| Large accelerated filer | ☐ | Accelerated filer | ☒ | ||||||||||||||||||||||||||||||||||||||
| Non-accelerated filer | ☐ | ||||||||||||||||||||||||||||||||||||||||
| Smaller reporting company | ☒ | ||||||||||||||||||||||||||||||||||||||||
| Emerging growth company | ☐ | ||||||||||||||||||||||||||||||||||||||||
If an emerging growth company, indicate by check mark if the registrant has elected not to use the extended transition period for complying with any new or revised financial accounting standards provided pursuant to Section 13(a) of the Exchange Act. [ ]☐
Indicate by check mark whether the registrant has filed a report on and attestation to its management’s assessment of the effectiveness of its internal control over financial reporting under Section 404(b) of the Sarbanes-Oxley Act (15 U.S.C. 7262(b)) by the registered public accounting firm that prepared or issued its audit report.
| ☒ | ||
If securities are registered pursuant to Section 12(b) of the Act, indicate by check mark whether the financial statements of the registrant included in the filing reflect the correction of an error to previously issued financial statements. ☐
Indicate by check mark whether any of those error corrections are restatements that required a recovery analysis of incentive-based compensation received by any of the registrant’s executive officers during the relevant recovery period pursuant to§240.10D-1(b). ☐
Indicate by check mark whether the registrant is a shell company (as defined in Rule 12b-2 of the Act). Yes [ ]☐ No [X]☒
The aggregate market value of the shares held by non-affiliates of the registrant as of June 30, 20172023 was $342,728,481$206,377,716 based on the closing price on the NASDAQNasdaq Stock MarketMarket LLC.
As of February 16, 2018,2024, there were 1,885,8691,890,623 common shares of the registrant outstanding.
Documents incorporated by reference: Portions of Investors Title Company’s definitive proxy statement for the Annual Meeting of Shareholders to be held May 16, 201815, 2024 are incorporated by reference in Part III hereof.
Safe Harbor and Forward-Looking Statements
This Annual Report on Form 10-K, as well as information included in future filings by theInvestors Title Company (the “Company”) with the Securities and Exchange Commission (“SEC”(the “SEC”) and information contained in written material, press releases and oral statements issued by or on behalf of the Company, contains, or may contain, “forward-looking statements” within the meaning of Section 27A of the Securities Act of 1933 (the “Securities Act”) and Section 21E of the Securities Exchange Act of 1934 (the “Exchange Act”), that reflect management’s current outlook for future periods. These statements may be identified by the use of words such as “plan,” “expect,” “aim,” “believe,” “project,” “anticipate,” “intend,” “estimate,” “should,” “could,” “would” and other expressions that indicate future events and trends. All statements that address expectations or projections about the future, including statements about the Company’s strategy for growth, product and service development, market share position, claims, expenditures, financial results and cash requirements, are forward-looking statements. Without limitation, projected developments in mortgage interest rates and the overall economic environment set forth in “Management’s Discussion and Analysis of Financial Condition and Results of Operations – Business Trends and Recent Conditions” constitute forward-looking statements. Forward-looking statements are based on certain assumptions and expectations of future events that areare subject to a number of risks and uncertainties. For a description of factors that may cause actual results to differ materially from such forward-looking statements, see Item 1A, “Riskrefer to “Item 1A. Risk Factors” of this Annual Report on Form 10-K.
Actual future results and trends may differ materially from historical results or those projected in any such forward-looking statements depending on a variety of factors, including, but not limited to, the following:
•changes in interest rates and real estate values;
•changes in general economic, business, and political conditions, including the performance of the financial and real estate markets and the effects of a potential shutdown of the U.S. Government;
•the impact of inflation;
•the impact of ongoing geopolitical and military conflicts;
•potential reform of government sponsored entities;
•the level of real estate transaction volumes, the level of mortgage origination volumes (including refinancing) and, the mix of title insurance between markets with varying real estate values, changes to the insurance requirements of the participants in the secondary mortgage market, and the effect of these factors on the demand for title insurance;
•the possible inadequacy of provisionsthe provision for claims to cover actual claim losses;
•the incidence of fraud-related losses;
•the impact of cyberattacks (including ransomware attacks) and other cybersecurity events, including damage to the Company's reputation in the event of a serious IT breach or failure;
•the impact of pandemics, climate change, severe weather conditions or the occurrence of another catastrophic event;
•unanticipated adverse changes in securities markets that could result in material losses to the Company’s investments;
•significant competition that the Company’s operating subsidiaries face, including the Company’s ability to develop and offer products and services that meet changing industry standards in a timely and cost-effective manner and expansion into new geographic locations;locations;
•the Company’s reliance upon the North Carolina, Texas, South Carolina and TexasGeorgia markets for a significant portion of its premiums, comprising approximately 38.3%37.4%, 27.0%, 9.3% and 19.1%6.8% of premiums written, respectively;
•compliance with government regulation, including pricing regulation, and significant changes to applicable regulations or in their application by regulators;
•the impact of governmental oversight of compliance of the Company’s service providers, including the application of financial regulation designed to protect consumers;
•possible downgrades from a rating agency, which could result in a loss of underwriting business;
•the inability of the Company to manage, develop and implement technological advancements and prevent system interruptions or unauthorized system intrusions;
•statutory requirements applicable to the Company’s insurance subsidiaries that require them to maintain minimum levels of capital, surplus and reserves and that restrict the amount of dividends they may pay to the Company without prior regulatory approval;
•the desire to maintain capital above statutory minimum requirements for competitive, marketing and other reasons;
•heightened regulatory scrutiny and investigations of the title insurance industry;
•the Company’s dependence on key management and marketing personnel, the loss of whom could have a material adverse effect on the Company’s business;
•difficulty managing growth, whether organic or through acquisitions;
•unfavorable economic or other conditions could cause the Company to record impairment charges for all or a portion of its goodwill and other intangible assets;
•policies and procedures for the mitigation of risks may be insufficient to prevent losses;
•the shareholder rights plan could discourage transactions involving actual or potential changes of control; and
•other risks detailed elsewhere in this document and in the Company’s other filings with the SEC.
2
These and other risks and uncertainties may be described from time to time in the Company’s other reports and filings with the SEC. The Company is not under any obligation (and expressly disclaims any such obligation) and does not undertake to update or alter any forward-looking statements to reflect circumstances or events that occur after the date the forward-looking statements are made. You should consider the possibility that actual results may differ materially from our forward-looking statements.
3
INVESTORS TITLE COMPANY AND SUBSIDIARIES
TABLE OF CONTENTS
| PART I | ||||||||
| Item 1. | Business | |||||||
| Executive Officers of the Company | ||||||||
| Item 1A. | Risk Factors | |||||||
| Item 1B. | Unresolved Staff Comments | |||||||
| Item | ||||||||
| Item | ||||||||
| Item 3. | Legal Proceedings | |||||||
| Item 4. | Mine Safety Disclosures | |||||||
| PART II | ||||||||
| Item 5. | Market for Registrant’s Common Equity, Related | |||||||
| Item 6. | ||||||||
| Item 7. | Management’s Discussion and Analysis of Financial Condition and Results of Operations | |||||||
| Item 7A. | Quantitative and Qualitative Disclosures About Market Risk | |||||||
| Item 8. | Consolidated Financial Statements and Supplementary Data | |||||||
| Item 9. | Changes in and Disagreements with Accountants on Accounting and Financial Disclosure | |||||||
| Item 9A. | Controls and Procedures | |||||||
| Item 9B. | Other Information | |||||||
| Item 9C. | Disclosure Regarding Foreign Jurisdictions that Prevent Inspections | |||||||
| PART III | ||||||||
| Item 10. | Directors, Executive Officers and Corporate Governance | |||||||
| Item | Executive Compensation | |||||||
| Item 12. | Security Ownership of Certain Beneficial Owners and Management and Related | |||||||
| Item 13. | Certain Relationships and Related Transactions, and Director Independence | |||||||
| Item 14. | Principal Accountant Fees and Services | |||||||
| PART IV | ||||||||
| Item 15. | Exhibits, Financial Statement Schedules | |||||||
| Item 16. | Form 10-K Summary | |||||||
| Signatures | ||||||||
4
PART I
GENERAL
Investors Title Company (the “Company”) is a holding company that operates through its subsidiaries and was incorporated inas a corporation under the laws of the state of North Carolina in 1973. The Company became operational in 1976, when it acquired Investors Title Insurance Company (“ITIC”), which had itself been operating since 1972, as a wholly owned subsidiary under a plan of exchange of shares of common stock. In 1983, the Company acquired National Investors Title Insurance Company (“NITIC”), formerly Northeast Investors Title Insurance Company, which had itself been operating since 1973, as a wholly owned subsidiary under a plan of exchange of shares of common stock. The Company’s executive offices are located at 121 North Columbia Street, Chapel Hill, North Carolina 27514 and its telephone number is (919) 968-2200. The Company maintains a website at www.invtitle.com. The contents of the Company’s website are not and shall not be a part of this Annual Report on Form 10-K or any other SEC filing.
OVERVIEW OF THE BUSINESS
The Company has two reportable segments. The Company’s primary business activity, and one of its only reportable operating segment,segments, is the issuance of residential and commercial title insurance through ITIC and NITIC. Additionally, the Company providesThe Company’s second reportable operating segment is providing tax-deferred real propertyexchange services through its subsidiaries, Investors Title Exchange Corporation (“ITEC”) and Investors Title Accommodation Corporation (“ITAC”);. Additionally, the Company provides management services to title insurance agencies through its subsidiary, Investors Title Management Services (“ITMS”), and investment management and trust services to individuals, trusts and other entities through its subsidiary Investors Trust Company (“Investors Trust”); and management services. Refer to title insurance agencies through its subsidiary, Investors Title Management Services (“ITMS”). See “Item 7. Management’s Discussion and Analysis of Financial Condition and Results of Operations” and Note 12 of the Notes to Consolidated Financial Statements included in Item 8 of this Annual Report on Form 10-K (the “Consolidated Financial Statements”) for additional information related to the revenues, income and assets attributable to the Company’s primary operating segment.segments.
Title Insurance
Through its two wholly owned title underwriting subsidiaries, ITIC and NITIC, the Company underwrites title insurance for owners and mortgagees as a primary insurer. ITIC and NITIC offer primary title insurance coverage to owners and mortgagees of real estate and assume reinsurance of title insurance risks from other title insurance companies. The commitments and policies are predominantly issued using standard forms approved by the American Land Title Association (“ALTA”).
Title insurance protects against losses resulting from title defects affecting real property.property and customarily arising prior to the policy date. Upon a real estate closing, the seller of real property executes a deed to the new owner, and typically, the property is encumbered with a new mortgage.When real property is conveyed from one party to another, occasionally there is an undisclosed or undiscovered defect in the title or a mistake or omission in a prior deed or mortgage that may give a third party a legal claim against such property or result in the invalidity or unenforceability of the insured mortgage. If a claim is made against the title to real property, title insurance provides indemnification against covered defects.
Numerous types of defects could jeopardize the property owner’s or mortgagee’s interest in the property for which a title policy may provide coverage. Such risks may include title being vested in an individual or entity other than the insured, lack of a right of access to the property, invalidity or unenforceability of the insured mortgage, or other liens or encumbrances that make the property unmarketable. The policy may provide coverage for defects arising from prior unsatisfied mortgages, judgments, tax liens or confirmed assessments, or encumbrances against the property arising through easements, restrictions or other existing covenants. Title insurance may also protect against deeds or mortgages in the insured’s chain of title that were forged or improperly acknowledged or delivered, that were executed by spouses without the other spouse’s signature or that were conveyed by minors or other persons who lack legal capacity.
Title Insurance Policies. Policies: The Company issues title insurance policies based on a search of public records. The title search documents the current status of title to the property. There are two basic types of title insurance policies – one for the mortgage lender and one for the real property owner. A lender often requires property owners to purchase title insurance to protect the priority of its mortgage loan, but the lender’s title insurance policy does not protect the property owner. The property owner has to purchase a separate owner’s title insurance policy to protect its investment.
5
Insured Risk on Policies in Force. Force: Generally, the amount of the insured risk under a title insurance policy is equal to the purchase price, the loan amount or the fair market value of the insured property. If a claim is made against an insured property’s title, the insurer can choose to pay the cost of eliminating the covered title defects or to defend the insured party against the coveredtitle defects affecting the property. In the alternative, the insurer may opt to pay the policy limits to the insured or, if the loss is less than the policy limits, the amount of the insured’s actual loss due to such title defects as defined by the policy,at which time the insurer’s duty to defend the claim and all other obligations of the insurer with respect to the claim are satisfied.
At any given time, the insurer’s actual risk of monetary loss under outstanding policies is only a portion of the aggregate insured risk, or total face amount, of all policies in force. The lower risk results primarily from the reissuance of title insurance policies for the same property by other underwriters over time when such property is subsequently conveyed or refinanced. The coverage on a lender’s title insurance policy is reduced and eventually terminated as the mortgage loan is paid. An owner’s policy is effective as long as the insured has an ownership interest in the property or has liability under warranties of title. Due to the variability of these factors, the aggregate contingent liability of the Company’s title underwriters on outstanding policies cannot be determined with precision.
Losses and Reserves. Reserves: While most other forms of insurance provide for the assumption of risk of loss arising from unforeseen events, title insurance is based upon a process of loss avoidance. Title insurance generally serves to protect the policyholder from the risk of loss from events that predate the issuance of the policy. Losses on policies typically occur when a title defect is not discovered during the examination and settlement process or upon the occurrence of certain hidden risks which cannot be determined from an accurate search of public land records. The maximum amount of liability under a title insurance policy is generally the face amount of the policy plus the cost of defending the insured’s title against an adverse claim, if agreed to by the insurer prior to payment of loss under the policy, and any inflation protection clause associated with the policy. The reserve for claim losses is established from known claims, as well asestimatedlosses incurred but not yet reported to the Company based upon historical experience and other factors.
Title claims can often be complex, vary greatly in dollar amounts, are affected by economic and market conditions and may involve uncertainties as to ultimate exposure. Therefore, reserve estimates are subject to variability. For a more complete description of the Company’s reserve for claims, seerefer to “Item 7. Management’s Discussion and Analysis of Financial Condition and Results of Operations” in this Annual Report on Form 10-K.
Title Insurance Underwriting Operations.Operations: ITIC and NITIC issue title insurance through the Company’s home and branch officespolicies directly and through a network of agents. Issuing agents are typically real estate attorneys, independent agents or subsidiaries of community and regional mortgage lending institutions, depending on local customs and regulations and the Company’s marketing strategy in a particular territory. The Company’s title insurance subsidiaries determine the terms and conditions upon which they will insure title to real property according to the Company’s underwriting standards, policies and procedures. Title insurance premiums written reflect a one-time premium payment, with no recurring premiums.
Generally, premiums for title insurance are recorded and recognized as revenue at the closing of the related transaction, when the earnings process is considered complete. When the policy is issued directly, through a home or branch office, the premiums collected are retained by the Company. When the policy is issued through a non-wholly owned title insurance agent,agency, the agentagency retains a majority of the premium as a commission and remits the net amount to the Company. Title insurance commissions earned by the Company’s agents are recognized as expenses concurrently with premium recognition. The percentage of the premium retained by agents varies by region and is sometimes regulated by the states where the property is located.
For a description of the level of net premiums written by directdirectly and through agency operations, refer to “Item 7. Management’s Discussion and Analysis of Financial Condition and Results of Operations” in this Annual Report on Form 10-K.
Geographic Operations. Operations: ITIC was incorporated in North Carolina in 1972, and is licensed to write title insurance in 44 states and the District of Columbia. ITIC currently writes title insurance as a primary insurer in 21 states and the District of Columbia, primarily located in the eastern half of theUnited States, and as a reinsurer for NITIC and third partythird-party title insurance companies.
NITIC was incorporated in South Carolina in 1973, and is licensed to write title insuranceinsurance in 20 states and the District of Columbia. In November 2014, NITIC redomesticated to Texas. NITIC currently writes title insurance as a primary insurer in Texas, and as a reinsurer for ITIC.
Premiums from title insurance written on properties located in North Carolina, Texas, South Carolina and TexasGeorgia represent the largest source of revenue for the title insurance segment. In North Carolina ITIC primarilyissuesand Texas, the Company’s title insurance commitments and policies are issued directly and through branch offices.agents. In TexasSouth Carolina, Georgia and other states, title policies are primarily issued through issuing agents. For a description of the level of net premiums written geographically for significant states, refer to “Item 7. Management’s Discussion and Analysis of Financial Condition and Results of Operations” in this Annual Report on Form 10-K.
6
Each state license authorizing ITIC or NITIC to write title insurance must be renewed annually. These licenses are necessary for the companies to operate as a title insurer in each state in which they write premiums.
In the ordinary course of business, ITIC and NITIC reinsure certain risks with other title insurers to limit their risk exposure and to comply with state insurance regulations. They also assume reinsurance for certain risks of other title insurers for which they receive additional income in the form of reinsurance premiums. For each of the last threetwo years, revenues from reinsurance activities accounted for less than 1% of total premium volume.
Exchange Services Investment Management and Trust Services, and Management Services
The Company’s other lines ofexchange services business includeincludes services offered by wholly owned subsidiaries ITEC ITAC, Investors Trust, and ITMS.ITAC.
In 1988, the Company established ITEC to provide services in connection with tax-deferred exchanges of like-kind property pursuant to Section 1031§1031 of the Internal Revenue Code of 1986, as amended.amended (the “IRC”). ITEC acts as a qualified intermediary in tax-deferred exchanges of real property held for productive use in a trade or business or for investment, and its income is derived from fees for handling exchange transactions and a portion of the interest earned on client deposits held by the Company. In its role as qualified intermediary, ITEC coordinates the exchange aspects of the real estate transaction, and its duties include drafting standard exchange documents, holding the exchange funds between the time the old property is sold and the new property is purchased, and accepting the formal identification of the replacement property within the required identification period. ITAC provides services as an exchange accommodation titleholder for accomplishing “parking transactions” as set forth in the safe harbor contained in Internal Revenue Procedure 2000-37. These transactions include reverse exchanges when taxpayers decide to acquire replacement property before selling the relinquished property, or “build to suit” exchanges, when improvements must be made to the replacement property before the taxpayer acquires the improved replacement property. The services provided by the Company’s exchange services division, ITEC and ITAC, are pursuant to provisions in the Internal Revenue Code.IRC. From time to time, these laws are subject to review and changes, which may negatively affect the demand for tax-deferred exchanges in general, and consequently, the revenues and profitability of the Company’s exchange services division.
Management Services, Investment Management and Trust Services
The Company’s other lines of business include services offered by wholly owned subsidiaries ITMS and Investors Trust provides investment management and trust services to individuals, companies, banks and trusts.Trust.
ITMS offers various consulting and management services to provide clients with the technical expertise to start and successfully operate a title insurance agency.
Investors Trust provides investment management and trust services to individuals, companies, banks and trusts.
None of these other lines of business is currently a reportable segment for which separate financial information is presented; instead, they are collectively included and reported in the category “All Other” in the segment information in Note 12 of the Company’s financial statements.Notes to the Consolidated Financial Statements.
CYCLICALITY AND SEASONALITY
Real estate activity, home sales and mortgage lending are cyclical in nature. Title insurance premiums are closely related to the level of real estate activity and the average price of real estate sales. The availability of funds to finance purchases directly affects real estate sales. Other factors include mortgage interest rates, consumer confidence, economic conditions, supply, and demand, and family income levels. The Company’s premiums in future periods are likely to fluctuate due to these and other factors which are beyond management’s control.
Historically, the title insurance business tends to be seasonal as well as cyclical.Because home sales are typically strongest in periods of favorable weather, the first calendar quarter tends to have the lowest activity levels, while the spring and summer quarters tend to be more active. Refinance activity is generally less seasonal, but is subject to interest rate fluctuations.
7
Seasonal and other factors affecting the level of real estate activity and the volume of title premiums written will also generally affect the demand for exchange services.
MARKETING
The Company markets its title insurance services to a broad range of customers in the residential and commercial market sectors of the real estate industry. Issuing agents are typically real estate attorneys, independent agents or subsidiaries of community and regional mortgage lending institutions, depending on local customs and regulations and the Company’s marketing strategy in a particular territory.
ITIC and NITIC strive to provide superior service to their customers and consider this an important factor in attracting and retaining customers. Branch and corporateCompany personnel strive to develop new business and agency relationships to increase market share while ITIC’s Commercial Services Division focuses on services provided to commercial clients. The Commercial Services Division of ITIC also markets the services offered by ITEC and ITAC to its commercial clients.
Marketing of tax-deferred exchange services offered by ITEC and ITAC has been incorporated into the marketing of the core title products offered by ITIC and NITIC.
REGULATION
Any material change in the Company’s regulatory environment may have an adverse effect on its business.
The Company is an insurance holding company and therefore, it is subject to regulation in the states in which its insurance subsidiaries do business. These regulations, among other things, require insurance holding companies to register and file certain reports, and require prior regulatory approval of the payment of extraordinary dividends and other intercompany distributions or transfers. They also may require approval of the insurance commissioner prior to a third party directly or indirectly acquiring control of the insurer, which may make it difficult or prohibitive for a third party to acquire the Company.
Title insurance companies are extensively regulated under applicable state laws. All states have requirements for admission to do business as an insurance company, including minimum levels of capital, surplus and reserves. State regulatory authorities monitor the stability and service of insurance companies and possess broad powers with respect to the licensing of title insurers and agents, approving rate schedules and policy forms, financial reporting and accounting practices, reserve requirements, investmentsand dividend restrictions, approving related party transactions, as well as examining and auditing title insurers. At December 31, 2017,2023, both ITIC and NITIC met the statutory premium reserve requirements and the minimum capital and surplus requirements of the states where they are licensed. A substantial portion of the assets of the Company’s title insurance subsidiaries consists of their portfolios of investment securities. Both of these subsidiaries are required by various state laws to maintain assets of a defined minimum quality and amount.
The Company’s insurance subsidiaries are subject to examination at any time by the insurance regulators in the states where they are licensed as well as required periodic examinations. These and other governmental authorities have the power to enforce state and federal laws to which the title insurance subsidiaries are subject. These governmental authorities include, but are not limited to,the Consumer Financial Protection Bureau (“CFPB”), which enforces the Real Estate Settlement Procedures Act (“RESPA”), the primary federal regulatory guidance governing the real estate settlement industry. The CFPB has the authority to identify and address, through regulation, unfair, deceptive and abusive practices in the mortgage industry and certain other settlement service industries.
Certain laws and regulations, such as the Tax Cutscybersecurity requirements of governmental authorities, require the Company to maintain certain information security standards and Jobspractices. Other laws and regulations regulate the manner in which the Company collects, uses, retains, protects, discloses, transfers, and processes personal data. Following the enactment of the California Consumer Privacy Act, (“TCJA”), was enacted into law. The new tax legislation, among other changes, reduces the federal corporate income tax rate from 35% to 21%, effective January 1, 2018. As required under generally accepted accounting principles, the Company’s deferred tax assets and liabilities were revalued at the newly enacted U.S. corporate income tax rate,Virginia Consumer Data Protection Act and the impact was recognizedEuropean Union General Data Protection Regulation, the Company expects the adoption of comprehensive data privacy laws in our provision for income taxesmore jurisdictions in the fourth quarterwhich it operates.
8
Intermediary services are not federally regulated by any regulatory commissions, and neither ITEC nor ITAC operate in any state that regulates this industry, unless they are in compliance with such state regulations. ITEC and ITAC both provide services to taxpayers pursuant to Internal Revenue Service regulations that provide taxpayers a safe harbor by using a qualified intermediary to structure tax-deferred exchanges of 2017. The revaluation resultedproperty and using an exchange accommodation titleholder to hold property in a benefit of approximately $5.3 million, or $2.82 per diluted share.reverse exchange transactions.
Investors Trust is regulated by the North Carolina Commissioner of Banks.
The title insurance industry is highly competitive. The four largest title insurance companies typically maintain greater than 85%80% of the market for title insurance in the United States, with smaller regional companies holding the balance of the market. The number and size of competing companies varies in the respective geographic areas in which the Company conducts business. Key competitive factors in the title insurance industry are the financial strength and size of the insurer, timeliness and quality of service, price and expertise in certain transactions. Title insurance underwriters also compete for agents based upon service and commission levels. Some title insurers currently have greater financial resources, larger distribution networks and more extensive computerized databases of property records and related information than the Company. In addition, there are numerous industry-related regulations and statutes that set out conditions and requirements to conduct business. Changes to or the removal of such regulations and statutes could result in additional competition from alternative title insurance products or new entrants into the industry that could materially affect the Company’s business operations and financial condition.
Competition for ITEC and ITAC comes from other title insurance companies and agents, banks, attorneys, and other independently-owned, qualified intermediaries that offer exchange services. Key elements that affect competition are price, expertise, timeliness and quality of service and the financial strength and size of the exchange service provider. Exchange services are not a regulated industry; there is no market data available regarding the Company’s market position in this industry.
CUSTOMER AND LENDER CONCENTRATION
The Company is not dependent upon any single title insurance customer or a few customers, and the loss of any single customer would not have a material adverse effect on the Company.
INVESTMENT POLICIES
The Company and its subsidiaries derive a substantial portion of their income from investments in municipal and federal U.S. government securities and investment grade corporate bondsfixed maturity securities and equity securities. The Company’s debt and equityfixed maturity securities are classified as available for sale and carried at estimated fair marketvalue. Equity securities are also carried at estimated fair value. The Company’s investment policy is designed to maintain a high quality portfolio and maximize income. Some state laws impose restrictions upon the types and amounts of investments that can be made by the Company’s insurance subsidiaries. The Company’s investment portfolio is managed internally and via a wholly owned subsidiary. The securities in the Company’s portfolio are subject to economic conditions and normal market risks. Equity securities at December 31, 20172023 and 20162022 consisted of investments in various industry groups. The Company’s investment portfolio did not include any significant investments in banks, trust or insurance companies at December 31, 20172023 or 2016.2022. Short-term investments, which consist primarily of money market instrumentsfunds and certificates of deposit whichU.S. Treasury bills, have an original maturity of one year or less, are carried at cost, which approximates fair value due to the short duration to maturity. In addition, at December 31, 20172023 and 2016,2022, the Company held investments that are accounted for using the equity method (seeand measurement alternative method (refer to Note 1 of the Notes to the Consolidated Financial Statements in this Annual Report on Form 10-K.)Statements).
ENVIRONMENTAL MATTERS
The title insurance policies ITIC and NITIC currently issue exclude any liability for environmental risks and contamination unless a notice of violation relating to an environmental protection law, ordinance or regulation is recorded prior to the date of such policy or the Company issues a specific policy endorsement providing coverage for environmental liens recorded prior to the date of such policy. The Company has not experienced, and does not anticipate that it or its subsidiaries will incur, any significant expenses related to environmental claims.
9
In connection with tax-deferred exchanges of like-kind property, ITAC may temporarily hold title to property pursuant to an accommodation titleholder agreement. In order for ITAC to enter into such arrangements, each person or entity for which title is being held must first (i)(a) execute an indemnification agreement under which it agrees to indemnify ITAC for any environmental or other claims which may arise as a result of the arrangement, and (ii)(b) provide due diligence materials regarding any known environmental issues, in the form of an environmental questionnaire and/or applicable environmental engineering studies, if indicated for review by ITAC, as applicable.
EMPLOYEES AND HUMAN CAPITAL
The Company and its subsidiaries had 360545 full-time employees and 2326 part-time employees as of December 31, 2017.2023. None of the employees are covered by any collective bargaining agreements. Management considers its relationship with its employees to be favorable.
Recruiting and retaining qualified personnel and key talent is important to the Company’s success. The Company’s business results depend in part on its ability to successfully manage its human capital resources. Factors that may affect the Company’s ability to attract and retain qualified employees include employee morale, competition from other employers and availability of qualified individuals.
The Company is an equal opportunity employer, committed to creating an inclusive culture that supports all employees and is free of discrimination based on gender, race, ethnicity, religion, disability or other legally protected characteristic. The current makeup of the Company's Board of Directors complies with the Nasdaq Stock Market LLC's rules related to board diversity.
Compensation and Benefits
The Company strives to provide robust compensation and benefits to its employees. In addition to competitive salaries, compensation and benefit programs include annual bonuses, an employer-sponsored 401(k) plan, employer paid healthcare, life insurance, long and short term disability benefits, flexible spending accounts, an employee assistance program, and paid time off. The Company’s ability to attract and retain key personnel who are necessary to the operation of the business is critical to its success.
ADDITIONAL INFORMATION
The Company files annual, quarterly and current reports and other information with the SEC. The SEC maintains a website at www.sec.gov that contains reports, proxy and information statements, and other information regarding issuers that file electronically with the SEC.
The Company’s internet address is www.invtitle.com. The contents of the Company’s website, including the “Investor Relations” section, are not and shall not be deemed to be a part of this documentAnnual Report on Form 10-K or any other Securities and Exchange Commission (“SEC”)SEC filing. The Company makes available free of charge through its internet website its annual reports on Form 10-K, its quarterly reports on Form 10-Q, its current reports on Form 8-K, and all amendments to those reports filed or furnished pursuant to Section 13(a) or 15(d) of the Securities Exchange Act of 1934 as soon as reasonably practicable after such materials are electronically filed with, or furnished to, the SEC, and also makes available the Section 16 reports on Forms 3, 4 and 5 of its insiders no later than the end of the business day following such filings. The information is free of charge and may be reviewed and downloaded from the website at any time. The public may read any material it has filed with the SEC at the SEC’s Public Reference Room at 100 F Street, N.E., Washington, D.C. 20549. The “Investor Relations” section of the Company’s website also includes its codeCode of business conductBusiness Conduct and ethicsEthics and the charters of the Audit, Compensation and Nominating Committees of its Board of Directors.
Executive Officers of the Company
Following is information regarding the executive officers of the Company as of February 23, 2018.21, 2024. Each officer is appointed at the annual meeting of the Board of Directors to serve until the next annual meeting of the Board or until his or her respective successor has been elected and qualified.
| Name | Age | ||||||||||||||
| Position with Registrant | |||||||||||||||
| J. Allen Fine | 89 | Chief Executive Officer and Chairman of the Board | |||||||||||||
| James A. Fine, Jr. | 61 | President, Treasurer, Chief Financial Officer, Chief Accounting Officer and Director | |||||||||||||
| W. Morris Fine | 57 | Executive Vice President, Secretary and Director | |||||||||||||
J. Allen Fine has been Chief Executive Officer and Chairman of the Board of the Company since its incorporation in 1973. He also served as President of the Company until May 1997. He is the father of James A. Fine, Jr. and W. Morris Fine.
10
James A. Fine, Jr. was named Vice President of the Company in 1987. In 1997, he was named President and Treasurer and appointed as a Director of the Company. In 2002, he was appointed as Chief Financial Officer and Chief Accounting Officer. He is the son of J. Allen Fine and the brother of W. Morris Fine.
W. Morris Fine was named Vice President of the Company in 1992. In 1993, he was named Treasurer of the Company and served in that capacity until 1997. In 1997, he was named Executive Vice President and Secretary of the Company. In 1999, he was appointed as a Director of the Company. He is the son of J. Allen Fine and the brother of James A. Fine, Jr.
The risk factors listed in this section and other factors noted herein could cause actual results to differ materially from those contained in any forward-looking statements or could result in a significant or material adverse effect on the Company’s results of operations.
RISKS RELATED TO THE COMPANY’S BUSINESS
Adverse changes in economic conditions, especially those related to real estate activity, may negatively impact the Company’s results of operations and financial condition.
The demand for the Company’s title insurance, exchange services, and other real estate transaction products and services varies from year to year and is dependent upon, among other factors, the volume of residential and commercial real estate transactions and mortgage financing transactions. The volume of these transactions has historically been influenced by factors such as the overall state of the economy, the average price level of real estate sales, housing inventory, unemployment levels, and the availability and pricing of mortgage financing. During periods of economic uncertainty,Real estate activity generally decreases when the economy is weak or whenuncertain, home prices are increasing, housing inventory is limited, the availability of mortgage credit is limited, or when mortgage interest rates are increasing, real estate activity typically declines.increasing. The cyclical nature of the Company’s business has caused in the past, and is currently causing, volatility in revenue and profitability in the past and could do so in the future.
Demand for title insurance also depends in part upon the requirement by mortgage lenders and other participants in the secondary mortgage market that title insurance policies be obtained on residential and commercial real property.
The Company may experience material losses resulting from fraud, defalcation or misconduct.
Underwriting agents and approved settlement providers, which can include issuing agents and approved settlement agents, attorneys, and search firms, perform a significant portion of the work necessary to issue the Company’s title insurance policies. These agents and providers operate with a substantial degree of independence from the Company, and while they are subject to certain contractual limitations designed to mitigate the Company’s risk, therelimitations. There is no guarantee that theseall title agents and approved providers will comply with contractual limitations, will eliminate all associated risks.and, due to changes in the regulatory environment and trends in litigation, the Company could be held liable for their actions. As a result, the Company’s use of title agents and approved providers could result in claims on the Company’s policies and other expenses due to fraud and negligence. Fraud, defalcation, errors and other misconduct by the Company’s agents, approved attorneys and employees are risks inherent in the Company’s business. Agents and approved attorneys typically handle large sums of money in truststrust pursuant to the closing of real estate transactions. Misappropriation of funds by any of these parties could result in title claims, some of which could be large and have a material negative impact on the Company’s results of operations and financial condition.
11
The Company relies upon the North Carolina, Texas, South Carolina and TexasGeorgia markets for a significant portion of its premiums. Changes in the economic or regulatory environments in North Carolina or Texasthese states could have an adverse impact on the Company.
North Carolina, Texas, South Carolina and TexasGeorgia are the largest sources of premium revenue for the Company’s title insurance subsidiaries. In 2017, North Carolina2023, these states represented 37.4%, 27.0%, 9.3% and Texas represented 38.3% and 19.1%6.8% of total premiums written by the Company, respectively. A decrease in the level of real estate activity in either North Carolina and/or Texas,these states, whether driven by weak economic conditions, changes in regulatory environments or other factors that influence demand, could have a negative impact on the Company’s financial results. Some of these markets, like the overall real estate market, experienced during 2023, and may continue to experience, an overall decline in the level of real estate transaction volumes resulting from higher average mortgage interest rates.
Adverse deviation of actual claims experience from expected claims experience will result in lower net earnings.
The Company’s net income is affected by the extent to which its actual claims experience differs from the assumptions used in establishing the reserve for claims. The reserve for claims is established based on actuarial estimates of future payments for reported claims, as well as claims which have been incurred but not yet reported. In addition, management considers factors such as the Company’s historical claims experience, case reserve estimates on reported claims, large claims and other relevant factors in determining loss provision rates and the aggregate recorded expected liability for claims.
Due to the nature of the underlying risks and the high degree of uncertainty associated with the estimation of the reserve for claims, the Company cannot determine precisely the amounts which it will ultimately pay to settle its claims. Factors contributing to the complexity in establishing reserves can include varying loss potentials, timing, unfavorable market or economic conditions and the legal environment. The timing of claims is difficult to estimate as payments may not occur until well into the future. Higher levels of defaults and foreclosures upon insured properties are more prevalent in times of unfavorable economic conditions and can lead to an increase in title insurance claims. The Company may also incur higher than normal claim payment experience or large losses. To the extent that actual claims experience is greater than estimated, the Company could be required to increase the reserve.
Competition affects the Company’s results of operations.
The title insurance industry is highly competitive with only a few insurers comprising a large percentage of the market. Key competitive factors are quality of service, price within regulatory parameters, expertise, timeliness and the financial strength and size of the insurer. Title insurance underwriters compete for premiums by choosing various distribution channels which may include company-owned operations, independent agents and agency relationships with real estate attorneys, subsidiaries of community and regional lending institutions, realtors, builders and other settlement service providers. Title insurance underwriters compete for agents on the basis of service, technology and commission levels. Some title insurers currently have greater financial resources, larger distribution networks and more extensive computerized databases of property records and information than the Company. The number and size of competing companies varies in the different geographic areas in which the Company operates, and any reductions to current regulatory barriers within any of the different geographic areas could increase the number of competitors entering into the title insurance market. Competition among the major providers of title insurance or the acceptance of alternative products to traditional title products by the regulatory authorities and the marketplace could adversely affect the Company’s operations and financial condition.
The Company may encounter difficulties managing growth, which could adversely affect its operating results.
The Company’s future growth plans involve expansion into new geographic locations and further penetration into established markets through new or existing agents, or through acquisitions. Such growth may subject the Company to associated risks, such as diverting management’s attention, incurring unanticipated liabilities from an acquired business, difficulty integrating an acquired entity, or retaining its employees or customers and realization of synergies. The occurrence of any of these risks may deprive the Company of some or all of the anticipated value of an acquisition or other growth initiatives, resulting in lower returns on investmentinvestments and result in a negative impact on the Company’s results of operations. These risks could be particularly significant if the Company incurs significant costs in pursuing an acquisition or other initiatives.
12
The Company depends on its ability to attract and retain key personnel and agents, and its inability to do so could adversely affect its business.
Competition for skilled and experienced personnel in the Company’s industry is high, and the success of the Company is substantially dependent on its ability to attract and retain such personnel. The Company may have difficulty hiring and retaining the necessary marketing and management personnel to support future growth plans. Also, the Company’s results of operations and financial condition could be adversely affected if it is unsuccessful in attracting and retaining new agents.
Mortgage lending is highly concentrated and changes in relationships with lenders or reform of government-sponsored entities could adversely affect the Company.
Large mortgage lenders and government-sponsored entities, because of their significant role in the mortgage process, have significant influence over the Company and other service providers. Refusal by major market lenders to accept the Company’s product offerings could have a material adverse effect on the Company. Furthermore, government-sponsored entities, the Federal National Mortgage Association (“Fannie Mae”) and the Federal Home Loan Mortgage Corporation (“Freddie Mac”), often require the purchase of title insurance for home loans they securitize. Any alterations made by these regulatory entities, such as modifying the requirements for title insurance or allowing the use of alternative products in lieu of title insurance, could impact the entire mortgage loan process and, as a result, could impact the demand for title insurance. In addition, the federal government has had discussions about the possible reform of Fannie Mae and Freddie Mac. The timing and results of reform are currently unknown; however, changes to these entities could adversely impact the Company and its results of operations.
Unfavorable economic or other conditions could cause the Company to record impairment charges for all or a portion of its goodwill and other intangible assets.
As a result of acquisition activity, the Company has goodwill and other intangible assets that comprise approximately 4.9% of total assets as of December 31, 2023. Quarterly, the Company performs an impairment analysis that reviews changes in events or circumstances that could lead to the carrying value not being recoverable. Economic downturns or poor performance of the acquisitions could result in the Company recognizing an impairment of a portion or all of the goodwill and intangible assets on the Company’s books, which could have a material adverse effect on the Company’s results of operations and financial condition.
RISKS RELATED TO REGULATORY AND COMPLIANCE MATTERS
The Company’s insurance subsidiaries are subject to complex government regulations. Changes in regulations may have an adverse effect on the Company’s results of operations.
The Company’s title insurance subsidiaries are subject to extensive regulations that are intended to protect policyholders and consumers.
The Company’s title insurance subsidiaries are subject to regulations by the CFPB, created by the Dodd-Frank Act. The CFPB has extensive regulatory and enforcement authority over real estate and mortgage markets, including RESPA, the primary federal regulatory guidance governing the real estate settlement industry. The manner and extent to which the CFPB will implement new regulations is not fully known; however, any new regulations implemented could result in changes to internal processes, including changes to systems and forms.
13
In addition to federal regulation, title insurance subsidiaries are subject to state regulations. The nature and extent of state regulations, which vary from state to state, typically involve, among other matters, licensing and renewal requirements and trade and marketing practices, including, but not limited to, the following:
•licensing of insurers and agents;
•capital and surplus requirements;
•approval, regulation or establishment of premium rates for insurance;
•limitations on types and amounts of investments;
•limitations on the size of risks that may be insured by a single company;
•filing of annual and other reports with respect to financial condition;
•the amount of dividends and other payments made by insurance subsidiaries;
•establishing reserves;
•accounting and financing practices;
•deposits of securities for the benefit of policyholders;
•trade and marketing practices;
•regulation of reinsurance;
•approval of policy forms; and
•use of personal information, including cybersecurity regulations.
Insurance holding companies are subject to periodic examinations and the regulation of acquisitions, intercompany transactions and changes in control, among other regulations, by state regulators.
The Company and its subsidiaries are also subject to certain federal regulations established by the Office of the Comptroller of Currency, the Federal Reserve and various other governmental agencies.
The Company’s other businesses also operate within state and federal guidelines. Any changes in the regulatory environment could restrict its existing or future operations and could possibly make it more burdensome and costly to conduct them.
New regulations, or differing interpretations of existing laws, could change business processes, products and services and have a negative impact on the Company’s results of operations and financial condition.
A downgrade from a rating agency could result in a loss of underwriting business.
The competitive positions of title insurance companies rely partly on ratings published by independent rating services. Government-sponsored entities and lending institutions utilize these ratings, among other items, to evaluate a title insurer’s strength and stability. The Company’s title insurance subsidiaries are currently rated by A.M. Best Company and Demotech, Inc. The ratings issued by independent rating agencies are not credit ratings, but represent the opinion of the individual rating agency regarding the title insurance subsidiaries’ financial strength, operating performance, and ability to meet policyholder obligations. These insurer ratings are subject to periodic review and there can be no assurance that the Company’s insurance subsidiaries will maintain their current respective ratings. A significant downgrade in the ratings of either of the Company’s insurance subsidiaries could negatively impact the ability to compete for new business, retain existing business and maintain the necessary licenses to operate as title insurance companies in various states.
Title insurance rate regulation could have an adverse impact on the Company’s results of operations.
Rates for title insurance vary by state and are subject to extensive regulation. Statutes generally provide that rates must not be excessive, inadequate or unfairly discriminatory. The process of implementing a rate change in most states involves pre-approval by the applicable state insurance regulator. These regulations could impact the Company’s ability to adjust prices in the face of rapidly changing market conditions, which could adversely affect results of operations.
Regulatory investigations of the title insurance industry by governmental entities could adversely impact the Company’s results of operations.
The title insurance industry is subject to scrutiny by both federal and state regulators focusing on violations of state insurance codes, RESPA and similar state and federal laws, among others. The Company’s insurance subsidiaries occasionally receive inquiries from regulators involving market conduct. Future inquiries could lead to fines for violations, settlements with regulating authorities that could result in fines or requirements to pay claims, and the potential for further regulation. The results of future inquiries could adversely affect the Company’s results of operations and financial condition.
14
The Company relies on distributions from its insurance subsidiaries.
The Company is an insurance holding company and it has no substantial operations of its own. Its principal assets are investments in its operating subsidiaries, primarily its insurance subsidiaries. The Company’s ability to pay dividends and meet its obligations is dependent, among other factors, on the ability of its subsidiaries to pay dividends or repay intercompany loans. The Company’s insurance subsidiaries are subject to regulations that limit the amount of dividends, loans or advances they may make to the Company. The restriction on these amounts is based on the amount of the insurance subsidiaries’ unassigned surplus and net income, with certain adjustments. Additionally, these subsidiaries are required to maintain minimum amounts of capital, surplus and reserves. As of December 31, 2017, approximately $102,082,0002023, approximately $113.0 million of consolidated stockholders’consolidated shareholders’ equity represented the net assets of the Company’s subsidiaries that cannot be transferred in the form of dividends, loans or advances to the Company. In general, dividends in excess of prescribed limits are deemed “extraordinary” and require prior approval by the appropriate regulatory body. In addition, the Company’s ability to pay dividends may be constrained by business considerations, such as the impact of dividends on insurer ratings or competitive position. These dividend restrictions could limit the Company’s ability to pay dividends to its shareholders or fund growth opportunities.
RISKS RELATED TO INVESTMENTS AND DEPOSITS
Deterioration in financial markets may cause a decline in the performance of the Company’s investments and could have a material adverse impact on net income.
The Company derives a substantial portion of its income from its investment portfolio that primarily includes fixed maturity securities, equity securities and short-term investments. The Company’s investment policy is designed to comply with regulatory requirements and to balance the competing objectives of asset quality and investment returns. The Company’s investment portfolio is subject to risk from changes in general economic conditions, prices of marketable fixed maturity securities and equity securities, interest rates, liquidity, credit markets, and other external factors. The risk of loss is increased during periods of economic uncertainty and tight credit markets as these factors could limit the ability of some issuers to repay their debt obligations.
Fixed maturity securities and equity securities are carried at estimated fair value on the Company’s Consolidated Balance Sheets. Changes in the estimated fair value of fixed maturity securities are recorded as a component of accumulated other comprehensive income. Fixed maturity securities are regularly reviewed for differences between the cost and estimated fair value of each security for factors indicating impairment that would result in the value of the investment being written down. Unrealized holding gains and losses on equity securities are reported in the Consolidated Statements of Operations as net investment gains (losses), without regard to impairment. Changes in the estimated fair value of securities in the Company’s investment portfolio could have a material adverse effect on the Company’s results of operations and financial condition.
Financial institution failures could adversely affect the Company.
The Company has substantial deposits with financial institutions, including fiduciary deposits that are owned by third parties. There is no guarantee the Company, whether through the Federal Deposit Insurance Corporation or otherwise, would recover the funds it has deposited should one or more of the financial institutions at which the Company maintains deposits fail.
15
RISKS RELATED TO CYBERSECURITY, TECHNOLOGY AND RISK MANAGEMENT
Breaches and failures of, and other disruptions to, information technology systems of the Company or its service providers may disrupt the Company’s operations, result in monetary losses and harm the Company’s reputation.
The Company relies on information technology (“IT”) systems for a wide range of activities involved in the delivery of its products and services, including, but not limited to, the following:
•process title insurance applications and policy issuances;
•perform due diligence on land titles;
•manage substantial cash, investment assets, bank deposits, trust assets and escrow account balances on behalf of the Company and its customers;
•manage billing, collections and payables, including insurance premiums and agent commissions;
•manage accounting and financial reporting; and
•manage payroll and human resources information.
The Company’s IT systems may be disrupted or fail, and information stolen or otherwise misappropriated, for a number of reasons, including, but not limited to:
•hacking, computer viruses, malware, ransomware or other cyberattacks;
•software “bugs”, hardware defects or human error;
•natural disasters, like fires, or pandemics; or
•power loss.
Any of these events could disrupt operations both internally and externally, which may result in the loss of revenues. These events could also result in the unauthorized release of proprietary and/or non-public information, or even defalcation of corporate or client funds.
Like all companies, the Company’s IT systems have been, and likely will continue to be, the target of computer viruses, cyberattacks, phishing attacks and other malicious activity. While the Company has not experienced a known material breach to date, the occurrence or scope of such events is not always immediately apparent and there can be no assurance that the Company will not suffer additional attacks or incur serious financial consequences or expense in the future. The Company invests resources in maintaining the security of its systems and adapting to evolving security threats. There is, however, no guarantee that its security measures will be adequate to prevent all cyberattacks. There is similarly no guarantee that the Company’s backup systems or disaster recovery procedures will be adequate to mitigate losses due to IT system disruptions in a timely fashion, and the Company may incur significant expense in correcting IT system emergencies. The Company’s reputation may also be damaged in the event of a serious IT breach or failure. Furthermore, as technology develops, and as cybercriminals become more capable, the difficulty and expense of maintaining IT security and redundancy may increase.
To the extent the Company’s IT systems store non-public personal information, and information about its employees, security breaches may expose the Company to other serious liabilities and reputational harm if such data is misappropriated. Non-public personal information may include, but is not limited to, names, addresses, social security numbers, and banking information.
Additionally, future or past business transactions (such as acquisitions or integrations) could expose the Company to additional cybersecurity risks and vulnerabilities, as the Company’s systems could be negatively affected by vulnerabilities present in acquired or integrated entities’ systems and technologies.
In conducting its business and delivering its products and services, the Company also utilizes service providers.These service providers and the IT systems they utilize are typically subject to similar types of risks that the Company faces.The Company provides certain of these service providers with data, including non-public personal information.There is no guarantee that the Company’s due diligence or ongoing vendor oversight will be sufficient to ensure the integrity and security of the systems utilized by these service providers or the protection of the information that resides thereon.
Furthermore, the Company is required by law and by certain contracts, particularly contracts with financial institutions, to notify various parties, consumers and customers in the event that confidential or personal information may have been or was accessed by unauthorized third parties. Such an event could potentially result in a breach of contract, and any required notifications could result in, among other things, the loss of customers, negative publicity, distraction of management, fines, lawsuits for breach of contract, regulatory inquiries or involvement and a decline in sales.
16
The Company seeks to mitigate the financial risk associated with unauthorized disclosure of non-public information by maintaining cyber liability insurance coverage. As cybercriminals continue to become more sophisticated, the costs to insure against cyberattacks have risen and may continue to rise in the future. The Company’s coverage under its cyber liability insurance policy may be insufficient to cover all losses that the Company may incur in connection with an unauthorized disclosure of non-public information.
Any inability of the Company or its service providers to prevent or adequately respond to the issues described above could disrupt the Company’s business, delay or impact the delivery of its products and services, inhibit its ability to retain existing customers or attract new customers, divert management’s time and energy, otherwise harm its reputation and/or result in financial losses, litigation, regulatory inquiries, increased costs or other adverse consequences that could be material to the Company.
Errors and fraud involving the transfer of funds may adversely affect the Company.
The Company relies on its systems, employees and banks to transfer its own funds and the funds of third parties. These transfers are susceptible to user input error, fraud, system interruptions and other similar errors that could result in lost funds or delayed transactions. The Company’s email and computer systems, along with systems used by other parties involved in the transactions, have been subject to, and are likely to continue to be the target of, fraudulent attacks, including attempts to cause the improper transfer of funds. Funds transferred to a fraudulent recipient are often not recoverable and, in certain instances, the Company may be liable for those unrecovered funds. These attacks have increased in frequency and sophistication. The controls and procedures used by the Company to prevent transfer errors and fraud may prove inadequate, resulting in financial losses, reputational harm, loss of customers or other adverse consequences which could be material to the Company.
The Company may encounter difficulties managing system or technological changes, which could adversely affect its financial and operating results.
Technological changes in the title insurance industry are driven primarily by evolution in technology, competitive factors and regulatory changes. These changes have resulted in faster information delivery and efficient, highly automated production processes. The inability of the Company to manage, develop or successfully implement new systems or technological changes could negatively impact profitability.
Policies and procedures for the mitigation of risk may not be sufficient.
The Company has policies and procedures in place to help identify, analyze, and measure the risks associated with the issuance of title insurance policies, investment risks, interest rate risks and legal risks, among others. In evaluating risks, the Company considers enterprise risk management, information technology risk management, disaster recovery, business continuity, and vendor risk management. Because a significant degree of judgment is involved with the establishment of policies and processes as well as the measurement of risks, it is possible not all risks have been identified or anticipated. Misidentified or unanticipated risks could adversely impact the Company and its results of operations.
RISKS RELATED TO THE EFFECTS OF CLIMATE CHANGE, SEVERE WEATHER CONDITIONS, POTENTIAL PANDEMICS, HEALTH CRISES, OR OTHER CATASTROPHIC EVENTS
Our business could be adversely affected by climate change, severe weather conditions, potential pandemics, health crises, or the occurrence of another catastrophic event.
Climate change, extreme weather conditions and catastrophic events, such as future pandemic diseases, natural disasters and terrorist attacks, could have a material adverse effect on the Company’s future results of operations and financial condition. The Company’s business operations could be impacted, including availability of key Company personnel or the Company’s information technology systems, by volatility of real estate prices, significant climate migration, and disruptions to the real estate environment or financial markets. Given the unpredictable nature of these events with respect to size, severity, duration and geographic location, it is not currently possible to quantify the ultimate impact that they may have on the Company’s business.
17
RISKS RELATED TO OWNING THE COMPANY’S COMMON STOCK
Certain provisions ofin the Company’s organizational law, North Carolina law, organizational documents, and the Company’s shareholder rights plan may deter or discourage a takeover of the Company.
The Company has adopted a shareholder rights plan. The rights set forth in the plan are not intended toCompany’s articles of incorporation, as amended (the “Articles”) and amended and restated bylaws (the “Bylaws”) contain certain provisions that could delay, prevent a takeover of the Company, and we believe the rights would be beneficial to the Company and its shareholders in the event of negotiations with a potential acquirer. However, the shareholder rights plan couldor discourage transactions involving actual or potential changes of control, including transactions that may involve payment of a premium over prevailing market prices to the Company’s common shareholders. In addition, the Company has adopted a shareholder rights plan (the “Plan”). The provisions in the Company’s organizational documents and the rights set forth in the Plan are not intended to prevent a takeover of the Company, and the Company believes these protective measures are beneficial to the Company and its shareholders in the event of negotiations with a potential acquirer. These provisions are described in further detail in “Description of the Company’s Securities” incorporated by reference as Exhibit 4.1 to this Annual Report on Form 10-K.
The Company’s Bylaws provide that, unless the Company consents in writing to the selection of an alternative forum, the state courts of North Carolina will be the sole and exclusive forum for substantially all disputes between the Company’s and its shareholders.
The Bylaws provide that, unless the Company consents in writing to the selection of an alternative forum, the sole and exclusive forum for (i) any derivative action or proceeding brought in the name or right of the Company or on its behalf, (ii) any action asserting a claim of breach of a fiduciary duty owed by any director, officer or other employee of Company to the Company or its shareholders, (iii) any action asserting a claim arising pursuant to any provision of the North Carolina Business Corporation Act (the “NCBCA”), the Articles, or the Bylaws, (iv) any action to interpret, apply, enforce, or determine the validity of the Articles or the Bylaws, or (v) any action asserting a claim governed by the internal affairs doctrine, including, without limitation, any action to interpret, apply, enforce or determine the validity of the Articles or the Bylaws, shall be the state courts of North Carolina in and for Orange County, North Carolina, subject to designation or assignment to the North Carolina Business Court (or, if no state court located within the State of North Carolina has jurisdiction, the United States District Court for the Middle District of North Carolina). The Bylaws also provide that, notwithstanding the foregoing, (a) the provisions described above will not apply to suits brought to enforce any liability or duty created by the Exchange Act or any other claim for which the federal courts have exclusive jurisdiction, and (b) unless the Company consents in writing to the selection of an alternative forum, the federal district courts shall, to the fullest extent permitted by law, be the exclusive forum for the resolution of any complaint asserting a cause of action against the Company or any director, officer, employee, or agent of the Company and arising under the Securities Act (however, there is uncertainty as to whether a court would enforce such provision, and investors cannot waive compliance with federal securities laws and the rules and regulations thereunder). The choice of forum provision may limit a shareholder’s ability to bring a claim in a judicial forum that it finds favorable for disputes with the Company or its directors, officers or other employees and may also result in increased costs for shareholders to bring any such claim, which may discourage such lawsuits against the Company and its directors, officers, and other employees.
If a court were to find the choice of forum provision contained in the Bylaws to be inapplicable or unenforceable in an action, the Company may incur additional costs associated with resolving such action in other jurisdictions, which could harm the Company’s business, results of operations, and financial condition. Even if the Company is successful in defending against these claims, litigation could result in substantial costs and be a distraction to management and other employees.
None.
ITEM 1C. CYBERSECURITY
Cybersecurity Risk Management and Strategy
Our enterprise information security program is designed to detect, manage, mitigate, and respond to cybersecurity threats and is integrated into our overall risk management systems. The Company’s Chief Information Security Officer (“CISO”), in concert with a Data Security Committee, is responsible for developing and implementing our enterprise information security program and reporting cybersecurity matters to senior management.
18
Our risk management strategy encompasses a range of policies, procedures, and controls designed to safeguard our information assets. Key elements of our risk management and control framework include Information Technology (“IT”) policies and procedures, employee training, annual disaster recovery tests, and penetration tests performed by third-party experts. The Company has established robust IT policies and procedures governing the use, access, and protection of our digital assets. These policies serve as a foundation for secure operations, outlining best practices and compliance standards for our employees. The Company recognizes the crucial role of employees in maintaining a secure environment and conducts regular cybersecurity training programs. These initiatives are designed to empower our staff with the knowledge and skills necessary to identify and respond to potential threats, reducing the risk of human error in cybersecurity matters. To test the preparedness of our operations in the face of unforeseen events, the Company conducts annual disaster recovery tests. These tests evaluate our ability to recover critical systems and data in the event of a disruption, contributing to our overall business continuity and risk mitigation efforts. As part of our commitment to maintaining a strong defense against cyber threats, the Company engages third-party experts to conduct regular penetration tests on our network. These tests are intended to simulate real-world cyber-attacks, allowing us to identify vulnerabilities and address them proactively.
The Company’s planned investments in cybersecurity include implementing advanced data loss prevention measures, encryption protocols, and continuous monitoring to safeguard sensitive information and mitigate the risk of unauthorized access or disclosure. As part of the Company’s risk management strategy, it has secured comprehensive cyber insurance coverage. The Company regularly reviews and updates its cyber insurance coverage to align with the evolving nature of cyber threats and industry standards.
The Company’s IT systems have been, and likely will continue to be, the target of computer viruses, cyberattacks, phishing attacks, and other malicious activity. While the Company has not experienced a known material breach to date, the occurrence or scope of such events is not always immediately apparent and there can be no assurance that the Company will not suffer additional attacks or incur serious financial consequences or expense in the future. Refer to “Item 1A. Risk Factors” of this Annual Report on Form 10-K for further discussion of cybersecurity risks
Governance
The Company’s Board of Directors oversees the processes for risk management, including cybersecurity risks, to help align risk exposure with strategic objectives. Senior management, including our CISO, periodically briefs the Board of Directors on our cybersecurity framework and assessments of the information security program, key and emerging threats and risks, the status of projects to strengthen our information security systems, and any cybersecurity incidents that could potentially have a material business impact. In the event of an incident, the Company would follow a detailed incident response plan, which outlines the steps to be followed, including notification of senior management and the Board of Directors, as appropriate.
Our CISO has 25 years of experience in the cybersecurity and technology space. Our Data Security Committee is composed of key business and functional stakeholders to include Risk, Legal, Finance, IT, Operations, and Business line leads.
The Company owns two adjacent office buildings and property located on the corner of North Columbia and West Rosemary streets in Chapel Hill, North Carolina, which serve as the Company’s corporate headquarters. The main building contains approximately 23,000 square feet and has on-site parking facilities. The Company’s subsidiaries, principally ITIC and NITIC, lease office space in 37 locations throughout North Carolina, South Carolina, Texas, Michigan, Florida, Georgia and Nebraska. The Company believes that each of the office facilities occupied by the Company and its subsidiaries are in good condition, adequately insured and sufficient for its present operations.
The Company and its subsidiaries are involved in legal proceedings that are incidental to their business. In the Company’s opinion, based on the present status of these proceedings, any potential liability of the Company or its subsidiaries with respect to these legal proceedings, will not, in the aggregate, be material to the Company’s consolidated financial condition or operations. Additional information about the Company’s legal proceedings is included in Note 11 of the Notes to the Consolidated Financial Statements.
Not ApplicableApplicable.
19
PART II
ITEM 5. MARKET FOR REGISTRANT’S COMMON EQUITY, RELATED STOCKHOLDERSHAREHOLDER MATTERS AND ISSUER PURCHASES OF EQUITY SECURITIES
Common Stock Data and Dividends
The Common Stockcommon stock of the Company is traded under the symbol “ITIC” on the NASDAQNasdaq Stock Market LLC. The number of record holders of common stock at December 31, 20172023 was 269.209. The number of record holders is based upon the actual number of holders registered on the books of the Company at such date and does not include holders of shares in “street name” or persons, partnerships, associations, corporations or other entities identified in security position listings maintained by securities depositories. The following table shows, for the periods indicated, the high and low sales prices of the Company’s Common Stock as reported on the NASDAQ Global Market, and cash dividends declared.
| 2017 | 2016 | ||||||||||||||||||||||
| High | Low | Dividend Paid | High | Low | Dividend Paid | ||||||||||||||||||
| First Quarter | $ | 163.34 | $ | 118.10 | $ | 0.20 | $ | 99.89 | $ | 76.35 | $ | 0.16 | |||||||||||
| Second Quarter | $ | 199.75 | $ | 153.71 | $ | 0.35 | $ | 106.80 | $ | 82.13 | $ | 0.16 | |||||||||||
| Third Quarter | $ | 196.79 | $ | 169.25 | $ | 0.40 | $ | 102.70 | $ | 88.70 | $ | 0.20 | |||||||||||
| Fourth Quarter | $ | 203.97 | $ | 178.50 | $ | 2.80 | $ | 174.10 | $ | 93.78 | $ | 0.20 | |||||||||||
The Company’s current dividend policy anticipates the payment of quarterly dividends in the future. The declaration and payment of dividends will be at the discretion of the Board of Directors and will be dependent upon the Company’s future earnings, financial condition and capital requirements. The Company’s ability to pay dividends is also subject to certain regulatory restrictions on the payment of dividends by its insurance subsidiaries as described in the “Liquidity and Capital Resources” section of “Item 7. Management’s Discussion and Analysis of Financial Condition and Results of Operations,” and Note 2 to the Consolidated Financial Statements included in Item 8 of this Form 10-K.Statements.
| Issuer Purchases of Equity Securities (unrounded) | |||||||||||||||||||||||
| Period | Total Number of Shares Purchased | Average Price Paid per Share | Total Number of Shares Purchased as Part of Publicly Announced Plan | Maximum Number of Shares that May Yet Be Purchased Under the Plan (1) | |||||||||||||||||||
| Beginning of period | 420,216 | ||||||||||||||||||||||
| October 1 through October 31, 2023 | — | $ | — | — | 420,216 | ||||||||||||||||||
| November 1 through November 30, 2023 | — | — | — | 420,216 | |||||||||||||||||||
| December 1 through December 31, 2023 | — | — | — | 420,216 | |||||||||||||||||||
| Total | — | $ | — | — | 420,216 | ||||||||||||||||||
(1)On November 9, 2015, the Board of Directors of the Company approved the purchase of an additional 163,335 shares pursuant to the Company’s repurchase plan, such that there was authority remaining under the plan to purchase up to an aggregate of 500,000 shares of the Company’s common stock pursuant to the plan immediately after this approval. During the quarter and year ended December 31, 2017,2023, the Company purchased a total of 1,3330 and 7,000 shares of the Company’s common stock at an average per share price of $183.67 under the Company’s repurchase plan.plan, respectively. As of December 31, 2017,2023, there was authority remaining under the plan to purchase up to an aggregate of 428,444420,216 shares of the Company’s common stock. Unless terminated earlier by resolution of the Board of Directors, the plan will expire when all shares authorized for purchase under the plan (as such number may be amended by the Board from time to time) have been purchased. The Company anticipates making further purchases under this plan from time to time in the future, depending on such factors as the prevailing market price of the Company’s common stock, the Company’s available cash and thenthe existing alternative uses for such cash.
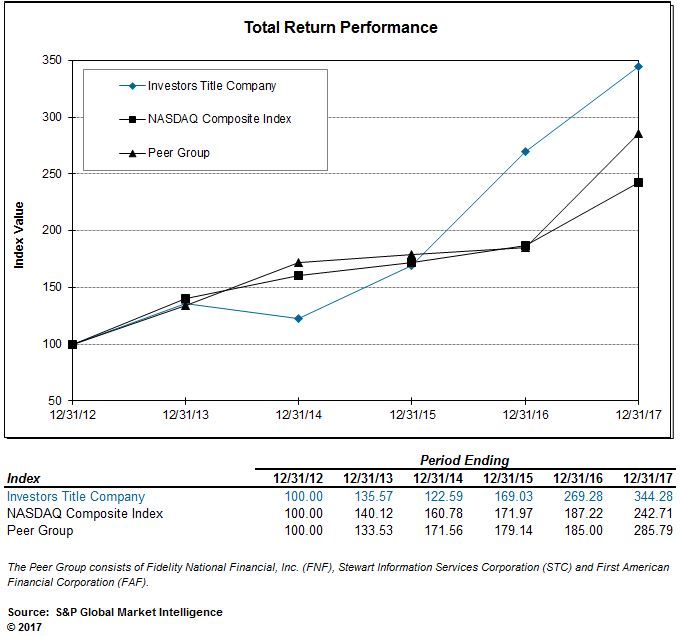
ITEM 6. SELECTED FINANCIAL DATA[Reserved]
| For the Year | 2017 | 2016 | 2015 | 2014 | 2013 | ||||||||||||||
| Net premiums written | $ | 138,589 | $ | 120,569 | $ | 111,909 | $ | 109,567 | $ | 113,669 | |||||||||
| Investment income | 4,444 | 4,684 | 4,531 | 4,260 | 3,895 | ||||||||||||||
| Revenues | 161,649 | 138,492 | 127,200 | 123,119 | 126,251 | ||||||||||||||
| Net income attributable to the Company | 25,707 | 19,523 | 12,534 | 9,649 | 14,708 | ||||||||||||||
| Per Share Data | |||||||||||||||||||
| Basic earnings per common share | $ | 13.63 | $ | 10.23 | $ | 6.32 | $ | 4.75 | $ | 7.15 | |||||||||
Weighted average shares outstanding – Basic | 1,886 | 1,908 | 1,984 | 2,032 | 2,056 | ||||||||||||||
| Diluted earnings per common share | $ | 13.56 | $ | 10.19 | $ | 6.30 | $ | 4.74 | $ | 7.08 | |||||||||
Weighted average shares outstanding – Diluted | 1,896 | 1,915 | 1,990 | 2,038 | 2,077 | ||||||||||||||
| Cash dividends per share | $ | 3.75 | $ | 0.72 | $ | 0.40 | $ | 0.32 | $ | 0.32 | |||||||||
| At Year-End | |||||||||||||||||||
| Assets | $ | 248,913 | $ | 228,938 | $ | 211,522 | $ | 198,039 | $ | 188,306 | |||||||||
| Investments | 186,520 | 160,854 | 160,552 | 159,411 | 142,764 | ||||||||||||||
| Stockholders’ equity attributable to the Company | 177,835 | 155,045 | 142,670 | 137,564 | 128,062 | ||||||||||||||
| Book value/share attributable to the Company | 94.29 | 82.28 | 73.17 | 67.99 | 62.86 | ||||||||||||||
| Performance Ratios | |||||||||||||||||||
| Net income attributable to the Company to: | |||||||||||||||||||
| Average stockholders’ equity attributable to the Company | 15.44 | % | 13.12 | % | 8.95 | % | 7.27 | % | 12.12 | % | |||||||||
| Total revenues | 15.90 | % | 14.10 | % | 9.85 | % | 7.84 | % | 11.65 | % | |||||||||
ITEM 7. MANAGEMENT’S DISCUSSION AND ANALYSIS OF FINANCIAL CONDITION AND RESULTS OF OPERATIONS
The following discussion should be read in conjunction with the Consolidated Financial Statements and the related notes in this report. Forward-lookingThe following discussion may contain forward-looking statements. These forward-looking statements are based on certain assumptions and expectations of future events that are subject to a number of risks and uncertainties. Actual results may vary. See the sections in this Annual Report on Form 10-K titled “Safe Harbor and Forward-Looking Statements” and “Risk Factors” included in Part I, Item 1A that could affect forward-looking statements.
Overview
Title Insurance
Investors Title Company (the “Company”) is a holding company that engages primarily in issuing title insurance through two subsidiaries, Investors Title Insurance Company (“ITIC”) and National Investors Title Insurance Company (“NITIC”). Total revenues from the title segment accounted for 95.6%89.4% of the Company’s revenues in 2017.2023. Through ITIC and NITIC, the Company underwrites land title insurance for owners and mortgagees as a primary insurer.
Title insurance protects against loss or damage resulting from title defects that affect real property and customarily arising prior to the policy date. When real property is conveyed from one party to another, occasionally there is an undisclosed defect in the title or a mistake or omission in a prior deed, will or mortgage that may give a third party a legal claim against such property. If a covered claim is made against real property, title insurance provides indemnification against insured defects.
There are two basic types of title insurance policies -– one for the mortgage lender and one for the real property owner. A lender often requires the property owner to purchase a lender’s title insurance policy to protect its position as a holder of a mortgage loan, but the lender’s title insurance policy does not protect the property owner. The property owner has to purchase a separate owner’s title insurance policy to protect its investment. When real property is conveyed from one party to another, occasionally there is an undisclosed defect in the title or a mistake or omission in a prior deed, will or mortgage that may give a third party a legal claim against such property. If a covered claim is made against real property, title insurance provides indemnification against insured defects.
The Company issues title insurance policies through its home and branch officesdirectly and through a network of agents. Issuing agents are typically real estate attorneys, independent agents or subsidiaries of community and regional mortgage lending institutions, depending on local customs and regulations and the Company’s marketing strategy in a particular territory. The ability to attract and retain issuing agents is a key determinant of the Company’s growth in title insurance premiums written.
Revenues for the title insurance segment primarily result from purchases of new and existing residential and commercial real estate, refinance activity and certain other types of mortgage lending such as home equity lines of credit.
Title insurance premiums vary from state to state and are subject to extensive regulation. Statutes generally provide that rates must not be excessive, inadequate or unfairly discriminatory. The process of implementing a rate change in most states involves pre-approval by the applicable state insurance regulator.
Volume is a factor in the Company’s profitability due to fixed operating costs whichthat are incurred by the Company regardless of title insurance premium volume. The resulting operating leverage tends to amplify the impact of changes in volume on the Company’s profitability. The Company’s profitability also depends, in part, upon its ability to manage its investment portfolio to maximize investment returns and to minimize risks such as interest rate changes, defaults and impairments of assets.
The Company’s volume of title insurance premiums is affected by the overall level of residential and commercial real estate activity, which includes property sales, mortgage financing and mortgage refinancing. Real estate activity, home sales and mortgage lending are cyclical in nature. In turn, realReal estate activity is affected by a number of factors, including the availability of mortgage credit, the cost of real estate, consumer confidence, employment and family income levels, and general United States economic conditions. Interest rate volatility is also an important factor in the level of residential and commercial real estate activity.
The Company’s title insurance premiums in future periods are likely to fluctuate due to these and other factors which are beyond management’s control.
21
Exchange Services
The Company’s exchange services division, consisting of the operations of ITEC and ITAC, provides customer services in connection with tax-deferred real property exchanges. ITEC servesacts as a qualified intermediary in like-kindtax-deferred exchanges under Section 1031of real property held for productive use in a trade or business or for investment, and its income is derived from fees for handling exchange transactions and a portion of the Internal Revenue Code of 1986, as amended.interest earned on client deposits held by the Company. In its role as qualified intermediary, ITEC coordinates the exchange aspects of the real estate transaction, and its duties include drafting standard exchange documents, holding the exchange funds between the sale oftime the old property is sold and the purchase of the new property is purchased, and accepting the formal identification of the replacement property within the required identification period. ITAC servesprovides services as an exchange accommodation titleholder for accomplishing “parking transactions” as set forth in the safe harbor contained in Internal Revenue Procedure 2000-37. These transactions include reverse exchanges. An exchange accommodation offers a vehicle for accommodating a reverse exchangeexchanges when the taxpayer musttaxpayers decide to acquire replacement property before selling the relinquished property, or “build to suit” exchanges, when improvements must be made to the replacement property before the taxpayer acquires the improved replacement property. The services provided by the Company’s exchange services division, ITEC and ITAC, are pursuant to provisions in the IRC. From time to time, these laws are subject to review and changes, which may negatively affect the demand for tax-deferred exchanges in general, and consequently, the revenues and profitability of the Company’s exchange services division.
Management Services, Investment Management and Trust Services
Other services provided by operating divisions of the Company are not reported separately, but rather are reported collectively in a category called “All Other.” These other services include those offered by the Company and by its wholly owned subsidiaries, Investors Title Management Services, Inc. (“ITMS”) and Investors Trust Company (“Investors Trust”).
ITMS offers various consulting and management services to provide clients with the technical expertise to start and successfully operate a title insurance agency.
The Company’s trust services division, Investors Trust, provides investment management and trust services to individuals, companies, banks and trusts.
Business Trends and Recent Conditions
The housing market is heavily influenced by government policies and overall economic conditions. Regulatory reform and initiatives by various governmental agencies, including the Federal Reserve's monetary policy and other regulatory changes, could impact lending standards or the processes and procedures used by the Company. The current real estate environment, including interest rates and general economic activity, typically influence the demand for real estate. Changes in either one, or both of these areas, would likelyin addition to any inventory constraints or volatility in the cost and availability of building materials, could impact the Company's results of operations.operations in future periods.
Regulatory Environment
The FOMC issues disclosures on a periodic basis that include projections of the federal funds rate and expected actions. At the December 2015 meeting, the FOMC voted to raise the federal funds rate for the first time since December 2008 toThe FOMC maintained a target range between 0.00% and 0.25% and 0.50%. Since December 2015,from March 2020 until March 2022. Starting at the March 2022 meeting of the FOMC, has voted four times to increase the federal funds rate. Specifically, the FOMC voted to increaseconsistently raised the target federal funds rate atrange through July 2023, when the December 2016 meeting to aFOMC increased the target range to between 0.50%5.25% and 0.75%, at5.50%. No additional changes to the March 2017 meeting to a target range between 0.75% and 1.00%, atfederal funds rate have been made since the June 2017 meeting to a target range between 1.00% and 1.25%, and most recently at the December 2017 meeting to a target range between 1.25% and 1.50%. AnyJuly 2023 meeting. In normal economic situations, future adjustments to the rateFOMC’s stance of monetary policy are expected to be based on realized and expected economic developments to achieve maximum employment and 2.0% inflation. The FOMC anticipates future economic conditions to evolve in ways that will warrant gradual increases and that for some time, the federal funds rate is expected to be below long range levels. At the September 2017 meeting,inflation near the FOMC announced the reduction of securities held on the Federal Reserve's balance sheet, also known as normalization, which began in October 2017.
's symmetric long-term 2.0% objective.
22
Real Estate Environment
2024. According to data published by Freddie Mac, the average 30-year fixed mortgage interest raterates in the United States was 4.0%, 3.6%were 6.8% and 3.8%5.3% for the years ended December 31, 2017, 20162023 and 2015,2022, respectively. Per the MBA Forecast, refinancing is expected to be lower in 2018 as mortgage interest rates continueare projected to climbdecrease in subsequent periods, reaching 5.5% in 2025. Due to a projected 4.8% in the fourth quarterrapidly changing environment brought on by inflationary pressures, inventory constraints, geopolitical and military conflicts and COVID-19, these projections and the impact of 2018. actual future developments on the Company could be subject to material change.
Historically, activity in real estate markets has varied over the course of market cycles by geographic region and in response to evolving economic factors. Operating results can vary from year to year based on cyclical market conditions and do not necessarily indicate the Company's future operating results and cash flows.
Critical Accounting Estimates and Policies
The Consolidated Financial Statements of the Company are prepared in conformity with accounting principles generally accepted in the United States (“GAAP”) and follow general practices within the industries in which it operates. This discussionpreparation requires management to make estimates and analysisassumptions that affect the amounts reported in the consolidated financial statements and accompanying notes. These estimates and assumptions are based on information available as of the date of the consolidated financial statements; accordingly, as this information changes, actual results could differ from the estimates and assumptions reflected in the consolidated financial statements. Certain estimates inherently have a greater reliance on the use of assumptions and judgments and, as such, have a greater possibility of producing results that could be materially different than originally reported. Management believes the following estimates are both important to the portrayal of the Company’s financial condition and results of operations is based uponand require subjective or complex judgments and, therefore, management considers the Company’s accompanying Consolidated Financial Statements, which have been prepared in accordance withfollowing to be critical accounting principles generally accepted in the United States. The Company’s management makes various estimates and judgments when applying policies affecting the preparation of the Consolidated Financial Statements. Actual results could differ from those estimates. Significant accounting policies of the Company are discussed in Note 1 to the accompanying Consolidated Financial Statements. Following are the accounting estimates and policies considered critical to the Company.
Reserve for Claim Losses
The Company’s reserve for claims is established using estimates of amounts required to settle claims for which notice has been received (reported) and the amount estimated to be required to satisfy incurred claims of policyholders which may be reported in the future (incurred but not reported, or “IBNR”). The total reserve for all losses incurred but unpaid as of December 31, 20172023 is represented by the reserve for claims totaling $34,801,000$37.1 million in the accompanying Consolidated Balance Sheets.Sheets included in Item 8 of this Annual Report on Form 10-K (the “Consolidated Balance Sheets”). Of that total, approximately $4,646,000$2.9 million was reserved for specific claims which have been reported to the Company, and approximately $30,155,000$34.3 million was reserved for IBNR claims.
A provision for estimated future claims payments is recorded at the time the related policy revenue is recorded. The Company records the claims provision estimate as a percentage of net premiums written. In making loss estimates, management determines a loss provision rate, which it then applies to net premiums written. This loss provision rate is set to provide for losses on current year policies. By their nature, title claims can often be complex, vary greatly in dollar amounts, vary in number due to economic and market conditions such as an increase in mortgage foreclosures, and involve uncertainties as to ultimate exposure. In addition, some claims may require a number of years to settle and determine the final liability for indemnity and loss adjustment expense. The payment experience may extend for more than 20 years after the issuance of a policy. Events such as fraud, defalcation and multiple property defects can substantially and unexpectedly cause increases in estimates of losses. Due to the length of time over which claim payments are made and regularly occurring changes in underlying economic and market conditions, these estimates are subject to variability.
Management considers factors such as the Company’s historical claims experience, case reserve estimates on reported claims, large claims, actuarial projections and other relevant factors in determining its loss provision rates and the aggregate recorded expected liability for claims. In establishing the reserve, actuarial projections are compared with recorded reserves to evaluate the adequacy of such recorded claims reserves and any necessary adjustments are then recorded in the current period’s income statement.Consolidated Statement of Operations. Loss ratios for older years tend to be more reliable than recent policy years as those years are more fully developed. As the most recent claims experience develops and new information becomes available, the loss reserve estimate related to prior periods will change to more accurately reflect updated and improved emerging data. The Company reflects any adjustments to the reserve in the results of operations in the period in which new information (principally claims experience) becomes available.
The Company initially reserves for each known claim based upon an assessment of specific facts and updates the reserve amount as necessary over the course of administering each claim. Loss ratios for earlier years tend to be more reliable than recent policy years, as those years are more fully developed. In making loss estimates, management determines a loss provision rate, which it then applies to net premiums written.
23
The Company assumes the reported liability for known claims and IBNR, in the aggregate, will be comparable to its historical claims experience unless factors, such as loss experience and charged premium rates, change significantly. Also affecting the Company’s assumptions are large losses related to fraud and defalcation, as these can cause significant variances in loss emergence patterns. Management defines a large loss as one where incurred losses exceed $250,000.$500,000. Due to the small volume of large claims, the long-tail nature of title insurance claims and the inherent uncertainty in loss emergence patterns, large claim activity can vary significantly between policy years. The estimated development of large claims by policy year is, therefore, subject to significant changes as experience develops. The loss provision rate is set to provide for losses on current year policies and changes in prior year estimates.
Management also considers actuarial analyses in evaluating the claims reserve. The actuarial methods used to evaluate the reserve are loss development methods, Bornhuetter-Ferguson methods and Cape Cod methods, all of which are accepted actuarial methods for estimating ultimate losses and, therefore, loss reserves. In the loss development method, each policy year’s paid or incurred losses are projected to an “ultimate”ultimate level using loss development factors. In the Bornhuetter-Ferguson method, a type of expected loss method, losses for each policy year are estimated based on an expected loss ratio derived directly from a previous estimate of ultimate loss for each policy year plus an additional provision for losses that have not been reported or paid as of the evaluation date. Bornhuetter-Ferguson methods produce more stable ultimate loss estimates than do loss development methods, which are more responsive to the current loss data but can lead to volatile results. The Cape Cod method, a special case of the Bornhuetter-Ferguson method, blends the results of the loss development and expected loss methods. For more recent policy years, the Cape Cod methods give more weight to the results of the expected loss methods; for older policy years, more weight is given to the loss development method results.
The key actuarial assumptions are principally loss development factors and expected loss ratios. The selected loss development factors are based on a combination of the Company’s historical loss experience and title industry loss experience. Expected loss ratios are estimated for each policy year based on the Company’s own experience and title industry loss ratios. When updated data is incorporated into the actuarial models, the resulting loss development factors and expected loss ratios will likely change from the prior values. Changes in these values for historical policy years have generally been the result of actual Company and industry experience during the calendar years.
If one or more of the variables or assumptions used changed such that the Company’s recorded loss ratio, or loss provision as a percentage of net title premiums, increased or decreased three loss ratio percentage points, the impact on after-tax income for the year ended December 31, 20172023 would be as follows:
| (in thousands) | |||||
| Increase in loss ratio of three percentage points | $ | (4,056) | |||
| Decrease in loss ratio of three percentage points | $ | 4,056 | |||
| Increase in loss ratio of three percentage points | $ | (2,702,000 | ) |
| Decrease in loss ratio of three percentage points | $ | 2,702,000 | |
Company management believes that using a sensitivity of three loss percentage points for the loss ratio provides a reasonable benchmark for analysis of the calendar year loss provision of the Company based on historical loss ratios by year.
Despite the variability of such estimates, management believes that, based on historical claims experience and actuarial analysis, the Company’s reserve for claims is adequate to cover claim losses resulting from pending and future claims for policies issued through December 31, 2017.2023. The ultimate settlement of claims will likely vary from the reserve estimates included in the Company’saccompanying Consolidated Financial Statements. The Company continually reviews and adjusts its reserve estimates to reflect its loss experience and any new information that becomes available. There are no known claims that are expected to have a material adverse effect on the Company’s financial position or operating results.
Premiums Written and Commissions to Agents
Generally, title insurance premiums are recognized at the time of settlement of the related real estate transaction, as the earnings process is then considered complete, irrespective of the timing of the issuance of a title insurance policy or commitment. Expenses typically associated with premiums, including agent commissions, premium taxes, and thea provision for future claims are recognized concurrent with recognition of related premium revenue.
24
Total premiums include accrualsan estimate of premiums for transactions whichpolicies that have settledbeen issued directly and by agents, but have not been reported to the Company as of the balance sheet date. These accruals are based on estimates ofTo determine the typical lagestimated premiums, the Company uses historical experience, as well as other factors, to make certain assumptions about the average elapsed time between settlement of real estate transactionsthe policy effective date and the agent’s reporting of these transactions todate the Company.policies are reported. Reporting lag times vary by market. In certain markets, the lag time may be very short, but in others, can be as high as 100 days.three months. From time to time, the Company adjusts the inputs to the estimation process as branches and agents report transactions and new information becomes available. The Company reviews and adjusts lag time estimates periodically, using historical experience and other factors, and reflects any adjustments in the result of operations in the period in which new information becomes available.
Quarterly, the Company evaluates the collectability of receivables. Premiums not collected within 7 months are fully reserved. Write-offs of receivablesReceivables deemed uncollectible have not been material to the Company.
Valuation, Impairment and ImpairmentCredit Losses of Investments in Securities
Securities are regularly evaluated and reviewed for differences between the cost and estimated fair value of each security for factorsindicating impairment. Factors considered in determining whether the impairment is credit-related include the financial condition and prospects of the issuer (including credit ratings and analyst reports) and macro-economic changes. If the Company intends to sell an available-for-sale security in an unrealized loss position, or determines that may indicateit is more likely than not that a decline inthe Company will be required to sell the security before it recovers its amortized cost basis, the security is impaired and it is written down to estimated fair value is other-than-temporary. When,with all losses recognized in earnings. For available-for-sale fixed maturity securities in an unrealized loss position for which the opinion of management, aCompany does not intend to sell the security, the Company evaluates the securities to determine whether the decline in the estimated fair value below the amortized cost basis (impairment) is due to credit-related factors or noncredit-related factors. Any impairment that is not credit-related is recognized in other comprehensive income (loss), net of applicable taxes. Credit-related impairment is recognized as an investment is consideredallowance for credit losses (“ACL”) in the Consolidated Balance Sheets, limited to be other-than-temporary, such investment is written down to its estimated fair value. Some factors considered in evaluating whether or not a decline inthe amount by which the amortized cost basis exceeds the estimated fair value, is other-than-temporary include, butwith a corresponding adjustment to earnings.
Both the ACL and the adjustment to the Consolidated Statements of Operations may be reversed if conditions change. Changes in the ACL are not limited to:
recorded as provision for (or reversal of) credit loss expense. Losses are charged against the duration and extent to whichACL when management believes the fair value has been less than cost;
Investments in Equity Securities: Equity securities represent ownership interests held by the Company in entities for investment purposes. Unrealized holding gains and losses are reported in the Consolidated Statements of Operations as net investment gains (losses). Realized investment gains and losses from sales are recorded on the trade date and are determined using the specific identification method. Refer to Note 3 to the Consolidated Financial Statements for further information about the Company’s investments in equity securities.
Other Investments: Other investments consist of investments in real estate and unconsolidated affiliated entities, typically structured as limited liability companies ("LLCs"), without readily determinable fair values.
Real estate investments are reported at amortized cost. The Company monitors any events or changes in circumstances that may have had a significant adverse effect on the fair value of real estate investments and makes any necessary adjustments, with any reductions in the carrying amount of these investments recorded in net realized investment gains in the Consolidated Statement of Operations when recognized.
Other investments are accounted for under either the equity method or the measurement alternative method. The measurement alternative method is used when an investment does not qualify for the equity method or an estimated fair value using the net asset value per share. Under the measurement alternative method, investments are recorded at cost, less any impairment and plus or minus any changes resulting from observable price changes in orderly transactions for an identical or similar investment of the same issuer. The Company monitors any events or changes in circumstances that may have had a significant adverse effect on the estimated fair value of these investments and makes any necessary adjustments.
The fair values of the majority of the Company’s investments are based on quoted market prices from independent pricing services. SeeRefer to Note 3 to the Consolidated Financial Statements included in this Annual Report on Form 10-K for further information about the Company’s valuation techniques.
25
Deferred Taxes
The Company recorded net deferred tax liabilities at December 31, 20172023 and 2016.2022. The deferred tax liabilities recorded during both periods primarily relate to net unrealized gains on investments, the recorded reserve for claims, net of statutory premium reserves, the excess of tax over book depreciation, recorded statutory premium reserve, net of reserve for claims, 1031 exchange gains, and intangible assets. SeeRefer to Note 8 to the Consolidated Financial Statements in this Annual Report on Form 10-K for further information on the Company’s deferred taxes.
Cyclicality and Seasonality
Real estate activity, home sales and mortgage lending are cyclical in nature. Title insurance premiums are closely related to the level of real estate activity and the average price of real estate sales. Factors directly impacting realReal estate sales include mortgage interest rates andactivity is affected by a number of factors, including the availability of funds,mortgage credit, the cost of real estate, consumer confidence, economic conditions, supply and demandemployment and family income levels.levels, and general United States economic conditions. Interest rate volatility is also an important factor in the level of residential and commercial real estate activity. The Company’s premiums in future periods are likely to fluctuate due to these and other factors which are beyond management’s control.
Historically, the title insurance business tends to be seasonal as well as cyclical.Because home sales are typically strongest in periods of favorable weather, the first calendar quarter tends to have the lowest activity levels, while the spring and summer seasons tend to be more active. Refinance activity is generally less seasonal, but is subject to interest rate fluctuations.
Seasonal factors affecting the level of real estate activity and the volume of title premiums written will also affect the demand for exchange services.
Results of Operations
The following table presents certain income statementConsolidated Statements of Operations data for the years ended December 31, 2017, 20162023 and 2015:2022:
| For the Years Ended December 31, (in thousands) | 2023 | 2022 | ||||||||||||
| Revenues: | ||||||||||||||
| Net premiums written | $ | 171,158 | $ | 248,632 | ||||||||||
| Escrow and other title-related fees | 17,109 | 22,314 | ||||||||||||
| Non-title services | 19,237 | 13,931 | ||||||||||||
| Interest and dividends | 9,055 | 4,704 | ||||||||||||
| Other investment income | 3,752 | 3,896 | ||||||||||||
| Net investment gains (losses) | 3,448 | (11,226) | ||||||||||||
| Other | 991 | 1,141 | ||||||||||||
| Total Revenues | 224,750 | 283,392 | ||||||||||||
| Operating Expenses: | ||||||||||||||
| Commissions to agents | 83,374 | 121,566 | ||||||||||||
| Provision for claims | 4,762 | 4,255 | ||||||||||||
| Personnel expenses | 76,706 | 85,331 | ||||||||||||
| Office and technology expenses | 17,359 | 17,323 | ||||||||||||
| Other expenses | 16,319 | 24,809 | ||||||||||||
| Total Operating Expenses | 198,520 | 253,284 | ||||||||||||
| Income before Income Taxes | 26,230 | 30,108 | ||||||||||||
| Provision for Income Taxes | 4,544 | 6,205 | ||||||||||||
| Net Income | $ | 21,686 | $ | 23,903 | ||||||||||
26
| For the Years Ended December 31, | 2017 | 2016 | 2015 | |||||||||
| Revenues: | ||||||||||||
| Net premiums written | $ | 138,588,877 | $ | 120,569,151 | $ | 111,909,473 | ||||||
| Investment income – interest and dividends | 4,444,447 | 4,684,489 | 4,531,319 | |||||||||
| Net realized gain (loss) on investments | 1,040,901 | 768,436 | (116,163 | ) | ||||||||
| Other | 17,575,071 | 12,470,338 | 10,875,443 | |||||||||
| Total Revenues | 161,649,296 | 138,492,414 | 127,200,072 | |||||||||
| Operating Expenses: | ||||||||||||
| Commissions to agents | 68,643,220 | 63,643,321 | 62,174,301 | |||||||||
| Provision for claims | 3,311,080 | 242,953 | 4,478,494 | |||||||||
| Salaries, employee benefits and payroll taxes | 39,012,354 | 31,372,099 | 28,041,213 | |||||||||
| Office occupancy and operations | 8,966,623 | 6,265,908 | 5,885,336 | |||||||||
| Business development | 3,164,730 | 2,511,699 | 2,373,270 | |||||||||
| Filing fees, franchise and local taxes | 1,198,013 | 907,225 | 732,985 | |||||||||
| Premium and retaliatory taxes | 2,672,034 | 2,202,595 | 2,161,571 | |||||||||
| Professional and contract labor fees | 1,825,598 | 2,115,754 | 2,691,411 | |||||||||
| Other | 2,585,074 | 1,099,408 | 884,438 | |||||||||
| Total Operating Expenses | 131,378,726 | 110,360,962 | 109,423,019 | |||||||||
| Income before Income Taxes | 30,270,570 | 28,131,452 | 17,777,053 | |||||||||
| Provision for Income Taxes | 4,570,000 | 8,616,000 | 5,228,000 | |||||||||
| Net Income Attributable to the Company | $ | 25,706,502 | $ | 19,523,118 | $ | 12,533,905 | ||||||
Revenues
| (in thousands, except percentages) | 2023 | % | 2022 | % | |||||||||||||||||||
| Title Insurance | $ | 200,937 | 89.4 | $ | 269,004 | 94.9 | |||||||||||||||||
| Exchange Services | 13,467 | 6.0 | 8,082 | 2.9 | |||||||||||||||||||
| All Other | 10,346 | 4.6 | 6,306 | 2.2 | |||||||||||||||||||
| Total | $ | 224,750 | 100.0 | $ | 283,392 | 100.0 | |||||||||||||||||
| 2017 | % | 2016 | % | 2015 | % | |||||||||||||||
| Title Insurance | $ | 149,716,397 | 95.9 | % | $ | 127,228,426 | 95.6 | % | $ | 117,281,588 | 95.5 | % | ||||||||
| All Other | 6,447,551 | 4.1 | % | 5,811,063 | 4.4 | % | 5,503,328 | 4.5 | % | |||||||||||
| Total | $ | 156,163,948 | 100.0 | % | $ | 133,039,489 | 100.0 | % | $ | 122,784,916 | 100.0 | % | ||||||||
Title Insurance Revenues
Title insurance revenues include net premiums written and escrow and other title-related income that includes escrow fees, commissions and settlement fees. Non-title services revenue, investment-related revenues and other revenues are discussed separately below.
Net Premiums: Written
Net premiums written increased 14.9%decreased 31.2% in 20172023 to $138,588,877$171.2 million, compared with $120,569,151$248.6 million in 2016, and increased 7.7%2022. The decrease in 20162023, compared with $111,909,473 in 2015. The increase in 2017 compared with 20162022, was primarily due to higher levels of home sales in our core markets, a continuation of the multi-year trend of increases in the underlying values of real estate, and business from newly-signed agents, partially offsetdriven by a decreasean overall decline in the level of refinance activity. The increase in 2016 net premiums versus the prior year is primarily attributable to growth in average real estate values, coupled with growth in transaction volumes stemmingresulting from higher levels of home salesaverage mortgage interest rates and refinance activity.ongoing housing inventory constraints.
| 2017 | % | 2016 | % | 2015 | % | |||||||||||||||
| Home and Branch | $ | 40,244,394 | 29.0 | % | $ | 33,482,154 | 27.8 | % | $ | 27,834,881 | 24.9 | % | ||||||||
| Agency | 98,344,483 | 71.0 | % | 87,086,997 | 72.2 | % | 84,074,592 | 75.1 | % | |||||||||||
| Total | $ | 138,588,877 | 100.0 | % | $ | 120,569,151 | 100.0 | % | $ | 111,909,473 | 100.0 | % | ||||||||
| (in thousands, except percentages) | 2023 | % | 2022 | % | |||||||||||||||||||
| Direct | $ | 58,063 | 33.9 | $ | 85,676 | 34.5 | |||||||||||||||||
| Agency | 113,095 | 66.1 | 162,956 | 65.5 | |||||||||||||||||||
| Total | $ | 171,158 | 100.0 | $ | 248,632 | 100.0 | |||||||||||||||||
Direct Net Premiums: The Company's direct business consists of operations at the home office, branch offices, and wholly owned title insurance agencies. In the Company's direct operations, the Company issues a title insurance policy and retains the entire premium, as no commissions are recognized in connection with these policies. Net premiums written from direct operations decreased 32.2% in 2023 to $58.1 million, compared with $85.7 million in 2022. The decrease in net premiums written from direct operations for 2023, compared with 2022, was primarily attributable to an overall decline in the level of real estate transaction volumes resulting from higher average mortgage interest rates and ongoing housing inventory constraints.
Agency Net Premiums: When a policy is written through a non-wholly owned title agency, the premium is shared between the agency and the underwriter. The agent retains a majority of the premium as a commission and remits the net amount to the Company. Title insurance commissions earned by the Company’s agents are recognized as expenses concurrently with premium recognition. Agency net premiums written increased 12.9%decreased 30.6% in 20172023 to $98,344,483$113.1 million, compared with $87,086,997$163.0 million in 2016, and increased 3.6%2022. The decrease in 20162023, compared with $84,074,592 in 2015. The increases in 2017 and 2016 compared with their respective prior years were2022, was primarily attributable to the addition of new title insurance agentsan overall decline in the Company's Texas and southeast markets, higher levelslevel of real estate activitytransaction volumes resulting from existing agentshigher average mortgage interest rates and overall higher home prices. ongoing housing inventory constraints.
27
The increase in 2017 was partially offset by lower refinance activity.
| State (in thousands) | 2023 | 2022 | |||||||||
| North Carolina | $ | 64,143 | $ | 88,777 | |||||||
| Texas | 46,308 | 72,278 | |||||||||
| South Carolina | 16,023 | 23,454 | |||||||||
| Georgia | 11,731 | 22,954 | |||||||||
| All Others | 33,307 | 41,987 | |||||||||
| Premiums Written | 171,512 | 249,450 | |||||||||
| Reinsurance Assumed | — | — | |||||||||
| Reinsurance Ceded | (354) | (818) | |||||||||
| Net Premiums Written | $ | 171,158 | $ | 248,632 | |||||||
| State | 2017 | 2016 | 2015 | ||||||||
| North Carolina | $ | 53,194,503 | $ | 42,868,773 | $ | 36,407,413 | |||||
| Texas | 26,545,852 | 24,162,213 | 25,211,496 | ||||||||
| South Carolina | 14,353,567 | 12,249,382 | 11,290,945 | ||||||||
| Georgia | 12,790,161 | 10,981,062 | 7,682,820 | ||||||||
| Virginia | 5,970,194 | 6,052,602 | 5,706,769 | ||||||||
| All Others | 25,996,003 | 24,378,815 | 25,791,094 | ||||||||
| Premiums Written | 138,850,280 | 120,692,847 | 112,090,537 | ||||||||
| Reinsurance Assumed | 2,756 | 17,246 | 33,603 | ||||||||
| Reinsurance Ceded | (264,159 | ) | (140,942 | ) | (214,667 | ) | |||||
| Net Premiums Written | $ | 138,588,877 | $ | 120,569,151 | $ | 111,909,473 | |||||
Escrow and Other RevenuesTitle-Related Fees
Escrow and other title-related fees consists primarily include other fee income,of commission income, escrow and other various fees associated with the issuance of a title insurance policy including settlement, examination and closing fees. In 2023, escrow and other title-related fee revenue decreased 23.3% to $17.1 million, compared with $22.3 million in 2022, primarily due to the decline in real estate transactions volume.
Revenue from Non-Title Services
Revenue from non-title services includes trust income,services, agency management services income,and exchange services income, and incomeincome. Non-title service revenues increased 38.1% in 2023 to $19.2 million, compared with $13.9 million in 2022. The increase in 2023, compared with 2022, primarily related to the Company’s equity method investments. Other revenues were $17,575,071, $12,470,338 and $10,875,443 in 2017, 2016 and 2015, respectively. Other revenues increased in 2017 compared with 2016 primarily due to increases in title fees, commission income and exchange services income. Other revenues increased in 2016 compared with 2015 primarily due to increases in commission income, title fees,segment benefiting from the impact of higher interest rate spreads on like-kind exchange services income and management services income, partially offset by a decrease in earnings of unconsolidated affiliates.deposits.
Investment Related Revenues
Investment related revenues include interest and dividends, other investment income, and realizednet investment gains (losses).
Interest and losses from investments are included in investment related revenues.Dividends
The Company derives a substantial portion of its income from investments in short-term investments, fixed maturity securities, which are primarily municipal and corporate bondsfixed maturity securities, and equity securities. The Company's title insurance subsidiaries are required by statute to maintain minimum levels of investments in order to protect the interests of policyholders. The Company’s investment policy is designed to comply with regulatory requirements and to balance the competing objectives of asset quality and investment returns. The Company’s title insurance subsidiaries are required by statute to maintain minimum levels of investments in order to protect the interests of policyholders. BondsFixed maturity securities totaling approximately $7,119,000 and $6,843,000$6.7 million at December 31, 20172023 and 2016, respectively,2022, were deposited with the insurance departments of the states in which business is conducted.
The Company’s investment strategy emphasizes after-tax income and principal preservation. The Company’s investments are primarily in bondsshort-term investments and fixed maturity securities and, to a lesser extent, equity securities. The average effective maturity of the majority of the bondsfixed maturity securities is less than 10 years. The Company’s invested assets are managed to fund its obligations and evaluated to ensure long term stability of capital accounts.
As the Company generates cash from operations, it is invested in accordance with the Company’s investment policy and corporate goals. The Company’s investment policy has been designed to balance multiple goals, including the assurance of a stable source of income from interest and dividends, the preservation of principal, and the provision of liquidity sufficient to meet insurance underwriting and other obligations as they become payable in the future. Securities purchased may include a combination of taxable bonds,or tax-exempt bondsfixed maturity securities and equity securities. The Company also invests in short-term investments that typically include money market funds, U.S. Treasury bills, commercial paper money-market funds and certificates of deposit. In addition, the Company holds other investments that are primarily investments in partnerships structured as limited liability companies. The Company strives to maintain a high quality investment portfolio. Since 2022, the Company has been purchasing higher levels of short-term investments to take advantage of elevated short-term interest rates during this period of uncertainty in the investment market.
28
Interest and dividends were $9.1 million in 2023, compared with $4.7 million in 2022. Interest and investment income levels are primarily a function of general market performance, interest rates and the amount of cash available for investment.
Other investment income consists primarily of income related to investments in unconsolidated affiliates, typically structured as LLCs, accounted for under either the equity method of accounting or the measurement alternative for investments that do not have readily determinable fair values. The measurement alternative method requires investments without readily determinable fair values to be recorded at cost, less impairments, and plus or minus any changes resulting from observable price changes. The Company monitors any events or changes in circumstances that may have had a significant adverse effect on the fair value of these investments and makes any necessary adjustments.
Other investment income was $3.8 million in 2023, compared with $3.9 million in 2022. Changes in other investment income are impacted by fluctuations in the carrying value of the underlying investment and/or distributions received.
Net Investment Gains (Losses)
Net investment gains (losses) include realized gains and losses on the sale of investment securities and changes in the estimated fair value of equity security investments. Net investment gains (losses) were $3.4 million and $(11.2) million in 2023 and 2022, respectively.
Net Realized Gain (Loss) on Investments
Investment Gains and Losses -Dispositions of equity securities at a realized gain or loss reflect such factors as industry sector allocation decisions, ongoing assessments of issuers’ business prospects and tax planning considerations. Additionally, the amounts ofincluded in net realized investment gains and losses(losses) are affected by assessments of securities’ valuation for other-than-temporary impairment. As a result of the interaction of these factors and considerations, the net realized investment gain or loss can vary significantly from period to period.
The net realized gain (loss) on investments was $1,040,901investment gains were $15.6 million for 20172023, compared with $768,436$9.7 million for 2016 and $(116,163) for 2015.2022. The net realized gain (loss) on investmentsgains in 2023 and 2022 included impairment charges of $208,077, $233,941$201 thousand and $984,128, on$172 thousand, respectively, for certain investments and other assets that were deemedfixed maturity securities where the intent to be other-than-temporarily impaired in 2017, 2016 and 2015, respectively, offset by a net realized gain on the sales of investments and other assets of $1,248,978, $1,002,377 and $867,965 in 2017, 2016, and 2015, respectively.hold had changed. Management believes unrealized losses on the remaining fixed income and equitymaturity securities at December 31, 20172023 are temporary in nature.not credit-related.
The securities in the Company’s investment portfolio are subject to economic conditions and market risks. The Company considers relevant facts and circumstances in evaluating whether a credit or interest-related impairment of a fixed maturity security is other-than-temporary.has occurred. Relevant facts and circumstances include the extent and length of time the fair value of an investment has been below cost.
There are a number of risks and uncertainties inherent in the process of monitoring impairments and determining if an impairment is other-than-temporary.exists. These risks and uncertainties include the risk that the economic outlook will be worse than expected or have more of an impact on the issuer than anticipated; the risk that the Company’s assessment of an issuer’s ability to meet all of its contractual obligations will change based on changes in the characteristics of that issuer; the risk that information obtained by the Company or changes in other facts and circumstances leads management to change its intent to hold the equity security until it recovers in value or its intent to sell the debtfixed maturity security; and the risk that management is making decisions based on misstatedinaccurate information in the consolidated financial statements provided by issuers.
Changes in the Estimated Fair Value of Equity Security Investments - Changes in the estimated fair value of equity security investments were $(12.2) million in 2023 and $(21.0) million in 2022. Such fluctuations are the result of changes in general market conditions during the respective periods, however, the sale of appreciated investment securities can result in a reduction in unrealized gains as they are reclassified to net realized investment gains, which is not indicative of a decline in estimated fair value.
Other Revenues
Other revenues primarily includes gains and losses on the disposal of assets, rental income from real estate investments and miscellaneous revenues. Other revenues were virtually unchanged at $1.0 million in 2023, compared with $1.1 million for 2022.
29
Expenses
The Company’sCompany's operating expenses consist primarily of agent commissions salaries, employee benefitsto agents, personnel expenses, office and payroll taxes, office occupancy and operationstechnology expenses and the provision for claims. Operating expenses increased 19.0%decreased 21.6% in 20172023, compared with 20162022, primarily due to increasesdecreases in payroll expense, agent commissions claims expenseto agents, personnel expenses and office occupancy and operations. Operating expenses increased 0.9% in 2016 compared with 2015 primarily due to increases in payroll expense and agent commissions, mostly offset by a decrease in claims.other operating expenses.
Following is a summary of the Company’s operating expenses for 2017, 20162023 and 2015.2022. Intersegment eliminations have been netted; therefore, the individual segment amounts will not agree to Note 12 in the accompanying Consolidated Financial Statements.
| (in thousands, except percentages) | 2023 | % | 2022 | % | |||||||||||||||||||
| Title Insurance | $ | 187,333 | 94.4 | $ | 242,280 | 95.7 | |||||||||||||||||
| Exchange Services | 2,414 | 1.2 | 2,588 | 1.0 | |||||||||||||||||||
| All Other | 8,773 | 4.4 | 8,416 | 3.3 | |||||||||||||||||||
| Total | $ | 198,520 | 100.0 | $ | 253,284 | 100.0 | |||||||||||||||||
| 2017 | % | 2016 | % | 2015 | % | |||||||||||||||
| Title Insurance | $ | 123,558,870 | 94.0 | % | $ | 103,828,173 | 94.1 | % | $ | 102,895,701 | 94.0 | % | ||||||||
| All Other | 7,819,856 | 6.0 | % | 6,532,789 | 5.9 | % | 6,527,318 | 6.0 | % | |||||||||||
| Total | $ | 131,378,726 | 100.0 | % | $ | 110,360,962 | 100.0 | % | $ | 109,423,019 | 100.0 | % | ||||||||
Total Company
Personnel Expenses: Personnel costsexpenses include base salaries, benefits and payroll taxes, and bonuses paid to employees. Salaries, employee benefitsemployees and payroll taxescontract labor expenses. Personnel expenses were $39,012,354, $31,372,099$76.7 million and $28,041,213$85.3 million for 2017, 20162023 and 2015,2022, respectively. Salaries and related costs increasedPersonnel expenses decreased by approximately 24.4%10.1% in 2017 from 2016 and 11.9% in 2016 from 2015. The increase in 20172023, compared with 20162022, primarily relateddue to increasesreductions in salaries, benefits and payroll expenses associated with the acquisition of a title agency that was acquired in the fourth quarter of 2016 and other staffing and inflationary increases. The increase in 2016 compared with 2015 was primarily related to higher levels of incentive compensation inflationary increases in salaries and benefits, payroll expenses associated with the acquisition of a title agency and increasesreductions in staffing levelslevels. Employee headcount decreased by 12.8%, when compared to accommodate higher volume.the same prior year period, primarily due to the Company's cost saving measures. On a consolidated basis, salaries and employee benefits as a percentage of total revenues were 24.1%, 22.7% and 22.0% in 2017, 2016 and 2015, respectively.
Office and Technology Expenses: Office and technology expenses primarily include marketingfacilities expenses, software and travel-related expenses. Business developmenthardware expenses, increased to $3,164,730depreciation expense, telecommunications expenses, and business insurance. Office and technology expenses were $17.4 million and $17.3 million for 2023 and 2022, respectively. The slight increase in 2017office and technology expenses in 2023, compared with $2,511,699 in 2016 and $2,373,270 in 2015,2022, was primarily due to increasesan increase in travel and marketingtechnology expenses partially offset by a decline in office expenses.
Other Expenses: Expenses: Other operating expenses primarily include amortization of intangible assets, other miscellaneousbusiness development expenses, of thepremium-related taxes and licensing, professional services, title segment and miscellaneous operating expenses of the trust division. These amounts typically fluctuate with transaction volume of the title segment and the trust division. Other expenses increased to $2,585,074 in 2017, compared with $1,099,408 in 2016 and $884,438 in 2015. Other operating expenses increased in 2017 and 2016 primarily due to theservice fees, amortization of intangible assets and miscellaneousother general expenses. Other expenses were $16.3 million and $24.8 million for 2023 and 2022, respectively. The decrease in 2023, compared with 2022, was mainly due to the impact of lower title insurance volumes and a reduction in the title segment.level of contractors engaged in software development activities.
Title Insurance
Commissions to a number of factors, including the volume and type of real estate activity. After-tax profit margins for the title insurance segment were 16.9% 15.0% and 10.9% in 2017, 2016 and 2015, respectively. The increase in after-tax profit margin in 2017 compared with 2016 was primarily related to an increase in operating revenues and a lower provision for taxes, partially offset by increases in salaries, employee benefits and payroll expenses, commissions to agents and the provision for claims. The increase in after-tax profit margin in 2016 compared with 2015 was primarily related to an increase in operating revenues and, a lower provision for claims, partially offset by an increase in salaries, employee benefits and payroll expenses.
Provision for Claims: The provision for claims increased 11.9% in 2023, compared to 2022. The provision for claims as a percentage of net premiums written was 2.4%, 0.2%2.8% and 4.0%1.7% in 2017, 20162023 and 2015,2022, respectively. The dollar increase in the provision for claims as a percentage of net premiums written in 20172023, compared with 20162022, was primarily relateddue to higher levels ofless favorable loss development in 2016. The decreaseand higher incurred claims in the provision for claims in 2016 compared with 2015 primarily related to favorable loss development, as the Company’s incurred losses for policy years 2009 through 2015 continued to develop favorably.current period.
The increase in the loss provision rate in 20172023, from the 20162022 level, resulted in approximately $3,032,000$1.8 million more in reserves than would have been recorded at the lower 20162022 level. Loss provision ratiosrates are subject to variability and are reviewed and adjusted as experience develops.
Title claims are typically reported and paid within the first several years of policy issuance. The provision for claims reflects actual payments of claims, net of recovery amounts, plus adjustments to the specific and incurred but not reported claims reserves, the latter of which are actuarially determined based on historical claims experience. Actual payments of claims, net of recoveries, were $3,815,080, $2,725,953$4.8 million and $3,367,494$3.8 million in 2017, 20162023 and 2015,2022, respectively.
30
Reserve for Claims: At December 31, 2017,2023, the total reserve for claims was $34,801,000.$37.1 million. Of that total, approximately $4,646,000$2.9 million was reserved for specific claims, and approximately $30,155,000$34.3 million was reserved for claims for which the Company had no notice. Because of the uncertainty of future claims, changes in economic conditions and the fact that many claims do not materialize for several years, reserve estimates are subject to variability.
Changes from prior periods in the expected liability for claims reflect the uncertainty of the claims environment, as well as the limited predictive power of historical data. The Company continually updates and refines its reserve estimates as current experience develops and credible data emerges. Such data includes payments on claims closed during the quarter, new details that emerge on open cases that cause claims adjusters to increase or decrease the case reserves, and the impact that these types of changes have on the Company’s total loss provision. Adjustments may be required as new information develops which often varies from past experience.
Income Taxes
The provision for income taxes was $4,570,000, $8,616,000$4.5 million and $5,228,000$6.2 million for the years ended December 31, 2017, 20162023 and 2015,2022, respectively. Income tax expense, including federal and state taxes, as a percentage of earningsincome before income taxes was 15.1%, 30.6%17.3% and 29.4%20.6% for the years ended December 31, 2017, 20162023 and 2015,2022, respectively. On December 22, 2017, the TCJA was enacted into law, reducing the federal corporate income tax rate from 35% to 21% effective January 1, 2018. The decrease in the effective rate in 2017 compared with 2016 was primarily due to the revaluation of deferred tax assets and liabilities to the newly enacted tax rate of 21%. The revaluation resulted in a tax benefit of approximately $5,300,000 recognized in the fourth quarter of 2017. The increase in the effective rate in 2016 compared with 2015 was primarily due to a lower proportion of tax-exempt to taxable income. The effective income tax raterates for 2017 was belowboth 2023 and 2022 differ from the U.S. federal statutory income tax rate (34%)of 21% primarily due to the effects of thedeferred tax rate deduction andadjustments, tax credits, tax-exempt income whileand state taxes, all of which lowered the effective income tax rates for 2016 and 2015 were below the statutory income tax rate primarily due to the effects of tax-exempt income.rate.
The Company believes it is more likely than not that the tax benefits associated with recognized impairments and unrecognized losses recorded through December 31, 20172023 will be realized. However, this judgment could be impacted by further market fluctuations. Information regarding the components of income tax expense and the items included in the reconciliation of the effective rate with the federal statutory rate can be found in Note 8 to the accompanying Consolidated Financial Statements.
After-Tax Profit Margin
The Company’s after-tax profit margin varies according to a number of factors, including the volume and type of real estate activity. On a combined basis, the after-tax profit margins were 9.6% and 8.4% in 2023 and 2022, respectively. The increase in after-tax margin in 2023, compared with 2022, was primarily related to a decrease in total expenses. The Company continually strives to enhance its competitive strengths and market position, including ongoing initiatives to manage its operating expenses.
Liquidity and Capital Resources
The Company’s currentmaterial cash requirements include general operating expenses, contractual and other obligations for the future payment of title claims, employment agreements, lease agreements, income taxes, capital expenditures, dividends on its common stock and repurchasesother contractual commitments for goods and services needed for operations. All other arrangements entered into by the Company are not reasonably likely to have a material effect on liquidity or the availability of its common stock.capital resources. Cash flows from operations have historically been the primary source of financing for expanding operations, whether through organic growth or outside investments. The Company believes its balances of cash, short-term investments and other readily marketable securities, along with cash flows generated by ongoing operations, will be sufficient to satisfy its cash requirements over the next 12 months and thereafter, including the funding of operating activities and commitments for investing and financing activities. There are currently no known trends that the Company believes will materially impact the Company’s capital resources, nor is the Company anticipating any material changes in the mix or relative cost of such resources except as otherwise disclosed in the Business Trends and Recent Conditions section of this Management's Discussion and Analysis.
The Company evaluates nonorganic growth opportunities, such as mergers and acquisitions, from time to time in the ordinary course of business. Because of the episodic nature of these events, related incremental liquidity and capital resource needs can be difficult to predict.
The Company’s operating results and cash flows are heavily dependent on the real estate market. The Company’s business has certain fixed costs such as personnel; therefore, changes in the real estate market are monitored closely, and operating expenses such as staffing levels are managed and adjusted accordingly. The Company believes that its significant working capital position and management of operating expenses will aid its ability to manage cash resources through fluctuations in the real estate market.
Cash Flows: Net cash flows provided by operating activities were $19,893,180, $22,567,262$7.4 million and $16,916,506$36.2 million for 2017, 20162023 and 2015,2022, respectively. Cash flows fromprovided by operating activities decreased in 2017differ from 2016 primarilynet income due to a benefit in deferred income taxes, andadjustments for non-cash items, such as changes in other assetsthe estimated fair value of equity security investments, gains and income taxes payable, partially offset by increases in net incomelosses on investments and the provision for claims. Cash flows from operating activities increased in 2016 from 2015 primarily due to a decrease in other assets and an increase in net income, partially offset byproperty, the timing of payable disbursements for taxes, claims and a lower provision for claims.other accrued liabilities, and collections or changes in receivables and other assets.
31
Cash flows from non-operating activities have historically consisted of purchases and proceeds from investing activities, the issuance of dividends and repurchases of common stock and the issuance of dividends.stock. In 2017,2023, the Company had higher levels of investment purchase activity, higher levels of proceeds received from investments,investment sales activity and higher dividends paid when compared to 2022. In the fourth quarters of 2023 and lower levels of subsidiary purchases and repurchases of common stock compared with 2016. In 2016,2022, the Company had a lower levelpaid special cash dividends in the amounts of investment purchase activity, the purchase of a subsidiary,$4.00 and a higher level of common stock repurchases compared with 2015.$3.00 per share, respectively, in addition to regular cash dividends. Total dividends paid per share were $5.84 and $4.84 in 2023 and 2022, respectively.
The Company maintains a high degree of liquidity within its investment portfolio classified as available for sale, in the form of cash, short-term investments, and other readily marketable securities. As of December 31, 2017,2023, the Company held cash and cash equivalents of $20,214,468,$24.0 million, short-term investments of $23,779,672,$110.2 million, available-for-sale fixed maturity securities of $103,341,083$63.8 million and equity securities of $47,366,826.$37.2 million. The net effect of all activities on total cash and cash equivalents was a decrease of $7,714,004$11.3 million for 2017, an increase2023. Beginning in late 2022, ongoing evaluation of $6,138,404 for 2016,changing business and an increasefinancial market conditions led to portions of $5,963,553 for 2015.cash flow from operations, and certain amounts resulting from sales and maturities in the company’s investment portfolio, to be invested in short term investments to take advantage of elevated short-term interest rates.
Capital Resources: The amount of capital resources the Company maintains is influenced by state regulation, the need to maintain superior financial ratings from third-party rating agencies and other marketing and operational considerations.
The Company's significant sources of funds are dividends and distributions from its subsidiaries, primarily its two title insurance subsidiaries. Cash is received from its subsidiaries in the form of dividends and as reimbursements for operating and other administrative expenses that it incurs. The reimbursements are executed within the guidelines of management agreements between the Company and its subsidiaries.
The ability of the Company's title insurance subsidiaries to pay dividends to the Company is subject to state regulation from their respective states of domicile. Each state regulates the extent to which title underwriters can pay dividends or make distributions and requires prior regulatory approval of the payment of dividends and other intercompany transfers. The maximum dividend permitted by law is not necessarily indicative of an insurer’s actual ability to pay dividends. Depending on regulatory conditions, the Company may in the future need to retain cash in its title insurance subsidiaries in order to maintain their statutory capital position. As of December 31, 2017,2023, both ITIC and NTIICNITIC met the minimum capital, surplus and reserve requirements for each state in which they are licensed.
As of December 31, 2017,2023, approximately $102,082,000$113.0 million of the consolidated stockholders’shareholders’ equity represented net assets of the Company’s subsidiaries that cannot beare restricted by regulation from being transferred in the form of dividends, loans or advances to the parent company under statutory regulations without prior approval from the respective state insurance department. These regulations require prior regulatory approval of the payment of dividends and other intercompany transfers. The Company believes, however, that amounts available for transfer from the insurance and other subsidiaries are adequate to meet the Company’s current operating needs.
During 2018,2024, the maximum distributions the insurance subsidiaries can make to the Company without prior approval from applicable regulators total approximately $18,960,000.$17.5 million.
While state regulations and the need to cover risks may set a minimum level for capital requirements, other factors necessitate maintaining capital resources in excess of the required minimum amounts. For instance, the Company’s capital resources help it maintain high ratings from insurance company rating agencies. Superior ratings strengthen the Company's ability to compete with larger, well known title insurers with national footprints.
A strong financial position provides the necessary flexibility to fund potential acquisition activity, to invest in the Company's core business, and to minimize the financial impact of potential adverse developments. Adverse developments that generally require additional capital include adverse financial results, changes in statutory accounting requirements by regulators, reserve charges, investment losses or costs incurred to adapt to a changing regulatory environment, including costs related to CFPB regulation of the real estate industry.
Due to the Company’s historical ability to consistently generate positive cash flows from its consolidated operations and investment income, management believes that funds generated from operations will enable the Company to adequately meet its current operating needs for the foreseeable future. However, given inflationary pressures and geopolitical and military conflicts, there can be no assurance that future experience will be similar to historical experience, since it is influenced by such factors as the interest rate environment, real estate activity, the Company’s claims-paying ability and its financial strength ratings. In addition to operational and investment considerations, taking advantage of opportunistic external growth opportunities may necessitate obtaining additional capital resources. The Company is unaware of any trendcarefully monitoring inflation, geopolitical and military conflicts, and other trends that is likely tocould potentially result in material adverse liquidity changes, butand will continually assessesassess its capital allocation strategy, including decisions relating to payment of dividends, repurchasing the Company’s common stock and/or conserving cash.
32
Purchase of Company Stock: On November 9, 2015, the Board of Directors of the Company approved the purchase of an additional 163,335 shares pursuant to the Company’s repurchase plan, such that there was authority remaining under the plan to purchase up to an aggregate of 500,000 shares of the Company’s common stock pursuant to the plan immediately after this approval. Unless terminated earlier by resolution of the Board of Directors, the plan will expire when all shares authorized for purchase under the plan have been purchased. Pursuant to the Company’s ongoing purchase program, the Company has purchased 1,3337,000 shares in the twelve months ended December 31, 2017, 66,803 shares in the twelve months ended December 31, 2016, and 75,665 shares in the twelve months ended December 31, 2015 at an average per share pricesprice of $183.67, $93.10$137.00 and $72.48,945 shares at an average per share price of $141.01 in 2023 and 2022, respectively. The Company anticipates making further purchases under this plan from time to time in the future, depending on such factors as the prevailing market price of the Company’s common stock, the Company’s available cash and thenthe existing alternative uses for such cash.
Capital Expenditures: Capital expenditures were approximately $2,883,000, $2,457,000$9.2 million and $2,743,000$5.7 million during 2017, 20162023 and 2015,2022, respectively. The Company has plans for various capital improvement projects, including increasedCash flows from operations are expected to fund the Company's investment in a number of technology and system development initiatives and hardware purchases, which are anticipated to be funded via cash flows from operations.given ongoing capital improvement projects and plans for future projects. All material anticipated capital expenditures are subject to periodic review and revision and may vary depending on a number of factors.
| Payments due by period | |||||||||||||||||||
| Contractual Obligations Including Off-Balance Sheet Arrangements | Total | Less than 1 year | 1-3 years | 3-5 years | More than 5 years | ||||||||||||||
| Reserve for claims | $ | 34,801,000 | $ | 5,881,369 | $ | 9,744,280 | $ | 6,612,190 | $ | 12,563,161 | |||||||||
| Obligations under executive employment plans and agreements | 9,992,442 | 115,665 | 28,256 | 40,751 | 9,807,770 | ||||||||||||||
| Operating lease obligations | 4,766,948 | 1,190,734 | 1,880,447 | 1,355,305 | 340,462 | ||||||||||||||
| Other obligations | 1,118,359 | 838,013 | 225,346 | 55,000 | — | ||||||||||||||
| Total | $ | 50,678,749 | $ | 8,025,781 | $ | 11,878,329 | $ | 8,063,246 | $ | 22,711,393 | |||||||||
Contractual Obligations: As of December 31, 2017,2023, the Company had a claims reserve totaling $34,801,000.$37.1 million. The amounts and timing of these obligations are estimated and not set contractually. Nonetheless, based on historical insurance claims experience, the Company anticipates the payments shown in the Contractual Obligations table. Events such as fraud, defalcation, and multiple property title defects can substantially and unexpectedly cause increases in both the amount and timing of estimated title insurance loss payments and loss cost trends whereby increases or decreases in inflationary factors (including the value of real estate) will influence the ultimate amount of title insurance loss payments and could increase total obligations and influence claim payout patterns. Due to the length of time over which claim payments are made and regularly occurring changes in underlying economic and market conditions, claim estimates are subject to variability and future payments could increase or decrease from these estimated amounts in the future.
ITIC, a wholly owned subsidiary of the Company, has entered into employment agreements with certain executive officers. The amounts accrued for these agreements at December 31, 2023 and 2022 were approximately $15.2 million and $15.0 million, respectively, which includes postretirement compensation and health benefits, and were calculated based on the terms of the contracts. These executive contracts are accounted for on an individual contract basis. As payments are based upon the occurrence of specific events, including death, disability, retirement, termination without cause or upon a change in control, payment periods are currently uncertain. Information regarding retirement agreements and other postretirement benefit plans can be found in Note 10 to the Consolidated Financial Statements.
In the normal course of business, the Company enters into other contractual commitments for securities held at a discount; the discount continues to be amortized to maturity. The update is effectivegoods and services needed for annual periods beginning after December 15, 2018, and interim periods within those fiscal years. Early adoption is permitted. The Company is currently evaluating the impact that the recently issued accounting standard will have on the Company's financial position and results of operations, but does not expect it to have a material impact.
33
Off-Balance Sheet Arrangements
As a service to its customers, the Company, through ITIC, administers escrow and trust deposits representing earnest money received under real estate contracts, undisbursed amounts received for settlement of mortgage loans and indemnities against specific title risks. Cash held by the Company for these purposes was approximately $28.2 million and $24.2 million as of December 31, 2023 and 2022, respectively. These amounts are not considered assets of the Company and, therefore, are excluded from the Consolidated Balance Sheets. However, the Company remains contingently liable for the disposition of these deposits.
In addition, in administering tax-deferred like-kind exchanges pursuant to § 1031 of the IRC, ITEC serves as a qualified intermediary for exchanges, holding the net sales proceeds from relinquished property to be used for purchase of replacement property. ITAC serves as exchange accommodation titleholder and, through LLCs that are wholly owned subsidiaries of ITAC, holds property in reverse exchange transactions. Like-kind exchange deposits and reverse exchange property held by the Company for the purpose of completing such transactions totaled approximately $263.7 million and $432.0 million as of December 31, 2023 and 2022, respectively. These exchange deposits are held at third-party financial position or resultsinstitutions. Exchange deposits are not considered assets of operations.
External assets under management of Investors Trust Company totaled approximately $663.9 million and is meant to better reflect an entity’s current estimate of all expected credit losses. In addition, this update amends the accounting for credit losses on available-for-sale debt securities and purchased financial assets with credit deterioration. The update is effective for annual periods beginning after December 15, 2019, and interim periods within those fiscal years. Early adoption is permitted$635.3 million as of fiscal years beginning after December 15, 2018, including interim periods within those fiscal years. The31, 2023 and 2022, respectively. These amounts are not considered assets of the Company and, therefore, are excluded from the Consolidated Balance Sheets.
It is currently evaluatingnot the impact thatgeneral practice of the recently issued accounting standard will have on the Company's financial position and results of operations, but does not expect itCompany to have a material impact. Currently, the Company's potential credit losses under this accounting standard relateenter into off-balance sheet arrangements or issue guarantees to available-for-sale securities.third parties. The Company does not believehave any material source of liquidity or financing that the risk of credit losses, based on current available-for-sale security holdings, is materialinvolves off-balance sheet arrangements. Other than items noted above, off-balance sheet arrangements are generally limited to the Company's financial statements as a whole. Please refer to Note 3 for further information about the Company's investments.future payments due under various agreements with third-party service providers.
ITEM 7A. QUANTITATIVE AND QUALITATIVE DISCLOSURES ABOUT MARKET RISK
Item not required for smaller reporting companies.
34
ITEM 8. CONSOLIDATED FINANCIAL STATEMENTS AND SUPPLEMENTARY DATA
| 1. | Report of Independent Registered Public Accounting Firm (PCAOB ID: 686) | ||||||||||
| 2. | Management's Report on Internal Control Over Financial Reporting | ||||||||||
| 3. | Report of Independent Registered Public Accounting Firm on Internal Control Over Financial Reporting | ||||||||||
| 4. | Consolidated Balance Sheets | ||||||||||
| 5. | Consolidated Statements of Operations | ||||||||||
| 6. | Consolidated Statements of Comprehensive Income | ||||||||||
| 7. | Consolidated Statements of Shareholders' Equity | ||||||||||
| 8. | Consolidated Statements of Cash Flows | ||||||||||
| 9. | Notes to Consolidated Financial Statements | ||||||||||
| 1. | ||
| 2. | ||
| 3. | ||
| 4. | ||
| 5. | ||
| 6. | ||
| 7. | ||
| 8. | ||
| 9. | ||
The financial statement schedules meeting the requirements of Regulation S-X are attached hereto as Schedules I, II, III, IV and V.
35
| 2017 | March 31 | June 30 | September 30 | December 31 | |||||||||||
| Net premiums written | $ | 32,298,596 | $ | 34,168,504 | $ | 36,941,189 | $ | 35,180,588 | |||||||
| Net income | 4,466,180 | 5,674,023 | 5,926,615 | 9,633,752 | |||||||||||
| Net income attributable to the Company | 4,476,055 | 5,675,192 | 5,926,457 | 9,628,798 | |||||||||||
| Basic earnings per common share | 2.37 | 3.01 | 3.14 | 5.11 | |||||||||||
| Diluted earnings per common share | 2.36 | 2.99 | 3.13 | 5.08 | |||||||||||
| 2016 | March 31 | June 30 | September 30 | December 31 | |||||||||||
| Net premiums written | $ | 21,430,397 | $ | 29,621,053 | $ | 36,306,522 | $ | 33,211,179 | |||||||
| Net income | 1,804,461 | 4,530,047 | 8,129,167 | 5,051,777 | |||||||||||
| Net income attributable to the Company | 1,814,040 | 4,529,380 | 8,126,939 | 5,052,759 | |||||||||||
| Basic earnings per common share | 0.94 | 2.36 | 4.30 | 2.68 | |||||||||||
| Diluted earnings per common share | 0.93 | 2.35 | 4.29 | 2.67 | |||||||||||
| 2015 | March 31 | June 30 | September 30 | December 31 | |||||||||||
| Net premiums written | $ | 24,811,813 | $ | 30,309,705 | $ | 30,845,991 | $ | 25,941,964 | |||||||
| Net income | 1,726,124 | 4,120,497 | 4,495,498 | 2,206,934 | |||||||||||
| Net income attributable to the Company | 1,726,124 | 4,120,497 | 4,490,962 | 2,196,322 | |||||||||||
| Basic earnings per common share | 0.86 | 2.06 | 2.28 | 1.13 | |||||||||||
| Diluted earnings per common share | 0.86 | 2.05 | 2.28 | 1.12 | |||||||||||
Report of Independent Registered Public Accounting Firm
To the Shareholders and Board of Directors and Stockholders
Investors Title Company
Chapel Hill, North CarolinaNC
Opinion on the Consolidated Financial Statements
We have audited the accompanying consolidated balance sheets of Investors Title Company and Subsidiaries (the Company)“Company”) as of December 31, 20172023 and 2016, and2022, the related consolidated statements of income,operations, comprehensive income, stockholders’shareholders’ equity and cash flows for each of the three years in the periodthen ended, December 31, 2017 and the related consolidated notes and schedules (collectively referred to as the "financial statements"“consolidated financial statements”). In our opinion, the consolidated financial statements referred to above present fairly, in all material respects, the financial position of the Company as of December 31, 20172023 and 2016,2022, and the results of its operations and its cash flows for each of the three years in the periodthen ended December 31, 2017, in conformity with U.S.accounting principles generally accepted accounting principles.in the United States of America.
We also have audited, in accordance with the standards of the Public Company Accounting Oversight Board (United States) ("PCAOB"(“PCAOB”), the Company'sCompany’s internal control over financial reporting as of December 31, 2017,2023, based on criteria established in Internal Control-IntegratedControl – Integrated Framework (2013) issued by the Committee of Sponsoring Organizations of the Treadway Commission and our report dated March 12, 201814, 2024, expressed an unqualified opinion.opinion thereon.
Basis for Opinion
These consolidated financial statements are the responsibility of the Company'sCompany’s management. Our responsibility is to express an opinion on the Company'sCompany’s consolidated financial statements based on our audits.
We are a public accounting firm registered with the PCAOB and are required to be independent with respect to the Company in accordance with the U.S. federal securities laws and the applicable rules and regulations of the Securities and Exchange Commission and the PCAOB.
We conducted our audits in accordance with the standards of the PCAOB. Those standards require that we plan and perform the auditaudits to obtain reasonable assurance about whether the consolidated financial statements are free of material misstatement, whether due to error or fraud.
Our audits included performing procedures to assess the risks of material misstatement of the consolidated financial statements, whether due to error or fraud, and performing procedures that respond to those risks. Such procedures includedinclude examining, on a test basis, evidence regarding the amounts and disclosures in the consolidated financial statements. Our audits also included evaluating the accounting principles used and significant estimates made by management, as well as evaluating the overall presentation of the consolidated financial statements. We believe that our audits provide a reasonable basis for our opinion.
36
Critical Audit Matter
The critical audit matter communicated below is a matter arising from the current-period audit of the consolidated financial statements that was communicated or required to be communicated to the audit committee and that: (1) relates to accounts or disclosures that are material to the consolidated financial statements and (2) involved our especially challenging, subjective, or complex judgments. The communication of a critical audit matter does not alter in any way our opinion on the consolidated financial statements, taken as a whole, and we are not, by communicating the critical audit matter below, providing separate opinions on the critical audit matter or on the accounts or disclosures to which they relate.
Reserve for Claims
As described in notes 1 and 6 to the Company’s consolidated financial statements, the Company’s unpaid loss and losses adjustment expenses are established using estimated amounts required to settle claims for which notice has been received (reported) and the amount estimated to be required to satisfy incurred claims of policyholders which may be reported in the future (incurred but not reported, or “IBNR”). As of December 31, 2023, the Company had approximately $37.1 million in reserve for claims. Management records a provision for future claim payments at the time the related premium revenue is recognized by applying a loss provision rate against net premiums written. Management determines its loss provision rate through the consideration of factors such as the Company’s historical claim experience, case reserve estimates on reported claims, large claims, actuarial projections, and other relevant factors. The Company’s specialist utilizes accepted actuarial methodologies when performing the actuarial projections. Management’s assumptions include assumed comparability to its historical claims experience unless factors, such as loss experience and charged premium rates, change significantly, as well as assumptions around large losses related to fraud and defalcation.
We identified the reserve for claims as a critical audit matter. The principal considerations for our determination of the reserve for claims as a critical audit matter were management’s use of significant actuarial estimates and assumptions to estimate the reserve for claims, including the selection of actuarial methods, loss development factors, and expected loss ratios, as well as the high degree of auditor judgment, subjectivity, and effort in determining the reasonableness of the actuarial assumptions and methodologies utilized, and our use of an auditor’s specialist.
37
Our audit procedures related to the reserve for claims included the following, among others:
•We obtained an understanding, evaluated the design and implementation, and tested the operating effectiveness of the Company’s controls over the process for developing its reserve for claims. This included, among others, the controls over the determination of the actuarial methods and assumptions utilized to support the reserve for claims calculations and controls over the completeness and accuracy of historical loss data utilized in the reserve for claims calculations.
•We engaged a third-party actuary with specialized skill and knowledge to assist in evaluating the reasonableness of the reserving methodologies utilized by the Company’s specialist and evaluating the reasonableness of the assumptions related to loss development factors and expected loss ratios.
•We tested the inputs utilized by the Company’s specialist in developing the reserve for claims. This included testing the accuracy and completeness of the data provided to the Company’s specialist.
•We evaluated the reasonableness of the significant assumptions utilized by the Company in developing the reserve for claims.
/S/ DIXON HUGHES GOODMAN,s/ FORVIS, LLP
We have served as the Company’s auditor since 2004.2004
High Point, North CarolinaNC
March 12, 2018
14, 2024
38
MANAGEMENT’S REPORT ON INTERNAL CONTROL OVER FINANCIAL REPORTING
Management of Investors Title Company and Subsidiaries is responsible for establishing and maintaining adequate internal control over financial reporting, as such term is defined in the Exchange Act Rules 13a-15(f) and 15(d)-15(f). The Company’s internal control over financial reporting has been designed to provide reasonable assurance regarding the reliability of the Company’s financial reporting and the preparation of published financial statements in accordance with generally accepted accounting principles.
The Company’s internal control over financial reporting includes policies and procedures that (1) pertain to the maintenance of records that, in reasonable detail, accurately and fairly reflect transactions and dispositions of assets of the Company; (2) provide reasonable assurance that transactions are recorded as necessary to permit preparation of financial statements in accordance with accounting principles generally accepted in the United States of America, and that receipts and expenditures are being made only in accordance with authorization of management and directors of the Company; and (3) provide reasonable assurance regarding prevention or timely detection of unauthorized acquisition, use or disposition of the Company’s assets that could have a material effect on the Company’s Consolidated Financial Statements.
Because of its inherent limitation, internal control over financial reporting may not prevent or detect misstatements. Also, projections of any evaluation of effectiveness to future periods are subject to the risk that controls may become inadequate because of changes in conditions, or that the degree of compliance with policies or procedures may deteriorate.
Management conducted an evaluation of the effectiveness of the Company’s internal control over financial reporting based on the framework in Internal Control-Integrated Framework(2013) issued by the Committee of Sponsoring Organizations of the Treadway Commission (“COSO”) and concluded that the Company’s internal control over financial reporting was effective as of December 31, 2017.
2023.
39
Report of Independent Registered Public Accounting Firm
To the Shareholders and Board of Directors and Stockholders
Investors Title Company
Chapel Hill, North CarolinaNC
Opinion on the Internal Control Overover Financial Reporting
We have audited Investors Title Company’sCompany and Subsidiaries’ (the Company’s)“Company”) internal control over financial reporting as of December 31, 2017,2023, based on criteria established in Internal Control-Integrated FrameworkControl – Integrated Framework: (2013) issued by the Committee of Sponsoring Organizations of the Treadway Commission (COSO). In our opinion, the Company maintained, in all material respects, effective internal control over financial reporting as of December 31, 2017,2023, based on criteria established in Internal Control-Integrated FrameworkControl – Integrated Framework: (2013) issued by COSO.
We also have audited, in accordance with the standards of the Public Company Accounting Oversight Board (United States) (PCAOB)(“PCAOB”), the consolidated financial statements of the Company as of December 31, 20172023 and 2016,2022, and for each of the three years in the periodthen ended, December 31, 2017, and our report dated March 12, 2018,14, 2024, expressed an unqualified opinion on those consolidated financial statements.
Basis for Opinion
The Company’s management is responsible for maintaining effective internal control over financial reporting and for its assessment of the effectiveness of internal control over financial reporting, included in the accompanying Management’s Report on Internal Control Over Financial Reporting. Our responsibility is to express an opinion on the Company’s internal control over financial reporting based on our audit.
We are a public accounting firm registered with the PCAOB and are required to be independent with respect to the Company in accordance with the U.S. federal securities laws and the applicable rules and regulations of the Securities and Exchange Commission and the PCAOB.
We conducted our audit in accordance with the standards of the PCAOB. Those standards require that we plan and perform the audit to obtain reasonable assurance about whether effective internal control over financial reporting was maintained in all material respects. Our audit included obtaining an understanding of internal control over financial reporting, assessing the risk that a material weakness exists, and testing and evaluating the design and operating effectiveness of internal control based on the assessed risk, andrisk. Our audit also included performing such other procedures as we considered necessary in the circumstances. We believe that our audit provides a reasonable basis for our opinion.
A company’s internal control over financial reporting is a process designed to provide reasonable assurance regarding the reliability of financial reporting and the preparation of reliable financial statements for external purposes in accordance with generally accepted accounting principles. A company’s internal control over financial reporting includes those policies and procedures that (1) pertain to the maintenance of records that, in reasonable detail, accurately and fairly reflect the transactions and dispositions of the assets of the company; (2) provide reasonable assurance that transactions are recorded as necessary to permit preparation of financial statements in accordance with generally accepted accounting principles, and that receipts and expenditures of the company are being made only in accordance with authorizations of management and directors of the company; and (3) provide reasonable assurance regarding prevention or timely detection of unauthorized acquisition, use, or disposition of the company’s assets that could have a material effect on the financial statements.
40
Because of its inherent limitations, internal control over financial reporting may not prevent or detect misstatements. Also, projections of any evaluation of effectiveness to future periods are subject to the risk that controls may become inadequate because of changes in conditions or that the degree of compliance with the policies or procedures may deteriorate.
/S/ DIXON HUGHES GOODMAN,s/ FORVIS, LLP
High Point, North CarolinaNC
March 12, 201814, 2024
41
Investors Title Company and Subsidiaries
Consolidated Balance Sheets
(in thousands)
| As of December 31, | 2017 | 2016 | As of December 31, | 2023 | 2022 | ||||||||||||||||
| Assets: | |||||||||||||||||||||
| Investments in securities: | |||||||||||||||||||||
| Fixed maturities, available-for-sale, at fair value (amortized cost: December 31, 2017: $100,314,085; December 31, 2016: $100,162,357) | $ | 103,341,083 | $ | 101,934,077 | |||||||||||||||||
| Equity securities, available-for-sale, at fair value (cost: December 31, 2017: $26,002,619; December 31, 2016: $24,836,032) | 47,366,826 | 41,179,259 | |||||||||||||||||||
| Assets | Assets | ||||||||||||||||||||
| Cash and cash equivalents | |||||||||||||||||||||
| Investments: | Investments: | ||||||||||||||||||||
| Fixed maturity securities, available-for-sale, at fair value (amortized cost: December 31, 2023: $63,106; December 31, 2022: $53,775) | |||||||||||||||||||||
| Equity securities, at fair value (cost: December 31, 2023: $22,981; December 31, 2022: $25,278) | |||||||||||||||||||||
| Short-term investments | 23,779,672 | 6,558,840 | |||||||||||||||||||
| Other investments | 12,032,426 | 11,181,531 | |||||||||||||||||||
| Total investments | 186,520,007 | 160,853,707 | |||||||||||||||||||
| Cash and cash equivalents | 20,214,468 | 27,928,472 | |||||||||||||||||||
| Premium and fees receivable | |||||||||||||||||||||
| Premium and fees receivable | |||||||||||||||||||||
| Premium and fees receivable | 10,159,519 | 8,654,161 | |||||||||||||||||||
| Accrued interest and dividends | 1,099,879 | 1,035,152 | |||||||||||||||||||
| Prepaid expenses and other assets | 9,003,683 | 9,456,523 | |||||||||||||||||||
| Prepaid expenses and other receivables | |||||||||||||||||||||
| Property, net | 10,172,904 | 8,753,466 | |||||||||||||||||||
| Goodwill and other intangible assets, net | 11,357,290 | 12,256,641 | |||||||||||||||||||
| Current income taxes receivable | 385,109 | — | |||||||||||||||||||
| Lease assets | |||||||||||||||||||||
| Other assets | |||||||||||||||||||||
| Current income taxes recoverable | |||||||||||||||||||||
| Total Assets | $ | 248,912,859 | $ | 228,938,122 | |||||||||||||||||
| Liabilities and Stockholders’ Equity | |||||||||||||||||||||
| Liabilities and Shareholders’ Equity | |||||||||||||||||||||
| Liabilities and Shareholders’ Equity | |||||||||||||||||||||
| Liabilities and Shareholders’ Equity | |||||||||||||||||||||
| Liabilities: | Liabilities: | ||||||||||||||||||||
| Reserve for claims | $ | 34,801,000 | $ | 35,305,000 | |||||||||||||||||
| Accounts payable and accrued liabilities | 27,565,660 | 26,146,480 | |||||||||||||||||||
| Current income taxes payable | — | 1,232,432 | |||||||||||||||||||
| Lease liabilities | |||||||||||||||||||||
| Deferred income taxes, net | 8,625,759 | 11,118,256 | |||||||||||||||||||
| Total liabilities | 70,992,419 | 73,802,168 | |||||||||||||||||||
| Commitments and Contingencies | — | — | |||||||||||||||||||
| Commitments and Contingencies | |||||||||||||||||||||
| Commitments and Contingencies | |||||||||||||||||||||
| Stockholders’ Equity: | |||||||||||||||||||||
| Preferred stock (1,000,000 authorized shares; no shares issued) | — | — | |||||||||||||||||||
| Common stock – no par value (10,000,000 authorized shares; 1,885,993 and 1,884,283 shares issued and outstanding as of December 31, 2017 and December 31, 2016, respectively, excluding in each period 291,676 shares of common stock held by the Company) | 1 | 1 | |||||||||||||||||||
| Shareholders’ Equity: | |||||||||||||||||||||
| Shareholders’ Equity: | |||||||||||||||||||||
| Shareholders’ Equity: | |||||||||||||||||||||
| Preferred stock (1,000 authorized shares; no shares issued) | |||||||||||||||||||||
| Common stock – no par value (10,000 authorized shares; 1,891 and 1,897 shares issued and outstanding as of December 31, 2023 and 2022, respectively, excluding in each period 292 shares of common stock held by the Company) | |||||||||||||||||||||
| Retained earnings | 161,890,660 | 143,283,621 | |||||||||||||||||||
| Accumulated other comprehensive income | 15,944,826 | 11,761,447 | |||||||||||||||||||
| Total stockholders’ equity attributable to the Company | 177,835,487 | 155,045,069 | |||||||||||||||||||
| Noncontrolling interests | 84,953 | 90,885 | |||||||||||||||||||
| Total stockholders’ equity | 177,920,440 | 155,135,954 | |||||||||||||||||||
| Total Liabilities and Stockholders’ Equity | $ | 248,912,859 | $ | 228,938,122 | |||||||||||||||||
| Total shareholders’ equity | |||||||||||||||||||||
| Total Liabilities and Shareholders’ Equity | |||||||||||||||||||||
42
Investors Title Company and Subsidiaries
Consolidated Statements of IncomeOperations
(in thousands, except per share amounts)
| For the Years Ended December 31, | 2017 | 2016 | 2015 | For the Years Ended December 31, | 2023 | 2022 | ||||||||||||||||||||
| Revenues: | Revenues: | |||||||||||||||||||||||||
| Net premiums written | $ | 138,588,877 | $ | 120,569,151 | $ | 111,909,473 | ||||||||||||||||||||
| Investment income – interest and dividends | 4,444,447 | 4,684,489 | 4,531,319 | |||||||||||||||||||||||
| Net realized gain (loss) on investments | 1,040,901 | 768,436 | (116,163 | ) | ||||||||||||||||||||||
| Escrow and other title-related fees | ||||||||||||||||||||||||||
| Non-title services | ||||||||||||||||||||||||||
| Interest and dividends | ||||||||||||||||||||||||||
| Other investment income | ||||||||||||||||||||||||||
| Net investment gains (losses) | ||||||||||||||||||||||||||
| Other | 17,575,071 | 12,470,338 | 10,875,443 | |||||||||||||||||||||||
| Total Revenues | 161,649,296 | 138,492,414 | 127,200,072 | |||||||||||||||||||||||
| Operating Expenses: | ||||||||||||||||||||||||||
| Operating Expenses: | ||||||||||||||||||||||||||
| Operating Expenses: | ||||||||||||||||||||||||||
| Commissions to agents | 68,643,220 | 63,643,321 | 62,174,301 | |||||||||||||||||||||||
| Provision for claims | 3,311,080 | 242,953 | 4,478,494 | |||||||||||||||||||||||
| Salaries, employee benefits and payroll taxes | 39,012,354 | 31,372,099 | 28,041,213 | |||||||||||||||||||||||
| Office occupancy and operations | 8,966,623 | 6,265,908 | 5,885,336 | |||||||||||||||||||||||
| Business development | 3,164,730 | 2,511,699 | 2,373,270 | |||||||||||||||||||||||
| Filing fees, franchise and local taxes | 1,198,013 | 907,225 | 732,985 | |||||||||||||||||||||||
| Premium and retaliatory taxes | 2,672,034 | 2,202,595 | 2,161,571 | |||||||||||||||||||||||
| Professional and contract labor fees | 1,825,598 | 2,115,754 | 2,691,411 | |||||||||||||||||||||||
| Other | 2,585,074 | 1,099,408 | 884,438 | |||||||||||||||||||||||
| Personnel expenses | ||||||||||||||||||||||||||
| Office and technology expenses | ||||||||||||||||||||||||||
| Other expenses | ||||||||||||||||||||||||||
| Total Operating Expenses | 131,378,726 | 110,360,962 | 109,423,019 | |||||||||||||||||||||||
| Income before Income Taxes | 30,270,570 | 28,131,452 | 17,777,053 | |||||||||||||||||||||||
| Income before Income Taxes | ||||||||||||||||||||||||||
| Income before Income Taxes | ||||||||||||||||||||||||||
| Provision for Income Taxes | ||||||||||||||||||||||||||
| Provision for Income Taxes | ||||||||||||||||||||||||||
| Provision for Income Taxes | 4,570,000 | 8,616,000 | 5,228,000 | |||||||||||||||||||||||
| Net Income | 25,700,570 | 19,515,452 | 12,549,053 | |||||||||||||||||||||||
| Net Income | ||||||||||||||||||||||||||
| Net Income | ||||||||||||||||||||||||||
| Net Loss (Income) Attributable to Noncontrolling Interests | 5,932 | 7,666 | (15,148 | ) | ||||||||||||||||||||||
| Net Income Attributable to the Company | $ | 25,706,502 | $ | 19,523,118 | $ | 12,533,905 | ||||||||||||||||||||
| Basic Earnings per Common Share | ||||||||||||||||||||||||||
| Basic Earnings per Common Share | ||||||||||||||||||||||||||
| Basic Earnings per Common Share | $ | 13.63 | $ | 10.23 | $ | 6.32 | ||||||||||||||||||||
| Weighted Average Shares Outstanding – Basic | 1,886,354 | 1,907,675 | 1,984,360 | |||||||||||||||||||||||
| Weighted Average Shares Outstanding – Basic | ||||||||||||||||||||||||||
| Weighted Average Shares Outstanding – Basic | ||||||||||||||||||||||||||
| Diluted Earnings per Common Share | ||||||||||||||||||||||||||
| Diluted Earnings per Common Share | ||||||||||||||||||||||||||
| Diluted Earnings per Common Share | $ | 13.56 | $ | 10.19 | $ | 6.30 | ||||||||||||||||||||
| Weighted Average Shares Outstanding – Diluted | 1,895,871 | 1,915,057 | 1,989,799 | |||||||||||||||||||||||
| Cash Dividends Paid per Common Share | $ | 3.75 | $ | 0.72 | $ | 0.40 | ||||||||||||||||||||
| Weighted Average Shares Outstanding – Diluted | ||||||||||||||||||||||||||
| Weighted Average Shares Outstanding – Diluted | ||||||||||||||||||||||||||
43
Investors Title Company and Subsidiaries
Consolidated Statements of Comprehensive Income
| For the Years Ended December 31, | 2017 | 2016 | 2015 | |||||||||
| Net income | $ | 25,700,570 | $ | 19,515,452 | $ | 12,549,053 | ||||||
| Other comprehensive income (loss), before tax: | ||||||||||||
| Amortization related to prior year service cost | — | — | 4,390 | |||||||||
| Amortization of unrecognized loss | 8,612 | 8,941 | 3,514 | |||||||||
| Accumulated postretirement expense (benefit) obligation adjustment | 69,634 | (566 | ) | (63,566 | ) | |||||||
| Unrealized gains (losses) on investments arising during the period | 7,478,490 | 1,145,529 | (2,077,542 | ) | ||||||||
| Reclassification adjustment for sale of securities included in net income | (1,227,265 | ) | (972,672 | ) | (718,837 | ) | ||||||
| Reclassification adjustment for write-down of securities included in net income | 25,411 | 233,941 | 751,059 | |||||||||
| Other comprehensive income (loss), before tax | 6,354,882 | 415,173 | (2,100,982 | ) | ||||||||
| Income tax expense (benefit) related to postretirement health benefits | 26,602 | 2,849 | (18,924 | ) | ||||||||
| Income tax expense (benefit) related to unrealized gains (losses) on investments arising during the year | 2,555,694 | 387,508 | (722,226 | ) | ||||||||
| Income tax benefit related to reclassification adjustment for sale of securities included in net income | (419,462 | ) | (333,426 | ) | (245,200 | ) | ||||||
| Income tax expense related to reclassification adjustment for write-down of securities included in net income | 8,669 | 79,810 | 258,862 | |||||||||
| Net income tax expense (benefit) on other comprehensive income (loss) | 2,171,503 | 136,741 | (727,488 | ) | ||||||||
| Other comprehensive income (loss) | 4,183,379 | 278,432 | (1,373,494 | ) | ||||||||
| Comprehensive Income | $ | 29,883,949 | $ | 19,793,884 | $ | 11,175,559 | ||||||
| Less: Comprehensive loss (income) attributable to noncontrolling interests | 5,932 | 7,666 | (15,148 | ) | ||||||||
| Comprehensive Income Attributable to the Company | $ | 29,889,881 | $ | 19,801,550 | $ | 11,160,411 | ||||||
| For the Years Ended December 31, | 2023 | 2022 | |||||||||
| Net income | $ | 21,686 | $ | 23,903 | |||||||
| Other comprehensive income (loss), before income tax: | |||||||||||
| Accumulated postretirement benefit obligation adjustment | 24 | 228 | |||||||||
| Unrealized gains (losses) on investments arising during the period | 320 | (4,342) | |||||||||
| Reclassification adjustment for sale of securities included in net income | — | 104 | |||||||||
| Reclassification adjustment for write-down of securities included in net income | 208 | 172 | |||||||||
| Other comprehensive income (loss), before income tax | 552 | (3,838) | |||||||||
| Income tax expense related to postretirement health benefits | 5 | 48 | |||||||||
| Income tax expense (benefit) related to net unrealized gains (losses) on investments arising during the year | 61 | (921) | |||||||||
| Income tax expense related to reclassification adjustment for sale of securities included in net income | — | 22 | |||||||||
| Income tax expense related to reclassification adjustment for write-down of securities included in net income | 48 | 39 | |||||||||
| Net income tax expense (benefit) on other comprehensive income (loss) | 114 | (812) | |||||||||
| Other comprehensive income (loss) | 438 | (3,026) | |||||||||
| Comprehensive Income | $ | 22,124 | $ | 20,877 | |||||||
Refer to the Notes to the Consolidated Financial Statements.
44
Investors Title Company and Subsidiaries
Consolidated Statements of Stockholders’Shareholders’ Equity
(in thousands, except per share amounts)
| Common Stock | Retained Earnings | Accumulated Other Comprehensive Income | Noncontrolling Interests | Total Stockholders’ Equity | ||||||||||||||||||
| Shares | Amount | |||||||||||||||||||||
| Balance, January 1, 2015 | 2,023,270 | $ | 1 | $ | 124,707,196 | $ | 12,856,509 | $ | — | $ | 137,563,706 | |||||||||||
| Net income attributable to the Company | 12,533,905 | 12,533,905 | ||||||||||||||||||||
| Dividends paid ($0.40 per share) | (789,907 | ) | (789,907 | ) | ||||||||||||||||||
| Shares of common stock repurchased and retired | (75,665 | ) | (5,483,953 | ) | (5,483,953 | ) | ||||||||||||||||
| Stock options and stock appreciation rights exercised | 2,192 | 54,988 | 54,988 | |||||||||||||||||||
| Share-based compensation expense | 137,762 | 137,762 | ||||||||||||||||||||
| Amortization related to postretirement health benefits | 5,216 | 5,216 | ||||||||||||||||||||
| Accumulated postretirement benefit obligation adjustment | (41,954 | ) | (41,954 | ) | ||||||||||||||||||
| Net unrealized loss on investments | (1,336,756 | ) | (1,336,756 | ) | ||||||||||||||||||
| Net effect changes of ownership | 127,050 | 127,050 | ||||||||||||||||||||
| Subsidiary return of capital | (35,000 | ) | (35,000 | ) | ||||||||||||||||||
| Net income attributable to noncontrolling interests | 15,148 | 15,148 | ||||||||||||||||||||
| Income tax benefit from share-based compensation | 26,875 | 26,875 | ||||||||||||||||||||
| Balance, December 31, 2015 | 1,949,797 | $ | 1 | $ | 131,186,866 | $ | 11,483,015 | $ | 107,198 | $ | 142,777,080 | |||||||||||
| Net income attributable to the Company | 19,523,118 | 19,523,118 | ||||||||||||||||||||
| Dividends paid ($0.72 per share) | (1,370,390 | ) | (1,370,390 | ) | ||||||||||||||||||
| Shares of common stock repurchased and retired | (66,803 | ) | (6,219,670 | ) | (6,219,670 | ) | ||||||||||||||||
| Stock options and stock appreciation rights exercised | 1,289 | (200 | ) | (200 | ) | |||||||||||||||||
| Share-based compensation expense | 132,098 | 132,098 | ||||||||||||||||||||
| Amortization related to postretirement health benefits | 5,900 | 5,900 | ||||||||||||||||||||
| Accumulated postretirement benefit obligation adjustment | (374 | ) | (374 | ) | ||||||||||||||||||
| Net unrealized gain on investments | 272,906 | 272,906 | ||||||||||||||||||||
| Purchase of noncontrolling interest of subsidiary | (8,647 | ) | (8,647 | ) | ||||||||||||||||||
| Additional paid-in capital from purchase of non-controlling interest of subsidiary | (494 | ) | (494 | ) | ||||||||||||||||||
| Net loss attributable to noncontrolling interests | (7,666 | ) | (7,666 | ) | ||||||||||||||||||
| Income tax benefit from share-based compensation | 32,293 | 32,293 | ||||||||||||||||||||
| Balance, December 31, 2016 | 1,884,283 | $ | 1 | $ | 143,283,621 | $ | 11,761,447 | $ | 90,885 | $ | 155,135,954 | |||||||||||
| Net income attributable to the Company | 25,706,502 | 25,706,502 | ||||||||||||||||||||
| Dividends paid ($3.75 per share) | (7,073,210 | ) | (7,073,210 | ) | ||||||||||||||||||
| Shares of common stock repurchased and retired | (1,333 | ) | (244,831 | ) | (244,831 | ) | ||||||||||||||||
| Stock options and stock appreciation rights exercised | 3,043 | (737 | ) | (737 | ) | |||||||||||||||||
| Share-based compensation expense | 219,315 | 219,315 | ||||||||||||||||||||
| Amortization related to postretirement health benefits | 5,686 | 5,686 | ||||||||||||||||||||
| Accumulated postretirement benefit obligation adjustment | 45,958 | 45,958 | ||||||||||||||||||||
| Net unrealized gain on investments | 4,131,735 | 4,131,735 | ||||||||||||||||||||
| Common Stock | Retained Earnings | Accumulated Other Comprehensive Income | Total Shareholders’ Equity | ||||||||||||||||||||||||||
| Shares | Amount | ||||||||||||||||||||||||||||
| Balance, January 1, 2022 | 1,895 | $ | — | $ | 225,861 | $ | 3,226 | $ | 229,087 | ||||||||||||||||||||
| Net income | 23,903 | 23,903 | |||||||||||||||||||||||||||
| Dividends paid ($4.84 per share) | (9,181) | (9,181) | |||||||||||||||||||||||||||
| Repurchases of common stock | (1) | (133) | (133) | ||||||||||||||||||||||||||
| Exercise of stock appreciation rights | 3 | (1) | (1) | ||||||||||||||||||||||||||
| Share-based compensation expense related to stock appreciation rights | 362 | 362 | |||||||||||||||||||||||||||
| Accumulated postretirement benefit obligation adjustment | 180 | 180 | |||||||||||||||||||||||||||
| Net unrealized loss on investments | (3,206) | (3,206) | |||||||||||||||||||||||||||
| Balance, December 31, 2022 | 1,897 | $ | — | $ | 240,811 | $ | 200 | $ | 241,011 | ||||||||||||||||||||
| Net income | 21,686 | 21,686 | |||||||||||||||||||||||||||
| Dividends paid ($5.84 per share) | (11,048) | (11,048) | |||||||||||||||||||||||||||
| Repurchases of common stock | (7) | (959) | (959) | ||||||||||||||||||||||||||
| Exercise of stock appreciation rights | 1 | — | — | ||||||||||||||||||||||||||
| Share-based compensation expense related to stock appreciation rights | 425 | 425 | |||||||||||||||||||||||||||
| Accumulated postretirement benefit obligation adjustment | 19 | 19 | |||||||||||||||||||||||||||
| Net unrealized gain on investments | 419 | 419 | |||||||||||||||||||||||||||
| Balance, December 31, 2023 | 1,891 | $ | — | $ | 250,915 | $ | 638 | $ | 251,553 | ||||||||||||||||||||
| Consolidated Statements of Stockholders’ Equity, continued | ||||||||||||||||||||||
| Common Stock | Retained Earnings | Accumulated Other Comprehensive Income | Noncontrolling Interests | Total Stockholders’ Equity | ||||||||||||||||||
| Shares | Amount | |||||||||||||||||||||
| Net loss attributable to noncontrolling interests | (5,932 | ) | (5,932 | ) | ||||||||||||||||||
| Balance, December 31, 2017 | 1,885,993 | $ | 1 | $ | 161,890,660 | $ | 15,944,826 | $ | 84,953 | $ | 177,920,440 | |||||||||||
45
Investors Title Company and Subsidiaries
Consolidated Statements of Cash Flows
| For the Years Ended December 31, | 2017 | 2016 | 2015 | ||||||||
| Operating Activities | |||||||||||
| Net income | $ | 25,700,570 | $ | 19,515,452 | $ | 12,549,053 | |||||
| Adjustments to reconcile net income to net cash provided by operating activities: | |||||||||||
| Depreciation | 1,434,771 | 1,306,643 | 1,105,839 | ||||||||
| Amortization of investments, net | 788,390 | 772,100 | 728,510 | ||||||||
| Amortization of other intangible assets | 916,684 | 213,795 | — | ||||||||
| Amortization related to postretirement benefits obligation | 8,612 | 8,941 | 7,904 | ||||||||
| Share-based compensation expense related to stock appreciation rights and options | 219,315 | 132,098 | 137,762 | ||||||||
| Net gain on disposals of property | (22,499 | ) | (12,439 | ) | (24,867 | ) | |||||
| Net realized (gain) loss on securities | (1,201,854 | ) | (738,731 | ) | 32,222 | ||||||
| Net realized gains on other investments | (21,714 | ) | (29,705 | ) | (149,128 | ) | |||||
| Net realized loss on impairments of other assets and other investments | 182,667 | — | 233,069 | ||||||||
| Net earnings from other investments | (1,672,790 | ) | (1,750,485 | ) | (2,002,276 | ) | |||||
| Provision for claims | 3,311,080 | 242,953 | 4,478,494 | ||||||||
| (Benefit) provision for deferred income taxes | (4,664,000 | ) | 2,790,000 | 1,015,000 | |||||||
| Changes in assets and liabilities: | |||||||||||
| (Increase) decrease in receivables | (1,505,358 | ) | (261,464 | ) | 217,594 | ||||||
| Decrease (increase) in other assets | 388,113 | 2,631,205 | (4,879,418 | ) | |||||||
| Increase in current income taxes recoverable | (385,109 | ) | — | — | |||||||
| Increase (decrease) in accounts payable and accrued liabilities | 1,463,814 | (581,518 | ) | 6,689,204 | |||||||
| (Decrease) increase in current income taxes payable | (1,232,432 | ) | 1,054,370 | 145,038 | |||||||
| Payments of claims, net of recoveries | (3,815,080 | ) | (2,725,953 | ) | (3,367,494 | ) | |||||
| Net cash provided by operating activities | 19,893,180 | 22,567,262 | 16,916,506 | ||||||||
| Investing Activities | |||||||||||
| Purchases of available-for-sale securities | (23,066,396 | ) | (19,424,849 | ) | (20,164,353 | ) | |||||
| Purchases of short-term securities | (26,413,954 | ) | (1,775,239 | ) | (4,593,240 | ) | |||||
| Purchases of other investments | (1,873,398 | ) | (2,743,413 | ) | (3,717,978 | ) | |||||
| Investment in subsidiary | — | (9,141 | ) | (72,600 | ) | ||||||
| Proceeds from sales and maturities of available-for-sale securities | 22,126,726 | 20,258,089 | 22,151,408 | ||||||||
| Proceeds from sales and maturities of short-term securities | 9,227,942 | 2,081,805 | 304,827 | ||||||||
| Proceeds from sales and distributions of other investments | 2,695,670 | 3,437,999 | 3,911,286 | ||||||||
| Proceeds from sales of other assets | 21,714 | 17,601 | 149,128 | ||||||||
| Purchase of subsidiary, net of cash | (175,000 | ) | (8,316,155 | ) | — | ||||||
| Purchases of property, equipment and software | (2,882,732 | ) | (2,456,951 | ) | (2,742,619 | ) | |||||
| Proceeds from disposals of property | 51,022 | 91,656 | 75,060 | ||||||||
| Net cash used in investing activities | (20,288,406 | ) | (8,838,598 | ) | (4,699,081 | ) | |||||
| Financing Activities | |||||||||||
| Repurchases of common stock | (244,831 | ) | (6,219,670 | ) | (5,483,953 | ) | |||||
| Exercise of stock appreciation rights and options | (737 | ) | (200 | ) | 54,988 | ||||||
| Proceeds from note payable | — | 6,000,000 | — | ||||||||
| Payments on note payable | — | (6,000,000 | ) | — | |||||||
| Subsidiary return of capital | — | — | (35,000 | ) | |||||||
| Dividends paid | (7,073,210 | ) | (1,370,390 | ) | (789,907 | ) | |||||
| Net cash used in financing activities | (7,318,778 | ) | (7,590,260 | ) | (6,253,872 | ) | |||||
| For the Years Ended December 31, | 2023 | 2022 | |||||||||
| Operating Activities | |||||||||||
| Net income | $ | 21,686 | $ | 23,903 | |||||||
| Adjustments to reconcile net income to net cash provided by operating activities: | |||||||||||
| Depreciation | 2,760 | 2,298 | |||||||||
| (Accretion) amortization of investments, net | (3,698) | 271 | |||||||||
| Amortization of other intangible assets, net | 1,361 | 1,282 | |||||||||
| Share-based compensation expense related to stock appreciation rights | 425 | 362 | |||||||||
| Net gains on disposals of property | (204) | (58) | |||||||||
| Net investment (gains) losses | (3,448) | 11,226 | |||||||||
| Net earnings from other investments | (3,206) | (2,224) | |||||||||
| Provision for claims | 4,762 | 4,255 | |||||||||
| Benefit for deferred income taxes | (4,234) | (4,644) | |||||||||
| Changes in assets and liabilities: | |||||||||||
| Decrease in premium and fees receivable | 5,709 | 3,906 | |||||||||
| Decrease in other assets | 621 | 532 | |||||||||
| Decrease (increase) in lease assets | 404 | (1,505) | |||||||||
| Decrease (increase) in current income taxes recoverable | 93 | (1,174) | |||||||||
| (Decrease) increase in lease liabilities | (390) | 1,510 | |||||||||
| (Decrease) increase in accounts payable and accrued liabilities | (10,408) | 3,410 | |||||||||
| Decrease in current income taxes payable | — | (3,329) | |||||||||
| Payments of claims, net of recoveries | (4,807) | (3,817) | |||||||||
| Net cash provided by operating activities | 7,426 | 36,204 | |||||||||
| Investing Activities | |||||||||||
| Purchases of fixed maturity securities | (20,339) | (10,704) | |||||||||
| Purchases of equity securities | (11,969) | (5,855) | |||||||||
| Purchases of short-term investments | (174,742) | (101,718) | |||||||||
| Purchase of subsidiary | — | (4,927) | |||||||||
| Purchases of other investments | (3,006) | (1,574) | |||||||||
| Proceeds from sales and maturities of fixed maturity securities | 10,937 | 31,305 | |||||||||
| Proceeds from the sale of equity securities | 30,216 | 20,785 | |||||||||
| Proceeds from sales and maturities of short-term investments | 166,362 | 44,236 | |||||||||
| Proceeds from sales and distributions of other investments | 4,499 | 5,332 | |||||||||
| Proceeds from sales of other assets | — | 29 | |||||||||
| Purchases of property, equipment and software | (9,186) | (5,681) | |||||||||
| Proceeds from disposals of property | 529 | 26 | |||||||||
| Net cash used in investing activities | (6,699) | (28,746) | |||||||||
46
| Consolidated Statements of Cash Flows, continued | |||||||||||
| For the Years Ended December 31, | 2023 | 2022 | |||||||||
| Financing Activities | |||||||||||
| Repurchases of common stock | (959) | (133) | |||||||||
| Exercise of stock appreciation rights | — | (1) | |||||||||
| Dividends paid | (11,048) | (9,181) | |||||||||
| Net cash used in financing activities | (12,007) | (9,315) | |||||||||
| Net Decrease in Cash and Cash Equivalents | (11,280) | (1,857) | |||||||||
| Cash and Cash Equivalents, Beginning of Period | 35,311 | 37,168 | |||||||||
| Cash and Cash Equivalents, End of Period | $ | 24,031 | $ | 35,311 | |||||||
| Supplemental Disclosures: | |||||||||||
| Cash Paid During the Year for: | |||||||||||
| Income tax payments, net | $ | 8,688 | $ | 15,363 | |||||||
| Non Cash Investing and Financing Activities: | |||||||||||
| Non cash net unrealized (gain) loss on investments, net of deferred tax (expense) benefit of $(109) and $860 for December 31, 2023 and 2022, respectively | $ | (419) | $ | 3,206 | |||||||
| Adjustments to postretirement benefits obligation, net of deferred tax expense of $(5) and $(48) for December 31, 2023 and 2022, respectively | $ | (19) | $ | (180) | |||||||
| Non cash 1031 exchange proceeds receivable | $ | (2,589) | $ | — | |||||||
| Changes in Financial Statement Amounts Related to Purchase of Subsidiaries, Net of Cash Received: | |||||||||||
| Goodwill and other intangibles acquired | $ | — | $ | (2,832) | |||||||
| Title plant acquired | — | (637) | |||||||||
| Prepaid and other assets acquired | — | (121) | |||||||||
| Fixed assets acquired | — | (1,337) | |||||||||
| Purchase of subsidiary, net of cash received | $ | — | $ | (4,927) | |||||||
| Consolidated Statements of Cash Flows, continued | |||||||||||
| 2017 | 2016 | 2015 | |||||||||
| Net (Decrease) Increase in Cash and Cash Equivalents | (7,714,004 | ) | 6,138,404 | 5,963,553 | |||||||
| Cash and Cash Equivalents, Beginning of Period | 27,928,472 | 21,790,068 | 15,826,515 | ||||||||
| Cash and Cash Equivalents, End of Period | $ | 20,214,468 | $ | 27,928,472 | $ | 21,790,068 | |||||
| Supplemental Disclosures: | |||||||||||
| Cash Paid During the Year for: | |||||||||||
| Income tax payments, net | $ | 11,538,800 | $ | 5,068,400 | $ | 4,658,000 | |||||
| Non Cash Investing and Financing Activities | |||||||||||
| Non cash net unrealized (gain) loss on investments, net of deferred tax (provision) benefit of $(2,144,901), $(133,892) and $708,564 for December 31, 2017, 2016 and 2015, respectively | $ | (4,131,735 | ) | $ | (272,906 | ) | $ | 1,336,756 | |||
| Adjustments to postretirement benefits obligation, net of deferred tax (provision) benefit of $(23,676), $192 and $21,612 for December 31, 2017, 2016 and 2015, respectively | $ | (45,958 | ) | $ | 374 | $ | 41,954 | ||||
| Changes in Financial Statement Amounts Related to Purchase of Subsidiaries, Net of Cash Received | |||||||||||
| Goodwill and other intangibles acquired | $ | (237,000 | ) | $ | (11,249,851 | ) | $ | — | |||
| Title plant acquired (in prepaid expenses and other assets) | — | (690,000 | ) | — | |||||||
| Fixed assets acquired | — | (533,424 | ) | — | |||||||
| Prepaid and other assets acquired | — | (15,233 | ) | — | |||||||
| Accounts payable and accrued liabilities assumed | 62,000 | 1,683,844 | — | ||||||||
| Deferred income taxes | — | 2,488,509 | — | ||||||||
| Purchase of subsidiary, net of cash received | $ | (175,000 | ) | $ | (8,316,155 | ) | $ | — | |||
47
Investors Title Company and Subsidiaries
Notes to Consolidated Financial Statements
1. Basis of Presentation and Summary of Significant Accounting Policies
Description of Business – Business: Investors Title Company’s (the “Company”) two primary business segments are title insurance and only reportable segment, is title insurance.exchange services. The title insurance segment, through its two subsidiaries, Investors Title Insurance Company (“ITIC”) and National Investors Title Insurance Company (“NITIC”), is licensed to insure titles to residential, institutional, commercial and industrial properties. The Company issues title insurance policies primarily through approved attorneys from underwriting officesdirectly and through independent issuinga network of agents in 22 states and the District of Columbia, primarily in the eastern half of the United States. The majority of the Company’s title insurance business is concentrated in Georgia, North Carolina, Texas, South Carolina Texas and Virginia.Georgia.
Investors Title Exchange Corporation (“ITEC”) acts as an intermediary in tax-deferred exchanges of property held for productive use in a trade or business or for investments, while Investors Title Accommodation Corporation (“ITAC”) provides services for accomplishing reverse exchanges when taxpayers decide to acquire replacement property before selling the relinquished property.
Principles of Consolidation and Basis of Presentation – Presentation: The accompanying Consolidated Financial Statements include the accounts and operations of Investors Title Company and its subsidiaries, and have been prepared in accordance with accounting principles generally accepted in the United States (“GAAP”). Earnings attributable to noncontrolling interests in majority-owned insurance agencies are recorded in the Consolidated Statements of Income. Noncontrolling interests representing the portion of equity not related to the Company's ownership interests are recorded in separate sections of the Consolidated Balance Sheets. All intercompany balances and transactions have been eliminated in consolidation.
Significant Accounting Policies – Policies: The significant accounting policies of the Company are summarized below.
Cash and Cash Equivalents
For the purpose of presentation in the Company’sConsolidated Balance Sheets and Consolidated Statements of Cash Flows, cash equivalents are highly liquid instruments with remaining original maturities of three months or less. The carrying amount of cash and cash equivalents is a reasonable estimate of fair value due to the short-term maturity at purchase of these instruments.
Investments in Securities
Investments in Fixed Maturity Securities for which the Company has the intent and ability to hold to: Fixed maturity are classified as held-to-maturity and reported at cost, adjusted for amortization of premiums or accretion of discounts, and other-than-temporary declines in fair value. Securities held principally for resale in the near term are classified as trading securities and recorded at fair values. Realized and unrealized gains and losses on trading securities are included in other income. Securities not classified as either trading or held-to-maturity are classified as available-for-sale and reported at estimated fair value with unrealized gains and losses, net of tax and adjusted for other-than-temporary declines in fair value,recognized impairment, and reported as accumulated other comprehensive income. As of December 31, 2017 and 2016, all investments in securities are classified as available-for-sale. Securities are regularly reviewed for differences between the cost and estimated fair value of each security for factors that may indicate that a decline in fair value is other-than-temporary. Some factors consideredimpaired. In evaluating available-for-sale fixed maturity securities in evaluating whetherunrealized loss positions for impairment and the criteria regarding its intent or not a decline inrequirement to sell such securities, the Company considers the extent to which estimated fair value is other-than-temporary includeless than amortized cost, whether the durationsecurities are issued by the federal government or its agencies, whether downgrades by bond rating agencies have occurred, and extentthe results of reviews of the issuers’ financial condition, among other factors. If the Company intends to sell an available-for-sale security in an unrealized loss position, or determines that it is more likely than not that the Company will be required to sell the security before it recovers its amortized cost basis, the security is impaired and it is written down to estimated fair value with all losses recognized in earnings. For available-for-sale fixed maturity securities in an unrealized loss position for which the Company does not intend to sell the security and it is not more likely than not that the Company will be required to sell the security, the Company evaluates the securities to determine whether the decline in the estimated fair value has been less thanbelow the amortized cost andbasis (impairment) is due to credit-related factors or noncredit-related factors. Any impairment that is not credit-related is recognized in other comprehensive income (loss), net of applicable taxes. Credit-related impairment is recognized as an allowance for credit losses (“ACL”) in the Company’s ability andConsolidated Balance Sheets, limited to the amount by which the amortized cost basis exceeds the estimated fair value, with a corresponding adjustment to earnings.
The ACL may be reversed if conditions change through an adjustment to the Consolidated Statements of Operations. Changes in the ACL are recorded as provision for (or reversal of) credit loss expense. Losses are charged against the ACL when management believes the uncollectability of an available-for-sale fixed maturity security is confirmed or when either of the criteria regarding intent or requirement to retainsell is met. Accrued interest receivable is excluded from the investment for a periodestimate of time sufficient to allow for a recovery in value. Suchcredit losses. Impairment reviews are inherently uncertain and the value of the investment may not fully recover or may decline in future periods resulting in a realized loss. Fair values of the majority of investments are based on quoted market prices. Realized gains and losses are determined on the specific identification method. Refer to Note 3 for further information regardingabout the Company’s investments in fixed maturity securities.
48
Investments in Equity Securities: Equity securities represent ownership interests held by the Company in entities for investment purposes. Changes in the estimated fair value of equity security investments are reported in the Consolidated Statements of Operations. Realized investment gains and fair value.losses from sales are recorded on the trade date and are determined using the specific identification method. Refer to Note 3 for further information about the Company’s investments in equity securities.
Other Investments
Other investments consist of investments in real estate and unconsolidated affiliated entities, typically structured as limited liability companies ("LLCs"), without readily determinable fair values. As of December 31, 2023, the Company had investments in real estate of $2.5 million and investments in unconsolidated affiliated entities of $14.9 million. As of December 31, 2022, the Company had investments in real estate of $5.0 million and investments in unconsolidated affiliated entities of $13.3 million.
Real estate investments are comprised of money market accounts which are invested in short-term funds, commercial paper, certificates of deposit,reported at amortized cost. Depreciation and other investments expectedrelated expenses are recorded as an offset to have maturities or redemptions greater than three months and less than twelve months.the related rental income. The Company monitors any events or changes in circumstances that may have had a significant adverse effect on the fair value of real estate investments and makes any necessary adjustments, with any reductions in the carrying amount of these investments.investments recorded in net investment gains (losses) in the Consolidated Statement of Operations when recognized. Lease rental income earned by the Company, which does not have a material impact on the Company's results of operations, is included with other revenues in the Consolidated Statements of Operations.
Short-term investments are comprised of money market accounts which are invested in short-term funds, U.S. Treasury bills, commercial paper, certificates of deposit, and other investments expected to have maturities or redemptions greater than three months and less than twelve months.
Property Acquired in Settlement of Claims
Property acquired in settlement of claims is held for sale and valued at the lower of cost or market.estimated realizable value, net of any indebtedness on the property. Adjustments to reported estimated realizable values and realized gains or losses on dispositions are recorded as increases or decreases in claim costs. Properties acquired in settlement of claims are included in prepaid expenses and other assets in the Consolidated Balance Sheets.
Property and Equipment
Property and equipment are recorded at cost and are depreciated principally under the straight-line method over the estimated useful lives (3 to 25 years) of the respective assets. Maintenance and repairs are charged to operating expenses and improvements are capitalized.
Reserve for Claims
The total reserve for all reported and unreported losses the Company incurred through December 31, 20172023 is represented by the reserve for claims. The Company’s reserve for unpaid losses and loss adjustment expenses is established using estimated amounts required to settle claims for which notice has been received (reported) and the amount estimated to be required to satisfy incurred claims of policyholders which may be reported in the future.future (incurred but not reported, or “IBNR”). Despite the variability of such estimates, management believes that the reserve is adequate to cover claimclaims losses resulting from pending and future claims for policies issued through December 31, 2017.2023. The Company continually reviews and adjusts its reserve estimates as necessary to reflect its loss experience and any new information that becomes available. Adjustments resulting from such reviews may be significant.
49
Management records a provision for future claim payments at the time the related premium revenue is recognized by applying a loss provision rate against net premiums written. Management determines its loss provision rate through the consideration of factors such as the Company’s historical claim experience, case reserve estimates on reported claims, large claims, actuarial projections, and other relevant factors. The Company’s specialist utilizes accepted actuarial methodologies when performing the actuarial projections. Management’s assumptions include assumed comparability to its historical claims experience unless factors, such as loss experience and charged premium rates, change significantly, as well as assumptions around large losses related to fraud and defalcation.
Claims and losses paid are charged to the reserve for claims. Although claims losses are typically paid in cash, occasionally claims are settled by purchasing the interest of the insured or the claimant in the real property. When this event occurs, the acquiring company carries the assets atas property acquired in the lowersettlement of cost or estimated realizable value, net of any indebtedness on the property.claims.
Income Taxes
The Company makes certain estimates and judgments in determining income tax expense (benefit) for financial statement purposes. These estimates and judgments occur in the calculation of certain tax assets and liabilities which arise from differences in the timing of recognition of revenue and expense for tax and financial statement purposes. The Company provides for deferred income taxes (benefits) for the tax consequences in future years of temporary differences between the financial statements’ carrying values and the tax bases of assets and liabilities using currently enacted tax rates. The Company establishes a valuation allowance if it believes that it is more likely than not that some or all of its deferred tax assets will not be realized. Refer to Note 8 for further information regarding income taxes.
Premiums Written and Commissions to Agents
Generally, title insurance premiums are recognized at the time of settlement of the related real estate transaction, as the earnings process is then considered complete, irrespective of the timing of issuance of a title insurance policy or commitment. Expenses typically associated with premiums, including agent commissions, premium taxes, and a provision for future claims are recognized concurrent with recognition of related premium revenue.
Allowance for Doubtful Accounts
Company management continually evaluates the collectability of receivables and provides an allowance for doubtful accounts equal to estimated losses expected to be incurred in the collection of premiums and fees receivable.receivable over the term of the receivables. On a quarterly basis, the Company considers its historical loss experience as well as current conditions and reasonable and supportable forecasts to determine the allowance for doubtful accounts. Changes to the allowance for doubtful accounts are reflected within net premiums written in the Consolidated Statements of Income. Amounts are charged off in the period they areOperations.
Receivables deemed to be uncollectible.
Exchange Services Revenue
Fees are recognized at the signing of a binding agreement, and investmentas the earnings process, or performance obligation, is then considered to be complete. Investment earnings are recognized as they are earned. Exchange services revenue is included in other revenuesnon-title services in the Consolidated Statements of Income.Operations.
Fair Values of Financial Instruments
The carrying amounts reported in the Consolidated Balance Sheets for cash and cash equivalents, short-term investments, premium and fees receivable, accrued interest and dividends, accounts payable, commissions payable, reinsurance payable and current income taxes recoverable/payable approximate fair value due to the short-term nature of these assets and liabilities. Estimated fair values for the majority of investment securities are based on quoted market prices. Refer to Note 3 for further information regarding investments in securities and fair value.
50
Accumulated Other Comprehensive Income
The Company’s accumulated other comprehensive income is comprised of unrealized holding gains/gains or losses on available-for-sale securities, net of tax, and unrecognized prior service cost and unrealized gains/gains or losses associated with postretirement benefit liabilities, net of tax. Accumulated other comprehensive income as of December 31, 20172023 consists of $16,002,382$583 thousand of unrealized holding gains on available-for-sale securities and $57,556$55 thousand of unrecognized actuarial lossesgains associated with postretirement benefit liabilities. Accumulated other comprehensive income as of December 31, 20162022 consists of $11,870,647$164 thousand of unrealized holding gains on available-for-sale securities and $109,200$36 thousand of unrecognized actuarial lossesgains associated with postretirement benefit liabilities. AccumulatedRefer to Note 18 for further information regarding accumulated other comprehensive income as of December 31, 2015 consists of $11,597,741 of unrealized holding gains on available-for-sale securities and $114,726 of unrecognized prior service cost and unrecognized actuarial losses associated with postretirement benefit liabilities.income.
Share-Based Compensation
Share-based compensation cost is generally measured at the grant date, based on the estimated fair value of the award, and is recognized as an expense over the employee’s requisite service period.
As the share-based compensation expense recognized in the Consolidated Statements of IncomeOperations is based on awards ultimately expected to vest, it has been reduced for estimated forfeitures. Forfeitures are estimated at the time of grant and revised, if necessary, in subsequent periods if actual forfeitures differ from those estimates.
Goodwill
Goodwill represents the excess of cost over fair value of identifiable net assets acquired and assumed in a business combination. The fair value of the Company’s goodwill at acquisition is principally based on values obtained from a third partyan independent third-party valuation service.
Goodwill iswas reviewed for impairment as of December 31, 2023, and is reviewed at least annually, or when events or changes in circumstances indicate the carrying value may not be recoverable. When evaluating whether goodwill is impaired, the Company determines through qualitative analysis whether relevant events and circumstances indicate that it is more likely than not that goodwill balances are impaired as of the testing date. If the qualitative analysis does not indicate that an impairment of goodwill is more likely than not, then no other specific quantitative impairment testing is required. If it is determined that it is more likely than not that an impairment exists, the Company performs a quantitative assessment whereby a discounted cash flow analysis is utilized to determine an estimated fair value. The estimated fair value is compared to the carrying value of goodwill as of the measurement date. The discounted cash flows used in estimating fair value are dependent on a number of significant assumptions, and therefore estimated fair value measurements are subject to change given the inherent uncertainty in predicting future results and cash flows.
Other Intangible Assets
The Company’s other intangible assets consist of non-compete agreements, referral relationships and a tradename resulting from agency acquisitions; all of which are recorded at the acquisition date fair value. The fair value of the Company’s other intangible assets is principally based on values obtained from a third partyan independent third-party valuation service. These assets areAssets with remaining useful lives will be amortized on a straight-line basis over theirthose useful lives, which range from 13 months to 30 years; noting that the amortization23 years as of certain non-compete contracts will start at a future date when the related employment agreements are terminated.December 31, 2023. Other intangible assets are reviewed for impairment at least annually or when events or changes in circumstances indicate the carrying value may not be recoverable.
Title Plants
Title plants represent a historical record of matters affecting title to parcels of land in a particular geographic area. Title plants are recorded at the cost incurred to construct or obtain and organize historical title information to the point it can be used to perform title searches. Costs incurred to maintain, update and operate title plants are expensed as incurred. Title plants are not amortized as they are considered to have an indefinite life with no diminishment of value if properly maintained; but are subject to impairment evaluation, which the Company performs on at least an annual basis.
51
Leases
At inception, the Company determines if an arrangement is a lease. The Company enters into lease agreements that are primarily used for office space, and the majority of current leases are accounted for as operating leases. Amounts related to leases are included in lease assets and lease liabilities in the Consolidated Balance Sheets. Lease assets represent the Company’s right to use an underlying asset for the stated lease term. Lease liabilities represent the Company’s obligation to make lease payments arising from a lease. Lease assets and liabilities are recognized at the date of the lease commencement, and are based on the present value of lease payments over the lease term. The Company's current leases do not provide an implicit interest rate, thus the Company utilized the average rate over a 10-year term based upon the Moody's seasoned Aaa corporate bond yields in determining the present value of lease payments. A portion of the Company's current leases includes an option to extend or cancel the lease term. The exercise of such an option is solely at the Company's discretion. The lease liability recorded in the Consolidated Balance Sheets includes lease payments related to options to extend or cancel the lease term if the Company determined at the date of adoption that the lease was expected to be renewed or extended. A lease expense is recognized on a straight-line basis over the lease term. Adjustments for straight-line rental expense for the periods presented are not material and as such, the lease expense recognized was reflected in cash used in operating activities for the respective periods. Refer to Note 9 for further information about the Company's leases.
Subsequent Events
The Company has evaluated and concluded that there were no material subsequent events requiring adjustment or disclosure to its Consolidated Financial Statements.
Use of Estimates and Assumptions
The preparation of financial statementsthe Consolidated Financial Statements in conformity with GAAP requires management to make estimates and assumptions that affect the reported amounts of assets and liabilities, and disclosures of contingent assets and liabilities at the date of the financial statements,Consolidated Financial Statements, and the reported amounts of revenues and expenses during the reporting period and the accompanying notes.Notes to Consolidated Financial Statements. Actual results could differ materially from those estimates and assumptions used. The more significant of these estimates and assumptions include the following:
Management considers factors such as the Company’s historical claims experience, case reserve estimates on reported claims, large claims, actuarial projections and other relevant factors in determining its loss provision rates and the aggregate recorded expected liability for claims. In establishing the reserve, actuarial projections are compared with recorded reserves to evaluate the adequacy of such recorded claims reserves and any necessary adjustments are then recorded in the current period’s income statement.statements of operations. As the most recent claims experience develops and new information becomes available, the loss reserve estimate related to prior periods will change to more accurately reflect updated and improved emerging data. The Company reflects any adjustments to the reserve in the results of operations in the period in which new information (principally claims experience) becomes available.
Premiums written –written: Premium revenues from certainissued directly and by agency operations include accruals for transactions which have settled but have not been reported as of the balance sheet date. These accruals are based on estimates of the typical lag time between settlement of real estate transactions and the agent’s reporting of these transactions to the Company. Reporting lag times vary by market. In certain markets, the lag time may be very short, but in others, can be as high as 100 days.3 months. The Company reviews and adjusts lag time estimates periodically, using historical experience and other factors, and reflects any adjustments in the result of operations in the period in which new information becomes available.
52
Impairments: Securities are regularly evaluated and reviewed for differences between the cost and estimated fair value of each security for factors that may indicate that a decline in estimated fair value is other-than-temporary.an impairment. When, in the opinion of management, a decline in the estimated fair value of an investment is considered to be other-than-temporary,an impairment, such investment is written down to its estimated fair value. Some factors considered in evaluating whether or not a decline in estimated fair value is other-than-temporaryan impairment include the duration and extent to which the estimated fair value has been less than cost; the probability that the Company will be unable to collect all amounts due under the contractual terms of the security; with respect to equity securities, whether the Company’s ability and intent to retain the investment for a period of time is sufficient to allow for a recovery in value; with respect to fixed maturity securities, whether the Company has the intent to sell or will more likely than not be required to sell a particular security before recovery in value; and the financial condition and prospects of the issuer (including credit ratings). These factors are reviewed quarterly and any material degradation in the prospect for recovery will be considered in the other-than-temporary impairment analysis. Such reviews are inherently uncertain and the value of the investment may not fully recover or may decline in future periods resulting in a realized loss. The estimated fair values of the majority of the Company’s investments are based on quoted market prices from independent pricing services.
2. Statutory Accounting and Restrictions on Consolidated Stockholders’Shareholders’ Equity and Investments
The Consolidated Financial Statements have been prepared in conformity with GAAP, which differ in some respects from statutory accounting practices prescribed or permitted in the preparation of financial statements for submission to insurance regulatory authorities.
Combined capital and surplus on a statutory basis was $171,896,522$243.3 million and $152,700,227$235.6 million as of December 31, 20172023 and 2016,2022, respectively. Net income on a statutory basis was $18,766,527, $17,863,815$31.6 million and $13,621,174$35.6 million and for the twelve monthsyears ended December 31, 2017, 20162023 and 2015,2022, respectively.
The Company has designated approximately $57,301,000$52.1 million and $53,190,000$53.3 million of retained earnings as of December 31, 20172023 and 2016,2022, respectively, as appropriated to reflect the required statutory premium and supplemental reserves. SeeRefer to Note 8 for the tax treatment of the statutory premium reserve.
As of December 31, 20172023 and 2016,2022, approximately $102,082,000$113.0 million and $88,323,000,$110.3 million, respectively, of consolidated stockholders’shareholders’ equity represents net assets of the Company’s subsidiaries that cannot be transferred in the form of dividends, loans or advances to the parent company under statutory regulations without prior insurance department approval. During 2018,2024, the maximum distributions the insurance subsidiaries can make to the Company without prior approval from applicable regulators total approximately $18,960,000.$17.5 million.
Fixed maturity securities with fair market values totaling approximately $7,119,000 and $6,843,000$6.7 million at December 31, 20172023 and 2016, respectively,2022, are deposited with the insurance departments of the states in which business is conducted.
3. Investments and Estimated Fair Value
Investments in Fixed Maturity Securities
The aggregate estimated fair value, gross unrealized holding gains, gross unrealized holding losses and cost or amortized cost for fixed maturity securities by major security type at December 31 wereclassification are as follows:
| December 31, 2017 | Amortized Cost | Gross Unrealized Gains | Gross Unrealized Losses | Estimated Fair Value | |||||||||||
| Fixed maturities, available-for-sale, at fair value: | |||||||||||||||
| Government obligations | $ | 1,042,921 | $ | — | $ | 951 | $ | 1,041,970 | |||||||
| General obligations of U.S. states, territories and political subdivisions | 24,189,032 | 505,513 | 50,224 | 24,644,321 | |||||||||||
| Special revenue issuer obligations of U.S. states, territories and political subdivisions | 62,591,978 | 2,217,665 | 164,355 | 64,645,288 | |||||||||||
| Corporate debt securities | 12,490,154 | 528,218 | 8,868 | 13,009,504 | |||||||||||
| Total | $ | 100,314,085 | $ | 3,251,396 | $ | 224,398 | $ | 103,341,083 | |||||||
| Equity securities, available-for-sale, at fair value: | |||||||||||||||
| Common stocks | $ | 26,002,619 | $ | 21,376,110 | $ | 11,903 | $ | 47,366,826 | |||||||
| Total | $ | 26,002,619 | $ | 21,376,110 | $ | 11,903 | $ | 47,366,826 | |||||||
| Short-term investments: | |||||||||||||||
| Commercial paper, money market funds and certificates of deposit | $ | 23,779,672 | $ | — | $ | — | $ | 23,779,672 | |||||||
| Total | $ | 23,779,672 | $ | — | $ | — | $ | 23,779,672 | |||||||
| December 31, 2016 | Amortized Cost | Gross Unrealized Gains | Gross Unrealized Losses | Estimated Fair Value | |||||||||||
| Fixed maturities, available-for-sale, at fair value: | |||||||||||||||
| General obligations of U.S. states, territories and political subdivisions | $ | 29,374,774 | $ | 440,628 | $ | 298,533 | $ | 29,516,869 | |||||||
| Special revenue issuer obligations of U.S. states, territories and political subdivisions | 57,459,818 | 1,619,444 | 502,135 | 58,577,127 | |||||||||||
| Corporate debt securities | 13,327,765 | 512,316 | — | 13,840,081 | |||||||||||
| Total | $ | 100,162,357 | $ | 2,572,388 | $ | 800,668 | $ | 101,934,077 | |||||||
| Equity securities, available-for sale, at fair value: | |||||||||||||||
| Common stocks | $ | 24,836,032 | $ | 16,392,210 | $ | 48,983 | $ | 41,179,259 | |||||||
| Total | $ | 24,836,032 | $ | 16,392,210 | $ | 48,983 | $ | 41,179,259 | |||||||
| Short-term investments: | |||||||||||||||
| Money market funds and certificates of deposit | $ | 6,558,840 | $ | — | $ | — | $ | 6,558,840 | |||||||
| Total | $ | 6,558,840 | $ | — | $ | — | $ | 6,558,840 | |||||||
| As of December 31, 2023 (in thousands) | Amortized Cost | Gross Unrealized Gains | Gross Unrealized Losses | Estimated Fair Value | |||||||||||||||||||
| Fixed maturity securities, available-for-sale, at fair value: | |||||||||||||||||||||||
| Government obligations | $ | 2,220 | $ | 2 | $ | (2) | $ | 2,220 | |||||||||||||||
| General obligations of U.S. states, territories and political subdivisions | 9,419 | 64 | (24) | 9,459 | |||||||||||||||||||
| Special revenue issuer obligations of U.S. states, territories and political subdivisions | 24,908 | 145 | (66) | 24,987 | |||||||||||||||||||
| Corporate debt securities | 26,559 | 655 | (33) | 27,181 | |||||||||||||||||||
| Total | $ | 63,106 | $ | 866 | $ | (125) | $ | 63,847 | |||||||||||||||
53
| As of December 31, 2022 (in thousands) | Amortized Cost | Gross Unrealized Gains | Gross Unrealized Losses | Estimated Fair Value | |||||||||||||||||||
| Fixed maturity securities, available-for-sale, at fair value: | |||||||||||||||||||||||
| Governmental obligations | $ | 4,329 | $ | — | $ | (7) | $ | 4,322 | |||||||||||||||
| General obligations of U.S. states, territories and political subdivisions | 8,561 | 21 | (36) | 8,546 | |||||||||||||||||||
| Special revenue issuer obligations of U.S. states, territories and political subdivisions | 30,123 | 106 | (219) | 30,010 | |||||||||||||||||||
| Corporate debt securities | 10,762 | 417 | (68) | 11,111 | |||||||||||||||||||
| Total | $ | 53,775 | $ | 544 | $ | (330) | $ | 53,989 | |||||||||||||||
The special revenue category for both periods presented includes approximately 6030 individual bondsfixed maturity securities with revenue sources from a variety of industry sectors.
The scheduled maturities of fixed maturity securities at December 31, 2017 were2023 are as follows:
| Available-for-Sale | |||||||||||
| (in thousands) | Amortized Cost | Fair Value | |||||||||
| Due in one year or less | $ | 24,328 | $ | 24,430 | |||||||
| Due after one year through five years | 27,348 | 27,530 | |||||||||
| Due after five years through ten years | 10,597 | 10,785 | |||||||||
| Due after ten years | 833 | 1,102 | |||||||||
| Total | $ | 63,106 | $ | 63,847 | |||||||
| Available-for-Sale | |||||||
Amortized Cost | Fair Value | ||||||
| Due in one year or less | $ | 11,570,232 | $ | 11,637,351 | |||
| Due after one year through five years | 38,510,415 | 39,352,750 | |||||
| Due five years through ten years | 48,246,123 | 49,802,410 | |||||
| Due after ten years | 1,987,315 | 2,548,572 | |||||
| Total | $ | 100,314,085 | $ | 103,341,083 | |||
| 2017 | 2016 | 2015 | |||||||||
| Fixed maturities | $ | 3,037,105 | $ | 3,506,484 | $ | 3,439,296 | |||||
| Equity securities | 1,202,912 | 1,157,550 | 1,086,365 | ||||||||
| Invested cash and other short-term investments | 201,780 | 19,982 | 5,605 | ||||||||
| Miscellaneous interest | 2,650 | 473 | 53 | ||||||||
| Investment income | $ | 4,444,447 | $ | 4,684,489 | $ | 4,531,319 | |||||
| 2017 | 2016 | 2015 | |||||||||
| Gross realized gains: | |||||||||||
| Special revenue issuer obligations of U.S. states, territories and political subdivisions | $ | 139 | $ | 161 | $ | — | |||||
| Corporate debt securities | — | 119,001 | 5,417 | ||||||||
| Common stocks and nonredeemable preferred stocks | 1,487,420 | 953,491 | 1,572,636 | ||||||||
| Auction rate securities | — | 74,996 | — | ||||||||
| Total | 1,487,559 | 1,147,649 | 1,578,053 | ||||||||
| Gross realized losses: | |||||||||||
| General obligations of U.S. states, territories and political subdivisions | — | (535 | ) | (12,319 | ) | ||||||
| Special revenue issuer obligations of U.S. states, territories and political subdivisions | (100 | ) | (1,085 | ) | (397 | ) | |||||
| Common stocks | (260,194 | ) | (173,357 | ) | (846,500 | ) | |||||
| Other than temporary impairment of securities | (25,411 | ) | (233,941 | ) | (751,059 | ) | |||||
| Total | (285,705 | ) | (408,918 | ) | (1,610,275 | ) | |||||
| Net realized gain (loss) | $ | 1,201,854 | $ | 738,731 | $ | (32,222 | ) | ||||
| Net realized (loss) gain on other investments: | |||||||||||
| Impairments of other assets and investments | $ | (182,667 | ) | $ | — | $ | (233,069 | ) | |||
| Net gain on other assets and investments | 21,714 | 29,705 | 149,128 | ||||||||
| Total | $ | (160,953 | ) | $ | 29,705 | $ | (83,941 | ) | |||
| Net realized gain (loss) on investments | $ | 1,040,901 | $ | 768,436 | $ | (116,163 | ) | ||||
The following table presents the gross unrealized losses on investmentfixed maturity securities and the estimated fair value of the related securities, aggregated by investment category and length of time that individual securities have been in a continuous loss position at December 31, 20172023 and 2016:2022, respectively:
| Less than 12 Months | 12 Months or Longer | Total | |||||||||||||||||||||||||||||||||
| As of December 31, 2023 (in thousands) | Estimated Fair Value | Unrealized Losses | Estimated Fair Value | Unrealized Losses | Estimated Fair Value | Unrealized Losses | |||||||||||||||||||||||||||||
| Government obligations | $ | 1,488 | $ | (2) | $ | — | $ | — | $ | 1,488 | $ | (2) | |||||||||||||||||||||||
| General obligations of U.S. states, territories and political subdivisions | 5,925 | (23) | 101 | (1) | 6,026 | (24) | |||||||||||||||||||||||||||||
| Special revenue issuer obligations of U.S. states, territories and political subdivisions | 7,124 | (16) | 3,085 | (50) | 10,209 | (66) | |||||||||||||||||||||||||||||
| Corporate debt securities | 6,052 | (29) | 296 | (4) | 6,348 | (33) | |||||||||||||||||||||||||||||
| Total | $ | 20,589 | $ | (70) | $ | 3,482 | $ | (55) | $ | 24,071 | $ | (125) | |||||||||||||||||||||||
| Less than 12 Months | 12 Months or Longer | Total | |||||||||||||||||||||
| December 31, 2017 | Estimated Fair Value | Unrealized Loss | Estimated Fair Value | Unrealized Loss | Estimated Fair Value | Unrealized Loss | |||||||||||||||||
| Government obligations | $ | 1,041,970 | $ | (951 | ) | $ | — | $ | — | $ | 1,041,970 | $ | (951 | ) | |||||||||
| General obligations of U.S. states, territories and political subdivisions | 4,560,021 | (26,823 | ) | 3,535,040 | (23,401 | ) | 8,095,061 | (50,224 | ) | ||||||||||||||
| Special revenue issuer obligations of U.S. states, territories and political subdivisions | 13,550,979 | (61,127 | ) | 4,022,310 | (103,228 | ) | 17,573,289 | (164,355 | ) | ||||||||||||||
| Corporate debt securities | 3,744,195 | (8,868 | ) | — | — | 3,744,195 | (8,868 | ) | |||||||||||||||
| Total fixed maturity securities | $ | 22,897,165 | $ | (97,769 | ) | $ | 7,557,350 | $ | (126,629 | ) | $ | 30,454,515 | $ | (224,398 | ) | ||||||||
| Equity securities | 61,187 | (11,903 | ) | — | — | 61,187 | (11,903 | ) | |||||||||||||||
| Total temporarily impaired securities | $ | 22,958,352 | $ | (109,672 | ) | $ | 7,557,350 | $ | (126,629 | ) | $ | 30,515,702 | $ | (236,301 | ) | ||||||||
54
| December 31, 2016 | |||||||||||||||||||||||
| General obligations of U.S. states, territories and political subdivisions | $ | 13,884,808 | $ | (298,533 | ) | $ | — | $ | — | $ | 13,884,808 | $ | (298,533 | ) | |||||||||
| Special revenue issuer obligations of U.S. states, territories and political subdivisions | 16,161,906 | (502,135 | ) | — | — | 16,161,906 | (502,135 | ) | |||||||||||||||
| Total fixed maturity securities | $ | 30,046,714 | $ | (800,668 | ) | $ | — | $ | — | $ | 30,046,714 | $ | (800,668 | ) | |||||||||
| Equity securities | 380,400 | (48,983 | ) | — | — | 380,400 | (48,983 | ) | |||||||||||||||
| Total temporarily impaired securities | $ | 30,427,114 | $ | (849,651 | ) | $ | — | $ | — | $ | 30,427,114 | $ | (849,651 | ) | |||||||||
| Less than 12 Months | 12 Months or Longer | Total | |||||||||||||||||||||||||||||||||
| As of December 31, 2022 (in thousands) | Estimated Fair Value | Unrealized Losses | Estimated Fair Value | Unrealized Losses | Estimated Fair Value | Unrealized Losses | |||||||||||||||||||||||||||||
| Government obligations | $ | 4,322 | $ | (7) | $ | — | $ | — | $ | 4,322 | $ | (7) | |||||||||||||||||||||||
| General obligations of U.S. states, territories and political subdivisions | 3,221 | (36) | — | — | 3,221 | (36) | |||||||||||||||||||||||||||||
| Special revenue issuer obligations of U.S. states, territories and political subdivisions | 12,568 | (216) | 1,100 | (3) | 13,668 | (219) | |||||||||||||||||||||||||||||
| Corporate debt securities | 6,498 | (68) | — | — | 6,498 | (68) | |||||||||||||||||||||||||||||
| Total | $ | 26,609 | $ | (327) | $ | 1,100 | $ | (3) | $ | 27,709 | $ | (330) | |||||||||||||||||||||||
Management evaluates available-for-sale fixed maturity securities in unrealized loss positions to determine whether the impairment is due to credit-related factors or noncredit-related factors. The decline in estimated fair value of the fixed maturity securities can be attributed primarily to changes in market interest rates and changes in credit spreads over Treasury securities. Because the Company does not have the intent to sell these securities and will likely not be compelled to sell them before it can recover its cost basis, the Company does not consider these investments to be other-than-temporarily impaired.
Factors considered in determining whether a loss is temporarycredit-related include the length of time and extent to which fair value has been below cost, the financial condition and prospects of the issuer (including credit ratings and analyst reports) and macro-economic changes. A total of 3252 and 3651 fixed maturity securities had unrealized losses at December 31, 20172023 and December 31, 2016,2022, respectively. The Company does not intend to sell any of these securities and believes that it is more likely than not that the Company will not have to sell any such securities before a recovery of cost. The fair value is expected to recover as the securities approach their maturity date or repricing date or if market yields for such investments decline. The Company believes that the unrealized losses detailed in the previous table are due to noncredit-related factors, including changes in market interest rates and other market conditions, and therefore the unrealized loss is recorded in accumulated other comprehensive income.
Reviews of the values of fixed maturity securities are inherently uncertain and the value of the investment may not fully recover, or may decline in future periods resulting in a realized loss. During 2017, theThe Company recorded other-than-temporary$201 thousand and $172 thousand of impairment charges in the amount of $25,411 related to securities. During 2016,fixed maturity securities for the Company recorded other-than-temporary impairment charges in the amount of $233,941twelve-month periods ended December 31, 2023 and 2022, respectively. Expenses related to securities. During 2015, the Companyimpairments are recorded other-than-temporary impairment charges in the amount of $751,059 related to securities. Other-than-temporary impairment charges are included in net realized gain (loss) on investmentsinvestment gains (losses) in the Consolidated Statements of Income.Operations when recognized.
Investments in Equity Securities
The cost and estimated fair value of equity securities are as follows:
| As of December 31, 2023 (in thousands) | Cost | Estimated Fair Value | |||||||||
| Equity securities, at fair value: | |||||||||||
| Common stocks | $ | 22,981 | $ | 37,212 | |||||||
| Total | $ | 22,981 | $ | 37,212 | |||||||
| As of December 31, 2022 (in thousands) | Cost | Estimated Fair Value | |||||||||
| Equity securities, at fair value: | |||||||||||
| Common stocks | $ | 25,278 | $ | 51,691 | |||||||
| Total | $ | 25,278 | $ | 51,691 | |||||||
Unrealized holding gains and losses are recorded in net investment gains (losses) in the Consolidated Statements of Operations.
55
Interest and Dividends
Earnings on investments for the years ended December 31 are as follows:
| (in thousands) | 2023 | 2022 | |||||||||
| Fixed maturity securities | $ | 2,317 | $ | 1,902 | |||||||
| Equity securities | 1,078 | 1,425 | |||||||||
| Invested cash and other short-term investments | 5,659 | 1,375 | |||||||||
| Miscellaneous interest | 1 | 2 | |||||||||
| Interest and dividends | $ | 9,055 | $ | 4,704 | |||||||
Net Investment Gains (Losses)
Gross realized gains and losses on sales of investments and unrealized holding gains and losses for the years ended December 31 are summarized as follows:
| (in thousands) | 2023 | 2022 | |||||||||
| Gross realized gains from securities: | |||||||||||
| Corporate debt securities | $ | — | $ | — | |||||||
| Common stocks | 16,350 | 11,020 | |||||||||
| Total | $ | 16,350 | $ | 11,020 | |||||||
| Gross realized losses from securities: | |||||||||||
| General obligations of U.S. states, territories and political subdivisions | $ | — | $ | (353) | |||||||
| Corporate debt securities | — | (104) | |||||||||
| Common stocks | (400) | (290) | |||||||||
| Impairment of securities | (201) | (172) | |||||||||
| Total | $ | (601) | $ | (919) | |||||||
| Net realized gains from securities | $ | 15,749 | $ | 10,101 | |||||||
| Net realized other investment gains (losses): | |||||||||||
| Gains on other investments | $ | 5 | $ | — | |||||||
| Losses on other investments | (123) | (366) | |||||||||
| Total | $ | (118) | $ | (366) | |||||||
| Net realized investment gains | $ | 15,631 | $ | 9,735 | |||||||
| Changes in the estimated fair value of equity security investments | $ | (12,183) | $ | (20,961) | |||||||
| Net investment gains (losses) | $ | 3,448 | $ | (11,226) | |||||||
Realized gains and losses are determined on the specific identification method.
56
Variable Interest Entities
The Company holds investments in variable interest entities (“VIEs”) that are not consolidated in the Company's consolidated financial statements as the Company is not the primary beneficiary. These entities are considered VIEs as the equity investors at risk, including the Company, do not have the power over the activities that most significantly impact the economic performance of the entities; this power resides with a third-party general partner or managing member that cannot be removed except for cause.cause and no participation rights exist. The following table sets forth details about the Company's variable interest investments in VIEs, which are structured either as limited partnerships ("LPs") or limited liability companies ("LLCs"),LLCs, as of December 31, 2017:2023:
| Type of Investment | Balance Sheet Classification | Carrying Value | Estimated Fair Value | Maximum Potential Loss (a) | ||||||||||
| Tax credit LPs | Other investments | $ | 905,179 | $ | 905,179 | $ | 1,325,000 | |||||||
| Real estate LLCs or LPs | Other investments | 5,355,874 | 5,849,112 | 7,700,000 | ||||||||||
| Small business investment LPs | Other investments | 3,750,677 | 3,806,600 | 9,400,000 | ||||||||||
| Total | $ | 10,011,730 | $ | 10,560,891 | $ | 18,425,000 | ||||||||
| Type of Investment (in thousands) | Balance Sheet Classification | Carrying Value | Estimated Fair Value | Maximum Potential Loss * | ||||||||||||||||||||||
| Real estate LLCs or LPs | Other investments | $ | 13,310 | $ | 14,166 | $ | 18,060 | |||||||||||||||||||
| Small business investment LLCs or LPs | Other investments | 200 | 200 | 80 | ||||||||||||||||||||||
| Total | $ | 13,510 | $ | 14,366 | $ | 18,140 | ||||||||||||||||||||
| * | ||||||||
| Maximum potential loss is calculated as the total investment in the LLC or LP including any capital commitments that may have not yet been called. The Company is not exposed to any loss beyond the total commitment of its investment. | ||||||||
Valuation of Financial Assets and Liabilities
The FASBFinancial Accounting Standards Board (“FASB”) has established a valuation hierarchy for disclosure of the inputs used to measure estimated measure fair value of financial assets and liabilities, such as securities. This hierarchy categorizes the inputs into three broad levels as follows. Level 1 inputs are quoted prices (unadjusted) in active markets for identical assets or liabilities. Level 2 inputs are quoted prices for similar assets and liabilities in active markets or inputs that are observable for the asset or liability, either directly or indirectly through market corroboration, for substantially the full term of the financial instrument. Level 3 inputs are unobservable inputs based on the Company’s own assumptions intended to represent market participant assumptions used to measure assets and liabilities at fair value.
A financial instrument’s classification within the valuation hierarchy is based upon the lowest level of input that is significant to the fair value measurement—measurement – consequently, if there are multiple significant valuation inputs that are categorized in different levels of the hierarchy, the instrument’s hierarchy level is the lowest level (with Level 3 being the lowest level) within which any significant input falls.
The Level 1 category includes equity securities and U.S. Treasury securities that are measured at estimated fair value using quoted active market prices.
The Level 2 category includes fixed maturity investmentssecurities such as corporate bonds,debt securities, U.S. government obligations, and agency bondsobligations of U.S. states, territories, and municipal bonds.political subdivisions. Estimated fair value is principally based on market values obtained from a third partythird-party pricing service. Factors that are used in determining estimated fair market value include benchmark yields, reported trades, broker/dealer quotes, issuer spreads, two-sided markets, benchmark securities, bids, offers and reference data. The Company receives one quote per security from a third partythird-party pricing service, although as discussed below, the Company does consult other pricing resources when confirming that the prices it obtains reflect the estimated fair values of the instruments in accordance with ASC 820, Fair Value Measurements and Disclosures.GAAP. Generally, quotes obtained from the pricing service for instruments classified as Level 2 are not adjusted and are not binding. As of December 31, 20172023 and December 31, 2016,2022, the Company did not adjust any Level 2 fair values.
A number of the Company’s investment grade corporate bondsdebt securities are frequently traded in active markets, and trading prices are consequently available for these securities. However, these securities are classified as Level 2 because the pricing service from which the Company has obtained estimated fair values for these instruments uses valuation models that use observable market inputs in addition to trading prices. Substantially all of the input assumptions used in the service’s model are observable in the marketplace or can be derived or supported by observable market data.
57
In estimating the fair value of the financial instruments presented, the Company used the following methods and assumptions:
Cash and cash equivalents
The carrying amount for cash and cash equivalents is a reasonable estimate of fair value due to the short-term maturity of these investments.
Measurement alternative equity investments
The measurement alternative method requires investments without readily determinable fair values to be recorded at cost, less impairments, and plus or minus any changes resulting from observable price changes. The Company monitors any events or changes in circumstances that may have had a significant adverse effect on the fair value of these investments and makes any necessary adjustments.
Notes receivable
Notes receivable are recorded at amortized cost and are included in prepaid expenses and other receivables in the Consolidated Balance Sheets. The amortized cost is the amount at which a receivable is originated and adjusted for applicable accrued interest, accretion, or amortization of premium, discount, and net deferred fees or costs, collection of cash, writeoffs, foreign exchange, and fair value hedge accounting adjustments. The Company monitors any events or changes in circumstances that may have had a significant adverse effect on the fair value of these investments and makes any necessary adjustments.
Accrued interest and dividends
The carrying amount for accrued interest and dividends is a reasonable estimate of fair value due to the short-term maturity of these assets.
The following table presents, by level, the financial assetsfixed maturity securities carried at estimated fair value measured on a recurring basis as of December 31, 20172023 and 2016. The table does not include cash on hand and also does not include assets that are measured at historical cost or any basis other than fair value.2022:
| As of December 31, 2023 (in thousands) | Level 1 | Level 2 * | Level 3 | Total | |||||||||||||||||||
| Fixed maturity securities: | |||||||||||||||||||||||
| Obligations of U.S. states, territories and political subdivisions | $ | 2,220 | $ | 34,446 | $ | — | $ | 36,666 | |||||||||||||||
| Corporate debt securities | — | 27,181 | — | 27,181 | |||||||||||||||||||
| Total | $ | 2,220 | $ | 61,627 | $ | — | $ | 63,847 | |||||||||||||||
| As of December 31, 2017 | Level 1 | Level 2 | Level 3 | Total | |||||||||||
| Short-term investments | $ | 23,779,672 | $ | — | $ | — | $ | 23,779,672 | |||||||
| Equity securities: | |||||||||||||||
| Common stocks | 47,366,826 | — | — | 47,366,826 | |||||||||||
| Fixed maturities: | |||||||||||||||
| Obligations of U.S. states, territories and political subdivisions* | — | 90,331,579 | — | 90,331,579 | |||||||||||
| Corporate debt securities* | — | 13,009,504 | — | 13,009,504 | |||||||||||
| Total | $ | 71,146,498 | $ | 103,341,083 | $ | — | $ | 174,487,581 | |||||||
| As of December 31, 2022 (in thousands) | Level 1 | Level 2 * | Level 3 | Total | |||||||||||||||||||
| Fixed maturity securities: | |||||||||||||||||||||||
| Obligations of U.S. states, territories and political subdivisions | $ | 4,322 | $ | 38,556 | $ | — | $ | 42,878 | |||||||||||||||
| Corporate debt securities | — | 11,111 | — | 11,111 | |||||||||||||||||||
| Total | $ | 4,322 | $ | 49,667 | $ | — | $ | 53,989 | |||||||||||||||
| As of December 31, 2016 | Level 1 | Level 2 | Level 3 | Total | |||||||||||
| Short-term investments | $ | 6,558,840 | $ | — | $ | — | $ | 6,558,840 | |||||||
| Equity securities: | |||||||||||||||
| Common stocks | 41,179,259 | — | — | 41,179,259 | |||||||||||
| Fixed maturities: | |||||||||||||||
| Obligations of U.S. states, territories and political subdivisions* | — | 88,093,996 | — | 88,093,996 | |||||||||||
| Corporate debt securities* | — | 13,840,081 | — | 13,840,081 | |||||||||||
| Total | $ | 47,738,099 | $ | 101,934,077 | $ | — | $ | 149,672,176 | |||||||
*Denotes fair market value obtained from pricing services.
58
The following table presents, by level, estimated fair values of equity investments and other financial instruments as of December 31, 2023 and 2022:
| As of December 31, 2023 (in thousands) | Level 1 | Level 2 | Level 3 | Total | |||||||||||||||||||
| Financial assets: | |||||||||||||||||||||||
| Cash | $ | 24,031 | $ | — | $ | — | $ | 24,031 | |||||||||||||||
| Accrued interest and dividends | 978 | — | — | 978 | |||||||||||||||||||
| Equity securities, at fair value: | |||||||||||||||||||||||
| Common stocks | 37,212 | — | — | 37,212 | |||||||||||||||||||
| Short-term investments: | |||||||||||||||||||||||
| Money market funds and U.S. Treasury bills | 110,224 | — | — | 110,224 | |||||||||||||||||||
| Total | $ | 172,445 | $ | — | $ | — | $ | 172,445 | |||||||||||||||
| As of December 31, 2022 (in thousands) | Level 1 | Level 2 | Level 3 | Total | |||||||||||||||||||
| Financial assets: | |||||||||||||||||||||||
| Cash | $ | 35,311 | $ | — | $ | — | $ | 35,311 | |||||||||||||||
| Accrued interest and dividends | 872 | — | — | 872 | |||||||||||||||||||
| Equity securities, at fair value: | |||||||||||||||||||||||
| Common stocks | 51,691 | — | — | 51,691 | |||||||||||||||||||
| Short-term investments: | |||||||||||||||||||||||
| Money market funds and U.S. Treasury bills | 103,649 | — | — | 103,649 | |||||||||||||||||||
| Total | $ | 191,523 | $ | — | $ | — | $ | 191,523 | |||||||||||||||
The Company did not hold any Level 3 category debt or marketable equity investment securities as of December 31, 2023 or 2022.
There were no transfers into or out of Levels 1, and 2 or 3 during the period.periods presented.
To help ensure that estimated fair value determinations are consistent with ASC 820,GAAP, prices from our pricing services go through multiple review processes to ensure appropriate pricing. Pricing procedures and inputs used to price each security include, but are not limited to, the following: unadjusted quoted market prices for identical securities such as stock market closing prices; non-binding quoted prices for identical securities in markets that are not active; interest rates; yield curves observable at commonly quoted intervals; volatility; prepayment speeds; loss severity; credit risksrisks; and default rates. The Company reviews the procedures and inputs used by its pricing services, and verifies a sample of the services’ quotes by comparing them to values obtained from other pricing resources. In the event the Company disagrees with a price provided by its pricing services, the respective service reevaluates the price to corroborate the market information and then reviews inputs to the evaluation in light of potentially new market data. The Company believes that these processes and inputs result in appropriate classifications and estimated fair values consistent with ASC 820.
59
Certain equity investments under the measurement of thealternative and notes receivable are measured at estimated fair value of certain financial instruments, other valuation techniques were utilized if quoted market prices were not available. These derived fair value estimateson a non-recurring basis and are significantly affected by the assumptions used. Additionally, ASC 820 excludes from its scope certain financial instruments including those relatedreviewed for impairment quarterly. If any such investment is determined to insurance contracts, pensionbe impaired, an impairment charge is recorded against such investment and other postretirement benefits, and equity method investments.
Statements of Operations. There were no impairments of such investments made during the twelve-month periods ended December 31, 2023 or 2022. The carrying amount for accrued interest and dividends is a reasonable estimate offollowing table presents assets measured at fair value due to the short-term maturity of these assets.
| As of December 31, 2023 (in thousands) | Level 1 | Level 2 | Level 3 | Total | |||||||||||||||||||
| Financial assets: | |||||||||||||||||||||||
| Equity investments in unconsolidated affiliates, measurement alternative | $ | — | $ | — | $ | 9,300 | $ | 9,300 | |||||||||||||||
| Notes receivable | — | — | 2,201 | 2,201 | |||||||||||||||||||
| Total | $ | — | $ | — | $ | 11,501 | $ | 11,501 | |||||||||||||||
| As of December 31, 2017 | |||||||||||||||||||
| Financial Assets | Carrying Value | Estimated Fair Value | Level 1 | Level 2 | Level 3 | ||||||||||||||
| Cash and cash equivalents | $ | 20,214,468 | $ | 20,214,468 | $ | 20,214,468 | $ | — | $ | — | |||||||||
| Cost-basis investments | 5,438,745 | 5,710,184 | — | — | 5,710,184 | ||||||||||||||
| Accrued interest and dividends | 1,099,879 | 1,099,879 | 1,099,879 | — | — | ||||||||||||||
| Total | $ | 26,753,092 | $ | 27,024,531 | $ | 21,314,347 | $ | — | $ | 5,710,184 | |||||||||
| As of December 31, 2022 (in thousands) | Level 1 | Level 2 | Level 3 | Total | |||||||||||||||||||
| Financials assets: | |||||||||||||||||||||||
| Equity investments in unconsolidated affiliates, measurement alternative | $ | — | $ | — | $ | 8,915 | $ | 8,915 | |||||||||||||||
| Notes receivable | — | — | 1,921 | 1,921 | |||||||||||||||||||
| Total | $ | — | $ | — | $ | 10,836 | $ | 10,836 | |||||||||||||||
| As of December 31, 2016 | |||||||||||||||||||
| Financial Assets | Carrying Value | Estimated Fair Value | Level 1 | Level 2 | Level 3 | ||||||||||||||
| Cash and cash equivalents | $ | 27,928,472 | $ | 27,928,472 | $ | 27,928,472 | $ | — | $ | — | |||||||||
| Cost-basis investments | 4,244,402 | 4,497,665 | — | — | 4,497,665 | ||||||||||||||
| Accrued interest and dividends | 1,035,152 | 1,035,152 | 1,035,152 | — | — | ||||||||||||||
| Total | $ | 33,208,026 | $ | 33,461,289 | $ | 28,963,624 | $ | — | $ | 4,497,665 | |||||||||
4. Property and Equipment
Property and equipment and estimated useful lives at December 31 are summarized as follows:
| 2017 | 2016 | ||||||||||||||||||||
| (in thousands) | (in thousands) | 2023 | 2022 | ||||||||||||||||||
| Land | $ | 1,122,582 | $ | 1,122,582 | |||||||||||||||||
| Office buildings and improvements (25 years) | 4,406,117 | 4,399,448 | |||||||||||||||||||
| Furniture, fixtures and equipment (3 to 10 years) | 12,993,387 | 10,444,355 | |||||||||||||||||||
| Automobiles (3 years) | 891,001 | 971,235 | |||||||||||||||||||
| Total | 19,413,087 | 16,937,620 | |||||||||||||||||||
| Less accumulated depreciation | (9,240,183 | ) | (8,184,154 | ) | |||||||||||||||||
| Property and equipment, net | $ | 10,172,904 | $ | 8,753,466 | |||||||||||||||||
Included within furniture, fixtures and equipment is software developed by the Company for internal use. Capitalized costs include both direct and indirect costs, such as payroll costs of employees associated with developing software, incurred during the software development stage.
5. Reinsurance
The Company assumes and cedes reinsurance with other insurance companies in the normal course of business. PremiumsThere were no premiums assumed for 2023 and ceded2022. Ceded premiums were approximately $3,000$354 thousand and $264,000, respectively,$818 thousand for 2017, $17,0002023 and $141,000, respectively, for 2016 and $34,000 and $215,000, respectively, for 2015.2022, respectively. Ceded reinsurance is comprised of excess of loss treaties, which outline the conditions in which the reinsurance company will pay claims and protect against losses over certain agreed upon amounts. The Company remains liable to the insured for claims under ceded insurance policies in the event that the assuming insurance companies are unable to meet their obligations under these contracts. The Company hasdid not paidpay or recoveredrecover any reinsured losses during the three years ended December 31, 2017.2023 and 2022.
60
6. Reserve for Claims
Changes in the reserve for claims for the years ended December 31 are summarized as follows based on the year in which the policies were written:
| (in thousands) | 2023 | 2022 | |||||||||
| Balance, beginning of period | $ | 37,192 | $ | 36,754 | |||||||
| Provision related to: | |||||||||||
| Current year | 7,547 | 9,817 | |||||||||
| Prior years | (2,785) | (5,562) | |||||||||
| Total provision charged to operations | 4,762 | 4,255 | |||||||||
| Claims paid, net of recoveries, related to: | |||||||||||
| Current year | (428) | (333) | |||||||||
| Prior years | (4,379) | (3,484) | |||||||||
| Total claims paid, net of recoveries | (4,807) | (3,817) | |||||||||
| Balance, end of year | $ | 37,147 | $ | 37,192 | |||||||
| 2017 | 2016 | 2015 | |||||||||
| Balance, beginning of period | $ | 35,305,000 | $ | 37,788,000 | $ | 36,677,000 | |||||
| Provision (benefit) related to: | |||||||||||
| Current year | 7,431,586 | 6,673,036 | 7,295,013 | ||||||||
| Prior years | (4,120,506 | ) | (6,430,083 | ) | (2,816,519 | ) | |||||
| Total provision charged to operations | 3,311,080 | 242,953 | 4,478,494 | ||||||||
| Claims paid, net of recoveries, related to: | |||||||||||
| Current year | (74,885 | ) | (102,501 | ) | (97,116 | ) | |||||
| Prior years | (3,740,195 | ) | (2,623,452 | ) | (3,270,378 | ) | |||||
| Total claims paid, net of recoveries | (3,815,080 | ) | (2,725,953 | ) | (3,367,494 | ) | |||||
| Balance, end of year | $ | 34,801,000 | $ | 35,305,000 | $ | 37,788,000 | |||||
The Company continually refines its reserve estimates as current loss experience develops and more credible data emerges. Movements in the reserve related to prior periods were primarily the result of changes to estimates to better reflect the latest reported loss data. The 2017 increase in the provision for claims in 2023, compared with 2016to 2022, is primarily related to higher levels ofless favorable loss development in 2016. The 2016 calendar year changeand higher incurred claims in the provision relating to prior years resulted mostly from changes to certain actuarial inputs and favorable development in 2016 versus the prior year related primarily to policy years 2009 through 2015.current period. Due to variances between actual and expected loss payments, loss development is subject to significant variability.
The Company does not recognize claim recoveries until an actual payment has been received by the Company. The Company realized claim recoveries of approximately $570,000, $1,040,000$597 thousand and $467,000$1.0 million during 2017, 20162023 and 2015,2022, respectively.
The provision for claims as a percentage of net premiums written was 2.4%, 0.2%2.8% and 4.0%1.7% in 2017, 20162023 and 2015,2022, respectively.
A large claim is defined as a claim with incurred losses exceeding $250,000.$500 thousand. Due to the small volume of large claims, the long-tail nature of title insurance claims and the inherent uncertainty in loss emergence patterns, large claim activity can vary significantly between policy years. The estimated development of large claims by policy year is therefore subject to significant changes as experience develops.
A summary of the Company’s loss reserve for claims, broken down into its components of known title claims and IBNR, follows:
| (in thousands, except percentages) | 2023 | % | 2022 | % | |||||||||||||||||||
| Known title claims | $ | 2,855 | 7.7 | $ | 3,250 | 8.7 | |||||||||||||||||
| IBNR | 34,292 | 92.3 | 33,942 | 91.3 | |||||||||||||||||||
| Total reserve for claims | $ | 37,147 | 100.0 | $ | 37,192 | 100.0 | |||||||||||||||||
| 2017 | % | 2016 | % | ||||||||
| Known title claims | $ | 4,646,422 | 13.4 | $ | 4,405,343 | 12.5 | |||||
| IBNR | 30,154,578 | 86.6 | 30,899,657 | 87.5 | |||||||
| Total loss reserve | $ | 34,801,000 | 100.0 | $ | 35,305,000 | 100.0 | |||||
In management’s opinion, the reserve for claims is adequate to cover claimclaims losses which might result from pending and future claims.
7. Earnings Per Common Share and Share Awards
Basic earnings per common share is computed by dividing net income attributable to the Company by the weighted average number of common shares outstanding during the reporting period. Diluted earnings per common share is computed by dividing net income attributable to the Company by the combination of dilutive potential common stock, comprised of shares issuable under the Company’s share-based compensation plans, and the weighted average number of common shares outstanding during the reporting period. Dilutive common share equivalents include the dilutive effect of in-the-money share-based awards, which are calculated based on the average share price for each period using the treasury stock method. Under the treasury stock method, when share-based awards are assumed to be exercised, (a) the exercise price of a share-based award;award and (b) the amount of compensation cost, if any, for future services that the Company has not yet recognized.recognized, are assumed to be used to repurchase shares in the current period.
The following table sets forth the computation of basic and diluted earnings per share for the years ended December 31:
| (in thousands, except per share amounts) | 2023 | 2022 | |||||||||
| Net Income | $ | 21,686 | $ | 23,903 | |||||||
| Weighted average common shares outstanding – Basic | 1,893 | 1,897 | |||||||||
| Incremental shares outstanding assuming the exercise of dilutive SARs (share-settled) | — | 1 | |||||||||
| Weighted average common shares outstanding – Diluted | 1,893 | 1,898 | |||||||||
| Basic earnings per common share | $ | 11.45 | $ | 12.60 | |||||||
| Diluted earnings per common share | $ | 11.45 | $ | 12.59 | |||||||
| For the Years Ended December 31, | 2017 | 2016 | 2015 | ||||||||
| Net income attributable to the Company | $ | 25,706,502 | $ | 19,523,118 | $ | 12,533,905 | |||||
| Weighted average common shares outstanding – Basic | 1,886,354 | 1,907,675 | 1,984,360 | ||||||||
| Incremental shares outstanding assuming the exercise of dilutive stock options and SARs (share-settled) | 9,517 | 7,382 | 5,439 | ||||||||
| Weighted average common shares outstanding – Diluted | 1,895,871 | 1,915,057 | 1,989,799 | ||||||||
| Basic earnings per common share | $ | 13.63 | $ | 10.23 | $ | 6.32 | |||||
| Diluted earnings per common share | $ | 13.56 | $ | 10.19 | $ | 6.30 | |||||
There were 4,50024 thousand and 18 thousand potential shares excluded from the computation of diluted earnings per share in 2017. There were no potential shares excluded from2023 and 2022, respectively, due to the computationout-of-the-money status of diluted earnings per share in 2016 and 2015.the related share-based awards rendering them anti-dilutive.
The Company historically has adopted employee stock award plans under which restricted stock, and options or stock appreciation rights ("SARs") ofexercisable for the Company's stock may be granted to key employees or directors of the Company at a price not less than the market value on the dateCompany. As of grant. There is currentlyDecember 31, 2023 there was one active plan from which the Company may grant share-based awards.awards and one legacy plan under which equity awards remain outstanding. The awards eligible to be granted under the active plan are limited to SARs, and the maximum aggregate number of shares of common stock of the Company available pursuant to the plan for the grant of SARs is 250,000250 thousand shares.
Number Of Shares | Weighted Average Exercise Price | Average Remaining Contractual Term (Years) | Aggregate Intrinsic Value | |||||||||
| Outstanding as of January 1, 2015 | 21,000 | $ | 51.30 | 3.64 | $ | 453,510 | ||||||
| SARs granted | 4,500 | 73.00 | ||||||||||
| SARs exercised | (2,000 | ) | 47.88 | |||||||||
| Options exercised | (1,500 | ) | 36.79 | |||||||||
| Outstanding as of December 31, 2015 | 22,000 | $ | 57.04 | 3.93 | $ | 945,055 | ||||||
| SARs granted | 4,500 | 93.87 | ||||||||||
| SARs exercised | (2,000 | ) | 32.00 | |||||||||
| Outstanding as of December 31, 2016 | 24,500 | $ | 65.85 | 3.85 | $ | 836,640 | ||||||
| SARs granted | 4,500 | 192.71 | ||||||||||
| SARs exercised | (4,000 | ) | 36.38 | |||||||||
| Outstanding as of December 31, 2017 | 25,000 | $ | 93.40 | 3.98 | $ | 2,623,720 | ||||||
| Exercisable as of December 31, 2017 | 23,875 | $ | 88.72 | 3.87 | $ | 2,617,375 | ||||||
| Unvested as of December 31, 2017 | 1,125 | $ | 192.71 | 6.38 | $ | 6,345 | ||||||
During both 2023 and the quoted price of the Company’s common stock at December 31, 2017. The intrinsic values of SARs exercised during 2017, 2016 and 2015 were approximately $473,000, $117,000 and $104,000, respectively.
| SARs Outstanding at Year-End | SARs Exercisable at Year-End | |||||||||||||||||||||||
| Range of Exercise Prices | Number Outstanding | Weighted Average Remaining Contractual Life | Weighted Average Exercise Price | Number Exercisable | Weighted Average Exercise Price | |||||||||||||||||||
| $ | 40.00 | — | $ | 49.99 | 1,000 | 0.38 | $ | 41.50 | 1,000 | $ | 41.50 | |||||||||||||
| 50.00 | — | 59.99 | 3,000 | 1.37 | 50.50 | 3,000 | 50.50 | |||||||||||||||||
| 60.00 | — | 69.99 | 4,500 | 3.39 | 68.70 | 4,500 | 68.70 | |||||||||||||||||
| 70.00 | — | 79.99 | 7,500 | 3.58 | 72.44 | 7,500 | 72.44 | |||||||||||||||||
| 90.00 | — | 99.99 | 4,500 | 5.38 | 93.87 | 4,500 | 93.87 | |||||||||||||||||
| 190.00 | — | 199.99 | 4,500 | 6.38 | 192.71 | 3,375 | 192.71 | |||||||||||||||||
| $ | 40.00 | — | $ | 199.99 | 25,000 | 3.98 | $ | 93.40 | 23,875 | $ | 88.72 | |||||||||||||
| (in thousands, except weighted average exercise price and average remaining contractual term) | Number Of Shares | Weighted Average Exercise Price | Average Remaining Contractual Term (Years) | Aggregate Intrinsic Value | |||||||||||||||||||
| Outstanding as of January 1, 2022 | 35 | $ | 150.36 | 3.96 | $ | 1,643 | |||||||||||||||||
| SARs granted | 10 | 155.16 | |||||||||||||||||||||
| SARs exercised | (6) | 94.44 | |||||||||||||||||||||
| Outstanding as of December 31, 2022 | 39 | $ | 159.39 | 4.10 | $ | 243 | |||||||||||||||||
| SARs granted | 5 | 142.88 | |||||||||||||||||||||
| SARs exercised | (2) | 93.87 | |||||||||||||||||||||
| Outstanding as of December 31, 2023 | 42 | $ | 160.83 | 3.69 | $ | 428 | |||||||||||||||||
| Exercisable as of December 31, 2023 | 34 | $ | 165.33 | 3.38 | $ | 265 | |||||||||||||||||
| Unvested as of December 31, 2023 | 8 | $ | 142.58 | 4.93 | $ | 163 | |||||||||||||||||
62
The aggregate intrinsic value is calculated as the difference between the exercise price of the underlying awards and the quoted price of the Company’s common stock at December 31. The intrinsic values of SARs exercised during 2023 and 2022 were approximately $156 thousand and $496 thousand, respectively.
There were no options outstanding at December 31, 2023. The following table summarizes information about SARs outstanding at December 31, 2023:
| (in thousands, except exercise prices and average remaining contractual term) | SARs Outstanding at Year-End | SARs Exercisable at Year-End | ||||||||||||||||||||||||||||||||||||||||||
| Range of Exercise Prices | Number Outstanding | Weighted Average Remaining Contractual Life | Weighted Average Exercise Price | Number Exercisable | Weighted Average Exercise Price | |||||||||||||||||||||||||||||||||||||||
| $ | 60.00 | — | $ | 99.99 | — | 0.00 | $ | — | — | $ | — | |||||||||||||||||||||||||||||||||
| 100.00 | — | 149.99 | 18 | 4.79 | 139.11 | 10 | 136.27 | |||||||||||||||||||||||||||||||||||||
| 150.00 | — | 199.99 | 24 | 2.82 | 177.84 | 24 | 177.84 | |||||||||||||||||||||||||||||||||||||
| $ | 60.00 | — | $ | 199.99 | 42 | 3.69 | $ | 160.83 | 34 | $ | 165.33 | |||||||||||||||||||||||||||||||||
In 2023, 8 thousand SARs vested with a fair value of approximately $425 thousand.
The fair value of each awardSAR is estimated on the date of grant using the Black-Scholes option valuation model with the weighted average assumptions noted in the table shown below. Expected volatilities are based on both the implied and historical volatility of the Company’s stock. The Company uses historical data to project SAR exercises and pre-exercise forfeitures within the valuation model. The expected term of awards represents the period of time that SARs granted are expected to be outstanding. The interest rate assumed for the expected life of the award is based on the U.S. Treasury yield curve in effect at the time of the grant. The weighted average fair values for the SARs issued during 2017, 20162023 and 20152022 were $55.40, $28.75$55.52 and $31.16,$62.60, respectively, and were estimated using the weighted average assumptions shown in the table below.below:
| 2023 | 2022 | ||||||||||||||||||||||
| Expected life in years | 6.2 | - | 7.0 | 7.0 | |||||||||||||||||||
| Volatility | 36.6% | 35.6% | |||||||||||||||||||||
| Interest rate | 3.7% | 3.2% | |||||||||||||||||||||
| Yield rate | 1.2% | 0.6% | |||||||||||||||||||||
| 2017 | 2016 | 2015 | |||
| Expected Life in Years | 7.0 | 7.0 | 7.0 | ||
| Volatility | 26.2% | 28.9% | 40.7% | ||
| Interest Rate | 2.0% | 1.7% | 2.0% | ||
| Yield Rate | 0.8% | 0.7% | 0.4% | ||
There was approximately $219,000, $132,000$425 thousand and $138,000$362 thousand of compensation expense relating to SARs or options vesting on or before December 31, 2017, 20162023 and 2015,2022, respectively, included in salaries, employee benefits and payroll taxespersonnel expenses in the Consolidated Statements of Income.Operations. As of December 31, 2017,2023, there was approximately $62,000$407 thousand of total unrecognized compensation cost related to unvested share-based compensation arrangements granted under the Company’s stock award plans. That cost is expected to be recognized over a weighted average period of approximately 3 months.one year.
| For the Years Ended December 31, | 2017 | 2016 | 2015 | ||||||||
| Exercise price equal to market price on date of grant: | |||||||||||
| Weighted average market price | $ | 192.71 | $ | 93.87 | $ | 73.00 | |||||
| Weighted average grant-date fair value | $ | 55.40 | $ | 28.75 | $ | 31.16 | |||||
8. Income Taxes
The components of income tax expense for the years ended December 31 are summarized as follows:
| (in thousands) | 2023 | 2022 | |||||||||
| Current: | |||||||||||
| Federal | $ | 8,389 | $ | 10,685 | |||||||
| State | 389 | 164 | |||||||||
| Total current | 8,778 | 10,849 | |||||||||
| Deferred: | |||||||||||
| Federal | (4,150) | (4,510) | |||||||||
| State | (84) | (134) | |||||||||
| Total deferred | (4,234) | (4,644) | |||||||||
| Total | $ | 4,544 | $ | 6,205 | |||||||
63
| For the Years Ended December 31, | 2017 | 2016 | 2015 | ||||||||
| Current: | |||||||||||
| Federal | $ | 9,163,000 | $ | 5,745,000 | $ | 4,179,000 | |||||
| State | 71,000 | 81,000 | 34,000 | ||||||||
| Total current | 9,234,000 | 5,826,000 | 4,213,000 | ||||||||
| Deferred: | |||||||||||
| Federal | (4,649,054 | ) | 2,755,777 | 976,624 | |||||||
| State | (14,946 | ) | 34,223 | 38,376 | |||||||
| Total deferred | (4,664,000 | ) | 2,790,000 | 1,015,000 | |||||||
| Total | $ | 4,570,000 | $ | 8,616,000 | $ | 5,228,000 | |||||
For state income tax purposes, ITIC and NITIC generally pay only a gross premium tax found in premium and retaliatory taxesother expenses in the Consolidated Statements of Income.Operations.
At December 31, the approximate tax effect of each component of deferred income tax assets and liabilities is summarized as follows:
| (in thousands) | 2023 | 2022 | |||||||||
| Deferred income tax assets: | |||||||||||
| Accrued benefits and retirement services | $ | 3,990 | $ | 3,860 | |||||||
| Net operating loss carryforward | 246 | 202 | |||||||||
| Impairment of assets | 186 | 185 | |||||||||
| Reinsurance and commission payable | 62 | 28 | |||||||||
| Allowance for doubtful accounts | 29 | 59 | |||||||||
| Lease assets | 1,354 | 1,280 | |||||||||
| Other | 563 | 519 | |||||||||
| Total | 6,430 | 6,133 | |||||||||
| Deferred income tax liabilities: | |||||||||||
| Net unrealized gain on investments | 3,157 | 5,615 | |||||||||
| Recorded statutory premium reserve, net of reserves for claims | 2,223 | 2,497 | |||||||||
| Intangible assets | 797 | 885 | |||||||||
| Excess of tax over book depreciation | 657 | 1,551 | |||||||||
| Lease liabilities | 1,324 | 1,252 | |||||||||
| 1031 gain | 935 | 912 | |||||||||
| Other | 883 | 1,086 | |||||||||
| Total | 9,976 | 13,798 | |||||||||
| Net deferred income tax liabilities | $ | (3,546) | $ | (7,665) | |||||||
| For the Years Ended December 31, | 2017 | 2016 | |||||
| Deferred income tax assets: | |||||||
| Accrued benefits and retirement services | $ | 2,448,598 | $ | 3,625,943 | |||
| Other-than-temporary impairment of assets | 265,178 | 429,167 | |||||
| Allowance for doubtful accounts | 102,015 | 122,477 | |||||
| Net operating loss carryforward | 33,000 | 15,000 | |||||
| Postretirement benefit obligation | 18,318 | 56,259 | |||||
| Other | 878,195 | 418,335 | |||||
| Total | 3,745,304 | 4,667,181 | |||||
| Deferred income tax liabilities: | |||||||
| Net unrealized gain on investments | 5,193,029 | 6,207,324 | |||||
| Recorded reserve for claims, net of statutory premium reserves | 4,126,388 | 4,985,984 | |||||
| Intangible assets | 1,337,909 | 2,525,511 | |||||
| Excess of tax over book depreciation | 1,042,205 | 1,303,710 | |||||
| Other | 671,532 | 762,908 | |||||
| Total | 12,371,063 | 15,785,437 | |||||
| Net deferred income tax liabilities | $ | (8,625,759 | ) | $ | (11,118,256 | ) | |
At December 31, 20172023 and 2016,2022, there were no valuation allowance wasallowances recorded. Based upon the Company’s historical results of operations, the existing financial condition of the Company and management’s assessment of all other available information, management believes that it is more likely than not that the benefit of these deferred income tax assets will be realized.
A reconciliation of income tax as computed for the years ended December 31 at the U.S. federal statutory income tax rate of 35%21.0% for 2017, 34.6% for 2016the years ended December 31, 2023 and 34.4% for 2015, respectively,2022, to income tax expense, is as follows:
| (in thousands) | 2023 | 2022 | |||||||||
| Anticipated income tax expense | $ | 5,508 | $ | 6,323 | |||||||
| Increase (decrease) related to: | |||||||||||
| State income taxes, net of federal income tax benefit | 307 | 130 | |||||||||
| Tax-exempt interest income, net of amortization | (525) | (577) | |||||||||
| Other, net | (746) | 329 | |||||||||
| Provision for income taxes | $ | 4,544 | $ | 6,205 | |||||||
| For the Years Ended December 31, | 2017 | 2016 | 2015 | ||||||||
| Anticipated income tax expense | $ | 10,594,700 | $ | 9,733,482 | $ | 6,115,306 | |||||
| Increase (decrease) related to: | |||||||||||
| State income taxes, net of federal income tax benefit | 46,150 | 52,974 | 22,304 | ||||||||
| Tax-exempt interest income (net of amortization) | (1,298,251 | ) | (1,074,504 | ) | (981,712 | ) | |||||
| Tax Cuts and Jobs Act | (5,341,521 | ) | — | — | |||||||
| Other, net | 568,922 | (95,952 | ) | 72,102 | |||||||
| Provision for income taxes | $ | 4,570,000 | $ | 8,616,000 | $ | 5,228,000 | |||||
In accounting for uncertainty in income taxes, the Company is required to recognize in its financial statementsConsolidated Financial Statements the impact of a tax position if that position is more likely than not of being sustained on an audit, based on the technical merits of the position. In this regard, an uncertain tax position represents the Company’s expected treatment of a tax position taken in a filed tax return, or planned to be taken in a future tax return, that has not been reflected in measuring income tax expense for financial reporting purposes. There were no unrecognized tax benefits or liabilities as of December 31, 2017.2023.
The amount of unrecognized tax benefit or liability may increase or decrease in the future for various reasons, including adding amounts for current tax year positions, expiration of open income tax returns due to the expiration of the applicable statute of limitations, changes in management’s judgment about the level of uncertainty, status of examinations, litigation and legislative activity and the additions or eliminations of uncertain tax positions.
64
The Company’s policy is to report interest and penalties related to income taxes in the other expenses line item in the Consolidated Statements of Income.Operations.
The Company or one of its subsidiaries, files income tax returns in the U.S. federal jurisdiction and various states. With few exceptions, the Company is no longer subject to U.S. federal or state and local examinations by taxing authorities for years before 2014.2019.
9. Leases
The Company enters into lease agreements that are primarily for office space. These leases certainare accounted for as operating leases, with lease expense recognized on a straight-line basis over the term of the lease. The Company occasionally assumes equipment lease agreements through business acquisitions. These leases are accounted for as finance leases.
Included in a portion of the Company's current leases is an option to extend or cancel the lease term. The exercise of such an option is solely at the Company's discretion. The lease liability recorded in the Consolidated Balance Sheets includes lease payments related to options to extend or cancel the lease term if the Company determined at the inception date that the lease was expected to be renewed or extended. The Company, in determining the present value of lease payments, utilized the average rate over a 10-year term based upon the Moody's seasoned Aaa corporate bond yields, as explicit rates of interest were not readily determinable in the lease contracts. The Company does not carry debt; thus no incremental borrowing rate is available to the Company.
Lease expense is included in office facilities and equipment under operating leases. Rental expense also includes occasional rentaltechnology expenses in the Consolidated Statements of automobiles. Rent expense totaled approximately $1,232,000, $896,000, and $793,000Operations. Information regarding the Company’s leases for the years ended December 31 is as follows:
| (in thousands) | 2023 | 2022 | |||||||||
| Operating leases | $ | 2,591 | $ | 2,518 | |||||||
| Finance leases: | |||||||||||
| Amortization of lease assets | 237 | 168 | |||||||||
| Interest on lease liabilities | 22 | 24 | |||||||||
| Short-term leases (a) | 141 | 214 | |||||||||
| Lease expense | $ | 2,991 | $ | 2,924 | |||||||
| Sub-lease income | (14) | — | |||||||||
| Lease cost | $ | 2,977 | $ | 2,924 | |||||||
| (a) | Leases with an initial term of twelve months or less are not recorded on the Consolidated Balance Sheets. | |||||||
Components of the lease liability presented in 2017, 2016 and 2015, respectively. the Consolidated Balance Sheets for the years ended December 31 are as follows:
| (in thousands) | 2023 | 2022 | |||||||||
| Current: | |||||||||||
| Operating lease liabilities | $ | 2,201 | $ | 1,693 | |||||||
| Finance lease liabilities | 170 | 218 | |||||||||
| Non-current: | |||||||||||
| Operating lease liabilities | 3,792 | 4,401 | |||||||||
| Finance lease liabilities | 286 | 527 | |||||||||
| Total lease liabilities | $ | 6,449 | $ | 6,839 | |||||||
65
The future minimum lease payments under operatingfor leases that have initial or remaining noncancelable lease terms in excess of one year as of December 31, 2017,2023, are summarized as follows:
| Year Ended (in thousands) | Operating Leases | Finance Leases | Total | ||||||||
| 2024 | $ | 2,385 | $ | 183 | $ | 2,568 | |||||
| 2025 | 2,045 | 147 | 2,192 | ||||||||
| 2026 | 1,265 | 109 | 1,374 | ||||||||
| 2027 | 366 | 41 | 407 | ||||||||
| 2028 | 135 | — | 135 | ||||||||
| Thereafter | 151 | — | 151 | ||||||||
| Total undiscounted payments | $ | 6,347 | $ | 480 | $ | 6,827 | |||||
| Less: present value adjustment | (354) | (24) | (378) | ||||||||
| Lease liabilities | $ | 5,993 | $ | 456 | $ | 6,449 | |||||
| Year Ended: | |||
| 2018 | $ | 1,190,734 | |
| 2019 | 1,018,685 | ||
| 2020 | 861,763 | ||
| 2021 | 766,584 | ||
| 2022 | 588,720 | ||
| Thereafter | 340,462 | ||
| Total | $ | 4,766,948 | |
Supplemental lease information for the years ended December 31 is as follows:
| 2023 | 2022 | ||||||||||
| Weighted average remaining lease term (years) | |||||||||||
| Operating leases | 3.07 | 3.43 | |||||||||
| Finance leases | 2.93 | 3.80 | |||||||||
| Weighted average discount rate | |||||||||||
| Operating leases | 3.8 | % | 3.9 | % | |||||||
| Finance leases | 3.7 | % | 3.7 | % | |||||||
The Company does not have any material pending operating or financing lease agreements that become effective in future periods.
10. Retirement Agreements and Other Postretirement Benefit Plan
The Company has a 401(k) savings plan. In order to participate in the plan, individualsemployees must have worked at the Company for at least 3 months.be 21 years old. In order to be eligible for employer contributions, individuals must be employed for a period of one full year and work at least 1,000 hours annually. The Company makes a 3% Safe Harbor contribution and also has the option annually to make a discretionary profit share contribution. Individuals may elect to make contributions up to the maximum deductible amount as determined by the Internal Revenue Code.Code of 1986, as amended (the “IRC”). Expenses related to the 401(k) plan were approximately $1,577,000, $810,000$1.6 million and $741,000$1.7 million for 2017, 20162023 and 2015,2022, respectively.
In November 2003, ITIC, a wholly owned subsidiary of the Company, entered into employment agreements with the Chief Executive Officer, Chief Financial Officer and Chief Operating Officer of ITIC. These individuals also serve as the Chairman, President and Executive Vice President, respectively, of the Company. The agreements provide compensation and life, health, dental and vision benefits upon the occurrence of specific events, including death, disability, retirement, termination without cause or upon a change in control. The employment agreements also prohibit each of these executives from competing with ITIC and its parent, subsidiaries and affiliates in North Carolina while employed by ITIC and for a period of two years following termination of their employment.
In addition, during the second quarter of 2004, ITIC entered into nonqualified deferred compensation plan agreements with these executives. The amountamounts accrued for all agreements at December 31, 20172023 and 2016 was2022 were approximately $9,492,000$15.2 million and $8,487,000,$15.0 million, respectively, which includes postretirement compensation and health benefits, and was calculated based on the terms of the contract. Both the 20172023 and 20162022 accruals are included in the accounts payable and accrued liabilities line item of the Consolidated Balance Sheets. These executive contracts are accounted for on an individual contract basis. On December 24, 2008, the executive contracts were amended effective January 1, 2009 to bring them into compliance with Section 409A of the Internal Revenue Code,IRC, and were amended and restated to provide for an annual cash payment to the officers equal to the amounts the Company would have contributed to their accounts under its 401(k) plan if such contributions were not limited by the federal tax laws, less the amount of any contributions that the Company actually makes to their accounts under the Company’s 401(k) plan.
66
On November 17, 2003, ITIC entered into employment agreements with key executives that provide for the continuation of certain employee benefits upon retirement.retirement, which were most recently amended and restated on May 4, 2022. The executive employee benefits include health insurance, dental insurance, vision insurance and life insurance. The benefits are unfunded. Estimated future benefit payouts expected to be paid for each of the next five years are $11,789$24 thousand in 2018, $13,3432024, $36 thousand in 2019, $14,9132025, $44 thousand in 2020, $16,5012026, $58 thousand in 2021, $24,2502027, $83 thousand in 20222028 and $174,283$297 thousand in the next five years thereafter.
Cost of the Company’s postretirement benefits included the following components and is presented in the salaries, employee benefits and payroll taxespersonnel expenses line of its Consolidated Statements of Income:Operations:
| (in thousands) | 2023 | 2022 | |||||||||
| Net periodic benefit cost | |||||||||||
| Service cost – benefits earned during the year | $ | — | $ | — | |||||||
| Interest cost on the projected benefit obligation | 65 | 26 | |||||||||
| Amortization of unrecognized prior service cost | — | — | |||||||||
| Amortization of unrecognized (gain) loss | (37) | 12 | |||||||||
| Net periodic benefits cost at end of year | $ | 28 | $ | 38 | |||||||
| 2017 | 2016 | 2015 | |||||||||
| Net periodic benefit cost | |||||||||||
| Service cost – benefits earned during the year | $ | — | $ | 10,180 | $ | 16,748 | |||||
| Interest cost on the projected benefit obligation | 36,869 | 35,123 | 30,772 | ||||||||
| Amortization of unrecognized prior service cost | — | — | 4,390 | ||||||||
| Amortization of unrecognized loss | 8,612 | 8,941 | 3,514 | ||||||||
| Net periodic benefits cost at end of year | $ | 45,481 | $ | 54,244 | $ | 55,424 | |||||
The Company is required to recognize the funded status (i.e., the difference between the fair value of the assets and the accumulated postretirement benefit obligations of its postretirement benefits) in its Consolidated Balance Sheet,Sheets, with a corresponding adjustment to accumulated other comprehensive income, net of tax. The net amount in accumulated other comprehensive income is $(87,191), $(57,556)$68 thousand, $55 thousand net of tax, for December 31, 2017,2023, and $(165,437), $(109,200)$44 thousand, $36 thousand net of tax, for December 31, 2016,2022, and represents the net unrecognized actuarial lossesgains and unrecognized prior service costs. The effects of the funded status on the Company’s Consolidated Balance Sheets at December 31, 20172023 and 20162022 are presented in the following table:
| (in thousands) | 2023 | 2022 | |||||||||
| Funded status | |||||||||||
| Actuarial present value of future benefits: | |||||||||||
| Fully eligible active employees | $ | (906) | $ | (928) | |||||||
| Non-eligible active employees | — | — | |||||||||
| Plan assets | — | — | |||||||||
| Funded status of accumulated postretirement benefit obligation, recognized in accounts payable and accrued liabilities | $ | (906) | $ | (928) | |||||||
| 2017 | 2016 | ||||||
| Funded status | |||||||
| Actuarial present value of future benefits: | |||||||
| Fully eligible active employee | $ | (895,727 | ) | $ | (928,492 | ) | |
| Non-eligible active employees | — | — | |||||
| Plan assets | — | — | |||||
| Funded status of accumulated postretirement benefit obligation, recognized in other liabilities | $ | (895,727 | ) | $ | (928,492 | ) | |
Development of the accumulated postretirement benefit obligation for the years ended December 31, 20172023 and 20162022 includes the following:
| (in thousands) | 2023 | 2022 | |||||||||
| Accrued postretirement benefit obligation at beginning of year | $ | (928) | $ | (1,118) | |||||||
| Service cost – benefits earned during the year | — | — | |||||||||
| Interest cost on projected benefit obligation | (65) | (26) | |||||||||
| Actuarial gain | 87 | 216 | |||||||||
| Accrued postretirement benefit obligation at end of year | $ | (906) | $ | (928) | |||||||
| 2017 | 2016 | ||||||
| Accrued postretirement benefit obligation at beginning of year | $ | (928,492 | ) | $ | (882,623 | ) | |
| Service cost – benefits earned during the year | — | (10,180 | ) | ||||
| Interest cost on projected benefit obligation | (36,869 | ) | (35,123 | ) | |||
| Actuarial gain (loss) | 69,634 | (566 | ) | ||||
| Accrued postretirement benefit obligation at end of year | $ | (895,727 | ) | $ | (928,492 | ) | |
The changes in amounts related to accumulated other comprehensive income, pre-tax, are as follows:
| 2017 | 2016 | ||||||
| Balance at beginning of year | $ | 165,437 | $ | 173,812 | |||
| Components of accumulated other comprehensive income: | |||||||
| Unrecognized prior service cost | — | — | |||||
| Amortization of loss, net | (8,612 | ) | (8,941 | ) | |||
| Actuarial (gain) loss | (69,634 | ) | 566 | ||||
| Balance at end of year | $ | 87,191 | $ | 165,437 | |||
One Percentage Point Increase | One Percentage Point Decrease | ||||||
| Net periodic postretirement benefit cost | |||||||
| Effect on the service cost component | $ | — | $ | — | |||
| Effect on interest cost | 6,761 | (5,305 | ) | ||||
| Total effect on the net periodic postretirement benefit cost | $ | 6,761 | $ | (5,305 | ) | ||
Accumulated postretirement benefit obligation (including active employees who are not fully eligible) | |||||||
| Effect on those currently receiving benefits (retirees and spouses) | $ | — | $ | — | |||
| Effect on active fully eligible | 187,814 | (147,367 | ) | ||||
| Effect on actives not yet eligible | — | — | |||||
| Total effect on the accumulated postretirement benefit obligation | $ | 187,814 | $ | (147,367 | ) | ||
| (in thousands) | 2023 | 2022 | |||||||||
| Balance at beginning of year | $ | 44 | $ | (184) | |||||||
| Components of accumulated other comprehensive income: | |||||||||||
| Unrecognized prior service cost | — | — | |||||||||
| Amortization of gain (loss), net | (37) | 12 | |||||||||
| Actuarial gain | 61 | 216 | |||||||||
| Balance at end of year | $ | 68 | $ | 44 | |||||||
67
11. Commitments and Contingencies
Legal Proceedings. Proceedings: The Company and its subsidiaries are involved in legal proceedings that are incidental to their business. In the Company’s opinion, based on the present status of these proceedings, any potential liability of the Company or its subsidiaries with respect to these legal proceedings willis not expected to, in the aggregate, be material to the Company’s consolidated financial condition or operations.
Escrow and Trust Deposits.Deposits: As a service to its customers, the Company, through ITIC, administers escrow and trust deposits representing earnest money received under real estate contracts, escrowed funds received under escrow agreements, undisbursed amounts received for settlement of mortgage loans and indemnities against specific title risks. Cash heldadministered by the Company for these purposes was approximately $20,880,000$28.2 million and $18,032,000$24.2 million as of December 31, 20172023 and 2016,2022, respectively. These amounts are not considered assets of the Company and, therefore, are excluded from the accompanying Consolidated Balance Sheets. However,Sheets; however, the Company remains contingently liable for the disposition of these deposits.
Like-Kind Exchange Proceeds.Proceeds: In administering tax-deferred propertylike-kind exchanges pursuant to § 1031 of the IRC, the Company’s wholly owned subsidiary, Investors Title Exchange Corporation (“ITEC”),ITEC, serves as a qualified intermediary, for exchanges, holding the net sales proceeds from relinquished property to be used for purchase of replacement property. Another Company wholly owned subsidiary, Investors Title Accommodation Corporation (“ITAC”),ITAC, serves as exchange accommodation titleholder and, through limited liability companiesLLCs that are wholly owned subsidiaries of ITAC, holds property for exchangers in reverse exchange transactions. Like-kind exchange deposits and reverse exchange property totaled approximately $184,985,000$263.7 million and $202,184,000$432.0 million as of December 31, 20172023 and 2016,2022, respectively. These amounts are not considered assets of the Company and, therefore, are excluded from the accompanying Consolidated Balance Sheets; however, the Company remains contingently liable for the disposition of the transfers of property, disbursements of proceeds and the return on the proceeds at the agreed upon rate. Exchange services revenue includes earnings on these deposits; therefore, investment income is shown as other revenuerevenues rather than investment income. These like-kind exchange funds are primarily invested in money market funds and other short-term investments.
12. Segment Information
The Company has onetwo reportable segment,segments, title insurance and exchange services. The remaining immaterial segments have been combined into a group called “All Other.”
The title insurance segment primarily issues title insurance policies through approved attorneys from underwriting offices and through independent issuing agents. Title insurance policies insure titles to real estate.
The tax-deferred exchange services segment acts as an intermediary in tax-deferred exchanges of property held for productive use in a trade or business or for investments and serves as exchange accommodation titleholder, holding property for exchangers in reverse exchange transactions.
Provided below is selected financial information about the Company’s operations by segment for the periods ended December 31, 2017, 20162023 and 2015:2022:
| 2023 (in thousands) | Title Insurance | Exchange Services | All Other | Intersegment Eliminations | Total | ||||||||||||||||||||||||
| Insurance and other services revenues | $ | 207,140 | $ | 13,270 | $ | 7,800 | $ | (19,715) | $ | 208,495 | |||||||||||||||||||
| Net investment income | 12,303 | 196 | 3,756 | — | 16,255 | ||||||||||||||||||||||||
| Total revenues | $ | 219,443 | $ | 13,466 | $ | 11,556 | $ | (19,715) | $ | 224,750 | |||||||||||||||||||
| Operating expenses | 204,979 | 2,518 | 8,885 | (17,862) | 198,520 | ||||||||||||||||||||||||
| Income before income taxes | $ | 14,464 | $ | 10,948 | $ | 2,671 | $ | (1,853) | $ | 26,230 | |||||||||||||||||||
| Total assets | $ | 216,622 | $ | 5,534 | $ | 108,403 | $ | — | $ | 330,559 | |||||||||||||||||||
| 2017 | Title Insurance | All Other | Intersegment Eliminations | Total | |||||||||||
| Insurance and other services revenues | $ | 154,333,311 | $ | 7,530,496 | $ | (5,699,859 | ) | $ | 156,163,948 | ||||||
| Investment income | 4,992,127 | 546,105 | (1,093,785 | ) | 4,444,447 | ||||||||||
| Net realized gain on investments | 931,635 | 109,266 | — | 1,040,901 | |||||||||||
| Total revenues | $ | 160,257,073 | $ | 8,185,867 | $ | (6,793,644 | ) | $ | 161,649,296 | ||||||
| Operating expenses | 129,095,939 | 7,912,962 | (5,630,175 | ) | 131,378,726 | ||||||||||
| Income before income taxes | $ | 31,161,134 | $ | 272,905 | $ | (1,163,469 | ) | $ | 30,270,570 | ||||||
| Total assets | $ | 193,827,920 | $ | 55,084,939 | $ | — | $ | 248,912,859 | |||||||
68
| 2016 | Title Insurance | All Other | Intersegment Eliminations | Total | |||||||||||
| Insurance and other services revenues | $ | 128,408,746 | $ | 6,808,392 | $ | (2,177,649 | ) | $ | 133,039,489 | ||||||
| Investment income | 4,329,605 | 564,891 | (210,007 | ) | 4,684,489 | ||||||||||
| Net realized gain on investments | 644,850 | 123,586 | — | 768,436 | |||||||||||
| Total revenues | $ | 133,383,201 | $ | 7,496,869 | $ | (2,387,656 | ) | $ | 138,492,414 | ||||||
| Operating expenses | 105,885,770 | 6,583,157 | (2,107,965 | ) | 110,360,962 | ||||||||||
| Income before income taxes | $ | 27,497,431 | $ | 913,712 | $ | (279,691 | ) | $ | 28,131,452 | ||||||
| Total assets | $ | 183,763,655 | $ | 45,174,467 | $ | — | $ | 228,938,122 | |||||||
| 2022 (in thousands) | Title Insurance | Exchange Services | All Other | Intersegment Eliminations | Total | ||||||||||||||||||||||||
| Insurance and other services revenues | $ | 294,851 | $ | 8,038 | $ | 7,502 | $ | (24,373) | $ | 286,018 | |||||||||||||||||||
| Net investment (loss) income | (2,678) | 43 | 9 | — | (2,626) | ||||||||||||||||||||||||
| Total revenues | $ | 292,173 | $ | 8,081 | $ | 7,511 | $ | (24,373) | $ | 283,392 | |||||||||||||||||||
| Operating expenses | 264,952 | 2,666 | 8,557 | (22,891) | 253,284 | ||||||||||||||||||||||||
| Income (loss) before income taxes | $ | 27,221 | $ | 5,415 | $ | (1,046) | $ | (1,482) | $ | 30,108 | |||||||||||||||||||
| Total assets | $ | 244,399 | $ | 3,101 | $ | 92,257 | $ | — | $ | 339,757 | |||||||||||||||||||
| 2015 | Title Insurance | All Other | Intersegment Eliminations | Total | |||||||||||
| Insurance and other services revenues | $ | 118,144,981 | $ | 6,479,484 | $ | (1,839,549 | ) | $ | 122,784,916 | ||||||
| Investment income | 4,073,857 | 574,132 | (116,670 | ) | 4,531,319 | ||||||||||
| Net realized loss on investments | (13,603 | ) | (102,560 | ) | — | (116,163 | ) | ||||||||
| Total revenues | $ | 122,205,235 | $ | 6,951,056 | $ | (1,956,219 | ) | $ | 127,200,072 | ||||||
| Operating expenses | 104,594,829 | 6,598,055 | (1,769,865 | ) | 109,423,019 | ||||||||||
| Income before income taxes | $ | 17,610,406 | $ | 353,001 | $ | (186,354 | ) | $ | 17,777,053 | ||||||
| Total assets | $ | 163,582,898 | $ | 47,939,131 | $ | — | $ | 211,522,029 | |||||||
13. Stockholders’Shareholders’ Equity
On November 12, 2002, the Company’s Board of Directors amended the Company’s Articles of Incorporation, creating a series of Classpreferred stock designated Series A Junior Participating Preferred Stock (the “Class“Series A Preferred Stock”). The ClassSeries A Preferred Stock is senior to common stock in dividends or distributions of assets upon liquidations, dissolutionsliquidation, dissolution or winding up of the Company. Dividends on the ClassSeries A Preferred Stock are cumulative and accrue from the quarterly dividend payment date. Each share of ClassSeries A Preferred Stock entitles the holder thereof to 100 votes on all matters submitted to a vote of shareholders of the Company. These shares were reserved for issuance under the Shareholder Rights Plan, (the “Plan”), which was originally adopted on November 21, 2002 by the Company’s Board of Directors.Directors and most recently amended and restated on September 30, 2022 (as amended and restated, the “Plan”). Under the terms of the Plan, the Company’s common stock acquired by a person or a group buying 15% or more of the Company’s common stock would be diluted, except in transactions approved by the Board of Directors. The Plan expires on September 30, 2032.
In connection with the adoption of the Plan, the Company’s Board of Directors declared a dividend distribution of one right (a “Right”) for each outstanding share of the Company’s common stock paid on December 16, 2002, to shareholders of record at the close of business on December 2, 2002. Each Right entitles the registered holder to purchase from the Company a unit (a “Unit”) consisting of one one-hundredth of a share of ClassSeries A Preferred Stock. Under the Plan, the Rights detach and become exercisable upon the earlier of (a) ten (10)10 days following public announcement that a person or group of affiliated or associated persons has acquired, or obtained the right to acquire, beneficial ownership of 15% or more of the outstanding shares of the Company’s common stock, or (b) ten (10)10 business days following the commencement of, or first public announcement of the intent of a person or group to commence, a tender offer or exchange offer that would result in a person or group beneficially owning 15% or more of such outstanding shares of the Company’s common stock. The current price to exercise one Right is $525 per Unit. The exercise price, the kind and the number of shares covered by each rightRight are subject to adjustment upon the occurrence of certain events described in the Plan.
If any person or group of affiliated or associated persons acquires beneficial ownership of 15% or more of the outstanding common stock, each holder of a Right (other than the acquiring person or group) will have the right to buy, at the exercise price, common stock of the Company having a market value of twice the exercise price. If the Company is acquired in a merger or consolidation in which the Company is not the surviving corporation, or the Company engages in a merger or consolidation in which the Company is the surviving corporation and the Company’s common stock is changed or exchanged, or more than 50% of the Company’s assets or earning power is sold or transferred, the Rights entitle a holder (other than the acquiring person or group) to buy, at the exercise price, stock of the acquiring company having a market value equal to twice the exercise price. At any time after a person or group of affiliated or associated persons has acquired beneficial ownership of 15% or more of the outstanding common stock and prior to the acquisition by such person or group of 50% or more of the outstanding common stock, the Company’s Board of Directors may exchange the Rights (other than the Rights owned by such person or group), in whole or in part, at an exchange ratio of one share of the Company’s common stock, or one one-hundredth of a share of Series A Preferred Stock, per Right.
The Rights are redeemable upon action by the Board of Directors at a price of $0.01 per rightRight at any time before they become exercisable. Until the Rights become exercisable, they are evidenced only by the common stock certificates and are transferred with and only with such certificates.
There were 1,000,0001.0 million shares of Preferred Stock authorized as of December 31, 20172023 and 2016,2022, with 200,000 being designated ClassSeries A Junior Participating Preferred Stock.
14. Concentration of Credit Risk
Financial instruments that potentially subject the Company to concentrations of credit risk consist primarily of cash and cash equivalents. The Company invests its cash and cash equivalents into high credit quality security instruments. Deposits which exceed $250,000$250 thousand at each institution are not insured by the Federal Deposit Insurance Corporation (“FDIC”). Of the $20.2$24.0 million in cash and cash equivalents at December 31, 2017, $19.32023, $22.3 million was not insured by the FDIC. Of the $27.9$35.3 million in cash and cash equivalents at December 31, 2016, $27.12022, $33.8 million was not insured by the FDIC. The Company mitigates the risk of having cash and cash equivalents not insured by the FDIC by monitoring the credit quality of the financial institutions in which the funds are held.
15. Business Concentration
The Company generates a significant amount of title insurance premiums in North Carolina, Texas, South Carolina and South Carolina.Georgia. In 2017, 20162023 and 2015, North Carolina accounted for 38.3%, 35.5% and 32.5%2022, these states generated the following percentage of total title premiums respectively. In 2017, 2016 and 2015, Texas accounted for 19.1%, 20.0% and 22.5% of total title premiums, respectively. In 2017, 2016 and 2015, South Carolina accounted for 10.3%, 10.1% and 10.1% of total title premiums, respectively.written:
| State | 2023 | 2022 | |||||||||
| North Carolina | 37.4 | % | 35.6 | % | |||||||
| Texas | 27.0 | % | 29.0 | % | |||||||
| South Carolina | 9.3 | % | 9.4 | % | |||||||
| Georgia | 6.8 | % | 9.2 | % | |||||||
16. Related Party Transactions
The Company does business with, and has investments in, unconsolidated limited liability companiesLLCs that are primarily title insurance agencies. The Company utilizes the equity method to account for its investments in these limited liability companies.LLCs. The following table sets forth the approximate values by year found within each financial statement classification:
| Financial Statement Classification, | 2017 | 2016 | |||||
| Consolidated Balance Sheets | |||||||
| Other investments | $ | 6,594,000 | $ | 6,437,000 | |||
| Premiums and fees receivable | $ | 720,000 | $ | 56,000 | |||
| Financial Statement Classification, Consolidated Balance Sheets (in thousands) | 2023 | 2022 | |||||||||
| Other investments | $ | 5,561 | $ | 4,420 | |||||||
| Premium and fees receivable | $ | 627 | $ | 735 | |||||||
| Financial Statement Classification, | |||||||||||
| Consolidated Statements of Income | 2017 | 2016 | 2015 | ||||||||
| Net premiums written | $ | 14,355,000 | $ | 15,016,000 | $ | 14,015,000 | |||||
| Other income | $ | 2,240,000 | $ | 2,317,000 | $ | 2,618,000 | |||||
| Commissions to agents | $ | 9,864,000 | $ | 10,394,000 | $ | 9,700,000 | |||||
| Financial Statement Classification, Consolidated Statements of Operations (in thousands) | 2023 | 2022 | |||||||||
| Net premiums written | $ | 22,131 | $ | 26,666 | |||||||
| Non-title services and other investment income | $ | 4,062 | $ | 2,935 | |||||||
| Commissions to agents | $ | 15,115 | $ | 18,798 | |||||||
17. Business Combinations, Intangible Assets, Goodwill and GoodwillTitle Plants
Intangible Assets
The estimated fair values of intangible assets recognized as the result of title insurance agency acquisitions all Level 3 inputs, are principally based on values obtained from a third partyan independent third-party valuation service. In accordance with ASC 350, Intangibles – Goodwillservice and Other, managementare all Level 3 inputs. Management determined that certainno events andor changes in circumstances occurred during 2017the periods ended December 31, 2023 and 2022 that indicated a portion ofwould indicate the carrying amount of the Company’s intangible assetsamounts may not be recoverable. Therefore, netrecoverable, and therefore, determined that no identifiable intangible assets of $153,667 were impaired during 2017.impaired.
Identifiable intangible assets consist of the following as of December 31:
Year Ended (in thousands) | 2023 | 2022 | |||||||||
| Referral relationships | $ | 8,898 | $ | 8,898 | |||||||
| Non-compete agreements | 3,155 | 3,155 | |||||||||
| Tradename | 747 | 747 | |||||||||
| Total | 12,800 | 12,800 | |||||||||
| Accumulated amortization | (6,176) | (4,814) | |||||||||
| Identifiable intangible assets, net | $ | 6,624 | $ | 7,986 | |||||||
70
| Year Ended: | 2017 | 2016 | ||||
| Referral relationships | $ | 6,416,215 | $ | 6,416,215 | ||
| Non-complete agreements | 1,405,685 | 1,405,685 | ||||
| Tradename | 560,000 | 560,000 | ||||
| Total | 8,381,900 | 8,381,900 | ||||
| Accumulated amortization | (1,374,461 | ) | (475,110 | ) | ||
| Identifiable intangible assets, net | $ | 7,007,439 | $ | 7,906,790 | ||
The following table provides the estimated aggregate amortization expense, as of December 31, 2023 for each of the five succeeding fiscal years:
| Year Ended: | |||
| 2018 | $ | 642,253 | |
| 2019 | 568,920 | ||
| 2020 | 568,920 | ||
| 2021 | 561,587 | ||
| 2022 | 524,920 | ||
| Thereafter | 4,140,839 | ||
| Total | $ | 7,007,439 | |
| Year Ended (in thousands) | |||||
| 2024 | $ | 1,178 | |||
| 2025 | 1,095 | ||||
| 2026 | 1,095 | ||||
| 2027 | 679 | ||||
| 2028 | 650 | ||||
| Thereafter | 1,740 | ||||
| Total | $ | 6,437 | |||
Goodwill and Title PlantPlants
As of December 31, 2017 and 2016,2023, the Company recognized $4,349,851$9.6 million in goodwill and $690,000$1.5 million in a title plant,plants, net of impairments, as the result of title insurance agency acquisitions. The title plants are included with other assets in the Consolidated Balance Sheets. The fair values of goodwill and the title plant,plants as of the date of acquisition, both Level 3 inputs, arewere principally based on values obtained from a third partyan independent third-party valuation service. In accordance with ASCFASB’s Accounting Standards Codification (“ASC”) 350, Intangibles – Goodwill and Other, managementthe Company determined that certainno events andor changes in circumstances occurred during 2017the periods ended December 31, 2023 and 2022 that indicated a portion ofwould indicate the carrying amount of the Company’s goodwillamounts may not be recoverable. Therefore,recoverable, and therefore, determined that there were no goodwill of $29,000 was impaired during 2017.or title plant impairments.
18. Accumulated Other Comprehensive Income
The following tables providetable provides changes in the balances of each component of accumulated other comprehensive income, net of tax, for the periods ended December 31, 2017, 20162023 and 2015:2022:
| 2023 (in thousands) | Unrealized Gains and Losses On Available-for-Sale Securities | Postretirement Benefits Plans | Total | ||||||||||||||
| Beginning balance at January 1 | $ | 164 | $ | 36 | $ | 200 | |||||||||||
| Other comprehensive income before calculations | 259 | 19 | 278 | ||||||||||||||
| Amounts reclassified from accumulated other comprehensive income | 160 | — | 160 | ||||||||||||||
| Net current-period other comprehensive income | 419 | 19 | 438 | ||||||||||||||
| Ending balance | $ | 583 | $ | 55 | $ | 638 | |||||||||||
| 2017 | Unrealized Gains and Losses On Available-for-Sale Securities | Postretirement Benefits Plans | Total | |||||||||||||||||||||||||||||||
| 2022 (in thousands) | 2022 (in thousands) | Unrealized Gains and Losses On Available-for-Sale Securities | Postretirement Benefits Plans | Total | ||||||||||||||||||||||||||||||
| Beginning balance at January 1 | $ | 11,870,647 | $ | (109,200 | ) | $ | 11,761,447 | |||||||||||||||||||||||||||
| Other comprehensive income before reclassifications | 4,922,796 | 45,958 | 4,968,754 | |||||||||||||||||||||||||||||||
| Other comprehensive (loss) income before calculations | ||||||||||||||||||||||||||||||||||
| Amounts reclassified from accumulated other comprehensive income | (791,061 | ) | 5,686 | (785,375 | ) | |||||||||||||||||||||||||||||
| Net current-period other comprehensive income | 4,131,735 | 51,644 | 4,183,379 | |||||||||||||||||||||||||||||||
| Net current-period other comprehensive (loss) income | ||||||||||||||||||||||||||||||||||
| Ending balance | $ | 16,002,382 | $ | (57,556 | ) | $ | 15,944,826 | |||||||||||||||||||||||||||
| 2016 | Unrealized Gains and Losses On Available-for-Sale Securities | Postretirement Benefits Plans | Total | ||||||||
| Beginning balance at January 1 | $ | 11,597,741 | $ | (114,726 | ) | $ | 11,483,015 | ||||
| Other comprehensive income (loss) before reclassifications | 758,021 | (374 | ) | 757,647 | |||||||
| Amounts reclassified from accumulated other comprehensive income | (485,115 | ) | 5,900 | (479,215 | ) | ||||||
| Net current-period other comprehensive income | 272,906 | 5,526 | 278,432 | ||||||||
| Ending balance | $ | 11,870,647 | $ | (109,200 | ) | $ | 11,761,447 | ||||
| 2015 | Unrealized Gains and Losses On Available-for-Sale Securities | Postretirement Benefits Plans | Total | ||||||||
| Beginning balance at January 1 | $ | 12,934,497 | $ | (77,988 | ) | $ | 12,856,509 | ||||
| Other comprehensive loss before reclassifications | (1,355,316 | ) | (41,954 | ) | (1,397,270 | ) | |||||
| Amounts reclassified from accumulated other comprehensive income | 18,560 | 5,216 | 23,776 | ||||||||
| Net current-period other comprehensive loss | (1,336,756 | ) | (36,738 | ) | (1,373,494 | ) | |||||
| Ending balance | $ | 11,597,741 | $ | (114,726 | ) | $ | 11,483,015 | ||||
71
The following tables providetable provides significant amounts reclassified out of each component of accumulated other comprehensive income for the periods ended December 31, 20172023 and 2022:
| 2023 (in thousands) | |||||||||||
| Details about Accumulated Other Comprehensive Income Components | Amount Reclassified from Accumulated Other Comprehensive Income | Affected Line Item in the Consolidated Statements of Operations | |||||||||
| Unrealized gains and losses on available-for-sale securities: | |||||||||||
| Net realized losses on investments | $ | — | |||||||||
| Impairments | (208) | ||||||||||
| Total | $ | (208) | Net investment gains (losses) | ||||||||
| Tax | 48 | Provision for Income Taxes | |||||||||
| Net of Tax | $ | (160) | |||||||||
| Reclassifications for the period | $ | (160) | |||||||||
| 2022 (in thousands) | |||||||||||
| Details about Accumulated Other Comprehensive Income Components | Amount Reclassified from Accumulated Other Comprehensive Income | Affected Line Item in the Consolidated Statements of Operations | |||||||||
| Unrealized gains and losses on available-for-sale securities: | |||||||||||
| Net realized losses on investments | $ | (104) | |||||||||
| Impairments | (172) | ||||||||||
| Total | $ | (276) | Net investment gains (losses) | ||||||||
| Tax | 61 | Provision for Income Taxes | |||||||||
| Net of Tax | $ | (215) | |||||||||
| Reclassifications for the period | $ | (215) | |||||||||
19. Revenue from Contracts with Customers
ASC 606, Revenue from Contracts with Customers, 2016requires that an entity recognize revenue to depict the transfer of promised goods or services to customers in an amount that reflects the consideration to which the entity expects to be entitled in exchange for those goods or services. This guidance does not apply to revenue associated with insurance contracts (including title insurance policies), financial instruments and 2015:lease contracts; and therefore is primarily applicable to the following Company revenue categories.
| 2017 | |||||
Details about Accumulated Other Comprehensive Income Components | Amount Reclassified from Accumulated Other Comprehensive Income | Affected Line Item in the Consolidated Statements of Income | |||
| Unrealized gains and losses on available-for-sale securities: | |||||
| Net realized gain on investment | $ | 1,227,265 | |||
| Other-than-temporary impairments | (25,411 | ) | |||
| Total | $ | 1,201,854 | Net realized gain (loss) on investments | ||
| Tax | (410,793 | ) | Provision for Income Taxes | ||
| Net of Tax | $ | 791,061 | |||
| Amortization related to postretirement benefit plans: | |||||
| Prior year service cost | $ | — | |||
| Unrecognized loss | (8,612 | ) | |||
| Total | $ | (8,612 | ) | (a) | |
| Tax | 2,926 | Provision for Income Taxes | |||
| Net of Tax | $ | (5,686 | ) | ||
| Reclassifications for the period | $ | 785,375 | |||
| 2016 | |||||
| Details about Accumulated Other Comprehensive Income Components | Amount Reclassified from Accumulated Other Comprehensive Income | Affected Line Item in the Consolidated Statements of Income | |||
| Unrealized gains and losses on available-for-sale securities: | |||||
| Net realized gain on investment | $ | 972,672 | |||
| Other-than-temporary impairments | (233,941 | ) | |||
| Total | $ | 738,731 | Net realized gain (loss) on investments | ||
| Tax | (253,616 | ) | Provision for Income Taxes | ||
| Net of Tax | $ | 485,115 | |||
| Amortization related to postretirement benefit plans: | |||||
| Prior year service cost | $ | — | |||
| Unrecognized loss | (8,941 | ) | |||
| Total | $ | (8,941 | ) | (a) | |
| Tax | 3,041 | Provision for Income Taxes | |||
| Net of Tax | $ | (5,900 | ) | ||
| Reclassifications for the period | $ | 479,215 | |||
Other: The Company occasionally recognizes revenue from other miscellaneous contracts which can include, but is not limited to, seminar and education registration fees and software licensing contracts. These revenue streams are deemed immaterial to the operations of the Company, and revenue is recognized when, or as, performance obligations are completed.
72
The following table provides a breakdown of the Company’s revenue by major business activity:
| (in thousands) | 2023 | 2022 | |||||||||
| Revenue from contracts with customers: | |||||||||||
| Escrow and other title-related fees | $ | 17,109 | $ | 22,314 | |||||||
| Non-title services | 19,237 | 13,931 | |||||||||
| Total revenue from contracts with customers | 36,346 | 36,245 | |||||||||
| Other sources of revenue: | |||||||||||
| Net premiums written | 171,158 | 248,632 | |||||||||
| Investment-related revenue (loss) | 16,255 | (2,626) | |||||||||
| Other | 991 | 1,141 | |||||||||
| Total revenues | $ | 224,750 | $ | 283,392 | |||||||
| 2015 | |||||
| Details about Accumulated Other Comprehensive Income Components | Amount Reclassified from Accumulated Other Comprehensive Income | Affected Line Item in the Consolidated Statements of Income | |||
| Unrealized gains and losses on available-for-sale securities: | |||||
| Net realized gain on investment | $ | 718,837 | |||
| Other-than-temporary impairments | (751,059 | ) | |||
| Total | $ | (32,222 | ) | Net realized gain (loss) on investments | |
| Tax | 13,662 | Provision for Income Taxes | |||
| Net of Tax | $ | (18,560 | ) | ||
| Amortization related to postretirement benefit plans: | |||||
| Prior year service cost | $ | (4,390 | ) | ||
| Unrecognized loss | (3,514 | ) | |||
| Total | $ | (7,904 | ) | (a) | |
| Tax | 2,688 | Provision for Income Taxes | |||
| Net of Tax | $ | (5,216 | ) | ||
| Reclassifications for the period | $ | (23,776 | ) | ||
73
ITEM 9. CHANGES IN AND DISAGREEMENTS WITH ACCOUNTANTS ON ACCOUNTING AND FINANCIAL DISCLOSURE
ITEM 9A. CONTROLS AND PROCEDURES
Disclosure Controls and Procedures
The Company’s disclosure controls and procedures are designed to ensure that information required to be disclosed by the Company in the reports that it files or submits under the Securities Exchange Act of 1934 (the “Exchange Act”) is recorded, processed, summarized and reported within the time periods specified by the Securities and Exchange Commission’s rules and forms. Disclosure controls and procedures include controls and procedures designed to ensure that information required to be disclosed in such reports is accumulated and communicated to the Company’s management as appropriate to allow timely decisions regarding required disclosure.
No system of controls, no matter how well designed and operated, can provide absolute assurance that the objectives of the system of controls are met, and no evaluation of controls can provide absolute assurance that the system of controls has operated effectively in all cases. The Company’s disclosure controls and procedures, however, are designed to provide reasonable assurance that the objectives of disclosure controls and procedures are met.
Pursuant to Rule 13a-15(b) under the Exchange Act, an evaluation was performed under the supervision and with the participation of the Company’s management, including its Chief Executive Officer and Chief Financial Officer, of the effectiveness of the design and operation of the Company’s disclosure controls and procedures. Based on that evaluation, the Company’s Chief Executive Officer and Chief Financial Officer concluded that the Company’s disclosure controls and procedures were effective as of December 31, 20172023 to provide reasonable assurance that the objectives of disclosure controls and procedures are met.
Changes in Internal Control Over Financial Reporting
During the quarter ended December 31, 2017,2023, there were no changes in the Company’s internal control over financial reporting that have materially affected, or are reasonably likely to materially affect, the Company’s internal control over financial reporting.
Reports of Management and Independent Registered Public Accounting Firm on Internal Control Over Financial Reporting
Management has assessed, and the Company’s independent registered public accounting firm, Dixon Hughes GoodmanFORVIS LLP, has audited, the Company’s internal control over financial reporting as of December 31, 2017.2023. The reports of management and Dixon Hughes GoodmanFORVIS LLP thereon are included in Item 8 of this Annual Report on Form 10-K and are incorporated by reference herein.
ITEM 9B. OTHER INFORMATION
During the fourth quarterthree-month period ended December 31, 2023, none of the year that has not been reported.Company's directors or executive officers adopted or terminated a “Rule 10b5-1 trading arrangement” or a “non-Rule 10b5-1 trading arrangement,” as each term is defined in Item 408 of Regulation S-K.
ITEM 9C. DISCLOSURE REGARDING FOREIGN JURISDICTIONS THAT PREVENT INSPECTIONS
Not applicable.
74
PART III
ITEM 10. DIRECTORS, EXECUTIVE OFFICERS AND CORPORATE GOVERNANCE
The information called for by this item is incorporated by reference to the material under the captions “Proposals Requiring Your Vote – Proposal 1 – Election of Directors,” “General Information -Section 16(a) Beneficial Ownership Reporting Compliance,” “Corporate Governance – Board of Directors and Committees -– The Audit Committee” and “Corporate Governance – Code of Business Conduct and Ethics” in the Company’s definitive Proxy Statement for the Annual Meeting of Shareholders to be held on May 16, 2018.15, 2024, to be filed by the Company with the Securities and Exchange Commission (“SEC”) pursuant to Regulation 14A within 120 days after the year ended December 31, 2023 (the “2024 Proxy Statement”). Other information with respect to the executive officers of the Company is included at the end of Part I of this Annual Report on Form 10-K under the separate caption “Executive Officers of the Company.”
ITEM 11. EXECUTIVE COMPENSATION
The information called for by this item is set forth under the captions “Executive Compensation” and “Compensation of Directors” in the Company’s definitive2024 Proxy Statement relating to the Annual Meeting of Shareholders to be held on May 16, 2018 and is incorporated by reference in this Annual Report on Form 10-K.
ITEM 12. SECURITY OWNERSHIP OF CERTAIN BENEFICIAL OWNERS AND MANAGEMENT AND RELATED STOCKHOLDERSHAREHOLDER MATTERS
The information pertaining to securities ownership of certain beneficial owners and management is set forth under the caption “Stock Ownership of Certain Beneficial Owners and Management” in the Company’s definitive2024 Proxy Statement relating to the Annual Meeting of Shareholders to be held on May 16, 2018 and is incorporated by reference in this Annual Report on Form 10-K.
The following table provides information about the Company’s compensation plans under which equity securities are authorized for issuance as of December 31, 2017.2023. The Company does not have any equity compensation plans that have not been approved by its shareholders.
Equity Compensation Plan Information (unrounded)
Plan Category | Number of Securities to be Issued Upon Exercise of Outstanding Options, Warrants and Rights | Weighted Average Exercise Price of Outstanding Options, Warrants and Rights | Number of Securities Remaining Available for Future Issuance Under Equity Compensation Plans | ||||||||||||||||||||||||||
| Equity compensation plans approved by shareholders | 42,125 | (a) | $ | 160.83 | 212,250 | (b) | |||||||||||||||||||||||
| Equity compensation plans not approved by shareholders | — | — | — | ||||||||||||||||||||||||||
| Total | 42,125 | $ | 160.83 | 212,250 | |||||||||||||||||||||||||
| (a) | Includes 9,000 shares issuable upon exercise of outstanding stock appreciation rights (“SARs”) under the 2009 Stock Appreciation Rights Plan (the “2009 Plan”), and 33,125 shares issuable upon exercise of SARs under the 2019 Stock Appreciation Rights Plan (the “2019 Plan”). | |||||||
| (b) | Includes shares remaining for future issuance under the 2019 Plan. The 2009 Plan expired in March 2019. | |||||||
Plan Category | Number of Securities to be Issued Upon Exercise of Outstanding Options, Warrants and Rights | Weighted Average Exercise Price of Outstanding Options, Warrants and Rights | Number of Securities Remaining Available for Future Issuance Under Equity Compensation Plans | ||||||
| Equity compensation plans approved by shareholders | 25,000 | $ | 93.40 | 223,000 | |||||
| Equity compensation plans not approved by shareholders | — | — | — | ||||||
| Total | 25,000 | $ | 93.40 | 223,000 | |||||
ITEM 13. CERTAIN RELATIONSHIPS AND RELATED TRANSACTIONS, AND DIRECTOR INDEPENDENCE
The information called for by this item is set forth under the captions “Certain Relationships and Related Transactions,” “Corporate Governance – Independent Directors” and “Proposals Requiring Your Vote – Proposal 1 – Election of Directors” set forth in the Company’s definitive2024 Proxy Statement relating to the Annual Meeting of Shareholders to be held on May 16, 2018 and is incorporated by reference in this Annual Report on Form 10-K.
ITEM 14. PRINCIPAL ACCOUNTANT FEES AND SERVICES
The information pertaining to principal accountant fees and services is set forth under the caption “Proposals Requiring Your Vote – Proposal 2 – Ratification of Appointment of Independent Registered Public Accounting Firm” in the Company’s definitive2024 Proxy Statement relating to the Annual Meeting of Shareholders to be held on May 16, 2018 and is incorporated by reference in this Annual Report on Form 10-K.
75
PART IV
ITEM 15. EXHIBITS, FINANCIAL STATEMENT SCHEDULES
(a)(1) Consolidated Financial Statements
The following financial statements are filed under Item 8 of this Annual Report on Form 10-K:
Report of Independent Registered Public Accounting Firm (PCAOB ID: 686)
Management’s Report on Internal Control Over Financial Reporting
Report of Independent Registered Public Accounting Firm
Consolidated Balance Sheets as of December 31, 20172023 and 20162022
Consolidated Statements of IncomeOperations for the Years Ended December 31, 2017, 20162023 and 20152022
Consolidated Statements of Comprehensive Income for the Years Ended December 31, 2017, 20162023 and 20152022
Consolidated Statements of Stockholders’Shareholders’ Equity for the Years Ended December 31, 2017, 20162023 and 20152022
Consolidated Statements of Cash Flows for the Years Ended December 31, 2017, 20162023 and 20152022
Notes to Consolidated Financial Statements
(a)(2) Financial Statement Schedules
The following is a list of financial statement schedules filed as part of this Form 10-K Annual Report:
| Schedule Number | Description | |||||||
| I | ||||||||
| Summary of Investments – Other Than Investments in Related Parties | ||||||||
| II | Condensed Financial Information of Registrant | |||||||
| III | Supplementary Insurance Information | |||||||
| IV | Reinsurance | |||||||
| V | Valuation and Qualifying Accounts | |||||||
All other schedules are omitted, as the required information either is not applicable, is not required, or is presented in the accompanying Consolidated Financial Statements or the notes thereto.
(a)(3) Exhibits
The following exhibits are filed as a part of this report and incorporated herein by reference to other documents are listed in the Index to Exhibits to this Annual Report on Form 10-K.10-K are incorporated herein by reference.
INDEX TO EXHIBITS
Exhibit Number | Description | Location | |||||||||
| 3.1(a) | Incorporated by reference to Exhibit 4.1 to Form S-8 filed August 10, 2009, File No. 333-161209 | ||||||||||
| 3.1(b) | Incorporated by reference to Exhibit 4.2 to Form S-8 filed August 10, 2009, File No. 333-161209 | ||||||||||
| 3.1(c) | Incorporated by reference to Exhibit 4.3 to Form S-8 filed August 10, 2009, File No. 333-161209 | ||||||||||
| 3.1(d) | Incorporated by reference to Exhibit 3.3 to Form 10-Q for the quarter ended June 30, 2002, File No. 11774 | ||||||||||
| 3.1(e) | Incorporated by reference to Exhibit 3.4 to Form 10-Q for the quarter ended March 31, 2003, File No. 11774 | ||||||||||
| 3.1(f) | Incorporated by reference to Exhibit 3.1 to Form 10-Q filed on October 31, 2012, File No. 11774 | ||||||||||
| 3.2 | Incorporated by reference to Exhibit 3.1 to Form 10-Q filed on November 8, 2023, File No. 11774 | ||||||||||
| 4.1 | Incorporated by reference to Exhibit 4.1 to Form 10-K for the year ended December 31, 2019, File No. 11774 | ||||||||||
| 4.2 | Incorporated by reference to Exhibit 4.1 to Form 8-K filed on October 3, 2022, File No. 11774 | ||||||||||
| 10.1* | Incorporated by reference to Exhibit 10.13 to Form 10-K for the year ended December 31, 2008, File No. 11774 | ||||||||||
| 10.2* | Incorporated by reference to Exhibit 10.14 to Form 10-K for the year ended December 31, 2008, File No. 11774 | ||||||||||
| 10.3(a)* | Incorporated by reference to Appendix A to the Proxy Statement dated May 26, 2009, File No. 11774 | ||||||||||
| 10.3(b)* | Incorporated by reference to Exhibit 10 to Form 10-Q for the quarter ended June 30, 2011, File No. 11774 | ||||||||||
| 10.4(a)* | Incorporated by reference to Exhibit 99.1 to the Registration Statement on Form S-8 filed on May 15, 2019, File No. 333-231486 | ||||||||||
| 10.4(b)* | Incorporated by reference to Exhibit 10.2 to Form 8-K filed on May 16, 2019, File No. 11774 | ||||||||||
| 10.5* | Incorporated by reference to Exhibit 10.11 to Form 10-K for the year ended December 31, 2019, File No. 11774 | ||||||||||
| 10.6* | Incorporated by reference to Exhibit 10.1 to Form 10-Q for the quarter ended March 31, 2022, File No. 11774 | ||||||||||
| 10.7* | Incorporated by reference to Exhibit 10.2 to Form 10-Q for the quarter ended March 31, 2022, File No. 11774 | ||||||||||
77
| 10.8* | Incorporated by reference to Exhibit 10.3 to Form 10-Q for the quarter ended March 31, 2022, File No. 11774 | ||||||||||
| 10.9* | Incorporated by reference to Exhibit 10.4 to Form 10-Q for the quarter ended March 31, 2022, File No. 11774 | ||||||||||
| 10.10* | Incorporated by reference to Exhibit 10.5 to Form 10-Q for the quarter ended March 31, 2022, File No. 11774 | ||||||||||
| 10.11* | Incorporated by reference to Exhibit 10.6 to Form 10-Q for the quarter ended March 31, 2022, File No. 11774 | ||||||||||
| 16 | Incorporated by reference to Exhibit 16.1 to Form 8-K filed on June 7, 2022 , File No. 11774 | ||||||||||
| 21 | Filed herewith | ||||||||||
| 23 | Filed herewith | ||||||||||
| 31.1 | Filed herewith | ||||||||||
| 31.2 | Filed herewith | ||||||||||
| 32 | Furnished herewith | ||||||||||
| 97 | Filed herewith | ||||||||||
| 101.INS | XBRL Instance Document (the instance document does not appear in the Interactive Data File because its XBRL tags are embedded within the Inline XBRL document) | Filed herewith | |||||||||
| 101.SCH | XBRL Taxonomy Extension Schema Document | Filed herewith | |||||||||
| 101.CAL | XBRL Taxonomy Extension Calculation Linkbase Document | Filed herewith | |||||||||
| 101.LAB | XBRL Taxonomy Extension Label Linkbase Document | Filed herewith | |||||||||
| 101.PRE | XBRL Taxonomy Extension Presentation Linkbase Document | Filed herewith | |||||||||
| 101.DEF | XBRL Taxonomy Extension Definition Linkbase Document | Filed herewith | |||||||||
| 104 | Cover Page Interactive Data File (formatted in Inline XBRL and contained in Exhibit 101) | Filed herewith | |||||||||
| * | Management contract or compensatory plan or arrangement | ||||
78
SCHEDULE I
INVESTORS TITLE COMPANY AND SUBSIDIARIES
SUMMARY OF INVESTMENTS – OTHER THAN INVESTMENTS IN RELATED PARTIES
AS OF DECEMBER 31, 2023
| Type of Investment (in thousands) | Cost (1) | Market Value | Amount at which shown in the Balance Sheet (3) | ||||||||||||||
| Fixed maturity securities: | |||||||||||||||||
| Government obligations | $ | 2,220 | $ | 2,220 | $ | 2,220 | |||||||||||
| General obligations of U.S. states, territories and political subdivisions | 9,419 | 9,459 | 9,459 | ||||||||||||||
| Special revenue issuer obligations of U.S. states, territories and political subdivisions | 18,514 | 18,525 | 18,525 | ||||||||||||||
| Public utilities | 6,394 | 6,462 | 6,462 | ||||||||||||||
| Corporate debt securities | 26,559 | 27,181 | 27,181 | ||||||||||||||
| Total fixed maturity securities | 63,106 | 63,847 | 63,847 | ||||||||||||||
| Equity securities: | |||||||||||||||||
| Common stocks: | |||||||||||||||||
| Public utilities | 176 | 301 | 301 | ||||||||||||||
| Banks, trusts and insurance companies | 1,441 | 2,385 | 2,385 | ||||||||||||||
| Industrial, miscellaneous and all other | 19,738 | 29,539 | 29,539 | ||||||||||||||
| Technology | 1,626 | 4,987 | 4,987 | ||||||||||||||
| Total equity securities | 22,981 | 37,212 | 37,212 | ||||||||||||||
| Other investments: | |||||||||||||||||
| Short-term investments | 110,224 | 110,224 | 110,224 | ||||||||||||||
| Other investments (2) | 14,170 | 14,170 | 14,170 | ||||||||||||||
| Total other investments | 124,394 | 124,394 | 124,394 | ||||||||||||||
| Total investments (2) | $ | 210,481 | $ | 225,453 | $ | 225,453 | |||||||||||
(1)Fixed maturity securities are shown at amortized cost and equity securities are shown at original cost.
(2)The above summary of investments does not include investments in related parties accounted for under the equity method or the measurement alternative methods of accounting in the amount of $3,215.
(3)All fixed maturity securities presented are classified as available-for-sale and shown at estimated fair value. Equity securities are shown at fair value.
79
SCHEDULE II
INVESTORS TITLE COMPANY (PARENT COMPANY)
CONDENSED FINANCIAL INFORMATION OF REGISTRANT
BALANCE SHEETS
AS OF DECEMBER 31, 2023 AND 2022
| (in thousands) | 2023 | 2022 | |||||||||
| Assets | |||||||||||
| Cash and cash equivalents | $ | 4,409 | $ | 3,450 | |||||||
| Fixed maturity securities, available-for-sale, at fair value | 4,287 | 5,900 | |||||||||
| Equity securities, at fair value | 188 | 325 | |||||||||
| Short-term investments | 83,095 | 64,832 | |||||||||
| Investments in affiliated companies | 148,934 | 159,700 | |||||||||
| Other investments | 4,172 | 6,703 | |||||||||
| Prepaid expenses and other receivables | 5,516 | 3,864 | |||||||||
| Current income taxes receivable | 1,293 | 2,799 | |||||||||
| Accrued interest and dividends | 192 | 185 | |||||||||
| Property, net | 1,562 | 1,691 | |||||||||
| Total Assets | $ | 253,648 | $ | 249,449 | |||||||
| Liabilities and Shareholders’ Equity | |||||||||||
| Liabilities: | |||||||||||
| Accounts payable and accrued liabilities | $ | 1,842 | $ | 7,726 | |||||||
| Deferred income taxes, net | 253 | 712 | |||||||||
| Total liabilities | 2,095 | 8,438 | |||||||||
| Shareholders’ Equity: | |||||||||||
| Preferred stock (1,000 authorized shares; no shares issued) | — | — | |||||||||
| Common stock – no par value (10,000 authorized shares; 1,891 and 1,897 shares issued and outstanding as of December 31, 2023 and 2022, respectively, excluding in each period 292 shares of common stock held by the Company) | — | — | |||||||||
| Retained earnings | 250,915 | 240,811 | |||||||||
| Accumulated other comprehensive income | 638 | 200 | |||||||||
| Total shareholders’ equity | 251,553 | 241,011 | |||||||||
| Total Liabilities and Shareholders’ Equity | $ | 253,648 | $ | 249,449 | |||||||
Refer to the Notes to Condensed Financial Statements.
80
SCHEDULE II
INVESTORS TITLE COMPANY (PARENT COMPANY)
CONDENSED FINANCIAL INFORMATION OF REGISTRANT
STATEMENTS OF OPERATIONS
FOR THE YEARS ENDED DECEMBER 31, 2023 AND 2022
| (in thousands, except per share amounts) | 2023 | 2022 | |||||||||
| Revenues: | |||||||||||
| Interest and dividends | $ | 3,671 | $ | 990 | |||||||
| Net investment losses | (142) | (739) | |||||||||
| Rental income | 922 | 869 | |||||||||
| Gain on disposals of property | 194 | — | |||||||||
| Miscellaneous (loss) income | (36) | 305 | |||||||||
| Total Revenues | 4,609 | 1,425 | |||||||||
| Operating Expenses: | |||||||||||
| Personnel expenses | 874 | 947 | |||||||||
| Office and technology expenses | 628 | 447 | |||||||||
| Other expenses | 979 | 936 | |||||||||
| Total Operating Expenses | 2,481 | 2,330 | |||||||||
| Equity in Net Income of Affiliated Companies | 19,670 | 24,584 | |||||||||
| Income before Income Taxes | 21,798 | 23,679 | |||||||||
| Provision (Benefit) for Income Taxes | 112 | (224) | |||||||||
| Net Income | $ | 21,686 | $ | 23,903 | |||||||
| Basic Earnings per Common Share | $ | 11.45 | $ | 12.60 | |||||||
| Weighted Average Shares Outstanding – Basic | 1,893 | 1,897 | |||||||||
| Diluted Earnings per Common Share | $ | 11.45 | $ | 12.59 | |||||||
| Weighted Average Shares Outstanding – Diluted | 1,893 | 1,898 | |||||||||
Refer to the Notes to Condensed Financial Statements.
81
SCHEDULE II
INVESTORS TITLE COMPANY (PARENT COMPANY)
CONDENSED FINANCIAL INFORMATION OF REGISTRANT
STATEMENTS OF CASH FLOWS
FOR THE YEARS ENDED DECEMBER 31, 2023 AND 2022
| (in thousands) | 2023 | 2022 | |||||||||
| Operating Activities | |||||||||||
| Net income | $ | 21,686 | $ | 23,903 | |||||||
| Adjustments to reconcile net income to net cash provided by operating activities: | |||||||||||
| Equity in net earnings of subsidiaries | (19,670) | (24,584) | |||||||||
| Depreciation | 126 | 115 | |||||||||
| Amortization, net | (2,924) | (272) | |||||||||
| Share-based compensation expense related to stock appreciation rights | 425 | 362 | |||||||||
| Net gains on disposal of property | (194) | — | |||||||||
| Net investment losses on securities | 142 | 343 | |||||||||
| Net realized losses on other investments | — | 396 | |||||||||
| Net losses from other investments | 21 | 11 | |||||||||
| Benefit for deferred income taxes | (433) | (927) | |||||||||
| (Increase) decrease in receivables | (1,652) | 1,249 | |||||||||
| Decrease (increase) in current income taxes receivable | 1,506 | (2,799) | |||||||||
| Decrease (increase) in other assets | 3,204 | (153) | |||||||||
| Decrease in current income taxes payable | — | (433) | |||||||||
| (Decrease) increase in accounts payable and accrued liabilities | (1,326) | 3,212 | |||||||||
| Net cash provided by operating activities | 911 | 423 | |||||||||
| Investing Activities | |||||||||||
| Dividends received from subsidiaries | 32,478 | 55,643 | |||||||||
| Purchases of fixed maturity and equity securities | (1,203) | (3,851) | |||||||||
| Purchases of short-term securities | (127,789) | (64,513) | |||||||||
| Purchases of and net earnings from other investments | (81) | (46) | |||||||||
| Proceeds from sales and maturities of fixed maturity and equity securities | 2,892 | 5,278 | |||||||||
| Proceeds from sales and maturities of short-term securities | 107,083 | 23,487 | |||||||||
| Proceeds from sales and distributions of other investments | 2 | 776 | |||||||||
| Proceeds from sales of other assets | — | — | |||||||||
| Purchases of property | (9) | (201) | |||||||||
| Proceeds from disposals of property | 206 | 60 | |||||||||
| Net cash provided by investing activities | 13,579 | 16,633 | |||||||||
| Financing Activities | |||||||||||
| Repurchases of common stock | (959) | (133) | |||||||||
| Exercise of stock appreciation rights | — | (1) | |||||||||
| Capital contribution to subsidiaries | (1,524) | (4,875) | |||||||||
| Dividends paid | (11,048) | (9,181) | |||||||||
| Net cash used in financing activities | (13,531) | (14,190) | |||||||||
| Net Increase in Cash and Cash Equivalents | 959 | 2,866 | |||||||||
| Cash and Cash Equivalents, Beginning of Period | 3,450 | 584 | |||||||||
| Cash and Cash Equivalents, End of Period | $ | 4,409 | $ | 3,450 | |||||||
| Supplemental Disclosures: | |||||||||||
| Income tax payments, net | $ | 8,320 | $ | 15,186 | |||||||
| Non cash 1031 exchange proceeds receivable | $ | (2,589) | $ | — | |||||||
Refer to the Notes to Condensed Financial Statements.
82
SCHEDULE II
INVESTORS TITLE COMPANY (PARENT COMPANY)
CONDENSED FINANCIAL INFORMATION OF REGISTRANT
NOTES TO THE CONDENSED FINANCIAL STATEMENTS
FOR THE YEARS ENDED DECEMBER 31, 2023 AND 2022
(in thousands)
1.The accompanying Condensed Financial Statements should be read in conjunction with the Consolidated Financial Statements and notes thereto of Investors Title Company and Subsidiaries.
2.Cash dividends paid to Investors Title Company by its wholly owned subsidiaries were as follows:
| Subsidiaries | 2023 | 2022 | |||||||||
| Investors Title Insurance Company, net* | $ | 25,478 | $ | 48,243 | |||||||
| Investors Title Exchange Corporation | 5,800 | 4,300 | |||||||||
| Investors Title Accommodation Corporation | — | 100 | |||||||||
| Investors Trust Company | 500 | 400 | |||||||||
| Investors Title Commercial Agency, LLC | — | 2,600 | |||||||||
| National Investors Holdings, LLC | 700 | — | |||||||||
| Total | $ | 32,478 | $ | 55,643 | |||||||
* Total dividends of $27,181 and $49,655 paid to the Parent Company in 2023 and 2022, respectively, netted with dividends of $1,703 and $1,412 received from the Parent Company in 2023 and 2022, respectively.
83
SCHEDULE III
INVESTORS TITLE COMPANY AND SUBSIDIARIES
SUPPLEMENTARY INSURANCE INFORMATION
FOR THE YEARS ENDED DECEMBER 31, 2023 AND 2022
| Segment | Deferred Policy Acquisition Cost | Future Policy Benefits, Losses, Claims and Loss Expenses | Unearned Premiums | Other Policy Claims and Benefits Payable | Premium Revenue | Net Investment Income | Benefits, Claims, Losses and Settlement Expenses | Amortization of Deferred Policy Acquisition Costs | Other Operating Expenses | Premiums Written | |||||||||||||||||||||||||||||||||||||||||||||||||
| Year Ended December 31, 2023 (in thousands) | |||||||||||||||||||||||||||||||||||||||||||||||||||||||||||
| Title Insurance | $ | — | $ | 37,147 | $ | — | $ | 804 | $ | 171,158 | $ | (2,926) | $ | 4,762 | $ | — | $ | 182,571 | N/A | ||||||||||||||||||||||||||||||||||||||||
| All Other | — | — | — | — | — | 3,550 | — | — | 11,187 | N/A | |||||||||||||||||||||||||||||||||||||||||||||||||
| $ | — | $ | 37,147 | $ | — | $ | 804 | $ | 171,158 | $ | 624 | $ | 4,762 | $ | — | $ | 193,758 | N/A | |||||||||||||||||||||||||||||||||||||||||
| Year Ended December 31, 2022 (in thousands) | |||||||||||||||||||||||||||||||||||||||||||||||||||||||||||
| Title Insurance | $ | — | $ | 37,192 | $ | — | $ | 1,491 | $ | 248,632 | $ | (9,333) | $ | 4,255 | $ | — | $ | 238,025 | N/A | ||||||||||||||||||||||||||||||||||||||||
| All Other | — | — | — | — | — | (3,028) | — | — | 11,004 | N/A | |||||||||||||||||||||||||||||||||||||||||||||||||
| $ | — | $ | 37,192 | $ | — | $ | 1,491 | $ | 248,632 | $ | (12,361) | $ | 4,255 | $ | — | $ | 249,029 | N/A | |||||||||||||||||||||||||||||||||||||||||
84
SCHEDULE IV
INVESTORS TITLE COMPANY AND SUBSIDIARIES
REINSURANCE
FOR THE YEARS ENDED DECEMBER 31, 2023 AND 2022
| Gross Amount | Ceded to Other Companies | Assumed from Other Companies | Net Amount | Percentages of Amount Assumed to Net | |||||||||||||||||||||||||
| Year Ended December 31, 2023 (in thousands) | |||||||||||||||||||||||||||||
| Title Insurance | $ | 171,512 | $ | 354 | $ | — | $ | 171,158 | — | % | |||||||||||||||||||
| Year Ended December 31, 2022 (in thousands) | |||||||||||||||||||||||||||||
| Title Insurance | $ | 249,450 | $ | 818 | $ | — | $ | 248,632 | — | % | |||||||||||||||||||
85
SCHEDULE V
INVESTORS TITLE COMPANY AND SUBSIDIARIES
VALUATION AND QUALIFYING ACCOUNTS
FOR THE YEARS ENDED DECEMBER 31, 2023 AND 2022
| Description | Balance at Beginning of Period | Additions Charged to Costs and Expenses | Additions Charged to Other Accounts – Describe | Deductions – Describe | Balance at End of Period | |||||||||||||||||||||||||||
| 2023 (in thousands) | ||||||||||||||||||||||||||||||||
| Premiums receivable: | ||||||||||||||||||||||||||||||||
| Valuation provision | $ | 159 | $ | 773 | $ | — | $ | (844) | (a) | $ | 88 | |||||||||||||||||||||
| Reserves for claims | $ | 37,192 | $ | 4,762 | $ | — | $ | (4,807) | (b) | $ | 37,147 | |||||||||||||||||||||
| 2022 (in thousands) | ||||||||||||||||||||||||||||||||
| Premiums receivable: | ||||||||||||||||||||||||||||||||
| Valuation provision | $ | 190 | $ | 508 | $ | — | $ | (539) | (a) | $ | 159 | |||||||||||||||||||||
| Reserves for claims | $ | 36,754 | $ | 4,255 | $ | — | $ | (3,817) | (b) | $ | 37,192 | |||||||||||||||||||||
(a)Canceled premiums
(b)Payments of claims, net of recoveries
86
ITEM 16. FORM 10-K SUMMARY
87
SIGNATURES
Pursuant to the requirements of Section 13 or 15(d) of the Securities Exchange Act of 1934, the registrant has duly caused this report to be signed on its behalf by the undersigned, thereunto duly authorized.
| INVESTORS TITLE COMPANY | |||||||||
| (Registrant) | |||||||||
| By: | /s/ J. Allen Fine | ||||||||
| J. Allen Fine, Chairman and Chief Executive | |||||||||
Officer (Principal Executive Officer) | |||||||||
March 14, 2024
Pursuant to the requirements of the Securities Exchange Act of 1934, this report has been signed below by the following persons on behalf of the Registrant and in the capacities indicated on the 12th14th day of March, 2018.
2024.
| /s/ J. Allen Fine | /s/ James A. Fine, Jr. | |||||||||
| J. Allen Fine, Chairman of the Board and | James A. Fine, Jr., President, Treasurer, Chief | |||||||||
| Chief Executive Officer | Financial Officer, Chief Accounting Officer and | |||||||||
| (Principal Executive Officer) | Director (Principal Financial Officer and | |||||||||
| Principal Accounting Officer) | ||||||||||
| /s/ W. Morris Fine | /s/ | |||||||||
| W. Morris Fine, Executive Vice President, | ||||||||||
| Secretary and Director | ||||||||||
| /s/ David L. Francis | ||||||||||
| /s/ Richard M. Hutson II | ||||||||||
| David L. Francis, Director | Richard M. Hutson II, Director | |||||||||
| /s/ Elton C. Parker, Jr. | /s/ James E. Scott | |||||||||
| Elton C. Parker, Jr., Director | James E. Scott, Director | |||||||||
| /s/ James H. Speed, Jr. | ||||||||||
| James H. Speed, Jr., Director | ||||||||||
88
| Type of Investment | Cost (1) | Market Value | Amount at which shown in the Balance Sheet (2) | ||||||||
| Fixed maturities: | |||||||||||
| Bonds: | |||||||||||
| Government obligation | $ | 1,042,921 | $ | 1,041,970 | $ | 1,041,970 | |||||
| General obligations of U.S. states, territories and political subdivisions | 23,979,386 | 24,435,873 | 24,435,873 | ||||||||
| Special revenue issuer obligations of U.S. states, territories and political subdivisions | 45,848,032 | 47,470,175 | 47,470,175 | ||||||||
| Public utilities | 16,953,592 | 17,383,561 | 17,383,561 | ||||||||
| Corporate debt securities | 12,490,154 | 13,009,504 | 13,009,504 | ||||||||
| Total fixed maturities | 100,314,085 | 103,341,083 | 103,341,083 | ||||||||
| Equity securities: | |||||||||||
| Common stocks: | |||||||||||
| Public utilities | 312,656 | 459,265 | 459,265 | ||||||||
| Banks, trusts and insurance companies | 5,213,975 | 9,112,321 | 9,112,321 | ||||||||
| Industrial, miscellaneous and all other | 17,596,334 | 30,385,656 | 30,385,656 | ||||||||
| Technology | 2,879,654 | 7,409,584 | 7,409,584 | ||||||||
| Total equity securities | 26,002,619 | 47,366,826 | 47,366,826 | ||||||||
| Other investments: | |||||||||||
| Short-term investments | 23,779,672 | 23,779,672 | 23,779,672 | ||||||||
| Other investments (3) | 11,024,172 | 11,024,172 | 11,024,172 | ||||||||
| Total other investments | 34,803,844 | 34,803,844 | 34,803,844 | ||||||||
| Total investments (3) | $ | 161,120,548 | $ | 185,511,753 | $ | 185,511,753 | |||||
| 2017 | 2016 | ||||||
| Assets: | |||||||
| Cash and cash equivalents | $ | 5,872,001 | $ | 10,178,219 | |||
| Investments in fixed maturities, available-for-sale | 22,713,771 | 16,505,866 | |||||
| Investments in equity securities, available-for-sale | 3,691,564 | 3,193,268 | |||||
| Short-term investments | 5,808,966 | 3,162,283 | |||||
| Investments in affiliated companies | 128,580,223 | 113,234,094 | |||||
| Other investments | 5,167,102 | 4,318,296 | |||||
| Premium and fees receivable | 94,521 | 99,878 | |||||
| Other receivables | 1,629,758 | 1,986,634 | |||||
| Income taxes recoverable | 3,878,824 | 2,562,589 | |||||
| Accrued interest and dividends | 198,297 | 86,481 | |||||
| Property, net | 2,253,866 | 2,340,605 | |||||
| Total Assets | $ | 179,888,893 | $ | 157,668,213 | |||
| Liabilities and Stockholders’ Equity | |||||||
| Liabilities: | |||||||
| Accounts payable and accrued liabilities | $ | 1,916,253 | $ | 2,370,963 | |||
| Deferred income taxes, net | 137,153 | 252,181 | |||||
| Total liabilities | 2,053,406 | 2,623,144 | |||||
| Stockholders’ Equity: | |||||||
| Preferred stock (1,000,000 authorized shares; no shares issued) | — | — | |||||
| Common stock – no par value (10,000,000 authorized shares; 1,885,993 and 1,884,283 shares issued and outstanding as of December 31, 2017 and December 31, 2016, respectively, excluding in each period 291,676 shares of common stock held by the Company) | 1 | 1 | |||||
| Retained earnings | 161,890,660 | 143,283,621 | |||||
| Accumulated other comprehensive income | 15,944,826 | 11,761,447 | |||||
| Total stockholders’ equity | 177,835,487 | 155,045,069 | |||||
| Total Liabilities and Stockholders’ Equity | $ | 179,888,893 | $ | 157,668,213 | |||
| 2017 | 2016 | 2015 | ||||||||||
| Revenues: | ||||||||||||
| Investment income – interest and dividends | $ | 501,653 | $ | 525,453 | $ | 535,963 | ||||||
| Net realized gain (loss) on investments | 35,834 | 77,895 | (152,026 | ) | ||||||||
| Rental income | 812,951 | 772,123 | 765,134 | |||||||||
| Miscellaneous income | 220,497 | 77,074 | 385,058 | |||||||||
| Total | 1,570,935 | 1,452,545 | 1,534,129 | |||||||||
| Operating Expenses: | ||||||||||||
| Salaries, employee benefits and payroll taxes | 1,004,177 | 664,436 | 651,957 | |||||||||
| Office occupancy and operations | 213,547 | 236,954 | 239,176 | |||||||||
| Business development | 98,562 | 99,229 | 76,684 | |||||||||
| Taxes – other than payroll and income | 396,084 | 183,566 | 213,466 | |||||||||
| Professional and contract labor fees | 134,659 | 377,738 | 378,265 | |||||||||
| Other expenses | 269,300 | 246,375 | 198,788 | |||||||||
| Total | 2,116,329 | 1,808,298 | 1,758,336 | |||||||||
| Equity in Net Income of Affiliated Companies | 25,633,964 | 19,665,205 | 12,640,260 | |||||||||
| Income before Income Taxes | 25,088,570 | 19,309,452 | 12,416,053 | |||||||||
| Income Tax Benefit | (612,000 | ) | (206,000 | ) | (133,000 | ) | ||||||
| Net Income | 25,700,570 | 19,515,452 | 12,549,053 | |||||||||
| Net Loss (Income) Attributable to Noncontrolling Interests | 5,932 | 7,666 | (15,148 | ) | ||||||||
| Net Income Attributable to the Company | $ | 25,706,502 | $ | 19,523,118 | $ | 12,533,905 | ||||||
| Basic Earnings per Common Share | $ | 13.63 | $ | 10.23 | $ | 6.32 | ||||||
| Weighted Average Shares Outstanding – Basic | 1,886,354 | 1,907,675 | 1,984,360 | |||||||||
| Diluted Earnings per Common Share | $ | 13.56 | $ | 10.19 | $ | 6.30 | ||||||
| Weighted Average Shares Outstanding – Diluted | 1,895,871 | 1,915,057 | 1,989,799 | |||||||||
| Cash Dividends Paid per Common Share | $ | 3.75 | $ | 0.72 | $ | 0.40 | ||||||
| 2017 | 2016 | 2015 | |||||||||
| Operating Activities | |||||||||||
| Net income | $ | 25,700,570 | $ | 19,515,452 | $ | 12,549,053 | |||||
| Adjustments to reconcile net income to net cash (used in) provided by operating activities: | |||||||||||
| Equity in net earnings of subsidiaries | (25,633,964 | ) | (19,665,205 | ) | (12,640,260 | ) | |||||
| Depreciation | 97,407 | 93,086 | 112,690 | ||||||||
| Amortization, net | 157,674 | 163,989 | 192,654 | ||||||||
| Share-based compensation expense related to stock appreciation rights and options | 219,315 | 132,098 | 137,759 | ||||||||
| Net loss on disposals of property | 2,955 | — | 1,683 | ||||||||
| Net realized (gain) loss on investments | (35,834 | ) | (77,895 | ) | 152,026 | ||||||
| Net loss (earnings) from other investments | 4,994 | (13,135 | ) | (237,686 | ) | ||||||
| (Benefit) provision for deferred income taxes | (211,000 | ) | (18,000 | ) | 13,000 | ||||||
| Decrease (increase) in receivables | 362,233 | 1,037,423 | (847,177 | ) | |||||||
| (Increase) decrease in income taxes recoverable | (1,316,235 | ) | (796,982 | ) | 169,803 | ||||||
| (Increase) decrease in other assets | (111,816 | ) | 33,888 | 7,852 | |||||||
| (Decrease) increase in accounts payable and accrued liabilities | (454,710 | ) | (896,311 | ) | 1,192,927 | ||||||
| Net cash (used in) provided by operating activities | (1,218,411 | ) | (491,592 | ) | 804,324 | ||||||
| Investing Activities | |||||||||||
| Purchase of subsidiary | — | (10,918,003 | ) | — | |||||||
| Dividends received from subsidiaries | 14,816,379 | 17,330,948 | 7,630,835 | ||||||||
| Purchases of available-for-sale securities | (13,178,177 | ) | (1,783,223 | ) | (260,044 | ) | |||||
| Purchases of short-term securities | (5,835,325 | ) | (3,162,283 | ) | (2,721,578 | ) | |||||
| Purchases of and net earnings from other investments | (1,049,680 | ) | (1,552,769 | ) | (2,007,798 | ) | |||||
| Proceeds from sales and maturities of available-for-sale securities | 6,616,875 | 6,815,907 | 2,475,557 | ||||||||
| Proceeds from sales and maturities of short-term securities | 3,188,641 | 3,005,647 | — | ||||||||
| Proceeds from sales and distributions of other investments | 195,881 | 321,758 | 734,170 | ||||||||
| Purchases of property | (13,623 | ) | (144,915 | ) | (32,071 | ) | |||||
| Net cash provided by investing activities | 4,740,971 | 9,913,067 | 5,819,071 | ||||||||
| Financing Activities | |||||||||||
| Repurchases of common stock | (244,831 | ) | (6,219,670 | ) | (5,483,953 | ) | |||||
| Exercise of stock appreciation rights and options | (737 | ) | (200 | ) | 54,988 | ||||||
| Proceeds from note payable | — | 6,000,000 | — | ||||||||
| Payments on note payable | — | (6,000,000 | ) | — | |||||||
| Capital contribution to subsidiary | (510,000 | ) | — | — | |||||||
| Dividends paid | (7,073,210 | ) | (1,370,390 | ) | (789,907 | ) | |||||
| Net cash used in financing activities | (7,828,778 | ) | (7,590,260 | ) | (6,218,872 | ) | |||||
| Net (Decrease) Increase in Cash and Cash Equivalents | (4,306,218 | ) | 1,831,215 | 404,523 | |||||||
| Cash and Cash Equivalents, Beginning of Period | 10,178,219 | 8,347,004 | 7,942,481 | ||||||||
| Cash and Cash Equivalents, End of Period | $ | 5,872,001 | $ | 10,178,219 | $ | 8,347,004 | |||||
| Supplemental Disclosures: | |||||||||||
| Income tax payments, net | $ | 11,447,000 | $ | 4,964,000 | $ | 4,598,000 | |||||
| Subsidiaries | 2017 | 2016 | 2015 | ||||||||
| Investors Title Insurance Company, net* | $ | 13,236,379 | $ | 15,838,248 | $ | 7,134,823 | |||||
| Investors Title Exchange Corporation | 300,000 | 100,000 | 245,000 | ||||||||
| Investors Title Accommodation Corporation | 80,000 | 45,000 | 12,000 | ||||||||
| Investors Capital Management Company | — | — | 9,012 | ||||||||
| Investors Trust Company | 200,000 | 750,000 | — | ||||||||
| Investors Title Commercial Agency, LLC | 150,000 | 125,000 | 230,000 | ||||||||
| National Investors Holdings, LLC | 850,000 | 472,700 | — | ||||||||
| Total | $ | 14,816,379 | $ | 17,330,948 | $ | 7,630,835 | |||||
| Segment | Deferred Policy Acquisition Cost | Future Policy Benefits, Losses, Claims and Loss Expenses | Unearned Premiums | Other Policy Claims and Benefits Payable | Premium Revenue | Net Investment Income | Benefits, Claims. Losses and Settlement Expenses | Amortization of Deferred Policy Acquisition Costs | Other Operating Expenses | Premiums Written | |||||||||||||||||||||||||||
| Year Ended December 31, 2017 | |||||||||||||||||||||||||||||||||||||
| Title Insurance | $ | — | $ | 34,801,000 | $ | — | $ | 537,379 | $ | 138,588,877 | $ | 3,898,342 | $ | 3,311,080 | $ | — | $ | 120,247,790 | N/A | ||||||||||||||||||
| All Other | — | — | — | — | — | 546,105 | — | — | 7,819,856 | N/A | |||||||||||||||||||||||||||
| $ | — | $ | 34,801,000 | $ | — | $ | 537,379 | $ | 138,588,877 | $ | 4,444,447 | $ | 3,311,080 | $ | — | $ | 128,067,646 | N/A | |||||||||||||||||||
| Year Ended December 31, 2016 | |||||||||||||||||||||||||||||||||||||
| Title Insurance | $ | — | $ | 35,305,000 | $ | — | $ | 475,700 | $ | 120,569,151 | $ | 4,119,598 | $ | 242,953 | $ | — | $ | 103,585,220 | N/A | ||||||||||||||||||
| All Other | — | — | — | — | — | 564,891 | — | — | 6,532,789 | �� | N/A | ||||||||||||||||||||||||||
| $ | — | $ | 35,305,000 | $ | — | $ | 475,700 | $ | 120,569,151 | $ | 4,684,489 | $ | 242,953 | $ | — | $ | 110,118,009 | N/A | |||||||||||||||||||
| Year Ended December 31, 2015 | |||||||||||||||||||||||||||||||||||||
| Title Insurance | $ | — | $ | 37,788,000 | $ | — | $ | 341,191 | $ | 111,909,473 | $ | 3,957,187 | $ | 4,478,494 | $ | — | $ | 98,417,207 | N/A | ||||||||||||||||||
| All Other | — | — | — | — | — | 574,132 | — | — | 6,527,318 | N/A | |||||||||||||||||||||||||||
| $ | — | $ | 37,788,000 | $ | — | $ | 341,191 | $ | 111,909,473 | $ | 4,531,319 | $ | 4,478,494 | $ | — | $ | 104,944,525 | N/A | |||||||||||||||||||
| Gross Amount | Ceded to Other Companies | Assumed from Other Companies | Net Amount | Percentages of Amount Assumed to Net | ||||||||||||||
| Year Ended December 31, 2017 | ||||||||||||||||||
| Title Insurance | $ | 138,850,280 | $ | 264,159 | $ | 2,756 | $ | 138,588,877 | — | % | ||||||||
| Year Ended December 31, 2016 | ||||||||||||||||||
| Title Insurance | $ | 120,692,847 | $ | 140,942 | $ | 17,246 | $ | 120,569,151 | 0.01 | % | ||||||||
| Year Ended December 31, 2015 | ||||||||||||||||||
| Title Insurance | $ | 112,090,537 | $ | 214,667 | $ | 33,603 | $ | 111,909,473 | 0.03 | % | ||||||||
| Description | Balance at Beginning of Period | Additions Charged to Costs and Expenses | Additions Charge to Other Accounts – Describe | Deductions – Describe | Balance at End of Period | |||||||||||||||
| 2017 | ||||||||||||||||||||
| Premiums Receivable: | ||||||||||||||||||||
| Valuation Provision | $ | 372,172 | $ | 5,783,429 | $ | — | $ | (5,779,869 | ) | (a) | $ | 375,732 | ||||||||
| Reserves for Claims | $ | 35,305,000 | $ | 3,311,080 | $ | — | $ | (3,815,080 | ) | (b) | $ | 34,801,000 | ||||||||
| 2016 | ||||||||||||||||||||
| Premiums Receivable: | ||||||||||||||||||||
| Valuation Provision | $ | 3,552,779 | $ | 2,679,300 | $ | — | $ | (5,859,907 | ) | (a) | $ | 372,172 | ||||||||
| Reserves for Claims | $ | 37,788,000 | $ | 242,953 | $ | — | $ | (2,725,953 | ) | (b) | $ | 35,305,000 | ||||||||
| 2015 | ||||||||||||||||||||
| Premiums Receivable: | ||||||||||||||||||||
| Valuation Provision | $ | 3,022,731 | $ | 6,267,911 | $ | — | $ | (5,737,863 | ) | (a) | $ | 3,552,779 | ||||||||
| Reserves for Claims | $ | 36,677,000 | $ | 4,478,494 | $ | — | $ | (3,367,494 | ) | (b) | $ | 37,788,000 | ||||||||