UNITED STATES
SECURITIES AND EXCHANGE COMMISSION
Washington, D.C. 20549
FORM 10-K10-K/A
(Amendment No. 1)
| | | | | | | | |
| x | Annual report pursuant to Section 13 or 15(d) of the Securities Exchange Act of 1934. |
| | |
| For the fiscal year ended | December 31, 20212023 |
| | |
| o | Transition report pursuant to Section 13 or 15(d) of the Securities Exchange Act of 1934. |
| | |
| Commission file number | 000-50254 |
| | | | | | | | | | | |
| LAKE AREA CORN PROCESSORS, LLC |
| (Exact name of registrant as specified in its charter) |
| |
| South Dakota | | 46-0460790 |
(State or other jurisdiction of
incorporation or organization) | | (I.R.S. Employer Identification No.) |
| |
46269 SD Highway 34, P.O. Box 100, Wentworth, South Dakota 5705757075
(Address of principal executive offices)
(605) 483-2676
(Registrant's telephone number, including area code)
Securities registered pursuant to Section 12(b) of the Act: None
| | | | | | | | |
| Title of each class | Trading Symbol(s) | Name of each exchange on which registered |
| | |
Securities registered pursuant to Section 12(g) of the Act: Membership Units
Indicate by check mark if the registrant is a well-known seasoned issuer, as defined in Rule 405 of the Securities Act.
o Yes x No
Indicate by check mark if the registrant is not required to file reports pursuant to Section 13 or Section 15(d) of the Act.
o Yes x No
Indicate by check mark whether the registrant: (1) has filed all reports required to be filed by Section 13 or 15(d) of the Securities Exchange Act of 1934 during the preceding 12 months (or for such shorter period that the registrant was required to file such reports), and (2) has been subject to such filing requirements for the past 90 days. x Yes o No
Indicate by check mark whether the registrant has submitted electronically every Interactive Data File required to be submitted pursuant to Rule 405 of Regulation S-T (§232.405 of this chapter) during the preceding 12 months (or for such shorter period that the registrant was required to submit such files). x Yes o No
Indicate by check mark whether the registrant is a large accelerated filer, an accelerated filer, a non-accelerated filer, a smaller reporting company or an emerging growth company. See the definitions of "large accelerated filer," "accelerated filer," "smaller reporting company" and "emerging growth company" in Rule 12b-2 of the Exchange Act.
| | | | | | | | | | | | | | |
| Large accelerated filer | o | | Accelerated filer | o |
| Non-accelerated filer | x | | Smaller Reporting Company | o |
| | | Emerging Growth Company | o |
If an emerging growth company, indicate by check mark if the registrant has elected not to use the extended transition period for complying with an new or revised financial accounting standards provided pursuant to Section 13(a) of the Exchange Act.
o
Indicate by check mark whether the registrant has filed a report on and attestation to its management's assessment of the effectiveness of its internal control over financial reporting under Section 404(b) of the Sarbanes-Oxley Act (15 U.S.C. 7262(b)) by the registered public accounting firm that prepared or issued its audit report. o
If securities are registered pursuant to Section 12(b) of the Act, indicate by check mark whether the financial statements of the registrant included in the filing reflect the correction of an error to previously issued financial statements. o
Indicate by check mark whether any of those error corrections are restatements that required a recovery analysis of incentive-based compensation received by an of the registration's executive officers during the relevant recovery period pursuant to §240.10D-1(b). o
Indicate by check mark whether the registrant is a shell company (as defined in Rule 12b-2 of the Act). o Yes x No
As of June 30, 2021,2023, the last day of the registrant's most recently completed second fiscal quarter, the aggregate market value of the registrant's membership units held by non-affiliates of the registrant was $14,293,875 computed(computed by reference to the most recent public offering price on Form S-4.of such membership units of $0.50) was $14,137,375.
As of March 3, 2022,7, 2024, there were 29,620,000 membership units of the registrant outstanding.
DOCUMENTS INCORPORATED BY REFERENCE
The registrant has incorporated by reference into Part III of this Annual Report on Form 10-K portions of its definitive information statement to be filed with the Securities and Exchange Commission within 120 days after the close of the fiscal year covered by this Annual Report (December 31, 2021)2023). This information statement is referred to in this report as the 20222024 Information Statement.
EXPLANATORY NOTE
Lake Area Corn Processors, LLC (the “Company”) is filing this Amendment No. 1 on Form 10-K/A (the “Amended 10-K”) to amend the Company’s annual report on Form 10-K for the fiscal year ended December 31, 2023 (the “Original 10-K”), originally filed with the Securities and Exchange Commission (the “SEC”) on March 7, 2024. The amendment needed is contained in Item 8-Financial Statements and Supplementary Data. The changes are limited solely to financial footnote 14, “Parent Financial Statements” in which the distributions to members line item contained in the Unconsolidated Statements of Cashflows for the year ended December 31, 2023 is corrected from 123 to (14,935,970) consistent with the basic financial statement cash flow. The corresponding subtotals and ending cash were also updated to reflect this correction. Such numbers were inadvertently and mistakenly changed just prior to filing.
Except as described above, no other amendments are being made to the Original 10-K. This Amended 10-K does not reflect events occurring after the filing of the Original 10-K or modify or update the disclosure contained therein in any way other than as required to reflect the amendments discussed above.
The Company has attached to this Amended 10-K updated certifications executed as of the date of this Amended 10-K by the Principal Executive Officer and Principal Financial Officer as required by Sections 302 and 906 of the Sarbanes Oxley Act of 2002. These updated certifications are attached as Exhibits 31.1/31 .2 and 32.1/32.2 to this Amended 10-K.
CAUTIONARY STATEMENTS REGARDING FORWARD-LOOKING STATEMENTS
This annual report contains historical information, as well as forward-looking statements that involve known and unknown risks and relate to future events, our future financial performance, or our expected future operations and actions. In some cases, you can identify forward-looking statements by terms such as "may," "will," "should," "expect," "plan," "anticipate," "believe," "estimate," "future," "intend," "could," "hope," "predict," "target," "potential," or "continue" or the negative of these terms or other similar expressions. These forward-looking statements are only our predictions based upon current information and involve numerous assumptions, risks and uncertainties. Our actual results or actions may differ materially from these forward-looking statements for many reasons, including the reasons described in this report. While it is impossible to identify all such factors, factors that could cause actual results to differ materially from those estimated by us include:
•A slowdown in global and regional economic activity, demand for our products and the potential for labor shortages and shipping disruptions resulting from pandemics including COVID-19;
•Reductions in the corn-based ethanol use requirement in the Federal Renewable Fuels Standard;
•The impact of small refinery exemptions from the RFS which have reduced ethanol demand;
•Oversupply in the ethanol industry resulting in lower market ethanol prices;
•Negative operating margins which result from lower ethanol prices;
•Lower ethanol prices due to the Chinese and Brazilian ethanol tariffs;
•Lower distillers grains prices due to the Chinese anti-dumping and countervailing duty tariffs;
•Lower gasoline prices may negatively impact ethanol prices which could hurt our profitability;
•Availability and costs of raw materials, particularly corn and natural gas;
•Changes in the price and market for ethanol, distillers grains and corn oil;
•Our ability to maintain liquidity and maintain our risk management positions;
•Changes in the availability and cost of credit;
•Changes and advances in ethanol production technology;
•The effectiveness of our risk management strategy to offset increases in the price of our raw materials and decreases in the prices of our products;
•Overcapacity within the ethanol industry causing supply to exceed demand;
•Our ability to market and our reliance on third parties to market our products;
•The decrease or elimination of governmental incentives which support the ethanol industry;
•Changes in the weather or general economic conditions impacting the availability and price of corn;
•Our ability to generate free cash flow to invest in our business and service our debt;
•Changes in plant production capacity or technical difficulties in operating the plant;
•Changes in our business strategy, capital improvements or development plans;
•Our ability to retain key employees and maintain labor relations;
•Our liability resulting from potential litigation;
•Global economic uncertainty, inflation, market disruptions, and increased volatility in commodity prices;
•Competition from alternative fuels and alternative fuel additives; and
•Other factors described elsewhere in this report.
The cautionary statements referred to in this section also should be considered in connection with any subsequent written or oral forward-looking statements that may be issued by us or persons acting on our behalf. We undertake no duty to update these forward-looking statements, even though our situation may change in the future. Furthermore, we cannot guarantee future results, events, levels of activity, performance, or achievements. We caution you not to put undue reliance on any forward-looking statements, which speak only as of the date of this report. You should read this report and the documents that we reference in this report and have filed as exhibits completely and with the understanding that our actual future results may be materially different from what we currently expect. We qualify all of our forward-looking statements by these cautionary statements.
PART I
ITEM 1. BUSINESS.
Overview
Lake Area Corn Processors, LLC is a South Dakota limited liability company that owns and manages an ethanol plant that has a nameplate production capacity of 90100 million gallons of ethanol per year through its wholly-owned subsidiary Dakota Ethanol, L.L.C. The ethanol plant currently produces at rates in excess of 9098 million gallons of ethanol per year. The ethanol plant is located near Wentworth, South Dakota. Lake Area Corn Processors, LLC is referred to in this report as "LACP," the "Company," "we," or "us." Dakota Ethanol, L.L.C. is referred to in this report as "Dakota Ethanol" or the "ethanol plant."
Since September 4, 2001, we have been engaged in the production of ethanol and distillers grains. Fuel grade ethanol is our primary product accounting for the majority of our revenue. We also sell distillers grains and corn oil, the principal co-products of the ethanol production process.
The ethanol industry experienced industry-wide record low ethanol prices throughout most of 2018 and 2019 due to reduced demand and high industry inventory levels. This continued into 2020 and the situation was compounded by the crisis associated with the 2019 novel coronavirus disease ("COVID-19"). In response to these unfavorable operating conditions and a slowdown in global and regional economic activity and a disruption in transportation fuel demand resulting from the COVID-19 pandemic, we reduced our ethanol production rate early in 2020 which impacted our total ethanol production for our 2020 fiscal year. The Company operated at full production capacity for our 2021 fiscal year.
General Development of Business
LACP was formed as a South Dakota cooperative on May 25, 1999. On August 20, 2002, our members approved a plan to reorganize into a South Dakota limited liability company. The reorganization became effective on August 31, 2002, and the assets and liabilities of the cooperative were transferred to the newly formed limited liability company. Following the reorganization, our legal name was changed to Lake Area Corn Processors, LLC.
Our ownership of Dakota Ethanol represents our primary asset and source of revenue. Since we operate Dakota Ethanol as a wholly-owned subsidiary, all net income generated by Dakota Ethanol is passed to LACP. We make distributions of the income received from Dakota Ethanol to our unit holders in proportion to the number of units held by each member.
We entered into a loan agreement with the Small Business Association through First State Bank, Gothenburg, NE on April 4, 2020 for $760,400 as part of the Paycheck Protection Program under Division A, Title I of the Coronavirus Aid, Relief and Economic Security Act (CARES Act). In June 2021, the Company received notification from the Small Business Administration that all loan proceeds and accrued interest received and recorded by the Company were forgiven. Due to forgiveness of the loan, the Company recorded a gain on debt extinguishment in other income in the statement of operations for $768,400 for the year ending December 31, 2021.
On October 11, 2021,September 27, 2023, we entered into a FourthFifth Amendment to ourthe credit agreement with Farm Credit Services of America, PCA and Farm Credit Services of America, FLCA ("Farm Credit") (the "Fourth"Fifth Amendment"). Under the FourthFifth Amendment, the operating lines' available credit increased to $20,000,000 and the maturity date was extended to November 1, 2025. Interest on the outstanding principal balance of the operating line will accrue at the SOFR 30 plus 300 basis points. The available credit on the reducing revolving note increased to $60,000,000 and the maturity was extended to November 1, 2030. Interest on the outstanding principal balance of the revolving loan and term loan will accrue at the SOFR 30 plus 325 basis points. The working capital covenant was increased to $13,500,000$15,000,000, and the net worth covenant was increased to $28,000,0000. The next measurement date for the debt service coverage ratio was deferred until December 31, 2021. The interest rates will be measured using the Secured Overnight Financing Rate (SOFR) 30-Day Average Rate.$30,000,0000. Dakota Ethanol may make distributions in an amount up to 75% of prior year's net income, so long as the Company's working capital stays above $18,000,000$20,000,000 post distribution. The combined distributions for 2021 and 2022 shall also be limited to 75% of the combined net income of 2020 and 2021.
During our 2019 fiscal year, we completed a plant expansion projectThrough the BioFuel Producer Program, the United States Department of Agriculture (the "USDA") is making up to $700,000,000.00 in direct payments available for biofuel producers who faced unexpected market losses due to the COVID-19 pandemic. The Company received payments from the USDA Biofuel Producer Program of $2,960,000 during 2023 and $1,200,000 during 2022 which expanded our production capacity to approximately 90 million gallonsare recorded in interest and other income on the statement of ethanol per year. The cost ofoperations for the expansion was approximately $36 million. As a result of the plant expansion project, results of our 2019 fiscal year were different from our more recent fiscal years.years ended December 31, 2023 and 2022.
Financial Information
Please refer to "Item 7 - Management's Discussion and Analysis of Financial Condition and Results of Operations" for information regarding our results of operations and "Item 8 - Financial Statements and Supplementary Data" for our audited consolidated financial statements.
Principal Products
The principal products produced at the ethanol plant are fuel grade ethanol, distillers grains and corn oil. The table below shows the approximate percentage of our total revenue which is attributed to each of our primary products for each of our last three fiscal years.
| | Product | Product | | Fiscal Year 2021 | | Fiscal Year 2020 | | Fiscal Year 2019 | Product | | Fiscal Year 2023 | | Fiscal Year 2022 | | Fiscal Year 2021 |
| Ethanol | Ethanol | | 79% | | 76% | | 78% | Ethanol | | 76% | | 74% | | 79% |
| Distillers Grains | Distillers Grains | | 16% | | 20% | | 18% | Distillers Grains | | 18% | | 19% | | 16% |
| Corn Oil | Corn Oil | | 5% | | 4% | | 4% | Corn Oil | | 6% | | 7% | | 5% |
Ethanol
Ethanol is ethyl alcohol, a fuel component made primarily from corn and various other grains. Ethanol is primarily used as: (i) an octane enhancer in fuels; (ii) an oxygenated fuel additive for the purpose of reducing ozone and carbon monoxide vehicle emissions; and (iii) a non-petroleum-based gasoline substitute. Ethanol produced in the United States is primarily used for blending with unleaded gasoline and other fuel products. Ethanol blended fuel is typically designated in the marketplace according to the percentage of the fuel that is ethanol, with the most common fuel blend being E10, which includes 10% ethanol. The United States Environmental Protection Agency ("EPA") has approved the use of gasoline blends that contain 15% ethanol, or E15, for use in all vehicles manufactured in model year 2001 and later. In addition, flexible fuel vehicles can use gasoline blends that contain up to 85% ethanol called E85.
An ethanol plant is essentially a fermentation plant. Ground corn and water are mixed with enzymes and yeast to produce a substance called "beer," which contains approximately 15% alcohol, 11% solids and 74% water. The "beer" is boiled to separate the water, resulting in ethyl alcohol, which is then dehydrated to increase the alcohol content. This product is then mixed with a certified denaturant, such as gasoline, to make the product unfit for human consumption which allows it to be sold commercially.
Distillers Grains
A principal co-product of the ethanol production process is distillers grains, a high protein, high-energy animal feed supplement primarily marketed to the dairy, poultry, swine and beef industry.industries. We primarily produce distillers grains in two forms, modified/wet distillers grains and dried distillers grains. Modified/wet distillers grains have a higher moisture content than dried distillers grains. Our modified/wet distillers grains are sold primarily in our local market because they have a shorter shelf life and are more expensive to transport than dried distillers grains.
Corn Oil
We separate a portion of the corn oil contained in our distillers grains which we market separately from our distillers grains. The corn oil that we produce is not food grade corn oil and therefore cannot be used for human consumption. The primary uses for the corn oil that we produce are animal feed, industrial uses and biodiesel production.
Principal Product Markets
Ethanol
The primary market for our ethanol isOver the domestic fuel blending market. However, the ethanol industry has focused on increasing ethanol exports. According to the U.S. Energy Information Administration,past fiscal year, Canada, India, Columbia, Switzerland, Philippines, PeruColombia, and the European UnionIndia were top destinations for ethanol exports in 2021. However, overall exportsexports. Colombia represented a new market for 2023 after virtually no imports previously. Exports of ethanol for thisthe 2022 period decreasedincreased significantly when compared to the same period last year duein 2021. Exports of ethanol for the 2023 period were slightly lower when compared to escalating trade barriersthe same period in 2022. Ethanol export demand is more unpredictable than domestic demand and the impacts of COVID-19.tends to fluctuate over time as it is subject to monetary and political forces in other nations. Tariffs implemented by Brazil and China on ethanol imported from the United States reducedhave had a negative effect on export demand from thesethose markets. Trade barriers with key markets may continue to take a tollTariffs imposed by China remain unchanged. In March 2022, Brazil suspended its tariff through the end of 2022 on ethanol export demand negativelyimported from the United States following a 10% reduction on the tariff in November 2021. In February 2023, Brazil reinstated the tariff at a rate of 16% through 2023, increasing to 18% in 2024. These tariffs will likely result in limited ethanol exports to Brazil in 2024 or 2025.
affecting domestic ethanol prices. Ethanol export demand is more unpredictable than domestic demand and tends to fluctuate throughout the year as it is subject to monetary and political forces in other nations. An example of this, the imposition of a tax on imported ethanol by Brazil created uncertainty as to the viability of that market for ethanol produced in the United States and has required the United States producers to seek out other markets for their products. During 2021, the United States did not export any ethanol to Brazil as a result of its tariff.
Ethanol is generally blended with gasoline before it is sold to the end consumer. Therefore, the primary purchasers of ethanol are fuel blending companies which mix the ethanol we produce with gasoline. As discussed below in the section entitled "Distribution of Principal Products," we have a third party marketer that sells all of our ethanol. Our ethanol marketer makes substantially all decisions regarding where our ethanol is sold.
Distillers Grains
Distillers grains are primarily used as animal feed. Distillers grains are typically fed to animals instead of other traditional animal feeds such as corn and soybean meal. Distillers grains exports have increased in recent years as distillers grains have become a more accepted animal feed. Currently, the United States ethanol industry exports a significant amount of distiller grains. According to the U.S. Grains Council,Renewable Fuels Association, during the 2020/20212022/2023 marketing year, the largest importers of United States distiller grains were Vietnam, the European Union,Mexico, South Korea, Mexico and Turkey.Vietnam.
During 2016, China began an anti-dumping and countervailing duty investigation related to distillers grains imported from the United States which contributed to a decline in distillers grains shipped to China. In January 2017, the Chinese finalized the anti-dumping and anti-subsidy duties. TheIn the beginning of 2023, China's Commerce Ministry announced that they will continue to impose anti-dumping duties rangerules on distiller grains imported from 42.2%the United States for an additional five years, keeping tariffs amounting to 53.7%, and the final anti-subsidy tariffs range from 11.2% to 12%.as much as 66% on distillers grains. The trade actions taken by the Chinese have resulted in declines in distillers grains demand and prices. The significant reduction in distillers grains exports to China requires United States distillers grains producers to seek out alternative markets.
We anticipate that the vast majority of our distillers grains will continue to be sold in the domestic market due to our plant's location. Further, management anticipates that we will continue to sell a large proportion of our distillers grains in the modified/wet form, which is marketed locally.
Corn Oil
The primary markets for corn oil are the industrial chemicals market, animal feeding market and the biodiesel production market. The biodiesel blenders' tax credit expiredwas scheduled to expire at the end of 2017.2022. However, on December 20, 2019,during 2022 the biodiesel blenders' tax credit was reinstated retroactively for 2018 and 2019 after it expired at the end of 2017, and a forward looking extension was included for the years 2020, 2021, and 2022.extended through 2024. Since corn oil can be used as a feedstock to produce biodiesel, when biodiesel production increases it has a positive impact on corn oil prices. Further, recent increases in oil demand from the renewable diesel market has significantly increased market corn oil prices. The market for corn oil is expected to continue to shift as changes in supply and demand of corn oil interact. Our corn oil is primarily marketed in the United States, and we do not expect that significant exports of corn oil will occur in the near future.
Distribution of Principal Products
Ethanol Distribution
We have an ethanol marketing agreement with RPMG, Inc. ("RPMG"), a professional third party marketer, which is the sole marketer of our ethanol. We are an equity owner of Renewable Products Marketing Group, LLC ("RPMG, LLC"), the parent company of RPMG, which allows us to realize favorable marketing fees in the sale of our ethanol, distillers grains and corn oil. Our ethanol marketing agreement provides that we can sell our ethanol either through an index arrangement or at a fixed price agreed to between us and RPMG. The term of our ethanol marketing agreement is perpetual, until it is terminated according to the terms of the agreement. The primary reasons our ethanol marketing agreement would terminate are if we cease to be an owner of RPMG, LLC, if there is a breach of our ethanol marketing agreement which is not cured, or if we give advance notice to RPMG that we wish to terminate our ethanol marketing agreement. Notwithstanding our right to terminate our ethanol marketing agreement, we may be obligated to continue to market our ethanol through RPMG for a period of time after termination. Further, following termination we agreed to accept an assignment of certain railcar leases which RPMG has secured to service our ethanol sales. If our ethanol marketing agreement is terminated, it would trigger a redemption by RPMG, LLC of our ownership interest in RPMG, LLC.
Distillers Grains Distribution
Other than the modified/wet distillers grains that we market locally without a third party marketer, our distillers grains are marketed by RPMG. Our distillers grains marketing agreement with RPMG automatically renews for additional one-year terms unless notice of termination is given as provided by the distillers grains marketing agreement. We pay RPMG a commission based on each ton of distillers grains sold by RPMG.
We market a portion of our modified/wet distillers grains to our local market without the use of an external marketer. Currently, we market approximately 65%70%, based on volume, of our distillers grains internally. Shipments of these products are made to local markets by truck. This has allowed us to sell less distillers grains in the form of dried distillers grains which has decreased our natural gas usage and improved our margins from the sale of distillers grains.
Corn Oil Distribution
We market all of our corn oil through RPMG. Our corn oil marketing agreement automatically renews for additional one year terms unless either party gives 180 days notice that the agreement will not be renewed. We pay RPMG a commission based on each pound of our corn oil that is sold by RPMG.
New Products and Services
We did not introduce any new products or services during our 20212023 fiscal year.
Patents, Trademarks, Licenses, Franchises and Concessions
We do not currently hold any patents, trademarks, franchises or concessions. We were granted a license by Broin and Associates, Inc. ("Broin"), the company that designed and built the ethanol plant, to use certain ethanol production technology necessary to operate our ethanol plant. The cost of the license granted by Broin was included in the amount we paid Broin to design and build our ethanol plant.
Sources and Availability of Raw Materials
Corn Feedstock Supply
The major raw material required for our ethanol plant to produce ethanol, distillers grains and corn oil is corn. The plant operates at a rate in excess of its nameplate capacity of 90100 million gallons of ethanol per year. We anticipate using approximately 3134 million bushels of corn.corn annually. The area surrounding the ethanol plant usually provides an ample supply of corn to meet and exceed our raw material requirements for the production capacity of the plant.
Corn prices have been volatile in recent years due to changes in corn demand as well as yield and production fluctuations that have had a significant impact on corn prices. High corn prices have a negative effect on our operating margins unless the price of ethanol and distillers grains outpaces rising corn prices. We could experience a drought or other unfavorable weather conditions during our 20222024 fiscal year which could impact the price we pay for corn and could negatively impact the availability of corn near our plant. If we experience a localized shortage of corn, we may be forced to purchase corn from producers located farther away from our ethanol plant which can increase our transportation costs. In addition, if new corn customers enter the market, it can increase demand for corn which could result in higher corn prices. Since corn is the primary raw material we use to produce our products, the availability and cost of corn can have a significant impact on the profitability of our operations.
Corn prices were lower during the fiscal year ended December 31, 2023 compared to the same period in 2022, primarily due to supply shortage concerns which drove prices higher during the 2022 period and increased corn production during the 2023 period. On November 9, 2022, the United States Department of Agriculture ("USDA") released a report estimating the 2022 national corn crop at approximately 13.9 billion bushels, down 8% from 2021, with yields averaging 172.3 bushels per acre. On September 12, 2023, the USDA released a report estimating the 2023 corn crop in the United States at approximately 15.1 billion bushels, up 10% from last year's production, with yields averaging 173.8 bushels per acre. The USDA also reported area harvested for grain at 94.9 million acres. Weather conditions, world supply and demand, current anticipated corn stocks, agricultural policy and other factors can all contribute to volatility in corn prices.
Corn is supplied to us primarily from our members who are local agricultural producers and from purchases of corn on the open market. We anticipate purchasing corn from third parties should our members fail to supply us with enough corn to operate the ethanol plant at capacity. We do not currently anticipate experiencing difficulty purchasing the corn we require to operate the ethanol plant.
We have an agreement with John Stewart & Associates ("JSA") to provide us with consulting services related to our risk management strategy. We pay JSA a fee of $2,500 per month to assist us in making risk management decisions regarding our commodity purchases. The agreement renews on a month-to-month basis.
Natural Gas
Natural gas is an important input to our manufacturing process. We purchase our natural gas on the open market and the price for our natural gas is based on market rates. We have a contract with Northern Natural Gas for the interstate transportation of our natural gas. We contract with NorthWestern Energy for the local transportation of our natural gas. BothOur contracts with Northern Natural Gas and NorthWestern Energy both expire in 2028. We have had no interruptions or shortages in the supply of natural gas to the plant since operations commenced in 2001. We anticipate that we will be able to purchase sufficient natural gas to continue to operate the ethanol plant during our 20222024 fiscal year.
Electricity
Electricity is necessary for lighting and powering much of the machinery and equipment used in the production process. We contract with Sioux Valley Energy, Inc. to provide all of the electric power and energy requirements for the ethanol plant. We have had no interruptions or shortages in the supply of electricity to the plant since operations commenced in 2001.
Water
Water is a necessary part of the ethanol production process. It is used in the fermentation process and to produce steam for the cooking, evaporation, and distillation processes. We contract with Big Sioux Community Water System, Inc. to meet our water requirements. Our current agreement with Big Sioux was modified in February 2020 and expires in 2025. Since our operations commenced in September 2001, we have had no interruption in the supply of water and all of our requirements have been met.
Seasonal Factors in Business
We experience some seasonality of demand for our ethanol, distillers grains and corn oil. Since ethanol is predominantly blended with gasoline for use in automobiles, ethanol demand tends to shift in relation to gasoline demand. As a result, we experience some seasonality of demand for ethanol in the summer months related to increased driving and, as a result, increased gasoline demand. In addition, we experience some increased ethanol demand during holiday seasons related to increased gasoline demand. We also experience decreased distillers grains demand during the summer months due to natural depletion in the size of herds at cattle feed lots. Further, we expectexperience some seasonality of demand for our corn oil since the biodiesel industry is a major corn oil user and biodiesel plants typically reduce production during the winter months. We experience some seasonality in the price we pay for natural gas with premium pricing during the winter months. This increase in natural gas prices coincides with increased natural gas demand for heating needs in the winter months.
Working Capital
We primarily use our working capital for purchases of raw materials necessary to operate the ethanol plant, payments on our credit facilities, distributions to our members and capital expenditures to maintain and upgrade the ethanol plant. Our primary sources of working capital are income from our operations and investments as well as our revolving lines of credit with our primary lender, Farm Credit.FCSA. For our 20222024 fiscal year, we anticipate using cash from our operations and our credit facilities to maintain our current plant infrastructure. Management believes that our current sources of working capital are sufficient to sustain our operations for our 20222024 fiscal year and beyond.
Dependence on One or a Few Major Customers
As discussed above, we have marketing agreements with RPMG to market our ethanol, distillers grains and corn oil. Therefore, we rely on RPMG to market almost all of our products, except for the modified/wet distillers grains that we market locally. Our financial success will be highly dependent on RPMG's ability to market our products at competitive prices. Any loss of RPMG as our marketing agent or any lack of performance under these agreements or inability to secure competitive prices could have a significant negative impact on our revenues. While we believe we can secure new marketers if RPMG were to fail, we may not be able to secure such new marketers at rates which are competitive with RPMG's.
Our Competition
Ethanol Competition
We are in direct competition with numerous ethanol producers in the sale of our products and with respect to raw material purchases related to those products. Many of the ethanol producers with which we compete have greater resources than we do. While management believes we are a lower cost producer of ethanol, larger ethanol producers may be able to take advantage of economies of scale due to their larger size and increased bargaining power with both ethanol, distillers grains and corn oil customers and raw material suppliers. As of December 31, 2021,February 24, 2024, the Renewable Fuels Association estimates that there are 210approximately 200 ethanol production facilities in the United States with capacity to produce approximately 17.47617.807 billiongallons of ethanol per year. The largest ethanol producers include Archer Daniels Midland, Green Plains Renewable Energy, POET Biorefining, and Valero Renewable Fuels, each of which is capable of producing significantly more ethanol than we produce.
The following table identifies the largest ethanol producers in the United States along with their production capacities.
U.S. FUEL ETHANOL PRODUCTION CAPACITY
BY TOP PRODUCERS
Producers of Approximately 800
million gallons per year (MMgy) or more
| | | | | | | | | | | | | | |
| Company | | Current Capacity
(MMgy) | | Percent of Total |
| Archer Daniels Midland | | 1,674 | | 9.6% |
| POET Biorefining | | 2,648 | | 15.2% |
| Green Plains Renewable Energy | | 934 | | 5.3% |
| Valero Renewable Fuels | | 1,740 | | 10.0% |
Updated: December 31, 2021 | | | | | | | | | | | | | | |
| Company | | Current Capacity
(MMgy) | | Percent of Total |
| Archer Daniels Midland | | 1,613 | | 9.1% |
| Green Plains Renewable Energy | | 903 | | 5.1% |
| POET Biorefining | | 3,005 | | 16.9% |
| Valero Renewable Fuels | | 1,642 | | 9.2% |
The products that we produce are commodities. Since our products are commodities, there are typically no significant differences between the products we produce and the products of our competitors that would allow us to distinguish our products in the market. As a result, competition in the ethanol industry is primarily based on price and consistent fuel quality.
A number of automotive, industrial and power generation manufacturers are developing alternative clean power systems using fuel cells, plug-in hybrids, electric cars or clean burning gaseous fuels. Electric car technology has recently grown in popularity, especially in urban areas, and continuescontinue to represent a source of competition for the ethanol industry. While there are currently a limited number of vehicle recharging stations, making electric carscar ownership not feasible for all consumers, there has been increased development of these recharging stations which is making this technology more widely available.accessible. Additional competition from these other sources of alternative energy, particularly in the automobile market, could reduce the demand for ethanol, which would negatively impact our profitability.
In addition to domestic producers of ethanol, we face competition from ethanol produced in foreign countries, particularly Brazil. Ethanol imports have been lower in recent years and ethanol exports have been higher. As of May 1, 2013, Brazil increased its domestic ethanol use requirement from 20% to 25% which decreased the amount of ethanol available in Brazil for export. Further, in August 2017, Brazil instituted a quota and tariff on ethanol produced in the United States and exported to Brazil which reduced exports to Brazil. Brazil increased the quota during our 2019 fiscal year which resulted in additional demand from Brazil, however, without this quota and tariff, Brazilian exports likely would have been higher. In December 2020, the Brazilian quota expired so all ethanol produced in the United States and exported to Brazil is now subject to Brazil's import tariff which resulted in no ethanol exports to Brazil during 2021.
Competition among ethanol producers may continue to increase as gasoline demand decreases due to more fuel efficient vehicles being produced. If the concentration of ethanol used in most gasoline does not increase and gasoline demand is lower due to increased fuel efficiency by the vehicles operated in the United States, competition may increase among ethanol producers to supply the ethanol market.
Distillers Grains Competition
Our ethanol plant competes with other ethanol producers in the production and sales of distillers grains. Distillers grains are primarily used as an animal feed supplement which replaces corn and soybean meal. As a result, we believe that
distillers grains prices are positively impacted by increases in corn and soybean prices. In addition, in recent years the United States ethanol industry has increased exports of distillers grains which management believes has positively impacted demand and prices for distillers grains in the United States. In the event these distillers grains exports decrease, including as a result of the Chinese tariffs which have significantly reduced export demand for distillers grains, it could lead to an oversupply of distillers grains in the United States. An oversupply of distillers grains could result in increased competition among ethanol producers for sales of distillers grains which could negatively impact market distillers grains prices in the United States.
Corn Oil Competition
We compete with many ethanol producers for the sale of corn oil. Many ethanol producers have installed the equipment necessary to separate corn oil from the distillers grains they produce which has increased competition for corn oil sales.
Governmental Regulation
Federal Ethanol Supports
The ethanol industry is dependent on several economic incentives to produce ethanol, the most significant of which is the Federal Renewable Fuels Standard (the "RFS"). The RFS requires that in each year, a certain amount of renewable fuels must be used in the United States. The RFS is a national program that does not require that any renewable fuels be used in any particular area or state, allowing refiners to use renewable fuel blends in those areas where it is most cost-effective. The RFS statutory volume requirement increasesincreased incrementally each year until the United States iswas required to use 36 billion gallons of renewable fuels by 2022. After 2022, the EPA has authority to establish the RFS for subsequent years. Starting in 2009, the RFS required that a portion of the RFS must be met by certain "advanced" renewable fuels. These advanced renewable fuels include ethanol that is not made from corn, such as cellulosic ethanol and biomass based biodiesel. The use of these advanced renewable fuels increases each year as a percentage of the total renewable fuels required to be used in the United States.
The EPA has the authority to waiveset the RFS statutory volume requirement, in whole or in part, provided one of the following two conditions have been met: (1) there is inadequate domestic renewable fuel supply; or (2) implementation of the requirement would severely harm the economy or environment of a state, region or the United States.requirement. Annually, the EPA is required to pass a rule that establishes the number of gallons of conventional and advanced renewable fuels that must be used in the United States which is called the renewable volume obligations (RVO). In previous years, the EPA granted small refinery exemptions from the RFS while not using its authority to waive the RFS statutory volume requirements. These small refinery exemptions created unallocated gallons reducing the corn-based conventional biofuel RFS requirements by 2.25 billion gallons in 2018 and 2 billion gallons in 2019. These small refinery exemptions had a significant negative impact on domestic demand for ethanol and have resulted in negative operating margins in the ethanol industry.
On November 30, 2018, the final RVO for 2019 was set at 19.29 billion gallons and the corn-based ethanol RVO was set at 15 billion gallons. However, the EPA did not address small refinery exemptions in its 2019 RVO release. In addition, the EPA did not address the reallocation of 500 million gallons from the 2016 RVO which was ordered by a federal court in a recent lawsuit. In June 2019, the EPA proposed an RVO of 20.04 billion gallons and the corn-based ethanol RVO was set at 15 billion gallons. On December 19, 2019, the final RVO for 2020 was set at 20.09 billion gallons and the corn-based ethanol RVO was set at 15 billion gallons. On December 7, 2021, the EPA proposed RVOs for 2021 and 2022 along with a proposed reduction to the 2020 RVO. For 2022, the EPA proposed a 15 billion gallon RVO for corn-based ethanol. The EPA proposed a 13.3 billion gallon RVO for corn-based ethanol in 2021, a reduction from the statutory corn-based ethanol RVO of 15 billion gallons. Finally, the EPA is proposing reducing the RVO for 2020 by 2.5 billion gallons. The ethanol industry has been pushing the EPA to reverse the effects of these small refinery waivers which we believe are the reason for the poor operating margins during 2018 and 2019. In January 2020, the Tenth Circuit Court of Appeals ruled that small refinery exemptions may only be granted to refineries that had secured them continuously each year since 2010. Consistent with this ruling, in September 2020, the EPA denied certain small refinery exemption petitions filed by oil refineries in 2020 seeking retroactive relief from their ethanol use requirements for prior years. This ruling was recentlyHowever, in June 2021, the U.S. Supreme Court partially reversed the decision finding that a small refinery may obtain a hardship exemption even if its earlier exemption had lapsed in one or more previous years. In June 2022, the EPA announced the denial of 69 small refinery exemption petitions for one or more compliance years between 2016 and 2021 on the grounds that the petitioners had failed to provideshow that smaller refiners who have allowed their exemptionthe EPA had a basis to lapse can reapply.approve them.
In July 2022, the EPA retroactively reduced the RVO for total renewable fuel for 2020 to 17.13 billion gallons. The portion that could be met by corn-based ethanol was reduced to 12.50 billion for 2020. The EPA indicated that the reason for this retroactive change was due to program and market challenges, including those related to the COVID-19 pandemic. In addition, the EPA set the RVO for total renewable fuel for 2021 at 18.84 billion gallons and for 2022 at 20.63 billion gallons. The portion that could be met by corn-based ethanol was 13.79 billion for 2021 and 15 billion gallons for 2022. The EPA also added a 250 million gallon supplemental obligation in 2022 and stated its intention to do the same for 2023. On December 1, 2022, the EPA proposed to set the RVO for total renewable fuel for 2023 to 20.82 billion gallons, for 2024 to 21.87 billion gallons and for 2025 to 22.68 billion gallons. The portion that could be met by corn-based ethanol would be 15 billion gallons for 2023 and would then increase to 15.25 billion gallons in 2024 and 2025. Public hearings for the proposed rules were held in January 2023. In June 2023, the EPA released the final rule which set the RVO for total renewable fuel for 2023, 2024, and 2025 as 20.94 billion gallons, 21.54 billion gallons, and 22.33 billion gallons, respectively.
In February 2010, the EPA issued new regulations governing the RFS. These new regulations are called RFS2. The most controversial part of RFS2 involves what is commonly referred to as the lifecycle analysis of greenhouse gas emissions. Specifically, the EPA adopted rules to determine which renewable fuels provided sufficient reductions in greenhouse gases, compared to conventional gasoline, to qualify under the RFS program. RFS2 establishes a tiered approach, where regular renewable fuels are required to accomplish a 20% greenhouse gas reduction compared to gasoline, advanced biofuels and biomass-based biodiesel must accomplish a 50% reduction in greenhouse gases, and cellulosic biofuels must accomplish a 60%
reduction in greenhouse gases. Any fuels that fail to meet this standard cannot be used by fuel blenders to satisfy their obligations under the RFS program. The scientific method of calculating these greenhouse gas reductions has been a contentious issue. Many in the ethanol industry were concerned that corn based ethanol would not meet the 20% greenhouse gas reduction requirement based on certain parts of the environmental impact model that many in the ethanol industry believed was scientifically suspect. However, RFS2 as adopted by the EPA provides that corn-based ethanol from modern ethanol
production processes does meet the definition of a renewable fuel under the RFS program. Our ethanol plant was originally grandfathered into the RFS up to a certain operating capacity due to the fact that it was constructed prior to the effective date of the lifecycle greenhouse gas requirement and is not requiredbut the recent plant expansion requires us to prove compliance withmeet the lifecyclethreshold reduction in greenhouse gas reductions.(GHG) emissions to produce ethanol eligible for the RFS2 mandate. Many in the ethanol industry are concerned that certain provisions of RFS2 as adopted may disproportionately benefit ethanol produced from sugarcane which could make sugarcane based ethanol, which is primarily produced in Brazil, more competitive in the United States ethanol market. If this were to occur, it could reduce demand for the ethanol that we produce.
Most ethanol that is used in the United States is sold in a blend called E10. E10 is a blend of 10% ethanol and 90% gasoline. E10 is approved for use in all standard vehicles. Estimates indicate that gasoline demand in the United States is approximately 143135 billion gallons per year. Assuming that all gasoline in the United States is blended at a rate of 10% ethanol and 90% gasoline, the maximum demand for ethanol is 14.313.5 billion gallons per year. This is commonly referred to as the "blend wall," which represents a theoretical limit where more ethanol cannot be blended into the national gasoline pool. This is a theoretical limit because it is believed that it would not be possible to blend ethanol into every gallon of gasoline that is being used in the United States and it discounts the use of higher percentage blends such as E15 or E85. These higher percentage blends may lead to additional ethanol demand if they become more widely available and accepted by the market.
Many in the ethanol industry believe that it will be impossible to meet the RFS requirement in future years without an increase in the percentage of ethanol that can be blended with gasoline for use in standard (non-flex fuel) vehicles. The EPA has approved the use of E15, gasoline which is blended at a rate of 15% ethanol and 85% gasoline, in vehicles manufactured in the model year 2001 and later. However, there are still state hurdles that need to be addressed in some states before E15 will become more widely available. Many states still have regulatory issues that prevent the sale of E15. Sales of E15 may be limited because it is not approved for use in all vehicles, the EPA requires a label that management believes may discourage consumers from using E15, and retailers may choose not to sell E15 due to concerns regarding liability. In June 2019, the Trump administration approved the use of E15 year-round. However, this rule was challenged in court and was reversed making E15 unavailable in certain markets during different times of the year. In February 2024, the EPA issued an emergency waiver allowing summer-time sales of E15 during 2024. Also in February 2024, the EPA issued a final rule that will allow E15 to be sold year-round in Illinois, Iowa, Minnesota, Missouri, Nebraska, Ohio, South Dakota and Wisconsin beginning in 2025.
In May 2020, the United States Department of Agriculture ("USDA") announced the Higher Blends Infrastructure Incentive Program which consists of up to $100 million in funding for grants to be used to increase the availability of higher blends of ethanol and biodiesel fuels. Funds may be awarded to retailers such as fueling stations and convenience stores to assist in the cost of installation or upgrading of fuel pumps and other infrastructure. In October 2020,To date, the USDA announcedhas awarded approximately $74 million to eligible projects.
On August 16, 2022, the Inflation Reduction Act of 2022, which has several provisions that may benefit the ethanol industry, was signed into law. There is, however, continued uncertainty as to how the required provisions will be implemented in future regulatory guidance. The Inflation Reduction Act maintains the 12-year credit period for the existing Section 45Q tax credit for carbon capture and storage ("CCS"). However, the Act extends eligibility for the credit to facilities that have commenced construction by December 31, 2032, and substantially lowers the minimum annual capture requirements to 12,500 tons for qualifying facilities. In addition, the potential credit rate is increased five times for industrial facilities and power plants that capture their carbon emissions to $85 per metric ton of carbon dioxide stored in secure geologic formations, $60 per ton for the beneficial utilization of captured carbon emissions, and $60 per ton for carbon oxide stored in oil and gas fields. Prevailing wage and apprenticeship requirements must be met by the facility to claim the full amount of the higher credit. In addition, projects will now be eligible to be directly paid for the credit by the Internal Revenue Service for the first roundfive years with no direct pay for many projects for the final seven years of awardsthe credit, and, as an alternative to recipientsdirect pay, projects will now be allowed to sell their credits to unrelated third parties for cash without adverse tax consequences. The Act also creates a Clean Fuel Production Tax Credit for the production of $22 million worthlow-emissions transportation fuel produced and sold in 2025, 2026 and 2027, subject to certain requirements as to prevailing wage and apprenticeship. However, the Act provides that the Clean Fuel Production Tax Credit is not available for a facility that qualifies for the Section 45Q tax credit. Additional incentives for production of grants. A second round of grants was awarded equal to $18.4 million. In August 2021, the USDA announced an additional $26sustainable aviation fuel and $500 million in funding for biofuels infrastructure grants, bringingfunding are also included in the total grants underAct. In December 2023, the programBiden administration announced it would recognize a methodology which would permit ethanol companies to a total of $66.4 million.claim tax credits for sustainable aviation fuel, which could increase demand for ethanol. However, the administration has also indicated the methodology will be updated sometime in 2024.
Effect of Governmental Regulation
The government's regulation of the environment changes constantly. We are subject to extensive air, water and other environmental regulations and we have been required to obtain a number of environmental permits to construct and operate the
ethanol plant. It is possible that more stringent federal or state environmental rules or regulations could be adopted, which could increase our operating costs and expenses. It also is possible that federal or state environmental rules or regulations could be adopted that could have an adverse effect on the use of ethanol. Plant operations are governed by the Occupational Safety and Health Administration ("OSHA"). OSHA regulations may change such that the costs of operating the ethanol plant may increase. Any of these regulatory factors may result in higher costs or other adverse conditions effecting our operations, cash flows and financial performance.
We have obtained all of the necessary permits to operate the ethanol plant. During our 20212023 fiscal year, our costs of environmental compliance were approximately $158,000.$222,000. We anticipate that our environmental compliance costs will be approximately $240,000$264,000 during our 20222024 fiscal year. Although we have been successful in obtaining all of the permits currently required, any future or retroactive change in environmental regulations, either at the federal or state level, could require us to obtain additional or new permits or spend considerable resources in complying with such regulations.
In late 2009, California passed a Low Carbon Fuels Standard ("LCFS"). The California LCFS requires that renewable fuels used in California must accomplish certain reductions in greenhouse gases which is measured using a lifecycle analysis,
similar to the RFS. The LCFS could have a negative impact on demand for corn-based ethanol and result in decreased ethanol prices affecting our ability to operate profitably.
In August 2017, Brazil instituted an import quota for ethanol produced in the United States and exported to Brazil, along with a 20% tariff on ethanol imports in excess of the quota. The quota expired in December 2020 soand all U.S. ethanol exports to Brazil are nowwere subject to the tariff. In March 2022, Brazil suspended its tariff through the end of 2022 on ethanol imported from the United States following a 10% reduction on the tariff in November 2021. However, in February of 2023, the Brazilian government ended the tax exemption on imports of fuel ethanol and reinstated the tariff of 16% for 2023, increasing to 18% in 2024. This tariff and quota have reduced exports of ethanol to Brazil and may continue to negatively impact ethanol exports from the United States. Any reduction in ethanol exports could negatively impact market ethanol prices in the United States. In addition, the Chinese government increased the tarifftariffs on United States ethanol imports into China from 30% to 45% and ultimately to 70%.remain high. Due to other recent tariff activity between the United States and China, management does not expect these Chinese tariffs to be removed in the near term. Both China and Brazil have been major sources of import demand for United States ethanol and distillers grains.ethanol. These trade actions may result in negative operating margins for United States ethanol producers.
We are subject to environmental oversight by the EPA. There is always a risk that the EPA may enforce certain rules and regulations differently than South Dakota's environmental administrators. South Dakota or EPA rules are subject to change, and any such changes could result in greater regulatory burdens on plant operations. We could also be subject to environmental or nuisance claims from adjacent property owners or residents in the area arising from possible foul smells or other air or water discharges from the ethanol plant. Such claims may result in an adverse result in court if we are deemed to engage in a nuisance that substantially impairs the fair use and enjoyment of adjacent property.
Employees
We depend on our employees to operate our plant. While we face competition to attract and retain personnel with necessary skills, we believe that we compete favorably on the basis of wages and benefits and our commitment to training and development. In addition, the safety of our employees is our highest priority. We have developed and enforce workplace safety policies and programs in order to maintain a high standard for performance in our operations and ensure the safety of our workers. As of December 31, 2021,2023, we had 4647 full-time employees. We do not expect the number of employees to materially change in the next 12 months.
Available Information
Additional information about the Company can be found at the Company's Website: https://www.dakotaethanol.com/.
ITEM 1A. RISK FACTORS.
You should carefully read and consider the risks and uncertainties below and the other information contained in this report. The risks and uncertainties described below are not the only ones we may face. The following risks, together with additional risks and uncertainties not currently known to us or that we currently deem immaterial could impair our financial condition and results of operation.
Risks Relating to Our Business
We are subject to global and regional economic downturns and related risks and the effects of COVID-19 or another pandemic may materially and adversely affect demand and the market price for our products. The level of demand for our products is affected by global and regional demographic and macroeconomic conditions. A significant downturn in global economic growth, or recessionary conditions in major geographic regions for prolonged periods, may lead to reduced demand for our products, which could have a negative effect on the market price of our products. In December 2019, a novel coronavirus surfaced in Wuhan, China (“COVID-19”). The spread of COVID-19 worldwide has resulted in businesses suspending or substantially curtailing global operations and travel, quarantines, and an overall substantial slowdown of economic activity. Transportation fuels in particular, including ethanol, have experienced significant price declines and reduced demand. The effects of COVID-19 have and may continue to materially and adversely affect the market price for our products, our business, results of operations and liquidity.
COVID-19 or another pandemic may negatively impact our ability to operate our business which could decrease or eliminate the value of our units. COVID-19 has resulted in significant uncertainty in many areas of our business. We do not know how long these conditions will last. This uncertainty is expected to negatively impact our operations. We may experience labor shortages if our employees are unable or unwilling to come to work. If our suppliers cannot deliver the supplies we need to operate our business or if we are unable to ship our products due to trucking or rail shipping disruptions, we may be forced to suspend operations or reduce production. If we are unable to operate the ethanol plant at capacity, it may result in unfavorable operating results. Any shut down of operations or reduction in production, especially for an extended period of time, could reduce or eliminate the value of our units.
The EPA issued small refinery exemption waivers to the RFS requirement which has resulted in demand destruction and negatively impacted profitability in the ethanol industry. During 2019, the ethanol industry learned that the EPA has been issuing small refinery waivers to the ethanol use requirements in the RFS. In previous years, when the EPA issued small refinery exemption waivers, the EPA reallocated the waived gallons to other refiners. The EPA under the Trump
Administration was granting significantly more waivers than in the past and was not reallocating the waived gallons to other refiners. These actions resulted in demand destruction in 2019 and 2020 which led to reduced market ethanol prices and negative operating margins in the ethanol industry. This reduction in ethanol demand negatively impacted the profitability of our operations. These small refinery exemption waivers have impacted the ethanol industry which could reduce or eliminate the value of our units.
The spread between ethanol and corn prices can vary significantly which can negatively impact our financial condition. Our only source of revenue comes from sales of our ethanol, distillers grains and corn oil. The primary raw materials we use to produce our ethanol, distillers grains and corn oil are corn and natural gas. In order to operate the ethanol plant profitably, we must maintain a positive spread between the revenue we receive from sales of our products and our corn and natural gas costs. This spread between the market price of our products and our raw material costs has been volatile in the past. If we were to experience a period of time where this spread is negative, and the negative margins continue for an extended period of time, it may prevent us from profitably operating the ethanol plant which could decrease the value of our units.
Decreasing gasoline prices may lower ethanol prices which could negatively impact our ability to operate profitably. Until recently,Typically, the price of ethanol has been less than the price of gasoline which increased ethanol demand. However, at times in recent years, gasoline prices have decreased significantly which have reduced the spread between the price of gasoline and the price of ethanol. When it occurs, this trend has negatively impacted ethanol prices. If this trend continuedwere to continue for a significant period of time, it could hurt our ability to profitably operate the ethanol plant which could decrease the value of our units.
We may be forced to reduce production or cease production altogether if we are unable to secure the corn we require to operate the ethanol plant. We require a significant amount of corn to operate the ethanol plant at capacity. Poor weather conditions can have a significant impact on corn production. If the corn crop harvested in future years is smaller than we have recently experienced, it is possible that we could experience corn shortages which could negatively impact our ability to operate the ethanol plant. We may also experience a shortage of corn in our local market which may not increase national corn prices but may require us to increase our corn basis in order to attract corn which can impact our overall corn costs. If we are unable to secure the corn we require to continue to operate the ethanol plant, or we are unable to secure corn at prices that allow us to operate profitably, we may have to reduce production or cease operating altogether which may negatively impact the value of our units.
Our revenue will be greatly affected by the price at which we can sell our ethanol, distillers grains and corn oil. Our ability to generate revenue is dependent on our ability to sell the ethanol, distillers grains and corn oil that we produce. Ethanol, distillers grains and corn oil prices can be volatile as a result of a number of factors. These factors include overall supply and demand, the market price of corn, the market price of gasoline, levels of government support, general economic conditions and the availability and price of competing products. Ethanol, distillers grains and corn oil prices tend to fluctuate based on changes in energy prices and other commodity prices, such as corn and soybean meal. Exports of our products and the various trade actions taken by China and Brazil have impacted the market prices for our products. If we experience lower prices for our products for a significant period of time, the value of our units may be negatively affected.
Our business is not diversified. Our success depends primarily on our ability to profitably operate our ethanol plant. We do not have any other lines of business or any other significant source of revenue if we are unable to operate our ethanol plant and manufacture ethanol, distillers grains and corn oil. If economic or political factors adversely affect the market for ethanol, distillers grains and corn oil, we may not be able to continue our operations. Our business would also be significantly harmed if our ethanol plant could not operate at full capacity for any extended period of time, which could reduce or eliminate the value of our units.
Our inability to secure credit facilities we may require in the future may negatively impact our liquidity. While we do not currently require more financing than we have, in the future we may need additional financing. If we require financing in the future and we are unable to secure such financing, or we are unable to secure the financing we require on reasonable terms, it may have a negative impact on our liquidity which could negatively impact the value of our units.
Our product marketer may fail to market our products at competitive prices which may cause us to operate unprofitably. RPMG is the sole marketer of all of our ethanol, corn oil and some of our distillers grains, and we rely heavily on its marketing efforts to successfully sell our products. Because RPMG sells ethanol, corn oil and distillers grains for a number of other producers, we have limited control over its sales efforts. Our financial performance is dependent upon the financial health of RPMG as most of our revenue is attributable to RPMG's sales. If RPMG breaches our marketing agreements or it cannot market all of the ethanol, corn oil and distillers grains we produce, we may not have any readily available means to sell our ethanol, corn oil and distillers grains and our financial performance could be negatively affected. While we market a portion of our distillers grains internally to local consumers, we do not anticipate that we would have the ability to sell all of the
distillers grains, corn oil and ethanol we produce ourselves. If our agreements with RPMG terminate, we may seek other arrangements to sell our ethanol, corn oil and distillers grains, including selling our own products, but we may not be able to achieve results comparable to those achieved by RPMG which could harm our financial performance. Switching marketers may negatively impact our cash flow and our ability to continue to operate the ethanol plant. If we are unable to sell all of our ethanol, distillers grain and corn oil at prices that allow us to operate profitably, it may decrease the value of our units.
We engage in hedging transactions which involve risks that could harm our business. We are exposed to market risk from changes in commodity prices. Exposure to commodity price risk results from our dependence on corn and natural gas in the ethanol production process. We seek to minimize the risks from fluctuations in the prices of corn, natural gas and ethanol through the use of hedging instruments. These hedging instruments can be risky and can negatively impact our liquidity. In times when commodity prices are volatile, we may be required to use significant amounts of cash to make margin calls as a result of our hedging positions. The effectiveness of our hedging strategies is dependent on the price of corn, natural gas and ethanol and our ability to sell sufficient products to use all of the corn and natural gas for which we have futures contracts. Our hedging activities may not successfully reduce the risk caused by price fluctuation which may leave us vulnerable to corn and natural gas prices. We may choose not to engage in hedging transactions in the future and our operations and financial conditions may be adversely affected during periods in which corn and/or natural gas prices increase. These hedging transactions could impact our ability to profitably operate the ethanol plant and negatively impact our liquidity.
We may incur casualty losses that are not covered by insurance which could negatively impact the value of our units. We have purchased insurance which we believe adequately covers our potential losses from foreseeable risks. However, there are risks that we may encounter for which there is no insurance or for which insurance is not available on terms that are acceptable to us. If we experience a loss which materially impairs our ability to operate the ethanol plant which is not covered by insurance, the value of our units could be reduced or eliminated.
Our operations may be negatively impacted by natural disasters, severe weather conditions, and other unforeseen plant shutdowns which can negatively impact our operations. Our operations may be negatively impacted by events outside of our control such as natural disasters, severe weather, strikes, train derailments and other unforeseen events which may negatively impact our operations. If we experience any of these unforeseen circumstances which negatively impact our operations, it may affect our cash flow and negatively impact the value of our business.
We depend on our management and key employees, and the loss of these relationships could negatively impact our ability to operate profitably. We are highly dependent on our management team to operate our ethanol plant. We may not be able to replace these individuals should they decide to cease their employment with us, or if they become unavailable for any other reason. While we seek to compensate our management and key employees in a manner that will encourage them to continue their employment with us, they may choose to seek other employment. Any loss of these managers or key employees may prevent us from operating the ethanol plant profitably and could decrease the value of our units.
We may violate the terms of our loan agreements and financial covenants which could result in our lender demanding immediate repayment of our loans. We have a credit facility with Farm Credit. Our credit agreements with Farm Credit include various financial loan covenants. We are currently in compliance with all of our financial loan covenants. Current management projections indicate that we will be in compliance with our loan covenants for at least the next 12 months. However, unforeseen circumstances may develop which could result in us violating our loan covenants. If we violate the terms of our loan agreements, Farm Credit, our primary lender, could deem us in default of our loans and require us to immediately repay any outstanding balance of our loans. If we do not have the funds available to repay the loans and we cannot find another source of financing, we may fail which could decrease the value of our units.
Risks Related to Ethanol Industry
Excess ethanol supply in the market could put negative pressure on the price of ethanol which could lead to tight operating margins and may impact our ability to operate profitably. In the past the ethanol industry has confronted market conditions where ethanol supply exceeded demand which led to unfavorable operating conditions. Most recently, in 2012,
profitability in the ethanol industry was reduced due to increased ethanol imports from Brazil at a time when gasoline demand in the United States was lower and domestic ethanol supplies were higher. This disconnect between ethanol supply and demand resulted in lower ethanol prices at a time when corn prices were higher which led to unfavorable operating conditions. We may experience periods of time when ethanol supply exceeds demand which could negatively impact our profitability. During 2021 we experienced excess ethanol supply compared to demand which negatively impacted profitability in the industry. The United States benefited from additional exports of ethanol in recent years which may not continue to occur during our 20222024 fiscal year. We may experience periods of ethanol supply and demand imbalance during our 20222024 fiscal year. If we experience excess
ethanol supply, either due to increased ethanol production or lower domestic or foreign demand, it could negatively impact the price of ethanol which could hurt our ability to profitably operate the ethanol plant.
Demand for ethanol may not increase past current levels unless higher percentage blends of ethanol are more widely used. Currently, ethanol is primarily blended with gasoline for use in standard (non-flex fuel) vehicles to create a blend which is 10% ethanol and 90% gasoline. Estimates indicate that approximately 143135 billion gallons of gasoline are sold in the United States each year. Assuming that all gasoline in the United States is blended at a rate of 10% ethanol and 90% gasoline, the maximum domestic demand for ethanol is 14.313.5 billion gallons. This is commonly referred to as the "blend wall," which represents a theoretical limit where more ethanol cannot be blended into the national gasoline pool. Many in the ethanol industry believe that the ethanol industry has reached this blend wall. In order to expand demand for ethanol, higher percentage blends of ethanol must be utilized in standard vehicles. Such higher percentage blends of ethanol are a contentious issue. Automobile manufacturers and environmental groups have fought against higher percentage ethanol blends. The EPA approved the use of E15 for standard (non-flex fuel) vehicles produced in the model year 2001 and later. The fact that E15 has not been approved for use in all vehicles and the labeling requirements associated with E15 may lead to gasoline retailers refusing to carry E15. Without an increase in the allowable percentage blends of ethanol that can be used in all vehicles, demand for ethanol may not continue to increase which could decrease the selling price of ethanol and could result in our inability to operate the ethanol plant profitably, which could reduce or eliminate the value of our units.
Changes and advances in ethanol production technology could require us to incur costs to update our plant or could otherwise hinder our ability to compete in the ethanol industry or operate profitably. Advances and changes in the technology of ethanol production are expected to occur. Such advances and changes may make the ethanol production technology installed in our plant less desirable or obsolete. These advances could also allow our competitors to produce ethanol at a lower cost than we are able. If we are unable to adopt or incorporate technological advances, our ethanol production methods and processes could be less efficient than our competitors, which could cause our plant to become uncompetitive or completely obsolete. If our competitors develop, obtain or license technology that is superior to ours or that makes our technology obsolete, we may be required to incur significant costs to enhance or acquire new technology so that our ethanol production remains competitive. Alternatively, we may be required to seek third-party licenses, which could also result in significant expenditures. These third-party licenses may not be available or, once obtained, they may not continue to be available on commercially reasonable terms. These costs could negatively impact our financial performance by increasing our operating costs and reducing our net income.
Decreases in ethanol demand may result in excess production capacity in our industry. The supply of domestically produced ethanol is at an all-time high. According to the Renewable Fuels Association, as of December 31, 2021,February 24, 2024, there are 210200 ethanol plants in operation or under construction with capacity to productproduce approximately 17.47617.807 billion gallons of ethanol per year. Excess ethanol production capacity may have an adverse impact on our results of operations, cash flows and general financial condition. Further, ethanol demand may be negatively impacted by reductions in the RFS. While the United States is currently exporting ethanol which has generally resulted in increased ethanol demand, these ethanol exports may not continue. If ethanol demand does not grow at the same pace as increases in supply, we expect the selling price of ethanol to decline. If excess capacity in the ethanol industry continues to occur, the market price of ethanol may decline to a level that is inadequate to generate sufficient cash flow to cover our costs, which could negatively affect our profitability.
We operate in an intensely competitive industry and compete with larger, better financed companies which could impact our ability to operate profitably. There is significant competition among ethanol producers. There are numerous producer-owned and privately-owned ethanol plants operating throughout the Midwest and elsewhere in the United States. We also face competition from ethanol producers located outside of the United States. The largest ethanol producers include Archer Daniels Midland, Green Plains Renewable Energy, POET Biorefining, and Valero Renewable Fuels, each of which is capable of producing significantly more ethanol than we produce. Further, many believe that there will be consolidation occurring in the ethanol industry which will likely lead to a few companies that control a significant portion of the United States ethanol production market. We may not be able to compete with these larger producers. These larger ethanol producers may be able to affect the ethanol market in ways that are not beneficial to us which could negatively impact our financial performance and the value of our units.
Competition from the advancement of alternative fuels and other technologies may lessen demand for ethanol. Alternative fuels, gasoline oxygenates and ethanol production methods are continually under development. A number of automotive, industrial and power generation manufacturers are developing alternative clean power systems using fuel cells,
plug-in hybrids, and electric cars or clean burning gaseous fuels. Like ethanol, these emerging technologies offer an option to address worldwide energy costs, the long-term availability of petroleum reserves and environmental concerns. If these alternative technologies continue to expand and gain broad acceptance and become readily available to consumers for motor
vehicle use, we may not be able to compete effectively. This additional competition could reduce the demand for ethanol, resulting in lower ethanol prices that might adversely affect our results of operations and financial condition.
Consumer resistance to the use of ethanol based on the belief that ethanol is expensive, adds to air pollution, harms engines and/or takes more energy to produce than it contributes or based on perceived issues related to the use of corn as the feedstock to produce ethanol may affect demand for ethanol. Certain individuals believe that the use of ethanol will have a negative impact on gasoline prices at the pump. Some also believe that ethanol adds to air pollution and harms car and truck engines. Still other consumers believe that the process of producing ethanol actually uses more fossil energy, such as oil and natural gas, than the amount of energy that is produced. Further, some consumers object to the fact that ethanol is produced using corn as the feedstock which these consumers perceive as negatively impacting food prices. These consumer beliefs could potentially be wide-spread and may be increasing as a result of recent efforts to increase the allowable percentage of ethanol that may be blended for use in vehicles. If consumers choose not to buy ethanol based on these beliefs, it would affect demand for the ethanol we produce which could negatively affect our profitability and financial condition.
If exports of ethanol are reduced, including as a result of the imposition of tariffs on U.S. ethanol, ethanol prices may be negatively impacted. The United States ethanol industry was supported during our 20212023 fiscal year with exports of ethanol, which has generally over recent years increased demand for our ethanol. Management believes these exports of ethanol were due to lower market ethanol prices in the United States and increased global demand for ethanol. Further,However, in 2017 both Brazil and China implemented tariffs on ethanol produced in the United States. These tariffs have resulted in decreased demand for ethanol from these countries which has negatively impacted ethanol prices in the United States. Any decrease in ethanol prices or demand may negatively impact our ability to profitably operate the ethanol plant.
Distillers grains demand and prices may continue to be negatively impacted by the Chinese antidumping and countervailing duty investigation. China was historically the world's largest importer of distillers grains produced in the United States. On January 12, 2016, the Chinese government announced that it would commence an anti-dumping and countervailing duty investigation related to distillers grains imported from the United States. In January 2017, the Chinese set the final anti-dumping duties from 42.2% to 53.7%, and set the final anti-subsidy tariffs from 11.2% to 12%. In 2023, the Chinese Government extended the tariffs for an additional five (5) years. Both during the investigation and after the announcement of the duty, distillers grains demand and prices have been negatively impacted. While we expect China to continue to import some distillers grains, due to continued trade disputes and tensions between the United States and China, management does not expect these tariffs to be removed in the near term which could continue to negatively impact market distillers grains demand and prices. This reduction in demand along with lower domestic corn prices could negatively impact our ability to profitably operate the ethanol plant.
A reduction in ethanol exports to Brazil due to the imposition by the Brazilian government of a tariff on U.S. ethanol could have a negative impact on ethanol pricesprices. .Brazil has historically been a top destination for ethanol produced in the United States. However, in 2017,recent years, Brazil has imposed a 20% tarifftariffs on ethanol which is produced in the United States and exported to Brazil. This tariff has resultedThese tariffs result in a decline in demand for ethanol from Brazil. The effectIn 2021 and 2022, the impact of these tariffs were reduced as the Brazilian government lowered and suspended the tariff. However, in February of 2023, the Brazilian Government reinstituted the tariff had been mitigated somewhat by the adoption of a rate tariff quota18%. Management believes that allowed 750 million liters of ethanol annually to be allowed into Brazil before the tariff applies. However, this rate tariff quota expired on December 14, 2020, so all of the ethanol exports to Brazil are now subject to the 20% tariff. This tariff hascould negatively impactedimpact ethanol demand and prices in the United States and could negativelymay impact our ability to profitably operate the ethanol plant.
Overcapacity within the ethanol industry could cause an oversupply of ethanol and a decline in ethanol prices. Excess ethanol production capacity could have an adverse impact on our results of operations, cash flows and general financial condition. If demand for ethanol does not grow at the same pace as increases in supply, we would expect the price of ethanol to decline. If excess capacity in the ethanol industry occurs, the market price of ethanol may decline to a level that is inadequate to generate sufficient cash flow to cover our costs which could reduce the value of our units.
Many ethanol producers are expanding their production capacity which could lead to an oversupply of ethanol in the United States. Recently, many ethanol producers have commenced projects to expand their ethanol production capacities. These expansions could result in a significant increase in the supply of ethanol in the United States. Currently, ethanol prices are supported by ethanol exports which may not continue at their current levels. While many in the ethanol industry are working to increase the amount of ethanol that is used domestically, specifically in the form of E15, which contains 15% ethanol as compared to the 10% ethanol which is used in most current blends, adoption of E15 has not been as rapid as most ethanol producers would like. Also, the additional ethanol capacity which is being constructed may exceed current domestic
and export demand. An oversupply of ethanol negatively impacts domestic ethanol prices which could negatively impact our ability to profitably operate the ethanol plant.
We made significant investments in Guardian Hankinson, LLC and Ring-neck Energy & Feed, LLC which may fail. In December 2013 we made a $12 million investment and in September 2023 we made an additional $44 million investment in Guardian Hankinson, LLC, an entity that owns an ethanol plant in North Dakota. In addition, in July 2017, we made a $10 million investment in Ring-neck Energy & Feed, LLC. Both of these companies will face many of the same risks that we face in operating our ethanol plant. Further, we have limited control over the management decisions made by Guardian Hankinson, LLC and Ring-neck Energy & Feed, LLC. If Guardian Hankinson, LLC or Ring-neck Energy & Feed, LLC is ultimately unsuccessful, it could negatively impact the return we receive on our investment which could negatively impact our financial performance and the value of our units.
Failures of our information technology infrastructure could have a material adverse effect on operations. We utilize various software applications and other information technology that are critically important to our business operations. We rely on information technology networks and systems, including the Internet,internet, to process, transmit and store electronic and financial information, to manage a variety of business processes and activities, including production, manufacturing, financial, logistics, sales, marketing and administrative functions. We depend on our information technology infrastructure to communicate internally and externally with employees, customers, suppliers and others. We also use information technology networks and systems to comply with regulatory, legal and tax requirements. These information technology systems, some of which are managed by third parties, may be susceptible to damage, disruptions or shutdowns due to failures during the process of upgrading or replacing software, databases or components thereof, power outages, hardware failures, computer viruses and ransomware attacks by computer hackers or other cybersecurity risks, telecommunication failures, user errors, natural disasters, terrorist attacks or other catastrophic events. If any of our significant information technology systems suffer severe damage, disruption or shutdown, and our disaster recovery and business continuity plans do not effectively resolve the issues in a timely manner, our product sales, financial condition and results of operations may be materially and adversely affected.
A cyber attack or other information security breach could have a material adverse effect on our operations and result in financial losses. We are regularly the target of attempted cyber and other security threats and must continuously monitor and develop our information technology networks and infrastructure to prevent, detect, address and mitigate the risk of unauthorized access, misuse, computer viruses and ransomware as well as other events that could have a security impact. If we are unable to prevent cyber attacks and other information security breaches, we may encounter significant disruptions in our operations which could adversely impact our business, financial condition and results of operations or result in the unauthorized disclosure of confidential information. Such breaches may also harm our reputation, result in financial losses or subject us to litigation or other costs or penalties.
Risks Related to Regulation and Governmental Action
Uncertainty and instability which results from the conflict between Ukraine and Russia and resulting sanctions by the United States, European Union, and other countries could negatively impact commodities marketsresult in a slowdown in economic growth, rising inflation, market disruptions and could negatively impact our options.increased volatility in commodity prices in the United States. Russia invaded Ukraine in MarchFebruary 2022 which has resulted in significant uncertainty in the commodities market and has impacted commodity prices. In response to the attacks on Ukraine, sanctions and other penalties have been instituted. The invasion by Russia and resulting sanctions have created global economic uncertainty and have resulted in significant market disruptions and increased volatility in commodity prices such as corn, oil prices.and natural gas. This uncertainty and instability which may result from the situation in Ukraine could impacthas impacted the ethanol industry, including our operations. Ukraine is a major agricultural producer and if the Russian invasion impactscontinues to impact the commodities produced in Ukraine, it could resultwhich has resulted in higher commodities prices in the United States, including corn and natural gas which are our two largest costs of production. In addition, the conflict could impacthas impacted oil prices which could have an impact on gasoline prices and demand in the United States. These impacts could be far reaching and could last for a significant period of time which could negatively impact our operations.
Government incentives for ethanol production may be reduced or eliminated in the future, which could hinder our ability to operate at a profit. The ethanol industry is assisted by various federal and state ethanol incentives, the most important of which is the RFS set forth in the Energy Policy Act of 2005. The RFS helps support a market for ethanol that might disappear without this incentive. The EPA has the authority to waive the RFS statutory volume requirement, in whole or in part, provided certain conditions have been met. Annually, the EPA is supposed to pass a rule that establishes the number of gallons of different types of renewable fuels that must be used in the United States which is called the renewable volume obligations.obligations (RVOs). In July 2022, the EPA retroactively reduced the RVO for total renewable fuel for 2020 to 17.13 billion gallons. The portion that could be met by corn-based ethanol was reduced to 12.50 billion for 2020. The EPA indicated that the reason for this retroactive change was due to program and market challenges, including those related to the COVID-19 pandemic. In
addition, the EPA set the RVO for total renewable fuel for 2021 at 18.84 billion gallons and for 2022 at 20.63 billion gallons. The portion that could be met by corn-based ethanol was 13.79 billion for 2021 and 15 billion gallons for 2022. The EPA also added a 250 million gallon supplemental obligation in 2022 and stated its intention to do the same for 2023. On December 20211, 2022, the EPA proposed ato set the RVO for total renewable volume obligationfuel for 2021 below2023 to 20.82 billion gallons, for 2024 to 21.87 billion gallons and for 2025 to 22.68 billion gallons. The portion that could be met by corn-based ethanol would be 15 billion gallons for 2023 and would then increase to 15.25 billion gallons in 2024 and 2025. Public hearings for the statutory volume requirementsproposed rules were held in January 2023. In June 2023, the EPA released the final rule which set the RVO for total renewable fuel for 2023, 2024, and proposed a reduction in the renewable volume obligations for 2020.2025 as 20.94 billion gallons, 21.54 billion gallons, and 22.33 billion gallons, respectively. If the final renewable volume obligations matchEPA reduces or retroactively reduces the EPA's proposal or if the RFS were to be otherwise reduced or eliminated by the exercise of the EPA waiver authority or by Congress in the future,RVOs, the market price and demand for ethanol could decrease which will negatively impact our financial performance.
The California Low Carbon Fuel Standard may decrease demand for corn-based ethanol which could negatively impact our profitability. California passed a Low Carbon Fuels Standard ("LCFS") which requires that renewable fuels used in California must accomplish certain reductions in greenhouse gases which reductions are measured using a lifecycle analysis. Management believes that these regulations could preclude corn-based ethanol produced in the Midwest from being used in California. California represents a significant ethanol demand market. If the ethanol industry is unable to supply corn-based
ethanol to California, it could significantly reduce demand for the ethanol we produce. This could result in a reduction of our revenues and negatively impact our ability to profitably operate the ethanol plant.
Changes in environmental regulations or violations of these regulations could be expensive and reduce our profitability. We are subject to extensive air, water and other environmental laws and regulations. In addition, some of these laws require our plant to operate under a number of environmental permits. These laws, regulations and permits can often require expensive pollution control equipment or operational changes to limit actual or potential impacts to the environment. A violation of these laws and regulations or permit conditions could result in substantial fines, damages, criminal sanctions, permit revocations and/or plant shutdowns. In the future, we may be subject to legal actions brought by environmental advocacy groups and other parties for actual or alleged violations of environmental laws or our permits. Additionally, any changes in environmental laws and regulations, both at the federal and state level, could require us to spend considerable resources in order to comply with future environmental regulations. The expense of compliance could be significant enough to reduce our profitability and negatively affect our financial condition.
Carbon dioxide may be regulated in the future by the EPA as an air pollutant requiring us to obtain additional permits and install additional environmental mitigation equipment, which could adversely affect our financial performance. In 2007, the Supreme Court decided a case in which it ruled that carbon dioxide is an air pollutant under the Clean Air Act for motor vehicle emissions. Our plant produces a significant amount of carbon dioxide. While there are currently no regulations restricting carbon dioxide emissions, if the EPA or the State of South Dakota were to regulate carbon dioxide emissions by plants such as ours, we may have to apply for additional permits or we may be required to install carbon dioxide mitigation equipment or take other as yet unknown steps to comply with these potential regulations. Compliance with any future regulation of carbon dioxide, if it occurs, could be costly and may prevent us from operating the ethanol plant profitably which could decrease or eliminate the value of our units.
Government policies and regulations, particularly those affecting the agricultural sector and related industries, could adversely affect our operations and profitability. Agricultural commodity production and trade flows are significantly affected by government policies and regulations. Governmental policies affecting the agricultural industry, such as taxes, trade tariffs, duties, subsidies, import and export restrictions on commodities and commodity products, can influence industry profitability, the planting of certain crops, the location and size of crop production, whether unprocessed or processed commodity products are traded, and the volume and types of imports and exports. In addition, international trade disputes can adversely affect trade flows by limiting or disrupting trade between countries or regions. Future governmental policies, regulations or actions affecting our industry may adversely affect the supply of, demand for and prices of our products, restrict our ability to do business and cause our financial results to suffer. We may experience negative impacts of higher ethanol tariffs and other disruptions to international agricultural trade. In April of 2018, the Chinese government increased the tariff on United States ethanol imports into China from 30% to 45% and ultimately 70%. Currently, the tariff rate is effectively 45%. We cannot estimate the exact effect this tariff increase will havehas had on the overall domestic ethanol market. However, the increased tariff is expected to reducelikely decreased overall United States ethanol export demand, which could havelikely has had a negative effect on domestic ethanol prices.
ITEM 2. PROPERTIES.
We own Dakota Ethanol as a wholly-owned subsidiary. The ethanol plant is located on Dakota Ethanol's 210-acre rural site near Wentworth, South Dakota. All of our operations occur at our plant in Wentworth, South Dakota.
We maintain a comprehensive credit facility with Farm Credit Services of America, PCA and Farm Credit Services of America, FLCA (collectively "FCSA"). All of Dakota Ethanol's tangible and intangible property, real and personal, serves as the collateral for debt financing with FCSA which is described below under "Item 7 - Management's Discussion and Analysis of Financial Condition and Results of Operations - Indebtedness."
ITEM 3. LEGAL PROCEEDINGS.
From time to time in the ordinary course of business, Dakota Ethanol or Lake Area Corn Processors may be named as a defendant in legal proceedings related to various issues, including, worker's compensation claims, tort claims, or contractual disputes. We are not currently involved in any material legal proceedings, directly or indirectly, and we are not aware of any claims pending or threatened against us or any of the managers that could result in the commencement of material legal proceedings.
ITEM 4. MINE SAFETY DISCLOSURES.
None.
PART II
ITEM 5. MARKET FOR REGISTRANT'S COMMON EQUITY, RELATED MEMBER MATTERS AND ISSUER PURCHASES OF EQUITY SECURITIES.
Recent Sales of Unregistered Equity Securities
None.
Issuer Purchases of Equity Securities
We did not repurchase any equity securities between October 1, 20212023 and December 31, 2021.2023.
Market Information
There is no public trading market for our units. Our units may only be transferred in accordance with our Capital Units Transfer System, which provides for transfers by gift to family members, upon death, and through a qualified matching service, subject to approval by our board of managers. Our qualified matching service is operated through Variable Investment Advisors, Inc., a registered broker-dealer based in Sioux Falls, South Dakota. Variable Investment Advisor's Alternative Trading System may be accessed at www.agstocktrade.com. The matching service consists of an electronic bulletin board that provides information to prospective sellers and buyers of our units. We do not receive any compensation relating to the matching service. We have no role in effecting the transactions beyond approval, as required under our operating agreement, and the issuance of new certificates. So long as we remain a publicly reporting company, information about us will be publicly available through the SEC's filing system.
Unit Holders
As of March 3, 2022,7, 2024, we had 29,620,000 membership units issued and outstanding and a total of approximately 1,0581,064 unit holders.
Bid and Asked Prices
The following table contains historical information concerning completed unit transactions that occurred during our last two fiscal years. Our bulletin board trading system does not track bid and asked prices and therefore we only have information concerning completed unit transactions.
| | | | | | | | | | | | | | | | | | | | | | | | | | |
| Quarter | | Low Price | | High Price | | Average Price | | Number of
Units Traded |
| First Quarter 2020 | | 2.10 | | | 2.34 | | | 2.16 | | | 59,000 | |
| Second Quarter 2020 | | — | | | — | | | — | | | — | |
| Third Quarter 2020 | | 1.50 | | | 1.51 | | | 1.50 | | | 45,000 | |
| Fourth Quarter 2020 | | 1.57 | | | 1.63 | | | 1.61 | | | 90,000 | |
| First Quarter 2021 | | 1.51 | | | 1.75 | | | 1.63 | | | 53,500 | |
| Second Quarter 2021 | | 1.68 | | | 2.02 | | | 1.82 | | | 75,000 | |
| Third Quarter 2021 | | 2.03 | | | 2.20 | | | 2.14 | | | 101,000 | |
| Fourth Quarter 2021 | | 2.05 | | | 2.94 | | | 2.43 | | | 90,000 | |
| | | | | | | | | | | | | | | | | | | | | | | | | | |
| Quarter | | Low Price | | High Price | | Average Price | | Number of
Units Traded |
| First Quarter 2022 | | 2.90 | | | 3.99 | | | 3.62 | | | 48,500 | |
| Second Quarter 2022 | | 3.00 | | | 3.52 | | | 3.22 | | | 138,000 | |
| Third Quarter 2022 | | 3.61 | | | 3.90 | | | 3.67 | | | 25,000 | |
| Fourth Quarter 2022 | | 3.90 | | | 3.95 | | | 3.92 | | | 30,000 | |
| First Quarter 2023 | | 4.25 | | | 4.47 | | | 4.38 | | | 12,000 | |
| Second Quarter 2023 | | 4.24 | | | 4.47 | | | 4.25 | | | 51,000 | |
| Third Quarter 2023 | | 4.49 | | | 4.49 | | | 4.49 | | | 3,500 | |
| Fourth Quarter 2023 | | 6.00 | | | 6.08 | | | 6.06 | | | 25,000 | |
Distributions
Our board of managers has complete discretion over the timing and amount of distributions to our unit holders subject to certain restrictions in our credit agreements and our operating agreement. Our expectations with respect to our ability to make future distributions are discussed further in "Item 7. Management's Discussion and Analysis of Financial Condition and Results of Operations." Distributions are restricted by certain loan covenants in our credit agreements with Farm Credit.
Performance Graph
The following graph shows a comparison of cumulative total member return since December 31, 2015,2018, calculated on a dividend reinvested basis, for the Company, the NASDAQ Composite Index (the "NASDAQ Market Index") and an index of other companies that have the same SIC code as the Company (the "SIC Code Index"). The graph assumes $100 was invested in each of our units, the NASDAQ Market Index, and the SIC Code Index on December 31, 2015.2018. Data points on the graph are annual. Note that historic unit price performance is not necessarily indicative of future unit price performance. The data for this performance graph was compiled for us by Zacks Investment Research, Inc.
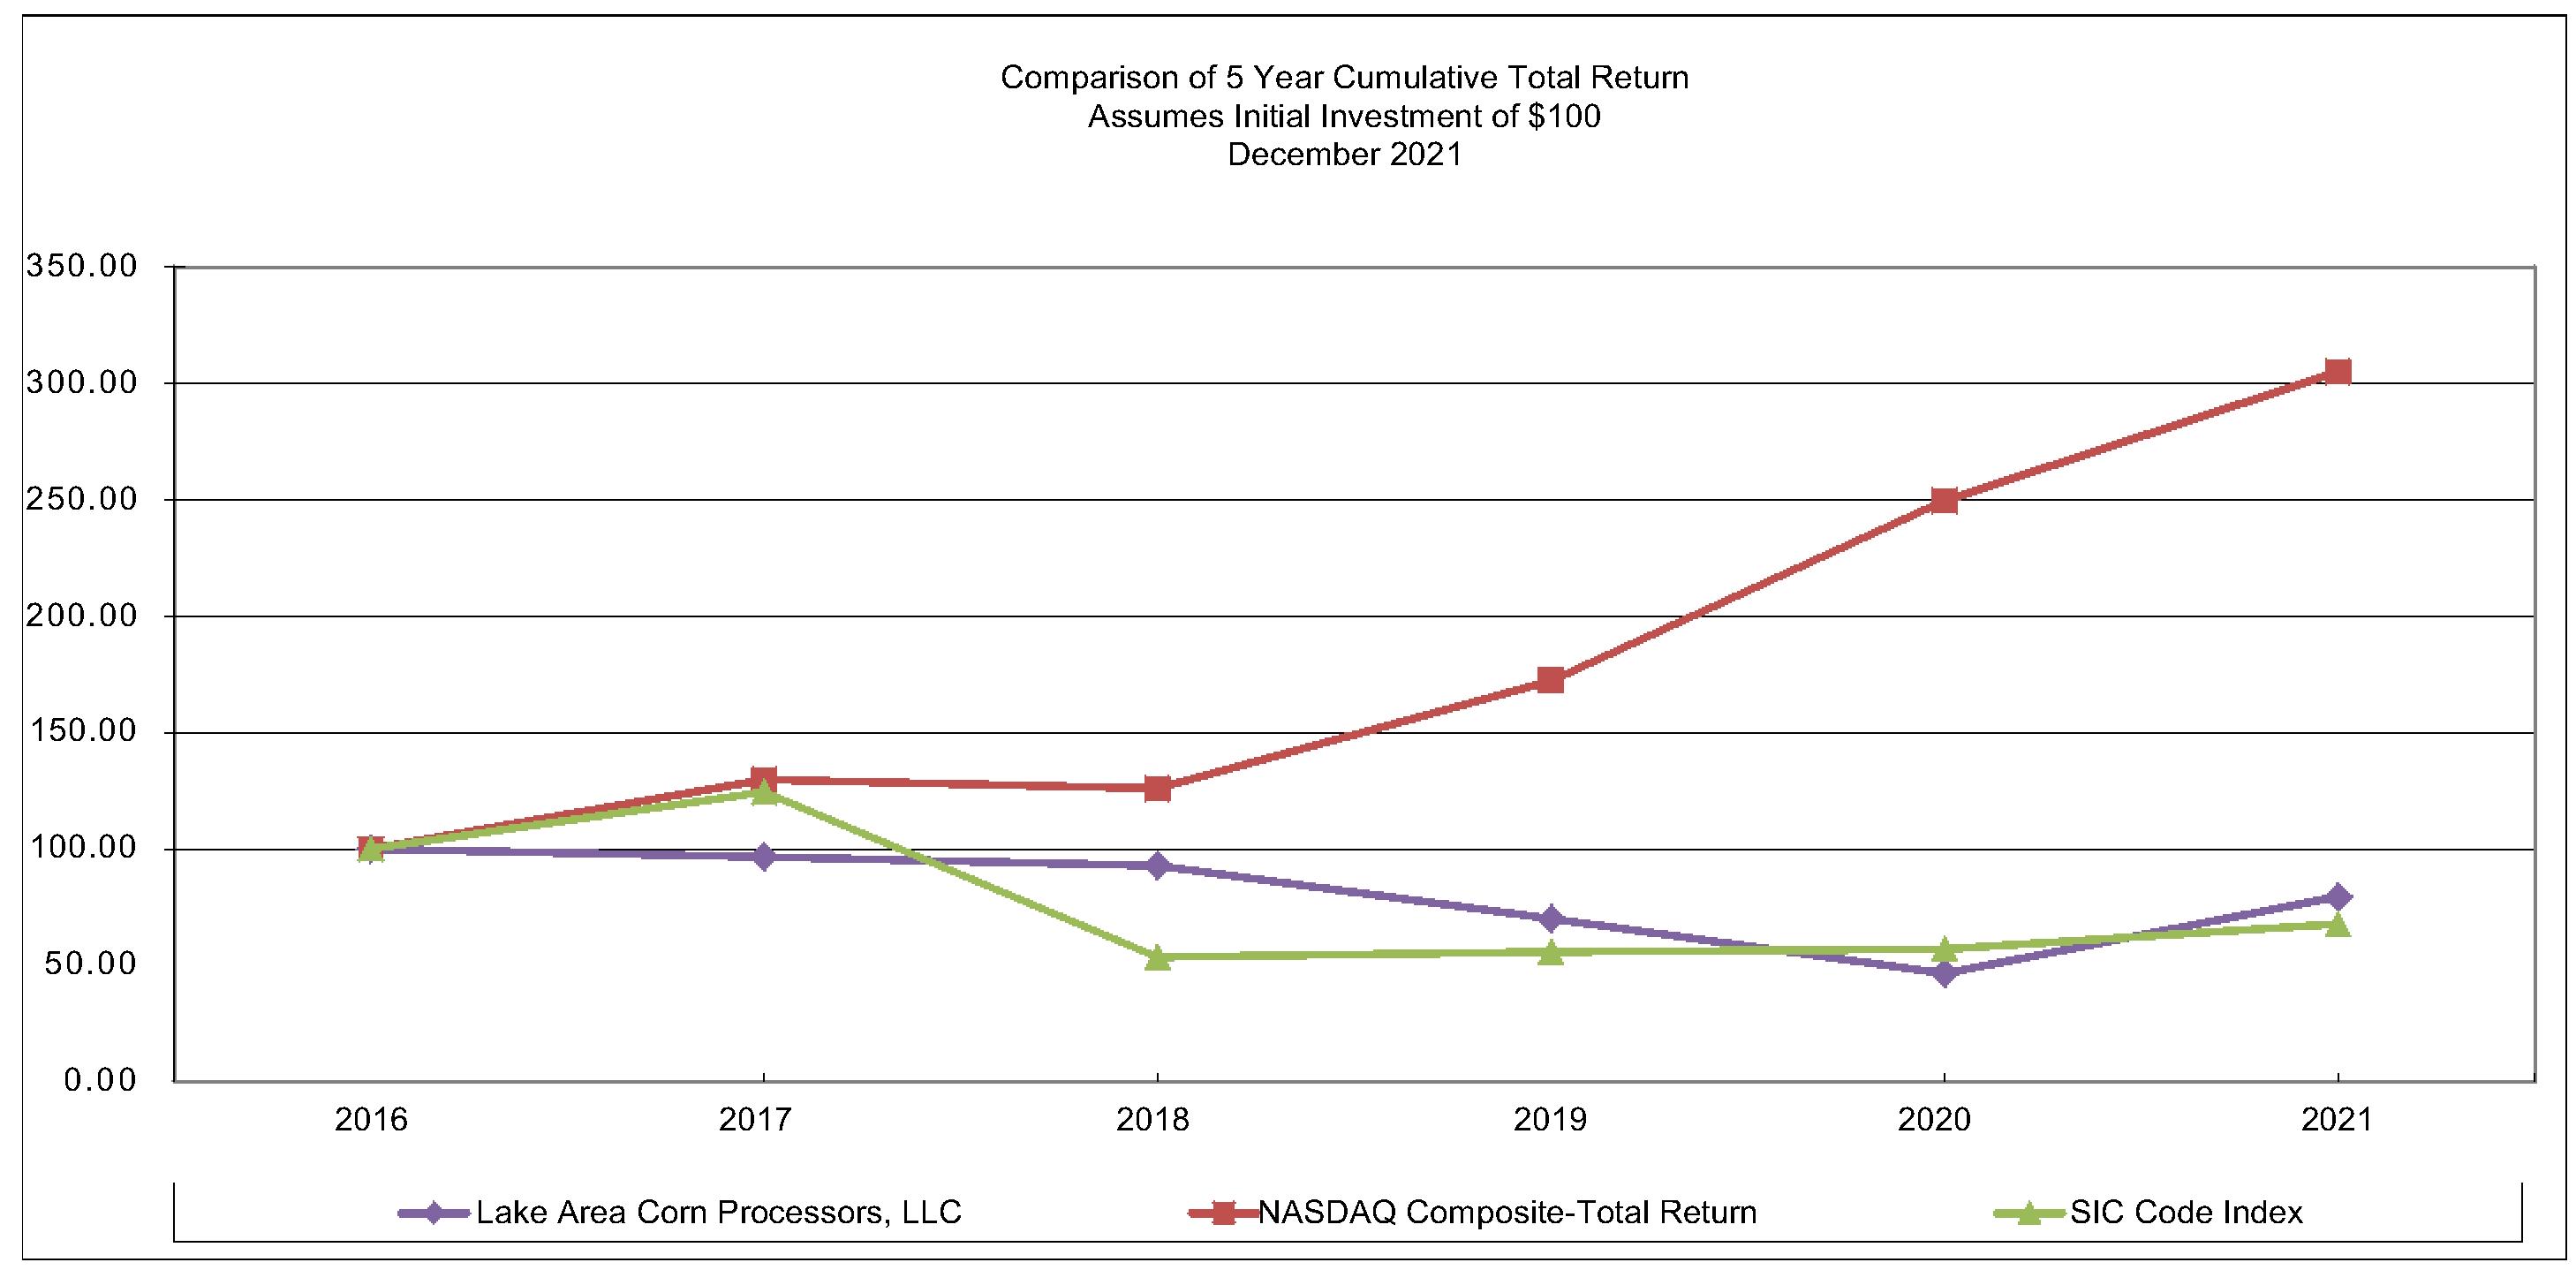
Pursuant to the rules and regulations of the Securities and Exchange Commission, the performance graph and the information set forth therein shall not be deemed to be filed for purposes of Section 18 of the Securities Exchange Act of 1934, and shall not be deemed to be incorporated by reference in any filing under the Securities Act of 1933, as amended, or the Exchange Act, except as shall be expressly set forth by specific reference in such a filing.
ITEM 6. RESERVED.
ITEM 7. MANAGEMENT'S DISCUSSION AND ANALYSIS OF FINANCIAL CONDITION AND RESULTS OF OPERATIONS.
Results of Operations
Comparison of the Fiscal Years Ended December 31, 20212023 and 20202022
The following table shows the results of our operations and the percentage of revenues, cost of revenues, operating expenses and other items to total revenues in our consolidated statements of operations for the fiscal years ended December 31, 20212023 and 2020:2022:
| | 2021 | | 2020 |
| | 2023 | | | | 2023 | | 2022 |
| Income Statement Data | Income Statement Data | | Amount | | % | | Amount | | % | Income Statement Data | | Amount | | % | | Amount | | % |
| Revenue | Revenue | | $ | 258,989,603 | | | 100.0 | | | $ | 130,521,814 | | | 100.0 | |
| | Cost of Revenues | Cost of Revenues | | 207,275,615 | | | 80.0 | | | 124,493,268 | | | 95.4 | |
| Cost of Revenues | |
| Cost of Revenues | |
| | Gross Profit | |
| Gross Profit | |
| Gross Profit | Gross Profit | | 51,713,988 | | | 20.0 | | | 6,028,546 | | | 4.6 | |
| | Operating Expense | Operating Expense | | 5,430,294 | | | 2.1 | | | 4,418,074 | | | 3.4 | |
| Operating Expense | |
| Operating Expense | |
| | Income from Operations | |
| Income from Operations | |
| Income from Operations | Income from Operations | | 46,283,694 | | | 17.9 | | | 1,610,472 | | | 1.2 | |
| | Other Income (Expense) | Other Income (Expense) | | 10,802,592 | | | 4.1 | | | (554,833) | | | (0.4) | |
| Other Income (Expense) | |
| Other Income (Expense) | |
| | Net Income | Net Income | | $ | 57,086,286 | | | 22.0 | | | $ | 1,055,639 | | | 0.8 | |
| Net Income | |
| Net Income | |
Revenues
Revenue from ethanol sales increased by approximately 105.4%1.4% during our 20212023 fiscal year compared to the same period of 2020.2022. Revenue from distillers grains sales increaseddecreased by approximately 61.3%5.4% during our 20212023 fiscal year compared to the same period of 2020.2022. Revenue from corn oil sales increaseddecreased by approximately 141.0%10.4% during our 20212023 fiscal year compared to the same period of 2020.2022.
Ethanol
Our ethanol revenue increased by approximately 105.4%1.4% during our 20212023 fiscal year compared to our 20202022 fiscal year. This increase in ethanol revenue was primarily due to increasedan increase in the gallons sold partially offset by a decrease in the average price we received per gallon of ethanol sold and increased gallons of ethanol sold. during our 2023 fiscal year.
The average price per gallon we received for our ethanol during our 20212023 fiscal year was approximately 90.6% higher11.0% lower compared to our 20202022 fiscal year. Management attributes this increasedecrease in the average price we received per gallon of ethanol with higher corn prices along with increasedlower gasoline demand.prices. Since ethanol is typically blended with gasoline, when gasoline demand is higher,prices are lower, it has a corresponding impact on ethanol demand.prices. As a result, we experienced a significant increasedecrease in average ethanol prices during our 20212023 fiscal year. Ethanol exports were lowerhigher during our 20212023 fiscal year compared to our 20202022 fiscal year as COVID-19 restrictions are still impacting the global market.which increased demand for ethanol and had an impact on market ethanol prices. Management expects ethanol prices to remain stable during our 20222024 fiscal year.
Ethanol sales volumes were greaterincreased during our 20212023 fiscal year compared to the same period of 20202022 due primarily to lackincreased production as a result of COVID-19 pandemic related shutdowns.the fermentation expansion added in August 2022 along with decreases in ethanol inventory. The total gallons of ethanol we sold during our 20212023 fiscal year was approximately 7.8%13.9% greater compared to the same period of 2020.2022. Management anticipates similar ethanolcomparable production and sales during our 2022 fiscal year provided ethanol demand remains stable during the year.2024 fiscal.
Distillers Grains
Our total distillers grains revenue increaseddecreased by approximately 61.3%5.4% for our 20212023 fiscal year compared to the same period of 2020.2022. The increasedecrease in revenue from distillers grains was primarily due to increased tons sold due to no prolonged plant shutdowns in 2021 and sales price ofdecreased average prices for our distillers grains sold during our 20212023 fiscal year. For our 20212023 fiscal year, we sold approximately 35.1%29.0% of our total distillers grains, by volume, in the dried form and approximately 64.9%71.0% of our total distillers grains in the modified/wet form. For our 20202022 fiscal year, we sold approximately 38.1%31.9% of our total distillers grains, by volume, in the dried form and approximately 61.9%68.1% of our total distillers grains in the modified/wet form. The average price
we received for our modified/wet distillers grains was approximately 52.3% more4.0% lower for our 20212023 fiscal year compared to the same period of 2020.2022. Modified/wet distillers grains have a shorter shelf life and are more expensive to transport compared to dried distillers grains. As a result, they are only sold in our local market.
The average price we received for our dried distillers grains was approximately 50.1% greater8.2% lower during our 20212023 fiscal year compared to the same period of 2020.2022. Management attributes this increasedecrease in dried distillers grains prices with an increasea decrease in the domestic price of corn.
Management expects that distillers grains prices will remain similarlower during our 20222024 fiscal year due to anticipated stablelower corn prices during our 20222024 fiscal year which typically have a direct impact on distillers grains prices. Further, if China and the United States reach an agreement on trade disputes which have occurred in recent years, it may have a positive impact on distillers grains prices and demand.
Management anticipates similarcomparable distillers grains production during our 20222024 fiscal year compared to our 2021 fiscal year due to anticipated similar production at the ethanol plant provided ethanol demand remains steady during our 20222023 fiscal year.
Corn Oil
Our total corn oil revenue increaseddecreased by approximately 141.0%10.4% during our 20212023 fiscal year compared to the same period of 2020.2022. Our total pounds of corn oil sold increased by approximately 16.0%4.5% during our 20212023 fiscal year compared to the same period of 2020,2022, primarily due to a lack of pandemic related plant shutdowns.increased production from the 2022 fermentation expansion. Management anticipates similar corn oil production during our 20222024 fiscal year compared to our 2021 fiscal year due to anticipated similar production provided ethanol demand remains at current levels allowing us to operate the ethanol plant at capacity during our 20222023 fiscal year.
The average price we received for our corn oil was approximately 107.8% greater14.3% less during our 20212023 fiscal year compared to the same period of 2020.2022. Management believes that corn oil prices were higherlower due primarily to demand fromincreased global supply. During 2023, the renewable diesel and biodiesel industry along with higher soybean oil prices. The biodiesel blenders' tax credit was reinstated through 20222024 so we expect that corn oil demand will remain highstrong through 2022.2025.
Cost of Revenues
The primary raw materials we use to produce ethanol, distillers grains and corn oil are corn and natural gas.
Corn
Our cost of revenues relating to corn was approximately 87.5% greater11.0% lower for our 20212023 fiscal year compared to the same period of 2020.2022. Our average cost per bushel of corn increaseddecreased by approximately 71.1%15.1% for our 20212023 fiscal year compared to our 20202022 fiscal year. Management attributes the increasedecrease in corn prices to high demand mixed with global supply concerns. Corn demand was higher duea larger number of bushels harvested in 2023 compared to increased export demand for United States corn.2022. Management anticipates corn prices will be stable with the possibility of a slight increaselower during our 20222024 fiscal year due to anticipated weather conditions.increased production and carry over from 2023 crop year.
We used approximately 9.6%4.9% more bushels of corn during our 20212023 fiscal year compared to the same period of 20202022 due to the increased overall production atfrom the ethanol plant during our 2021 fiscal year.2022 fermentation expansion. Management expects our corn consumption will be similar during our 20222024 fiscal year compared to our 20212023 fiscal year due to anticipated similar ethanol production during our 20222024 fiscal year provided ethanol demand remains steady during our 20222024 fiscal year.
We experienced approximately $3,967,000$6,653,000 of combined realized and unrealized loss for our 20212023 fiscal year related to our corn derivative instruments which increased our cost of goods sold. By comparison, we experienced approximately $1,627,000$5,034,000 of combined realized and unrealized loss for our 20202022 fiscal year related to our corn derivative instruments which increased our cost of goods sold. We recognize the gains or losses that result from the changes in the value of our derivative instruments from corn in cost of goods sold as the changes occur. As corn prices fluctuate, the value of our derivative instruments are impacted, which affects our financial performance.
Natural Gas
Our cost of revenues related to natural gas decreased by approximately 2.6% for our 2023 fiscal year compared to our 2022 fiscal year. This decrease was due to lower natural gas costs per MMBtu during our 2023 fiscal year compared to the same period of 2022. Natural gas prices were lower during our 2023 fiscal year compared to the same period of 2022 primarily because of decreased natural gas demand. Our average cost per MMBtu of natural gas during our 2023 fiscal year was approximately 7.4% lower compared to the cost for our 2022 fiscal year. Management anticipates similar natural gas costs per MMBtu during 2024.
We used approximately 5.2% more MMBtus of natural gas during our 2023 fiscal year compared to the same period of 2022 due to increased ethanol production as a result of the 2022 fermentation expansion. Management anticipates that our natural gas consumption during our 2024 fiscal year will comparable to our 2023 year.
Operating Expense
Our operating expenses were higher for our 2023 fiscal year compared to the same period of 2022 due primarily to increased wages, insurance premiums, and amortization.
Other Income and Expense
Our other income increased during the 2023 fiscal year compared to our 2022 fiscal year due to the $2.5 million payment from the USDA Biofuel Producer Relief Program awarded during the 2023 fiscal year. We had more income from our equity method investments during our 2023 fiscal year compared to our 2022 fiscal year due to increased profitability in the ethanol industry which impacts the income generated by our investments. We had more interest expense during our 2023 fiscal year compared to our 2022 fiscal year due to higher interest rates on outstanding debt instruments.
Results of Operations
Comparison of the Fiscal Years Ended December 31, 2022 and 2021
The following table shows the results of our operations and the percentage of revenues, cost of revenues, operating expenses and other items to total revenues in our consolidated statements of operations for the fiscal years ended December 31, 2022 and 2021:
| | | | | | | | | | | | | | | | | | | | | | | | | | |
| | 2022 | | 2021 |
| Income Statement Data | | Amount | | % | | Amount | | % |
| Revenue | | $ | 282,564,697 | | | 100.0 | | | $ | 258,989,603 | | | 100.0 | |
| | | | | | | | |
| Cost of Revenues | | 255,710,981 | | | 90.5 | | | 207,275,615 | | | 80.0 | |
| | | | | | | | |
| Gross Profit | | 26,853,716 | | | 9.5 | | | 51,713,988 | | | 20.0 | |
| | | | | | | | |
| Operating Expense | | 4,954,621 | | | 1.8 | | | 5,430,294 | | | 2.1 | |
| | | | | | | | |
| Income (Loss) from Operations | | 21,899,095 | | | 7.8 | | | 46,283,694 | | | 17.9 | |
| | | | | | | | |
| Other Income (Expense) | | 5,402,862 | | | 1.8 | | | 10,802,592 | | | 4.1 | |
| | | | | | | | |
| Net Income (Loss) | | $ | 27,301,957 | | | 9.6 | | | $ | 57,086,286 | | | 22.0 | |
Revenues
Revenue from ethanol sales increased by approximately 2.9% during our 2022 fiscal year compared to the same period of 2021. Revenue from distillers grains sales increased by approximately 29.1% during our 2022 fiscal year compared to the same period of 2021. Revenue from corn oil sales increased by approximately 40.1% during our 2022 fiscal year compared to the same period of 2021.
Ethanol
Our ethanol revenue increased by approximately 2.9% during our 2022 fiscal year compared to our 2021 fiscal year. This increase in ethanol revenue was primarily due to an increased in the average price we received per gallon of ethanol sold and a slight increase in gallons of ethanol sold during our 2022 fiscal year. The average price we received for our ethanol during our 2022 fiscal year was approximately 2.0% higher compared to our 2021 fiscal year. Management attributes this increase in the average price we received per gallon of ethanol with higher corn prices along with increased gasoline demand and prices. Since ethanol is typically blended with gasoline, when gasoline demand is higher, it has a corresponding impact on ethanol demand. As a result, we experienced an increase in average ethanol prices during our 2022 fiscal year. Ethanol exports were higher during our 2022 fiscal year compared to our 2021 fiscal year which increased demand for ethanol and had an impact on market ethanol prices.
Ethanol sales volumes were similar during our 2022 fiscal year compared to the same period of 2021 due primarily to consistent operational of the ethanol plant. The total gallons of ethanol we sold during our 2022 fiscal year was approximately 0.9% greater compared to the same period of 2021.
Distillers Grains
Our total distillers grains revenue increased by approximately 29.1% for our 2022 fiscal year compared to the same period of 2021. The increase in revenue from distillers grains was primarily due to increased average prices for our distillers grains along with increased tons of distillers grains sold during our 2022 fiscal year. For our 2022 fiscal year, we sold approximately 31.9% of our total distillers grains, by volume, in the dried form and approximately 68.1% of our total distillers grains in the modified/wet form. For our 2021 fiscal year, we sold approximately 35.1% of our total distillers grains, by volume, in the dried form and approximately 64.9% of our total distillers grains in the modified/wet form. The average price we received for our modified/wet distillers grains was approximately 21.1% higher for our 2022 fiscal year compared to the same period of 2021. Modified/wet distillers grains have a shorter shelf life and are more expensive to transport compared to dried distillers grains. As a result, they are only sold in our local market.
The average price we received for our dried distillers grains was approximately 16.9% higher during our 2022 fiscal year compared to the same period of 2021. Management attributes this increase in dried distillers grains prices with an increase in the domestic price of corn.
Corn Oil
Our total corn oil revenue increased by approximately 40.1% during our 2022 fiscal year compared to the same period of 2021. Our total pounds of corn oil sold increased by approximately 4.5% during our 2022 fiscal year compared to the same period of 2021, primarily due to increased corn oil extraction efficiency.
The average price we received for our corn oil was approximately 34.1% greater during our 2022 fiscal year compared to the same period of 2021. Management believes that corn oil prices were higher due primarily to demand from the renewable diesel and biodiesel industry along with higher soybean oil prices. During 2022, the biodiesel blenders' tax credit was reinstated through 2024 so we expect that corn oil demand will remain high through 2024.
Cost of Revenues
The primary raw materials we use to produce ethanol, distillers grains and corn oil are corn and natural gas.
Corn
Our cost of revenues relating to corn was approximately 24.8% higher for our 2022 fiscal year compared to the same period of 2021. Our average cost per bushel of corn increased by approximately 18.8% for our 2022 fiscal year compared to our 2021 fiscal year. Management attributes the increase in corn prices to high demand mixed with global supply concerns and a smaller number of bushels harvested in 2022 compared to 2021. Corn demand was higher due to increased export demand for United States corn.
We used approximately 3.9% more bushels of corn during our 2022 fiscal year compared to the same period of 2021 due to decreased fermentation efficiency at the ethanol plant during our 2022 fiscal year.
We experienced approximately $5,034,000 of combined realized and unrealized loss for our 2022 fiscal year related to our corn derivative instruments which increased our cost of goods sold. By comparison, we experienced approximately $3,967,000 of combined realized and unrealized loss for our 2021 fiscal year related to our corn derivative instruments which increased our cost of goods sold. We recognize the gains or losses that result from the changes in the value of our derivative instruments from corn in cost of goods sold as the changes occur. As corn prices fluctuate, the value of our derivative instruments are impacted, which affects our financial performance.
Natural Gas
Our cost of revenues related to natural gas increased by approximately 64.1%17.6% for our 20212022 fiscal year compared to our 20202021 fiscal year. This increase was due to higher natural gas costs per MMBtu during our 20212022 fiscal year compared to the same period of 2020.2021. Natural gas prices were higher during our 20212022 fiscal year compared to the same period of 2020
2021 primarily because of increased natural gas demand. Our average cost per MMBtu of natural gas during our 20212022 fiscal year was approximately 58.0% more19.1% higher compared to the cost for our 20202021 fiscal year. Management anticipates similar natural gas costs per MMBtu during 2022.
We used approximately 3.8% more1.2% fewer MMBtus of natural gas during our 20212022 fiscal year compared to the same period of 2020. Management anticipates that our natural gas consumption during our 2022 fiscal year will remain steady2021 due to similar production during our 2022 fiscal year.less distillers grains which were produced in the dried form which uses natural gas.
Operating Expense
Our operating expenses were higherlower for our 20212022 fiscal year compared to the same period of 20202021 due primarily to increaseddecreased wages and benefits and property insurance premiums.offset by increased professional fees.
Other Income and Expense
Our interest and other income was greaterlower during our 20212022 fiscal year compared to our 20202021 fiscal year due to lower gains on investments and forgiveness of the Paycheck Protection Program loan during the 2021 period.our investments. We had moreless income from our investments during our 20212022 fiscal year compared to our 20202021 fiscal year due to increaseddecreased profitability in the ethanol industry which impacts the income generated by our investments. We had less interest expense during our 20212022 fiscal year compared to our 20202021 fiscal year due to lower carrying balances on outstanding debt.
Results of Operations
Comparison of the Fiscal Years Ended December 31, 2020 and 2019
The following table shows the results of our operations and the percentage of revenues, cost of revenues, operating expenses and other items to total revenues in our consolidated statements of operations for the fiscal years ended December 31, 2020 and 2019:
| | | | | | | | | | | | | | | | | | | | | | | | | | |
| | 2020 | | 2019 |
| Income Statement Data | | Amount | | % | | Amount | | % |
| Revenue | | $ | 130,521,814 | | | 100.0 | | | $ | 115,986,821 | | | 100.0 | |
| | | | | | | | |
| Cost of Revenues | | 124,493,268 | | | 95.4 | | | 114,687,231 | | | 98.9 | |
| | | | | | | | |
| Gross Profit | | 6,028,546 | | | 4.6 | | | 1,299,590 | | | 1.1 | |
| | | | | | | | |
| Operating Expense | | 4,418,074 | | | 3.4 | | | 4,060,343 | | | 3.5 | |
| | | | | | | | |
| Income (Loss) from Operations | | 1,610,472 | | | 1.2 | | | (2,760,753) | | | (2.4) | |
| | | | | | | | |
| Other Income (Expense) | | (554,833) | | | (0.4) | | | (1,063,431) | | | (0.9) | |
| | | | | | | | |
| Net Income (Loss) | | $ | 1,055,639 | | | .8 | | | $ | (3,824,184) | | | (3.3) | |
Revenues
Revenue from ethanol sales increased by approximately 9.6% during our 2020 fiscal year compared to the same period of 2019. Revenue from distillers grains sales increased by approximately 20.4% during our 2020 fiscal year compared to the same period of 2019. Revenue from corn oil sales increased by approximately 35.6% during our 2020 fiscal year compared to the same period of 2019.
Ethanol
Our ethanol revenue increased by approximately 9.6% during our 2020 fiscal year compared to our 2019 fiscal year. This increase in ethanol revenue was due to increased gallons of ethanol produced and sold due to our plant expansion project partially offset by a lower average price we received per gallon of ethanol sold. The average price we received for our ethanol during our 2020 fiscal year was approximately 8.2% lower compared to our 2019 fiscal year. Management attributes this
decrease in the average price we received per gallon of ethanol with decreased gasoline demand due to travel restrictions from the COVID-19 pandemic. Since ethanol is typically blended with gasoline, when gasoline demand is lower, it has a corresponding impact on ethanol demand. As a result, we experienced a significant decrease in average ethanol prices during our first and second quarters of our 2020 fiscal year. Ethanol prices rebounded during our third and fourth quarters of our 2020 fiscal year. Ethanol exports were also lower during our 2020 fiscal year compared to our 2019 fiscal year as the COVID-19 pandemic had an impact on gasoline and ethanol demand globally.
Ethanol sales volumes were greater during our 2020 fiscal year compared to the same period of 2019 due to our plant expansion project, which was operational for our entire 2020 fiscal year, partially offset by lower ethanol sales during our first and second quarters of 2020 due to the COVID-19 pandemic. The total gallons of ethanol we sold during our 2020 fiscal year was approximately 19.4% greater compared to the same period of 2019.
Distillers Grains
Our total distillers grains revenue increased by approximately 20.4% for our 2020 fiscal year compared to the same period of 2019. The increase in revenue from distillers grains was primarily due to increased tons of distillers grains sold during our 2020 fiscal year. For our 2020 fiscal year, we sold approximately 38.1% of our total distillers grains, by volume, in the dried form and approximately 61.9% of our total distillers grains in the modified/wet form. For our 2019 fiscal year, we sold approximately 25.9% of our total distillers grains, by volume, in the dried form and approximately 74.1% of our total distillers grains in the modified/wet form. The average price we received for our modified/wet distillers grains was approximately 1.3% less for our 2020 fiscal year compared to the same period of 2019. Due to our plant expansion project, the supply of modified/wet distillers grains in our market is higher which has had an impact on the price we received for our modified/wet distillers grains.
The average price we received for our dried distillers grains was approximately 0.4% greater during our 2020 fiscal year compared to the same period of 2019. Management attributes this increase in dried distillers grains prices with lower distillers grains production in the United States due to reduced ethanol demand. This reduction in distillers grains production reduced the supply of distillers grains in the market which had a positive impact on prices.
Corn Oil
Our total corn oil revenue increased by approximately 35.6% during our 2020 fiscal year compared to the same period of 2019. Our total pounds of corn oil sold increased by approximately 27.4% during our 2020 fiscal year compared to the same period of 2019, primarily due to increased production due to our plant expansion project.
The average price we received for our corn oil was approximately 6.4% greater during our 2020 fiscal year compared to the same period of 2019. In addition, corn oil demand remained favorable due to demand from the biodiesel industry which uses corn oil as a feedstock to produce biodiesel. The biodiesel blenders' tax credit was reinstated through 2022 so we expect that corn oil demand will remain higher through 2022.
Cost of Revenues
The primary raw materials we use to produce ethanol, distillers grains and corn oil are corn and natural gas.
Corn
Our cost of revenues relating to corn was approximately 8.1% greater for our 2020 fiscal year compared to the same period of 2019. Our average cost per bushel of corn decreased by approximately 10.0% for our 2020 fiscal year compared to our 2019 fiscal year. Management attributes the decrease in corn prices to decreased corn demand from the ethanol industry. Corn demand was lower due to decreased ethanol demand during the COVID-19 pandemic.
We used approximately 19.9% more bushels of corn during our 2020 fiscal year compared to the same period of 2019 due to increased overall production at the ethanol plant during our 2020 fiscal year.
We experienced approximately $1,627,000 of combined realized and unrealized loss for our 2020 fiscal year related to our corn derivative instruments which increased our cost of goods sold. By comparison, we experienced approximately $906,000 of combined realized and unrealized loss for our 2019 fiscal year related to our corn derivative instruments which increased our cost of goods sold We recognize the gains or losses that result from the changes in the value of our derivative instruments from corn in cost of goods sold as the changes occur. As corn prices fluctuate, the value of our derivative instruments are impacted, which affects our financial performance.
Natural Gas
Our cost of revenues related to natural gas increased by approximately 10.8% for our 2020 fiscal year compared to our 2019 fiscal year. This increase was due to increased consumption due to our plant expansion project, partially offset by lower natural gas costs per MMBtu during our 2020 fiscal year compared to the same period of 2019. Natural gas prices were lower during our 2020 fiscal year compared to the same period of 2019 primarily because of decreased natural gas demand and lower energy prices generally during 2020 which decreased natural gas prices during that period of time. Our average cost per MMBtu of natural gas during our 2020 fiscal year was approximately 6.7% less compared to the cost for our 2019 fiscal year.
We used approximately 18.6% more MMBtus of natural gas during our 2020 fiscal year compared to the same period of 2019 due to increased overall production due to our plant expansion project.
Operating Expense
Our operating expenses were higher for our 2020 fiscal year compared to the same period of 2019 due primarily to increased professional fees and property insurance premiums.
Other Income and Expense
Our interest and other income was greater during our 2020 fiscal year compared to our 2019 fiscal year due to additional dividend income from our lender during the 2020 period. Our equity in net income of our investments was higher during our 2020 fiscal year compared to our 2019 fiscal year due to increased profitability in the ethanol industry which impacts the income generated by our investments. We had significantly more interest expense during our 2020 fiscal year compared to our 2019 fiscal year due to borrowing for our plant expansion project. During the time the expansion was under construction, interest was capitalized. When the expansion became operational, subsequent interest was expensed to our statement of operations.
Changes in Financial Condition for the Fiscal Year Ended December 31, 20212023 compared to the Fiscal Year Ended December 31, 2020.2022.
Current Assets
We had more cash and cash equivalents at December 31, 20212023 compared to December 31, 2020,2022, primarily due to increased deferred payments on corn liability along with increasedmore net income and decreased member distribution payments during our 20212023 fiscal year compared to our 2022 fiscal year. We had lessmore accounts receivable at December 31, 2021,2023, compared to December 31, 2020, due to increased advance payments. We had increased inventory values at December 31, 2021, compared to December 31, 2020,2022, due primarily to the timing of our year end and the payments received related to the shipments of our products as well as higherproducts. We had decreased inventory values at December 31, 2023, compared to December 31, 2022, due primarily to lower corn values and decreased ethanol prices which increase the value of our inventory.volume on hand. The value of our derivative financial instruments was greaterlower at December 31, 20212023 and December 31, 2022. We had more prepaid and other expenses at December 31, 2023 compared to December 31, 2020, primarily because we had more cash in2022 due to our margin account asprepayment for the firm commitment of December 31, 2021 compared to December 31, 2020. We had more prepaid expenses at December 31, 2021 compared to December 31, 2020 due tonatural gas transportation with Northern Natural Gas along with insurance premium increases during our 20212023 fiscal year.
Property and Equipment
The value of our property and equipment was lower at December 31, 20212023 compared to December 31, 2020 due to2022 primarily as a result of the regular depreciation of our assets offset by new construction of water well field equipment during our 20212023 fiscal year.
Other Assets
The value of our investments was greaterhigher at December 31, 2021,2023, compared to December 31, 2020, mainly2022, due to earningsthe recent purchase of additional shares in excess of distributionsGuardian Hankinson as well as the profitability from our investments during the 20212023 fiscal year. We had more other assets at December 31, 2023, compared to December 31, 2022 due primarily to the prepayment for the firm commitment on natural gas transportation with Northern Natural Gas.
Current Liabilities
At December 31, 2021,2023, we had moreless checks which were issued in excess of the amount of cash we had in our bank accounts, compared to at December 31, 2020,2022, due to the timing of transfers between our accounts.year end and payments issued. Any checks which are presented for payment in excess of the balances in our bank accounts are paid from our revolving lines of credit. Our accounts payable was higherlower at December 31, 2021,2023, compared to December 31, 2020,2022, due to increaseddecreased deferred corn payables at the end
of our 20212023 fiscal year.year due in part to lower market corn prices. We had more accrued liabilities at December 31, 2021,2023, compared to December 31, 20202022 due to more administrative payablesincreased accrued interest and accrued payroll at the end of the 20212023 fiscal year. The liability on our balance sheet related to our derivative instruments was more at December 31, 2021,2023, compared to December 31, 2020,2022, due to having more unrealized losses on our forward corn purchases at December 31, 2021,2023, compared to at December 31, 2020.2022. The current portion of our long-term debt payments was less at December 31, 2021 and at2023 compared to December 31, 20202022 due to the forgivenessan early payoff of the Paycheck Protection Program Loan we received in 2020.our term note.
Long-Term Liabilities
Our long-term liabilities were lessmore at December 31, 2021,2023, compared to December 31, 2020,2022, due to decreased borrowings and reductions in notes payable resulting from increased profitability.used for the purchase of additional shares of Guardian Hankinson during the 2023 fiscal year.
Liquidity and Capital Resources
Our main sources of liquidity are cash from our continuing operations, distributions we receive from our investments and amounts we have available to draw on our revolving credit facilities. Management does not anticipate that we will need to raise additional debt or equity financing in the next twelve months and management believes that our current sources of liquidity will be sufficient to continue our operations during that time period. We anticipate that any capital expenditures we undertake will be paid out of cash from operations and existing loans, but will not require any additional debt or equity financing.
Currently, we have two revolving loans which allow us to borrow funds for working capital. These two revolving loans are described in greater detail below in the section entitled "Item 7 - Management's Discussion and Analysis of Financial Condition and Results of Operations - Indebtedness." As of December 31, 2021,2023, we had $0$20,001,000 outstanding and $48,250,000$59,999,000 available to be drawn on these revolving loans. Management anticipates that this is sufficient to maintain our liquidity and continue our operations.
The following table shows cash flows for the fiscal years ended December 31, 20212023 and 2020:2022:
| | Fiscal Years Ended December 31 |
| 2021 | | 2020 |
| | Fiscal Years Ended December 31 | | | | Fiscal Years Ended December 31 |
| | 2023 | | | | 2023 | | 2022 |
| Net cash provided by operating activities | Net cash provided by operating activities | | $ | 59,720,664 | | | $ | 9,238,635 | |
| Net cash used in investing activities | Net cash used in investing activities | | (2,385,841) | | | (359,221) | |
| Net cash used in financing activities | Net cash used in financing activities | | (37,977,324) | | | (3,065,256) | |
Cash Flow From Operations. Our operating activities generatedprovided more cash during our fiscal year ended December 31, 2021,2023, compared to the same period of 2020,2022, primarily due to having moreincreased net income and decreased inventory partially offset by a decrease in accounts payable during the 20212023 period.
Cash Flow From Investing Activities. Our investing activities used more cash during our fiscal year ended December 31, 2021,2023, compared to the same period of 2020, primarily because we had more capital expenditures during the 2021 period compared2022, due to the 2020 period.increased purchases of investments.
Cash Flow From Financing Activities. Our financing activities used moreless cash during our fiscal year ended December 31, 2021,2023, compared to the same period of 2020,2022, due primarily due to net payments on borrowings andless distributions paid to members and net borrowings during the 20212023 period compared to net proceeds from borrowings during the same period of 2020.2022.
The following table shows cash flows for the fiscal years ended December 31, 20202022 and 2019:2021:
| | Fiscal Years Ended December 31 |
| 2020 | | 2019 |
| | Fiscal Years Ended December 31 | | | | Fiscal Years Ended December 31 |
| | 2022 | | | | 2022 | | 2021 |
| Net cash provided by operating activities | Net cash provided by operating activities | | $ | 9,238,635 | | | $ | 7,517,770 | |
| Net cash used in investing activities | Net cash used in investing activities | | (359,221) | | | (9,700,103) | |
| Net cash provided by (used in) financing activities | | (3,065,256) | | | 13,308,049 | |
| Net cash used in financing activities | |
Cash Flow From Operations. Our operating activities generated less cash during our fiscal year ended December 31, 2020,2022, compared to the same period of 2019,2021, primarily due to having less net income during the 2020 period which was partially offset by an increase in accounts payable which had a positive impact on cash during the 20202022 period.
Cash Flow From Investing Activities. Our investing activities used lessmore cash during our fiscal year ended December 31, 2020,2022, compared to the same period of 2019, primarily because we had less capital expenses related2021, due to increased purchases of property and equipment as well as our expansion project during the 2020 period compared to the 2019 period.prepayment for our natural gas transportation services agreement.
Cash Flow From Financing Activities. Our financing activities providedused less cash during our fiscal year ended December 31, 2020,2022, compared to the same period of 2019,2021, due primarily due to fewer net proceeds from borrowing we incurredless distributions paid to members during the 20202022 period offset by decreased distributions to our members.
Indebtedness
We maintain a comprehensive credit facility with Farm Credit Services of America, PCA and Farm Credit Services of America, FLCA (collectively "FCSA"). We have a $2 million revolving operating line of credit (the "Operating Line") and a $46 million reducing revolving loan (the "Reducing Revolving Loan"). All of our assets, including the ethanol plant and equipment, its accounts receivable and inventory, serve as collateral for our loans with FCSA.
On August 1, 2017, we executed an amendment to our credit agreement to create an $8 million term loan, which we used to finance a portion of our investment in Ring-neck Energy & Feed, LLC.
On February 6, 2018, we executed an Amended and Restated Credit Agreement (the "Credit Agreement") with FCSA. Pursuant to the Credit Agreement, our total credit availability is $40 million to support our expansion project. The credit availability matures on January 1, 2026. Interest on the outstanding principal balance will accrue at the one month London Interbank Offered Rate ("LIBOR") plus 325 basis points until February 1,September 27, 2023, and the basis increases to 350 points thereafter until maturity. The interest rate is not subject to a floor. We agreed to pay a fee of 0.50% on the unused portion of the increased credit availability.
On October 21, 2019, we entered into a Second Amendment to Amended and Restated Credit Agreement (the "Loan Amendment") with FCSA. In the Loan Amendment, we extended the maturity date of our $10 million revolving loan to November 1, 2021; we also extended the date when the available balance of our $40 million revolving loan started to decrease from January 1, 2020 to January 1, 2021.
On June 5, 2020, we entered into a ThirdFifth Amendment to the credit agreement (the "Third"Fifth Amendment"). Under the Third Amendment, the available credit under the revolving operating note was reduced to $2,000,000 and the available credit on the reducing revolving note was increased to $48,000,000. The working capital covenant was reduced to $11,000,000, and the net worth covenant was reduced to $18,000,000. The next measurement date for the debt service coverage ratio was deferred until December 31, 2021. The annual installment on the term note for 2020 was deferred until maturity in 2025. The interest rates were unchanged.
On October 11, 2021, we entered into a Fourth Amendment to the credit agreement (the "Fourth Amendment"). Under the FourthFifth Amendment, the operating lines'slines' available credit increased to $20,000,000 and the maturity date was extended to November 1, 2023.2025. Interest on the outstanding principal balance of the operating line will accrue at the Secured Overnight Financing Rate ("SOFR") 30-Day Average RateSOFR 30 plus 305300 basis points. The available credit on the reducing revolving note is $46,250,000.increased to $60,000,000 and the maturity was extended to November 1, 2030. Interest on the outstanding principal balance of the revolving loan and term loan will accrue at the SOFR 30-Day Average Rate30 plus 330325 basis points. The minimum working capital covenant was increased to $13,500,000,$15,000,000, and the minimum net worth covenant was increased to $28,000,000.$30,000,0000. Dakota Ethanol may make distributions in an amount up to 75% of prior year's net income, so long as the Company's working capital stays above $18,000,000$20,000,000 post distribution. The combined distributions for 2021 and 2022 shall also be limited to 75% of the combined net income of 2020 and 2021.
Operating Line
On October 21, 2019, Dakota Ethanol amended thehas a revolving promissory note from Farm Credit Services of AmericaFCSA in thean amount up to $10,000,000 or the amount available in accordance with the borrowing base calculation, whichever is less. On June 5, 2020, the available balance of the Operating Line was reduced to $2,000,000.$20,000,000. Interest on the outstanding principal balance will accrue at 305300 basis points above the SOFR 30-day average rate30 and is not subject to a floor. The rate was 3.10%8.34% at December 31, 2021.2023. There is a non-use fee of 0.25% per annum on the unused portion of the $2,000,000 availability. The note is collateralized by substantially all assets of the Company. The note expires on November 1, 2023.2025. On December 31,
2021, 2023, Dakota Ethanol had $0 outstanding and $0$20,000,000 available to be drawn on the revolving promissory note under the borrowing base calculation.note.
Reducing Revolving Loan
On February 6, 2018, Dakota Ethanol executedhas a reducing revolving promissory note from FCSA in the amount up to $40,000,000$60,000,000 or the amount available in accordance with the borrowing availability under the credit agreement. The available balance of the Reducing Revolving Loan was increased to $48,000,000 on June 5, 2020. The amount Dakota Ethanol can borrow on the note decreases by $1,750,000$2,500,000 semi-annually starting on JulyJanuary 1, 20212024 until the maximum balance reaches $32,250,000$40,000,000 on July 1, 2025.2027. The note matures on JanuaryNovember 1, 2026.2030. Interest on the outstanding principal balance will accrue at 330 basis points above the SOFR 30-day average rate.30
plus 325 basis points. The interest rate is not subject to a floor. The rate was 3.35%8.59% at December 31, 2021.2023. The note contains a non-use fee of 0.50%0.5% per annum on the unused portion of the note. On December 31, 2021,2023, Dakota Ethanol had $0$20,001,000 outstanding and $46,250,000$39,999,000 available to be drawn on the note.
2017 Term Loan
On August 1, 2017, Dakota Ethanol executedhad a term note withfrom FCSA in the amount of $8 million.$8,000,000. Dakota Ethanol agreed to makemade monthly interest payments starting September 1, 2017 and annual principal payments of $1,000,000 starting$1,000,000. The note matured on August 1, 2018. The notes matures on August 1, 2025. The payment due on August 1, 2020 was deferred to August 1, 2025. Interest on the outstanding principal balance will accrueaccrued at 330325 basis points above the SOFR 30-day average rate.30. The interest rate iswas not subject to a floor. The rate was 3.35% at December 31, 2021. On December 31, 2021, Dakota Ethanol had $5,000,000 outstanding on the note.
2020 Loans
The Company entered into a loan agreement with the Small Business Association through First State Bank, Gothenburg, NE on April 4, 2020 for $760,400 as partbalance of the Paycheck Protection Program under Division A, Title I of the Coronavirus Aid, Relief and Economic Security Act (CARES Act). In June 2021, the Company received notification from the Small Business Administration that all loan proceeds and accrued interest received and recorded by the Company were forgiven. Due to forgiveness of the loan, the Company recorded a gain on debt extinguishmentterm note was paid off in other income in the statement of operations for $768,400 for the year ending December 31, 2021.
The Company also received an Economic Injury Disaster Loan (EIDL) in the amount of $10,000 in June 2020. The Company was notified by the Small Business Association in June 2021 that all EIDL proceeds received by the Company had been forgiven. Due to forgiveness of the loan, the Company recorded a gain on debt extinguishment in other income in the statement of operations for $10,000 for the year ending December 31, 2021.its entirety during July 2023.
Covenants
Our credit facilities with FCSA are subject to various loan covenants. If we fail to comply with these loan covenants, FCSA can declare us to be in default of our loans. The material loan covenants applicable to our credit facilities are our working capital covenant, local net worth covenant and our debt service coverage ratio. We are required to maintain working capital (current assets minus current liabilities plus availability on our revolving loan) of at least $13.5$15 million. We are required to maintain local net worth (total assets minus total liabilities minus the value of certain investments) of at least $28$30 million. We are required to maintain a debt service coverage ratio of at least 1.25:1.00. Dakota Ethanol may make distributions in an amount up to 75% of prior year's net income, so long as the Company's working capital stays above $18,000,000$20,000,000 post distribution. The combined distributions for 2021 and 2022 shall also be limited to 75% of the combined net income of 2020 and 2021.
As of December 31, 2021,2023, we were in compliance with our financial covenants under the FCSA loans. Management's current financial projections indicate that we will be in compliance with our financial covenants for the next 12 months and we expect to remain in compliance thereafter. Management does not believe that it is reasonably likely that we will fall out of compliance with our material loan covenants in the next 12 months. If we fail to comply with the terms of our credit agreements with FCSA, and FCSA refuses to waive the non-compliance, FCSA may require us to immediately repay all amounts outstanding on our loans.
Contractual Cash Obligations
In addition to our debt obligations, we have certain other contractual cash obligations and commitments. The following table provides information regarding our consolidated contractual obligations and commitments as of December 31, 2021:2023:
| | Payments Due By Period |
| | Payments Due By Period | | | | Payments Due By Period |
| Contractual Cash Obligations | Contractual Cash Obligations | | Total | | Less than One Year | | One to Three Years | | Three to Five Years | | After Five Years | Contractual Cash Obligations | | Total | | Less than One Year | | One to Three Years | | Three to Five Years | | After Five Years |
| | | | | | | | | | | | |
| Long-Term Debt Obligations | Long-Term Debt Obligations | | $ | 6,220,920 | | | $ | 1,378,958 | | | $ | 2,614,014 | | | $ | 2,227,948 | | | $ | — | |
| Long-Term Debt Obligations | |
| Long-Term Debt Obligations | |
| | Purchase Obligations | |
| Purchase Obligations | |
| Purchase Obligations | Purchase Obligations | | 57,976,297 | | | 56,775,097 | | | 369,600 | | | 369,600 | | | 462,000 | |
| Capital Expenditures | Capital Expenditures | | 3,676,067 | | | 3,676,067 | | | — | | | — | | | — | |
| Total Contractual Cash Obligations | Total Contractual Cash Obligations | | $ | 67,873,284 | | | $ | 61,830,122 | | | $ | 2,983,614 | | | $ | 2,597,548 | | | $ | 462,000 | |
Application of Critical Accounting Policies
Management uses estimates and assumptions in preparing our consolidated financial statements in accordance with generally accepted accounting principles. These estimates and assumptions affect the reported amounts of assets and liabilities, the disclosure of contingent assets and liabilities, and the reported revenues and expenses. Of the significant accounting policies described in the notes to our consolidated financial statements, we believe that the following are the most critical:
Derivative Instruments
We enter into short-term forward, grain, option and futures contracts as a means of securing corn for the ethanol plant and managing exposure to changes in commodity prices. We enter into short-term forward, option and futures contracts for sales of ethanol to manage exposure to changes in commodity prices. All of our derivatives are designated as non-hedge derivatives, and accordingly are recorded at fair value with changes in fair value recognized in net income.income or treated as normal purchases and sales contracts and analyzed for inherent losses. Although the contracts are considered economic hedges of specified risks, they are not designated as nor accounted for as hedging instruments.
As part of our trading activity, we use futures and option contracts offered through regulated commodity exchanges to reduce our risk and we are exposed to risk of loss in the market value of inventories. To reduce that risk, we generally take positions using cash and futures contracts and options.
Unrealized gains and losses related to derivative contracts for corn and natural gas purchases are included as a component of cost of revenues and derivative contracts related to ethanol sales are included as a component of revenues in the accompanying financial statements. The fair values of derivative contracts are presented on the accompanying balance sheets as derivative financial instruments.
Goodwill
Annually, as well as when an event triggering impairment may have occurred, the Company performs an impairment test on goodwill. The Company performs a quantitative analysis that tests for impairment. The second step,goodwill which compares the fair value of the reporting unit with its carrying amount. An impairment charge is recognized, if necessary, measuresfor the impairment. Duringamount by which the first quartercarrying value exceeds the fair value up to the amount of 2020 a triggering event was determinedthe goodwill attributed to have occurred and an impairment test was performed as of March 31, 2020. The Company determined there was no impairment at that time.the reporting unit. The Company performs the annual analysis on December 31 of each fiscal year. The Company determined that there was no impairment of goodwill at December 31, 20212023 and 2020, respectively.2022.
Inventory Valuation
Inventories are generally valued using methods which approximate the lower of cost (first-in, first-out) or net realizable value. In the valuation of inventories, and purchase commitments, net realizable value is based on estimated selling prices in the ordinary course of business less reasonably predictable costs of completion, disposal and transportation.
Revenue Recognition
The Company generally recognizes revenue at a point in time when performance obligations are satisfied. Revenue from the production of ethanol and related products is recorded when control transfers to customers. Generally, ethanol and related products are shipped FOB shipping point, based on written contract terms between Dakota Ethanol and its customers. Collectability of revenue is reasonably assured based on historical evidence of collectability between Dakota Ethanol and its customers. Interest income is recognized as earned.
Shipping costs incurred by the Company in the sale of ethanol, dried distillers grains and corn oil are not specifically identifiable and as a result, revenue from the sale of those products is recorded based on the net selling price reported to the Company from the marketer.
ITEM 7A. QUANTITATIVE AND QUALITATIVE DISCLOSURES ABOUT MARKET RISK.
We are exposed to the impact of market fluctuations associated with commodity prices and interest rates as discussed below. We have no exposure to foreign currency risk as all of our business is conducted in U.S. Dollars. We use derivative financial instruments as part of an overall strategy to manage market risk. We use cash, futures and option contracts to hedge changes to the commodity prices of corn and natural gas. We do not enter into these derivative financial instruments for trading or speculative purposes, nor do we designate these contracts as hedges for accounting purposes.
Interest Rate Risk
We are exposed to market risk from changes in interest rates. Exposure to interest rate risk results primarily from holding loans which bear variable interest rates. As of December 31, 2021,2023, we had $5,000,000$20,001,000 outstanding on our variable interest rate loans with interest accruing at a rate of 3.35%8.59%. Our variable interest rates are calculated by adding a set basis to SOFR. If we were to experience a 10% increase in SOFR, the annual effect such change would have on our statement of operations, based on the amount we had outstanding on our variable interest rate loans as of December 31, 2021,2023, would be approximately $250.$107,000.
Commodity Price Risk
We are exposed to market risk from changes in commodity prices. Exposure to commodity price risk results from our dependence on corn and natural gas in the ethanol production process. We seek to minimize the risks from fluctuations in the prices of corn and natural gas through the use of hedging instruments In practice, as markets move, we actively manage our risk and adjust hedging strategies as appropriate. Although we believe our hedge positions accomplish an economic hedge against our future purchases, they are not designated as such for hedge accounting purposes, which would match the gain or loss on our hedge positions to the specific commodity purchase being hedged. We are marking to market our hedge positions, which means as the current market price of our hedge positions changes, the gains and losses are immediately recognized in our cost of revenues.
The immediate recognition of hedging gains and losses can cause net income to be volatile from quarter to quarter due to the timing of the change in value of the derivative instruments relative to the cost and use of the commodity being hedged. We recorded an increase to our cost of revenues of approximately $3,915,000$6,857,000 related to derivative instruments for our fiscal year ended December 31, 2021.2023. We recorded an increase to our cost of revenues of approximately $1,627,000$4,990,000 related to derivative instruments for the fiscal year ended December 31, 2020.2022. There are several variables that could affect the extent to which our derivative instruments are impacted by price fluctuations in the cost of corn or natural gas. However, it is likely that commodity cash prices will have the greatest impact on the derivatives instruments with delivery dates nearest the current cash price.
As of December 31, 2021,2023, we were committed to purchasing approximately 8.74.1 million bushels of corn with an average price of $5.95$4.75 per bushel. These corn purchases represent approximately 29%12% of our expected corn usage for the next 12 months. As corn prices move in reaction to market trends and information, our statement of operations will be affected depending on the impact such market movements have on the value of our derivative instruments. Depending on market movements, crop prospects and weather, these price protection positions may cause immediate adverse effects to our financial results, but are designed to produce long-term positive growth for us.
We have 291,000580,000 bushels of corn inventory delivered under delayed-pricing contracts. The contracts have various pricing deadlines through November 30, 2022.August 25, 2024. We are subject to risk of changes in the corn market until they are priced.
As of December 31, 2021,2023, we were committed to purchasing approximately 1,275,0001,495,000 MMBtus of natural gas with an average price of $3.68$3.50 per MMBtu. Under these arrangements, we assume the risk of a price decrease in the market price of natural gas between the time the price is fixed and the time the natural gas is delivered. We account for these transactions as normal purchases, and accordingly, we do not mark these transactions to market. The natural gas purchases represent approximately 63%71% of the projected annual plant requirements.
As of December 31, 2021,2023, we were committed to selling approximately 38,00046,000 dry equivalent tons of distillers grains with an average price of $192$189 per ton. The distillers grains sales represent approximately 18%21% of the projected annual plant production.
As of December 31, 2021,2023, we were committed to selling approximately 3,464,0001,709,000 pounds of distillers corn oil with an average price of $0.59$0.48 per pound. The distillers corn oil sales represent approximately 15%5% of the projected annual plant production.
We did not have any firm-priced sales commitments for ethanol as of December 31, 2021.2023.
A sensitivity analysis has been prepared to estimate our exposure to ethanol, corn and natural gas price risk. Market risk related to these factors is estimated as the potential change in income resulting from a hypothetical 10% adverse change in the average cost of our corn and natural gas prices and average ethanol price as of December 31, 2021,2023, net of the forward and future contracts used to hedge our market risk for corn and natural gas usage requirements. The volumes are based on our
expected use and sale of these commodities for a one year period from December 31, 2021.2023. The results of this analysis, which may differ from actual results, are as follows:
| | Estimated Volume Requirements for the next 12 months (net of forward and futures contracts) | | Unit of Measure | | Hypothetical Adverse Change in Price | | Approximate Adverse Change to Income |
| Estimated Volume Requirements for the next 12 months (net of forward and futures contracts) | | | Estimated Volume Requirements for the next 12 months (net of forward and futures contracts) | | Unit of Measure | | Hypothetical Adverse Change in Price | | Approximate Adverse Change to Income |
| Ethanol | Ethanol | 92,000,000 | | | Gallons | | 10 | % | | $ | 23,092,000 | |
| Corn | Corn | 25,525,393 | | | Bushels | | 10 | % | | $ | 15,065,087 | |
| Natural Gas | Natural Gas | 755,000 | | | MMBTU | | 10 | % | | $ | 272,555 | |
For comparison purposes, our sensitivity analysis for our 20202022 fiscal year is set forth below.
| | Estimated Volume Requirements for the next 12 months (net of forward and futures contracts) | | Unit of Measure | | Hypothetical Adverse Change in Price | | Approximate Adverse Change to Income |
| Estimated Volume Requirements for the next 12 months (net of forward and futures contracts) | | | Estimated Volume Requirements for the next 12 months (net of forward and futures contracts) | | Unit of Measure | | Hypothetical Adverse Change in Price | | Approximate Adverse Change to Income |
| Ethanol | Ethanol | 92,000,000 | | | Gallons | | 10 | % | | $ | 11,710,362 | |
| Corn | Corn | 27,299,311 | | | Bushels | | 10 | % | | $ | 12,257,390 | |
| Natural Gas | Natural Gas | 1,769,000 | | | MMBTU | | 10 | % | | $ | 449,149 | |
ITEM 8. FINANCIAL STATEMENTS AND SUPPLEMENTARY DATA.
REPORT OF INDEPENDENT REGISTERED PUBLIC ACCOUNTING FIRM (PCAOB ID: 49)
Members and Board of Managers
Lake Area Corn Processors, LLC
Opinion on the Financial Statements
We have audited the accompanying consolidated balance sheets of Lake Area Corn Processors, LLC and its subsidiary (the Company) as of December 31, 20212023 and 2020,2022, the related consolidated statements of operations, changes in members’ equity, and cash flows for each of the three years in the period ended December 31, 2021,2023, and the related notes to the consolidated financial statements (collectively, the financial statements). In our opinion, the financial statements present fairly, in all material respects, the financial position of the Company as of December 31, 20212023 and 20202022, and the results of its operations and its cash flows for each of the three years in the period ended December 31, 2021,2023, in conformity with accounting principles generally accepted in the United States of America.
Basis for Opinion
These financial statements are the responsibility of the Company’s management. Our responsibility is to express an opinion on the Company’s financial statements based on our audits. We are a public accounting firm registered with the Public Company Accounting Oversight Board (United States) (PCAOB) and are required to be independent with respect to the Company in accordance with U.S. federal securities laws and the applicable rules and regulations of the Securities and Exchange Commission and the PCAOB.
We conducted our audits in accordance with the standards of the PCAOB. Those standards require that we plan and perform the audit to obtain reasonable assurance about whether the financial statements are free of material misstatement, whether due to error or fraud. The Company is not required to have, nor were we engaged to perform, an audit of its internal control over financial reporting. As part of our audits we are required to obtain an understanding of internal control over financial reporting but not for the purpose of expressing an opinion on the effectiveness of the Company’s internal control over financial reporting. Accordingly, we express no such opinion.
Our audits included performing procedures to assess the risks of material misstatement of the financial statements, whether due to error or fraud, and performing procedures that respond to those risks. Such procedures included examining, on a test basis, evidence regarding the amounts and disclosures in the financial statements. Our audits also included evaluating the accounting principles used and significant estimates made by management, as well as evaluating the overall presentation of the financial statements. We believe that our audits provide a reasonable basis for our opinion.
Critical Audit MatterMatters
The critical audit matter communicated below is a matter arising from the current period audit of the financial statements that was communicated or required to be communicated to the audit committee and that: (1) relates to accounts or disclosures that are material to the financial statements and (2) involved our especially challenging, subjective or complex judgments. The communication of critical audit matters does not alter in any way our opinion on the financial statements, taken as a whole, and we are not, by communicating the critical audit matter below, providing a separate opinionopinions on the critical audit matter or on the accounts or disclosures to which it relates.they relate.
Valuation of GoodwillEthanol Revenue
As reflected on the Company's balance sheet at December 31, 2021, the Company has goodwill of $10,395,766. As discloseddescribed in Note 210 to the financial statements, the Company tests goodwillhas an agreement with RPMG for impairment annually onthe marketing of all ethanol produced by the Company. RPMG has discretion to determine the price, terms and conditions of the sale of the Company’s ethanol production that is sold and marketed as indexed gallons. For the fiscal year ended December 31, as well as on an interim date if an event occurs or circumstances exist that may indicate impairment. A goodwill impairment loss is recorded if2023, the fair value is below the carrying value of the applicable reporting unit. The Company performedelected to sell its goodwill impairment test at December 31, 2021, using a quantitative evaluation based on a sales comparison approach. The impairment tests require management to make assumptions when estimating the fair value of the reporting unit, including the identified market comparisons based upon industry published data of recent sales and projections of gallons of ethanol produced.production through index arrangement contracts, which totaled $212,497,680.
We identified the valuation of goodwillethanol revenue associated with index arrangement contracts as a critical audit matter because of certain significant assumptions management makes in determining the fair valuesubjective auditor judgment required to audit ethanol revenue due to RPMG having discretion to determine the price, terms and conditions of the reporting unit, sale.
including the identified market comparisons based upon industry published data of recent sales and projections of gallons of ethanol produced. The significant judgments made by management resulted in a high degree of auditor judgment and an increased
Our audit effort in performing procedures and evaluating evidence obtained related to the significant assumptionsrevenue recognition for ethanol sales included the following, among others:
•We obtained and reviewed the terms of the ethanol marketing agreement to identify the relevant terms and conditions which would impact the Company’s accounting conclusions.
•We obtained an understanding of the RPMG index pricing used by management.for determining the price of indexed gallons.
Our audit procedures related to•We confirmed with RPMG the Company’s valuation of goodwill includedtotal ethanol gallons sold, total price paid by, and indexed ethanol pricing for the following, among others:fiscal year ended December 31, 2023, ethanol sales.
•We tested management’s determination of reporting units and the assigned assets and liabilities to the respective reporting units.
•We evaluated management’s assumptions for consistency with evidence obtained in other areas of the audit. We performed a retrospective review of prior years' analysis to determine the reasonableness of key assumptions used by management.
•We evaluated the reasonableness of the methods and significant assumptions used in developing management’s estimates, including the market comparisons of recentsubstantive analytical procedures over ethanol plants:
–Testing the completeness of identified market comparisons based upon industry published data of recent sales.
–Testing the reasonableness of the identified market comparisons by comparing historical operating performance results per ethanol gallon produced based upon published market data for identified market comparisons to historical performance of the Company.revenue using independent pricing sources.
/s/ RSM US LLP
We have served as the Company'sCompany’s auditor since 2007.
Sioux Falls, South Dakota
March 3, 20227, 2024
LAKE AREA CORN PROCESSORS, LLC
Consolidated Balance Sheets
| | December 31, 2021 | | December 31, 2020 |
| December 31, 2023 | | | December 31, 2023 | | December 31, 2022 |
| ASSETS | ASSETS | | | |
| | CURRENT ASSETS | CURRENT ASSETS | |
| | CURRENT ASSETS | |
| | CURRENT ASSETS | |
| Cash and cash equivalents | |
| Cash and cash equivalents | |
| Cash and cash equivalents | Cash and cash equivalents | $ | 37,995,310 | | | $ | 18,637,811 | |
| Accounts receivable | Accounts receivable | 876,949 | | | 585,054 | |
| Accounts receivable (related party) | 1,032,541 | | | 1,633,760 | |
| | Inventory | |
| | Inventory | |
| | Inventory | Inventory | 16,410,437 | | | 9,768,916 | |
| | Derivative financial instruments | Derivative financial instruments | 2,886,831 | | | 2,074,010 | |
| Prepaid expenses | 733,189 | | | 677,471 | |
| Derivative financial instruments | |
| Derivative financial instruments | |
| Prepaid and other expenses | |
| Total current assets | Total current assets | 59,935,257 | | | 33,377,022 | |
| | PROPERTY AND EQUIPMENT | PROPERTY AND EQUIPMENT | |
| PROPERTY AND EQUIPMENT | |
| PROPERTY AND EQUIPMENT | |
| Land | |
| Land | |
| Land | Land | 874,473 | | | 874,473 | |
| Land improvements | Land improvements | 8,738,063 | | | 8,631,224 | |
| Buildings | Buildings | 9,316,576 | | | 9,316,576 | |
| Equipment | Equipment | 96,159,927 | | | 95,867,639 | |
| Construction in progress | Construction in progress | 1,669,148 | | | 6,303 | |
| 116,758,187 | | | 114,696,215 | |
| 127,980,781 | |
| Less accumulated depreciation | Less accumulated depreciation | (58,706,491) | | | (53,328,718) | |
| Net property and equipment | Net property and equipment | 58,051,696 | | | 61,367,497 | |
| | OTHER ASSETS | OTHER ASSETS | |
| OTHER ASSETS | |
| OTHER ASSETS | |
| Goodwill | |
| Goodwill | |
| Goodwill | Goodwill | 10,395,766 | | | 10,395,766 | |
| Investments | Investments | 20,504,842 | | | 16,636,367 | |
| Other | Other | 65,302 | | | 81,295 | |
| Total other assets | Total other assets | 30,965,910 | | | 27,113,428 | |
| | TOTAL ASSETS | TOTAL ASSETS | $ | 148,952,863 | | | $ | 121,857,947 | |
| TOTAL ASSETS | |
| TOTAL ASSETS | |
|
See Notes to Consolidated Financial Statements
LAKE AREA CORN PROCESSORS, LLC
Consolidated Balance Sheets
| | | December 31, 2021 | | December 31, 2020 |
| December 31, 2023 | |
| December 31, 2023 | |
| December 31, 2023 | | | December 31, 2022 |
| LIABILITIES AND MEMBERS’ EQUITY | LIABILITIES AND MEMBERS’ EQUITY | | | |
| | CURRENT LIABILITIES | CURRENT LIABILITIES | |
| | CURRENT LIABILITIES | |
| | CURRENT LIABILITIES | |
| Outstanding checks in excess of bank balance | |
| Outstanding checks in excess of bank balance | |
| Outstanding checks in excess of bank balance | Outstanding checks in excess of bank balance | $ | 2,228,284 | | | $ | 319,608 | |
| Accounts payable | Accounts payable | 25,855,071 | | | 18,526,170 | |
| Accrued liabilities | Accrued liabilities | 914,994 | | | 732,544 | |
| Derivative financial instruments | Derivative financial instruments | 1,490,510 | | | 244,181 | |
| | Current portion of notes payable | Current portion of notes payable | 1,000,000 | | | 1,201,628 | |
| Other | — | | | 4,000 | |
| Current portion of notes payable | |
| Current portion of notes payable | |
| | Total current liabilities | |
| Total current liabilities | |
| Total current liabilities | Total current liabilities | 31,488,859 | | | 21,028,131 | |
| | LONG-TERM LIABILITIES | LONG-TERM LIABILITIES | |
| LONG-TERM LIABILITIES | |
| LONG-TERM LIABILITIES | |
| Notes payable | |
| Notes payable | |
| Notes payable | Notes payable | 3,995,139 | | | 35,561,237 | |
| | Total long-term liabilities | Total long-term liabilities | 3,995,139 | | | 35,561,237 | |
| | Total long-term liabilities | |
| | Total long-term liabilities | |
| | COMMITMENTS AND CONTINGENCIES (Note 10) | |
| COMMITMENTS AND CONTINGENCIES (Note 10) | |
| COMMITMENTS AND CONTINGENCIES (Note 10) | COMMITMENTS AND CONTINGENCIES (Note 10) | 0 | | 0 | | | |
| | MEMBERS' EQUITY (29,620,000 units issued and outstanding) | MEMBERS' EQUITY (29,620,000 units issued and outstanding) | 113,468,865 | | | 65,268,579 | |
| MEMBERS' EQUITY (29,620,000 units issued and outstanding) | |
| MEMBERS' EQUITY (29,620,000 units issued and outstanding) | |
| | TOTAL LIABILITIES AND MEMBERS' EQUITY | TOTAL LIABILITIES AND MEMBERS' EQUITY | $ | 148,952,863 | | | $ | 121,857,947 | |
| TOTAL LIABILITIES AND MEMBERS' EQUITY | |
| TOTAL LIABILITIES AND MEMBERS' EQUITY | |
|
See Notes to Consolidated Financial Statements
LAKE AREA CORN PROCESSORS, LLC
Consolidated Statements of Operations
| | Year Ended
December 31, 2023 | | | Year Ended
December 31, 2023 | | Year Ended
December 31, 2022 | | Year Ended
December 31, 2021 |
| | Year Ended
December 31, 2021 | | Year Ended
December 31, 2020 | | Year Ended
December 31, 2019 |
| | REVENUES | |
| REVENUES | |
| REVENUES | REVENUES | $ | 258,989,603 | | | $ | 130,521,814 | | | $ | 115,986,821 | |
| | COSTS OF REVENUES | COSTS OF REVENUES | 207,275,615 | | | 124,493,268 | | | 114,687,231 | |
| COSTS OF REVENUES | |
| COSTS OF REVENUES | |
| | GROSS PROFIT | |
| GROSS PROFIT | |
| GROSS PROFIT | GROSS PROFIT | 51,713,988 | | | 6,028,546 | | | 1,299,590 | |
| | OPERATING EXPENSES | OPERATING EXPENSES | 5,430,294 | | | 4,418,074 | | | 4,060,343 | |
| OPERATING EXPENSES | |
| OPERATING EXPENSES | |
| | INCOME (LOSS) FROM OPERATIONS | 46,283,694 | | | 1,610,472 | | | (2,760,753) | |
| INCOME FROM OPERATIONS | |
| INCOME FROM OPERATIONS | |
| INCOME FROM OPERATIONS | |
| | OTHER INCOME (EXPENSE) | OTHER INCOME (EXPENSE) | |
| OTHER INCOME (EXPENSE) | |
| OTHER INCOME (EXPENSE) | |
| Interest and other income | Interest and other income | 1,360,438 | | | 495,474 | | | 180,801 | |
| Equity in net income (loss) of investments | 10,169,606 | | | 343,728 | | | (60,908) | |
| Interest and other income | |
| Interest and other income | |
| Equity in net income of investments | |
| Interest expense | Interest expense | (727,452) | | | (1,394,035) | | | (1,183,324) | |
| Total other income (expense) | Total other income (expense) | 10,802,592 | | | (554,833) | | | (1,063,431) | |
| | NET INCOME (LOSS) | $ | 57,086,286 | | | $ | 1,055,639 | | | $ | (3,824,184) | |
| NET INCOME | |
| NET INCOME | |
| NET INCOME | |
| | BASIC AND DILUTED EARNINGS (LOSS) PER UNIT | $ | 1.93 | | | $ | 0.04 | | | $ | (0.13) | |
| BASIC AND DILUTED EARNINGS PER UNIT | |
| BASIC AND DILUTED EARNINGS PER UNIT | |
| BASIC AND DILUTED EARNINGS PER UNIT | |
| | WEIGHTED AVERAGE NUMBER OF UNITS OUTSTANDING | WEIGHTED AVERAGE NUMBER OF UNITS OUTSTANDING | 29,620,000 | | | 29,620,000 | | | 29,620,000 | |
| WEIGHTED AVERAGE NUMBER OF UNITS OUTSTANDING | |
| WEIGHTED AVERAGE NUMBER OF UNITS OUTSTANDING | |
| | DISTRIBUTIONS DECLARED PER UNIT | |
| DISTRIBUTIONS DECLARED PER UNIT | |
| DISTRIBUTIONS DECLARED PER UNIT | |
See Notes to Consolidated Financial Statements
LAKE AREA CORN PROCESSORS, LLC
Consolidated Statements of Changes in Members' Equity
Years Ended December 31, 2021, 20202023, 2022 and 20192021
| | | | | | | | |
| | Members' |
| | Equity |
| | |
| | |
| | |
| | |
| | |
| | |
| | |
| | |
| Balance, December 31, 2018 | | 68,037,124 |
| Net (loss) | | (3,824,184) |
| | |
| Balance, December 31, 2019 | | 64,212,940 |
| Net income | | 1,055,639 |
| | |
| | |
| | |
| Balance, December 31, 2020 | | $ | 65,268,579 | |
| Net income | | 57,086,286 | |
| | |
Member Distributions ($.30 per capital unit) | | (8,886,000) | |
| | |
| Balance, December 31, 2021 | | 113,468,865 | |
| Net income | | 27,301,957 | |
| Member Distributions | | (32,822,816) | |
| | |
| Balance, December 31, 2022 | | 107,948,006 | |
| Net income | | 42,381,393 | |
| Member Distribution | | (14,935,970) | |
| | |
| Balance, December 31, 2023 | | $ | 113,468,865135,393,429 | |
| | |
See Notes to Consolidated Financial Statements
LAKE AREA CORN PROCESSORS, LLC
Consolidated Statements of Cash Flows | | Year Ended December 31, 2021 | | Year Ended December 31, 2020 | | Year Ended December 31, 2019 |
| Year Ended December 31, 2023 | | | Year Ended December 31, 2023 | | Year Ended December 31, 2022 | | Year Ended December 31, 2021 |
| | OPERATING ACTIVITIES | OPERATING ACTIVITIES | |
| Net income (loss) | $ | 57,086,286 | | | $ | 1,055,639 | | | $ | (3,824,184) | |
| Adjustments to reconcile net income (loss) to net cash provided by operating activities | |
| OPERATING ACTIVITIES | |
| OPERATING ACTIVITIES | |
| Net income | |
| Net income | |
| Net income | |
| Adjustments to reconcile net income to net cash provided by operating activities | |
| Depreciation and amortization | |
| Depreciation and amortization | |
| Depreciation and amortization | Depreciation and amortization | 5,396,440 | | | 5,718,454 | | | 4,965,966 | |
| Distributions in excess of earnings (earnings in excess of distributions) from investments | Distributions in excess of earnings (earnings in excess of distributions) from investments | (3,544,606) | | | 45,803 | | | 1,252,223 | |
| Paycheck Protection Program loan forgiveness | Paycheck Protection Program loan forgiveness | (768,400) | | | — | | | — | |
| Government grant income | Government grant income | (10,000) | | | — | | | — | |
| | Loss on disposal of property and equipment | |
| (Increase) decrease in | (Increase) decrease in | |
| Accounts receivable | |
| Accounts receivable | |
| Accounts receivable | Accounts receivable | 309,324 | | | (642,721) | | | (347,041) | |
| Inventory | Inventory | (6,641,522) | | | 774,506 | | | (2,981,920) | |
| Prepaid expenses | Prepaid expenses | (55,718) | | | (198,049) | | | (213,629) | |
| Derivative financial instruments | Derivative financial instruments | 433,509 | | | (2,023,655) | | | 379,355 | |
| | Increase (decrease) in | Increase (decrease) in | |
| Increase (decrease) in | |
| Increase (decrease) in | |
| Accounts payable | Accounts payable | 7,328,901 | | | 4,713,782 | | | 8,123,326 | |
| Accrued and other liabilities | 186,450 | | | (205,124) | | | 163,674 | |
| Accounts payable | |
| Accounts payable | |
| Accrued liabilities | |
| NET CASH PROVIDED BY OPERATING ACTIVITIES | NET CASH PROVIDED BY OPERATING ACTIVITIES | 59,720,664 | | | 9,238,635 | | | 7,517,770 | |
| | INVESTING ACTIVITIES | INVESTING ACTIVITIES | |
| INVESTING ACTIVITIES | |
| INVESTING ACTIVITIES | |
| Natural gas transportation prepayment | |
| Natural gas transportation prepayment | |
| Natural gas transportation prepayment | |
| | Purchase of property and equipment | |
| | Purchase of property and equipment | |
| | Purchase of property and equipment | Purchase of property and equipment | (2,061,972) | | | (359,221) | | | (9,066,179) | |
| Purchase of investments | Purchase of investments | (323,869) | | | — | | | (633,924) | |
| NET CASH USED IN INVESTING ACTIVITIES | NET CASH USED IN INVESTING ACTIVITIES | (2,385,841) | | | (359,221) | | | (9,700,103) | |
| | FINANCING ACTIVITIES | FINANCING ACTIVITIES | |
| FINANCING ACTIVITIES | |
| FINANCING ACTIVITIES | |
| Increase (decrease) in outstanding checks in excess of bank balance | |
| Increase (decrease) in outstanding checks in excess of bank balance | |
| Increase (decrease) in outstanding checks in excess of bank balance | Increase (decrease) in outstanding checks in excess of bank balance | 1,908,676 | | | (835,656) | | | (1,091,951) | |
| Borrowings on notes payable | Borrowings on notes payable | 21,000,000 | | | 60,770,400 | | | 85,500,000 | |
| Payments on notes payable | Payments on notes payable | (52,000,000) | | | (63,000,000) | | | (71,100,000) | |
| | Financing costs paid | |
| | Distributions paid to members | Distributions paid to members | (8,886,000) | | | — | | | — | |
| NET CASH PROVIDED BY (USED IN) FINANCING ACTIVITIES | (37,977,324) | | | (3,065,256) | | | 13,308,049 | |
| Distributions paid to members | |
| Distributions paid to members | |
| NET CASH USED IN FINANCING ACTIVITIES | |
| | NET INCREASE IN CASH AND CASH EQUIVALENTS | 19,357,499 | | | 5,814,158 | | | 11,125,716 | |
| NET INCREASE (DECREASE) IN CASH, CASH EQUIVALENTS AND RESTRICTED CASH | |
| NET INCREASE (DECREASE) IN CASH, CASH EQUIVALENTS AND RESTRICTED CASH | |
| NET INCREASE (DECREASE) IN CASH, CASH EQUIVALENTS AND RESTRICTED CASH | |
| | CASH AND CASH EQUIVALENTS AT BEGINNING OF PERIOD | 18,637,811 | | | 12,823,653 | | | 1,697,937 | |
| CASH, CASH EQUIVALENTS AND RESTRICTED CASH AT BEGINNING OF PERIOD | |
| CASH, CASH EQUIVALENTS AND RESTRICTED CASH AT BEGINNING OF PERIOD | |
| CASH, CASH EQUIVALENTS AND RESTRICTED CASH AT BEGINNING OF PERIOD | |
| | CASH AND CASH EQUIVALENTS AT END OF PERIOD | $ | 37,995,310 | | | $ | 18,637,811 | | | $ | 12,823,653 | |
| CASH, CASH EQUIVALENTS AND RESTRICTED CASH AT END OF PERIOD | |
| CASH, CASH EQUIVALENTS AND RESTRICTED CASH AT END OF PERIOD | |
| CASH, CASH EQUIVALENTS AND RESTRICTED CASH AT END OF PERIOD | |
| | SUPPLEMENTAL DISCLOSURES OF CASH FLOW INFORMATION | SUPPLEMENTAL DISCLOSURES OF CASH FLOW INFORMATION | |
| Cash paid during the period for interest, net of capitalized interest of $6,339; $148; and $831,170 in 2021, 2020 and 2019, respectively | $ | 943,736 | | | $ | 1,510,468 | | | $ | 835,236 | |
| SUPPLEMENTAL DISCLOSURES OF CASH FLOW INFORMATION | |
| SUPPLEMENTAL DISCLOSURES OF CASH FLOW INFORMATION | |
| Cash paid during the period for interest, net of capitalized interest of $18,307; $158,636; and $6,339 in 2023, 2022 and 2021, respectively | |
| Cash paid during the period for interest, net of capitalized interest of $18,307; $158,636; and $6,339 in 2023, 2022 and 2021, respectively | |
| Cash paid during the period for interest, net of capitalized interest of $18,307; $158,636; and $6,339 in 2023, 2022 and 2021, respectively | |
| Capital expenditures in accounts payable | |
|
See Notes to Consolidated Financial Statements
LAKE AREA CORN PROCESSORS, LLC
NOTES TO CONSOLIDATED FINANCIAL STATEMENTS
DECEMBER 31, 2021, 20202023, 2022 AND 20192021
NOTE 1 - NATURE OF OPERATIONS
Principal Business Activity
Lake Area Corn Processors, LLC and subsidiary (the Company) is a South Dakota limited liability company.
The Company owns and manages Dakota Ethanol, LLC (Dakota Ethanol), a 90100 million-gallon (annual nameplate capacity) ethanol plant located near Wentworth, South Dakota. Dakota Ethanol sells ethanol and related products to customers located in North America.
In addition, the Company has investment interests in 5five companies in related industries. See note 5 for further details.
NOTE 2 - SUMMARY OF SIGNIFICANT ACCOUNTING POLICIES
Principles of Consolidation
The consolidated financial statements of the Company include the accounts of its wholly owned subsidiary, Dakota Ethanol. All significant inter-company transactions and balances have been eliminated in consolidation.
Revenue Recognition
ASC Topic 606, Revenue from Contracts with Customers requires the Company to recognize revenue to depict the transfer of promised goods or services to customers in an amount that reflects the consideration to which the entity expects to be entitled in exchange for those goods or services. The guidance requires the Company to apply the following steps: (1) identify the contract with a customer; (2) identify the performance obligations in the contract; (3) determine the transaction price; (4) allocate the transaction price to the performance obligations in the contract; and (5) recognize revenue when, or as, the Company satisfies a performance obligation. The Company generally recognizes revenue at a point in time. The Company's contracts with customers have one performance obligation and a contract duration of one year or less.
The following is a description of principal activities from which we generate revenue. Revenues from contracts with customers are recognized when control of the promised goods or services are transferred to our customers, in an amount that reflects the consideration that we expect to receive in exchange for those goods or services. Generally, ethanol and related products are shipped FOB shipping point and control of the goods transfers to customers when the goods are loaded into trucks or when rail cars are shipped. Consideration is based on predetermined contractual prices or on current market prices.
•Sales of Ethanol
•Sales of Distillers Grains
•Sales of Distillers Corn Oil
Disaggregation of Revenue:
All revenue recognized in the income statement of operations is considered to be revenue from contracts with customers. The following table depicts the disaggregation of revenue according to product line:
| | | 2023 | | | | 2023 | | 2022 | | 2021 |
| | 2021 | | 2020 | | 2019 |
| | Revenues ethanol | |
| Revenues ethanol | |
| Revenues ethanol | Revenues ethanol | | $ | 203,540,577 | | | $ | 99,077,363 | | | $ | 90,415,936 | |
| Revenues distillers grains | Revenues distillers grains | | 41,168,903 | | | 25,519,999 | | | 21,200,904 | |
| Revenues distillers corn oil | Revenues distillers corn oil | | 14,280,123 | | | 5,924,452 | | | 4,369,981 | |
| $ | 258,989,603 | | | $ | 130,521,814 | | | $ | 115,986,821 | |
| | $ | |
LAKE AREA CORN PROCESSORS, LLC
NOTES TO CONSOLIDATED FINANCIAL STATEMENTS
DECEMBER 31, 2021, 20202023, 2022 AND 20192021
Contract Assets and Contract Liabilities:
The Company receives payments from customers based upon contractual billing schedules; accounts receivable are recorded when the right to consideration becomes unconditional. Contract liabilities include payments received in advance of performance under the contract, and are realized with the associated revenue recognized under the contract.
The Company has no0 significant contract assets or contract liabilities from contracts with customers at December 31, 20212023 and 2020, respectively.2022.
Shipping Costs
Shipping costs incurred by the Company in the sale of ethanol, dried distiller's grains and corn oil are not specifically identifiable and as a result, revenue from the sale of those products is recorded based on the net selling price reported to the Company from the marketer.
When the Company performs shipping and handling activities after the transfer of control to the customers (e.g., when control transfers prior to delivery), they are considered as fulfillment activities, and accordingly, the costs are accrued for when the related revenue is recognized.
Cost of Revenues
The primary raw materials we use to produce ethanol, distillers grains and corn oil are corn and natural gas.
Electricity, raw materials expense (chemicals and denaturant), direct labor costs, and shipping costs on modified and wet distiller's grains are included in cost of revenues.
Inventory Valuation
Inventories are generally valued using methods which approximate the lower of cost (first-in, first-out) or net realizable value. In the valuation of inventories, net realizable value is based on estimated selling prices in the ordinary course of business less reasonably predictable costs of completion, disposal and transportation.
Cash, and Cash Equivalents, and Restricted Cash
Cash and cash equivalents consist of demand accounts and other accounts with original maturities of three months or less that provide withdrawal privileges. Restricted cash is subject to a contractual restriction and not readily available in accordance with the terms of the West Leg agreement.
| | | | | | | | | | | |
| December 31, 2023 | | December 31, 2022 |
| | | |
| Cash and Cash Equivalents | $ | 36,773,989 | | | $ | 27,004,205 | |
| Restricted Cash (included in other assets) | 555,043 | | | — | |
| Total Cash, Cash Equivalents, and Restricted Cash | $ | 37,329,032 | | | $ | 27,004,205 | |
Receivables and Credit Policies
Accounts receivable are uncollateralized customer obligations due under normal trade terms requiring payment within fifteen days from the invoice date. Unpaid accounts receivable with invoice dates over thirty days old bear interest at 1.5% per month. Accounts receivable are stated at the amount billed to the customer. Payments of accounts receivable are allocated to the specific invoices identified on the customer's remittance advice or, if unspecified, are applied to the earliest unpaid invoices.
The carrying amount of trade receivables is reduced by a valuation allowance that reflects management's best estimate of the amounts that will not be collected. Management regularly reviews trade receivable balances and based on an assessment of
LAKE AREA CORN PROCESSORS, LLC
NOTES TO CONSOLIDATED FINANCIAL STATEMENTS
DECEMBER 31, 2023, 2022 AND 2021
current creditworthiness, estimates the portion, if any, of the balance that will not be collected. The valuation allowance was $0 and $0determined to be immaterial as of December 31, 20212023 and 2020 respectively.2022.
Investment in commodities contracts, derivative instruments and hedging activities
The Company is exposed to certain risks related to ourits ongoing business operations. The primaryoperations including price risks that the Company manages by using forward contracts or derivative instruments are price risk on anticipated purchases of corn, and natural gas, and the sale of ethanol, distillers grains and distillers corn oil. The Company manages these risks by using forward, future and options derivative instruments.
LAKE AREA CORN PROCESSORS, LLC
NOTES TO CONSOLIDATED FINANCIAL STATEMENTS
DECEMBER 31, 2021, 2020 AND 2019
The Company is subject to market risk with respect to the price and availability of corn, the principal raw material the Company uses to produce ethanol and ethanol by-products. In general, unfavorable market conditions result from rising corn prices result in lower profit margins and, therefore, represent unfavorable market conditions.prices. This is especially true when market conditions do not allow us to pass along increased corn costs to our customers. The availability and price of corn isare subject to wide fluctuations due to unpredictable factors such as weather conditions, farmer planting decisions, governmental policies with respect to agriculture and international trade and global demand and supply. Additionally, the crisis in Ukraine may effect the price of corn, and by extension, our business.
Certain contracts that literally meet the definition of a derivative may be exempted from derivative accounting as normal purchases or normal sales. Normal purchases and normal sales are contracts that provide for the purchase or sale of something other than a financial instrument or derivative instrument that will be delivered in quantities expected to be used or sold over a reasonable period in the normal course of business. Contracts that meet the requirements of normal purchases or sales are documented as normal and exempted from the accounting and reporting requirements of derivative accounting.
The Company does not apply the normal purchase and sales exemption for forward corn purchase contracts. As of December 31, 2021,2023, the Company is committed to purchasing approximately 8.74.1 million bushels of corn on a forward contract basis with an average price of $5.95$4.75 per bushel. The total corn purchase contracts represent 29%12% of the projected annual plant corn usage.
The Company has 291,000580,000 bushels of corn inventory delivered under delayed-pricing contracts. The contracts have various pricing deadlines through November 30, 2022.August 25, 2024. The Company is subject to risk of changes in the corn market until they are priced.
The Company enters into firm-price purchase commitments with natural gas suppliers under which the Company agrees to buy natural gas at a price set in advance of the actual delivery. Under these arrangements, the Company assumes the risk of a price decrease in the market price of natural gas between the time the price is fixed and the time the natural gas is delivered. At December 31, 2021,2023, the Company is committed to purchasing approximately 1,275,0001,495,000 MMBtu's of natural gas with an average price of $3.68$3.50 per MMBtu. The Company accounts for these transactions as normal purchases, and accordingly, does not mark these transactions to market. The natural gas purchases represent approximately 63%71% of the projected annual plant requirements.
The Company enters into firm-price sales commitments with distillers grains customers under which the Company agrees to sell distillers grains at a price set in advance of the actual delivery. Under these arrangements, the Company assumes the risk of a price increase in the market price of distillers grain between the time the price is fixed and the time the distillers grains are delivered. At December 31, 2021,2023, the Company is committed to selling approximately 38,00046,000 dry equivalent tons of distillers grains with an average price of $192$189 per ton. The Company accounts for these transactions as normal sales, and accordingly, does not mark these transactions to market. The distillers grains sales represent approximately 18%21% of the projected annual plant production.
The Company enters into firm-price sales commitments with distillers corn oil customers under which the Company agrees to sell distillers corn oil at a price set in advance of the actual delivery. Under these arrangements, the Company assumes the risk of a price increase in the market price of distillers corn oil between the time this price is fixed and the time the distillers corn oil is delivered. At December 31, 2021,2023, the Company is committed to selling approximately 3,464,0001,709,000 pounds of distillers corn oil with an average price of $0.59$0.48 per pound. The Company accounts for these transactions as normal sales, and accordingly, does not mark these transactions to market. The distillers corn oil sales represent approximately 15%5% of the projected annual plant production.
The Company does not have any firm-priced sales commitments for ethanol as of December 31, 2021.
The Company enters into short-term forward, option and futures contracts for ethanol, corn and natural gas as a means of managing exposure to changes in commodity and energy prices. All contracts of the Company are designated as non-hedge derivatives and are recorded at fair value with changes being recognized in net income, or are designated as normal purchases and normal sales and are evaluated for inherent losses. Although the contracts are considered economic hedges of specified risks, they are not designated as and accounted for as hedging instruments.
LAKE AREA CORN PROCESSORS, LLC
NOTES TO CONSOLIDATED FINANCIAL STATEMENTS
DECEMBER 31, 2021, 20202023, 2022 AND 20192021
The Company does not have any firm-priced sales commitments for ethanol as of December 31, 2023.
The Company enters into short-term forward, option and futures contracts for corn and natural gas as a means of managing exposure to changes in commodity and energy prices. All of the Company's derivatives are designated as non-hedge derivatives, and accordingly are recorded at fair value with changes in fair value recognized in net income, or a normal purchase, normal sale exemption is elected. Although the contracts are considered economic hedges of specified risks, they are not designated and accounted for as hedging instruments.
As part of our trading activity, the Company uses futures and option contracts offered through regulated commodity exchanges to reduce risk of loss in the market value of inventories and purchase commitments. To reduce that risk, the Company generally takes positions using forward and futures contracts and options.
Derivatives not designated as hedging instruments at December 31, 20212023 and December 31, 20202022 were as follows:
| | | Balance Sheet Classification | | | | Balance Sheet Classification | | December 31, 2023 | | December 31, 2022 |
| | Balance Sheet Classification | | December 31, 2021 | | December 31, 2020 |
| | Corn forward contracts in gain position | |
| Corn forward contracts in gain position | |
| Corn forward contracts in gain position | Corn forward contracts in gain position | | $ | 892,509 | | | $ | 1,742,054 | |
| Futures and options contracts in gain position | Futures and options contracts in gain position | | 140,863 | | | — | |
| Futures and options contracts in loss position | Futures and options contracts in loss position | | (1,238,560) | | | (1,799,688) | |
| Total forward, futures and options contracts | Total forward, futures and options contracts | | (205,188) | | | (57,634) | |
| Cash held by broker | Cash held by broker | | 3,092,019 | | | 2,131,644 | |
| Current Assets | | $ | 2,886,831 | | | $ | 2,074,010 | |
| | Current Assets | |
| | Corn forward contracts in loss position | Corn forward contracts in loss position | | Current Liabilities | | $ | (1,490,510) | | | $ | (244,181) | |
| Corn forward contracts in loss position | |
| Corn forward contracts in loss position | |
|
Futures and options contracts and cash held by broker are all with one party and the right of offset exists. Therefore, on the balance sheet, these items are netted in one balance regardless of position.
Forward contracts are with multiple parties and the right of offset does not exist. Therefore, these contracts are reported at the gross amounts on the balance sheet.
Realized and unrealized gainsGains and losses related to derivative contracts related to corn and natural gas purchases are included as a component of costcosts of revenues and derivative contracts related to ethanol sales are included as a component of revenues in the accompanying financial statements.revenues.
| | Statement of Operations | | Years Ended December 31, |
| Classification | | 2021 | | 2020 | | 2019 |
| | Statement of Operations | | | | Statement of Operations | | Years Ended December 31, |
| | Classification | | | | Classification | | 2023 | | 2022 | | 2021 |
| | Net realized and unrealized gains (losses) related to purchase contracts: | Net realized and unrealized gains (losses) related to purchase contracts: | | | | | | | | |
| | Net realized and unrealized gains (losses) related to purchase contracts: | |
| | Net realized and unrealized gains (losses) related to purchase contracts: | |
| Futures and options contracts | |
| Futures and options contracts | |
| Futures and options contracts | Futures and options contracts | | Cost of Revenues | | $ | (10,137,035) | | | $ | (1,211,861) | | | $ | (8,631) | |
| Forward contracts | Forward contracts | | Cost of Revenues | | 6,222,026 | | | (415,420) | | | (897,283) | |
Investments
The Company has investment interests in 5five companies in related industries. AllFour of these interests are at ownership shares less than 20%. One of the investments exceeds 20%. These investments are flow-through entities and are being accounted for by the equity method of accounting under which the Company's share of net income is recognized as income in the Company's statements of operations and added to the investment account. Distributions or dividends received from the investments are treated as a reduction of the investment account. The Company consistently follows the practice of recognizing the net income based on the most recent reliable data.
LAKE AREA CORN PROCESSORS, LLC
NOTES TO CONSOLIDATED FINANCIAL STATEMENTS
DECEMBER 31, 2023, 2022 AND 2021
Use of Estimates
The preparation of financial statements in conformity with accounting principles generally accepted in the United States of America requires management to make estimates and assumptions that affect the reported amount of assets and liabilities and disclosure of contingent assets and liabilities at the date of the financial statements and revenues and expenses during the reporting period. Actual results could differ from those estimates. Significant estimates include the fair value of derivative
LAKE AREA CORN PROCESSORS, LLC
NOTES TO CONSOLIDATED FINANCIAL STATEMENTS
DECEMBER 31, 2021, 2020 AND 2019
financial instruments, lower of cost or net realizable value accounting for inventory and goodwill and fixed asset impairment evaluation.
Concentrations of Credit Risk
The Company's cash balances are maintained in bank depositories and regularly exceed federally insured limits. The Company has not experienced any losses in connection with these balances.
Property and Equipment
Property and equipment is stated at cost. Significant additions and betterments are capitalized, while expenditures for maintenance, repairs and minor renewals are charged to operations when incurred. Depreciation on assets placed in service is computed using the straight-line method over estimated useful lives as follows:
•Land improvements 20-40 years
•Equipment 5-20 years
•Buildings 15-40 years
Equipment relates to two general categories: mechanical equipment and administrative and maintenance equipment. Mechanical equipment generally relates to equipment for handling inventories and the production of ethanol and related products, with useful lives of 15 to 20 years, including boilers, cooling towers, grain bins, centrifuges, conveyors, fermentation tanks, pumps and drying equipment. Administrative and maintenance equipment is equipment with useful lives of 5 to 15 years, including vehicles, computer systems, security equipment, testing devices and shop equipment.
The Company reviews its property and equipment for impairment whenever events indicate that the carrying amount of an asset group may not be recoverable. An impairment loss is recorded when the sum of the undiscounted future cash flows is less than the carrying amount of the asset group. An impairment loss is measured as the amount by which the carrying amount of the asset group exceeds its fair value. During the first quarter of 2020, the COVID-19 pandemic represented a change in circumstance that indicated the carrying value of property and equipment may not be recoverable. The Company calculated the undiscounted future cash flows of the property and equipment and determined them to be recoverable. Accordingly, no impairment was recorded. No indicators of impairment were identified at December 31, 2021.2023.
Goodwill
Annually, as well as when an event triggering impairment may have occurred, the Company performs an impairment test on goodwill. The Company performs a quantitative analysis that tests for impairment. The second step,goodwill, which compares the fair value of the reporting unit with its carrying amount. An impairment charge is recognized, if necessary, measuresfor the impairment. Duringamount by which the first quartercarrying value exceeds the fair value up to the amount of 2020 a triggering event was determinedthe goodwill attributed to have occurred and an impairment test was performed as of March 31, 2020. The Company determined there was no impairment at that time.the reporting unit. The Company performs the annual analysis on December 31 of each fiscal year. The Company determined that there was no impairment of goodwill at December 31, 20212023 and 2020, respectively.2022.
Earnings Per Unit
For purposes of calculating basic earnings per unit, units issued are considered outstanding on the effective date of issuance. Diluted earnings per unit are calculated by including dilutive potential equity units in the denominator. There were no dilutive equity units for the years ending December 31, 2021, 2020,2023, 2022, and 2019.2021.
Income Taxes
The Company is taxed as a limited liability company under the Internal Revenue Code. The income of the Company flows through to the members to be taxed at the member level rather than the corporate level. Accordingly, the Company has no tax liability.
LAKE AREA CORN PROCESSORS, LLC
NOTES TO CONSOLIDATED FINANCIAL STATEMENTS
DECEMBER 31, 2023, 2022 AND 2021
Management has evaluated the Company's tax positions under the Financial Accounting Standards Board issued guidance on accounting for uncertainty in income taxes and concluded that the Company had taken no uncertain tax positions that require
LAKE AREA CORN PROCESSORS, LLC
NOTES TO CONSOLIDATED FINANCIAL STATEMENTS
DECEMBER 31, 2021, 2020 AND 2019
adjustment to the financial statements to comply with the provisions of this guidance. Generally, the Company is no longer subject to income tax examinations by the U.S. federal, state or local authorities beyond three years for the years before 2017.jurisdictions in which they file.
Environmental Liabilities
The Company's operations are subject to environmental laws and regulations adopted by various governmental authorities in the jurisdictions in which it operates. These laws require the Company to investigate and remediate the effects of the release or disposal of materials at its locations. Accordingly, the Company has adopted policies, practices and procedures in the areas of pollution control, occupational health and the production, handling, storage and use of hazardous materials to prevent material environmental or other damage, and to limit the financial liability which could result from such events. Environmental liabilities are recorded when the Company's liability is probable and the costs can be reasonably estimated.
Reporting Segment
Operating segments are defined as components of an enterprise for which separate financial information is available that is evaluated regularly by the chief operating decision maker or decision making group in deciding how to allocate resources and in assessing performance. The Company has determined that it has six operating segments that give rise to two reportable segments. See "Note 3 - Segments" in our Notes to Consolidated Financial Statements included elsewhere in this report for financial information about our segment reporting.
Recently Issued Accounting Pronouncements
There are currently no recently issued accounting pronouncements that the Company determined to be factually relevant to the understanding of the financial statements.
Risks and Uncertainties
The Company has certain risks and uncertainties that it will experience during volatile market conditions, which can have a severe impact on operations. The Company's revenues are derived from the sale and distribution of ethanol and distiller grains to customers primarily located in the United States. Corn for the production process is supplied to the plant primarily from local agricultural producers and from purchases on the open market. For the twelve months ended December 31, 2021,2023, ethanol sales averaged approximately 79%76% of total revenues, while approximately 16%18% of revenues were generated from the sale of distillers grains and 5%6% of revenues were generated from the sale of corn oil. For the twelve months ended December 31, 2021,2023, corn costs averaged approximately 77%81% of cost of goods sold.
The Company's operating and financial performance is largely driven by the prices at which it sells ethanol and the net expense of corn. The price of ethanol is influenced by factors such as supply and demand, weather, government policies and programs, and unleaded gasoline and the petroleum markets.markets, government programs, global political or economic issues, including but not limited to, the war in Ukraine including sanctions associated therewith, shortages, export prices, crude oil prices, currency valuations and government policies in the United States and around the world, over which we have no control. Excess ethanol supply in the market, in particular, puts downward pressure on the price of ethanol.
The Company's largest cost of production is corn. The cost of corn is generally impacted by factors such as supply and demand, weather, and government policies and programs.programs, global political or economic issues, including but not limited to the war in Ukraine including sanctions associated therewith, or global damaging growing conditions, such as plant disease or adverse weather, including drought, increased fertilizer costs as well as global conflicts. The Company's risk management program is used to protect against the price volatility of these commodities.
On January 30, 2020, the World Health Organization declared the coronavirus outbreak (COVID-19) a “Public Health Emergency of International Concern” and on March 11, 2020, declared COVID-19 a pandemic. Quarantines, labor shortages, and other disruptions to the Company’s operations, and those of its customers, adversely impacted the Company’s revenues, ability to provide its services and operating results. Any future quarantines, labor shortages, or other disruptions to the Company's operations, or those of its customers may adversely impact the Company's revenues, ability to provide its services and operating results. Like the COVID-19 pandemic, any significant outbreak of epidemic, pandemic or contagious diseases in the human population could result in a widespread health crisis that could adversely affect the economies and financial markets of many countries, including the geographical area in which the Company operates, resulting in an economic downturn that could affect demand for its goods and services. The extent to which COVID-19 will impact the Company’s long-term results will depend on future developments, which are highly uncertain and cannot be predicted, including new developments regarding continued distribution of the COVID-19 vaccine, new information which may emerge concerning the severity of the coronavirus, prevalence of new COVID-19 cases and actions taken to contain the coronavirus or its impact, among others.
LAKE AREA CORN PROCESSORS, LLC
NOTES TO CONSOLIDATED FINANCIAL STATEMENTS
DECEMBER 31, 2021, 20202023, 2022 AND 20192021
NOTE 3 - SEGMENTS
The Company reports its financial and operating performance in 2two segments: (1) production, which includes the manufacture and marketing of fuel-grade ethanol and co-products of the ethanol production process and (2) ethanol producing equity method investments, which consists of the aggregation of the Company's two equity method operating segments of investment in Guardian Hankinson, LLC and investment in Ring-neck Energy & Feed, LLC. The Company discloses its other identified operating segments in an all other category, which consists of the Company's investments in RPMG, LLC, Lawrenceville Tank, LLC, and Guardian Energy Management, LLC.
The Company's 2two reportable segments have been identified based on their unique characteristics. Our production segment is the Company's ethanol plant that is operated in a manner chosen by our chief decision making team. The ethanol producing equity method segment are aggregated operating segments investments that have exceeded the quantitative thresholds for reportable segments which have similar economic characteristics but our chief decision making team does not have input into the daily operations of those entities. The all other category is comprised of investments that fall below the quantitative thresholds for reporting segments and the Company's chief decision making team has no input into their daily operations. Production includes the core operating drivers of the Company's consolidated financial statements which consist of the production and sale of ethanol and its co-products. Ethanol producing equity method investments derive their revenues from the production and sale of ethanol and its co-products. The all other category receives its revenues from marketing fees, management fees, and storage fees. The reconciliation item is necessary due to reportable segments not being consolidated in the financial statements, but rather are reflected as equity method investments.
The segments were identified using standards under ASC 280-10-50. They each engage in business activities, the operating results are reviewed by the Company’s chief operating decision maker, and discrete financial information is available for each segment.
The following tables set forth certain financial data for the Company's operating segments:
| | Year Ended | | Year Ended | | Year Ended |
| December 31, 2021 | | December 31, 2020 | | December 31, 2019 |
| Year Ended | | | Year Ended |
| December 31, 2023 | | | December 31, 2023 | | December 31, 2022 | | December 31, 2021 |
| Net Sales | Net Sales | | | | | |
| Production | |
| Production | |
| Production | Production | $ | 258,989,603 | | | $ | 130,521,814 | | | $ | 115,986,821 | |
| Ethanol Producing Equity Method Investments | Ethanol Producing Equity Method Investments | 650,859,715 | | | 325,954,417 | | | 321,321,517 | |
| All Other | All Other | 16,262,276 | | | 14,200,489 | | | 19,180,356 | |
| Total | Total | 926,111,594 | | | 470,676,720 | | | 456,488,694 | |
| Reconciliation | Reconciliation | (667,121,991) | | | (340,154,906) | | | (340,501,873) | |
| Consolidated | Consolidated | $ | 258,989,603 | | | $ | 130,521,814 | | | $ | 115,986,821 | |
| | Gross Profit | Gross Profit | |
| Gross Profit | |
| Gross Profit | |
| Production | |
| Production | |
| Production | Production | $ | 51,713,988 | | | $ | 6,028,546 | | | $ | 1,299,590 | |
| Ethanol Producing Equity Method Investments | Ethanol Producing Equity Method Investments | 102,631,701 | | | 11,976,243 | | | 12,354,418 | |
| All Other | All Other | 10,280,024 | | | 8,840,138 | | | 13,024,964 | |
| Total | Total | 164,625,713 | | | 26,844,927 | | | 26,678,972 | |
| Reconciliation | Reconciliation | (112,911,725) | | | (20,816,381) | | | (25,379,382) | |
| Consolidated | Consolidated | $ | 51,713,988 | | | $ | 6,028,546 | | | $ | 1,299,590 | |
| | Net Income (Loss) | |
| Net Income | |
| Net Income | |
| Net Income | |
| Production | |
| Production | |
| Production | Production | $ | 57,086,286 | | | $ | 1,055,639 | | | $ | (3,824,184) | |
| Ethanol Producing Equity Method Investments | Ethanol Producing Equity Method Investments | 97,010,893 | | | 307,019 | | | (708,491) | |
| All Other | All Other | 5,538,295 | | | 2,411,213 | | | 2,562,676 | |
| Total | Total | 159,635,474 | | | 3,773,871 | | | (1,969,999) | |
| Reconciliation | Reconciliation | (102,549,188) | | | (2,718,232) | | | (1,854,185) | |
| Consolidated | Consolidated | $ | 57,086,286 | | | $ | 1,055,639 | | | $ | (3,824,184) | |
|
LAKE AREA CORN PROCESSORS, LLC
NOTES TO CONSOLIDATED FINANCIAL STATEMENTS
DECEMBER 31, 2021, 20202023, 2022 AND 20192021
| | Interest Income | Interest Income | |
| Production | |
| Production | |
| Production | Production | $ | 13,361 | | | $ | 3,615 | | | $ | 11,876 | |
| Ethanol Producing Equity Method Investments | Ethanol Producing Equity Method Investments | 39,177 | | | 21,902 | | | 23,104 | |
| All Other | All Other | 2,135,470 | | | 2,395,057 | | | 2,810,198 | |
| Total | Total | 2,188,008 | | | 2,420,574 | | | 2,845,178 | |
| Reconciliation | Reconciliation | (2,174,647) | | | (2,416,959) | | | (2,833,302) | |
| Consolidated | Consolidated | $ | 13,361 | | | $ | 3,615 | | | $ | 11,876 | |
| | Interest Expense | Interest Expense | |
| Interest Expense | |
| Interest Expense | |
| Production | |
| Production | |
| Production | Production | $ | 727,452 | | | $ | 1,394,035 | | | $ | 1,183,324 | |
| Ethanol Producing Equity Method Investments | Ethanol Producing Equity Method Investments | 3,293,641 | | | 4,276,226 | | | 5,673,185 | |
| All Other | All Other | 3,082,000 | | | 2,469,656 | | | 3,337,002 | |
| Total | Total | 7,103,093 | | | 8,139,917 | | | 10,193,511 | |
| Reconciliation | Reconciliation | (6,375,641) | | | (6,745,882) | | | (9,010,187) | |
| Consolidated | Consolidated | $ | 727,452 | | | $ | 1,394,035 | | | 1,183,324 | |
| | Depreciation and Amortization | Depreciation and Amortization | |
| Depreciation and Amortization | |
| Depreciation and Amortization | |
| Production | |
| Production | |
| Production | Production | $ | 5,396,439 | | | $ | 5,718,454 | | | $ | 4,965,966 | |
| Ethanol Producing Equity Method Investments | Ethanol Producing Equity Method Investments | 26,798,254 | | | 26,742,646 | | | 23,314,542 | |
| All Other | All Other | 204,745 | | | 235,325 | | | 871,269 | |
| Total | Total | 32,399,438 | | | 32,696,425 | | | 29,151,777 | |
| Reconciliation | Reconciliation | (27,002,999) | | | (26,977,971) | | | (24,185,811) | |
| Consolidated | Consolidated | $ | 5,396,439 | | | $ | 5,718,454 | | | $ | 4,965,966 | |
| | Expenditures for Additions to Long-lived Assets | Expenditures for Additions to Long-lived Assets | |
| Expenditures for Additions to Long-lived Assets | |
| Expenditures for Additions to Long-lived Assets | |
| Production | |
| Production | |
| Production | Production | $ | 2,061,972 | | | $ | 359,221 | | | $ | 9,066,179 | |
| Ethanol Producing Equity Method Investments | Ethanol Producing Equity Method Investments | 1,780,335 | | | 2,431,446 | | | 22,592,254 | |
| All Other | All Other | — | | | 47,650 | | | 50,176 | |
| Total | Total | 3,842,307 | | | 2,838,317 | | | 31,708,609 | |
| Reconciliation | Reconciliation | (1,780,335) | | | (2,479,096) | | | (22,642,430) | |
| Consolidated | Consolidated | $ | 2,061,972 | | | $ | 359,221 | | | 9,066,179 | |
LAKE AREA CORN PROCESSORS, LLC
NOTES TO CONSOLIDATED FINANCIAL STATEMENTS
DECEMBER 31, 2021, 20202023, 2022 AND 20192021
| | December 31, 2021 | | December 31, 2020 |
| December 31, 2023 | | | December 31, 2023 | | December 31, 2022 |
| Total Assets | Total Assets | | | |
| Production | |
| Production | |
| Production | Production | $ | 148,952,863 | | | $ | 121,857,947 | |
| Ethanol Producing Equity Method Investments | Ethanol Producing Equity Method Investments | 261,642,408 | | | 244,353,900 | |
| All Other | All Other | 283,835,871 | | | 175,909,073 | |
| Total | Total | 694,431,142 | | | 542,120,920 | |
| Reconciliation | Reconciliation | (545,478,279) | | | (420,262,973) | |
| Consolidated | Consolidated | $ | 148,952,863 | | | $ | 121,857,947 | |
| | Equity Method Investments | Equity Method Investments | |
| Equity Method Investments | |
| Equity Method Investments | |
| Production | |
| Production | |
| Production | Production | $ | 20,504,842 | | | $ | 16,636,367 | |
| Ethanol Producing Equity Method Investments | Ethanol Producing Equity Method Investments | 4,125,459 | | | 2,206,234 | |
| All Other | All Other | 209,328 | | | 189,347 | |
| Total | Total | 24,839,629 | | | 19,031,948 | |
| Reconciliation | Reconciliation | (4,334,787) | | | (2,395,581) | |
| Consolidated | Consolidated | $ | 20,504,842 | | | $ | 16,636,367 | |
NOTE 4 - INVENTORY
Inventory consisted of the following as of December 31, 20212023 and 2020:2022:
| | December 31, 2021 | | December 31, 2020 |
| | December 31, 2023 | | | | December 31, 2023 | | December 31, 2022 |
| Raw materials | Raw materials | | $ | 7,278,381 | | | $ | 5,096,067 | |
| Finished goods | Finished goods | | 6,195,222 | | | 2,474,638 | |
| Work in process | Work in process | | 1,779,170 | | | 1,090,893 | |
| Parts inventory | Parts inventory | | 1,157,664 | | | 1,107,318 | |
| $ | 16,410,437 | | | $ | 9,768,916 | |
| | $ | |
As of December 31, 20212023 and December 31, 2020,2022, the Company recorded a lower of cost or net realizable value write-down on inventory of approximately $0$29,000 and $13,000,$2,000, respectively.
NOTE 5 - INVESTMENTS
Dakota Ethanol has a 5% investment interest in the Company's ethanol marketer, Renewable Products Marketing Group, LLC (RPMG). The net income which is reported in the Company's income statement for RPMG is based on RPMG's September 30, 2021, 20202023, 2022 and 20192021 audited results. The carrying amount of the Company's investment was approximately $1,709,000$2,317,000 and $1,208,000$2,286,000 as of December 31, 20212023 and 2020,2022, respectively.
Dakota Ethanol has a 10% investment interest in Lawrenceville Tanks, LLC (LT), a partnership to construct and operate an ethanol storage terminal in Georgia. The net income which is reported in the Company's income statement for LT is based on LT's December 31, 2021, 20202023, 2022 and 20192021 unaudited results. The carrying amount of the Company's investment was approximately $215,000$209,000 and $194,000$216,000 as of December 31, 20212023 and 2020,2022, respectively.
Lake Area Corn Processors hashad a 10% investment interest in Guardian Hankinson, LLC (GH), a partnership to operate an ethanol plant in North Dakota. On September 29, 2023 the Company purchased additional units increasing our ownership percentage of GH to 27%. The net income which is reported in the Company's income statement for GH is based on GH's December 31, 2021, 20202023, 2022 and 20192021 audited results. The carrying amount of the Company's investment was approximately $5,714,000$37,424,000 and $5,012,000$1,870,000 as of December 31, 20212023 and 2020,2022, respectively.
LAKE AREA CORN PROCESSORS, LLC
NOTES TO CONSOLIDATED FINANCIAL STATEMENTS
DECEMBER 31, 2021, 20202023, 2022 AND 20192021
the underlying equity in net assets by approximately $38,854,000. The excess is comprised of basis adjustment. The Company determined the excess would be amortized over 10 years. The amortization is recorded in equity in net income of investments.
Lake Area Corn Processors has a 17%20% investment interest in Guardian Energy Management, LLC (GEM), a partnership to provide management services to ethanol plants. The net income which is reported in the Company's income statement for GEM is based on GEM's December 31, 2021, 20202023, 2022 and 20192021 unaudited interim results. The carrying amount of the Company's investment was approximately $90,000$93,000 and $90,000$92,000 as of December 31, 20212023 and 2020,2022, respectively.
Lake Area Corn Processors has an 11%12% investment interest in Ring-neck Energy & Feed, LLC (REF), a partnership to operate an ethanol plant in South Dakota. The net income which is reported in the Company's income statement for REF is based on REF's December 31, 20212023, 2022, and 20202021 audited results. The carrying amount of the Company's investment was approximately $12,778,000$14,725,000 and $10,134,000$13,227,000 as of December 31, 20212023 and 2020,2022, respectively. REF commenced operations during the second quarter of 2019. Prior to then, the ethanol plant was under construction. The carrying amount of the investment exceeds the underlying equity in net assets by approximately $999,000.$884,000. The excess is comprised of a basis adjustment of approximately $410,000$363,000 and capitalized interest of $589,000.$521,000. The excess is amortized over 20 years. The amortization is recorded in equity in net income of investments.
Condensed, combined unaudited financial information of the Company's investments in RPMG, LT, GH, GEM and REF are as follows:
| | Balance Sheet | | 12/31/2021 | | 12/31/2020 | | 12/31/2019 |
| | 12/31/2023 | | | | 12/31/2023 | | 12/31/2022 | | 12/31/2021 |
| | Current assets | |
| Current assets | |
| Current assets | Current assets | | $ | 370,470,221 | | | $ | 218,336,920 | | | $ | 219,618,012 | |
| Other assets | Other assets | | 179,230,853 | | | 201,926,053 | | | 226,475,381 | |
| Current liabilities | Current liabilities | | 308,504,144 | | | 209,538,950 | | | 187,381,453 | |
| Long-term liabilities | Long-term liabilities | | 44,248,272 | | | 48,854,217 | | | 95,219,540 | |
| Member's equity | | 196,948,658 | | | 161,869,806 | | | 163,492,402 | |
| Members' equity | |
| Revenue | Revenue | | 667,121,991 | | | 340,154,906 | | | 340,501,873 | |
| Gross Profit | Gross Profit | | 112,911,725 | | | 20,816,381 | | | 25,379,382 | |
| Net Income | Net Income | | 102,549,188 | | | 2,718,232 | | | 1,854,185 | |
The following table shows the condensed financial information of Guardian Energy Hankinson; thean investment in which represents greater than 10% of the Company's assets and income as of December 31, 2021.31,2023.
| | Balance Sheet | | 12/31/2021 | | 12/31/2020 | | 12/31/2019 |
| | 12/31/2023 | | | | 12/31/2023 | | 12/31/2022 | | 12/31/2021 |
| | Current assets | |
| Current assets | |
| Current assets | Current assets | | $ | 43,793,006 | | | $ | 29,709,743 | | | $ | 22,448,739 | |
| Other assets | Other assets | | 54,451,233 | | | 71,133,974 | | | 88,765,658 | |
| Current liabilities | Current liabilities | | 34,990,527 | | | 48,451,437 | | | 22,475,261 | |
| Long-term liabilities | Long-term liabilities | | 6,115,092 | | | 2,568,850 | | | 38,453,025 | |
| Member's equity | | 57,138,620 | | | 49,823,430 | | | 50,286,111 | |
| Members' equity | |
| Revenue | Revenue | | 442,502,900 | | | 211,380,830 | | | 250,769,851 | |
| Gross Profit | Gross Profit | | 68,569,989 | | | 2,664,119 | | | 12,896,477 | |
| Net Income | Net Income | | 71,815,190 | | | (462,681) | | | 8,054,076 | |
LAKE AREA CORN PROCESSORS, LLC
NOTES TO CONSOLIDATED FINANCIAL STATEMENTS
DECEMBER 31, 2021, 20202023, 2022 AND 20192021
The following table shows the condensed financial information of Ring-neck Energy & Feed; the investment in which represents greater than 10% of the Company's assets as of December 31, 2021.2022.
| | Balance Sheet | | 12/31/2021 | | 12/31/2020 | | 12/31/2019 |
| | 12/31/2023 | | | | 12/31/2023 | | 12/31/2022 | | 12/31/2021 |
| | Current assets | |
| Current assets | |
| Current assets | Current assets | | $ | 44,893,050 | | | $ | 14,651,294 | | | $ | 12,928,367 | |
| Other assets | Other assets | | 122,727,914 | | | 128,858,889 | | | 135,519,290 | |
| Current liabilities | Current liabilities | | 23,595,688 | | | 16,314,452 | | | 11,554,477 | |
| Long-term liabilities | Long-term liabilities | | 38,133,180 | | | 46,285,367 | | | 56,752,516 | |
| Member's equity | Member's equity | | 105,892,096 | | | 80,910,363 | | | 80,140,664 | |
| Revenue | Revenue | | 208,356,815 | | | 114,573,587 | | | 70,551,667 | |
| Gross Profit | Gross Profit | | 34,061,712 | | | 9,312,124 | | | 3,854,114 | |
| Net Income | Net Income | | 25,195,703 | | | 769,700 | | | (8,762,567) | |
The Company recorded equity in net income (loss) of approximately $10,170,000, $344,000$8,640,000, $3,704,000 and $(61,000)$10,170,000 from our investments for the years ended December 31, 2021, 20202023, 2022 and 20192021 respectively. The Company received distributions of approximately $6,625,000, $390,000$15,763,000, $7,005,000 and $1,191,000$6,625,000 for our investments for the years ended December 31, 2021, 20202023, 2022 and 20192021 respectively. The Company has undistributed net earnings in investees of approximately $3,108,000$5,178,000 and $662,000$3,648,000 as of December 31, 20212023 and 2020,2022, respectively.
NOTE 6 - REVOLVING OPERATING NOTE
On February 6, 2018, Dakota Ethanol executedhas a revolving promissory note with Farm Credit Services of America (FCSA) in the amount up to $10,000,000 or the amount available in accordance with the borrowing base calculation, whichever is less. Dakota Ethanol amended the note agreement with FCSA in June of 2020 and October of 2021. Under the amendments, the available credit under the revolving operating note was reduced to $2,000,000.$20,000,000. There is a non-use fee of 0.25% per annum on the unused portion of the $2,000,000 availability.note. The note is collateralized by substantially all assets of the Company. The note expires on November 1, 2023.2025. Interest on the outstanding principal balance will accrue at 305300 basis points above the Secured Overnight Financing 30-day Average Rate ("SOFR 30-day average rate.30"). The interest rate is not subject to a floor. The rate was 3.10%8.34% at December 31, 2021.2023. On December 31, 2021,2023, Dakota Ethanol had no balance$0 outstanding and $0$20,000,000 available to be drawn on the revolving promissory note.
NOTE 7 - LONG-TERM NOTES PAYABLE
On August 1, 2017, Dakota Ethanol executedhad a term note from FCSA in the amount of $8,000,000. Dakota Ethanol agreed to makemade monthly interest payments starting September 1, 2017 and annual principal payments of $1,000,000 starting on August 1, 2018.$1,000,000. The payment on August 1, 2020 was deferred after the note was amended with FCSA and is now due on August 1, 2025. The notes maturesmatured on August 1, 2025. Interest on the outstanding principal balance will accrueaccrued at 330325 basis points above the SOFR 30-day average rate.30. The interest rate iswas not subject to a floor. The ratebalance of the term note was 3.35% at December 31, 2021. On December 31, 2021, Dakota Ethanol had $5,000,000 outstanding on the note.paid off in its entirety in July 2023.
On February 6, 2018, Dakota Ethanol executedhas a reducing revolving promissory note from FCSA in the amount up to $40,000,000$60,000,000 or the amount available in accordance with the borrowing availability under the credit agreement. Dakota Ethanol amended the note agreement with FCSA in June of 2020. Under the amendment, the available credit on the reducing revolving note was increased to $48,000,000. The amount Dakota Ethanol can borrow on the note decreases by $1,750,000$2,500,000 semi-annually starting on JulyJanuary 1, 20212024 until the maximum balance reaches $32,250,000$40,000,000 on July 1, 2025.2027. The note matures on January 1, 2026.2030. Interest on the outstanding principal balance will accrue at 330325 basis points above the SOFR 30-day average rate.30. The interest rate is not subject to a floor. The rate was 3.35%8.59% at December 31, 2021.2023. The note contains a non-use fee of 0.50% on the unused portion of the note. On December 31, 2021,2023, Dakota Ethanol had $0$20,001,000 outstanding and $46,250,000$39,999,000 available to be drawn on the note.
As part of the note payable agreement,notes, Dakota Ethanol is subject to certain restrictive covenants establishing financial reporting requirements, distribution and capital expenditure limits, minimum debt service coverage ratios, net worth and working capital requirements. The note is collateralized by substantially all assets of the Company. The note payable agreement was amended in October 20212023 with modifications to the requirements. The minimum working capital covenant was increased to $13,500,000$15,000,000 and the minimum net worth covenant was increased to $30,000,000. We are required to maintain a debt service coverage ratio of at least 1.25:1.00.
LAKE AREA CORN PROCESSORS, LLC
NOTES TO CONSOLIDATED FINANCIAL STATEMENTS
DECEMBER 31, 2021, 20202023, 2022 AND 20192021
net worth covenant was increased to $28,000,000. We are required to maintain a debt service coverage ratio of at least 1.25:1.00.
The Company entered into a loan agreement with the Small Business Association through First State Bank, Gothenburg, NE on April 4, 2020 for $760,400 as part of the Paycheck Protection Program under Division A, Title I of the Coronavirus Aid, Relief and Economic Security Act (CARES Act). In June 2021, the Company received notification from the Small Business Administration that all loan proceeds and accrued interest received and recorded by the Company were forgiven. Due to forgiveness of the loan, the Company recorded a gain on debt extinguishment in other income in the statement of operations for $768,400 for the year ending December 31, 2021.
The Company also received an Economic Injury Disaster Loan (EIDL) in the amount of $10,000 in June 2020. The Company was notified by the Small Business Association in June 2021 that all EIDL proceeds received by the Company had been forgiven. Due to forgiveness of the loan, the Company recorded a gain on debt extinguishment in other income in the statement of operations for $10,000 for the year ending December 31, 2021.
The balancebalances of the notes payable are as of December 31, 2021 and 2020 is as follows:follows. The balances reflect the updated agreement:
| | 2021 | | 2020 |
| | Note Payable - FCSA | | $ | 5,000,000 | | | $ | 36,000,000 | |
| Note Payable - Other | | — | | | 770,400 | |
| | 2023 | | | | 2023 | | 2022 |
| Revolving Note Payable | |
| Term Note Payable | |
| Reducing Revolving Note Payable | |
| Less unamortized debt issuance costs | Less unamortized debt issuance costs | | (4,861) | | | (7,535) | |
| 4,995,139 | | | 36,762,865 | |
| | 20,001,000 | |
| Less current portion | Less current portion | | (1,000,000) | | | (1,201,628) | |
| $ | 3,995,139 | | | $ | 35,561,237 | |
| | $ | |
Principal maturities for the next five years are estimated as follows:
| | | | | | | | | | |
| | | | |
| Years Ending December 31, | | Principal | | |
| 2022 | | $ | 1,000,000 | | | |
| 2023 | | 1,000,000 | | | |
| 2024 | | 1,000,000 | | | |
| 2025 | | 2,000,000 | | | |
| | | | |
| thereafter | | — | | | |
| | $ | 5,000,000 | | | |
| | | | | | | | | | |
| | | | |
| Years Ending December 31, | | Principal | | |
| 2024 | | $ | — | | | |
| 2025 | | — | | | |
| 2026 | | — | | | |
| 2027 | | — | | | |
| 2028 | | — | | | |
| thereafter | | 20,001,000 | | | |
| | | | |
| | 20,001,000 | | | |
| | | | |
NOTE 8 - EMPLOYEE BENEFIT PLANS
Dakota Ethanol maintains a 401(k) plan for the employees who meet the eligibility requirements set forth in the plan documents. Dakota Ethanol matches a percentage of the employees' contributed earnings. Employer contributions to the plan totaled approximately $142,000, $133,000$160,000, $157,000 and $123,000$142,000 for the years ended December 31, 2021, 20202023, 2022 and 2019,2021, respectively.
NOTE 9 - FAIR VALUE MEASUREMENTS
The Company complies with the fair value measurements and disclosures standard which defines fair value, establishes a framework for measuring fair value, and expands disclosure for those assets and liabilities carried on the balance sheet on a fair value basis.
The Company's balance sheet contains derivative financial instruments that are recorded at fair value on a recurring basis. Fair value measurements and disclosures require that assets and liabilities carried at fair value be classified and disclosed according to the process for determining fair value. There are three levels of determining fair value.
LAKE AREA CORN PROCESSORS, LLC
NOTES TO CONSOLIDATED FINANCIAL STATEMENTS
DECEMBER 31, 2021, 2020 AND 2019
Level 1 uses quoted market prices in active markets for identical assets or liabilities.
Level 2 uses observable market based inputs or unobservable inputs that are corroborated by market data.
Level 3 uses unobservable inputs that are not corroborated by market data.
A description of the valuation methodologies used for instruments measured at fair value, as well as the general classification of such instruments pursuant to the valuation hierarchy, is set forth below.
Derivative financial instruments. Commodity futures and options contracts are reported at fair value utilizing Level 1 inputs. For these contracts, the Company obtains fair value measurements from an independent pricing service. The fair value
LAKE AREA CORN PROCESSORS, LLC
NOTES TO CONSOLIDATED FINANCIAL STATEMENTS
DECEMBER 31, 2023, 2022 AND 2021
measurements consider observable data that may include dealer quotes and live trading levels from the CBOTChicago Board of Trade (CBOT) and NYMEXNew York Mercantile Exchange (NYMEX) markets. Over-the-counter commodity options contracts are reported at fair value utilizing Level 2 inputs. For these contracts, the Company obtains fair value measurements from an independent pricing service. The fair value measurements consider observable data that may include dealer quotes and live trading levels from the over-the-counter markets. Forward purchase contracts are reported at fair value utilizing Level 2 inputs. For these contracts, the Company obtains fair value measurements from local grain terminal bid values. The fair value measurements consider observable data that may include live trading bids from local elevators and processing plants which are based off the CBOT markets.
The following table summarizes financial assets and financial liabilities measured at fair value on a recurring basis as of December 31, 20212023 and 2020,2022, segregated by the level of the valuation inputs within the fair value hierarchy utilized to measure fair value:
| | | | | | | | | | | | | | | | | | | | | | | | | | |
| | Total | | Level 1 | | Level 2 | | Level 3 |
| December 31, 2023 | | | | | | | | |
| | | | | | | | |
| Assets: | | | | | | | | |
| Derivative financial instruments, futures and options contracts | | $ | 289,681 | | | $ | 289,681 | | | $ | — | | | $ | — | |
| Forward contracts | | 16,878 | | | — | | | 16,878 | | | — | |
| | | | | | | | |
| Liabilities: | | | | | | | | |
| Derivative financial instruments, futures and options contracts | | $ | 200 | | | $ | 200 | | | $ | — | | | $ | — | |
| Forward contracts | | 1,114,590 | | | — | | | 1,114,590 | | | — | |
| | | | | | | | |
| December 31, 2022 | | | | | | | | |
| | | | | | | | |
| Assets: | | | | | | | | |
| | | | | | | | |
| Derivative financial instruments, futures and options contracts | | $ | 252,450 | | | $ | 252,450 | | | $ | — | | | $ | — | |
| Forward contracts | | 922,181 | | | — | | | 922,181 | | | — | |
| | | | | | | | |
| Liabilities: | | | | | | | | |
| Derivative financial instruments, futures and options contracts | | $ | 395,300 | | | $ | 395,300 | | | $ | — | | | $ | — | |
| Forward contracts | | 435,053 | | | — | | | 435,053 | | | — | |
| | | | | | | | | | | | | | | | | | | | | | | | | | |
| | Total | | Level 1 | | Level 2 | | Level 3 |
| December 31, 2021 | | | | | | | | |
| | | | | | | | |
| Assets: | | | | | | | | |
| Derivative financial instruments, futures and options contracts | | $ | 140,863 | | | $ | 140,863 | | | $ | — | | | $ | — | |
| Forward contracts | | 892,509 | | | — | | | 892,509 | | | — | |
| | | | | | | | |
| Liabilities: | | | | | | | | |
| Derivative financial instruments, futures and options contracts | | $ | 1,238,560 | | | $ | 1,238,560 | | | $ | — | | | $ | — | |
| Forward contracts | | 1,490,510 | | | — | | | 1,490,510 | | | — | |
| | | | | | | | |
| December 31, 2020 | | | | | | | | |
| | | | | | | | |
| Assets: | | | | | | | | |
| | | | | | | | |
| Derivative financial instruments, forward contracts | | $ | 1,742,054 | | | $ | — | | | $ | 1,742,054 | | | $ | — | |
| | | | | | | | |
| Liabilities: | | | | | | | | |
| Derivative financial instruments, futures and options contracts | | $ | 1,799,688 | | | $ | 1,799,688 | | | $ | — | | | $ | — | |
| Forward contracts | | 244,181 | | | — | | | 244,181 | | | — | |
During the years ended December 31, 20212023 and 2020,2022, the Company did not make any changes between Level 1 and Level 2 assets and liabilities. As of December 31, 20212023 and 2020,2022, the Company did not have any Level 3 assets or liabilities.
Certain financial assets and financial liabilities are measured at fair value on a nonrecurring basis; that is, the instruments are not measured at fair value on an ongoing basis but are subject to fair value adjustments in certain circumstances (for example,
LAKE AREA CORN PROCESSORS, LLC
NOTES TO CONSOLIDATED FINANCIAL STATEMENTS
DECEMBER 31, 2021, 2020 AND 2019
when there is evidence of impairment). Financial assets and financial liabilities measured at fair value on a non-recurring basis were not significant at December 31, 20212023 and 2020.2022.
Disclosure requirements for fair value of financial instruments require disclosure of the fair value of financial assets and financial liabilities, including those financial assets and financial liabilities that are not measured and reported at fair value on a recurring basis or nonrecurring basis. The methodologies for estimating the fair value of financial assets and financial liabilities that are measured at fair value on a recurring or nonrecurring basis are discussed above.
LAKE AREA CORN PROCESSORS, LLC
NOTES TO CONSOLIDATED FINANCIAL STATEMENTS
DECEMBER 31, 2023, 2022 AND 2021
The Company believes the carrying amount of cash and cash equivalents (level 1), accounts receivable (level 2), accounts payable and accruals (level 2) and short-term debt (level 2) approximates fair value.
The carrying amount of long-term obligations (level 3) at December 31, 20212023 of $5,000,000$20,001,000 had an estimated fair value of approximately $5,000,000$20,001,000 based on estimated interest rates for comparable debt. The carrying amount of long-term obligations at December 31, 20202022 of $36,770,400$4,001,000 had an estimated fair value of approximately $36,770,400.$4,001,000.
NOTE 10 - COMMITMENTS, CONTINGENCIES AND AGREEMENTS
Dakota Ethanol has entered into contracts and agreements regarding the operation of the ethanol plant as follows:
Natural Gas - The agreements provide Dakota Ethanol with transportation and distribution services for natural gas through October 2028, and is renewable annually thereafter. Fees for the services are at tariff rates approved by regulatory agencies. The agreement does not require minimum purchases of natural gas during their initial term.
Electricity - The agreement provides Dakota Ethanol with electric service through June 2029. The contract automatically renews unless prior notice of cancellation is given. The agreement sets rates for energy usage based on market rates and requires a minimum charge each month during the term of the agreement.
Expenses related to the agreements for the purchase of electricity and natural gas were approximately $12,415,000, $8,899,000,$13,462,000, $13,897,000, and $8,157,000,$12,415,000, for the years ended December 31, 2021, 20202023, 2022 and 2019,2021, respectively.
Minimum annual payments during the term of the electricity agreement are as follows:
| | Years Ending December 31, | Years Ending December 31, | | Amount | Years Ending December 31, | | Amount |
| 2022 | | $184,800 |
| 2023 | | 184,800 |
| 2024 | 2024 | | 184,800 | 2024 | | $1,381,722 |
| 2025 | 2025 | | 184,800 | 2025 | | 1,381,722 |
| 2026 | 2026 | | 184,800 | 2026 | | 1,381,722 |
| 2027 | | 2027 | | 1,381,722 |
| 2028 | | 2028 | | 1,020,536 |
| thereafter | thereafter | | 462,000 | thereafter | | 92,400 |
Ethanol Fuel Marketing Agreement - Dakota Ethanol has an agreement with RPMG, (a related party, see note 11), a joint venture of ethanol producers, for the sale, marketing billing and receipt of payment and other administrative services for all ethanol produced by the plant. The agreement continues indefinitely unless terminated under terms set forth in the agreement. Based on the terms of the marketing agreement, RPMG will use commercially reasonable efforts to obtain the best price for all ethanol sold subject to the terms of the marketing agreement. RPMG shall have discretion to determine the price, terms and conditions of the sale of ethanol that is sold and marketed as indexed gallons.
Distiller's Grain Marketing Agreement - Dakota Ethanol has an agreement with RPMG, (a related party, see note 11), for the marketing of all distiller's dried grains produced by the plant. The agreement continues indefinitely unless terminated under terms set forth in the agreement.
Corn Oil Marketing Agreement - Dakota Ethanol has an agreement with RPMG, (a related party, see note 11), for the marketing of all corn oil produced by the plant. The agreement continues indefinitely unless terminated under terms set forth in the agreement.
Capital Expenditures
- Dakota Ethanol has committed to a contract for the design and construction of a new 2 million gallon ethanol storage tank. The value of the construction is approximately $2.2 million, of which approximately $1.5
LAKE AREA CORN PROCESSORS, LLC
NOTES TO CONSOLIDATED FINANCIAL STATEMENTS
DECEMBER 31, 2021, 20202023, 2022 AND 20192021
million
Revenues and marketing fees related to the agreements are as follows:
| | | | | | | | | | | | | | | | | | | | |
| | Years Ended December 31, |
| | 2023 | | 2022 | | 2021 |
| | | | | | |
| Revenues ethanol | | $ | 212,497,680 | | | $ | 209,721,622 | | | $ | 203,807,925 | |
| Revenues distillers grains | | 13,268,415 | | | 15,980,263 | | | 13,971,006 | |
| Revenues corn oil | | 17,971,900 | | | 20,053,909 | | | 14,330,754 | |
| | | | | | |
| Marketing fees ethanol | | $ | 230,553 | | | $ | 293,253 | | | $ | 267,348 | |
| Marketing fees distillers grains | | 61,817 | | | 67,294 | | | 65,651 | |
| Marketing fees corn oil | | 60,618 | | | 54,022 | | | 50,631 | |
| | | | | | |
| | | | | | |
| | | | | | |
| | | | | | |
Agreements
On June 24, 2022, Dakota Ethanol, LLC, entered into the Precedent Agreement West Leg 2023 Expansion between Northern Natural Gas Company and Dakota Ethanol (the "West Leg Agreement"). Pursuant to the West Leg Agreement, Dakota Ethanol will receive additional firm commitment natural gas transportation services. In order to secure these firm commitment natural gas transportation services, Dakota Ethanol to paid Northern Natural Gas Company a contribution to the cost of constructing certain additional natural gas pipeline and storage facilities. Dakota Ethanol's contribution was $8,890,000. For a period of five years beginning on November 1, 2023, Dakota Ethanol is outstanding asentitled to a firm natural gas commitment of December 31, 2021. The project is expected to be completed7,000 decatherms per day during the fourth quarterwinter months (between November 1 and March 31 each year), and firm commitment of 2022. The Company has also committed to a contract for the design and construction of an eighth fermentor. The value of the construction is approximately $3.1 million, of which approximately $2.2 million is outstanding as of December 31, 2021. The project is expected to be completed4,340 decatherms per day during the third quarter of 2022.
From time to time in the normal course of business, the Company can be subject to litigation based on its operations. There is no current litigation nor any litigation that is considered probable at this time.
NOTE 11 - RELATED PARTY TRANSACTIONS
Dakota Ethanol has a 5% interest in RPMG, and Dakota Ethanol has entered into marketing agreements for the exclusive rights to market, sell and distribute the entire ethanol, dried distiller's grains, and corn oil inventories produced by Dakota Ethanol. The marketing fees are included in net revenues. Dakota Ethanol also purchases denaturant from RPMG. Amounts due from RPMG are presented as accounts receivable (related party) on the balance sheet.
Revenues and marketing fees related to the agreements are as follows:
| | | | | | | | | | | | | | | | | | | | |
| | Years Ended December 31, |
| | 2021 | | 2020 | | 2019 |
| | | | | | |
| Revenues ethanol | | $ | 203,807,925 | | | $ | 99,280,464 | | | $ | 90,555,111 | |
| Revenues distillers grains | | 13,971,006 | | | 9,541,074 | | | 5,108,266 | |
| Revenues corn oil | | 14,330,754 | | | 5,969,230 | | | 4,406,438 | |
| | | | | | |
| Marketing fees ethanol | | $ | 267,348 | | | $ | 203,101 | | | $ | 242,607 | |
| Marketing fees distillers grains | | 65,651 | | | 68,354 | | | 36,935 | |
| Marketing fees corn oil | | 50,631 | | | 44,778 | | | 36,457 | |
| Denaturant purchases | | 3,647,081 | | | 1,503,071 | | | 918,071 | |
| | | | | | |
| | | | | | |
| Amounts due to RPMG | | 79,909 | | | 47,073 | | | 46,234 | |
The Company purchased corn and services from members of its Board of Directors that farm and operate local businesses. Corn purchases from these related parties during the fiscal years ended December 31, 2021, 20202023, 2022 and 20192021 totaled approximately $2,139,000, $1,022,000$2,233,000, $1,964,000 and $1,084,000,$2,139,000, respectively. As of December 31, 20212023 and 2020,2022, the Company 0had no outstanding obligations to these related parties.
NOTE 12 - CAPTIVE INSURANCE
The Company participates, along with other plants in the industry, in a group captive insurance company (Captive). The Captive insures losses related to workman's compensation, commercial property and general liability. The Captive reinsures catastrophic losses for all participants, including the Company, in excess of predetermined amounts. The Company's premiums are accrued by a charge to income for the period to which the premium relates and is remitted by the Company's insurer to the captive reinsurer. These premiums are structured such that the Company has made a prepaid collateral deposit estimated for losses related to the above coverage. The Captive insurer has estimated and collected an amount in excess of the estimated losses but less than the catastrophic loss limit insured by the Captive. The Company cannot be assessed over the amount in the collateral fund.
LAKE AREA CORN PROCESSORS, LLC
NOTES TO CONSOLIDATED FINANCIAL STATEMENTS
DECEMBER 31, 2021, 20202023, 2022 AND 20192021
NOTE 13 - QUARTERLY FINANCIAL REPORTING (UNAUDITED)
Summary quarterly results are as follows:
| | First Quarter | | Second Quarter | | Third Quarter | | Fourth Quarter |
| Year ended December 31, 2021 | | | | | | | |
| First Quarter | | | First Quarter | | Second Quarter | | Third Quarter | | Fourth Quarter |
| Year ended December 31, 2023 | |
| Total revenues | |
| Total revenues | |
| Total revenues | Total revenues | $ | 48,615,653 | | | $ | 64,238,127 | | | $ | 63,794,494 | | | $ | 82,341,329 | |
| Gross profit | Gross profit | 6,957,219 | | | 9,468,054 | | | 9,041,115 | | | 26,247,600 | |
| Income from operations | Income from operations | 5,706,085 | | | 8,191,959 | | | 7,791,872 | | | 24,593,778 | |
| Net income | Net income | 6,535,530 | | | 10,058,652 | | | 8,812,557 | | | 31,679,547 | |
| Basic and diluted earnings per unit | Basic and diluted earnings per unit | 0.22 | | | 0.34 | | | 0.30 | | | 1.07 | |
| | Year ended December 31, 2020 | |
| Year ended December 31, 2022 | |
| Year ended December 31, 2022 | |
| Year ended December 31, 2022 | |
| Total revenues | |
| Total revenues | |
| Total revenues | |
| Gross profit | |
| Income from operations | |
| Net income | |
| Basic and diluted earnings per unit | |
| | Year ended December 31, 2021 | |
| Year ended December 31, 2021 | |
| Year ended December 31, 2021 | |
| Total revenues | |
| Total revenues | |
| Total revenues | Total revenues | $ | 32,456,238 | | | $ | 25,424,832 | | | $ | 33,917,787 | | | $ | 38,722,957 | |
| Gross profit (loss) | Gross profit (loss) | (7,849,642) | | | 5,611,925 | | | 6,046,492 | | | 2,219,771 | |
| Income (loss) from operations | Income (loss) from operations | (9,189,480) | | | 4,666,216 | | | 5,054,469 | | | 1,079,267 | |
| Net income (loss) | Net income (loss) | (10,475,043) | | | 4,213,375 | | | 5,810,426 | | | 1,506,881 | |
| Basic and diluted earnings (loss) per unit | Basic and diluted earnings (loss) per unit | (0.35) | | | 0.14 | | | 0.20 | | | 0.05 | |
| | Year ended December 31, 2019 | |
| Total revenues | $ | 21,613,298 | | | $ | 26,096,989 | | | $ | 32,441,510 | | | $ | 35,835,024 | |
| Gross profit (loss) | 2,450,262 | | | 1,298,964 | | | (1,815,202) | | | (634,434) | |
| Income (loss) from operations | 1,440,935 | | | 372,585 | | | (2,786,864) | | | (1,787,409) | |
| Net income (loss) | 1,790,204 | | | (192,897) | | | (3,599,789) | | | (1,821,702) | |
| Basic and diluted earnings (loss) per unit | 0.06 | | | (0.01) | | | (0.12) | | | (0.06) | |
NOTE 14 - PARENT FINANCIAL STATEMENTS
The following financial information represents the unconsolidated financial statements of Lake Area Corn Processors, LLC as of December 31, 20212023 and 2020,2022, and for the years ended December 31, 2021, 20202023, 2022 and 2019.2021. The Company's ability to receive distributions from its wholly owned subsidiary, Dakota Ethanol, LLC, is based on the terms and conditions set forth in the FourthFifth Amendment to its credit agreement with Farm Credit Services of America, PCA and Farm Credit Services of America, FLCA. Under the FourthFifth Amendment, if no event of default or potential default exists, Dakota Ethanol may make distributions in an amount up to 75% of prior year's net income, so long as the Company's working capital stays above $18,000,000$20,000,000 post distribution. The combined distributions for 2021 and 2022 shall also be limited to 75% of the combined net income of 2020 and 2021.
LAKE AREA CORN PROCESSORS, LLC
NOTES TO CONSOLIDATED FINANCIAL STATEMENTS
DECEMBER 31, 2021, 20202023, 2022 AND 20192021
The unconsolidated balance sheet is as follows:
| | | | | | | | | | | |
| LAKE AREA CORN PROCESSORS, LLC | | | |
| UNCONSOLIDATED BALANCE SHEETS | | | |
| | | |
| December 31, 2021 | | December 31, 2020 |
| ASSETS | | | |
| | | |
| CURRENT ASSETS | | | |
| Cash and cash equivalents | $ | 121,244 | | | $ | 58,505 | |
| Accounts Receivable - Subsidiary | 2,500,000 | | | — | |
| Prepaid expenses | — | | | 24,542 | |
| Total current assets | 2,621,244 | | | 83,047 | |
| | | |
| OTHER ASSETS | | | |
| Goodwill | 10,395,766 | | | 10,395,766 | |
| Investment in Dakota Ethanol | 81,870,361 | | | 39,554,776 | |
| Investments - other | 18,581,494 | | | 15,234,990 | |
| Total other assets | 110,847,621 | | | 65,185,532 | |
| | | |
| TOTAL ASSETS | $ | 113,468,865 | | | $ | 65,268,579 | |
| | | |
| LIABILITIES AND MEMBERS' EQUITY | | | |
| | | |
| CURRENT LIABILITIES | | | |
| Total current liabilities | — | | | — | |
| | | |
| LONG-TERM LIABILITIES | | | |
| Total long-term liabilities | — | | | — | |
| | | |
| MEMBERS' EQUITY (29,620,000 units issued and outstanding) | 113,468,865 | | | 65,268,579 | |
| | | |
| TOTAL LIABILITIES AND MEMBERS' EQUITY | $ | 113,468,865 | | | $ | 65,268,579 | |
| | | |
| | | | | | | | | | | |
| LAKE AREA CORN PROCESSORS, LLC | | | |
| UNCONSOLIDATED BALANCE SHEETS | | | |
| | | |
| December 31, 2023 | | December 31, 2022 |
| ASSETS | | | |
| | | |
| CURRENT ASSETS | | | |
| Cash and cash equivalents | $ | 92,223 | | | $ | 114,718 | |
| | | |
| Prepaid expenses | 4,700 | | | 4,700 | |
| Total current assets | 96,923 | | | 119,418 | |
| | | |
| OTHER ASSETS | | | |
| Goodwill | 10,395,766 | | | 10,395,766 | |
| Investment in Dakota Ethanol | 72,201,447 | | | 82,253,625 | |
| Investments - other | 52,707,140 | | | 15,188,797 | |
| Total other assets | 135,304,353 | | | 107,838,188 | |
| | | |
| TOTAL ASSETS | $ | 135,401,276 | | | $ | 107,957,606 | |
| | | |
| LIABILITIES AND MEMBERS' EQUITY | | | |
| | | |
| CURRENT LIABILITIES | | | |
| Outstanding checks in excess of bank balance | 7,847 | | | — | |
| Accounts Payable | — | | | 9,600 | |
| Total current liabilities | 7,847 | | | 9,600 | |
| | | |
| LONG-TERM LIABILITIES | | | |
| Total long-term liabilities | — | | | — | |
| | | |
| MEMBERS' EQUITY (29,620,000 units issued and outstanding) | 135,393,429 | | | 107,948,006 | |
| | | |
| TOTAL LIABILITIES AND MEMBERS' EQUITY | $ | 135,401,276 | | | $ | 107,957,606 | |
| | | |
LAKE AREA CORN PROCESSORS, LLC
NOTES TO CONSOLIDATED FINANCIAL STATEMENTS
DECEMBER 31, 2021, 20202023, 2022 AND 20192021
The unconsolidated statement of operation is as follows:
| | | | | | | | | | | | | | | | | |
| LAKE AREA CORN PROCESSORS, LLC | | | | | |
| UNCONSOLIDATED STATEMENTS OF OPERATIONS | | | | | |
| Year Ended | | Year Ended | | Year Ended |
| December 31, 2021 | | December 31, 2020 | | December 31, 2019 |
| EQUITY IN NET INCOME (LOSS) OF CONSOLIDATED SUBSIDIARY | $ | 47,366,330 | | | $ | 1,073,965 | | | $ | (3,298,638) | |
| OPERATING EXPENSES | 83,659 | | | 127,978 | | | 311,001 | |
| INCOME (LOSS) FROM OPERATIONS | 47,282,671 | | | 945,987 | | | (3,609,639) | |
| OTHER INCOME (EXPENSE) | | | | | |
| Interest and other income | 7,112 | | | 10,737 | | | 5,949 | |
| Equity in net income (loss) of investments | 9,796,503 | | | 98,915 | | | (220,494) | |
| Total other income (expense) | 9,803,615 | | | 109,652 | | | (214,545) | |
| NET INCOME (LOSS) | $ | 57,086,286 | | | $ | 1,055,639 | | | $ | (3,824,184) | |
| | | | | | | | | | | | | | | | | |
| LAKE AREA CORN PROCESSORS, LLC | | | | | |
| UNCONSOLIDATED STATEMENTS OF OPERATIONS | | | | | |
| Year Ended | | Year Ended | | Year Ended |
| December 31, 2023 | | December 31, 2022 | | December 31, 2021 |
| EQUITY IN NET INCOME OF CONSOLIDATED SUBSIDIARY | $ | 33,858,889 | | | $ | 23,985,264 | | | $ | 47,366,330 | |
| OPERATING EXPENSES | 119,948 | | | 55,829 | | | 83,659 | |
| INCOME FROM OPERATIONS | 33,738,941 | | | 23,929,435 | | | 47,282,671 | |
| OTHER INCOME (EXPENSE) | | | | | |
| Interest and other income | 12,549 | | | 35,219 | | | 7,112 | |
| Equity in net income of investments | 8,629,903 | | | 3,337,303 | | | 9,796,503 | |
| Total other income | 8,642,452 | | | 3,372,522 | | | 9,803,615 | |
| NET INCOME | $ | 42,381,393 | | | $ | 27,301,957 | | | $ | 57,086,286 | |
LAKE AREA CORN PROCESSORS, LLC
NOTES TO CONSOLIDATED FINANCIAL STATEMENTS
DECEMBER 31, 2021, 20202023, 2022 AND 20192021
The unconsolidated statement of cash flows is as follows:
| | LAKE AREA CORN PROCESSORS, LLC | LAKE AREA CORN PROCESSORS, LLC | |
| UNCONSOLIDATED STATEMENTS OF CASH FLOWS | UNCONSOLIDATED STATEMENTS OF CASH FLOWS | |
| Year Ended | | Year Ended | | Year Ended |
| December 31, 2021 | | December 31, 2020 | | December 31, 2019 |
| UNCONSOLIDATED STATEMENTS OF CASH FLOWS | |
| UNCONSOLIDATED STATEMENTS OF CASH FLOWS | |
| Year Ended | |
| Year Ended | |
| Year Ended | | | Year Ended |
| December 31, 2023 | | | December 31, 2023 | | December 31, 2022 | | December 31, 2021 |
| OPERATING ACTIVITIES | OPERATING ACTIVITIES | | | | | |
| Net income (loss) | $ | 57,086,286 | | | $ | 1,055,639 | | | $ | (3,824,184) | |
| Adjustments to reconcile net income (loss) to net cash provided by operating activities | |
| Net income | |
| Net income | |
| Net income | |
| Adjustments to reconcile net income to net cash provided by operating activities | |
| Distributions in excess of earnings (earnings in excess of distributions) from investments | Distributions in excess of earnings (earnings in excess of distributions) from investments | (3,346,503) | | | (98,915) | | | 1,220,493 | |
| Equity in (net income) loss of consolidated subsidiary | (47,366,330) | | | (1,073,965) | | | 3,298,638 | |
| Distributions in excess of earnings (earnings in excess of distributions) from investments | |
| Distributions in excess of earnings (earnings in excess of distributions) from investments | |
| Equity in (net income) of consolidated subsidiary | |
| (Increase) decrease in | (Increase) decrease in | |
| Accounts receivable - subsidiary | |
| Accounts receivable - subsidiary | |
| Accounts receivable - subsidiary | Accounts receivable - subsidiary | (2,500,000) | | | — | | | — | |
| Prepaid expenses | Prepaid expenses | 24,542 | | | (7,456) | | | (275) | |
| Increase (decrease) in | Increase (decrease) in | |
| Accounts payable | Accounts payable | — | | | — | | | — | |
| Accounts payable | |
| Accounts payable | |
| NET CASH PROVIDED BY (USED IN) OPERATING ACTIVITIES | NET CASH PROVIDED BY (USED IN) OPERATING ACTIVITIES | 3,897,995 | | | (124,697) | | | 694,672 | |
| | INVESTING ACTIVITIES | INVESTING ACTIVITIES | |
| INVESTING ACTIVITIES | |
| INVESTING ACTIVITIES | |
| Distributions received from consolidated subsidiary | Distributions received from consolidated subsidiary | 5,050,744 | | | 100,000 | | | 750,000 | |
| Investment in consolidated subsidiary | — | | | — | | | (1,000,000) | |
| Distributions received from consolidated subsidiary | |
| Distributions received from consolidated subsidiary | |
| | Purchase of investments | Purchase of investments | — | | | — | | | (500,000) | |
| Other investing cash inflow (outflow) | — | | | 49,729 | | | 41,338 | |
| NET CASH PROVIDED BY (USED IN) INVESTING ACTIVITIES | 5,050,744 | | | 149,729 | | | (708,662) | |
| Purchase of investments | |
| Purchase of investments | |
| | NET CASH PROVIDED BY INVESTING ACTIVITIES | |
| NET CASH PROVIDED BY INVESTING ACTIVITIES | |
| NET CASH PROVIDED BY INVESTING ACTIVITIES | |
| | FINANCING ACTIVITIES | FINANCING ACTIVITIES | |
| FINANCING ACTIVITIES | |
| FINANCING ACTIVITIES | |
| Outstanding checks in excess of bank balance | |
| Outstanding checks in excess of bank balance | |
| Outstanding checks in excess of bank balance | |
| Distributions to members | Distributions to members | (8,886,000) | | | — | | | — | |
| NET CASH USED FOR FINANCING ACTIVITIES | NET CASH USED FOR FINANCING ACTIVITIES | (8,886,000) | | | — | | | — | |
| | NET INCREASE (DECREASE) IN CASH AND CASH EQUIVALENTS | 62,739 | | | 25,032 | | | (13,990) | |
| NET INCREASE (DECREASE) IN CASH,CASH EQUIVALENTS, AND RESTRICTED CASH | |
| NET INCREASE (DECREASE) IN CASH,CASH EQUIVALENTS, AND RESTRICTED CASH | |
| NET INCREASE (DECREASE) IN CASH,CASH EQUIVALENTS, AND RESTRICTED CASH | |
| | CASH AND CASH EQUIVALENTS AT BEGINNING OF PERIOD | 58,505 | | | 33,473 | | | 47,463 | |
| CASH,CASH EQUIVALENTS, AND RESTRICTED CASH AT BEGINNING OF PERIOD | |
| CASH,CASH EQUIVALENTS, AND RESTRICTED CASH AT BEGINNING OF PERIOD | |
| CASH,CASH EQUIVALENTS, AND RESTRICTED CASH AT BEGINNING OF PERIOD | |
| | CASH AND CASH EQUIVALENTS AT END OF PERIOD | $ | 121,244 | | | $ | 58,505 | | | $ | 33,473 | |
| CASH,CASH EQUIVALENTS, AND RESTRICTED CASH AT END OF PERIOD | |
| CASH,CASH EQUIVALENTS, AND RESTRICTED CASH AT END OF PERIOD | |
| CASH,CASH EQUIVALENTS, AND RESTRICTED CASH AT END OF PERIOD | |
LAKE AREA CORN PROCESSORS, LLC
NOTES TO CONSOLIDATED FINANCIAL STATEMENTS
DECEMBER 31, 2021, 2020 AND 2019
NOTE 1615 - SUBSEQUENT EVENTS
LAKE AREA CORN PROCESSORS, LLC
NOTES TO CONSOLIDATED FINANCIAL STATEMENTS
DECEMBER 31, 2023, 2022 AND 2021
During January 2022,2024, Dakota Ethanol committed to the agreements for the design and construction of a distillers corn oil extraction and distillation equipment. The value of the agreements are approximately $11.8 million. The projects are expected to be completed during the fourth quarter of 2024.
During March 2024, the Company declared a distribution to its members of $14,810,000,$8,886,000, or $0.50$0.30 per capital unit, to unit holders of record as of January 1, 2022.
During March 2022, Dakota Ethanol committed to an agreement for the design and construction of an additional grain storage bin. The value of the agreement is approximately $4.5 million. The project is expected to be completed during the fourth quarter of 2022.2024.
ITEM 9. CHANGES IN AND DISAGREEMENTS WITH ACCOUNTANTS ON ACCOUNTING AND FINANCIAL DISCLOSURE.
None.
ITEM 9A. CONTROLS AND PROCEDURES.
Disclosure Controls and Procedures
Our management, including our President and Chief Executive Officer (the principal executive officer), Scott Mundt, along with our Chief Financial Officer (the principal financial officer), Rob Buchholtz, have reviewed and evaluated the effectiveness of our disclosure controls and procedures (as defined in Rule 13a-15(e) and Rule 15d-15(e) under the Securities Exchange Act of 1934, as amended) as of December 31, 2021.2023. Based on this review and evaluation, these officers have concluded that our disclosure controls and procedures are effective to ensure that information required to be disclosed in the reports that we file or submit under the Exchange Act is recorded, processed, summarized and reported within the time periods required by the forms and rules of the Securities and Exchange Commission; and to ensure that the information required to be disclosed by an issuer in the reports that it files or submits under the Exchange Act is accumulated and communicated to our management including our principal executive and principal financial officers, or persons performing similar functions, as appropriate to allow timely decisions regarding required disclosure.
Internal Control Over Financial Reporting
Inherent Limitations Over Internal Controls.
Our internal control over financial reporting is designed to provide reasonable assurance regarding the reliability of financial reporting and the preparation of financial statements for external purposes in accordance with generally accepted accounting principles. Our internal control over financial reporting includes those policies and procedures that:
(i) pertain to the maintenance of records that, in reasonable detail, accurately and fairly reflect the transactions and dispositions of our assets;
(ii) provide reasonable assurance that transactions are recorded as necessary to permit preparation of financial statements in accordance with generally accepted accounting principles, and that our receipts and expenditures are being made only in accordance with authorizations of our management and directors; and
(iii) provide reasonable assurance regarding prevention or timely detection of unauthorized acquisition, use, or disposition of our assets that could have a material effect on the financial statements.
Management, including our Chief Executive Officer and Chief Financial Officer, does not expect that our internal controls will prevent or detect all errors and all fraud. A control system, no matter how well designed and operated, can provide only reasonable, not absolute, assurance that the objectives of the control system are met. Further, the design of a control system must reflect the fact that there are resource constraints, and the benefits of controls must be considered relative to their costs. Because of the inherent limitations in all control systems, no evaluation of internal controls can provide absolute assurance that all control issues and instances of fraud, if any, have been detected. Also, any evaluation of the effectiveness of controls in future periods is subject to the risk that those internal controls may become inadequate because of changes in business conditions, or that the degree of compliance with the policies or procedures may deteriorate.
Management's Annual Report on Internal Control Over Financial Reporting.
Our management is responsible for establishing and maintaining adequate internal control over financial reporting (as defined in Rule 13a-15(f) under the Securities Exchange Act of 1934, as amended). Management conducted an evaluation of the effectiveness of our internal control over financial reporting based on the criteria set forth in Internal Control-Integrated Framework issued by the Committee of Sponsoring Organizations of the Treadway Commission ("COSO") in 2013. Based on this evaluation, management has concluded that our internal control over financial reporting was effective as of December 31, 2021.2023.
This annual report does not include an attestation report of our registered public accounting firm regarding internal control over financial reporting. As we are a non-accelerated filer, management's report is not subject to attestation by our registered public accounting firm pursuant to Section 404(c) of the Sarbanes-Oxley Act of 2002 that permits us to provide only management's report in this annual report.
Changes in Internal Control Over Financial Reporting.
There were no changes in our internal control over financial reporting during the fourth quarter of our fiscal year ended December 31, 20212023 which were identified in connection with management's evaluation required by paragraph (d) of rules 13a-15 and 15d-15 under the Exchange Act that have materially affected, or are reasonably likely to materially affect, our internal control over financial reporting.
ITEM 9B. OTHER INFORMATION.
None.
ITEM 9C. DISCLOSURE REGARDING FOREIGN JURISDICTIONS THAT PREVENT INSPECTIONS
Not Applicable.
PART III
ITEM 10. MANAGERS, EXECUTIVE OFFICERS AND CORPORATE GOVERNANCE.
The information required by this Item is incorporated by reference to the definitive information statement from our 20222024 annual meeting of members to be filed with the Securities and Exchange Commission within 120 days after our 20212023 fiscal year end on December 31, 2021.2023. This information statement is referred to in this report as the 20222024 Information Statement.
ITEM 11. EXECUTIVE COMPENSATION.
The information required by this Item is incorporated by reference to the 20222024 Information Statement.
ITEM 12. SECURITY OWNERSHIP OF CERTAIN BENEFICIAL OWNERS AND MANAGEMENT AND RELATED MEMBER MATTERS.
The information required by this Item is incorporated by reference to the 20222024 Information Statement.
ITEM 13. CERTAIN RELATIONSHIPS AND RELATED TRANSACTIONS, AND MANAGER INDEPENDENCE.
The information required by this Item is incorporated by reference to the 20222024 Information Statement.
ITEM 14. PRINCIPAL ACCOUNTING FEES AND SERVICES.
The information required by this Item is incorporated by reference to the 20222024 Information Statement.
PART IV
ITEM 15. EXHIBITS AND FINANCIAL STATEMENT SCHEDULES.
The following exhibits and financial statements are filed as part of, or are incorporated by reference into, this report:
(1) The financial statements appear beginning on page 3233 of this report.
(2) All supplemental schedules are omitted because of the absence of conditions under which they are required or because the information is shown in the Consolidated Financial Statements or notes thereto.
(3) The exhibits we have filed herewith or incorporated by reference herein are identified in the Exhibit Index set forth below.
The following exhibits are filed as part of this report. Exhibits previously filed are incorporated by reference, as noted.
| | | | | | | | | | | | | | | | | |
| Exhibit No. | Exhibit | | Filed Herewith | | Incorporated by Reference |
| 3.2 | | | | | | Filed as Exhibit 3.6 on the registrant's Form 10-K filed with the Commission on March 31, 2005 and incorporated by reference herein. |
| 3.3 | | | | | | Filed as Exhibit 99.1 on the registrant's Form 8-K filed with the Commission on March 19, 2007 and incorporated by reference herein. |
| 3.4 | | | | | | Filed as Exhibit 99.1 on the registrant's Form 8-K filed with the Commission on January 10, 2018 and incorporated by reference herein. |
| 4.1 | | | | | X | Filed herewithas Exhibit 4.1 on the registrant's Form 10-K filed with the Commission on March 3, 2022 and incorporated by reference herein. |
| 10.1 | | | | | | Filed as Exhibit 10.1 on the registrant's Form 10-Q filed with the Commission on August 14, 2008 and incorporated by reference herein. |
| 10.2 | | | | | | Filed as Exhibit 10.1 on the registrant's Form 10-Q filed with the Commission on August 14, 2007 and incorporated by reference herein. |
| 10.3 | | | | | | Filed as Exhibit 10.1 on the registrant's Form 10-K filed with the Commission on March 30, 2007. |
| 10.4 | | | | | Filed as Exhibit 10.1 on the registrant's Form 8-K filed with the Commission on December 2, 2005 and incorporated by reference herein. |
| 10.5 | | | | | Filed as Exhibit 10.1 on the registrant's Form 10-Q filed with the Commission on May 15, 2009 and incorporated by reference herein. |
| 10.6 | | | | | Filed as Exhibit 10.1 on the registrant's Form 10-Q filed with the Commission on August 12, 2009 and incorporated by reference herein. |
| 10.7 | | | | | Filed as Exhibit 10.2 on the registrant's Form 10-Q filed with the Commission on August 12, 2009 and incorporated by reference herein. |
| 10.8 | | | | | Filed as Exhibit 10.1 on the registrant's Form 10-Q filed with the Commission on August 13, 2010 and incorporated by reference herein. |
| 10.9 | | | | | Filed as Exhibit 10.2 on the registrant's Form 10-Q filed with the Commission on August 13, 2010 and incorporated by reference herein. |
10.10 | | | | | Filed as Exhibit 10.3 on the registrant's Form 10-Q filed with the Commission on August 13, 2010 and incorporated by reference herein. |
| | | | | | | | | | | | | | | | | |
| 10.10 | | | | | | | | | | | | | | | | | Filed as Exhibit 10.3 on the registrant's Form 10-Q filed with the Commission on August 13, 2010 and incorporated by reference herein. |
| 10.11 | | | | | Filed as Exhibit 10.22 on the registrant's Form 10-K filed with the Commission on March 30, 2011 and incorporated by reference herein. |
| 10.12 | | | | | | Filed as Exhibit 10.1 on the registrant's Form 10-Q filed with the Commission on August 11, 2011 and incorporated by reference herein. |
| 10.13 | | | | | | Filed as Exhibit 10.2 on the registrant's Form 10-Q filed with the Commission on August 11, 2011 and incorporated by reference herein. |
| 10.14 | | | | | | Filed as Exhibit 10.3 on the registrant's Form 10-Q filed with the Commission on August 11, 2011 and incorporated by reference herein. |
| 10.15 | | | | | | Filed as Exhibit 10.1 on the registrant's Form 10-Q filed with the Commission on May 14, 2012 and incorporated by reference herein. |
| 10.16 | | | | | | Filed as Exhibit 10.2 on the registrant's Form 10-Q filed with the Commission on May 14, 2012 and incorporated by reference herein. |
| 10.17 | | | | | | Filed as Exhibit 10.3 on the registrant's Form 10-Q filed with the Commission on May 14, 2012 and incorporated by reference herein. |
| 10.18 | | | | | | Filed as Exhibit 10.1 on the registrant's Form 10-Q filed with the Commission on November 13, 2012 and incorporated by reference herein. |
| 10.19 | | | | | | Filed as Exhibit 10.1 on the registrant's Form 10-Q filed with the Commission on May 13, 2013 and incorporated by reference herein. |
| 10.20 | | | | | | Filed as Exhibit 10.2 on the registrant's Form 10-Q filed with the Commission on May 13, 2013 and incorporated by reference herein. |
| 10.21 | | | | | | Filed as Exhibit 10.1 on the registrant's Form 10-Q filed with the Commission on August 13, 2013 and incorporated by reference herein. |
| 10.22 | | | | | | Filed as Exhibit 10.22 on the registrant's Form 10-K filed with the Commission on February 27, 2014 and incorporated by reference herein. |
| 10.23 | | | | | | Filed as Exhibit 10.1 on the registrant's Form 10-Q filed with the Commission on November 13, 2014 and incorporated by reference herein. |
| 10.24 | | | | | | Filed as Exhibit 10.24 on the registrant's Form 10-K filed with the Commission on February 26, 2015 and incorporated by reference herein. |
| | | | | | | | | | | | | | | | | |
| 10.25 | | | | | | Filed as Exhibit 10.1 on the registrant's Form 10-Q filed with the Commission on May 14, 2015 and incorporated by reference herein. |
| | | | | | | | | | | | | | | | | |
| 10.26 | | | | | | Filed as Exhibit 10.1 on the registrant's Form 10-Q filed with the Commission on November 14, 2016 and incorporated by reference herein. |
| 10.27 | | | | | | Filed as Exhibit 10.1 on the registrant's Form 10-Q filed with the Commission on August 11, 2017 and incorporated by reference herein. |
| 10.28 | | | | | | Filed as Exhibit 10.28 on the registrant's Form 10-K filed with the Commission on March 2, 2018 and incorporated by reference herein. |
| 10.29 | | | | | | Filed as Exhibit 10.29 on the registrant's Form 10-K filed with the Commission on March 2, 2018 and incorporated by reference herein. |
| 10.30 | | | | | Filed as Exhibit 10.30 on the registrant's Form 10-K filed with the Commission on February 28, 2019 and incorporated by reference herein. |
| 10.31 | | | | | | Filed as Exhibit 10.1 on the registrant's Form 10-Q filed with the Commission on November 14, 2019 and incorporated by reference herein. |
| 10.32 | | | | | | Filed as Exhibit 10.1 on the registrant's Form 10-Q filed with the Commission on August 14, 2020 and incorporated by reference herein. |
| 10.33 | | | | | | Filed as Exhibit 10.1 on the registrant's Form 10-Q filed with the Commission on November 12, 2021 and incorporated by reference herein. |
| 10.34 | | | | | | Filed as Exhibit 10.1 on the registrant's Form 10-Q filed with the Commission on August 15, 2022 and incorporated by reference herein. |
| 10.35 | | | | | | Filed as Exhibit 10.1 on the registrant's Form 10-Q filed with the Commission on November 14, 2023 and incorporated by reference herein. |
| 31.1 | | | | X | | Filed herewith |
| 31.2 | | | | X | | Filed herewith |
| 32.1 | | | | X | | Filed herewith |
| 32.2 | | | | X | | Filed herewith |
| 101.INS | Inline XBRL Instance Document – the instance document does not appear on the Interactive Data File because its XBRL tags are embedded within the Inline XBRL document | | | | |
| 101.SCH | Inline XBRL Taxonomy Extension Schema Document | | | | |
| | | | | | | | | | | | | | | | | |
| 101.CAL | Inline XBRL Taxonomy Extension Calculation Linkbase Document | | | | |
| 101.DEF | Inline XBRL Taxonomy Extension Definition Linkbase Document | | | | |
| 101.LAB | Inline XBRL Taxonomy Extension Labels Linkbase Document | | | | |
| 101.PRE | Inline XBRL Presentation Linkbase Document | | | | |
| 104 | | Cover Page Interactive Data File (formatted as Inline XBRL and contained in the Interactive Data Files submitted as Exhibit 101). | | | | |
+ Confidential Treatment Requested
** Furnished herewith.
ITEM 16. FORM 10-K SUMMARY.
None.
SIGNATURES
Pursuant to the requirements of Section 13 or 15(d) of the Securities Exchange Act of 1934, the registrant has duly caused this report to be signed on its behalf by the undersigned, thereunto duly authorized.
| | | | | | | | | | | |
| LAKE AREA CORN PROCESSORS, LLC |
| |
| Date: | March 3, 202211, 2024 | | /s/ Scott Mundt |
| Scott Mundt |
| President and Chief Executive Officer
(Principal Executive Officer) |
| |
| Date: | March 3, 202211, 2024 | | /s/ Rob Buchholtz |
| Rob Buchholtz |
| Chief Financial Officer
(Principal Financial and Accounting Officer) |
Pursuant to the requirements of the Securities Exchange Act of 1934, this report has been signed below by the following persons on behalf of the registrant and in the capacities and on the dates indicated.
| | | | | | | | | | | |
Date: | March 3, 2022 | | /s/ Ronald Alverson |
| | | Ronald Alverson, Manager |
| | | |
Date: | March 3, 2022 | | /s/ Todd Brown |
| | | Todd Brown, Manager |
| | | |
Date: | March 3, 2022 | | /s/ Randy Hansen |
| | | Randy Hansen, Manager |
| | | |
Date: | March 3, 2022 | | /s/ Rick Kasperson |
| | | Rick Kasperson, Manager |
| | | |
Date: | March 3, 2022 | | /s/ Marty Thompson |
| | | Marty Thompson, Manager |
| | | |
Date: | March 3, 2022 | | /s/ Wayne Backus |
| | | Wayne Backus, Manager |
| | | |
Date: | March 3, 2022 | | /s/ Dave Wolles |
| | | Dave Wolles, Manager |
| | | |