PART I - FINANCIAL INFORMATION
FORWARD-LOOKING STATEMENTS
In addition to historical information, this Form 10-K contains “forward-looking statements” within the meaning of Section 27A of the federal Securities Act and Section 21E of the Exchange Act, which are subject to the “safe harbor” created by those sections. All statements, other than statements of historical facts, included in this Annual Report on Form 10-K are forward-looking statements. You canForward-looking statements are generally identify forward-looking statementsidentified by our use of forward-looking terminology, such as “anticipate”, “believe”, “continue”, “could”, “estimate”, “expect”, “intend”, “may”, “might”, “plan”, “potential”, “predict”, “seek”,including the terms “anticipate,” “believe,” “continue,” “could,” “estimate,” “expect,” “intend,” “may,” “might,” “plan,” “potential,” “predict,” “seek,” or “should”, or the“should,” and, in each case, their negative thereof or other variations thereonvarious orcomparable terminology. In particular, statements about the markets in which we operate, including growth of our various markets, and our expectations, beliefs, plans, strategies, objectives, prospects, assumptions, or future events or performance contained under the headings Item 1A- Risk Factors, Item 7- 7 - Management’s Discussion and Analysis of Financial Condition and Results of Operations, and Item 1- 1 - Business are forward-looking statements. In addition, statements regarding the potential outcome and impact of pending litigation are forward-looking statements.
We have based these forward-looking statements on our current expectations, assumptions, estimates, and projections. While we believe these expectations, assumptions, estimates, and projections are reasonable, such forward-looking statements are only predictions and involve known and unknown risks and uncertainties, many of which are beyond our control. These and other important factors, including those discussed under the headings Item 1A- 1A - Risk Factors, Item 7- Management’s Discussion and Analysis of Financial Condition and Results of Operations, and Item 1- Business, in this Form 10-K may cause our actual results, performance or achievements to differ materially from any future results, performance or achievements expressed or implied by these forward-looking statements. Some of the factors that could cause actual results to differ materially from those expressed or implied by the forward-looking statements include:
•negative trends in overall business, financial market and economic conditions, and/or activity levels in our end markets;
•our highly competitive business environment;
increases in interest rates and reduced availability of financing for the purchase of new homes and home construction and improvements;
•our highly competitive business environment;
•failure to timely identify or effectively respond to consumer needs, expectations, or trends;
•failure to successfully implement our strategic initiatives, including our productivity, cost reduction and global footprint rationalization initiatives;
•disruptions in our operations due to natural disasters, public health issues, such as COVID-19, and armed conflicts, including the ongoing conflict between Russia and Ukraine and instabilities in the Middle East;
•economic and geopolitical uncertainty and risks that arise from operating a multinational business;
•acquisitions, divestitures, or investments in other businesses that may not be successful;
•adverse outcome of pending or future litigation;
•declines in our relationships with and/or consolidation of our key customers;
•fluctuations in the prices of raw materials used to manufacture our products;
•delays or interruptions in the delivery of raw materials or finished goods;
•failure to retain and recruit executives, managers, and employees;
•seasonal business andwith varying revenue and profit;
•changes in weather patterns;patterns and related extreme weather conditions;
•political, economic, and other risks that arise from operating a multinational business;
•disruptions in our operations;
•our new Enterprise Resource Planning system that we anticipate implementing in the future proving ineffective;
•increases in labor costs, potential labor disputes, and work stoppages at our facilities;
•changes in building codes that could increase the cost of our products or lower the demand for our windows and doors;
•compliance costs and liabilities under environmental, health, and safety laws and regulations;
7
•lack of transparency, threat of fraud, public sector corruption, and other forms of criminal activity involving government officials;
•product liability claims, product recalls, or warranty claims;
•inability to protect our intellectual property;
•loss of key officers or employees;
•availability and cost of credit;
•our current level of indebtedness;indebtedness and the effect of restrictive covenants under our existing or future indebtedness including our Credit Facilities, Senior Secured Notes, and Senior Notes; and
•risks associated with the material weaknesses that have been identified;
Given these risks and uncertainties, you are cautioned not to place undue reliance on such forward-looking statements. The forward-looking statements contained in this Form 10-K are not guarantees of future performance and our actual results of operations, financial condition, and liquidity, and the development of the industry in which we operate, may differ materially from the forward-looking statements contained in herein. In addition, even if our results of operations, financial condition, and liquidity, and events in the industry in which we operate, are consistent with the forward-looking statements contained in this Form 10-K, they may not be predictive of results or developments in future periods.
Any forward-looking statement in this Form 10-K speaks only as of the date of this Form 10-K or as of the date such statement was made.10-K. We do not undertake any obligation to update or revise, or to publicly announce any update or revision to, any of the forward-looking statements, whether as a result of new information, future events or otherwise, except as required by law.
8
Item 1 - Business.
Our Company
We are onea leading global designer, manufacturer, and distributor of the world’s largest door and window manufacturers. We design, produce, and distribute an extensive range ofhigh-performance interior and exterior doors, wood, vinyl, and aluminum windows, and related building products, for use inserving the new construction and R&R sectors.
The JELD-WEN family of residential homesbrands includes JELD-WEN worldwide; LaCantina and to a lesser extent, non-residential buildings.
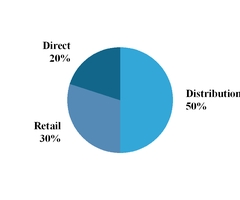
| Channel | Geography | Construction Application(1) | ||||||||||||


(1)Percentage of net revenues by construction application is management’s estimate based on the end markets into which our customers sell.


As onea leading global manufacturer of the largest doorinterior and window companies in the world,exterior building products, we have invested significant capital to build a business platform that we believe is unique among our competitors. We operate 12384 manufacturing and distribution facilities in 1915 countries located primarily in North America Europe, and Australia. OurEurope. We are focused on optimizing our global manufacturing footprint is strategically sizedto enhance performance and located to meetimprove profit margins. On July 2, 2023, we completed the delivery requirementssale of our customers. Australasia business (“JW Australia”). The net assets and operations of the disposal group met the criteria to be classified as “discontinued operations” and are reported as such in all periods. Unless otherwise indicated, the description of our business provided in Part I pertains to continuing operations only (seeNote 1 - Description of Company and Summary of Significant Accounting Policies and Note 2 - Discontinued Operationsto our consolidated financial statements for further information).
For many product lines, our manufacturing processes are vertically integrated, enhancing our range of capabilities, our ability to innovate, and our quality control, as well as providing us with supply chain, transportation, and working capital savings. We believe that our manufacturing network allows us to deliver our broad portfolio of products to a wide range of customers across the globe, improveswhile improving our customer service and strengthensstrengthening our market positions.
Our History
We were founded in 1960 by Richard L. Wendt, when he, together with four business partners, bought a millwork plant in Oregon. The subsequent decades were a time of successful expansion and growth as we added different businesses and product categories such as interior doors, exterior steel doors, and vinyl windows. Our first overseas acquisition was Norma Doors in Spain in 1992 and since then we have acquired or established numerous businesses in Europe, Australia, Asia, Canada, and Mexico, and Chile, making usJELD-WEN a truly global company.
In October 2011, certain funds managed by affiliates of Onex acquired a majority of JELD-WEN’sthe combined voting interests. power in the Company through the acquisition of convertible debt and convertible preferred equity. After the Onex investment, we began the transformation of our business from a family-run operation to a global organization with independent, professional management. The transformation accelerated after 2013 with the hiring of a new senior management team strategically recruited from a number of world-class industrial companies. Our newcurrent management team has decades ofextensive experience driving operational improvement, innovation, and growth, both organically and through acquisitions. As of December 31, 2020, Onex owned approximately 32.6% of our outstanding shares of Common Stock. In 2021, Onex exercised its rights under its Registration Rights Agreement and requested
9
Directors.
Our Business Strategy and Operating Model
We seekstrive to achieve best-in-industry financial performance and shareholder returns through the disciplined execution of:of our strategy which includes:
•enhancing performance and improving profit margins through strategic cost-reduction and productivity initiatives, such as the JEM,upgrading go-to-market processes, optimizing our sales force through training, right-sizing and consolidating our manufacturing network, investing in automation and leveraging our scale to improve our profit marginsstreamline sourcing;
•disciplined capital allocation and freeworking capital management designed to maximize shareholder returns, cash flow;flows, and return on invested capital in a balanced manner;
•investing in our brands and marketing, channel management, and pricingcommercial excellence programs such as customer segmentation, and price optimization; and
Our Products
We provide a broad portfolio of interior and exterior doors, windows, and related building products manufactured from a variety of wood, metal, and composite materials and offered across a full spectrum of price points. In the year ended December 31, 2017,2023, our door sales accounted for 67%63% of net revenues, our window sales accounted for 24%21% of net revenues, and our other ancillary products and services accounted for 9%16% of net revenues.
Doors
We are a leading global manufacturer of residential doors. We offer a full line of residential interior and exterior door products, including patio doors and folding or sliding wall systems. Our non-residential door product offering is concentrated in Europe, where we are a leading non-residential door provider by net revenues in Germany, Austria, Switzerland, and Scandinavia. In order toWe also offer non-residential doors across North America in certain markets. To meet the style, design, durability, and durability needsenergy efficiency requirements of our customers, across a broad range of price points, our product portfolio encompasses many types of materials, including wood veneer, composite wood, steel, glass, and fiberglass. Our interior and exterior residential door models generally retail at prices rangingfiberglass that satisfy a range of price points from $30entry-level to $40 for our most basic products to several thousand dollars for our high-end exterior doors.high-end. Our highest volume products include molded interior doors, which are made from two composite molded door skins joined by a wooden frame and filled with a hollow honey-cell core or other solid core materials. These low-costvalue doors are the most popular choice for interior residential applications in North America, and also are prevalent in France and the U.K. In the U.S., we manufacture exterior doors primarily made from fiberglass and steel. Our fiberglass product line has grown in popularity due to its attractive thermal properties, aesthetics, and durability. We have dedicated additional resources to our exterior fiberglass door business, which includes door slabs and door systems, and believe we have a leading product offering based on quality, breadth of design options, and range of price points. We also manufacturer stile and rail doors in our U.S. manufacturing facilities. In Europe, we also sell highly engineeredhigh performance residential and non-residential doors, with features such as soundproofing, fire resistance, radiation resistance, security, and added security. We alsoin Scandinavia we design and manufacture stiledoors which can withstand extreme environmental conditions in coastal and rail doors in our Southeast Asia manufacturing facilities, as well as in the U.S. through our 2015 acquisition of Karona. In the U.S., our 2015 acquisition of LaCantina added a line of folding and sliding wall systems to our product offerings.arctic environments. Additionally, we offer profitable value-added distribution services for residential and non-residential products in all of our markets, including customizable configuration services, specialized component options, and multiple finishing options. These services are valued by labor constrained customers and allow us to capture more profit from the sale of our door products. In the U.S., our recent acquisitionacquisitions of ABS and MMI Door is an exampleare examples of our increased focus on value-added services. Our newest door product offering includes steel doors, steel door frames, and fire doors for commercial and residential markets through our recent acquisition of Domoferm, which closed in February 2018.
Windows
We are a leading global manufacturer of residential windows.windows in North America. We manufacture a full line of residential wood, vinyl, and aluminumwood composite windows in North America, wood and aluminum windows in Australia, and wood windows in the U.K.America. Our window product lines comprise a full range of styles, features, and energy-saving options in order to meet the varied needs of our customers in each of our regional end markets. For example, our high performancehigh-performance wood and vinyl windows with multi-pane glazing and superior energy efficiency properties are in greater demand in Canada and the northern U.S. By contrast,In addition, our lower-cost aluminum framedvalue windows are popular in somewith production builders and the remodel and replacement markets. In select coastal regions, of the southern U.S., while in coastal Florida certain local building codes requirewe offer impact windows that can withstand the impact of debris propelled by hurricane-force winds. Woodhurricane force winds and satisfy local building codes. Our wood windows areremain prevalent as a high-end option in all of our markets because they possess both insulating qualities and the beauty of natural wood. In North America, our wood windows and patio doors include our proprietary AuraLast treatment, which is a unique water-based wood protection process that provides protection against wood rot and decay. We believe AuraLast is unique in its
10
ability to penetrate and protect the wood through to the core, as opposed to being a shallow or surface-only treatment. Our newest window product offerings include sashless window systems through our 2015With the acquisition of AneetaLaCantina Doors, the Company added LaCantina’s innovative folding, multi-slide, and louver windowswing patio doors and wall systems through our 2016to its already robust windows product offering. We also offer a non-residential line of vinyl windows for a broad assortment of commercial applications. With the acquisition of Breezway. OurVPI, we added vinyl windows typically retail at prices ranging from $100for mid-rise, multi-family, institutional, hospitality, and commercial properties to $200 for a basic vinyl window to over $1,000 for a custom energy-efficient wood window.our product lineup. We believe that our innovative energy-efficient windows position us to benefit from increasing environmental awareness among consumers and from changes in local building codes. In recognition of our expansive energy-efficient product line, we have been an ENERGY STAR partner since 1998. We have received ENERGY STAR Canada’s Excellence Award in 2023 and have won 7 ENERGY STAR Canada Manufacturer of the Year Awards.
Other Ancillary Products and Services
In certain regions, we sell a variety of other products that are ancillary to our door and window offerings, which we do not classify as door or window sales. These products include shower enclosures and wardrobes, moldings, trim board, lumber, cutstock, glass, staircases, hardware and locks, cabinets, and window screens. Molded door skins sold to certain third-party manufacturers, as well as miscellaneous installation and other services, areWe also included in this category.
Our Segments
We operate within the global market for residential and non-residential doors and windows with sales spanning 81approximately 71 countries. While we operate globally, the markets for doors and windows are regionally distinct with suppliers manufacturing finished goods in proximity to their customers. Finished doors and windows are generally bulky, expensive to ship, and, in the case of windows, fragile. Designs and specifications of doors and windows also vary from country to country due to differing construction methods, building codes, certification requirements, and consumer preferences. Customers also demand short delivery times and can require special order customizations. We believe that we are well-positioned to meet the global demands of our customers due to our market leadership, strong brands, broad product line, and strategically located manufacturing and distribution facilities.
Our operations are managed and reported in threetwo reportable segments, organized and managed principally by geographic region. Our reportable segments are North America Europe and Australasia.Europe. We report all other business activities in Corporate and unallocated costs. Factors considered in determining the threetwo reportable segments include the nature of business activities, the management structure accountable directly to the CODM for operating and administrative activities, the discrete financial information available, and the information regularly presented toreviewed by the CODM.
North America
In our North America segment, we compete primarily in the new construction and R&R market for residential doors and windows in the U.S. and Canada. We are the only manufacturer that offers a full line of interior and exterior door and window products, allowing us to offer a more complete solution to our customer base. We believe thatWhile we expect to realize some benefit from share gains and continued growth from pricing strategies to offset inflation, our leading position in the North American market will enable usis expected to benefit fromcontinue to face headwinds during 2024 primarily due to heightened interest rates and continued recovery in residential construction activity over the next several years.labor inflation. We believe that our total market opportunity in North America also includeswill continue to include non-residential applications and other related building products, and value-added services.products.
Europe
The European market for doors is highly fragmented, and we have the only platform in the industry capable of serving nearly all European countries. In our Europe segment, we compete primarily in the market for residential and non-residential doors in Germany, the U.K., France, Austria, Switzerland, and Scandinavia. We believeDuring 2024, we expect headwinds in our residential and non-residential markets due to general economic weakness and as interest rates that our total market opportunity in Europe also includes other European countries, other door product lines, related building products, and value-added services. Although
Financial information regarding our segments is included in Note 1914 - Segment Information to our financial statements included in this Form 10-K.
Materials
We generally maintain a diversified supply base for the materials used in our manufacturing operations. Materials represented approximately 50% of our cost of sales in the year ended December 31, 2017. The primary materials used for our door business include wood, wood veneers, wood composites, steel, glass, internally produced door skins, fiberglass compound, and hardware, as well as petroleum-based products such as resin and binders. The primary materials for our window business include wood, wood components, glass, and hardware, as well as aluminum extrusions, and vinyl extrusions. Wood components for our window operations are sourced primarily from our own manufacturing plants, which allow us to improve margins and take advantage of our proprietary technologies such as our AuraLast wood treatment process.
11
We track commodities in order to understand our vendors’ costs, realizing that our costs are determined by the broader competitive market as well as by increases in the inputs to our vendors. In order to manage the risk in material costs, we develop strategic relationships with suppliers, routinely evaluate substitute components, develop new products, vertically integrate, where applicable, and seek alternative sources of supply from multiple vendors and often from multiple geographies.
Seasonality
In a typical year, our operating results are impacted by seasonality. Historically, peak season for home construction and remodeling in our North America and Europe segments, which represent the substantial majority of our revenues, generally corresponds with the second and third calendar quarters, and therefore our sales volume is usually higher during those quarters. Seasonal variations in operating results may be impacted by inclement weather conditions, such as cold or wet weather, which can delay construction projects.
Sales and Marketing
We actively market and sell our products directly to our customers around the world through our global sales force and indirectly through our marketing and branding initiatives.initiatives, which includes our enhanced social media presence. Our global sales force, which is organized and managed regionally, focuses on building and maintaining relationships with key customers as well as managing customer supply needs and arranging in-store promotional initiatives. In North America and Europe, we also have a dedicated teamteams that focusesfocus on our large home centerretail customers.
We have recently made significantcontinue to make investments in tools and technologies to enhance the effectiveness of our sales force and improve ease of doing business.our customers’ purchasing experience. For example, we are continuing to invest and utilize Salesforce in the process of deploying Salesforce.com on a global basis, which will provide us with a common globalNorth America and Europe to enhance our customer relationshiprelationships and support. We continue to leverage Salesforce for improved data management, platform. In addition, we are in the process of simplifying our order entry process by implementing online configuration tools. We have introduced an electronic ordering system for easy order placement,service level tracking, Ecommerce, and we intend to expand our online retail sales. Our new strategy also includes initiatives focused on expanding our market through the use of social media. To date, these initiatives have included hosting videos and increasing our presence on Facebook.
We believe that our broad product portfolio of both doors and windows in North America and Australasia is a competitive advantage as it allows us to cross-sell our door and window products to our end customers, many of whom find it more efficient to choose one supplier for their door and window needs on a given project. None of our primary competitors in these regions offers a similarly complete range of windows as well as interior and exterior doors.
Research and Development
Although product specifications and certifications vary from country to country, the global nature of our operations allows us to leverage our global innovation capabilities and create product platforms which enable us to share new product designs across our markets. We believe that the global nature of our research and development capabilities is unique among our door and window competition. An example of global sharing of innovation is the “soft close” door system, which is based on hardware originally designed and manufactured by our European operations that is now being offered in North America and Australia. Additionally, we have successfully launched new door designs into our North American and Australian markets that were originally developed in our European operations.
Customers
We sell our products worldwide and have well-established relationships with numerous customers throughout the door and window distribution chain in each of our end markets, including retail home centers, wholesale distributors, and building product dealers that supply homebuilders, contractors, and consumers. Our wholesale customers include such industry leaders as BMC/Stock Building Supply, ProBuild/Builders First Source, American Building Supply, Saint-Gobain, and the Holzring group. Our home center customers include, among others, The Home Depot, Lowes,Lowe’s Companies, and Menards in North America; and B&Q, Howdens, and Bauhaus in Europe; and Bunnings Warehouse in Australia.Europe. We have maintained relationships with the majority of our top ten customers for over 1925 years and believe that the strength and tenure of our customer relationships is based on the total value we provide, including the quality and breadth of our ability to produceproduct offering, our customer service, innovation, and deliver high-quality products quickly and in the desired volumes for a reasonable cost.delivery capabilities. Our top ten customers together accounted for approximately 36%43%, 44% and 43% of our net revenues in the yearyears ended December 31, 2017,2023, 2022 and our largest customer,2021, respectively. The Home Depot, accounted for approximatelya customer of our North America segment, represents 15%, 16%, and 17% of our consolidated net revenues induring the yearyears ended December 31, 2017.2023, 2022, 2021, respectively. Lowe’s Companies, another customer of our North America segment, represents 11%, 11%, and 10% of our consolidated net revenues during the years ended December 31, 2023, 2022, 2021, respectively.
12
Competition
The door and window industry is highly competitive and includes a number of regional and international competitors. Competition is largely based on the functional and aesthetic quality of products, service quality, distribution capability, and price. We believe that we are well-positioned in our industry due to our leading brands, our broad product lines, our consistently high product quality and service, our global manufacturing and distribution capabilities, and our extensive multi-channel distribution. For North American interior doors, our major competitors include Masonite, Steves & Sons, Inc. and several smaller independent door manufacturers. For North American exterior doors, competitors include Masonite, Therma-Tru (a division of Fortune Brands), Plastpro and Plastpro.Steves & Sons, Inc. The North American window market is highly fragmented, with sizable competitors including Anderson,Andersen, Pella, Marvin, Ply-Gem (a division of Cornerstone Building Brands, formerly NCI Building Systems), and Milgard (a division of Masco)MI Windows and Doors). The door manufacturers that we primarily compete with in our European markets include Huga, Prüm/Garant (a division of Arbonia Group), Viljandi, Masonite, Keyor, Herholz, and Herholz. The competitive landscape in Australia is varied across the door and window markets. In the Australian door market, Hume Doors is our primary competitor, while in the window, shower screen, and wardrobe markets we largely compete against a fragmented set of smaller companies.Hormann.
Intellectual Property
We rely primarily on patent, trademark, copyright, and trade secret laws and contractual commitments to protect our intellectual property and other proprietary rights. Generally, registered trademarks have a perpetual life, provided that they are renewed on a timely basis and continue to be used properly as trademarks. We intend to maintain the trademark registrations listed below so long as they remain valuable to our business.
Our U.S. window and door trademarks include JELD-WEN®, AuraLast®, MiraTEC®, Extira®, LaCANTINA Karona, ImpactGard, JW, Aurora,®, MMI Door®, KaronaTM, ImpactGard®, JW®, Aurora®, IWP®, True BLU®, ABSTM, Siteline®, National Door®, Low-Friction Glider®, Hydrolock®, VPITM, AURALINE®, FINISHIELD®, MILLENNIUM®,TRUFIT®, EPICVUE®, and IWP.EVELIN®. Our trademarks are either registered or have long been used as a common law trademarktrademarks by the
Environmental, Social, and Swedoor, Dooria, DANA, MattioviGovernance Matters
Human Capital Management
We believe that the success of our mission is realized by the engagement and Alupanempowerment of our employees and we are committed to investing in Europe.
As of December 31, 2017,2023, we employed approximately 21,00017,700 people. Of our total number of employees, approximately 10,90011,000 are employed in operations included in our North America segment and corporate operations, and approximately 6,0006,700 are employed in operations included in our Europe segment, and approximately 4,100 are employed in operations included in our Australasia segment.
In total, approximately 1,020,1,200, or 10%11%, of our employees in the U.S. and Canada are unionized. Two facilities in the U.S., representing approximately 420350 employees, are covered by collective bargaining agreements. In Canada, approximately 47%68% of our employees work at facilities covered by collective bargaining agreements. As is common in Europe, and Australia, the majority of our facilities are covered by work councils and/or labor agreements. We believe we have satisfactory relationships with our employees and our organized labor unions.
13
Diversity, Equity, and Inclusion (DE&I)
We believe that a diverse and engaged workforce is a strong competitive advantage and we strive to create an environment where individuals of the environment. Many of our productsall backgrounds can fully contribute and maximize their potential. Our employees are also subjectencouraged to various laws and regulations such as building and construction codes, product safety regulations, and regulations and mandates related to energy efficiency.
TrainingandTalentDevelopment
We strive to not only attract and retain great talent but are committed to the continued development of our workforce. We invest in formal leadership development programs that help prepare senior leaders for succession into executive roles, in regional programs to accelerate the leadership conversion of mid-level managers, and in focused efforts to upskill our front-line leaders. Retaining and developing early career talent is an additional focus. Across our teams, we welcome apprenticeship and work study arrangements that seed talent into manufacturing and team lead roles. In North America specifically, we offer a summer internship program and a multi-year, cross-functional rotational program to identify, attract, and accelerate the growth of an internal pipeline of future managers. In our regions, we seek out, seed, and utilize financial grants and social educational investment requirements to reinvest in the ongoing learning and development needs of our diverse global workforce.
Internal job opportunities are posted for employees to review and our internal mobility philosophy encourages employees to apply for roles after they have passed twelve months on a job. As part of the annual performance management process, managers and employees meet to review goals and performance and discuss actions for ongoing growth and development. The Company continues to invest in its employees through new global learning platforms, content libraries, and additional formal and informal training programs.
Organizational Health
We manage and measure our organizational health with a view to gaining insight into our employees’ experiences, levels of workplace satisfaction, and safety lawsfeelings of engagement within the Company. Organizational health is driven through an “enterprise-guided” approach that includes both global and regulations, Item 1A - Risk Factors - Risks Relatinglocal initiatives in line with the Company’s overall cultural vision and strategy. We measure organizational health annually through our global employee survey and strive to Our Businesscontinually develop our culture and Industry, Item 1A - Risk Factors -We may be subjectemployee engagement. Results of the annual survey are communicated as global themes across the Company, with managers sharing more detailed insights from their areas of the business directly with their teams. The senior leadership team demonstrates their commitment to significant compliance costs with respect to legislativeengagement through transparent communications in town halls and regulatory proposals to restrict emissions of GHGs, and Item 3 - Legal Proceedings - Environmental Regulatory Actions.leadership team meetings; they also carry cultural targets on their individual annual goal plans.
Environmental Sustainability
We strive to conduct our business in a manner that is environmentally sustainable and demonstrates environmental stewardship. Toward that end, we pursue processes that are designed to minimize waste, maximize efficient utilization of materials, and conserve resources, including using recycled and reused materials to produce portions of our products. We are taking steps to mitigate climate change by measuring and reducing our GHG emissions, implementing renewable energy solutions and pursuing efficiency projects. We offer a variety of products that contain pre-consumer recycled content, such as our vinyl windows, aluminum cladding, and window glass. In January 2023, we launched a new primer formula developed by our coatings division designed to decrease volatile organic compounds (“VOC”) emissions in coatings applied to interior door skins. Our U.S. produced pine wood windows and select patio doors and door frames are made from AuraLast® pine, which is a proprietary, water-based wood protection process that results in a decrease of VOCs released during production. In addition, we manufacture many products that meet local green building provisions and top nationally recognized environmental programs. We continue to evaluate and modify our manufacturing and other processes on an ongoing basis to further reduce our impact on the environment. We believe it is important for our employees to share our commitment and we strive to recruit, educate, and train our employees in these values on an ongoing basis throughout their careers with us.
Environmental Regulatory Actions
The geographic breadth of our facilities and the nature of our operations subject us to extensive environmental, health, and safety laws and regulations in jurisdictions throughout the world. Such laws and regulations relate to, among other things, air emissions, the treatment and discharge of wastewater, the discharge of hazardous materials into the environment, the handling, storage, use and disposal of solid, hazardous and other wastes, worker health and safety, or otherwise relate to health, safety, and protection of the environment. Many of our products are also subject to various laws and regulations, such as building and construction codes, product safety regulations, and regulations and mandates related to energy efficiency.
The nature of our operations, which involve the handling, storage, use, and disposal of hazardous wastes, exposes us to the risk of liability and claims associated with contamination at our current and former facilities or sites where we have disposed of or
14
arranged for the disposal of waste, or with the impact of our products on human health and safety and the environment. Laws and regulations with respect to the investigation and remediation of contaminated sites can impose joint and several liability for releases or threatened releases of hazardous materials upon statutorily defined parties, including us, regardless of fault or the lawfulness of the original activity or disposal. We have been subject to claims, including having been named as a potentially responsible party, in certain proceedings initiated pursuant to the Comprehensive Environmental Response, Compensation, and Liability Act (“CERCLA”) and similar state and foreign laws, regulations, and statutes, and may be named a potentially responsible party in other similar proceedings in the future. Unforeseen expenditures or liabilities may arise in connection with such matters.
We have also been the subject of certain environmental regulatory actions by the EPA and state regulatory agencies in the U.S. and foreign governmental authorities in jurisdictions in which we operate and are obligated to make certain expenditures in settlement of those actions. We do not expect expenditures for compliance with environmental laws and regulations to have a material adverse effect on our financial position or competitive position. However, the discovery of a presently unknown environmental condition, changes in environmental requirements or their enforcement, or other unanticipated events, may give rise to unforeseen expenditures and liabilities which could be material.
In 2007, we were identified by the WADOE as a PLP with respect to our former manufacturing site in Everett, Washington. In 2008, we entered into an Agreed Order with the WADOE to assess historic environmental contamination and remediation feasibility at our former manufacturing site in Everett, Washington.the site. As part of this agreement,the order, we also agreed to develop a CAP, arising from the feasibility assessment. We are currently workingIn December 2020, we submitted to the WADOE a draft feasibility assessment with an array of remedial alternatives, which we considered substantially complete. During 2021, several comment rounds were completed as well as the identification of the Port of Everett and W&W Everett Investment LLC as additional PLPs, with respect to this matter with each PLP being jointly and severally liable for the cleanup costs. The WADOE received the final feasibility assessment on December 31, 2021, containing various remedial alternatives with its preferred remedial alternatives totaling $23.4 million. Based on this study, we have determined our range of possible outcomes to be $11.8 million to $33.4 million. On March 1, 2022, we delivered a draft CAP consistent with the preferred alternatives which was approved by WADOE in August 2023. The existing Agreed Order of 2008 was also modified with WADOE in July 2023 to finalize our RI/FS, and, once final, we will developsupport the CAP. We estimate the remaining cost to complete our RI/FS and develop the CAP at $0.5 million, which we have fully accrued.
In 2015,December 2020, we entered into a COA with the PaDEP to remove a pile of wood fiber waste from our site in Towanda, Pennsylvania, which we acquired in connection with our acquisition of CMI in 2013,2012, by using it as fuel for a boiler at that site. The COA replaced a 19952018 Consent Decree between CMI’s predecessor Masonite, Inc.PaDEP and PaDEP.us. Under the COA, we are required to achieve certain periodic removal objectives and ultimately remove the entire pile by August 31, 2022. There are currently $11.02025. As of December 31, 2023 and December, 31, 2022 there was $1.4 million and $2.3 million, respectively in bonds posted in connection with these obligations. If we are unable to remove this pile by August 31, 2022,2025, then the bonds will be forfeited, and we may be subject to penalties by PaDEP. We currently anticipate meeting all applicable removal deadlines;deadlines; however, if our operations at this site decrease and we burn less fuel than currently anticipated, we may not be able to meet such deadlines.
For more information regarding the risks associated with environmental, health, and safety laws and regulations, see Item 1A - Risk Factors.
Government Regulation
As a public company with global operations, we are subject to the laws and regulations of the United States and multiple foreign jurisdictions. These regulations, which differ among jurisdictions, include those related to financial and other disclosures, accounting standards, corporate governance, intellectual property, tax, trade, antitrust, employment, privacy, and anti-corruption, in addition to the environmental laws and regulations described above.
For a more detailed description of the various laws and regulations that affect our business, see Item 1A - Risk Factors.
Available Information
Our Annual Reports on Form 10-K, Quarterly Reports on Form 10-Q, Current Reports on Form 8-K, and amendments to reports filed pursuant to Sections 13(a) and 15(d) of the Exchange Act, are filed with the SEC. We are subject to the informational requirements of the Exchange Act and file or furnish reports, proxy statements and other information with the SEC. Such reports and other information filed by us with the SEC are available free of charge on our website at investors.jeld-wen.com when such reports are made available and on the SEC’s website. The public may read and copy any materials filed by us with the SEC at the SEC’s Public Reference Room at 100 F Street, NE, Room 1580, Washington, DC 20549. The public may obtain information on the operation of the Public Reference Room by calling the SEC at 1-800-SEC-0330. The SEC maintains an Internet site that contains reports, proxy and information statements and other information regarding issuers that file electronically with the SECwebsite at www.sec.gov. The contents of these websites are not incorporated into this filing. Further, our references to the URLs for these websites are intended to be inactive textual references only.
15
Executive Officers of the Registrant
Set forth below is certain information about our executive officers. Ages are as of February 20, 2024. There are no family relationships among the following executive officers.
Julie C. Albrecht,Executive Vice President and Chief Financial Officer. Ms. Albrecht, age 56, joined the Company as Executive Vice President and Chief Financial Officer in July 2022. Previously, Ms. Albrecht joined Sonoco Products Company in 2017 as Vice President, Treasurer / Assistant Chief Financial Officer before being named Vice President, Chief Financial Officer in which role she served until June 2022. Prior to Sonoco, Ms. Albrecht served as Vice President, Finance, Investor Relations and Treasurer for Esterline Technologies Corporation (acquired by TransDigm in 2019). She began her finance career at PricewaterhouseCoopers. Ms. Albrecht earned a bachelor’s degree in accounting from Wake Forest University.
Peggie Bolan, Vice President and General Manager, North America Building Products and Fiber. Ms. Bolan, age 52, joined the Company in October 2012 as Vice President and General Manager, North American Building Products and Fiber. She is a seasoned executive with experience in sales, marketing and operations. She earned a bachelor’s degree in English from Vanderbilt University.
William J. Christensen,Chief Executive Officer and Director. Mr. Christensen, age 51, joined the Company in April 2022 as Executive Vice President and President, Europe. In December 2022, he was appointed to his current role as Chief Executive Officer and Director of the Company. Prior to joining the Company, Mr. Christensen was Chief Executive Officer and Group Executive Board Chair of REHAU AG, a Swiss-based global manufacturer, from 2018 to 2021. Prior to his appointment as Chief Executive Officer in 2018, Mr. Christensen served as its Chief Marketing Officer. Prior to joining REHAU AG, Mr. Christensen was Chief Executive Officer of AFG Holding, a Swiss-based global building products manufacturer from 2014 to 2015. In addition, he spent ten years at Geberit International AG, a global plumbing manufacturer, in several executive roles including Group Executive Board Member and Head of International Sales, as well as President and Chief Executive Officer of The Chicago Faucets Company. He also served in various finance and business development roles at J.P. Morgan Securities and Rieter Automotive Systems. Mr. Christensen earned a bachelor’s degree in economics from Rollins College and an MBA from the University of Chicago’s Booth School of Business.
James S. Hayes,Executive Vice President, General Counsel and Corporate Secretary. Mr. Hayes, age 51, joined the Company in August 2018 as Vice President, Deputy General Counsel. In August 2022, he was promoted to Senior Vice President, Deputy General Counsel and Corporate Secretary. He was appointed to his current role in June 2023. Mr. Hayes leads the global legal team, providing legal advice and guidance to the Board of Directors and the senior leadership team. Mr. Hayes earned a bachelor’s degree in English and history from Emory University and a law degree from Villanova University School of Law.
Daniel Jacobs,Vice President and General Manager, North America Windows. Mr. Jacobs, age 38, joined the Company in September 2008 as a Sales Representative and was promoted to Sales Manager in 2010. He has held roles of increasing responsibility as a National Account Manager and Director of National Accounts from 2010 to 2016. In December 2016, Mr. Jacobs was promoted to Director of Product Management. He was promoted to Vice President and General Manager, Exterior Doors in June 2020 until May 2022 and was promoted to his current role in May 2022. Mr. Jacobs earned a bachelor’s degree in economics from Rollins College.
Michael Leon,Senior Vice President and Chief Accounting Officer. Mr. Leon, age 43, joined the Company as Senior Vice President and Chief Accounting Officer in March 2023. Prior to joining the Company, Mr. Leon was the Chief Accounting Officer and Corporate Controller at Sealed Air, a global provider of packaging solutions, from June 2018 to March 2023, where he was also the Assistant Corporate Controller from December 2014 to June 2018. Mr. Leon earned a master’s degree in accounting from the University of South Carolina.
Kevin C. Lilly, Executive Vice President, Global Transformation. Mr. Lilly, age 63, joined the Company as Senior Vice President and Chief Information Officer in February 2019 and was promoted to Executive Vice President and Chief Information Officer in July 2022. Mr. Lilly served as the Company’s Interim Chief Executive Officer from August 2022 until December 2022 when he was named Executive Vice President, Global Transformation. Mr. Lilly leads the Company’s enterprise transformation initiatives and has responsibility for the global information technology organization. Prior to joining the Company, he served as Vice President of IT at Trane Technologies (formerly Ingersoll Rand) from 2011 to 2019. Previously, he was VP and Chief Information Officer for AGCO Corporation and served in a number of IT and finance positions of increasing responsibility for global companies including KPMG, Xerox, Delphi Automotive, General Motors, and EDS. Mr. Lilly earned a bachelor’s degree in business administration from Houghton College and attended the executive graduate program at the Thunderbird School of Global Management.
Wendy Livingston,Executive Vice President, Chief Human Resources Officer. Ms. Livingston, age 50, joined the Company as Executive Vice President, Chief Human Resources Officer in June 2023. Prior to joining the Company, Ms. Livingston was the Chief People Officer for Spreetail, a multinational e-commerce company, from August 2022 to June 2023 and the Senior Vice President and Chief Human Resources Officer for Harsco Corporation (now Enviri Corporation), a global environmental services company, from August 2020 to August 2022. She held leadership roles of increasing responsibility at The Boeing Company, a global aerospace company, from 1996 to 2020, including interim Senior Vice President, Human Resources in 2020 and Vice President, Corporate Human Resources from 2017 to 2020. Ms. Livingston earned a bachelor’s degree in business administration from Peru State College,
16
a master’s degree in human resource management from Lindenwood University and is certified by the Society for Human Resource Management.
Matthew Meier,Executive Vice President, Chief Digital and Information Officer. Mr. Meier, age 51, joined the Company as Executive Vice President, Chief Digital and Information Officer in January 2024. Previously, he was Executive Vice President, Chief Digital and Data Officer at Driven Brands Holding, Inc., an automotive services company, from October 2021 to January 2024. Prior to joining Driven Brands, Mr. Meier was employed at Whirlpool Corporation, a manufacturer of home appliances, as the Vice President, Global Technology Value Streams from 2020 to 2021 and as Vice President, Chief Information Officer from 2016 to 2020. Mr. Meier earned a bachelor’s degree in industrial engineering from Purdue University, a master’s degree in information systems management from Carnegie Mellon University and an MBA from the Massachusetts Institute of Technology Sloan School of Management.
Daniel Valenti,Executive Vice President and General Manager, North America Doors & Distribution. Mr. Valenti, age 46, joined the Company as Executive Vice President and General Manager, North America Doors & Distribution in January 2024. Previously, Mr. Valenti was employed at Whirlpool Corporation, a manufacturer of home appliances, as the Senior Vice President and General Manager, KitchenAid Small Appliances from September 2018 to December 2023. Mr. Valenti earned a bachelor’s degree in business administration from the University of North Carolina at Chapel Hill.
Gustavo Vianna,Executive Vice President and President, Europe. Mr. Vianna, age 55, joined the Company as Executive Vice President and President, Europe in January 2024. Prior to joining the Company, Mr. Vianna was employed at Aliaxis Group SA, a global manufacturer of advanced fluid management solutions, as Chief Executive Officer, EMEA from November 2020 to September 2022 and as Chief Business Officer from September 2019 to November 2020. Previously, he was the Chief Executive Officer, Pipe Business for Saint-Gobain Europe du Nord, a manufacturer and distributor of construction materials, from September 2016 to February 2019. Mr. Vianna earned a bachelor’s degree in electrical engineering from Pontifical Catholic University and a master’s degree in business administration from Fundacão Getúlio Vargas.
17
Item 1A - Risk Factors
Investing in our common stockCommon Stock involves a high degree of risk. These risks include those described below and may include additional risks and uncertainties not presently known to us or that we currently deem immaterial. You should carefully consider the following factors, as well as other information contained or incorporated by reference in this Annual Report on Form 10-K, before deciding to invest in shares of our common stock. TheCommon Stock. Our business, financial condition, and results of operations could be materially adversely affected by any of these risks, and the trading price of our common stockCommon Stock could decline due to any of these risks, and you may lose all or part of your investment in our common stock.Common Stock.
Risks Relating to Our Business and Industry
Negative trends in overall business, financial market and economic conditions, and/orand activity levels in our end markets may reduce demand for our products, which could have a material adverse effect on our business, financial condition, and results of operations.
Negative trends in overall business, financial market, and economic conditions globally or in the regions where we operate may reduce demand for our doors and windows, which is tied to activity levels in the R&R and new residential and non-residential construction end markets. In particular, the following factors may have a direct impact on our business in the regions where our products are marketed and sold:
•the strength of the economy;
•employment rates, and consumer confidence, and spending rates;
•the availability and cost of credit;
•interest rate fluctuations (including mortgage and credit card interest rates) and the availability of financing for our customers and consumers;
•the amount and type of residential and non-residential construction;
•housing sales and home values;
•the age of existing home stock, home vacancy rates, and foreclosures;
•volatility in both debt and equity capital markets;
•increases in the cost of raw materials or any shortage in supplies or labor;labor, including as a result of tariffs or other trade restrictions;
•the effects of governmental regulation and initiatives to manage economic conditions;
•geographical shifts in population and other changes in demographics; and
•changes in weather patterns.patterns and extreme weather events.
While cyclicalitycyclicity in our new residential and non-residential construction end markets is moderated to a certain extent by R&R activity, much R&R spending is discretionary and can be deferred or postponed entirely when economic conditions are poor. We have experienced sales declines in all of our end markets during this recent economic downturn.downturns.
The ability of consumers to finance home construction and improvements is affected by the nearability of consumers to procure third-party financing and the interest rates available for home mortgages, credit card debt, home equity or long-term. Moreover, uncertain economic conditions continue in our Australasia segmentother lines of credit, and certain countries in our Europe segment.other sources of third-party financing. Negative business, financial market, and economic conditions, including rising inflation, interest rates and difficulty for consumers to procure financing, globally and within the industries or in the regions where we operatecompete in may materially and adversely affect demand for or costs to produce our products andwhich could have a material adverse effect on our business, financial condition, and results of operationsoperations.
A decline in our relationships with our key customers, the amount of products they purchase from us, or a decline in our key customers’ financial condition could be materially negatively impactedhave a material adverse effect on our business, financial condition, and results of operations.
Our business depends on our relationships with our key customers, which consist mainly of wholesale distributors and retail home centers. Our top ten customers together accounted for approximately 43%, 44% and 43% of our net revenues in the years ended
18
December 31, 2023, 2022 and 2021, respectively. The Home Depot, a customer of our North America segment, represents 15%, 16%, and 17% of our consolidated net revenues during the years ended December 31, 2023, 2022, and 2021, respectively. Lowe’s Companies, another customer of our North America segment, represents 11%, 11%, and 10% of our consolidated net revenues during the years ended December 31, 2023, 2022, and 2021, respectively. Although we have established and maintain significant long-term relationships with our key customers, we cannot assure you that all of these relationships will continue or will not diminish. We generally do not enter into long-term contracts with our customers and they generally do not have an obligation to purchase products from us. Accordingly, sales from customers that have accounted for a significant portion of our sales in past periods, individually or as a result.group, may not continue in future periods, or if continued, may not reach or exceed historical levels in any period. For example, certain of our large customers perform periodic line reviews to assess their product offering, which have in the past and may in the future lead to loss of business and pricing pressures. Some of our large customers may also experience economic difficulties or otherwise default on their obligations to us. Furthermore, our pricing optimization strategy, which requires maintaining pricing discipline in order to improve or maintain profit margins, has in the past and may in the future lead to the loss of certain customers, including key customers, who do not agree to our pricing terms. The loss of, or a diminution in our relationship with, any of our largest customers could lower our sales volumes and could have a material adverse effect on our business, financial condition, and results of operations.
We operate in a highly competitive business environment. Failure to compete effectively could cause us to lose market share and/or force us to reduce the prices we chargeand any decrease in demand for our products. This competitionproducts could have a material adverse effect on our business, financial condition, and results of operations.
We operate in a highly competitive business environment. Some of our competitors may have greater financial, marketing, and distribution resources and may develop stronger relationships with customers in the markets where we sell our products. Some of our competitors may be less leveraged than we are, providing them with more flexibility to invest in new facilities and processes and also making them better able to withstand adverse economic or industry conditions.
In addition, some of our competitors, regardless of their size or resources, may choose to compete in the marketplace by adopting more aggressive sales policies, including price cuts, or by devoting greater resources to the development, promotion, and sale of their products. This could result in our loss of customers and/or market share to these competitors, or being forcedwhich may cause us to reduce the prices at which we sell our products to remain competitive.
As a result of competitive bidding processes, we may have to provide pricing concessions to our significant customers in order for us to keep their business. Reduced pricing would result in lower product margins on sales to those customers. There is no guarantee that a reduction in prices would be offset by sufficient gains in market share and sales volume to those customers.
The loss of, or a reduction in orders from, any significant customers, or decreases in the prices of our products due to lower demand, could have a material adverse effect on our business, financial condition, and results of operations.
Failure to implement our strategic cost reduction and productivity initiatives could adversely impact our business, financial condition, and results of operations.
Our future financial performance depends in part on our management’s ability to successfully implement our strategic initiatives, including our productivity, cost reduction, and global footprint rationalization initiatives. We cannot guarantee the successful implementation of these initiatives and related strategies throughout the geographic regions in which we operate or that such implementation will improve our operating results. Any failure to successfully implement these initiatives and related strategies could adversely affect our business, financial condition, and results of operations, including increases in our severance and asset related charges. We may, in addition, decide to alter or discontinue certain aspects of our business strategy at any time.
A disruption in our operations due to natural disasters, unstable geopolitical conditions or armed conflicts could have a material adverse effect on our business, financial condition, and results of operations.
We operate facilities worldwide. We have facilities located in areas that are vulnerable to hurricanes, earthquakes, wildfires, and other natural disasters. In the event that a hurricane, earthquake, natural disaster, fire, pandemic, or other catastrophic event were to interrupt our operations for any extended period of time, it could delay shipment of merchandise to our customers, damage our reputation, or otherwise have a material adverse effect on our business, financial condition, and results of operations.
In addition, our operations may be interrupted by armed conflicts, terrorist attacks or other acts of violence or war. These attacks may directly impact our suppliers’ or customers’ physical facilities. Furthermore, these attacks may make travel and the transportation of our supplies and products more difficult and more expensive and ultimately have a material adverse effect on our business, financial condition, and results of operations. Political and economic instability in some regions of the world may also negatively impact the global economy and, therefore, our business. For instance, instabilities in the Middle East and the ongoing conflict between Russia and Ukraine, including sanctions imposed on Russia, has had and could continue to have an adverse impact on our business, such as shortages in materials and heightened inflation on materials, freight, and other variable costs, such as utilities. The consequences of any of these armed conflicts are unpredictable, and we may not be able to foresee events that could have an adverse effect on our business or your investment. More generally, any of these events could cause consumer confidence and spending
19
to decrease or result in increased volatility in the worldwide financial markets. They could also result in economic recessions. Any of these occurrences could have a material adverse effect on our business, financial condition, and results of operations.
We may not identify or effectively respond to consumer needs, expectations, or trends in a timely fashion, which could adversely affect our relationship with customers, our reputation, the demand for our brands, products, and services, and our market share.
Accordingly, the success of our business depends in part on our ability to maintain strong brands and identify and respond promptly to evolving trends in demographics, consumer preferences, and expectations and needs, while also managing inventory levels. It is difficult to successfully predict the products and services our customers will demand. Even if we are successful in anticipating consumer preferences, our ability to adequately react to and address those preferences will in part depend upon our continued ability to develop and introduce innovative, high-quality products and acquire or develop the intellectual
property necessary to develop new products or improve our existing products. There can be no assurance that the products we develop, even those to which we devote substantial resources, will be successful. While we continue to invest in innovation, brand building, and brand awareness, and intend to increase our investments in these areas in the future, these initiatives may not be successful. Failure to anticipate and successfully react to changing consumer preferences could have a material adverse effect on our business, financial condition, and results of operations.
In addition, our competitors could introduce new or improved products that would replace or reduce demand for our products or create new proprietary designs and/or changes in manufacturing technologies that may render our products obsolete or too expensive for efficient competition in the marketplace. Our failure to competitively respond to changing consumer and customer trends, demands, and preferences could cause us to lose market share, which could have a material adverse effect on our business, financial condition, and results of operations.
We continually review our manufacturing operations to maintainaddress market changes and to implement efficiencies presented by past acquisitions. Effects of periodic manufacturing integrations, realignments, and cost savings programs have in the performance, reliability, quality,past and service standards required bycould in the future result in a decrease in our customers,short-term earnings, cash flows, and operating efficiency until the expected results are achieved. Such programs may include the consolidation, integration, and upgrading of facilities, functions, systems, and procedures. Such programs involve substantial planning, often require capital investments, and may result in charges for fixed asset impairments or to timely deliver our products, could have a material adverse effect on our business, financial condition,obsolescence and results of operations.
Our business is seasonal, and revenue and profit can vary significantly throughout the year, which may adversely impact the timing of our cash flows and limit our liquidity at certain times of the year.
Our business is seasonal, and our net revenues and operating results can vary significantly from quarter to quarter based upon the timing of the building season in our markets. Our sales typically follow seasonal new construction and R&R industry patterns. The peak season for home construction and R&R activity in the majority of the geographies where we market and sell our products generally corresponds with the second and third calendar quarters, and therefore our sales volume is typically higher during those quarters. Our first and fourth quarter sales volumes are generally lower due to reduced R&R and new construction activity as a result of less favorable climate conditions in the majority of our geographic end markets. Failure to effectively manage our inventory in anticipation of or in response to seasonal fluctuations could negatively impact our liquidity profile during certain seasonal periods.
We may be unable to protect our intellectual property, and we may face claims of intellectual property infringement.
We rely on a combination of patent, copyright, trademark, and trade secret laws, as well as confidentiality agreements, nondisclosure agreements, and other contractual commitments, to protect our intellectual property rights. However, these measures may not be adequate or sufficient, and third parties may not always respect these legal protections even if they are aware of them. In addition, our competitors may develop similar technologies and know-how without violating our intellectual property rights. Furthermore, the laws of foreign countries may not protect our intellectual property rights to the same extent as the laws of the U.S. The failure to obtain worldwide patent and trademark protection may result in other companies copying and marketing products based on our technologies or under brand or trade names similar to ours outside the jurisdictions in which we are protected. This could
20
impede our growth in existing regions, create confusion among consumers, and result in a greater supply of similar products that could erode prices for our protected products.
Litigation may be necessary to protect our intellectual property rights. Intellectual property litigation can result in substantial costs, could distract our management, and could impinge upon other resources. Our failure to enforce and protect our intellectual property rights may cause us to lose brand recognition and result in a decrease in sales of our products.
Moreover, while we are not aware that any of our products or brands infringes upon the proprietary rights of others, third parties may make such claims in the future. From time to time, third parties may claim that we have infringed upon their intellectual property rights and we may receive notices from such third parties asserting such claims. Any such infringement claims are thoroughly investigated and, regardless of merit, could be time-consuming and result in costly litigation or damages, undermine the exclusivity and value of our brands, decrease sales, or require us to enter into royalty or licensing agreements that may not be on acceptable terms and that could have a material adverse effect on our business, financial condition, and results of operations.
Changes in weather patterns and related extreme weather events, including as a result of global climate change, could significantly affect our financial results or financial condition.
Weather patterns may affect our operating results and our ability to maintain our sales volume throughout the year. Because our customers depend on suitable weather to engage in construction projects, increased frequency or duration of extreme weather conditions could have a material adverse effect on our financial results or financial condition. For example, unseasonably cool weather or extraordinary amounts of rainfall may decrease construction activity, thereby decreasing our sales. Also, we cannot predict the effects that global climate change may have on our business. In addition to changes in weather patterns, it might, for example, reduce the demand for construction, destroy forests (increasing the cost and reducing the availability of wood products used in construction), and increase the cost and reduce the availability of raw materials and energy. New laws and regulations related to global climate change may also increase our expenses or reduce our sales.
We are exposed to political, economic, and other risks that arise from operating a multinational business.
We have operations in North America South America, Europe, Australia, and Asia.Europe. In the year ended December 31, 2017,2023, our North America segment accounted for approximately 57%73% of net revenues and our Europe segment accounted for approximately 28%27% of net revenues, and our Australasia segment accounted for approximately 15% of our net revenues. Further, certain of our businesses obtain raw materials and finished goods from foreign suppliers. Accordingly, our business is subject to political, economic, and other risks that are inherent in operating in numerous countries.
These risks include:
•the difficulty of enforcing agreements and collecting receivables through foreign legal systems;
•trade protection measures and import or export licensing requirements;
•the imposition of, or increases in, tariffs or other trade restrictions;
•required compliance with a variety of foreign laws and regulations, including the application of foreign labor regulations;
•tax rates in foreign countries and the imposition of withholding requirements on foreign earnings;
•difficulty in staffing and managing widespread operations;
•the imposition of, or increases in, currency exchange controls; and
•potential inflation and interest rate fluctuation in applicable non-U.S. economies; and
The success of our business depends in part on our ability to anticipate and effectively manage these and other risks. We cannot assure you that these and other factors will not have a material adverse effect on our international operations or ultimately on our global business, financial condition, and results of operations.
Certain of our customers may expand through consolidation and internal growth, which may increase their buying power. The notice given by the U.K.increased size of its intent to withdraw from the E.U.our customers could have a material adverse effect on our business, financial condition, and results of operations.
We are subject to the credit risk of our customers, suppliers, and other counterparties.
We are subject to the credit risk of our customers, because we provide credit to our customers in the normal course of business. Any failure by our customers to meet their obligations to us may have a material adverse effect on our business, financial
21
condition, and results of operations. In addition, we may incur increased expenses related to collections in the future if we find it necessary to take legal action to enforce the contractual obligations of a significant number of our customers.
Exchange rate fluctuations may impact our business, financial condition, and results of operations.
Our operations expose us to both transaction and translation exchange rate risks. In the year ended December 31, 2017, 49%2023, 34% of our net revenues came from sales outside of the U.S., and we anticipate that our operations outside of the U.S. will continue to represent a significant portion of our net revenues for the foreseeable future. In addition, the nature of our operations often requires that we incur expenses in currencies other than those in which we earn revenue. Because of the mismatch between revenues and expenses, we are exposed to significant currency exchange rate risk and we may not be successful in achieving balances in currencies throughout our operations. In addition, if the effective price of our products were to increase as a result of fluctuations in foreign currency exchange rates, demand for our products could decline, which could adversely affect our business, financial condition, and results of operations. Also, because our financial statements are presented in U.S. dollars, we must translate the financial statements of our foreign subsidiaries and affiliates into U.S. dollars at exchange rates in effect during or at the end of each reporting period, and increases or decreases in the value of the U.S. dollar against other major currencies will affect our reported financial results, including the amount of our outstanding indebtedness. Exchange rates had a positive impact of 1% on our consolidated net revenues in the year ended December 31, 2017 as compared to a 1% negative impact in the year ended December 31, 2016. We cannot assure you that fluctuations in foreign currency exchange rates, particularly the strengthening of the U.S. dollar against major currencies, such as the Euro, the Australian dollar, the Canadian dollar, the British pound, or the currencies of large developing countries, would not materially adversely affect our business, financial condition, and results of operations.
We may be the subject of product liability claims or product recalls and we may not accurately estimate costs related to warranty claims. Expenses associated with product liability claims and lawsuits and related negative publicity or warranty claims in excess of our reserves could have a material adverse effect on our business, financial condition, and results of operations.
Our products are used in a wide variety of residential, non-residential, and architectural applications. We face the risk of exposure to product liability or other claims, including class action lawsuits, in the event our products are alleged to be defective or have resulted in harm to others or to property. We may in the future incur liability if product liability lawsuits against us are successful. Moreover, any such lawsuits, whether or not successful, could result in adverse publicity to us, which could cause our sales to decline materially. In addition, it may be necessary for us to recall defective products, which would also result in adverse publicity, as well as resulting in costs connected to the recall and loss of sales. We maintain insurance coverage to protect us against product liability claims, but that coverage may not be adequate to cover all claims that may arise, or we may not be able to maintain adequate insurance coverage in the future at an acceptable cost. Any liability not covered by insurance could have a material adverse effect on our business, financial condition, and results of operations.
In addition, consistent with industry practice, we provide warranties on many of our products and we may experience costs associated with warranty claims if our products have defects in manufacture or design or they do not meet contractual specifications. We estimate our future warranty costs based on historical trends and product sales, but we may fail to accurately estimate those costs and thereby fail to establish adequate warranty reserves for them. If warranty claims exceed our estimates, it may have a material adverse effect on our business, financial condition, and results of operations.
We may make acquisitions, divestitures, or investments in other businesses, which may involve risks or may not be successful.
Generally, we may seek to acquire businesses that broaden our existing product lines and service offerings or expand our geographic reach. There can be no assurance that we will be able to identify suitable acquisition candidates or that our acquisitions or investments in other businesses will be successful. We may also seek to divest business that do not align with our goal to streamline and simplify our operations. These acquisitions or investments in other businesses may also involve risks, many of which may be unpredictable and beyond our control, and which may have a material adverse effect on our business, financial condition, and results of operations, including risks related to:
•the nature of the acquired company’s business;
•any acquired business not performing as well as anticipated;
•the potential loss of key employees of the acquired company;
•any damage to our reputation as a result of performance or customer satisfaction problems relating to an acquired business;
•the failure of our due diligence procedures to detect material issues related to the acquired business, including exposure to legal claims for activities of the acquired business prior to the acquisition;
•unexpected liabilities resulting from the acquisition for which we may not be adequately indemnified;
•our inability to enforce indemnification and non-compete agreements;
•the integration of the personnel, operations, technologies, and products of the acquired business, and establishment of internal controls, into the acquired company’s operations;
•our failure to achieve projected synergies or cost savings;
•additional stock-based compensation issued or assumed in connection with an acquisition, including the impact on stockholder dilution and our results of operations;
22
•our inability to establish uniform standards, controls, procedures, and policies;
•any requirement that we make divestitures of operations or properties in connection with any acquisitions;
•the diversion of management attention and financial resources;
•our inability to obtain approvals from government authorities; and
•any unforeseen management and operational difficulties, particularly if we acquire assets or businesses in new foreign jurisdictions where we have little or no operational experience.
Our inability to achieve the anticipated benefits of acquisitions and other investments could materially and adversely affect our business, financial condition, and results of operations. In addition, the means by which we finance an acquisition may have a material adverse effect on our business, financial condition, and results of operations, including changes to our equity, debt, and liquidity position. If we issue Convertible Preferred or Common Stock to pay for an acquisition, the ownership percentage of our existing shareholders may be diluted. Using our existing cash may reduce our liquidity. Incurring additional debt to fund an acquisition may result in higher debt service and a requirement to comply with additional financial and other covenants, including potential restrictions on future acquisitions and distributions.
COVID-19 has had, and may continue to have, a negative impact on the global economy and on our business, operations, and results.
While the level of disruption caused by, and the economic impact of, the COVID-19 pandemic has lessened since 2021, there is no assurance that the pandemic will not worsen again, including as a result of the emergence of new strains of the virus, or another health-related emergency will not emerge. Any worsening of the pandemic or a new health-related emergency and their effects on the economy could have an adverse impact on our business, financial condition, and results of operations.
Risks Relating to Labor and Supply Chain
Prices and availability of raw materials, freight, energy and other critical inputs we use to manufacture our products are subject to fluctuations due to inflation and other factors, and we may be unable to protectpass along to our intellectual property,customers the effects of any price increases.
As a manufacturer, our sales and weprofitability are dependent on the availability and cost of raw materials, freight, energy and other inputs. Prices and availability of our critical inputs fluctuate for a variety of reasons beyond our control, many of which cannot be anticipated with any degree of reliability. The reasons for these fluctuations include, among other things, variable worldwide supply and demand across different industries, speculation in commodities futures, general economic or environmental conditions, inflation, political unrest and instability, such as the ongoing military conflict between Russia and Ukraine and instabilities in the Middle East, labor costs, competition, import duties, tariffs, worldwide currency fluctuations, freight, regulatory costs, and product and process evolutions that impact demand for the same materials. Our most significant raw materials include logs and lumber, vinyl extrusions, glass, steel, and aluminum, each of which has been subject to periods of rapid and significant fluctuations in price. Changes in the prices of critical inputs have, and may face claimscontinue to have, a material adverse effect on our business, financial condition, and results of intellectual property infringement.operations.
We have short-term supply contracts with certain of our largest suppliers that limit our exposure to short term fluctuations in prices and availability of our materials, but we are susceptible to longer-term fluctuations in prices. Generally, we do not hedge against commodity price fluctuations, but may from time to time. Significant increases in the prices of raw materials for finished goods, including as a result of significant or protracted material shortages due to pandemic or otherwise, may be difficult to pass through to customers and may negatively impact our profitability and net revenues. We may attempt to modify products that use certain raw materials, but these measureschanges may not be adequate or sufficient,successful.
Some of our manufacturing operations require the use of substantial amounts of electricity and third partiesnatural gas, which may not always respect these legal protections even if they are aware of them. In addition, our competitors may develop similar technologies and know-how without violating our intellectual property rights. Furthermore, the laws of foreign countries may not protect our intellectual property rightsbe subject to the same extentsignificant price increases as the lawsresult of changes in overall supply and demand and the U.S.impacts of legislation and regulatory action. The failurecurrent conflict between Russia and Ukraine has, and may continue to, obtain worldwide patentaffect the price of oil and trademark protectionnatural gas throughout the world and impact the availability of energy supplies and other inputs at our manufacturing sites, particularly in Europe.
23
Such a disruption in the supply of natural gas could impact our ability to continue our operations at such sites at normal levels. We have taken actions in an attempt to reduce the impact of energy price increases. However, these efforts may resultbe insufficient to protect us against fluctuations in other companies copyingenergy prices or shortages of natural gas and marketing products based onwe could suffer adverse effects to net income and cash flow should we be unable to either offset or pass higher energy costs through to our technologies or under brand or trade names similar to ours outside the jurisdictions in which we are protected. This could impede our growth in existing regions, create confusion among consumers, and resultcustomers in a greater supply of similar products that could erode prices for our protected products.timely manner or at all.
We rely upon regular deliveries of raw materials, finished goods, and certain component parts. For certain raw materials that are used in our products, we depend on a single or limited number of suppliers for our materials, and we typically do not have long-term contracts with our suppliers. If we are not able to accurately forecast our supply needs, our limited number of suppliers may make it difficult to quickly obtain additional raw materials to respond to shifting or increased demand. In addition, a supply shortage could occur as a result of unanticipated increases in market demand, including as a result of accelerated demand in reaction to the threat of tariffs or trade restrictions; difficulties in production or delivery, including insufficient energy supply; financial difficulties; or catastrophic events in the supply chain. Furthermore, because our products and the components of some of our products are subject to regulation, changes to these regulations could cause delays in delivery of raw materials, finished goods, and certain component parts.
ship orders on time and could idle some of our manufacturing capability for those products. This could result in a loss of revenues, reduced margins, and damage to our relationships with customers, which could have a material adverse effect on our business, financial condition, and results of operations.
Increases in labor costs, potential labor disputes, and work stoppages at our facilities or the facilities of our suppliers could have a material adverse effect on our business, financial condition, and results of operations.
Our financial performance is affected by the availability of qualified personnel and the cost of labor. We have employees in the U.S. and Canada that are unionized workers, and the majority of our workforce in other countries belong to work councils or are otherwise subject to labor agreements. U.S. and Canada employees represented by these unions are subject to collective bargaining agreements that are subject to periodic negotiation and renewal. If we are unable to enter into new, satisfactory labor agreements with our unionized employees upon expiration of their agreements, we could experience a significant disruption of our operations, which could cause us to be unable to deliver products to customers on a timely basis. Such disruptions could result in a loss of business and an increase in our operating expenses, which could reduce our net revenues and profit margins. In addition, our non-unionized labor force may become subject to labor union organizing efforts, which could cause us to incur additional labor costs and increase the related risks that we now face.
We believe many of our direct and indirect suppliers also have unionized workforces. Strikes, work stoppages, or slowdowns experienced by suppliers could result in slowdowns or closures of facilities where components of our products are manufactured or delivered. Any interruption in the production or delivery of these components could reduce sales, increase costs, and have a material adverse effect on us.
Our business will suffer if certain key officers or employees discontinue employment with us or if we are unable to retain and recruit executives, managers and retain highly skilled staffemployees at a competitive cost.
The success of our business depends upon the skills, experience, and efforts of our executives and other key officersemployees. Our senior management team has acquired specialized knowledge and employees. In recent years, we have hired a large number of key executives who haveskills with respect to our business, and will continue to be integral in the continuing transformation of our business. The loss of key personnelany of these individuals could have a material adverse effect onharm our business, financial condition,especially if we are not successful in developing adequate succession plans. In addition, we rely on the specialized knowledge and resultsexperience of operations. We do not maintain key-man life insurance policies on any members of management.certain key technical employees. Our business also depends on our ability to continue to recruit, train, and retain skilled employees, particularly skilled sales personnel. The loss of the services of anythese key personnel,executives and employees, or our inability to hire new personnel with the requisite skills, could impairhave a material adverse effect on our business, financial condition, and results of operations. For example, our ability to develop new products or enhance existing products, sell products to our customers, or manage our business effectively. Shouldeffectively could be impaired if we lose the services of any member of our senior management team, our board of directors would haveare unable to conductretain and attract qualified personnel. In addition, a search for a qualified replacement. This search may be prolonged, and we may not be able to locate and hire a qualified replacement. A significant increase in the wages paid by competing employers could result in a reduction of our qualified labor force, increases in the wage rates that we must pay, or both.
Our pension plan obligations are currently not fully funded, and we may have to make significant cash payments to these plans, which would reduce the cash available for our businesses.
24
Although we have closed our U.S. pension plan to new participants and have frozen future benefit accruals for current participants, we continue to have unfunded obligations under that plan. The funded levels of our pension plan depend upon many factors, including returns on invested assets, certain market interest rates, and the discount rate used to determine pension obligations. The projected benefit obligation and unfunded liability included in our consolidated financial statements as of December 31, 20172023 for our U.S. pension plan were approximately $435.7$283.9 million and $95.9$4.3 million, respectively. Unfavorable returns on the plan assets or unfavorable changes in applicable laws or regulations could materially change the timing and amount of required plan funding, which would reduce the cash available for our operations. In addition, a decrease in the discount rate used to determine pension obligations could increase the estimated value of our pension obligations, which would affect the reported funding status of our pension plans and would require us to increase the amounts of future contributions. Additionally, we have foreign defined benefit plans, some of which continue to be open to new participants. As of December 31, 2017,2023, our foreign defined benefit plans had unfunded pension liabilities of approximately $22.2 million and overfunded pension assets of approximately $1.9$27.0 million.
Under the Employee Retirement Income Security Act of 1974, as amended, or “ERISA”, the U.S. Pension Benefit Guaranty Corporation, or the “PBGC”, also has the authority to terminate an underfunded tax-qualified U.S. pension plan under certain circumstances. In the event our tax-qualified U.S. pension plans were terminated by the PBGC, we could be liable to the PBGC for an amount that exceeds the underfunding disclosed in our consolidated financial statements. In addition, because our U.S. pension plan has unfunded obligations, if we have a substantial cessation of operations at a U.S. facility and, as a result of such cessation of operations an event under ERISA Section 4062(e) is triggered, additional liabilities that exceed the amounts disclosed in our consolidated financial statements could arise, including an obligation for us to provide additional contributions or alternative security for a period of time after such an event occurs. Any such action could have a material adverse effect on our business, financial condition, and results of operations.
Risks Relating to Cybersecurity and Data Privacy
We are highly dependent on information technology, the disruption of which could significantly impede our ability to do business.
Our operations depend on our network of information technology systems, which are vulnerable to damage from hardware failure, fire, power loss, telecommunications failure, and impacts of terrorism, natural disasters, or other disasters. We rely on our information technology systems to accurately maintain books and records, record transactions, provide information to management and prepare our financial statements. We may not have sufficient redundant operations to cover a loss or failure in a timely manner. Any damage to our information technology systems could cause interruptions to our operations that materially adversely affect our ability to meet customers’ requirements, resulting in an adverse impact to our business, financial condition, and results of operations. Periodically, these systems need to be expanded, updated, or upgraded as our business needs change. We may not be able to successfully implement changes in our information technology systems without experiencing difficulties, which could require significant financial and human resources. Moreover, our increasing dependence on technology may exacerbate this risk.
Our systems and IT infrastructure have been and may continue to be subject to security breaches and other cybersecurity incidents.
We rely on the accuracy, capacity, and security of digital technologies, including information systems, infrastructure, and cloud applications, some of which are managed or hosted by third party service providers, and the sale of our products may involve the transmission and/or storage of data, including in certain instances customers’ and employees’ business and personally identifiable information. Maintaining the security of computers, computer networks, and data storage resources is a critical issue for us and our customers, as security breaches, including computer viruses and malware, denial of service actions, misappropriation of data and similar events through the internet, including via devices and applications connected to the internet, and through email attachments and persons with access to these information systems could result in vulnerabilities and loss of and/or unauthorized access to confidential information. The use of generative artificial intelligence (“AI”) in our internal systems may create new vulnerabilities. Because generative AI is a new field, understanding of security risks and protection methods continues to develop. We have experienced and could continue to experience cybersecurity incidents, such as attempts by experienced hackers, cybercriminals, or others with authorized access to our systems to misappropriate our proprietary information and technology, interrupt our business, and/or gain unauthorized access to confidential information, some of which have been, and may continue to be, successful. If our IT systems or those managed or hosted by third party service providers are breached, or cease to function as anticipated, we could suffer interruptions or inefficiencies in our operations, harm to our reputation, or misappropriation of proprietary or confidential information, including personal information. This could lead some customers to stop purchasing our products and reduce or delay future purchases of our products or use competing products.
In addition, we could face enforcement actions by U.S. states, the U.S. federal government, or foreign governments, which could result in fines, penalties, and/or other liabilities, which may cause us to incur legal fees and costs, and/or additional costs associated with responding to the cyberattack. Increased regulation regarding cybersecurity may increase our costs of compliance, including fines and penalties, as well as costs of cybersecurity audits and associated repairs or updates to infrastructure, physical systems or data processing systems. Any of these actions could have a material adverse impact on our business and results of operations. Although we maintain insurance coverage to protect us against some of the risks, those policies may be insufficient to
25
cover all losses or all types of claims that may arise in the event we experience a cybersecurity incident, data breach or disruption, unauthorized access, or failure of systems.
In addition, we are subject to state, foreign, and international laws and regulations, as well as contractual obligations, that apply to the collection, use, retention, protection, disclosure, transfer and other processing of personal data. These privacy and data-protection related laws and regulations are evolving, with new or modified laws and regulations proposed and implemented frequently and existing laws and regulations subject to new or different interpretations. In particular, the E.U. General Data Protection Regulation (“GDPR”), which became effective in 2018, poses increased compliance challenges both for companies operating within the E.U. and non-E.U. companies that administer or process certain personal data of E.U. residents. It is not possible to predict the ultimate content, and therefore effect, of data protection regulation over time, and efforts to comply with evolving regulation may result in additional costs.
We believe we have invested in industry-appropriate protections and monitoring practices for our data and information technology to reduce these risks and continue to monitor our systems on an ongoing basis for compliance with applicable privacy regulations and any current or potential threats. While we have not experienced any material breaches in security in our recent history, there can be no assurance that our efforts will prevent breakdowns or breaches to databases or systems that could have a material adverse effect on our business, financial condition, and results of operations, or that we will be subject to enforcement actions or penalties in connection with a failure or alleged failure to comply with applicable laws.
Risks Relating to our Governmental and Regulatory Environment
Changes in building codes and standards, including ENERGY STAR standards, could increase the cost of our products, lower the demand for our windows and doors, or otherwise adversely affect our business.
Our products and markets are subject to extensive and complex local, state, federal and foreign statutes, ordinances, rules, and regulations. These mandates, including building design and safety and construction standards and zoning requirements, affect the cost, selection, and quality requirements of building components like windows and doors.
These regulations often provide broad discretion to governmental authorities as to the types and quality specifications of products used in new residential and non-residential construction and home renovations and improvement projects, and different governmental authorities can impose different standards. Compliance with these standards and changes in such regulations may increase the costs of manufacturing our products or may reduce the demand for certain of our products in the affected geographical areas or product markets. Conversely, a decrease in product safety standards could reduce demand for our more modern products if less expensive alternatives that did not meet higher standards became available for use in that market. All or any of these changes could have a material adverse effect on our business, financial condition, and results of operations.
In addition, in order for our products to obtain the “ENERGY STAR” certification, they must meet certain requirements set by the EPA. Changes in the energy efficiency requirements established by the EPA for the ENERGY STAR label could increase our costs, and a lapse in our ability to label our products as such or to comply with the new standards, may have a material adverse effect on our business, financial condition, and results of operations.
Domestic and foreign regulations, legislation and government policy, including those applicable to general business operations, could increase the costs of operating our business and adversely affect our business.
We are subject to a variety of regulation, legislation and government policies from U.S. and foreign governmental authorities relating to wage requirements, employee benefits, and other matters. While it is not possible to predict whether and when any changes to the federal or administrative landscape will occur, changes at the local, state, and federal level could significantly impact our business. For example, changes in local minimum or living wage requirements, rights of employees to unionize, healthcare regulations, and other requirements relating to employee benefits could increase our labor costs, which would in turn increase our cost of doing business. In addition, our international operations are subject to laws applicable to foreign operations, trade protection measures, foreign labor relations, differing intellectual property rights, privacy regulations, other legal and regulatory constraints, and currency regulations of the countries or regions in which we currently operate or where we may operate in the future. These factors may restrict the sales of, or increase costs of, manufacturing and selling our products.
We may be subject to significant compliance costs, as well as liabilities under environmental, health, and safety laws and regulations.
Our past and present operations, assets, and products are subject to extensive environmental laws and regulations at the federal, state, and local level worldwide. These laws regulate, among other things, air emissions, the discharge or release of materials into the environment, the handling and disposal of wastes, remediation of contaminated sites, worker health and safety, and the impact of products on human health and safety and the environment. Under certain of these laws, liability for contaminated property may be imposed on current or former owners or operators of the property or on parties that generated or arranged for waste sent to the property for disposal. Liability under these laws may be joint and several and may be imposed without regard to fault or the legality of
26
the activity giving rise to the contamination. Notwithstanding our compliance efforts, we may still face material liability, limitations on our operations, fines, or penalties for violations of environmental, health, and safety laws and regulations, including releases of regulated materials and contamination by us or previous occupants at our current or former properties or at offsite disposal locations we use.
The applicable environmental, health, and safety laws and regulations, and any changes to them or in their enforcement, may require us to make material expenditures with respect to ongoing compliance with or remediation under these laws and regulations or require that we modify our products or processes in a manner that increases our costs and/or reduces our profitability. For example, additional pollution control equipment, process changes, or other environmental control measures may be needed at some of our facilities to meet future requirements. In addition, discovery of currently unknown or unanticipated soil or groundwater conditions at our properties could result in significant liabilities and costs. Accordingly, we are unable to predict the exact future costs of compliance with or liability under environmental, health, and safety laws and regulations.
Legal, regulatory or stakeholder preferences regarding climate change and Environmental, Social, and Governance (“ESG”) matters could have an adverse impact on the Company’s business and results of operations.
Concerns over the long-term effects of climate change have led to, and may continue to lead to, governmental efforts around the world to mitigate those effects. We will need to respond to any new laws and regulations as well as to consumer, investor and business preferences resulting from climate change concerns, which may have an impact on our business, from the demand for our customers’ products in various industries to our costs of compliance in the manufacturing and servicing of our customers’ products, all of which may impact our results of operations and result in costs to us in order to comply with any new laws, regulations or preferences. Overall, climate change, its effects and the resulting, unknown impact on government regulation, consumer, investor and business preferences could have a long-term material adverse effect on our business and results of operations.
Heightened stakeholder focus on ESG issues related to our business requires the continuous monitoring of various and evolving laws, regulations, standards and expectations and the associated reporting requirements. There can be no certainty that we will adequately or timely meet stakeholder expectations and reporting requirements, which may result in noncompliance with any imposed regulations, the loss of business, reputational impacts, diluted market valuation, an inability to attract and retain customers, and an inability to attract and retain top talent. In addition, our adoption and the reporting of certain standards or mandated compliance to certain requirements could necessitate additional investments that could impact our profitability. The lack of economic and regulatory certainty surrounding ESG may have an adverse impact on our business and results of operations.
Further, we have established and publicly disclosed ESG targets and goals and other sustainability commitments that are subject to a variety of assumptions, risks and uncertainties. If we are unable to, or perceived to be unable to, meet these targets, goals or commitments, our reputation, business and results of operations may be adversely impacted. In addition, not all of our competitors may seek to establish climate or other ESG targets and goals, or at a comparable level to ours, which could result in our competitors achieving competitive advantages through lower supply chain or operating costs.
Changes to legislative and regulatory policies that currently promote home ownership may have a material adverse effect on our business, financial condition, and results of operations.
Our markets are also affected by legislative and regulatory policies, such as U.S. tax rules, allowing for deductions of mortgage interest and the mandate of government-sponsored entities like Freddie Mac and Fannie Mae to promote home ownership through mortgage guarantees on certain types of home loans. The Tax Act passed in the U.S. in December 2017 made significant changes to some of these historical benefits of home ownership. The specific changes which could affect our markets are, among others, a reduction of the maximum amount of home mortgage indebtedness for which a tax deduction for interest paid may be claimed, an elimination of the deduction for interest paid on home equity indebtedness, and a limitation on the amount of state and local taxes allowed to be deducted annually as itemized deductions. These changes to the tax code and any future policy changes may adversely impact demand for our products and have a material adverse effect on our business, financial condition, and results of operations.
Lack of transparency, threat of fraud, public sector corruption, and other forms of criminal activity involving government officials increases the risk of potential liability under anti-bribery/anti-corruption or anti-fraud legislation, including the U.S. Foreign Corrupt Practices Act, the U.K. Bribery Act, and similar laws and regulations.
As a result of the international nature of our operations, we may enter from time to time into negotiations and contractual arrangements with parties affiliated with foreign governments and their officials in the ordinary course of business. In connection with these activities, we may be subject to anti-corruption laws in various jurisdictions, including the U.S. Foreign Corrupt Practices Act, or the “FCPA”, the U.K. Bribery Act and other anti-bribery laws applicable to jurisdictions where we do business that prohibit improper payments or offers of payments to foreign government officials and political parties and others for the purpose of obtaining or retaining business, or otherwise receiving discretionary favorable treatment of any kind, and require the maintenance of internal controls to prevent such payments. In particular, we may be held liable for actions taken by agents in foreign countries where we operate, even though such parties are not always subject to our control. We have established anti-bribery/anti-corruption policies and
27
procedures and offer several channels for raising concerns in an effort to comply with the laws and regulations applicable to us. However, there can be no assurance that our policies and procedures will effectively prevent us from violating these laws and regulations in every transaction in which we may engage. Allegations of violations of the FCPA or other anti-bribery or anti-corruption laws may result in internal, independent, or government investigations. Any determination that we have violated the FCPA or other anti-bribery/anti-corruption laws (whether directly or through acts of others, intentionally or through inadvertence) could result in severe criminal and civil sanctions and other liabilities that could have a material adverse effect on our business, reputation, financial condition, and results of operations.
As we continue to expand our business globally, including through foreign acquisitions, we may have difficulty anticipating and effectively managing these and other risks that our international operations may face, which may adversely impact our business outside of the U.S. and our financial condition and results of operations. In addition, any acquisition of businesses with operations outside of the U.S. may exacerbate this risk.
Our annual effective tax rate and the amount of taxes we pay can change materially as a result of changes in U.S. and foreign tax laws, changes in the mix of our U.S. and foreign earnings, adjustments to our estimates for the potential outcome of any uncertain tax issues, and audits by federal, state and foreign tax authorities.
As a large multinational corporation, we are subject to U.S. federal, state and local, and many foreign tax laws and regulations, all of which are complex and subject to significant change and varying interpretations. Changes in these laws or regulations, or any change in the position of taxing authorities regarding their application, administration or interpretation, could have a material adverse effect on our business, consolidated financial condition or results of our operations. For example, in August 2022, the U.S. government enacted the Inflation Reduction Act of 2022 (the “Inflation Reduction Act”) into law, which includes a new corporate alternative minimum tax and an excise tax on corporate stock repurchases. Future changes in tax law could significantly impact our provision for income taxes, the amount of taxes payable, and our deferred tax asset and liability balances. In addition, our products, and our customers’ products, are subject to import and excise duties and/or sales or value-added taxes in many jurisdictions in which we operate. Increases in these indirect taxes could affect the affordability of our products and our customers’ products, and, therefore, reduce demand.
Recently, international tax norms governing each country’s jurisdiction to tax cross-border international trade have evolved, and are expected to continue to evolve, due in part to the Base Erosion and Profit Shifting project led by the Organization for Economic Cooperation and Development (“OECD”), which represents a coalition of member countries including the United States, and supported by the G20. Changes in these laws and regulations, or any change in the position of tax authorities regarding their application, administration or interpretation could adversely affect our financial results. In addition, a number of countries are actively pursuing changes to their tax laws applicable to multinational corporations.
Due to widely varying tax rates in the taxing jurisdictions applicable to our business, a change in income generation to higher taxing jurisdictions or away from lower taxing jurisdictions may also have an adverse effect on our financial condition and results of operations.
We make estimates of the potential outcome of uncertain tax issues based on our assessment of relevant risks and facts and circumstances existing at the time, and we use these assessments to determine the adequacy of our provision for income taxes and other tax-related accounts. These estimates are highly judgmental. Although we believe we adequately provide for any reasonably foreseeable outcome related to these matters, future results may include favorable or unfavorable adjustments to estimated tax liabilities, which may cause our effective tax rate to fluctuate significantly.
In addition, our income tax returns are subject to regular examination by domestic and foreign tax authorities. These taxing authorities may disagree with the positions we have taken or intend to take regarding the tax treatment or characterization of any of our transactions. If any tax authorities were to successfully challenge the tax treatment or characterization of any of our transactions, it could have a material adverse effect on our business, consolidated financial condition or results of our operations. Furthermore, regardless of whether any such challenge is resolved in our favor, the final resolution of such matter could be expensive and time consuming to defend and/or settle.
Changes in accounting standards, new interpretations of existing standards and subjective assumptions, estimates, and judgments by management related to complex accounting matters could significantly affect our financial results or financial condition.
Risks Relating to our Indebtedness
28
Our failure to comply with the credit agreements governing our Credit Facilities and indentures governing the Senior Notes and Senior Secured Notes, including as a result of events beyond our control, could trigger events of default and acceleration of our indebtedness. Defaults under our debt agreements could have a material adverse effect on our business, financial condition, and results of operations.
If there were an event of default under the credit agreements governing our Credit Facilities, the indentures governing the Senior Notes and Senior Secured Notes, or other indebtedness that we may incur, the holders of the defaulted indebtedness could cause all amounts outstanding with respect to that indebtedness to be immediately due and payable. It is likely that our cash flows would not be sufficient to fully repay borrowings under our Credit Facilities and principal amounts of the Senior Notes and Senior Secured Notes, if accelerated upon an event of default. If we are unable to repay, refinance, or restructure our secured debt, the holders of such indebtedness may proceed against the collateral securing that indebtedness.
Furthermore, any event of default or declaration of acceleration under one debt instrument may also result in an event of default under one or more of our other debt instruments. In exacerbated or prolonged circumstances, one or more of these events could result in our bankruptcy or liquidation. Accordingly, any default by us on our debt could have a material adverse effect on our business, financial condition, and results of operations.
Our indebtedness could adversely affect our financial flexibility and our competitive position.
Financial information regarding our indebtedness is included in Note 1612 - Notes Payable and Long-Term Debt to our financial statements included in this Form 10-K.
Our level of indebtedness increases the risk that we may be unable to generate cash sufficient to pay amounts due in respect of our indebtedness and could have other material consequences, including:
•limiting our ability to obtain financing in the future for working capital, capital expenditures, acquisitions, debt service, or other general corporate purposes;
•requiring us to use a substantial portion of our available cash flow to service our debt, which will reduce the amount of cash flow available for working capital, capital expenditures, acquisitions, and other general corporate purposes;
•increasing our vulnerability to general economic downturns and adverse industry conditions;
•limiting our flexibility in planning for, or reacting to, changes in our business and in our industry in general;
•limiting our ability to invest in and develop new products;
•placing us at a competitive disadvantage compared to our competitors that are not as highly leveraged, as we may be less capable of responding to adverse economic conditions, general economic downturns, and adverse industry conditions;
•restricting the way we conduct our business because of financial and operating covenants in the agreements governing our existing and future indebtedness;
•increasing the risk of our failing to satisfy our obligations with respect to borrowings outstanding under our Credit Facilities, Senior Notes, and Senior Secured Notes and/or being able to comply with the financial and operating covenants contained in our debt instruments, which could result in an event of default under the credit agreements governing our Credit Facilities and the agreements governing our other debt, including the indentureindentures governing the Senior Notes and Senior Secured Notes, that, if not cured or waived, could have a material adverse effect on our business, financial condition, and results of operations; and
•increasing our cost of borrowing.
The credit agreements governing our Credit Facilities and the indentureindentures governing the Senior Notes and Senior Secured Notes impose significant operating and financial restrictions on us that may prevent us from capitalizing on business opportunities.
The credit agreements governing our Credit Facilities and the indentureindentures governing the Senior Notes and Senior Secured Notes impose significant operating and financial restrictions on us. These restrictions limit our ability, among other things, to:
•incur or guarantee additional indebtedness;
•make certain loans, or investments, or restricted payments, including dividends to our shareholders;
•repurchase or redeem capital stock;
•engage in certain transactions with affiliates;
•sell certain assets (including stock of subsidiaries) or merge with or into other companies; and
•create or incur liens.
29
Under the terms of the ABL Facility, we will at times be required to comply with a specified fixed charge coverage ratio when the amount of certain unrestricted cash balances of the U.S. and Canadian loan parties plus the amount available for borrowing by the U.S. borrowers and Canadian borrowers is less than a specified amount. The Australia Senior Secured Credit Facility and Euro Revolving Facility also contain financial maintenance covenants. Our ability to meet the specified covenants could be affected by events beyond our control, and our failure to meet these covenants will result in an event of default as defined in the applicable facility.
In addition, our ability to borrow under the ABL Facility is limited by the amount of the borrowing base applicable to U.S. dollar and Canadian dollar borrowings. Any negative impact on the elements of our borrowing base, such as eligible accounts receivable and inventory, will reduce our borrowing capacity under the ABL Facility. Moreover, the ABL Facility provides discretion to the agent bank acting on behalf of the lenders to impose additional requirements on what accounts receivable and inventory may be counted toward the borrowing base availability and to impose other reserves, which could materially impair the amount of borrowings that would otherwise be available to us. There can be no assurance that the agent bank will not impose such reserves or, were it to do so, that the resulting impact of this action would not materially and adversely impair our liquidity.
As a result of these covenants and restrictions, we are limited in how we conduct our business, and we may be unable to raise additional debt or equity financing to compete effectively or to take advantage of new business opportunities or engage in other activities that may be in our long-term best interests. The terms of any future indebtedness we may incur could include more
restrictive covenants. We cannot assure you that we will be able to maintain compliance with these covenants in the future and, if we fail to do so, we may be unable to obtain waivers from the lenders or amend the covenants.
We require a significant amount of liquidity to fund our operations, and borrowing has increasedmay increase our vulnerability to negative unforeseen events.
Our liquidity needs vary throughout the year. If our business experiences materially negative unforeseen events, we may be unable to generate sufficient cash flow from operations to fund our needs or maintain sufficient liquidity to operate and remain in compliance with our debt covenants, which could result in reduced or delayed purchases of raw materials, planned capital expenditures, and other investments and adversely affect our financial condition or results of operations. Our ability to borrow under the ABL Facility may be limited due to decreases in the borrowing base as described above.
Risks Relating to Ownership of Our Common Stock
The market price of our common stockCommon Stock may be highly volatile.
Our common stockCommon Stock has only been listed for public trading since January 27, 2017. Since that date, the price of our common stock, as reported by the NYSE, has ranged from a low of $24.95 on January 27, 2017 to a high of $42.27 on January 5, 2018. The trading price of our common stock may be volatile. Securities markets worldwide experience significant price and volume fluctuations. This market volatility, as well as other general economic, market or political conditions, could reduce the market price of our shares in spite of our operating performance. The followingVarious factors, including those listed in this Item 1A - Risk Factors section, may have a significant impact on the market price of our common stock:
In addition, broad market and industry factors, including the trading prices of the securities of our publicly-tradedpublicly traded competitors, may negatively affect the market price of our common stock,Common Stock, regardless of our actual operating performance, and factors beyond our control may cause our stock price to decline rapidly and unexpectedly. Furthermore, the stock market has experienced extreme volatility that, in some cases, has been unrelated or disproportionate to the operating performance of particular companies.
We may be subject to securities litigation, which is expensive and could divert management attention.
Our share price may be volatile and, in the past, companies that have experienced volatility in the market price of their stock have been subject to securities class action litigation. We may be the target of this type of litigation in the future.litigation. Litigation of this type could result in substantial costs and diversion of management’s attention and resources, which could have a material adverse effect on our business, financial condition, and results of operations. Any adverse determination in litigation could also subject us to significant liabilities.
Because we have no current plans to pay cash dividends on our shares of common stock,Common Stock, shareholders must rely on appreciation of the value of our common stockCommon Stock for any return on their investment.
We currently anticipate that we will retain future earnings for the development, operation, and expansion of our business, to repay debt and potentially repurchase shares, and have no current plans to declare or pay any cash dividends in the foreseeable future. In addition, the terms of our Credit Facilities, Senior Notes, Senior Secured Notes, and any future debt agreements may preclude us from paying dividends. As a result, we expect that only appreciation of the price of our common stock,Common Stock, if any, will provide a return to shareholders for the foreseeable future.
Because we are a holding company with no operations of our own, we rely on dividends, distributions, and transfers of funds from our subsidiaries, and we could be harmed if such distributions were not made in the future.
30
We are a holding company that conducts all of our operations through subsidiaries and the majority of our operating income is derived from JWI, our main operating subsidiary. Consequently, we rely on dividends or advances from our subsidiaries. We have no current plans to declare or pay dividends on our common stockCommon Stock for the foreseeable future; however, to the extent that we determine in the future to pay dividends on our common stock,Common Stock, none of our subsidiaries will be obligated to make funds available to us for the payment of dividends. The ability of such subsidiaries to pay dividends to us is subject to applicable local law and may be limited due to terms of other contractual arrangements, including our indebtedness. Such laws and restrictions would restrict our ability to continue operations. In addition, Delaware law may impose requirements that may restrict our ability to pay dividends to holders of our common stock.Common Stock.
Item 1B - Unresolved Staff Comments.
None.
Item 1C - Cybersecurity.
Risk Management and Strategy
We maintain a comprehensive process for assessing, identifying and managing material risks from cybersecurity threats as part of our overall risk management system and processes. Our cybersecurity risk management processes include the following:
a.We leverage the National Institute of Standards and Technology (“NIST”) framework to help ensure the Company’s risk posture remains in alignment with the Company’s overall risk appetite.
b.The Company utilizes policies, software, training programs, hardware solutions and managed services to protect and monitor our environment, including multifactor authentication on all critical systems, firewalls, intrusion detection and prevention systems, vulnerability and penetration testing, identity and access management systems and 24x7 security operations center.
c.The Company’s approach to managing cybersecurity and digital risk is led by our CIO and CISO. Our CIO is supported by the Company at the highest levels and regularly engages with cross-functional teams at the Company, including Legal, Audit, Finance, Human Resources and Enterprise Risk Management.
d.We also carry insurance that provides protection against the potential losses arising from a cybersecurity incident. Such insurance may be insufficient to cover all losses or all types of claims that may arise.
e.Our cybersecurity team conducts semi-annual cyber awareness training for professional associates using an independent third-party security training provider to educate best practices, policies and responsibilities pertaining to cybersecurity. We also conduct quarterly simulated phishing tests to generate awareness and run tabletop exercises to simulate a response to a cybersecurity incident and use the findings to improve our practices, procedures and technologies.
f.Our cybersecurity incident response plan coordinates the activities we take to prepare for, detect, respond to, and recover from cybersecurity incidents, which include processes to triage, assess severity for, escalate, contain, investigate, communicate and remediate the incident, as well as to comply with potentially applicable legal obligations and mitigate brand and reputational damage.
g.Our cybersecurity team regularly conduct tests of our information security environment and controls through vulnerability scanning, penetration testing and attack simulation testing.
Additionally, our cybersecurity risk management processes include review and assessment by external, independent third parties, who assess the maturity of our cybersecurity program and identify areas for continued focus and improvement. Furthermore, our Legal Department advises the Board about best practices for cybersecurity oversight by the Board, and the evolution of that oversight over time.
Our cybersecurity risk management processes extend to the oversight and identification of threats associated with our use of third-party service providers. Our cybersecurity team conducts third-party software security reviews for new software products being implemented into our production environments. The Company also has a third-party risk management process that regularly assesses and monitors risks, including cybersecurity, from vendors and suppliers.
See “Risk Factors” in Item 1A of this Annual Report on Form 10-K for information on cybersecurity risks that may materially affect our business strategy, results of operations and financial condition.
Governance
The cybersecurity risk management processes described above are led by our CIO and CISO, each having more than 25 years of information security experience. Our Board, Audit Committee, senior management and the Enterprise Risk Management Committee (a management committee of senior representatives from corporate functions and business lines) devote resources to cybersecurity and risk management processes. The Audit Committee is primarily responsible for the oversight of enterprise risk management and cybersecurity risks, including cybersecurity threats. To fulfill this responsibility, the Audit Committee receives periodic reports from the CIO. These reports include information regarding updates on cybersecurity initiatives, cybersecurity metrics, such as phishing
31
results and attack volume metrics, results of any assessments performed by internal stakeholders or external third-party advisors and updates on cybersecurity trends and insights. The CIO provides a cybersecurity update to the full Board at least annually.
32
Item 2 - Properties
Our principal executive offices areoffice is located in Charlotte, North Carolina. We operate 123 manufacturing facilities, 22 distribution facilities,lease administrative office space in Charlotte, North Carolina and 55 showrooms (which are often co-located with a manufacturing or distribution facility) located in 22 countries. In addition, weBirmingham, U.K. We also own andor lease other properties to support our primary operating activities, including sales offices closed facilities, and administrative office space in Klamath Falls, Oregon, which we own, as well as Charlotte, North Carolina; Birmingham, U.K.; and Sydney, Australia, each of which we lease. Our facilities in the U.S., Canada, St. Kitts, St. Maarten, Chile, Peru, and Mexico are used primarily for operations involving our North America segment; our facilities in the U.K., France, Austria, Switzerland, Hungary, Germany, Sweden, Denmark, Latvia, Estonia, Finland, and Russia are used primarily for operations involving our Europe segment; and our facilities in Australia, New Zealand, Malaysia, and Indonesia are used primarily for operations involving our Australasia segment.Oregon.
| Manufacturing | Distribution | ||||||||||||||||
| North America | |||||||||||||||||
| United States and Caribbean | 38 | 13 | |||||||||||||||
| Canada | 4 | 2 | |||||||||||||||
| 42 | 15 | ||||||||||||||||
| Europe | |||||||||||||||||
| United Kingdom | 2 | — | |||||||||||||||
| France | 2 | — | |||||||||||||||
| Austria | 3 | — | |||||||||||||||
| Czech Republic | 1 | — | |||||||||||||||
| Switzerland | 1 | — | |||||||||||||||
| Hungary | 1 | — | |||||||||||||||
| Germany | 4 | 1 | |||||||||||||||
| Sweden | 2 | — | |||||||||||||||
| Denmark | 3 | — | |||||||||||||||
| Latvia | 2 | — | |||||||||||||||
| Estonia | 3 | — | |||||||||||||||
| Finland | 2 | — | |||||||||||||||
| 26 | 1 | ||||||||||||||||
| Total JELD-WEN | 68 | 16 | |||||||||||||||
33
| Manufacturing | Distribution | Showrooms | ||||||
| North America | ||||||||
| United States | 39 | 7 | — | |||||
| Canada | 4 | 6 | — | |||||
| St. Kitts | — | 1 | — | |||||
| Chile | 1 | — | — | |||||
| Peru | 1 | — | — | |||||
| Mexico | 2 | — | — | |||||
| 47 | 14 | — | ||||||
| Europe | ||||||||
| United Kingdom | 5 | 1 | — | |||||
| France | 2 | — | — | |||||
| Austria | 2 | — | 3 | |||||
| Croatia | — | — | 1 | |||||
| Switzerland | 1 | — | 3 | |||||
| Hungary | 1 | — | — | |||||
| Germany | 2 | 1 | — | |||||
| Sweden | 3 | — | — | |||||
| Denmark | 3 | — | — | |||||
| Latvia | 3 | — | — | |||||
| Estonia | 3 | — | — | |||||
| Finland | 5 | — | — | |||||
| 30 | 2 | 7 | ||||||
| Australasia | ||||||||
| Australia | 43 | 5 | 48 | |||||
| New Zealand | — | 1 | — | |||||
| Indonesia | 2 | — | — | |||||
| Malaysia | 1 | |||||||
| 46 | 6 | 48 | ||||||
| Total JELD-WEN | 123 | 22 | 55 | |||||
Item 3 - Legal Proceedings
Item 4 - Mine Safety Disclosures.
Not applicable.
34
PART II - OTHER INFORMATION
Item 5 - Market for Registrant'sRegistrant’s Common Equity, Related Shareholder Matters and Issuer Purchases of Equity Securities.Securities
Market Information and Holders
Our common stockCommon Stock has been listed and traded on the NYSE under the symbol “JELD” since January 27, 2017. Prior to that time, there was no public trading market for our stock.
| Market Price | ||||||
| Fiscal Year 2017 | High | Low | ||||
| First Quarter (from January 27, 2017) | $ | 33.42 | $24.95 | |||
| Second Quarter | $ | 34.95 | $29.65 | |||
| Third Quarter | $ | 35.93 | $27.61 | |||
| Fourth Quarter | $ | 40.25 | $34.05 | |||
As of February 27, 2018,16, 2024, there were 703approximately 1,374 shareholders of record of our common stock.Common Stock. The number of record holders does not include a substantially greater number of holders whose shares are held of record in nominee or “street name” accounts through banks, brokers, and other financial institutions.
Stock Performance Graph
The following graph depicts the total return to shareholders from January 27, 2017, the date our common shares became listed on the NYSE,December 31, 2018 through December 31, 2017,2023, relative to the performance of the Standard & Poor's 500 Index and the Standard & Poor's 1500 Building Products Index. The graph assumes an investment of $100 in our common stockCommon Stock and each index on January 27, 2017,December 31, 2018, and the reinvestment of dividends paid since that date. The stock performance shown in the graph is not necessarily indicative of future price performance.


*$100 invested on 1/27/1712/31/18 in stock or 12/31/16 in index, including reinvestment of dividends.
Fiscal year ended December 31.
Copyright©20182023 Standard & Poor's, a division of S&P Global. All rights reserved.
Fiscal year ended December 31.
Copyright©
| 12/31/2018 | 12/31/2019 | 12/31/2020 | 12/31/2021 | 12/31/2022 | 12/31/2023 | ||||||||||||||||||||||||||||||||||||||||||||||||||||||||||||||||||
| JELD-WEN Holding, Inc. | $100.00 | $164.74 | $178.47 | $185.5 | $67.91 | $132.86 | |||||||||||||||||||||||||||||||||||||||||||||||||||||||||||||||||
| S&P 500 | $100.00 | $131.49 | $155.68 | $200.37 | $164.08 | $207.21 | |||||||||||||||||||||||||||||||||||||||||||||||||||||||||||||||||
| S&P 1500 Building Products Index | $100.00 | $142.18 | $182.48 | $267.75 | $205.19 | $295.93 | |||||||||||||||||||||||||||||||||||||||||||||||||||||||||||||||||
35
| 1/27/2017 | 3/31/2017 | 6/30/2017 | 9/30/2017 | 12/31/2017 | ||||||
| JELD-WEN Holding, Inc. | $100.00 | $125.77 | $124.27 | $135.99 | $150.73 | |||||
| S&P 500 | $100.00 | $106.07 | $109.34 | $114.24 | $121.83 | |||||
| S & P 1500 Building Products Index | $100.00 | $101.36 | $106.76 | $106.55 | $110.00 | |||||
See “Item 12- Item 12 - Security Ownership of Certain Beneficial Owners and Management and Related Shareholder Matters”Matters for the information required by Item 201(d) of Regulation S-K regarding equity compensation plans.
We do not currently expect to pay any further cash dividends on our common stockCommon Stock for the foreseeable future. Instead, we intend to retain future earnings, if any, for the future operation and expansion of our business, and the repayment of debt.debt, and potentially for share repurchases. Any determination to pay dividends in the future will be at the discretion of our boardBoard of directorsDirectors and will depend upon our results of operations, cash requirements, financial condition, contractual restrictions, restrictions imposed by applicable laws, and other factors that our boardBoard of directorsDirectors may deem relevant.
The terms of our Corporate Credit Facilities were amended in July 2015 and November 2016 to permit the cash dividends described above, but the covenants ofagreements governing our existing or future indebtedness may limit our ability to further pay dividends and make distributions to our shareholders. Our business is conducted through our subsidiaries and dividends from, and cash generated by, our subsidiaries will be our principal sources of cash to repay indebtedness, fund operations, and pay any dividends. Accordingly, our ability to pay dividends to our shareholders is dependent on the earnings and distributions of funds from our subsidiaries (which distributions may be restricted by the terms of our Corporate Credit Facilities and Senior Notes).
Item 6 - Selected Financial Data[Reserved]
Not applicable.
36
| Year Ended December 31, | ||||||||||||||||||||
| 2017 | 2016 | 2015 | 2014 | 2013 | ||||||||||||||||
| (dollars in thousands, except per share data) | ||||||||||||||||||||
| Net revenues | $ | 3,763,934 | $ | 3,666,799 | $ | 3,381,060 | $ | 3,507,206 | $ | 3,456,539 | ||||||||||
| Income (loss) from continuing operations, net of tax | 7,152 | 376,714 | 91,390 | (78,275 | ) | (74,197 | ) | |||||||||||||
| Income (loss) per common share from continuing operations | ||||||||||||||||||||
| Basic and Diluted | $0.00 | $(0.90) | $(15.72) | $(8.75) | $(7.68) | |||||||||||||||
| Cash dividends per common share | $0.00 | $4.09 | $4.73 | $0.00 | $0.00 | |||||||||||||||
| Other financial data: | ||||||||||||||||||||
| Capital expenditures | $ | 63,049 | $ | 79,497 | $ | 77,687 | $ | 70,846 | $ | 85,689 | ||||||||||
| Depreciation and amortization | 111,273 | 107,995 | 95,196 | 100,026 | 104,650 | |||||||||||||||
Adjusted EBITDA(1) | 437,613 | 393,682 | 310,986 | 229,849 | 153,210 | |||||||||||||||
Consolidated balance sheet data: | ||||||||||||||||||||
| Total assets | $ | 2,862,940 | $ | 2,536,046 | $ | 2,182,373 | $ | 2,184,059 | $ | 2,290,897 | ||||||||||
| Total debt | 1,273,703 | 1,620,035 | 1,260,320 | 806,228 | 667,152 | |||||||||||||||
| Redeemable convertible preferred stock | — | 150,957 | 481,937 | 817,121 | 817,121 | |||||||||||||||
| Year Ended December 31, | ||||||||||||||||||||
| 2017 | 2016 | 2015 | 2014 | 2013 | ||||||||||||||||
| (dollars in thousands) | ||||||||||||||||||||
| Net income (loss) | $ | 10,791 | $ | 377,181 | $ | 90,918 | $ | (84,109 | ) | $ | (68,406 | ) | ||||||||
| Adjustments: | ||||||||||||||||||||
| Loss from discontinued operations, net of tax | — | 3,324 | 2,856 | 5,387 | 5,863 | |||||||||||||||
| Gain on sale of discontinued operations, net of tax | — | — | — | — | (10,711 | ) | ||||||||||||||
| Equity (earnings) loss of non-consolidated entities | (3,639 | ) | (3,791 | ) | (2,384 | ) | 447 | (943 | ) | |||||||||||
| Income tax (benefit) expense | 138,603 | (246,394 | ) | (5,435 | ) | 18,942 | 1,142 | |||||||||||||
| Depreciation and amortization | 111,273 | 107,995 | 95,196 | 100,026 | 104,650 | |||||||||||||||
Interest expense, net(a) | 79,034 | 77,590 | 60,632 | 69,289 | 71,362 | |||||||||||||||
Impairment and restructuring charges(b) | 13,057 | 18,353 | 31,031 | 38,645 | 44,413 | |||||||||||||||
| Gain on sale of property and equipment | (299 | ) | (3,275 | ) | (416 | ) | (23 | ) | (3,039 | ) | ||||||||||
| Share-based compensation expense | 19,785 | 22,464 | 15,620 | 7,968 | 5,665 | |||||||||||||||
| Non-cash foreign exchange transaction/translation (income) loss | (2,181 | ) | 5,734 | 2,697 | (528 | ) | (4,114 | ) | ||||||||||||
Other non-cash items(c) | 526 | 2,843 | 1,141 | 2,334 | (68 | ) | ||||||||||||||
Other items(d) | 47,000 | 30,585 | 18,893 | 20,278 | 7,284 | |||||||||||||||
Costs relating to debt restructuring, debt refinancing, and the Onex investment(e) | 23,663 | 1,073 | 237 | 51,193 | 112 | |||||||||||||||
| Adjusted EBITDA | $ | 437,613 | $ | 393,682 | $ | 310,986 | $ | 229,849 | $ | 153,210 | ||||||||||
Item 7 - Management’s Discussion and Analysis of Financial Condition and Results of Operations
This MD&A contains forward-looking statements that involve risks and uncertainties. Please see “Forward-Looking Statements” in Item 1- 1 - Business and Item 1A- 1A - Risk Factors in this Form 10-K for a discussion of the uncertainties, risks and assumptions associated with these statements. This discussion should be read in conjunction with our historical financial statements and related notes thereto and the other disclosures contained elsewhere in this Form 10-K. The results of operations for the periods reflected herein are not necessarily indicative of results that may be expected for future periods, and our actual results may differ materially from those discussed in the forward-looking statements as a result of various factors, including but not limited to those listed under Item 1A- Risk Factors and included elsewhere in this Form 10-K.
This MD&A is a supplement to our financial statements and notes thereto included elsewhere in this Form 10-K and is provided to enhance your understanding of our results of operations and financial condition. Our discussion of results of operations is presented in millions throughout the MD&A and due to rounding may not sum or calculate precisely to the totals and percentages provided in the tables. Our MD&A is organized as follows:
•Consolidated Results of Operations and Operating Results by Business Segment. This section provides our analysis and outlook for the significant line items on our consolidated statements of operations, as well as other information that we deem meaningful to an understanding of our results of operations on both a consolidated basis and a business segment basis.
•Liquidity and Capital Resources. This section contains an overview of our financing arrangements and provides an analysis of trends and uncertainties affecting liquidity, cash requirements for our business, and sources and uses of our cash.
•Critical Accounting Policies and Estimates. This section discusses the accounting policies that we consider important to the evaluation and reporting of our financial condition and results of operations, and whose application requires significant judgments or a complex estimation process.
Company Overview and Background
We are one of the world’s largest door and window manufacturers, and we hold a leading position by net revenues in the majorityglobal designer, manufacturer, and distributor of the countries and markets we serve. We design, produce, and distribute an extensive range ofhigh performance interior and exterior doors, wood, vinyl, and aluminum windows, and related building products, for use inserving the new construction and R&R of residential homes and, to a lesser extent, non-residential buildings.
sectors.
We operate 123 manufacturing and distribution facilities in 1915 countries, located primarily in North America Europe, and Australia.Europe. For many product lines, our manufacturing processes are vertically integrated, enhancing our range of capabilities, our ability to innovate, and our quality control as well as providing supply chain, transportation, and working capital savings.
Business Segments
Our business is organized in geographic regions to ensure integration across operations serving common end markets and customers. We have threetwo reportable segments: North America (which includes limited activity in Chile and Peru), Europe, and Australasia.Europe. Financial information related to our business segments can be found in Note 1914 - Segment Information of our financial statements included elsewhere in this Form 10-K.
finalized. For additional information on acquisition activity,the Steves litigation and divestiture, see Note 25 - Commitments and Contingencies of our financial statements included elsewhere in this Form 10-K.
On April 17, 2023, we entered into a Share Sale Agreement with Aristotle Holding III Pty Limited, a subsidiary of Platinum Equity Advisors, LLC, to sell our Australasia business. On July 2, 2023, we completed the sale. The net assets and operations of the disposal group met the criteria to be classified as “discontinued operations” and are reported as such in all periods presented unless otherwise noted. The consolidated statements of cash flows include cash flows from discontinued operations through the divestiture date of July 2, 2023. See Note 2-Acquisitions. Discontinued Operations of our financial statements included elsewhere in this Form 10-K.
37
Factors and Trends Affecting Our Business
The key components of our net revenues include core net revenuesCore Revenues (which we define to include the impact of pricing and volume/mix, as discussed further under the heading, “Product Pricing and Volume/Mix” below), contribution from acquisitions and divestitures made within the prior twelve months, and the impact of foreign exchange. Our core netNet revenues reported in our financial statements are impacted by the relative and fluctuating currency values in the geographies in which we operate, which we refer to as the impact offrom foreign exchange. Throughout this “Management’s Discussion and Analysis of Financial Condition and Results of Operations”, percentage changes in pricing are based on management schedules and are not derived directly from our accounting records.
Product Demand
General business, financial market, and economic conditions globally and in the regions where we operate influence overall demand in our end markets and for our products. In particular, the following factors may have a direct impact on demand for our products in the countries and regions where our products are marketed and sold:
•the strength of the economy;
•employment rates, and consumer confidence, and spending rates;
•the availability and cost of credit;
•interest rate fluctuations (including mortgage and credit card interest rates) and the availability of financing for our customers and consumers;
•the amount and type of residential and non-residential construction;
•housing sales and home values;
•the age of existing home stock, home vacancy rates, and foreclosures;
•increases in the cost of raw materials or any shortage in supplies or labor;labor, including as a result of tariffs or other trade restrictions;
•the effects of governmental regulation and initiatives to manage economic conditions;
•geographical shifts in population and other changes in demographics; and
•changes in weather patterns.patterns and extreme weather events.
In addition, we seek to drive demand for our products through the implementation of various strategies and initiatives. We believe we can enhance demand for our new and existing products by:
•innovating and developing new products and technologies;
•investing in branding and marketing strategies, including marketing campaigns in both print and social media, as well as our investments in new training centerscurriculum, in-field training and mobile training facilities;technologies to facilitate remote learning; and
•implementing channel initiatives to enhance our relationships with key channel partners and customers, including implementing the True BLU dealer management programoptimizing growth through rebate programs in North America.
Product Pricing and Volume/Mix
The price and mix of products that we sell are important drivers of our net revenues and net income. Under the heading “-Results“Results of Operations”Operations,” references to (i) “pricing” refer to the impact of price increases or decreases, as applicable, for particular products between periods and (ii) “volume/mix” refer to the combined impact of both the number of products we sell in a particular period and the types of products sold, in each case, on net revenues and net income.revenues. While we operate in competitive markets, the demand for our innovative products allows us to exercise pricing discipline, which is an important element of our strategy to achieve profitable growth through improved margins. Our strategiesstrategy also includeincludes incentivizing our channel partners to sell our higher margin products, and we believe a renewed focus on innovation and the development of new technologies will increase our sales volumes and the overall profitability of our product mix.
38
Cost Reduction and Productivity Initiatives
•reducing labor, overtime, and waste costs by reducing facility count while optimizing manufacturing capacity and improving planning and manufacturing processes;
•increasing rigor and alignment around capital expenditures with a clear linkage to our strategy and optimizing returns;
•reducing or minimizing increases in material usage and costs through strategic global sourcingvalue-added engineering;
•investing in logistics optimization programs to reduce freight costs and value-added re-engineering of components, in part by leveragingincrease throughput;
•redesigning our significant spendsupply chain network to reduce lead times and the global nature of our purchases;optimize inventory levels to increase cash flow; and
•reducing warranty costs by improving quality.
We are in the early stages of implementingcontinue to implement our strategic cost-reduction and productivity initiatives including JEM, to develop the culture and processes of operational excellence and continuous improvement. These cost reduction initiatives, as well aswhich may include plant closures and consolidations, headcount reductions, and other various initiatives aimed at lowering production and overhead costs, may not produce the intended results within the intended timeframe.
Raw Material Costs
Commodities such as vinyl extrusions, glass, aluminum, wood, steel, plastics,glass, fiberglass, aluminum and other compositesvinyl are major components in the production of our products. Changes in the underlying prices of these commodities have a direct impact on the cost of productsgoods sold. While we attempt to pass on a substantial portion of such cost increases to our customers, we may not be successful in doing so. In addition, our results of operations for individual quarters may be negatively impacted by a delay between the time of raw material cost increases and a corresponding price increase. Conversely, our results of operations for individual quarters may be positively impacted by a delay between the time of a raw material price decrease and a corresponding competitive pricing decrease.
Freight Costs
We incur substantial freight and duty costs to third party logistics providers and port authorities to transport raw materials and work-in-process inventory to our manufacturing facilities and to deliver finished goods to our customers. Changes in freight and duty rates as well as the availability of freight services can have a significant impact on our cost of goods sold. Freight and duty costs have risen significantly due to a number of factors that have affected the supply and demand of trucking and port services, including increased regulation, such as logging of miles, increases in general economic activity, labor shortages, and an aging workforce. We attempt to mitigate some of these cost increases through various internal initiatives and to pass a substantial portion of these increases to our customers; however, we may not realize the intended results within the intended timeframe.
Working Capital and Seasonality
Working capital which is defined as accounts receivable plus inventory less accounts payable, fluctuates throughout the year and is affected by seasonality of sales of our products and of customer payment patterns. The peak season for home construction and remodeling in our North America and Europe segments which represent the substantial majority of our revenues, generally corresponds with the second and third calendar quarters, and therefore our sales volume is usually higher during those
quarters. Typically, working capital increases at the end of the first quarter and beginning of the second quarter in conjunction with, and in preparation for, our peak season, and working capital decreases starting in the third quarter as inventory levels and accounts receivable decline. Inventories fluctuate for some raw materials with long deliveryGlobal supply markets and supply chains have been impacted by certain events, resulting in shortages and extended lead times such as steel, as we work through prior shipmentsimpacting our operations and take deliveryprofitability. We continue to apply a number of new orders.different strategies to mitigate the impact of these challenges on our operations, including extending our demand planning, seeking alternative sources, utilizing substitute products and leveraging our supplier relationships.
Foreign Currency Exchange Rates
We report our consolidated financial results in U.S. dollars. Due to our international operations, the weakening or strengthening of foreign currencies against the U.S. dollar can affect our reported operating results and our cash flows as we translate our foreign subsidiaries’ financial statements from their reporting currencies into U.S. dollars. In the year ended December 31, 2017 compared to the year ended December 31, 2016, the depreciation of the U.S. dollar relative to the reporting currencies of our foreign subsidiaries resulted in higher reported results in such foreign reporting entities. In particular, the exchange rates used to translate our foreign subsidiaries’ financial results for the year ended December 31, 2017 compared to the year ended December 31, 2016 reflected, on average, the U.S. dollar weakening against the Euro, Australian dollar, and Canadian dollar by 2%, 3%, and 2%, respectively. See Item 1A- 1A - Risk Factors- Risks Relating to Our Business and Industry, Item 1A- 1A - Risk Factors- Exchange rate fluctuations may impact our business, financial condition, and results of operations, and Item 7A- 7A - Quantitative and Qualitative Disclosures About Market Risk- Exchange Rate Risk.
39
Components of our Operating Results
Net Revenues
Our net revenues are a function of sales volumes and selling prices, each of which is a function of product mix, and consist primarily of:
•sales of a wide variety of interior and exterior doors, including patio doors, for use in residential and non-residential applications, with and without frames, to a broad group of wholesale and retail customers in allboth of our geographic markets;
•sales of a wide variety of windows for both residential and certain non-residential uses, to a broad group of wholesale and retail customers primarily in North America, Australia,America; and the U.K.; and
•other sales, including sales of moldings, trim board, cut-stock, glass, stairs, hardware and locks, door skins, shower enclosures, wardrobes, window screens, and miscellaneous installation and other services revenue.services. We also sell molded door skins to certain customers pursuant to long-term contracts, and these customers in turn use the molded door skins to manufacture interior doors and compete directly against us in the marketplace.
Net revenues do not include internal transfers of products between our component manufacturing, product manufacturing and assembly, and distribution facilities.
Cost of Sales
Cost of sales consists primarily of material costs, direct labor and benefit costs, including payroll taxes, repair and maintenance, depreciation, utility, rent and warranty expenses, outbound freight, and insurance and benefits, supervision and tax expenses. Detail for each of these items is provided below.
Material Costs. The single largest component of cost of sales is material costs, which include raw materials, components, and finished goods purchased for use in manufacturing our products or for resale. Our most significant material costs include glass, wood, wood composites, wood components, doors,steel, glass, internally produced door facings, door parts,skins, fiberglass compound, hardware, vinyl extrusions, steel, fiberglass, packaging materials, adhesives, resinspetroleum-based products such as resin and other chemicals, core material,binders, as well as aluminum and aluminumvinyl extrusions. The cost of each of these items is impacted by global supply and demand trends, both within and outside our industry, as well as commodity price fluctuations, conversion costs, energy costs, and transportation costs. Material costs also include purchased finished goods. We have and may continue to experience inflation in our material costs, including increased costs for inbound freight, due to supply chain challenges from economic and geopolitical uncertainties, including the ongoing conflict between Russia and Ukraine. The imposition of new tariffs on imports, new trade restrictions, or changes in tariff rates or trade restrictions may further impact material costs. See Item 7A- 7A - Quantitative and Qualitative Disclosures About Market Risk- Raw Materials Risk.
Direct Labor and Benefit Costs. Direct labor and benefit costs reflect a combination of production hours, average headcount, general wage levels, payroll taxes, and benefits provided to employees. Direct labor and benefit costs include wages, overtime, payroll taxes, and benefits paid to hourly employees at our facilities that are involved in the production and/or distribution of our products. These costs are generally managed by each facility and headcount is adjusted according to overall and seasonal production demand. We run multi-shift operations in many of our facilities to maximize return on assets and utilization. Direct labor and benefit costs fluctuate with headcount, but generally tend to increase with inflation due to increases in wages and health benefit costs.
Repair and Maintenance, Depreciation, Utility, Rent, and Warranty Expenses.
•Repairs and maintenance costs consist of equipment and facility maintenance expenses, purchases of maintenance supplies, and the labor costs involved in performing maintenance on our equipment and facilities.
•Depreciation includes depreciation expense associated with our production assets and plants.
•Rent is predominantly comprised of lease costs for facilities we do not own as well as vehicle fleet and equipment lease costs. Facility leases are typically multi-year and may include increases tied to certain measures of inflation.
•Warranty expenses represent all costs related to servicing warranty claims and product issues and are mostly related to our window and door products sold in the U.S. and Canada.
Outbound Freight. Outbound freight includes payments to third-party carriers for shipments of orders to our customers, as well as driver, vehicle, and fuel expenses when we deliver orders to customers. The majority of our products are shipped by third-party carriers.
Insurance and Benefits, Supervision, and Tax Expenses.
•Insurance and benefit costs are the expenses relating to our insurance programs, health benefits, retirement benefit programs (including the pension plan), and other benefits for employees that are not included in direct labor and benefits costs.
40
•Supervision costs are the wages and bonus expenses related to plant managers. Both insurance and benefits and supervision expenses tend to be influenced by headcount and wage levels.
•Tax costs are mostly payroll taxes for employees not included in direct labor and benefit costs, and property taxes. Tax expenses are impacted by changes in tax rates, headcount and wage levels, and the number and value of properties owned.
In addition, an appropriate portion of each of the insurance and benefits, supervision and tax expenses are allocated to SG&A expenses.
Selling, general,General, and administrative expensesAdministrative Expenses
SG&A expenses consist primarily of research and development, sales and marketing, and general and administrative expenses.
Research and Development. Research and development expenses consist primarily of personnel expenses related to research and development, consulting and contractor expenses, tooling and prototype materials, and overhead costs allocated to such expenses. Substantially all of our research and development expenses are related to developing new products and services and improving our existing products and services. To date, research and development expenses have been expensed as incurred, because the period between achieving technological feasibility and the release of products and services for sale has been short and development costs qualifying for capitalization have been insignificant.
Sales and Marketing. Sales and marketing expenses consist primarily of advertising and marketing promotions of our products and services and related personnel expenses, as well as sales incentives, trade show and event costs, sponsorship costs,
consulting and contractor expenses, travel, display expenses, and related amortization. Sales and marketing expenses are generally variable expenses and not fixed expenses. We expect our sales and marketing expenses to increase in absolute dollars as we continue to actively promote our products and services.
General and Administrative. General and administrative expenses consist of personnel expenses for our finance, legal, human resources, and administrative personnel, as well as the costs of professional services, any allocated overhead, information technology, amortization of intangible assets acquired, and other administrative expenses. We expect
Goodwill Impairment
Goodwill impairment consists of goodwill impairment charges associated with our general and administrative expensesEurope reporting unit in the year ended December 31, 2022. For more information, refer to increase in absolute dollars due to the anticipated growth Note 6 - Goodwill of our businessconsolidated financial statements included in this Form 10-K.
Restructuring and related infrastructure as well as legal, accounting, insurance, investor relations, and other costs associated with becoming a public company.Asset Related Charges
Interest Expense, Net
Interest expense, net relates primarily to interest payments on our then-outstanding credit facilities (andand debt securities)securities, as well as commitment fees and amortization of any original issue discount or debt issuance costs. Debt issuance costs are included as an offset to long-term debt in the accompanying consolidated balance sheets and are amortized to interest expense over the life of the applicablerelated facility using the effective interest method. For additional details, see Note 1612 - Notes Payable and Long-Term Debt inof our financial statements for the year ended December 31, 20172023 included elsewhere in this Form 10-K.
Other Income, (Expense), Net
Other income, (expense), net, includes profitincome and losses related to various miscellaneous non-operating expenses including loss on extinguishment expenses. For more information, refer to Note 22 - Other Income, Net of debt and certain foreign currency related gains and losses.our consolidated financial statements included in this Form 10-K.
Income Taxes
Income taxes are recorded using the asset and liability method of accounting for income taxes. Under this method, deferred tax assets and liabilities are recognized for the deferred tax consequences attributable to differences between the financial statement carrying amounts of existing assets and liabilities and their respective tax bases. Deferred tax assets and liabilities are measured using enacted tax rates expected to apply to taxable income in the years in which those temporary differences are expected to be recovered
41
or settled. The effect on deferred tax assets and liabilities due to a change in tax rates is recognized in income in the period that includes the date of enactment. We recognize the effect of income tax positions only if those positions are more likely than not of being sustained. Recognized income tax positions are measured at the largest amount that is greater than 50% likely of being realized. Changes in recognition or measurement are reflected in the period in which the change in judgment occurs. We record interest relatedFor more information, refer to unrecognized tax benefits in income tax expense. As of December 31, 2017,Note 15 - Income Taxes to our federal, state, and foreign net operating loss (“NOL”) carryforwards were $1,450.1 million in the aggregate and $106.5 million of such NOL carryforwards do not expire.
Results of Operations
The tables in this section summarize key components of our results of operations for the periods indicated, both in U.S. dollars and as a percentage of our net revenues. Certain percentages presented in this section have been rounded to the nearest whole number. Accordingly, totals may not equal the sum of the line items in the tables below. The results for
We present several financial metrics in “Core” terms, such as Core Revenue, which excludes the years ended December 31, 2016impact of foreign exchange, acquisitions and December 31, 2015 have been revised to reflectdivestitures completed in the correctionlast twelve months. We believe Core Revenue assists management, investors, and analysts in understanding the organic performance of certain errors and other accumulated misstatements as described in Note 36 - Revision of Prior Period Financial Statements.our operations.
Comparison of the Year Ended December 31, 20172023 to the Year Ended December 31, 20162022
| December 31, 2017 | December 31, 2016 | ||||||||||||||||||||||||||||||||||||||||||||||||||||||||||
| (dollars in thousands) | % of Net Revenues | % of Net Revenues | |||||||||||||||||||||||||||||||||||||||||||||||||||||||||
| Year Ended | Year Ended | ||||||||||||||||||||||||||||||||||||||||||||||||||||||||||
| December 31, 2023 | December 31, 2023 | December 31, 2022 | |||||||||||||||||||||||||||||||||||||||||||||||||||||||||
| (amounts in thousands) | (amounts in thousands) | % of Net Revenues | % of Net Revenues | ||||||||||||||||||||||||||||||||||||||||||||||||||||||||
| Net revenues | $ | 3,763,934 | 100.0 | % | $ | 3,666,799 | 100.0 | % | Net revenues | $ | 4,304,334 | 100.0 | 100.0 | % | $ | 4,543,808 | 100.0 | 100.0 | % | ||||||||||||||||||||||||||||||||||||||||
| Cost of sales | 2,915,736 | 77.5 | % | 2,892,248 | 78.9 | % | Cost of sales | 3,471,713 | 80.7 | 80.7 | % | 3,757,888 | 82.7 | 82.7 | % | ||||||||||||||||||||||||||||||||||||||||||||
| Gross margin | 848,198 | 22.5 | % | 774,551 | 21.1 | % | Gross margin | 832,621 | 19.3 | 19.3 | % | 785,920 | 17.3 | 17.3 | % | ||||||||||||||||||||||||||||||||||||||||||||
| Selling, general and administrative | 585,074 | 15.5 | % | 565,619 | 15.4 | % | Selling, general and administrative | 655,280 | 15.2 | 15.2 | % | 654,077 | 14.4 | 14.4 | % | ||||||||||||||||||||||||||||||||||||||||||||
| Impairment and restructuring charges | 13,056 | 0.3 | % | 13,847 | 0.4 | % | |||||||||||||||||||||||||||||||||||||||||||||||||||||
| Goodwill impairment | Goodwill impairment | — | — | % | 54,885 | 1.2 | % | ||||||||||||||||||||||||||||||||||||||||||||||||||||
| Restructuring and asset related charges | Restructuring and asset related charges | 35,741 | 0.8 | % | 17,622 | 0.4 | % | ||||||||||||||||||||||||||||||||||||||||||||||||||||
| Operating income | 250,068 | 6.6 | % | 195,085 | 5.3 | % | Operating income | 141,600 | 3.3 | 3.3 | % | 59,336 | 1.3 | 1.3 | % | ||||||||||||||||||||||||||||||||||||||||||||
| Interest expense, net | 79,034 | 2.1 | % | 77,590 | 2.1 | % | Interest expense, net | 72,258 | 1.7 | 1.7 | % | 82,505 | 1.8 | 1.8 | % | ||||||||||||||||||||||||||||||||||||||||||||
| Other expense (income) | 25,279 | 0.7 | % | (12,825 | ) | (0.3 | )% | ||||||||||||||||||||||||||||||||||||||||||||||||||||
| Income before taxes, equity earnings and discontinued operations | 145,755 | 3.9 | % | 130,320 | 3.6 | % | |||||||||||||||||||||||||||||||||||||||||||||||||||||
| Income tax expense (benefit) | 138,603 | 3.7 | % | (246,394 | ) | (6.7 | )% | ||||||||||||||||||||||||||||||||||||||||||||||||||||
| Loss on extinguishment of debt | Loss on extinguishment of debt | 6,487 | 0.2 | % | — | — | % | ||||||||||||||||||||||||||||||||||||||||||||||||||||
| Other income, net | Other income, net | (25,719) | (0.6) | % | (53,433) | (1.2) | % | ||||||||||||||||||||||||||||||||||||||||||||||||||||
| Income from continuing operations before taxes | Income from continuing operations before taxes | 88,574 | 2.1 | % | 30,264 | 0.7 | % | ||||||||||||||||||||||||||||||||||||||||||||||||||||
| Income tax expense | Income tax expense | 63,339 | 1.5 | % | 18,041 | 0.4 | % | ||||||||||||||||||||||||||||||||||||||||||||||||||||
| Income from continuing operations, net of tax | 7,152 | 0.2 | % | 376,714 | 10.3 | % | Income from continuing operations, net of tax | 25,235 | 0.6 | 0.6 | % | 12,223 | 0.3 | 0.3 | % | ||||||||||||||||||||||||||||||||||||||||||||
| Equity earnings of non-consolidated entities | 3,639 | 0.1 | % | 3,791 | 0.1 | % | |||||||||||||||||||||||||||||||||||||||||||||||||||||
| Loss from discontinued operations, net of tax | — | — | % | (3,324 | ) | (0.1 | )% | ||||||||||||||||||||||||||||||||||||||||||||||||||||
| Gain on sale of discontinued operations, net of tax | Gain on sale of discontinued operations, net of tax | 15,699 | 0.4 | % | — | — | % | ||||||||||||||||||||||||||||||||||||||||||||||||||||
| Income from discontinued operations, net of tax | Income from discontinued operations, net of tax | 21,511 | 0.5 | % | 33,504 | 0.7 | % | ||||||||||||||||||||||||||||||||||||||||||||||||||||
| Net income | $ | 10,791 | 0.3 | % | $ | 377,181 | 10.3 | % | Net income | $ | 62,445 | 1.5 | 1.5 | % | $ | 45,727 | 1.0 | 1.0 | % | ||||||||||||||||||||||||||||||||||||||||
Consolidated Results
Net Revenues – Net revenues increased $97.1decreased $239.5 million, or 2.6%5.3%, to $3,763.9$4,304.3 million in the year ended December 31, 20172023 from $3,666.8$4,543.8 million in the year ended December 31, 2016.2022. The increasedecrease was driven by a decrease in net revenues was primarilyCore Revenues of 5% and a nominal impact from foreign exchange. Core Revenues decreased 5% due to our recent acquisitions which provided a 2% increase as well as a favorable foreign exchange impact of 1%. Our core net revenues were unchanged with a 1% benefit from pricing10% decrease in volume/mix, partially offset by a 1% decrease in volume/mix.5% benefit from price realization.
Gross Margin – Gross margin increased $73.6$46.7 million, or 9.5%5.9%, to $848.2$832.6 million in the year ended December 31, 20172023 from $774.6$785.9 million in the year ended December 31, 2016.2022. Gross margin as a percentage of net revenues was 22.5%19.3% in the year ended December 31, 20172023 and 21.1%17.3% in the year ended December 31, 2016.2022. The increase in gross margin and gross margin percentage was due primarily to favorable pricing, price/cost, savings initiatives and contribution from recent acquisitions, partially offset by operational inefficienciesaccelerated depreciation in our North American windows business.America from reviews of equipment capacity optimization.
SG&A Expense – SG&A expense increased $19.5$1.2 million, or 3.4%0.2%, to $585.1$655.3 million in the year ended December 31, 20172023 from $565.6$654.1 million in the year ended December 31, 2016.2022. SG&A expense as a percentage of net revenues was 15.5% forincreased to 15.2% in the year ended December 31, 2017 and 15.4% for2023 from 14.4% in the year ended December 31, 2016.2022. The increase in SG&A expense was primarily due to increased professional fees, costs associated with our IPOperformance-based variable compensation expenses and secondary offerings, SG&A expense associated with our recent acquisitions, and increased wages,accelerated amortization of an ERP system that we intend to not utilize upon completion of the JW Australia Transition Services Agreement period, partially offset by decreased labor expenses driven by a decreasereduction in share-based compensation associated with the 2016 Dividend.headcount and lower bad debt expense in our North America segment due to improved collections.
42
Goodwill Impairment and Restructuring Charges – Impairment and restructuringGoodwill impairment charges decreased $0.8 million, or 5.7%, to $13.1of $54.9 million in the year ended December 31, 2017 from $13.82022 relate to goodwill impairment charges in our Europe reporting unit. For further information, refer to Note 6 - Goodwill of our consolidated financial statements included in this Form 10-K.
Restructuring and Asset Related Charges – Restructuring and asset related charges of $35.7 million in the year ended December 31, 2016. The charges in the year ended December 31, 2017 consisted primarily of a reduction in workforce in our North American segment as well as ongoing restructuring costs in our Europe segment. The charges for the year ended December 31, 2016 consisted primarily of ongoing personnel restructuring in our Europe and North America segment.
Interest Expense, Net – Interest expense, net, decreased $10.2 million, or 12.4%, to $72.3 million in the year ended December 31, 2016. The increase was primarily due to interest expense resulting2023 from the write-off of a portion of the unamortized debt issuance costs and original issue discount totaling approximately $6.1 million in connection with the repayment of $375.0 million of outstanding term loans with proceeds from our IPO. In addition, interest expense increased due to higher long-term debt levels for the first month of the period as a result of borrowings of $375.0 million under our Term Loan Facility, partially offset by reductions in the applicable margin which became effective in March 2017 and December 2017.
Loss on Extinguishment of Debt – The $6.5 million loss on extinguishment of debt is related to the redemption of our Senior Secured Notes and partial redemption of our Senior Notes during the year ended December 31, 2023. Refer to Note 12 - Long-Term Debt of our consolidated financial statements included in this Form 10-K.
Other Income, Net – Other income, net decreased $27.7 million, or 51.9%, to $25.7 million in the year ended December 31, 2017 was primarily of loss on the extinguishment of debt of $23.32023 from $53.4 million associated with our Term Loan, foreign currency losses of $10.4 million, partially offset by a contract settlement of $2.2 million and legal settlement income of $2.5 million. Income in the year ended December 31, 2016 primarily consisted of $8.4 million received in a confidential settlement agreement on a commercial matter in our North America segment.
Income Taxes – Income tax expense was $63.3 million and $18.0 million in the years ended December 31, 2023 and December 31, 2022, respectively. The effective tax rate in the year ended December 31, 20172023 was 95.1%71.5% compared to an effective tax rate of (189.1)%59.6% in the year ended December 31, 2016.2022. The prior yeareffective tax benefit of $246.4 million wasrate increased primarily due primarily to the impacts of the $32.7 million net release valuation allowance recorded in the year ended December 31, 2023, partially offset by the $54.9 million non-deductible goodwill impairment charge recorded for the year ended December 31, 2022 not recorded in the year ended December 31, 2023. For more information, refer to Note 15- Income Taxes of our valuation allowanceconsolidated financial statements included in this Form 10-K.
Gain on Sale of $236.5Discontinued Operations, net of tax – The $15.7 million
gain on sale of discontinued operations, net of tax is related to the July 2, 2023 sale of JW Australia. Refer to Note 2 - Discontinued Operations of our consolidated financial statements included in this Form 10-K.
43
Comparison of the Year Ended December 31, 20162022 to the Year Ended December 31, 20152021
| December 31, 2016 | December 31, 2015 | ||||||||||||||||||||||||||||||||||||||||||||||
| December 31, 2022 | |||||||||||||||||||||||||||||||||||||||||||||||
| December 31, 2022 | |||||||||||||||||||||||||||||||||||||||||||||||
| December 31, 2022 | December 31, 2021 | ||||||||||||||||||||||||||||||||||||||||||||||
| (dollars in thousands) | % of Net Revenues | % of Net Revenues | (dollars in thousands) | % of Net Revenues | % of Net Revenues | ||||||||||||||||||||||||||||||||||||||||||
| Net revenues | $ | 3,666,799 | 100.0 | % | $ | 3,381,060 | 100.0 | % | Net revenues | $ | 4,543,808 | 100.0 | 100.0 | % | $ | 4,181,690 | 100.0 | 100.0 | % | ||||||||||||||||||||||||||||
| Cost of sales | 2,892,248 | 78.9 | % | 2,721,341 | 80.5 | % | Cost of sales | 3,757,888 | 82.7 | 82.7 | % | 3,358,773 | 80.3 | 80.3 | % | ||||||||||||||||||||||||||||||||
| Gross margin | 774,551 | 21.1 | % | 659,719 | 19.5 | % | Gross margin | 785,920 | 17.3 | 17.3 | % | 822,917 | 19.7 | 19.7 | % | ||||||||||||||||||||||||||||||||
| Selling, general and administrative | 565,619 | 15.4 | % | 505,910 | 15.0 | % | Selling, general and administrative | 654,077 | 14.4 | 14.4 | % | 604,514 | 14.5 | 14.5 | % | ||||||||||||||||||||||||||||||||
| Impairment and restructuring charges | 13,847 | 0.4 | % | 21,342 | 0.6 | % | |||||||||||||||||||||||||||||||||||||||||
| Goodwill impairment | Goodwill impairment | 54,885 | 1.2 | % | — | — | % | ||||||||||||||||||||||||||||||||||||||||
| Restructuring and asset related charges | Restructuring and asset related charges | 17,622 | 0.4 | % | 2,556 | 0.1 | % | ||||||||||||||||||||||||||||||||||||||||
| Operating income | 195,085 | 5.3 | % | 132,467 | 3.9 | % | Operating income | 59,336 | 1.3 | 1.3 | % | 215,847 | 5.2 | 5.2 | % | ||||||||||||||||||||||||||||||||
| Interest expense, net | 77,590 | 2.1 | % | 60,632 | 1.8 | % | Interest expense, net | 82,505 | 1.8 | 1.8 | % | 76,788 | 1.8 | 1.8 | % | ||||||||||||||||||||||||||||||||
| Other expense (income) | (12,825 | ) | (0.3 | )% | (14,120 | ) | (0.4 | )% | |||||||||||||||||||||||||||||||||||||||
| Income before taxes, equity earnings and discontinued operations | 130,320 | 3.6 | % | 85,955 | 2.5 | % | |||||||||||||||||||||||||||||||||||||||||
| Income tax benefit | (246,394 | ) | (6.7 | )% | (5,435 | ) | (0.2 | )% | |||||||||||||||||||||||||||||||||||||||
| Other income, net | Other income, net | (53,433) | (1.2) | % | (13,241) | (0.3) | % | ||||||||||||||||||||||||||||||||||||||||
| Loss on extinguishment of debt | Loss on extinguishment of debt | — | — | % | 1,342 | — | % | ||||||||||||||||||||||||||||||||||||||||
| Income before taxes | Income before taxes | 30,264 | 0.7 | % | 150,958 | 3.6 | % | ||||||||||||||||||||||||||||||||||||||||
| Income tax expense | Income tax expense | 18,041 | 0.4 | % | 19,636 | 0.5 | % | ||||||||||||||||||||||||||||||||||||||||
| Income from continuing operations, net of tax | 376,714 | 10.3 | % | 91,390 | 2.7 | % | Income from continuing operations, net of tax | 12,223 | 0.3 | 0.3 | % | 131,322 | 3.1 | 3.1 | % | ||||||||||||||||||||||||||||||||
| Equity earnings of non-consolidated entities | 3,791 | 0.1 | % | 2,384 | 0.1 | % | |||||||||||||||||||||||||||||||||||||||||
| Loss from discontinued operations, net of tax | (3,324 | ) | (0.1 | )% | (2,856 | ) | (0.1 | )% | |||||||||||||||||||||||||||||||||||||||
| Income from discontinued operations, net of tax | |||||||||||||||||||||||||||||||||||||||||||||||
| Income from discontinued operations, net of tax | |||||||||||||||||||||||||||||||||||||||||||||||
| Income from discontinued operations, net of tax | 33,504 | 0.7 | % | 37,500 | 0.9 | % | |||||||||||||||||||||||||||||||||||||||||
| Net income | $ | 377,181 | 10.3 | % | $ | 90,918 | 2.7 | % | Net income | $ | 45,727 | 1.0 | 1.0 | % | $ | 168,822 | 4.0 | 4.0 | % | ||||||||||||||||||||||||||||
Consolidated Results
Net Revenues—– Net revenues increased $285.7$362.1 million, or 8.5%8.7%, to $3,666.8$4,543.8 million in the year ended December 31, 20162022 from $3,381.1$4,181.7 million in the year ended December 31, 2015.2021. The increase was due to an improvement in net revenues was primarily attributable to a 7% increase associated with our recent acquisitions described under the heading “Acquisitions” above. Our core net revenues increased 3%, comprisedCore Revenues of an increase in pricing as a result of implementing our pricing optimization strategy and volume/mix. These increases were12%, partially offset by ana 4% adverse impact from foreign exchange. Core Revenues increased due to a 13% benefit from price realization and unfavorable foreign exchange impactvolume/mix of 1%.
Gross Margin—– Gross margin increased $114.8decreased $37.0 million, or 17.4%4.5%, to $774.6$785.9 million in the year ended December 31, 20162022 from $659.7$822.9 million in the year ended December 31, 2015.2021. Gross margin as a percentage of net revenues was 21.1%17.3% in the year ended December 31, 20162022 and 19.5%19.7% in the year ended December 31, 2015.2021. The increasesdecrease in gross margin percentage was due primarily to the timing differences between increased input costs and gross margin percentage were due to acquisitions, price increases, and cost out initiatives, partially offset by the weakening of the British pound, Canadian dollar and the Australian dollarour pricing actions in the current period which resulted in an unfavorable translation impact of $3.7 million.our end markets.
SG&A Expense—– SG&A expense increased $59.7$49.6 million, or 11.8%8.2%, to $565.6$654.1 million in the year ended December 31, 20162022 from $505.9$604.5 million in the year ended December 31, 2015.2021. SG&A expense as a percentage of net revenues was 15.4% fordecreased to 14.4% in the year ended December 31, 2016 and 15.0% for2022 from 14.5% in the year ended December 31, 2015.2021. The increasesincrease in SG&A expense and SG&A expense percentage werewas primarily due to SG&A expense associated with our recent acquisitions, share basedincreased variable compensation expenseexpenses, self-insurance costs, and other payments related to our November 2016 dividend recapitalization transactions,sales and marketing expenses, partially offset by decreased legal and professional fees related to the IPO process. Partially offsetting these increases was a favorable translation impactfees.
Goodwill Impairment – Goodwill impairment charges of $5.8 million due to the weakening of the British pound, Canadian dollar and the Australian dollar in the current period.
Restructuring and Asset Related Charges – Restructuring and asset related charges increased $15.1 million, or 589.4%, to $17.6 million in the year ended December 31, 2015. The charges in the year ended December 31, 2016 consisted primarily of $6.2 million for restructuring and plant closures of recent acquisitions, $5.5 million for various personnel restructuring and severance costs and $2.1 million of other impairment and restructuring charges. The charges for the year ended December 31, 2015 consisted primarily of $13.4 million of impairment and restructuring charges in Europe primarily due to the closure of one of our three French manufacturing facilities, $2.0 million of charges related to the consolidation of our fiber door skin designs, and $1.5 million of impairment charges related to a non-core equity investment and related notes receivable. The remaining charges of $4.4 million are primarily related to personnel restructuring.
Interest Expense, Net – Interest expense, of $60.6net, increased $5.7 million, or 7.4%, to $82.5 million in the year ended December 31, 2015. The increase was primarily due
Other Income, Net – Other income, net increased $40.2 million, or 303.5%, to $53.4 million in the year ended December 31, 2022 from $13.2 million in the year ended December 31, 2021. Other income, net in the year ended December 31, 2022 primarily
44
consisted of the recovery of cost from interest received on impaired notes of $14.0 million, legal settlement income of $10.5 million, reimbursements from governmental assistance and insurance of $8.0 million, pension income of $4.9 million, a credit for overpayments of utility expenses of $2.0 million, and foreign currency gains of $1.0 million. Other income, net in the year ended December 31, 2021 primarily consisted of foreign currency gains of $7.1 million and reimbursements from governmental pandemic assistance relating to COVID-19 and insurance of $3.2 million.
Loss on Extinguishment of Debt – The $1.3 million loss on extinguishment of debt is related to an amendment of our Term Loan Facility during the year ended December 31, 2021. Refer to Note 12 - Long-Term Debt of our consolidated financial statements included in this Form 10-K.
Income Taxes – Tax expense was $18.0 million and $19.6 million in the years ended December 31, 2022 and December 31, 2021, respectively. The effective tax rate in the year ended December 31, 20162022 was (189.1)%59.6% compared to an effective tax rate of (6.3)%13.0% in the year ended December 31, 2015.2021. The increased tax benefit of $241.0 million was due primarily to a release of a valuation allowanceincrease in the U.S. and U.K. totaling $272.3 millioneffective tax rate in the year ended December 31, 2016 compared to a $19.6 million release of certain foreign subsidiaries' valuation allowance in the year ended December 31, 2015. This increase in benefit2022 was offset by an increase in current tax expense of $4.5 million attributableprimarily due to the earnings mix.non-deductible goodwill impairment charge of $54.9 million. For more information, refer to Note 15 - Income Taxes of our consolidated financial statements included in this Form 10-K.
Segment Results
We report our segment information in the same way management internally organizes the business in assessing performance and making decisions regarding allocation of resources in accordance with ASC 280-10- 280-10 - Segment Reporting. We determined that wedefine Adjusted EBITDA from continuing operations as income (loss) from continuing operations, net of tax, adjusted for the following items: income tax expense (benefit); depreciation and amortization; interest expense, net; and certain special items consisting of non-recurring net legal and professional expenses and settlements; goodwill impairment; restructuring and asset related charges; other facility closure, consolidation, and related costs and adjustments; M&A related costs; net (gain) loss on sale of property and equipment; loss on extinguishment of debt; share-based compensation expense; pension settlement charges; non-cash foreign exchange transaction/translation (income) loss; and other special items. This non-GAAP financial measure should be viewed in addition to, and not as a substitute for, the Company’s reported results prepared in accordance with GAAP.
We have threetwo reportable segments in our continuing operations, organized and managed principally by geographic region. Our reportable segments areregion: North America Europe and Australasia.Europe. We report all other business activities in Corporate and unallocated costs. We define
Reconciliations of net income to Adjusted EBITDA from continuing operations for our segments’ operations are as follows:
45
| Year Ended December 31, 2023 | |||||||||||||||||||||||||||||||||||||||||||||||
| (amounts in thousands) | North America | Europe | Total Operating Segments | Corporate and Unallocated Costs | Total Consolidated | ||||||||||||||||||||||||||||||||||||||||||
| Income (loss) from continuing operations, net of tax | $ | 175,980 | $ | (3,335) | $ | 172,645 | $ | (147,410) | $ | 25,235 | |||||||||||||||||||||||||||||||||||||
Income tax expense (benefit)(1) | 79,210 | 44,095 | 123,305 | (59,966) | 63,339 | ||||||||||||||||||||||||||||||||||||||||||
Depreciation and amortization(2) | 79,900 | 30,185 | 110,085 | 24,911 | 134,996 | ||||||||||||||||||||||||||||||||||||||||||
| Interest expense, net | 4,713 | 3,224 | 7,937 | 64,321 | 72,258 | ||||||||||||||||||||||||||||||||||||||||||
Special items:(3) | |||||||||||||||||||||||||||||||||||||||||||||||
| Net legal and professional expenses and settlements | 946 | 3,726 | 4,672 | 23,512 | 28,184 | ||||||||||||||||||||||||||||||||||||||||||
| Restructuring and asset-related charges | 29,207 | 5,738 | 34,945 | 796 | 35,741 | ||||||||||||||||||||||||||||||||||||||||||
| Other facility closure, consolidation, and related costs and adjustments | (5) | 2,242 | 2,237 | — | 2,237 | ||||||||||||||||||||||||||||||||||||||||||
| M&A related costs | 759 | — | 759 | 5,816 | 6,575 | ||||||||||||||||||||||||||||||||||||||||||
| Net loss (gain) on sale of property and equipment | 1,223 | (5,101) | (3,878) | (6,645) | (10,523) | ||||||||||||||||||||||||||||||||||||||||||
| Loss on extinguishment of debt | — | — | — | 6,487 | 6,487 | ||||||||||||||||||||||||||||||||||||||||||
| Share-based compensation expense | 5,121 | 1,890 | 7,011 | 10,466 | 17,477 | ||||||||||||||||||||||||||||||||||||||||||
| Pension settlement charge | 4,349 | — | 4,349 | — | 4,349 | ||||||||||||||||||||||||||||||||||||||||||
| Non-cash foreign exchange transaction/translation (income) loss | (261) | 1,628 | 1,367 | (772) | 595 | ||||||||||||||||||||||||||||||||||||||||||
| Other special items | 1,047 | (2,837) | (1,790) | (4,721) | (6,511) | ||||||||||||||||||||||||||||||||||||||||||
| Adjusted EBITDA from continuing operations | $ | 382,189 | $ | 81,455 | $ | 463,644 | $ | (83,205) | $ | 380,439 | |||||||||||||||||||||||||||||||||||||
(1)Income tax expense in our Europe segment includes an increase in valuation allowance against net income (loss)operating loss carryforwards of $30.0 million. Refer toNote 15 - Income Taxes of our consolidated financial statements for further information.
(2)North America depreciation and amortization expense includes accelerated depreciation of $9.1 million from reviews of equipment capacity optimization. Corporate and unallocated depreciation and amortization expense includes software accelerated amortization of $14.1 million for an ERP system that we intend to not utilize upon completion of the JW Australia Transition Services Agreement period.
(3)For the definitions of the Special items listed above, refer to Note 14 - Segment Information of our consolidated financial statements included in this Form 10-K.
46
| Year Ended December 31, 2022 | |||||||||||||||||||||||||||||||||||||||||||||||
| (amounts in thousands) | North America | Europe | Total Operating Segments | Corporate and Unallocated Costs | Total Consolidated | ||||||||||||||||||||||||||||||||||||||||||
| Income (loss) from continuing operations, net of tax | $ | 260,590 | $ | (50,796) | $ | 209,794 | $ | (197,571) | $ | 12,223 | |||||||||||||||||||||||||||||||||||||
Income tax expense(1) | 6,963 | 3,307 | 10,270 | 7,771 | 18,041 | ||||||||||||||||||||||||||||||||||||||||||
| Depreciation and amortization | 69,427 | 31,139 | 100,566 | 12,566 | 113,132 | ||||||||||||||||||||||||||||||||||||||||||
| Interest expense, net | 4,011 | 6,193 | 10,204 | 72,301 | 82,505 | ||||||||||||||||||||||||||||||||||||||||||
Special items:(2) | |||||||||||||||||||||||||||||||||||||||||||||||
| Net legal and professional expenses and settlements | 12 | 1,674 | 1,686 | (1,973) | (287) | ||||||||||||||||||||||||||||||||||||||||||
| Goodwill impairment | — | 54,885 | 54,885 | — | 54,885 | ||||||||||||||||||||||||||||||||||||||||||
| Restructuring and asset-related charges | 7,338 | 6,042 | 13,380 | 4,242 | 17,622 | ||||||||||||||||||||||||||||||||||||||||||
| Other facility closure, consolidation, and related costs and adjustments | 2,587 | 16,304 | 18,891 | — | 18,891 | ||||||||||||||||||||||||||||||||||||||||||
| M&A related costs | 736 | — | 736 | 9,016 | 9,752 | ||||||||||||||||||||||||||||||||||||||||||
| Net (gain) loss on sale of property and equipment | (8,397) | 354 | (8,043) | 7 | (8,036) | ||||||||||||||||||||||||||||||||||||||||||
| Share-based compensation expense | 4,870 | 2,729 | 7,599 | 6,978 | 14,577 | ||||||||||||||||||||||||||||||||||||||||||
| Non-cash foreign exchange transaction/translation loss | 148 | 876 | 1,024 | 11,413 | 12,437 | ||||||||||||||||||||||||||||||||||||||||||
| Other special items | 4,600 | 1,618 | 6,218 | (3,113) | 3,105 | ||||||||||||||||||||||||||||||||||||||||||
| Adjusted EBITDA from continuing operations | $ | 352,885 | $ | 74,325 | $ | 427,210 | $ | (78,363) | $ | 348,847 | |||||||||||||||||||||||||||||||||||||
(1)Income tax expense in Corporate and unallocated costs includes the tax impact of U.S. Operations.
(2)For the definitions of the Special items listed above, refer to Note 14 - Segment Information of our financial statements included in this Form 10-K.
| Year Ended December 31, 2021 | |||||||||||||||||||||||||||||||||||||||||
| (amounts in thousands) | North America | Europe | Total Operating Segments | Corporate and Unallocated Costs | Total Consolidated | ||||||||||||||||||||||||||||||||||||
| Income (loss) from continuing operations, net of tax | $ | 255,975 | $ | 66,596 | $ | 322,571 | $ | (191,249) | $ | 131,322 | |||||||||||||||||||||||||||||||
Income tax expense (benefit)(1) | 5,704 | 16,980 | 22,684 | (3,048) | 19,636 | ||||||||||||||||||||||||||||||||||||
| Depreciation and amortization | 72,095 | 32,855 | 104,950 | 11,405 | 116,355 | ||||||||||||||||||||||||||||||||||||
| Interest expense, net | 6,080 | 9,282 | 15,362 | 61,426 | 76,788 | ||||||||||||||||||||||||||||||||||||
Special items:(2) | |||||||||||||||||||||||||||||||||||||||||
| Net legal and professional expenses and settlements | 1,450 | 563 | 2,013 | 13,585 | 15,598 | ||||||||||||||||||||||||||||||||||||
| Restructuring and asset-related charges, net | 1,200 | 1,453 | 2,653 | (97) | 2,556 | ||||||||||||||||||||||||||||||||||||
| Other facility closure, consolidation, and related costs and adjustments | — | 2,326 | 2,326 | — | 2,326 | ||||||||||||||||||||||||||||||||||||
| M&A related costs | 664 | 375 | 1,039 | 4,167 | 5,206 | ||||||||||||||||||||||||||||||||||||
| Net loss (gain) on sale of property and equipment | 1,589 | 584 | 2,173 | (87) | 2,086 | ||||||||||||||||||||||||||||||||||||
| Loss on extinguishment of debt | — | 1,342 | 1,342 | ||||||||||||||||||||||||||||||||||||||
| Share-based compensation expense | 5,472 | 2,096 | 7,568 | 12,420 | 19,988 | ||||||||||||||||||||||||||||||||||||
| Non-cash foreign exchange transaction/translation gain | (51) | (10,108) | (10,159) | (262) | (10,421) | ||||||||||||||||||||||||||||||||||||
| Other special items | 2,703 | 4,290 | 6,993 | 2,999 | 9,992 | ||||||||||||||||||||||||||||||||||||
| Adjusted EBITDA from continuing operations | $ | 352,881 | $ | 127,292 | $ | 480,173 | $ | (87,399) | $ | 392,774 | |||||||||||||||||||||||||||||||
(1)Income tax benefit in Corporate and unallocated costs includes the tax impact of U.S. Operations.
(2)For the definitions of the Special items listed above, refer to Note 14 - Segment Information of our financial statements included in this Form 10-K.
47
Comparison of the Year Ended December 31, 2023 to the Year Ended December 31, 2022
| Year Ended | ||||||||||||||||||||
| (amounts in thousands) | December 31, 2023 | December 31, 2022 | ||||||||||||||||||
| Net revenues from external customers | % Variance | |||||||||||||||||||
| North America | $ | 3,123,056 | $ | 3,259,353 | (4.2) | % | ||||||||||||||
| Europe | 1,181,278 | 1,284,455 | (8.0) | % | ||||||||||||||||
| Total Consolidated | $ | 4,304,334 | $ | 4,543,808 | (5.3) | % | ||||||||||||||
| Percentage of total consolidated net revenues | ||||||||||||||||||||
| North America | 72.6 | % | 71.7 | % | ||||||||||||||||
| Europe | 27.4 | % | 28.3 | % | ||||||||||||||||
| Total Consolidated | 100.0 | % | 100.0 | % | ||||||||||||||||
Adjusted EBITDA from continuing operations (1) | ||||||||||||||||||||
| North America | $ | 382,189 | $ | 352,885 | 8.3 | % | ||||||||||||||
| Europe | 81,455 | 74,325 | 9.6 | % | ||||||||||||||||
| Corporate and unallocated costs | (83,205) | (78,363) | 6.2 | % | ||||||||||||||||
| Total Consolidated | $ | 380,439 | $ | 348,847 | 9.1 | % | ||||||||||||||
| Adjusted EBITDA from continuing operations as a percentage of segment net revenues | ||||||||||||||||||||
| North America | 12.2 | % | 10.8 | % | ||||||||||||||||
| Europe | 6.9 | % | 5.8 | % | ||||||||||||||||
| Total Consolidated | 8.8 | % | 7.7 | % | ||||||||||||||||
(1)Adjusted EBITDA from continuing operations is a financial measure that is not calculated in accordance with GAAP. For a discussion of our presentation of Adjusted EBITDA from continuing operations, see Note 14 - Segment Information of our financial statements included in this Form 10-K.
North America
Net revenues in North America decreased $136.3 million, or 4.2%, eliminatingto $3,123.1 million in the year ended December 31, 2023 from $3,259.4 million in the year ended December 31, 2022. The decrease was primarily due to a decrease in Core Revenues of 4.0%. Core Revenues decreased due to an 8% unfavorable volume/mix driven by weakened market demand, partially offset by a 4% benefit from price realization.
Adjusted EBITDA from continuing operations in North America increased $29.3 million to $382.2 million, or 8.3%, in the year ended December 31, 2023 from $352.9 million in the year ended December 31, 2022. The increase was primarily due to favorable price/cost and positive productivity, partially offset by unfavorable volume/mix and higher SG&A. The increase in SG&A was primarily driven by increased performance-based variable compensation and the impact of inflation on labor expenses, partially offset by a reduction in bad debt expense due to improved collections. Additionally, a decrease in other income, net, was primarily driven by net pension expense in the following items: losscurrent period compared to gains in the same period last year, partially offset by income recognized for a refund of deposits for antidumping duties and an ERC during the year ended December 31, 2023.
Europe
Net revenues in Europe decreased $103.2 million, or 8.0%, to $1,181.3 million in the year ended December 31, 2023 from discontinued$1,284.5 million in the year ended December 31, 2022. The decrease was primarily due to a decrease in Core Revenues of 9%. Core Revenues decreased due to unfavorable volume/mix of 15% primarily due to market softness across the region, partially offset by a 7% benefit from price realization.
Adjusted EBITDA from continuing operations net of tax; gainin Europe increased $7.1 million, or 9.6%, to $81.5 million in the year ended December 31, 2023 from $74.3 million in the year ended December 31, 2022. The increase was primarily due to favorable productivity and positive price/cost, partially offset by unfavorable volume/mix.
Corporate and unallocated costs
Corporate and unallocated costs increased by $4.8 million, or 6.2%, to $83.2 million in the year ended December 31, 2023, from $78.4 million in the year ended December 31, 2022. The increase in cost is primarily due to losses on sale of discontinued operations, net of tax; equity earnings (loss) of non-consolidated entities; income tax; depreciation and amortization; interest expense, net; impairment and restructuring charges; (gain) loss on sale of property and equipment; share-based compensation expense; non-cash foreign exchange transaction/translation (income) loss; other non-cash items; other items;transactions in the current period compared to gains in the same period last year, and a reduction in the recovery of cost from interest received on impaired notes, partially offset by lower labor costs relateddue to debt restructuring, debt refinancing, andreduced headcount.
48
Comparison of the Onex Investment. For additional information on segment Year Ended December 31, 2022 to the Year Ended December 31, 2021
| Year Ended | ||||||||||||||||||||
| (dollars in thousands) | December 31, 2022 | December 31, 2021 | ||||||||||||||||||
| Net revenues from external customers | % Variance | |||||||||||||||||||
| North America | $ | 3,259,353 | $ | 2,829,240 | 15.2 | % | ||||||||||||||
| Europe | 1,284,455 | 1,352,450 | (5.0) | % | ||||||||||||||||
| Total Consolidated | $ | 4,543,808 | $ | 4,181,690 | 8.7 | % | ||||||||||||||
| Percentage of total consolidated net revenues | ||||||||||||||||||||
| North America | 71.7 | % | 67.7 | % | ||||||||||||||||
| Europe | 28.3 | % | 32.3 | % | ||||||||||||||||
| Total Consolidated | 100.0 | % | 100.0 | % | ||||||||||||||||
Adjusted EBITDA from continuing operations (1) | ||||||||||||||||||||
| North America | $ | 352,885 | $ | 352,881 | — | % | ||||||||||||||
| Europe | 74,325 | 127,292 | (41.6) | % | ||||||||||||||||
| Corporate and Unallocated costs | (78,363) | (87,399) | (10.3) | % | ||||||||||||||||
| Total Consolidated | $ | 348,847 | $ | 392,774 | (11.2) | % | ||||||||||||||
| Adjusted EBITDA from continuing operations as a percentage of segment net revenues | ||||||||||||||||||||
| North America | 10.8 | % | 12.5 | % | ||||||||||||||||
| Europe | 5.8 | % | 9.4 | % | ||||||||||||||||
| Total Consolidated | 7.7 | % | 9.4 | % | ||||||||||||||||
(1)Adjusted EBITDA from continuing operations is a financial measure that is not calculated in accordance with GAAP. For a discussion of our presentation of Adjusted EBITDA from continuing operations, see Note 1914 - Segment Informationto our financial statements included in this Form 10-K.
| (dollars in thousands) | December 31, 2017 | December 31, 2016 | |||||||||
| Net revenues from external customers | % Variance | ||||||||||
| North America | $ | 2,158,083 | $ | 2,149,168 | 0.4 | % | |||||
| Europe | 1,042,767 | 1,008,729 | 3.4 | % | |||||||
| Australasia | 563,084 | 508,902 | 10.6 | % | |||||||
| Total Consolidated | $ | 3,763,934 | $ | 3,666,799 | 2.6 | % | |||||
| Percentage of total consolidated net revenues | |||||||||||
| North America | 57.3 | % | 58.6 | % | |||||||
| Europe | 27.7 | % | 27.5 | % | |||||||
| Australasia | 15.0 | % | 13.9 | % | |||||||
| Total Consolidated | 100.0 | % | 100.0 | % | |||||||
Adjusted EBITDA(1) | |||||||||||
| North America | $ | 273,594 | $ | 251,831 | 8.6 | % | |||||
| Europe | 132,929 | 122,574 | 8.4 | % | |||||||
| Australasia | 74,706 | 59,519 | 25.5 | % | |||||||
| Corporate and Unallocated costs | (43,616 | ) | (40,242 | ) | 8.4 | % | |||||
| Total Consolidated | $ | 437,613 | $ | 393,682 | 11.2 | % | |||||
| Adjusted EBITDA as a percentage of segment net revenues | |||||||||||
| North America | 12.7 | % | 11.7 | % | |||||||
| Europe | 12.7 | % | 12.2 | % | |||||||
| Australasia | 13.3 | % | 11.7 | % | |||||||
| Total Consolidated | 11.6 | % | 10.7 | % | |||||||
North America
Net revenues in North America increased $8.9$430.1 million, or 0.4%15.2%, to $2,158.1$3,259.4 million in the year ended December 31, 20172022 from $2,149.2$2,829.2 million in the year ended December 31, 2016.2021. The increase in net revenues was primarily due to the acquisitionan increase in Core Revenues of MMI Door which provided15%. Core Revenues increased due to a 2% increase. This was partially offset by a decrease in core net revenues of 1% comprised of favorable pricing of 2%, offset by a decrease in14% benefit from price realization mostly related to significant cost inflation, and positive volume/mix of 3%1%. The decrease in volume/mix was primarily driven by activity in our retail channel, including the impact of the previously announced business line rationalization in Florida and reduced volume in our windows business.
Adjusted EBITDA in North America increased $21.8 million, or 8.6%, to $273.6remained relatively consistent at $352.9 million in the year ended December 31, 20172022 from $251.8$352.9 million in the year ended December 31, 2016. The increase in2021. While Adjusted EBITDA was due toincreased slightly primarily driven by improved volume/mix and productivity, the acquisition of MMI Door, as well as favorable pricing and cost saving initiatives, partiallyincrease was offset by operational inefficiencies in our windows business.
higher SG&A expenses.
Europe
Net revenues in Europe increased $34.0decreased $68.0 million, or 3.4%5.0%, to $1,042.8$1,284.5 million in the year ended December 31, 20172022 from $1,008.7$1,352.5 million in the year ended December 31, 2016.2021. The increase in net revenuesdecrease was primarily due to a 12% adverse impact from foreign exchange, partially offset by an increase in core net revenuesCore Revenues of 2% which was comprised of an increase in7%. Core Revenues increased due to a 11% benefit from price realization mostly related to significant cost inflation, partially offset by lower volume/mix of approximately 1%, and favorable pricing of approximately 1%4%. The acquisition of Mattiovi provided an additional 1% increase.
Adjusted EBITDA in Europe increased $10.4decreased $53.0 million, or 8.4%41.6%, to $132.9$74.3 million in the year ended December 31, 20172022 from $122.6$127.3 million in the year ended December 31, 2016.2021. The increase in Adjusted EBITDAdecrease was primarily due to the additional shipping days in the first quarter of 2017, favorable pricing, our Mattiovi acquisitionlower volume/mix, higher SG&A expenses, and our negative price/cost, saving initiatives.partially offset by improved productivity.
Corporate and unallocated costs
current periods.
49
| (dollars in thousands) | December 31, 2016 | December 31, 2015 | |||||||||
| Net revenues from external customers | % Variance | ||||||||||
| North America | $ | 2,149,168 | $ | 2,015,715 | 6.6 | % | |||||
| Europe | 1,008,729 | 996,014 | 1.3 | % | |||||||
| Australasia | 508,902 | 369,331 | 37.8 | % | |||||||
| Total Consolidated | $ | 3,666,799 | $ | 3,381,060 | 8.5 | % | |||||
| Percentage of total consolidated net revenues | |||||||||||
| North America | 58.6 | % | 59.6 | % | |||||||
| Europe | 27.5 | % | 29.5 | % | |||||||
| Australasia | 13.9 | % | 10.9 | % | |||||||
| Total Consolidated | 100.0 | % | 100.0 | % | |||||||
Adjusted EBITDA(1) | |||||||||||
| North America | $ | 251,831 | $ | 201,660 | 24.9 | % | |||||
| Europe | 122,574 | 99,540 | 23.1 | % | |||||||
| Australasia | 59,519 | 40,453 | 47.1 | % | |||||||
| Corporate and Unallocated costs | (40,242 | ) | (30,667 | ) | 31.2 | % | |||||
| Total Consolidated | $ | 393,682 | $ | 310,986 | 26.6 | % | |||||
| Adjusted EBITDA as a percentage of segment net revenues | |||||||||||
| North America | 11.7 | % | 10.0 | % | |||||||
| Europe | 12.2 | % | 10.0 | % | |||||||
| Australasia | 11.7 | % | 11.0 | % | |||||||
| Total Consolidated | 10.7 | % | 9.2 | % | |||||||
Liquidity and Capital Resources
Overview
We have historically funded our operations through a combination of cash from operations, draws on our revolving credit facilities, and the issuance of non-revolving debt such as our Term Loan Facility and our Senior Notes. We place a strong emphasis on cash flow generation, which includes an operating discipline focused on working capital management. Working capital fluctuates throughout the year and is impacted by inflation, the seasonality of our sales, customer payment patterns, supply availability, and the translation of the balance sheets of our foreign operations into the U.S. dollar. Typically, working capital increases at the end of the first quarter and beginning of the second quarter in conjunction with, and in preparation for, the peak season for home construction and remodeling in our North America and Europe segments, and decreases starting in the fourth quarter as inventory levels and accounts receivable decline. Inventories fluctuate for raw materials that have long delivery lead times, as we work through prior shipments and take delivery of new orders.
As of December 31, 2017,2023, we had total liquidity (a non-GAAP measure) of $512.2$750.6 million, which included $220.2consisting of $288.3 million in unrestricted cash, $232.4$462.3 million available for borrowing under the ABL Facility, AUD $17.0 million ($13.3 million) available for borrowing under the Australia Senior Secured Credit Facility, and €38.7 million ($46.3 million) available for borrowing under the Euro Revolving Facility. This comparescompared to total liquidity of $381.9$575.2 million as of December 31, 2016.2022 (on a continuing operations basis and excluding JW Australia). The increase in total liquidity was primarily due to both higher cash balances and lower borrowings on our ABL Facility at December 31, 20172023 compared to December 31, 2016 was primarily due to the retained portion of net proceeds of $472.4 million from the IPO, as well as cash provided by operations.
2022.
As of December 31, 2017,2023, our cash balances, including $36.1$0.8 million of restricted cash, consisted of $69.4$72.9 million in the U.S. and $186.8$216.3 million in non-U.S. subsidiaries. The company repatriated $21.8 million and $132.8 million from non-U.S. subsidiaries during the year ended December 31, 2023 and December 31, 2022, respectively. The Company utilized cash repatriated from non-U.S. subsidiaries to repay a portion of the outstanding ABL Facility during the year ended December 31, 2022. Based on our current and forecasted level of operations theand seasonality of our business, and anticipated growth, we believe that cash provided by operations and other sources of liquidity, including cash, cash equivalents, and borrowingsavailability under our revolving credit facilities, will provide adequate liquidity for ongoing operations, planned capital expenditures and other investments, and debt service requirements for at least the next twelve months.
We may, from time to time, refinance, reprice, extend, retire, or otherwise modify our outstanding debt to lower our interest payments, reduce our debt, or otherwise improve our financial position. These actions may include repricing amendments, extensions, and/or opportunistic refinancing of debt. The amount of debt that may be refinanced, re-priced,repriced, extended, retired, or otherwise modified, if any, will depend on market conditions, trading levels of our debt, our cash position, compliance with debt covenants, and other considerations. Our affiliates
We may, also purchase our debt from time to time, seek to retire or purchase our outstanding debt through cash purchases and/or exchanges for equity or debt, in open market purchases, privately negotiated transactions or otherwise. Such repurchases or exchanges, if any, will be on such terms and at such prices as we may determine, and will depend on prevailing market conditions, our liquidity requirements, contractual restrictions and other transactions. In such cases, ourfactors. The amounts involved may be material.
Based on hypothetical variable rate debt may not be retired, in which case wethat would continuehave resulted from drawing each revolving credit facility up to pay interest in accordance with the terms of the debt, and we would continue to reflect the debt as outstanding in our consolidated balance sheets.
| (amounts in thousands) | 2017 | 2016 | ||||||
| Cash provided by (used in): | ||||||||
| Operating activities | $ | 265,793 | $ | 201,655 | ||||
| Investing activities | (189,793 | ) | (156,782 | ) | ||||
| Financing activities | 64,090 | (52,001 | ) | |||||
| Effect of changes in exchange rates on cash and cash equivalents | 12,692 | (3,697 | ) | |||||
| Net change in cash and cash equivalents | $ | 152,782 | $ | (10,825 | ) | |||
Contractual Obligations
In addition to our discussion and analysis surrounding our liquidity and capital resources, we have significant contractual obligations and commitments as of December 31, 2023 relating to the following:
•Long-term debt and interest obligations – As of December 31, 2023 our outstanding debt balance was $1,232.8 million. See Note 12- Long-Term Debt of our consolidated financial statements for additional details regarding the timing of expected future principal payments. Interest on long-term debt is calculated based on debt outstanding and interest rates in effect on December 31, 2023, taking into account scheduled maturities and amortization payments. As of December 31, 2023, we estimate interest payments of $72.9 million due in 2024 and $179.6 million due in 2025 and thereafter.
•Finance and operating lease obligations – As of December 31, 2023, our remaining contractual commitments for finance and operating leases was $192.7 million. See Note 8 - Leases of our consolidated financial statements for additional details regarding the timing of expected future payments.
•Purchase obligations – As of December 31, 2023, we have purchase obligations of $26.7 million due in 2024 and $28.1 million due in 2025 and thereafter. These purchase obligations are primarily relating to software hosting services and equipment purchase agreements. Purchase obligations are defined as purchase agreements that are enforceable and legally binding and that specify all significant terms, including quantity, price, and the approximate timing of the transaction.
50
Borrowings and Refinancings
In July 2021, we refinanced our existing Term Loan Facility and ABL Facility by issuing replacement loans that aggregated to $550.0 million in principal amount under the Term Loan Facility and added $100.0 million in potential additional revolving loan capacity to our ABL Facility.
In June 2023, we amended the Term Loan Facility to replace LIBOR with a Term SOFR based rate as the successor benchmark rate and made certain other technical amendments and related conforming changes. All other material terms and conditions were unchanged.
On August 3, 2023, we redeemed all $250.0 million of our 6.25% Senior Secured Notes and $200.0 million of our 4.63% Senior Notes. The Company recognized a pre-tax loss of $6.5 million on the redemption in year ended December 31, 2023, consisting of $3.9 million in call premium and $2.6 million in accelerated amortization of debt issuance costs.
In January 2024, we amended the Term Loan Facility to lower the applicable margin for replacement term loans, remove certain provisions no longer relevant to the parties, and make certain other technical amendments related to related conforming changes. Pursuant to the amendment, replacement term loans bear interest at SOFR plus a margin of 1.75% to 2.00% depending on JWI’s corporate credit ratings, compared to a margin of 2.00% to 2.25% under the previous amendment. All other material terms and conditions of the Term Loan Agreement were unchanged.
As of December 31, 2023, we were in compliance with the terms of all of our Credit Facilities and the indentures governing the Senior Notes.
Our results have been and will continue to be impacted by substantial changes in our net interest expense throughout the periods presented and into the future. See Note 12 - Long-Term Debt of our consolidated financial statements for additional details.
Cash Flows (1)
The following table summarizes the changes to our significant contractual obligations atcash flows for the periods presented:
| Year Ended | ||||||||||||||||||||
| (amounts in thousands) | December 31, 2023 | December 31, 2022 | December 31, 2021 | |||||||||||||||||
| Cash provided by (used in): | ||||||||||||||||||||
| Operating activities | $ | 345,188 | $ | 30,337 | $ | 175,666 | ||||||||||||||
| Investing activities | 279,174 | (67,030) | (92,361) | |||||||||||||||||
| Financing activities | (563,157) | (120,014) | (401,209) | |||||||||||||||||
| Effect of changes in exchange rates on cash and cash equivalents | 7,074 | (19,315) | (21,800) | |||||||||||||||||
| Net change in cash and cash equivalents | $ | 68,279 | $ | (176,022) | $ | (339,704) | ||||||||||||||
(1)Cash flow information is inclusive of cash flows from JW Australia as discontinued operations through the divestiture date of July 2, 2023.
Cash Flow from Operations
Net cash provided by operating activities increased $314.9 million to a $345.2 million source of cash in the year ended December 31, 2017:2023 compared to a $30.3 million source of cash in the year ended December 31, 2022. The increase in cash provided by operating activities was primarily due to a $342.5 million improvement in net cash provided by our working capital accounts. Cash flow provided by Inventory was $193.1 million favorable compared to the year ended December 31, 2022, primarily driven by demand planning that drove lower inventory days on hand, which mitigated inflation on raw materials. Cash flow provided by Accounts receivable, net of $90.6 million was favorable in the year ended December 31, 2023 compared to the year ended December 31, 2022, which was primarily due to decreased sales, partially offset by slightly deteriorated days sales outstanding. Cash flow provided by Accounts payable was $58.8 million favorable compared to the year ended December 31, 2022, which was primarily due to lower raw material inflation on purchases in the current year as compared to prior year, partially offset by demand planning that drove moderated purchasing.
Net cash provided by operating activities decreased $145.3 million to a $30.3 million source of cash in the year ended December 31, 2022 compared to a $175.7 million source of cash in the year ended December 31, 2021. The decrease in cash provided by operating activities was primarily due to increased working capital and decreased earnings in the year ended December 31, 2022, partially offset by non-recurrence of legal settlements paid in 2021.
51
| Payments Due By Period | ||||||||||||||||||||
| Total | Less Than 1 Year | 1-3 Years | 3-5 Years | More Than 5 Years | ||||||||||||||||
| (dollars in thousands) | ||||||||||||||||||||
Contractual Obligations(1) | ||||||||||||||||||||
| Long-term debt obligations | $ | 1,263,413 | $ | 6,009 | $ | 9,012 | $ | 8,746 | $ | 1,239,646 | ||||||||||
Capital lease obligations(2) | 30,017 | 2,761 | 4,286 | 2,879 | 20,091 | |||||||||||||||
| Operating lease obligations | 122,284 | 33,549 | 42,758 | 21,263 | 24,714 | |||||||||||||||
Purchase obligations(3) | 1,196 | 683 | 513 | — | — | |||||||||||||||
Interest on long-term debt obligations(4) | 488,264 | 56,866 | 112,998 | 112,159 | 206,241 | |||||||||||||||
| Totals: | $ | 1,905,174 | $ | 99,868 | $ | 169,567 | $ | 145,047 | $ | 1,490,692 | ||||||||||
Net cash used in investing activities decreased $25.3 million to a $67.0 million use of cash in the year ended December 31, 2022 compared to a $92.4 million use of cash in the year ended December 31, 2021 primarily due to cash received from the recovery of cost from interest received on impaired notes of $14.0 million, an increase in cash received from the sale of property and equipment, and a reduction in capital expenditures. Cash Flow from Financing Activities Net cash used in financing activities increased $443.1 million to $563.2 million in the year ended December 31, 2023 compared to $120.0 million in the year ended December 31, 2022, primarily due to net debt payments and payments of debt extinguishment costs of $561.3 million in the year ended December 31, 2023 compared to net debt borrowings of $12.7 million in the year ended December 31, 2022, partially offset by the non-recurrence of repurchases of our Common Stock of $132.0 million in the year ended December 31, 2022. Net cash used in financing activities decreased $281.2 million to $120.0 million in the year ended December 31, 2022 compared to $401.2 million in the year ended December 31, 2021, primarily due to a decrease of $191.7 million in repurchases of our Common Stock and net debt borrowings of $12.7 million in the year ended December 31, 2022, compared to net debt payments and payments of debt extinguishment cost of $86.1 million in the year ended December 31, 2021. Holding Company Status We are a holding company that conducts all of our operations through subsidiaries, and we rely on dividends or advances from our subsidiaries to fund the holding company. The majority of our operating income is derived from JWI, our main operating subsidiary. The ability of our subsidiaries to pay dividends to us is subject to applicable local law and may be limited due to the terms of other contractual arrangements, including our Credit Facilities and Senior Notes. The amount of our consolidated net assets that were available to be distributed under our Credit Facilities as of December 31, 2023 was $889.6 million. 52 |
Critical Accounting Policies and Estimates
The following disclosure is provided to supplement the description of our accounting policies contained in Note 1 - Description of Company and Summary of Significant Accounting Policies of our consolidated financial statements. Our MD&A is based upon our consolidated financial statements, which have been prepared in accordance with GAAP. The preparation of these consolidated financial statements requires us to make estimates and judgments that affect the reported amounts of assets, liabilities, revenues and expenses, and related disclosure of contingent assets and liabilities. On an ongoing basis, we evaluate our estimates. We base our estimates on historical experience and on various other assumptions that are believed to be reasonable under the circumstances, the results of which may differ from these estimates. Our significant accounting policies are fully disclosed in our annual consolidated financial statements included elsewhere in this Form 10-K. The following discussion highlights the estimates we believe are critical and should be read in conjunction with the consolidated financial statements included in Part II, Item 8 of this Form 10-K.
Acquisitions
We allocate the fair value of purchase consideration to the tangible assets acquired, liabilities assumed, and intangible assets acquired based on their acquisition date fair values. Goodwill as of the acquisition date is measured as the excess of consideration transferred over the net of the acquisition date fair values of the assets acquired and the liabilities assumed. If the fair value of the acquired assets exceeds the purchase price the difference is recorded as a bargain purchase in other income, (expense).net. Such valuations require us to make significant estimates and assumptions, especially with respect to intangible assets. As a result, during the measurement period, which may be up to one year from the acquisition date, material adjustments must be reflected in the comparative consolidated financial statements in the period in which the adjustment amount will beis determined. Upon the conclusion of the measurement period or final determination of the values of assets acquired or liabilities assumed, whichever comes first, any subsequent adjustments are recorded to our consolidated statements of operations. Newly acquired entities are included in our results from the date of their respective acquisitions.
Intangible Assets
Long-lived assets, other than goodwill, are reviewed for impairment whenever events or changes in circumstances indicate the carrying amount of such assetsasset groups may not be recoverable. Such events or circumstances include, but are not limited to, a significant decrease in the fair value of the underlying business or a change in utilization of property and equipment.
We group assets to test for impairment at the lowest level for which identifiable cash flows are largely independent of the cash flows of other groups of assets and liabilities. Recoverability of assets to be held and used is measured by a comparison of the carrying amount of an asset to estimated undiscounted future cash flows expected to be generated by the assets.
When evaluating long-lived assets and definite lived intangible assets for potentiala triggering event is identified, we perform an impairment the first step to review for impairment is to forecasttest by reviewing the expected undiscounted cash flows generated from the anticipated use and eventual disposition of the asset.asset group compared to the carrying value of the asset group. If the expected undiscounted cash flows are less than the carrying value of the asset group, then an impairment charge is required to reduce the carrying value of the asset to fair value. If we recognize an impairment loss, and the carrying amount of the asset is adjusted to fair value based on the discounted estimated future net cash flows and will be its new cost basis.flows. For a depreciable long-lived asset, the new cost basis will be depreciated over the remaining useful life of that asset. Forassets and an amortizable intangible asset, the new cost basis will be amortized over the remaining useful life of the asset. Our impairment loss calculations require management to apply judgments in estimating future cash flows to determine asset fair values, including forecasting useful lives of the assets and selecting the discount rate that represents the risk inherent in future cash flows.
assets.
53
Goodwill
Goodwill is tested for impairment on an annual basis during the fourth quarter and between annual tests if indicators of potential impairment exist, using a fair-value-based approach.exist. Current accounting guidance provides an entity the option to perform a qualitative assessment to determine whether it is more likely than notmore-likely-than-not that the fair value of a reporting unit is less than its carrying amount prior to performing the two-step goodwill impairment test.amount. If this is the case, the two-step goodwill impairment test is required. Ifwe do not perform a qualitative assessment, or if we determine that it is more likely than not that the fair value of a reporting is greater than its carrying amount, the two-step goodwill impairment test is not required.
Under the income approach, the fair value of a reporting unit is based on a discounted cash flow projections areanalysis of management's short-term and long-term forecast of operating performance. This analysis contains significant assumptions and estimates of our futureincluding revenue growth rates, profitexpected EBITDA margins, business plans, cost ofdiscount rates, capital expenditures, and taxterminal growth rates. Our judgments with respect to these metrics are based on historical experience, current trends, consultations with external specialists, and other information. Changes in assumptions or estimates used in our goodwill impairment testing could materially affect the determination of the fair value of a reporting unit, and therefore, could eliminate the excess of fair value over carrying valueamount of a reporting unit and, in some cases, could result in impairment. Such changes in assumptions could be caused by items such as a loss of one or more significant customers, decline in the demand for our products due to changing economic conditions, or failure to control cost increases above what can be recouped in sale price increases. These types of changes would negatively affect our profits, revenues, and growth over the long term and such a decline could significantly affect the fair value assessment of our reporting units and cause our goodwill to become impaired.
During the year ended 2022, we identified three reporting units for the purpose of conducting our goodwill impairment assessment: North America, Europe and Australasia. After the divestiture of our Australasia reporting unit in the third quarter of 2023, we identified two reporting units: North America and Europe. In determining our reporting units, we considered (i) whether an operating segment or a component of an operating segment was a business, (ii) whether discrete financial information was available, and (iii) whether the financial information is regularly reviewed by management of the operating segment.
During the quarter ended September 24, 2022, management identified various qualitative and quantitative factors which collectively indicated a triggering event had occurred within our North America and Europe reporting units. These factors included the macroeconomic environment in each region including increasing interest rates, persistent inflation, and operational inefficiencies attributable to subsequent ownersongoing global supply chain disruptions, the continuing geopolitical environment in Europe associated with the conflict between Russia in Ukraine, and are generally limited to ten years fromforeign exchange fluctuations. These factors have negatively impacted our business performance. Based upon the dateresults of manufacture or require pro-rata payments fromour interim impairment analysis, we concluded that the customer. A provision for estimated warranty costs is recorded at the timecarrying amount of sale based on historical experienceour Europe reporting unit exceeded its fair value, and we periodically adjust these provisionsrecorded a goodwill impairment charge of $54.9 million, representing a partial impairment of goodwill assigned to reflect actual experience.the Europe reporting unit. In addition, we determined that our North America reporting unit was not impaired.
We performed our annual impairment assessment during the fourth quarter of 2022 and 2021 using a quantitative analysis for each of our reporting units. No indication of goodwill impairment was identified.
Income Taxes
Income taxes are accounted for under the asset and liability method. Deferred tax assets and liabilities are recognized for the future tax consequences attributable to differences between the financial statement carrying amounts of existing assets and liabilities and their respective tax bases and operating loss and tax credit carryforwards. Deferred tax assets and liabilities are measured using enacted tax rates expected to apply to taxable income in the years in which those temporary differences are expected to be recovered or settled. The effect on the deferred tax assets and liabilities of a change in tax rates is recognized in income in the period that includes the enactment date. We evaluate both the positive and negative evidence that is relevant in assessing whether we will realize the deferred tax assets. A valuation allowance is recorded when it is more likely than not that some of the deferred tax assets will not
54
be realized. This projected realization is directly related to our future projections of the performance of our business and management’s planning initiatives at any point in time. As a result, valuation allowances are subject to change as proven business trends and planning initiatives develop.
The tax effects from an uncertain tax position can be recognized in the consolidated financial statements only if the position is more likely than not to be sustained, based on the technical merits of the position and the jurisdiction. We recognize the financial statement benefit of a tax position only after determining that the relevant tax authority would more likely than not sustain the position following an audit and the tax related to the position would be due to the entity and not the owners. For tax positions meeting the more likely than not threshold, the amount recognized in the consolidated financial statements is the largest benefit that has a greater than 50 percent likelihood of being realized, upon ultimate settlement with the relevant tax authority. We apply this accounting standard to all tax positions for which the statute of limitations remains open. Changes in recognition or measurement are reflected in the period in which the change in judgment occurs.
We file a consolidated federal income tax return in the U.S. and various states. For financial statement purposes, we calculate the provision for federal income taxes using the separate return method. Certain subsidiaries file separate tax returns in certain countries and states. Any U.S. federal, state and foreign income taxes refundable and payable are reported in other current assets and accrued income taxes payableother current liabilities in the consolidated balance sheets.sheets as of December 31, 2023 and December 31, 2022. We record interest and penalties on amounts due to tax authorities as a component of income tax expense in the consolidated statements of operations. We have elected to account for the impact of GILTI in the period in which it is incurred.
Contingent Liabilities
Contingent liabilities require significant judgment in estimating potential losses for legal and environmental claims. Each quarter, we review significant new claims and litigation for the probability of an adverse outcome. Estimates are recorded as liabilities when it is probable that a liability has been incurred and the amount of the loss is reasonably estimable. Disclosure is required when there is a reasonable possibility that the ultimate loss will materially exceed the recorded provision. Contingent liabilities are often resolved over long time periods. Estimating probable losses requires analysis of multiple forecasts that often depend on judgments about potential actions by third parties such as regulators, and the estimated loss can change materially as individual claims develop.
Share-based Compensation Plan
We have share-based compensation plans that provide for compensation to employees through various grants of share-based instruments. We apply the fair value method of accounting using the Black-Scholes option pricingoption-pricing model to determine the compensation expense for stock appreciation rights.options. The compensation expense for RSURSUs awarded is based on the fair value of the RSU at the date of grant. Compensation expense is recorded in the consolidated statements of operations and is recognized over the requisite service period. The determination of obligations and compensation expense requires the use of several mathematical and judgmental factors, including stock price, expected volatility, the anticipated life of the option, and estimated risk-free rate, and the number of shares or share options expected to vest. Any difference in the number of shares or share options that actually vest can affect future compensation expense. Other assumptions are not revised after the original estimate. For stock options granted, we prepare the valuations with the assistance of a third-party valuation firm, utilizing approaches and methodologies consistent with the AICPA Practice Aid.
The Black-Scholes option-pricing model requires the use of weighted average assumptions for estimated expected volatility, estimated expected term of stock options, risk-free rate, estimated expected dividend yield, and the fair value of the underlying common stock at the date of grant. We estimate the expected term of all stock options based on previous history of exercises. The risk-free rate is based on the U.S. Treasury yield curve in effect at the time of grant for the expected term of the stock option. The expected dividend yield rate is 0.00%0% which is consistent with the expected dividends to be paid on common stock.
For PSUs issued prior to 2021, the number of PSUs that vest is determined by a payout factor consisting of equally weighted performance measures of Adjusted EBITDA and free cash flow, each as reported over the applicable three-year performance period and is adjusted based upon a market condition measured by our relative total shareholder return (“TSR”) over the applicable three-year performance period as compared to the TSR of the Russell 3000 index. For PSUs issued in 2021 and thereafter, the number of PSUs that vest is determined by a payout factor consisting of equally weighted pre-set three-year performance targets on return on invested capital (“ROIC”) and TSR. The fair value of the award is estimated using a Monte Carlo simulation approach in a risk-neutral framework to model future stock price movements based on historical volatility, risk free rates of return, and correlation matrix.
We estimate forfeitures based on our historical analysis of actual stock option forfeitures. Actual forfeitures are recorded when incurred and estimated forfeitures are reviewed and adjusted at least annually.
55
Employee Retirement and Pension Benefits
The obligations under our defined benefit pension plans are calculated using actuarial models and methods. The most critical assumption and estimate used in the actuarial calculations is the discount rate for determining the current value of benefit obligations. Other assumptions and estimates used in determining benefit obligations and plan expenses include expected return on plan assets, inflation rates, and demographic factors such as retirement age, mortality, and turnover. These assumptions and estimates are evaluated periodically and are updated accordingly to reflect our actual experience and expectations.
The discount rate used to determine the benefit obligations was computed through a projected benefit cash flow model. This approach determines the discount rate as the rate that equates the present value of the cash flows (determined using that single rate) to the present value of the cash flows where each cash flows' present value is determined using the spot rates from the December 31, 2017 Citigroup Pension DiscountWTW RATE: Link 10:90 Yield Curve.
The discount rate utilized to calculate the projected benefit obligation at the measurement date for our U.S. pension plan decreased to 3.47%5.05% at December 31, 20172023 from 4.00%5.39% at December 31, 2016. As the discount rate is reduced or increased, the pension and post retirement obligation would increase or decrease, respectively, and future pension and post-retirement expense would increase or decrease, respectively.2022. Lowering the discount rate by 0.25% would increase the U.S. pension and post-retirement obligation at December 31, 20172023 by approximately $15.1$7.2 million and would increasedecrease estimated fiscal year 20182024 pension expense by approximately $1.3$0.1 million. Increasing the discount rate by 0.25% would decrease the U.S. pension and post-retirement obligation at December 31, 20172023 by approximately $14.3$6.9 million and would decreaseincrease estimated fiscal year 20182024 pension expense by approximately $1.4$0.3 million.
We determine the expected long-term rate of return on plan assets based on the plan assets’ historical long termlong-term investment performance, current asset allocation, and estimates of future long-term returns by asset class. Holding all other assumptions constant, a 1% increase or decrease in the assumed rate of return on plan assets would have decreaseddecrease or increased,increase, respectively, 20182024 net periodic pension expense by approximately $3.3$2.7 million.
The actuarial assumptions we use in determining our pension benefits may differ materially from actual results because of changing market and economic conditions, higher or lower withdrawal rates, or longer or shorter life spans of participants. While we believe that the assumptions used are appropriate, differences in actual experience or changes in assumptions might materially affect our financial position or results of operations.
Capital Expenditures
We expect that the majority of our capital expenditures will be focused on supporting our cost reduction and efficiency improvement projects certain growth initiatives, and to a lesser extent, on sustaining our current manufacturing operations. We are subject to health, safety, and environmental regulations that may require us to make capital expenditures to ensure our facilities are compliant with those various regulations.
Item 7A - Quantitative and Qualitative Disclosures About Market Risk
We are exposed to various types of market risks, including the effects of adverse fluctuationsrisk that our earnings, cash flows and equity could be adversely impacted by changes in foreign currency exchange rates, adverse changes in interest rates and adverse movements in commodity prices for products we use in our manufacturing. To reduce our exposure to these risks, weprices. We maintain risk management controls and policies to monitor these risks and take appropriate actionsrisk mitigation actions. We use certain derivative instruments, when available on a cost-effective basis, to attempt to mitigate such formshedge our underlying economic exposures. For additional information on our financial instruments and hedging strategies, See Note 23 – Derivative Financial Instruments of market risk.our consolidated financial statements for the year ended December 31, 2023 included elsewhere in this Form 10-K.
Exchange Rate Risk
We have global operations and therefore enter into transactions denominated in various foreign currencies. To mitigate cross-currency transaction risk, we analyze significant forecast exposures where we expect receipts or payments in a currency other than the functional currency of our operations, and from time to time we may strategically enter into short-term foreign currency forward contracts to lock in some or all of the cash flows associated with these transactions. In most of the countries in which we operate, the exposure to foreign currency movements is limited because the operating revenues and expenses of our business units are substantially denominated in the local currency. We also are subject to currency translation risk associated with converting our foreign operations’ financial statements into U.S. dollars. The exchange rates used to translate our foreign subsidiaries’ financial results for the year ended December 31, 2023 compared to the year ended December 31, 2022 reflected, on average, the U.S. dollar strengthened against the Canadian dollar 4% and weakened against the Euro by 3%, respectively. Exchange rates had a nominal impact on our consolidated net revenues and Adjusted EBITDA from continuing operations, respectively, in the year ended December 31, 2023 as compared to an adverse impact of (4%) and of (3%) on our consolidated net revenues and Adjusted EBITDA from continuing operations, respectively, in the year ended December 31, 2022.
We cannot be certain that fluctuations in foreign currency exchange rates, particularly the strengthening of the U.S. dollar against major currencies, such as the Euro, the Canadian dollar, the British pound, or the currencies of large developing countries, would not materially adversely affect our business, financial condition, and results of operations.
56
We use short-term foreign currency forward contracts and swaps to mitigate the impact of foreign exchange fluctuations on consolidated earnings. We useAs of December 31, 2023, we held foreign currency derivative contracts, with a total notional amount of $124.5$95.9 million in order to manage the effect of exchange fluctuations on forecasted sales, purchases, acquisitions, inventory and capital expenditures and certain intercompany transactions that are denominated in foreign currencies. We usehave foreign currency derivative contracts, with a total notional amount of $76.3$140.1 million, to hedgemanage the effectsrisks of translationforeign currency gains and losses on intercompany loans and interest. We also useused foreign currency derivative contracts, with a total notional amount of $121$28.9 million as of December 31, 2023, to mitigate the impact to the consolidated earnings of the Company from the effect of the
translation of certain subsidiaries’ local currency results into U.S. dollars. We do not use derivative financial instruments for trading or speculative purposes.
By using derivative financial instruments to hedge exposures to foreign currency fluctuations, we are exposed to credit risk and market risk. Credit risk is the failure of the counterparty to perform under the terms of the derivative contract. When the fair value of a derivative contract is positive, the counterparty owes us, which creates credit risk for us. When the fair value of a derivative contract is negative, we owe the counterparty and, therefore, we are not exposed to the counterparty’s credit risk in those circumstances. We attempt to minimize counterparty credit risk in derivative instruments by entering into transactions with high-quality counterparties whose credit rating is at least upper-medium investment grade. Our derivative instruments do not contain credit risk related contingent features.
Interest Rate Risk
We are subjectexposed to interest rate market risk in connection with our long-term debt, some of which is based upon floating interest rates. To manage our interest rate risk, we may enter into interest rate derivatives, such as interest rate swaps, caps, or collars when we deem it to be appropriate. We do not use derivative financial instruments for trading or other speculative purposes and are not a party to any leveraged derivative instruments. Our net exposure to interest rate risk would primarily be based on the difference between outstanding variable rate debt and the notional amount of any interest rate swaps.derivatives. We assess interest rate risk by continually identifying and monitoring changes in interest rate exposures that may adversely impact expected future cash flows and by evaluating hedging opportunities. We maintain risk management control systems to monitor interest rate risk attributable to both our outstanding or forecasted debt obligations, as well as any offsetting hedge positions. The risk management control systems involveinvolving the use of analytical techniques including cash flow sensitivity analysis, to estimatedetermine the expectedpotential impact of changes in interest ratesrate volatility on our future cash flows.interest payments.
Raw Materials Risk
Our major raw materials include wood, wood composites, wood components, steel, glass, internally produced door skins, fiberglass compound, hardware, petroleum-based products such as resin and binders, as well as aluminum and vinyl extrusions, aluminum, steel, wood, hardware, adhesives, and packaging.extrusions. Prices of these commoditiesmaterials can fluctuate significantly in response to, among other things, variable worldwide supply and demand across different industries, speculation in commodities futures, general economic or environmental conditions, labor costs, competition, import duties, tariffs, worldwide currency fluctuations, freight, regulatory costs, and product and process evolutions that impact demand for the same materials. Increasing raw material prices directly impact our cost of sales and our ability to maintain margins depends on implementing price increases in response to increasing raw material costs. The market for our products may or may not accept price increases, and as such, there is no assurance that we can maintain margins in an environment of rising commodity prices. See Item 1A- Risk Factors- Risks Relating to Our BusinessPrices and Industry- Pricesavailability of the raw materials we use to manufacture our products are subject to fluctuations and we may be unable to pass along to our customers the effects of any price increases.
Item 8 - Financial Statements and Supplementary Data
See Index to Consolidated Financial StatementStatements beginning on page F-1 of the Form 10-K.
Item 9 - Changes in and Disagreements with Accountants on Accounting and Financial Disclosure.
Disclosure
None.
Item 9A - Controls and Procedures.
Procedures
Disclosure Controls and Procedures
The Company maintains disclosure controls and procedures (as defined in Rules 13a-15(e) and 15d-15(e) under the Securities Exchange Act of 1934, as amended (the “Exchange Act”)), which are designed to ensure that information required to be disclosed by
57
the Company carried out an evaluation,in reports that it files or submits under the supervisionExchange Act, including this Report, are recorded, processed, summarized and withreported within the participation oftime periods specified in the SEC’s rules and forms. These disclosure controls and procedures include controls and procedures designed to ensure that information required to be disclosed by the Company under the Exchange Act is accumulated and communicated to the Company’s management, including its principal executive officer (“CEO”) and principal financial officer (“CFO”), as appropriate to allow timely decisions regarding required disclosure.
The Company’s management, including the Company’s Chief Executive OfficerCEO and Chief Financial Officer,CFO, conducted an evaluation of the effectiveness of the Company’s disclosure controls and procedures as defined in Exchange Act Rules 13a-15 (e)of the end of the period covered by this Report and, 15d-15(e). Based uponbased on that evaluation, the Company’s Chief Executive OfficerCEO and Chief Financial OfficerCFO concluded that the Company’s disclosure controls and procedures were ineffectiveeffective as of December 31, 2017 due to the material weaknesses described below.
2023.
Management’s Report on Internal Control Overover Financial Reporting
The Company’s management is responsible for establishing and maintaining adequate internal control over financial reporting, as such term is defined in Securities Exchange Act RuleRules 13a-15(f) and 15d-15(f).
The Company carried out an evaluation under the supervision and with the participation of the Company’s management, including the Company’s Chief Executive OfficerCEO and Chief Financial Officer,CFO, of the effectiveness of the Company’s internal control over financial reporting. The Company’s management used the framework in Internal Control-Integrated Framework (2013) issued by the Committee of Sponsoring Organizations (COSO) to perform this evaluation.
firm, as stated in their report appearing under Item 8- Financial Statements and Supplementary Data.
Changes in Internal Control Overover Financial Reporting
There were no changes in our internal controlscontrol over financial reporting (as defined in Rules 13a-15(f) and 15d-15(f) under the Exchange Act) that occurred during the Company’s most recently completed quarter ended December 31, 2023 that have materially affected, or are reasonably likely to materially affect, the Company’s internal control over financial reporting.
Item 9B - Other Information.Information
(c) During the year ended December 31, 2023, no director or officer (as defined in Rule 16a-1(f) of the Exchange Act) of the Company adopted or terminated a “Rule 10b5-1 trading arrangement” or “non-Rule 10b5-1 trading arrangement,” as each term is defined in Item 408(a) of Regulation S-K.
Not applicable.
58
PART III
Item 10 - Directors, Executive Officers and Corporate Governance
The information required by this item with respect to our executive officers appears in Part I of this Form 10-K under the heading, “Executive Officers of the Registrant”. The other information required by this item is incorporated by reference to the Company’s definitive Proxy Statement for its 2024 Annual Meeting of Stockholders to be held on April 25, 2024, which will be filed with the SEC within 120 days of the Company’s fiscal year end covered by this Form 10-K (“Proxy Statement”).
Item 11 - Executive Officers and DirectorsCompensation
The information required by this item is incorporated herein by reference to the definitive proxy statementProxy Statement, except as to information required pursuant to Item 402(v) of SEC Regulation S-K relating to the Annual Meeting of Shareholders of the Company to be held on April 26, 2018. We intend to file such definitive proxy statement with the SEC pursuant to Regulation 14A within 120 days after the end of the fiscal year covered by this Form 10-K.pay versus performance.
Item 12 - Security Ownership of Certain Beneficial Owners and Management and Related Shareholder Matters.Matters
Equity Compensation Plan Information
The following table sets forth information with respect to shares of our common stockCommon Stock that may be issued under our existing equity compensation plans, as of December 31, 2017:2023:
| (a) | (b) | (c) | ||||||||||||||||||
| Plan Category | Number of Securities to be Issued Upon Exercise of Outstanding Options, Warrants, and Rights | Weighted Average Exercise Price of Outstanding Options, Warrants, and Rights(1) | Number of Securities Remaining Available for Future Issuance Under Equity Compensation Plans (Excluding Securities Reflected in Column (a)) | |||||||||||||||||
| Equity compensation plans approved by security holders | 3,935,257(2) | $20.42 | 3,428,568(3) | |||||||||||||||||
| Equity compensation plans not approved by security holders | — | — | — | |||||||||||||||||
| Total | 3,935,257 | $20.42 | 3,428,568 | |||||||||||||||||
| (a) | (b) | (c) | |||||||
| Plan Category | Number of Securities to be Issued Upon Exercise of Outstanding Options, Warrants, and Rights(1) | Weighted Average Exercise Price of Outstanding Options, Warrants, and Rights(3) | Number of Securities Remaining Available for Future Issuance Under Equity Compensation Plans (Excluding Securities Reflected in Column (a)) | ||||||
Equity compensation plans approved by security holders(1) | 5,489,036(2) | $14.56 | 6,669,624(4) | ||||||
| Equity compensation plans not approved by security holders | — | — | — | ||||||
| Total | 5,489,036 | $14.56 | 6,669,624 | ||||||
(1)Excludes RSUs and PSUs, which have no exercise price.
(2)Consists of shares underlying 1,452,819 stock options, 2,224,642 RSUs, and 257,796 PSUs outstanding under the 2011 Stock Incentive Plan and 2017 Omnibus Equity Plan.
(3)Number of securities remaining for future issuances includes only shares available under the 2017 Omnibus Equity Plan.
The other information required by this item is incorporated herein by reference to the definitive proxy statement relating to the Annual Meeting of Shareholders of the Company to be held on April 26, 2018. We intend to file such definitive proxy statement with the SEC pursuant to Regulation 14A within 120 days after the end of the fiscal year covered by this Form 10-K.Proxy Statement.
Item 13 - Certain Relationships and Related Transactions, and Director Independence.Independence
The information required by this item is incorporated herein by reference to the definitive proxy statement relating to the Annual Meeting of Shareholders of the Company to be held on April 26, 2018. We intend to file such definitive proxy statement with the SEC pursuant to Regulation 14A within 120 days after the end of the fiscal year covered by this Form 10-K.Proxy Statement.
Item 14 - Principal Accounting Fees and Services.Services
The information required by this item is incorporated herein by reference to the definitive proxy statement relating to the Annual Meeting of Shareholders of the Company to be held on April 26, 2018. We intend to file such definitive proxy statement with the SEC pursuant to Regulation 14A within 120 days after the end of the fiscal year covered by this Form 10-K.
Proxy Statement.
59
PART IV
Item 15 - Exhibits and Financial Statement Schedules.Schedules
1. Financial Statements
The financial statements are set forth under Item 8- 8 - Financial Statements and Supplementary Data of this Form 10-K.
2. Financial Statement Schedules
All financial statementstatements and schedules are omitted sincebecause they are not applicable, not required, or are not applicable, or the required information is included in the consolidated financial statements or the notes thereto.
3. Exhibits
The exhibits listed on the accompanying Exhibit Index are filed or incorporated by reference as part of this reportForm 10-K and such Exhibit Index is incorporated herein by reference.
| Exhibit No. | Exhibit Description | Form | File No. | Exhibit | Filing Date | |||||||||||||||||||||||||||
| 3.1 | 8-K | 001-38000 | 3.1 | May 4, 2022 | ||||||||||||||||||||||||||||
| 3.2 | 8-K | 001-38000 | 3.1 | February 9, 2024 | ||||||||||||||||||||||||||||
| 4.1 | 10-K | 001-38000 | 4.1 | February 22, 2022 | ||||||||||||||||||||||||||||
| 4.2 | 8-K | 001-38000 | 4.1 | December 14, 2017 | ||||||||||||||||||||||||||||
| 4.3 | 8-K | 001-38000 | 4.1 | December 27, 2018 | ||||||||||||||||||||||||||||
| 4.4 | 10-Q | 001-38000 | 4.2 | November 3, 2020 | ||||||||||||||||||||||||||||
| 4.5 | 10-K | 001-38000 | 4.9 | February 23, 2021 | ||||||||||||||||||||||||||||
| 4.6 | 8-K | 001-38000 | 4.1 | May 5, 2020 | ||||||||||||||||||||||||||||
| 4.7 | 10-Q | 001-38000 | 4.1 | November 3, 2020 | ||||||||||||||||||||||||||||
| 4.8 | 10-K | 001-38000 | 4.12 | February 23, 2021 | ||||||||||||||||||||||||||||
| 4.9 | 8-K | 001-38000 | 4.2 | May 5, 2020 | ||||||||||||||||||||||||||||
| 4.10 | 10-Q | 001-38000 | 4.3 | November 3, 2020 | ||||||||||||||||||||||||||||
| 4.11 | 10-Q | 001-38000 | 4.4 | November 3, 2020 | ||||||||||||||||||||||||||||
60
| Exhibit No. | Exhibit Description | Form | File No. | Exhibit | Filing Date | ||
| 3.1 | 8-K | 001-38000 | 3.1 | February 3, 2017 | |||
| 3.2 | S-1/A | 333-211761 | 3.4 | January 5, 2017 | |||
| 4.1 | S-1/A | 333-211761 | 4.1 | January 5, 2017 | |||
| 4.2 | 10-K | 001-38000 | 4.2 | March 3, 2017 | |||
| 4.3 | S-1 | 333-221538 | 4.3 | May 15, 2017 | |||
| 4.4 | S-1 | 333-221538 | 4.4 | November 13, 2017 | |||
| 10.1 | S-1 | 333-211761 | 10.1 | June 1, 2016 | |||
| 10.2 | S-1 | 333-211761 | 10.1.1 | June 1, 2016 | |||
| 10.3 | S-1/A | 333-211761 | 10.1.2 | November 17, 2016 | |||
| 10.4 | 8-K | 001-38000 | 10.1 | December 15, 2017 | |||
| 10.5 | S-1 | 333-211761 | 10.2 | June 1, 2016 | |||
| 10.6 | S-1 | 333-211761 | 10.2.1 | June 1, 2016 | |||
| Exhibit No. | Exhibit Description | Form | File No. | Exhibit | Filing Date | |||||||||||||||||||||||||||
| 10.1 | S-1 | 333-211761 | 10.1 | June 1, 2016 | ||||||||||||||||||||||||||||
| 10.2 | S-1 | 333-211761 | 10.1.1 | June 1, 2016 | ||||||||||||||||||||||||||||
| 10.3 | S-1/A | 333-211761 | 10.1.2 | November 17, 2016 | ||||||||||||||||||||||||||||
| 10.4 | 8-K | 001-38000 | 10.1 | December 15, 2017 | ||||||||||||||||||||||||||||
| 10.5 | 8-K | 001-38000 | 10.1 | December 27, 2018 | ||||||||||||||||||||||||||||
| 10.6 | 8-K | 001-38000 | 10.1 | January 6, 2020 | ||||||||||||||||||||||||||||
| 10.7 | 10-Q | 001-38000 | 10.2 | August 2, 2021 | ||||||||||||||||||||||||||||
| 10.8 | 8-K | 001-38000 | 10.1 | June 16, 2023 | ||||||||||||||||||||||||||||
| 10.9 | S-1 | 333-211761 | 10.2 | June 1, 2016 | ||||||||||||||||||||||||||||
| 10.10 | S-1 | 333-211761 | 10.2.1 | June 1, 2016 | ||||||||||||||||||||||||||||
| 10.11 | S-1/A | 333-211761 | 10.2.2 | November 17, 2016 | ||||||||||||||||||||||||||||
| 10.12 | 8-K | 001-38000 | 10.1 | March 8, 2017 | ||||||||||||||||||||||||||||
| 10.13 | 8-K | 001-38000 | 10.2 | December 15, 2017 | ||||||||||||||||||||||||||||
| 10.14 | 8-K | 001-38000 | 10.1 | September 20, 2019 | ||||||||||||||||||||||||||||
| 10.15 | 10-Q | 001-38000 | 10.3 | August 2, 2021 | ||||||||||||||||||||||||||||
| 10.16 | 8-K | 001-38000 | 10.2 | June 16, 2023 | ||||||||||||||||||||||||||||
61
| Exhibit No. | Exhibit Description | Form | File No. | Exhibit | Filing Date | ||
| 10.7 | S-1/A | 333-211761 | 10.2.2 | November 17, 2016 | |||
| 10.8 | 8-K | 001-38000 | 10.1 | March 8, 2017 | |||
| 10.9 | 8-K | 001-38000 | 10.2 | December 15, 2017 | |||
| 10.10 | S-1/A | 333-211761 | 10.3 | December 16, 2016 | |||
| 10.11 | S-1/A | 333-211761 | 10.3.1 | December 16, 2016 | |||
| 10.12 | S-1/A | 333-211761 | 10.3.2 | December 16, 2016 | |||
| 10.13 | S-1/A | 333-211761 | 10.3.3 | December 16, 2016 | |||
| 10.14 | S-1/A | 333-211761 | 10.4 | December 16, 2016 | |||
| 10.15 | S-1/A | 333-211761 | 10.4.1 | December 16, 2016 | |||
| 10.16 | S-1/A | 333-211761 | 10.4.2 | December 16, 2016 | |||
| 10.17+ | S-1/A | 333-211761 | 10.6 | December 16, 2016 | |||
| 10.18+ | 10-Q | 001-38000 | 10.14 | May 12, 2017 | |||
| 10.19+ | S-1/A | 333-211761 | 10.7 | December 16, 2016 | |||
| 10.20+ | S-1/A | 333-211761 | 10.8 | December 16, 2016 | |||
| 10.21+ | S-1/A | 333-211761 | 10.9 | December 16, 2016 | |||
| 10.22+ | S-1/A | 333-211761 | 10.11 | January 5, 2017 | |||
| 10.23+ | S-1/A | 333-211761 | 10.12 | January 5, 2017 | |||
| 10.24+ | S-1/A | 333-211761 | 10.12.1 | January 5, 2017 | |||
| 10.25+ | S-1/A | 333-211761 | 10.13 | January 5, 2017 | |||
| 10.26+ | S-1/A | 333-211761 | 10.14 | January 5, 2017 | |||
| 10.27+ | S-1/A | 333-211761 | 10.15 | January 5, 2017 | |||
| 10.28+ | 10-Q | 001-38000 | 10.1 | August 8, 2017 | |||
| 10.29+ | 10-Q | 001-38000 | 10.2 | August 8, 2017 | |||
| Exhibit No. | Exhibit Description | Form | File No. | Exhibit | Filing Date | |||||||||||||||||||||||||||
| 10.17 | 8-K | 001-38000 | 10.1 | January 19, 2024 | ||||||||||||||||||||||||||||
| 10.18 | 8-K | 001-38000 | 2.1 | April 18, 2023 | ||||||||||||||||||||||||||||
| 10.19+ | 10-Q | 001-38000 | 10.14 | May 12, 2017 | ||||||||||||||||||||||||||||
| 10.20+ | S-1/A | 333-211761 | 10.7 | December 16, 2016 | ||||||||||||||||||||||||||||
| 10.21+ | S-1/A | 333-211761 | 10.8 | December 16, 2016 | ||||||||||||||||||||||||||||
| 10.22+ | 10-K | 001-38000 | 10.18 | February 22, 2022 | ||||||||||||||||||||||||||||
| 10.23+ | 10-Q | 001-38000 | 10.2 | April 30, 2021 | ||||||||||||||||||||||||||||
| 10.24+ | 10-K | 001-38000 | 10.20 | February 22, 2022 | ||||||||||||||||||||||||||||
| 10.25+ | 10-K | 001-38000 | 10.21 | February 22, 2022 | ||||||||||||||||||||||||||||
| 10.26*+ | ||||||||||||||||||||||||||||||||
| 10.27*+ | ||||||||||||||||||||||||||||||||
| 10.28*+ | ||||||||||||||||||||||||||||||||
| 10.29*+ | ||||||||||||||||||||||||||||||||
| 10.30+ | S-1 | 333-211761 | 10.25 | June 1, 2016 | ||||||||||||||||||||||||||||
| 10.31+ | 10-Q | 001-38000 | 10.1 | September 24, 2022 | ||||||||||||||||||||||||||||
| 10.32+ | 10-Q | 001-38000 | 10.2 | September 24, 2022 | ||||||||||||||||||||||||||||
| 10.33+ | 10-Q | 001-38000 | 10.1 | August 5, 2020 | ||||||||||||||||||||||||||||
| 10.34 | 8-K | 001-38000 | 10.1 | February 18, 2022 | ||||||||||||||||||||||||||||
| 19.1* | ||||||||||||||||||||||||||||||||
| 21.1* | ||||||||||||||||||||||||||||||||
| 22.1 | 10-K | 001-38000 | 22.1 | February 22, 2022 | ||||||||||||||||||||||||||||
| 23.1* | ||||||||||||||||||||||||||||||||
| 24.1* | ||||||||||||||||||||||||||||||||
| 31.1* | ||||||||||||||||||||||||||||||||
| 31.2* | ||||||||||||||||||||||||||||||||
| 32.1* | ||||||||||||||||||||||||||||||||
| 97.1* | ||||||||||||||||||||||||||||||||
| 101.INS* | Inline XBRL Instance Document. | |||||||||||||||||||||||||||||||
| 101.SCH* | Inline XBRL Taxonomy Extension Schema Document. | |||||||||||||||||||||||||||||||
| 101.CAL* | Inline XBRL Taxonomy Extension Calculation Linkbase Document. | |||||||||||||||||||||||||||||||
| 101.DEF* | Inline XBRL Taxonomy Extension Definition Linkbase Document. | |||||||||||||||||||||||||||||||
| 101.LAB* | Inline XBRL Taxonomy Extension Label Linkbase Document. | |||||||||||||||||||||||||||||||
| 101.PRE* | Inline XBRL Taxonomy Extension Presentation Linkbase Document. | |||||||||||||||||||||||||||||||
| 104 | Cover Page Interactive Data File (formatted in Inline XBRL and contained in Exhibit 101). | |||||||||||||||||||||||||||||||
62
| Exhibit No. | Exhibit Description | Form | File No. | Exhibit | Filing Date | ||
| 10.30+ | S-1/A | 333-211761 | 10.15.1 | January 5, 2017 | |||
| 10.31+ | S-1/A | 333-211761 | 10.16 | January 5, 2017 | |||
| 10.32+ | S-1/A | 333-211761 | 10.17 | January 5, 2017 | |||
| 10.33+ | S-1/A | 333-211761 | 10.18 | January 5, 2017 | |||
| 10.34+ | S-1/A | 333-211761 | 10.19 | January 5, 2017 | |||
| 10.35+ | S-1/A | 333-211761 | 10.20 | January 5, 2017 | |||
| 10.36*+ | |||||||
| 10.37*+ | |||||||
| 10.38*+ | |||||||
| 10.39*+ | |||||||
| 10.40 | S-1 | 333-211761 | 10.25 | June 1, 2016 | |||
| 21.1 | S-1/A | 333-211761 | 21.1 | January 17, 2017 | |||
| 23.1* | |||||||
| 24.1* | |||||||
| 31.1* | |||||||
| 31.2* | |||||||
| 32.1* | |||||||
| 101.INS* | XBRL Instance Document. | ||||||
| 101.SCH* | XBRL Taxonomy Extension Schema Document. | ||||||
| 101.CAL* | XBRL Taxonomy Extension Calculation Linkbase Document. | ||||||
| 101.DEF* | XBRL Taxonomy Extension Definition Linkbase Document. | ||||||
| 101.LAB* | XBRL Taxonomy Extension Label Linkbase Document. | ||||||
| 101.PRE* | XBRL Taxonomy Extension Presentation Linkbase Document. | ||||||
| * | Filed herewith. | ||||||
| + | Indicates management contract or compensatory plan. | ||||||
| Exhibit No. | Exhibit Description | Form | File No. | Exhibit | Filing Date | |||||||||||||||||||||||||||
| * | Filed herewith. | |||||||||||||||||||||||||||||||
| + | Indicates management contract or compensatory plan. | |||||||||||||||||||||||||||||||
Item 16 - Form 10-K Summary.Summary
None.
63
SIGNATURES
Pursuant to the requirements of Section 13 or 15(d) of the Securities Exchange Act of 1934, the registrant has duly caused this reportForm 10-K to be signed on its behalf by the undersigned, thereunto duly authorized.
| JELD-WEN HOLDING, INC. | ||||||
| (Registrant) | ||||||
| By: | /s/ Julie Albrecht | |||||
| Executive Vice President and Chief Financial Officer | ||||||
Date: March 6, 2018February 20, 2024
POWER OF ATTORNEY
KNOW ALL PERSONS BY THESE PRESENTS, that each person whose signature appears below constitutes and appoints L. Brooks MallardJulie Albrecht and Laura W. Doerre,James Hayes, jointly and severally, his or her attorney-in-fact, with the power of substitution, for him or her in any and all capacities, to sign any amendments to this Annual Report on Form 10-K and to file the same, with exhibits thereto and other documents in connection therewith, with the Securities and Exchange Commission, hereby ratifying and confirming all that each of said attorneys-in-fact, or his or her substitute or substitutes, may do or cause to be done by virtue hereof.
Pursuant to the requirements of the Securities and Exchange Act of 1934, this reportAnnual Report on Form 10-K has been signed below by the following persons on behalf of the registrant and in the capacities and on the dates indicated.
| Signature | Title | Date | |||||||||||||||
| /s/ William Christensen | Chief Executive Officer and Director (Principal Executive Officer) | February 20, 2024 | |||||||||||||||
| William J. Christensen | |||||||||||||||||
| /s/ Julie Albrecht | Chief Financial Officer (Principal Financial Officer) | February 20, 2024 | |||||||||||||||
| Julie Albrecht | |||||||||||||||||
| /s/ Michael Leon | Chief Accounting Officer (Principal Accounting Officer) | February 20, 2024 | |||||||||||||||
| Michael Leon | |||||||||||||||||
| /s/ David Nord | Chair | February 20, 2024 | |||||||||||||||
| David Nord | |||||||||||||||||
| /s/ Catherine A. Halligan | Director | February 20, 2024 | |||||||||||||||
| Catherine Halligan | |||||||||||||||||
| /s/ Michael F. Hilton | Director | February 20, 2024 | |||||||||||||||
| Michael F. Hilton | |||||||||||||||||
| /s/ Tracey I. Joubert | Director | February 20, 2024 | |||||||||||||||
| Tracey I. Joubert | |||||||||||||||||
| /s/ Cynthia Marshall | Director | February 20, 2024 | |||||||||||||||
| Cynthia Marshall | |||||||||||||||||
| /s/ Suzanne Stefany | Director | February 20, 2024 | |||||||||||||||
| Suzanne Stefany | |||||||||||||||||
64
| Signature | Title | Date | |||||||||||||||||
| /s/ Bruce Taten | Director | February 20, 2024 | |||||||||||||||||
| /s/ Roderick C. Wendt | Director | ||||||||||||||||||
| Roderick C. Wendt | |||||||||||||||||||
| /s/ Steven E. Wynne | Director | ||||||||||||||||
| Steven E. Wynne | |||||||||||||||||
65
Index to Consolidated Financial Statements
| Report of Independent Registered Public Accounting Firm (PCAOB ID No. 238) | F- | |||||||
| Consolidated Statements of Operations for the Years Ended December 31, | F- | |||||||
| Consolidated Statements of Comprehensive Income (Loss) for the Years Ended December 31, | F- | |||||||
| Consolidated Balance Sheets as of December 31, | F- | |||||||
| Consolidated Statements of Equity for the Years Ended December 31, | F- | |||||||
| Consolidated Statements of Cash Flows for the Years Ended December 31, | F- | |||||||
| Notes to Consolidated Financial Statements | F- | |||||||
| Note 1. Description of Company and Summary of Significant Accounting Policies | F-10 | |||||||
| Note 2. Discontinued Operations | F-17 | |||||||
| Note 3. Accounts Receivable | F-19 | |||||||
| Note 4. Inventories | F-19 | |||||||
| Note 5. Property and Equipment, Net | F-20 | |||||||
| Note 6. Goodwill | F-20 | |||||||
| Note 7. Intangible Assets, Net | F-21 | |||||||
| Note 8. Leases | F-22 | |||||||
| Note 9. Accrued Payroll and Benefits | F-23 | |||||||
| Note 10. Accrued Expenses and Other Current Liabilities | F-23 | |||||||
| Note 11. Warranty Liability | F-24 | |||||||
| Note 12. Long-Term Debt | F-25 | |||||||
| Note 13. Deferred Credits and Other Liabilities | F-27 | |||||||
| Note 14. Segment Information | F-27 | |||||||
| Note 15. Income Taxes | F-31 | |||||||
| Note 16. Capital Stock | F-35 | |||||||
| Note 17. Earnings Per Share | F-36 | |||||||
| Note 18. Stock Compensation | F-37 | |||||||
| Note 19. Restructuring and Asset Related Charges | F-39 | |||||||
| Note 20. Held for Sale | F-40 | |||||||
| Note 21. Interest Expense, Net | F-41 | |||||||
| Note 22. Other Income, Net | F-41 | |||||||
| Note 23. Derivative Financial Instruments | F-41 | |||||||
| Note 24. Fair Value of Financial Instruments | F-43 | |||||||
| Note 25. Commitments and Contingencies | F-44 | |||||||
| Note 26. Employee Retirement and Pension Benefits | F-49 | |||||||
| Note 27. Supplemental Cash Flow Information | F-53 | |||||||
| Note 28. Summarized Quarterly Financial Information (Unaudited) | F-54 | |||||||
F-1
Report of Independent Registered Public Accounting Firm
To theBoard of Directors and Shareholders of JELD-WEN Holding, Inc.:
We have audited the accompanying consolidatedbalance sheets of JELD-WEN Holding, Inc.and its subsidiaries (the “Company”) as of December 31, 20172023 and 2016,2022, and the related consolidatedstatements of operations, of comprehensive income (loss), of equity and cash flowsfor each of the three years in the period ended December 31, 2017, including the related notes and financial statement schedule listed in the accompanying index(collectively referred to as the “consolidatedfinancial statements”). In our opinion, the consolidated financial statements present fairly, in all material respects, the financial position of the Companyas ofDecember 31, 2017 and 2016, and the results of their operations and their cash flows for each of the three years in the period ended December 31, 2017,2023, including the related notes (collectively referred to as the “consolidated financial statements”). We also have audited the Company's internal control over financial reporting as of December 31, 2023, based on criteria established in Internal Control - Integrated Framework (2013) issued by the Committee of Sponsoring Organizations of the Treadway Commission (COSO).
In our opinion, the consolidated financial statements referred to above present fairly, in all material respects, the financial position of the Company as of December 31, 2023 and 2022, and the results of its operations and its cash flows for each of the three years in the period ended December 31, 2023 in conformity with accounting principles generally accepted in the United States of America. Also in our opinion, the Company maintained, in all material respects, effective internal control over financial reporting as of December 31, 2023, based on criteria established in Internal Control - Integrated Framework (2013) issued by the COSO.
Basis for OpinionOpinions
We conducted our audits of these consolidatedfinancial statements in accordance with the standards of the PCAOB. Those standards require that we plan and perform the auditaudits to obtain reasonable assurance about whether the consolidated financial statements are free of material misstatement, whether due to error or fraud. The Company is not required to have, nor were we engaged to perform, an audit of its internal control over financial reporting. As part of our audits we are required to obtain an understanding offraud, and whether effective internal control over financial reporting but not for the purpose of expressing an opinion on the effectivenesswas maintained in all material respects.
Our audits of the Company's internal control overconsolidated financial reporting. Accordingly, we express no such opinion.
Definition and Limitations of Internal Control over Financial Reporting
A company’s internal control over financial reporting is a process designed to provide reasonable assurance regarding the reliability of financial reporting and the preparation of financial statements for external purposes in accordance with generally accepted accounting principles. A company’s internal control over financial reporting includes those policies and procedures that (i) pertain to the maintenance of records that, in reasonable detail, accurately and fairly reflect the transactions and dispositions of the assets of the company; (ii) provide reasonable assurance that transactions are recorded as necessary to permit preparation of financial statements in accordance with generally accepted accounting principles, and that receipts and expenditures of the company are being made only in accordance with authorizations of management and directors of the company; and (iii) provide reasonable assurance regarding prevention or timely detection of unauthorized acquisition, use, or disposition of the company’s assets that could have a material effect on the financial statements.
Because of its inherent limitations, internal control over financial reporting may not prevent or detect misstatements. Also, projections of any evaluation of effectiveness to future periods are subject to the risk that controls may become inadequate because of changes in conditions, or that the degree of compliance with the policies or procedures may deteriorate.
F-2
Critical Audit Matters
The critical audit matter communicated below is a matter arising from the current period audit of the consolidated financial statements that was communicated or required to be communicated to the audit committee and that (i) relates to accounts or disclosures that are material to the consolidated financial statements and (ii) involved our especially challenging, subjective, or complex judgments. The communication of critical audit matters does not alter in any way our opinion on the consolidated financial statements, taken as a whole, and we are not, by communicating the critical audit matter below, providing a separate opinion on the critical audit matter or on the accounts or disclosures to which it relates.
Goodwill Impairment Assessment – Europe Reporting Unit
As described in Notes 1 and 6 to the consolidated financial statements, the Company’s consolidated goodwill balance was $390.2 million as of December 31, 2023, and the goodwill associated with the Europe reporting unit was $207.8 million. Management tests goodwill for impairment on an annual basis during the fourth quarter and between annual tests if indicators of potential impairment exist. Management estimates the fair value of reporting units using the income and market approaches. Under the income approach, the fair value of a reporting unit is based on discounted cash flow analysis that contains significant assumptions and estimates including revenue growth rates, expected EBITDA margins, discount rates, capital expenditures, and terminal growth rates.
The principal considerations for our determination that performing procedures relating to the goodwill impairment assessment for the Europe reporting unit is a critical audit matter are (i) the significant judgment by management when developing the fair value estimate of the reporting unit; (ii) a high degree of auditor judgment, subjectivity, and effort in performing procedures and evaluating management’s significant assumptions related to revenue growth rates, expected EBITDA margins, the discount rate, capital expenditures, and the terminal growth rate; and (iii) the audit effort involved the use of professionals with specialized skill and knowledge.
Addressing the matter involved performing procedures and evaluating audit evidence in connection with forming our overall opinion on the consolidated financial statements. These procedures included testing the effectiveness of controls relating to management’s annual goodwill impairment assessment, including controls over the valuation of the Europe reporting unit. These procedures included, among others (i) testing management’s process for developing the fair value estimate of the Europe reporting unit; (ii) evaluating the appropriateness of the discounted cash flow analysis used by management; (iii) testing the completeness and accuracy of underlying data used in the discounted cash flow analysis; and (iv) evaluating the reasonableness of the significant assumptions used by management related to revenue growth rates, expected EBITDA margins, the discount rate, capital expenditures, and the terminal growth rate. Evaluating management’s assumptions related to revenue growth rates, expected EBITDA margins, and capital expenditures involved evaluating whether the assumptions used by management were reasonable considering (i) the current and past performance of the reporting unit; (ii) the consistency with external market and industry data; and (iii) whether these assumptions were consistent with evidence obtained in other areas of the audit. Professionals with specialized skill and knowledge were used to assist in evaluating (i) the appropriateness of the discounted cash flow analysis and (ii) the reasonableness of the discount rate and terminal growth rate assumptions.
/s/ PricewaterhouseCoopers LLP
Charlotte, North Carolina
We have served as the Company’s auditor since 2000.
F-3
Item 1 - Financial Statements
JELD-WEN HOLDING, INC.
CONSOLIDATED STATEMENTS OF OPERATIONS
| For the Years Ended December 31, | |||||||||||||||||||||||||||||
| (amounts in thousands, except share and per share data) | 2023 | 2022 | 2021 | ||||||||||||||||||||||||||
| Net revenues | $ | 4,304,334 | $ | 4,543,808 | $ | 4,181,690 | |||||||||||||||||||||||
| Cost of sales | 3,471,713 | 3,757,888 | 3,358,773 | ||||||||||||||||||||||||||
| Gross margin | 832,621 | 785,920 | 822,917 | ||||||||||||||||||||||||||
| Selling, general and administrative | 655,280 | 654,077 | 604,514 | ||||||||||||||||||||||||||
| — | 54,885 | — | |||||||||||||||||||||||||||
| 35,741 | 17,622 | 2,556 | |||||||||||||||||||||||||||
| Operating income | 141,600 | 59,336 | 215,847 | ||||||||||||||||||||||||||
| 72,258 | 82,505 | 76,788 | |||||||||||||||||||||||||||
| 6,487 | — | 1,342 | |||||||||||||||||||||||||||
| (25,719) | (53,433) | (13,241) | |||||||||||||||||||||||||||
| Income from continuing operations before taxes | 88,574 | 30,264 | 150,958 | ||||||||||||||||||||||||||
| 63,339 | 18,041 | 19,636 | |||||||||||||||||||||||||||
| Income from continuing operations, net of tax | 25,235 | 12,223 | 131,322 | ||||||||||||||||||||||||||
| 15,699 | — | — | |||||||||||||||||||||||||||
| 21,511 | 33,504 | 37,500 | |||||||||||||||||||||||||||
| Net income | $ | 62,445 | $ | 45,727 | $ | 168,822 | |||||||||||||||||||||||
| Basic | 84,995,515 | 86,374,499 | 96,563,155 | ||||||||||||||||||||||||||
| Diluted | 85,874,035 | 87,075,176 | 98,371,142 | ||||||||||||||||||||||||||
| Net income per share from continuing operations | |||||||||||||||||||||||||||||
| Basic | $ | 0.30 | $ | 0.14 | $ | 1.36 | |||||||||||||||||||||||
| Diluted | $ | 0.29 | $ | 0.14 | $ | 1.33 | |||||||||||||||||||||||
| Net income per share from discontinued operations | |||||||||||||||||||||||||||||
| Basic | $ | 0.44 | $ | 0.39 | $ | 0.39 | |||||||||||||||||||||||
| Diluted | $ | 0.43 | $ | 0.38 | $ | 0.38 | |||||||||||||||||||||||
| Net income per share | |||||||||||||||||||||||||||||
| Basic | $ | 0.73 | $ | 0.53 | $ | 1.75 | |||||||||||||||||||||||
| Diluted | $ | 0.73 | $ | 0.53 | $ | 1.72 | |||||||||||||||||||||||
| For the Years Ended December 31, | ||||||||||||
| (amounts in thousands, except share and per share data) | 2017 | 2016 | 2015 | |||||||||
| Net revenues | $ | 3,763,934 | $ | 3,666,799 | $ | 3,381,060 | ||||||
| Cost of sales | 2,915,736 | 2,892,248 | 2,721,341 | |||||||||
| Gross margin | 848,198 | 774,551 | 659,719 | |||||||||
| Selling, general and administrative | 585,074 | 565,619 | 505,910 | |||||||||
| Impairment and restructuring charges | 13,056 | 13,847 | 21,342 | |||||||||
| Operating income | 250,068 | 195,085 | 132,467 | |||||||||
| Interest expense, net | 79,034 | 77,590 | 60,632 | |||||||||
| Loss on debt extinguishment | 23,262 | — | — | |||||||||
| Other expense (income) | 2,017 | (12,825 | ) | (14,120 | ) | |||||||
| Income before taxes, equity earnings and discontinued operations | 145,755 | 130,320 | 85,955 | |||||||||
| Income tax expense (benefit) | 138,603 | (246,394 | ) | (5,435 | ) | |||||||
| Income from continuing operations, net of tax | 7,152 | 376,714 | 91,390 | |||||||||
| Equity earnings of non-consolidated entities | 3,639 | 3,791 | 2,384 | |||||||||
| Loss from discontinued operations, net of tax | — | (3,324 | ) | (2,856 | ) | |||||||
| Net income | $ | 10,791 | $ | 377,181 | $ | 90,918 | ||||||
| Convertible preferred stock dividends | 10,462 | 396,647 | 381,418 | |||||||||
| Net income (loss) attributable to common shareholders | $ | 329 | $ | (19,466 | ) | $ | (290,500 | ) | ||||
| Weighted average common shares outstanding | ||||||||||||
| Basic | 97,460,676 | 17,992,879 | 18,296,003 | |||||||||
| Diluted | 101,462,135 | 17,992,879 | 18,296,003 | |||||||||
| Basic and diluted income (loss) per share from continuing operations | $ | 0.00 | $ | (0.90 | ) | $ | (15.72 | ) | ||||
| Basic and diluted income (loss) per share from discontinued operations | $ | 0.00 | $ | (0.18 | ) | $ | (0.16 | ) | ||||
| Basic and diluted net income (loss) per share | $ | 0.00 | $ | (1.08 | ) | $ | (15.88 | ) | ||||
Net income per share may not sum due to rounding.
The accompanying notes are an integral part of these Consolidated Financial Statements.
F-4
JELD-WEN HOLDING, INC.
CONSOLIDATED STATEMENTS OF COMPREHENSIVE INCOME (LOSS)
| For the Years Ended December 31, | |||||||||||||||||||||||||||||
| (amounts in thousands) | 2023 | 2022 | 2021 | ||||||||||||||||||||||||||
| Net income | $ | 62,445 | $ | 45,727 | $ | 168,822 | |||||||||||||||||||||||
| Other comprehensive income (loss), net of tax: | |||||||||||||||||||||||||||||
| Foreign currency translation adjustments, net of tax expense (benefit) of $2,301, $1,502, and $(4,096), respectively | 45,859 | (71,811) | (77,904) | ||||||||||||||||||||||||||
| Interest rate hedge adjustments, net of tax (benefit) expense of $(4,076), $3,268, and $1,302, respectively | (12,159) | 9,668 | 3,850 | ||||||||||||||||||||||||||
| Defined benefit pension plans, net of tax expense of $3,287, $4,104, and $13,226, respectively | 13,624 | 13,255 | 39,001 | ||||||||||||||||||||||||||
| Total other comprehensive income (loss), net of tax | 47,324 | (48,888) | (35,053) | ||||||||||||||||||||||||||
| Comprehensive income (loss) | $ | 109,769 | $ | (3,161) | $ | 133,769 | |||||||||||||||||||||||
| For the Years Ended December 31, | ||||||||||||
| (amounts in thousands) | 2017 | 2016 | 2015 | |||||||||
| Net income | $ | 10,791 | $ | 377,181 | $ | 90,918 | ||||||
| Other comprehensive income (loss), net of tax: | ||||||||||||
| Foreign currency translation adjustments, net of tax of $0 | 87,934 | (32,383 | ) | (78,636 | ) | |||||||
| Interest rate hedge adjustments, net of tax expense of $5,001, $0, and $0, respectively | 4,486 | (2,679 | ) | (11,200 | ) | |||||||
| Defined benefit pension plans, net of tax expense (benefit) of $5,357, ($419), and $189, respectively | 9,415 | 868 | 30,700 | |||||||||
| Total other comprehensive income, net of tax | 101,835 | (34,194 | ) | (59,136 | ) | |||||||
| Comprehensive income | $ | 112,626 | $ | 342,987 | $ | 31,782 | ||||||
The accompanying notes are an integral part of these Consolidated Financial Statements.
F-5
JELD-WEN HOLDING, INC.
CONSOLIDATED BALANCE SHEETS
| (amounts in thousands, except share and per share data) | December 31, 2023 | December 31, 2022 | |||||||||
| ASSETS | |||||||||||
| Current assets | |||||||||||
| Cash and cash equivalents | $ | 288,312 | $ | 164,475 | |||||||
| Restricted cash | 835 | 1,463 | |||||||||
| 516,674 | 531,232 | ||||||||||
| 481,451 | 594,471 | ||||||||||
| Other current assets | 71,507 | 73,485 | |||||||||
| 135,563 | 125,748 | ||||||||||
| — | 204,732 | ||||||||||
| Total current assets | 1,494,342 | 1,695,606 | |||||||||
| 644,242 | 642,004 | ||||||||||
| 150,453 | 182,161 | ||||||||||
| 390,170 | 381,953 | ||||||||||
| 123,910 | 148,106 | ||||||||||
| 146,931 | 128,993 | ||||||||||
| Other assets | 30,077 | 25,778 | |||||||||
| — | 296,760 | ||||||||||
| Total assets | $ | 2,980,125 | $ | 3,501,361 | |||||||
| LIABILITIES AND EQUITY | |||||||||||
| Current liabilities | |||||||||||
| Accounts payable | $ | 269,322 | $ | 286,978 | |||||||
| 132,550 | 107,002 | ||||||||||
| 233,796 | 247,901 | ||||||||||
| 36,177 | 34,093 | ||||||||||
| 7,064 | 6,040 | ||||||||||
| — | 104,612 | ||||||||||
| Total current liabilities | 678,909 | 786,626 | |||||||||
| 1,190,075 | 1,712,790 | ||||||||||
| 26,502 | 31,109 | ||||||||||
| 121,993 | 105,068 | ||||||||||
| 104,831 | 95,936 | ||||||||||
| 7,170 | 7,862 | ||||||||||
| — | 38,422 | ||||||||||
| Total liabilities | 2,129,480 | 2,777,813 | |||||||||
| Shareholders’ equity | |||||||||||
| Preferred Stock, par value $0.01 per share, 90,000,000 shares authorized; no shares issued and outstanding | — | — | |||||||||
| Common Stock: 900,000,000 shares authorized, par value $0.01 per share, 85,309,220 and 84,347,712 shares issued and outstanding as of December 31, 2023 and December 31, 2022, respectively. | 853 | 843 | |||||||||
| Additional paid-in capital | 752,171 | 734,853 | |||||||||
| Retained earnings | 192,931 | 130,486 | |||||||||
| Accumulated other comprehensive loss | (95,310) | (142,634) | |||||||||
| Total shareholders’ equity | 850,645 | 723,548 | |||||||||
| Total liabilities and shareholders’ equity | $ | 2,980,125 | $ | 3,501,361 | |||||||
| (amounts in thousands, except share and per share data) | December 31, 2017 | December 31, 2016 | ||||||
| ASSETS | ||||||||
| Current assets | ||||||||
| Cash and cash equivalents | $ | 220,175 | $ | 102,701 | ||||
| Restricted cash | 36,059 | 751 | ||||||
| Accounts receivable, net | 453,251 | 407,170 | ||||||
| Inventories | 405,353 | 334,634 | ||||||
| Other current assets | 30,403 | 32,248 | ||||||
| Total current assets | 1,145,241 | 877,504 | ||||||
| Property and equipment, net | 756,711 | 704,651 | ||||||
| Deferred tax assets | 183,726 | 287,699 | ||||||
| Goodwill | 549,063 | 486,920 | ||||||
| Intangible assets, net | 166,313 | 115,725 | ||||||
| Other assets | 61,886 | 63,547 | ||||||
| Total assets | $ | 2,862,940 | $ | 2,536,046 | ||||
| LIABILITIES AND EQUITY | ||||||||
| Current liabilities | ||||||||
| Accounts payable | $ | 259,934 | $ | 188,906 | ||||
| Accrued payroll and benefits | 122,212 | 130,668 | ||||||
| Accrued expenses and other current liabilities | 186,605 | 173,601 | ||||||
| Notes payable and current maturities of long-term debt | 8,770 | 20,031 | ||||||
| Total current liabilities | 577,521 | 513,206 | ||||||
| Long-term debt | 1,264,933 | 1,600,004 | ||||||
| Unfunded pension liability | 116,586 | 126,646 | ||||||
| Deferred credits and other liabilities | 102,614 | 74,455 | ||||||
| Deferred tax liabilities | 9,249 | 9,186 | ||||||
| Total liabilities | 2,070,903 | 2,323,497 | ||||||
Commitments and contingencies (Note 30) | ||||||||
| Convertible preferred stock | — | 150,957 | ||||||
| Shareholders’ equity | ||||||||
| Preferred Stock, par value $0.01 per share, 90,000,000 shares authorized; no shares issued and outstanding | — | — | ||||||
| Common Stock: 900,000,000 shares authorized, par value $0.01 per share, 105,990,483 shares outstanding as of December 31, 2017; 904,732,200 shares authorized, par value $0.01 per share, 17,894,393 shares outstanding as of December 31, 2016; 177,221 shares of Class B-1 Common Stock outstanding as of December 31, 2016 | 1,060 | 180 | ||||||
| Additional paid-in capital | 652,666 | 36,362 | ||||||
| Retained earnings | 233,658 | 222,232 | ||||||
| Accumulated other comprehensive loss | (95,347 | ) | (197,182 | ) | ||||
| Total shareholders’ equity | 792,037 | 61,592 | ||||||
| Total liabilities, convertible preferred shares, and shareholders’ equity | $ | 2,862,940 | $ | 2,536,046 | ||||
| December 31, 2017 | December 31, 2016 | December 31, 2015 | ||||||||||||||||||
| (amounts in thousands, except share and per share amounts) | Shares | Amount | Shares | Amount | Shares | Amount | ||||||||||||||
| Preferred stock, $0.01 par value per share | — | $ | — | — | $ | — | — | $ | — | |||||||||||
| Common stock, $0.01 par value per share | ||||||||||||||||||||
| Common stock | ||||||||||||||||||||
| Balance as of January 1 | 17,894,393 | $ | 178 | 17,829,240 | $ | 178 | 19,757,309 | $ | 198 | |||||||||||
| Shares issued | — | — | — | — | 118,976 | 1 | ||||||||||||||
| Shares issued for exercise/vesting of share-based compensation awards | 2,047,668 | 21 | 65,153 | — | 25,355 | — | ||||||||||||||
| Shares repurchased | (2,266 | ) | — | — | — | (2,073,885 | ) | (21 | ) | |||||||||||
| Shares issued upon conversion of Class B-1 Common Stock | 309,404 | 3 | — | — | 1,485 | — | ||||||||||||||
| Shares issued upon conversion of convertible preferred stock to common stock | 64,211,172 | 642 | — | — | — | — | ||||||||||||||
| Shares surrendered for tax obligations for employee share-based transactions | (742,615 | ) | (7 | ) | — | $ | — | — | $ | — | ||||||||||
| Shares issued in initial public offering | 22,272,727 | 223 | — | $ | — | — | $ | — | ||||||||||||
| Balance at period end | 105,990,483 | 1,060 | 17,894,393 | 178 | 17,829,240 | 178 | ||||||||||||||
| Class B-1 Common Stock | ||||||||||||||||||||
| Balance as of January 1 | 177,221 | 2 | 68,046 | 1 | 2,310 | — | ||||||||||||||
| Shares issued for exercise of stock options | — | — | 109,175 | 1 | 66,781 | 1 | ||||||||||||||
| Class B-1 Common stock converted to common | (177,221 | ) | (2 | ) | — | — | (1,045 | ) | — | |||||||||||
| Balance at period end | — | — | 177,221 | 2 | 68,046 | 1 | ||||||||||||||
| Balance at period end | $ | 1,060 | $ | 180 | $ | 179 | ||||||||||||||
| Additional paid-in capital | ||||||||||||||||||||
| Balance as of January 1 | $ | 37,205 | $ | 89,101 | $ | 198,184 | ||||||||||||||
| Shares issued | 2,769 | |||||||||||||||||||
| Shares issued for exercise/vesting of share-based compensation awards | 1,008 | 1,187 | 1,235 | |||||||||||||||||
| Shares repurchased | (183 | ) | — | (44,675 | ) | |||||||||||||||
| Shares surrendered for tax obligations for employee share-based transactions | (25,897 | ) | (982 | ) | — | |||||||||||||||
| Conversion of convertible preferred stock | 150,901 | — | — | |||||||||||||||||
| Initial public offering proceeds, net of underwriting fees and commissions | 480,306 | — | — | |||||||||||||||||
| Costs associated with initial public offering | (7,923 | ) | — | — | ||||||||||||||||
| Distributions on common stock and Class B-1 common stock | — | (73,957 | ) | (84,032 | ) | |||||||||||||||
| Amortization of share-based compensation | 17,910 | 21,856 | 15,620 | |||||||||||||||||
| Balance at period end | 653,327 | 37,205 | 89,101 | |||||||||||||||||
| Director notes | ||||||||||||||||||||
| Balance as of January 1 | — | (2,068 | ) | (16,127 | ) | |||||||||||||||
| Net issuances, payments and accrued interest on notes | — | 2,068 | 14,059 | |||||||||||||||||
| Balance at period end | — | — | (2,068 | ) | ||||||||||||||||
| Employee stock notes | ||||||||||||||||||||
| Balance as of January 1 | (843 | ) | (1,011 | ) | (1,353 | ) | ||||||||||||||
| Net issuances, payments and accrued interest on notes | 182 | 168 | 342 | |||||||||||||||||
| Balance at period end | (661 | ) | (843 | ) | (1,011 | ) | ||||||||||||||
| Balance at period end | $ | 652,666 | $ | 36,362 | $ | 86,022 | ||||||||||||||
The accompanying notes are an integral part of these Consolidated Financial Statements.
F-6
JELD-WEN HOLDING, INC.
CONSOLIDATED STATEMENTS OF EQUITY
| December 31, 2023 | December 31, 2022 | December 31, 2021 | |||||||||||||||||||||||||||||||||
| (amounts in thousands, except share and per share amounts) | Shares | Amount | Shares | Amount | Shares | Amount | |||||||||||||||||||||||||||||
| Preferred stock, $0.01 par value per share | — | $ | — | — | $ | — | — | $ | — | ||||||||||||||||||||||||||
| Common stock, $0.01 par value per share | |||||||||||||||||||||||||||||||||||
| Balance at beginning of period | 84,347,712 | $ | 843 | 90,193,550 | $ | 902 | 100,806,068 | $ | 1,008 | ||||||||||||||||||||||||||
| Shares issued for exercise/vesting of share-based compensation awards | 1,069,969 | 11 | 1,128,181 | 11 | 1,011,439 | 10 | |||||||||||||||||||||||||||||
| Shares repurchased | — | — | (6,848,356) | (69) | (11,564,009) | (115) | |||||||||||||||||||||||||||||
| Shares surrendered for tax obligations for employee share-based transactions | (108,461) | (1) | (125,663) | (1) | (59,948) | (1) | |||||||||||||||||||||||||||||
| Balance at period end | 85,309,220 | $ | 853 | 84,347,712 | $ | 843 | 90,193,550 | $ | 902 | ||||||||||||||||||||||||||
| Additional paid-in capital | |||||||||||||||||||||||||||||||||||
| Balance at beginning of period | $ | 735,526 | $ | 720,124 | $ | 691,360 | |||||||||||||||||||||||||||||
| Shares issued for exercise/vesting of share-based compensation awards | 552 | 1,998 | 10,174 | ||||||||||||||||||||||||||||||||
| Shares surrendered for tax obligations for employee share-based transactions | (1,637) | (2,764) | (1,619) | ||||||||||||||||||||||||||||||||
| Amortization of share-based compensation | 18,403 | 16,168 | 20,209 | ||||||||||||||||||||||||||||||||
| Balance at period end | 752,844 | 735,526 | 720,124 | ||||||||||||||||||||||||||||||||
| Employee stock notes | |||||||||||||||||||||||||||||||||||
| Balance at beginning of period | (673) | (673) | (673) | ||||||||||||||||||||||||||||||||
| Net issuances, payments and accrued interest on notes | — | — | — | ||||||||||||||||||||||||||||||||
| Balance at period end | (673) | (673) | (673) | ||||||||||||||||||||||||||||||||
| Balance at period end | $ | 752,171 | $ | 734,853 | $ | 719,451 | |||||||||||||||||||||||||||||
| Retained earnings | |||||||||||||||||||||||||||||||||||
| Balance at beginning of period | $ | 130,486 | $ | 215,611 | $ | 371,462 | |||||||||||||||||||||||||||||
| Shares repurchased | — | (130,852) | (324,673) | ||||||||||||||||||||||||||||||||
| Net income | 62,445 | 45,727 | 168,822 | ||||||||||||||||||||||||||||||||
| Balance at period end | $ | 192,931 | $ | 130,486 | $ | 215,611 | |||||||||||||||||||||||||||||
| Accumulated other comprehensive income (loss) | |||||||||||||||||||||||||||||||||||
| Balance at beginning of period | $ | (142,634) | $ | (93,746) | $ | (58,693) | |||||||||||||||||||||||||||||
| Foreign currency adjustments | 45,859 | (71,811) | (77,904) | ||||||||||||||||||||||||||||||||
| Unrealized (loss) gain on interest rate hedges | (12,159) | 9,668 | 3,850 | ||||||||||||||||||||||||||||||||
| Net actuarial pension gain | 13,624 | 13,255 | 39,001 | ||||||||||||||||||||||||||||||||
| Balance at period end | $ | (95,310) | $ | (142,634) | $ | (93,746) | |||||||||||||||||||||||||||||
| Total shareholders’ equity at period end | $ | 850,645 | $ | 723,548 | $ | 842,218 | |||||||||||||||||||||||||||||
| December 31, 2017 | December 31, 2016 | December 31, 2015 | |||||||||||||||
| Shares | Amount | Shares | Amount | Shares | Amount | ||||||||||||
| Retained earnings (accumulated deficit) | |||||||||||||||||
| Balance as of January 1 | $ | 222,232 | $ | (154,949 | ) | $ | (245,867 | ) | |||||||||
| Adoption of new accounting standard ASU 2016-09 | 635 | — | — | ||||||||||||||
| Net income | 10,791 | 377,181 | 90,918 | ||||||||||||||
| Balance at period end | $ | 233,658 | $ | 222,232 | $ | (154,949 | ) | ||||||||||
| Accumulated other comprehensive (loss) income | |||||||||||||||||
| Foreign currency adjustments | |||||||||||||||||
| Balance as of January 1 | $ | (65,949 | ) | $ | (33,575 | ) | $ | 45,061 | |||||||||
| Change during period | 87,934 | (32,374 | ) | (78,636 | ) | ||||||||||||
| Balance at end of period | 21,985 | (65,949 | ) | (33,575 | ) | ||||||||||||
| Unrealized (loss) gain on interest rate hedges | |||||||||||||||||
| Balance as of January 1 | (13,296 | ) | (10,617 | ) | 583 | ||||||||||||
| Change during period | 4,486 | (2,679 | ) | (11,200 | ) | ||||||||||||
| Balance at end of period | (8,810 | ) | (13,296 | ) | (10,617 | ) | |||||||||||
| Net actuarial pension (loss) gain | |||||||||||||||||
| Balance as of January 1 | (117,937 | ) | (118,805 | ) | (149,505 | ) | |||||||||||
| Change during period | 9,415 | 868 | 30,700 | ||||||||||||||
| Balance at end of period | (108,522 | ) | (117,937 | ) | (118,805 | ) | |||||||||||
| Balance at period end | $ | (95,347 | ) | $ | (197,182 | ) | $ | (162,997 | ) | ||||||||
| Total shareholders’ equity (deficit) at end of period | $ | 792,037 | $ | 61,592 | $ | (231,745 | ) | ||||||||||
The accompanying notes are an integral part of these Consolidated Financial Statements.Statements
F-7
JELD-WEN HOLDING, INC.
CONSOLIDATED STATEMENTS OF CASH FLOWS
| For the Years Ended December 31, | ||||||||||||||||||||
| (amounts in thousands) | December 31, 2023 | December 31, 2022 | 2021 | |||||||||||||||||
| OPERATING ACTIVITIES | ||||||||||||||||||||
| Net income | $ | 62,445 | $ | 45,727 | $ | 168,822 | ||||||||||||||
| Adjustments to reconcile net income to cash provided by (used in) operating activities: | ||||||||||||||||||||
| Depreciation and amortization | 140,192 | 131,754 | 137,247 | |||||||||||||||||
| Deferred income taxes | 31,735 | (4,394) | (14,973) | |||||||||||||||||
| Net (gain) loss on disposition of assets | (10,472) | (7,969) | 1,979 | |||||||||||||||||
| Goodwill impairment | — | 54,885 | — | |||||||||||||||||
| Adjustment to carrying value of assets | 7,862 | 2,375 | 2,076 | |||||||||||||||||
| Amortization of deferred financing costs | 2,614 | 3,150 | 3,175 | |||||||||||||||||
| Loss on extinguishment of debt | 6,487 | — | 1,001 | |||||||||||||||||
| Gain on sale of discontinued operations | (23,982) | — | — | |||||||||||||||||
| Stock-based compensation | 18,403 | 16,168 | 20,209 | |||||||||||||||||
| Amortization of U.S. pension expense | 480 | 1,798 | 9,092 | |||||||||||||||||
| Recovery of cost from interest received on impaired notes | (3,514) | (13,953) | — | |||||||||||||||||
| Other items, net | (7,439) | 24,597 | 3,804 | |||||||||||||||||
| Net change in operating assets and liabilities: | ||||||||||||||||||||
| Accounts receivable | 10,862 | (79,692) | (91,920) | |||||||||||||||||
| Inventories | 119,560 | (73,575) | (134,482) | |||||||||||||||||
| Other assets | 11,595 | (4,875) | (14,575) | |||||||||||||||||
| Accounts payable and accrued expenses | (21,548) | (58,615) | 70,184 | |||||||||||||||||
| Change in short-term and long-term tax liabilities | (92) | (7,044) | 14,027 | |||||||||||||||||
| Net cash provided by operating activities | 345,188 | 30,337 | 175,666 | |||||||||||||||||
| INVESTING ACTIVITIES | ||||||||||||||||||||
| Purchases of property and equipment | (98,332) | (83,217) | (83,603) | |||||||||||||||||
| Proceeds from sale of property and equipment | 16,751 | 11,871 | 3,166 | |||||||||||||||||
| Purchase of intangible assets | (12,550) | (9,003) | (16,090) | |||||||||||||||||
Proceeds (payments) related to the sale of JW Australia(1) | 365,555 | — | — | |||||||||||||||||
| Recovery of cost from interest received on impaired notes | 3,514 | 13,953 | — | |||||||||||||||||
| Cash received for notes receivable | 261 | 94 | 4,166 | |||||||||||||||||
| Cash received from insurance proceeds | 5,115 | — | — | |||||||||||||||||
| Change in securities for deferred compensation plan | (1,140) | (728) | — | |||||||||||||||||
| Net cash provided by (used in) investing activities | 279,174 | (67,030) | (92,361) | |||||||||||||||||
| FINANCING ACTIVITIES | ||||||||||||||||||||
| Change in long-term debt and payments of debt extinguishment costs | (561,338) | 12,729 | (86,051) | |||||||||||||||||
| Common stock issued for exercise of options | 563 | 2,009 | 10,184 | |||||||||||||||||
| Common stock repurchased | — | (131,987) | (323,722) | |||||||||||||||||
| Payments to tax authorities for employee share-based compensation | (1,638) | (2,765) | (1,620) | |||||||||||||||||
| Payments related to the sale of JW Australia | (744) | — | — | |||||||||||||||||
| Net cash used in financing activities | (563,157) | (120,014) | (401,209) | |||||||||||||||||
| Effect of foreign currency exchange rates on cash | 7,074 | (19,315) | (21,800) | |||||||||||||||||
| Net increase (decrease) in cash and cash equivalents | 68,279 | (176,022) | (339,704) | |||||||||||||||||
| Cash, cash equivalents and restricted cash, beginning | 220,868 | 396,890 | 736,594 | |||||||||||||||||
| Cash, cash equivalents and restricted cash, ending | $ | 289,147 | $ | 220,868 | $ | 396,890 | ||||||||||||||
| Balances included in the Consolidated Balance Sheets: | ||||||||||||||||||||
| Cash, cash equivalents, and restricted cash | $ | 289,147 | $ | 165,938 | $ | 344,062 | ||||||||||||||
| Cash and cash equivalents included in current assets of discontinued operations | — | 54,930 | 52,828 | |||||||||||||||||
| Cash and cash equivalents at end of period | $ | 289,147 | $ | 220,868 | $ | 396,890 | ||||||||||||||
For further information see Note 27 - Supplemental Cash Flow. | ||||||||||||||||||||
Cash flows from discontinued operations through the divestiture date of July 2, 2023 are included in the above amounts and explained in Note 1 — Basis of Presentation and Note 2 — Discontinued Operations. | ||||||||||||||||||||
F-8
| For the Years Ended December 31, | ||||||||||||
| (amounts in thousands) | 2017 | 2016 | 2015 | |||||||||
| OPERATING ACTIVITIES | ||||||||||||
| Net income | $ | 10,791 | $ | 377,181 | $ | 90,918 | ||||||
| Adjustments to reconcile net income to cash used in operating activities: | ||||||||||||
| Depreciation and amortization | 111,273 | 107,995 | 95,196 | |||||||||
| Deferred income taxes | 96,776 | (265,756 | ) | (18,862 | ) | |||||||
| Loss (gain) on sale of business units, property and equipment | 206 | (3,275 | ) | (414 | ) | |||||||
| Adjustment to carrying value of assets | 1,479 | 5,221 | 4,268 | |||||||||
| Equity earnings in non-consolidated entities | (3,639 | ) | (3,791 | ) | (2,384 | ) | ||||||
| Amortization of deferred financing costs | 9,422 | 3,980 | 4,261 | |||||||||
| Loss on extinguishment of debt | 23,262 | — | — | |||||||||
| Stock-based compensation | 19,785 | 22,464 | 15,620 | |||||||||
| Amortization of U.S. pension expense | 12,680 | 12,264 | 12,803 | |||||||||
| Other items, net | (8,170 | ) | (5,283 | ) | 1,820 | |||||||
| Net change in operating assets and liabilities, net of effect of acquisitions: | ||||||||||||
| Accounts receivable | 660 | (79,860 | ) | (3,904 | ) | |||||||
| Inventories | (32,028 | ) | 14,749 | 10,951 | ||||||||
| Other assets | (5,657 | ) | (10,799 | ) | (6,983 | ) | ||||||
| Contributions to U.S. pension plan | (10,000 | ) | — | (14,320 | ) | |||||||
| Accounts payable and accrued expenses | 26,714 | 27,569 | (28,225 | ) | ||||||||
| Change in long term tax liabilities | 12,239 | (1,004 | ) | 11,634 | ||||||||
| Net cash provided by operating activities | 265,793 | 201,655 | 172,379 | |||||||||
| INVESTING ACTIVITIES | ||||||||||||
| Purchases of property and equipment | (59,599 | ) | (74,033 | ) | (74,978 | ) | ||||||
| Proceeds from sale of business units, property and equipment | 2,713 | 7,614 | 4,680 | |||||||||
| Purchase of intangible assets | (3,450 | ) | (5,464 | ) | (2,709 | ) | ||||||
| Purchases of businesses, net of cash acquired | (131,448 | ) | (85,866 | ) | (86,695 | ) | ||||||
| Change in notes receivable | 1,991 | 967 | 1,250 | |||||||||
| Net cash used in investing activities | (189,793 | ) | (156,782 | ) | (158,452 | ) | ||||||
| FINANCING ACTIVITIES | ||||||||||||
| Distributions paid | — | (404,198 | ) | (419,216 | ) | |||||||
| Change in long-term debt | (389,665 | ) | 349,836 | 449,132 | ||||||||
| Change in notes payable | (205 | ) | (180 | ) | (3,420 | ) | ||||||
| Employee note repayments | 26 | 2,336 | 15,073 | |||||||||
| Common stock issued for exercise of options | 1,029 | 1,187 | 2,006 | |||||||||
| Common stock repurchased | — | — | (44,647 | ) | ||||||||
| Payments to tax authority for employee share-based compensation | (25,335 | ) | (982 | ) | — | |||||||
| Proceeds from the sale of common stock, net of underwriting fees and commissions | 480,306 | — | — | |||||||||
| Payments associated with initial public offering | (2,066 | ) | — | — | ||||||||
| Net cash provided by (used in) financing activities | 64,090 | (52,001 | ) | (1,072 | ) | |||||||
| Effect of foreign currency exchange rates on cash | 12,692 | (3,697 | ) | (4,786 | ) | |||||||
| Net increase (decrease) in cash and cash equivalents | 152,782 | (10,825 | ) | 8,069 | ||||||||
| Cash, cash equivalents and restricted cash, beginning | 103,452 | 114,277 | 106,208 | |||||||||
| Cash, cash equivalents and restricted cash, ending | $ | 256,234 | $ | 103,452 | $ | 114,277 | ||||||
| (1) Includes proceeds from the sale of JW Australia, net of the $73.9 million of cash divested. | ||||||||||||||||||||
F-9
JELD-WEN HOLDING, INC.
NOTES TO CONSOLIDATED FINANCIAL STATEMENTS
Note 1. Description of Company and Summary of Significant Accounting Policies
Nature of Business – JELD-WEN Holding, Inc. (“JWH”), along with its subsidiaries, is a vertically integrated global manufacturer and distributor of windows, doors, and doorsother building products that derives substantially all of its revenues from the sale of its door and window products. Unless otherwise specified or the context otherwise requires, all references in these notes to “JWH”, “JELD-WEN”, “we”, “us”, “our”,“JELD-WEN,” “we,” “us,” “our,” or the “Company” are to JELD-WEN Holding, Inc. and its subsidiaries.
We have facilities primarily located in the U.S., Canada, Europe, Australia, Asia, Mexico, and South America, and ourEurope. Our products are marketed primarily under the JELD-WEN brand name in the U.S. and Canada and under JELD-WEN and a variety of acquired brand names in Europe, Australia and Asia.
Europe.
Our revenues are affected by the level of new housing starts, residential and non-residential building construction, and repair and remodeling activity in each of our markets. Our sales typically follow seasonal new construction and repair and remodeling industry patterns. The peak season for home construction and remodeling in many of our markets generally correspondcorresponds with the second and third calendar quarters, and therefore, sales volume is typically higher during those quarters. Our first and fourth quarter sales volumes are generally lower due to reduced repair and remodeling activity and reduced activity in the building and construction industry as a result of colder and more inclement weather in certain areas of our geographic end markets.
Basis of Presentation – The accompanying consolidated balance sheetsfinancial statements have been prepared in accordance with GAAP and pursuant to the rules and regulations of the SEC. All intercompany balances and transactions have been eliminated in consolidation.
On April 17, 2023, we entered into a Share Sale Agreement with Aristotle Holding III Pty Limited, a subsidiary of Platinum Equity Advisors, LLC, to sell our Australasia business (“JW Australia”). On July 2, 2023, we completed the sale. The net assets and operations of the disposal group met the criteria to be classified as “discontinued operations” and are reported as such in all periods presented unless otherwise noted. The consolidated statements of operations has been revised to reflect the correction of certain errors and other accumulated misstatements as described in Note 36 - Revision of Prior Period Financial Statements. The errors did not impact the subtotals forcash flows include cash flows from operating activities, investing activities or financing activitiesdiscontinued operations through the divestiture date of July 2, 2023. See Note 2 - Discontinued Operations for any of the periods affected. We do not believe the errors corrected were material to our previously issued financial statements.
further information.
All U.S. dollar and other currency amounts, except per share amounts, are presented in thousands unless otherwise noted.
Fiscal Year– We operate on a fiscal calendar year, and each interim periodquarter is comprised of two 4-week periods and one 5-week period, with each week ending on a Saturday. Our fiscal year always begins on January 1 and ends on December 31. As a result, our first and fourth quarters may have more or fewer days included than a traditional 91-day fiscal quarter.
Use of Estimates – The preparation of consolidated financial statements in conformity with GAAP requires management to make estimates, assumptions, and assumptionsallocations that affect amounts reported in the consolidated financial statements and related notes. Significant items that are subject to such estimates and assumptions include, but are not limited to, long-lived assets including goodwill and other intangible assets, employee benefit obligations, income tax uncertainties, contingent assets and liabilities, provisions for bad debt, inventory, warranty liabilities, legal claims, valuation of derivatives, environmental remediation, and claims relating to self-insurance. Actual results could differ due to the uncertainty inherent in the nature of these estimates.
CARES Act – In March 2020, the United States government enacted the CARES Act to provide certain relief as a result of the COVID-19 pandemic. The CARES Act provided for tax relief, along with other stimulus measures, including a provision that allowed employers to defer the remittance of the employer portion of social security tax relating to 2020. The Company deferred $20.9 million of the employer portion of social security tax in 2020, all of which was paid in the year ended December 31, 2022. The CARES Act also included a provision for an ERC designed to encourage businesses to retain employees during the COVID-19 pandemic. During the year ended December 31, 2023, we recorded an ERC from the
F-10
U.S. government of $6.1 million in other income, net in the accompanying consolidated statements of operations. The balance is included in other current assets in the accompanying consolidated balance sheets as of December 31, 2023.
Segment Reporting – Our reportable operating segments are organized and managed principally by geographic region: North America Europe and Australasia.Europe. We report all other business activities in Corporate and unallocated costs. In addition to similar economic characteristics we alsoWe consider the following factors in determining the reportable segments: the nature of business activities, the management structure accountable directly accountable to our chief operating decision maker for operating and administrative activities,the CODM, the discrete financial information regularly reviewed by the chief operating decision maker,CODM, and information presented to the Board of Directors and investors. No operating segments have been aggregated for our presentation.presentation of reportable segments.
Cash and Cash Equivalents – We consider all highly-liquid investments purchased with an original or remaining maturity at the date of purchase of three monthsninety days or less to be cash equivalents. Our cash management system is designed to maintain zero bank balances at certain banks. Checks written and not presented to these banks for payment are reflected as book overdrafts and are a component of accounts payable.
Restricted Cash – Restricted cash consists primarily of cash deposits required to meet certain bank guarantees and projected self-insurance obligations. New funding is generated from employees’ portion of contributions and is added to the deposit account weekly as claims are paid.guarantees.
Accounts Receivable – Accounts receivable are recorded at their net realizable value. Our customers are primarily retailers, distributors, and contractors. As of December 31, 2017, one customerTwo customers, The Home Depot and Lowe’s Companies, each accounted for 16.9%more than 10% of the consolidated accounts receivable, balance. Asnet balance as of December 31, 2016, one customer accounted for 21.2% of the consolidated accounts receivable balance.2023 and December 31, 2022. We maintain allowances for doubtful accounts for estimatedcredit losses resulting from the inability of our customers to make required payments. We estimate the allowance for doubtful accountscredit losses based on a variety ofquantitative and qualitative factors includingassociated with the length of time receivables are past due, the financial healthcredit risk of our customers, unusual macroeconomic conditions andaccounts receivable, including historical experience.credit collections within each region where we have operations. If the financial condition of a customer deteriorates or other circumstances occur that result in an impairment of a customer’s ability to make payments, we record additional allowances as needed. We write off uncollectible trade accounts receivable against the allowance for doubtful accountscredit losses when collection efforts have been exhausted and/or any legal action taken by us has concluded.
Inventories – Inventories in the accompanying consolidated balance sheets are valued at the lower of cost or net realizable value and are determined by the first-in, first-out (“FIFO”) or average cost methods. We record provisions to write-down obsolete and excess inventory to its estimated net realizable value. The process for evaluating obsolete and excess inventory requires us to make subjective judgmentsevaluate historical inventory usage and estimates concerningexpected future sales levels, quantities and prices at which such inventory will be able to be sold in the normal course of business.production needs. Accelerating the disposal process or incorrect estimates of future sales potential may cause actual results to differ from the estimates at the time such inventory is disposed or sold. We classify certain inventories that are available for sale directly to external customers or used in the manufacturing of a finished good within raw materials.
Notes Receivable – Notes receivable are recorded at their net realizable value. The balance consists primarily of installment notes and affiliate notes. The allowance for doubtful notescredit losses is based upon credit risks, historical loss trends, and specific reviews of delinquent notes. We write off uncollectible note receivables against the allowance for doubtful accountscredit losses when collection efforts have been exhausted and/or any legal action taken by us has been concluded. Current maturities and interest, net of short-term allowance are reported as other current assets.
Customer Displays – Customer displays include all costs to manufacture, ship, and install the displays of our products in retail store locations. Capitalized display costs are included in other assets and are amortized over the life of the product lines, typically 1 to 3 to 4 years. Related amortization isyears, and are included in SG&A expense in the accompanying consolidated statements of operations and was $8.6$3.9 million in 2017, $8.82023, $1.4 million in 2016,2022, and $5.2$3.0 million in 2015.2021.
Cloud Computing Arrangements –We capitalize qualified cloud computing implementation costs associated with the application development stage and subsequently amortize these costs over the term of the hosting agreement and stated renewal period, if it is reasonably certain we will renew, typically 3 to 5 years. Capitalized costs are included in other assets on the consolidated balance sheet and amortization is included in SG&A expense in the accompanying consolidated statement of operations.
Property and Equipment – Property and equipment are recorded at cost. The cost of major additions and betterments are capitalized and depreciated using the straight-line method over their estimated useful lives while replacements,lives. Replacements, maintenance, and repairs that do not improve or extend the useful lives of the related assets or adapt the property to a new or different use are expensed as incurred. Interest over the construction period is capitalized as a component of cost of constructed assets. Upon sale or retirement of property or equipment, cost and related accumulated depreciation are removed from the accounts and any gain or loss is charged to income.
income and included in SG&A expense in the accompanying statements of operations.
Leasehold improvements are amortized over the shorter of the useful life of the improvement, the lease term, or the life of the building. Depreciation is generally provided over the following estimated useful service lives:
F-11
| Land improvements | 10 - 20 years | ||||
| Buildings and improvements | |||||
| Machinery and equipment | 3 - 20 years | ||||
Intangible Assets –Intangible assets are accounted for in accordance with ASC 350, Intangibles – Goodwilland Other. Definite lived intangible assets are amortized based on the pattern of economic benefit over the following estimated useful lives:
| Trademarks and trade names | |||||
| Software | |||||
| Patents, licenses and rights | 5 - 25 years | ||||
| Customer relationships | 5 - 20 years | ||||
The lives of definite lived intangible assets are reviewed and reduced if necessary, whenever changes in theirplanned use occur. Legal and registration costs related to internally-developed patents and trademarks arecapitalized and amortized over the lesser of their expected useful life or the legal patent life. Cost andaccumulated amortization are removed from the accounts in the period that an intangible asset becomesfully amortized. The carrying value of intangible assets is reviewed by management to assess therecoverability of the assets when facts and circumstances indicate that the carrying value may not berecoverable. The recoverability test requires us to first compare undiscounted cash flows expected to begenerated by that definite lived intangible asset or asset group to its carrying amount. If the carryingamounts of the definite lived intangible assets are not recoverable on an undiscounted cash flow basis, animpairment charge is recognized to the extent that the carrying amount exceeds its fair value. Fair value is determined through various valuation techniques.
Our valuation of identifiable intangible assets acquired is based on information and assumptions available tous at the time of acquisition, using income and market approaches to determine fair value. We do notamortize our indefinite-lived intangible assets, but test for impairment annually, or when indications ofpotential impairment exist. For intangible assets other than goodwill, if the carrying value exceeds the fairvalue, we recognize an impairment loss in an amount equal to the excess. No material impairments wereidentified during fiscalthe years 2017, 2016ended December 31, 2023, December 31, 2022 and 2015.December 31, 2021.
We capitalize certain qualified internal use software costs during the application development stage and subsequently amortize these costs over the estimated useful life of the asset. Costs incurred during the preliminary project stage and post-implementation operation stage are expensed as incurred.
Long-Lived Assets – Long-lived assets, other than goodwill, are reviewed for impairment whenever eventsor changes in circumstances indicate the carrying amount of such assets or asset groups may not be recoverable. The firststep inIf a triggering event is identified, we perform an impairment review is to forecasttest by reviewing the expected undiscounted cash flows generated from theanticipated use and eventual disposition of the asset.asset group compared to the carrying value of the asset group. If the expected undiscounted cash flows are less thanthe carrying value of the asset group, then an impairment charge is required to reduce the carrying value of theasset group to fair value. Long-lived assets currently available for sale and expected to be sold within one year areclassified as assets held for salesale.
Leases – We lease certain warehouses, distribution centers, office spaces, land, vehicles, and equipment. We determine if an arrangement is a lease at inception. A contract contains a lease if the contract conveys the right to control the use of identified property, plant, or equipment (an identified asset) for a period of time in exchange for consideration. Amounts associated with operating leases are included in operating lease assets (“ROU assets”), net, accrued expense and other current assets.liabilities and operating lease liability in our consolidated balance sheet. Amounts associated with finance leases are included in property and equipment, net, current maturities of long-term debt, and long-term debt in our consolidated balance sheet.
ROU assets represent our right to use an underlying asset for the lease term and lease liabilities represent our obligation to make lease payments arising from the lease. ROU assets and liabilities are recognized at the lease commencement date based on the estimated present value of lease payments over the lease term.
If the lease does not provide an implicit rate, we use our incremental borrowing rate based on the information available at the lease commencement date in determining the present value of lease payments. The incremental borrowing rate for operating leases that commenced in the period is determined by using the prior quarter end’s incremental borrowing rates.
We have elected not to recognize an ROU asset and lease liability for leases with an initial term of twelve months or less as well as any lease covering immaterial assets. We recognize lease expense for these leases on a straight-line basis over the lease term. Variable lease payments that are dependent on usage, output, or may vary for other reasons, are excluded from lease payments in the measurement of the ROU asset and lease liability, and accordingly are recognized as lease expense in the period the obligation for those payments is incurred. We combine lease and non-lease components for all agreements, with the exception of building leases.
F-12
Certain leases include renewal and/or termination options, with renewal terms that can extend the lease term from 1 to 20 years or more, and the exercise of lease renewal options under these leases is at our sole discretion. These options are included in the lease term used to determine ROU assets and corresponding liabilities when we are reasonably certain we will exercise the option. The depreciable life of assets and leasehold improvements are limited by the expected lease term. Our lease agreements do not contain any material residual value guarantees or material restrictive covenants.
Goodwill – Goodwill is tested for impairment on an annual basis during the fourth quarter and between annual tests if indicators of potential impairment exist, using a fair-value-based approach.exist. Current accounting guidance provides an entity the option to perform a qualitative assessment to determine whether it is more-likely-than-not that the fair value of a reporting unit is less than its carrying amount prior to performing the two-step goodwill impairment test.amount. If this is the case, the two-step goodwill impairment test is required. Ifwe do not perform a qualitative assessment, or if we determine that it is more-likely-than-notmore likely than not that the fair value of a reporting is greater than its carrying amount, the two-step goodwill impairment test is not required.
Under the income approach, the fair value of a reporting unit is based on a discounted cash flow projections areanalysis of management's short-term and long-term forecast of operating performance. This analysis contains significant assumptions and estimates derived from a review of our expectedincluding revenue growth rates, profitexpected EBITDA margins, business plans, cost ofdiscount rates, capital expenditures, and taxterminal growth rates. Changes in assumptions or estimates used in our goodwill impairment testing could materially affect the determination of the fair value of a reporting unit, and therefore, could eliminate the excess of fair value over carrying valueamount of a reporting unit and, in some cases, could result in impairment. Such changes in assumptions could be caused by items such as a loss of one or more significant customers, decline in the demand for our products due to changing economic conditions, or failure to control cost increases above what can be recouped in sale price increases. These types of changes would negatively affect our profits, revenues, and growth over the long term and such a decline could significantly affect the fair value assessment of our reporting units and cause our goodwill to become impaired.
We have completed the required annual testing of goodwill for impairment for allidentified two reporting units for the purpose of conducting our goodwill impairment review: North America and have determined that goodwillEurope and applied a quantitative approach to both reporting units. In determining our reporting units, we considered (i) whether an operating segment or a component of an operating segment was not impaireda business, (ii) whether discrete financial information was available, and (iii) whether the financial information is regularly reviewed by management of the operating segment.
Deferred Revenue – We record deferred revenue when we collect pre-payments from customers for performance obligations we expect to fulfill through future performance of a service or delivery of a product. We classify our deferred revenue based on our estimate as to when we expect to satisfy the related performance obligations. Deferred revenues are included in any years presented.accrued expenses and other current liabilities in the accompanying consolidated balance sheets.
Warranty Accrual – Warranty terms range primarily from one year to lifetime on certain window and door components. Warranties are normally limited to replacement or service of defective components for the original customer. Some warranties are transferable to subsequent owners and are generally limited to ten years from the date of manufacture or require pro-rata payments from the customer. A provision for estimated warranty costs is recorded at the time of sale based on historical experience and we periodically adjust these provisions to reflect actual experience.
Restructuring – Costs to exit or restructure certain activities of an acquired company or our internal operations are accounted for as one-time termination and exit costs as required by the provisions of FASB ASC 420, Exit or Disposal Cost Obligations, and are accounted for separately from any business combination. A liability for costs associated with an exit or disposal activity is recognized and measured at its fair value in our consolidated statements of operations in the period in which the liability is incurred. When estimating the fair value of facility restructuring activities, assumptions are applied, regarding estimated sub-lease payments to be received, which can differ materially from actual results. This may require us to revise our initial estimates, which may materially affect our results of operations and financial position in the period the revision is made.
Derivative Financial Instruments – Derivative financial instruments have beenare used to manage interest rate risk associated with our borrowings and foreign currency exposures related to transactions denominated in currencies other than the U.S. dollar, or in the case of our non-U.S. companies, transactions denominated in a currency other than their functional currency. We record all derivative instrumentsAll derivatives are recorded as assets or liabilities in the consolidated balance sheets at their respective fair value.values. As of December 31, 2023, December 31, 2022 and December 31, 2021, we had netting provisions in certain agreements with our counterparties. We have elected to not offset the fair values of derivative assets and liabilities executed with the same counterparty that are generally subject to enforceable netting agreements. Changes in a derivative’s fair value are recognized in earnings unless specific hedge criteria are met, and we elect hedge accounting prior to entering into the derivative.
F-13
hedge. If a derivative is designated as a fair value hedge, the changes in fair value of both the derivative and the hedged item attributable to the hedged riskrisks are recognized in the same line item in the results of operations. If the derivative is designated as a cash flow or net investment hedge, changes in the fair value ofrelated to the derivativederivatives considered highly effective are initially recorded in consolidatedaccumulated other comprehensive income (loss) and subsequently classified to the consolidated statements of operations when the hedged item impacts earnings. earnings, and in the same line item on the consolidated statements of operations as the impact of the hedge transaction. Cash flows from all derivative instruments, including those not designated as hedging instruments, are classified in the same category as the cash flows from the item being hedged.
At the inception of a fair value, or cash flow hedge transaction,or net investment hedge we formally document the hedge relationship and the risk management objective for undertaking the hedge. In addition, for derivatives that qualify for hedge accounting, we assess, both at inception of the fair value or cash flow hedge and on an ongoing basis, whether the derivative in the hedging transaction has beenfinancial instrument is and will continue to be highly effective in offsetting changes incash flows or fair value or cash flows of the hedged item and whether it is probable that the derivative is expectedhedged forecasted transaction will occur. Changes in the fair value of derivatives that do not qualify for hedge accounting, or fail to continue to be highly effective. The impact of any ineffectiveness ismeet the criteria, thereafter, are also recognized in ourthe consolidated statements of operations. See Note 24 - Fair Value of Financial Instruments for additional information on the fair value of our derivative assets and liabilities.
Revenue Recognition – We recognize revenueRevenue is recognized when four basic criteria have been met: (i) persuasive evidenceobligations under the terms of a contract with our customer arrangement exists; (ii)are satisfied. Generally, this occurs with the pricetransfer of control of our products or services. The transfer of control to the customer occurs at a point in time, usually upon satisfaction of the shipping terms within the contract. Revenue is fixedmeasured as the amount of consideration we expect to receive in exchange for transferring goods or determinable; (iii) collectability is reasonably assured; and (iv) product delivery has occurred or services have been rendered. We recognize revenue based on the invoice price less allowances forproviding services. The taxes we collect concurrent with revenue-producing activities (e.g., sales returns, cash discounts,tax, value-added tax, and other deductionstaxes) are excluded from revenue.
Shipping and handling costs are treated as required under GAAP. Incentive payments to customers that directly relate to future businessfulfillment costs and are recorded asnot considered a reduction of net revenues over the periods benefited.
separate performance obligation. Shipping Costs – Shippingand handling costs charged to customers and the related expenses are includedreported in net revenues. Therevenues and cost of shippingsales for all customers. The expected costs associated with our base warranties and field service actions continue to be recognized as expense when the products are sold (see Note 11 - Warranty Liability). Since payment is includeddue at or shortly after the point of sale, the contract asset is classified as a receivable.
We do not adjust the promised amount of consideration for the effects of a significant financing component when we expect, at contract inception, that the period between our transfer of a promised product or service to a customer and when the customer pays for that product or service will be one year or less. We do not typically include extended payment terms in costour contracts with customers. Incidental items that are immaterial in the context of sales.the contract are recognized as expense.
We disaggregate revenues based on geographical location. See Note 14 - Segment Information for further information on disaggregated revenue.
Advertising Costs – All costs of advertising our products and services are charged to expense as incurred. Advertising and promotion expenses included in SG&A expenses were $48.4$30.1 million in 2017, $49.12023, $27.1 million in 20162022, and $46.0$25.8 million in 2015.2021.
Net Interest Expense and Extinguishment of Debt Costs – We record the debt extinguishment costcosts separately infrom interest expense, net within the consolidated statements of operations. During 2016 and 2015, interest expense was allocated to discontinued operations based on debt that was specifically attributable to those operations.
Foreign Currency Translation and Adjustments – Typically, our foreign subsidiaries maintain their accounting records in their local currency. All of the assets and liabilities of these subsidiaries (including long-term assets, such as goodwill) are converted to U.S. dollars at the exchange rate in effect at the balance sheet date, income and expense accounts are translated at average rates for the period, and shareholder’s equity accounts are translated at historical rates. The effects of translating financial statements of foreign operations into our reporting currency are recognized as a cumulative translation adjustment in consolidated other comprehensive income (loss). This balance is net of tax, where applicable.
The effects of translating financial statements of foreign operations in which the U.S. dollar is their functional currency are included in the consolidated statements of operations. The effects of translating intercompany debt are recorded in the consolidated statements of operations unless the debt is of a long-term investment nature in which case gains and losses are recorded in consolidated other comprehensive income (loss).
Foreign currency transaction gains or losses are credited or charged to income as incurred.
Income Taxes – Income taxes are accounted for under the asset and liability method. Deferred tax assets and liabilities are recognized for the future tax consequences attributable to differences between the financial statement carrying amounts of existing assets and liabilities and their respective tax bases and operating loss and tax credit carryforwards. Deferred tax assets and liabilities are measured using enacted tax rates expected to apply to taxable income in the years in which those
F-14
temporary differences are expected to be recovered or settled. The effect on the deferred tax assets and liabilities of a
change in tax rates is recognized in income in the period that includes the enactment date. We evaluate both the positive and negative evidence that is relevant in assessing whether we will realize the deferred tax assets. A valuation allowance is recorded when it is more likely than not that some of the deferred tax assets will not be realized. The tax effects from an uncertain tax position can be recognized in the consolidated financial statements, only if the position is more likely than not to be sustained, based on the technical merits of the position and the jurisdiction taxes of the Company. We recognize the financial statement benefit of a tax position only after determining that the relevant tax authority would more likely than not sustain the position following an audit and the tax related to the position would be due to the entity and not the owners. For tax positions meeting the more likely than not threshold, the amount recognized in the consolidated financial statements is the largest benefit that has a greater than 50 percent likelihood of being realized, upon ultimate settlement with the relevant tax authority. We apply this accounting standard to all tax positions for which the statute of limitations remains open. Changes in recognition or measurement are reflected in the period in which the change in judgment occurs.
We file a consolidated federal income tax return in the U.S. and various states. For financial statement purposes, we calculate the provision for federal income taxes using the separate return method. Certain subsidiaries file separate tax returns in certain countries and states. Any U.S. federal, state, and foreign income taxes refundable and payable are reported in other current assets and accrued income taxes payableexpenses and other current liabilities in theour consolidated balance sheets. sheet. We do not have any non-current taxes receivable or payable at December 31, 2023 or December 31, 2022.
We record interest and penalties on amounts due to tax authorities as a component of income tax expense (benefit) in the consolidated statements of operations. We have elected to account for the impact of GILTI in the period in which it is incurred.
Contingent Liabilities – Contingent liabilities arising from claims, assessments, litigation, fines, penalties, and other sources require significant judgment in estimatingdetermining the probability of loss and the amount of the potential losses for legal claims.loss. Each quarter, we review significant new claims and litigation for the probability of an adverse outcome. Estimates are recorded as liabilities when it is probable that a liability has been incurred and the amount of the loss is reasonably estimable. Disclosure is required when there is a reasonable possibility that the ultimate loss will materially exceed the recorded provision. Contingent liabilities are often resolved over long time periods. Estimating probable losses requires analysis of multiple forecasts that often depend on judgments about potential actions by third parties, such as regulators, and the estimated loss can change materially as individual claims develop. Legal costs incurred in connection with loss contingencies are expensed as incurred.
Employee Retirement and Pension Benefits – We have a defined benefit plan available to certain U.S. hourly employees and several other defined benefit plans located outside of the U.S. that are country specific. The most significant of these plans is in the U.S., which is no longer open to new employees. Amounts relating to these plans are recorded based on actuarial calculations, which use various assumptions, such as discount rates and expected return on assets. See Note 3126 - Employee Retirement and Pension Benefits.
Recently Adopted Accounting Standards – In December 2019, the FASB issued ASU No. 2016-09, Stock Compensation2019-12, Income Taxes (Topic 740): Simplifying the Accounting for Income Taxes, which removes certain exceptions to the general principles of ASC 740, including, but not limited to, accounting relating to intraperiod tax allocations, deferred tax liabilities related to outside basis differences, and year to date losses in interim periods. This guidance is intended to simplify several aspects of the accountingeffective for share-based payment awards to employees. The new guidance requires companies to recognize the income tax effects of awards that vest or are settled as income tax expense or benefit in the income statement as opposed to additional paid-in capital, and gross excess tax benefits are classified as operating cash flows rather than financing cash flows. Additionally, the guidance allows companies to make a policy election to account for forfeitures either upon occurrence or by estimating forfeitures. We have elected to continue estimating forfeitures expected to occur in order to determine the amount of compensation cost to be recognized each period.fiscal years beginning after December 15, 2020. We adopted this ASU on a modified retrospective basisstandard in the first quarter ended April 1, 2017of 2021 and the adoption of this standard did not materiallyhave an impact results of operations, retained earnings, or cash flows.on our consolidated financial statements.
In March 2020, the FASB issued ASU No. 2015-11, Simplifying2020-04, Reference Rate Reform (Topic 848): Facilitation of the MeasurementEffects of Inventory requires that inventory withinReference Rate Reform on Financial Reporting, which provides optional expedients and exceptions for applying U.S. GAAP to contracts, hedging relationships, and other transactions affected by the discontinuation of LIBOR or by another reference rate expected to be discontinued. In January 2021, the FASB issued ASU No. 2021-01, Reference Rate Reform (Topic 848): Scope, to clarify the scope of this guidance be measured at the lower of cost and net realizable value. We adopted this ASU in the quarter ended April 1, 2017 and adoption of this standard did not materially impact results of operations, retained earnings, or cash flows.
ASU No. 2016-15, Statement2020-04. In December 2022, the FASB issued ASU No. 2022-06, Deferral of Cash Flows (Topic 230): Classificationthe Sunset Date of Certain Cash Receipts and Cash Payments, eliminatesTopic 848, which extended the diversityrelief provisions under Topic 848 through December 31, 2024. In May 2020, we elected the expedient within ASC 848 which allowed us to assume that our hedged interest payments were probable of occurring regardless of any expected modifications in practicetheir terms related to reference rate reform. In addition, ASC 848 allowed for the classificationoption to change the method of certain cash receiptsassessing effectiveness upon a change in critical terms of the derivative or the hedged transactions and payments for debt prepayment or extinguishment costs,upon the maturingend of a zero-coupon bond, the settlement of contingent liabilities arising from a business combination, proceeds from insurance settlements, distributions from certain equity method investees and beneficial interest obtained in a financial asset securitization. ASU No. 2016-18, Topic 230: Restricted Cash, requires that the statement of cash flows explain the change during the period in the total of cash, cash equivalents, and amounts generally described as restricted cash or restricted cash equivalents.relief under ASC 848. We elected to early adopt these ASUs usingassess effectiveness as documented in the retrospectiveoriginal hedge documentation and apply the practical expedients related to probability to assume that the reference rate on a hypothetical derivative matched the reference rate on the hedging instrument. In June 2023, we executed amendments to our Term Loan Facility, ABL Facility and interest rate derivative agreements to replace LIBOR with a Term SOFR based rate. These contract amendments did not have a material impact on our consolidated
F-15
financial statements. Refer to Note 12 - Long-Term Debt and Note 23 - Derivative Financial Instruments for further information.
| 2016 | |||||||||||
| (amounts in thousands) | As Reported | Retrospective Application | As Revised | ||||||||
| Cash, and cash equivalents beginning | $ | 113,571 | $ | 706 | $ | 114,277 | |||||
| Cash, and cash equivalents, ending | 102,701 | 751 | 103,452 | ||||||||
| Effect of foreign currency exchange rates on cash | (3,670 | ) | (27 | ) | (3,697 | ) | |||||
| Net change in other assets | (10,871 | ) | 72 | (10,799 | ) | ||||||
| 2015 | |||||||||||
| (amounts in thousands) | As Reported | Retrospective Application | As Revised | ||||||||
| Cash, and cash equivalents beginning | $ | 105,542 | $ | 666 | $ | 106,208 | |||||
| Cash, and cash equivalents, ending | 113,571 | 706 | 114,277 | ||||||||
| Net change in other assets | (7,023 | ) | 40 | (6,983 | ) | ||||||
Recent Accounting Standards Not Yet Adopted – In August 2017,November 2023, the FASB issued ASU No. 2017-12, Derivatives and Hedging (Topic 815): Targeted 2023-07, Improvements to AccountingReportable Segment Disclosures. ASU 2023-07 requires disclosure of significant segment expenses that are regularly provided to the CODM and included within the segment measure of profit or loss, an amount and description of its composition for Hedging Activities. The targeted amendments help simplify certain aspects of hedge accountingother segment items to reconcile to segment profit or loss, and result in a more accurate portrayalthe title and position of the economicsentity’s CODM. ASU 2023-07 will be applied retrospectively and is effective for annual reporting periods in fiscal years beginning after December 15, 2023, and interim reporting periods in fiscal years beginning after December 31, 2024. The guidance will not have an impact on our financial positions and results of operations. We are currently evaluating the impact of this guidance on the Company’s disclosures.
In December 2023, the FASB issued ASU 2023-09, Income Taxes (Topic 740): Improvements to Income Tax Disclosures. ASU 2023-09 expands disclosures in an entity’s risk management activitiesincome tax rate reconciliation table and regarding cash taxes paid both in its financial statements. For cash flowthe U.S. and net investment hedges as of the adoption date, the guidance requires a modified retrospective approach.foreign jurisdictions. The guidance is effective for annual periods beginning after December 15, 2018 and interim periods within those years,2024, with early adoption permitted.permitted, and should be applied either prospectively or retrospectively. We have not elected to early adopt this standard. The adoptionguidance will not have an impact on our financial positions and results of operations. We are currently evaluating the impact of this guidance ison the Company’s disclosures.
We have considered the applicability and impact of all ASUs. We have assessed ASUs not listed above and have determined that they were either not applicable or were not expected to have a material impact on our consolidated financial statements.
F-16
Note 2. Discontinued Operations
On April 17, 2023, we entered into a Share Sale Agreement with Aristotle Holding III Pty Limited, a subsidiary of Platinum Equity Advisors, LLC, to sell our Australasia business (“JW Australia”), for a purchase price of approximately AUD $688 million. On July 2, 2023, we completed the FASB issued ASU No. 2017-09, Compensationsale, receiving net cash proceeds of approximately $446 million, including $3.3 million of cash received from the settlement of certain forward contracts (refer to Note 23 - Stock Compensation (Topic 718): ScopeDerivative Financial Instruments for further information). We recorded a net gain on the sale of Modification Accounting.JW Australia of $15.7 million, net of taxes. The ASU provides guidance about which changesnet gain on sale includes $30.3 million of cumulative translation adjustments losses and $1.0 million of accumulated net actuarial pension losses reclassified from other comprehensive income. The net gain on sale also includes a $10.2 million loss recorded in the fourth quarter of 2023 in estimated taxes directly related to the terms or conditionssale transaction and return to provision true ups for the period in which we owned JW Australia.
This divestiture qualified as a discontinued operation as of April 17, 2023 since it represents a share-based payment award require an entity to apply modification accounting in Topic 718. The guidance is effectivestrategic shift for annual periods beginning after December 15, 2017us and interim periods within those years and is to be applied prospectively to an award modified on or after the adoption date. Early adoption is permitted. The adoption of this guidance is not expected to havehas a material impactmajor effect on our consolidated financial statements.results of operations. Accordingly, the results of operations for the JW Australia reportable segment, together with certain costs related to the sale, have been classified as discontinued operations within the consolidated statements of operations for all periods presented.
F-17
| (amounts in thousands) | December 31, 2022 | ||||||||||
| ASSETS | |||||||||||
| Cash and cash equivalents | $ | 54,930 | |||||||||
| Accounts receivable, net | 72,516 | ||||||||||
| Inventories | 71,984 | ||||||||||
| Other current assets | 5,302 | ||||||||||
| Current assets of discontinued operations | $ | 204,732 | |||||||||
| Property and equipment, net | $ | 120,482 | |||||||||
| Deferred tax assets | 13,019 | ||||||||||
| Goodwill | 78,552 | ||||||||||
| Intangible assets, net | 43,999 | ||||||||||
| Operating lease assets, net | 38,887 | ||||||||||
| Other assets | 1,821 | ||||||||||
| Non-current assets of discontinued operations | $ | 296,760 | |||||||||
| LIABILITIES | |||||||||||
| Accounts payable | $ | 33,704 | |||||||||
| Accrued payroll and benefits | 26,635 | ||||||||||
| Accrued expenses and other current liabilities | 43,975 | ||||||||||
| Current maturities of long-term debt | 298 | ||||||||||
| Current liabilities of discontinued operations | $ | 104,612 | |||||||||
| Long-term debt | $ | 448 | |||||||||
| Unfunded pension liability | 4,396 | ||||||||||
| Operating lease liability | 30,754 | ||||||||||
| Deferred credits and other liabilities | 1,962 | ||||||||||
| Deferred tax liabilities | 862 | ||||||||||
| Non-current liabilities of discontinued operations | $ | 38,422 | |||||||||
The fair valuesbalances of the assets and liabilities acquired are summarized below:
| (amounts in thousands) | Preliminary Allocation | Measurement Period Adjustment | Revised Preliminary Allocation | ||||||||
| Fair value of identifiable assets and liabilities: | |||||||||||
| Accounts receivable | $ | 23,900 | $ | (309 | ) | $ | 23,591 | ||||
| Inventories | 20,169 | 777 | 20,946 | ||||||||
| Other assets | 1,270 | 1,362 | 2,632 | ||||||||
| Property and equipment | 15,450 | 16,694 | 32,144 | ||||||||
| Identifiable intangible assets | 30,430 | 16,282 | 46,712 | ||||||||
| Goodwill | 47,754 | (23,614 | ) | 24,140 | |||||||
| Total assets | $ | 138,973 | $ | 11,192 | $ | 150,165 | |||||
| Accounts payable and other current liabilities | 14,147 | 52 | 14,199 | ||||||||
| Other liabilities | 1,092 | 3,224 | 4,316 | ||||||||
| Total liabilities | $ | 15,239 | $ | 3,276 | $ | 18,515 | |||||
| Purchase Price: | |||||||||||
| Cash consideration, net of cash acquired | $ | 123,734 | $ | 7,714 | $ | 131,448 | |||||
| Non-cash consideration related to acquired intercompany balances | — | 202 | 202 | ||||||||
| Total consideration, net of cash acquired | $ | 123,734 | $ | 7,916 | $ | 131,650 | |||||
Components of amounts reflected in the aggregate and therefore, have omitted the pro forma disclosures and sales and profits attributable to acquisitions under ASC 805-10-50.
| (amounts in thousands) | 2023 | 2022 | 2021 | ||||||||||||||||||||||||||
| Net revenues | $ | 301,876 | $ | 611,048 | $ | 610,737 | |||||||||||||||||||||||
| Cost of sales | 211,575 | 451,542 | 458,387 | ||||||||||||||||||||||||||
| Gross margin | 90,301 | 159,506 | 152,350 | ||||||||||||||||||||||||||
| Selling, general and administrative | 62,263 | 112,015 | 100,378 | ||||||||||||||||||||||||||
| Restructuring and asset related charges | — | 611 | 394 | ||||||||||||||||||||||||||
| Operating income | 28,038 | 46,880 | 51,578 | ||||||||||||||||||||||||||
| Interest (income) expense, net | (685) | (445) | 778 | ||||||||||||||||||||||||||
| Other income, net | (2,274) | (1,448) | (2,604) | ||||||||||||||||||||||||||
| Income from discontinued operations before taxes | 30,997 | 48,773 | 53,404 | ||||||||||||||||||||||||||
| Income tax expense | 9,486 | 15,269 | 15,904 | ||||||||||||||||||||||||||
| Income from discontinued operations, net of tax | $ | 21,511 | $ | 33,504 | $ | 37,500 | |||||||||||||||||||||||
F-18
| (amounts in thousands) | 2017 | 2016 | 2015 | |||||||||
| Net revenues | $ | — | $ | 7,593 | $ | 7,919 | ||||||
| Loss before tax and non-controlling interest | — | (3,513 | ) | (2,853 | ) | |||||||
| Loss from discontinued operations, net of tax | — | (3,324 | ) | (2,856 | ) | |||||||
| For the Years Ended December 31, | |||||||||||||||||||||||
| (amounts in thousands) | 2023 | 2022 | 2021 | ||||||||||||||||||||
| Depreciation and amortization | $ | 5,196 | $ | 18,622 | $ | 20,892 | |||||||||||||||||
| Capital expenditures | 6,229 | 7,746 | 5,492 | ||||||||||||||||||||
| Share-based incentive compensation | 926 | 1,591 | 221 | ||||||||||||||||||||
| Provision for bad debt | 5,062 | 392 | 86 | ||||||||||||||||||||
Note 4.3. Accounts Receivable
We sell our manufactured products to a large number of customers, primarily in the residential housing construction and remodel sectors, broadly dispersed across many domestic and foreign geographic regions. We assess the credit risk relating to our accounts receivable based on quantitative and qualitative factors, including historical credit collections within each region where we have operations. We perform ongoing credit evaluations of our customers to minimize credit risk. We do not usually require collateral for accounts receivable, but willdo require advance payment, guarantees, a security interest in the products sold to a customer, and/or letters of credit in certain situations. Customer accounts receivable converted to notes receivable are primarily collateralized by inventory or other collateral. One windowTwo customers, The Home Depot and door customer from our North America segment represents 16.8%Lowe’s Companies, each accounted for more than 10% of the consolidated accounts receivable, net revenues in 2017, 16.3%balance as of net revenues in 2016December 31, 2023 and 15.2% of net revenues in 2015.
December 31, 2022.
The following is a roll forward of our allowance for doubtful accountscredit losses as of December 31:
| (amounts in thousands) | 2023 | 2022 | 2021 | ||||||||||||||
| Balance as of January 1, | $ | (15,429) | $ | (9,472) | $ | (12,107) | |||||||||||
| Charges to income (expense) | 1,870 | (7,287) | 957 | ||||||||||||||
| Write-offs | 2,466 | 941 | 1,423 | ||||||||||||||
| Currency translation | (172) | 389 | 255 | ||||||||||||||
| Balance at period end | $ | (11,265) | $ | (15,429) | $ | (9,472) | |||||||||||
The decrease in the allowance for credit losses during 2023 was primarily due to improved collections experience and an improved portfolio of aged receivables.
| (amounts in thousands) | 2017 | 2016 | 2015 | ||||||||
| Balance as of January 1, | $ | (3,839 | ) | $ | (3,664 | ) | $ | (4,166 | ) | ||
Acquisitions (Note 2) | (268 | ) | (755 | ) | — | ||||||
| Additions charged to expense | (1,227 | ) | (410 | ) | (530 | ) | |||||
| Deductions | 1,260 | 1,057 | 1,180 | ||||||||
| Currency translation | (372 | ) | (67 | ) | (148 | ) | |||||
| Balance as of end of period | $ | (4,446 | ) | $ | (3,839 | ) | $ | (3,664 | ) | ||
Note 5.4. Inventories
Inventories are stated at the lower of cost or net realizable value. Finished goods and work-in-process inventories include material, labor, and manufacturing overhead costs.
| (amounts in thousands) | 2023 | 2022 | |||||||||
| Raw materials | $ | 404,360 | $ | 481,388 | |||||||
| Work in process | 21,141 | 28,295 | |||||||||
| Finished goods | 84,608 | 108,880 | |||||||||
| Provision for obsolete or excess inventory | (28,658) | (24,092) | |||||||||
| Total inventories | $ | 481,451 | $ | 594,471 | |||||||
To conform with current period presentation, certain amounts in prior period information have been reclassified.
F-19
| (amounts in thousands) | 2017 | 2016 | |||||
| Raw materials | $ | 283,772 | $ | 233,730 | |||
| Work in process | 35,734 | 30,202 | |||||
| Finished goods | 85,847 | 70,702 | |||||
| Inventories | $ | 405,353 | $ | 334,634 | |||
Note 6. Other Current Assets
| (amounts in thousands) | 2017 | 2016 | |||||
| Prepaid assets | $ | 22,782 | $ | 18,943 | |||
| Refundable income taxes | 4,234 | 6,438 | |||||
Fair value of derivative instruments (Note 27) | 2,235 | 6,309 | |||||
| Other | 1,152 | 558 | |||||
| $ | 30,403 | $ | 32,248 | ||||
| (amounts in thousands) | 2023 | 2022 | |||||||||
| Land improvements | $ | 30,350 | $ | 31,606 | |||||||
| Buildings | 459,516 | 445,321 | |||||||||
| Machinery and equipment | 1,386,819 | 1,343,119 | |||||||||
| Total depreciable assets | 1,876,685 | 1,820,046 | |||||||||
| Accumulated depreciation | (1,322,129) | (1,255,747) | |||||||||
| 554,556 | 564,299 | ||||||||||
| Land | 28,262 | 28,939 | |||||||||
| Construction in progress | 61,424 | 48,766 | |||||||||
| Total property and equipment, net | $ | 644,242 | $ | 642,004 | |||||||
| (amounts in thousands) | 2017 | 2016 | |||||
| Land improvements | $ | 33,026 | $ | 32,458 | |||
| Buildings | 468,355 | 435,577 | |||||
| Machinery and equipment | 1,237,915 | 1,158,232 | |||||
| Total depreciable assets | 1,739,296 | 1,626,267 | |||||
| Accumulated depreciation | (1,106,913 | ) | (1,008,031 | ) | |||
| 632,383 | 618,236 | ||||||
| Land | 68,312 | 60,500 | |||||
| Construction in progress | 56,016 | 25,915 | |||||
| $ | 756,711 | $ | 704,651 | ||||
We monitor all property,recorded accelerated depreciation of our plant and equipment for any indicators of potential impairment. We recorded impairment charges of $1.5$7.4 million, $3.0$0.7 million and $2.7$2.0 million during the years ended December 31, 2017, 2016,2023, December 31, 2022 and 2015, respectively.December 31, 2021, respectively, within restructuring and asset related charges in the accompanying consolidated statements of operations. For more information, refer to Note 19 - Restructuring and Asset Related Charges.
During the twelve months ended December 31, 2023, we recorded $9.1 million of accelerated depreciation resulting from reviews of our North America equipment capacity optimization. These charges were recorded within cost of sales in the accompanying consolidated statements of operations.
The effect on our carrying value of property and equipment due to currency translations for foreign assetsproperty and equipment, net, was an increase of $27.9$7.9 million and a decrease of $9.9$14.1 million for the years ended December 31, 20172023 and 2016, respectively.
2022, respectively.
Depreciation expense was recorded as follows for the years ended December 31:follows:
| (amounts in thousands) | 2023 | 2022 | 2021 | ||||||||||||||||||||||||||
| Cost of sales | $ | 89,396 | $ | 80,235 | $ | 81,518 | |||||||||||||||||||||||
| Selling, general and administrative | 5,191 | 5,376 | 6,158 | ||||||||||||||||||||||||||
| Total depreciation expense | $ | 94,587 | $ | 85,611 | $ | 87,676 | |||||||||||||||||||||||
| (amounts in thousands) | 2017 | 2016 | 2015 | |||||||||
| Cost of sales | $ | 78,975 | $ | 78,608 | $ | 73,913 | ||||||
| Selling, general and administrative | 7,835 | 7,839 | 8,264 | |||||||||
| $ | 86,810 | $ | 86,447 | $ | 82,177 | |||||||
Note 8.6. Goodwill
The following table summarizes the changes in goodwill by reportable segment:
| (amounts in thousands) | North America | Europe | Total Reportable Segments | ||||||||||||||||||||
| Balance as of December 31, 2021 | $ | 182,645 | $ | 278,668 | $ | 461,313 | |||||||||||||||||
| Impairment | — | (54,885) | (54,885) | ||||||||||||||||||||
| Currency translation | (376) | (24,099) | (24,475) | ||||||||||||||||||||
| Balance as of December 31, 2022 | $ | 182,269 | $ | 199,684 | $ | 381,953 | |||||||||||||||||
| Currency translation | 143 | 8,074 | 8,217 | ||||||||||||||||||||
| Balance as of December 31, 2023 | $ | 182,412 | $ | 207,758 | $ | 390,170 | |||||||||||||||||
| (amounts in thousands) | North America | Europe | Australasia | Total Reportable Segments | |||||||||||
| Balance as of December 31, 2015 | $ | 187,102 | $ | 240,187 | $ | 55,217 | $ | 482,506 | |||||||
| Acquisitions | — | — | 15,935 | 15,935 | |||||||||||
| Acquisition remeasurements | — | (3,140 | ) | (643 | ) | (3,783 | ) | ||||||||
| Currency translation | 274 | (7,070 | ) | (942 | ) | (7,738 | ) | ||||||||
| Balance as of December 31, 2016 | $ | 187,376 | $ | 229,977 | $ | 69,567 | $ | 486,920 | |||||||
| Acquisitions | 30,251 | 8,569 | 8,934 | 47,754 | |||||||||||
| Acquisition remeasurements | (16,504 | ) | (2,734 | ) | (4,376 | ) | (23,614 | ) | |||||||
| Currency translation | 437 | 32,350 | 5,216 | 38,003 | |||||||||||
| Balance as of December 31, 2017 | $ | 201,560 | $ | 268,162 | $ | 79,341 | $ | 549,063 | |||||||
F-20
Note 9.7. Intangible Assets, Net
| (amounts in thousands) | |||
| Balance as of December 31, 2015 | $ | 78,318 | |
| Acquisitions | 44,975 | ||
| Acquisition remeasurements | 2,194 | ||
| Additions, (net of $314 write-offs) | 5,357 | ||
| Amortization | (12,733 | ) | |
| Currency translation | (2,386 | ) | |
| Balance as of December 31, 2016 | $ | 115,725 | |
| Acquisitions | 30,430 | ||
| Acquisition remeasurements | 16,282 | ||
| Additions, (net of $137 write-offs) | 12,719 | ||
| Amortization | (15,896 | ) | |
| Currency translation | 7,053 | ||
| Balance as of December 31, 2017 | $ | 166,313 | |
The cost and accumulated amortization values of our intangible assets were as follows asfollows:
| December 31, 2023 | |||||||||||||||||
| (amounts in thousands) | Cost | Accumulated Amortization | Net Book Value | ||||||||||||||
| Customer relationships and agreements | $ | 123,713 | $ | (84,281) | $ | 39,432 | |||||||||||
| Software | 113,429 | (58,424) | 55,005 | ||||||||||||||
| Trademarks and trade names | 32,148 | (10,802) | 21,346 | ||||||||||||||
| Patents, licenses and rights | 12,666 | (4,539) | 8,127 | ||||||||||||||
| Total amortizable intangibles | $ | 281,956 | $ | (158,046) | $ | 123,910 | |||||||||||
| December 31, 2022 | |||||||||||||||||
| (amounts in thousands) | Cost | Accumulated Amortization | Net Book Value | ||||||||||||||
| Customer relationships and agreements | $ | 121,461 | $ | (73,182) | $ | 48,279 | |||||||||||
| Software | 108,611 | (36,231) | 72,380 | ||||||||||||||
| Trademarks and trade names | 31,789 | (9,000) | 22,789 | ||||||||||||||
| Patents, licenses and rights | 9,942 | (5,284) | 4,658 | ||||||||||||||
| Total amortizable intangibles | $ | 271,803 | $ | (123,697) | $ | 148,106 | |||||||||||
We recorded accelerated amortization of $14.1 million during the year ended December 31:
| (amounts in thousands) | 2017 | 2016 | |||||
| Trademarks and trade names | $ | 38,600 | $ | 28,709 | |||
| Software | 35,191 | 24,397 | |||||
| Patents, licenses and rights | 47,385 | 37,470 | |||||
| Customer relationships and agreements | 105,485 | 69,621 | |||||
| Total amortizable intangibles | $ | 226,661 | $ | 160,197 | |||
| Accumulated amortization | (60,348 | ) | (46,972 | ) | |||
| $ | 166,313 | $ | 113,225 | ||||
| Indefinite-lived intangibles | — | 2,500 | |||||
| $ | 166,313 | $ | 115,725 | ||||
The effect on our carrying value of intangible assets due to currency translations for foreign intangible assets was an increase of $0.7 million and a decrease of $2.1 million for the year ended December 31, 2023 and December 31, 2022, respectively.
Amortization expense was recorded as follows forfollows:
| (amounts in thousands) | 2023 | 2022 | 2021 | ||||||||||||||||||||||||||
| Amortization expense | $ | 36,523 | $ | 26,141 | $ | 25,678 | |||||||||||||||||||||||
Estimated future amortization expense:
| (amounts in thousands) | ||||||||
| 2024 | $ | 34,383 | ||||||
| 2025 | 15,662 | |||||||
| 2026 | 14,222 | |||||||
| 2027 | 13,806 | |||||||
| 2028 | 12,484 | |||||||
| Thereafter | 33,353 | |||||||
| $ | 123,910 | |||||||
F-21
Note 8. Leases
We lease certain warehouses, distribution centers, office spaces, land, vehicles, and equipment.
Lease ROU assets and liabilities at December 31 were as follows:
| (amounts in thousands) | Balance Sheet Location | 2023 | 2022 | |||||||||||||||||||||||
| Assets: | ||||||||||||||||||||||||||
| Operating | Operating lease assets, net | $ | 146,931 | $ | 128,993 | |||||||||||||||||||||
| Finance | Property and equipment, net (1) | 6,994 | 3,612 | |||||||||||||||||||||||
| Total lease assets | $ | 153,925 | $ | 132,605 | ||||||||||||||||||||||
| Liabilities: | ||||||||||||||||||||||||||
| Current: | ||||||||||||||||||||||||||
| Operating | Accrued expense and other current liabilities | $ | 32,477 | $ | 31,152 | |||||||||||||||||||||
| Finance | Current maturities of long-term debt | 2,407 | 1,486 | |||||||||||||||||||||||
| Noncurrent: | ||||||||||||||||||||||||||
| Operating | Operating lease liability | 121,993 | 105,068 | |||||||||||||||||||||||
| Finance | Long-term debt | 4,801 | 2,167 | |||||||||||||||||||||||
| Total lease liability | $ | 161,678 | $ | 139,873 | ||||||||||||||||||||||
(1) Finance lease assets are recorded net of accumulated depreciation of $5.1 million and $3.7 million as of December 31, 2023 and December 31, 2022, respectively.
During the years ended December 31:
| (amounts in thousands) | 2017 | 2016 | 2015 | |||||||||
| Amortization expense | $ | 15,896 | $ | 12,733 | $ | 7,861 | ||||||
| 2018 | $ | 17,831 | |
| 2019 | 17,246 | ||
| 2020 | 16,512 | ||
| 2021 | 15,541 | ||
| 2022 | 14,558 | ||
| Thereafter | 84,625 | ||
| $ | 166,313 | ||
| (amounts in thousands) | 2017 | 2016 | |||||
Investments (Note 11) | $ | 33,187 | $ | 29,476 | |||
| Customer displays | 12,702 | 11,886 | |||||
Long-term notes receivable (Note 12) | 4,984 | 6,346 | |||||
| Other | 3,772 | 9,060 | |||||
| Deposits | 3,640 | 3,784 | |||||
| Debt issuance costs | 2,045 | 1,910 | |||||
| Other long-term accounts receivable | 1,556 | 1,085 | |||||
| $ | 61,886 | $ | 63,547 | ||||
During the years ended December 31, 2023 and December 31, 2022, we obtained $5.4 million and $0.6 million in right-of-use assets, respectively, in exchange for finance lease liabilities.
The components of amortization is included in total depreciation and amortization in SG&Alease expense for the years ended December 31 2017, 2016 and 2015, respectively. As of December 2016, costs associated with our IPO of $5.6 million are included in the “Other” line above and were subsequently charged to equity upon completion of the IPO.as follows:
| (amounts in thousands) | 2023 | 2022 | 2021 | ||||||||||||||||||||
| Operating | $ | 41,942 | $ | 42,616 | $ | 42,518 | |||||||||||||||||
| Short term | 13,324 | 13,816 | 13,560 | ||||||||||||||||||||
| Variable | 6,571 | 7,287 | 6,400 | ||||||||||||||||||||
| Low value | 1,600 | 1,723 | 1,554 | ||||||||||||||||||||
| Finance | 313 | 139 | 178 | ||||||||||||||||||||
| Total lease costs | $ | 63,750 | $ | 65,581 | $ | 64,210 | |||||||||||||||||
| 2023 | 2022 | ||||||||||||||||
| Weighted average remaining lease terms (years): | |||||||||||||||||
| Operating | 5.7 | 6.1 | |||||||||||||||
| Finance | 4.1 | 2.9 | |||||||||||||||
| Weighted average discount rate: | |||||||||||||||||
| Operating | 5.6% | 4.8% | |||||||||||||||
| Finance | 6.4% | 3.5% | |||||||||||||||
F-22
| December 31, 2023 | |||||||||||||||||
| (amounts in thousands) | Operating Leases (1) | Finance Leases | Total | ||||||||||||||
| 2024 | $ | 41,934 | $ | 2,597 | $ | 44,531 | |||||||||||
| 2025 | 39,229 | 1,752 | 40,981 | ||||||||||||||
| 2026 | 27,503 | 1,445 | 28,948 | ||||||||||||||
| 2027 | 22,031 | 1,322 | 23,353 | ||||||||||||||
| 2028 | 17,447 | 682 | 18,129 | ||||||||||||||
| Thereafter | 36,481 | 239 | 36,720 | ||||||||||||||
| Total lease payments | 184,625 | 8,037 | 192,662 | ||||||||||||||
| Less: Interest | 30,155 | 829 | 30,984 | ||||||||||||||
| Present value of lease liability | $ | 154,470 | $ | 7,208 | $ | 161,678 | |||||||||||
| (amounts in thousands) | Equity | Cost | Total | ||||||||
| Ending balance, December 31, 2015 | $ | 25,834 | $ | 370 | $ | 26,204 | |||||
| Equity earnings | 3,791 | — | 3,791 | ||||||||
| Other | (519 | ) | — | (519 | ) | ||||||
| Ending balance, December 31, 2016 | $ | 29,106 | $ | 370 | $ | 29,476 | |||||
| Equity earnings | 3,639 | — | 3,639 | ||||||||
| Additions | — | 6 | 6 | ||||||||
| Other | — | 66 | 66 | ||||||||
| Ending balance, December 31, 2017 | $ | 32,745 | $ | 442 | $ | 33,187 | |||||
| Net loans and advances to affiliates at | |||||||||||
| December 31, 2016 | $ | 745 | $ | 3,768 | $ | 4,513 | |||||
| December 31, 2017 | $ | 720 | $ | — | $ | 720 | |||||
| (amounts in thousands) | 2017 | 2016 | |||||
| Assets | |||||||
| Current assets | $ | 96,127 | $ | 92,337 | |||
| Non-current assets | 23,539 | 21,079 | |||||
| Total assets | $ | 119,666 | $ | 113,416 | |||
| Liabilities | |||||||
| Current liabilities | $ | 18,151 | $ | 18,722 | |||
| Non-current liabilities | 35,632 | 37,499 | |||||
| Total liabilities | 53,783 | 56,221 | |||||
| Net worth | $ | 65,883 | $ | 57,195 | |||
| (amounts in thousands) | 2017 | 2016 | 2015 | ||||||||
| Net sales | $ | 354,964 | $ | 314,036 | $ | 361,013 | |||||
| Gross profit | 74,399 | 66,417 | 82,914 | ||||||||
| Net income | 6,870 | 7,750 | 4,628 | ||||||||
| Adjustment for profit (loss) in inventory | 204 | (84 | ) | 70 | |||||||
| Net income attributable to Company | 3,639 | 3,791 | 2,384 | ||||||||
Note 12. Notes Receivable
| (amounts in thousands) | 2017 Year-End Interest Rate | 2017 | 2016 | ||||||
| Employee demand notes secured by Company stock | 6.00% - 6.25% | $ | 233 | $ | 238 | ||||
| Installment notes | 0.00% - 14.00% | 5,082 | 2,865 | ||||||
| Affiliate notes | N/A | — | 3,768 | ||||||
| Accrued interest | 19 | 24 | |||||||
| Allowance for doubtful notes | (112 | ) | (353 | ) | |||||
| 5,222 | 6,542 | ||||||||
| Current maturities and interest, net of short-term allowance | (238 | ) | (196 | ) | |||||
| Long-term notes receivable, net of allowance | $ | 4,984 | $ | 6,346 | |||||
| (amounts in thousands) | 2023 | 2022 | |||||||||
| Accrued bonuses and commissions | $ | 45,742 | $ | 18,911 | |||||||
| Accrued vacation | 31,510 | 31,921 | |||||||||
| Accrued payroll | 30,018 | 30,304 | |||||||||
| Accrued payroll taxes | 13,898 | 11,560 | |||||||||
| Other accrued benefits | 10,072 | 13,052 | |||||||||
| Non-U.S. defined contributions and other accrued benefits | 1,310 | 1,254 | |||||||||
| Total accrued payroll and benefits | $ | 132,550 | $ | 107,002 | |||||||
| (amounts in thousands) | 2017 | 2016 | |||||
| Accrued vacation | $ | 49,398 | $ | 51,867 | |||
| Accrued management bonus | 16,487 | 31,243 | |||||
| Accrued payroll and commissions | 16,421 | 14,091 | |||||
| Accrued payroll taxes | 15,974 | 15,338 | |||||
| Other accrued benefits | 13,623 | 11,343 | |||||
| Non US defined contributions and other accrued benefits | 10,309 | 6,786 | |||||
| $ | 122,212 | $ | 130,668 | ||||
Note 14.10. Accrued Expenses and Other Current Liabilities
| (amounts in thousands) | December 31, 2023 | December 31, 2022 | |||||||||
| Accrued sales and advertising rebates | $ | 82,732 | $ | 90,461 | |||||||
| Current portion of operating lease liability | 32,477 | 31,152 | |||||||||
Current portion of warranty liability (Note 11) | 22,819 | 21,215 | |||||||||
| Non-income related taxes | 20,072 | 22,615 | |||||||||
| Accrued freight | 18,963 | 17,377 | |||||||||
| Accrued expenses | 15,758 | 13,505 | |||||||||
| Current portion of accrued claim costs relating to self-insurance programs | 14,079 | 16,231 | |||||||||
| Accrued income taxes payable | 9,252 | 9,368 | |||||||||
| Deferred revenue and customer deposits | 7,189 | 10,084 | |||||||||
Current portion of restructuring accrual (Note 19) | 3,375 | 5,021 | |||||||||
Current portion of derivative liability (Note 23) | 2,996 | 3,346 | |||||||||
| Accrued interest payable | 1,401 | 4,036 | |||||||||
Legal claims provision (Note 25) | 2,683 | 3,490 | |||||||||
| Total accrued expenses and other current liabilities | $ | 233,796 | $ | 247,901 | |||||||
The accrued sales and advertising rebates, accrued interest payable, accrued freight, and non-income related taxes can fluctuate significantly period-over-period due to timing of payments.
F-23
| (amounts in thousands) | 2017 | 2016 | |||||
| Accrued sales and advertising rebates | $ | 73,585 | $ | 70,862 | |||
| Accrued expenses | 26,126 | 25,243 | |||||
| Other accrued taxes | 19,996 | 19,474 | |||||
Current portion of warranty liability (Note 15) | 19,547 | 18,240 | |||||
| Current portion of accrued claim costs relating to self-insurance programs | 12,866 | 11,965 | |||||
| Current portion of deferred income | 11,511 | 11,644 | |||||
Current portion of accrued income taxes payable (Note 18) | 10,962 | 4,693 | |||||
Current portion of restructuring accrual (Note 24) | 7,162 | 1,467 | |||||
Current portion of derivative liability (Note 27) | 2,905 | 9,741 | |||||
| Accrued interest payable | 1,945 | 272 | |||||
| $ | 186,605 | $ | 173,601 | ||||
Note 15.11. Warranty Liability
Warranty terms range primarilyvary from one year to lifetime on certain window and door components. Warranties are normally limited to replacementservicing or service ofreplacing defective components for the original customer. Product defects arising within six months of sale are classified as manufacturing defects and are not included in the current period expense below. Some warranties are transferable to subsequent owners and are either limited to 10 years from the date of manufacture or require pro-rata payments from the customer. A provision for estimated warranty costs is recorded at the time of sale based on historical experience and weis periodically adjust these provisionsadjusted to reflect actual experience.
An analysis of our warranty liability is as follows:
| (amounts in thousands) | 2017 | 2016 | 2015 | |||||||||||||||||||||||||||||||||||||||||||
| (amounts in thousands) | ||||||||||||||||||||||||||||||||||||||||||||||
| (amounts in thousands) | 2023 | 2022 | 2021 | |||||||||||||||||||||||||||||||||||||||||||
| Balance as of January 1 | $ | 45,398 | $ | 44,891 | $ | 45,843 | ||||||||||||||||||||||||||||||||||||||||
| Current period expense | 17,674 | 17,992 | 16,838 | |||||||||||||||||||||||||||||||||||||||||||
| Liabilities assumed due to acquisition | 95 | — | 718 | |||||||||||||||||||||||||||||||||||||||||||
| Current period charges | ||||||||||||||||||||||||||||||||||||||||||||||
| Experience adjustments | ||||||||||||||||||||||||||||||||||||||||||||||
| Experience adjustments | ||||||||||||||||||||||||||||||||||||||||||||||
| Experience adjustments | (614 | ) | (3,846 | ) | (2,668 | ) | ||||||||||||||||||||||||||||||||||||||||
| Payments | (17,255 | ) | (13,527 | ) | (14,172 | ) | ||||||||||||||||||||||||||||||||||||||||
Transfers to liabilities held for sale (Note 20) | ||||||||||||||||||||||||||||||||||||||||||||||
| Currency translation | 958 | (112 | ) | (1,668 | ) | |||||||||||||||||||||||||||||||||||||||||
| Balance as of end of period | 46,256 | 45,398 | 44,891 | |||||||||||||||||||||||||||||||||||||||||||
| Balance at period end | ||||||||||||||||||||||||||||||||||||||||||||||
| Current portion | (19,547 | ) | (18,240 | ) | (16,802 | ) | ||||||||||||||||||||||||||||||||||||||||
| Long-term portion | $ | 26,709 | $ | 27,158 | $ | 28,089 | ||||||||||||||||||||||||||||||||||||||||
The most significant component of our warranty liability iswas in the North America segment. As of December 31, 2023, the warranty liability in the North America segment which totaled $41.2$46.5 million, at December 31, 2017 after discounting future estimated cash flows at rates between 0.76%0.53% and 4.75%4.01%. Without discounting, the liability would have been higherincreased by approximately $2.7$3.8 million. During the second quarter of 2016, we recorded an out-of-period adjustment which increased our warranty expense and reserve by approximately $2.5 million. The current and long-term portions of the warranty liability are included in accrued expenses and other current liabilities, and deferred credits and other liabilities, respectively, in the accompanying consolidated balance sheets. This correction was not material to our accompanying consolidated financial statements or to our previously issued financial statements. The current and long-term portions of the warranty liability are included in accrued expenses and other current liabilities, and deferred credits and other liabilities, respectively, in the accompanying consolidated balance sheets.
F-24
Note 16. Notes Payable and12. Long-Term Debt
| (amounts in thousands) | 2017 Year-end Interest Rate | 2017 | 2016 | ||||||
| Variable rate industrial revenue bonds | N/A | $ | — | $ | 205 | ||||
Our long-term debt, net of original issue discount and unamortized debt issuance costs, consisted of the following as of December 31:following:
| December 31, 2023 | December 31, 2023 | December 31, 2022 | |||||||||||||||
| (amounts in thousands) | Interest Rate | ||||||||||||||||
| Senior Notes | 4.63% - 4.88% | $ | 600,000 | $ | 800,000 | ||||||||||||
| Senior Secured Notes | — | 250,000 | |||||||||||||||
| Term Loan Facility | 7.72%(1) | 536,250 | 541,750 | ||||||||||||||
| Revolving credit facility | — | 55,000 | |||||||||||||||
| Finance leases and other financing arrangements | 1.00% - 8.28% | 74,460 | 89,258 | ||||||||||||||
| Mortgage notes | 5.67% - 6.17% | 22,070 | 22,472 | ||||||||||||||
| Total Debt | 1,232,780 | 1,758,480 | |||||||||||||||
| Unamortized debt issuance costs and original issue discounts | (6,528) | (11,597) | |||||||||||||||
| Current maturities of long-term debt | (36,177) | (34,093) | |||||||||||||||
| Long-term debt | $ | 1,190,075 | $ | 1,712,790 | |||||||||||||
| (amounts in thousands) | 2017 Year-end Effective Interest Rate | 2017 | 2016 | ||||||
| Senior notes | 4.63% - 4.88% | $ | 800,000 | $ | — | ||||
| Term loans, net of original discount of $0 and $8,086, respectively | 3.69% - 5.64% | 440,568 | 1,603,551 | ||||||
| Revolving credit facility | N/A | — | 742 | ||||||
| Mortgage notes | 1.15% | 33,517 | 29,505 | ||||||
| Installment notes | 2.15% - 6.38% | 10,290 | 5,880 | ||||||
| Installment notes for stock | 3.00% - 4.25% | 1,944 | 3,260 | ||||||
| Unamortized debt issuance costs | (12,616 | ) | (23,108 | ) | |||||
| 1,273,703 | 1,619,830 | ||||||||
| Current maturities of long-term debt | (8,770 | ) | (19,826 | ) | |||||
| Long-term debt | $ | 1,264,933 | $ | 1,600,004 | |||||
To conform with current period presentation, certain amounts in prior period information have been reclassified.
| Maturities by year, excluding unamortized debt issuance costs and original issue discounts: | ||||||||
| 2024 | $ | 36,177 | ||||||
| 2025 | 221,749 | |||||||
| 2026 | 19,243 | |||||||
| 2027 | 415,025 | |||||||
| 2028 | 522,809 | |||||||
| Maturities by year: | ||||
| 2018 | $ | 8,770 | ||
| 2019 | 6,697 | |||
| 2020 | 6,551 | |||
| 2021 | 5,883 | |||
| 2022 | 5,495 | |||
| Thereafter | 1,240,307 | |||
| $ | 1,273,703 | |||
Summaries of our significant changes to outstanding debt agreements as of December 31, 20172023 are as follows:
Senior Secured Notes and Senior Notes -
In December 2017, we issued $800.0 million of unsecured Senior Notes in two tranches: $400.0 million bearing interest at 4.625%4.63% and maturing in December 2025 (“4.63% Senior Notes”), and $400.0 million bearing interest at 4.875%4.88% and maturing in December 2027 in a private placement for resale to qualified institutional buyers pursuant to Rule 144A under the Securities Act. Each tranche was
In May 2020, we issued $250.0 million of Senior Secured Notes bearing interest at par.6.25% and maturing in May 2025 (“6.25% Senior Secured Notes”) in a private placement for resale to qualified institutional buyers pursuant to Rule 144A under the Securities Act. The proceeds were net of fees and expenses associated with debt issuance, including an underwriting fee of 1.25%. Interest is payable semiannually, in arrears, each JuneMay and December through maturity, beginningNovember.
On August 3, 2023, we redeemed all $250.0 million of our 6.25% Senior Secured Notes and $200.0 million of our 4.63% Senior Notes. The Company recognized a pre-tax loss of $6.5 million on the redemption in 2018. Debt issuance costs of $11.7 million will be amortized to interest expense over the life of the notes using the effective interest method. The Senior Notes contain certain restrictive covenants for which we were in compliance as ofyear ended December 31, 2017.2023, consisting of $3.9 million in call premium and $2.6 million in accelerated amortization of debt issuance costs.
Term Loan Facility
U.S. Facility - In July 2015,Initially executed in October 2014, we amended ourthe Term Loan Facility in July 2021 to, among other things, extend the maturity date from December 2024 to July 2028 and borrowed anprovide additional $480.0 million. The proceeds were primarily usedcovenant flexibility. Pursuant to make payments of approximately $431.0 million to holders of our then outstanding common stock, Series A Convertible Preferred Stock, Class B-1 Common Stock, options,the amendment, certain existing and RSUs. We incurred $7.9new lenders advanced $550.0 million of debt issuance costs related toreplacement term loans, the $480.0 millionproceeds of incremental borrowings.
F-25
extinguishment costs of the prior amendments. We incurred $0.7$1.3 million, which included $1.0 million of unamortized debt issuance costs and original discount fees. As of the date of the amendment, the outstanding principal balance, net of original issue discount, was $548.6 million.
In June 2023, we amended the Term Loan Facility to replace LIBOR with a Term SOFR based rate as the successor benchmark rate and made certain other technical amendments and related conforming changes. All other material terms and conditions were unchanged.
In January 2024, we amended the Term Loan Facility to lower the applicable margin for replacement term loans, remove certain provisions no longer relevant to the parties, and make certain other technical amendments and related to thisconforming changes. Pursuant to the amendment, which are being amortizedreplacement term loans bear interest at SOFR plus a margin of 1.75% to interest expense over2.00% depending on JWI’s corporate credit ratings, compared to a margin of 2.00% to 2.25% under the life of the facility using the effective interest method. The facility contains certain restrictive covenants for which we were in compliance as of December 31, 2017.
As of December 31, 2023, the outstanding principal balance, net of original issue discount, was $535.3 million.
In May 2020, we entered into interest rate swap agreements with a weighted average fixed rate of 0.395% paid against one-month LIBOR floored at 0.00% with outstanding notional amounts aggregating to $370.0 million corresponding to that amount of the debt outstanding under our Term Loan Facility. In June 2023, the interest rate swap agreements were amended to convert to a SOFR basis on June 30, 2023, resulting in a weighted average fixed rate of 0.317% paid against one-month USD-SOFR CME Term floored at (0.10)%. The interest rate swap agreements were designated as cash flow hedges of a portion of the interest obligations on our Term Loan Facility we amended our $300.0 million ABL Facility. The facility will now matureborrowings and matured in December 2022 (extended from October 2019) and bears interest primarily at LIBOR (subject to a floor of 0.00%) plus a margin of 1.25% to 1.75%, determined by availability. This compares favorably to the rate of LIBOR (subject to a floor of 0.00%) plus a margin of 1.50% to 2.00% under the previous amendment. This amendment also makes certain adjustments to the borrowing base and modifies other terms and provisions, including providing2023. See Note 23 - Derivative Financial Instruments for additional covenant flexibilityinformation on our derivative assets and additional flexibility under the facility, and conforming to certain terms and provisions of the Senior Notes and Term Loan Facility.liabilities.
ABL Facility we expensed $0.2 million of unamortized loan fees as a loss on extinguishment of debt - Initially executed in the accompanying consolidated statements of operations.
commitments. The ABL Facility has a minimum fixed charge coverage ratio that we are obligated to comply with under certain circumstances. The ABL Facility has various non-financial covenants, including restrictions on liens, indebtedness, and dividends, customary representations and warranties, and customary events of defaults and remedies. We were in compliance with the non-financial covenants as of December 31, 2017. The ABL Facility permits us to request commitment increases up to the greater of $100 million, or the greatest amount by which the borrowing base has exceeded the maximum global credit amount at the end of any of the twelve fiscal months prior to the effective date of the commitment increase, subject to certain conditions.
In June 2023, we amended the unutilized amount ofABL Facility to replace LIBOR with a Term SOFR based rate as the facility. successor benchmark rate and made certain other technical amendments and related conforming changes. All other material terms and conditions were unchanged.
As of December 31, 2017,2023, we had no outstanding borrowings, €0.3$10.6 million (or $0.4 million)in letters of bank guarantees outstanding,credit and €38.7$462.3 million (or $46.3 million) available under this facility. The facility requires JELD-WEN A/S to maintain certain financial ratios, including a maximum ratio of senior leverage to Adjusted EBITDA (as calculated therein), and a minimum ratio of Adjusted EBITDA (as calculated therein) to net finance charges with which we were in compliance as of December 31, 2017. In addition, the facility has various non-financial covenants including restrictions on liens, indebtedness, and dividends, customary representations and warranties, and customary events of default and remedies.ABL Facility.
Mortgage Note- Notes – In December 2007, we entered into thirty-year mortgage notes secured by land and buildings in Denmark with principal payments beginningwhich began in 2018. As of December 31, 2017,2023, we had DKK 208.2148.6 million (or $33.5($22.1 million) outstanding under these notes.
F-26
Note 17.13. Deferred Credits and Other Liabilities
Included in deferred credits and other liabilities is the long-term portion of the following liabilities as of December 31:
| (amounts in thousands) | 2023 | 2022 | |||||||||
Uncertain tax positions (Note 15) | $ | 36,804 | $ | 31,828 | |||||||
Warranty liability (Note 11) | $ | 30,428 | $ | 31,174 | |||||||
| Workers' compensation claims accrual | 21,875 | 20,331 | |||||||||
Environmental contingencies (Note 25) | 11,500 | 11,800 | |||||||||
| Other liabilities | 4,224 | 726 | |||||||||
| Deferred income | — | 77 | |||||||||
| Total deferred credits and other liabilities | $ | 104,831 | $ | 95,936 | |||||||
Note 14. Segment Information
| (amounts in thousands) | 2017 | 2016 | |||||
Warranty liability (Note 15) | $ | 26,709 | $ | 27,158 | |||
Headquarter lease liability (Note 7) | 19,860 | — | |||||
Uncertain tax positions (Note 18) | 14,519 | 12,054 | |||||
| Workers' compensation claims accrual | 14,179 | 13,966 | |||||
Long term accrued income taxes payable (Note 18) | 11,275 | — | |||||
| Other liabilities | 9,444 | 10,508 | |||||
| Restructuring accrual | 3,877 | 3,552 | |||||
| Over-market lease liabilities | 2,142 | 2,830 | |||||
| Deferred income | 609 | 509 | |||||
Long term derivative liability (Note 27) | — | 3,878 | |||||
| $ | 102,614 | $ | 74,455 | ||||
We have two reportable segments, organized and managed principally in geographic regions: North America and Europe. We report all other business activities in Corporate and unallocated costs. Factors considered in determining the two reportable segments include the nature of business activities, the management structure accountable directly to the CODM, the discrete financial information regularly reviewed by the CODM, and information presented to the Board of Directors and investors. No operating segments have been aggregated for our presentation of reportable segments.
F-27
The over-market lease liabilitiesfollowing tables set forth certain information relating to our segments’ operations:
| (amounts in thousands) | North America | Europe | Total Operating Segments | Corporate and Unallocated Costs | Total Consolidated | ||||||||||||||||||||||||||||||
| Year Ended December 31, 2023 | |||||||||||||||||||||||||||||||||||
| Total net revenues | $ | 3,123,270 | $ | 1,187,118 | $ | 4,310,388 | $ | — | $ | 4,310,388 | |||||||||||||||||||||||||
| Intersegment net revenues | (214) | (5,840) | (6,054) | — | (6,054) | ||||||||||||||||||||||||||||||
| Net revenues from external customers | $ | 3,123,056 | $ | 1,181,278 | $ | 4,304,334 | $ | — | $ | 4,304,334 | |||||||||||||||||||||||||
| Capital expenditures | 72,582 | 25,630 | 98,212 | 6,441 | 104,653 | ||||||||||||||||||||||||||||||
| Segment assets | 1,694,201 | 944,963 | 2,639,164 | 340,961 | 2,980,125 | ||||||||||||||||||||||||||||||
| Year Ended December 31, 2022 | |||||||||||||||||||||||||||||||||||
| Total net revenues | $ | 3,260,166 | $ | 1,284,796 | $ | 4,544,962 | $ | — | $ | 4,544,962 | |||||||||||||||||||||||||
| Intersegment net revenues | (813) | (341) | (1,154) | — | (1,154) | ||||||||||||||||||||||||||||||
| Net revenues from external customers | $ | 3,259,353 | $ | 1,284,455 | $ | 4,543,808 | $ | — | $ | 4,543,808 | |||||||||||||||||||||||||
| Capital expenditures | 59,023 | 19,095 | $ | 78,118 | 6,356 | 84,474 | |||||||||||||||||||||||||||||
| Segment assets | 1,718,379 | 947,974 | 2,666,353 | 333,516 | 2,999,869 | ||||||||||||||||||||||||||||||
| Year Ended December 31, 2021 | |||||||||||||||||||||||||||||||||||
| Total net revenues | $ | 2,829,918 | $ | 1,355,111 | $ | 4,185,029 | $ | — | $ | 4,185,029 | |||||||||||||||||||||||||
| Intersegment net revenues | (678) | (2,661) | (3,339) | — | (3,339) | ||||||||||||||||||||||||||||||
| Net revenues from external customers | $ | 2,829,240 | $ | 1,352,450 | $ | 4,181,690 | $ | — | $ | 4,181,690 | |||||||||||||||||||||||||
| Capital expenditures | 49,805 | 29,611 | 79,416 | 14,785 | 94,201 | ||||||||||||||||||||||||||||||
| Segment assets | 1,634,937 | 1,188,024 | 2,822,961 | 373,714 | 3,196,675 | ||||||||||||||||||||||||||||||
F-28
| (amounts in thousands) | North America | Europe | Total Operating Segments | Corporate and Unallocated Costs | Total Consolidated | ||||||||||||||||||||||||||||||
| Year Ended December 31, 2023 | |||||||||||||||||||||||||||||||||||
| Income (loss) from continuing operations, net of tax | $ | 175,980 | $ | (3,335) | $ | 172,645 | $ | (147,410) | $ | 25,235 | |||||||||||||||||||||||||
Income tax expense (benefit)(1) | 79,210 | 44,095 | 123,305 | (59,966) | 63,339 | ||||||||||||||||||||||||||||||
Depreciation and amortization(2) | 79,900 | 30,185 | 110,085 | 24,911 | 134,996 | ||||||||||||||||||||||||||||||
| Interest expense, net | 4,713 | 3,224 | 7,937 | 64,321 | 72,258 | ||||||||||||||||||||||||||||||
| Restructuring and asset related charges | 29,207 | 5,738 | 34,945 | 796 | 35,741 | ||||||||||||||||||||||||||||||
| Net other special items | 13,179 | 1,548 | 14,727 | 34,143 | 48,870 | ||||||||||||||||||||||||||||||
| Adjusted EBITDA from continuing operations | $ | 382,189 | $ | 81,455 | $ | 463,644 | $ | (83,205) | $ | 380,439 | |||||||||||||||||||||||||
| Year Ended December 31, 2022 | |||||||||||||||||||||||||||||||||||
| Income (loss) from continuing operations, net of tax | $ | 260,590 | $ | (50,796) | $ | 209,794 | $ | (197,571) | $ | 12,223 | |||||||||||||||||||||||||
Income tax expense(3) | 6,963 | 3,307 | 10,270 | 7,771 | 18,041 | ||||||||||||||||||||||||||||||
| Depreciation and amortization | 69,427 | 31,139 | 100,566 | 12,566 | 113,132 | ||||||||||||||||||||||||||||||
| Interest expense, net | 4,011 | 6,193 | 10,204 | 72,301 | 82,505 | ||||||||||||||||||||||||||||||
| Goodwill impairment | — | 54,885 | 54,885 | — | 54,885 | ||||||||||||||||||||||||||||||
| Restructuring and asset related charges | 7,338 | 6,042 | 13,380 | 4,242 | 17,622 | ||||||||||||||||||||||||||||||
| Net other special items | 4,556 | 23,555 | 28,111 | 22,328 | 50,439 | ||||||||||||||||||||||||||||||
| Adjusted EBITDA from continuing operations | $ | 352,885 | $ | 74,325 | $ | 427,210 | $ | (78,363) | $ | 348,847 | |||||||||||||||||||||||||
| Year Ended December 31, 2021 | |||||||||||||||||||||||||||||||||||
| Income (loss) from continuing operations, net of tax | $ | 255,975 | $ | 66,596 | $ | 322,571 | $ | (191,249) | $ | 131,322 | |||||||||||||||||||||||||
Income tax expense (benefit)(3) | 5,704 | 16,980 | 22,684 | (3,048) | 19,636 | ||||||||||||||||||||||||||||||
| Depreciation and amortization | 72,095 | 32,855 | 104,950 | 11,405 | 116,355 | ||||||||||||||||||||||||||||||
| Interest expense, net | 6,080 | 9,282 | $ | 15,362 | 61,426 | 76,788 | |||||||||||||||||||||||||||||
| Restructuring and asset related charges, net | 1,200 | 1,453 | 2,653 | (97) | 2,556 | ||||||||||||||||||||||||||||||
| Net other special items | 11,827 | 126 | 11,953 | 34,164 | 46,117 | ||||||||||||||||||||||||||||||
| Adjusted EBITDA from continuing operations | $ | 352,881 | $ | 127,292 | $ | 480,173 | $ | (87,399) | $ | 392,774 | |||||||||||||||||||||||||
(1)Income tax expense in our Europe segment includes an increase in valuation allowance against our foreign net operating loss carryforwards of $30.0 million.
(2)Corporate and unallocated costs depreciation and amortization expense in the year ended December 31, 2023 includes accelerated amortization of $14.1 million for an ERP system that we intend to not utilize upon completion of the JW Australia Transition Services Agreement period. North America depreciation and amortization expense in the twelve months ended December 31, 2023 includes accelerated depreciation of $9.1 million from reviews of equipment capacity optimization.
(3)Income tax expense (benefit) in Corporate and unallocated costs in the year ended December 31, 2022 and December 31, 2021 includes the tax impact of U.S. Operations.
F-29
Reconciliations of income from continuing operations, net of tax to Adjusted EBITDA from continuing operations are as follows:
| Year Ended | |||||||||||||||||||||||||||||||||||||||||
| (amounts in thousands) | 2023 | 2022 | 2021 | ||||||||||||||||||||||||||||||||||||||
| Income from continuing operations, net of tax | $ | 25,235 | $ | 12,223 | $ | 131,322 | |||||||||||||||||||||||||||||||||||
Income tax expense(1) | 63,339 | 18,041 | 19,636 | ||||||||||||||||||||||||||||||||||||||
Depreciation and amortization(2) | 134,996 | 113,132 | 116,355 | ||||||||||||||||||||||||||||||||||||||
| Interest expense, net | 72,258 | 82,505 | 76,788 | ||||||||||||||||||||||||||||||||||||||
| Special items: | |||||||||||||||||||||||||||||||||||||||||
Net legal and professional expenses and settlements(3) | 28,184 | (287) | 15,598 | ||||||||||||||||||||||||||||||||||||||
Goodwill impairment(4) | — | 54,885 | — | ||||||||||||||||||||||||||||||||||||||
Restructuring and asset related charges(5) | 35,741 | 17,622 | 2,556 | ||||||||||||||||||||||||||||||||||||||
Other facility closure, consolidation, and related costs and adjustments(6) | 2,237 | 18,891 | 2,326 | ||||||||||||||||||||||||||||||||||||||
M&A related costs(7) | 6,575 | 9,752 | 5,206 | ||||||||||||||||||||||||||||||||||||||
Net (gain) loss on sale of property and equipment(8) | (10,523) | (8,036) | 2,086 | ||||||||||||||||||||||||||||||||||||||
Loss on extinguishment of debt(9) | 6,487 | — | 1,342 | ||||||||||||||||||||||||||||||||||||||
Share-based compensation expense(10) | 17,477 | 14,577 | 19,988 | ||||||||||||||||||||||||||||||||||||||
Pension settlement charge(11) | 4,349 | — | — | ||||||||||||||||||||||||||||||||||||||
Non-cash foreign exchange transaction/translation loss (income)(12) | 595 | 12,437 | (10,421) | ||||||||||||||||||||||||||||||||||||||
Other special items (13) | (6,511) | 3,105 | 9,992 | ||||||||||||||||||||||||||||||||||||||
| Adjusted EBITDA from continuing operations | $ | 380,439 | $ | 348,847 | $ | 392,774 | |||||||||||||||||||||||||||||||||||
(1)Income tax expense in twelve months ended December 31, 2023 includes an increase in valuation allowance against foreign net operating loss carryforwards of $30.0 million.
(2)Depreciation and amortization expense in the year ended December 31, 2023 includes accelerated amortization of $14.1 million in Corporate and unallocated costs for an ERP system that we intend to not utilize upon completion of the JW Australia Transition Services Agreement period. In addition, the year ended December 31, 2023 includes accelerated depreciation of $9.1 million in North America from reviews of equipment capacity optimization.
(3)Net legal and professional expenses and settlements include: (i) in the year ended December 31, 2023, $26.1 million in strategic transformation expenses; (ii) in the year ended December 31, 2022, ($10.5) million of income resulting from a legal settlement, partially offset by $3.9 million in legal expenses relating primarily to litigation, and $3.8 million in strategic transformation expenses; (iii) in the year ended December 31, 2021, $14.4 million in legal fees and settlements relating primarily to litigation.
(4)Goodwill impairment consists of goodwill impairment charges associated with our Europe reporting unit.
(5)Represents severance, accelerated depreciation, equipment relocation and other expenses directly incurred as a result of restructuring events. The restructuring charges primarily relate to charges incurred to change the operating structure, eliminate certain roles, and close certain manufacturing facilities in our Melton operationsNorth America and Europe segments.
(6)Other facility closure, consolidation, and related costs and adjustments that do not meet the U.S. GAAP definition of restructuring, primarily related to the closure of certain facilities.
(7)M&A related costs consists primarily of legal and professional expenses related to the planned disposition of Towanda.
(8)Represents net (gain) loss on sales of property and equipment, primarily in the U.K.United Kingdom, Australia, and the related market value lease payments are includedKlamath Falls, Oregon in the minimum annual lease payments schedule. The non-cash impact to expense of the changeyear ended December 31, 2023, and Phoenix, Arizona in the lease liabilityyear ended December 31, 2022.
(9)Loss on extinguishment of debt of $6.5 million is related to the redemption of $250.0 million of our 6.25% Senior Secured Notes and $200.0 million of our 4.63% Senior Notes.
(10)Represents non-cash equity-based compensation expense related to the issuance of share-based awards.
(11)Represents a settlement loss associated with our U.S. defined benefit pension plan resulting from a one-time lump sum payment offered to pension plan participants. Refer to Note 26 -Employee Retirement and Pension Benefits for additional information.
(12)Non-cash foreign exchange transaction/translation loss (income) primarily associated with fair value adjustments of foreign currency derivatives and revaluation of intercompany balances.
F-30
(13)Other special items not core to ongoing business activity include: (i) in the year ended December 31, 2023, ($3.1) million in income from short-term investments as well as forward contracts related to the JW Australia divestiture in Corporate and unallocated costs, and ($2.8) million in adjustments to compensation and non-income taxes associated with exercises of legacy equity awards in our Europe segment; (ii) in the year ended December 31, 2022, $3.3 million relating primarily to exit costs for executives in Corporate and unallocated costs, and ($2.0) million relating to a credit received for overpayment of utility expenses in our North America segment; (iii) in the year ended December 31, 2021, $4.2 million in compensation and taxes associated with exercises of legacy equity awards in our Europe segment, and $3.8 million in expenses related to environmental matters and $1.3 million in expenses related to fire damage and downtime at one of our facilities in our North America segment.
To conform with current period presentation, certain amounts in prior period information have been reclassified.
Net revenues by locality are as follows for the discount factoryears ended December 31,:
| (amounts in thousands) | 2023 | 2022 | 2021 | ||||||||||||||
| Net revenues by location of external customer | |||||||||||||||||
| Canada | $ | 260,897 | $ | 258,629 | $ | 220,962 | |||||||||||
| U.S. | 2,841,921 | 2,978,492 | 2,587,536 | ||||||||||||||
| South America (including Mexico) | 20,212 | 22,656 | 21,371 | ||||||||||||||
| Europe | 1,180,075 | 1,280,364 | 1,350,582 | ||||||||||||||
| Africa and other | 1,229 | 3,667 | 1,239 | ||||||||||||||
| Total | $ | 4,304,334 | $ | 4,543,808 | $ | 4,181,690 | |||||||||||
Geographic information regarding property, plant, and equipment which exceed 10% of consolidated property, plant, and equipment is reported in other income (expense) inas follows for the consolidated statements of operations and totaled $0.5 million in 2017, 2016 and 2015.years ended December 31,:
| (amounts in thousands) | 2023 | 2022 | 2021 | ||||||||||||||
| North America: | |||||||||||||||||
| U.S. | $ | 412,195 | $ | 422,428 | $ | 425,680 | |||||||||||
| Other | 33,836 | 29,587 | 29,901 | ||||||||||||||
| 446,031 | 452,015 | 455,581 | |||||||||||||||
| Europe | 180,822 | 170,346 | 188,100 | ||||||||||||||
| Corporate: | |||||||||||||||||
| U.S. and other | 17,392 | 19,643 | 19,874 | ||||||||||||||
| Total property and equipment, net | $ | 644,245 | $ | 642,004 | $ | 663,555 | |||||||||||
Note 18.15. Income Taxes
Income (loss) before taxes, equity earnings (loss) and discontinued operations wasis comprised of the following for the years ended December 31:
| (amounts in thousands) | 2017 | 2016 | 2015 | ||||||||
| Domestic income (loss) | $ | (7,346 | ) | $ | 25,042 | $ | 24,146 | ||||
| Foreign income | 153,101 | 105,278 | 61,809 | ||||||||
| $ | 145,755 | $ | 130,320 | $ | 85,955 | ||||||
| (amounts in thousands) | 2023 | 2022 | 2021 | ||||||||||||||
| Domestic income | $ | 11,217 | $ | 63,130 | $ | 54,991 | |||||||||||
| Foreign income (loss) | 77,357 | (32,866) | 95,967 | ||||||||||||||
| Total income before taxes | $ | 88,574 | $ | 30,264 | $ | 150,958 | |||||||||||
Our foreign income is primarilyhistorically driven by our subsidiaries in Australia, Canada, Germany, and the U.K. The statutory tax rates are 30%, 27% and 19% respectively.Denmark.
F-31
Significant components of the provision (benefit) for income taxes are as follows for the years ended December 31:
| (amounts in thousands) | 2023 | 2022 | 2021 | ||||||||||||||
| Federal | $ | (2,464) | $ | 407 | $ | 520 | |||||||||||
| State | 1,753 | 1,103 | 480 | ||||||||||||||
| Foreign | 40,452 | 19,558 | 31,862 | ||||||||||||||
| Current taxes | 39,741 | 21,068 | 32,862 | ||||||||||||||
| Federal | 4,220 | 14,075 | 3,689 | ||||||||||||||
| State | 7,757 | (4,854) | (5,927) | ||||||||||||||
| Foreign | 11,621 | (12,248) | (10,988) | ||||||||||||||
| Deferred taxes | 23,598 | (3,027) | (13,226) | ||||||||||||||
| Total provision for income taxes | $ | 63,339 | $ | 18,041 | $ | 19,636 | |||||||||||
| (amounts in thousands) | 2017 | 2016 | 2015 | ||||||||
| Federal | $ | 11,699 | $ | 1,015 | $ | (14,124 | ) | ||||
| State | 667 | 72 | 731 | ||||||||
| Foreign | 29,461 | 18,274 | 28,289 | ||||||||
| Current taxes | 41,827 | 19,361 | 14,896 | ||||||||
| Federal | 60,618 | (164,765 | ) | (3,508 | ) | ||||||
| State | 27,241 | (74,882 | ) | (290 | ) | ||||||
| Foreign | 8,917 | (26,108 | ) | (16,533 | ) | ||||||
| Deferred taxes | 96,776 | (265,755 | ) | (20,331 | ) | ||||||
| Income tax provision (benefit) for continuing operations | 138,603 | (246,394 | ) | (5,435 | ) | ||||||
| Income tax provision for discontinued operations | — | — | — | ||||||||
| Total provision (benefit) for income taxes | $ | 138,603 | $ | (246,394 | ) | $ | (5,435 | ) | |||
Reconciliation of the U.S. federal statutory income tax rate to our effective tax rate is as follows for the years ended December 31:
| 2023 | 2022 | 2021 | |||||||||||||||||||||||||||||||||
| (amounts in thousands) | Amount | % | Amount | % | Amount | % | |||||||||||||||||||||||||||||
| Statutory rate | $ | 18,601 | 21.0 | $ | 6,355 | 21.0 | $ | 31,702 | 21.0 | ||||||||||||||||||||||||||
| State income tax, net of federal benefit | 1,959 | 2.2 | 2,154 | 7.1 | 2,339 | 1.5 | |||||||||||||||||||||||||||||
| Foreign source dividends and deemed inclusions | 1,906 | 2.2 | (237) | (0.8) | (9,822) | (6.5) | |||||||||||||||||||||||||||||
| Valuation allowance | 32,666 | 36.9 | (11,256) | (37.2) | (7,331) | (4.9) | |||||||||||||||||||||||||||||
| Nondeductible expenses | 2,661 | 3.0 | 2,097 | 6.9 | 2,741 | 1.8 | |||||||||||||||||||||||||||||
| Goodwill impairment | — | — | 12,735 | 42.1 | — | — | |||||||||||||||||||||||||||||
| Equity based compensation | 4,086 | 4.6 | 2,486 | 8.2 | (787) | (0.5) | |||||||||||||||||||||||||||||
| Foreign tax rate differential | (488) | (0.6) | (1,365) | (4.5) | (2,759) | (1.8) | |||||||||||||||||||||||||||||
| Tax rate differences and credits | 3,675 | 4.1 | 3,469 | 11.5 | (10,264) | (6.8) | |||||||||||||||||||||||||||||
| Uncertain tax positions | (174) | (0.2) | 2,966 | 9.8 | 8,711 | 5.8 | |||||||||||||||||||||||||||||
| Change in indefinite reversal assertion | — | — | — | — | 5,016 | 3.4 | |||||||||||||||||||||||||||||
| Prior year provision to return adjustments | (571) | (0.6) | (789) | (2.6) | 210 | 0.1 | |||||||||||||||||||||||||||||
| Other | (982) | (1.1) | (574) | (1.9) | (120) | (0.1) | |||||||||||||||||||||||||||||
| Effective tax rate | $ | 63,339 | 71.5% | $ | 18,041 | 59.6% | $ | 19,636 | 13.0% | ||||||||||||||||||||||||||
| 2017 | 2016 | 2015 | |||||||||||||||
| (amounts in thousands) | Amount | % | Amount | % | Amount | % | |||||||||||
| Statutory rate | $ | 51,015 | 35.0 | $ | 45,612 | 35.0 | $ | 30,085 | 35.0 | ||||||||
| State income tax, net of federal benefit | (4,784 | ) | (3.3) | 221 | 0.2 | 3,397 | 4.0 | ||||||||||
| Nondeductible expenses | 1,950 | 1.3 | 1,797 | 1.4 | 6,064 | 7.1 | |||||||||||
| Equity based compensation | (12,718 | ) | (8.7) | 826 | 0.6 | — | — | ||||||||||
| Deferred benefit on acquisitions | (6,201 | ) | (4.2) | — | — | (2,919 | ) | (3.4) | |||||||||
| Foreign tax rate differential | (17,959 | ) | (12.3) | (12,237 | ) | (9.4) | (7,225 | ) | (8.4) | ||||||||
| Tax rate differences and credits | (91,109 | ) | (62.5) | 382 | 0.3 | 698 | 0.7 | ||||||||||
| Uncertain tax positions | 736 | 0.5 | 406 | 0.3 | 11,634 | 13.5 | |||||||||||
| Foreign source dividends | 86,119 | 59.1 | 1,992 | 1.5 | 5,193 | 6.0 | |||||||||||
| Valuation allowance | 98,156 | 67.3 | (282,616 | ) | (216.9) | (41,196 | ) | (47.9) | |||||||||
| IRS audit adjustments | (699 | ) | (0.5) | 113 | 0.1 | (13,079 | ) | (15.2) | |||||||||
| Prior year correction | — | — | (1,392 | ) | (1.1) | (2,094 | ) | (2.4) | |||||||||
| U.S. Tax Reform | 32,414 | 22.2 | — | — | — | — | |||||||||||
| Other | 1,683 | 1.2 | (1,498 | ) | (1.1) | 4,007 | 4.7 | ||||||||||
| Effective rate for continuing operations | $ | 138,603 | 95.1 | $ | (246,394 | ) | (189.1) | $ | (5,435 | ) | (6.3) | ||||||
| Effective rate including discontinued operations | $ | 138,603 | 95.1 | $ | (246,394 | ) | (189.1) | $ | (5,435 | ) | (6.4) | ||||||
During the year ended December 31, 2022, we recognized benefit of $9.9 million from the reduction to state NOL and state credits valuation allowance, and $1.9 million of tax benefit attributable to research and development tax credits, partially offset by $12.7 million tax expense attributable to nondeductible goodwill impairment.
During the year ended December 31, 2021, we recognized $12.2 million of U.S. tax benefits attributed to the effect of tax planning, primarily related to the impact of GILTI, a benefit of $6.7 million from the reduction to state NOL and state credits valuation allowance, and $3.6 million of tax benefit attributable to research and development tax credits, partially offset by $5.0 million tax expense attributable to removing our assertion on certain undistributed foreign earnings.
F-32
Deferred income taxes are provided for the temporary differences between the financial reporting basis and tax basis of our assets, liabilities, and operating loss carryforwards. Significant deferred tax assets and liabilities are as follows as of December 31:
| (amounts in thousands) | 2023 | 2022 | |||||||||
| Net operating loss and tax credit carryforwards | $ | 157,790 | 200,343 | ||||||||
| Operating lease liabilities | 24,210 | 34,709 | |||||||||
| Employee benefits and compensation | 24,894 | $ | 28,161 | ||||||||
| Accrued liabilities and other | 46,944 | 35,807 | |||||||||
| Inventory | 7,255 | 7,531 | |||||||||
| Allowance for credit losses | 3,789 | 4,851 | |||||||||
| Investments and marketable securities | 522 | — | |||||||||
| Capitalized research and development expenses | 31,782 | 18,327 | |||||||||
| Gross deferred tax assets | 297,186 | 329,729 | |||||||||
| Valuation allowance | (54,786) | (21,048) | |||||||||
| Deferred tax assets | 242,400 | 308,681 | |||||||||
| Depreciation and amortization | (74,328) | (93,810) | |||||||||
| Operating lease assets | (22,442) | (32,953) | |||||||||
| Investments and marketable securities | — | (3,401) | |||||||||
| Investment in subsidiaries | (2,347) | (4,218) | |||||||||
| Deferred tax liabilities | (99,117) | (134,382) | |||||||||
| Net deferred tax assets | $ | 143,283 | $ | 174,299 | |||||||
| Balance sheet presentation: | |||||||||||
| Non-current assets | $ | 150,453 | $ | 182,161 | |||||||
| Non-current liabilities | (7,170) | (7,862) | |||||||||
| Net deferred tax assets | $ | 143,283 | $ | 174,299 | |||||||
| (amounts in thousands) | 2017 | 2016 | |||||
| Allowance for doubtful accounts and notes receivable | $ | 1,102 | $ | 4,807 | |||
| Employee benefits and compensation | 54,961 | 88,383 | |||||
| Net operating loss and tax credit carryforwards | 292,957 | 287,907 | |||||
| Inventory | 4,125 | 2,034 | |||||
| Deferred credits | 889 | 865 | |||||
| Accrued liabilities and other | 17,478 | 17,731 | |||||
| Gross deferred tax assets | 371,512 | 401,727 | |||||
| Valuation allowance | (144,701 | ) | (40,118 | ) | |||
| Deferred tax assets | 226,811 | 361,609 | |||||
| Depreciation and amortization | (42,632 | ) | (73,665 | ) | |||
| Investments and marketable securities | (9,702 | ) | (9,431 | ) | |||
| Deferred tax liabilities | (52,334 | ) | (83,096 | ) | |||
| Net deferred tax assets | $ | 174,477 | $ | 278,513 | |||
| Balance sheet presentation: | |||||||
| Long-term assets | $ | 183,726 | $ | 287,699 | |||
| Long-term liabilities | (9,249 | ) | (9,186 | ) | |||
| Net deferred tax assets | $ | 174,477 | $ | 278,513 | |||
Valuation Allowance – The realization of deferred tax assets is based on historical tax positions and estimates of future taxable income. We evaluate both the positive and negative evidence that we believe is relevant in assessing whether we will realize the deferred tax assets. We consider historical taxable income, the scheduled reversal of deferred tax liabilities (including the effect in available carry back and carryforward periods), projected taxable income, and tax-planning strategies in making this assessment. A valuation allowance is recorded when it is more likely than not that some portion of the deferred tax assets will not be realized.
Based on the level of historical taxable income and projections for future taxable income over the periods for which the deferred tax assets are deductible, management believes that it is more likely than not that we will realize the benefits of these deductible differences, net of existing valuation allowances at December 31, 2023. The amount of the deferred tax asset considered realizable, however, could be reduced or increased in the near term if estimates of future taxable income during the carryforward periods are reduced or exceeded.
We had a valuation allowance of $54.8 million and $21.0 million as of December 31, 2016, which represents a decrease of $278.4 million from2023 and December 31, 20152022, respectively. The increase was primarily driven by an increase of $30.0 million and was allocated to continuing operations.$2.7 million against our foreign and state net operating loss carryforwards, respectively.
We had a valuation allowance of $21.0 million and $31.8 million as of December 31, 2022 and December 31, 2021, respectively. The decrease was primarily the resultdriven by a decrease of (i) the release of $236.5$9.9 million of valuation allowances associated with NOLfor state net operating loss carryforwards primarily for our U.S. subsidiaries as we concluded at December 31, 2016 that it was more likely than not that the deferred tax assets will be realized based on our forecasted earnings , (ii) the release of $40.2 of valuation allowance (inclusive of $8.4 million reductionand state credit carryforwards.
F-33
The following is the activity in our valuation allowance:
| (amounts in thousands) | 2023 | 2022 | 2021 | ||||||||||||||
| Balance as of January 1, | $ | (21,048) | $ | (31,825) | $ | (37,786) | |||||||||||
| Valuation allowances established | 11 | (28) | — | ||||||||||||||
| Changes to existing valuation allowances | (32,830) | (31) | (2,066) | ||||||||||||||
| Release of valuation allowances | 1 | 9,918 | 7,510 | ||||||||||||||
| Currency translation | (920) | 918 | 517 | ||||||||||||||
| Balance at period end | $ | (54,786) | $ | (21,048) | $ | (31,825) | |||||||||||
| (amounts in thousands) | 2017 | 2016 | 2015 | ||||||||
| Balance as of January 1, | $ | (40,118 | ) | $ | (318,480 | ) | $ | (361,470 | ) | ||
| Valuation allowances established | — | (1,489 | ) | (4,381 | ) | ||||||
| Changes to existing valuation allowances | (105,453 | ) | 5,006 | 24,302 | |||||||
| Release of valuation allowances | 2,006 | 272,291 | 19,612 | ||||||||
| Currency translation | (1,136 | ) | 2,554 | 3,457 | |||||||
| Balance as of December 31, | $ | (144,701 | ) | $ | (40,118 | ) | $ | (318,480 | ) | ||
| 2018 | $ | 10,445 | |
| 2019 | 10,373 | ||
| 2020 | 8,671 | ||
| 2021 | 19,238 | ||
| Thereafter | 1,294,842 | ||
| $ | 1,343,569 | ||
| (amounts in thousands) | EZ Credit | R & E credit | Foreign Tax Credit | Work Opportunity & Welfare to Work Credit | State Investment Tax Credits | Tip Credit | Other | TOTAL | |||||||||||||||||||||||
| 2018 | $ | — | $ | — | $ | 8,690 | $ | — | $ | 266 | $ | — | $ | — | $ | 8,956 | |||||||||||||||
| 2019 | — | — | — | — | 253 | — | — | 253 | |||||||||||||||||||||||
| 2020 | — | — | 12,975 | — | 174 | — | — | 13,149 | |||||||||||||||||||||||
| 2021 | — | — | 14,990 | — | 225 | — | — | 15,215 | |||||||||||||||||||||||
| 2022 | — | — | 1,061 | — | 216 | — | — | 1,277 | |||||||||||||||||||||||
| Thereafter | 68 | 5,799 | 108,031 | 5,268 | 632 | 102 | 12 | 119,912 | |||||||||||||||||||||||
| $ | 68 | $ | 5,799 | $ | 145,747 | $ | 5,268 | $ | 1,766 | $ | 102 | $ | 12 | $ | 158,762 | ||||||||||||||||
Dual-Rate Jurisdiction – Estonia taxesand Latvia tax the corporate profits of resident corporations at different rates depending upon whether the profits are distributed. The undistributed profits of resident corporations are exempt from taxation while any distributed profits are subject to a 20% corporate income tax rate. The liability for the tax on distributed profits is recorded as an income tax expense in the period in which we declare the dividend. Thisa dividend is declared. The balance of retained earnings of our Estonian subsidiary which, if distributed, would be subject to this this tax must be remitted to the local tax authorities by the tenth daywas $85.0 million and $82.0 million as of the month following the month of the dividend distribution. The amount of undistributed earnings at December 31, 20172023 and 2016December 31, 2022, respectively. The balance of retained earnings of our Latvian subsidiary which, if distributed, would be subject to this tax was $66.3$32.8 million and $65.2$29.8 million as of December 31, 2023 and December 31, 2022, respectively.
Tax Payments and Balances – We made tax payments of $29.0$48.8 million, in 2017, $34.7$46.8 million, in 2016$38.6 million during the years ended December 31, 2023, 2022, and $9.1 million in 20152021, respectively, primarily for foreign liabilities. We received tax refunds of $6.5$0.7 million, $1.9 million, and $2.1 million during the years ended in 2017, $7.9 million in 2016December 31, 2023, 2022, and $15.5 million in 2015 primarily related to U.S. federal tax. We recorded2021, respectively. Total receivables for U.S. federal, foreigntax refunds are recorded in other current assets in the accompanying balance sheets and state refunds of $4.2totaled $14.2 million and $13.3 million at December 31, 20172023 and $6.4 million at December 31, 2016 which is included in other current assets on the accompanying consolidated balance sheets. We recorded2022, respectively. Foreign payables for U.S. federal, foreign and state taxes of $11.0 million at December 31, 2017 and 4.7 million at December 31, 2016 which is includedare recorded in accrued income taxes payable in the accompanying consolidated balance sheets. We recorded non-current U.S. payables of $11.3sheets and totaled $9.3 million and $9.4 million at December 31, 2017, which is included in deferred credits2023 and other liabilities in the accompanying consolidated balance sheets. The refunds received in 2017 were in excess of the receivables recorded at December 31, 2016 due primarily2022, respectively. We do not have any non-current taxes receivable or payable as of December 31, 2023 and December 31, 2022.
F-34
Accounting for Uncertain Tax Positions – A reconciliation of the beginning and ending amounts of unrecognized tax benefits excluding interest and penalties is as follows:
| (amounts in thousands) | 2017 | 2016 | 2015 | (amounts in thousands) | 2023 | 2022 | 2021 | |||||||||||||||||||||||||||
| Balance as of January 1, | $ | 12,054 | $ | 11,634 | $ | — | ||||||||||||||||||||||||||||
| Increase for tax positions taken during the prior period | 252 | 359 | 786 | |||||||||||||||||||||||||||||||
| Decrease for settlements with taxing authorities | (788 | ) | — | — | ||||||||||||||||||||||||||||||
| Increase for tax positions taken during the current period | 107 | — | 10,848 | |||||||||||||||||||||||||||||||
| Decrease due to statute expiration | ||||||||||||||||||||||||||||||||||
| Currency translation | 1,626 | (345 | ) | — | ||||||||||||||||||||||||||||||
| Balance as of end of period - unrecognized tax benefit | 13,251 | 11,648 | 11,634 | |||||||||||||||||||||||||||||||
| Accrued interest and penalties | 1,268 | 406 | — | |||||||||||||||||||||||||||||||
| $ | 14,519 | $ | 12,054 | $ | 11,634 | |||||||||||||||||||||||||||||
| Currency translation | ||||||||||||||||||||||||||||||||||
| Currency translation | ||||||||||||||||||||||||||||||||||
| Balance at period end - unrecognized tax benefit | ||||||||||||||||||||||||||||||||||
Unrecognized tax benefits were $13.3$38.9 million, $29.3 million, and $11.6$26.8 million at December 31, 20172023, 2022, and December 31, 2016.2021, respectively. The changes duringincrease is primarily related to management’s assessment of a potential liability as a result of ongoing tax audit discussions in Europe as well as uncertainty on prior years’ research and development tax credits in the U.S. The unrecognized tax benefit recorded in the current period relate to the establishment of an uncertain tax position for certain intercompany expensesyear is partially offset by a currency translation during the period. As of December 31, 2014, we had no unrecognizedan increase in deferred tax benefits.assets expected to be recovered should these liabilities be assessed. Interest and penalties related to uncertain tax positions are reported as a component of tax expense and included in the total uncertain tax position balance within deferred credits and other liabilities in the accompanying consolidated balance sheets.
There were benefits of the Europe segment due to the Managing Agreement, there may be changes in taxable income of the Operating Subsidiaries. Therefore, we have reserved for a potential loss resulting from such uncertainty.
We operate in multiplenumerous U.S., state, and foreign tax jurisdictions and are generally open to examination for tax years 20122013 and forward. InAs of December 31, 2023, the U.S., we are open to examination at a federal levelCompany has subsidiaries in various state and foreign jurisdictions under audit for tax years 2013 forward. We are under examination by certain federal, state and local jurisdictions for tax years 20052011 through 2008, but generally we are open to examination for state and local jurisdictions for tax years 2012 forward. We are under examination in Australia, Austria, Denmark, Estonia, France, Germany, and Indonesia for tax years 2010 through 2016, and generally remain open to examination for other non-US jurisdictions for tax years 2012 forward.
2019.
Note 19. Segment Information
| (amounts in thousands) | North America | Europe | Australasia | Total Operating Segments | Corporate and Unallocated Costs | Total Consolidated | |||||||||||||||||
| Twelve Months Ended December 31, 2017 | |||||||||||||||||||||||
| Total net revenues | $ | 2,160,104 | $ | 1,045,036 | $ | 572,518 | $ | 3,777,658 | $ | — | $ | 3,777,658 | |||||||||||
| Intersegment net revenues | (2,021 | ) | (2,269 | ) | (9,434 | ) | (13,724 | ) | — | (13,724 | ) | ||||||||||||
| Net revenues from external customers | $ | 2,158,083 | $ | 1,042,767 | $ | 563,084 | $ | 3,763,934 | $ | — | $ | 3,763,934 | |||||||||||
| Depreciation and amortization | $ | 66,990 | $ | 27,979 | $ | 13,248 | $ | 108,217 | $ | 3,056 | $ | 111,273 | |||||||||||
| Impairment and restructuring charges | 8,471 | 3,592 | (49 | ) | 12,014 | 1,042 | 13,056 | ||||||||||||||||
| Adjusted EBITDA | 273,594 | 132,929 | 74,706 | 481,229 | (43,616 | ) | 437,613 | ||||||||||||||||
| Capital expenditures | 34,769 | 14,889 | 6,019 | 55,677 | 7,372 | 63,049 | |||||||||||||||||
| Segment assets | $ | 1,207,539 | $ | 920,222 | $ | 447,734 | $ | 2,575,495 | $ | 287,445 | $ | 2,862,940 | |||||||||||
| Twelve Months Ended December 31, 2016 | |||||||||||||||||||||||
| Total net revenues | $ | 2,153,011 | $ | 1,009,545 | $ | 517,990 | $ | 3,680,546 | $ | — | $ | 3,680,546 | |||||||||||
| Intersegment net revenues | (3,843 | ) | (816 | ) | (9,088 | ) | (13,747 | ) | — | (13,747 | ) | ||||||||||||
| Net revenues from external customers | $ | 2,149,168 | $ | 1,008,729 | $ | 508,902 | $ | 3,666,799 | $ | — | $ | 3,666,799 | |||||||||||
| Depreciation and amortization | $ | 68,207 | $ | 26,657 | $ | 8,944 | $ | 103,808 | $ | 4,187 | $ | 107,995 | |||||||||||
| Impairment and restructuring charges | 3,584 | 6,777 | 2,448 | 12,809 | 1,038 | 13,847 | |||||||||||||||||
| Adjusted EBITDA | 251,831 | 122,574 | 59,519 | 433,924 | (40,242 | ) | 393,682 | ||||||||||||||||
| Capital expenditures | 39,775 | 14,991 | 21,610 | 76,376 | 3,121 | 79,497 | |||||||||||||||||
| Segment assets | $ | 1,099,845 | $ | 751,749 | $ | 377,410 | $ | 2,229,004 | $ | 307,042 | $ | 2,536,046 | |||||||||||
| Twelve Months Ended December 31, 2015 | |||||||||||||||||||||||
| Total net revenues | $ | 2,019,622 | $ | 996,753 | $ | 378,679 | $ | 3,395,054 | $ | — | $ | 3,395,054 | |||||||||||
| Intersegment net revenues | (3,907 | ) | (739 | ) | (9,348 | ) | (13,994 | ) | — | (13,994 | ) | ||||||||||||
| Net revenues from external customers | $ | 2,015,715 | $ | 996,014 | $ | 369,331 | $ | 3,381,060 | $ | — | $ | 3,381,060 | |||||||||||
| Depreciation and amortization | $ | 61,165 | $ | 25,296 | $ | 5,697 | $ | 92,158 | $ | 3,038 | $ | 95,196 | |||||||||||
| Impairment and restructuring charges | 7,113 | 13,089 | 317 | 20,519 | 823 | 21,342 | |||||||||||||||||
| Adjusted EBITDA | 201,660 | 99,540 | 40,453 | 341,653 | (30,667 | ) | 310,986 | ||||||||||||||||
| Capital expenditures | 35,721 | 25,572 | 14,049 | 75,342 | 2,345 | 77,687 | |||||||||||||||||
| Segment assets | $ | 1,057,056 | $ | 725,604 | $ | 257,496 | $ | 2,040,156 | $ | 142,217 | $ | 2,182,373 | |||||||||||
| Years Ended December 31, | |||||||||||
| (amounts in thousands) | 2017 | 2016 | 2015 | ||||||||
| Net income | $ | 10,791 | $ | 377,181 | $ | 90,918 | |||||
| Loss from discontinued operations, net of tax | — | 3,324 | 2,856 | ||||||||
| Equity earnings of non-consolidated entities | (3,639 | ) | (3,791 | ) | (2,384 | ) | |||||
| Income tax expense (benefit) | 138,603 | (246,394 | ) | (5,435 | ) | ||||||
| Depreciation and amortization | 111,273 | 107,995 | 95,196 | ||||||||
Interest expense, net (a) | 79,034 | 77,590 | 60,632 | ||||||||
Impairment and restructuring charges (b) | 13,057 | 18,353 | 31,031 | ||||||||
| Gain on sale of property and equipment | (299 | ) | (3,275 | ) | (416 | ) | |||||
| Stock-based compensation expense | 19,785 | 22,464 | 15,620 | ||||||||
| Non-cash foreign exchange transaction/translation (income) loss | (2,181 | ) | 5,734 | 2,697 | |||||||
Other non-cash items (c) | 526 | 2,843 | 1,141 | ||||||||
Other items (d) | 47,000 | 30,585 | 18,893 | ||||||||
Costs relating to debt restructuring and debt refinancing (e) | 23,663 | 1,073 | 237 | ||||||||
| Adjusted EBITDA | $ | 437,613 | $ | 393,682 | $ | 310,986 | |||||
| (amounts in thousands) | 2017 | 2016 | 2015 | ||||||||
| Net revenues by location of external customer | |||||||||||
| Canada | $ | 219,877 | $ | 218,947 | $ | 234,017 | |||||
| U.S. | 1,904,939 | 1,893,585 | 1,740,303 | ||||||||
| South America (including Mexico) | 35,280 | 34,518 | 38,422 | ||||||||
| Europe | 1,063,344 | 1,035,398 | 1,020,073 | ||||||||
| Australia | 530,521 | 476,251 | 345,523 | ||||||||
| Africa and other | 9,973 | 8,100 | 2,722 | ||||||||
| Total | $ | 3,763,934 | $ | 3,666,799 | $ | 3,381,060 | |||||
| (amounts in thousands) | 2017 | 2016 | 2015 | ||||||||
| North America: | |||||||||||
| U.S. | $ | 402,338 | $ | 400,023 | $ | 418,795 | |||||
| Other | 25,876 | 25,371 | 24,500 | ||||||||
| 428,214 | 425,394 | 443,295 | |||||||||
| Europe | 153,492 | 145,470 | 164,419 | ||||||||
| Australasia: | |||||||||||
| Australia | 118,568 | 104,063 | 81,992 | ||||||||
| Other | 7,818 | 8,259 | 8,543 | ||||||||
| 126,386 | 112,322 | 90,535 | |||||||||
| Corporate: | |||||||||||
| U.S. | 48,619 | 21,465 | 22,594 | ||||||||
| Total property and equipment, net | $ | 756,711 | $ | 704,651 | $ | 720,843 | |||||
Preferred Stock - Our Board of Directors is authorized to issue Preferred Stock from time to time in one or more series and with such rights, privileges, and preferences as the Board of Directors shall from time to time determine. We have not issued any shares of preferred stock.Preferred Stock.
Common Stock - As of December 31, 2016, we were governed by our pre-IPO charter, which provided the authority to issue 22,810,000 shares of common stock, with a par value of $0.01 per share, of which 22,379,800 shares were designated common stock and 430,200 shares were designated as Class B-1 Common Stock. On January 3, 2017, our pre-IPO charter was amended authorizing us to issue 904,732,200 shares of common stock, with a par value of $0.01 per share, of which 900,000,000 shares were designated common stock and 4,732,200 shares were designated as Class B-1 Common Stock. Each share of common stock (whether common stock or Class B-1 Common Stock) had the same rights, privileges, interest and attributes and was subject to the same limitations as every other share treating the Class B-1 Common Stock on an as-converted basis. Each share of Class B-1 Common Stock was convertible at the option of the holder into shares of common stock at the same ratio on the date of conversion as a share of Series A-1 Stock would have been convertible on such date of conversion, assuming that no cash dividends had been paid on the Series A-1 Stock (or its predecessor security) since the date of initial issuance. Immediately prior to the closing of our IPO, all of the outstanding shares of Class B-1 Common Stock were converted into 309,404 shares of common stock.
We record share repurchases on their trade date and reduce shareholders’ equity and increase accounts payable. Repurchased shares are retired, and the excess of the repurchase price over the par value of the shares is charged to retained earnings.
On January 30, 2015,July 27, 2021, our Board of Directors approvedincreased our previous repurchase authorization to a self-tender offer to purchase up to $40.0total of $400.0 million worth of common stock at a price of $20.00 per share. The tender offer was initiated on January 30, 2015, and on March 6, 2015, we repurchased 1,613,909 shares of our common stock for $32.3 million.
with no expiration date.
On July 28, 2015,2022, our Board of Directors authorized a distributionnew share repurchase program, replacing our previous share repurchase authorization, with an aggregate value of $4.73 per$200.0 million and no expiration date. As of December 31, 2023, there have been no share repurchases under this program.
We did not repurchase shares of common stock in which the Series A Convertible Preferred Stock and Class B-1our Common Stock would participate on an as-converted basis. The record date forduring the distribution was June 30, 2015year ended December 31, 2023. During the years ended December 31, 2022 and totaled $84.9 million for holdersDecember 31, 2021, prior to the authorization of our common stocknew share repurchase program, we repurchased 6,848,356 and Class B-1 Common Stock. We applied distributions totaling $14.4 million against principal11,564,009 shares, respectively, at an average price of $19.12 and accrued interest on outstanding employee and director notes. Participating in the distribution were 17,697,823 common shares and 52,679 shares of Class B-1 Common Stock (78,232 as-converted common shares). The distributions were paid on or about July 31, 2015.
$28.09, respectively.
F-35
Note 22.17. Earnings (Loss) Per Share
The basic and diluted income (loss) per share calculations for the years ended December 31, are presented below (in thousands, except share and per share amounts).
| Earnings (loss) per share basic: | 2017 | 2016 | 2015 | |||||||||
| Income from continuing operations | $ | 7,152 | $ | 376,714 | $ | 91,390 | ||||||
| Equity earnings of non-consolidated entities | 3,639 | 3,791 | 2,384 | |||||||||
| Income from continuing operations and equity earnings of non- consolidated entities | 10,791 | 380,505 | 93,774 | |||||||||
| Undeclared Series A Convertible Preferred Stock dividends | (10,462 | ) | (65,667 | ) | (46,234 | ) | ||||||
| Series A Convertible Preferred Stock distributions and dividends paid | — | (307,279 | ) | (335,184 | ) | |||||||
| Deemed Dividend on Series A Convertible Preferred Stock from Settlement Agreement | — | (23,701 | ) | — | ||||||||
| Income (loss) attributable to common shareholders from continuing operations | 329 | (16,142 | ) | (287,644 | ) | |||||||
| Loss from discontinued operations, net of tax | — | (3,324 | ) | (2,856 | ) | |||||||
| Net income (loss) attributable to common shareholders | $ | 329 | $ | (19,466 | ) | $ | (290,500 | ) | ||||
| Weighted average outstanding shares of common stock basic | 97,460,676 | 17,992,879 | 18,296,003 | |||||||||
| Basic income (loss) per share | ||||||||||||
| Income (loss) from continuing operations | $ | 0.00 | $ | (0.90 | ) | $ | (15.72 | ) | ||||
| Loss from discontinued operations | 0.00 | (0.18 | ) | (0.16 | ) | |||||||
| Net income (loss) per share | $ | 0.00 | $ | (1.08 | ) | $ | (15.88 | ) | ||||
| Earnings (loss) per share diluted: | 2017 | 2016 | 2015 | |||||||||
| Net income (loss) attributable to common shareholders - basic | $ | 329 | $ | (19,466 | ) | $ | (290,500 | ) | ||||
| Series A Convertible Preferred Stock distributions and dividends paid | — | — | — | |||||||||
| Net income (loss) attributable to common shareholders - diluted | $ | 329 | $ | (19,466 | ) | $ | (290,500 | ) | ||||
| Weighted average outstanding shares of common stock basic | 97,460,676 | 17,992,879 | 18,296,003 | |||||||||
| Restricted stock units and options to purchase common stock | 4,001,459 | — | — | |||||||||
| Weighted average outstanding shares of common stock diluted | 101,462,135 | 17,992,879 | 18,296,003 | |||||||||
| Dilutive income (loss) per share | ||||||||||||
| Income (loss) from continuing operations | $ | 0.00 | $ | (0.90 | ) | $ | (15.72 | ) | ||||
| Loss from discontinued operations | 0.00 | (0.18 | ) | (0.16 | ) | |||||||
| Net income (loss) per share | $ | 0.00 | $ | (1.08 | ) | $ | (15.88 | ) | ||||
| 2023 | 2022 | 2021 | |||||||||||||||||||||||||||||||||||||||
| Weighted average outstanding shares of Common Stock basic | 84,995,515 | 86,374,499 | 96,563,155 | ||||||||||||||||||||||||||||||||||||||
| Restricted stock units, performance share units and options to purchase Common Stock | 878,520 | 700,677 | 1,807,987 | ||||||||||||||||||||||||||||||||||||||
| Weighted average outstanding shares of Common Stock diluted | 85,874,035 | 87,075,176 | 98,371,142 | ||||||||||||||||||||||||||||||||||||||
The following table provides the securities that could potentially dilute basic earnings per share in the future but were not included in the computation of diluted earningsincome per share becauseas their inclusion would be anti-dilutive:
| 2023 | 2022 | 2021 | |||||||||||||||||||||||||||||||||||||||
| Common Stock options | 1,374,312 | 1,652,320 | 1,226,906 | ||||||||||||||||||||||||||||||||||||||
| Restricted stock units | 66,882 | 738,528 | 12,590 | ||||||||||||||||||||||||||||||||||||||
| Performance share units | 265,465 | 133,467 | 751 | ||||||||||||||||||||||||||||||||||||||
F-36
| 2017 | 2016 | 2015 | |||||||
| Series A Convertible Preferred Stock | — | 3,974,525 | 3,974,525 | ||||||
| Common Stock Options | 545,693 | 1,812,404 | 1,891,978 | ||||||
| Class B-1 Common Stock Options | — | 3,344,572 | 3,396,118 | ||||||
| Restricted stock units | 537 | 385,220 | 378,433 | ||||||
Note 23.18. Stock Compensation
In connection with our IPO, the Board adopted, and our shareholders approved, the JELD-WEN Holding, Inc. 2017 Omnibus Equity Plan, the(the “Omnibus Equity Plan”). Under the Omnibus Equity Plan, equity awards may be made in respect of 7,500,0009,900,000 shares of our common stockCommon Stock and may be granted in the form of options, restricted stock, RSUs, stock appreciation rights, dividend equivalent rights, share awards, and performance-based awards (including performance share units and performance-based restricted stock).
Share-based compensation expense included in SG&A expenses totaled $19.8$17.5 million, $14.6 million, and $20.0 million in 2017, $43.2 million in 20162023, 2022, and 27.4 million in 2015. We recognized a windfall tax benefit of $12.7 million in 2017, which includes a benefit of $14.1 million in the U.S. offset by disallowances in our foreign subsidiaries of $1.4 million. There were no material related tax benefits for the years 2016 and 2015.2021, respectively. As of December 31, 2017,2023, there were $22.2was $14.9 million of total unrecognized compensation expense related to non-vested share-based compensation arrangements. This cost is expected to be recognized over the remaining weighted-average vesting period of 1.61.5 years.
Stock Options – Generally, stock option awards vest ratably each year on the anniversary date over a 3 to 5-yearthree-year period, have an exercise term of 10 years, and any vested options must be exercised within 90 days of the employee leaving the Company. The compensation cost of option awards is charged to expense based upon the graded-vesting method over the vesting periods applicable to the option awards. The graded-vesting method provides for vesting of portions of the overall awards at interim dates and results in greater expense in earlier years than the straight-line method.
When options are granted, we calculate the fair value of common and Class B-1 Common Stock options using multiple Black-Scholes option valuation models. Expected volatilities are based upon a selection of public guideline companies. The risk-free rate was based upon U.S. Treasury rates.
Key assumptions used in the valuation models were as follows for the years ended December 31:
| 2017 | 2016 | 2015 | |||||||||||||||||||||||||||||||
| 2023 | 2023 | 2022 | 2021 | ||||||||||||||||||||||||||||||
| Expected volatility | 37.36% - 42.83% | 43.57% - 52.72% | 36.00% - 58.30% | Expected volatility | 55.06% - 58.73% | 51.33% - 60.06% | 52.42% -53.62% | ||||||||||||||||||||||||||
| Expected dividend yield rate | 0.00% | 0.00% | 0.00% | Expected dividend yield rate | 0.00% | 0.00% | |||||||||||||||||||||||||||
| Weighted average term (in years) | 5.50 - 6.50 | 5.50 - 7.50 | 1.60 - 6.20 | Weighted average term (in years) | 5.5 - 6.5 | 5.5 - 6.5 | |||||||||||||||||||||||||||
| Weighted average grant date fair value | $11.51 | $17.84 | $23.94 | Weighted average grant date fair value | $7.43 - $7.57 | $5.69 - $11.96 | $14.39 | ||||||||||||||||||||||||||
| Risk free rate | 1.83% - 2.19% | 1.47% - 1.77% | 0.54% - 1.84% | Risk free rate | 3.67% - 3.81% | 1.91% - 3.51% | 0.71% - 0.91% | ||||||||||||||||||||||||||
The following table represents stock option activity:
| Shares | Weighted Average Exercise Price Per Share | Aggregate Intrinsic Value (millions) | Weighted Average Remaining Contract Term in Years | ||||||||||||||||||||
| Outstanding as of January 1, 2021 | 2,631,831 | $ | 20.41 | ||||||||||||||||||||
| Granted | 309,902 | 29.01 | |||||||||||||||||||||
| Exercised | (699,756) | 14.48 | |||||||||||||||||||||
| Forfeited | (79,955) | 27.22 | |||||||||||||||||||||
| Balance as of December 31, 2021 | 2,162,022 | $ | 23.31 | ||||||||||||||||||||
| Granted | 534,631 | 18.18 | |||||||||||||||||||||
| Exercised | (157,167) | 11.89 | |||||||||||||||||||||
| Forfeited | (822,542) | 25.99 | |||||||||||||||||||||
| Balance as of December 31, 2022 | 1,716,944 | $ | 21.48 | ||||||||||||||||||||
| Granted | 262,809 | 13.28 | |||||||||||||||||||||
| Exercised | (66,170) | 8.58 | |||||||||||||||||||||
| Forfeited | (460,764) | 22.00 | |||||||||||||||||||||
| Balance as of December 31, 2023 | 1,452,819 | $ | 20.42 | 4.4 | 5.2 | ||||||||||||||||||
| Exercisable as of December 31, 2023 | 1,123,326 | $ | 22.84 | 2.1 | 4.1 | ||||||||||||||||||
| Shares | Weighted Average Exercise Price Per Share | Weighted Average Remaining Contract Term in Years | ||||
| Outstanding as of January 1, 2015 | 5,036,856 | $20.60 | 8.4 | |||
| Granted | 1,088,450 | 29.60 | ||||
| Exercised | (95,667 | ) | 21.41 | |||
| Forfeited | (741,543 | ) | 20.37 | |||
| Balance as of December 31, 2015 | 5,288,096 | $19.06 | 7.9 | |||
| Granted | 367,400 | 37.12 | ||||
| Exercised | (245,014 | ) | 19.91 | |||
| Forfeited | (253,506 | ) | 16.82 | |||
| Balance as of December 31, 2016 | 5,156,976 | $20.40 | 7.1 | |||
| Issued upon conversion of class B-1 common stock | 2,494,553 | 11.13 | ||||
| Granted | 505,122 | 27.78 | ||||
| Exercised | (2,781,055 | ) | 11.67 | |||
| Forfeited | (448,928 | ) | 15.01 | |||
| Balance as of December 31, 2017 | 4,926,668 | $14.56 | 6.6 | |||
| Exercisable as of December 31, 2017 | 2,739,877 | $13.09 | 5.7 | |||
RSUs– RSUs are subject to the continued employmentservice of the recipient through the vesting date, which is generally 12 to 60 months from issuance. Beginning 2021, RSUs granted vest ratably each year on the anniversary date generally over a three-year period rather than at the end of the three-year period. Once vested, the recipient will receive one share of common stockCommon Stock for each restricted stock unit. Prior to the IPO, the grant-date fair value per share used for RSUs was determined using the aggregate value of our common equity, as determined by a third-party valuation firm, as of the most recent calendar quarter-end and applying a 10% discount based upon reflecting the differential economic rights and preferences of the Preferred or the ESOP common shares relative to the common shares, with that amount rounded down to the nearest whole percent. After the IPO, theThe grant-date fair value per share used for RSUs was determined using the closing price of our common stock
F-37
Common Stock on the NYSE on the date of the grant. We apply this grant-date fair value per share to the total number of shares that we anticipate will fully vest and amortize the fair value to compensation expense over the vesting period using the straight-line method.
The following table represents RSU activity:
| Shares | Weighted Average Grant-Date Fair Value Per Share | ||||||||||
| Outstanding as of January 1, 2021 | 1,786,797 | $ | 21.43 | ||||||||
| Granted | 652,579 | 29.09 | |||||||||
| Vested | (311,683) | 22.65 | |||||||||
| Forfeited | (301,301) | 24.99 | |||||||||
| Balance as of December 31, 2021 | 1,826,392 | $ | 23.37 | ||||||||
| Granted | 1,540,246 | 20.32 | |||||||||
| Vested | (768,341) | 22.31 | |||||||||
| Forfeited | (600,785) | 23.14 | |||||||||
| Balance as of December 31, 2022 | 1,997,512 | $ | 21.50 | ||||||||
| Granted | 1,568,729 | 13.37 | |||||||||
| Vested | (1,003,799) | 22.33 | |||||||||
| Forfeited | (337,800) | 18.42 | |||||||||
| Balance as of December 31, 2023 | 2,224,642 | $ | 15.86 | ||||||||
PSUs – PSUs are subject to continued employment of the recipient through the vesting date, which is on the third anniversary of the grant. Once vested, the recipient will receive one share of Common Stock for each vested PSU.
For PSUs issued prior to 2021, the number of PSUs that vest is determined by a payout factor consisting of equally weighted performance measures of Adjusted EBITDA and Free Cash Flow, each as reported over the applicable three-year performance period and is adjusted based upon a market condition measured by our relative total shareholder return (“TSR”) over the applicable three-year performance period as compared to the TSR of the Russell 3000 index. For PSUs issued in 2021 and thereafter, the number of PSUs that vest is determined by a payout factor consisting of equally weighted pre-set three year performance targets on return on invested capital (“ROIC”) and TSR. The fair value of the award is estimated using a Monte Carlo simulation approach in a risk-neutral framework to model future stock price movements based on historical volatility, risk free rates of return, and correlation matrix.
The following table represents PSU activity for the awarded shares at target performance measures:
| Shares | Weighted Average Grant-Date Fair Value Per Share | ||||||||||
| Outstanding as of January 1, 2021 | 744,463 | $ | 25.09 | ||||||||
| Granted | 165,749 | 30.70 | |||||||||
| Forfeited | (205,949) | 28.58 | |||||||||
| Balance as of December 31, 2021 | 704,263 | $ | 25.39 | ||||||||
| Granted | 158,587 | 29.24 | |||||||||
| Vested | (202,673) | 22.20 | |||||||||
| Forfeited | (380,361) | 27.79 | |||||||||
| Balance as of December 31, 2022 | 279,816 | $ | 26.61 | ||||||||
| Granted | 307,273 | 28.67 | |||||||||
| Forfeited | (329,293) | 26.98 | |||||||||
| Balance as of December 31, 2023 | 257,796 | $ | 28.59 | ||||||||
F-38
| Shares | Weighted Average Grant-Date Fair Value Per Share | |||
| Outstanding January 1, 2016 | 378,433 | $20.28 | ||
| Granted - employee | 76,912 | 28.62 | ||
| Vested | (64,625 | ) | 20.35 | |
| Forfeited | (5,500 | ) | 15.31 | |
| Balance as of December 31, 2016 | 385,220 | $22.00 | ||
| Granted - non-employee directors | 23,245 | 31.22 | ||
| Granted - employee | 342,727 | 28.73 | ||
| Vested | (175,110 | ) | 18.40 | |
| Forfeited | (13,714 | ) | 26.02 | |
| Balance as of December 31, 2017 | 562,368 | $27.51 | ||
Note 24. Impairment19. Restructuring and RestructuringAsset Related Charges
We engage in restructuring activities focused on improving productivity and operating margins. Restructuring costs primarily relate to costs associated with workforce reductions, plant consolidations and closures, and changes to the management structure to align with our operations. Other restructuring associated costs for the year ended December 31, 2023, primarily consisted of equipment relocation costs. Other restructuring associated costs for the year ended December 31, 2022 primarily consisted of lease termination costs. Asset related charges consist of accelerated depreciation and amortization of assets due to changes in asset useful lives.
| (amounts in thousands) | 2017 | 2016 | 2015 | |||||||||
| Closed operations | $ | 1,479 | $ | 1,778 | $ | 677 | ||||||
| Continuing operations | — | 1,203 | 3,591 | |||||||||
| Total Impairments | $ | 1,479 | $ | 2,981 | $ | 4,268 | ||||||
| Restructuring charges, net of fair value adjustment gains | 11,577 | 10,866 | 17,074 | |||||||||
| Total impairment and restructuring charges | $ | 13,056 | $ | 13,847 | $ | 21,342 | ||||||
| (amounts in thousands) | North America | Europe | Corporate and Unallocated Costs | Total Consolidated | |||||||||||||||||||||||||
| Year Ended December 31, 2023 | |||||||||||||||||||||||||||||
| Restructuring severance and termination charges | $ | 11,156 | $ | 6,074 | $ | 796 | $ | 18,026 | |||||||||||||||||||||
| Other restructuring associated costs, net | 10,189 | (684) | — | 9,505 | |||||||||||||||||||||||||
| Asset related charges | 7,862 | 348 | — | 8,210 | |||||||||||||||||||||||||
| Other restructuring associated costs and asset related charges, net | 18,051 | (336) | — | 17,715 | |||||||||||||||||||||||||
| Total restructuring and asset related charges | $ | 29,207 | $ | 5,738 | $ | 796 | $ | 35,741 | |||||||||||||||||||||
| Year Ended December 31, 2022 | |||||||||||||||||||||||||||||
| Restructuring severance and termination charges | $ | 6,842 | $ | 3,773 | $ | 3,223 | $ | 13,838 | |||||||||||||||||||||
| Other restructuring associated costs | — | 1,253 | 156 | 1,409 | |||||||||||||||||||||||||
| Asset related charges | 496 | 1,016 | 863 | 2,375 | |||||||||||||||||||||||||
| Other restructuring associated costs and asset related charges | 496 | 2,269 | 1,019 | 3,784 | |||||||||||||||||||||||||
| Total restructuring and asset related charges | $ | 7,338 | $ | 6,042 | $ | 4,242 | $ | 17,622 | |||||||||||||||||||||
| Year Ended December 31, 2021 | |||||||||||||||||||||||||||||
| Restructuring severance and termination charges | $ | (4) | $ | 701 | $ | — | $ | 697 | |||||||||||||||||||||
| Other restructuring associated costs, net | (28) | — | (97) | (125) | |||||||||||||||||||||||||
| Asset related charges | 1,232 | 752 | — | 1,984 | |||||||||||||||||||||||||
| Other restructuring associated costs and asset related charges, net | 1,204 | 752 | (97) | 1,859 | |||||||||||||||||||||||||
| Total restructuring and asset related charges, net | $ | 1,200 | $ | 1,453 | $ | (97) | $ | 2,556 | |||||||||||||||||||||
The following is a summary of the restructuring accruals recorded and charges incurred:
| (amounts in thousands) | 2023 | 2022 | 2021 | |||||||||||||||||||||||
| Balance as of January 1 | $ | 5,021 | $ | 153 | $ | 1,358 | ||||||||||||||||||||
| Current period charges | 27,531 | 15,247 | 572 | |||||||||||||||||||||||
| Payments | (29,367) | (10,273) | (1,719) | |||||||||||||||||||||||
| Currency translation | 190 | (106) | (58) | |||||||||||||||||||||||
| Balance at period end | $ | 3,375 | $ | 5,021 | $ | 153 | ||||||||||||||||||||
Restructuring accruals are expected to be paid within the next 12 months and are included within accrued expenses and other current liabilities in the consolidated balance sheet.
F-39
| (amounts in thousands) | Beginning Accrual Balance | Additions Charged to Expense | Payments or Utilization | Ending Accrual Balance | |||||||||||
| December 31, 2017 | |||||||||||||||
| Severance and sales restructuring costs | $ | 836 | $ | 9,492 | $ | (3,096 | ) | $ | 7,232 | ||||||
| Disposal of property and equipment | — | 190 | (190 | ) | — | ||||||||||
| Lease obligations and other | 4,183 | 1,895 | (2,271 | ) | 3,807 | ||||||||||
| $ | 5,019 | $ | 11,577 | $ | (5,557 | ) | $ | 11,039 | |||||||
| December 31, 2016 | |||||||||||||||
| Severance and sales restructuring costs | $ | 5,424 | $ | 7,448 | $ | (12,036 | ) | $ | 836 | ||||||
| Disposal of property and equipment | — | (71 | ) | 71 | — | ||||||||||
| Lease obligations and other | 3,083 | 3,489 | (2,389 | ) | 4,183 | ||||||||||
| $ | 8,507 | $ | 10,866 | $ | (14,354 | ) | $ | 5,019 | |||||||
| December 31, 2015 | |||||||||||||||
| Severance and sales restructuring costs | $ | 7,307 | $ | 10,493 | $ | (12,376 | ) | $ | 5,424 | ||||||
| Disposal of property and equipment | — | 64 | (64 | ) | — | ||||||||||
| Lease obligations and other | 373 | 6,517 | (3,807 | ) | 3,083 | ||||||||||
| $ | 7,680 | $ | 17,074 | $ | (16,247 | ) | $ | 8,507 | |||||||
During 2023, we announced plans to transform our European operations by changing the operating structure, eliminating certain roles and rationalizing our manufacturing footprint. We plan to close two manufacturing facilities and transfer production to other facilities within Europe. We expect to incur pre-tax restructuring expenses and other closure costs of approximately $20.8 million for the approved actions, consisting of $13.3 million in restructuring severance and termination charges, $4.4 million in equipment relocation costs and $3.1 million of capital expenditures. Through December 31, 2023, approximately $3.5 million has been expensed in connection with these actions, consisting primarily of $3.1 million in restructuring severance and termination charges. We expect to incur a total pre-tax cash outlay of approximately $20.8 million by the end of 2024 in connection with the announced actions, of which, $2.1 million of cash outlay has been incurred as of December 31, 2023.
In the third quarter of 2023, we announced plans to close two manufacturing facilities, located in Tijuana, Mexico and Vista, California as part of our footprint rationalization activities. We expect to incur pre-tax restructuring expenses and other closure costs of approximately $16.1 million, primarily consisting of $8.2 million in restructuring severance and termination charges, $3.7 million of asset related charges and $2.1 million of equipment relocation and facility restoration costs. Through December 31, 2023, approximately $12.1 million has been expensed in connection with the announced closures, consisting of $7.8 million in restructuring severance and termination charges, $3.7 million in asset related charges and $0.6 million in equipment relocation and facility restoration costs. Additionally, $1.5 million in other non-cash inventory charges were recorded against Cost of Sales and were detrimental to Adjusted EBITDA. We expect to incur a total pre-tax cash outlay of approximately $10.3 million by the end of 2024 in connection with the announced closures, of which, $6.6 million of cash outlay has been incurred as of December 31, 2023.
On January 26, 2023, we announced to employees a restructuring plan to close a manufacturing facility in Atlanta, Georgia. We substantially completed the plant closure during the year ended December 31, 2023, with total cash outlays of $12.9 million. We incurred pre-tax restructuring expenses and other closure costs of approximately $17.7 million, which included $1.1 million of capital expenditures. The primary expenses incurred were accelerated depreciation and amortization, equipment relocation costs, and restructuring severance costs. We expect to incur the remaining cash expenses of approximately $0.5 million to $1.0 million, related to equipment relocation costs, during 2024.
Note 25.20. Held for Sale
During 2021, the Company ceased the appeal process for its litigation with Steves & Sons, Inc. (“Steves”) further described in Note 25 - Commitments and Contingencies. As a result, we are required to divest the Company’s Towanda, PA operations (“Towanda”). As of December 31, 2023 and December 31, 2022, the assets and liabilities associated with the sale of Towanda qualify as held for sale. Since the Company will continue manufacturing door skins for its internal needs, the divestiture decision did not represent a strategic shift thereby precluding the divestiture as qualifying as a discontinued operation. We will continue to report the Towanda results within our North America operations until the divestiture is finalized.
The assets and liabilities included within the summary below are expected to be disposed of within the next twelve months and are included in assets held for sale and liabilities held for sale in the accompanying consolidated balance sheets.
| (amounts in thousands) | December 31, 2023 | December 31, 2022 | |||||||||
| Assets | |||||||||||
| Inventory | $ | 17,337 | $ | 16,592 | |||||||
| Other current assets | 108 | 110 | |||||||||
| Property and equipment | 50,672 | 41,600 | |||||||||
| Intangible assets | 1,471 | 1,471 | |||||||||
| Goodwill | 65,000 | 65,000 | |||||||||
| Operating lease assets | 975 | 975 | |||||||||
| Assets held for sale | $ | 135,563 | $ | 125,748 | |||||||
| Liabilities | |||||||||||
| Accrued payroll and benefits | $ | 901 | $ | 852 | |||||||
| Accrued expenses and other current liabilities | 6,126 | 4,707 | |||||||||
| Current maturities of long term debt | — | 1 | |||||||||
| Operating lease liability | 37 | 480 | |||||||||
| Liabilities held for sale | $ | 7,064 | $ | 6,040 | |||||||
F-40
Note 21. Interest Expense, Net
Interest expense, net is net of capitalized interest.interest and interest income. Capitalized interest incurred during the construction phase of significant property and equipment additions totaled $1.1 million, $0.9 million, in 2017, $1.7and $0.4 million for the years ended December 31, 2023, 2022, and 2021, respectively. We recognized interest income of $19.0 million and $5.8 million in 2016the years ended December 31, 2023 and $0.8 million in 2015. We madeDecember 31, 2022, respectively, primarily from gains on our interest payments of $66.1 million in 2017, $73.9 million in 2016 and $57.0 million in 2015.rate swap agreements reclassified to interest income. Refer to Note 23 - Derivative Financial Instruments for further information. Interest income recorded during the year ended December 31, 2021 was not significant. Interest expense, net also includes amortization of debt issuance costs that are amortized using the effective interest method. We allocated interest expense to discontinued operationsmethod and amortization of zero in 2017, $0.6 million in 2016 and $0.8 million in 2015.original issue discounts.
Note 26.22. Other (Income) ExpenseIncome, Net
| (amounts in thousands) | 2017 | 2016 | 2015 | ||||||||
| Foreign currency losses (gains) | $ | 10,426 | $ | 3,580 | $ | (9,254 | ) | ||||
| Legal settlement income | (2,456 | ) | (9,671 | ) | (2,421 | ) | |||||
| Settlement of contract escrow | (2,247 | ) | — | — | |||||||
| Rent and finance income | (2,098 | ) | (2,630 | ) | (2,174 | ) | |||||
| Other items | (1,624 | ) | (1,133 | ) | 216 | ||||||
| Loss (gain) on sale of property and equipment | 16 | (2,971 | ) | (487 | ) | ||||||
| $ | 2,017 | $ | (12,825 | ) | $ | (14,120 | ) | ||||
| (amounts in thousands) | 2023 | 2022 | 2021 | ||||||||||||||||||||||||||
| JW Australia Transition Services Agreement cost recovery | $ | (8,281) | $ | — | $ | — | |||||||||||||||||||||||
Income from refund of deposits for China antidumping duties(1) | (6,984) | — | — | ||||||||||||||||||||||||||
| Pension expense (gain) | 6,546 | (4,940) | (733) | ||||||||||||||||||||||||||
U.S. Employee Retention Credit(2) | (6,073) | — | — | ||||||||||||||||||||||||||
Pension plan settlement expense(3) | 4,349 | — | — | ||||||||||||||||||||||||||
| Recovery of cost from interest received on impaired notes | (3,514) | (13,953) | — | ||||||||||||||||||||||||||
| Income from short-term investments and forward contracts related to the JW Australia divestiture | (3,109) | — | — | ||||||||||||||||||||||||||
| Insurance reimbursement | (2,531) | (6,343) | (1,619) | ||||||||||||||||||||||||||
| Foreign currency gains, net | (1,614) | (965) | $ | (7,122) | |||||||||||||||||||||||||
Governmental assistance(4) | (1,447) | (1,699) | (1,732) | ||||||||||||||||||||||||||
| Legal settlement income | — | (10,500) | — | ||||||||||||||||||||||||||
| Credit for overpayments of utility expenses | — | (1,975) | — | ||||||||||||||||||||||||||
| Other items, net | (3,061) | (13,058) | (2,035) | ||||||||||||||||||||||||||
| Total other income, net | $ | (25,719) | $ | (53,433) | $ | (13,241) | |||||||||||||||||||||||
(1)Represents estimated income from the refund of deposits for antidumping duties on wood moldings and millwork products purchased from China between 2020 through 2022.
(2)Represents an ERC from the U.S. government during the year ended December 31, 2023. The ERC is a refundable tax credit to partially refund qualified wages paid to employees that were unable to work during the years ended December 31, 2020 and December 31, 2021 due to COVID-related government restrictions.
(3)Represents a settlement loss associated with our U.S. defined benefit pension plan resulting from a one-time lump sum payment offered to pension plan participants. Refer to Note 26 -Employee Retirement and Pension Benefits for additional information.
(4)Governmental assistance for the year ended December 31, 2023 consisted primarily of energy subsidies received by our European businesses. Governmental assistance for years ended December 31, 2022, and December 31, 2021 consisted primarily of cash received from government pandemic assistance programs in Europe and North America as a result of COVID-19. During the year ended December 31, 2022, we recognized $0.6 million of government pandemic assistance within our Europe segment. During the year ended December 31, 2021 we recognized $1.6 million of government pandemic assistance within our Europe and North America segments.
To conform with current period presentation, certain amounts in prior period information have been reclassified.
Note 27.23. Derivative Financial Instruments
Foreign currency derivatives – WeAs a multinational corporation, we are exposed to the impact of foreign currency fluctuations in certain countries in which we operate. In most of these countries, the exposure to foreign currency movements is limited because the operating revenues and expenses of our business units are substantially denominated in the local currency.fluctuations. To the extent borrowings, sales, purchases, or other transactions are not executed in the local currency of the operating unit, we are exposed to foreign currency risk. In ordermost of the countries in which we operate, the exposure to foreign currency movements is limited because the operating revenues and expenses of our business units are substantially denominated in the local currency. To mitigate the exposure, we may enter into a variety of foreign currency derivative contracts, such as forward contracts, option collars and cross-currency swaps. We use foreign currency derivative contracts, with a total notional amount of $124.5 million, in order tocontracts. To manage the effect of exchange fluctuations on forecasted sales, purchases, acquisitions, inventory and capital expenditures, and certain intercompany transactions that are denominated in foreign currencies. We usecurrencies, we have foreign currency derivative contracts with a total notional amount of $76.3$95.9 million as of December 31, 2023. We have foreign currency derivative
F-41
contracts, with a total notional amount of $140.1 million, to hedgemanage the effectsrisks of translationforeign currency gains and losses on intercompany loans and interest. We also useare subject to currency translation risk associated with converting our foreign currency derivative contracts, with a total notional amount of $121.0 million, tooperations’ financial statements into U.S. dollars. To mitigate the impact to the consolidated earnings of the Company from the effect of the translation of certain subsidiaries’ local currency results into U.S. dollars.dollars, we have foreign currency derivative contracts with a total notional amount of $28.9 million as of December 31, 2023. We do not use derivative financial instruments for trading or speculative purposes. HedgeAs of December 31, 2023, we have not elected hedge accounting has not been elected for any foreign currency derivative contracts. We record mark-to-market changes in the values of these derivatives in other (expense) income.income, net. We recorded mark-to-market losses of $6.3$2.7 million relating to foreign currency derivatives in the year ended December 31, 2023 and gains of $1.1 million and $0.9 million, and a gain of $0.9$6.3 million in the years ended December 31, 2017, 20162022 and 2015,December 31, 2021, respectively.
On April 18, 2023 we entered into forward contracts to sell a total of AUD 420.0 million and receive USD at exchange rates ranging from 0.6751 USD to 0.6759 USD to 1.0 AUD to mitigate the impact of the Australian dollar currency fluctuations on our net investment in JELD-WEN Australia Pty. Ltd. We designated the forward contracts as net investment hedges. The contracts matured during the third quarter of 2023 and the gain, net of forward points, was included in the gain on the sale of JW Australia. The proceeds are included in the proceeds (payments) related to the sale of JW Australia within our consolidated statements of cash flows. No portion of these contracts were deemed ineffective during the year ended December 31, 2023.
Interest rate swap derivatives – We are exposed to interest rate risk in connection with our variable rate long-term debt. During the fourth quarter of 2014,In May 2020, we entered into interest rate swap agreements with notional amounts aggregating to $370.0 million to manage this risk. These interest rate swaps were set to mature in September 2019 with half of the $488.3 million amortized aggregate notional amount having become effective in September 2015, and the other half having become effective in September 2016. On July 1, 2015, we amended our Term Loan Facility, and we received an additional $480.0 million in long-term borrowings. In conjunction with the issuance of the incremental term loan debt, we entered into additional interest rate swap agreements to manage our
The interest rate swap agreements matured in December 2023. Initially, the agreements had a weighted average fixed rate of 0.395% swapped against one-month USD LIBOR floored at 0.00%. In June 2023, we amended the agreements to replace LIBOR with a Term SOFR based rate. The amended agreements had a weighted average fixed rate of 0.317% swapped against one-month USD-SOFR CME Term floored at (0.10)%. All other terms and conditions were unchanged. We designated the interest rate swap agreements as cash flow hedges and prior to their termination in December 2017,they effectively changedfixed the LIBOR-basedinterest rate on a corresponding portion of the interest rate (or “base rate”) on a portion of theaggregate debt outstanding under our Term Loan Facility to the weighted average fixed rates per the time frames below:Facility.
| Period | Notional (1) | Weighted Average Rate | |
| (amounts in thousands) | |||
| December 2015 - June 2016 | $273,000 | 1.997% | |
| June 2016 - September 2016 | $486,000 | 2.054% | |
| September 2016 - December 2016 | $759,000 | 2.161% | |
| December 2016 - December 2017 | $914,250 | 2.188% | |
During the first quarter of 2019, we entered into two interest rate cap contracts against three-month USD LIBOR, each with a cap rate of 3%. These caps had a combined notional amount of $150.0 million, became effective in March 2019, and matured in December 31, 2021. We did not elect hedge accounting and recorded insignificant mark-to-market adjustments in the year ended December 31, 2021.
operations each period.
The fair values of derivative instruments held are as follows as of December 31:follows:
| Derivative assets | |||||||||||||||||
| (amounts in thousands) | Balance Sheet Location | December 31, 2023 | December 31, 2022 | ||||||||||||||
| Derivatives designated as hedging instruments: | |||||||||||||||||
| Interest rate contracts | Other current assets | $ | — | $ | 16,235 | ||||||||||||
| Derivatives not designated as hedging instruments: | |||||||||||||||||
| Foreign currency forward contracts | Other current assets | $ | 1,186 | $ | 3,809 | ||||||||||||
| Other derivative instruments | Other current assets | 38 | 73 | ||||||||||||||
| Derivative liabilities | |||||||||||||||||
| (amounts in thousands) | Balance Sheet Location | December 31, 2023 | December 31, 2022 | ||||||||||||||
| Derivatives not designated as hedging instruments: | |||||||||||||||||
| Foreign currency forward contracts | Accrued expenses and other current liabilities | $ | 2,975 | $ | 3,058 | ||||||||||||
| Other derivative instruments | Accrued expenses and other current liabilities | $ | 21 | 288 | |||||||||||||
F-42
| Derivative assets | |||||||||
| (amounts in thousands) | Balance Sheet Location | 2017 | 2016 | ||||||
| Derivatives not designated as hedging instruments: | |||||||||
| Foreign currency forward contracts | Other current assets | $ | 2,235 | $ | 6,309 | ||||
| Derivatives liabilities | |||||||||
| Balance Sheet Location | 2017 | 2016 | |||||||
| Derivatives designated as hedging instruments: | |||||||||
| Interest rate contracts | Accrued expenses and other current liabilities | $ | — | $ | 9,050 | ||||
| Deferred credits and other liabilities | $ | — | $ | 3,878 | |||||
| Derivatives not designated as hedging instruments: | |||||||||
| Foreign currency forward contracts | Accrued expenses and other current liabilities | $ | 2,905 | $ | 691 | ||||
Note 28.24. Fair Value Measurements
of Financial Instruments
We record financial assets and liabilities at fair value based on FASB guidance related to Fair Value Measurements.fair value measurements. The guidance requires fair value to be determined based on the exchange price that would be received for an asset or paid to transfer a liability (an exit price) in the principal or most advantageous market for the asset or liability in an orderly transaction between market participants at the measurement date.
may be used to measure fair value:
Level 1 – Quoted prices (unadjusted) in active markets for identical assets or liabilities that the reporting entity has the ability to access at the measurement date.
liabilities.
Level 2 – Quoted prices for similar assetsmarket-based inputs or liabilities in active markets; quoted prices for identical or similar assets or liabilities in marketsunobservable inputs that are not active; and model-driven valuations whose significant inputs are observable or whose significant value drivers are observable.
corroborated by market data.
Level 3 – SignificantUnobservable inputs to the valuation model that are unobservable.
not corroborated by market data.
The recorded carrying amounts and fair values of these instruments were as follows asfollows:
| December 31, 2023 | |||||||||||||||||||||||||||||||||||
| (amounts in thousands) | Carrying Amount | Total Fair Value | Level 1 | Level 2 | Level 3 | Assets measured at NAV (1) | |||||||||||||||||||||||||||||
| Assets: | |||||||||||||||||||||||||||||||||||
| Cash equivalents | $ | 71,139 | $ | 71,139 | $ | 71,139 | $ | — | $ | — | $ | — | |||||||||||||||||||||||
Derivative assets, recorded in other current assets | 1,224 | 1,224 | — | 1,224 | — | — | |||||||||||||||||||||||||||||
| Deferred compensation plan assets, recorded in other assets | 2,098 | 2,098 | — | 2,098 | — | — | |||||||||||||||||||||||||||||
| Pension plan assets: | |||||||||||||||||||||||||||||||||||
| Cash and short-term investments | 17,317 | 17,317 | 17,317 | — | — | — | |||||||||||||||||||||||||||||
| U.S. Government and agency obligations | 48,600 | 48,600 | 48,600 | — | — | ||||||||||||||||||||||||||||||
| Corporate and foreign bonds | 133,819 | 133,819 | — | 133,819 | — | — | |||||||||||||||||||||||||||||
| Asset-backed securities | 6,885 | 6,885 | — | 6,885 | — | — | |||||||||||||||||||||||||||||
| Mutual funds | 34,076 | 34,076 | — | 34,076 | — | — | |||||||||||||||||||||||||||||
| Common and collective funds | 38,882 | 38,882 | — | — | — | 38,882 | |||||||||||||||||||||||||||||
| Liabilities: | |||||||||||||||||||||||||||||||||||
| Debt, recorded in long-term debt and current maturities of long-term debt | $ | 1,232,780 | $ | 1,209,961 | $ | — | $ | 1,209,961 | $ | — | $ | — | |||||||||||||||||||||||
Derivative liabilities, recorded in accrued expenses and other current liabilities | 2,996 | 2,996 | — | 2,996 | — | — | |||||||||||||||||||||||||||||
F-43
| December 31, 2022 | |||||||||||||||||||||||||||||||||||
| (amounts in thousands) | Carrying Amount | Total Fair Value | Level 1 | Level 2 | Level 3 | Assets measured at NAV (1) | |||||||||||||||||||||||||||||
| Assets: | |||||||||||||||||||||||||||||||||||
| Cash equivalents | $ | 6,078 | $ | 6,078 | $ | 6,078 | $ | — | $ | — | $ | — | |||||||||||||||||||||||
Derivative assets, recorded in other current assets | 20,117 | 20,117 | — | 20,117 | — | — | |||||||||||||||||||||||||||||
| Deferred compensation plan assets, recorded in other assets | 725 | 725 | — | 725 | — | — | |||||||||||||||||||||||||||||
| Pension plan assets: | |||||||||||||||||||||||||||||||||||
| Cash and short-term investments | 10,184 | 10,184 | 10,184 | — | — | — | |||||||||||||||||||||||||||||
| U.S. Government and agency obligations | 35,657 | 35,657 | 35,657 | — | — | — | |||||||||||||||||||||||||||||
| Corporate and foreign bonds | 127,618 | 127,618 | — | 127,618 | — | — | |||||||||||||||||||||||||||||
| Equity securities | 18,971 | 18,971 | 18,971 | — | — | — | |||||||||||||||||||||||||||||
| Mutual funds | 61,750 | 61,750 | — | 61,750 | — | — | |||||||||||||||||||||||||||||
| Common and collective funds | 60,297 | 60,297 | — | — | — | 60,297 | |||||||||||||||||||||||||||||
| Liabilities: | |||||||||||||||||||||||||||||||||||
| Debt, recorded in long-term debt and current maturities of long-term debt | $ | 1,758,480 | $ | 1,554,621 | $ | — | $ | 1,554,621 | $ | — | $ | — | |||||||||||||||||||||||
Derivative liabilities, recorded in accrued expenses and other current assets | 3,346 | 3,346 | — | 3,346 | — | — | |||||||||||||||||||||||||||||
(1)Certain pension assets that are measured at fair value using the NAV per share (or its equivalent) practical expedient have not been classified in the fair value hierarchy. These include investments in large cap equity and commingled real estate funds, which are valued using the NAV provided by the administrator of December 31:the funds. Redemption of these funds is not subject to restriction.
| 2017 | |||||||||||||||||||
| (amounts in thousands) | Level 1 | Level 2 | Level 3 | Assets measured at NAV (a) | Total Fair Value | ||||||||||||||
| Cash equivalents | $ | — | $ | 44,091 | $ | — | $ | — | $ | 44,091 | |||||||||
| Derivative assets, recorded in other current assets | — | 2,235 | — | — | 2,235 | ||||||||||||||
| Derivative liabilities, recorded in accrued expenses and deferred credits | — | (2,905 | ) | — | — | (2,905 | ) | ||||||||||||
| Pension plan assets: | |||||||||||||||||||
| Cash and short-term investments | — | 17,859 | — | — | 17,859 | ||||||||||||||
| U.S. Government and agency obligations | 25,122 | — | — | — | 25,122 | ||||||||||||||
| Corporate and foreign bonds | — | 98,432 | — | — | 98,432 | ||||||||||||||
| Asset-backed securities | — | 839 | — | — | 839 | ||||||||||||||
| Equity securities | 32,444 | — | — | — | 32,444 | ||||||||||||||
| Mutual funds | — | 80,352 | — | — | 80,352 | ||||||||||||||
| Common and collective funds | — | — | — | 100,697 | 100,697 | ||||||||||||||
| Total | $ | 57,566 | $ | 240,903 | $ | — | $ | 100,697 | $ | 399,166 | |||||||||
| 2016 | |||||||||||||||||||
| (amounts in thousands) | Level 1 | Level 2 | Level 3 | Assets measured at NAV (a) | Total Fair Value | ||||||||||||||
| Cash equivalents | $ | — | $ | 6,059 | $ | — | $ | — | $ | 6,059 | |||||||||
| Derivative assets, recorded in other current assets | — | 6,309 | — | — | 6,309 | ||||||||||||||
| Derivative liabilities, recorded in accrued expenses and deferred credits | — | (13,619 | ) | — | — | (13,619 | ) | ||||||||||||
| Pension plan assets: | — | — | — | — | — | ||||||||||||||
| Cash and short-term investments | 5,873 | — | — | 5,873 | |||||||||||||||
| U.S. Government and agency obligations | 30,953 | — | — | — | 30,953 | ||||||||||||||
| Corporate and foreign bonds | — | 77,934 | — | — | 77,934 | ||||||||||||||
| Asset-backed securities | — | 580 | — | — | 580 | ||||||||||||||
| Equity securities | 48,320 | — | 658 | — | 48,978 | ||||||||||||||
| Mutual funds | — | 129,791 | — | — | 129,791 | ||||||||||||||
| Common and collective funds | — | — | — | 15,482 | 15,482 | ||||||||||||||
| Total | $ | 79,273 | $ | 212,927 | $ | 658 | $ | 15,482 | $ | 308,340 | |||||||||
Derivative assets and liabilities reported in level 2 includeprimarily include: (1) as of December 31, 2023, foreign currency derivative contracts; (2) as of December 31, 2022, foreign currency derivative contracts and interest rate swaps. The fair values of the foreign currency contracts were determined using counterparty quotes based on prevailing market dataswap agreements. See Note 23 - Derivative Financial Instruments for additional information about our derivative assets and derived from their internal, proprietary model-driven valuation techniques. The fair values of the interest rate swaps areliabilities.
There are valued by third parties who make comparison to similarno material non-financial assets or use quotes for the same assets in inactive markets and are included in level 2. The valuation methodologies for pension plan government bonds and equity securities are quoted prices and are included in level 1.
| 2017 | |||||||||||||||||||
| (amounts in thousands) | Level 1 | Level 2 | Level 3 | Fair Value | Total Losses | ||||||||||||||
| Closed operations | $ | — | $ | — | $ | 914 | $ | 914 | $ | 1,473 | |||||||||
| Total | $ | — | $ | — | $ | 914 | $ | 914 | $ | 1,473 | |||||||||
| 2016 | |||||||||||||||||||
| (amounts in thousands) | Level 1 | Level 2 | Level 3 | Fair Value | Total Losses | ||||||||||||||
| Closed operations | $ | — | $ | — | $ | 1,445 | $ | 1,445 | $ | 1,602 | |||||||||
| Total | $ | — | $ | — | $ | 1,445 | $ | 1,445 | $ | 1,602 | |||||||||
Note 30.25. Commitments and Contingencies
Litigation – We are involved in various legal proceedings, encounteredclaims, and government audits arising in the normalordinary course of business and accrue forbusiness. We record our best estimate of a loss amounts on legal matters when itthe loss is considered probable a liability has been incurred and the amount of liabilitysuch loss can be reasonably estimated. Legal judgmentsWhen a loss is probable and there is a range of estimated settlements have been included in accrued expenses inloss with no best estimate within the accompanying consolidated balance sheets.
range, we record the minimum estimated liability related to the lawsuit or claim. As additional information becomes available, we reassess the potential liability and revise our accruals, if necessary. Because of uncertainties related to the resolution of lawsuits and claims, the ultimate outcome may differ materially from our estimates.
Other than asthe matters described below, as of December 31, 2017, there arewere no current proceedings or litigation matters involving the Company or its property as of December 31, 2023 that we believe would have a material adverse effect on our consolidated financial position or cash flows, although they could have a material adverse impacteffect on our business, financial condition,operating results of operations or cash flows.for a particular reporting period.
Steves and& Sons, Inc. vs JELD-WEN, Inc. – We sell molded door skins to certain customers pursuant to long-term contracts, and these customers in turn use the molded door skins to manufacture interior doors and compete directly against us in the marketplace. We have givengave notice of termination of one of these contracts and, on June 29, 2016, the counterparty to the agreement, Steves and& Sons, Inc. (“Steves”) filed a claim against JWI in the U.S. District Court for the Eastern District of Virginia, Richmond Division (“Eastern(the “Eastern District of Virginia”). The complaint allegesalleged that our acquisition of CMI, a competitor in the molded door skins market, together with subsequent price increases and other alleged acts and omissions, violated antitrust laws, and constituted a breach of contract and breach of warranty. Specifically, the complaint alleged that our acquisition of CMI substantially lessened competition in the molded door skins market. The complaint seekssought declaratory relief, ordinary and treble damages, and injunctive relief, including divestiture of certain assets acquired in the CMI acquisition.
F-44
supply agreement between the parties.parties (the “Original Action”). The verdict awardsawarded Steves $12,151,873$12.2 million for past damages under both the Clayton Act and breach of contract claims and $46,480,581$46.5 million in future lost profits under the Clayton Act claim. We expect that Steves will be required to elect to recover its past damages either under the Clayton Act claims or the contract claims, but not both. If a judgment is entered under the Clayton Act, any damages awarded will be trebled. In addition, if a judgment is entered under either theory in accordance with the verdict, Steves will be entitled to an award of attorney’s fees, which amounts have not yet been quantified. We have asserted a position that, because future lost profits were awarded, Steves is not permitted to pursue its claim for divestiture of certain assets acquired in the CMI acquisition. The court has not yet ruled on this issue.
During the course of the proceedings in the Eastern District of Virginia, we discovered certain facts that led us to conclude that Steves, its principals, and certain former employees of the Company had misappropriated Company trade secrets, violated the terms of various agreements between the Company and those parties, and violated other laws. We have asserted claims against certain of those partiesOn May 11, 2018, a jury in the Eastern District of Virginia and in the District Court of Bexar County, Texas, and are pursuing those claims vigorously. Ourreturned a verdict on our trade secrets claims against Steves and othersawarded damages in the amount of $1.2 million. The presiding judge entered a judgment in our favor for those damages, and the entire amount has been paid by Steves. On August 16, 2019, the presiding judge granted Steves’ request for an injunction, prohibiting us from pursuing certain claims against individual defendants pending in Bexar County, Texas (the “Steves Texas Trade Secret Theft Action”). On September 11, 2019, JELD-WEN filed a notice of appeal of the Eastern District of Virginia’s injunction to the Fourth Circuit Court of Appeals (the “Fourth Circuit”).
On March 13, 2019, the presiding judge entered an Amended Final Judgment Order in the Original Action, awarding $36.5 million in past damages under the Clayton Act (representing a trebling of the jury’s verdict) and granted divestiture of certain assets acquired in the CMI acquisition, subject to appeal. The judgment also conditionally awarded damages in the event the judgment was overturned on appeal. Specifically, the court awarded $139.4 million as future antitrust damages in the event the divestiture order was overturned on appeal and $9.9 million as past contract damages in the event both the divestiture and antitrust claims were overturned on appeal.
On April 12, 2019, Steves filed a petition requesting an award of its fees and a bill of costs, seeking $28.4 million in attorneys’ fees and $1.7 million in costs in connection with the Original Action. On November 19, 2019, the presiding judge entered an order for further relief awarding Steves an additional $7.1 million in damages for pricing differences from the date of the underlying jury verdict through May 31, 2019 (the “Pricing Action”). We also appealed that ruling. On April 14, 2020, Steves filed a motion for further supplemental relief for pricing differences from the date of the prior order and going forward through the end of the parties’ current supply agreement (the “Future Pricing Action”). We opposed that request for further relief.
JELD-WEN filed a supersedeas bond and notice of appeal of the judgment, which was heard by the Fourth Circuit on May 29, 2020. On February 18, 2021, the Fourth Circuit issued its decision on appeal in the Original Action, affirming the Amended Final Judgment Order in part and vacating and remanding in part. The Fourth Circuit vacated the Eastern District of Virginia’s alternative $139.4 million lost-profits award, holding that award was premature because Steves has not suffered the purported injury on which its claim for future lost profits rests. The Fourth Circuit also vacated the Eastern District of Virginia’s judgment for Sam Steves, Edward Steves, and John Pierce on JELD-WEN’s trade secrets claims. The Fourth Circuit affirmed the Eastern District of Virginia’s finding of antitrust injury and its award of $36.5 million in past antitrust damages. It also affirmed the Eastern District of Virginia’s divestiture order, while clarifying that JELD-WEN retains the right to challenge the terms of any divestiture, including whether a sale to any particular buyer will serve the public interest, and made clear that the Eastern District of Virginia may need to revisit its divestiture order if the special master who has been appointed by the presiding judge cannot locate a satisfactory buyer. JELD-WEN then filed a motion for rehearing en banc with the Fourth Circuit that was denied on March 22, 2021.
Following a thorough review, and consistent with our practice, we concluded that it is in the best interest of the Company and its stakeholders to move forward with the divestiture of Towanda and certain related assets. Although the Company did not seek Supreme Court review of the Fourth Circuit’s February 18, 2021 decision, the Company retains the legal right to challenge the divestiture process and the final divestiture order. We made estimates related to the divestiture in the preparation of our financial statements; however, there can be no guarantee that the divestiture will be consummated. The divestiture process is ongoing, and the special master is overseeing this process. Although the Company has decided to divest, we continue to believe that Steves’ claims lacked merit and that it was not entitled to the extraordinary remedy of divestiture. We continue to believe that the judgment in accordance with the verdict was improper under applicable law.
During the pendency of the Original Action, on February 14, 2020, Steves filed a complaint and motion for preliminary injunction in the Eastern District of Virginia related to misappropriation of trade secrets remain pending and are set for trial in April 2018. Ouralleging that we breached the long-term supply agreement between the parties, including, among other claims, remain pendingby incorrectly calculating the allocation of door skins owed to Steves (the “Allocation Action”). Steves sought an additional allotment of door skins and damages for violation of antitrust laws, tortious interference, and breach of contract. On April 10, 2020, the presiding judge granted Steves’ motion for preliminary injunction, and the parties settled the issues underlying the preliminary injunction on April 30, 2020 and the Company reserved the right to appeal the ruling in Bexar County, Texas,the Fourth Circuit. The Company believed all the claims lacked merit and are set for trial in October 2018.moved to dismiss the antitrust and tortious interference claims.
F-45
Pricing Action, withdrew its Future Pricing Action with prejudice, and filed a stipulated dismissal with prejudice in the Allocation Action. The Company also withdrew its appeal of the Pricing Action. The parties agreed to bear their own respective attorneys’ fees and costs in these actions. In partial consideration of the settlement, JWI and Steves entered into an amended supply agreement satisfactory to both parties that, by its terms, ended on September 10, 2021. This settlement had no effect on the Original Action between the parties except to agree that certain specific terms of the Amended Final Judgment Order in the Original Action would apply to the management and distributionamended supply agreement during the pendency of the ESOP funds. These matters were pled as class actions and noneappeal of the casesOriginal Action. On April 2, 2021, JWI and Steves filed a stipulation regarding the amended supply agreement in the Original Action, stating that regardless of whether the case remains on appeal as of September 10, 2021, and absent further order of the court, the amended supply agreement would be extended until the divestiture of Towanda and certain related assets is complete and Steves’ new supply agreement with the company that acquires Towanda is in effect.
We continue to believe the claims in the settled actions lacked merit and made no admission of liability in these matters.
On October 7, 2021, we entered into a settlement agreement with Steves to resolve the following: (i) Steves’ past and any future claims for attorneys’ fees, expenses, and costs in connection with the Original Action, except that Steves and JWI each reserved the right to seek attorneys’ fees arising out of any challenge of the divestiture process or the final divestiture order; (ii) the Steves Texas Trade Secret Theft Action and the related Fourth Circuit appeal of the Eastern District of Virginia’s injunction in the Original Action; (iii) the past damages award in the Original Action; and (iv) any and all claims and counterclaims, known or unknown, that were certified. In January 2015,asserted or could have been asserted against each other from the beginning of time through the date of the settlement agreement. As a result of the settlement, the parties filed a stipulated notice of satisfaction of the past antitrust damages judgment and a stipulated notice of settlement of Steves’ claim for attorneys’ fees, expenses, and costs against JWI in the Original Action, and Steves filed a notice of withdrawal of its motion for attorneys’ fees and expenses and bill of costs in the Original Action. The Company also filed a notice of dismissal with prejudice and agreed to take no judgment in the Steves Texas Trade Secret Theft Action, and the parties filed a joint agreement for dismissal of the injunction appeal in the Fourth Circuit. On November 3, 2021, we executedpaid $66.4 million to Steves under the settlement agreements with applicableagreement.
Cambridge Retirement System v. JELD-WEN Holding, Inc., et al. – On February 19, 2020, Cambridge Retirement System filed a putative class action lawsuit in the Eastern District of Virginia against the Company, current and former Company executives, and various Onex-related entities alleging violations of Section 10(b) and Rule 10b-5 of the Exchange Act, as well as violations of Section 20(a) of the Exchange Act against the individual defendants and Onex-related entities (“Cambridge”). The lawsuit sought compensatory damages, equitable relief, and an award of attorneys’ fees and costs. On May 8, 2020, the Public Employees Retirement System of Mississippi and the Plumbers and Pipefitters National Pension Fund were named as co-lead plaintiffs and filed an amended complaint on June 22, 2020.
On April 20, 2021, the parties resultingreached an agreement in our recordingprinciple to resolve this securities class action. The agreement contemplated a full release of claims through the date of preliminary court approval of the settlement in exchange for a payment of $39.5 million, primarily funded by the Company’s D&O insurance carriers, except $5.0 million in settlement expense in December 2015. Pursuantwhich was provisionally funded by the Company and remains subject to dispute with insurance carriers. On November 22, 2021, the agreements, we accrued a $15.7 million liability to the plaintiffs in other accrued expenses and a $10.7 million insurance receivable in accounts receivable. In June 2015, we paid all settlement funds into an escrow account. On October 19, 2015, the court providedCourt granted final approval of the settlement agreement. The deadline to appeal the entry of the final approval order and judgment was December 22, 2021, and no party or class member filed an appeal. The Company continues to believe that the plaintiffs’ claims lacked merit and has denied any liability or wrongdoing for the claims made against the Company.
In re JELD-WEN Holding, Inc. Derivative Litigation – On February 2, 2021, Jason Aldridge, on behalf of the Company, filed a derivative action in all respects.the U.S. District Court for the District of Delaware against certain current and former executives and directors of the Company, alleging that the individual defendants breached their fiduciary duties by allowing the wrongful acts alleged in the Steves and Cambridge actions, as well as violations of Section 14(a) and 20(a) of the Exchange Act, unjust enrichment, and waste of corporate assets among other allegations (the “Aldridge Action”). The lawsuit sought compensatory damages, equitable relief, and an award of attorneys’ fees and costs. The plaintiff filed an amended complaint on May 10, 2021.
On June 21, 2021, prior to a response from the Company in the Aldridge Action, Shieta Black and the Board of Trustees of the City of Miami General Employees’ & Sanitation Employees’ Retirement Trust, on behalf of the Company, filed a derivative action in the U.S. District Court for the District of Delaware against certain current and former executives and directors of the Company and Onex Corporation (“Onex”), alleging that the defendants breached their fiduciary duties by allowing the wrongful acts alleged in the Steves and Cambridge actions, as well as insider trading, and unjust enrichment among other allegations (the “Black Action”). The lawsuit sought compensatory damages, corporate governance reforms, restitution, equitable relief, and an award of attorneys’ fees and costs. The court granted the Black and Aldridge plaintiffs in motion to consolidate the lawsuits on July 16, 2021.
On June 20, 2022, the parties entered into a settlement agreement of the consolidated matters, which was approved by the Court on approval of the December 20, 2022, and the cases were dismissed with prejudice. In January 2023, the Company,
F-46
as putative plaintiff, received approximately $10.5 million after attorneys’ fees and costs were deducted as part of the settlement.
In re Interior Molded Doors Antitrust Litigation – On October 19, 2018, Grubb Lumber Company, on behalf of itself and others similarly situated, filed a putative class action lawsuit against us and one of our competitors in the doors market, Masonite Corporation (“Masonite”), in the Eastern District of Virginia. We subsequently received $10.7additional complaints from and on behalf of direct and indirect purchasers of interior molded doors. The suits were consolidated into two separate actions, a Direct Purchaser Action and an Indirect Purchaser Action. The suits alleged that Masonite and JELD-WEN violated Section 1 of the Sherman Act, and in the Indirect Purchaser Action, related state law antitrust and consumer protection laws, by engaging in a scheme to artificially raise, fix, maintain, or stabilize the prices of interior molded doors in the United States. The complaints sought ordinary and treble damages, declaratory relief, interest, costs, and attorneys’ fees.
On August 31, 2020, JELD-WEN and Masonite entered into a settlement agreement with the putative Direct Purchaser
class to resolve the Direct Purchaser Action. Each defendant agreed to pay a total of $30.8 million to the named plaintiffs and the settlement class in exchange for a full release of claims through the date of preliminary approval of the revised settlement, which the court granted on February 5, 2021. In addition, on September 4, 2020, JELD-WEN and Masonite entered into a separate settlement agreement with the putative Indirect Purchaser class to resolve the Indirect Purchaser Action. Each defendant agreed to pay $9.75 million to the named plaintiffs and the settlement class in exchange for a full release of claims through the execution date of the settlement agreement. The final fairness hearing in the Direct Purchaser Action was held on June 2, 2021, and the court entered a final approval order and judgment on June 3, 2021. On June 17, 2021, the Company made the settlement payment to the named plaintiffs and the settlement class in the Direct Purchaser Action. The deadline to appeal the entry of the final approval order and judgment was July 7, 2021, and no party or class member filed an appeal. The final fairness hearing in the Indirect Purchaser Action was held on July 26, 2021 and the court issued a final approval order and judgment on July 27, 2021. On August 10, 2021, the Company made the settlement payment to the named plaintiffs and the settlement class in the Indirect Purchaser Action. The deadline to appeal the entry of the final approval order and judgment was August 26, 2021, and no party or class member filed an appeal. The Company continues to believe that the plaintiffs’ claims lacked merit and has denied any liability or wrongdoing for the claims made against the Company.
Canadian Antitrust Litigation – On May 15, 2020, Développement Émeraude Inc., on behalf of itself and others similarly situated, filed a putative class action lawsuit against the Company and Masonite in the Superior Court of the Province of Quebec, Canada, which was served on us on September 18, 2020 (“the Quebec Action”). The putative class consists of any person in Canada who, since October 2012, purchased one or more interior molded doors from insurance carriersthe Company or Masonite. The suit alleges an illegal conspiracy between the Company and Masonite to agree on December 1, 2016. Allprices, the distribution of market shares and/or the production levels of interior molded doors and that the plaintiffs suffered damages in that they were charged and paid higher prices for interior molded doors than they would have had to pay but for the alleged anti-competitive conduct. The plaintiffs are seeking compensatory and punitive damages, attorneys’ fees and costs. On September 9, 2020, Kate O’Leary Swinkels, on behalf of herself and others similarly situated, filed a putative class action against the Company and Masonite in the Federal Court of Canada, which was served on us on September 29, 2020 (the “Federal Court Action”). The Federal Court Action makes substantially similar allegations to the Quebec Action and the putative class is represented by the same counsel. In February 2021, the plaintiff in the Federal Court Action issued a proposed Amended Statement of Claim that replaced the named plaintiff, Kate O’Leary Swinkels, with David Regan. The plaintiff has sought a stay of the Quebec Action while the Federal Court Action proceeds. We anticipate a hearing on the certification of the Federal Court Action in 2023. The Company believes both the Quebec Action and the Federal Court Action lack merit and intends to vigorously defend against them. On July 14, 2023, the Company entered into a preliminary agreement with class counsel to resolve both actions for an immaterial amount, which the Company recorded in the second quarter of 2023. The proposed settlement fundsremains subject to final documentation and court approval. The Company continues to believe the plaintiffs’ claims lack merit and denies any liability or wrongdoing for the claims made against the Company.
We have now been creditedevaluated the claims against us and recorded provisions based on management’s judgment about the probable outcome of the litigation and have included our estimates in accrued expenses in the accompanying balance sheets. See Note 10 - Accrued Expenses and Other Current Liabilities. While we expect a favorable resolution to claimant’sthese matters, the dispute resolution process could be lengthy, and if the plaintiffs were to prevail completely or substantially in the respective accounts.matters described above, such an outcome could have a material adverse effect on our operating results, consolidated financial position, or cash flows.
Self-Insured Risk – We self-insure substantially all of our domestic business liability risks including general liability, product liability, warranty, personal injury, auto liability, workers’ compensation, and employee medical benefits. Excess insurance policies from independent insurance companies generally cover exposures between $3.0$5.0 million and $250.0$200.0 million for domestic product liability risk and exposures between $0.5$3.0 million and $250.0$200.0 million for auto, general liability, personal injury, and workers’ compensation. We have no stop gap coverage on claims covered byloss insurance covering our self-insured domestic employee medical
F-47
plan and are responsible for all claims thereunder. We estimate our provision for self-insured losses based upon an evaluation of current claim exposure and historical loss experience. Actual self-insurance losses may vary significantly from these estimates. At December 31, 20172023 and December 31, 2016,2022, our accrued liability for self-insured risks was $73.3$89.2 million and $71.3$89.0 million, respectively.
Indemnifications– At December 31, 2017,2023, we had commitments related to certain representations made onin contracts for the purchase or sale of businesses or property.property, including the divestiture of JW Australia. Our indemnity obligations under the relevant agreements may be limited in terms of time, amount or scope. These representations primarily relate to past actions such as responsibility for transfer taxes if they should be claimed, and the adequacy of recorded liabilities, warranty matters, employment benefit plans, income tax matters, or environmental exposures. These guarantees or indemnification responsibilities typically expire within oneAs it relates to three years.certain income tax related liabilities, the relevant agreements may not provide any cap for such liabilities, and the period in which we would be liable would lapse upon expiration of the statute of limitation for assessment of the underlying taxes. Because of the conditional nature of these obligations and the unique facts and circumstances involved in each particular agreement, we are unable to reasonably estimate the potential maximum exposure associated with these items. We are not aware of any material amounts claimed or expected to be claimed under these indemnities.
From time to time and in limited geographic areas, we have entered into agreements for the sale of our products to certain customers that provide additional indemnifications for liabilities arising from construction or product defects. We cannot estimate the potential magnitude of such exposures, but to the
extent specific liabilities have been identified related to product sales, liabilities have been provided in the warranty accrual in the accompanying consolidated balance sheets.
| (amounts in thousands) | 2017 | 2016 | |||||
| Self-insurance workers’ compensation | $ | 21,072 | $ | 18,514 | |||
| Liability and other insurance | 12,900 | 15,884 | |||||
| Environmental | 14,452 | 14,086 | |||||
| Other | 6,650 | 14,070 | |||||
| $ | 55,074 | $ | 62,554 | ||||
Environmental Contingencies – We periodically incur environmental liabilities associated with remediating our current and former manufacturing sites as well as penalties for not complying with environmental rules and regulations. We record a liability for remediation costs when it is probable that we will be responsible for such costs and the costs can be reasonably estimated. These environmental liabilities are estimated based on current available facts and presentcurrent laws and regulations. Accordingly, it is likely that adjustments to the estimated liabilities will be necessary as additional information becomes available. Short-term environmental liabilities and settlements are recorded in accrued expenses and other current liabilities in the accompanying consolidated balance sheets and totaled $0.5 million at both December 31, 20172023 and December 31, 2016.2022, respectively. Long-term environmental liabilities are recorded in deferred credits and other liabilities in the accompanying consolidated balance sheets and totaled $0.1$11.5 million and $0.0$11.8 million at December 31, 20172023 and December 31, 2016,2022, respectively.
Everett, Washington WADOE Action - – In 2007, we were identified by the WADOE as a PLP with respect to our former manufacturing site in Everett, Washington. In 2008, we entered into an Agreed Order with the WADOE to assess historic environmental contamination and remediation feasibility at our former manufacturing site in Everett, Washington.the site. As part of thisthe order, we also agreed to develop a CAP, identifying remediation options andarising from the feasibility thereof. We are currently workingassessment. In December 2020, we submitted to the WADOE a draft feasibility assessment with an array of remedial alternatives, which we considered substantially complete. During 2021, several comment rounds were completed as well as the identification of the Port of Everett and W&W Everett Investment LLC as additional PLPs, with respect to this matter with each PLP being jointly and severally liable for the cleanup costs. The WADOE received the final feasibility assessment on December 31, 2021, containing various remedial alternatives with its preferred remedial alternatives totaling $23.4 million. Based on this study, we have determined our range of possible outcomes to be $11.8 million to $33.4 million. On March 1, 2022, we delivered a draft CAP consistent with the preferred alternatives which was approved by WADOE in August 2023. The existing Agreed Order of 2008 was also modified with WADOE in July 2023 to finalize our assessment and draft CAP. We estimatesupport the remaining cost to complete our assessment and develop the CAP at $0.5 million which we have fully accrued. We are working with insurance carriers who provided coverage to a previous owner and operatordevelopment of the site,associated CAP investigation, sampling and at this time we cannot reasonably estimatedesign components. We have made provisions within our financial statements within the cost associated with any remedial action we would be required to undertakerange of possible outcomes; however, the contents and have not provided for any remedial action in our accompanying consolidated financial statements. Should extensive remedial action ultimately be required, and if those costs are not found to be covered by insurance, the cost of remediation could have a material adverse effect on our results of operationsthe final CAP and cash flows.
Towanda, Pennsylvania Consent Order - –In 2015,December 2020, we entered into a COA with the Pennsylvania Department of Environmental ProtectionPaDEP to remove a pile of wood fiber waste from our site in Towanda, Pennsylvania, which we acquired in connection with our acquisition of CMI in 2013,2012, by using it as fuel for a boiler at that site. The COA replaced a 19952018 Consent Decree between CMI’s predecessor Masonite, Inc.the Company and PaDEP. Under the COA, we are required to achieve certain periodic removal objectives and ultimately remove the entire pile by August 31, 2022. There are currently $11.02025. As of December 31, 2023 and December, 31, 2022 there was $1.4 million and $2.3 million, respectively in bonds posted in connection with these obligations. If we are unable to remove this pile by August 31, 2022,2025, then the bonds will be forfeited, and we may be subject to penalties by PaDEP. We currently anticipate meeting all applicable removal deadlines; however, if our operations at this site decrease and we burn less fuel than currently anticipated, we may notshould change, additional alternatives would be ableevaluated to meet such deadlines.
F-48
Continuing Operations | |||
| 2018 | $ | 33,549 | |
| 2019 | 25,460 | ||
| 2020 | 17,298 | ||
| 2021 | 12,029 | ||
| 2022 | 9,234 | ||
| Thereafter | 24,714 | ||
| $ | 122,284 | ||
Note 31.26. Employee Retirement and Pension Benefits
U.S. Defined Benefit Pension Plan
Certain U.S. hourly employees participate in our defined benefit pension plan. The plan is not open to new employees.
During the fourth quarter of 2023, we completed a balance sheet risk mitigation action related to the U.S. defined benefit pension plan by offering a one-time lump sum election option to terminated vested participants and active participants over the age of 59 1/2. As a result of lump sum elections made by participants, we settled $49.5 million of future obligations and recognized a pre-tax pension settlement charge of $4.3 million in the fourth quarter of 2023. The changesettlement charge, primarily comprised of the recognition of past actuarial losses, is recorded within other income, net in estimate provides a more accurate measurementthe consolidated statements of service and interest cost by applying the spot rate that could be used to settle each projected cash flow individually. This change in estimate did not have a material effect on net periodic benefit costs from the twelve months ended December 31, 2017.
operations.
The components of net periodic benefit cost are summarized as follows for the years ended December 31:
| (amounts in thousands) | |||||||||||||||||||||||||||||
| Components of pension benefit expense - U.S. benefit plan | 2023 | 2022 | 2021 | ||||||||||||||||||||||||||
| Service cost | $ | 7,400 | $ | 3,470 | $ | 2,690 | |||||||||||||||||||||||
Interest cost | 16,602 | 10,556 | 8,870 | ||||||||||||||||||||||||||
Expected return on plan assets | (18,860) | (21,424) | (22,234) | ||||||||||||||||||||||||||
Amortization of net actuarial pension loss | 480 | 1,798 | 9,092 | ||||||||||||||||||||||||||
| Settlement loss | 4,349 | — | — | ||||||||||||||||||||||||||
| Pension benefit expense (income) | $ | 9,971 | $ | (5,600) | $ | (1,582) | |||||||||||||||||||||||
| Discount rate used to determine benefit costs | 5.39% | 2.88% | 2.55% | ||||||||||||||||||||||||||
| Expected long-term rate of return on assets | 6.20% | 5.25% | 5.75% | ||||||||||||||||||||||||||
| Compensation increase rate | N/A | N/A | N/A | ||||||||||||||||||||||||||
| (amounts in thousands) | ||||||||||||
| Components of pension benefit expense - U.S. benefit plan | 2017 | 2016 | 2015 | |||||||||
| Service cost | $ | 3,870 | $ | 3,320 | $ | 2,590 | ||||||
| Interest cost | 13,371 | 16,387 | 16,055 | |||||||||
| Expected return on plan assets | (17,940 | ) | (19,990 | ) | (21,213 | ) | ||||||
| Amortization of net actuarial pension loss | 12,680 | 12,264 | 12,803 | |||||||||
| Pension benefit expense | $ | 11,981 | $ | 11,981 | $ | 10,235 | ||||||
| Discount rate | 3.94% | 4.25% | 3.75% | |||||||||
| Expected long-term rate of return on assets | 6.25% | 7.00% | 7.00% | |||||||||
| Compensation increase rate | N/A | N/A | N/A | |||||||||
dates.
We developed the discount rate based on the plan’s expected benefit payments using the December 31, 2017 Citigroup Pension DiscountWTW RATE:Link 10:90 Yield Curve. Based on this analysis, we selected a 3.47%5.05% discount rate for our projected benefit obligation. As the discount rate is reduced or increased, the pension obligation would increase or decrease, respectively, and future pension expense would increase or decrease, respectively.
We maintain policies for investment of pension plan assets. The policies set forth stated objectives and a structure for managing assets, which includes various asset classes and investment management styles that, in the aggregate, are expected to produce a sufficient level of diversification and investment return over time and provide for the availability of funds for benefits as they become due. The policies also provide guidelines for each investment portfolio that control the level of risk assumed in the portfolio and ensure that assets are managed in accordance with stated objectives. The plan invests primarily in publicly-tradedpublicly traded equity and debt securities as directed by the plan’s investment committee. The target asset allocation is determined by reference to the plan’s funded status percentage. The target allocation of plan assets was 76.0% fixed income securities, 17.7% equity securities and 6.3% other investments, as of December 31, 2023 and 52.2% fixed income securities, 39.8% equity securities and 8.0% other investments, as of December 31, 2022. The pension plan’s expected return assumption is based on the weighted average aggregate long-term expected returns of various actively managed asset classes corresponding to the plan’s asset allocation. We have selected an expected return on plan assets based on a historical analysis of rates of return, our investment mix, market conditions and other factors. The fair value of plan assets increaseddecreased in 20172023 due primarily to the plan settlements and benefit payments, partially offset by investment returns. The fair value of plan assets decreased in 2022 due primarily to investment returns in excess of benefit payments and our discretionary contribution and increased in 2016 due primarily to investment returns in excess of benefit payments.
F-49
| (amounts in thousands) | |||||||
| Change in fair value of plan assets - U.S. benefit plan | 2017 | 2016 | |||||
| Balance at beginning of period | $ | 295,995 | $ | 293,055 | |||
| Actual return on plan assets | 52,559 | 20,658 | |||||
| Company contribution | 10,000 | — | |||||
| Benefits paid | (14,948 | ) | (14,415 | ) | |||
| Administrative expenses paid | (3,855 | ) | (3,303 | ) | |||
| Balance at end of period | $ | 339,751 | $ | 295,995 | |||
| % of Plan Assets | |||
| Summary of plan investments - U.S. benefit plan | 2017 | 2016 | |
| Equity securities | 7.3 | 57.7 | |
| Debt securities | 35.3 | 35.9 | |
| Other | 57.4 | 6.4 | |
| 100.0 | 100.0 | ||
| (amounts in thousands) | |||||||||||
| Change in fair value of plan assets - U.S. benefit plan | 2023 | 2022 | |||||||||
| Balance as of January 1, | $ | 314,477 | $ | 418,947 | |||||||
| Actual return on plan assets | 36,191 | (80,997) | |||||||||
| Benefits paid | (20,041) | (20,060) | |||||||||
| Administrative expenses paid | (4,381) | (3,413) | |||||||||
| Plan settlements | (46,667) | — | |||||||||
| Balance at period end | $ | 279,579 | $ | 314,477 | |||||||
The plan’s projected benefit obligation is determined by using weighted-average assumptions made onas of December 31 of each year, as summarized below:
| (amounts in thousands) | |||||||||||||||||||||
| Change in projected benefit obligation - U.S. benefit plan | 2017 | 2016 | |||||||||||||||||||
| Balance at beginning of period | $ | 405,310 | $ | 392,459 | |||||||||||||||||
| Change in projected benefit obligation - U.S. benefit plan | |||||||||||||||||||||
| Change in projected benefit obligation - U.S. benefit plan | 2023 | 2022 | |||||||||||||||||||
| Balance as of January 1, | |||||||||||||||||||||
| Service cost | 3,870 | 3,320 | |||||||||||||||||||
| Interest cost | 13,371 | 16,387 | |||||||||||||||||||
| Actuarial loss | 31,948 | 10,862 | |||||||||||||||||||
| Actuarial loss (gain) | |||||||||||||||||||||
| Benefits paid | (14,948 | ) | (14,415 | ) | |||||||||||||||||
| Administrative expenses paid | (3,855 | ) | (3,303 | ) | |||||||||||||||||
| Balance at end of period | $ | 435,696 | $ | 405,310 | |||||||||||||||||
| Plan Settlements | |||||||||||||||||||||
| Balance at period end | |||||||||||||||||||||
| Discount rate | 3.47% | 4.00% | Discount rate | 5.05% | 5.39% | ||||||||||||||||
| Compensation increase rate | N/A | N/A | Compensation increase rate | N/A | N/A | ||||||||||||||||
As of December 31, 2017,2023, the plan’s estimated benefit payments for the next ten years are as follows (amounts in thousands):
| 2018 | $ | 18,023 | |
| 2019 | 18,850 | ||
| 2020 | 19,635 | ||
| 2021 | 20,365 | ||
| 2022 | 21,052 | ||
| 2023-2027 | 112,401 | ||
| 2024 | $ | 19,799 | |||
| 2025 | 20,061 | ||||
| 2026 | 20,228 | ||||
| 2027 | 20,349 | ||||
| 2028 | 20,398 | ||||
| 2029-2033 | 100,415 | ||||
The companyCompany made no cash contributions to the plan of $10.0 million for the yearyears ended December 31, 2017. No contributions were made for the year ended2023 and December 31, 2016.2022. During fiscal year 2018, we expect to make2024, no cash contributions are required to be made to the plan of approximately $4.1 million.
plan.
The plan’s accumulated benefit obligation of $435.7$283.9 million is determined by taking the projected benefit obligation and removing the impact of the assumed compensation increases.
The plan’s funded status as of December 31 is as follows:
| (amounts in thousands) | |||||||||||
| Long-term unfunded pension liability - U.S. benefit plan | 2023 | 2022 | |||||||||
| Projected benefit obligation at end of period | $ | 283,896 | $ | 325,479 | |||||||
| Fair value of plan assets at end of period | (279,579) | (314,477) | |||||||||
| Long-term unfunded pension liability | $ | 4,317 | $ | 11,002 | |||||||
F-50
| (amounts in thousands) | |||||||
| Unfunded pension liability - U.S. benefit plan | 2017 | 2016 | |||||
| Projected benefit obligation at end of period | $ | 435,696 | $ | 405,310 | |||
| Fair value of plan assets at end of period | (339,751 | ) | (295,995 | ) | |||
| Unfunded pension liability | 95,945 | 109,315 | |||||
| Current portion | — | — | |||||
| Long-term unfunded pension liability | $ | 95,945 | $ | 109,315 | |||
Net actuarial pension losses are recorded in consolidated other comprehensive income (loss) for the years ended December 31 are as follows:
| (amounts in thousands) | |||||||||||||||||
| Accumulated other comprehensive loss - U.S. benefit plan | 2023 | 2022 | 2021 | ||||||||||||||
| Net actuarial pension loss beginning of period | $ | 43,113 | $ | 52,832 | $ | 102,161 | |||||||||||
| Amortization of net actuarial loss | (480) | (1,798) | (9,092) | ||||||||||||||
| Net gain occurring during year | (11,826) | (7,921) | (40,237) | ||||||||||||||
| Settlement recognition of net actuarial loss | (4,349) | — | — | ||||||||||||||
| Net actuarial pension loss at end of period | 26,458 | 43,113 | 52,832 | ||||||||||||||
| Tax expense | 11,113 | 8,059 | 5,603 | ||||||||||||||
| Net actuarial pension loss at end of period, net of tax | $ | 37,571 | $ | 51,172 | $ | 58,435 | |||||||||||
| (amounts in thousands) | |||||||||||
| Accumulated other comprehensive income (loss) - U.S. benefit plan | 2017 | 2016 | 2015 | ||||||||
| Net actuarial pension loss beginning of period | $ | 127,982 | $ | 130,052 | $ | 160,170 | |||||
| Amortization of net actuarial loss | (12,680 | ) | (12,264 | ) | (12,803 | ) | |||||
| Net loss (gain) occurring during year | (2,670 | ) | 10,194 | (17,315 | ) | ||||||
| Net actuarial pension loss at end of period | 112,632 | 127,982 | 130,052 | ||||||||
| Tax benefit | (9,583 | ) | (15,041 | ) | (15,041 | ) | |||||
| Net actuarial pension loss at end of period, net of tax | $ | 103,049 | $ | 112,941 | $ | 115,011 | |||||
Non-U.S. Defined Benefit Plans – We have several otherunfunded defined benefit plans located outside the U.S. that are country specific. Some of these plans remain open to participants and others are closed. The expenses related to these plans are recorded in the consolidated statements of operations and are determined by using weighted-average assumptions made on January 1 of each year as summarized below for the years ended December 31.
| (amounts in thousands) | |||||||||||||||||
| Components of pension benefit expense - Non-U.S. benefit plans | 2023 | 2022 | 2021 | ||||||||||||||
| Service cost | $ | 1,275 | $ | 1,842 | $ | 2,035 | |||||||||||
| Interest cost | 879 | 349 | 205 | ||||||||||||||
| Amortization of net actuarial pension loss | 45 | 311 | 645 | ||||||||||||||
| Pension benefit expense | $ | 2,199 | $ | 2,502 | $ | 2,885 | |||||||||||
| Discount rate | 3.1% - 3.8% | 3.3% - 3.7% | 0.8% - 1.6% | ||||||||||||||
| Compensation increase rate | 0.0% - 3.5% | 0.0% - 3.5% | 0.5% - 2.5% | ||||||||||||||
| (amounts in thousands) | |||||||||||
| Components of pension benefit expense - Non-U.S. benefit plans | 2017 | 2016 | 2015 | ||||||||
| Service cost | $ | 1,436 | $ | 1,142 | $ | 4,821 | |||||
| Interest cost | 1,184 | 1,118 | 970 | ||||||||
| Expected return on plan assets | (700 | ) | (714 | ) | (871 | ) | |||||
| Amortization of net actuarial pension loss | 145 | 351 | 334 | ||||||||
| Pension benefit expense | $ | 2,065 | $ | 1,897 | $ | 5,254 | |||||
| Discount rate | 0.8% - 7.2% | 0.7% - 8.3% | 0.7 - 9.0% | ||||||||
| Expected long-term rate of return on assets | 0.0% - 5.7% | 0.0% - 5.3% | 0.0 - 5.3% | ||||||||
| Compensation increase rate | 0.5% - 7.0% | 0.5% - 7.0% | 0.5 - 7.0% | ||||||||
| (amounts in thousands) | |||||||
| Change in fair value of plan assets - Non-U.S. benefit plans | 2017 | 2016 | |||||
| Balance at beginning of period | $ | 13,596 | $ | 13,180 | |||
| Fair value of assets acquired | — | 424 | |||||
| Actual return on plan assets | 1,232 | 508 | |||||
| Company contribution | 277 | 970 | |||||
| Benefits paid | (198 | ) | (1,286 | ) | |||
| Administrative expenses paid | (49 | ) | (25 | ) | |||
| Cumulative translation adjustment | 1,136 | (175 | ) | ||||
| Balance at end of period | $ | 15,994 | $ | 13,596 | |||
| % of Plan Assets | |||
| Summary of plan investments - Non-U.S. benefit plans | 2017 | 2016 | |
| Equity securities | 48.3 | 47.3 | |
| Debt securities | 22.0 | 20.0 | |
| Other | 29.7 | 32.7 | |
| 100.0 | 100.0 | ||
The projected benefit obligation for the non-U.S. plans is determined by using weighted-average assumptions made onas of December 31 of each year, as summarized below:
| (amounts in thousands) | |||||||||||||||||||||
| Change in projected benefit obligation - Non-U.S. benefit plans | 2017 | 2016 | |||||||||||||||||||
| Balance at beginning of period | $ | 30,307 | $ | 29,226 | |||||||||||||||||
| Pension obligation acquired | — | 375 | |||||||||||||||||||
| Change in projected benefit obligation - Non-U.S. benefit plans | |||||||||||||||||||||
| Change in projected benefit obligation - Non-U.S. benefit plans | 2023 | 2022 | |||||||||||||||||||
| Balance as of January 1, | |||||||||||||||||||||
| Service cost | |||||||||||||||||||||
| Service cost | |||||||||||||||||||||
| Service cost | 1,451 | 1,229 | |||||||||||||||||||
| Interest cost | 1,163 | 1,118 | |||||||||||||||||||
| Actuarial loss | 1,582 | 618 | |||||||||||||||||||
| Actuarial gain | |||||||||||||||||||||
| Benefits paid | (847 | ) | (1,401 | ) | |||||||||||||||||
| Administrative expenses paid | (49 | ) | (25 | ) | |||||||||||||||||
| Benefits paid | |||||||||||||||||||||
| Benefits paid | |||||||||||||||||||||
| Cumulative translation adjustment | 2,643 | (833 | ) | ||||||||||||||||||
| Balance at end of period | $ | 36,250 | $ | 30,307 | |||||||||||||||||
| Cumulative translation adjustment | |||||||||||||||||||||
| Cumulative translation adjustment | |||||||||||||||||||||
| Balance at period end | |||||||||||||||||||||
| Discount rate | 0.8% - 5.1% | 0.7% - 5.1% | |||||||||||||||||||
| Discount rate | |||||||||||||||||||||
| Discount rate | 3.1% - 3.8% | 3.3% - 3.7% | |||||||||||||||||||
| Compensation increase rate | 0.5% - 2.8% | 0.5% - 2.9% | Compensation increase rate | 0.0% - 3.5% | 0.0% - 3.5% | ||||||||||||||||
As of December 31, 2017,2023, the estimated benefit payments for the non-U.S. plans over the next ten years are as follows (amounts in thousands):
F-51
| 2018 | $ | 2,810 | |
| 2019 | 2,560 | ||
| 2020 | 3,035 | ||
| 2021 | 3,351 | ||
| 2022 | 2,435 | ||
| 2023-2027 | 13,768 | ||
| 2024 | $ | 1,370 | |||
| 2025 | 1,279 | ||||
| 2026 | 1,377 | ||||
| 2027 | 1,696 | ||||
| 2028 | 1,956 | ||||
| 2029-2033 | 9,550 | ||||
The accumulated benefit obligations of $30.0$23.6 million for the non-U.S. plans are determined by taking the projected benefit obligation and removing the impact of the assumed compensation increases. We expect to contribute $0.4$1.4 million to the non-U.S. plans in 2018.
2024.
The funded status of these plans as of December 31 are as follows:
| (amounts in thousands) | |||||||||||||||||||||
| Unfunded pension liability - Non-U.S. benefit plans | 2017 | 2016 | |||||||||||||||||||
| Projected benefit obligation at end of period | $ | 36,250 | $ | 30,307 | |||||||||||||||||
| Fair value of plan assets at end of period | (15,994 | ) | (13,596 | ) | |||||||||||||||||
| Net pension liability | $ | 20,256 | $ | 16,711 | |||||||||||||||||
| Unfunded pension liability - Non-U.S. benefit plans | |||||||||||||||||||||
| Unfunded pension liability - Non-U.S. benefit plans | 2023 | 2022 | |||||||||||||||||||
| Long-term unfunded pension liability | |||||||||||||||||||||
| Long-term unfunded pension liability | |||||||||||||||||||||
| Long-term unfunded pension liability | $ | 20,641 | $ | 17,331 | |||||||||||||||||
| Current portion | 1,518 | 714 | |||||||||||||||||||
| Total unfunded pension liability | $ | 22,159 | $ | 18,045 | |||||||||||||||||
| Total overfunded pension liability | $ | 1,903 | $ | 1,334 | |||||||||||||||||
The current portion of the unfunded pension liability is recorded in accrued payroll and benefits in the accompanying consolidated balance sheets and is equal to the expected employer contributions in the following year. The overfunded pension liability is recorded in long-term other assets in the accompanying consolidated balance sheets.
Net actuarial pension losses are recorded in consolidated other comprehensive income (loss) for the years ended December 31 are as follows:
| (amounts in thousands) | |||||||||||||||||
| Accumulated other comprehensive loss - Non-U.S. benefit plans | 2023 | 2022 | 2021 | ||||||||||||||
| Net actuarial pension loss beginning of period | $ | 2,273 | $ | 9,913 | $ | 12,811 | |||||||||||
| Amortization of net actuarial loss | (45) | (532) | (857) | ||||||||||||||
| Net (gain) loss occurring during year | 1,163 | (6,457) | (931) | ||||||||||||||
| Effect of curtailment | — | (167) | — | ||||||||||||||
| Divestiture of JW Australia benefit plans | (1,442) | — | — | ||||||||||||||
| Cumulative translation adjustment | 68 | (484) | (1,110) | ||||||||||||||
| Net actuarial pension loss at end of period | 2,017 | 2,273 | 9,913 | ||||||||||||||
| Tax benefit | (399) | (632) | (2,280) | ||||||||||||||
| Net actuarial pension loss at end of period, net of tax | $ | 1,618 | $ | 1,641 | $ | 7,633 | |||||||||||
| (amounts in thousands) | |||||||||||
| Accumulated other comprehensive income (loss) - Non-U.S. benefit plans | 2017 | 2016 | 2015 | ||||||||
| Net actuarial pension loss beginning of period | $ | 6,781 | $ | 5,160 | $ | 5,931 | |||||
| Amortization of net actuarial (loss) gain | (149 | ) | (10 | ) | 367 | ||||||
| Net loss (gain) occurring during year | 742 | 1,621 | (1,073 | ) | |||||||
| Cumulative translation adjustment | (15 | ) | 10 | (65 | ) | ||||||
| Net actuarial pension loss at end of period | 7,359 | 6,781 | 5,160 | ||||||||
| Tax benefit | (1,886 | ) | (1,785 | ) | (1,366 | ) | |||||
| Net actuarial pension loss at end of period, net of tax | $ | 5,473 | $ | 4,996 | $ | 3,794 | |||||
F-52
Note 33. Related Party Transactions
| (amounts in thousands) | 2017 | 2016 | 2015 | ||||||||
| Notes receivable and accrued interest balance, January 1 | $ | 56 | $ | 2,159 | $ | 16,380 | |||||
| Cash payments | — | (2,152 | ) | (14,850 | ) | ||||||
| Reserve for bad debt | (56 | ) | — | — | |||||||
| Interest accrued | — | 49 | 629 | ||||||||
| Notes receivable and accrued interest balance, December 31 | $ | — | $ | 56 | $ | 2,159 | |||||
| Interest rates, December 31 | N/A | 5.75% | 5.50% | ||||||||
| Amounts due from other directors and family | — | 56 | 2,159 | ||||||||
| $ | — | $ | 56 | $ | 2,159 | ||||||
| Year Ended | |||||||||||||||||
| (amounts in thousands) | December 31, 2023 | December 31, 2022 | December 31, 2021 | ||||||||||||||
| Cash Operating Activities: | |||||||||||||||||
| Operating leases | $ | 50,995 | $ | 58,575 | $ | 59,190 | |||||||||||
| Interest payments on financing lease obligations | 331 | 161 | 205 | ||||||||||||||
| Cash paid for amounts included in the measurement of lease liabilities | $ | 51,326 | $ | 58,736 | $ | 59,395 | |||||||||||
| Cash Investing Activities: | |||||||||||||||||
| Purchases of securities for deferred compensation plan | $ | (1,206) | $ | (834) | $ | — | |||||||||||
| Sale of securities for deferred compensation plan | 66 | 106 | — | ||||||||||||||
| Change in securities for deferred compensation plan | $ | (1,140) | $ | (728) | $ | — | |||||||||||
| Issuances of notes receivable | $ | (58) | $ | (55) | $ | (52) | |||||||||||
| Cash received on notes receivable | 319 | 149 | 4,218 | ||||||||||||||
| Change in notes receivable | $ | 261 | $ | 94 | $ | 4,166 | |||||||||||
| Non-cash Investing Activities: | |||||||||||||||||
| Property, equipment, and intangibles purchased in accounts payable | $ | 10,025 | $ | 4,987 | $ | 6,753 | |||||||||||
| Property, equipment, and intangibles purchased with debt | 14,045 | 9,779 | 8,839 | ||||||||||||||
| Customer accounts receivable converted to notes receivable | 293 | 49 | 141 | ||||||||||||||
| Cash Financing Activities: | |||||||||||||||||
| Proceeds from issuance of new debt | $ | — | $ | — | $ | 548,625 | |||||||||||
| Borrowings on long-term debt | 127,336 | 779,977 | 37,306 | ||||||||||||||
| Payments of long-term debt | (684,766) | (767,248) | (666,534) | ||||||||||||||
| Payments of debt issuance and extinguishment costs, including underwriting fees | (3,908) | — | (5,448) | ||||||||||||||
| Change in long-term debt and payments of debt extinguishment costs | $ | (561,338) | $ | 12,729 | $ | (86,051) | |||||||||||
| Cash paid for amounts included in the measurement of finance lease liabilities | $ | 1,880 | $ | 1,792 | $ | 2,090 | |||||||||||
| Non-cash Financing Activities: | |||||||||||||||||
| Prepaid insurance funded through short-term debt borrowings | $ | 16,628 | $ | 16,486 | $ | 13,048 | |||||||||||
| Shares repurchased in accounts payable | — | — | 1,066 | ||||||||||||||
| Accounts payable converted to installment notes | 176 | 1,279 | 69 | ||||||||||||||
| Other Supplemental Cash Flow Information: | |||||||||||||||||
| Cash taxes paid, net of refunds | $ | 48,092 | $ | 44,723 | $ | 36,513 | |||||||||||
| Cash interest paid | 74,735 | 80,613 | 74,953 | ||||||||||||||
F-53
| (amounts in thousands) | 2017 | 2016 | 2015 | ||||||||
| Cash Investing Activities: | |||||||||||
| Change in notes receivable | |||||||||||
| Issuances of notes receivable | $ | (61 | ) | $ | (68 | ) | $ | (73 | ) | ||
| Cash received on notes receivable | 2,052 | 1,035 | 1,323 | ||||||||
| $ | 1,991 | $ | 967 | $ | 1,250 | ||||||
| Non-cash Investing Activities: | |||||||||||
| Property, equipment and intangibles purchased in accounts payable | $ | 15,099 | $ | 1,340 | $ | 4,128 | |||||
| Property and equipment purchased for debt | 791 | 1,438 | — | ||||||||
| Notes receivable and accrued interest from employees and directors settled with return of JWH stock | 183 | — | 49 | ||||||||
| Customer accounts receivable converted to notes receivable | 393 | 1,276 | 174 | ||||||||
| Cash Financing Activities: | |||||||||||
| Common stock repurchased | |||||||||||
| Stock repurchases | $ | — | $ | — | $ | (32,569 | ) | ||||
| Repurchase of ESOP shares to fund distribution | — | — | (12,127 | ) | |||||||
| $ | — | $ | — | $ | (44,696 | ) | |||||
| Change in long-term debt | |||||||||||
| Proceeds from issuance of new debt, net of discount | $ | 1,240,000 | $ | 374,063 | $ | 477,600 | |||||
| Borrowings on long-term debt | 5,334 | 763 | — | ||||||||
| Payments of long-term debt | (1,618,641 | ) | (16,844 | ) | (19,402 | ) | |||||
| Payments of debt issuance and extinguishment costs, including underwriting fees | (16,358 | ) | (8,146 | ) | (9,066 | ) | |||||
| $ | (389,665 | ) | $ | 349,836 | $ | 449,132 | |||||
| Change in notes payable | |||||||||||
| Borrowings on notes payable | $ | — | $ | — | $ | 8,017 | |||||
| Payments on notes payable | (205 | ) | (180 | ) | (11,437 | ) | |||||
| $ | (205 | ) | $ | (180 | ) | $ | (3,420 | ) | |||
| Non-cash Financing Activities: | |||||||||||
| Common stock issued as consideration for acquisition | $ | — | $ | — | $ | 2,000 | |||||
| Prepaid insurance funded through short-term debt borrowings | 2,662 | 2,954 | 3,107 | ||||||||
| Costs associated with initial public offering formerly capitalized in prepaid expenses | 5,857 | — | — | ||||||||
| Shares surrendered for tax obligations for employee share-based transactions in accrued liabilities | 569 | — | — | ||||||||
Note 35.28. Summarized Quarterly Financial Data (unaudited)Information (Unaudited)
.
| 2023 | |||||||||||||||||||||||
| (amounts in thousands) | First Quarter | Second Quarter | Third Quarter | Fourth Quarter | |||||||||||||||||||
| Net revenues | $ | 1,080,522 | $ | 1,125,767 | $ | 1,076,980 | $ | 1,021,065 | |||||||||||||||
| Gross margin | $ | 191,787 | $ | 225,555 | $ | 223,596 | $ | 191,683 | |||||||||||||||
| Income (loss) from continuing operations, net of tax | 8,465 | 22,502 | 16,908 | (22,640) | |||||||||||||||||||
| Gain (loss) on sale of discontinued operations, net of tax | — | — | 26,076 | (10,377) | |||||||||||||||||||
| Income (loss) from discontinued operations, net of tax | 6,669 | 15,779 | 801 | (1,738) | |||||||||||||||||||
| Net income (loss) | 15,134 | 38,281 | 43,785 | (34,755) | |||||||||||||||||||
| Diluted Net income (loss) per share from continuing operations | $ | 0.10 | $ | 0.26 | $ | 0.20 | $ | (0.27) | |||||||||||||||
| Diluted Net income (loss) per share from discontinued operations | 0.08 | 0.18 | 0.31 | (0.14) | |||||||||||||||||||
| Diluted Net income (loss) per share | $ | 0.18 | $ | 0.45 | $ | 0.51 | $ | (0.41) | |||||||||||||||
| 2022 | |||||||||||||||||||||||
| (amounts in thousands) | First Quarter | Second Quarter | Third Quarter | Fourth Quarter | |||||||||||||||||||
| Net revenues | $ | 1,045,615 | $ | 1,179,154 | $ | 1,140,025 | $ | 1,179,014 | |||||||||||||||
| Gross margin | $ | 171,666 | $ | 206,614 | $ | 206,389 | $ | 201,251 | |||||||||||||||
| Income (loss) from continuing operations, net of tax | (3,575) | 34,958 | (45,064) | 25,904 | |||||||||||||||||||
| Income from discontinued operations, net of tax | 3,047 | 10,868 | 11,872 | 7,717 | |||||||||||||||||||
| Net income (loss) | $ | (528) | $ | 45,826 | $ | (33,192) | $ | 33,621 | |||||||||||||||
| Diluted Net income (loss) per share from continuing operations | $ | (0.04) | $ | 0.40 | $ | (0.53) | $ | 0.31 | |||||||||||||||
| Diluted Net income per share from discontinued operations | 0.03 | 0.12 | 0.14 | 0.09 | |||||||||||||||||||
| Diluted Net income (loss) per share | $ | (0.01) | $ | 0.52 | $ | (0.39) | $ | 0.40 | |||||||||||||||
| Three Months Ended | ||||||||||||||||
April 1, 2017 | July 1, 2017 | September 30, 2017 | December 31, 2017 | |||||||||||||
| (dollars in thousands) | ||||||||||||||||
| Statements of Operations Data: | ||||||||||||||||
| Net revenues | $ | 847,787 | $ | 948,736 | $ | 991,408 | $ | 976,003 | ||||||||
Gross margin(a) | 181,365 | 231,001 | 227,591 | 208,241 | ||||||||||||
| Operating income | 37,690 | 83,720 | 83,335 | 45,323 | ||||||||||||
| Income before taxes, equity earnings and discontinued operations | 8,199 | 63,408 | 63,242 | 10,906 | ||||||||||||
| Net income (loss) | 6,428 | 46,778 | 51,275 | (93,690 | ) | |||||||||||
| Net (loss) income attributable to common shareholders | (4,034 | ) | 46,778 | 51,275 | (93,690 | ) | ||||||||||
| Net (loss) income per share basic | $ | (0.05 | ) | $ | 0.45 | $ | 0.49 | $ | (0.89 | ) | ||||||
| Net (loss) income per share diluted | $ | (0.05 | ) | $ | 0.43 | $ | 0.47 | $ | (0.89 | ) | ||||||
| Three Months Ended | ||||||||||||||||
| March 26, 2016 | June 25, 2016 | September 24, 2016 | December 31, 2016 | |||||||||||||
| (dollars in thousands) | ||||||||||||||||
| Statements of Operations Data: | ||||||||||||||||
| Net revenues | $ | 796,547 | $ | 964,608 | $ | 932,475 | $ | 973,169 | ||||||||
Gross margin(a) | 155,237 | 205,789 | 204,563 | 208,962 | ||||||||||||
| Operating income | 23,150 | 68,970 | 71,920 | 31,045 | ||||||||||||
| Income before taxes, equity earnings and discontinued operations | 6,863 | 51,308 | 61,104 | 11,045 | ||||||||||||
Net income(b) | 6,045 | 66,890 | 46,084 | 258,162 | ||||||||||||
| Net (loss) income attributable to common shareholders | (20,361 | ) | 15,188 | 15,977 | (68,079 | ) | ||||||||||
| (Loss) earnings per share - basic: | ||||||||||||||||
| (Loss) income from continuing operations | $ | (1.16 | ) | $ | 0.88 | $ | 1.04 | $ | (3.73 | ) | ||||||
| Income (loss) from discontinued operations | 0.03 | (0.03 | ) | (0.15 | ) | (0.03 | ) | |||||||||
| Net (loss) income per share | $ | (1.13 | ) | $ | 0.85 | $ | 0.89 | $ | (3.76 | ) | ||||||
| (Loss) earnings per share - diluted: | ||||||||||||||||
| (Loss) income from continuing operations | $ | (1.16 | ) | $ | 0.82 | $ | 0.57 | $ | (3.73 | ) | ||||||
| Income (loss) from discontinued operations | 0.03 | (0.01 | ) | (0.03 | ) | (0.03 | ) | |||||||||
| Net (loss) income per share | $ | (1.13 | ) | $ | 0.81 | $ | 0.54 | $ | (3.76 | ) | ||||||
| December 31, 2014 | |||||||||||
| (amounts in thousands, except per share data) | As Reported | Correction of Misclassification | As Revised | ||||||||
| Consolidated Statement of Operations: | |||||||||||
| Cost of sales | $ | 2,919,864 | $ | 6,113 | $ | 2,925,977 | |||||
| Gross margin | 587,342 | (6,113 | ) | 581,229 | |||||||
| Selling, general and administrative | 488,477 | (6,113 | ) | 482,364 | |||||||
| Operating income | 60,477 | — | 60,477 | ||||||||
| December 31, 2015 | |||||||||||
| (amounts in thousands, except per share data) | As Reported | Correction of Misclassification | As Revised | ||||||||
| Consolidated Statement of Operations: | |||||||||||
| Cost of sales | $ | 2,715,125 | $ | 6,216 | $ | 2,721,341 | |||||
| Gross margin | 665,935 | (6,216 | ) | 659,719 | |||||||
| Selling, general and administrative | 512,126 | (6,216 | ) | 505,910 | |||||||
| Operating income | 132,467 | — | 132,467 | ||||||||
| December 31, 2016 | |||||||||||
| (amounts in thousands, except per share data) | As Reported | Correction of Errors | As Revised | ||||||||
| Consolidated Balance Sheet: | |||||||||||
| Accounts receivable | $ | 407,620 | $ | (450 | ) | $ | 407,170 | ||||
| Other current assets | 30,104 | 2,144 | 32,248 | ||||||||
| Total current assets | 875,810 | 1,694 | 877,504 | ||||||||
| Deferred tax assets | 268,965 | 18,734 | 287,699 | ||||||||
| Goodwill | 486,055 | 865 | 486,920 | ||||||||
| Intangible assets, net | 117,795 | (2,070 | ) | 115,725 | |||||||
| Other assets | 63,020 | 527 | 63,547 | ||||||||
| Total assets | 2,516,296 | 19,750 | 2,536,046 | ||||||||
| Accrued expenses and other current liabilities | 173,521 | 80 | 173,601 | ||||||||
| Total current liabilities | 513,126 | 80 | 513,206 | ||||||||
| Total liabilities | 2,323,417 | 80 | 2,323,497 | ||||||||
| Retained earnings | 202,562 | 19,670 | 222,232 | ||||||||
| Total shareholders’ equity | 41,922 | 19,670 | 61,592 | ||||||||
| Total liabilities, convertible preferred shares, and shareholders’ equity | 2,516,296 | 19,750 | 2,536,046 | ||||||||
| Twelve months ended | |||||||||||||||
| December 31, 2016 | |||||||||||||||
| (amounts in thousands, except per share data) | As Reported | Correction of Errors | Correction of Misclassification | As Revised | |||||||||||
| Consolidated Statement of Operations: | |||||||||||||||
| Cost of sales | $ | 2,866,805 | $ | 405 | $ | 25,038 | $ | 2,892,248 | |||||||
| Gross margin | 799,994 | (405 | ) | (25,038 | ) | 774,551 | |||||||||
| Selling, general and administrative | 589,407 | 1,250 | (25,038 | ) | 565,619 | ||||||||||
| Operating income | 196,740 | (1,655 | ) | — | 195,085 | ||||||||||
| Income before taxes, equity earnings and discontinued operations | 131,975 | (1,655 | ) | — | 130,320 | ||||||||||
| Income tax benefit | (225,596 | ) | (20,798 | ) | — | (246,394 | ) | ||||||||
| Income from continuing operations, net of tax | 357,571 | 19,143 | — | 376,714 | |||||||||||
| Equity earnings on non-consolidated entities | 3,264 | 527 | — | 3,791 | |||||||||||
| Net income | 357,511 | 19,670 | — | 377,181 | |||||||||||
| Net loss attributable to common shareholders | (39,136 | ) | 19,670 | — | (19,466 | ) | |||||||||
| Weighted Average Common Shares | |||||||||||||||
| Basic and diluted | 17,992,879 | — | — | 17,992,879 | |||||||||||
| Loss per share from continuing operations: | |||||||||||||||
| Basic | $ | (1.99 | ) | $ | 1.09 | $ | — | $ | (0.90 | ) | |||||
| Diluted | $ | (1.99 | ) | $ | 1.09 | $ | — | $ | (0.90 | ) | |||||
| Net loss per share: | |||||||||||||||
| Basic | $ | (2.17 | ) | $ | 1.09 | $ | — | $ | (1.08 | ) | |||||
| Diluted | $ | (2.17 | ) | $ | 1.09 | $ | — | $ | (1.08 | ) | |||||
| Twelve months ended | |||||||||||
| December 31, 2016 | |||||||||||
| (dollars in thousands) | As Reported | Correction of Errors | As Revised | ||||||||
| Net income | $ | 357,511 | $ | 19,670 | $ | 377,181 | |||||
| Equity earnings on non-consolidated entities | (3,264 | ) | (527 | ) | (3,791 | ) | |||||
| Income tax benefit | (225,596 | ) | (20,798 | ) | (246,394 | ) | |||||
| Depreciation and amortization | 106,790 | 1,205 | 107,995 | ||||||||
| Adjusted EBITDA | 394,132 | (450 | ) | 393,682 | |||||||
| Twelve months ended | |||||||||||||||||||||||
| December 31, 2016 | |||||||||||||||||||||||
| (dollars in thousands) | North America | Europe | Australasia | Total Operating Segments | Corporate and Unallocated Costs | Total Consolidated | |||||||||||||||||
| As Reported | $ | 251,831 | $ | 122,574 | $ | 59,519 | $ | 433,924 | $ | (39,792 | ) | $ | 394,132 | ||||||||||
| Adjustment | — | — | — | — | (450 | ) | (450 | ) | |||||||||||||||
| As Revised | $ | 251,831 | $ | 122,574 | $ | 59,519 | $ | 433,924 | $ | (40,242 | ) | $ | 393,682 | ||||||||||
| For the Years Ended December 31, | ||||||||||||
| (amounts in thousands, except share and per share data) | 2017 | 2016 | 2015 | |||||||||
| Selling, general and administrative | $ | 23,457 | $ | 48,195 | $ | 28,522 | ||||||
| Equity in earnings of subsidiary | 33,860 | 424,946 | 119,371 | |||||||||
| Other (income) expense | ||||||||||||
| Interest income | (35 | ) | (57 | ) | (206 | ) | ||||||
| Interest expense | 73 | 65 | 110 | |||||||||
| Other | (426 | ) | (438 | ) | 27 | |||||||
| Income (loss) before taxes | 10,791 | 377,181 | 90,918 | |||||||||
| Income tax (benefit) expense | — | — | — | |||||||||
| Net income | $ | 10,791 | $ | 377,181 | $ | 90,918 | ||||||
| Comprehensive income (loss): | ||||||||||||
| Net income | $ | 10,791 | $ | 377,181 | $ | 90,918 | ||||||
| Other comprehensive income (loss), net of tax | ||||||||||||
| Equity in comprehensive income (loss) of subsidiary | 101,835 | (34,194 | ) | (59,136 | ) | |||||||
| Total other comprehensive income (loss), net of tax | 101,835 | (34,194 | ) | (59,136 | ) | |||||||
| Total comprehensive income | $ | 112,626 | $ | 342,987 | $ | 31,782 | ||||||
| (amounts in thousands, except share and per share data) | December 31, 2017 | December 31, 2016 | ||||||
| ASSETS | ||||||||
| Current assets | ||||||||
| Cash and cash equivalents | $ | 3,830 | $ | 2,375 | ||||
| Other current assets | 15 | — | ||||||
| Total current assets | 3,845 | 2,375 | ||||||
| Property and equipment, net | 3,363 | 3,502 | ||||||
| Investment in subsidiary | 885,070 | 403,321 | ||||||
| Other long-term assets | — | 5,857 | ||||||
| Long-term notes receivable | 147 | 6 | ||||||
| Total assets | $ | 892,425 | $ | 415,061 | ||||
| LIABILITIES AND EQUITY | ||||||||
| Current liabilities | ||||||||
| Accounts payable | $ | 744 | $ | 1,654 | ||||
| Current payable to subsidiary | 2,126 | 964 | ||||||
| Accrued expenses and other current liabilities | 227 | 788 | ||||||
| Notes payable and current maturities of long-term debt | 981 | 686 | ||||||
| Total current liabilities | 4,078 | 4,092 | ||||||
| Long-term debt | 963 | 1,238 | ||||||
| Total liabilities | 5,041 | 5,330 | ||||||
Commitments and contingencies (Note 5) | ||||||||
| Convertible preferred stock | — | 150,957 | ||||||
| Shareholders’ equity | ||||||||
| Preferred Stock, par value $0.01 per share, 90,000,000 shares authorized; no shares issued and outstanding | — | — | ||||||
| Common Stock: 900,000,000 shares authorized, par value $0.01 per share, 105,990,483 shares outstanding as of December 31, 2017; 904,732,200 shares authorized, par value $0.01 per share, 17,894,393 shares outstanding as of December 31, 2016; 177,221 shares of Class B-1 Common Stock outstanding as of December 31, 2016 | 1,060 | 180 | ||||||
| Additional paid-in capital | 652,666 | 36,362 | ||||||
| Retained earnings | 233,658 | 222,232 | ||||||
| Total shareholders’ equity | 887,384 | 258,774 | ||||||
| Total liabilities, convertible preferred shares, and shareholders’ equity | $ | 892,425 | $ | 415,061 | ||||
| For the Years Ended December 31, | ||||||||||||
| (amounts in thousands) | 2017 | 2016 | 2015 | |||||||||
| OPERATING ACTIVITIES | ||||||||||||
| Net income | $ | 10,791 | $ | 377,181 | $ | 90,918 | ||||||
| Adjustments to reconcile net income to cash used in operating activities: | ||||||||||||
| Depreciation | 139 | 139 | — | |||||||||
| Litigation settlement funded by subsidiaries | — | — | 325 | |||||||||
| Income from subsidiary investment | (33,860 | ) | (424,946 | ) | (119,371 | ) | ||||||
| Other items, net | 191 | (205 | ) | (180 | ) | |||||||
| Payment to option holders funded by subsidiaries | — | 20,739 | 11,780 | |||||||||
| Stock-based compensation | 19,785 | 22,464 | 15,620 | |||||||||
| Net change in operating assets and liabilities, net of effect of acquisitions: | ||||||||||||
| Receivables and payables from subsidiaries | (24,020 | ) | (1,296 | ) | (75 | ) | ||||||
| Other assets | (15 | ) | (5,253 | ) | (595 | ) | ||||||
| Accounts payable and accrued expenses | (882 | ) | 1,092 | 670 | ||||||||
| Net cash provided by (used in) operating activities | (27,871 | ) | (10,085 | ) | (908 | ) | ||||||
| INVESTING ACTIVITIES | ||||||||||||
| Additional Investment in subsidiary | (480,306 | ) | — | — | ||||||||
| Purchases of property and equipment | — | — | (3,641 | ) | ||||||||
| Cash received on notes receivable | 17 | 16 | 219 | |||||||||
| Proceeds from sales of subsidiaries' shares | 30,181 | 32,605 | 461,927 | |||||||||
| Distribution received from subsidiary | 1,000 | 382,400 | — | |||||||||
| Net cash (used in) provided by investing activities | (449,108 | ) | 415,021 | 458,505 | ||||||||
| FINANCING ACTIVITIES | ||||||||||||
| Distributions paid | — | (404,198 | ) | (419,216 | ) | |||||||
| Payments of long-term debt | (861 | ) | (728 | ) | (1,187 | ) | ||||||
| Employee note repayments | 26 | 223 | 4,144 | |||||||||
| Common stock issued for exercise of options | 1,029 | 1,187 | 2,006 | |||||||||
| Common stock repurchased | — | — | (44,647 | ) | ||||||||
| Proceeds from the sale of common stock, net of underwriting fees and commissions | 480,306 | — | — | |||||||||
| Payments associated with initial public offering | (2,066 | ) | — | — | ||||||||
| Net cash provided by (used in) financing activities | 478,434 | (403,516 | ) | (458,900 | ) | |||||||
| Effect of foreign currency exchange rates on cash | — | — | — | |||||||||
| Net increase (decrease) in cash and cash equivalents | 1,455 | 1,420 | (1,303 | ) | ||||||||
| Cash, cash equivalents and restricted cash, beginning | 2,375 | 955 | 2,258 | |||||||||
| Cash, cash equivalents and restricted cash, ending | $ | 3,830 | $ | 2,375 | $ | 955 | ||||||
F-54
| (amounts in thousands) | 2017 | 2016 | |||||
| Buildings | $ | 3,636 | $ | 3,641 | |||
| Total depreciable assets | 3,636 | 3,641 | |||||
| Accumulated depreciation | (273 | ) | (139 | ) | |||
| $ | 3,363 | $ | 3,502 | ||||
| (amounts in thousands) | 2017 Year-end Effective Interest Rate | 2017 | 2016 | ||||||
| Installment notes for stock | 3.00% - 4.25% | $ | 1,944 | $ | 1,924 | ||||
| Current maturities of long-term debt | (981 | ) | (686 | ) | |||||
| $ | 963 | $ | 1,238 | ||||||
| Maturities by year: | ||||
| 2018 | $ | 981 | ||
| 2019 | 757 | |||
| 2020 | 206 | |||
| 2021 | — | |||
| 2022 | — | |||
| Thereafter | — | |||
| $ | 1,944 | |||
| (amounts in thousands) | 2017 | 2016 | 2015 | ||||||||
| Notes receivable and accrued interest from employees and directors settled with return of JWH stock | $ | 183 | $ | — | $ | 49 | |||||
| Common stock repurchased | |||||||||||
| Stock repurchases | $ | — | $ | — | $ | (32,569 | ) | ||||
| Repurchase of ESOP shares to fund distribution | — | — | (12,127 | ) | |||||||
| $ | — | $ | — | $ | (44,696 | ) | |||||
| Common stock issued as consideration for acquisition | $ | — | $ | — | $ | 2,000 | |||||
| Costs associated with initial public offering formerly capitalized in prepaid expenses | $ | 5,857 | $ | — | $ | — | |||||
| Subsidiary non-cash director notes and accrued interest activity | $ | — | $ | 2,068 | $ | 10,438 | |||||