LIVERAMP HOLDINGS, INC. AND SUBSIDIARIES
CONDENSED CONSOLIDATED STATEMENTS OF OPERATIONS
(Unaudited)
(Dollars in thousands, except per share amounts)
| For the three months ended | ||||||||
| December 31, | ||||||||
| 2017 | 2016 | |||||||
| Revenues | $ | 234,871 | $ | 223,312 | ||||
| Cost of revenue | 115,920 | 116,468 | ||||||
| Gross profit | 118,951 | 106,844 | ||||||
| Operating expenses: | ||||||||
| Research and development | 23,318 | 20,950 | ||||||
| Sales and marketing | 53,730 | 43,048 | ||||||
| General and administrative | 30,886 | 31,620 | ||||||
| Gains, losses and other items, net | (41 | ) | 2,111 | |||||
| Total operating expenses | 107,893 | 97,729 | ||||||
| Income from operations | 11,058 | 9,115 | ||||||
| Other income (expense): | ||||||||
| Interest expense | (2,566 | ) | (1,743 | ) | ||||
| Other, net | 419 | 35 | ||||||
| Total other expense | (2,147 | ) | (1,708 | ) | ||||
| Income before income taxes | 8,911 | 7,407 | ||||||
| Income taxes (benefit) | (14,030 | ) | 6,334 | |||||
| Net earnings | $ | 22,941 | $ | 1,073 | ||||
| Basic earnings per share | $ | 0.29 | $ | 0.01 | ||||
| Diluted earnings per share | $ | 0.28 | $ | 0.01 | ||||
| For the three months ended | For the nine months ended | |||||||||||||||||||||||||||||||
| December 31, | December 31, | |||||||||||||||||||||||||||||||
| 2023 | 2022 | 2023 | 2022 | |||||||||||||||||||||||||||||
| Revenues | $ | 173,869 | $ | 158,615 | $ | 487,809 | $ | 447,957 | ||||||||||||||||||||||||
| Cost of revenue | 44,934 | 43,287 | 131,767 | 126,612 | ||||||||||||||||||||||||||||
| Gross profit | 128,935 | 115,328 | 356,042 | 321,345 | ||||||||||||||||||||||||||||
| Operating expenses: | ||||||||||||||||||||||||||||||||
| Research and development | 37,788 | 43,175 | 106,040 | 136,975 | ||||||||||||||||||||||||||||
| Sales and marketing | 46,203 | 47,702 | 135,217 | 144,931 | ||||||||||||||||||||||||||||
| General and administrative | 27,241 | 36,657 | 79,914 | 92,519 | ||||||||||||||||||||||||||||
| Gains, losses and other items, net | 2,502 | 11,743 | 9,192 | 25,593 | ||||||||||||||||||||||||||||
| Total operating expenses | 113,734 | 139,277 | 330,363 | 400,018 | ||||||||||||||||||||||||||||
| Income (loss) from operations | 15,201 | (23,949) | 25,679 | (78,673) | ||||||||||||||||||||||||||||
| Total other income (expense), net | 6,607 | (736) | 17,887 | 2,211 | ||||||||||||||||||||||||||||
| Income (loss) from continuing operations before income taxes | 21,808 | (24,685) | 43,566 | (76,462) | ||||||||||||||||||||||||||||
| Income tax expense | 8,429 | 5,835 | 27,297 | 11,712 | ||||||||||||||||||||||||||||
| Net earnings (loss) from continuing operations | 13,379 | (30,520) | 16,269 | (88,174) | ||||||||||||||||||||||||||||
| Earnings from discontinued operations, net of tax | 598 | 836 | 985 | 836 | ||||||||||||||||||||||||||||
| Net earnings (loss) | $ | 13,977 | $ | (29,684) | $ | 17,254 | $ | (87,338) | ||||||||||||||||||||||||
| Basic earnings (loss) per share | ||||||||||||||||||||||||||||||||
| Continuing operations | $ | 0.20 | $ | (0.47) | $ | 0.25 | $ | (1.32) | ||||||||||||||||||||||||
| Discontinued operations | 0.01 | 0.01 | 0.01 | 0.01 | ||||||||||||||||||||||||||||
| Basic earnings (loss) per share | $ | 0.21 | $ | (0.46) | $ | 0.26 | $ | (1.31) | ||||||||||||||||||||||||
| Diluted earnings (loss) per share | ||||||||||||||||||||||||||||||||
| Continuing operations | $ | 0.20 | $ | (0.47) | $ | 0.24 | $ | (1.32) | ||||||||||||||||||||||||
| Discontinued operations | 0.01 | 0.01 | 0.01 | 0.01 | ||||||||||||||||||||||||||||
| Diluted earnings (loss) per share | $ | 0.21 | $ | (0.46) | $ | 0.25 | $ | (1.31) | ||||||||||||||||||||||||
See accompanying notes to condensed consolidated financial statements.
7
LIVERAMP HOLDINGS, INC. AND SUBSIDIARIES
CONDENSED CONSOLIDATED STATEMENTS OF OPERATIONSCOMPREHENSIVE INCOME (LOSS)
(Unaudited)
(Dollars in thousands, except per share amounts)thousands)
| For the nine months ended | ||||||||
| December 31, | ||||||||
| 2017 | 2016 | |||||||
| Revenues | $ | 672,625 | $ | 655,380 | ||||
| Cost of revenue | 344,952 | 359,392 | ||||||
| Gross profit | 327,673 | 295,988 | ||||||
| Operating expenses: | ||||||||
| Research and development | 70,894 | 58,631 | ||||||
| Sales and marketing | 152,288 | 118,243 | ||||||
| General and administrative | 95,166 | 91,993 | ||||||
| Gains, losses and other items, net | 3,521 | 2,724 | ||||||
| Total operating expenses | 321,869 | 271,591 | ||||||
| Income from operations | 5,804 | 24,397 | ||||||
| Other income (expense): | ||||||||
| Interest expense | (7,432 | ) | (5,244 | ) | ||||
| Other, net | (61 | ) | 135 | |||||
| Total other expense | (7,493 | ) | (5,109 | ) | ||||
| Income (loss) before income taxes | (1,689 | ) | 19,288 | |||||
| Income taxes (benefit) | (19,994 | ) | 7,099 | |||||
| Net earnings | $ | 18,305 | $ | 12,189 | ||||
| Basic earnings per share | $ | 0.23 | $ | 0.16 | ||||
| Diluted earnings per share | $ | 0.22 | $ | 0.15 | ||||
| For the three months ended | For the nine months ended | |||||||||||||||||||||||||||||||
| December 31, | December 31, | |||||||||||||||||||||||||||||||
| 2023 | 2022 | 2023 | 2022 | |||||||||||||||||||||||||||||
| Net earnings (loss) | $ | 13,977 | $ | (29,684) | 17,254 | (87,338) | ||||||||||||||||||||||||||
| Other comprehensive income (loss): | ||||||||||||||||||||||||||||||||
| Change in foreign currency translation adjustment | 941 | 2,257 | 4 | (1,548) | ||||||||||||||||||||||||||||
| Comprehensive income (loss) | $ | 14,918 | $ | (27,427) | 17,258 | (88,886) | ||||||||||||||||||||||||||
See accompanying notes to condensed consolidated financial statements.
8
LIVERAMP HOLDINGS, INC. AND SUBSIDIARIES
CONDENSED CONSOLIDATED STATEMENTS OF COMPREHENSIVE INCOMEEQUITY
THREE AND NINE MONTHS ENDED DECEMBER 31, 2023
(Unaudited)
(Dollars in thousands)
| For the three months ended | ||||||||
| December 31, | ||||||||
| 2017 | 2016 | |||||||
| Net earnings | $ | 22,941 | $ | 1,073 | ||||
| Other comprehensive income: | ||||||||
| Change in foreign currency translation adjustment | 416 | (1,340 | ) | |||||
| Unrealized gain on interest rate swap | — | 21 | ||||||
| Other comprehensive income | 416 | (1,319 | ) | |||||
| Comprehensive income | $ | 23,357 | $ | (246 | ) | |||
| Accumulated | ||||||||||||||||||||||||||||||||||||||||||||||||||
| Common Stock | Additional | other | Treasury Stock | |||||||||||||||||||||||||||||||||||||||||||||||
| Number | paid-in | Retained | comprehensive | Number | Total | |||||||||||||||||||||||||||||||||||||||||||||
| For the three months ended December 31, 2023 | of shares | Amount | Capital | earnings | income | of shares | Amount | Equity | ||||||||||||||||||||||||||||||||||||||||||
| Balances at September 30, 2023 | 154,732,140 | $ | 15,473 | $ | 1,889,178 | $ | 1,305,568 | $ | 3,567 | (88,880,987) | $ | (2,291,928) | $ | 921,858 | ||||||||||||||||||||||||||||||||||||
| Employee stock awards, benefit plans and other issuances | 85,481 | 9 | 1,637 | — | — | (16,710) | (547) | 1,099 | ||||||||||||||||||||||||||||||||||||||||||
| Non-cash stock-based compensation | 9,257 | 1 | 17,504 | — | — | — | — | 17,505 | ||||||||||||||||||||||||||||||||||||||||||
| Restricted stock units vested | 556,462 | 56 | (56) | — | — | — | — | — | ||||||||||||||||||||||||||||||||||||||||||
| Liability-classified restricted stock units vested | 38,643 | 3 | 1,107 | — | — | — | — | 1,110 | ||||||||||||||||||||||||||||||||||||||||||
| Acquisition of treasury stock | — | — | — | — | — | (346,761) | (10,000) | (10,000) | ||||||||||||||||||||||||||||||||||||||||||
| Comprehensive income: | ||||||||||||||||||||||||||||||||||||||||||||||||||
| Foreign currency translation | — | — | — | — | 941 | — | — | 941 | ||||||||||||||||||||||||||||||||||||||||||
| Net earnings | — | — | — | 13,977 | — | — | — | 13,977 | ||||||||||||||||||||||||||||||||||||||||||
| Balances at December 31, 2023 | 155,421,983 | $ | 15,542 | $ | 1,909,370 | $ | 1,319,545 | $ | 4,508 | (89,244,458) | $ | (2,302,475) | $ | 946,490 | ||||||||||||||||||||||||||||||||||||
| For the nine months ended December 31, 2023 | ||||||||||||||||||||||||||||||||||||||||||||||||||
| Balances at March 31, 2023 | 153,987,784 | $ | 15,399 | $ | 1,855,916 | $ | 1,302,291 | $ | 4,504 | (87,372,837) | $ | (2,252,034) | $ | 926,076 | ||||||||||||||||||||||||||||||||||||
| Employee stock awards, benefit plans and other issuances | 368,405 | 37 | 7,184 | — | — | (199,767) | (5,116) | 2,105 | ||||||||||||||||||||||||||||||||||||||||||
| Non-cash stock-based compensation | 31,782 | 3 | 44,090 | — | — | — | — | 44,093 | ||||||||||||||||||||||||||||||||||||||||||
| Restricted stock units vested | 950,573 | 95 | (95) | — | — | — | — | — | ||||||||||||||||||||||||||||||||||||||||||
| Liability-classified restricted stock units vested | 83,439 | 8 | 2,275 | — | — | — | — | 2,283 | ||||||||||||||||||||||||||||||||||||||||||
| Acquisition of treasury stock | — | — | — | — | — | (1,671,854) | (45,325) | (45,325) | ||||||||||||||||||||||||||||||||||||||||||
| Comprehensive income: | ||||||||||||||||||||||||||||||||||||||||||||||||||
| Foreign currency translation | — | — | — | — | 4 | — | — | 4 | ||||||||||||||||||||||||||||||||||||||||||
| Net earnings | — | — | — | 17,254 | — | — | — | 17,254 | ||||||||||||||||||||||||||||||||||||||||||
| Balances at December 31, 2023 | 155,421,983 | $ | 15,542 | $ | 1,909,370 | $ | 1,319,545 | $ | 4,508 | (89,244,458) | $ | (2,302,475) | $ | 946,490 | ||||||||||||||||||||||||||||||||||||
See accompanying notes to condensed consolidated financial statements.
LIVERAMP HOLDINGS, INC. AND SUBSIDIARIES
CONDENSED CONSOLIDATED STATEMENTS OF COMPREHENSIVE INCOMEEQUITY
THREE AND NINE MONTHS ENDED DECEMBER 31, 2022
(Unaudited)
(Dollars in thousands)
| For the nine months ended | ||||||||
| December 31, | ||||||||
| 2017 | 2016 | |||||||
| Net earnings | $ | 18,305 | $ | 12,189 | ||||
| Other comprehensive income (loss): | ||||||||
| Change in foreign currency translation adjustment | 1,827 | (2,410 | ) | |||||
| Unrealized gain on interest rate swap | — | 117 | ||||||
| Other comprehensive income (loss) | 1,827 | (2,293 | ) | |||||
| Comprehensive income | $ | 20,132 | $ | 9,896 | ||||
| Accumulated | ||||||||||||||||||||||||||||||||||||||||||||||||||
| Common Stock | Additional | other | Treasury Stock | |||||||||||||||||||||||||||||||||||||||||||||||
| Number | paid-in | Retained | comprehensive | Number | Total | |||||||||||||||||||||||||||||||||||||||||||||
| For the three months ended December 31, 2022 | of shares | Amount | Capital | earnings | income (loss) | of shares | Amount | Equity | ||||||||||||||||||||||||||||||||||||||||||
| Balances at September 30, 2022 | 151,477,616 | $ | 15,148 | $ | 1,780,803 | $ | 1,363,339 | $ | 1,925 | (85,057,331) | $ | (2,201,146) | $ | 960,069 | ||||||||||||||||||||||||||||||||||||
| Employee stock awards, benefit plans and other issuances | 114,240 | 11 | 1,653 | — | — | (38,442) | (764) | 900 | ||||||||||||||||||||||||||||||||||||||||||
| Non-cash stock-based compensation | 11,941 | 1 | 27,972 | — | — | — | — | 27,973 | ||||||||||||||||||||||||||||||||||||||||||
| Restricted stock units vested | 448,579 | 45 | (45) | — | — | — | — | — | ||||||||||||||||||||||||||||||||||||||||||
| Acquisition of treasury stock | — | — | — | — | — | (2,268,470) | (49,906) | (49,906) | ||||||||||||||||||||||||||||||||||||||||||
| Comprehensive income (loss): | ||||||||||||||||||||||||||||||||||||||||||||||||||
| Foreign currency translation | — | — | — | — | 2,257 | — | — | 2,257 | ||||||||||||||||||||||||||||||||||||||||||
| Net loss | — | — | — | (29,684) | — | — | — | (29,684) | ||||||||||||||||||||||||||||||||||||||||||
| Balances at December 31, 2022 | 152,052,376 | $ | 15,205 | $ | 1,810,383 | $ | 1,333,655 | $ | 4,182 | (87,364,243) | $ | (2,251,816) | $ | 911,609 | ||||||||||||||||||||||||||||||||||||
| For the nine months ended December 31, 2022 | ||||||||||||||||||||||||||||||||||||||||||||||||||
| Balances at March 31, 2022 | 149,840,925 | $ | 14,984 | $ | 1,721,118 | $ | 1,420,993 | $ | 5,730 | (81,205,596) | $ | (2,099,765) | $ | 1,063,060 | ||||||||||||||||||||||||||||||||||||
| Employee stock awards, benefit plans and other issuances | 396,093 | 39 | 6,216 | — | — | (92,417) | (2,054) | 4,201 | ||||||||||||||||||||||||||||||||||||||||||
| Non-cash stock-based compensation | 36,965 | 4 | 73,901 | — | — | — | — | 73,905 | ||||||||||||||||||||||||||||||||||||||||||
| Restricted stock units vested | 1,421,729 | 142 | (142) | — | — | — | — | — | ||||||||||||||||||||||||||||||||||||||||||
| Liability-classified restricted stock units vested | 356,664 | 36 | 9,290 | — | — | — | — | 9,326 | ||||||||||||||||||||||||||||||||||||||||||
| Acquisition of treasury stock | — | — | — | — | — | (6,066,230) | (149,997) | (149,997) | ||||||||||||||||||||||||||||||||||||||||||
| Comprehensive loss: | ||||||||||||||||||||||||||||||||||||||||||||||||||
| Foreign currency translation | — | — | — | — | (1,548) | — | — | (1,548) | ||||||||||||||||||||||||||||||||||||||||||
| Net loss | — | — | — | (87,338) | — | — | — | (87,338) | ||||||||||||||||||||||||||||||||||||||||||
| Balances at December 31, 2022 | 152,052,376 | $ | 15,205 | $ | 1,810,383 | $ | 1,333,655 | $ | 4,182 | (87,364,243) | $ | (2,251,816) | $ | 911,609 | ||||||||||||||||||||||||||||||||||||
See accompanying notes to condensed consolidated financial statements.
| LIVERAMP HOLDINGS, INC. AND SUBSIDIARIES | ||||||||||||||||||||
| CONDENSED CONSOLIDATED STATEMENTS OF CASH FLOWS | ||||||||||||||||||||
| (Unaudited) | ||||||||||||||||||||
| (Dollars in thousands) | ||||||||||||||||||||
| For the nine months ended | ||||||||||||||||||||
| December 31, | ||||||||||||||||||||
| 2023 | 2022 | |||||||||||||||||||
| Cash flows from operating activities: | ||||||||||||||||||||
| Net earnings (loss) | $ | 17,254 | $ | (87,338) | ||||||||||||||||
| Earnings from discontinued operations, net of tax | (985) | (836) | ||||||||||||||||||
| Non-cash operating activities: | ||||||||||||||||||||
| Depreciation and amortization | 7,685 | 16,561 | ||||||||||||||||||
| Loss on disposal or impairment of assets | 3,528 | 4,121 | ||||||||||||||||||
| Gain on sale of strategic investments | — | (194) | ||||||||||||||||||
| Lease-related impairment and restructuring charges | — | 18,165 | ||||||||||||||||||
| Provision for doubtful accounts | 307 | 1,728 | ||||||||||||||||||
| Impairment of goodwill | 2,875 | — | ||||||||||||||||||
| Deferred income taxes | 40 | 204 | ||||||||||||||||||
| Non-cash stock compensation expense | 46,524 | 81,142 | ||||||||||||||||||
| Changes in operating assets and liabilities: | ||||||||||||||||||||
| Accounts receivable, net | (41,036) | (27,171) | ||||||||||||||||||
| Deferred commissions | (7,142) | (2,123) | ||||||||||||||||||
| Other assets | 912 | 1,588 | ||||||||||||||||||
| Accounts payable and other liabilities | 8,754 | (9,309) | ||||||||||||||||||
| Income taxes | 29,560 | 6,967 | ||||||||||||||||||
| Deferred revenue | 9,737 | 271 | ||||||||||||||||||
| Net cash provided by operating activities | 78,013 | 3,776 | ||||||||||||||||||
| Cash flows from investing activities: | ||||||||||||||||||||
| Capital expenditures | (2,464) | (4,593) | ||||||||||||||||||
| Purchases of investments | (24,385) | (3,000) | ||||||||||||||||||
| Proceeds from sales of investments | 25,750 | 3,000 | ||||||||||||||||||
| Purchases of strategic investments | (1,000) | (500) | ||||||||||||||||||
| Proceeds from sale of strategic investment | — | 400 | ||||||||||||||||||
| Net cash used in investing activities | (2,099) | (4,693) | ||||||||||||||||||
| Cash flows from financing activities: | ||||||||||||||||||||
| Proceeds related to the issuance of common stock under stock and employee benefit plans | 7,221 | 6,255 | ||||||||||||||||||
| Shares repurchased for tax withholdings upon vesting of stock-based awards | (5,116) | (2,054) | ||||||||||||||||||
| Acquisition of treasury stock | (45,325) | (149,997) | ||||||||||||||||||
| Net cash used in financing activities | (43,220) | (145,796) | ||||||||||||||||||
| Net cash provided by (used in) continuing operations | 32,694 | (146,713) | ||||||||||||||||||
| Cash flows from discontinued operations: | ||||||||||||||||||||
| From operating activities | 985 | 836 | ||||||||||||||||||
| Net cash provided by discontinued operations | 985 | 836 | ||||||||||||||||||
11
| Accumulated | ||||||||||||||||||||||||||||||
| Common Stock | Additional | other | Treasury Stock | |||||||||||||||||||||||||||
| Number | paid-in | Retained | comprehensive | Number | Total | |||||||||||||||||||||||||
| of shares | Amount | Capital | earnings | income | of shares | Amount | Equity | |||||||||||||||||||||||
| Balances at March 31, 2017 | 132,875,373 | $ | 13,288 | $ | 1,154,429 | $ | 602,609 | $ | 7,999 | (54,582,392 | ) | $ | (1,039,345 | ) | $ | 738,980 | ||||||||||||||
| Cumulative-effect adjustment from adoption of ASU 2016-09 | — | — | 384 | 2,242 | — | — | — | $ | 2,626 | |||||||||||||||||||||
| Employee stock awards, benefit plans and other issuances | 805,768 | 80 | 15,229 | — | — | (389,912 | ) | (10,202 | ) | $ | 5,107 | |||||||||||||||||||
| Non-cash stock-based compensation | 487,385 | 49 | 46,658 | — | — | — | — | $ | 46,707 | |||||||||||||||||||||
| Restricted stock units vested | 1,351,652 | 135 | (135 | ) | — | — | — | — | $ | — | ||||||||||||||||||||
| Acquisition of treasury stock | — | — | — | — | — | (1,588,964 | ) | (39,441 | ) | $ | (39,441 | ) | ||||||||||||||||||
| Comprehensive income: | ||||||||||||||||||||||||||||||
| Foreign currency translation | — | — | — | — | 1,827 | — | — | $ | 1,827 | |||||||||||||||||||||
| Net earnings | — | — | — | 18,305 | — | — | — | $ | 18,305 | |||||||||||||||||||||
| Balances at December 31, 2017 | 135,520,178 | $ | 13,552 | $ | 1,216,565 | $ | 623,156 | $ | 9,826 | (56,561,268 | ) | $ | (1,088,988 | ) | $ | 774,111 | ||||||||||||||
| LIVERAMP HOLDINGS, INC. AND SUBSIDIARIES | ||||||||||||||||||||
| CONDENSED CONSOLIDATED STATEMENTS OF CASH FLOWS | ||||||||||||||||||||
| (Unaudited) | ||||||||||||||||||||
| (Dollars in thousands) | ||||||||||||||||||||
| For the nine months ended | ||||||||||||||||||||
| December 31, | ||||||||||||||||||||
| 2023 | 2022 | |||||||||||||||||||
| Effect of exchange rate changes on cash | 819 | (769) | ||||||||||||||||||
| Net change in cash and cash equivalents | 34,498 | (146,646) | ||||||||||||||||||
| Cash and cash equivalents at beginning of period | 464,448 | 600,162 | ||||||||||||||||||
| Cash and cash equivalents at end of period | $ | 498,946 | $ | 453,516 | ||||||||||||||||
| Supplemental cash flow information: | ||||||||||||||||||||
| Cash paid (received) for income taxes, net - continuing operations | $ | (2,440) | $ | 4,725 | ||||||||||||||||
| Cash (received) for income taxes - discontinued operations | (1,507) | (1,307) | ||||||||||||||||||
| Cash paid for operating lease liabilities | 7,699 | 5,733 | ||||||||||||||||||
| Operating lease assets obtained in exchange for operating lease liabilities | 11,677 | 69 | ||||||||||||||||||
| Operating lease assets, and related lease liabilities, relinquished in lease terminations | (4,486) | (6,781) | ||||||||||||||||||
| Purchases of property, plant and equipment remaining unpaid at period end | 1,218 | 77 | ||||||||||||||||||
See accompanying notes to condensed consolidated financial statementsstatements.
| For the nine months ended | ||||||||
| December 31, | ||||||||
| 2017 | 2016 | |||||||
| Cash flows from operating activities: | ||||||||
| Net earnings | $ | 18,305 | $ | 12,189 | ||||
| Adjustments to reconcile net earnings to net cash provided by operating activities: | ||||||||
| Depreciation and amortization | 63,719 | 61,097 | ||||||
| Loss (gain) on disposal or impairment of assets | 2,646 | (520 | ) | |||||
| Accelerated deferred debt costs | 720 | — | ||||||
| Deferred income taxes | (20,451 | ) | (1,982 | ) | ||||
| Non-cash stock compensation expense | 46,707 | 33,955 | ||||||
| Changes in operating assets and liabilities: | ||||||||
| Accounts receivable, net | (11,432 | ) | (6,161 | ) | ||||
| Other assets | (1,277 | ) | 8,653 | |||||
| Accounts payable and other liabilities | (18,232 | ) | (11,819 | ) | ||||
| Deferred revenue | (4,314 | ) | (10,247 | ) | ||||
| Net cash provided by operating activities | 76,391 | 85,165 | ||||||
| Cash flows from investing activities: | ||||||||
| Capitalized software development costs | (10,332 | ) | (11,171 | ) | ||||
| Capital expenditures | (26,950 | ) | (30,096 | ) | ||||
| Data acquisition costs | (621 | ) | (463 | ) | ||||
| Equity investments | (1,000 | ) | — | |||||
| Net cash received from disposition | 4,000 | 16,988 | ||||||
| Net cash paid in acquisitions | — | (137,383 | ) | |||||
| Net cash used in investing activities | (34,903 | ) | (162,125 | ) | ||||
| Cash flows from financing activities: | ||||||||
| Proceeds from debt | 230,000 | 70,000 | ||||||
| Payments of debt | (226,732 | ) | (24,173 | ) | ||||
| Fees for debt refinancing | (4,001 | ) | — | |||||
| Sale of common stock, net of stock acquired for withholding taxes | 5,107 | 9,670 | ||||||
| Excess tax benefits from stock-based compensation | — | 1,785 | ||||||
| Acquisition of treasury stock | (39,441 | ) | (30,542 | ) | ||||
| Net cash provided by (used) in financing activities | (35,067 | ) | 26,740 | |||||
| Effect of exchange rate changes on cash | 1,043 | (1,559 | ) | |||||
| Net change in cash and cash equivalents | 7,464 | (51,779 | ) | |||||
| Cash and cash equivalents at beginning of period | 170,343 | 189,629 | ||||||
| Cash and cash equivalents at end of period | $ | 177,807 | $ | 137,850 | ||||
12
| For the nine months ended | ||||||||
| December 31, | ||||||||
| 2017 | 2016 | |||||||
| Supplemental cash flow information: | ||||||||
| Cash paid during the period for: | ||||||||
| Interest | $ | 6,712 | $ | 5,301 | ||||
| Income taxes, net of refunds | 1,152 | 4,796 | ||||||
| Non-cash investing and financing activities: | ||||||||
| Leasehold improvements paid directly by lessor | 978 | — | ||||||
NOTES TO CONDENSED CONSOLIDATED FINANCIAL STATEMENTS
(Unaudited)
1. BASIS OF PRESENTATION AND SUMMARY OF SIGNIFICANT ACCOUNTING POLICIES:
These condensed consolidated financial statements have been prepared by Acxiom Corporation (“Registrant,” “Acxiom,” we, usLiveRamp Holdings, Inc. ("LiveRamp", "we", "us" or the “Company”"Company"), without audit, pursuant to the rules and regulations of the Securities and Exchange Commission (the “SEC” or the “Commission”). In the opinion of the Registrant’sCompany's management, all adjustments necessary for a fair presentation of the results for the periods included have been made, and the disclosures are adequate to make the information presented not misleading. All such adjustments are of a normal recurring nature. Certain note information has been omitted because it has not changed significantly from that reflected in Notes 1 through 1918 of the Notes to Consolidated Financial Statements filed as part of Item 8 of the Registrant’s annual reportCompany’s Annual Report on Form 10-K for the fiscal year ended March 31, 20172023 (“20172023 Annual Report”), as filed with the CommissionSEC on May 26, 2017.24, 2023. This quarterly report and the accompanying condensed consolidated financial statements should be read in connection with the 20172023 Annual Report. The financial information contained in this quarterly report is not necessarily indicative of the results to be expected for any other period or for the full fiscal year ending March 31, 2018.2024.
Management of the Company has made a number of estimates and assumptions relating to the reporting of assets and liabilities and the disclosure of contingent assets and liabilities to prepare these condensed consolidated financial statements in conformity with accounting principles generally accepted in the United States (“U.S. GAAP”). Actual results could differ from those estimates. Certain of the accounting policies used in the preparation of these condensed consolidated financial statements are complex and require management to make judgments and/or significant estimates regarding amounts reported or disclosed in these financial statements. Additionally, the application of certain of these accounting policies is governed by complex accounting principles and their interpretation. A discussion of the Company’s significant accounting principles and their application is included in Note 1 of the Notes to Consolidated Financial Statements and in Item 7, Management’s Discussion and Analysis of Financial Condition and Results of Operations, of the Company’s 20172023 Annual Report.
| Accounting Pronouncements Adopted During the Current Year | |||||||||||
| Standard | Description | Date of Adoption | Effect on Financial Statements or Other Significant Matters | ||||||||
| There were no material accounting pronouncements applicable to the Company | |||||||||||
13
| Recent Accounting Pronouncements Not Yet Adopted | |||||||||||
| Standard | Description | Date of Adoption | Effect on Financial Statements or Other Significant Matters | ||||||||
Accounting Standard Update (“ASU”) 2023-07 Segment Reporting (Topic 280): Improvements to Reportable Segment Disclosures | ASU 2023-07 expands annual and interim disclosure requirements for reportable segments, primarily through enhanced disclosures about significant segment expenses. | The updated standard is effective for our annual periods beginning in fiscal 2025 and interim periods beginning in the first quarter of fiscal 2026. Early adoption is permitted. | We are currently evaluating the impact that the updated standard will have on our consolidated financial statement disclosures. | ||||||||
ASU 2023-09 Income Taxes (Topic 740): Improvements to Income Tax Disclosures | ASU 2023-09 requires disaggregated information about a reporting entity's effective tax rate reconciliation as well as information on income tax paid. | The updated standard is effective for us beginning in fiscal 2026. Early adoption is permitted. | We are currently evaluating the impact that the updated standard will have on our consolidated financial statement disclosures. | ||||||||
14
2. EARNINGS (LOSS) PER SHARE AND STOCKHOLDERS’ EQUITY:
Earnings (Loss) Per Share
A reconciliation of the numerator and denominator of basic and diluted earnings (loss) per share is shown below (in thousands, except per share amounts):
| For the three months ended | For the nine months ended | |||||||||||||||||||||||||
| December 31, | December 31, | |||||||||||||||||||||||||
| 2023 | 2022 | 2023 | 2022 | |||||||||||||||||||||||
| Basic earnings (loss) per share: | ||||||||||||||||||||||||||
| Net earnings (loss) from continuing operations | $ | 13,379 | $ | (30,520) | $ | 16,269 | $ | (88,174) | ||||||||||||||||||
| Earnings from discontinued operations, net of tax | 598 | 836 | 985 | 836 | ||||||||||||||||||||||
| Net earnings (loss) | $ | 13,977 | $ | (29,684) | $ | 17,254 | $ | (87,338) | ||||||||||||||||||
| Basic weighted-average shares outstanding | 65,961 | 64,784 | 66,247 | 66,761 | ||||||||||||||||||||||
| Continuing operations | $ | 0.20 | $ | (0.47) | $ | 0.25 | $ | (1.32) | ||||||||||||||||||
| Discontinued operations | 0.01 | 0.01 | 0.01 | 0.01 | ||||||||||||||||||||||
| Basic earnings (loss) per share | $ | 0.21 | $ | (0.46) | $ | 0.26 | $ | (1.31) | ||||||||||||||||||
| Diluted earnings (loss) per share: | ||||||||||||||||||||||||||
| Basic weighted-average shares outstanding | 65,961 | 64,784 | 66,247 | 66,761 | ||||||||||||||||||||||
| Dilutive effect of common stock options and restricted stock units as computed under the treasury stock method (1) | 1,982 | — | 1,486 | — | ||||||||||||||||||||||
| Diluted weighted-average shares outstanding | 67,943 | 64,784 | 67,733 | 66,761 | ||||||||||||||||||||||
| Continuing operations | $ | 0.20 | $ | (0.47) | $ | 0.24 | $ | (1.32) | ||||||||||||||||||
| Discontinued operations | 0.01 | 0.01 | 0.01 | 0.01 | ||||||||||||||||||||||
| Diluted earnings (loss) per share | $ | 0.21 | $ | (0.46) | $ | 0.25 | $ | (1.31) | ||||||||||||||||||
| For the three months ended | For the nine months ended | |||||||||||||||
| December 31, | December 31, | |||||||||||||||
| 2017 | 2016 | 2017 | 2016 | |||||||||||||
| Basic earnings per share: | ||||||||||||||||
| Net earnings | $ | 22,941 | $ | 1,073 | $ | 18,305 | $ | 12,189 | ||||||||
| Basic weighted-average shares outstanding | 79,043 | 77,507 | 78,983 | 77,475 | ||||||||||||
| Basic earnings per share | $ | 0.29 | $ | 0.01 | $ | 0.23 | $ | 0.16 | ||||||||
| Diluted earnings per share: | ||||||||||||||||
| Basic weighted-average shares outstanding | 79,043 | 77,507 | 78,983 | 77,475 | ||||||||||||
| Dilutive effect of common stock options, warrants, and restricted stock as computed under the treasury stock method | 2,826 | 2,344 | 2,611 | 2,019 | ||||||||||||
| Diluted weighted-average shares outstanding | 81,869 | 79,851 | 81,594 | 79,494 | ||||||||||||
| Diluted earnings per share | $ | 0.28 | $ | 0.01 | $ | 0.22 | $ | 0.15 | ||||||||
Restricted stock units that were outstanding during the periods presented but were not included in the computation of diluted earningsloss per share because their effect would have been anti-dilutive (other than due to the effect was anti-dilutivenet loss position of the Company) are shown below (shares in thousands):
| For the three months ended | For the nine months ended | |||||||||||||||||||||||||
| December 31, | December 31, | |||||||||||||||||||||||||
| 2023 | 2022 | 2023 | 2022 | |||||||||||||||||||||||
| Number of shares underlying restricted stock units | 1,046 | 6,215 | 1,065 | 2,980 | ||||||||||||||||||||||
15
| For the three months ended | For the nine months ended | |||||||||||
| December 31, | December 31, | |||||||||||
| 2017 | 2016 | 2017 | 2016 | |||||||||
| Number of shares outstanding under options, warrants and restricted stock units | 97 | 156 | 89 | 345 | ||||||||
| Range of exercise prices for options | $32.85 | $32.85 | $32.85 | $20.27-$32.85 | ||||||||
Stockholders’ Equity
On August 29, 2011,December 20, 2022, the Company's board of directors adopted a common stock repurchase program. That program was subsequently modified and expanded, most recently on July 28, 2016. Underapproved an amendment to the modifiedexisting common stock repurchase program, which was initially adopted in 2011. The amendment authorized an additional $100.0 million in share repurchases, increasing the Company may purchase up to $400.0 million of itstotal amount authorized for repurchase under the common stock repurchase program to $1.1 billion. In addition, it extended the common stock repurchase program duration through the period ending June 30, 2018. December 31, 2024.
During the nine months ended December 31, 2017,2023, the Company repurchased 1.61.7 million shares of its common stock for $39.4 million.$45.3 million under the modified common stock repurchase program. Through December 31, 2017,2023, the Company had repurchased a total
of 18.437.3 million shares of its common stock for $325.2$927.5 million under the program, leaving remaining capacity of $74.8 million under the stock repurchase program.
Accumulated other comprehensive income accumulated balances of $9.8$4.5 million and $8.0$5.7 million at December 31, 20172023 and March 31, 2017,2023, respectively, reflect accumulated foreign currency translation adjustments.
3. SHARE-BASEDREVENUE FROM CONTRACTS WITH CUSTOMERS:
Disaggregation of Revenue
In the following table, revenue is disaggregated by primary geographical market and major service offerings (dollars in thousands):
| For the nine months ended December 31, | ||||||||||||||||||||
| Primary Geographical Markets | 2023 | 2022 | ||||||||||||||||||
| United States | $ | 456,651 | $ | 417,385 | ||||||||||||||||
| Europe | 25,737 | 24,172 | ||||||||||||||||||
| Asia-Pacific ("APAC") | 4,528 | 5,926 | ||||||||||||||||||
| Other | 893 | 474 | ||||||||||||||||||
| $ | 487,809 | $ | 447,957 | |||||||||||||||||
| Major Offerings/Services | ||||||||||||||||||||
| Subscription | $ | 379,938 | $ | 361,862 | ||||||||||||||||
| Marketplace and Other | 107,871 | 86,095 | ||||||||||||||||||
| $ | 487,809 | $ | 447,957 | |||||||||||||||||
Transaction Price Allocated to the Remaining Performance Obligations
We have performance obligations associated with fixed commitments in customer contracts for future services that have not yet been recognized in our condensed consolidated financial statements. The amount of fixed revenue not yet recognized was $546.2 million as of December 31, 2023, of which $382.4 million will be recognized over the next twelve months. The Company expects to recognize revenue on substantially all of these remaining performance obligations by March 31, 2028.
16
4. LEASES:
Right-of-use assets and lease liabilities balances consist of the following (dollars in thousands):
| December 31, 2023 | March 31, 2023 | |||||||||||||
| Right-of-use assets included in other assets, net | $ | 25,498 | $ | 24,604 | ||||||||||
| Short-term lease liabilities included in other accrued expenses | $ | 10,309 | $ | 9,929 | ||||||||||
| Long-term lease liabilities included in other liabilities | $ | 33,836 | $ | 37,243 | ||||||||||
| Supplemental balance sheet information: | ||||||||||||||
| Weighted average remaining lease term | 5.5 years | 5.6 years | ||||||||||||
| Weighted average discount rate | 5.2 | % | 3.5 | % | ||||||||||
The Company leases its office facilities under non-cancellable operating leases that expire at various dates through fiscal 2031. Certain leases contain provisions for property-related costs that are variable in nature for which the Company is responsible, including common area maintenance and other property operating services. These costs are calculated based on a variety of factors including property values, tax and utility rates, property service fees, and other factors. Operating lease costs were $7.2 million and $9.0 million for the nine months ended December 31, 2023, and 2022, respectively.
During the nine months ended December 31, 2023, the Company recorded $1.9 million of right-of-use asset impairment charges and $0.4 million of non-lease component restructuring charges that are included in gains, losses and other items, net in the condensed consolidated statements of operations related to certain leased office facilities. Please refer to Note 13, Restructuring, Impairment and Other Charges for further details.
The following table presents future minimum payments under all operating leases (including operating leases with a duration of one year or less) as of December 31, 2023. The amount for fiscal 2024 represents the remaining three months ending March 31, 2024. All other periods represent fiscal years ending March 31 (dollars in thousands):
| Amount | ||||||||
| Fiscal 2024 | $ | 2,702 | ||||||
| Fiscal 2025 | 9,965 | |||||||
| Fiscal 2026 | 8,675 | |||||||
| Fiscal 2027 | 8,265 | |||||||
| Fiscal 2028 | 8,454 | |||||||
| Thereafter | 12,828 | |||||||
| Total undiscounted lease commitments | 50,889 | |||||||
| Less: Interest and short-term leases | 6,744 | |||||||
| Total discounted operating lease liabilities | $ | 44,145 | ||||||
Future minimum payments as of December 31, 2023 related to restructuring plans as a result of the Company's exit from certain leased office facilities (see Note 13) are as follows (dollars in thousands): Fiscal 2024: $675; Fiscal 2025: $2,698; and Fiscal 2026: $1,799.
17
5. STOCK-BASED COMPENSATION:
The Company has stock option and equity compensation plans for which a total of 34.549.0 million shares of the Company’s common stock have been reserved for issuance since the inception of the plans. These plans provide that the exercise prices of qualified options will be at or above the fair market value of the common stock at the time of the grant. Board policy requires that nonqualified options also be priced at or above the fair market value of the common stock at the time of grant. At December 31, 2017,2023, there were a total of 6.26.8 million shares available for future grants under the plans.
During the quarter ended June 30, 2017,2023, the Boardboard of directors voted to amend the Amended and Restated 2005 Equity Compensation Plan (the "2005 Plan") to increase the number of shares available under the plan by 4.0 million shares. The amendment received shareholder approval at the August 2023 annual shareholders' meeting (the "2023 Annual Meeting"). This increased the plan shares from 28.442.4 million shares at March 31, 2023 to 32.946.4 million shares bringingbeginning in the quarter ended September 30, 2023 and increased the total number of shares reserved for issuance since inception of theall plans from 30.045.0 million shares at March 31, 20172023 to 34.549.0 million shares beginning in the quarter ended September 30, 2023.
Stock-based Compensation Expense
The Company's stock-based compensation activity for the nine months ended December 31, 2023 and 2022, by award type, was (dollars in thousands):
| For the nine months ended | ||||||||||||||
| December 31, | ||||||||||||||
| 2023 | 2022 | |||||||||||||
| Stock options | $ | 405 | $ | 776 | ||||||||||
| Restricted stock units, time-vesting | 36,706 | 65,214 | ||||||||||||
| Restricted stock units, performance based | 4,876 | 5,398 | ||||||||||||
| Data Plus Math ("DPM") acquisition consideration holdback | — | 2,031 | ||||||||||||
| Acuity performance plan | 165 | 673 | ||||||||||||
| DataFleets acquisition consideration holdback | 2,267 | 4,532 | ||||||||||||
| Employee stock purchase plan | 1,167 | 1,527 | ||||||||||||
| Directors stock-based compensation | 938 | 991 | ||||||||||||
| Total non-cash stock-based compensation included in the condensed consolidated statements of operations | 46,524 | 81,142 | ||||||||||||
| Less expense related to liability-based equity awards | (2,431) | (7,237) | ||||||||||||
| Total non-cash stock-based compensation included in the condensed consolidated statements of equity | $ | 44,093 | $ | 73,905 | ||||||||||
The effect of stock-based compensation expense on income, by financial statement line item, was (dollars in thousands):
| For the nine months ended | ||||||||||||||||||||
| December 31, | ||||||||||||||||||||
| 2023 | 2022 | |||||||||||||||||||
| Cost of revenue | $ | 2,075 | $ | 3,664 | ||||||||||||||||
| Research and development | 17,330 | 34,670 | ||||||||||||||||||
| Sales and marketing | 12,611 | 17,871 | ||||||||||||||||||
| General and administrative | 14,508 | 24,937 | ||||||||||||||||||
| Total non-cash stock-based compensation included in the condensed consolidated statements of operations | $ | 46,524 | $ | 81,142 | ||||||||||||||||
18
The following table provides the expected future expense for all of the Company's outstanding equity awards at December 31, 2017. That amendment received shareholder approval at2023, by award type. The amount for fiscal 2024 represents the August 8, 2017 annual shareholders' meeting.remaining three months ending March 31, 2024. All other periods represent fiscal years ending March 31 (dollars in thousands).
| For the years ending March 31, | ||||||||||||||||||||||||||||||||||||||
| 2024 | 2025 | 2026 | 2027 | Total | ||||||||||||||||||||||||||||||||||
| Stock options | $ | 81 | $ | 90 | $ | — | $ | — | $ | 171 | ||||||||||||||||||||||||||||
| Restricted stock units | 21,871 | 78,291 | 30,440 | 4,716 | 135,318 | |||||||||||||||||||||||||||||||||
| Employee stock purchase plan | 431 | 431 | — | — | 862 | |||||||||||||||||||||||||||||||||
| Expected future expense | $ | 22,383 | $ | 78,812 | $ | 30,440 | $ | 4,716 | $ | 136,351 | ||||||||||||||||||||||||||||
Stock OptionOptions Activity
Stock option activity for the nine months ended December 31, 20172023 was:
| Weighted-average | ||||||||||||||||||||||||||
| Weighted-average | remaining | Aggregate | ||||||||||||||||||||||||
| Number of | exercise price | contractual term | Intrinsic value | |||||||||||||||||||||||
| shares | per share | (in years) | (in thousands) | |||||||||||||||||||||||
| Outstanding at March 31, 2023 | 524,911 | $ | 18.39 | |||||||||||||||||||||||
| Exercised | (151,706) | $ | 19.37 | $ | 860 | |||||||||||||||||||||
| Forfeited or canceled | (2,410) | $ | 5.21 | |||||||||||||||||||||||
| Outstanding at December 31, 2023 | 370,795 | $ | 18.08 | 1.2 | $ | 7,342 | ||||||||||||||||||||
| Exercisable at December 31, 2023 | 368,662 | $ | 18.18 | 1.2 | $ | 7,264 | ||||||||||||||||||||
| Weighted-average | |||||||||||||
| Weighted-average | remaining | Aggregate | |||||||||||
| Number of | exercise price | contractual term | Intrinsic value | ||||||||||
| shares | per share | (in years) | (in thousands) | ||||||||||
| Outstanding at March 31, 2017 | 3,033,071 | $ | 13.14 | ||||||||||
| Performance units converted to options | 299,641 | $ | 21.32 | ||||||||||
| Exercised | (526,842 | ) | $ | 15.05 | $ | 6,044 | |||||||
| Forfeited or canceled | (88,870 | ) | $ | 20.08 | |||||||||
| Outstanding at December 31, 2017 | 2,717,000 | $ | 13.45 | 5.7 | $ | 38,448 | |||||||
| Exercisable at December 31, 2017 | 2,109,993 | $ | 13.53 | 5.1 | $ | 29,701 | |||||||
The aggregate intrinsic value at period end represents the total pre-tax intrinsic value (the difference between Acxiom’sthe Company’s closing stock price on the last trading day of the period and the exercise price for each in-the-money option) that would have been received by the option holders had option holdersthey exercised their options on December 31, 2017.2023. This amount changes based upon changes in the fair market value of Acxiom’sthe Company's common stock.
A summary of stock options outstanding and exercisable as of December 31, 20172023 was:
| Options outstanding | Options exercisable | ||||||||||||||||||||||||||||||||||||||||||||||||||||||||||||||||||||||||||||||||||||||||||||||||||||||||||||||||
| Options outstanding | Options outstanding | Options exercisable | |||||||||||||||||||||||||||||||||||||||||||||||||||||||||||||||||||||||||||||||||||||||||||||||||||||||||||||||
| Range of | Range of | Weighted-average | Weighted-average | Weighted-average | Range of | Weighted-average | Weighted-average | Weighted-average | |||||||||||||||||||||||||||||||||||||||||||||||||||||||||||||||||||||||||||||||||||||||||||||||||||||||||
| exercise price | exercise price | Options | remaining | exercise price | Options | exercise price | exercise price | Options | remaining | exercise price | Options | exercise price | |||||||||||||||||||||||||||||||||||||||||||||||||||||||||||||||||||||||||||||||||||||||||||||||||||||
| per share | per share | outstanding | contractual life | per share | exercisable | per share | per share | outstanding | contractual life | per share | exercisable | per share | |||||||||||||||||||||||||||||||||||||||||||||||||||||||||||||||||||||||||||||||||||||||||||||||||||||
| $ | 0.61 | — | $ | 9.99 | 690,169 | 6.4 years | $ | 1.68 | 474,434 | $ | 1.77 | ||||||||||||||||||||||||||||||||||||||||||||||||||||||||||||||||||||||||||||||||||||||||||||||||||||||
| $ | 10.00 | — | $ | 19.99 | 1,262,595 | 4.9 years | $ | 14.94 | 1,076,909 | $ | 14.47 | ||||||||||||||||||||||||||||||||||||||||||||||||||||||||||||||||||||||||||||||||||||||||||||||||||||||
| $ | 20.00 | — | $ | 24.99 | 744,684 | 6.6 years | $ | 21.31 | 539,098 | $ | 21.33 | ||||||||||||||||||||||||||||||||||||||||||||||||||||||||||||||||||||||||||||||||||||||||||||||||||||||
| $ | 25.00 | — | $ | 32.85 | 19,552 | 5.9 years | $ | 32.85 | 19,552 | $ | 32.85 | ||||||||||||||||||||||||||||||||||||||||||||||||||||||||||||||||||||||||||||||||||||||||||||||||||||||
| 2,717,000 | 5.7 years | $ | 13.45 | 2,109,993 | $ | 13.53 | |||||||||||||||||||||||||||||||||||||||||||||||||||||||||||||||||||||||||||||||||||||||||||||||||||||||||||
| 370,795 | |||||||||||||||||||||||||||||||||||||||||||||||||||||||||||||||||||||||||||||||||||||||||||||||||||||||||||||||||
| 370,795 | |||||||||||||||||||||||||||||||||||||||||||||||||||||||||||||||||||||||||||||||||||||||||||||||||||||||||||||||||
| 370,795 | |||||||||||||||||||||||||||||||||||||||||||||||||||||||||||||||||||||||||||||||||||||||||||||||||||||||||||||||||
19
| Weighted-average | ||||||||||||||
| Weighted-average | remaining | Aggregate | ||||||||||||
| Number | exercise price | contractual term | intrinsic value | |||||||||||
| of shares | per share | (in years) | (in thousands) | |||||||||||
| Outstanding at March 31, 2017 | 555,123 | $ | 21.41 | |||||||||||
| Performance units converted to options | (183,322 | ) | $ | 21.41 | ||||||||||
| Forfeited or canceled | (25,201 | ) | $ | 21.32 | ||||||||||
| Outstanding at December 31, 2017 | 346,600 | $ | 21.41 | 1.9 | $ | 2,131 | ||||||||
| Exercisable at December 31, 2017 | — | $ | — | — | $ | — | ||||||||
| Weighted-average | ||||||||||||||
| Weighted-average | remaining | Aggregate | ||||||||||||
| Number | exercise price | contractual term | intrinsic value | |||||||||||
| of shares | per share | (in years) | (in thousands) | |||||||||||
| Outstanding at March 31, 2017 | 245,404 | $ | 40.00 | |||||||||||
| Forfeited or canceled | (245,404 | ) | $ | 40.00 | ||||||||||
| Outstanding at December 31, 2017 | — | $ | — | — | $ | — | ||||||||
Restricted Stock Unit Activity
Time-vesting restricted stock units ("RSUs") -
During the nine months ended December 31, 2017,2023, the Company granted time-vesting restricted stock unitsRSUs covering 1,687,4161,730,545 shares of common stock withand having a fair value at the date of grant of $44.2$46.6 million. Of the restricted stock unitsRSUs granted in the current period, 358,812year, 947,054 vest in equal annual increments over four years, 106,571 vest in equal annual increments over three years 1,008,851and 783,491 vest 25% at the one-year anniversary and 75% in equal quarterly increments over the subsequent three years, 174,368 vest 50% at the one-year anniversary and 50% in equal quarterly increments over the following year, and 38,814 vest in one year.two years. Grant date fair value of these units is equal to the quoted market price for the shares on the date of grant.
| Weighted-average | ||||||||||||||||||||
| fair value per | Weighted-average | |||||||||||||||||||
| Number | share at grant | remaining contractual | ||||||||||||||||||
| of shares | date | term (in years) | ||||||||||||||||||
| Outstanding at March 31, 2023 | 4,009,759 | $ | 32.57 | 2.20 | ||||||||||||||||
| Granted | 1,730,545 | $ | 26.95 | |||||||||||||||||
| Vested | (890,679) | $ | 32.03 | |||||||||||||||||
| Forfeited or canceled | (378,510) | $ | 33.66 | |||||||||||||||||
| Outstanding at December 31, 2023 | 4,471,115 | $ | 30.41 | 1.70 | ||||||||||||||||
| Weighted-average | |||||||||
| fair value per | Weighted-average | ||||||||
| Number | share at grant | remaining contractual | |||||||
| of shares | date | term (in years) | |||||||
| Outstanding at March 31, 2017 | 3,307,577 | $ | 22.57 | 2.45 | |||||
| Granted | 1,687,416 | $ | 26.17 | ||||||
| Vested | (1,067,370 | ) | $ | 22.30 | |||||
| Forfeited or canceled | (345,581 | ) | $ | 23.36 | |||||
| Outstanding at December 31, 2017 | 3,582,042 | $ | 24.27 | 2.48 | |||||
Performance-based restricted stock units ("PSUs") -
Fiscal 2024 plan:
During the nine months ended December 31, 2017,2023, the Company granted performance-based restricted stock unitsPSUs covering 425,880666,496 shares of common stock having a fair value at the date of grant of $11.2$21.0 million. OfThe grants were made under two separate performance plans.
Under the performance-based restrictedtotal shareholder return ("TSR") performance plan, units covering 199,946 shares of common stock unitswere granted in the current period, 221,746 units - having a fair value at the date of grant of $6.2$8.4 million, determined using a Monte Carlo simulation model -model. The units vest subject to attainment of performance criteriamarket conditions established by the compensation committee of the board of directors (“compensation committee”) and continuous employment through the vesting date. The 221,746 units may vest in a number of shares from zero0% to 200% of the award, based on the total shareholder returnTSR of AcxiomLiveRamp common stock compared to total shareholder returnthe TSR of a group of peer companies (“TSR”) established by the compensation committeeRussell 2000 market index for the period from April 1, 20172023 to March 31, 2020. 2026.
Fiscal 2023 plan:
Units under the Company's fiscal 2023 TSR performance plan, net of forfeitures, covering 101,931 shares of common stock will reach maturity of their relevant performance period at March 31, 2025. The units may vest in a number of shares from zero0% to 150%200% of the initial award, less the number of shares awarded at completion of year one. The units will vest based on the attainmentTSR of certain revenue growth initiativesLiveRamp common stock compared to the TSR of the Russell 2000 market index for the period from OctoberApril 1, 20172022 to September 30, 2019.March 31, 2025.
20
Units under the Company's fiscal 2023 operating metrics performance plan, net of forfeitures, covering 237,837 shares of common stock will reach maturity of their relevant performance period at March 31, 2025. The remaining 116,950 performance-based restricted stock units granted in the current period - having a fair value at the date of grant of $2.9 million, based on the quoted market price for the shares on the date of grant - vest in three equal tranches, each being subject to attainment of performance criteria established by the compensation committee and continuous employment through the vesting date. Each of the three tranches may vest in a number of shares from zero0% to 300%200% of the initialaward, at the end of the performance period, based on the average attainment of annual revenue growth and EBITDA margin targets for fiscal years 2023, 2024, and 2025.
Fiscal 2022 plans:
Units under the Company's fiscal 2022 special incentive performance plan covering 36,425 shares of common stock were measured and vesting was evaluated on a quarterly basis beginning on January 1, 2023 and continuing through the end of the performance period, December 31, 2023. Through the final measurement date, December 31, 2023, an accumulated 77% achievement, or 27,959 total units were earned under this plan. The remaining 8,466 units are expected to be cancelled in the fourth quarter of fiscal 2024 upon compensation committee approval.
Units under the Company's fiscal 2022 TSR performance plan, net of forfeitures, covering 41,298 shares of common stock will reach maturity of their relevant performance period at March 31, 2024. The units may vest in a number of shares from 0% to 200% of the award, based on the attainmentTSR of certain revenue growth and operating margin targetsLiveRamp common stock compared to the TSR of the Russell 2000 market index for the years endingperiod from April 1, 2021 to March 31, 2018, 2019, and 2020, respectively.2024.
PSU activity for the nine months ended December 31, 20172023 was:
| Weighted-average | ||||||||||||||||||||
| fair value per | Weighted-average | |||||||||||||||||||
| Number | share at grant | remaining contractual | ||||||||||||||||||
| of shares | date | term (in years) | ||||||||||||||||||
| Outstanding at March 31, 2023 | 709,589 | $ | 34.97 | 1.01 | ||||||||||||||||
| Granted | 666,496 | $ | 31.58 | |||||||||||||||||
| Vested | (55,968) | $ | 47.11 | |||||||||||||||||
| Forfeited or canceled | (214,760) | $ | 40.19 | |||||||||||||||||
| Outstanding at December 31, 2023 | 1,105,357 | $ | 31.29 | 1.84 | ||||||||||||||||
| Weighted-average | |||||||||
| fair value per | Weighted-average | ||||||||
| Number | share at grant | remaining contractual | |||||||
| of shares | date | term (in years) | |||||||
| Outstanding at March 31, 2017 | 732,711 | $ | 20.89 | 1.13 | |||||
| Granted | 425,880 | $ | 26.22 | ||||||
| Additional earned performance shares | 94,775 | $ | 19.46 | ||||||
| Vested | (252,760 | ) | $ | 19.46 | |||||
| Forfeited or canceled | (48,422 | ) | $ | 22.00 | |||||
| Outstanding at December 31, 2017 | 952,184 | $ | 23.45 | 1.37 | |||||
Other Stock Compensation Activity
Acquisition-related Performance Plan
Through December 31, 2023, the performance-based restricted stock units outstanding at March 31, 2017, 157,985Company has recognized a total of $5.1 million as stock-based compensation expense related to the Acuity performance earnout plan. The final annual settlement of $1.7 million occurred in the second quarter of fiscal 2024.
Acquisition-related Consideration Holdback
Through December 31, 2023, the Company has recognized a performance period ended March 31, 2017. total of $14.7 million as stock-based compensation expense related to the DataFleets consideration holdback. The final settlement of $2.6 million occurred in the third quarter of fiscal 2024.
21
Qualified Employee Stock Purchase Plan ("ESPP")
During the quarternine months ended June 30, 2017, the units vested at a 160% attainment level based on performance results approved by the compensation committee, resulting in issuance of 252,760December 31, 2023, 216,699 shares of common stock were purchased under the ESPP at a weighted-average price of which 94,775 were the additional earned performance shares referenced$19.76 per share, resulting in the table above.
Stock-based compensation expense associated with the TSR multiplier, in the first quarter of fiscal 2019.
| Weighted-average | |||||||||
| fair value per | Weighted-average | ||||||||
| Number | share at grant | remaining contractual | |||||||
| of shares | date | term (in years) | |||||||
| Outstanding at March 31, 2017 | 597,193 | $ | 4.14 | 0.30 | |||||
| Vested | (24,573 | ) | $ | 2.94 | |||||
| Forfeited or canceled | (461,509 | ) | $ | 3.92 | |||||
| Outstanding at December 31, 2017 | 111,111 | $ | 5.33 | 0.25 | |||||
| For the three months ended | For the nine months ended | |||||||||||||||
| December 31, | December 31, | |||||||||||||||
| 2017 | 2016 | 2017 | 2016 | |||||||||||||
| Revenues | $ | — | $ | — | $ | — | $ | 20,375 | ||||||||
| Income from operations | $ | — | $ | — | $ | — | $ | 120 | ||||||||
Other current assets consist of the following (dollars in thousands):
| December 31, 2017 | March 31, 2017 | |||||||
| Prepaid expenses and other | $ | 28,246 | $ | 25,714 | ||||
| Escrow deposit | — | 5,880 | ||||||
| Note receivable | — | 4,000 | ||||||
| Assets of non-qualified retirement plan | 14,111 | 12,716 | ||||||
| Other current assets | $ | 42,357 | $ | 48,310 | ||||
| December 31, 2023 | March 31, 2023 | |||||||||||||
| Prepaid expenses and other | $ | 24,254 | $ | 18,918 | ||||||||||
| Assets of non-qualified retirement plan | 13,672 | 12,110 | ||||||||||||
| Other current assets | $ | 37,926 | $ | 31,028 | ||||||||||
Other noncurrent assets consist of the following (dollars in thousands):
| December 31, 2023 | March 31, 2023 | |||||||||||||
| Long-term prepaid revenue share | $ | 5,729 | $ | 9,659 | ||||||||||
| Right-of-use assets (see Note 4) | 25,498 | 24,604 | ||||||||||||
| Deferred tax asset | 1,262 | 1,253 | ||||||||||||
| Deposits | 3,071 | 3,452 | ||||||||||||
| Strategic investments | 2,600 | 1,600 | ||||||||||||
| Other miscellaneous noncurrent assets | 138 | 477 | ||||||||||||
| Other assets, net | $ | 38,298 | $ | 41,045 | ||||||||||
7. PROPERTY AND EQUIPMENT:
Property and equipment is summarized as follows (dollars in thousands):
| December 31, 2023 | March 31, 2023 | |||||||||||||
| Leasehold improvements | $ | 22,882 | $ | 25,262 | ||||||||||
| Data processing equipment | 5,963 | 6,537 | ||||||||||||
| Office furniture and other equipment | 6,280 | 7,594 | ||||||||||||
| 35,125 | 39,393 | |||||||||||||
| Less accumulated depreciation and amortization | (26,923) | (32,308) | ||||||||||||
| Property and equipment, net of accumulated depreciation and amortization | $ | 8,202 | $ | 7,085 | ||||||||||
Depreciation expense on property and equipment was $2.0 million and $3.1 million for the nine months ended December 31, 2023 and 2022, respectively.
22
| December 31, 2017 | March 31, 2017 | |||||||
| Acquired intangible assets, net | $ | 36,183 | $ | 43,884 | ||||
| Deferred data acquisition costs | 982 | 1,116 | ||||||
| Other miscellaneous noncurrent assets | 6,411 | 6,443 | ||||||
| Noncurrent assets | $ | 43,576 | $ | 51,443 | ||||
8. GOODWILL:
Each quarter, the Company considers whether indicators of impairment exist such that additional impairment testing may be necessary. During the quarter ended September 30, 2023, triggering events occurred which required the Company to test the recoverability of goodwill associated with its APAC reporting unit. The triggering event was the restructuring of operations in the APAC region. Accordingly, we tested goodwill for impairment and determined that the fair value of the APAC reporting unit had decreased, resulting in complete impairment of the goodwill amount of $2.9 million.
In order to estimate the fair value of the APAC reporting unit, management utilized a discounted cash flow model, classified in level 3 in the fair value hierarchy, as well as considered market multiples of guideline public companies.
Changes in goodwill for the nine months ended December 31, 2023 were as follows (dollars in thousands):
| Total | ||||||||
| Balance at March 31, 2023 | $ | 363,116 | ||||||
| Impairment | (2,875) | |||||||
| Change in foreign currency translation adjustment | (14) | |||||||
| Balance at December 31, 2023 | $ | 360,227 | ||||||
9. INTANGIBLE ASSETS:
The amounts allocated to intangible assets from acquisitions include developed technology, customer relationships, trade names, and publisher and data supply relationships. The following table shows the amortization activity of intangible assets (dollars in thousands):
| December 31, 2023 | March 31, 2023 | |||||||||||||
| Developed technology, gross | $ | 72,129 | $ | 72,095 | ||||||||||
| Accumulated amortization | (67,964) | (63,658) | ||||||||||||
| Net developed technology | $ | 4,165 | $ | 8,437 | ||||||||||
| Customer relationship/trade name, gross | $ | 34,388 | $ | 34,384 | ||||||||||
| Accumulated amortization | (34,373) | (33,953) | ||||||||||||
| Net customer/trade name | $ | 15 | $ | 431 | ||||||||||
| Publisher/data supply relationships, gross | $ | 16,000 | $ | 16,000 | ||||||||||
| Accumulated amortization | (16,000) | (15,000) | ||||||||||||
| Net publisher/data supply relationships | $ | — | $ | 1,000 | ||||||||||
| Total intangible assets, gross | $ | 122,517 | $ | 122,479 | ||||||||||
| Total accumulated amortization | (118,337) | (112,611) | ||||||||||||
| Total intangible assets, net | $ | 4,180 | $ | 9,868 | ||||||||||
Total amortization expense related to intangible assets was $5.7 million and $13.5 million for the nine months ended December 31, 2023 and 2022, respectively.
23
The following table presents the estimated future amortization expenses related to intangible assets. The amount for fiscal 2024 represents the remaining three months ending March 31, 2024. All other periods represent fiscal years ending March 31 (dollars in thousands).
| Fiscal Year: | Amount | |||||||
| 2024 | $ | 1,181 | ||||||
| 2025 | 2,999 | |||||||
| $ | 4,180 | |||||||
10. OTHER ACCRUED EXPENSES:
Other accrued expenses consist of the following (dollars in thousands):
| December 31, 2023 | March 31, 2023 | |||||||||||||
| Liabilities of non-qualified retirement plan | $ | 13,672 | $ | 12,110 | ||||||||||
| Short-term lease liabilities (see Note 4) | 10,309 | 9,929 | ||||||||||||
| Acuity performance earnout liability (see Note 5) | — | 1,535 | ||||||||||||
| DataFleets consideration holdback (see Note 5) | — | 324 | ||||||||||||
| Rakam consideration holdback | — | 223 | ||||||||||||
| Other miscellaneous accrued expenses | 18,619 | 11,615 | ||||||||||||
| Other accrued expenses | $ | 42,600 | $ | 35,736 | ||||||||||
| December 31, 2017 | March 31, 2017 | |||||||
| Accrued purchase consideration | $ | — | $ | 5,880 | ||||
| Liabilities of non-qualified retirement plan | 14,111 | 12,716 | ||||||
| Other accrued expenses | 39,888 | 41,265 | ||||||
| Other accrued expenses | $ | 53,999 | $ | 59,861 | ||||
Marketing Services | Audience Solutions | Connectivity | Total | |||||||||||||
| Balance at March 31, 2017 | $ | 118,890 | $ | 273,448 | $ | 200,393 | $ | 592,731 | ||||||||
| Arbor adjustment | — | — | (21 | ) | (21 | ) | ||||||||||
| Change in foreign currency translation adjustment | 82 | — | 35 | 117 | ||||||||||||
| Balance at December 31, 2017 | $ | 118,972 | $ | 273,448 | $ | 200,407 | $ | 592,827 | ||||||||
| Marketing Services | Audience Solutions | Connectivity | Total | |||||||||||||
| U.S. | $ | 110,910 | $ | 273,448 | $ | 196,812 | $ | 581,170 | ||||||||
| APAC | 8,062 | — | 3,595 | 11,657 | ||||||||||||
| Balance at December 31, 2017 | $ | 118,972 | $ | 273,448 | $ | 200,407 | $ | 592,827 | ||||||||
| December 31, 2023 | March 31, 2023 | |||||||||||||
| Uncertain tax positions | $ | 25,531 | $ | 23,427 | ||||||||||
| Long-term lease liabilities (see Note 4) | 33,836 | 37,243 | ||||||||||||
| Lease restructuring accruals and related sublease deposits | 4,881 | 5,713 | ||||||||||||
| Deferred tax liabilities | 348 | 298 | ||||||||||||
| Other | 4,903 | 5,117 | ||||||||||||
| Other liabilities | $ | 69,499 | $ | 71,798 | ||||||||||
| December 31, 2017 | March 31, 2017 | |||||||
| Term loan credit agreement | $ | — | $ | 155,000 | ||||
| Revolving credit borrowings | 230,000 | 70,000 | ||||||
| Other debt | 3,881 | 5,612 | ||||||
| Total long-term debt | 233,881 | 230,612 | ||||||
| Less current installments | 1,837 | 39,819 | ||||||
| Less deferred debt financing costs | 4,101 | 1,552 | ||||||
| Long-term debt, excluding current installments and deferred debt financing costs | $ | 227,943 | $ | 189,241 | ||||
Trade accounts receivable are presented net of allowances for doubtful accounts,credit losses, returns and credits of $6.3 million at December 31, 2017 and $6.1 million at March 31, 2017.
uncollectible are charged against the allowance for doubtful accounts. Indicators that there is no reasonable
24
The following table presents information by business segmentsummarizes the Company's activity of allowance for credit losses, returns and credits (dollars in thousands):
| Balance at beginning of period | Additions (reductions) charged to costs and expenses | Other changes | Bad debts written off, net of amounts recovered | Balance at end of period | ||||||||||||||||||||||||||||
| For the nine months ended December 31, 2023 | $ | 9,344 | $ | 307 | $ | 63 | $ | (1,699) | $ | 8,015 | ||||||||||||||||||||||
| For the three months ended | For the nine months ended | |||||||||||||||
| December 31, | December 31, | |||||||||||||||
| 2017 | 2016 | 2017 | 2016 | |||||||||||||
| Revenues: | ||||||||||||||||
| Marketing Services | $ | 94,457 | $ | 101,177 | $ | 280,093 | $ | 316,571 | ||||||||
| Audience Solutions | 84,436 | 83,399 | 238,984 | 235,669 | ||||||||||||
| Connectivity | 55,978 | 38,736 | 153,548 | 103,140 | ||||||||||||
| Total segment revenues | $ | 234,871 | $ | 223,312 | $ | 672,625 | $ | 655,380 | ||||||||
Gross profit(1): | ||||||||||||||||
| Marketing Services | $ | 35,798 | $ | 37,494 | $ | 101,476 | $ | 109,440 | ||||||||
| Audience Solutions | 52,821 | 53,120 | 148,352 | 143,030 | ||||||||||||
| Connectivity | 37,914 | 23,091 | 100,730 | 60,509 | ||||||||||||
| Total segment gross profit | $ | 126,533 | $ | 113,705 | $ | 350,558 | $ | 312,979 | ||||||||
Income from operations(1): | ||||||||||||||||
| Marketing Services | $ | 22,063 | $ | 21,127 | $ | 63,721 | $ | 61,109 | ||||||||
| Audience Solutions | 33,112 | 34,572 | 91,151 | 89,640 | ||||||||||||
| Connectivity | 6,808 | 1,877 | 12,475 | 3,831 | ||||||||||||
| Total segment income from operations | $ | 61,983 | $ | 57,576 | $ | 167,347 | $ | 154,580 | ||||||||
| For the three months ended | For the nine months ended | |||||||||||||||
| December 31, | December 31, | |||||||||||||||
| 2017 | 2016 | 2017 | 2016 | |||||||||||||
| Total segment gross profit | $ | 126,533 | $ | 113,705 | $ | 350,558 | $ | 312,979 | ||||||||
| Less: | ||||||||||||||||
| Purchased intangible asset amortization | 5,971 | 4,621 | 17,958 | 12,588 | ||||||||||||
| Non-cash stock compensation | 1,611 | 2,240 | 4,927 | 4,403 | ||||||||||||
| Gross profit | $ | 118,951 | $ | 106,844 | $ | 327,673 | $ | 295,988 | ||||||||
| Total segment income from operations | $ | 61,983 | $ | 57,576 | $ | 167,347 | $ | 154,580 | ||||||||
| Less: | ||||||||||||||||
| Corporate expenses (principally general and administrative) | 23,862 | 24,184 | 75,582 | 75,342 | ||||||||||||
| Separation and transformation costs included in general and administrative | 5,214 | 4,118 | 17,775 | 5,573 | ||||||||||||
| Gains, losses and other items, net | (41 | ) | 2,111 | 3,521 | 2,725 | |||||||||||
| Purchased intangible asset amortization | 5,971 | 4,621 | 17,958 | 12,588 | ||||||||||||
| Non-cash stock compensation | 15,919 | 13,427 | 46,707 | 33,955 | ||||||||||||
| Income from operations | $ | 11,058 | $ | 9,115 | $ | 5,804 | $ | 24,397 | ||||||||
A reconciliation of the beginning and ending restructuring activityliabilities is shown below for the nine months ended December 31, 2017 (dollars in thousands):
| Associate-related reserves | Lease accruals | Total | ||||||||||
| March 31, 2017 | $ | 2,400 | $ | 4,308 | $ | 6,708 | ||||||
| Restructuring charges and adjustments | 1,476 | 2,068 | 3,544 | |||||||||
| Payments | (2,842 | ) | (1,187 | ) | (4,029 | ) | ||||||
| December 31, 2017 | $ | 1,034 | $ | 5,189 | $ | 6,223 | ||||||
2023. The above balances are included in other accrued expenses and other liabilities on the condensed consolidated balance sheet.
| Employee-related reserves | Lease accruals | Total | ||||||||||||||||||
| Balances at March 31, 2023 | $ | 759 | $ | 4,873 | $ | 5,632 | ||||||||||||||
| Restructuring charges and adjustments | 2,754 | 398 | 3,152 | |||||||||||||||||
| Payments | (1,474) | (1,599) | (3,073) | |||||||||||||||||
| Balances at December 31, 2023 | $ | 2,039 | $ | 3,672 | $ | 5,711 | ||||||||||||||
Employee-related Restructuring Plans
During the nine months ended December 31, 2023, the Company recorded a total of $2.8 million in employee-related restructuring charges and adjustments. The expense included severance and other associate-relatedemployee-related charges of $1.5 million, lease accruals and adjustments of $1.0 million, and leasehold improvement write-offs of $1.1 million.
In fiscal 2023, the Company recorded a total of $7.8 million in employee-related restructuring charges and adjustments. The expense included severance and other employee-related charges primarily in the United States. The fiscal 2018.2023 employee-related restructuring plans were paid out during fiscal 2023 and 2024.
In fiscal 2021, the Company recorded a total of $1.7 million in employee-related restructuring charges and adjustments. The lease accrualsexpense included severance and adjustments of $1.0 million result fromother employee-related charges in the Company's exit from certain leased office facilities.United States and Europe. Of the amount accrued, together with the deferred rent creditsemployee-related charges of $1.4$1.7 million, related to the space, $2.1$0.1 million remained accrued as of December 31, 2017.2023 and are expected to be paid out during fiscal 2024.
Lease-related Impairments and Restructuring Plans
During the nine months ended December 31, 2023, the Company recorded a total of $1.9 million in additional impairment charges and adjustments related to the fiscal 2023 global real estate footprint reduction initiatives. The charges primarily related to the leased office space in San Francisco and were driven by declines in the expected sublease terms and rates available in the market. The impairment charges included impairments of the operating lease ROU assets of $1.7 million, and the associated furniture, equipment, and leasehold improvements of $0.2 million. Additionally, the Company recorded $0.4 million in additional lease-related restructuring charges and adjustments that covered other obligations related to the leased office spaces.
25
In fiscal 2023, the Company initiated a restructuring plan to lower its operating expenses by reducing its global real estate footprint. As part of this plan, we exited a total of eight leased office spaces. Of those, five were located in the United States: one in Boston, one in Philadelphia, one in Phoenix, and two floors of leased office space in San Francisco. The three remaining spaces were located in Europe: one in the Netherlands, one floor of leased office space in London, England, and one floor of leased office space in Paris, France.
Based on a comparison of undiscounted cash flows to the ROU asset group of each exited lease, the Company determined that each of the ROU asset groups was impaired, driven largely by the difference between the existing lease terms and rates on the Company’s leases and the expected sublease terms and rates available in the market. This resulted in impairment charges totaling $24.6 million during the second, third, and fourth quarters of fiscal 2023, reflecting the excess of the ROU asset group book value over its fair value, which was determined based on estimates of future discounted cash flows and is classified as Level 3 in the fair value hierarchy. The lease impairment charges included impairments of the operating lease ROU assets of $20.5 million, and the associated furniture, equipment, and leasehold improvements of $4.1 million. Additionally, the Company recorded $2.9 million in lease-related restructuring charges and adjustments that covered other obligations related to the leased office spaces in San Francisco and Phoenix. Of the combined fiscal 2023 and 2024 lease-related restructuring charges of $3.3 million, $2.2 million remain accrued as of December 31, 2023 and will be satisfied over the remainder of the San Francisco lease term, which continues through April 2029.
In fiscal 2017, the Company recordedmade the strategic decision to exit and sub-lease a total of $8.9 million in restructuring charges and adjustments included in gains, losses and other items, net in the condensed consolidated statement of operations. The expense included severance and other associate-related charges of $3.8 million, lease accruals and adjustments of $3.0 million, and leasehold improvement write-offs of $2.1 million. Of the associate-related accruals of $3.8 million, $0.2 million remained accrued as of December 31, 2017. These costs are expected to be paid out in fiscal 2018. The lease accruals and adjustments of $3.0 million resulted from the Company's exit from certain leased office facilities ($1.5 million) and adjustments to estimates related to the fiscal 2015 lease accruals ($1.5 million). Of the amount accrued for fiscal 2017 lease accruals, $2.3 million remained accrued as of December 31, 2017.
Gains, Losses and Other Items, Net
| Three Months Ended December 31, | Nine Months Ended December 31, | |||||||||||||||||||||||||||||||
| 2023 | 2022 | 2023 | 2022 | |||||||||||||||||||||||||||||
| Employee-related restructuring plan charges | $ | 1,283 | $ | 5,803 | $ | 2,754 | $ | 7,449 | ||||||||||||||||||||||||
| Lease-related restructuring plan charges and adjustments | — | 582 | 398 | 2,637 | ||||||||||||||||||||||||||||
| ROU asset group impairments and adjustments | — | 5,358 | 1,946 | 15,528 | ||||||||||||||||||||||||||||
| Goodwill impairment (see Note 8) | — | — | 2,875 | — | ||||||||||||||||||||||||||||
| Other | 1,219 | — | 1,219 | (21) | ||||||||||||||||||||||||||||
| $ | 2,502 | $ | 11,743 | $ | 9,192 | $ | 25,593 | |||||||||||||||||||||||||
26
| For the three months ended | For the nine months ended | |||||||||||||||
| December 31, | December 31, | |||||||||||||||
| 2017 | 2016 | 2017 | 2016 | |||||||||||||
| Restructuring plan charges and adjustments | $ | (18 | ) | $ | 899 | $ | 3,545 | $ | 2,107 | |||||||
| Gain on disposition of Impact email business | — | (155 | ) | — | (784 | ) | ||||||||||
| Arbor and Circulate acquisition-related costs | — | 1,365 | — | 1,365 | ||||||||||||
| Other | (23 | ) | 2 | (24 | ) | 36 | ||||||||||
| $ | (41 | ) | $ | 2,111 | $ | 3,521 | $ | 2,724 | ||||||||
Legal Matters
The Company is involved in various claims and legal proceedings.proceedings that arise in the ordinary course of business. Management routinely assesses the likelihood of adverse judgments or outcomes to these matters, as well as ranges of probable losses, to the extent losses are reasonably estimable. The Company records accruals for these matters to the extent that management concludes a loss is probable and the financial impact, should an adverse outcome occur, is reasonably estimable. These accruals are reflected in the Company’sCompany's condensed consolidated financial statements.statements and are adjusted to reflect the impacts of negotiations, settlements, rulings, advice of legal counsel, and other information and events pertinent to a particular matter. In management’s opinion, the Company has made appropriate and adequate accruals for these matters, and management believes the probability of a material loss beyond the amounts accrued to be remote. However, the ultimate liability for these matters is uncertain, and if accruals are not adequate, an adverse outcome could have a material effect on the Company’s condensed consolidated financial condition or results of operations. The Company maintains insurance coverage above certain limits. There are currently no matters pending against
Commitments
The following table presents the Company’s purchase commitments at December 31, 2023. Purchase commitments primarily include contractual commitments for the purchase of data, hosting services, software-as-a-service arrangements and leasehold improvements. The table does not include the future payment of liabilities related to uncertain tax positions of $25.5 million as the Company or its subsidiaries foris not able to predict the periods in which the potential exposure is considered material topayments will be made. The amount for 2024 represents the Company’s condensed consolidated financial statements. remaining three months ending March 31, 2024. All other periods represent fiscal years ending March 31 (dollars in thousands):
| For the years ending March 31, | ||||||||||||||||||||||||||||||||||||||||||||
| 2024 | 2025 | 2026 | 2027 | 2028 | Total | |||||||||||||||||||||||||||||||||||||||
| Purchase commitments | $ | 23,774 | $ | 89,013 | $ | 16,660 | $ | 4,085 | $ | 3,375 | $ | 136,907 | ||||||||||||||||||||||||||||||||
15. INCOME TAX:
In determining the quarterly provision for income taxes, the Company makesapplies its best estimate of theestimated annual effective income tax rate expected to be applicableits year-to-date ordinary income or loss and adjusts for discrete tax items in the full fiscal year.period. The estimated annual effective income tax rate for the current fiscal year is impactedprimarily driven by nondeductible stock-based compensation, state income taxes,capitalization of research tax credits, and lossesdevelopment expenditures in foreign jurisdictions. State income taxes are influencedaccordance with Internal Revenue Code ("IRC") Section 174, as modified by the geographicTax Cuts and legal entity mixJobs Act of 2017, and the valuation allowance. Realization of the Company’s U.S.Company's net deferred tax assets is dependent upon its generation of sufficient taxable income of the proper character in future years in appropriate tax jurisdictions to obtain benefit from the reversal of deductible temporary differences as well as net operating loss and tax credit carryforwards. As of December 31, 2023, the diversity of rules among the states. The Company does not recordcontinues to maintain a full valuation allowance on its net deferred tax benefit forassets except in certain foreign losses duejurisdictions.
On August 16, 2022, President Biden signed into law the Inflation Reduction Act of 2022 (the “Act”). Under the Act, share repurchases made after December 31, 2022 are subject to uncertaintya 1% excise tax. In determining the total taxable value of future utilization.
27
16. FAIR VALUE OF FINANCIAL INSTRUMENTS:INSTRUMENTS AND FAIR VALUE MEASUREMENTS:
The following methods and assumptions were used to estimate the fair value of each class ofCompany measures certain financial instruments for which it is practicable to estimate that value.
is determined based upon the present value ofexit price that would be received to sell an asset or paid to transfer a liability in an orderly transaction between market participants, as determined by either the expected cash flows considering expected maturities and using interest rates currently availableprincipal market or the most advantageous market. Inputs used in the valuation techniques to the Company for long-term borrowings with similar terms. At December 31, 2017, the estimatedderive fair value of long-term debt approximates its carrying value.
•Level 1 - quotedQuoted prices in active markets for identical assets or liabilities, liabilities.
•Level 2 - Observable inputs other than Level 1 prices such as quoted prices for similar assets or liabilities; quoted prices in markets with insufficient volume or infrequent transactions (less active markets); or model-derived valuations in which all significant otherinputs are observable inputs and or can be derived principally from or corroborated by observable market data for substantially the full term of the assets or liabilities.
•Level 3 - Unobservable inputs to the valuation methodology that are significant unobservable inputs.to the measurement of fair value of assets or liabilities.
The following table presentsdetails the balancesfair value measurements within the fair value hierarchy of the Company's financial assets and liabilities at December 31, 2023 and March 31, 2023 that are measured at fair value as of December 31, 2017on a recurring basis (dollars in thousands):
| December 31, 2023 | ||||||||||||||||||||||||||
| Cash and Cash Equivalents | Short-Term Investments | Other Current Assets | Total | |||||||||||||||||||||||
| Cash | $ | 28,526 | $ | — | $ | — | $ | 28,526 | ||||||||||||||||||
| Level 1: | ||||||||||||||||||||||||||
| Money market funds | 470,420 | — | — | 470,420 | ||||||||||||||||||||||
| Assets of non-qualified retirement plan | — | — | 13,672 | 13,672 | ||||||||||||||||||||||
| U.S. Treasury securities | — | 24,764 | — | 24,764 | ||||||||||||||||||||||
| Certificates of deposit | — | 7,500 | — | 7,500 | ||||||||||||||||||||||
| Total | $ | 498,946 | $ | 32,264 | $ | 13,672 | $ | 544,882 | ||||||||||||||||||
| March 31, 2023 | ||||||||||||||||||||||||||
| Cash and Cash Equivalents | Short-Term Investments | Other Current Assets | Total | |||||||||||||||||||||||
| Cash | $ | 22,603 | $ | — | $ | — | $ | 22,603 | ||||||||||||||||||
| Level 1: | ||||||||||||||||||||||||||
| Money market funds | 439,853 | — | — | 439,853 | ||||||||||||||||||||||
| Assets of non-qualified retirement plan | — | — | 12,110 | 12,110 | ||||||||||||||||||||||
| U.S. Treasury securities | 1,992 | 25,307 | — | 27,299 | ||||||||||||||||||||||
| Certificates of deposit | — | 7,500 | — | 7,500 | ||||||||||||||||||||||
| Total | $ | 464,448 | $ | 32,807 | $ | 12,110 | $ | 509,365 | ||||||||||||||||||
For certain financial instruments, including accounts receivable and accounts payable, the carrying amounts approximate their fair value due to the relatively short maturity of these balances.
28
| Level 1 | Level 2 | Level 3 | Total | |||||||||||||
| Assets: | ||||||||||||||||
| Other current assets | $ | 14,111 | $ | — | $ | — | $ | 14,111 | ||||||||
| Total assets | $ | 14,111 | $ | — | $ | — | $ | 14,111 | ||||||||
Certain of the Company's non-financial assets were measured at fair value on a nonrecurring basis during the nine months ended December 31, 2023, and 2022, respectively, including property and equipment and right-of-use assets that were reduced to fair value when they were impaired as a result of the Company's lease-related restructuring plans and goodwill that was reduced to fair value related to the restructuring of operations in the APAC region. For additional information on the Company's fair value measurement in connection with the impairment of certain property and equipment and right-of-use assets associated with office facilities, see Note 4 and Note 7. For additional information on the Company's fair value measurement in connection with the impairment of goodwill, see Note 8.
17. SUBSEQUENT EVENT:
On January 31, 2024, the Company completed the acquisition of Habu, Inc. ("Habu"), a data clean room software provider that works with global brands and companies to securely share first-party customer data with business partners and publishers to enable more effective and personalized marketing, for approximately $174 million in cash. The aggregate value of merger consideration with respect to assumed unvested stock options and consideration holdback amounts under holdback agreements with certain key employees is expected to equal approximately $26 million and will be reported as non-cash stock compensation over the applicable vesting periods. In connection with the acquisition, the Company assumed approximately $16 million of unvested restricted stock units to induce certain employees of Habu to accept employment with the Company.
The initial accounting for this acquisition is incomplete due to the timing of the acquisition, including the disclosure of the major classes of assets acquired and liabilities assumed and supplemental pro forma disclosures.
29
Item 2. Management’s Discussion and Analysis of Financial Condition and Results of Operations
Introduction and Overview
Operating SegmentsSegment
The Company operates as one operating segment. An operating segment is defined as a component of an enterprise for which separate financial information is evaluated regularly by the chief operating decision maker. Our chief operating segments provide managementdecision maker evaluates our financial information and resources and assesses the performance of these resources on a consolidated basis. Since we operate as one operating segment, all required financial segment information can be found in the condensed consolidated financial statements.
Sources of Revenues
LiveRamp recognizes revenue from the following sources: (i) Subscription revenue,which consists primarily of subscription fees from customers accessing our platform; and (ii) Marketplace and Other revenue, which primarily consists of revenue-sharing fees generated from data transactions through our LiveRamp Data Marketplace, transactional usage-based revenue from arrangements with a comprehensive viewcertain publishers and addressable TV providers, and professional services.
LiveRamp Data Collaboration Platform
As depicted in the graphic below, we power the industry’s leading enterprise platform for data collaboration. We enable organizations to access and leverage data more effectively across the applications they use to interact with their customers. At the core of our key businesses based on how we manage our operationsplatform is an omnichannel, deterministic identity resolution technology that offers unparalleled accuracy, breadth, and measure results. Additional information relateddepth. Leveraging deep expertise in data collaboration, the LiveRamp Data Collaboration platform (formerly branded as Safe Haven) enables an organization to our operating segmentsunify customer and geographic information is contained in Note 10 - Segment Information of the Notes to Condensed Consolidated Financial Statements.
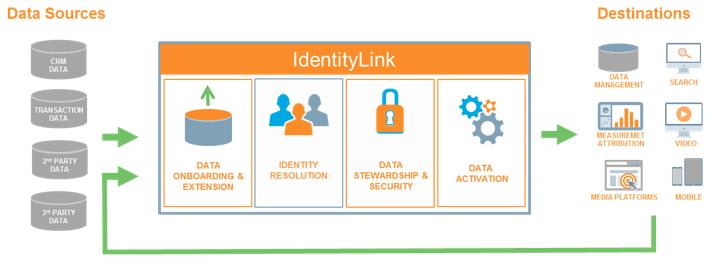
•Data Collaboration. We enable second-party data collaboration between organizations and their trusted partners in a neutral, manageable environment. Our platform provides customers with collaborative opportunities to safely and securely build a more accurate, dynamic view of their customers leveraging partner data. Advanced measurement and analytics use cases can be performed on this shared data without either party giving up control or compromising privacy.
30
•Activation. We enable organizations to leverage their customer and prospect data in the digital and TV ecosystems and across the customer experience applications they use through a safe and secure data matching process called data onboarding. Our technology ingests a customer’s first-party data, removes all offline data (directly identifiable information or "DII"), and replaces them with pseudonymized IDs called RampID™, a durable identifier for connecting to the digital ecosystem. RampID can then be distributed through direct integrations to the top platforms our customers work with, including leading marketing cloud providers, publishers and social networks, personalization tools, and connected TV services.
•Measurement & Analytics. We power more accurate, more complete measurement with the measurement vendors and partners our customers use. Our platform allows our customers to combine disparate data files (typically ad exposure and customer events, such as transactions), replacing customer identifiers with RampID. Our customers then can use that aggregated view of each customer for measurement of reach and frequency, sales lift, closed loop offline to online conversion and cross-channel attribution.
•Identity. We provide enterprise-level identity solutions that enable organizations to: 1) resolve and connect disparate identities, 2) enrich data sets with hygiene capabilities and additional audience data from the LiveRamp Data Marketplace providers, and 3) translate data between different systems. Our approach to identity is built from two complementary graphs, combining offline data and online data and providing accuracy with a focus on privacy. LiveRamp technology for DII gives brands and platforms the ability to connect and update what they know about consumers, resolving DII across enterprise databases and systems to deliver better customer experiences. Our digital identity graph powered by our Authenticated Traffic Solution (or "ATS") associates pseudonymous device IDs, TV IDs and other online customer IDs from premium publishers, platforms or data providers, around a RampID. This allows marketers to perform personalized segmentation, targeting, personalization and measurement in use cases.cases that require a consistent view of the user. There are currently more than 165 supply-side platforms and demand-side platforms live or committed to bid on RampID or ATS. In addition, to date more than 18,000 publisher domains, and 70% of the comScore 100 largest digital publishers, have adopted ATS.
•Data Marketplace. Our Data Marketplace provides customers with simplified access to industry-leading third-party data providers globally. The LiveRamp Data Collaboration Platform allows for the search, discovery and distribution of data from data providers to improve targeting, measurement, and customer intelligence. Our customers may license data through the LiveRamp Data Marketplace and connect via RampID to enrich their first-party data, leveraging across technology and media platforms, agencies, analytics environments, and TV partners. Our platform provides tools for data providers to manage the organization, distribution, and operation of their data and services across our network of customers and partners. Today we work with approximately 200 data providers across all verticals and many data types (see below for discussion on Marketplace and Other).
31
 |  |  |

Subscription
We primarily charge for our platform services on an Acxiom SafeHaven® certified environment with technical, operational,annual basis. Our subscription pricing is based primarily on data volume, which is a function of data input records and personnel controls designed to ensure our clients’ data is kept private and secure.connection points.
32
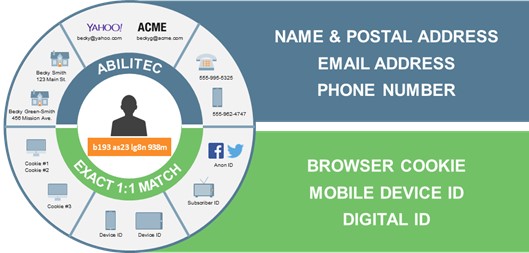
Marketplace and Other
As we have scaled the LiveRamp network and technology, we have found additional ways to leverage our platform, deliver more effectivevalue to customers and create incremental revenue streams. Leveraging our common identity system and broad integration network, the Data Marketplace seamlessly connects data sellers’ audience targeting and deliver better, more relevant customer experiences.
We generate revenue from the Data Marketplace primarily through revenue-sharing arrangements with data sellers that are monetizing their data assets power best-in-class consumer identificationvia our marketplace platform service. We also generate Marketplace and linking across channelsOther revenue through transactional usage-based arrangements with certain publishers and devices. And,addressable TV providers.
To complement our integratedproduct offering, we provide professional services and enhanced support entitlements to help customers leverage our platform and drive business outcomes. Our services offering provides the expertise requiredincludes product implementation, data science analytics, audience measurement and general advisory.We generate revenue from services primarily from project fees paid by subscribers to manage large setsour platform. Service projects are sold on an ad hoc basis as well as bundled with platform subscriptions. Services revenue is less than 5% of data legally, ethically, securely, and in a way that protects consumer privacy.total Company revenue.
33
Summary Results and Notable Events
A financial summary of the quarter ended December 31, 20172023 compared to the same period in fiscal 2023 is presented below:
•Revenues were $234.9$173.9 million, a 5.2%9.6% increase from $223.3 million in the same quarter a year ago.$158.6 million.
•Cost of revenue was $115.9$44.9 million, a 0.5% decrease3.8% increase from $116.5 million in the same quarter a year ago.$43.3 million.
•Gross margin increased to 50.6%74.2% from 47.8% in the same quarter a year ago.72.7%.
•Total operating expenses were $107.9$113.7 million, a 10.4% increasean 18.3% decrease from $97.7 million in the same quarter a year ago.$139.3 million.
•Cost of revenue and operating expenses for the quarters ended December 31, 2017fiscal 2024 and 2016 include2023 included the following items:
◦Non-cash stock compensation of $17.5 million and $29.6 million, respectively (cost of revenue of $0.8 million and $1.2 million, respectively, and operating expenses of $16.7 million and $28.4 million, respectively)
◦Purchased intangible asset amortization of $1.2 million and $4.2 million, respectively (cost of revenue)
◦Transformation costs of $1.9 million in fiscal 2023 (general and administrative)
◦Restructuring charges of $2.5 million and $11.7 million, respectively (gains, losses, and other items, net)
•Total other income, net was $6.6 million, an increase of $7.3 million from total other expense, net of $0.7 million.
•Net earnings increased to $22.9were $14.0 million, or $0.28$0.21 per diluted share compared to net earningsloss of $1.1$29.7 million, or $0.01$0.46 per diluted share in the same quarter a year ago. The increase is primarily due to recent changes as a result of the Tax Act, including a $20.3 million one-time benefit for the remeasurement of net deferred tax liabilities.share.
•Net cash provided by operating activities of $43.6was $16.6 million a $5.3 million decrease compared to $48.9 million in the same quarter a year ago.$15.8 million.
•The Company repurchased 0.70.3 million shares of its common stock for $19.7$10.0 million compared to 2.3 million shares for $49.9 million under the Company's common stock repurchase program.
This summary highlightsand the following discussion and analysis highlight financial results as well as other significant events and transactions of the Company during the fiscal quarter ended December 31, 2017.2023 compared to the same period in fiscal 2023, unless otherwise stated. However, this summary is not intended to be a full discussion of the Company’sCompany's results. This summary should be read in conjunction with the following discussion of Results of Operations and Capital Resources and Liquidity and with the Company’sCompany's condensed consolidated financial statements and footnotes accompanying this report.
Recent Development
On January 31, 2024, the Company completed the acquisition of Habu, Inc. ("Habu"), a data clean room software provider that works with global brands and companies to securely share first-party customer data with business partners and publishers to enable more effective and personalized marketing, for approximately $174 million in cash. The aggregate value of merger consideration with respect to assumed unvested stock options and consideration holdback amounts under holdback agreements with certain key employees is expected to equal approximately $26 million and will be reported as non-cash stock compensation over the applicable vesting periods. In connection with the acquisition, the Company assumed approximately $16 million of unvested restricted stock units to induce certain employees of Habu to accept employment with the Company.
34
Key Performance Metrics
In addition to measures of financial performance presented in our condensed consolidated financial statements, we monitor the key metrics set forth below to help us evaluate revenue growth trends, establish budgets and measure the effectiveness of our sales and marketing efforts. The below data is presented in millions, except for percentages.
| % Change | ||||||||||||||||||||||||||||||||
| December 31, 2023 | December 31, 2022 | December 31, 2023 from December 31, 2022 | December 31, 2022 from December 31, 2021 | |||||||||||||||||||||||||||||
| Subscription net retention | 101 | % | 101 | % | — | % | (8.2) | % | ||||||||||||||||||||||||
| Annualized recurring revenue | $ | 446.9 | $ | 421.8 | 6.0 | % | 10.6 | % | ||||||||||||||||||||||||
| Remaining performance obligation | $ | 546.2 | $ | 405.7 | 34.6 | % | 6.8 | % | ||||||||||||||||||||||||
| Current remaining performance obligation | $ | 382.4 | $ | 324.4 | 17.9 | % | 12.1 | % | ||||||||||||||||||||||||
| Subscription CRPO | $ | 339.3 | $ | 295.0 | 15.0 | % | 11.8 | % | ||||||||||||||||||||||||
Subscription Net Retention
Subscription net retention (“SNR”) is defined as the current quarter subscription revenue (net) from customers who have been on our platform for one year or more, divided by the prior year quarter subscription revenue (net), inclusive of upsell, churn (lost contract), downsell (contract reduction), and variable revenue changes. SNR excludes revenue from new customers that have not been on our platform for one year or more. We believe our SNR is an important metric that provides insight into the long-term value of our subscription agreements and our ability to retain and grow revenue from our subscription customer base. SNR rate is an operational metric and there is no comparable GAAP financial measure to which we can reconcile this particular key metric.
SNR at December 31, 2023 compared to December 31, 2022 was flat. Increasing levels of downsell and churn activity continue to substantially offset customer upsell revenue. The levels of downsell and churn activity were driven in part by budget and economic pressures on our customers.
Annualized Recurring Revenue
Annualized Recurring Revenue (“ARR”) is defined as the last month of quarter recurring revenue annualized. Recurring revenue is fixed and contracted subscription revenue and does not include any variable or non-recurring revenue amounts. We believe ARR provides important information about our future revenue potential, our ability to acquire new customers, and our ability to maintain and expand our relationship with existing customers. ARR is not a forecast of future revenue, which can be impacted by contract start and end dates and renewal rates. ARR should be viewed independently of revenue and deferred revenue as ARR is an operating metric and is not intended to be combined with or replace these items. Our use of ARR has limitations as an analytical tool, and investors should not consider it in isolation. Other companies in our industry may calculate ARR differently, which reduces its usefulness as a comparative measure.
Our ARR growth of 6.0% was primarily attributable to new customer revenue. The lower growth rate compared to the 10.6% growth in the previous year is due to similar reasons as those impacting SNR results, namely downsell and churn from customers, due in part to budget pressures, offsetting existing customer upsell activity in the current period as well as lower contribution from new customer activity.
Remaining Performance Obligations and Current Remaining Performance Obligations
Remaining performance obligations (“RPO”) is defined as all future revenue under contract that has not yet been recognized as revenue. Future invoicing is determined to be certain when we have an executed non-cancellable contract or a significant penalty that is due upon cancellation, and invoicing is not dependent on a future event such as the delivery of a specific new product or feature, or the achievement of contractual contingencies. Current RPO
35
("CRPO") represents RPO to be recognized over the next twelve months. Subscription CRPO represents CRPO associated with subscription-only RPO to be recognized over the next twelve months.
While the Company believes RPO, CRPO, and Subscription CRPO are leading indicators of revenue as they represent sales activity not yet recognized in revenue, they are not necessarily indicative of future revenue growth as they are influenced by several factors, including seasonality of contract renewal timing and average contract terms. The Company monitors RPO, CRPO, and Subscription CRPO to manage the business and evaluate performance. RPO increased due to several large, multi-year renewals. CRPO and Subscription CRPO growth was due to new customer additions, as well as the multi-year renewals.
36
Results of Operations
A summary of selected financial information for each of the periods reported is presented below (dollars in thousands, except per share amounts):
| For the three months ended | For the nine months ended | |||||||||||||||||||||
| December 31, | December 31, | |||||||||||||||||||||
| % | % | |||||||||||||||||||||
| 2017 | 2016 | Change | 2017 | 2016 | Change | |||||||||||||||||
| Revenues | $ | 234,871 | $ | 223,312 | 5 | $ | 672,625 | $ | 655,380 | 3 | ||||||||||||
| Cost of revenue | 115,920 | 116,468 | (1 | ) | 344,952 | 359,392 | (4 | ) | ||||||||||||||
| Gross profit | 118,951 | 106,844 | 11 | 327,673 | 295,988 | 11 | ||||||||||||||||
| Total operating expenses | 107,893 | 97,729 | 10 | 321,869 | 271,591 | 19 | ||||||||||||||||
| Income from operations | 11,058 | 9,115 | 21 | 5,804 | 24,397 | (76 | ) | |||||||||||||||
| Net earnings | 22,941 | 1,073 | 2,038 | 18,305 | 12,189 | 50 | ||||||||||||||||
| Diluted earnings per share | $ | 0.28 | $ | 0.01 | 2,700 | $ | 0.22 | $ | 0.15 | 47 | ||||||||||||
| For the three months ended | For the nine months ended | |||||||||||||||||||||||||||||||||||||
| December 31, | December 31, | |||||||||||||||||||||||||||||||||||||
| % | % | |||||||||||||||||||||||||||||||||||||
| 2023 | 2022 | Change | 2023 | 2022 | Change | |||||||||||||||||||||||||||||||||
| Revenues | $ | 173,869 | $ | 158,615 | 10 | $ | 487,809 | $ | 447,957 | 9 | ||||||||||||||||||||||||||||
| Cost of revenue | 44,934 | 43,287 | 4 | 131,767 | 126,612 | 4 | ||||||||||||||||||||||||||||||||
| Gross profit | 128,935 | 115,328 | 12 | 356,042 | 321,345 | 11 | ||||||||||||||||||||||||||||||||
| Total operating expenses | 113,734 | 139,277 | (18) | 330,363 | 400,018 | (17) | ||||||||||||||||||||||||||||||||
| Income (loss) from operations | 15,201 | (23,949) | 163 | 25,679 | (78,673) | 133 | ||||||||||||||||||||||||||||||||
| Total other income (expense), net | $ | 6,607 | $ | (736) | NA | 17,887 | 2,211 | NA | ||||||||||||||||||||||||||||||
| Net earnings (loss) from continuing operations | $ | 13,379 | $ | (30,520) | 144 | $ | 16,269 | $ | (88,174) | 118 | ||||||||||||||||||||||||||||
| Diluted earnings (loss) per share | $ | 0.21 | $ | (0.46) | 145 | $ | 0.25 | $ | (1.31) | 119 | ||||||||||||||||||||||||||||
Revenues
The Company's revenues by reporting segment for each of the periods reported is presented below (dollars in thousands):
| For the three months ended | For the nine months ended | |||||||||||||||||||||
| December 31, | December 31, | |||||||||||||||||||||
| % | % | |||||||||||||||||||||
| Revenues | 2017 | 2016 | Change | 2017 | 2016 | Change | ||||||||||||||||
| Marketing Services | $ | 94,457 | $ | 101,177 | (7 | ) | $ | 280,093 | $ | 316,571 | (12 | ) | ||||||||||
| Audience Solutions | 84,436 | 83,399 | 1 | 238,984 | 235,669 | 1 | ||||||||||||||||
| Connectivity | 55,978 | 38,736 | 45 | 153,548 | 103,140 | 49 | ||||||||||||||||
| Total revenues | $ | 234,871 | $ | 223,312 | 5 | $ | 672,625 | $ | 655,380 | 3 | ||||||||||||
| For the three months ended | For the nine months ended | |||||||||||||||||||||||||||||||||||||
| December 31, | December 31, | |||||||||||||||||||||||||||||||||||||
| % | % | |||||||||||||||||||||||||||||||||||||
| 2023 | 2022 | Change | 2023 | 2022 | Change | |||||||||||||||||||||||||||||||||
| Revenues: | ||||||||||||||||||||||||||||||||||||||
| Subscription | $ | 132,351 | $ | 126,427 | 5 | $ | 379,938 | $ | 361,862 | 5 | ||||||||||||||||||||||||||||
| Marketplace and Other | 41,518 | 32,188 | 29 | 107,871 | 86,095 | 25 | ||||||||||||||||||||||||||||||||
| Total revenues | $ | 173,869 | $ | 158,615 | 10 | $ | 487,809 | $ | 447,957 | 9 | ||||||||||||||||||||||||||||
Total revenues were $234.9 million, an increase of 5.2%, or $11.6 million, from $223.3 million in the same quarter a year ago. Strong revenue growth in Connectivity ($17.2 million) was partially offset by a decline in MS of $6.7 million due to non-recurring transactions in the prior year of $4.8 million as well as volume and contract reductions. The impact of exchange rates was positive by approximately $1.5 million.
37
Cost of revenueRevenue and Gross profitProfit
The Company’s cost of revenue and gross profit for each of the periods reported is presented below (dollars in thousands):
| For the three months ended | For the nine months ended | |||||||||||||||||||||
| December 31, | December 31, | |||||||||||||||||||||
| % | % | |||||||||||||||||||||
| 2017 | 2016 | Change | 2017 | 2016 | Change | |||||||||||||||||
| Cost of revenue | $ | 115,920 | $ | 116,468 | (1 | ) | $ | 344,952 | $ | 359,392 | (4 | ) | ||||||||||
| Gross profit | $ | 118,951 | $ | 106,844 | 11 | $ | 327,673 | $ | 295,988 | 11 | ||||||||||||
| Gross margin % | 50.6 | 47.8 | 6 | 48.7 | 45.2 | 8 | ||||||||||||||||
| For the three months ended | For the nine months ended | |||||||||||||||||||||||||||||||||||||
| December 31, | December 31, | |||||||||||||||||||||||||||||||||||||
| % | % | |||||||||||||||||||||||||||||||||||||
| 2023 | 2022 | Change | 2023 | 2022 | Change | |||||||||||||||||||||||||||||||||
| Cost of revenue | $ | 44,934 | $ | 43,287 | 4 | $ | 131,767 | $ | 126,612 | 4 | ||||||||||||||||||||||||||||
| Gross profit | $ | 128,935 | $ | 115,328 | 12 | $ | 356,042 | $ | 321,345 | 11 | ||||||||||||||||||||||||||||
| Gross margin (%) | 74.2 | % | 72.7 | % | 2 | 73.0 | % | 71.7 | % | 2 | ||||||||||||||||||||||||||||
Cost of revenue: Includes allrevenue includes third-party direct costs of sales such asincluding identity graph data, other data and other third-partycloud-based hosting costs, directly associated with revenue.as well as costs of IT, security and product operations functions. Cost of revenue also includes expenses for each of the Company’s operations functions including client services, account management, agency, strategy and analytics, IT, data acquisition, and product operations. Finally, cost of revenue includes amortization of internally developed software and other acquisition relatedacquisition-related intangibles.
Cost of revenue was $115.9$44.9 million for the quarter ended December 31, 2017,2023, a $0.5$1.6 million, or 0.5%3.8%, decreaseincrease from the same quarter a year ago. Gross margins increased to 50.6% compared to 47.8%74.2% from 72.7% in the prior year. The gross margin increase isyear quarter due to the Connectivity revenue increases and MSa $3.0 million decrease in intangible asset amortization offset partially by an increase in cost efficiencies.of revenue primarily from services support costs. U.S. gross margins increased to 51.7% in the current year76.4% from 49.0% in the prior year again due to the Connectivity revenue growth and MS efficiencies.74.2% while International gross margins increaseddecreased to 40.3%39.6% from 35.8%51.6%.
Cost of revenue was $345.0$131.8 million for the nine months ended December 31, 2017,2023, a $14.4$5.2 million, or 4.0%4.1%, decreaseincrease from the same period a year ago, due primarily to the disposition of Acxiom Impact ($18.2 million).ago. Gross margins increased to 48.7% compared to 45.2%73.0% from 71.7% in the prior year. The gross margin increase isyear due to the Connectivity revenue increases and MSa $7.8 million decrease in intangible amortization offset partially by an increase in cost efficiencies.of revenue primarily from services support costs. U.S. gross margins increased to 50.0% in the current year75.0% from 46.3% for the same reasons.73.1%, and International gross margins increaseddecreased to 35.2%43.1% from 32.5%53.2%.
Operating Expenses
The Company’s operating expenses for each of the periods reported is presented below (dollars in thousands):
| For the three months ended | For the nine months ended | ||||||||||||||||||||||||||||||||||||||||||||||||||||||||||||||||||||||||||||||||||||||||||||||||||||||||
| December 31, | December 31, | ||||||||||||||||||||||||||||||||||||||||||||||||||||||||||||||||||||||||||||||||||||||||||||||||||||||||
| % | % | ||||||||||||||||||||||||||||||||||||||||||||||||||||||||||||||||||||||||||||||||||||||||||||||||||||||||
| Operating expenses | 2017 | 2016 | Change | 2017 | 2016 | Change | |||||||||||||||||||||||||||||||||||||||||||||||||||||||||||||||||||||||||||||||||||||||||||||||||||
| For the three months ended | For the three months ended | For the nine months ended | |||||||||||||||||||||||||||||||||||||||||||||||||||||||||||||||||||||||||||||||||||||||||||||||||||||||
| December 31, | December 31, | December 31, | |||||||||||||||||||||||||||||||||||||||||||||||||||||||||||||||||||||||||||||||||||||||||||||||||||||||
| % | % | % | |||||||||||||||||||||||||||||||||||||||||||||||||||||||||||||||||||||||||||||||||||||||||||||||||||||||
| 2023 | 2023 | 2022 | Change | 2023 | 2022 | Change | |||||||||||||||||||||||||||||||||||||||||||||||||||||||||||||||||||||||||||||||||||||||||||||||||||
| Operating expenses: | |||||||||||||||||||||||||||||||||||||||||||||||||||||||||||||||||||||||||||||||||||||||||||||||||||||||||
| Research and development | |||||||||||||||||||||||||||||||||||||||||||||||||||||||||||||||||||||||||||||||||||||||||||||||||||||||||
| Research and development | |||||||||||||||||||||||||||||||||||||||||||||||||||||||||||||||||||||||||||||||||||||||||||||||||||||||||
| Research and development | $ | 23,318 | $ | 20,950 | 11 | $ | 70,894 | $ | 58,631 | 21 | |||||||||||||||||||||||||||||||||||||||||||||||||||||||||||||||||||||||||||||||||||||||||||||||
| Sales and marketing | 53,730 | 43,048 | 25 | 152,288 | 118,243 | 29 | |||||||||||||||||||||||||||||||||||||||||||||||||||||||||||||||||||||||||||||||||||||||||||||||||||
| General and administrative | 30,886 | 31,620 | (2 | ) | 95,166 | 91,993 | 3 | ||||||||||||||||||||||||||||||||||||||||||||||||||||||||||||||||||||||||||||||||||||||||||||||||||
| Gains, losses and other items, net | (41 | ) | 2,111 | (102 | ) | 3,521 | 2,724 | 29 | |||||||||||||||||||||||||||||||||||||||||||||||||||||||||||||||||||||||||||||||||||||||||||||||||
| Total operating expenses | $ | 107,893 | $ | 97,729 | 10 | $ | 321,869 | $ | 271,591 | 19 | |||||||||||||||||||||||||||||||||||||||||||||||||||||||||||||||||||||||||||||||||||||||||||||||
Research and development (“R&D”): Includes expense includes operating expenses for the Company’s engineering and product/project management functions supporting research, new development, and related product enhancement.
R&D expenses were $23.3$37.8 million for the quarter ended December 31, 2017, an increase2023, a decrease of $2.4$5.4 million, or 11.3%12.5%, compared to the same quarter a year ago, and are 9.9%21.7% of total revenues compared to 9.4%27.2% in the prior year.same quarter a year ago. The increasedecrease is primarily due primarily to non-cash stockstock-based compensation of $0.6 million,expense (decreased $3.7 million), hosting and Connectivitysoftware expenses (decreased $0.7 million) and AS investments of $1.9 million andprofessional services (decreased $0.4 million, respectively. The increase in non-cash stock compensation is largelymillion). Headcount related to the Arbor and Circulate acquisitions.expenses were approximately flat.
38
R&D expenses were $70.9$106.0 million for the nine months ended December 31, 2017, an increase2023, a decrease of $12.3$30.9 million, or 20.9%22.6%, compared to the same period a year ago, and are 10.5%21.7% of total revenues compared to 8.9%30.6% in the prior year. The increasedecrease is primarily due to stock-based compensation expense (decreased $17.3 million), headcount related costs (employee-related expenses decreased $8.0 million primarily to non-cash stock compensationas a result of $4.0 million,the headcount reduction that occurred in the quarter ended December 31, 2022) and Connectivity and AS investments of $8.8 million and $1.6 million, respectively, offset partially by aprofessional services (decreased $1.3 million). The decrease in MS of $2.8 million related mostlystock-based compensation is primarily due to the U.S. Impact disposition. The increase in non-cash stock compensation is largely relatedprior year-end accelerated vesting of awards that would have otherwise vested over the first six months of fiscal 2024 to the Arbor and Circulate acquisitions.take advantage of cash tax savings opportunities.
Sales and marketing (“S&M”): Includes expense includes operating expenses for the Company’s sales, marketing, and product marketing functions.
S&M expenses were $53.7$46.2 million for the quarter ended December 31, 2017, an increase2023, a decrease of $10.7$1.5 million, or 24.8%3.1%, compared to the same quarter a year ago, and are 22.9%26.6% of total revenues compared to 19.3%30.1% in the prior year.same quarter a year ago. The increasedecrease is primarily due to primarilystock-based compensation expense (decreased $1.8 million) and professional services (decreased $0.4 million), offset partially by an increase in headcount related costs due to non-cash stock compensation of $3.9 million (largely related to the Arbor and Circulate acquisitions), and Connectivity investments of $8.3 million. The increases were partially offset by a decrease in MS ($2.5 million) due primarily to lower variableincentive compensation.
S&M expenses were $152.3$135.2 million for the nine months ended December 31, 2017, an increase2023, a decrease of $34.0$9.7 million, or 28.8%6.7%, compared to the same period a year ago, and are 22.6%27.7% of total revenues compared to 18.0%32.4% in the prior year. The increasedecrease is primarily due to stock-based compensation expense (decreased $5.3 million), professional services (decreased $1.8 million), and administrative expenses (decreased $1.5 million from lower bad debt expense). The decrease in stock-based compensation is primarily to non-cash stock compensation of $11.9 million (largely relateddue to the Arbor and Circulate acquisitions), and Connectivity investmentsprior year-end accelerated vesting of $23.6 million, corporate marketingawards that would have otherwise vested over the first six months of $4.2 million, and AS investmentsfiscal 2024 to take advantage of $2.2 million. The increases were partially offset by a decrease in MS ($7.8 million) due primarily to lower variable compensation.cash tax savings opportunities.
General and administrative (G&A): Represents("G&A") expense represents operating expenses for all corporate functions, includingthe Company's finance, human resources, legal, corporate IT, and theother corporate office.administrative functions.
G&A expenses were $30.9$27.2 million for the quarter ended December 31, 2017,2023, a decrease of $0.7$9.4 million, or 2.3%25.7%, compared to the same quarter a year ago, and are 13.2%15.7% of total revenues compared to 14.2%23.1% in the prior year.same quarter a year ago. The decrease is primarily due primarily to a decreasedecreases in non-cash stockstock-based compensation of $1.5 million, incentive compensation accruals,expense (decreased $6.3 million) and other cost savingstransformation costs (decreased $4.1 million), offset partially by a $1.1 millionan increase in separation and transformation costs.headcount related costs due to incentive compensation.
G&A expenses were $95.2$79.9 million for the nine months ended December 31, 2017, an increase2023, a decrease of $3.2$12.6 million, or 3.4%13.6%, compared to the same period a year ago, and are 14.1%16.4% of total revenues compared to 14.0%20.7% in the prior
year. The increasedecrease is primarily due primarily to a $12.2 million increasedecreases in separationstock-based compensation expense (decreased $10.4 million) and transformation costs (decreased $3.5 million), offset partially by ahigher employee-related expenses due to increased incentive compensation costs. The decrease in non-cash stockstock-based compensation is primarily due to the prior year-end accelerated vesting of $4.5 million, incentive compensation accruals,awards that would have otherwise vested over the first six months of fiscal 2024 to take advantage of cash tax savings opportunities and other cost savings. Prior year non-cash stock compensation costs were impacted by adjustments to increase expected performance levels for certain performance based awards.current period forfeitures.
Gains, losses, and other items, net of $0.0represents restructuring costs and other adjustments.
Gains, losses and other items, net was $2.5 million for the quarter ended December 31, 2017 decreased $2.22023, a decrease of $9.2 million compared to the same quarter a year ago. The current quarter amount includes $1.3 million related to termination benefits for employees whose positions were or will be eliminated and $1.2 million of third party merger costs associated with the Habu acquisition. The prior year quarter amount included $5.9 million in lease impairments and restructuring and $5.8 million related to termination benefits for employees whose positions were eliminated.
Gains, losses and other items, net of $3.5was $9.2 million for the nine months ended December 31, 2017 increased $0.82023, a decrease of $16.4 million compared to the same period a year ago. The current year amount includes a $2.1$2.8 million charge related to the restructuringimpairment of the Redwood City, California lease and $1.5APAC goodwill, $2.3 million in severancelease impairments and other associate-related charges.restructuring, $2.8 million related to termination benefits for employees whose positions were or will be eliminated, and $1.2 million of third party merger costs associated with the Habu acquisition. The prior year amount included $15.5 million in lease impairments and restructuring, and $7.4 million related to termination benefits for employees whose positions were eliminated.
39
Income (Loss) from Operations and Profit MarginsOperating Margin
| For the three months ended | For the nine months ended | |||||||||||||||
| December 31, | December 31, | |||||||||||||||
| 2017 | 2016 | 2017 | 2016 | |||||||||||||
| Operating income and margin: | ||||||||||||||||
| Marketing Services | $ | 22,063 | $ | 21,127 | $ | 63,721 | $ | 61,109 | ||||||||
| 23.4 | % | 20.9 | % | 22.7 | % | 19.3 | % | |||||||||
| Audience Solutions | 33,112 | 34,572 | 91,151 | 89,640 | ||||||||||||
| 39.2 | % | 41.5 | % | 38.1 | % | 38.0 | % | |||||||||
| Connectivity | 6,808 | 1,877 | 12,475 | 3,831 | ||||||||||||
| 12.2 | % | 4.8 | % | 8.1 | % | 3.7 | % | |||||||||
| Less: | ||||||||||||||||
| Corporate expenses | 23,862 | 24,184 | 75,582 | 75,342 | ||||||||||||
| Purchased intangible asset amortization | 5,971 | 4,621 | 17,958 | 12,588 | ||||||||||||
| Non-cash stock compensation | 15,919 | 13,427 | 46,707 | 33,955 | ||||||||||||
| Restructuring charges | (41 | ) | 2,111 | 3,521 | 2,725 | |||||||||||
| Separation and transformation costs | 5,214 | 4,118 | 17,775 | 5,573 | ||||||||||||
| Income from operations | $ | 11,058 | $ | 9,115 | $ | 5,804 | $ | 24,397 | ||||||||
| Total operating margin | 4.7 | % | 4.1 | % | 0.9 | % | 3.7 | % | ||||||||
Income from operations was $11.1$15.2 million for the quarter ended December 31, 20172023 compared to $9.1a loss from operations of $23.9 million forin the same quarter a year ago. Operating margin was 4.7%positive 8.7% compared to 4.1%negative 15.1%. The increase in income from operations of $1.9 million was due primarily to the increase in Connectivity income from operations, offset partiallyMargins were positively impacted by increases in non-cash stock compensation, largelyrevenue growth, and operating expense reductions related to the Arborprior year headcount reduction, reduced stock-based compensation due to prior year accelerated vesting of awards, and Circulate acquisitions,lower gains, losses and separation and transformation costs.other items.
Income from operations was $5.8$25.7 million for the nine months ended December 31, 20172023 compared to $24.4a loss from operations of $78.7 million forin the same period a year ago. Operating margin was 0.9%positive 5.3% compared to 3.7%. The decrease of $18.6 million was due primarily to increases in non-cash stock compensation, largely related to the Arbor and Circulate acquisitions, and separation and transformation costs, offset partially by increases in operating segments' income from operations.
Total other income from operations was $91.2 million, a 38.1% margin, for the nine months ended December 31, 2017 compared to $89.6 million, a 38.0% margin, for the same period a year ago. U.S. margins decreased to 39.6% in the current period from 39.7% due to the increase in gross profit offset by investments in S&M and R&D. International operating margins increased to 26.3% from 23.5%.
Discontinued Operations
Earnings from discontinued operations, net of tax, was $0.6 million for the same period a year ago. The increase is primarily related to $70 million of borrowings in the third quarter of fiscal year 2017 related to the Arbor and Circulate acquisitions and an increase in the average rate of approximately 81 basis points. On June 20, 2017, the Company refinanced its debt facility to consist of a $600 million revolving credit facility, of which $230 million was outstanding at December 31, 2017.
40
Capital Resources and Liquidity
The Company’s cash isand cash equivalents are primarily located in the United States. Approximately $18.3At December 31, 2023, approximately $18.0 million of the total cash balance of $177.8$498.9 million, or approximately 10.3%3.6%, iswas located outside of the United States. ��The Company has no current plans to repatriate this cash to the United States.
| December 31, 2017 | March 31, 2017 | |||||||
| Numerator – trade accounts receivable, net | $ | 155,634 | $ | 142,768 | ||||
| Denominator: | ||||||||
| Quarter revenue | 234,871 | 224,867 | ||||||
| Number of days in quarter | 92 | 90 | ||||||
| Average daily revenue | $ | 2,553 | $ | 2,499 | ||||
| Days sales outstanding | 61 | 57 | ||||||
Working capital at December 31, 2023 totaled $560.9 million, a $21.2 million increase when compared to $85.2$539.7 million at March 31, 2023.
Subsequent to December 31, 2023, the Company closed its acquisition of Habu, which included the payment of approximately $174 million in the same period a year ago. The $8.8 million decrease resulted primarily from unfavorable changes in working capital. cash at closing.
The following table summarizes our cash flows for the periods reported (dollars in thousands):
| For the nine months ended | ||||||||||||||
| December 31, | ||||||||||||||
| 2023 | 2022 | |||||||||||||
| Net cash provided by operating activities | $ | 78,013 | $ | 3,776 | ||||||||||
| Net cash used in investing activities | $ | (2,099) | $ | (4,693) | ||||||||||
| Net cash used in financing activities | $ | (43,220) | $ | (145,796) | ||||||||||
| Net cash provided by discontinued operations | $ | 985 | $ | 836 | ||||||||||
Operating Activities
Our cash flows from operating activities are primarily influenced by growth in our operations, increases or decreases in collections from our customers, and Commitmentsrelated payments to our suppliers and employees. The timing of cash receipts from customers and payments to suppliers can significantly impact our cash flows from operating activities. Our collection and payment cycles can vary from period to period.
41
In connection with the Acxiom Impact disposition,nine months ended December 31, 2023, net cash provided by operating activities of $78.0 million resulted primarily from net earnings adjusted for non-cash items of $77.2 million and changes in operating assets and liabilities of $0.8 million. Net cash provided by changes in operating assets and liabilities was primarily related to a $29.2 million Internal Revenue Service refund related to fiscal 2021, an increase in deferred revenue of $9.7 million, and an increase in other assets of $8.8 million, offset partially by an increase in accounts receivable of $41.0 million. The change in accounts receivable is primarily due to revenue growth and the timing of cash receipts from customers.
In the nine months ended December 31, 2022, net cash provided by operating activities of $3.8 million resulted primarily from net loss adjusted for non-cash items of $33.6 million offset by changes in operating assets and liabilities of $29.8 million. Net cash used by changes in operating assets and liabilities was primarily related to an increase in accounts receivable of $27.2 million and a decrease in accounts payable and other liabilities of $9.3 million, offset partially by a decrease in income taxes of $7.0 million. The change in accounts receivable is primarily due to revenue growth and the timing of cash receipts from customers. The change in accounts payable and other liabilities is primarily due to the payment of annual incentive compensation and the timing of payments to suppliers.
Investing Activities
Our primary investing activities have historically consisted of capital expenditures. Capital expenditures may vary from period to period due to the timing of the expansion of our operations, the addition of new headcount, new facilities, and acquisitions.
In the nine months ended December 31, 2023, net cash used in investing activities consisted of capital expenditures of $2.5 million, purchases of strategic investments of $1.0 million, and purchases of investments of $24.4 million partially offset by the proceeds from the sale of investments of $25.8 million.
In the nine months ended December 31, 2022, net cash used in investing activities consisted of capital expenditures of $4.6 million and purchases of investments of $3.5 million, offset partially by proceeds from the sale of investments of $3.0 million and the sale of a strategic investment of $0.4 million.
Financing Activities
Our financing activities have consisted of acquisition of treasury stock, proceeds from our equity compensation plans, and shares repurchased for tax withholdings upon vesting of stock-based awards.
In the nine months ended December 31, 2023, net cash used in financing activities was $43.2 million, consisting of the acquisition of treasury shares pursuant to the board of directors' approved stock repurchase plan of $45.3 million (1.7 million shares) and $5.1 million for shares repurchased for tax withholdings upon vesting of stock-based awards. These uses of cash were partially offset by proceeds of $7.2 million from the sale of common stock from our equity compensation plans.
In the nine months ended December 31, 2022, net cash used in financing activities was $145.8 million, consisting of the acquisition of treasury shares pursuant to the board of directors' approved stock repurchase plan of $150.0 million (6.1 million shares), and $2.1 million for shares repurchased for tax withholdings upon vesting of stock-based awards. These uses of cash were partially offset by proceeds of $6.3 million from the sale of common stock from our equity compensation plans.
42
Common Stock Repurchase Program
On December 20, 2022, the Company's board of directors approved an amendment to the existing common stock repurchase program, which was initially adopted in 2011. The amendment authorized an additional $100.0 million in share repurchases, increasing the total amount authorized for repurchase under the common stock repurchase program to $1.1 billion. In addition, it extended the common stock repurchase program duration through December 31, 2024.
During the nine months ended December 31, 2023, the Company assignedrepurchased 1.7 million shares of its common stock for $45.3 million under the modified common stock repurchase program. Through December 31, 2023, the Company had repurchased a facility leasetotal of 37.3 million shares of its common stock for $927.5 million under the program, leaving remaining capacity of $172.5 million.
Pursuant to the buyerInflation Reduction Act of the business. The Company guaranteed the facility lease as required by the asset disposition agreement. Should the assignee default, the Company would be required to perform under the terms of the facility lease, which continues through September 2021. At2022 (the "Act"), share repurchases made after December 31, 2017, the Company's maximum potential future rent payments2022 are subject to this guarantee totaled $2.3 million.a 1% excise tax. In determining the total taxable value of shares repurchased, a deduction is allowed for the fair market value of any newly issued shares during the fiscal year. The excise tax and other corporate income tax changes included in the Act did not have, and are not expected to have, a material impact on our condensed consolidated financial statements.
Contractual Commitments
The following table presentstables present the Company’s contractual cash obligations exclusive of interest, and purchase commitments at December 31, 2017.2023 (dollars in thousands). Operating leases primarily consist of our various office facilities. Purchase commitments primarily include contractual commitments for the purchase of data, hosting services, software-as-a-service arrangements, and leasehold improvements. The table doestables do not include the future payment of liabilities related to uncertain tax positions of $5.1$25.5 million as the Company is not able to predict the periods in which the payments will be made. The amounts for 20182024 represent the remaining three months ending March 31, 2018.2024. All other periods represent fiscal years ending March 31 (dollars in thousands).
| For the years ending March 31, | ||||||||||||||||||||||||||||
| 2018 | 2019 | 2020 | 2021 | 2022 | Thereafter | Total | ||||||||||||||||||||||
| Revolving credit borrowings | $ | — | $ | — | $ | — | $ | — | $ | — | $ | 230,000 | $ | 230,000 | ||||||||||||||
| Other debt | 588 | 1,583 | 1,362 | 348 | — | — | 3,881 | |||||||||||||||||||||
| Total long-term debt | 588 | 1,583 | 1,362 | 348 | — | 230,000 | 233,881 | |||||||||||||||||||||
| Operating leases | 5,113 | 19,447 | 14,537 | 14,181 | 13,839 | 17,393 | 84,510 | |||||||||||||||||||||
| Total contractual cash obligations | $ | 5,701 | $ | 21,030 | $ | 15,899 | $ | 14,529 | $ | 13,839 | $ | 247,393 | $ | 318,391 | ||||||||||||||
| For the years ending March 31, | ||||||||||||||||||||||||||||||||||||||||||||
| 2024 | 2025 | 2026 | 2027 | 2028 | Thereafter | Total | ||||||||||||||||||||||||||||||||||||||
| Operating leases | $ | 2,702 | $ | 9,965 | $ | 8,675 | $ | 8,265 | $ | 8,454 | $ | 12,828 | $ | 50,889 | ||||||||||||||||||||||||||||||
| For the years ending March 31, | ||||||||||||||||||||||||||||
| 2018 | 2019 | 2020 | 2021 | 2022 | Thereafter | Total | ||||||||||||||||||||||
| Total purchase commitments | $ | 13,080 | $ | 22,149 | $ | 16,096 | $ | 8,262 | $ | 1,284 | $ | 338 | $ | 61,209 | ||||||||||||||
| Lease guarantees | $ | 2,260 | |
| Surety bonds | $ | 405 | |
| For the years ending March 31, | ||||||||||||||||||||||||||||||||||||||||||||
| 2024 | 2025 | 2026 | 2027 | 2028 | Total | |||||||||||||||||||||||||||||||||||||||
| Purchase commitments | $ | 23,774 | $ | 89,013 | $ | 16,660 | $ | 4,085 | $ | 3,375 | $ | 136,907 | ||||||||||||||||||||||||||||||||
While the Company does not have any other material contractual commitments for capital expenditures, certain levels of investments in facilities and computer equipment continue to be necessary to support the growth of the business. In some cases, the Company also licenses software and sells hardware to clients. Management believes that the Company’s existing available debt and cash flow from operations will be sufficient to meet the Company’s working capital and capital expenditure requirements for the foreseeable future. The Company also evaluates acquisitions from time to time, which may require up-front payments of cash.
For a description of certain risks that could have an impact on results of operations or financial condition, including liquidity and capital resources, see “Risk Factors” contained in Part I, Item 1A, of the Company’s 2017Company's Annual Report.Report on Form 10-K for the fiscal year ended March 31, 2023 ("2023 Annual Report"), as filed with the SEC on May 24, 2023.
43
Non-U.S. Operations
The Company has a presence in the United Kingdom, France, Germany, Poland,Netherlands, Italy, Spain, Brazil, India, Australia, China, Singapore and Japan. Most of the Company’s exposure to exchange rate fluctuation is due to translation gains and losses as there are no material transactions that cause exchange rate impact. In general, each of the foreign locations is expected to fund its own operations and cash flows, although funds may be loaned or invested from the U.S. to the foreign subsidiaries subject to limitations in the Company’s revolving credit facility.subsidiaries. These advances are considered long-term investments, and any gain or loss resulting from changes in exchange rates as well as gains or losses resulting from translating the foreign financial statements into U.S. dollars are included in accumulated other comprehensive income. ExchangeTherefore, exchange rate movements of foreign currencies may have an impact on the Company’s future costs or on future cash flows from foreign investments. The Company has not entered into any foreign currency forward exchange contracts or other derivative instruments to hedge the effects of adverse fluctuations in foreign currency exchange rates.
Critical Accounting Policies
We prepare our condensed consolidated financial statements in conformity with U.S. GAAP.GAAP as set forth in the FASB ASC, and we consider the various staff accounting bulletins and other applicable guidance issued by the SEC. These accounting principles require management to make certain judgments and assumptions that affect the reported amounts of assets and liabilities and the disclosure of contingent assets and liabilities as of the date of the financial statements and the reported amounts of revenues and expenses during the reporting periods. The consolidated financial statements in the Company’s 20172023 Annual Report include a summary of significant accounting policies used in the preparation of Acxiom’sthe Company’s consolidated financial statements. In addition, the Management’s Discussion and Analysis of Financial Condition and Results of Operations filed as part of the 20172023 Annual Report contains a discussion of the policies that management has identified as the most critical because they require management’s use of complex and/or significant judgments. None of the Company’s critical accounting policies have materially changed since the date of the last annual report.
2023 Annual Report other than as described in the Accounting Pronouncements Adopted Duringduring the Current Year
Recent Accounting Pronouncements
For information on recent accounting standards that have been issuedpronouncements, see “Accounting Pronouncements Adopted During the Current Year" and were adopted during the current fiscal year.
44
Item 3. Quantitative and Qualitative Disclosures aboutAbout Market Risk
We believe there have been no material changes in our market risk exposures for the nine months ended December 31, 2017,2023, as compared with those discussed in ourthe Company's 2023 Annual Report on Form 10-K for the fiscal year ended March 31, 2017.Report.
Item 4. Controls and Procedures
(a) Evaluation of Disclosure Controls and Procedures.
Our management, with the participation of our Chief Executive Officer and President (our principal executive officer) and our Chief Financial Officer and Executive Vice President (our principal financial and accounting officer), evaluated the effectiveness of our disclosure controls and procedures (as defined under Rule 13a-15(e) of the Securities Exchange Act of 1934, as amended)amended (the "Exchange Act")). Based on this evaluation, our principal executive officer and our principal financial and accounting officer concluded that as of December 31, 2017,2023, our disclosure controls and procedures were effective.
(b) Changes in Internal Control over Financial Reporting.
There have been no changes in our internal control over financial reporting (as defined in Rules 13a-15(f) and 15d-15(f) under the Exchange Act) that occurred during the fiscal quarter ended December 31, 20172023 that have materially affected, or are reasonably likely to materially affect, our internal control over financial reporting.
45
PART II. OTHER INFORMATION
Item 1. Legal Proceedings
Item 1A. Risk Factors
The risks described in Part I, Item 1A, “Risk Factors” in ourthe Company's 2023 Annual Report, on Form 10-K for the year ended March 31, 2017, which was filed with the Securities and Exchange Commission on May 26, 2017, remain current in all material respects. ThoseThe risk factors in our 2023 Annual Report do not identify all risks that we face. Our operations could also be affected by factors that are not presently known to us or that we currently consider to be immaterial to our operations. If any of the identified risks or others not specified in our SEC filings materialize, our business, financial condition, or results of operations could be materially adversely affected. In these circumstances, the market price of our common stock could decline.
Item 2. Unregistered Sales of Equity Securities and Use of Proceeds
| Maximum Number (or Approximate | ||||||||||||
| Total Number | Average Price | Total Number of Shares | Dollar Value) of Shares that May Yet | |||||||||
| of Shares | Paid | Purchased as Part of Publicly | Be Purchased Under the | |||||||||
| Period | Purchased | Per Share | Announced Plans or Programs | Plans or Programs | ||||||||
| October 2017 | — | n/a | — | $ | 94,474,907 | |||||||
| November 2017 | 339,883 | 26.54 | 339,883 | 85,455,426 | ||||||||
| December 2017 | 389,081 | 27.36 | 389,081 | 74,809,780 | ||||||||
| Total | 728,964 | 26.98 | 728,964 | $ | 74,809,780 | |||||||
| Period | Total Number of Shares Purchased | Average Price Paid Per Share | Total Number of Shares Purchased as Part of Publicly Announced Plans or Programs | Maximum Number (or Approximate Dollar Value) of Shares that May Yet Be Purchased Under the Plans or Programs | ||||||||||||||||||||||
| October 1, 2023 - October 31, 2023 | 346,761 | $ | 28.84 | 346,761 | $ | 172,502,429 | ||||||||||||||||||||
| November 1, 2023 - November 30, 2023 | — | $ | — | — | $ | 172,502,429 | ||||||||||||||||||||
| December 1, 2023 - December 31, 2023 | — | $ | — | — | $ | 172,502,429 | ||||||||||||||||||||
| Total | 346,761 | $ | 28.84 | 346,761 | ||||||||||||||||||||||
On August 29, 2011, the board of directors adopted a common stock repurchase program. That program was subsequently modified and expanded, most recently on July 28, 2016.December 20, 2022. Under the modified common stock repurchase program, the Company may purchase up to $400.0 million$1.1 billion of its common stock through the period ending June 30, 2018.December 31, 2024. Through December 31, 2017,2023, the Company had repurchased a total of 18.437.3 million shares of its common stock for $325.2$927.5 million, leaving remaining capacity of $74.8$172.5 million under the stock repurchase program.
Item 3. Defaults Upon Senior Securities
Not applicable.
Item 4. Mine Safety Disclosures
Not applicable.
Item 5. Other Information
a. Not applicable.
b. Not applicable.
c. During the three months ended December 31, 2023, none of the Company’s directors or officers (as defined in Rule 16a-1(f) under the Exchange Act) adopted or terminated a Rule 10b5-1 trading arrangement or non-Rule 10b5-1 trading arrangement (as such terms are defined in Item 408 of Regulation S-K).
47
Item 6. Exhibits
The following exhibits are filed with this quarterly report:
| 10.1 | ||||||||
| 31.2 | ||||||||
| 32.1 | ||||||||
| 32.2 | ||||||||
| 101 | ||||||||
The following financial information from our Quarterly Report on Form 10-Q for the quarter ended December 31, | ||||||||
| 104 | Cover Page Interactive Data File (formatted as inline XBRL and contained in Exhibit 101) | |||||||
48
SIGNATURE
Pursuant to the requirements of the Securities Exchange Act of 1934, the Registrant has duly caused this report to be signed on its behalf by the undersigned thereunto duly authorized.
| LIVERAMP HOLDINGS, INC. | ||||||||
| Dated: February 8, 2024 | By: | /s/ Lauren Dillard | ||||||
| (Signature) | ||||||||
| Executive Vice President and Chief Financial Officer | ||||||||
| (principal financial and accounting officer) | ||||||||
49