false--12-31--12-31Q32019000104786200000236322457200000057200000081230000001420000002536600000074000000088610000001830000002619700000080600000096000000002110000001000000000.480.4870000004500000008100000046100000088000000476000000960000000.156900000020000000740000002200000079000000250000000.10000.47140.0960P10YP10Y1130000008400000037000000012200000032600000016700000021660000000717100000022783000000791100000023926000000862200000065000000750000000.0930.093P3YP2YP3Y0.06610.066127500000025000000357000000250000006200000057000000670000006200000050000003000000500000030000000.7150.7150.7150.7150.740.740.740.02940.03460.03730.0382P2Y7.7571.774.110.4523.400.357.7571.772.437.030.4516.200.971.002000000290000003000000103000000800000000.04630.046370000006000000100000010000000.49930.0890.50160.0880.0881990000058000002030000010000002000000100000010000003000000P2Y0.0300.023267000000450000002690000004300000027200000010000000 0001047862 ed:TermLoanMember 2019-02-28
UNITED STATES
SECURITIES AND EXCHANGE COMMISSION
WASHINGTON, D.C. 20549
FORM 10-Q
|
| |
x☒ | Quarterly Report Pursuant To Section 13 or 15(d) of the Securities Exchange Act of 1934 |
FOR THE QUARTERLY PERIOD ENDED SEPTEMBERSeptember 30, 20172019
OR
|
| |
¨☐ | Transition Report Pursuant to Section 13 or 15(d) of the Securities Exchange Act of 1934 |
For the transition period from to
|
| | | | | | | | | | |
Commission File Number | | Exact name of registrant as specified in its charter and principal executive office address and telephone number | | State of Incorporation | | I.R.S. Employer ID. Number |
| 1-14514 | | Consolidated Edison, Inc. | | New York | | 13-3965100 |
| | | 4 Irving Place, | New York, | New York | 10003 | | | | |
| | | (212) | 460-4600 | | | | | | |
| 1-1217 | | Consolidated Edison Company of New York, Inc. | | New York | | 13-5009340 |
| | | 4 Irving Place, | New York, | New York | 10003 | | | | |
| | | (212) | 460-4600 | | | | | | |
Securities Registered Pursuant to Section 12(b) of the Act:
|
| | | | |
| Title of each class | | Trading Symbol | | Name of each exchange on which registered |
| Consolidated Edison, Inc., | | ED | | New York Stock Exchange |
| Common Shares ($.10 par value) | | | | |
Indicate by check mark whether the registrant (1) has filed all reports required to be filed by Section 13 or 15(d) of the Securities Exchange Act of 1934 during the preceding 12 months (or for such shorter period that the registrant was required to file such reports), and (2) has been subject to such filing requirements for the past 90 days.
|
| | | |
| Consolidated Edison, Inc. (Con Edison) | Yesx | ☒ | No¨☐ |
| Consolidated Edison Company of New York, Inc. (CECONY) | Yesx | ☒ | No¨☐ |
Indicate by check mark whether the registrant has submitted electronically and posted on its corporate Web site, if any, every Interactive Data File required to be submitted and posted pursuant to Rule 405 of Regulation S-T (§232.405 of this chapter) during the preceding 12 months (or for such shorter period that the registrant was required to submit and post such files).
|
| | | |
| Con Edison | Yesx | ☒ | No¨☐ |
| CECONY | Yesx | ☒ | No¨☐ |
Indicate by check mark whether the registrant is a large accelerated filer, an accelerated filer, a non-accelerated filer, smaller reporting company, or an emerging growth company. See the definitions of “large accelerated filer”, “accelerated filer,” “smaller reporting company,” and "emerging growth company" in Rule 12b-2 of the Exchange Act.
|
| | | | | | |
| Con Edison |
Large accelerated filerx | ☒ | | Accelerated filer☐
| Accelerated filer¨
| Non-accelerated filer¨ | ☐ |
Smaller reporting company¨ | ☐ | Emerging growth company¨ | ☐ | | |
| CECONY |
Large accelerated filer¨ | ☐ | | Accelerated filer¨☐ | | Non-accelerated filerx | ☒ |
Smaller reporting company¨ | ☐ | Emerging growth company¨ | ☐ | | |
If an emerging growth company, indicate by check mark if the registrant has elected not to use the extended transition period for complying with any new or revised financial accounting standards provided pursuant to Section 13(a) of the Exchange Act. ¨
Indicate by check mark whether the registrant is a shell company (as defined in Rule 12b-2 of the Exchange Act).
|
| | | | |
| Con Edison | Yes¨ | ☐ | Nox | ☒ |
| CECONY | Yes¨ | ☐ | Nox | ☒ |
As of October 31, 2017,2019, Con Edison had outstanding 310,068,797332,430,408 Common Shares ($.10 par value). All of the outstanding common equity of CECONY is held by Con Edison.
Filing Format
This Quarterly Report on Form 10-Q is a combined report being filed separately by two different registrants: Consolidated Edison, Inc. (Con Edison) and Consolidated Edison Company of New York, Inc. (CECONY). CECONY is a wholly-owned subsidiary of Con Edison and, as such, the information in this report about CECONY also applies to Con Edison. As used in this report, the term the “Companies” refers to Con Edison and CECONY. However, CECONY makes no representation as to the information contained in this report relating to Con Edison or the subsidiaries of Con Edison other than itself.
Glossary of Terms
The following is a glossary of abbreviations or acronyms that are used in the Companies’ SEC reports:
|
| | |
| Con Edison Companies |
| Con Edison | | Consolidated Edison, Inc. |
| CECONY | | Consolidated Edison Company of New York, Inc. |
| Clean Energy Businesses | | Con Edison Clean Energy Businesses, Inc., together with its subsidiaries |
| Con Edison Development | | Consolidated Edison Development, Inc. |
| Con Edison Energy | | Consolidated Edison Energy, Inc. |
| Con Edison Solutions | | Consolidated Edison Solutions, Inc. |
| Con Edison Transmission | | Con Edison Transmission, Inc., together with its subsidiaries |
| CET Electric | | Consolidated Edison Transmission, LLC |
| CET Gas | | Con Edison Gas Pipeline and Storage, LLC |
| O&R | | Orange and Rockland Utilities, Inc. |
| RECO | | Rockland Electric Company |
| The Companies | | Con Edison and CECONY |
| The Utilities | | CECONY and O&R |
| |
| Regulatory Agencies, Government Agencies and Other Organizations |
| CPUC | | California Public Utilities Commission |
| EPA | | U.S. Environmental Protection Agency |
| FASB | | Financial Accounting Standards Board |
| FERC | | Federal Energy Regulatory Commission |
| IASB | | International Accounting Standards Board |
| IRS | | Internal Revenue Service |
| NJBPU | | New Jersey Board of Public Utilities |
| NJDEP | | New Jersey Department of Environmental Protection |
| NYISO | | New York Independent System Operator |
| NYPA | | New York Power Authority |
| NYSDEC | | New York State Department of Environmental Conservation |
| NYSERDA | | New York State Energy Research and Development Authority |
| NYSPSC | | New York State Public Service Commission |
| NYSRC | | New York State Reliability Council, LLC |
| PJM | | PJM Interconnection LLC |
| SEC | | U.S. Securities and Exchange Commission |
| | |
| Accounting | | |
| AFUDC | | Allowance for funds used during construction |
| ASU | | Accounting Standards Update |
| GAAP | | Generally Accepted Accounting Principles in the United States of America |
| HLBV | | Hypothetical liquidation at book value |
| OCI | | Other Comprehensive Income |
| VIE | | Variable Interest Entity |
|
| | |
| Environmental | | |
| CO2 | | Carbon dioxide |
| GHG | | Greenhouse gases |
| MGP Sites | | Manufactured gas plant sites |
| PCBs | | Polychlorinated biphenyls |
| PRP | | Potentially responsible party |
| RGGI | | Regional Greenhouse Gas Initiative |
| Superfund | | Federal Comprehensive Environmental Response, Compensation and Liability Act of 1980 and similar state statutes |
| | | |
| Units of Measure | | |
| AC | | Alternating current |
| Bcf | | Billion cubic feet |
| Dt | | Dekatherms |
| kV | | Kilovolt |
| kWh | | Kilowatt-hour |
| MDt | | Thousand dekatherms |
| MMlb | | Million pounds |
| MVA | | Megavolt ampere |
| MW | | Megawatt or thousand kilowatts |
| MWh | | Megawatt hour |
| | | |
| Other | | |
| AMI | | Advanced metering infrastructure |
| COSO | | Committee of Sponsoring Organizations of the Treadway Commission |
| DER | | Distributed energy resources |
EGWP | | Employer Group Waiver Plan |
| Fitch | | Fitch Ratings |
| First Quarter Form 10-Q | | The Companies' combined Quarterly Report on Form 10-Q for the quarterly period ended March 31 of the current year |
| Second Quarter Form 10-Q | | The Companies' combined Quarterly Report on Form 10-Q for the quarterly period ended June 30 of the current year |
| Third Quarter Form 10-Q | | The Companies' combined Quarterly Report on Form 10-Q for the quarterly period ended September 30 of the current year |
| Form 10-K | | The Companies’ combined Annual Report on Form 10-K for the year ended December 31, 20162018 |
| LTIP | | Long Term Incentive Plan |
| Moody’s | | Moody’s Investors Service |
| REV | | Reforming the Energy Vision |
| S&P | | S&P Global Ratings |
| TCJA | | The federal Tax Cuts and Jobs Act of 2017, as enacted on December 22, 2017 |
| VaR | | Value-at-Risk |
TABLE OF CONTENTS
|
| | |
|
| PAGE |
| |
| ITEM 1 | Financial Statements (Unaudited) | |
| | Con Edison | |
| | | |
| | | |
| | | |
| | | |
| | | |
| | CECONY | |
| | | |
| | | |
| | | |
| | | |
| | | |
| | | |
| ITEM 2 | | |
| ITEM 3 | | |
| ITEM 4 | | |
| |
| ITEM 1 | | |
| ITEM 1A | | |
| ITEM 6 | | |
| | | |
FORWARD-LOOKING STATEMENTS
This report includes forward-looking statements intended to qualify for the safe-harbor provisions of Section 27A of the Securities Act of 1933, as amended, and Section 21E of the Securities Exchange Act of 1934, as amended. Forward-looking statements are statements of future expectation and not facts. Words such as “forecasts,” “expects,” “estimates,” “anticipates,” “intends,” “believes,” “plans,” “will” and similar expressions identify forward-looking statements. Forward-looking statements are based on information available at the time the statements are made, and accordingly speak only as of that time. Actual results or developments might differ materially from those included in the forward-looking statements because of various factors including, but not limited to:
the Companies are extensively regulated and are subject to penalties;
| |
| �� | the Companies are extensively regulated and are subject to penalties; |
the Utilities’ rate plans may not provide a reasonable return;
the Companies may be adversely affected by changes to the Utilities’ rate plans;
the intentional misconduct of employees or contractors could adversely affect the Companies;
the failure of, or damage to, the Companies’ facilities could adversely affect the Companies;
a cyber attack could adversely affect the Companies;
the Companies are exposed to risks from the environmental consequences of their operations;
a disruption in the wholesale energy markets or failure by an energy supplier or customer could adversely affect the Companies;
the Companies have substantial unfunded pension and other postretirement benefit liabilities;
Con Edison’s ability to pay dividends or interest depends on dividends from its subsidiaries;
the Companies require access to capital markets to satisfy funding requirements;
changes to tax laws could adversely affect the Companies;
the Companies’ strategies may not be effective to address changes in the external business environment; and
the Companies also face other risks that are beyond their control.
The Companies assume no obligation to update forward-looking statements.
ConsolidatedEdison, Inc.
CONSOLIDATED INCOME STATEMENT (UNAUDITED)
| | | | For the Three Months Ended September 30, | For the Nine Months Ended September 30, | For the Three Months Ended September 30, | For the Nine Months Ended September 30, |
| | 2017 |
| 2016 | 2017 | 2016 | |
| | (Millions of Dollars/ Except Per Share Data) | |
| (Millions of Dollars/Except Share Data) | | 2019 | 2018 |
| 2019 | 2018 |
|
| OPERATING REVENUES | | | | | | |
| Electric | $2,675 | $2,769 | $6,573 | $6,717 | $2,753 | $2,783 | $6,665 | $6,611 |
| Gas | 296 | 235 | 1,593 | 1,246 | 306 | 298 | 1,790 | 1,726 |
| Steam | 62 | 63 | 448 | 406 | 58 | 64 | 469 | 474 |
| Non-utility | 178 | 350 | 458 | 999 | 248 | 183 | 699 | 577 |
| TOTAL OPERATING REVENUES | 3,211 | 3,417 | 9,072 | 9,368 | 3,365 | 3,328 | 9,623 | 9,388 |
| OPERATING EXPENSES | | | | | | |
| Purchased power | 460 | 798 | 1,253 | 2,047 | 483 | 545 | 1,203 | 1,287 |
| Fuel | 30 | 29 | 169 | 133 | 31 | 39 | 163 | 201 |
| Gas purchased for resale | 115 | 81 | 584 | 320 | 98 | 164 | 671 | 736 |
| Other operations and maintenance | 852 | 840 | 2,406 | 2,447 | 847 | 797 | 2,422 | 2,389 |
| Depreciation and amortization | 337 | 305 | 998 | 905 | 421 | 360 | 1,253 | 1,061 |
| Taxes, other than income taxes | 544 | 528 | 1,597 | 1,523 | 618 | 597 | 1,800 | 1,707 |
| TOTAL OPERATING EXPENSES | 2,338 | 2,581 | 7,007 | 7,375 | 2,498 | 2,502 | 7,512 | 7,381 |
| Gain on sale of retail electric supply business and solar electric production project | — |
| 104 | 1 | 104 | |
| OPERATING INCOME | 873 | 940 | 2,066 | 2,097 | 867 | 826 | 2,111 | 2,007 |
| OTHER INCOME (DEDUCTIONS) | | | | | | |
| Investment income | 20 | 20 | 59 | 27 | 25 | 39 | 70 | 96 |
| Other income | 20 | 31 | 43 | 10 | 7 | 26 | 18 |
| Allowance for equity funds used during construction | 3 | 3 | 8 | 7 | 4 | 4 | 11 | 11 |
| Other deductions | (4) | (5) | (12) | (16) | (25) | (61) | (76) | (154) |
| TOTAL OTHER INCOME | 39 | 49 | 98 | 61 | |
| TOTAL OTHER INCOME (DEDUCTIONS) | | 14 | (11) | 31 | (29) |
| INCOME BEFORE INTEREST AND INCOME TAX EXPENSE | 912 | 989 | 2,164 | 2,158 | 881 | 815 | 2,142 | 1,978 |
| INTEREST EXPENSE | | | | | | |
| Interest on long-term debt | 183 | 174 | 539 | 504 | 220 | 195 | 660 | 576 |
| Other interest | 4 | 5 | 11 | 17 | 45 | 13 | 122 | 28 |
| Allowance for borrowed funds used during construction | (2) | (1) | (5) | (4) | (3) | (3) | (10) | (7) |
| NET INTEREST EXPENSE | 185 | 178 | 545 | 517 | 262 | 205 | 772 | 597 |
| INCOME BEFORE INCOME TAX EXPENSE | 727 | 811 | 1,619 | 1,641 | 619 | 610 | 1,370 | 1,381 |
| INCOME TAX EXPENSE | 270 | 314 | 599 | 602 | 116 | 175 | 243 | 330 |
| NET INCOME | $457 | $497 | $1,020 | $1,039 | $503 | $435 | $1,127 | $1,051 |
| Income attributable to non-controlling interest | | 30 | — |
| 79 | — |
|
| NET INCOME FOR COMMON STOCK | | $473 | $435 | $1,048 | $1,051 |
| Net income per common share—basic | $1.48 | $1.63 | $3.33 | $3.47 | $1.42 | $1.40 | $3.20 | $3.38 |
| Net income per common share—diluted | $1.48 | $1.62 | $3.31 | $3.46 | $1.42 | $1.39 | $3.19 | $3.37 |
| DIVIDENDS DECLARED PER COMMON SHARE | $0.69 | $0.67 | $2.07 | $2.01 | |
| AVERAGE NUMBER OF SHARES OUTSTANDING—BASIC (IN MILLIONS) | 307.8 | 304.5 | 306.2 | 299.1 | 332.2 | 311.1 | 327.3 | 310.8 |
| AVERAGE NUMBER OF SHARES OUTSTANDING—DILUTED (IN MILLIONS) | 309.3 | 305.9 | 307.7 | 300.5 | 333.2 | 312.3 | 328.3 | 311.9 |
The accompanying notes are an integral part of these financial statements.
Consolidated Edison, Inc.
CONSOLIDATED STATEMENT OF COMPREHENSIVE INCOME (UNAUDITED)
| | | | For the Three Months Ended September 30, | For the Nine Months Ended September 30, | Three Months Ended September 30, | Nine Months Ended September 30, |
| | 2017 | 2016 | 2017 | 2016 | |
| | (Millions of Dollars) | |
| (Millions of Dollars) | | 2019 | 2018 |
| 2019 | 2018 |
|
| NET INCOME | $457 | $497 | $1,020 | $1,039 | $503 | $435 | $1,127 | $1,051 |
| INCOME ATTRIBUTABLE TO NON-CONTROLLING INTEREST | | (30) | — |
| (79) | — |
|
| OTHER COMPREHENSIVE INCOME, NET OF TAXES | | | |
|
|
| Pension and other postretirement benefit plan liability adjustments, net of taxes | 1 | 2 | 1 | 2 | 6 | 8 |
| TOTAL OTHER COMPREHENSIVE INCOME, NET OF TAXES | 1 | 2 | 1 | 2 | 6 | 8 |
| COMPREHENSIVE INCOME | $458 | $498 | $1,021 | $1,041 | $474 | $437 | $1,054 | $1,059 |
The accompanying notes are an integral part of these financial statements.
Consolidated Edison, Inc.
CONSOLIDATED STATEMENT OF CASH FLOWS (UNAUDITED)
| | | For the Nine Months Ended September 30, | For the Nine Months Ended September 30, | |
| 2017 |
| 2016 | |
| | (Millions of Dollars) | |
| (Millions of Dollars) | | 2019 |
| 2018 |
|
| OPERATING ACTIVITIES | | | |
| Net income | $1,020 | $1,039 | $1,127 | $1,051 |
| PRINCIPAL NON-CASH CHARGES/(CREDITS) TO INCOME | | | |
| Depreciation and amortization | 998 | 905 | 1,253 | 1,061 |
| Deferred income taxes | 626 | 524 | 257 | 308 |
| Rate case amortization and accruals | (93) | (157) | (88) | (85) |
| Common equity component of allowance for funds used during construction | (8) | (7) | (11) |
| Net derivative gains | (4) | (7) | 55 | 5 |
| Gain on sale of retail electric supply business and solar electric production project | (1) | (104) | |
| Unbilled revenue and net unbilled revenue deferrals | | 29 | 135 |
| Gain on sale of assets | | (5) | — |
|
| Other non-cash items, net | (1) | 99 | (25) | (44) |
| CHANGES IN ASSETS AND LIABILITIES | | | |
| Accounts receivable – customers | 1 | (138) | 8 | (246) |
| Materials and supplies, including fuel oil and gas in storage | 2 | 15 | — |
| (4) |
| Revenue decoupling mechanism receivable | | (91) | — |
|
| Other receivables and other current assets | (39) | 90 | 103 | (31) |
| Income taxes receivable | 33 | 100 | |
| Taxes receivable | | 39 | 47 |
| Prepayments | (433) | (403) | (520) | (487) |
| Accounts payable | (54) | 142 | (67) | (8) |
| Pensions and retiree benefits obligations, net | 305 | 464 | 253 | 264 |
| Pensions and retiree benefits contributions | (462) | (510) | (353) | (475) |
| Accrued taxes | (21) | (21) | (27) | (60) |
| Accrued interest | 59 | 66 | 95 | 67 |
| Superfund and environmental remediation costs, net | (9) | 68 | (8) | (14) |
| Distributions from equity investments | 87 | 45 | 46 | 88 |
| System benefit charge | 194 | 193 | 9 | 74 |
| Deferred charges, noncurrent assets and other regulatory assets | (18) | (104) | (238) | (223) |
| Deferred credits and other regulatory liabilities | (40) | 116 | 144 | 382 |
| Other current and noncurrent liabilities | 85 | (79) | (25) | (194) |
| NET CASH FLOWS FROM OPERATING ACTIVITIES | 2,227 | 2,336 | 1,960 | 1,600 |
| INVESTING ACTIVITIES | | | |
| Utility construction expenditures | (2,148) | (2,057) | (2,428) | (2,457) |
| Cost of removal less salvage | (185) | (149) | (219) | (188) |
| Non-utility construction expenditures | (288) | (436) | (143) | (193) |
| Investments in electric and gas transmission projects | (29) | (1,040) | (159) | (123) |
| Investments in/acquisitions of renewable electric production projects | (1) | (241) | — |
| (15) |
| Proceeds from the transfer of assets to NY Transco | — |
| 122 | |
| Proceeds from sale of assets | 34 | 250 | 48 | — |
|
| Restricted cash | 13 | (21) | |
| Other investing activities | 32 | (145) | 17 | 29 |
| NET CASH FLOWS USED IN INVESTING ACTIVITIES | (2,572) | (3,717) | (2,884) | (2,947) |
| FINANCING ACTIVITIES | | | |
| Net payment of short-term debt | (698) | (928) | |
| Net issuance/(payment) of short-term debt | | (1,266) | 775 |
| Issuance of long-term debt | 997 | 1,765 | 1,989 | 1,905 |
| Retirement of long-term debt | (429) | (407) | (702) | (1,319) |
| Debt issuance costs | (12) | (16) | (15) | (21) |
| Common stock dividends | (600) | (570) | (690) | (631) |
| Issuance of common shares - public offering | 343 | 702 | 825 | — |
|
| Issuance of common shares for stock plans | 37 | 38 | 40 | 39 |
| Distribution to noncontrolling interest | — |
| (1) | (10) | — |
|
| NET CASH FLOWS (USED IN)/FROM FINANCING ACTIVITIES | (362) | 583 | |
| CASH AND TEMPORARY CASH INVESTMENTS: | | | |
| NET CASH FLOWS FROM FINANCING ACTIVITIES | | 171 | 748 |
| CASH, TEMPORARY CASH INVESTMENTS, AND RESTRICTED CASH: | | |
| NET CHANGE FOR THE PERIOD | (707) | (798) | (753) | (599) |
| BALANCE AT BEGINNING OF PERIOD | 776 | 944 | 1,006 | 844 |
| BALANCE AT END OF PERIOD | $69 | $146 | $253 | $245 |
| LESS: CHANGE IN CASH BALANCES HELD FOR SALE | — |
| (4) | |
| BALANCE AT END OF PERIOD EXCLUDING HELD FOR SALE | $69 | $150 | |
| SUPPLEMENTAL DISCLOSURE OF CASH INFORMATION | | | |
| Cash paid/(received) during the period for: | | | |
| Interest | $479 | $437 | $576 | $519 |
| Income taxes | $(34) | $(144) | $(28) | $(1) |
| SUPPLEMENTAL DISCLOSURE OF NON-CASH INFORMATION | | | |
| Construction expenditures in accounts payable | $352 | $242 | $328 | $318 |
| Issuance of common shares for dividend reinvestment | $35 | $35 | $36 |
| Software licenses acquired but unpaid as of end of period | | $80 | $100 |
| Equipment acquired but unpaid as of end of period | | $33 | — |
|
The accompanying notes are an integral part of these financial statements.
Consolidated Edison, Inc.
CONSOLIDATED BALANCE SHEET (UNAUDITED)
| | | | September 30,
2017 | December 31,
2016 | |
| | (Millions of Dollars) | |
| (Millions of Dollars) | | September 30,
2019 | December 31,
2018 |
|
| ASSETS | | | |
| CURRENT ASSETS | | | |
| Cash and temporary cash investments | $69 | $776 | $78 | $895 |
| Accounts receivable – customers, less allowance for uncollectible accounts of $63 and $69 in 2017 and 2016, respectively | 1,111 | 1,106 | |
| Other receivables, less allowance for uncollectible accounts of $8 and $14 in 2017 and 2016, respectively | 181 | 195 | |
| Income taxes receivable | 46 | 79 | |
| Accounts receivable – customers, less allowance for uncollectible accounts of $67 and $62 in 2019 and 2018, respectively | | 1,254 | 1,267 |
| Other receivables, less allowance for uncollectible accounts of $5 in 2019 and 2018 | | 169 | 285 |
| Taxes receivable | | 10 | 49 |
| Accrued unbilled revenue | 411 | 447 | 505 | 514 |
| Fuel oil, gas in storage, materials and supplies, at average cost | 337 | 339 | 358 | 358 |
| Prepayments | 592 | 159 | 707 | 187 |
| Regulatory assets | 109 | 100 | 83 | 76 |
| Restricted cash | 41 | 54 | 175 | 111 |
| Revenue decoupling mechanism | | 91 | — |
|
| Other current assets | 199 | 151 | 151 | 122 |
| TOTAL CURRENT ASSETS | 3,096 | 3,406 | 3,581 | 3,864 |
| INVESTMENTS | 1,977 | 1,921 | 1,983 | 1,766 |
| UTILITY PLANT, AT ORIGINAL COST | | | |
| Electric | 28,595 | 27,747 | 31,584 | 30,378 |
| Gas | 7,972 | 7,524 | 9,879 | 9,100 |
| Steam | 2,458 | 2,421 | 2,594 | 2,562 |
| General | 2,891 | 2,719 | 3,492 | 3,331 |
| TOTAL | 41,916 | 40,411 | 47,549 | 45,371 |
| Less: Accumulated depreciation | 8,904 | 8,541 | 10,329 | 9,769 |
| Net | 33,012 | 31,870 | 37,220 | 35,602 |
| Construction work in progress | 1,415 | 1,175 | 1,963 | 1,978 |
| NET UTILITY PLANT | 34,427 | 33,045 | 39,183 | 37,580 |
| NON-UTILITY PLANT | | | |
| Non-utility property, less accumulated depreciation of $185 and $140 in 2017 and 2016, respectively | 1,686 | 1,482 | |
| Non-utility property, less accumulated depreciation of $357 and $275 in 2019 and 2018, respectively | | 3,848 | 4,000 |
| Construction work in progress | 615 | 689 | 203 | 169 |
| NET PLANT | 36,728 | 35,216 | 43,234 | 41,749 |
| OTHER NONCURRENT ASSETS | | | |
| Goodwill | 428 | 446 | 440 |
| Intangible assets, less accumulated amortization of $12 and $6 in 2017 and 2016, respectively | 114 | 124 | |
| Intangible assets, less accumulated amortization of $103 and $29 in 2019 and 2018, respectively | | 1,580 | 1,654 |
| Regulatory assets | 6,769 | 7,024 | 4,159 | 4,294 |
| Operating lease right-of-use asset | | 834 | — |
|
| Other deferred charges and noncurrent assets | 134 | 136 | 123 | 153 |
| TOTAL OTHER NONCURRENT ASSETS | 7,445 | 7,712 | 7,142 | 6,541 |
| TOTAL ASSETS | $49,246 | $48,255 | $55,940 | $53,920 |
The accompanying notes are an integral part of these financial statements.
Consolidated Edison, Inc.
CONSOLIDATED BALANCE SHEET (UNAUDITED)
| | | | September 30,
2017 | December 31,
2016 | |
| | (Millions of Dollars) | |
| (Millions of Dollars) | | September 30,
2019 |
| December 31,
2018 |
|
| LIABILITIES AND SHAREHOLDERS’ EQUITY | | |
| CURRENT LIABILITIES | | |
| Long-term debt due within one year | $687 | $39 | $1,914 | $650 |
| Term loan | | — |
| 825 |
| Notes payable | 356 | 1,054 | 1,300 | 1,741 |
| Accounts payable | 1,057 | 1,147 | 1,082 | 1,187 |
| Customer deposits | 344 | 352 | 348 | 351 |
| Accrued taxes | 43 | 64 | 35 | 61 |
| Accrued interest | 209 | 150 | 224 | 129 |
| Accrued wages | 105 | 101 | 115 | 109 |
| Fair value of derivative liabilities | 70 | 77 | 72 | 50 |
| Regulatory liabilities | 58 | 128 | 93 | 114 |
| System benefit charge | 628 | 434 | 636 | 627 |
| Operating lease liabilities | | 59 | — |
|
| Other current liabilities | 358 | 297 | 341 | 363 |
| TOTAL CURRENT LIABILITIES | 3,915 | 3,843 | 6,219 | 6,207 |
| NONCURRENT LIABILITIES | | |
| Provision for injuries and damages | 164 | 160 | 139 | 146 |
| Pensions and retiree benefits | 1,443 | 1,847 | 810 | 1,228 |
| Superfund and other environmental costs | 745 | 753 | 767 | 779 |
| Asset retirement obligations | 256 | 246 | 360 | 450 |
| Fair value of derivative liabilities | 83 | 40 | 147 | 16 |
| Deferred income taxes and unamortized investment tax credits | 10,744 | 10,205 | 6,136 | 5,820 |
| Operating lease liabilities | | 819 | — |
|
| Regulatory liabilities | 1,873 | 1,905 | 4,590 | 4,641 |
| Other deferred credits and noncurrent liabilities | 262 | 215 | 282 | 299 |
| TOTAL NONCURRENT LIABILITIES | 15,570 | 15,371 | 14,050 | 13,379 |
| LONG-TERM DEBT | 14,651 | 14,735 | 17,537 | 17,495 |
| EQUITY | | |
| Common shareholders’ equity | 15,102 | 14,298 | 17,959 | 16,726 |
| Noncontrolling interest | 8 | 175 | 113 |
| TOTAL EQUITY (See Statement of Equity) | 15,110 | 14,306 | 18,134 | 16,839 |
| TOTAL LIABILITIES AND EQUITY | $49,246 | $48,255 | $55,940 | $53,920 |
The accompanying notes are an integral part of these financial statements.
Consolidated Edison, Inc.
CONSOLIDATED STATEMENT OF EQUITY (UNAUDITED)
|
| | | | | | | | | | | |
| (In Millions, except for dividends per share) | Common Stock | Additional
Paid-In
Capital | Retained
Earnings | Treasury Stock | Capital
Stock
Expense | Accumulated
Other
Comprehensive
Income/(Loss) | Non- controlling
Interest | Total |
| Shares | Amount | Shares | Amount |
| BALANCE AS OF DECEMBER 31, 2017 | 310 | $34 | $6,298 | $10,235 | 23 | $(1,038) | $(85) | $(26) | $7 | $15,425 |
| Net income |
|
|
| 428 |
|
|
|
|
| 428 |
| Common stock dividends ($0.715 per share) |
|
|
| (221) |
|
|
|
|
| (221) |
| Issuance of common shares for stock plans | 1 |
| 25 |
|
|
|
|
|
| 25 |
| Other comprehensive income |
|
|
|
|
|
|
| 4 |
| 4 |
| Noncontrolling interest |
|
|
|
|
|
|
|
|
| — |
|
| BALANCE AS OF MARCH 31, 2018 | 311 | $34 | $6,323 | $10,442 | 23 | $(1,038) | $(85) | $(22) | $7 | $15,661 |
| Net income |
|
|
| 188 |
|
|
|
|
| 188 |
| Common stock dividends ($0.715 per share) |
|
|
| (223) |
|
|
|
|
| (223) |
| Issuance of common shares for stock plans |
|
| 27 |
|
|
|
|
|
| 27 |
| Other comprehensive income |
|
|
|
|
|
|
| 2 |
| 2 |
| Noncontrolling interest |
|
|
|
|
|
|
|
|
| — |
|
| BALANCE AS OF JUNE 30, 2018 | 311 | $34 | $6,350 | $10,407 | 23 | $(1,038) | $(85) | $(20) | $7 | $15,655 |
| Net income |
|
|
| 435 |
|
|
|
|
| 435 |
| Common stock dividends ($0.715 per share) |
|
|
| (223) |
|
|
|
|
| (223) |
| Issuance of common shares for stock plans |
|
| 25 |
|
|
|
|
|
| 25 |
| Other comprehensive income |
|
|
|
|
|
|
| 2 |
| 2 |
| Noncontrolling interest |
|
|
|
|
|
|
|
| 4 | 4 |
| BALANCE AS OF SEPTEMBER 30, 2018 | 311 | $34 | $6,375 | $10,619 | 23 | $(1,038) | $(85) | $(18) | $11 | $15,898 |
| Net income |
|
|
| 331 |
|
|
|
|
| 331 |
| Common stock dividends ($0.715 per share) |
|
|
| (222) |
|
|
|
|
| (222) |
| Issuance of common shares - public offering | 10 |
| 719 |
|
|
| (14) |
|
| 705 |
| Issuance of common shares for stock plans |
|
| 23 |
|
|
|
|
|
| 23 |
| Other comprehensive income |
|
|
|
|
|
|
| 2 |
| 2 |
| Noncontrolling interest |
|
|
|
|
|
|
|
| 102 | 102 |
| BALANCE AS OF DECEMBER 31, 2018 | 321 | $34 | $7,117 | $10,728 | 23 | $(1,038) | $(99) | $(16) | $113 | $16,839 |
| Net income |
|
|
| 424 |
|
|
|
| 21 | 445 |
| Common stock dividends ($0.74 per share) |
|
|
| (237) |
|
|
|
|
| (237) |
| Issuance of common shares – public offering | 6 |
| 433 |
|
|
| (8) |
|
| 425 |
| Issuance of common shares for stock plans |
|
| 27 |
|
|
|
|
|
| 27 |
| Other comprehensive income |
|
|
|
|
|
|
| 4 |
| 4 |
| Distributions to noncontrolling interest |
|
|
|
|
|
|
|
| (2) | (2) |
| BALANCE AS OF MARCH 31, 2019 | 327 | $34 | $7,577 | $10,915 | 23 | $(1,038) | $(107) | $(12) | $132 | $17,501 |
| Net income |
|
|
| 152 |
|
|
|
| 27 | 179 |
| Common stock dividends ($0.74 per share) |
|
|
| (242) |
|
|
|
|
| (242) |
| Issuance of common shares – public offering | 5 | 1 | 402 |
|
|
| (3) |
|
| 400 |
| Issuance of common shares for stock plans |
|
| 29 |
|
|
|
|
|
| 29 |
| Other comprehensive income |
|
|
|
|
|
|
| 1 |
| 1 |
| Distributions to noncontrolling interest |
|
|
|
|
|
|
|
| (3) | (3) |
| BALANCE AS OF JUNE 30, 2019 | 332 | $35 | $8,008 | $10,825 | 23 | $(1,038) | $(110) | $(11) | $156 | $17,865 |
| Net income |
|
|
| 473 |
|
|
|
| 30 | 503 |
| Common stock dividends ($0.74 per share) |
|
|
| (247) |
|
|
|
|
| (247) |
| Issuance of common shares for stock plans |
|
| 23 |
|
|
|
|
|
| 23 |
| Other comprehensive income |
|
|
|
|
|
|
| 1 |
| 1 |
| Distributions to noncontrolling interest |
|
|
|
|
|
|
|
| (11) | (11) |
| BALANCE AS OF SEPTEMBER 30, 2019 | 332 | $35 | $8,031 | $11,051 | 23 | $(1,038) | $(110) | $(10) | $175 | $18,134 |
|
| | | | | | | | | | | | |
| (In Millions) | Common Stock | Additional
Paid-In
Capital | Retained
Earnings | Treasury Stock | Capital
Stock
Expense | Accumulated
Other
Comprehensive
Income/(Loss) | Noncontrolling
Interest | Total |
| Shares | Amount | Shares | Amount |
BALANCE AS OF
DECEMBER 31, 2015 | 293 | $32 | $5,030 | $9,123 | 23 | $(1,038) | $(61) | $(34) | $9 | $13,061 |
| Net income | | | | 310 | | | | | | 310 |
| Common stock dividends | | | | (197) | | | | | | (197) |
| Issuance of common shares for stock plans | 1 | | 28 | | | | | | | 28 |
| Other comprehensive income | | | | | | | |
| | — |
|
| Noncontrolling interest | | | | | | | | | (1) | (1) |
BALANCE AS OF
MARCH 31, 2016 | 294 | $32 | $5,058 | $9,236 | 23 | $(1,038) | $(61) | $(34) | $8 | $13,201 |
| Net income | | | | 232 | | | | | | 232 |
| Common stock dividends | | | | (204) | | | | | | (204) |
| Issuance of common shares - public offering | 10 | 1 | 723 | | | | (22) | | | 702 |
| Issuance of common shares for stock plans |
| | 26 | | | | | | | 26 |
| Other comprehensive income | | | | | | | | 1 | | 1 |
BALANCE AS OF
JUNE 30, 2016 | 304 | $33 | $5,807 | $9,264 | 23 | $(1,038) | $(83) | $(33) | $8 | $13,958 |
| Net income | | | | 497 | | | | | | 497 |
| Common stock dividends | | | | (204) | | | | | | (204) |
| Issuance of common shares for stock plans | 1 |
| | 23 | | | | | | | 23 |
| Other comprehensive income | | | | | | | | 1 | | 1 |
BALANCE AS OF
SEPTEMBER 30, 2016 | 305 | $33 | $5,830 | $9,557 | 23 | $(1,038) | $(83) | $(32) | $8 | $14,275 |
| | | | | | | | | | | |
| BALANCE AS OF DECEMBER 31, 2016 | 305 | $33 | $5,854 | $9,559 | 23 | $(1,038) | $(83) | $(27) | $8 | $14,306 |
| Net income | | | | 388 | | | | | | 388 |
| Common stock dividends | | | | (211) | | | | | | (211) |
| Issuance of common shares for stock plans | | | 24 | | | | | | | 24 |
| Other comprehensive loss | | | | | | | | (1) | | (1) |
BALANCE AS OF
MARCH 31, 2017 | 305 | $33 | $5,878 | $9,736 | 23 | $(1,038) | $(83) | $(28) | $8 | $14,506 |
| Net income | | | | 175 | | | | | | 175 |
| Common stock dividends | | | | (210) | | | | | | (210) |
| Issuance of common shares for stock plans | 1 | | 26 | | | | | | | 26 |
| Other comprehensive income | | | | | | | | 1 | | 1 |
BALANCE AS OF
JUNE 30, 2017 | 306 | $33 | $5,904 | $9,701 | 23 | $(1,038) | $(83) | $(27) | $8 | $14,498 |
| Net income | | | | 457 | | | | | | 457 |
| Common stock dividends | | | | (214) | | | | | | (214) |
| Issuance of common shares - public offering | 4 |
| 345 | | | | (2) | | | 343 |
| Issuance of common shares for stock plans |
|
| 25 | | | | | | | 25 |
| Other comprehensive income | | | | | | | | 1 | | 1 |
BALANCE AS OF
SEPTEMBER 30, 2017 | 310 | $33 | $6,274 | $9,944 | 23 | $(1,038) | $(85) | $(26) | $8 | $15,110 |
The accompanying notes are an integral part of these financial statements.
Consolidated Edison Company of New York, Inc.
CONSOLIDATED INCOME STATEMENT (UNAUDITED)
| | | | For the Three Months Ended September 30, | For the Nine Months Ended September 30, | For the Three Months Ended September 30, | For the Nine Months Ended September 30, |
| | 2017 |
| 2016 | 2017 | 2016 | |
| | (Millions of Dollars) | |
| (Millions of Dollars) | | 2019 | 2018 | 2019 | 2018 |
| OPERATING REVENUES | | | |
| Electric | $2,469 | $2,557 | $6,079 | $6,222 | $2,544 | $2,571 | $6,174 | $6,107 |
| Gas | 268 | 208 | 1,421 | 1,113 | 275 | 264 | 1,605 | 1,540 |
| Steam | 62 | 63 | 448 | 406 | 58 | 64 | 469 | 474 |
| TOTAL OPERATING REVENUES | 2,799 | 2,828 | 7,948 | 7,741 | 2,877 | 2,899 | 8,248 | 8,121 |
| OPERATING EXPENSES | | | |
| Purchased power | 400 | 495 | 1,110 | 1,216 | 423 | 472 | 1,058 | 1,117 |
| Fuel | 30 | 29 | 169 | 133 | 31 | 39 | 163 | 201 |
| Gas purchased for resale | 58 | 34 | 372 | 217 | 52 | 66 | 445 | 457 |
| Other operations and maintenance | 691 | 724 | 1,992 | 2,105 | 712 | 666 | 2,022 | 1,926 |
| Depreciation and amortization | 300 | 278 | 891 | 825 | 346 | 322 | 1,020 | 949 |
| Taxes, other than income taxes | 520 | 502 | 1,523 | 1,446 | 590 | 570 | 1,715 | 1,621 |
| TOTAL OPERATING EXPENSES | 1,999 | 2,062 | 6,057 | 5,942 | 2,154 | 2,135 | 6,423 | 6,271 |
| OPERATING INCOME | 800 | 766 | 1,891 | 1,799 | 723 | 764 | 1,825 | 1,850 |
| OTHER INCOME (DEDUCTIONS) | | | |
| Investment and other income | 2 | 4 | 9 | 6 | 10 | 6 | 23 | 14 |
| Allowance for equity funds used during construction | 3 | 2 | 7 | 6 | 3 | 4 | 9 | 10 |
| Other deductions | (5) | (4) | (10) | (22) | (43) | (63) | (123) |
| TOTAL OTHER INCOME | — |
| 2 | 6 | 2 | |
| TOTAL OTHER INCOME (DEDUCTIONS) | | (9) | (33) | (31) | (99) |
| INCOME BEFORE INTEREST AND INCOME TAX EXPENSE | 800 | 768 | 1,897 | 1,801 | 714 | 731 | 1,794 | 1,751 |
| INTEREST EXPENSE | | | |
| Interest on long-term debt | 155 | 150 | 456 | 440 | 168 | 167 | 501 | 492 |
| Other interest | 4 | 5 | 11 | 14 | 16 | 10 | 52 | 23 |
| Allowance for borrowed funds used during construction | (2) | (1) | (4) | (3) | (3) | (2) | (8) | (7) |
| NET INTEREST EXPENSE | 157 | 154 | 463 | 451 | 181 | 175 | 545 | 508 |
| INCOME BEFORE INCOME TAX EXPENSE | 643 | 614 | 1,434 | 1,350 | 533 | 556 | 1,249 | 1,243 |
| INCOME TAX EXPENSE | 242 | 226 | 551 | 491 | 119 | 125 | 271 | 274 |
| NET INCOME | $401 | $388 | $883 | $859 | $414 | $431 | $978 | $969 |
The accompanying notes are an integral part of these financial statements.
Consolidated Edison Company of New York, Inc.
CONSOLIDATED STATEMENT OF COMPREHENSIVE INCOME (UNAUDITED)
| | | | For the Three Months Ended September 30, | For the Nine Months Ended September 30, | Three Months Ended September 30, | Nine Months Ended September 30, |
| | 2017 |
| 2016 |
| 2017 | 2016 | |
| | (Millions of Dollars) | |
| (Millions of Dollars) | | 2019 | 2018 |
| 2019 | 2018 |
| NET INCOME | $401 | $388 | $883 | $859 | $414 | $431 | $978 | $969 |
| OTHER COMPREHENSIVE INCOME, NET OF TAXES | | | |
| Pension and other postretirement benefit plan liability adjustments, net of taxes | 1 |
| — |
| 1 | 1 | — |
| 1 |
| TOTAL OTHER COMPREHENSIVE INCOME, NET OF TAXES | 1 |
| — |
| 1 | 1 | — |
| 1 |
| COMPREHENSIVE INCOME | $402 | $388 | $884 | $860 | $415 | $431 | $979 | $970 |
The accompanying notes are an integral part of these financial statements.
Consolidated Edison Company of New York, Inc.
CONSOLIDATED STATEMENT OF CASH FLOWS (UNAUDITED)
| | | For the Nine Months Ended September 30, | For the Nine Months Ended September 30, | |
| 2017 |
| 2016 | |
| | (Millions of Dollars) | |
| (Millions of Dollars) | | 2019 |
| 2018 |
|
| OPERATING ACTIVITIES | | | |
| Net income | $883 | $859 | $978 | $969 |
| PRINCIPAL NON-CASH CHARGES/(CREDITS) TO INCOME | | | |
| Depreciation and amortization | 891 | 825 | 1,020 | 949 |
| Deferred income taxes | 566 | 569 | 244 | 346 |
| Rate case amortization and accruals | (107) | (170) | (87) | (98) |
| Common equity component of allowance for funds used during construction | (7) | (6) | (9) | (10) |
| Unbilled revenue and net unbilled revenue deferrals | | 38 | 43 |
| Gain on sale of assets | | (5) | — |
|
| Other non-cash items, net | (14) | 7 | (19) | (20) |
| CHANGES IN ASSETS AND LIABILITIES | | | |
| Accounts receivable – customers | 18 | (79) | (2) | (218) |
| Materials and supplies, including fuel oil and gas in storage | (18) | 15 | 9 | (3) |
| Revenue decoupling mechanism | | (91) | — |
|
| Other receivables and other current assets | 29 | 18 | 107 | (47) |
| Accounts receivable from affiliated companies | 12 | 38 | 14 | (267) |
| Prepayments | (398) | (351) | (499) | (448) |
| Accounts payable | (20) | 82 | (92) | (32) |
| Accounts payable to affiliated companies | 1 | 8 | (4) | 8 |
| Pensions and retiree benefits obligations, net | 274 | 439 | 237 | 242 |
| Pensions and retiree benefits contributions | (416) | (472) | (322) | (436) |
| Superfund and environmental remediation costs, net | (7) | 76 | (10) | (14) |
| Accrued taxes | (18) | (17) | (23) | (63) |
| Accrued taxes to affiliated companies | (119) | (2) | — |
| (72) |
| Accrued interest | 61 | 43 | 68 | 67 |
| System benefit charge | 175 | 176 | 9 | 70 |
| Deferred charges, noncurrent assets and other regulatory assets | (60) | (153) | (248) | (158) |
| Deferred credits and other regulatory liabilities | 77 | 165 | 184 | 376 |
| Other current and noncurrent liabilities | (13) | (53) | (7) | (99) |
| NET CASH FLOWS FROM OPERATING ACTIVITIES | 1,790 | 2,017 | 1,490 | 1,085 |
| INVESTING ACTIVITIES | | | |
| Utility construction expenditures | (2,020) | (1,932) | (2,271) | (2,315) |
| Cost of removal less salvage | (179) | (146) | (214) | (183) |
| Proceeds from the transfer of assets to NY Transco | — |
| 122 | |
| Restricted cash | 2 | 13 | |
| Proceeds from sale of assets | | 48 | — |
|
| NET CASH FLOWS USED IN INVESTING ACTIVITIES | (2,197) | (1,943) | (2,437) | (2,498) |
| FINANCING ACTIVITIES | | | |
| Net payment of short-term debt | (453) | (553) | |
| Net issuance/(payment) of short-term debt | | (262) | 854 |
| Issuance of long-term debt | 500 | 550 | 700 | 1,640 |
| Retirement of long-term debt | — |
| (400) | (475) | (1,236) |
| Debt issuance costs | (7) | (6) | (9) | (18) |
| Capital contribution by parent | 279 | 76 | 875 | 95 |
| Dividend to parent | (597) | (558) | (685) | (635) |
| NET CASH FLOWS USED IN FINANCING ACTIVITIES | (278) | (891) | |
| CASH AND TEMPORARY CASH INVESTMENTS: | | | |
| NET CASH FLOWS FROM FINANCING ACTIVITIES | | 144 | 700 |
| CASH, TEMPORARY CASH INVESTMENTS, AND RESTRICTED CASH: | | |
| NET CHANGE FOR THE PERIOD | (685) | (817) | (803) | (713) |
| BALANCE AT BEGINNING OF PERIOD | 702 | 843 | 818 | 730 |
| BALANCE AT END OF PERIOD | $17 | $26 | $15 | $17 |
| SUPPLEMENTAL DISCLOSURE OF CASH INFORMATION | | | |
| Cash paid/(received) during the period for: | | | |
| Interest | $388 | $386 | $439 | $424 |
| Income taxes | $96 | $(130) | $13 | $268 |
| SUPPLEMENTAL DISCLOSURE OF NON-CASH INFORMATION | | | |
| Construction expenditures in accounts payable | $240 | $195 | $295 | $279 |
| Software licenses acquired but unpaid as of end of period | | $76 | $95 |
| Equipment acquired but unpaid as of end of period | | $33 | — |
|
The accompanying notes are an integral part of these financial statements.
Consolidated Edison Company of New York, Inc.
CONSOLIDATED BALANCE SHEET (UNAUDITED)
| | | | September 30,
2017 | December 31,
2016 | |
| | (Millions of Dollars) | |
| (Millions of Dollars) | | September 30,
2019 |
| December 31,
2018 |
|
| ASSETS | | | |
| CURRENT ASSETS | | | |
| Cash and temporary cash investments | $17 | $702 | $15 | $818 |
| Accounts receivable – customers, less allowance for uncollectible accounts of $58 and $65 in 2017 and 2016, respectively | 1,021 | 1,032 | |
| Other receivables, less allowance for uncollectible accounts of $7 and $13 in 2017 and 2016, respectively | 85 | 81 | |
| Accounts receivable – customers, less allowance for uncollectible accounts of $62 and $57 in 2019 and 2018, respectively | | 1,160 | 1,163 |
| Other receivables, less allowance for uncollectible accounts of $3 in 2019 and 2018 | | 104 | 211 |
| Taxes receivable | | — |
| 5 |
| Accrued unbilled revenue | 382 | 399 | 374 | 392 |
| Accounts receivable from affiliated companies | 97 | 109 | 200 | 214 |
| Fuel oil, gas in storage, materials and supplies, at average cost | 288 | 270 | 295 | 304 |
| Prepayments | 498 | 100 | 616 | 117 |
| Regulatory assets | 100 | 90 | 69 | 64 |
| Restricted cash | — |
| 2 | |
| Revenue decoupling mechanism receivable | | 91 | — |
|
| Other current assets | 62 | 95 | 81 | 69 |
| TOTAL CURRENT ASSETS | 2,550 | 2,880 | 3,005 | 3,357 |
| INVESTMENTS | 370 | 315 | 436 | 385 |
| UTILITY PLANT, AT ORIGINAL COST | | | |
| Electric | 26,930 | 26,122 | 29,736 | 28,595 |
| Gas | 7,229 | 6,814 | 9,012 | 8,295 |
| Steam | 2,458 | 2,421 | 2,594 | 2,562 |
| General | 2,640 | 2,490 | 3,201 | 3,056 |
| TOTAL | 39,257 | 37,847 | 44,543 | 42,508 |
| Less: Accumulated depreciation | 8,170 | 7,836 | 9,504 | 8,988 |
| Net | 31,087 | 30,011 | 35,039 | 33,520 |
| Construction work in progress | 1,327 | 1,104 | 1,843 | 1,850 |
| NET UTILITY PLANT | 32,414 | 31,115 | 36,882 | 35,370 |
| NON-UTILITY PROPERTY | | | |
| Non-utility property, less accumulated depreciation of $25 in 2017 and 2016 | 4 | 4 | |
| Non-utility property, less accumulated depreciation of $25 in 2019 and 2018 | | 3 | 4 |
| NET PLANT | 32,418 | 31,119 | 36,885 | 35,374 |
| OTHER NONCURRENT ASSETS | | | |
| Regulatory assets | 6,248 | 6,473 | 3,831 | 3,923 |
| Operating lease right-of-use asset | | 610 | — |
|
| Other deferred charges and noncurrent assets | 61 | 69 | 41 | 69 |
| TOTAL OTHER NONCURRENT ASSETS | 6,309 | 6,542 | 4,482 | 3,992 |
| TOTAL ASSETS | $41,647 | $40,856 | $44,808 | $43,108 |
The accompanying notes are an integral part of these financial statements.
Consolidated Edison Company of New York, Inc.
CONSOLIDATED BALANCE SHEET (UNAUDITED)
| | | | September 30,
2017 | December 31,
2016 | |
| | (Millions of Dollars) | |
| (Millions of Dollars) | | September 30,
2019 | December 31,
2018 |
|
| LIABILITIES AND SHAREHOLDER’S EQUITY | | | | |
| CURRENT LIABILITIES | | | | |
| Long-term debt due within one year | $600 |
| $— |
| $350 | $475 |
| Notes payable | 147 | 600 | 930 | 1,192 |
| Accounts payable | 802 | 876 | 883 | 977 |
| Accounts payable to affiliated companies | 11 | 10 | 13 | 17 |
| Customer deposits | 332 | 336 | 335 | 339 |
| Accrued taxes | 32 | 50 | 33 | 55 |
| Accrued taxes to affiliated companies | — |
| 119 | |
| Accrued interest | 172 | 111 | 180 | 112 |
| Accrued wages | 95 | 91 | 104 | 99 |
| Fair value of derivative liabilities | 59 | 66 | 33 | 25 |
| Regulatory liabilities | 38 | 90 | 56 | 73 |
| System benefit charge | 573 | 398 | 578 | 569 |
| Operating lease liabilities | | 49 | — |
|
| Other current liabilities | 207 | 242 | 269 | 267 |
| TOTAL CURRENT LIABILITIES | 3,068 | 2,989 | 3,813 | 4,200 |
| NONCURRENT LIABILITIES | | | | |
| Provision for injuries and damages | 158 | 154 | 135 | 141 |
| Pensions and retiree benefits | 1,150 | 1,544 | 577 | 952 |
| Superfund and other environmental costs | 648 | 655 | 684 | 693 |
| Asset retirement obligations | 234 | 227 | 301 | 292 |
| Fair value of derivative liabilities | 73 | 33 | 82 | 6 |
| Deferred income taxes and unamortized investment tax credits | 10,060 | 9,450 | 6,082 | 5,739 |
| Operating lease liabilities | | 595 | — |
|
| Regulatory liabilities | 1,673 | 1,712 | 4,200 | 4,258 |
| Other deferred credits and noncurrent liabilities | 217 | 190 | 236 | 241 |
| TOTAL NONCURRENT LIABILITIES | 14,213 | 13,965 | 12,892 | 12,322 |
| LONG-TERM DEBT | 11,971 | 12,073 | 14,024 | 13,676 |
| SHAREHOLDER’S EQUITY (See Statement of Shareholder’s Equity) | 12,395 | 11,829 | 14,079 | 12,910 |
| TOTAL LIABILITIES AND SHAREHOLDER’S EQUITY | $41,647 | $40,856 | $44,808 | $43,108 |
The accompanying notes are an integral part of these financial statements.
Consolidated Edison Company of New York, Inc.
CONSOLIDATED STATEMENT OF SHAREHOLDER’S EQUITY (UNAUDITED) | | | | Common Stock | Additional
Paid-In
Capital | Retained
Earnings | Repurchased
Con Edison
Stock | Capital
Stock
Expense | Accumulated
Other
Comprehensive
Income/(Loss) | Total | Common Stock | Additional
Paid-In
Capital | Retained
Earnings | Repurchased
Con Edison
Stock | Capital
Stock
Expense | Accumulated
Other
Comprehensive
Income/(Loss) | Total |
| (In Millions) | Shares | Amount | |
| BALANCE AS OF DECEMBER 31, 2015 | 235 | $589 | $4,247 | $7,611 | $(962) | $(61) | $(9) | $11,415 | |
| (In Millions, except for dividends per share) | | Shares | Amount | Additional
Paid-In
Capital | Retained
Earnings | Repurchased
Con Edison
Stock | Capital
Stock
Expense | Accumulated
Other
Comprehensive
Income/(Loss) | Total |
| BALANCE AS OF DECEMBER 31, 2017 | | 235 | $589 |
| Net income | | 310 | | | 310 |
|
| 389 |
|
| 389 |
| Common stock dividend to parent | | (186) | | | (186) |
|
| (211) |
|
| (211) |
| Capital contribution by parent | | 23 | | | 23 |
| 45 |
|
| 45 |
| Other comprehensive income | | — |
| — |
|
|
|
|
|
| — |
|
| BALANCE AS OF MARCH 31, 2016 | 235 | $589 | $4,270 | $7,735 | $(962) | $(61) | $(9) | $11,562 | |
| BALANCE AS OF MARCH 31, 2018 | | 235 | $589 | $4,694 | $8,409 | $(962) | $(62) | $(6) | $12,662 |
| Net income | | 161 | | | 161 |
|
| 149 |
|
| 149 |
| Common stock dividend to parent | | (186) | | | (186) |
|
| $(212) |
|
| (212) |
| Capital contribution by parent | | 28 | | | 28 |
| 25 |
|
|
| 25 |
| Other comprehensive income | | 1 |
|
|
| 1 |
| 1 |
| BALANCE AS OF JUNE 30, 2016 | 235 | $589 | $4,298 | $7,710 | $(962) | $(61) | $(8) | $11,566 | |
| BALANCE AS OF JUNE 30, 2018 | | 235 | $589 | $4,719 | $8,346 | $(962) | $(62) | $(5) | $12,625 |
| Net income | | 388 | | | 388 |
|
| $431 |
|
| 431 |
| Common stock dividend to parent | | (186) | | | (186) |
|
| (212) |
|
| (212) |
| Capital contribution by parent | | 25 | | | 25 |
| 25 |
|
| 25 |
| Other comprehensive income | | — |
| — |
|
|
|
|
| — |
|
| BALANCE AS OF SEPTEMBER 30, 2016 | 235 | $589 | $4,323 | $7,912 | $(962) | $(61) | $(8) | $11,793 | |
| | | | |
| BALANCE AS OF DECEMBER 31, 2016 | 235 | $589 | $4,347 | $7,923 | $(962) | $(61) | $(7) | $11,829 | |
| BALANCE AS OF SEPTEMBER 30, 2018 | | 235 | $589 | $4,744 | $8,565 | $(962) | $(62) | $(5) | $12,869 |
| Net income | | 339 | | | 339 |
|
| 227 |
|
| 227 |
| Common stock dividend to parent | | (199) | | | (199) |
|
| (211) |
|
| (211) |
| Capital contribution by parent | | 22 | | | 22 |
| 25 |
|
| 25 |
| Other comprehensive income | | — |
| — |
|
|
|
|
| — |
|
| BALANCE AS OF MARCH 31, 2017 | 235 | $589 | $4,369 | $8,063 | $(962) | $(61) | $(7) | $11,991 | |
| BALANCE AS OF DECEMBER 31, 2018 | | 235 | $589 | $4,769 | $8,581 | $(962) | $(62) | $(5) | $12,910 |
| Net income | | 143 | | | 143 | | | 412 | | | 412 |
| Common stock dividend to parent | | (199) | | | (199) | | | (228) | | | (228) |
| Capital contribution by parent | | 23 | | | 23 | | 225 | | | 225 |
| Other comprehensive income | | — |
| — |
| | | | | — |
|
| BALANCE AS OF JUNE 30, 2017 | 235 | $589 | $4,392 | $8,007 | $(962) | $(61) | $(7) | $11,958 | |
| BALANCE AS OF MARCH 31, 2019 | | 235 | $589 | $4,994 | $8,765 | $(962) | $(62) | $(5) | $13,319 |
| Net income | | 401 | | | 401 |
|
| 152 |
|
| 152 |
| Common stock dividend to parent | | (199) | | | (199) |
|
| (228) |
|
| (228) |
| Capital contribution by parent | | 235 | | (1) | | 234 |
| 625 |
|
| 625 |
| Other comprehensive income | | 1 |
|
|
|
|
| — |
|
| BALANCE AS OF SEPTEMBER 30, 2017 | 235 | $589 | $4,627 | $8,209 | $(962) | $(62) | $(6) | $12,395 | |
| BALANCE AS OF JUNE 30, 2019 | | 235 | $589 | $5,619 | $8,689 | $(962) | $(62) | $(5) | $13,868 |
| Net income | |
|
| 414 |
|
| 414 |
| Common stock dividend to parent | |
|
| (229) |
|
| (229) |
| Capital contribution by parent | |
| 25 |
|
| 25 |
| Other comprehensive income | |
|
|
| 1 | 1 |
| BALANCE AS OF SEPTEMBER 30, 2019 | | 235 | $589 | $5,644 | $8,874 | $(962) | $(62) | $(4) | $14,079 |
The accompanying notes are an integral part of these financial statements.
NOTES TO THE FINANCIAL STATEMENTS (UNAUDITED)
General
These combined notes accompany and form an integral part of the separate consolidated financial statements of each of the two2 separate registrants: Consolidated Edison, Inc. and its subsidiaries (Con Edison) and Consolidated Edison Company of New York, Inc. and its subsidiaries (CECONY). CECONY is a subsidiary of Con Edison and as such its financial condition and results of operations and cash flows, which are presented separately in the CECONY consolidated financial statements, are also consolidated, along with those of Orange and Rockland Utilities, Inc. (O&R), Con Edison Clean Energy Businesses, Inc. (together with its subsidiaries, the Clean Energy Businesses) and Con Edison Transmission, Inc. (together with its subsidiaries, Con Edison Transmission) in Con Edison’s consolidated financial statements. The term “Utilities” is used in these notes to refer to CECONY and O&R.
As used in these notes, the term “Companies” refers to Con Edison and CECONY and, except as otherwise noted, the information in these combined notes relates to each of the Companies. However, CECONY makes no representation as to information relating to Con Edison or the subsidiaries of Con Edison other than itself.
The separate interim consolidated financial statements of each of the Companies are unaudited but, in the opinion of their respective managements, reflect all adjustments (which include only normally recurring adjustments) necessary for a fair presentation of the results for the interim periods presented. The Companies’ separate interim consolidated financial statements should be read together with their separate audited financial statements (including the combined notes thereto) included in Item 8 of their combined Annual Report on Form 10-K for the year ended December 31, 20162018 and their separate unaudited financial statements (including the combined notes thereto) included in Part 1, Item 1 of their combined Quarterly Report on Form 10-Q for the quarterly periods ended March 31, 20172019 and June 30, 2017. Certain prior period amounts have been reclassified to conform to the current period presentation.2019.
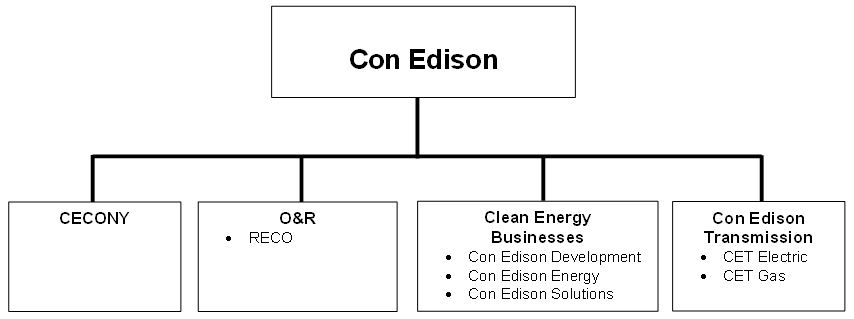
Con Edison has two2 regulated utility subsidiaries: CECONY and O&R. CECONY provides electric service and gas service in New York City and Westchester County. The company also provides steam service in parts of Manhattan. O&R, along with its regulated utility subsidiary, provides electric service in southeastern New York and northern New Jersey and gas service in southeastern New York. Con Edison Clean Energy Businesses, Inc. has three3 subsidiaries: Consolidated Edison Development, Inc. (Con Edison Development), a company that develops, owns and operates renewable and energy infrastructure projects; Consolidated Edison Energy, Inc. (Con Edison Energy), a company that provides energy-related products and services to wholesale customers; and Consolidated Edison Solutions, Inc. (Con Edison Solutions), a company that provides energy-related products and services to retail customers. Con Edison Transmission, Inc. invests in electric transmission facilities through its subsidiary, Consolidated Edison Transmission, LLC (CET Electric), and invests in gas pipeline and storage facilities through its subsidiary Con Edison Gas Pipeline and Storage, LLC (CET Gas).
Note A – Summary of Significant Accounting Policies and Other Matters
Revenue Recognition
The following table presents, for the three and nine months ended September 30, 2019 and 2018, revenue from contracts with customers as defined in Accounting Standards Codification (ASC) Topic 606, "Revenue from Contracts with Customers," as well as additional revenue from sources other than contracts with customers, disaggregated by major source.
|
| | | | | | | | | | | | | |
| | For the Three Months Ended September 30, 2019 | For the Three Months Ended September 30, 2018 |
| (Millions of Dollars) | Revenues from contracts with customers | | Other revenues (a) | Total operating revenues | Revenues from contracts with customers | | Other revenues (a) | Total operating revenues |
| CECONY | | | | | | | | |
| Electric | $2,582 | | $(38) | $2,544 | $2,631 | | $(60) | $2,571 |
| Gas | 263 | | 12 | 275 | 264 | | — |
| 264 |
| Steam | 54 | | 4 | 58 | 64 | | — |
| 64 |
| Total CECONY | $2,899 | | $(22) | $2,877 | $2,959 | | $(60) | $2,899 |
| O&R | | | | | | | | |
| Electric | 205 | | 5 | 210 | 215 | | (3) | 212 |
| Gas | 25 | | 6 | 31 | 31 | | 3 | 34 |
| Total O&R | $230 | | $11 | $241 | $246 | |
| $— |
| $246 |
| Clean Energy Businesses | | | | | | | | |
| Renewables | 193 | (b) | — |
| 193 | 68 | (b) | — |
| 68 |
| Energy services | 14 | | — |
| 14 | 24 | | — |
| 24 |
| Other | — |
| | 40 | 40 | — |
| | 89 | 89 |
| Total Clean Energy Businesses | $207 | | $40 | $247 | $92 | | $89 | $181 |
| Con Edison Transmission | 1 | | — |
| 1 | 1 | | — |
| 1 |
| Other (c) | — |
|
| (1) | (1) | — |
|
| 1 | 1 |
| Total Con Edison | $3,337 | | $28 | $3,365 | $3,298 | | $30 | $3,328 |
(a) For the Utilities, this includes revenue from alternative revenue programs, such as the revenue decoupling mechanisms under their New York electric and gas rate plans.For the Clean Energy Businesses, this includes revenue from wholesale services.
(b) Included within the totals for Renewables revenue at the Clean Energy Businesses is $3 millionfor the three months ended September 30, 2019 and 2018, of revenue related to engineering, procurement and construction services.
| |
| (c) | Parent company and consolidation adjustments. |
|
| | | | | | | | | | | | | |
| | For the Nine Months Ended September 30, 2019 | For the Nine Months Ended September 30, 2018 |
| (Millions of Dollars) | Revenues from contracts with customers | | Other revenues (a) | Total operating revenues | Revenues from contracts with customers | | Other revenues (a) | Total operating revenues |
| CECONY | | | | | | | | |
| Electric | $6,048 | | $126 | $6,174 | $6,106 | | $1 | $6,107 |
| Gas | 1,573 | | 32 | 1,605 | 1,516 | | 24 | 1,540 |
| Steam | 456 | | 13 | 469 | 467 | | 7 | 474 |
| Total CECONY | $8,077 | | $171 | $8,248 | $8,089 | | $32 | $8,121 |
| O&R | | | | | | | | |
| Electric | 488 | | 5 | 493 | 508 | | (3) | 505 |
| Gas | 178 | | 7 | 185 | 179 | | 7 | 186 |
| Total O&R | $666 | | $12 | $678 | $687 | | $4 | $691 |
| Clean Energy Businesses | | | | | | | | |
| Renewables | 465 | (b) | — |
| 465 | 273 | (b) | — |
| 273 |
| Energy services | 53 | | — |
| 53 | 65 | | — |
| 65 |
| Other | — |
| | 178 | 178 | — |
| | 235 | 235 |
| Total Clean Energy Businesses | $518 | | $178 | $696 | $338 | | $235 | $573 |
| Con Edison Transmission | 3 | | — |
| 3 | 3 | | — |
| 3 |
| Other (c) | — |
| | (2) | (2) | — |
| | — |
| — |
|
| Total Con Edison | $9,264 | | $359 | $9,623 | $9,117 | | $271 | $9,388 |
(a) For the Utilities, this includes revenue from alternative revenue programs, such as the revenue decoupling mechanisms under their New York electric and gas rate plans.For the Clean Energy Businesses, this includes revenue from wholesale services.
(b) Included within the totals for Renewables revenue at the Clean Energy Businesses is $9 millionand $100 millionfor the nine months ended September 30, 2019 and 2018, respectively, of revenue related to engineering, procurement and construction services.
| |
| (c) | Parent company and consolidation adjustments. |
|
| | | | | | |
| | 2019 | 2018 |
| (Millions of Dollars) | Unbilled contract revenue (a) | Unearned revenue (b) | | Unbilled contract revenue (a) | Unearned revenue (b) | |
| Beginning balance as of January 1, | $29 | $20 | | $58 | $87 | |
| Additions (c) | 63 | 2 | | 111 | 34 | |
| Subtractions (c) | 68 | 2 | (d) | 138 | 105 | (d) |
| Ending balance as of September 30, | $24 | $20 | | $31 | $16 | |
| |
| (a) | Unbilled contract revenue represents accumulated incurred costs and earned profits on contracts (revenue arrangements), which have been recorded as revenue, but have not yet been billed to customers, and which represent contract assets as defined in Topic 606. Substantially all accrued unbilled contract revenue is expected to be collected within one year. Unbilled contract revenue arises from the cost-to-cost method of revenue recognition. Unbilled contract revenue from fixed-price type contracts is converted to billed receivables when amounts are invoiced to customers according to contractual billing terms, which generally occur when deliveries or other performance milestones are completed. |
| |
| (b) | Unearned revenue represents a liability for billings to customers in excess of earned revenue, which are contract liabilities as defined in Topic 606. |
| |
| (c) | Additions for unbilled contract revenue and subtractions for unearned revenue represent additional revenue earned. Additions for unearned revenue and subtractions for unbilled contract revenue represent billings. Activity also includes appropriate balance sheet classification for the period. |
| |
| (d) | Of the subtractions from unearned revenue, $2 million and $50 million were included in the balance as of January 1, 2019 and 2018, respectively. |
As of September 30, 2019, the aggregate amount of the remaining fixed performance obligations of the Clean Energy Businesses under contracts with customers for energy services is $89 million, of which $53 million will be recognized within the next two years, and the remaining $36 million will be recognized pursuant to long-term service and maintenance agreements.
Utility Plant
General utility plant of Con Edison and CECONY included $95 million and $90 million, respectively, at September 30, 2019 and $100 million and $95 million, respectively, at December 31, 2018, related to a May 2018 acquisition of software licenses. The estimated aggregate annual amortization expense related to the software licenses for Con Edison and CECONY is $7 million. The accumulated amortization for Con Edison and CECONY was $8 million at September 30, 2019 and was $3 million at December 31, 2018.
Long-Lived and Intangible Assets
In January 2019, Pacific Gas and Electric Company (PG&E) filed in the United States Bankruptcy Court for the Northern District of California for reorganization under Chapter 11 of the U.S. Bankruptcy Code. The output of certain Con Edison Development renewable electric production projects with an aggregate generating capacity of 680 MW (AC) (PG&E Projects) is sold to PG&E under long-term power purchase agreements (PG&E PPAs). Most of the PG&E PPAs have contract prices that are higher than estimated market prices. PG&E, as a debtor in possession, may assume or reject the PG&E PPAs, subject to review by the bankruptcy court. In September 2019, PG&E submitted its plan of reorganization to the bankruptcy court. PG&E’s plan includes the assumption by PG&E of all of its power purchase agreements. PG&E’s plan is subject to, among other things: confirmation by the bankruptcy court by June 30, 2020 (or any extension of the date by which PG&E’s bankruptcy must be resolved for PG&E to participate in the insurance fund described below); approval by the California Public Utilities Commission (CPUC) of PG&E’s implementation of the plan and participation in the insurance fund; and PG&E obtaining funding for distributions under the plan. PG&E may revoke, withdraw or delay consideration of the plan prior to its confirmation by the bankruptcy court, and file subsequent amended plans of reorganization. In October 2019, the Ad Hoc PG&E senior note holder committee (Noteholders) and tort claimant committee (TCC) submitted to the bankruptcy court an alternative plan of reorganization for PG&E. The Noteholder/TCC plan also calls for PG&E to assume all of its power purchase agreements and participate in the insurance fund. The Noteholder/TCC plan is also subject to, among other things, confirmation by the bankruptcy court, approval by the CPUC and obtaining funding for distributions under the plan. The Noteholder/TCC plan can be revoked, amended, withdrawn or delayed. Bankruptcy court approval is required for a plan of reorganization to be sent to creditors for consideration.
In January and May 2019, FERC issued orders (which PG&E is challenging) affirming its jurisdiction to review and approve the modification or abrogation of wholesale power contracts that are the subject of rejection in bankruptcy. In June 2019, the bankruptcy court ruled that FERC does not have concurrent jurisdiction with it and that FERC’s January and May 2019 orders are of no force and effect in the bankruptcy proceeding. FERC and additional parties, including Con Edison Development, are challenging the bankruptcy court’s June 2019 ruling in appeals that are pending in the United States Court of Appeals for the Ninth Circuit.
In July 2019, California enacted a law addressing future California wildfires. The law includes provisions for the establishment of wildfire liquidity and insurance funds and possible limitation of future wildfire liabilities for California utilities. PG&E, Southern California Edison Company and San Diego Gas & Electric Company have agreed to participate in the insurance fund. PG&E’s participation will require bankruptcy court approval and is conditioned on, among other things, resolution of PG&E’s bankruptcy by June 30, 2020, and a determination by the CPUC that PG&E’s bankruptcy reorganization plan is consistent with the state’s climate goals as required under the California Renewables Portfolio Standard Program and related procurement requirements of the state.
The PG&E bankruptcy is an event of default under the PG&E PPAs. Unless the lenders for the related project debt otherwise agree, distributions from the related projects to Con Edison Development will not be made during the pendency of the bankruptcy. See “Reconciliation of Cash, Temporary Cash Investments and Restricted Cash,” below.
At September 30, 2019, Con Edison’s consolidated balance sheet included $827 million of net non-utility plant relating to the PG&E Projects, $1,075 million of intangible assets relating to the PG&E PPAs, $287 million of net non-utility plant of additional projects that secure the related project debt and $1,012 million of non-recourse related project debt. See Note C. Con Edison has tested whether its net non-utility plant relating to the PG&E Projects and intangible assets relating to the PG&E PPAs have been impaired. The projected future cash flows used in the test reflected Con Edison’s expectation that the PG&E PPAs are not likely to be rejected. Based on the test, Con Edison has determined that there was no impairment. If, in the future, one or more of the PG&E PPAs is rejected or any such rejection becomes likely, there will be an impairment of the related intangible assets and could be an impairment of the related non-utility plant. The amount of any such impairment could be material.
Acquisitions and Investments
For the nine months ended September 2019, the Clean Energy Businesses reclassified approximately $100 million related to the purchase price adjustments for the December 2018 acquisition by a Con Edison Development subsidiary of Sempra Solar Holdings, LLC. The adjustments primarily decreased property, plant and equipment and asset retirement obligations, and were recorded within the one year available to finalize the purchase price allocation, including working capital and other closing adjustments.
Earnings Per Common Share
Con Edison presents basic and diluted earnings per share (EPS) on the face of its consolidated income statement. Basic EPS is calculated by dividing earnings available to common shareholders (“Net income”income for common stock” on Con Edison’s consolidated income statement) by the weighted average number of Con Edison common shares outstanding during the period. In the calculation of diluted EPS, weighted average shares outstanding are increased for additional shares that would be outstanding if potentially dilutive securities were converted to common stock.
Potentially dilutive securities for Con Edison consist of restricted stock units and deferred stock units and stock options for which the average market price of the common shares for the period was greater than the exercise price.price and its common shares that are subject to a May 2019 forward sale agreement (see Note C). Before the issuance of common shares upon settlement of the forward sale agreement, the shares will be reflected in the company’s diluted earnings per share calculations using the treasury stock method. Under this method, the number of common shares used in calculating diluted earnings per share is deemed to be increased by the excess, if any, of the number of shares that would be issued upon physical settlement of the forward sale agreement over the number of shares that could be purchased by the company in the market (based on the average market price during the period) using the proceeds due upon physical settlement (based on the adjusted forward sale price at the end of the reporting period).
For the three and nine months ended September 30, 20172019 and 2016,2018, basic and diluted EPS for Con Edison are calculated as follows:
|
| | | | |
| | For the Three Months Ended September 30, | For the Nine Months Ended September 30, |
| (Millions of Dollars, except per share amounts/Shares in Millions) | 2017 | 2016 | 2017 | 2016 |
| Net income | $457 | $497 | $1,020 | $1,039 |
| Weighted average common shares outstanding – basic | 307.8 | 304.5 | 306.2 | 299.1 |
| Add: Incremental shares attributable to effect of potentially dilutive securities | 1.5 | 1.4 | 1.5 | 1.4 |
| Adjusted weighted average common shares outstanding – diluted | 309.3 | 305.9 | 307.7 | 300.5 |
| Net Income per common share – basic | $1.48 | $1.63 | $3.33 | $3.47 |
| Net Income per common share – diluted | $1.48 | $1.62 | $3.31 | $3.46 |
|
| | | | |
| | For the Three Months Ended September 30, | For the Nine Months Ended September 30, |
| (Millions of Dollars, except per share amounts/Shares in Millions) | 2019 | 2018 | 2019 | 2018 |
| Net income for common stock | $473 | $435 | $1,048 | $1,051 |
| Weighted average common shares outstanding – basic | 332.2 | 311.1 | 327.3 | 310.8 |
| Add: Incremental shares attributable to effect of potentially dilutive securities | 1.0 | 1.2 | 1.0 | 1.1 |
| Adjusted weighted average common shares outstanding – diluted | 333.2 | 312.3 | 328.3 | 311.9 |
| Net Income per common share – basic | $1.42 | $1.40 | $3.20 | $3.38 |
| Net Income per common share – diluted | $1.42 | $1.39 | $3.19 | $3.37 |
The computation of diluted EPS for the three and nine months ended September 30, 2018 excludes immaterial amounts of performance share awards that were not included because of their anti-dilutive effect.
Changes in Accumulated Other Comprehensive Income/(Loss) by Component
For the three and nine months ended September 30, 20172019 and 2016,2018, changes to accumulated other comprehensive income/(loss) (OCI) for Con Edison and CECONY are as follows:
|
| | | | | |
| | For the Three Months Ended September 30, |
| | Con Edison | CECONY |
| (Millions of Dollars) | 2019 | 2018 | 2019 | 2018 |
|
| Beginning balance, accumulated OCI, net of taxes (a) | $(11) | $(20) | $(5) | $(5) |
| Amounts reclassified from accumulated OCI related to pension plan liabilities, net of tax of $(1) for Con Edison in 2019 and 2018 (a)(b) | 1 | 2 | 1 | — |
|
| Current period OCI, net of taxes | 1 | 2 | 1 | — |
|
| Ending balance, accumulated OCI, net of taxes | $(10) | $(18) | $(4) | $(5) |
|
| | | | | |
| | For the Three Months Ended September 30, |
| | Con Edison | CECONY |
| (Millions of Dollars) | 2017 | 2016 | 2017 | 2016 |
|
| Beginning balance, accumulated OCI, net of taxes (a) | $(27) | $(33) | $(7) | $(8) |
| Amounts reclassified from accumulated OCI related to pension plan liabilities, net of tax of $(1) for Con Edison in 2017 and 2016 (a)(b) | 1 | 1 | 1 | — |
|
| Current period OCI, net of taxes | 1 | 1 | 1 | — |
|
| Ending balance, accumulated OCI, net of taxes | $(26) | $(32) | $(6) | $(8) |
| | | | For the Nine Months Ended September 30, | For the Nine Months Ended September 30, |
| | Con Edison | CECONY | Con Edison | CECONY |
| (Millions of Dollars) | 2017 | 2016 | 2017 |
| 2016 |
| 2019 | 2018 | 2019 |
| 2018 |
|
| Beginning balance, accumulated OCI, net of taxes (a) | $(27) | $(34) | $(7) | $(9) | $(16) | $(26) | $(5) | $(6) |
| OCI before reclassifications, net of tax of $1 for Con Edison in 2017 and 2016 | (2) | (1) | — |
| — |
| |
| Amounts reclassified from accumulated OCI related to pension plan liabilities, net of tax of $(2) for Con Edison in 2017 and 2016 (a)(b) | 3 | 1 | 1 | |
| OCI before reclassifications, net of tax of $(1) for Con Edison in 2019 and 2018 | | 2 | 3 | — |
| — |
|
| Amounts reclassified from accumulated OCI related to pension plan liabilities, net of tax of $(1) and $(2) for Con Edison in 2019 and 2018, respectively (a)(b) | | 4 | 5 | 1 | 1 |
| Current period OCI, net of taxes | 1 | 2 | 1 | 1 | 6 | 8 | 1 | 1 |
| Ending balance, accumulated OCI, net of taxes | $(26) | $(32) | $(6) | $(8) | $(10) | $(18) | $(4) | $(5) |
| |
| (a) | Tax reclassified from accumulated OCI is reported in the income tax expense line item of the consolidated income statement. |
| |
| (b) | For the portion of unrecognized pension and other postretirement benefit costs relating to the Utilities, costs are recorded into, and amortized out of, regulatory assets instead of OCI. The net actuarial losses and prior service costs recognized during the period are included in the computation of total periodic pension and other postretirement benefit cost. See Notes E and F. |
Reconciliation of Cash, Temporary Cash Investments and Restricted Cash
Cash, temporary cash investments and restricted cash are presented on a combined basis in the Companies’ consolidated statements of cash flows. At September 30, 2019 and 2018, cash, temporary cash investments and restricted cash for Con Edison and CECONY are as follows:
20 |
| | | | | | |
| | At September 30, |
| | Con Edison | CECONY |
| (Millions of Dollars) | 2019 | 2018 | 2019 |
| 2018 |
|
| Cash and temporary cash investments | $78 | $199 | $15 | $17 |
| Restricted cash (a) | 175 | 46 | — |
| — |
|
| Total cash, temporary cash investments and restricted cash | $253 | $245 | $15 | $17 |
| |
| (a) | Restricted cash included cash of Con Edison Development renewable electric production project subsidiaries ($174 million and $44 million at September 30, 2019 and 2018, respectively) that, under the related project debt agreements, is either restricted until the various maturity dates of the project debt to being used for normal operating expenses and capital expenditures, debt service, and required reserves or |
restricted as a result of the PG&E bankruptcy. During the pendency of the PG&E bankruptcy, unless the lenders for the related project debt otherwise agree, cash may not be distributed from the related projects to Con Edison Development. See “Long-Lived and Intangible Assets,” above, and Note C. In addition, restricted cash included O&R's New Jersey utility subsidiary, Rockland Electric Company transition bond charge collections, net of principal, interest, trustee and service fees ($1 million and $2 million at September 30, 2019 and 2018, respectively).
Note B —– Regulatory Matters
Rate Plans
Rockland Electric Company (RECO)
In February 2017,October 2019, CECONY, the staff of the New Jersey Board ofYork State Public Utilities (NJBPU) approvedService Commission (NYSPSC) and other parties entered into a stipulation of settlementJoint Proposal for a RECOCECONY electric and gas rate plan commencing March 2017.plans for the three-year period January 2020 through December 2022. The Joint Proposal is subject to NYSPSC approval. The following table containstables contain a summary of the electric rate plan.plans.
|
| | |
RECOCECONY Electric | |
|
| Effective period | | March 2017 (a)January 2020 – December 2022 (c) |
| Base rate changes (a) | | Yr. 1 - $1.7– $113 million
Yr. 2 – $370 million
Yr. 3 – $326 million |
AmortizationAmortizations to income of net regulatory (assets) and liabilities (b) | | $0.2Yr. 1 – $267 million over three years and continuation
Yr. 2 – $269 million
Yr. 3 – $272 million |
| Other revenue sources | | Retention of $(25.6)$75 million of deferred storm costs over four years expiring July 31, 2018 (b)annual transmission congestion revenues.
Potential earnings adjustment mechanism incentives for energy efficiency and other potential incentives of up to: Yr. 1 - $69 million; Yr. 2 - $74 million; and Yr. 3 - $79 million.
|
| Revenue decoupling mechanism | | Continuation of reconciliation of actual to authorized electric delivery revenues. |
| Recoverable energy costs | | CurrentContinuation of current rate recovery of purchased power and fuel costs. |
| Negative revenue adjustments | | Potential charges if certain performance targets relating to service, reliability, safety and other matters are not met: Yr. 1 - $450 million; Yr. 2 - $461 million; and Yr. 3 - $476 million. |
| Cost reconciliations | | NoneContinuation of reconciliation of expenses for pension and other postretirement benefits, variable-rate debt, major storms, property taxes (d), municipal infrastructure support costs (e), the impact of new laws and environmental site investigation and remediation to amounts reflected in rates. (f) |
| Net utility plant reconciliations | | Target levels reflected in rates:
Electric average net plant target excluding advanced metering infrastructure (AMI): Yr. 1 - $24,572 million; Yr. 2 - $25,366 million; Yr. 3 - $26,197 million AMI: Yr. 1 - $572 million; Yr. 2 - $740 million; Yr. 3 - $806 million (g) |
| Average rate base | | Yr. 1 - $178.7$21,660 million
Yr. 2 - $22,783 million
Yr. 3 - $23,926 million |
| Weighted average cost of capital (after-tax) | | 7.476.61 percent |
| Authorized return on common equity | | 9.68.80 percent |
| Earnings sharing | | Most earnings above an annual earnings threshold of 9.3 percent are to be applied to reduce regulatory assets for environmental remediation and other costs accumulated in the rate year. |
| Cost of long-term debt | | 5.374.63 percent |
| Common equity ratio | | 49.748 percent |
| |
| (a) | Effective until a new rate plan approvedBase rates reflect recovery by the NJBPU goes into effect.company of certain costs of its energy efficiency, Reforming the Energy Vision demonstration projects, non-wire alternative projects (including the Brooklyn Queens demand management program), and off-peak electric vehicle charging programs (Yr. 1 - $206 million; Yr. 2 - $245 million; and Yr. 3 - $251 million) over a ten-year period, including the overall pre-tax rate of return on such costs. |
| |
| (b) | In January 2016,Amounts reflect amortization of the NJBPU approved RECO’s plan2018 tax savings under the federal Tax Cuts and Jobs Act of 2017 (TCJA) allocable to spend $15.7CECONY’s electric customers ($377 million) over a three-year period ($126 million annually), the protected portion of the regulatory liability for excess deferred income taxes allocable to CECONY’s electric customers ($1,663 million) over the remaining lives of the related assets ($49 million in Yr. 1, $50 million in Yr. 2, and $53 million in Yr. 3) and the unprotected portion of the net regulatory liability ($784 million) over five years ($157 million annually). Amounts also reflect amortization of the regulatory asset for deferred MTA power reliability costs ($238 million) over a 5-year period ($48 million annually). |
| |
| (c) | If at the end of any semi-annual period ending June 30 and December 31, Consolidated Edison Inc.’s investments in its non-utility businesses exceed 15 percent of its total consolidated revenues, assets or cash flow, or if the ratio of holding company debt to total |
consolidated debt rises above 20 percent, CECONY is required to notify the NYSPSC and submit a ring-fencing plan or a demonstration why additional ring-fencing measures are not necessary.
| |
| (d) | Deferrals for property taxes are limited to 90 percent of the difference from amounts reflected in rates, subject to an annual maximum for the remaining difference of not more than a maximum number of basis points impact on return on common equity: Yr. 1 - 10.0 basis points; Yr. 2 - 7.5 basis points; and Yr. 3 - 5.0 basis points. |
| |
| (e) | In general, if actual expenses for municipal infrastructure support (other than company labor) are below the amounts reflected in rates the company will defer the difference for credit to customers, and if the actual expenses are above the amount reflected in rates the company will defer for recovery from customers 80 percent of the difference subject to a maximum deferral, subject to certain exceptions, of 15 percent of the amount reflected in rates. |
| |
| (f) | In addition, the NYSPSC staff has commenced a focused operations audit to investigate the income tax accounting of CECONY and other New York utilities. Any NYSPSC-ordered adjustment to CECONY’s income tax accounting will be refunded to or collected from customers, as determined by the NYSPSC. |
| |
| (g) | Reconciliation of net utility plant for AMI will be done on a combined basis for electric and gas. |
|
| | |
| CECONY Gas | |
|
| Effective period | | January 2020 – December 2022 (c) |
| Base rate changes (a) | | Yr. 1 – $84 million
Yr. 2 – $122 million
Yr. 3 – $167 million |
| Amortizations to income of net regulatory liabilities (b) | | Yr. 1 – $45 million
Yr. 2 – $43 million
Yr. 3 – $10 million |
| Other revenue sources | | Retention of annual revenues from non-firm customers of up to $65 million and 15 percent of any such revenues above $65 million.
Potential earnings adjusted mechanism incentives for energy efficiency and other potential incentives of up to Yr. 1 - $20 million; Yr. 2 - $22 million; and Yr. 3 - $25 million |
| Revenue decoupling mechanism | | Continuation of reconciliation of actual to authorized gas delivery revenues, modified to be calculated based upon revenue per customer class instead of revenue per customer. |
| Recoverable energy costs | | Continuation of current rate recovery of purchased gas costs. |
| Negative revenue adjustments | | Potential charges if performance targets relating to service, safety and other matters are not met: Yr. 1 - $81 million; Yr. 2 - $88 million; and Yr. 3 - $96 million. |
| Cost reconciliations | | Continuation of reconciliation of expenses for pension and other postretirement benefits, variable-rate debt, major storms, property taxes (d), municipal infrastructure support costs (e), the impact of new laws and environmental site investigation and remediation to amounts reflected in rates. (f) |
| Net utility plant reconciliations | | Target levels reflected in rates:
Gas average net plant target excluding AMI: Yr. 1 - $8,123 million; Yr. 2 - $8,861 million; Yr. 3 - $9,600 million AMI: Yr. 1 - $142 million; Yr. 2 - $183 million; Yr. 3 - $211 million (g) |
| Average rate base | | Yr. 1 - $7,171 million
Yr. 2 - $7,911 million
Yr. 3 - $8,622 million |
Weighted average cost of capital over three years(after-tax) | | 6.61 percent |
| Authorized return on common equity | | 8.80 percent |
| Earnings sharing | | Most earnings above an annual earnings threshold of 9.3 percent are to harden its electric system against storms,be applied to reduce regulatory assets for environmental remediation and other costs accumulated in the rate year. |
| Cost of long-term debt | | 4.63 percent |
| Common equity ratio | | 48 percent |
| |
| (a) | At the NYSPSC’s option, the gas base rate increases shown above may be implemented with increases of $47 million in Yr. 1; $176 million in Yr. 2; and $170 million in Yr. 3. Base rates reflect recovery by the company of certain costs of which RECO, beginningits energy efficiency program (Yr. 1 - $30 million; Yr. 2 - $37 million; and Yr. 3 - $40 million) over a ten-year period, including the overall pre-tax rate of return on such costs. |
| |
| (b) | Amounts reflect amortization of the remaining 2018 TCJA tax savings allocable to CECONY’s gas customers ($63 million) over a two year period ($32 annually), the protected portion of the regulatory liability for excess deferred income taxes allocable to CECONY’s gas customers ($725 million) over the remaining lives of the related assets ($14 million in 2017, is collecting through a customer surcharge.Yr. 1, $14 million in Yr. 2, and $12 million in Yr. 3) and the unprotected portion of the net regulatory liability ($107 million) over five years ($21 million annually) |
| |
| (c)-(g) | See footnotes (c), (d), (e), (f) and (g) to the table under “CECONY Electric,” above. |
O&R New York – Electric and Gas
In September 2017, RECO,March 2019, the NYSPSC approved the November 2018 Joint Proposal for new electric and gas rates. The Joint Proposal provides for electric rate increases of $13.4 million, $8.0 million and $5.8 million, effective January 1, 2019, 2020 and 2021, respectively. The Joint Proposal provides for a gas rate decrease of $7.5 million, effective January 1, 2019, and gas rate increases of $3.6 million and $0.7 million, effective January 1, 2020 and 2021, respectively.
Rockland Electric Company (RECO)
In October 2019, the New Jersey Division of Rate Counsel andstaff submitted testimony in the New Jersey Board of Public Utilities entered into a settlement agreement,proceeding in which is subject to FERC approval, that increases RECO's annual transmission revenue requirement from $11.8RECO requested an electric rate increase, effective February 2020. The Division of Rate Counsel staff testimony supports an electric rate increase of $5.8 million to $17.7 million, effective April 2017. The revenue requirement reflects areflecting, among other things, an 8.9 percent return on common equity and a common equity ratio of 10.047.14 percent. In October 2019, RECO filed an update to the request it filed in May 2019. The company increased its requested February 2020 rate increase from $19.9 million to $20.3 million. The updated filing reflects an increase to the common equity ratio from 49.93 percent to 50.16 percent and a decrease in the return on common equity from 10.00 percent to 9.60 percent.
Other Regulatory Matters
OnIn August 16,and November 2017, the New York State Public Service Commission (NYSPSC)NYSPSC issued an orderorders in its proceeding investigating an April 21, 2017 Metropolitan Transportation Authority (MTA) subway power outage. The orderorders indicated that the investigation determined that the outage was caused by a failure of CECONY’s electricity supply to a subway station, which led to a loss of the subway signals, and that one of the secondary services to the MTA facility had been improperly rerouted and was not properly documented by the company. The orderorders also indicated that the loss of power to the subway station affected multiple subway lines and caused widespread delays across the subway system. Pursuant to the order,orders, the company iswas required to take certain actions, including performing inspections ofinspecting, repairing and installing certain electrical equipment that serves the MTAsubway system, analyzing power supply and power quality events affecting the MTA’s signaling services, providing new monitoring and other equipment and filing monthly reports with the NYSPSC on all of the company's activities related to the MTAsubway system. The company completed the required actions in 2018. The company’s costs related to this matter in excess of those reflected in its current electric rate plan were deferred as a regulatory asset and are addressed in the October 2019 Joint Proposal (see footnote (b) to the CECONY - Electric table under “Rate Plans,” above).
In July 2017,August 2018, the ChairmanNYSPSC ordered CECONY to begin on January 1, 2019 to credit the company's electric and gas customers, and to begin on October 1, 2018 to credit its steam customers, with the net benefits of the NYSPSC notifiedfederal Tax Cuts and Jobs Act of 2017 (TCJA) as measured based on amounts reflected in its rate plans prior to the company that the April 21, 2017 subway power outage incident will likely result in a prudence reviewenactment of the reasonablenessTCJA in December 2017. The net benefits include the revenue requirement impact of the reduction in the corporate federal income tax rate to 21 percent, the elimination for utilities of bonus depreciation and the amortization of excess deferred federal income taxes. CECONY estimates that its credit of net benefits of the TCJA to its electric, gas and steam customers in 2019 will amount to $259 million, $113 million and $25 million, respectively. CECONY’s net benefits prior to January 1, 2019 and its net regulatory liability for future income taxes, including both the protected and unprotected portions, allocable to the company’s electric and gas customers are addressed in the October 2019 Joint Proposal (see footnote (b) to the CECONY - Electric and Gas tables under “Rate Plans,” above). CECONY’s net benefits prior to October 1, 2018 allocable to the company’s steam customers ($15 million) are being amortized over a three-year period. CECONY’s net regulatory liability for future income taxes, including both the protected and unprotected portions, allocable to the company’s steam customers ($185 million) is being amortized over the remaining lives of the related assets (with the amortization period for the unprotected portion subject to review in its next steam rate proceeding).
In January 2018, the NYSPSC issued an order initiating a focused operations audit of the income tax accounting of certain utilities, including CECONY and O&R. The Utilities are unable to estimate the amount or range of their possible loss related to this matter. At September 30, 2019, the Utilities had not accrued a liability related to this matter.
In March 2018, Winter Storms Riley and Quinn caused damage to the Utilities’ electric distribution systems and interrupted service to approximately 209,000 CECONY customers, 93,000 O&R customers and 44,000 RECO customers. At September 30, 2019, CECONY's actionscosts related to March 2018 storms, including Riley and conduct.Quinn, amounted to $134 million, including operation and maintenance expenses reflected in its electric rate plan ($15 million), operation and maintenance expenses charged against a storm reserve pursuant to its electric rate plan
($84 million), capital expenditures ($29 million) and removal costs ($6 million). At September 30, 2019, O&R and RECO costs related to 2018 storms amounted to $43 million and $17 million, respectively, most of which were deferred as regulatory assets pursuant to their electric rate plans. In January 2019, O&R began recovering its deferred storm costs over a six year period in accordance with its New York electric rate plan. The order didNYSPSC investigated the preparation and response to the storms by CECONY, O&R, and other New York electric utilities, including all aspects of their emergency response plans. In April 2019, following the issuance of a NYSPSC staff report on the investigation, the NYSPSC ordered the utilities to show cause why the NYSPSC should not commence a prudence reviewpenalty action against them for violating their emergency response plans. The Utilities are unable to estimate the amount or address cost recovery.range of their possible loss related to this matter. At September 30, 2019, the Utilities had not accrued a liability related to this matter.
In May 2018, FERC denied a complaint the NJBPU filed with FERC seeking the re-allocation to CECONY of certain PJM Interconnection LLC (PJM) transmission costs that had been allocated to the company prior to April 2017 when transmission service provided to the company pursuant to the PJM open access transmission tariff terminated. The transmission service terminated because the company did not exercise its option to continue the service following a series of requests PJM had submitted to FERC that substantially increased the charges for the transmission service. CECONY challenged each of these requests. FERC rejected all but one of CECONY’s protests. In June 2015 and May 2016, CECONY filed appeals of certain FERC decisions with the U.S. Court of Appeals. In July 2018, FERC established a settlement proceeding relating to the allocation of PJM transmission costs. Under the New York State Administrative Procedure Act, the order could not remain in effect for more than 90 days without further actionCECONY’s electric rate plan, unless and until changed by the NYSPSC, because it was adopted on an emergency basis. At its October 19, 2017 meeting,the company will recover all charges incurred associated with the transmission service.
In July 2018, the NYSPSC approved another order incommenced an investigation into the rupture of a CECONY steam main (see Note H).
In March 2019, the NYSPSC ordered CECONY to show cause why the NYSPSC should not commence a penalty action and prudence proceeding against CECONY for alleged violations of gas operator qualification, performance, and inspection requirements. The company is seeking to resolve this proceeding. Thematter through settlement negotiations with the NYSPSC has not yet issued this other order.staff. Any settlement would be subject to NYSPSC approval. The company is unable to estimate the amount or range of its possible costsloss related to this matter. At September 30, 2019, the company had not accrued a liability related to this matter.
On July 13, 2019, electric service was interrupted to approximately 72,000 CECONY customers on the west side of Manhattan. The NYSPSC and the Northeast Power Coordinating Council, a regional reliability entity, are investigating the July 13, 2019 power outage. The NYSPSC is also investigating other CECONY power outages that occurred in July 2019. Pursuant to the reliability performance provisions of its electric rate plan, as a result of the July 13, 2019 power outage, the company is subject to a $5 million negative revenue adjustment (which it recognized in the third quarter of 2019). The company is unable to estimate the amount or range of its possible additional loss related to the power outages. At September 30, 2019, the company had accrued a $5 million liability related to the power outages.
Regulatory Assets and Liabilities
Regulatory assets and liabilities at September 30, 20172019 and December 31, 20162018 were comprised of the following items:
| | | Con Edison | | CECONY | Con Edison | | CECONY |
| (Millions of Dollars) | 2017 | 2016 | | 2017 |
| 2016 |
| 2019 |
| 2018 | | 2019 |
| 2018 |
|
| Regulatory assets | | | | | | | |
| Unrecognized pension and other postretirement costs | $2,626 | $2,874 |
| $2,476 | $2,730 | $1,919 | $2,238 |
| $1,816 | $2,111 |
| Future income tax | 2,419 | 2,439 |
| 2,308 | 2,325 | |
| Environmental remediation costs | 803 | 823 |
| 690 | 711 | 774 | 810 |
| 685 | 716 |
| Revenue taxes | 341 | 295 |
| 325 | 280 | 315 | 291 |
| 302 | 278 |
| MTA power reliability deferral | | 245 | 229 | | 245 | 229 |
| Property tax reconciliation | | 160 | 101 |
| 150 | 86 |
| Deferred derivative losses | 88 | 48 | | 78 | 42 | 99 | 17 | | 90 | 11 |
| Municipal infrastructure support costs | | 80 | 67 | | 80 | 67 |
| Pension and other postretirement benefits deferrals | 70 | 38 | | 45 | 7 | 77 | 73 | | 55 | 56 |
| Municipal infrastructure support costs | 57 | 44 | | 57 | 44 | |
| Deferred storm costs | 43 | 56 |
| — |
| 3 | 69 | 76 |
| — |
| — |
|
| System peak reduction and energy efficiency programs | | 60 | 72 | | 59 | 70 |
| Meadowlands heater odorization project | | 35 | 36 | | 35 | 36 |
| Brooklyn Queens demand management program | | 35 | 39 | | 35 | 39 |
| Unamortized loss on reacquired debt | 39 | 43 |
| 37 | 41 | 30 | 36 |
| 28 | 34 |
| Indian Point Energy Center program costs | 32 | 50 | | 32 | 50 | |
| O&R property tax reconciliation | 29 | 37 |
| — |
| — |
| |
| Brooklyn Queens demand management program | 28 | 29 | | 28 | 29 | |
| Preferred stock redemption | 24 | 25 | | 24 | 25 | 22 | 23 | | 22 | 23 |
| Surcharge for New York State assessment | 18 | 28 | | 16 | 26 | |
| Net electric deferrals | 13 | 24 |
| 13 | 24 | |
| Recoverable REV demonstration project costs | | 21 | 20 | | 18 |
| Gate station upgrade project | | 19 | 17 | | 19 | 17 |
| Workers’ compensation | 12 | 13 | | 12 | 13 | 5 | 5 | | 5 |
| O&R transition bond charges | 10 | 15 |
| — |
| — |
| — |
| 2 |
| — |
| — |
|
| Recoverable energy costs | 4 | 42 | | 4 | 38 | |
| Other | 113 | 101 |
| 103 | 85 | 194 | 142 |
| 187 | 127 |
| Regulatory assets – noncurrent | 6,769 | 7,024 |
| 6,248 | 6,473 | 4,159 | 4,294 |
| 3,831 | 3,923 |
| Deferred derivative losses | 81 | 91 |
| 75 | 86 | 68 | 36 |
| 57 | 29 |
| Recoverable energy costs | 28 | 9 |
| 25 | 4 | 15 | 40 |
| 12 | 35 |
| Regulatory assets – current | 109 | 100 |
| 100 | 90 | 83 | 76 |
| 69 | 64 |
| Total Regulatory Assets | $6,878 | $7,124 |
| $6,348 | $6,563 | $4,242 | $4,370 |
| $3,900 | $3,987 |
| Regulatory liabilities |
|
|
|
|
|
|
|
| Future income tax | | $2,448 | $2,515 | | $2,302 | $2,363 |
| Allowance for cost of removal less salvage | $798 | $755 |
| $671 | $641 | 952 | 928 |
| 808 | 790 |
| TCJA net benefits* | | 462 | 434 | | 444 | 411 |
| Net unbilled revenue deferrals | | 145 | 117 |
| 145 | 117 |
| Energy efficiency portfolio standard unencumbered funds | | 123 | 127 | | 119 | 122 |
| Pension and other postretirement benefit deferrals | 202 | 193 | | 174 | 162 | 67 | 62 | | 41 | 40 |
| Net unbilled revenue deferrals | 166 | 145 |
| 166 | 145 | |
| Property tax reconciliation | 140 | 178 |
| 140 | 178 | |
| Property tax refunds | | 45 | 45 | | 45 |
| Net proceeds from sale of property | | 44 | 6 | | 44 | 6 |
| System benefit charge carrying charge | | 43 | 27 | | 38 | 24 |
| Earnings sharing - electric, gas and steam | | 26 | 36 |
| 19 | 27 |
| BQDM and REV Demo reconciliations | | 25 | 18 | | 24 | 18 |
| Settlement of prudence proceeding | | 15 | 37 |
| 15 | 37 |
| Settlement of gas proceedings | | 11 | 15 | | 11 | 15 |
| Unrecognized other postretirement costs | 84 | 60 | | 84 | 60 | 5 | 7 | | — |
| 7 |
| Settlement of prudence proceeding | 73 | 95 |
| 73 | 95 | |
| Carrying charges on repair allowance and bonus depreciation | 49 | 68 | | 48 | 67 | 4 | 21 | | 4 | 21 |
| New York State income tax rate change | 48 | 61 |
| 48 | 60 | 3 | 17 |
| 3 | 17 |
| Variable-rate tax-exempt debt – cost rate reconciliation | 36 | 55 | | 32 | 48 | |
| Property tax refunds | 28 | 1 | | 28 | 1 | |
| Settlement of gas proceedings | 27 | | 27 | |
| Base rate change deferrals | 26 | 40 |
| 26 | 40 | 1 | 10 |
| 1 | 10 |
| Earnings sharing - electric, gas and steam | 24 | 39 |
| 15 | 28 | |
| Net utility plant reconciliations | 11 | 16 |
| 8 | 15 | |
| Property tax reconciliation | | — |
| 36 |
| — |
| 36 |
| Other | 161 | 172 |
| 133 | 145 | 171 | 183 |
| 137 | 152 |
| Regulatory liabilities – noncurrent | 1,873 | 1,905 |
| 1,673 | 1,712 | 4,590 | 4,641 |
| 4,200 | 4,258 |
| Refundable energy costs | 29 | | 9 | 5 | 36 | 31 | | 8 |
| Deferred derivative gains | | 33 | 30 |
| 32 | 29 |
| Revenue decoupling mechanism | 27 | 71 |
| 27 | 61 | 24 | 53 |
| 16 | 36 |
| Deferred derivative gains | 2 | 28 |
| 2 | 24 | |
| Regulatory liabilities – current | 58 | 128 |
| 38 | 90 | 93 | 114 |
| 56 | 73 |
| Total Regulatory Liabilities | $1,931 | $2,033 |
| $1,711 | $1,802 | $4,683 | $4,755 |
| $4,256 | $4,331 |
* See "Other Regulatory Matters," above.
Note C —– Capitalization
In February 2019, Con Edison borrowed $825 million under a two-year variable-rate term loan to fund the repayment of a six-month variable-rate term loan. In June 2019, Con Edison pre-paid $150 million of the amount borrowed.
In March 2017,2019, Con Edison issued 5,649,369 shares of its common stock for $425 million upon physical settlement of the remaining shares subject to its November 2018 forward sale agreements.
In April 2019, CECONY redeemed at maturity $475 million of 6.65 percent 10-year debentures.
In May 2019, Con Edison entered into a forward sale agreement relating to 5,800,000 shares of its common stock. In June 2019, the company issued 4,750,000 shares for $400 million upon physical settlement of shares subject to the forward sale agreement. At September 30, 2019, 1,050,000 shares remain subject to the forward sale agreement. The company expects the remaining shares under the forward sale agreement to settle by December 28, 2020. The company or the forward purchaser may accelerate the forward sale agreement upon the occurrence of certain events. On a settlement date, if the company decides to physically settle, it will issue shares to the forward purchaser at the then-applicable forward sale price. The forward sale price is equal to $84.83 per share subject to adjustment on a daily basis based on a floating interest rate factor less a spread and will be subject to decrease by amounts related to expected dividends. The remaining shares under the forward sale agreement will be physically settled, unless the company elects cash or net share settlement (which it has the right to do, subject to certain conditions, other than in limited circumstances). In the event the company elects to cash settle or net share settle, the settlement amount will be generally related to (1)(a) the market value of the common stock during the unwind period under the forward sale agreement minus (b) the applicable forward sale price; multiplied by (2) the number of shares subject to such cash settlement or net share settlement. If this settlement amount is a negative number, the forward purchaser will pay the company the absolute value of that amount or deliver to the company a number of shares having a value equal to the absolute value of such amount. If this settlement amount is a positive number, the company will pay the forward purchaser that amount or deliver to the forward purchaser a number of shares having a value equal to such amount.
In May 2019, CECONY issued $700 million aggregate principal amount of 2.004.125 percent debentures, due 2020, and prepaid2049.
In May 2019, O&R’s New Jersey utility subsidiary paid the $400remaining $1 million variable rate term loan that was to matureprincipal amount of Transition Bonds issued in 2018. Also, in March 2017,2004.
In May 2019, a Con Edison
Development subsidiary issued $97borrowed $464 million at a variable-rate, due 2026, secured by equity interests in solar electric production projects. The company has entered into fixed-rate interest rate swaps in connection with this borrowing. See Note L.
In September 2019, O&R agreed to issue in November 2019 $43 million aggregate principal amount of 4.453.73 percent senior notes,debentures, due 2042, secured by the company’s Upton County Solar project. In June 2017, CECONY issued $5002049 and to issue in December 2019 $44 million aggregate principal amount of 3.8752.94 percent debentures, due 2047. 2029 and $38 million aggregate principal amount of 3.46 percent debentures, due 2039.
In August 2017,October 2019, a Con Edison Development subsidiary issued 4.1$303 million common shares resulting in net proceedsaggregate principal amount of $343 million, after issuance expenses, that were invested3.82 percent senior notes, due 2038, secured by Con Edison in its subsidiaries, principally CECONYthe company's Panoche Valley and the Clean Energy Businesses, for funding of their construction expenditures and for other general corporate purposes.
Wistaria Solar renewable electric production projects.
The carrying amounts and fair values of long-term debt at September 30, 20172019 and December 31, 20162018 were:
|
| | | | |
| (Millions of Dollars) | 2019 | 2018 |
| Long-Term Debt (including current portion) (a) | Carrying Amount | Fair Value | Carrying Amount | Fair Value |
| Con Edison | $19,451 | $22,412 | $18,145 | $18,740 |
| CECONY | $14,374 | $17,047 | $14,151 | $14,685 |
|
| | | | |
| (Millions of Dollars) | 2017 | 2016 |
| Long-Term Debt (including current portion) (a) | Carrying Amount | Fair Value | Carrying Amount | Fair Value |
| Con Edison | $15,338 | $17,195 | $14,774 | $16,093 |
| CECONY | $12,571 | $14,213 | $12,073 | $13,268 |
| |
| (a) | Amounts shown are net of unamortized debt expense and unamortized debt discount of $137$167 million and $115$141 million for Con Edison and CECONY, respectively, as of September 30, 20172019 and $134$185 million and $113$139 million for Con Edison and CECONY, respectively, as of December 31, 2016.2018. |
FairThe fair values of the Companies' long-term debt have been estimated primarily using available market information. For Con Edison, $16,559 millioninformation and $636 million of the fair value of long-term debt at September 30, 20172019 are classified as Level 2 and Level 3, respectively. For CECONY, $13,577 million and $636(see Note M).
At December 31, 2018, the Clean Energy Businesses had $2,076 million of non-recourse project debt secured by the fair valuepledge of the applicable renewable energy production projects, of which $1,965 million was included in long-term debt atand $111 million was included in long-term debt due within one year in Con Edison's consolidated balance sheet. As a result of the January 2019 PG&E bankruptcy (see "Long-Lived and Intangible Assets" in Note A), during the first quarter of 2019, Con Edison reclassified on its consolidated balance sheet the PG&E-related project debt that was included in long-term debt to long-term debt due within one year. At September 30, 2017 are classified as Level 2 and Level 3, respectively (see Note L). The $6362019, long-term debt due within one year included $1,012 million of long-termPG&E-related project debt. The lenders for the PG&E-related project debt classified as Level 3may, upon written notice, declare principal and interest on the PG&E-related project debt to be due and payable immediately and, if such amounts are not timely paid, foreclose on the related projects. The company is CECONY’s tax-exempt, auction-rate securities forseeking to negotiate agreements with the PG&E-related project debt lenders pursuant to which the market is highly illiquid and there is a lack of observable inputs.lenders would defer exercising these remedies.
Note D —– Short-Term Borrowing
At September 30, 2017,2019, Con Edison had $356$1,300 million of commercial paper outstanding of which $147$930 million was outstanding under CECONY’s program. The weighted average interest rate at September 30, 20172019 was 1.32.3 percent for both Con Edison and CECONY. At December 31, 2016,2018, Con Edison had $1,054$1,741 million of commercial paper outstanding of which $600$1,192 million was outstanding under CECONY’s program. The weighted average interest rate at December 31, 20162018 was 1.03.0 percent for both Con Edison and CECONY.
At September 30, 20172019 and December 31, 2016, no2018, 0 loans were outstanding under the Companies' December 2016 credit agreement (Credit Agreement). An immaterial amount and $2 million (including $2 million for CECONY) of letters of credit were outstanding under the Credit Agreement as of September 30, 20172019 and December 31, 2016, respectively.2018. In April 2019, the termination date of the Credit Agreement was extended from December 2022 to December 2023 with respect to banks with aggregate commitments of $2,200 million.
Note E —– Pension Benefits
Total Periodic Benefit Cost
The components of the Companies’ total periodic benefit costscost for the three and nine months ended September 30, 20172019 and 20162018 were as follows:
|
| | | | |
| | For the Three Months Ended September 30, |
| | Con Edison | CECONY |
| (Millions of Dollars) | 2019 | 2018 | 2019 | 2018 |
| Service cost – including administrative expenses | $62 | $72 | $58 | $68 |
| Interest cost on projected benefit obligation | 150 | 140 | 141 | 131 |
| Expected return on plan assets | (247) | (258) | (234) | (245) |
| Recognition of net actuarial loss | 130 | 172 | 123 | 163 |
| Recognition of prior service cost/(credit) | (4) | (4) | (5) | (5) |
| TOTAL PERIODIC BENEFIT COST | $91 | $122 | $83 | $112 |
| Cost capitalized | (26) | (32) | (24) | (30) |
| Reconciliation to rate level | (5) | (22) | (4) | (24) |
| Total expense recognized | $60 | $68 | $55 | $58 |
|
| | | | | |
| | For the Three Months Ended September 30, |
| | Con Edison | CECONY |
| (Millions of Dollars) | 2017 | 2016 | 2017 | 2016 |
|
| Service cost – including administrative expenses | $66 | $69 | $61 | $65 |
| Interest cost on projected benefit obligation | 148 | 149 | 139 | 140 |
| Expected return on plan assets | (243) | (237) | (229) | (225) |
| Recognition of net actuarial loss | 149 | 149 | 141 | 141 |
| Recognition of prior service costs | (4) | 1 | (5) | — |
|
| TOTAL PERIODIC BENEFIT COST | $116 | $131 | $107 | $121 |
| Cost capitalized | (40) | (51) | (37) | (49) |
| Reconciliation to rate level | (14) | 10 | (16) | 13 |
| Cost charged to operating expenses | $62 | $90 | $54 | $85 |
|
| | | | |
| | For the Nine Months Ended September 30, |
| | Con Edison | CECONY |
| (Millions of Dollars) | 2019 | 2018 | 2019 | 2018 |
| Service cost – including administrative expenses | $187 | $218 | $175 | $204 |
| Interest cost on projected benefit obligation | 451 | 420 | 423 | 394 |
| Expected return on plan assets | (741) | (775) | (702) | (734) |
| Recognition of net actuarial loss | 389 | 516 | 369 | 488 |
| Recognition of prior service cost/(credit) | (13) | (13) | (15) | (15) |
| TOTAL PERIODIC BENEFIT COST | $273 | $366 | $250 | $337 |
| Cost capitalized | (80) | (94) | (76) | (89) |
| Reconciliation to rate level | (12) | (68) | (10) | (74) |
| Total expense recognized | $181 | $204 | $164 | $174 |
|
| | | | |
| | For the Nine Months Ended September 30, |
| | Con Edison | CECONY |
| (Millions of Dollars) | 2017 | 2016 | 2017 | 2016 |
| Service cost – including administrative expenses | $197 | $207 | $184 | $194 |
| Interest cost on projected benefit obligation | 444 | 447 | 416 | 419 |
| Expected return on plan assets | (726) | (711) | (689) | (674) |
| Recognition of net actuarial loss | 446 | 447 | 423 | 424 |
| Recognition of prior service costs | (13) | 3 | (14) | 1 |
| TOTAL PERIODIC BENEFIT COST | $348 | $393 | $320 | $364 |
| Cost capitalized | (134) | (157) | (125) | (148) |
| Reconciliation to rate level | (28) | 35 | (32) | 39 |
| Cost charged to operating expenses | $186 | $271 | $163 | $255 |
Components of net periodic benefit cost other than service cost are presented outside of operating income on the Companies' consolidated income statements, and only the service cost component is eligible for capitalization. Accordingly, the service cost component is included in the line "Other operations and maintenance" and the non-service cost components are included in the line "Other deductions" in the Companies' consolidated income statements.
Expected Contributions
Based on estimates as of September 30, 2017,2019, the Companies expect to make contributions to the pension plans during 20172019 of $450$350 million (of which $412$318 million is to be contributedmade by CECONY). The Companies’ policy is to fund the total periodic benefit cost of the qualified plan to the extent tax deductible and to also contribute to the non-qualified supplemental plans. During the first nine months of 2017,2019, the Companies contributed $446$346 million to the pension plans (of which $409$315 million was contributedmade by CECONY). CECONY also contributed $14$15 million to itsthe external trust for its non-qualified supplemental plans.plan.
Note F —– Other Postretirement Benefits
Total Periodic Benefit Cost
The components of the Companies’ total periodic other postretirement benefit costscost/(credit) for the three and nine months ended September 30, 20172019 and 20162018 were as follows:
|
| | | | | |
| | For the Three Months Ended September 30, |
| Con Edison | CECONY |
| (Millions of Dollars) | 2019 | 2018 | 2019 |
| 2018 |
| Service cost | $4 | $5 | $3 | $3 |
| Interest cost on accumulated other postretirement benefit obligation | 11 | 11 | 9 | 9 |
| Expected return on plan assets | (16) | (18) | (14) | (16) |
| Recognition of net actuarial loss/(gain) | (2) | 2 | (2) | 1 |
| Recognition of prior service cost/(credit) | (1) | (2) | — |
| (1) |
| TOTAL PERIODIC OTHER POSTRETIREMENT BENEFIT COST/(CREDIT) | $(4) | $(2) | $(4) | $(4) |
| Cost capitalized | (1) | (2) | (2) | (1) |
| Reconciliation to rate level | 3 | 2 | 2 | 2 |
| Total expense/(credit) recognized | $(2) | $(2) | $(4) | $(3) |
|
| | | | | |
| | For the Three Months Ended September 30, |
| Con Edison | CECONY |
| (Millions of Dollars) | 2017 | 2016 | 2017 |
| 2016 |
| Service cost | $5 | $4 | $3 | $3 |
| Interest cost on accumulated other postretirement benefit obligation | 11 | 12 | 9 | 10 |
| Expected return on plan assets | (17) | (19) | (15) | (17) |
| Recognition of net actuarial loss | 1 | 1 | — |
| 1 |
| Recognition of prior service cost | (5) | (5) | (3) | (3) |
| TOTAL PERIODIC OTHER POSTRETIREMENT BENEFIT COST | $(5) | $(7) | $(6) | $(6) |
| Cost capitalized | 2 | 2 | 2 | 2 |
| Reconciliation to rate level | (1) | 7 | — |
| 6 |
| Cost charged to operating expenses | $(4) | $2 | $(4) | $2 |
|
| | | | |
| | For the Nine Months Ended September 30, |
| Con Edison | CECONY |
| (Millions of Dollars) | 2017 | 2016 | 2017 | 2016 |
| Service cost | $15 | $13 | $10 | $10 |
| Interest cost on accumulated other postretirement benefit obligation | 34 | 36 | 28 | 30 |
| Expected return on plan assets | (52) | (58) | (45) | (50) |
| Recognition of net actuarial loss/(gain) | 2 | 4 | (2) | 2 |
| Recognition of prior service cost | (13) | (15) | (9) | (11) |
| TOTAL PERIODIC OTHER POSTRETIREMENT BENEFIT COST | $(14) | $(20) | $(18) | $(19) |
| Cost capitalized | 6 | 5 | 7 | 5 |
| Reconciliation to rate level | (3) | 20 | (1) | 19 |
| Cost charged to operating expenses | $(11) | $5 | $(12) | $5 |
|
| | | | |
| | For the Nine Months Ended September 30, |
| | Con Edison | CECONY |
| (Millions of Dollars) | 2019 | 2018 | 2019 | 2018 |
| Service cost | $13 | $15 | $9 | $10 |
| Interest cost on accumulated other postretirement benefit obligation | 33 | 32 | 27 | 26 |
| Expected return on plan assets | (49) | (55) | (41) | (47) |
| Recognition of net actuarial loss/(gain) | (6) | 6 | (7) | 2 |
| Recognition of prior service cost/(credit) | (2) | (5) | (1) | (2) |
| TOTAL PERIODIC OTHER POSTRETIREMENT BENEFIT COST/(CREDIT) | $(11) | $(7) | $(13) | $(11) |
| Cost capitalized | (6) | (6) | (4) | (4) |
| Reconciliation to rate level | 10 | 6 | 6 | 7 |
| Total expense/(credit) recognized | $(7) | $(7) | $(11) | $(8) |
For information about the presentation of the components of other postretirement benefit costs, see Note E.
Contributions
During the first nine months of 2017, Con Edison2019, the Companies contributed $16$7 million (substantially all of which $8 million was contributedmade by CECONY,CECONY) to the other postretirement benefit plans. The Companies' policy is to fund the total periodic benefit cost of the plans to the extent tax deductible.
Note G —– Environmental Matters
Superfund Sites
Hazardous substances, such as asbestos, polychlorinated biphenyls (PCBs) and coal tar, have been used or generated in the course of operations of the Utilities and their predecessors and are present at sites and in facilities and equipment they currently or previously owned, including sites at which gas was manufactured or stored.
The Federal Comprehensive Environmental Response, Compensation and Liability Act of 1980 and similar state statutes (Superfund) impose joint and several liability, regardless of fault, upon generators of hazardous substances for investigation and remediation costs (which include costs of demolition, removal, disposal, storage, replacement, containment and monitoring) and natural resource damages. Liability under these laws can be material and may be imposed for contamination from past acts, even though such past acts may have been lawful at the time they occurred. The sites at which the Utilities have been asserted to have liability under these laws, including their manufactured gas plant sites and any neighboring areas to which contamination may have migrated, are referred to herein as “Superfund Sites.”
For Superfund Sites where there are other potentially responsible parties and the Utilities are not managing the site investigation and remediation, the accrued liability represents an estimate of the amount the Utilities will need to pay to investigate and, where determinable, discharge their related obligations. For Superfund Sites (including the manufactured gas plant sites) for which one of the Utilities is managing the investigation and remediation, the accrued liability represents an estimate of the company’s share of the undiscounted cost to investigate the sites and, for sites that have been investigated in whole or in part, the cost to remediate the sites, if remediation is necessary and if a reasonable estimate of such cost can be made. Remediation costs are estimated in light of the information available, applicable remediation standards and experience with similar sites.
The accrued liabilities and regulatory assets related to Superfund Sites at September 30, 20172019 and December 31, 20162018 were as follows:
|
| | | | |
| | Con Edison | CECONY |
| (Millions of Dollars) | 2019 | 2018 | 2019 | 2018 |
| Accrued Liabilities: | | | | |
| Manufactured gas plant sites | $679 | $689 | $596 | $603 |
| Other Superfund Sites | 88 | 90 | 88 | 90 |
| Total | $767 | $779 | $684 | $693 |
| Regulatory assets | $774 | $810 | $685 | $716 |
|
| | | | |
| | Con Edison | CECONY |
| (Millions of Dollars) | 2017 | 2016 | 2017 | 2016 |
| Accrued Liabilities: | | | | |
| Manufactured gas plant sites | $659 | $664 | $563 | $567 |
| Other Superfund Sites | 86 | 89 | 85 | 88 |
| Total | $745 | $753 | $648 | $655 |
| Regulatory assets | $803 | $823 | $690 | $711 |
Most of the accrued Superfund Site liability relates to sites that have been investigated, in whole or in part. However, for some of the sites, the extent and associated cost of the required remediation has not yet been
determined. As investigations progress and information pertaining to the required remediation becomes available, the Utilities expect that additional liability may be accrued, the amount of which is not presently determinable but may be material. The Utilities are permitted to recover or defer as regulatory assets (for subsequent recovery through rates) prudently incurred site investigation and remediation costs.
Environmental remediation costs incurred related to Superfund Sites for the three and nine months ended September 30, 20172019 and 20162018 were as follows:
|
| | | | |
| | For the Three Months Ended September 30, |
| | Con Edison | CECONY |
| (Millions of Dollars) | 2019 | 2018 | 2019 | 2018 |
| Remediation costs incurred | $4 | $8 | $2 | $5 |
|
| | | | |
| | For the Three Months Ended September 30, |
| | Con Edison | CECONY |
| (Millions of Dollars) | 2017 | 2016 | 2017 | 2016 |
| Remediation costs incurred | $4 | $8 | $3 | $5 |
|
| | | | |
| | For the Nine Months Ended September 30, |
| | Con Edison | CECONY |
| (Millions of Dollars) | 2019 | 2018 | 2019 | 2018 |
| Remediation costs incurred | $15 | $17 | $10 | $14 |
25
|
| | | | |
| | For the Nine Months Ended September 30, |
| | Con Edison | CECONY |
| (Millions of Dollars) | 2017 | 2016 | 2017 | 2016 |
| Remediation costs incurred | $18 | $20 | $13 | $10 |
Insurance and other third-party recoveries received by Con Edison or CECONY were immaterial for the three and nine months ended September 30, 2017. Con Edison2019 and CECONY received $1 million in insurance recoveries for the three and nine months ended September 30, 2016.2018.
In 2016,2018, Con Edison and CECONY estimated that for their manufactured gas plant sites (including CECONY’s Astoria site), the aggregate undiscounted potential liability for the investigation and remediation of coal tar and/or other environmental contaminants could range up to $2.8 billion and $2.6 billion, respectively. These estimates were based on the assumption that there is contamination at all sites, including those that have not yet been fully investigated and additional assumptions about the extent of the contamination and the type and extent of the remediation that may be required. Actual experience may be materially different.
Asbestos Proceedings
Suits have been brought in New York State and federal courts against the Utilities and many other defendants, wherein a large number of plaintiffs sought large amounts of compensatory and punitive damages for deaths and injuries allegedly caused by exposure to asbestos at various premises of the Utilities. The suits that have been resolved, which are many, have been resolved without any payment by the Utilities, or for amounts that were not, in the aggregate, material to them. The amounts specified in all the remaining thousands of suits total billions of dollars; however, the Utilities believe that these amounts are greatly exaggerated, based on the disposition of previous claims. At September 30, 2017,2019, Con Edison and CECONY have accrued their estimated aggregate undiscounted potential liabilities for these suits and additional suits that may be brought over the next 15 years as shown in the following table. These estimates were based upon a combination of modeling, historical data analysis and risk factor assessment. Courts have begun, and unless otherwise determined on appeal may continue, to apply different standards for determining liability in asbestos suits than the standard that applied historically. As a result, the Companies currently believe that there is a reasonable possibility of an exposure to loss in excess of the liability accrued for the suits. The Companies are unable to estimate the amount or range of such loss. In addition, certain current and former employees have claimed or are claiming workers’ compensation benefits based on alleged disability from exposure to asbestos. CECONY is permitted to defer as regulatory assets (for subsequent recovery through rates) costs incurred for its asbestos lawsuits and workers’ compensation claims.
The accrued liability for asbestos suits and workers’ compensation proceedings (including those related to asbestos exposure) and the amounts deferred as regulatory assets for the Companies at September 30, 20172019 and December 31, 20162018 were as follows:
|
| | | | |
| | Con Edison | CECONY |
| (Millions of Dollars) | 2019 | 2018 | 2019 | 2018 |
| Accrued liability – asbestos suits | $8 | $8 | $7 | $7 |
| Regulatory assets – asbestos suits | $8 | $8 | $7 | $7 |
| Accrued liability – workers’ compensation | $79 | $79 | $75 | $75 |
| Regulatory assets – workers’ compensation | $5 | $5 | $5 | $5 |
|
| | | | |
| | Con Edison | CECONY |
| (Millions of Dollars) | 2017 | 2016 | 2017 | 2016 |
| Accrued liability – asbestos suits | $8 | $8 | $7 | $7 |
| Regulatory assets – asbestos suits | $8 | $8 | $7 | $7 |
| Accrued liability – workers’ compensation | $87 | $88 | $83 | $83 |
| Regulatory assets – workers’ compensation | $12 | $13 | $12 | $13 |
Note H —– Other Material Contingencies
Manhattan Explosion and Fire
On March 12, 2014, two2 multi-use five-story tall buildings located on Park Avenue between 116th and 117th Streets in Manhattan were destroyed by an explosion and fire. CECONY had delivered gas to the buildings through service lines from a distribution main located below ground on Park Avenue. EightNaN people died and more than 50 people were injured. Additional buildings were also damaged. The National Transportation Safety Board (NTSB) investigated. The parties to the investigation included the company, the City of New York, the Pipeline and Hazardous Materials Safety Administration and the NYSPSC. In June 2015, the NTSB issued a final report concerning the incident, its probable cause and safety recommendations. The NTSB determined that the probable cause of the incident was (1) the failure of a defective fusion joint at a service tee (which joined a plastic service line to a plastic distribution main) installed by the company that allowed gas to leak from the distribution main and migrate into a building where it ignited and (2) a breach in a City sewer line that allowed groundwater and soil to flow into the sewer, resulting in a loss of support for the distribution main, which caused it to sag and overstressed the defective fusion joint. The NTSB also made safety recommendations, including recommendations to the company that addressed its procedures for the preparation and examination of plastic fusions, training of its staff on conditions for notifications to the City’s Fire Department and extension of its gas main isolation valve installation program. In February 2017, the NYSPSC approved a settlement agreement with the company related to the NYSPSC's investigations of the incident and the practices of qualifying persons to perform plastic fusions. Pursuant to the agreement, the company will not recover from customers $126 million of costs it incurred for gas emergency response activities in 2014, 2015 and 2016 in excess of the amounts reflected in its gas rate plan and will provideis providing $27 million of future benefits to customers (for which it has accrued a regulatory liability, see Note B).liability) and will not recover from customers $126 million of costs for gas emergency response activities that it had previously incurred and expensed. Approximately eighty80 suits are pending against the company seeking generally unspecified damages and, in some cases, punitive damages, for wrongful death, personal injury, property damage and business interruption. The company has notified its insurers of the incident and believes that the policies in force at the time of the incident will cover the company’s costs, in excess of a required retention (the amount of which is not material), to satisfy any liability it may have for damages in connection with the incident. The company is unable to estimate the amount or range of its possible loss for damages related to the incident. At September 30, 2017,2019, the company had not accrued a liability for damages related to the incident.
Manhattan Steam Main Rupture
In July 2018, a CECONY steam main located on Fifth Avenue and 21st Street in Manhattan ruptured. Debris from the incident included dirt and mud containing asbestos. The response to the incident required the closing of buildings and streets for various periods. The NYSPSC has commenced an investigation. As of September 30, 2019, with respect to the incident, the company incurred estimated operating costs of $16 million for property damage, clean- up and other response costs and invested $10 million in capital and retirement costs. The company has notified its insurers of the incident and believes that the policies currently in force will cover the company’s costs, in excess of a required retention (the amount of which is not material), to satisfy any liability it may have for damages to others in connection with the incident. The company is unable to estimate the amount or range of its possible loss related to the incident. At September 30, 2019, the company had not accrued a liability related to the incident.
Other Contingencies
SeeFor information about the PG&E bankruptcy, see "Long-Lived and Intangible Assets" in Note A and Note C. Also, for additional contingencies, see "Other Regulatory Matters" in Note B and “Uncertain Tax Positions” in Note I.J.
Guarantees
Con Edison and its subsidiaries enterhave entered into various agreements providing financial or performance assurance primarily to third parties on behalf of their subsidiaries. Maximum amounts guaranteed by Con Edison under these agreements totaled $2,162$1,954 million and $2,370$2,439 million at September 30, 20172019 and December 31, 2016,2018, respectively.
A summary, by type and term, of Con Edison’s total guarantees under these agreements at September 30, 20172019 is as follows:
|
| | | | | | | |
| Guarantee Type | 0 – 3 years | 4 – 10 years |
| > 10 years |
| Total |
| | (Millions of Dollars) |
| Con Edison Transmission | $162 | $411 |
| $— |
| $573 |
| Energy transactions | 501 | 29 | 194 | 724 |
| Renewable electric production projects | 124 | 9 | 454 | 587 |
| Other | 70 | — |
| — |
| 70 |
| Total | $857 | $449 | $648 | $1,954 |
|
| | | | | | | |
| Guarantee Type | 0 – 3 years | 4 – 10 years |
| > 10 years |
| Total |
| | (Millions of Dollars) |
| Con Edison Transmission | $643 | $404 |
| $— |
| $1,047 |
| Energy transactions | 459 | 30 | 211 | 700 |
| Renewable electric production projects | 268 | — |
| 19 | 287 |
| Other | 128 | — |
| — |
| 128 |
| Total | $1,498 | $434 | $230 | $2,162 |
Con Edison Transmission — Con Edison has guaranteed payment by CET Electric of the contributions CET Electric agreed to make to New York Transco LLC (NY Transco). CET Electric acquiredowns a 45.7 percent interest in NY Transco when it was formed in 2014.Transco. In May 2016, the transmission owners transferred certain projects to NY Transco, for which CET Electric made its required contributions. NY Transco has proposed other transmission projects inApril 2019, the New York Independent System Operator's competitive bidding process. These otherOperator (NYISO) selected a transmission project that was jointly proposed by National Grid and NY Transco. The siting, construction and operation of the project will require approvals and permits from appropriate governmental agencies and authorities, including the NYSPSC. The NYISO indicated it will work with the developers to enter into agreements for the development and operation of the projects, are subject to certain authorizations from the NYSPSC, the FERC and, as applicable, other federal, state and local agencies.including a schedule for entry into service by December 2023. Guarantee amount shown is forincludes the maximum possible required amount of CET Electric’s contributions for these other projectsthis project as calculated based on the assumptions that the projects areproject is completed at 175 percent of theirits estimated costs and NY Transco does not use any debt financing for the projects. Guarantee term shown is assumed as the selection of the projects and resulting timing of the contributions is not certain.project. Also included within the table above is a guaranteeare guarantees for $25 million from Con Edison on behalf of CET Gas in relation to Mountain Valley Pipeline (MVP), LLC, a company developing a proposed gas transmission project in West Virginia and Virginia.
Energy Transactions — Con Edison guarantees payments on behalf of the Clean Energy Businesses in order to facilitate physical and financial transactions in electricity, gas, pipeline capacity, transportation, oil, renewable energy credits and energy services. To the extent that liabilities exist under the contracts subject to these guarantees, such liabilities are included in Con Edison’s consolidated balance sheet.
Renewable Electric Production Projects — Con Edison, Con Edison Development, and Con Edison Solutions guarantee payments on behalf of their wholly-owned subsidiaries associated with their investment in, or development for others of, solar and wind energy facilities.
Other — Other guarantees include $70 million in guarantees provided by Con Edison to Travelers Insurance Company for indemnity agreements for surety bonds in connection with operation of solar energy facilities and energy service projects of Con Edison Development and Con Edison Solutions, respectively. Other guarantees also includes Con Edison's guarantee (subject to a $53 million maximum amount) of certain obligations of Con Edison Solutions under the agreement pursuant to which it sold its retail electric supply business. In addition, Con Edison issued a guarantee estimated at $5 million to the Public Utility Commission of Texas covering obligations of Con Edison Solutions as a retail electric provider. As part of the sale agreement for the retail electric supply business discussed above, the purchaser has agreed to pay Con Edison Solutions for draws on the guarantee to the Public Utility Commission of Texas.
Note I —– Leases
In January 2019, the Companies adopted Accounting Standards Update (ASU) No. 2016-02, “Leases (Topic 842),” including the amendments thereto, using a modified retrospective transition method of adoption that required no prior period adjustments or charges to retained earnings for cumulative impact. The standard supersedes the lease requirements within ASC Topic 840, “Leases.”
The Companies lease land, office buildings, equipment and access rights to support electric transmission facilities. Upon adoption of Topic 842, the Companies recognized lease right-of-use assets and lease liabilities on their consolidated balance sheets for virtually all of their leases (other than leases that meet the definition of a short-term lease, the expense for which was immaterial). A lease right-of-use asset represents a right to use an identifiable underlying asset and obtain substantially all of the economic benefits from the use of that asset for the lease term. A lease liability represents an obligation to make lease payments arising from the lease. Leases are classified as either operating leases or finance leases. Operating leases are included in operating lease right-of-use asset and operating lease liabilities on the Companies’ consolidated balance sheets. Finance leases are included in other noncurrent assets, other current liabilities and other noncurrent liabilities. The Utilities, as regulated entities, are permitted to continue to recognize expense for operating leases using the timing that conforms to the regulatory rate treatment as rental payments are recovered from our customers and to account the same way for finance leases. Lessor accounting is similar to the previous model, but updated to align with ASC Topic 606 “Revenue from Contracts with Customers."
The Companies elected the following practical expedients: (1) a package of practical expedients that allows the Companies to not reassess: (a) whether expired or existing contracts contained leases; (b) the lease classification
for expired or existing leases and (c) the initial direct costs for existing leases; (2) for all underlying asset classes, an expedient that allows the Companies to not apply the recognition requirements to short-term leases and an expedient that allows the Companies to account for lease and associated non-lease components as a single lease component; (3) an expedient that allows the use of hindsight to determine lease term; and (4) an expedient that allows the Companies to not evaluate under Topic 842 land easements that exist or expired before the entity’s adoption of Topic 842 and that were not previously accounted for as leases under Topic 840.
The Companies, upon adoption of Topic 842 recognized, and for new operating leases at commencement date recognize, operating lease right-of-use assets and operating lease liabilities based on the present value of the future minimum lease payments over the lease term. As most of the Companies’ leases do not provide an implicit rate, the Companies used their collateralized incremental borrowing rate based on the information available at the commencement date to determine the present value of future payments. Most of the Companies’ leases have remaining lease terms of one year to 35 years, and may include options to renew or extend the leases for up to five years at the fair rental value. The Companies' lease terms may include options to renew, extend or terminate the lease when it is reasonably certain that the Companies will exercise that option. There were no leases with material variable lease payments or residual value guarantees.
Operating lease cost and cash paid for amounts included in the measurement of lease liabilities for the three and nine months ended September 30, 2019 were as follows:
|
| | | | | | |
| | For the Three Months Ended September 30, 2019 |
| (Millions of Dollars) | Con Edison | CECONY |
| Operating lease cost |
| $21 |
|
| $16 |
|
| Operating lease cash flows |
| $10 |
|
| $5 |
|
|
| | | | | | |
| | For the Nine Months Ended September 30, 2019 |
| (Millions of Dollars) | Con Edison | CECONY |
| Operating lease cost |
| $62 |
|
| $48 |
|
| Operating lease cash flows |
| $27 |
|
| $13 |
|
As of September 30, 2019, assets recorded as finance leases for Con Edison and CECONY were $2 million and $1 million, respectively, and the accumulated amortization associated with finance leases for Con Edison and CECONY were $5 million and $3 million, respectively. For the three and nine months ended September 30, 2019, finance lease costs and cash flows for Con Edison and CECONY were immaterial.
Right-of-use assets obtained in exchange for lease obligations for Con Edison and CECONY were $2 million and $1 million, respectively, for the three months ended September 30, 2019 and $3 million and $2 million, respectively, for the nine months ended September 30, 2019.
Other information related to leases for Con Edison and CECONY at September 30, 2019 was as follows:
|
| | |
| Con Edison | CECONY |
| Weighted Average Remaining Lease Term: | | |
| Operating leases | 18.9 years | 14.3 years |
| Finance leases | 11.2 years | 2.3 years |
| Weighted Average Discount Rate: | | |
| Operating leases | 4.3% | 3.6% |
| Finance leases | 3.8% | 4.7% |
Future minimum lease payments under non-cancellable leases at September 30, 2019 were as follows:
|
| | | | | | | | | | |
| (Millions of Dollars) | Con Edison | CECONY |
| Year Ending September 30, | Operating Leases | Finance Leases | Operating Leases | Finance Leases |
| 2020 | $74 | $1 | $58 | $1 |
| 2021 | 73 | — |
| 57 | — |
|
| 2022 | 69 | — |
| 53 | — |
|
| 2023 | 69 | — |
| 53 | — |
|
| 2024 | 69 | — |
| 53 | — |
|
| All years thereafter | 966 | 1 | 550 | — |
|
| Total future minimum lease payments | $1,320 | $2 | $824 | $1 |
| Less: imputed interest | (442) | — |
| (180) | — |
|
| Total | $878 | $2 | $644 | $1 |
| Reported as of September 30, 2019 | | | | |
| Operating lease liabilities (current) | $59 |
| $— |
| $49 |
| $— |
|
| Operating lease liabilities (noncurrent) | 819 | — |
| 595 | — |
|
| Other current liabilities | — |
| 1 | — |
| 1 |
| Other noncurrent liabilities | — |
| 1 | — |
| — |
|
| Total | $878 | $2 | $644 | $1 |
At September 30, 2019, the Companies do not have material obligations under operating or finance leases that have not yet commenced.
Disclosures related to the three and nine months ended September 30, 2019 are presented as required under Topic 842. Prior period disclosures for the year ended December 31, 2018 are presented under Topic 840. The Companies have elected to use a practical expedient provided by Topic 842 whereby comparative disclosures for prior periods are allowed to be presented under Topic 840. Prior period disclosures under Topic 840 have been provided on an annual basis. As a result, the disclosures presented under Topic 842 and Topic 840 will not be fully comparable in specific disclosure requirements or time period.
The future minimum lease commitments at December 31, 2018, accounted for under Topic 840, for the Companies’ operating lease agreements that are not cancellable by the Companies were as follows:
|
| | |
| (Millions of Dollars) | Con Edison | CECONY |
| 2019 | $72 | $56 |
| 2020 | 72 | 56 |
| 2021 | 71 | 54 |
| 2022 | 68 | 53 |
| 2023 | 68 | 53 |
| All years thereafter | 890 | 592 |
| Total | $1,241 | $864 |
The Companies are lessors under certain leases whereby the Companies own real estate and distribution poles and lease portions of them to others. Revenue under such leases was immaterial for Con Edison and CECONY for the three and nine months ended September 30, 2019.
Note J – Income Tax
Con Edison’s income tax expense decreased to $270$116 million for the three months ended September 30, 20172019 from $314$175 million for the three months ended September 30, 2016.2018. The decrease in income tax expense is primarily due to lower income before income tax expense (excluding income attributable to noncontrolling interest (see Note N)), lower state income taxes, the absence of a $42 million re-measurement of deferred tax assets due to the TCJA associated with Con Edison's effectiveEdison’s 2017 federal net operating loss carryforward into 2018 recognized at the filing of its 2017 federal tax ratereturn, an increase in the amortization of excess deferred federal income taxes due to the TCJA and higher renewable energy credits and adjustments for prior period federal income tax returns primarily due to increased research and development credits at the Clean Energy Businesses, offset, in part, by an increase in uncertain tax positions at the Clean Energy Businesses.
CECONY’s income tax expense decreased to $119 million for the three months ended September 30, 2017 and 2016 was 37 percent and 39 percent, respectively.2019 from $125 million for the three months ended September 30, 2018. The decrease in Con Edison's effectiveincome tax expense is primarily due to lower income before income tax expense, lower state income taxes and an increase in the amortization of excess deferred federal income taxes due to the TCJA, offset, in part, by lower tax benefits in 2019 for plant-related flow through items and adjustments for the 2017 federal income tax return primarily due to increased non-deductible business expenses.
Reconciliation of the difference between income tax expense and the amount computed by applying the prevailing statutory income tax rate to income before income taxes for the three months ended September 30, 2019 and 2018 is as follows:
|
| | | | | | | | |
| | Con Edison | CECONY |
| (% of Pre-tax income) | 2019 |
| 2018 |
| 2019 |
| 2018 |
|
| STATUTORY TAX RATE | | | | |
| Federal | 21 | % | 21 | % | 21 | % | 21 | % |
| Changes in computed taxes resulting from: | | | | |
| State income tax | 4 |
| 5 |
| 5 |
| 5 |
|
| Other plant-related items | — |
| (1 | ) | — |
| (1 | ) |
| Renewable energy credits | (1 | ) | (1 | ) | — |
| — |
|
| TCJA deferred tax re-measurement | — |
| 7 |
| — |
| — |
|
| Reserve for uncertain tax positions | 1 |
| — |
| — |
| — |
|
| Amortization of excess deferred federal income taxes | (3 | ) | (2 | ) | (3 | ) | (2 | ) |
| Prior period return adjustments | (2 | ) | — |
| — |
| — |
|
| Other | — |
| (1 | ) | (1 | ) | (1 | ) |
| Effective tax rate | 20 | % | 28 | % | 22 | % | 22 | % |
Con Edison’s income tax expense decreased to $243 million for the nine months ended September 30, 2019 from $330 million for the nine months ended September 30, 2018. The decrease in income tax expense is primarily due to lower income before income tax expense (excluding income attributable to noncontrolling interest (see Note N)), lower state income taxes, the absence of a $42 million re-measurement of deferred tax assets due to the TCJA associated with Con Edison’s 2017 federal net operating loss carryforward into 2018 recognized at the filing of its 2017 federal tax return, an increase in the amortization of excess deferred federal income taxes due to the TCJA, higher renewable energy credits and adjustments for prior period federal income tax returns primarily due to increased research and development credits at the Clean Energy Businesses, offset, in part, by an increase in uncertain tax positions at the Clean Energy Businesses.
CECONY’s income tax expense decreased to $271 million for the nine months ended September 30, 2019 from $274 million for the nine months ended September 30, 2018. The decrease in income tax expense is primarily due to lower state income taxes and an increase in the amortization of excess deferred federal income taxes due to the TCJA, offset, in part, by a decrease in tax benefits for plant-related flow through items.
CECONY’shigher income before income tax expense increased to $242 million for the three months ended September 30, 2017 from $226 million for the three months ended September 30, 2016. CECONY's effectiveand lower tax rate for the three months ended September 30, 2017 and 2016 was 38 percent and 37 percent, respectively. The increasebenefits in CECONY's effective tax rate is primarily due to a decrease in tax benefits2019 for plant-related flow through items and lower research and development credits, offset in part by lower stateadjustments for the 2017 federal income taxes.tax returns primarily due to increased non-deductible business expenses.
Con Edison’sReconciliation of the difference between income tax expense decreasedand the amount computed by applying the prevailing statutory income tax rate to $599 millionincome before income taxes for the nine months ended September 30, 2017 from $602 million2019 and 2018 is as follows:
|
| | | | | | | | |
| | Con Edison | CECONY |
| (% of Pre-tax income) | 2019 |
| 2018 |
| 2019 |
| 2018 |
|
| STATUTORY TAX RATE | | | | |
| Federal | 21 | % | 21 | % | 21 | % | 21 | % |
| Changes in computed taxes resulting from: | | | | |
| State income tax | 4 |
| 5 |
| 5 |
| 5 |
|
| Cost of removal | 1 |
| 1 |
| 1 |
| 1 |
|
| Other plant-related items | — |
| (1 | ) | (1 | ) | (1 | ) |
| Renewable energy credits | (2 | ) | (1 | ) | — |
| — |
|
| TCJA deferred tax re-measurement | — |
| 3 |
| — |
| — |
|
| Amortization of excess deferred federal income taxes | (4 | ) | (3 | ) | (3 | ) | (3 | ) |
| Other | (1 | ) | (1 | ) | (1 | ) | (1 | ) |
| Effective tax rate | 19 | % | 24 | % | 22 | % | 22 | % |
CECONY and O&R deferred as regulatory liabilities their estimated net benefits under the TCJA for the nine months ended September 30, 2016. Con Edison's effective tax rate2018. CECONY's net benefits prior to January 1, 2019 for its electric service and amortization of excess deferred federal income taxes for its electric service for the nine months ended September 30, 2017 and 2016 was 37 percent.2019 continue to be deferred. RECO deferred as a regulatory liability its estimated net benefits under the TCJA for the three months ended March 31, 2018. The effectivenet benefits include the revenue requirement impact of the reduction in the corporate federal income tax rate remained unchanged as lower stateto 21 percent, the elimination for utilities of bonus depreciation and the amortization of excess deferred federal income taxes were offset by a decreasethe utilities collected from customers that will not need to be paid to the Internal Revenue Service under the TCJA. See “Other Regulatory Matters” in tax benefits for plant-related flow through items.Note B.
CECONY’s income tax expense increased to $551 million for the nine months ended September 30, 2017 from $491 million for the nine months ended September 30, 2016. CECONY's effective tax rate for the nine months ended September 30, 2017 and 2016 was 38 percent and 36 percent, respectively. The increase in CECONY's effective tax rate is primarily due to a decrease in tax benefits for plant-related flow through items and lower research and development tax credits, offset in part by lower state income taxes.
Con Edison anticipates a federal consolidated net operating loss for 2017, primarily due to bonus depreciation. Con Edison expects to carryback a portion of its 2017 net operating loss to recover $19 million of income tax. The remaining 2017 net operating loss, as well as general business tax credits generated in 2017, will be carried forward to future tax years. A deferred tax asset for these tax attribute carryforwards was recorded, and no valuation allowance has been provided, as it is more likely than not that the deferred tax asset will be realized.
Uncertain Tax Positions
At September 30, 2017,2019, the estimated liability for uncertain tax positions for Con Edison was $41$15 million ($214 million for CECONY). Con Edison reasonably expects to resolve approximately $35 million ($24 million, net of federal taxes) of its uncertain tax positions within the next twelve months including $21approximately $12 million ($15 million, net of various federal taxes),and state uncertainties due to the expected completion of ongoing tax examinations, of which the entire amount, if recognized, would reduce Con Edison’sEdison's effective tax rate. The amount related to CECONY is approximately $18 million ($13 million, net of federal taxes), including $4$3 million, which, if recognized, would reduce CECONY’s effective tax rate. The total amount of unrecognized tax benefits, if recognized, that would reduce Con Edison’s effective tax rate is $25$15 million ($1814 million, net of federal taxes).
The Companies recognize interest on liabilities for uncertain tax positions in interest expense and would recognize penalties, if any, in operating expenses in the Companies’ consolidated income statements. In the three and nine months ended September 30, 2017,2019, the Companies recognized an immaterial amount of interest expense and no penalties for uncertain tax positions in their consolidated income statements. At September 30, 20172019 and December 31, 2016,2018, the Companies recognized an immaterial amount of accrued interest on their consolidated balance sheets.
Note J —K – Financial Information by Business Segment
Con Edison’s principal business segments are CECONY’s regulated utility activities, O&R’s regulated utility activities, the Clean Energy Businesses and Con Edison Transmission. CECONY’s principal business segments are its regulated electric, gas and steam utility activities. The financial data for the business segments for the three and nine months ended September 30, 20172019 and 20162018 were as follows:
| | | | For the Three Months Ended September 30, | For the Three Months Ended September 30, |
| | Operating revenues | Inter-segment revenues | Depreciation and amortization | Operating income/(loss) | Operating
revenues | Inter-segment
revenues | Depreciation and
amortization | Operating
income/(loss) |
| (Millions of Dollars) | 2017 |
| 2016 |
| 2017 |
| 2016 |
| 2017 |
| 2016 |
| 2017 |
| 2016 |
| 2019 |
| 2018 |
| 2019 |
| 2018 |
| 2019 |
| 2018 |
| 2019 |
| 2018 |
|
| CECONY | | | | | | |
| Electric | $2,469 | $2,557 | $4 | $5 | $232 | $217 | $855 | $841 | $2,544 | $2,571 | $4 | $266 | $248 | $803 | $850 |
| Gas | 268 | 208 | 2 | 1 | 47 | 41 | (12) | (28) | 275 | 264 | 2 | 58 | 52 | (24) | (34) |
| Steam | 62 | 63 | 19 | 22 | 21 | 20 | (43) | (47) | 58 | 64 | 18 | 19 | 22 | (56) | (52) |
| Consolidation adjustments | — |
| — |
| (25) | (28) | — |
| — |
| — |
| — |
| — |
| — |
| (24) | (25) | — |
| — |
| — |
| — |
|
| Total CECONY | $2,799 | $2,828 |
| $— |
|
| $— |
| $300 | $278 | $800 | $766 | $2,877 | $2,899 |
| $— |
|
| $— |
| $346 | $322 | $723 | $764 |
| O&R | | | | | | |
| Electric | $206 | $213 |
| $— |
|
| $— |
| $13 | $12 | $56 | $55 | $210 | $212 |
| $— |
|
| $— |
| $16 | $14 | $56 | $52 |
| Gas | 28 | 27 | — |
| — |
| 5 | (11) | (7) | 31 | 34 | — |
| — |
| 6 | 5 | (10) |
| Total O&R | $234 | $240 |
| $— |
|
| $— |
| $18 | $17 | $45 | $48 | $241 | $246 |
| $— |
|
| $— |
| $22 | $19 | $46 | $42 |
| Clean Energy Businesses | $177 | $350 |
| $— |
| $(2) | $19 | $11 | $29 | $125 | $247 | $181 |
| $— |
|
| $— |
| $53 | $18 | $100 | $25 |
| Con Edison Transmission | 1 | — |
| — |
| — |
| — |
| — |
| (2) | (1) | 1 | — |
| — |
| — |
| — |
| (1) | (2) |
| Other (a) | — |
| (1) | — |
| 2 | — |
| (1) | 1 | 2 | (1) | 1 | — |
| — |
| — |
| 1 | (1) | (3) |
| Total Con Edison | $3,211 | $3,417 |
| $— |
|
| $— |
| $337 | $305 | $873 | $940 | $3,365 | $3,328 |
| $— |
|
| $— |
| $421 | $360 | $867 | $826 |
|
| | | | | | | | | | | | | | | | | | |
| | For the Nine Months Ended September 30, |
| | Operating revenues | Inter-segment revenues | Depreciation and amortization | Operating income/(loss) |
| (Millions of Dollars) | 2017 |
| 2016 |
| 2017 |
| 2016 |
| 2017 |
| 2016 |
| 2017 |
| 2016 |
|
| CECONY | | | | | | | | |
| Electric | $6,079 | $6,222 | $12 | $13 | $690 | $645 | $1,477 | $1,487 |
| Gas | 1,421 | 1,113 | 5 | 4 | 137 | 118 | 362 | 273 |
| Steam | 448 | 406 | 55 | 65 | 64 | 62 | 52 | 39 |
| Consolidation adjustments | — |
| — |
| (72) | (82) | — |
| — |
| — |
| — |
|
| Total CECONY | $7,948 | $7,741 |
| $— |
|
| $— |
| $891 | $825 | $1,891 | $1,799 |
| O&R | | | | | | | | |
| Electric | $495 | $497 |
| $— |
|
| $— |
| $38 | $37 | $83 | $86 |
| Gas | 172 | 133 | — |
| — |
| 15 | 13 | 33 | 28 |
| Total O&R | $667 | $630 |
| $— |
|
| $— |
| $53 | $50 | $116 | $114 |
| Clean Energy Businesses | $460 | $998 |
| $— |
| $7 | $54 | $30 | $63 | $184 |
| Con Edison Transmission | 1 | — |
| — |
| — |
| — |
| — |
| (6) | (1) |
| Other (a) | (4) | (1) | — |
| (7) | — |
| — |
| 2 | 1 |
| Total Con Edison | $9,072 | $9,368 |
| $— |
|
| $— |
| $998 | $905 | $2,066 | $2,097 |
(a)Parent company and consolidation adjustments. Other does not represent a business segment.
29 |
| | | | | | | | | | | | | | | | | | |
| | For the Nine Months Ended September 30, |
| | Operating
revenues | Inter-segment
revenues | Depreciation and
amortization | Operating
income/(loss) |
| (Millions of Dollars) | 2019 |
| 2018 |
| 2019 |
| 2018 |
| 2019 |
| 2018 |
| 2019 |
| 2018 |
|
| CECONY | | | | | | | | |
| Electric | $6,174 | $6,107 | $13 | $12 | $785 | $732 | $1,374 | $1,421 |
| Gas | 1,605 | 1,540 | 6 | 6 | 168 | 152 | 414 | 369 |
| Steam | 469 | 474 | 52 | 56 | 67 | 65 | 37 | 60 |
| Consolidation adjustments | — |
| — |
| (71) | (74) | — |
| — |
| — |
| — |
|
| Total CECONY | $8,248 | $8,121 |
| $— |
|
| $— |
| $1,020 | $949 | $1,825 | $1,850 |
| O&R |
|
|
|
|
|
|
|
|
| Electric | $493 | $505 |
| $— |
|
| $— |
| $46 | $41 | $88 | $79 |
| Gas | 185 | 186 | — |
| — |
| 17 | 16 | 25 | 31 |
| Total O&R | $678 | $691 |
| $— |
|
| $— |
| $63 | $57 | $113 | $110 |
| Clean Energy Businesses | 696 | 573 | — |
| — |
| 169 | 55 | 183 | 59 |
| Con Edison Transmission | 3 | 3 | — |
| — |
| 1 | 1 | (5) | (5) |
| Other (a) | (2) | — |
| — |
| — |
| — |
| (1) | (5) | (7) |
| Total Con Edison | $9,623 | $9,388 |
| $— |
|
| $— |
| $1,253 | $1,061 | $2,111 | $2,007 |
(a) Parent company and consolidation adjustments. Other does not represent a business segment.
Note K —L – Derivative Instruments and Hedging Activities
Con Edison’s subsidiariesThe Utilities and the Clean Energy Businesses hedge market price fluctuations associated with physical purchases and sales of electricity, natural gas, steam and, to a lesser extent, refined fuels by using derivative instruments including futures, forwards, basis swaps, options, transmission congestion contracts and financial transmission rights contracts. These are economic hedges, for which the Utilities and the Clean Energy Business do not elect hedge accounting. The Clean Energy Businesses use interest rate swaps to manage the risks associated with interest rates related to outstanding and expected future debt issuances and borrowings. Derivatives are recognized on the consolidated balance sheet at fair value (see Note L)M), unless an exception is available under the accounting rules for derivatives and hedging. Qualifying derivative contracts that have been designated as normal purchases or normal sales contracts are not reported at fair value under the accounting rules.
In August 2017, the FASB issued amendments to the guidance for derivatives and hedging through ASU 2017-12, “Derivatives and Hedging (Topic 815): Targeted Improvements to Accounting for Hedging Activities.” The amendments in this update provide greater clarification on hedge accounting for risk components, presentation and disclosure of hedging instruments, and overall targeted improvements to simplify hedge accounting. The amendments were effective for reporting periods beginning after December 15, 2018. The application of the guidance did not have a material impact on the Companies’ financial position, results of operations and liquidity because the Companies do not elect hedge accounting for their derivative instruments and hedging activities.
The fair values of the Companies’ commodity derivatives including the offsetting of assets and liabilities on the consolidated balance sheet at September 30, 20172019 and December 31, 20162018 were:
| | | (Millions of Dollars) | 2017 | | 2016 | | 2019 | | 2018 | |
| Balance Sheet Location | Gross Amounts of Recognized Assets/(Liabilities) | Gross Amounts Offset | Net Amounts of Assets/ (Liabilities) (a) | | Gross Amounts of Recognized Assets/(Liabilities) | Gross Amounts Offset | Net Amounts of Assets/ (Liabilities) (a) | | Gross Amounts of Recognized Assets/(Liabilities) | Gross Amounts Offset | Net Amounts of Assets/ (Liabilities) (a) | | Gross Amounts of Recognized Assets/(Liabilities) | Gross Amounts Offset | Net Amounts of Assets/ (Liabilities) (a) | |
| Con Edison | | | | | | | | | |
| Fair value of derivative assets | | | | | | | |
| Current | $77 | $(67) | $10 | (b) | $81 | $(64) | $17 | (b) | $51 | $(8) | $43 | (b) | $43 | $(14) | $29 | (b) |
| Noncurrent | 64 | (61) | 3 | | 49 | (43) | 6 | | 7 | (7) | — |
| | 16 | (7) | 9 | (d) |
| Total fair value of derivative assets | $141 | $(128) | $13 | | $130 | $(107) | $23 | | $58 | $(15) | $43 | | $59 | $(21) | $38 | |
| Fair value of derivative liabilities | | | | | | | |
| Current | $(141) | $71 | $(70) | | $(138) | $61 | $(77) | | $(89) | $17 | $(72) | (c) | $(61) | $11 | $(50) | |
| Noncurrent | (143) | 60 | (83) | | (91) | 52 | (39) | (c) | (156) | 9 | (147) | (c) | (25) | 9 | (16) | (d) |
| Total fair value of derivative liabilities | $(284) | $131 | $(153) | | $(229) | $113 | $(116) | | $(245) | $26 | $(219) | | $(86) | $20 | $(66) | |
| Net fair value derivative assets/(liabilities) | $(143) | $3 | $(140) | (b) | $(99) | $6 | $(93) | (b) (c) | $(187) | $11 | $(176) | | $(27) | $(1) | $(28) | |
| CECONY | | | | | | | | | |
| Fair value of derivative assets | | | | | | | |
| Current | $55 | $(53) | $2 | (b) | $52 | $(45) | $7 | (b) | $42 | $(19) | $23 | (b) | $25 | $(6) | $19 | (b) |
| Noncurrent | 57 | (55) | 2 | | 41 | (35) | 6 | | 6 | (6) | — |
| | 11 | (5) | 6 | |
| Total fair value of derivative assets | $112 | $(108) | $4 | | $93 | $(80) | $13 | | $48 | $(25) | $23 | | $36 | $(11) | $25 | |
| Fair value of derivative liabilities | | | | | | | |
| Current | $(116) | $57 | $(59) | | $(111) | $45 | $(66) | | $(61) | $28 | $(33) | | $(31) | $6 | $(25) | |
| Noncurrent | (127) | 54 | (73) | | (77) | 44 | (33) | | (90) | 8 | (82) | | (12) | 6 | (6) | |
| Total fair value of derivative liabilities | $(243) | $111 | $(132) | | $(188) | $89 | $(99) | | $(151) | $36 | $(115) | | $(43) | $12 | $(31) | |
| Net fair value derivative assets/(liabilities) | $(131) | $3 | $(128) | (b) | $(95) | $9 | $(86) | (b) | $(103) | $11 | $(92) | | $(7) | $1 | $(6) | |
| |
| (a) | Derivative instruments and collateral were offset on the consolidated balance sheet as applicable under the accounting rules. The Companies enter into master agreements for their commodity derivatives. These agreements typically provide offset in the event of contract termination. In such case, generally the non-defaulting party’s payable will be offset by the defaulting party’s payable. The non-defaulting party will customarily notify the defaulting party within a specific time period and come to an agreement on the early termination amount. |
| |
| (b) | At September 30, 20172019 and December 31, 2016,2018, margin deposits for Con Edison ($5 million and $7 million, respectively)7 million) and CECONY ($5 million and $7 million, respectively)6 million) were classified as derivative assets on the consolidated balance sheet, but not included in the table. Margin is collateral, typically cash, that the holder of a derivative instrument is required to deposit in order to transact on an exchange and to cover its potential losses with its broker or the exchange. |
| |
| (c) | Does not include $(1) millionIncludes amounts for interest rate swap.swaps of $(7) million in current liabilities and $(57) million in noncurrent liabilities. At September 30, 2019, the Clean Energy Businesses had interest rate swaps with notional amounts of $934 million. The expiration dates of the swaps range from 2024-2041. |
| |
| (d) | Includes amounts for interest rate swaps of $2 million in noncurrent assets and $(6) million in noncurrent liabilities. At December 31, 2018, the Clean Energy Business had interest rate swaps with notional amounts of $499 million. The expiration dates of the swaps range from 2024-2035. |
The Utilities generally recover their prudently incurred fuel, purchased power and gas costs, including hedging gains and losses, in accordance with rate provisions approved by the applicable state utility regulators. In accordance with the accounting rules for regulated operations, the Utilities record a regulatory asset or liability to defer recognition of unrealized gains and losses on their electric and gas derivatives. As gains and losses are realized in future periods, they will be recognized as purchased power, gas and fuel costs in the Companies’ consolidated income statements.
The Clean Energy Businesses record realized and unrealized gains and losses on their derivative contracts in purchased power, gas purchased for resale and non-utility revenue in the reporting period in which they occur. The Clean Energy Businesses record changes in the fair value of their interest rate swaps in other interest expense at the end of each reporting period. Management believes that these derivative instruments represent economic hedges that mitigate exposure to fluctuations in commodity prices.prices and interest rates.
The following table presents the realized and unrealized gains or losses on commodity derivatives that have been deferred or recognized in earnings for the three and nine months ended September 30, 20172019 and 2016:2018:
| | | | | For the Three Months Ended September 30, | | For the Three Months Ended September 30, |
| | | Con Edison | | CECONY | | Con Edison | | CECONY |
| (Millions of Dollars) | Balance Sheet Location | 2017 |
| | 2016 | | 2017 |
| 2016 |
| Balance Sheet Location | 2019 |
| 2018 |
| | 2019 |
| 2018 |
|
| Pre-tax gains/(losses) deferred in accordance with accounting rules for regulated operations: | Pre-tax gains/(losses) deferred in accordance with accounting rules for regulated operations: | | | Pre-tax gains/(losses) deferred in accordance with accounting rules for regulated operations: | | |
| Current | Deferred derivative gains | $(4) | | $(1) | | $(3) | Deferred derivative gains | $15 | $6 | | $15 | $6 |
| Noncurrent | Deferred derivative gains | 1 | | (2) | | 1 | — |
| Deferred derivative gains | — |
| — |
| | — |
| 2 |
| Total deferred gains/(losses) | | $(3) | | $(3) | | $(2) | $(3) | | $15 | $6 | | $15 | $8 |
| Current | Deferred derivative losses | $(11) | | $(19) | | $(9) | $(18) | Deferred derivative losses | $6 | $25 | | $6 | $25 |
| Current | Recoverable energy costs | (40) | | (39) | | (38) | (35) | Recoverable energy costs | (35) | (4) | | (32) | (6) |
| Noncurrent | Deferred derivative losses | (12) | | (17) | | (8) | (14) | Deferred derivative losses | 18 | 15 | | 16 | 14 |
| Total deferred gains/(losses) | | $(63) | | $(75) | | $(55) | $(67) | | $(11) | $36 | | $(10) | $33 |
| Net deferred gains/(losses) | | $(66) | | $(78) | | $(57) | $(70) | | $4 | $42 | | $5 | $41 |
| | Income Statement Location | | | | | | Income Statement Location | | | | |
| Pre-tax gains/(losses) recognized in income | Pre-tax gains/(losses) recognized in income | | | | | Pre-tax gains/(losses) recognized in income | | | | |
| | Purchased power expense |
| $— |
| | $(37) | (b) |
| $— |
|
| $— |
| Gas purchased for resale | $1 |
| $— |
| |
| $— |
|
| $— |
|
| | Gas purchased for resale | (47) | | (38) | | — |
| — |
| Non-utility revenue | 5 | (7) | | — |
| — |
|
| | Non-utility revenue | 5 | (a) | (2) | (b) | — |
| — |
| Other operations and maintenance expense | (1) | — |
| | (1) | |
| | | Other interest expense | (26) | — |
| | — |
| — |
|
| Total pre-tax gains/(losses) recognized in income | Total pre-tax gains/(losses) recognized in income | $(42) | | $(77) | |
| $— |
|
| $— |
| Total pre-tax gains/(losses) recognized in income | $(21) | $(7) | | $(1) |
| $— |
|
| |
(a) | For the three months ended September 30, 2017, Con Edison recorded an unrealized pre-tax gain in non-utility operating revenue ($6 million). |
| |
(b) | For the three months ended September 30, 2016, Con Edison recorded unrealized pre-tax losses in non-utility operating revenue ($2 million) and purchased power expense ($23 million). |
|
| | | | | | | | | | | |
| | | For the Nine Months Ended September 30, |
| | | Con Edison | | CECONY |
| (Millions of Dollars) | Balance Sheet Location | 2019 | 2018 |
| | 2019 |
| 2018 |
|
| Pre-tax gains/(losses) deferred in accordance with accounting rules for regulated operations: | | | |
| Current | Deferred derivative gains | $3 | $(11) | | $3 | $(10) |
| Noncurrent | Deferred derivative gains | (8) | 5 | | (5) | 4 |
| Total deferred gains/(losses) | $(5) | $(6) | | $(2) | $(6) |
| Current | Deferred derivative losses | $(32) | $21 | | $(28) | $23 |
| Current | Recoverable energy costs | (94) | (13) | | (82) | (14) |
| Noncurrent | Deferred derivative losses | (82) | 23 | | (79) | 21 |
| Total deferred gains/(losses) | $(208) | $31 | | $(189) | $30 |
| Net deferred gains/(losses) | $(213) | $25 | | $(191) | $24 |
| | Income Statement Location | | | | | |
| Pre-tax gains/(losses) recognized in income | | | |
| | Gas purchased for resale | $(2) | $(1) | |
| $— |
|
| $— |
|
| | Non-utility revenue | 20 | (7) | | — |
| — |
|
| | Other interest expense | (60) | — |
| | — |
| — |
|
| Total pre-tax gains/(losses) recognized in income | $(42) | $(8) | |
| $— |
|
| $— |
|
|
| | | | | | | | | | | | | |
| | | For the Nine Months Ended September 30, |
| | | Con Edison | | CECONY |
| (Millions of Dollars) | Balance Sheet Location | 2017 |
| | 2016 | | 2017 |
| 2016 |
|
| Pre-tax gains/(losses) deferred in accordance with accounting rules for regulated operations: | | | |
| Current | Deferred derivative gains | $(26) | | $6 | | $(22) | $2 |
| Noncurrent | Deferred derivative gains | (2) | | (1) | | (2) | (1) |
| Total deferred gains/(losses) | | $(28) | | $5 | | $(24) | $1 |
| Current | Deferred derivative losses | $10 | | $19 | | $11 | $16 |
| Current | Recoverable energy costs | (125) | | (163) | | (116) | (148) |
| Noncurrent | Deferred derivative losses | (40) | | (5) | | (36) | (3) |
| Total deferred gains/(losses) | | $(155) | | $(149) | | $(141) | $(135) |
| Net deferred gains/(losses) | | $(183) | | $(144) | | $(165) | $(134) |
| | Income Statement Location | | | | | | |
| Pre-tax gains/(losses) recognized in income | | | | | | |
| | Purchased power expense |
| $— |
| | $(106) | (b) |
| $— |
|
| $— |
|
| | Gas purchased for resale | (161) | | (72) | | — |
| — |
|
| | Non-utility revenue | 11 | (a) | 15 | (b) | — |
| — |
|
| Total pre-tax gains/(losses) recognized in income | $(150) | | $(163) | |
| $— |
|
| $— |
|
| |
(a) | For the nine months ended September 30, 2017, Con Edison recorded an unrealized pre-tax gain in non-utility operating revenue ($2 million). |
| |
(b) | For the nine months ended September 30, 2016, Con Edison recorded unrealized pre-tax gains and losses in non-utility operating revenue ($3 million loss) and purchased power expense ($11 million gain). |
The following table presents the hedged volume of Con Edison’s and CECONY’s commodity derivative transactions at September 30, 2017:2019:
| | | | Electric Energy (MWh) (a)(b) | Capacity (MW) (a) | Natural Gas (Dt) (a)(b) | Refined Fuels (gallons) | Electric Energy (MWh) (a)(b) | Capacity (MW) (a) | Natural Gas (Dt) (a)(b) | Refined Fuels (gallons) |
| Con Edison | 32,596,372 |
| 6,790 |
| 166,913,644 |
| 672,000 |
| 27,843,993 |
| 25,054 |
| 277,395,718 |
| 6,720,000 |
|
| CECONY | 30,492,575 |
| 3,000 |
| 158,500,000 |
| 672,000 |
| 25,361,275 |
| 16,800 |
| 260,350,000 |
| 6,720,000 |
|
| |
| (a) | Volumes are reported net of long and short positions, except natural gas collars where the volumes of long positions are reported. |
| |
| (b) | Excludes electric congestion and gas basis swap contracts, which are associated with electric and gas contracts and hedged volumes. |
The Companies are exposed to credit risk related to transactions entered into primarily for the various energy supply and hedging activities by the Utilities and the Clean Energy Businesses. Credit risk relates to the loss that may result from a counterparty’s nonperformance. The Companies use credit policies to manage this risk, including an established credit approval process, monitoring of counterparty limits, netting provisions within agreements, collateral or prepayment arrangements, credit insurance and credit default swaps. The Companies measure credit risk exposure as the replacement cost for open energy commodity and derivative positions plus amounts owed from counterparties for settled transactions. The replacement cost of open positions represents unrealized gains, net of any unrealized losses where the Companies have a legally enforceable right to offset.
At September 30, 2017,2019, Con Edison and CECONY had $80$154 million and $8$6 million of credit exposure in connection with open energy supply net receivables and hedging activities, net of collateral, respectively. Con Edison’s net credit exposure consisted of $23$58 million with investment-grade counterparties, $23independent system operators, $50 million with non-investment grade/non-rated counterparties, $19$35 million with independent system operatorsinvestment-grade counterparties and $15$11 million with commodity exchange brokers. CECONY’s net credit exposure consisted of $7$6 million with commodity exchange brokers and $1 millionan immaterial amount with investment-grade counterparties.
The collateral requirements associated with, and settlement of, derivative transactions are included in net cash flows from operating activities in the Companies’ consolidated statement of cash flows. Most derivative instrument contracts contain provisions that may require a party to provide collateral on its derivative instruments that are in a net liability position. The amount of collateral to be provided will depend on the fair value of the derivative instruments and the party’s credit ratings.
The following table presents the aggregate fair value of the Companies’ derivative instruments with credit-risk-related contingent features that are in a net liability position, the collateral posted for such positions and the additional collateral that would have been required to be posted had the lowest applicable credit rating been reduced one level and to below investment grade at September 30, 2017:2019:
| | | (Millions of Dollars) | Con Edison (a) | | CECONY (a) | | Con Edison (a) | | CECONY (a) | |
| Aggregate fair value – net liabilities | $148 | | $131 | | $112 | | $95 | |
| Collateral posted | 61 | | 56 | | 26 | | 20 | |
| Additional collateral (b) (downgrade one level from current ratings) | 23 | | 22 | | 18 | | 14 | |
| Additional collateral (b) (downgrade to below investment grade from current ratings) | 101 | (c) | 88 | (c) | 123 | (c) | 92 | (c) |
| |
| (a) | Non-derivative transactions for the purchase and sale of electricity and gas and qualifying derivative instruments, which have been designated as normal purchases or normal sales, are excluded from the table. These transactions primarily include purchases of electricity from independent system operators. In the event the Utilities and the Clean Energy Businesses were no longer extended unsecured credit for such purchases, the Companies would be required to post an immaterial amount of additional collateral of $11 million at September 30, 2017.2019. For certain other such non-derivative transactions, the Companies could be required to post collateral under certain circumstances, including in the event counterparties had reasonable grounds for insecurity. |
| |
| (b) | The Companies measure the collateral requirements by taking into consideration the fair value amounts of derivative instruments that contain credit-risk-related contingent features that are in a net liability position plus amounts owed to counterparties for settled transactions and amounts required by counterparties for minimum financial security. The fair value amounts represent unrealized losses, net of any unrealized gains where the Companies have a legally enforceable right to offset. |
| |
| (c) | Derivative instruments that are net assets have been excluded from the table. At September 30, 2017,2019, if Con Edison had been downgraded to below investment grade, it would have been required to post additional collateral for such derivative instruments of $13$26 million. |
Interest Rate Swap
In December 2016, the Clean Energy Businesses acquired Coram Wind project which holds an interest rate swap that terminates in June 2024, pursuant to which it pays a fixed-rate of 2.0855 percent and receives a LIBOR-based variable rate. The fair value of this interest rate swap was immaterial as of September 30, 2017 and a liability of $1 million as of December 31, 2016 on Con Edison’s consolidated balance sheet.
Note L —M – Fair Value Measurements
The accounting rules for fair value measurements and disclosures define fair value as the price that would be received to sell an asset or paid to transfer a liability in an orderly transaction between market participants at the measurement date in a principal or most advantageous market. Fair value is a market-based measurement that is determined based on inputs, which refer broadly to assumptions that market participants use in pricing assets or
liabilities. These inputs can be readily observable, market corroborated, or generally unobservable firm inputs. The Companies often make certain assumptions that market participants would use in pricing the asset or liability, including assumptions about risk, and the risks inherent in the inputs to valuation techniques. The Companies use valuation techniques that maximize the use of observable inputs and minimize the use of unobservable inputs.
The accounting rules for fair value measurements and disclosures established a fair value hierarchy, which prioritizes the inputs to valuation techniques used to measure fair value in three broad levels. The rules require that assets and liabilities be classified in their entirety based on the level of input that is significant to the fair value measurement. Assessing the significance of a particular input may require judgment considering factors specific to the asset or liability, and may affect the valuation of the asset or liability and their placement within the fair value hierarchy. The Companies classify fair value balances based on the fair value hierarchy defined by the accounting rules for fair value measurements and disclosures as follows:
Level 1 – Consists of assets or liabilities whose value is based on unadjusted quoted prices in active markets at the measurement date. An active market is one in which transactions for assets or liabilities occur with sufficient frequency and volume to provide pricing information on an ongoing basis. This category includes contracts traded on active exchange markets valued using unadjusted prices quoted directly from the exchange.
Level 2 – Consists of assets or liabilities valued using industry standard models and based on prices, other than quoted prices within Level 1, that are either directly or indirectly observable as of the measurement date. The industry standard models consider observable assumptions including time value, volatility factors and current market and contractual prices for the underlying commodities, in addition to other economic measures. This category includes contracts traded on active exchanges or in over-the-counter markets priced with industry standard models.
Level 3 – Consists of assets or liabilities whose fair value is estimated based on internally developed models or methodologies using inputs that are generally less readily observable and supported by little, if any, market activity at the measurement date. Unobservable inputs are developed based on the best available information and subject to cost benefit constraints. This category includes contracts priced using models that are internally developed and contracts placed in illiquid markets. It also includes contracts that expire after the period of time for which quoted prices are available and internal models are used to determine a significant portion of the value.
Assets and liabilities measured at fair value on a recurring basis as of September 30, 20172019 and December 31, 20162018 are summarized below.
| | | | 2017 | 2016 | 2019 | 2018 |
| (Millions of Dollars) | Level 1 | Level 2 | Level 3 | Netting Adjustment (e) | Total | Level 1 | Level 2 | Level 3 | Netting Adjustment (e) | Total | Level 1 | Level 2 | Level 3 | Netting Adjustment (e) | Total | Level 1 | Level 2 | Level 3 | Netting Adjustment (e) | Total |
| Con Edison | | | | | | | | | | | | | | |
| Derivative assets: | | | | | | | | | | | | | | |
| Commodity (a)(b)(c) | $6 | $28 | $2 | $(18) | $18 | $14 | $33 | $7 | $(24) | $30 | $4 | $33 | $2 | $11 | $50 | $6 | $36 | $7 | $(6) | $43 |
| Interest rate swaps (a)(b)(c) | | — |
| — |
| — |
| — |
| — |
| — |
| 2 | — |
| — |
| 2 |
| Other (a)(b)(d) | 271 | 118 | — |
| — |
| 389 | 222 | 111 | — |
| — |
| 333 | 330 | 123 | — |
| — |
| 453 | 287 | 114 | — |
| — |
| 401 |
| Total assets | $277 | $146 | $2 | $(18) | $407 | $236 | $144 | $7 | $(24) | $363 | $334 | $156 | $2 | $11 | $503 | $293 | $152 | $7 | $(6) | $446 |
| Derivative liabilities: | | | | | | | | | | | | | | |
| Commodity (a)(b)(c) | $2 | $155 | $22 | $(26) | $153 | $4 | $144 | $6 | $(38) | $116 | $18 | $98 | $46 | $(7) | $155 | $8 | $43 | $20 | $(11) | $60 |
| Interest Rate Swap (a)(b)(c) | — |
| — |
| — |
| — |
| — |
| — |
| 1 | — |
| — |
| 1 | |
| Interest rate swaps (a)(b)(c) | | — |
| 64 | — |
| — |
| 64 | — |
| 6 | — |
| — |
| 6 |
| Total liabilities | $2 | $155 | $22 | $(26) | $153 | $4 | $145 | $6 | $(38) | $117 | $18 | $162 | $46 | $(7) | $219 | $8 | $49 | $20 | $(11) | $66 |
| CECONY | | | | | | | | | | | | | | |
| Derivative assets: | | | | | | | | | | | | | | |
| Commodity (a)(b)(c) | $5 | $12 | $1 | $(9) | $9 | $10 | $19 | $1 | $(10) | $20 | $3 | $25 | $1 |
| $— |
| $29 | $3 | $28 | $1 | $(1) | $31 |
| Other (a)(b)(d) | 248 | 113 | — |
| — |
| 361 | 200 | 106 | — |
| — |
| 306 | 310 | 117 | — |
| — |
| 427 | 267 | 109 | — |
| — |
| 376 |
| Total assets | $253 | $125 | $1 | $(9) | $370 | $210 | $125 | $1 | $(10) | $326 | $313 | $142 | $1 |
| $— |
| $456 | $270 | $137 | $1 | $(1) | $407 |
| Derivative liabilities: | | | | | | | | | | | | | | |
| Commodity (a)(b)(c) | $1 | $133 | $15 | $(17) | $132 | $1 | $124 |
| $— |
| $(26) | $99 | $15 | $87 | $32 | $(19) | $115 | $5 | $30 | $3 | $(6) | $32 |
| |
| (a) | The Companies’ policy is to review the fair value hierarchy and recognize transfers into and transfers out of the levels at the end of each reporting period. There wereCon Edison and CECONY had no transfers between levels 1, 2, and 3 forduring the nine months ended September 30, 2017 and for the year ended December 31, 2016.2019. |
Con Edison and CECONY had $2 million of commodity derivative liabilities transferred from level 3 to level 2 during the year ended December 31, 2018 because of availability of observable market data due to the decrease in the terms of certain contracts from beyond three years as of September 30, 2018 to less than three years as of December 31, 2018.
| |
| (b) | Level 2 assets and liabilities include investments held in the deferred compensation plan and/or non-qualified retirement plans, exchange-traded contracts where there is insufficient market liquidity to warrant inclusion in Level 1, certain over-the-counter derivative instruments for electricity, refined products and natural gas. Derivative instruments classified as Level 2 are valued using industry standard models that incorporate corroborated observable inputs; such as pricing services or prices from similar instruments that trade in liquid markets, time value and volatility factors. |
| |
| (c) | The accounting rules for fair value measurements and disclosures require consideration of the impact of nonperformance risk (including credit risk) from a market participant perspective in the measurement of the fair value of assets and liabilities. At September 30, 20172019 and December 31, 2016,2018, the Companies determined that nonperformance risk would have no material impact on their financial position or results of operations. |
| |
| (d) | Other assets are comprised of assets such as life insurance contracts within the deferred compensation plan and non-qualified retirement plans. |
| |
| (e) | Amounts represent the impact of legally-enforceable master netting agreements that allow the Companies to net gain and loss positions and cash collateral held or placed with the same counterparties. |
The employees in the Companies’ risk management group develop and maintain the Companies’ valuation policies and procedures for, and verify pricing and fair value valuation of, commodity derivatives.derivatives and interest rate swaps. Under the Companies’ policies and procedures, multiple independent sources of information are obtained for forward price curves used to value commodity derivatives.derivatives and interest rate swaps. Fair value and changes in fair value of commodity derivatives and interest rate swaps are reported on a monthly basis to the Companies’ risk committees, comprised of officers and employees of the Companies that oversee energy hedging at the Utilities and the Clean Energy Businesses. The risk management group reports to the Companies’ Vice President and Treasurer.
|
| | | | |
| | Fair Value of Level 3 at September 30, 2017 | Valuation Techniques | Unobservable Inputs | Range |
| | (Millions of Dollars) |
| Con Edison – Commodity |
| Electricity | $(21) | Discounted Cash Flow | Forward energy prices (a) | $19.00-$76.25 per MWh |
| |
| Discounted Cash Flow | Forward capacity prices (a) | $1.26-$9.47 per kW-month |
| Transmission Congestion Contracts/Financial Transmission Rights | 1 | Discounted Cash Flow | Discount to adjust auction prices for inter-zonal forward price curves (b) | 50.0% |
| | | | Inter-zonal forward price curves adjusted for historical zonal losses (b) | $0.50-$6.75 per MWh |
| Total Con Edison—Commodity | $(20) | | | |
| CECONY – Commodity |
| Electricity | $(15) | Discounted Cash Flow | Forward energy prices (a) | $20.50-$76.25 per MWh |
| Transmission Congestion Contracts | 1 | Discounted Cash Flow | Discount to adjust auction prices for inter-zonal forward price curves (b) | 50.0% |
| Total CECONY—Commodity | $(14) | | | |
|
| | | | |
| Fair Value of Level 3 at September 30, 2019 | Valuation Techniques | Unobservable Inputs | Range |
| (Millions of Dollars) |
| Con Edison – Commodity |
| Electricity | $(26) | Discounted Cash Flow | Forward energy prices (a) | $16.20-$71.77 per MWh |
| (18) | Discounted Cash Flow | Forward capacity prices (a) | $0.45-$7.75 per kW-month |
| Natural Gas | (1) | Discounted Cash Flow | Forward natural gas prices (a) | $0.97-$2.43 per Dt |
| Transmission Congestion Contracts/Financial Transmission Rights | 1 | Discounted Cash Flow | Inter-zonal forward price curves adjusted for historical zonal losses (b) | $(1.00)-$7.03 per MWh |
| Total Con Edison—Commodity | $(44) | | | |
| CECONY – Commodity |
| Electricity | $(24) | Discounted Cash Flow | Forward energy prices (a) | $23.40-$71.77 per MWh |
| (8) | Discounted Cash Flow | Forward capacity prices (a) | $0.45-$7.75 per kW-month |
| Transmission Congestion Contracts | 1 | Discounted Cash Flow | Inter-zonal forward price curves adjusted for historical zonal losses (b) | $0.35-$4.11 per MWh |
| Total CECONY—Commodity | $(31) | | | |
| |
| (a) | Generally, increases/(decreases) in this input in isolation would result in a higher/(lower) fair value measurement. |
| |
| (b) | Generally, increases/(decreases) in this input in isolation would result in a lower/(higher) fair value measurement. |
The table listed below provides a reconciliation of the beginning and ending net balances for assets and liabilities measured at fair value as of September 30, 20172019 and 20162018 and classified as Level 3 in the fair value hierarchy:
|
| | | | | | |
| | For the Three Months Ended September 30, |
| | Con Edison | CECONY |
| (Millions of Dollars) | 2019 | 2018 | 2019 | 2018 |
|
| Beginning balance as of July 1, | $(46) | $(4) | $(30) |
| $— |
|
| Included in earnings | 4 | 4 | 1 | 2 |
| Included in regulatory assets and liabilities | (1) | (4) | (1) | — |
|
| Settlements | (1) | (6) | (1) | (2) |
| Ending balance as of September 30, | $(44) | $(10) | $(31) |
| $— |
|
|
| | | | | | | | |
| | For the Three Months Ended September 30, |
| | �� Con Edison | CECONY |
| (Millions of Dollars) | 2017 |
| 2016 | 2017 |
| 2016 |
|
| Beginning balance as of July 1, | $(10) | $5 | $(6) | $2 |
| Included in earnings | 7 | (4) | 1 | — |
|
| Included in regulatory assets and liabilities | (13) | (5) | (8) | (3) |
| Sales | — |
| 4 | — |
| — |
|
| Settlements | (4) | 1 | (1) | 1 |
| Ending balance as of September 30, | $(20) | $1 | $(14) |
| $— |
|
| | | | For the Nine Months Ended September 30, | For the Nine Months Ended September 30, |
| | Con Edison | CECONY | Con Edison | CECONY |
| (Millions of Dollars) | 2017 |
| 2016 | 2017 |
| 2016 |
| 2019 |
| 2018 | 2019 |
| 2018 |
|
| Beginning balance as of January 1, | $1 | $6 | $1 | $8 | $(13) | $1 | $(2) | $4 |
| Included in earnings | 8 | (1) | 1 | (1) | (2) | 4 | 1 | 4 |
| Included in regulatory assets and liabilities | (21) | (11) | (14) | (6) | (32) | (7) | (29) | (5) |
| Purchases | 1 | 2 | 1 | 1 | |
| Sales | — |
| 4 | — |
| — |
| |
| Settlements | (9) | 1 | (3) | (2) | 3 | (9) | (1) | (4) |
| Transfer out of level 3 | | — |
| 1 | — |
| 1 |
| Ending balance as of September 30, | $(20) | $1 | $(14) |
| $— |
| $(44) | $(10) | $(31) |
| $— |
|
For the Utilities, realized gains and losses on Level 3 commodity derivative assets and liabilities are reported as part of purchased power, gas and fuel costs. The Utilities generally recover these costs in accordance with rate provisions approved by the applicable state public utilities regulators. Unrealized gains and losses for commodity derivatives are generally deferred on the consolidated balance sheet in accordance with the accounting rules for regulated operations.
For the Clean Energy Businesses, realized and unrealized gains and losses on Level 3 commodity derivative assets and liabilities are reported in non-utility revenues (immaterial for both periods)($3 million gain and $1 million loss) and purchased power costs ($4 million gain and $5 million loss)(immaterial for both periods) on the consolidated income statement for the three months ended September 30, 20172019 and 2016,2018, respectively. Realized and unrealized gains and losses on Level 3 commodity derivative assets and liabilities are reported in non-utility revenues (immaterial for both periods)($2 million gain and $4 million loss) and purchased power costs ($3 million gain and $6 million loss)(immaterial for both periods) on the consolidated income statement for the nine months ended September 30, 20172019 and 2016,2018, respectively. The change in fair value relating to Level 3 commodity derivative assets and liabilities held at September 30, 20172019 and 20162018 is included in non-utility revenues (immaterial for both periods)($3 million gain and $1 million loss) and purchased power costs ($4 million gain and $4 million loss)(immaterial for both periods) on the consolidated income statement for the three months ended
September 30, 20172019 and 2016,2018, respectively. For the nine months ended September 30, 20172019 and 2016,2018, the change in fair value relating to Level 3 commodity derivativederivatives assets and liabilities is included in non-utility revenues (immaterial for both periods)($2 million gain and $5 million loss) and purchased power costs ($2 million gain and $2 million loss)(immaterial for both periods), respectively, on the consolidated income statement, respectively.statement.
Note M —N – Variable Interest Entities
Con Edison entersThe accounting rules for consolidation address the consolidation of a variable interest entity (VIE) by a business enterprise that is the primary beneficiary. A VIE is an entity that does not have a sufficient equity investment at risk to permit it to finance its activities without additional subordinated financial support, or whose equity investors lack the characteristics of a controlling financial interest. The primary beneficiary is the business enterprise that has the power to direct the activities of the VIE that most significantly impact the VIE’s economic performance and either absorbs a significant amount of the VIE’s losses or has the right to receive benefits that could be significant to the VIE.
The Companies enter into arrangements including leases, partnerships and electricity purchase agreements, with various entities. As a result of these arrangements, Con Edison retainsthe Companies retain or may retain a variable interest in these entities.
CECONY
CECONY has an ongoing long-term electricity purchase agreement with Brooklyn Navy Yard Cogeneration Partners, LP, a potential variable interest entity (VIE).VIE. In April 2017, CECONY's long-term electricity purchase agreement with Cogen Technologies Linden Venture, LP, another potential VIE, expired. In 2016, requests were2018, a request was made of these counterpartiesthis counterparty for information necessary to determine whether the entity was a VIE and whether CECONY is the primary beneficiary; however, the information was not made available. The payments for these contractsthis contract constitute CECONY’s maximum exposure to loss with respect to the potential VIEs.VIE.
The following table summarizesCon Edison Development
In September 2019, Con Edison Development, which previously owned an 80 percent membership interest in OCI Solar San Antonio 4 LLC (Texas Solar 4), acquired the VIEsremaining 20 percent interest. Texas Solar 4 is a consolidated entity. Prior to the acquisition, Con Edison had a variable interest in Texas Solar 4, as to which Con Edison Development has entered into as of September 30, 2017:
|
| | | | | |
| Project Name (a) | Generating Capacity (b) (MW AC) | Power Purchase Agreement Term (in Years) | Year of Initial Investment | Location | Maximum Exposure to Loss (Millions of Dollars) (c) |
| Copper Mountain Solar 3 | 128 | 20 | 2014 | Nevada | $175 |
| Mesquite Solar 1 | 83 | 20 | 2013 | Arizona | 102 |
| Copper Mountain Solar 2 | 75 | 25 | 2013 | Nevada | 83 |
| California Solar | 55 | 25 | 2012 | California | 64 |
| Broken Bow II | 38 | 25 | 2014 | Nebraska | 44 |
| Texas Solar 4 | 32 | 25 | 2014 | Texas | 47 |
(a) With the exception of Texas Solar 4, Con Edison’s ownership interest is 50 percent and these projects are accounted for using the equity method of accounting. With the exception of Texas Solar 4, Con Edison is notwas the primary beneficiary since the power to direct the activities that most significantly impact the economics of the entities are shared equally betweenTexas Solar 4 was held by a Con Edison Development and third parties. Con Edison’s ownership interest insubsidiary. Texas Solar 4 owns a project company that developed a 40 MW (AC) solar electric production project. Electricity generated by the project is 80 percentsold
pursuant to a long-term power purchase agreement. Con Edison's losses from Texas Solar 4 for the three and is consolidatednine months ended September 30, 2019 and 2018 were immaterial.
In December 2018, a Con Edison Development subsidiary completed its acquisition of Sempra Solar Holdings, LLC. Included in the financial statements.acquisition were certain operating projects (Tax Equity Projects) with a noncontrolling tax equity investor to which a percentage of earnings, tax attributes and cash flows are allocated. The Tax Equity Projects are consolidated entities in which Con Edison has less than a 100 percent membership interest. Con Edison is the primary beneficiary since the power to direct the activities that most significantly impact the economics of Texas Solar 4the Tax Equity Projects is held by Con Edison Development.
(b) Represents Con Edison Development’s ownership interest inDevelopment subsidiaries. Electricity generated by the project.
(c)Tax Equity Projects is sold to utilities and municipalities pursuant to long-term power purchase agreements. For investments accounted for under the equity method, maximum exposure is equal to the carrying value of the investment on the consolidated balance sheet. For consolidated investments, such as Texas Solar 4, maximum exposure is equal to the net assets of the project on the consolidated balance sheet less any applicable noncontrolling interest ($7 million for Texas Solar 4). Con Edison did not provide any financial or other support during the three months ended September 30, 2019, the hypothetical liquidation at book value (HLBV) method of accounting for the Tax Equity Projects resulted in $30 million of income ($23 million, after tax) for the tax equity investor and a $13 million loss ($10 million, after tax) for Con Edison. For the nine months ended September 30, 2017 that was not previously contractually required.2019, the HLBV method of accounting for the Tax Equity Projects resulted in $79 million of income ($60 million, after-tax) for the tax equity investor and a $47 million loss ($36 million, after-tax) for Con Edison.
At September 30, 2019 and December 31, 2018, Con Edison’s consolidated balance sheet included the following amounts associated with its VIEs:
|
| | | | | | | | | | | | | |
| | Tax Equity Projects | |
| | Great Valley Solar
(c)(d) | Copper Mountain - Mesquite Solar
(c)(e) | Texas Solar 4
(c)(f) |
| (Millions of Dollars) | 2019 | 2018 | 2019 | 2018 | 2018 |
| Restricted cash |
| $— |
|
| $— |
|
| $— |
|
| $— |
| $4 |
| Non-utility property, less accumulated depreciation (g)(h) | 295 | 313 | 465 | 492 | 98 |
| Other assets | 47 | 18 | 131 | 97 | 9 |
| Total assets (a) | $342 | $331 | $596 | $589 | $111 |
| Long-term debt due within one year |
| $— |
|
| $— |
|
| $— |
|
| $— |
| $2 |
| Other liabilities | 19 | 17 | 22 | 33 | 26 |
| Long-term debt | — |
| — |
| — |
| — |
| 56 |
| Total liabilities (b) | $19 | $17 | $22 | $33 | $84 |
| |
| (a) | The assets of the Tax Equity Projects represent assets of a consolidated VIE that can be used only to settle obligations of the consolidated VIE. |
| |
| (b) | The liabilities of the Tax Equity Projects represent liabilities of a consolidated VIE for which creditors do not have recourse to the general credit of the primary beneficiary. |
| |
| (c) | Con Edison did not provide any financial or other support during the year that was not previously contractually required. |
| |
| (d) | Great Valley Solar consists of the Great Valley Solar 1, Great Valley Solar 2, Great Valley Solar 3 and Great Valley Solar 4 projects, for which the noncontrolling interest of the tax equity investor was $57 million and $33 million at September 30, 2019 and December 31, 2018, respectively. |
| |
| (e) | Copper Mountain - Mesquite Solar consists of the Copper Mountain Solar 4, Mesquite Solar 2 and Mesquite Solar 3 projects for which the noncontrolling interest of the tax equity investor was $115 million and $71 million at September 30, 2019 and December 31, 2018, respectively. |
| |
| (f) | Noncontrolling interest of the third party was $7 million at December 31, 2018. |
| |
| (g) | Non-utility property is reduced by accumulated depreciation of $7 million for Great Valley Solar and $10 million for Copper Mountain - Mesquite Solar at September 30, 2019. |
| |
| (h) | Non-utility property is reduced by accumulated depreciation of $1 million for Great Valley Solar, $1 million for Copper Mountain - Mesquite Solar and $15 million for Texas Solar 4 at December 31, 2018. |
Note N —O – New Financial Accounting Standards
In May 2014, the Financial Accounting Standards Board (FASB) and the International Accounting Standards Board jointly issued a revenue recognition standard that will supersede the revenue recognition requirements within Accounting Standards Codification Topic 605, “Revenue Recognition,” and most industry-specific guidance under the Codification through Accounting Standards Update (ASU) No. 2014-09, “Revenue from Contracts with Customers (Topic 606).” The purpose of the new guidance is to create a consistent framework for revenue recognition. The guidance clarifies how to measure and recognize revenue arising from customer contracts to depict the transfer of goods or services in an amount that reflects the consideration the entity expects to receive. Amendments were issued subsequently to clarify key areas including principal/agent considerations, performance obligations, licensing, sales taxes, noncash consideration, and contracts. The new standard is effective for reporting periods beginning after December 15, 2017. Early adoption is permitted for reporting periods beginning after December 15,June 2016, however, the Companies plan to adopt the new standard for reporting periods beginning after December 15, 2017.
Under the new standard, companies may use either of the following transition methods: (i) a full retrospective approach reflecting the application of the standard in each prior reporting period with the option to elect certain practical expedients, or (ii) a modified retrospective approach with the cumulative effect of initially adopting ASU
2014-09 recognized at the date of adoption (which includes additional footnote disclosures). The Companies anticipate using the modified retrospective approach.
The Companies have completed their analyses of the impact of the new standard on the majority of their various revenue streams.
The majority of the Companies’ sales are derived from tariffs to provide electric, gas, and steam service to customers. For such tariffs, the Companies expect that the revenue from contracts with customers under ASU 2014-09 will be equivalent to revenue from electricity, gas, or steam supplied in that period which is consistent with current practice. Consequently, the Companies do not anticipate that the new standard will materially impact the amount and/or timing of such revenues.
Con Edison has also completed its evaluation for the majority of the revenue at the Clean Energy Businesses, including revenue from the sale of energy-related products and services to retail customers, revenue from operating renewable and energy infrastructure projects, and revenue from the sale of renewable energy credits. For such revenues, Con Edison expects that the revenue from contracts with customers under ASU 2014-09 will not be materially different from revenue recorded consistent with current practice. Consequently, Con Edison does not anticipate that the new standard will materially impact the amount and/or timing of such revenues.
The Companies continue to review the potential impacts of the remaining revenue at the Utilities and the Clean Energy Businesses on the Companies' financial position, results of operations and liquidity as well as the additional disclosures and related controls required under the new standard, and anticipate completing such reviews during the fourth quarter of 2017.
In February 2016, the FASB issued amendments on financial reporting of leasing transactions through ASU No. 2016-02, “Leases (Topic 842)." The amendments require lessees to recognize assets and liabilities on the balance sheet and disclose key information about leasing arrangements. Lessees will need to recognize a right-of-use asset and a lease liability for virtually all of their leases (other than leases that meet the definition of a short-term lease). Lessor accounting is similar to the current model, but updated to align with certain changes to the lessee model. For income statement purposes, the pattern of expense recognition will be dependent on whether transactions are designated as operating leases or finance leases. The amendments are effective for reporting periods beginning after December 15, 2018. Early adoption is permitted. The amendments must be adopted using a modified retrospective transition and provide for certain practical expedients. Based on the existing portfolio of leases at implementation, for leases currently classified as operating leases, the Companies expect to recognize on the statements of financial position right-of-use assets and lease liabilities. The Companies are in the process of evaluating the potential impact of the new guidance on the Companies’ results of operations and liquidity.
In January 2017, the FASB issued amendments to the guidance for Business Combinationsrecognition of credit losses for financial instruments through ASU 2017-01, “Business Combinations2016-13, “Financial Instruments-Credit Losses (Topic 805)326): Clarifying the DefinitionMeasurement of a Business.Credit Losses on Financial Instruments.” The amendments replace the incurred loss impairment methodology which involved delayed recognition of credit losses. The amendments introduce an expected credit loss impairment model which requires immediate recognition of anticipated losses over the instrument’s life. A broader range of reasonable and supportable information must be considered in this update clarifydeveloping the definition of a businesscredit loss estimates. The Companies' financial instruments that would be subject to the amendments include their accounts receivable - customers and provide guidance on evaluating whether transactions should be accounted for as acquisitions (or disposals) of assets or businesses.other receivables. For public entities, the amendments are effective, and the Companies plan to adopt the amendments, for reporting periods beginning after December 15, 2017. Early2019. The adoption is permitted. The application of this guidance is not expected to have a material impact on the Companies’ financial position, results of operations and liquidity. The Companies will implement additional internal controls related to the amendments, however the adoption of the amendments is not expected to require a change that will materially affect the Companies’ internal control over financial reporting.
In January 2017, the FASB issued amendments to the guidance for the subsequent measurement of goodwill through ASU 2017-04, “Intangibles-Goodwill and Other (Topic 350): Simplifying the Test for Goodwill Impairment.” The amendments in this update simplify goodwill impairment testing by eliminating Step 2 of the goodwill impairment test wherein an entity has to compute the implied fair value of goodwill by performing procedures to determine the fair value of its assets and liabilities. Under the new guidance, an entity should recognize an impairment charge for the amount by which the carrying amount exceeds the reporting unit’s fair value up to the total amount of goodwill allocated to that reporting unit. For public entities, the amendments are effective for reporting periods beginning after December 15, 2019. Early adoption is permitted. The application of this guidance is not expected to have a material impact on the Companies’ financial position, results of operations and liquidity.
In February 2017, the FASB issued amendments to the guidance for other income through ASU 2017-05, “Other Income-Gains and Losses from the Derecognition of Nonfinancial Assets (Subtopic 610-20): Clarifying the Scope of Asset Derecognition Guidance and Accounting for Partial Sales of Nonfinancial Assets.” The amendments in this update clarify the scope of assets within Subtopic 610-20 and add guidance for partial sales of nonfinancial assets. The amendments are effective upon the adoption of ASU 2014-09, and therefore will be effective for reporting
periods beginning after December 15, 2017. The Company is in the process of evaluating the potential impact of the new guidance on the Company’s financial position, results of operations and liquidity.
In March 2017, the FASB issued amendments to the guidance for retirement benefits through ASU 2017-07, “Compensation-Retirement Benefits (Topic 715): Improving the Presentation of Net Periodic Pension Cost and Net Periodic Postretirement Benefit Cost.” The amendments in this update modify the presentation of net benefit cost, where the service component must be disaggregated from the other components of net benefit cost and be presented in the same line item as current employee compensation costs. The remaining components of the net benefit cost should be presented outside of income from operations. Additionally, the update allows only the service cost component to be eligible for capitalization. For public entities, the amendments are effective for reporting periods beginning after December 15, 2017. Early adoption is permitted. The Companies are in the process of evaluating the potential impact of the new guidance on the Companies’ financial position, results of operations and liquidity.
In March 2017, the FASB issued amendments to the guidance for debt securities through ASU 2017-08, “Receivables-Nonrefundable Fees and Other Costs (Subtopic 310-20): Premium Amortization on Purchased Callable Debt Securities.” The amendments in this update shorten the amortization period for certain callable debt securities held at a premium. The amendments do not require an accounting change for securities held at a discount; the discount continues to be amortized to maturity. For public entities, the amendments are effective for reporting periods beginning after December 15, 2018. Early adoption is permitted. The application of this guidance is not expected to have a material impact on the Companies’ financial position, results of operations and liquidity.
In May 2017, the FASB issued amendments to the guidance for stock compensation through ASU 2017-09, “Compensation-Stock Compensation (Topic 718): Scope of Modification Accounting.” The amendments in this update specify that changes to value, vesting conditions, or classification of an existing share-based payment award require application of modification accounting in Topic 718. For public entities, the amendments are effective for reporting periods beginning after December 15, 2017. Early adoption is permitted. The application of this guidance is not expected to have a material impact on the Companies’ financial position, results of operations and liquidity.
In August 2017, the FASB issued amendments to the guidance for derivatives and hedging through ASU 2017-12, “Derivatives and Hedging (Topic 815): Targeted Improvements to Accounting for Hedging Activities.” The amendments in this update provide greater clarification on hedge accounting for risk components, presentation and disclosure of hedging instruments, and overall targeted improvements to simplify hedge accounting. For public entities, the amendments are effective for reporting periods beginning after December 15, 2018 and interim periods within those fiscal years. Early adoption is permitted. The Companies are in the process of evaluating the potential impact of the new guidance on the Companies’ financial position, results of operations and liquidity.
Note O — Dispositions
Upton 2
In May 2017, Con Edison Development sold Upton 2, a development stage solar electric production project, for $11 million to Vistra Asset Co. and recorded a $1 million gain on sale ($0.7 million, net of taxes). In addition, Con Edison Development agreed to perform the engineering, procurement and construction for the 180 MW (AC) project, which is expected to be substantially completed in 2018.
Item 2: Management’s Discussion and Analysis of Financial Condition and Results of Operations
This combined management’s discussion and analysis of financial condition and results of operations (MD&A) relates to the consolidated financial statements (the Third Quarter Financial Statements) included in this report of two separate registrants: Consolidated Edison, Inc. (Con Edison) and Consolidated Edison Company of New York, Inc. (CECONY). As used in this report, the term the “Companies” refers to Con Edison and CECONY. CECONY is a subsidiary of Con Edison and, as such, information in this management’s discussion and analysis about CECONY applies to Con Edison.
This MD&A should be read in conjunction with the Third Quarter Financial Statements and the notes thereto, the MD&A in Item 7 of the Companies’ combined Annual Report on Form 10-K for the year ended December 31, 20162018 (File Nos. 1-14514 and 1-1217, the Form 10-K) and the MD&A in Part 1, Item 2 of the Companies' combined Quarterly ReportsReport on Form 10-Q for the quarterly periods ended March 31, 20172019 and June 30, 20172019 (File Nos. 1-14514 and 1-1217).
Information in any item of this report referred to in this discussion and analysis is incorporated by reference herein. The use of terms such as “see” or “refer to” shall be deemed to incorporate by reference into this discussion and analysis the information to which reference is made.
Con Edison, incorporated in New York State in 1997, is a holding company that owns all of the outstanding common stock of CECONY, Orange and Rockland Utilities, Inc. (O&R), Con Edison Clean Energy Businesses, Inc. and Con Edison Transmission, Inc. As used in this report, the term the “Utilities” refers to CECONY and O&R.
Con Edison’s principal business operations are those of CECONY, O&R, the Clean Energy Businesses and Con Edison Transmission. CECONY’s principal business operations are its regulated electric, gas and steam delivery businesses. O&R’s principal business operations are its regulated electric and gas delivery businesses. The Clean Energy Businesses develop, own and operate renewable and energy infrastructure projects and provide energy-relatedenergy-
related products and services to wholesale and retail customers. Con Edison Transmission invests in electric transmission facilities and gas pipeline and storage facilities.
Con Edison seeks to provide shareholder value through continued dividend growth, supported by earnings growth in regulated utilities and contracted assets. The company invests to provide reliable, resilient, safe and clean energy critical for New York City’s growing economy. The company is an industry leading owner and operator of contracted, large-scale solar generation in the United States. Con Edison is a responsible neighbor, helping the communities it serves become more sustainable.
CECONY
Electric
CECONY provides electric service to approximately 3.43.5 million customers in all of New York City (except a part of Queens) and most of Westchester County, an approximately 660 square mile service area with a population of more than nine million.
During the summer of 2017,2019, electric peak demand in CECONY's service area was 12,32112,389 MW (which occurred on July 20, 2017)17, 2019). At design conditions, electric peak demand in the company's service area would have been approximately 13,27013,222 MW in 20172019 compared to the company's forecast of 13,47013,270 MW. The company'scompany decreased its five-year forecast of average annual growth of thechange in electric peak demand in its service area at design conditions isfrom approximately 0.1 percent for 2018(for 2019 to 2022 (as compared2023) to approximately 0.2(0.1) percent for 2017(for 2020 to 2021)2024).
Gas
CECONY delivers gas to approximately 1.1 million customers in Manhattan, the Bronx, parts of Queens and most of Westchester County.
In May 2017,2019, the company decreasedincreased its five-year forecast of average annual growth of the peak gas demand in its service area at design conditions from approximately 2.31.3 percent(for 2019 to 2023) to approximately 1.5 percent (for 20172020 to 2021) to 1.6 percent (for 2018 to 2022)2024). The decreaseincrease reflects among other things, thatincreased applications for firm gas service in rollingadvance of the forecast forwardMarch 15, 2019 start of a year, another yeartemporary moratorium on new applications in most of oil-to-gas conversions has been completed and fewer opportunities to convert remain.Westchester County.
Steam
CECONY operates the largest steam distribution system in the United States by producing and delivering approximately 19,50020,445 MMlb of steam annually to approximately 1,6401,591 customers in parts of Manhattan.
In July 2019, the company's five-year forecast of average annual change in the peak steam demand in its service area at design conditions increased from approximately (0.5) percent (for 2019 to 2023) to (0.4) percent (for 2020 to 2024).
O&R
Electric
O&R and its utility subsidiary, Rockland Electric Company (RECO) (together referred to herein as O&R) provide electric service to approximately 0.3 million customers in southeastern New York and northern New Jersey, an approximately 1,300 square mile service area.
During the summer of 2017,2019, electric peak demand in O&R's service area was 1,4101,446 MW (which occurred on June 13, 2017)July 21, 2019). At design conditions, electric peak demand in the company's service area would have been approximately 1,6151,543 MW in 20172019 compared to the company's forecast of 1,6251,585 MW. The company’scompany increased its five-year forecast of average annual growth of thechange in electric peak demand in its service area at design conditions is flat for 2018from approximately (0.3) percent (for 2019 to 2022 (as compared2023) to approximately (0.1)(0.2) percent for 2017(for 2020 to 2021)2024).
Gas
O&R delivers gas to over 0.1 million customers in southeastern New York.
In May 2019, the company increased its five-year forecast of average annual growth of the peak gas demand in its service area at design conditions from approximately 0.6 percent (for 2019 to 2023) to 0.7 percent (for 2020 to 2024).
Clean Energy Businesses
Con Edison Clean Energy Businesses, Inc. has three wholly-owned subsidiaries: Consolidated Edison Development, Inc. (Con Edison Development), Consolidated Edison Energy, Inc. (Con Edison Energy) and Consolidated Edison Solutions, Inc. (Con Edison Solutions). Con Edison Clean Energy Businesses, Inc., together with these subsidiaries, (which were formerly referred to as the competitive energy businesses), are referred to in this report as the Clean Energy Businesses.
In September 2016, Con Edison sold the retail electric supply business of its The Clean Energy Businesses develop, own and operate renewable and energy infrastructure projects and provide energy-related
products and services to a subsidiary of Exelon Corporation for cash consideration of $235 million.wholesale and retail customers. In addition, Con Edison received $23 million in cash asDecember 2018, a working capital adjustment in February 2017.
In May 2017, Con Edison Development sold a development-stage solar electric production project for $11 million and agreed to perform engineering, procurement and construction for the project. See Note O to the Third Quarter Financial Statements.subsidiary acquired Sempra Solar Holdings, LLC.
Con Edison Transmission
Con Edison Transmission, Inc. invests in electric and gas transmission projects through its wholly-owned subsidiaries, Consolidated Edison Transmission, LLC (CET Electric) and Con Edison Gas Pipeline and Storage, LLC (CET Gas). CET Electric owns a 45.7 percent interest in New York Transco LLC (NY Transco), which owns and is proposing to build additional electric transmission assets in New York. CET Gas owns, through subsidiaries, a 50 percent interest in Stagecoach Gas Services, LLC, a joint venture that owns operates and will further developoperates an existing gas pipeline and storage business located in northern Pennsylvania and southern New York. Also, CET Gas and CECONY own 71.2 percent and 28.8 percent interests, respectively, in Honeoye Storage Corporation which owns and operates a gas storage businessfacility in upstate New York. In addition, CET Gas owns a 12.5 percent interest in Mountain Valley Pipeline LLC, a joint venture developing a proposed 300 mile300-mile gas transmission project in West Virginia and Virginia (Mountain Valley Pipeline).Virginia. Con Edison Transmission, Inc., together with CET Electric and CET Gas, are referred to in this report as Con Edison Transmission.
In October 2017, FERC issued a Certificate of Public Convenience and Necessity for the Mountain Valley Pipeline. The project has an estimated total cost of $3,000 million to $3,500 million and an in-service date targeted for late 2018.
Certain financial data of Con Edison’s businesses are presented below:
| | | For the Three Months Ended
September 30, 2017 | For the Nine Months Ended
September 30, 2017 | At September 30, 2017 | For the Three Months Ended
September 30, 2019 | For the Nine Months Ended
September 30, 2019 | At September 30, 2019 |
| (Millions of Dollars, except percentages) | Operating Revenues | Net Income | Operating Revenues | Net Income | Assets | Operating Revenues | Net Income for Common Stock | Operating Revenues | Net Income for
Common Stock | Assets |
| CECONY | $2,799 | 87 | % | $401 | 88 | % | $7,948 | 88 | % | $883 | 87 | % | $41,647 | 85 | % | $2,877 | 86 | % | $414 | 88 | % | $8,248 | 86 | % | $978 | 93 | % | $44,808 | 80 | % |
| O&R | 234 | 7 |
| 22 | 5 |
| 667 | 7 |
| 53 | 5 |
| 2,832 | 6 |
| 241 | 7 |
| 25 | 5 |
| 678 | 7 |
| 60 | 6 |
| 2,935 | 5 |
|
| Total Utilities | 3,033 | 94 |
| 423 | 93 |
| 8,615 | 95 |
| 936 | 92 |
| 44,479 | 91 |
| 3,118 | 93 |
| 439 | 93 |
| 8,926 | 93 |
| 1,038 | 99 |
| 47,743 | 85 |
|
| Clean Energy Businesses (a) | 177 | 6 |
| 26 | 5 |
| 460 | 5 |
| 54 | 5 |
| 2,811 | 6 |
| 247 | 7 |
| 22 | 5 |
| 696 | 7 |
| (19) | (2 | ) | 6,376 | 12 |
|
| Con Edison Transmission | 1 | — |
| 9 | 2 |
| 1 | — |
| 25 | 2 |
| 1,210 | 2 |
| 1 | — |
| 14 | 2 |
| 3 | — |
| 38 | 4 |
| 1,559 | 3 |
|
| Other (b) | — |
| — |
| (1) | — |
| (4) | — |
| 5 | 1 |
| 746 | 1 |
| (1) | — |
| (2) | — |
| (2) | — |
| (9) | (1 | ) | 262 | — |
|
| Total Con Edison | $3,211 | 100 | % | $457 | 100 | % | $9,072 | 100 | % | $1,020 | 100 | % | $49,246 | 100 | % | $3,365 | 100 | % | $473 | 100 | % | $9,623 | 100 | % | $1,048 | 100 | % | $55,940 | 100 | % |
| |
| (a) | Net income for common stock from the Clean Energy Businesses includes for the nine months ended September 30, 2017 $1 million net after-tax gain related to the sale of a development stage solar electric production project (see Note O to the Third Quarter Financial Statements). Also includes for the three and nine months ended September 30, 2017 $42019 includes $(17) million and $1$(41) million, respectively, of net after-tax mark-to-market gains, respectively.losses and reflects $23 million (after-tax) and $60 million (after-tax), respectively, of income attributable to the non-controlling interest of a tax equity investor in renewable electric production projects accounted for under the HLBV method of accounting. See Note N to the Third Quarter Financial Statements. |
| |
| (b) | Other includes parent company and consolidation adjustments. |
Results of Operations
Net income for common stock and earnings per share for the three and nine months ended September 30, 20172019 and 20162018 were as follows:
| | | | For the Three Months Ended September 30, | For the Nine Months Ended September 30, | For the Three Months Ended September 30, | For the Nine Months Ended September 30, |
| | 2017 | 2016 | 2017 |
| 2016 |
| 2017 | 2016 | 2017 |
| 2016 |
| 2019 | 2018 | 2019 | 2018 | 2019 | 2018 | 2019 | 2018 |
| (Millions of Dollars, except per share amounts) | Net Income | Earnings
per Share | Net Income | Earnings
per Share | Net Income for Common Stock | Earnings
per Share | Net Income for Common Stock | Earnings
per Share |
| CECONY | $401 | $388 |
| $1.30 |
|
| $1.27 |
| $883 | $859 |
| $2.88 |
|
| $2.87 |
| $414 | $431 | $1.25 | $1.38 | $978 | $969 | $2.99 | $3.12 |
| O&R | 22 | 27 | 0.07 |
| 0.09 |
| 53 | 55 | 0.18 |
| 0.18 |
| 25 | 21 | 0.07 | 60 | 52 | 0.18 | 0.17 |
| Clean Energy Businesses (a) | 26 | 78 | 0.08 |
| 0.26 |
| 54 | 120 | 0.18 |
| 0.40 |
| 22 | 27 | 0.07 | 0.10 | (19) | 58 | (0.06) | 0.19 |
| Con Edison Transmission | 9 | 10 | 0.03 |
| 0.03 |
| 25 | 11 | 0.08 |
| 0.04 |
| 14 | 13 | 0.04 | 38 | 35 | 0.11 |
| Other (b) | (1) | (6) | — |
| (0.02 | ) | 5 | (6) | 0.01 |
| (0.02 | ) | (2) | (57) | (0.01) | (0.19) | (9) | (63) | (0.02) | (0.21) |
| Con Edison (c) | $457 | $497 |
| $1.48 |
|
| $1.63 |
| $1,020 | $1,039 |
| $3.33 |
|
| $3.47 |
| $473 | $435 | $1.42 | $1.40 | $1,048 | $1,051 | $3.20 | $3.38 |
| |
| (a) | Includes $4 million or $0.01 a share and $(15) million or $(0.05) a share of net after-tax mark-to-market gains/(losses)Net income for common stock from the three months ended September 30, 2017 and 2016, respectively, and $1 million or $0.01 a share and $5 million or $0.02 a share of net after-tax mark-to-market gains/(losses) for the nine months ended September 30, 2017 and 2016, respectively. Also includes a $1 million or $0.00 a share net after-tax gain on the sale of a solar electric production project for the nine months ended September 30, 2017 (see Note O to the Third Quarter Financial Statements) and a $47 million or $0.15 a share of net gain related to the sale of the retail electric supply business, $5 million or $0.02 a share of net gain related to the acquisition of a solar electric production investmentClean Energy Businesses for the three and nine months ended September 30, 2016 and a $52019 includes $(17) million or $0.02$(0.05) a share and $(41) million or $(0.13) a share, respectively, of net loss relatedafter-tax mark-to-market losses and reflects $23 million or $0.07 a share (after-tax) and $60 million or $0.18 a share (after-tax), respectively, of income attributable to the impairmentnon-controlling interest of a solartax equity investor in renewable electric production investmentprojects accounted for under the HLBV method of accounting. See Note N to the Third Quarter Financial Statements. Net income for common stock from the Clean Energy Businesses for the three and nine months ended September 30, 2016.2018 includes $(2) million or $0.00 a share and $(3) million or $(0.01) a share, respectively, of net after-tax mark-to-market losses. |
| |
| (b) | Other includes parent company and consolidation adjustments. Includes $(42) million or $(0.14) a share of income tax expense resulting from a re-measurement of the company's deferred tax assets and liabilities following the issuance of proposed regulations relating to the TCJA for the three and nine months ended September 30, 2018. See Note I to the Third Quarter Financial Statements. Also includes for the three and nine months ended September 30, 2018 $10 million (net of tax) or $0.03 a share of transaction costs related to a Con Edison Development subsidiary’s agreement to purchase Sempra Solar Holdings, LLC. |
| |
| (c) | Earnings per share on a diluted basis were $1.48$1.42 a share and $1.62$1.39 a share for the three months ended September 30, 20172019 and 2016,2018, respectively, and $3.31$3.19 a share and $3.46$3.37 a share for the nine months ended September 30, 20172019 and 2016,2018, respectively. |
The Companies’ resultsfollowing tables present the estimated effect of operationsmajor factors on earnings per share and net income for common stock for the three and nine months ended September 30, 2017,2019 as compared with the 2016 periods, reflect changes in rate plans and regulatory charges and the impact of weather on steam revenues. The new electric rate plan of CECONY includes changes in the timing of recognition of annual revenues between quarters. Operations and maintenance expenses for CECONY for the three and nine months ended September 30, 2017 primarily reflect lower costs for pensions and other postretirement benefits. In addition, the Utilities' rate plans provide for revenues to cover expected changes in certain operating costs including depreciation, property taxes and other tax matters.2018 periods.
The following table presents the estimated effect on earnings per share and net income for the three and nine months ended September 30, 2017 period as compared with 2016 period, resulting from these and other major factors: |
| | | | | | | |
| | Three Months Variation | Nine Months Variation |
| (Millions of Dollars, except per share amounts) | Earnings
per Share
Variation | Net Income
Variation | Earnings
per Share
Variation | Net Income
Variation |
| CECONY (a) | | | | |
| Changes in rate plans and regulatory charges (b) | $0.12 | $35 | $0.29 | $87 |
| Weather impact on steam revenues | — |
| (1) | 0.01 | 4 |
| Other operations and maintenance expenses (c) | 0.07 | 22 | 0.24 | 73 |
| Depreciation, property taxes and other tax matters (d) | (0.10) | (30) | (0.36) | (108) |
| Other (e) | (0.06) | (13) | (0.17) | (32) |
| Total CECONY | 0.03 | 13 | 0.01 | 24 |
| O&R (a) |
|
|
|
|
| Changes in rate plans and regulatory charges | — |
| 1 | 0.04 | 12 |
| Other operations and maintenance expenses (f) | (0.01) | (2) | (0.03) | (9) |
| Depreciation and property taxes | (0.01) | (4) | (0.02) | (6) |
| Other (e) | — |
| — |
| 0.01 | 1 |
| Total O&R | (0.02) | (5) | — |
| (2) |
| Clean Energy Businesses |
|
|
|
|
| Operating revenues less energy costs (g) | 0.10 | 32 | 0.10 | 31 |
| Other operations and maintenance expenses (h) | (0.08) | (23) | (0.10) | (30) |
| Depreciation | (0.02) | (5) | (0.05) | (15) |
| Net interest expense | (0.01) | (3) | (0.02) | (6) |
| Other (e) (i) | (0.17) | (53) | (0.15) | (46) |
| Total Clean Energy Businesses | (0.18) | (52) | (0.22) | (66) |
| Con Edison Transmission (e) (j) | — |
| (1) | 0.04 | 14 |
| Other, including parent company expenses (e) (k) | 0.02 | 5 | 0.03 | 11 |
| Total variations | $(0.15) | $(40) | $(0.14) | $(19) |
| |
(a) | Under the revenue decoupling mechanisms in the Utilities’ New York electric and gas rate plans and the weather-normalization clause applicable to their gas businesses, revenues are generally not affected by changes in delivery volumes from levels assumed when rates were approved. In general, the Utilities recover on a current basis the fuel, gas purchased for resale and purchased power costs they incur in supplying energy to their full-service customers. Accordingly, such costs do not generally affect the Companies' results of operations. |
| |
(b) | For the three and nine months ended September 30, 2017 as compared to the 2016 periods, reflects lower electric net base revenues of $(0.03) a share, resulting from the timing of recognition of annual revenues between quarters under CECONY's new electric rate plan. Also, for the three and nine months ended September 30, 2017 as compared with the 2016 periods, reflects higher electric net base revenues ($0.07 a share and $0.08 a share, respectively), resulting from the increased base rates under CECONY's new electric rate plan, higher gas net base revenues ($0.01 a share and $0.16 a share, respectively), incentives earned under the electric Earnings Adjustment Mechanisms of $0.02 a share, a property tax refund incentive of $0.01 a share and an increase to the regulatory reserve related to certain gas proceedings in 2016 ($0.02 a share and $0.03 a share, respectively). For the nine months ended September 30, 2017 as compared with the 2016 period, reflects growth in the number of gas customers of $0.03 a share. |
| |
(c) | Reflects lower pension and other postretirement benefits costs of $0.07 a share and $0.22 a share for the three and nine months ended September 30, 2017 as compared with the 2016 periods. |
| |
(d) | Reflects higher depreciation and amortization expense of $(0.04) a share and $(0.13) a share, property taxes of $(0.04) a share and $(0.13) a share, and income taxes of $(0.02) a share and $(0.10) a share for the three and nine months ended September 30, 2017 as compared with the 2016 periods. |
| |
(e) | Includes the impact of the dilutive effect of Con Edison's stock issuances. |
| |
(f) | Reflects higher pension costs of $(0.01) a share and $(0.02) a share for the three and nine months ended September 30, 2017 as compared with the 2016 periods. Also, for the nine months ended September 30, 2017 as compared with the 2016 period, reflects higher regulatory assessments and fees that are collected in revenues from customers and a higher reserve for injuries and damages of $(0.01) a share. |
| |
(g) | Reflects higher revenues from renewable electric production projects and lower revenues and energy costs resulting from the retail electric supply business which was sold in September 2016. Includes $0.01 a share and $(0.05) a share of net after-tax mark-to-market gains/(losses) for the three months ended September 30, 2017 and 2016, respectively, and $0.01 a share and $0.02 a share of net after-tax mark-to-market gains for the nine months ended September 30, 2017 and 2016, respectively. Substantially all the mark-to-market effects in the 2016 periods were related to the retail electric supply business sold in September 2016. |
| |
(h) | Reflects Upton 2 engineering, procurement and construction costs ($(0.05) a share and $(0.06) a share, respectively) as well as increased energy service costs ($(0.02) a share and $(0.04) a share, respectively) for the three and nine months ended September 30, 2017 as compared with the 2016 periods. |
| |
(i) | Includes $0.02 a share of net after-tax gain related to the acquisition of a solar electric production investment for the three and nine months ended September 30, 2016, net of $(0.02) a share of impairment loss related to the solar electric production investment for the nine months ended September 30, 2016. Includes $0.15 a share of net after-tax gain related to the sale of the retail electric supply business for the three and nine months ended September 30, 2016. |
| |
(j) | Reflects income from equity investments. |
| |
(k) | Reflects higher state income tax benefits. |
|
| | | | |
| Variation for the Three Months Ended September 30, 2019 vs. 2018 |
| | Earnings
per Share | Net Income for Common Stock (Millions of Dollars) | |
| CECONY (a) | | | |
| Changes in rate plans | $0.11 | $35 | Reflects higher electric and gas net base revenues of $0.19 a share and $0.01 a share, respectively, due primarily to electric and gas base rates increases in January 2019 under the company's rate plans. |
| Weather impact on steam revenues | — |
| (1) |
|
| Operations and maintenance expenses | (0.11) | (34) | Reflects higher costs for pension and other postretirement benefits of $(0.04) a share, stock-based compensation of $(0.03) a share and uncollectibles of $(0.02) a share. |
| Depreciation, property taxes and other tax matters | (0.10) | (31) | Reflects higher property taxes of $(0.06) a share and higher depreciation and amortization expense of $(0.06) a share, offset, in part, by the reduction in the sales and use tax reserve upon conclusion of the audit assessment of $0.02 a share. |
| Other | (0.03) | 14 | Reflects primarily the dilutive effect of Con Edison's stock issuances of $(0.09) a share, offset, in part, by lower costs associated with components of pension and other postretirement benefits other than service cost of $0.05 a share. |
| Total CECONY | (0.13) | (17) |
|
| O&R (a) |
|
|
|
| Changes in rate plans | 0.03 | 11 | Reflects primarily an electric base rate increase under the company's new rate plan, effective January 1, 2019. |
| Operations and maintenance expenses | — |
| (1) |
|
| Depreciation, property taxes and other tax matters | (0.01) | (2) | Reflects higher depreciation and amortization expense. |
| Other | (0.02) | (4) | Reflects primarily the dilutive effect of Con Edison's stock issuances of $(0.01) a share. |
| Total O&R | — |
| 4 |
|
| Clean Energy Businesses |
|
|
|
|
| Operating revenues less energy costs | 0.27 | 85 | Reflects primarily higher revenues from renewable electric production projects resulting from the December 2018 acquisition of Sempra Solar Holdings, LLC, including the consolidation of certain jointly-owned projects that were previously accounted for as equity investments of $0.30 a share, and lower gas purchased for resale due to lower purchased volume of $0.12 a share, offset, in part, by lower wholesale revenues of $(0.13) a share. |
| Operations and maintenance expenses | (0.01) | (2) | Reflects higher costs associated with additional renewable electric production projects in operation resulting from the December 2018 acquisition of Sempra Solar Holdings, LLC. of $(0.03) a share, offset, in part, by lower energy services costs of $0.02 a share. |
| Depreciation and amortization | (0.08) | (26) | Reflects an increase in renewable electric production projects resulting from the December 2018 acquisition of Sempra Solar Holdings, LLC. |
| Net interest expense | (0.12) | (35) | Reflects primarily an increase in debt resulting from the December 2018 acquisition of Sempra Solar Holdings, LLC. |
| HLBV effects | (0.07) | (23) |
|
| Other | (0.02) | (4) | Reflects primarily the absence in 2019 of equity income from certain jointly-owned projects that were accounted for as equity investments in 2018 but consolidated after the December 2018 acquisition of Sempra Solar Holdings, LLC. |
| Total Clean Energy Businesses | (0.03) | (5) |
|
| Con Edison Transmission | — |
| 1 | Reflects income from equity investments. |
| Other, including parent company expenses | 0.18 | 55 |
|
| Total Reported (GAAP basis) | $0.02 | $38 |
|
| | | | |
a. Under the revenue decoupling mechanisms in the Utilities’ New York electric and gas rate plans and the weather-normalization clause applicable to their gas businesses, revenues are generally not affected by changes in delivery volumes from levels assumed when rates were approved. In general, the utilities recover on a current basis the fuel, gas purchased for resale and purchased power costs they incur in supplying energy to their full-service customers. Accordingly, such costs do not generally affect Con Edison’s results of operations. |
|
| | | | |
| Variation for the Nine Months Ended September 30, 2019 vs. 2018 |
| | Earnings
per Share | Net Income for Common Stock (Millions of Dollars) | |
| CECONY (a) |
|
|
|
| Changes in rate plans | $0.59 | $185 | Reflects higher electric and gas net base revenues of $0.42 a share and $0.12 a share, respectively, due primarily to electric and gas base rates increases in January 2019 under the company's rate plans and growth in the number of gas customers of $0.02 a share. |
| Weather impact on steam revenues | (0.05) | (15) | Reflects the impact of warmer winter weather in 2019. |
| Operations and maintenance expenses | (0.23) | (71) | Reflects higher costs for pension and other postretirement benefits of $(0.11) a share, stock-based compensation of $(0.07) a share and regulatory assessments and fees that are collected in revenues from customers of $(0.05) a share. |
| Depreciation, property taxes and other tax matters | (0.38) | (121) | Reflects higher property taxes of $(0.19) a share, higher depreciation and amortization expense of $(0.17) a share and the absence of New York State sales and use tax refunds received in 2018 of $(0.04) a share; offset, in part, by the reduction in the sales and use tax reserve upon conclusion of the audit assessment of $0.02 a share. |
| Other | (0.06) | 31 | Reflects primarily the dilutive effect of Con Edison's stock issuances of $(0.16) a share and higher interest expense on long-term debt of $(0.09) a share, offset, in part, by lower costs associated with components of pension and other postretirement benefits other than service cost of $0.14 a share. |
| Total CECONY | (0.13) | 9 |
|
| O&R (a) |
|
|
|
| Changes in rate plans | 0.03 | 10 | Reflects an electric base rate increase of $0.05 a share, offset, in part, by a gas base rate decrease of $(0.02) a share under the company's new rate plans, effective January 1, 2019. |
| Operations and maintenance expenses | 0.02 | 6 | Reflects primarily a reduction of a regulatory asset associated with certain site investigation and environmental remediation costs in 2018. |
| Depreciation, property taxes and other tax matters | (0.02) | (5) | Reflects higher depreciation and amortization expense. |
| Other | (0.02) | (3) | Reflects primarily the dilutive effect of Con Edison's stock issuances of $(0.01) a share. |
| Total O&R | 0.01 | 8 |
|
| Clean Energy Businesses |
|
|
|
|
| Operating revenues less energy costs | 0.44 | 137 | Reflects primarily higher revenues from renewable electric production projects resulting from the December 2018 acquisition of Sempra Solar Holdings, LLC, including the consolidation of certain jointly-owned projects that were previously accounted for as equity investments of $0.68 a share, offset, in part, by lower engineering, procurement and construction services revenues of $(0.22) a share. |
| Operations and maintenance expenses | 0.14 | 43 | Reflects primarily lower engineering, procurement and construction costs of $0.20 a share and lower energy services costs of $0.02 a share, offset, in part, by higher costs associated with additional renewable electric production projects in operation resulting from the December 2018 acquisition of Sempra Solar Holdings, LLC. of $(0.08) a share. |
| Depreciation and amortization | (0.27) | (84) | Reflects an increase in renewable electric production projects resulting from the December 2018 acquisition of Sempra Solar Holdings, LLC. |
| Net interest expense | (0.31) | (96) | Reflects primarily an increase in debt resulting from the December 2018 acquisition of Sempra Solar Holdings, LLC. |
| HLBV effects | (0.18) | (60) |
|
| Other | (0.07) | (17) | Reflects primarily the absence in 2019 of equity income from certain jointly-owned projects that were accounted for as equity investments in 2018 but consolidated after the December 2018 acquisition of Sempra Solar Holdings, LLC. |
| Total Clean Energy Businesses | (0.25) | (77) |
|
| Con Edison Transmission | — |
| 3 | Reflects income from equity investments. |
| Other, including parent company expenses | 0.19 | 54 |
|
| Total Reported (GAAP basis) | $(0.18) | $(3) |
|
| | | | |
a. Under the revenue decoupling mechanisms in the Utilities’ New York electric and gas rate plans and the weather-normalization clause applicable to their gas businesses, revenues are generally not affected by changes in delivery volumes from levels assumed when rates were approved. In general, the utilities recover on a current basis the fuel, gas purchased for resale and purchased power costs they incur in supplying energy to their full-service customers. Accordingly, such costs do not generally affect Con Edison’s results of operations. |
The Companies’ other operations and maintenance expenses for the three and nine months ended September 30, 20172019 and 20162018 were as follows:
| | | | For the Three Months Ended September 30, | For the Nine Months Ended September 30, | For the Three Months Ended September 30, | For the Nine Months Ended September 30, |
| (Millions of Dollars) | 2017 | 2016 | 2017 | 2016 | 2019 | 2018 | 2019 |
| 2018 |
| CECONY | | | | |
| Operations | $386 | $381 | $1,147 | $1,109 | $414 | $393 | $1,190 | $1,186 |
| Pensions and other postretirement benefits | 51 | 87 | 152 | 261 | 34 | 18 | 100 | 53 |
| Health care and other benefits | 45 | 47 | 127 | 124 | 46 | 126 | 132 |
| Regulatory fees and assessments (a) | 142 | 135 | 355 | 361 | 134 | 132 | 356 | 335 |
| Other | 67 | 74 | 211 | 250 | 84 | 77 | 250 | 220 |
| Total CECONY | 691 | 724 | 1,992 | 2,105 | 712 | 666 | 2,022 | 1,926 |
| O&R | 80 | 77 | 236 | 220 | 81 | 80 | 225 | 234 |
Clean Energy Businesses | 79 | 40 | 174 | 124 | 53 | 50 | 168 | 226 |
| Con Edison Transmission | 3 | 1 | 7 | 1 | 2 | 3 | 7 | 7 |
Other (b)(c) | (1) | (2) | (3) | (1) | (2) | — |
| (4) |
| Total other operations and maintenance expenses | $852 | $840 | $2,406 | $2,447 | $847 | $797 | $2,422 | $2,389 |
| |
| (a) | Includes Demand Side Management, System Benefit Charges and Public Service Law 18A assessments which are collected in revenues. |
| |
| (b) | The decrease in operations and maintenance for the nine months ended September 30, 2019 compared with the 2018 period is due primarily to lower engineering, procurement and construction costs. |
| |
| (c) | Includes parent company and consolidation adjustments. |
A discussion of the results of operations by principal business segment for the three and nine months ended September 30, 20172019 and 20162018 follows. For additional business segment financial information, see Note JK to the Third Quarter Financial Statements.
Three Months Ended September 30, 2017 Compared with Three Months Ended September 30, 2016
The Companies’ results of operations in 2017 compared with 2016 were:for the three months ended September 30, 2019 and 2018 were as follows:
| | | | CECONY | O&R | Clean Energy Businesses | Con Edison Transmission | Other (a) | Con Edison (b) | CECONY | O&R | Clean Energy Businesses | Con Edison
Transmission | Other (a) | Con Edison (b) |
| (Millions of Dollars) | Increases (Decreases) Amount | Increases (Decreases) Percent | Increases (Decreases) Amount | Increases (Decreases) Percent | Increases (Decreases) Amount | Increases (Decreases) Percent | Increases
(Decreases)
Amount | Increases
(Decreases)
Percent | Increases
(Decreases)
Amount | Increases
(Decreases)
Percent | Increases (Decreases) Amount | Increases (Decreases) Percent | 2019 |
| 2018 |
| 2019 |
| 2018 |
| 2019 |
| 2018 |
| 2019 |
| 2018 |
| 2019 |
| 2018 |
| 2019 | 2018 |
|
| Operating revenues | $(29) | (1.0 | )% | $(6) | (2.5 | )% | $(173) | (49.4 | )% | $1 | — | % | $1 | Large |
| $(206) | (6.0 | )% | $2,877 | $2,899 | $241 | $246 | $247 | $181 | $1 | $1 | $(1) | $1 | $3,365 | $3,328 |
| Purchased power | (95) | (19.2 | ) | (9) | (13.0 | ) | (234) | Large |
| — |
| — |
| — |
| — |
| (338) | (42.4 | ) | 423 | 472 | 61 | 73 | — |
| — |
| — |
| — |
| (1) | — |
| 483 | 545 |
| Fuel | 1 | 3.4 |
| — |
| — |
| — |
| — |
| — |
| — |
| — |
| — |
| 1 | 3.4 |
| 31 | 39 | — |
| — |
| — |
| — |
| — |
| — |
| — |
| — |
| 31 | 39 |
| Gas purchased for resale | 24 | 70.6 |
| 2 | 25.0 |
| 8 | 20.5 |
| — |
| — |
| — |
| — |
| 34 | 42.0 |
| 52 | 66 | 10 | 12 | 36 | 85 | — |
| — |
| — |
| 1 | 98 | 164 |
| Other operations and maintenance | (33) | (4.6 | ) | 3 | 3.9 |
| 39 | 97.5 |
| 2 | Large |
| 1 | (50.0 | ) | 12 | 1.4 |
| 712 | 666 | 81 | 80 | 53 | 50 | 2 | 3 | (1) | (2) | 847 | 797 |
| Depreciation and amortization | 22 | 7.9 |
| 1 | 5.9 |
| 8 | 72.7 |
| — |
| — |
| 1 | Large |
| 32 | 10.5 |
| 346 | 322 | 22 | 19 | 53 | 18 | — |
| — |
| — |
| 1 | 421 | 360 |
| Taxes, other than income taxes | 18 | 3.6 |
| — |
| — |
| (2) | (40.0 | ) | — |
| — |
| — |
| — |
| 16 | 3.0 |
| 590 | 570 | 21 | 20 | 5 | 3 | — |
| — |
| 2 | 4 | 618 | 597 |
| Gain on sale of retail electric supply business (2016) | — |
| — |
| — |
| — |
| (104) | Large |
| — |
| — |
| — |
| — |
| (104) | Large |
| |
| Operating income | 34 | 4.4 |
| (3) | (6.3 | ) | (96) | (76.8 | ) | (1) | Large |
| (1) | (50.0 | ) | (67) | (7.1 | ) | 723 | 764 | 46 | 42 | 100 | 25 | (1) | (2) | (1) | (3) | 867 | 826 |
| Other income less deductions | (2) | Large |
| (1) | Large |
| (9) | (33.3 | ) | 1 | 5.0 |
| 1 | Large |
| (10) | (20.4 | ) | (9) | (33) | (3) | (5) | 1 | 18 | 27 | 24 | (2) | (15) | 14 | (11) |
| Net interest expense | 3 | 1.9 |
| — |
| — |
| 5 | 71.4 |
| 1 | 33.3 |
| (2) | (40.0 | ) | 7 | 3.9 |
| 181 | 175 | 10 | 10 | 61 | 13 | 7 | 5 | 3 | 2 | 262 | 205 |
| Income before income tax expense | 29 | 4.7 |
| (4) | (10.0 | ) | (110) | (75.9 | ) | (1) | (6.3 | ) | 2 | 50.0 |
| (84) | (10.4 | ) | 533 | 556 | 33 | 27 | 40 | 30 | 19 | 17 | (6) | (20) | 619 | 610 |
| Income tax expense | 16 | 7.1 |
| 1 | 7.7 |
| (58) | (86.6 | ) | — |
| — |
| (3) | Large |
| (44) | (14.0 | ) | 119 | 125 | 8 | 6 | (12) | 3 | 5 | 4 | (4) | 37 | 116 | 175 |
| Net income | $13 | 3.4 | % | $(5) | (18.5 | )% | $(52) | (66.7 | )% | $(1) | (10.0 | )% | $5 | 83.3 | % | $(40) | (8.0 | )% | $414 | $431 | $25 | $21 | $52 | $27 | $14 | $13 | $(2) | $(57) | $503 | $435 |
Income attributable to non-controlling interest
| | — |
| — |
| — |
| — |
| 30 | — |
| — |
| — |
| — |
| — |
| 30 | — |
|
| Net income for common stock | | $414 | $431 | $25 | $21 | $22 | $27 | $14 | $13 | $(2) | $(57) | $473 | $435 |
| |
| (a) | Includes parent company and consolidation adjustments. |
| |
| (b) | Represents the consolidated results of operations of Con Edison and its businesses. |
CECONY
| | | For the Three Months Ended
September 30, 2017 | | For the Three Months Ended
September 30, 2016 | | For the Three Months Ended
September 30, 2019 | | For the Three Months Ended
September 30, 2018 | |
| (Millions of Dollars) | Electric |
| Gas |
| Steam |
| 2017 Total | Electric |
| Gas |
| Steam |
| 2016 Total | 2017-2016
Variation | Electric |
| Gas |
| Steam |
| 2019 Total | Electric |
| Gas |
| Steam |
| 2018 Total | 2019-2018
Variation |
| Operating revenues | $2,469 | $268 | $62 | $2,799 | $2,557 | $208 | $63 | $2,828 | $(29) | $2,544 | $275 | $58 | $2,877 | $2,571 | $264 | $64 | $2,899 | $(22) |
| Purchased power | 393 | — |
| 7 | 400 | 486 | — |
| 9 | 495 | (95) | 418 | — |
| 5 | 423 | 465 | — |
| 7 | 472 | (49) |
| Fuel | 24 | — |
| 6 | 30 | 21 | — |
| 8 | 29 | 1 | 27 | — |
| 4 | 31 | 34 | — |
| 5 | 39 | (8) |
| Gas purchased for resale | — |
| 58 | — |
| 58 | — |
| 34 | — |
| 34 | 24 | — |
| 52 | — |
| 52 | — |
| 66 | — |
| 66 | (14) |
| Other operations and maintenance | 547 | 104 | 40 | 691 | 578 | 102 | 44 | 724 | (33) | 565 | 102 | 45 | 712 | 518 | 101 | 47 | 666 | 46 |
| Depreciation and amortization | 232 | 47 | 21 | 300 | 217 | 41 | 20 | 278 | 22 | 266 | 58 | 22 | 346 | 248 | 52 | 22 | 322 | 24 |
| Taxes, other than income taxes | 418 | 71 | 31 | 520 | 414 | 59 | 29 | 502 | 18 | 465 | 87 | 38 | 590 | 456 | 79 | 35 | 570 | 20 |
| Operating income | $855 | $(12) | $(43) | $800 | $841 | $(28) | $(47) | $766 | $34 | $803 | $(24) | $(56) | $723 | $850 | $(34) | $(52) | $764 | $(41) |
Electric
CECONY’s results of electric operations for the three months ended September 30, 20172019 compared with the 20162018 period iswere as follows:
| | | For the Three Months Ended | | For the Three Months Ended | |
| (Millions of Dollars) | September 30, 2017 | September 30, 2016 | Variation | September 30, 2019 | September 30, 2018 | Variation |
| Operating revenues | $2,469 | $2,557 | $(88) | $2,544 | $2,571 | $(27) |
| Purchased power | 393 | 486 | (93) | 418 | 465 | (47) |
| Fuel | 24 | 21 | 3 | 27 | 34 | (7) |
| Other operations and maintenance | 547 | 578 | (31) | 565 | 518 | 47 |
| Depreciation and amortization | 232 | 217 | 15 | 266 | 248 | 18 |
| Taxes, other than income taxes | 418 | 414 | 4 | 465 | 456 | 9 |
| Electric operating income | $855 | $841 | $14 | $803 | $850 | $(47) |
CECONY’s electric sales and deliveries for the three months ended September 30, 20172019 compared with the 20162018 period were:
| | | Millions of kWh Delivered | | Revenues in Millions (a) | Millions of kWh Delivered | | Revenues in Millions (a) |
| For the Three Months Ended | | | For the Three Months Ended | | For the Three Months Ended | | | For the Three Months Ended | |
| Description | September 30, 2017 |
| September 30, 2016 |
| Variation |
| Percent Variation |
| | September 30, 2017 | September 30, 2016 | Variation | Percent Variation |
| September 30, 2019 |
| September 30, 2018 |
| Variation |
| Percent Variation |
| | September 30, 2019 | September 30, 2018 | Variation | Percent Variation |
|
| Residential/Religious (b) | 3,237 |
| 3,653 |
| (416 | ) | (11.4 | )% | | $805 | $883 | $(78) | (8.8 | )% | 3,687 |
| 3,777 |
| (90) |
| (2.4 | )% | | $923 | $988 | $(65) | (6.6 | )% |
| Commercial/Industrial | 2,570 |
| 2,749 |
| (179 | ) | (6.5 | ) | | 534 | 551 | (17) | (3.1 | ) | 2,831 |
| 2,706 |
| 125 |
| 4.6 |
| | 557 | 542 | 15 | 2.8 |
|
| Retail choice customers | 7,510 |
| 8,136 |
| (626 | ) | (7.7 | ) | | 867 | 918 | (51) | (5.6 | ) | 7,339 |
| 7,756 |
| (417) |
| (5.4 | ) | | 854 | 910 | (56) | (6.2 | ) |
| NYPA, Municipal Agency and other sales | 2,705 |
| 2,764 |
| (59 | ) | (2.1 | ) | | 207 | 204 | 3 | 1.5 |
| 2,756 |
| 2,758 |
| (2) |
| (0.1 | ) | | 219 | 225 | (6) | (2.7 | ) |
| Other operating revenues (c) | — |
| — |
| — |
| — |
| | 56 | 1 | 55 | Large |
| — |
| — |
| — |
| — |
| | (9) | (94) | 85 | (90.4 | ) |
| Total | 16,022 |
| 17,302 |
| (1,280 | ) | (7.4 | )% | (d) | $2,469 | $2,557 | $(88) | (3.4 | )% | 16,613 |
| 16,997 |
| (384) |
| (2.3 | )% | (d) | $2,544 | $2,571 | $(27) | (1.1 | )% |
| |
| (a) | Revenues from electric sales are subject to a revenue decoupling mechanism, as a result of which delivery revenues generally are not affected by changes in delivery volumes from levels assumed when rates were approved. |
| |
| (b) | “Residential/Religious” generally includes single-family dwellings, individual apartments in multi-family dwellings, religious organizations and certain other not-for-profit organizations. |
| |
| (c) | Other electric operating revenues generally reflect changes in the revenue decoupling mechanism current asset or regulatory liability and changes in regulatory assets and liabilities in accordance with the revenue decoupling mechanism and other provisions of the company’s rate plans. |
| |
| (d) | After adjusting for variations, primarily weather and billing days, electric delivery volumes in CECONY’s service area decreased 1.4increased 0.7 percent in the three months ended September 30, 20172019 compared with the 20162018 period. |
Operating revenues decreased $88$27 million in the three months ended September 30, 20172019 compared with the 20162018 period due primarily to lower purchased power expenses ($9347 million) and fuel expenses ($7 million), offset, in part, by higheran increase in revenues from the electric rate plan ($2721 million).
Purchased power expenses decreased $93$47 million in the three months ended September 30, 20172019 compared with the 20162018 period due to lower unit costs ($82 million), offset, in part, by higher purchased volumes ($6635 million) and unit costs ($27 million).
Fuel expenses increased $3decreased $7 million in the three months ended September 30, 20172019 compared with the 20162018 period due to higherlower unit costs ($68 million), offset, in part, by lowerhigher purchased volumes from the company's electric generating facilities ($31 million).
Other operations and maintenance expenses decreased $31increased $47 million in the three months ended September 30, 20172019 compared with the 20162018 period due primarily to lowerhigher costs for pension and other postretirement benefits ($38 million) and environmental costs ($618 million), offset by higher surchargesstock-based compensation ($9 million), reserve for assessments and fees that are collected in revenues from customersuncollectibles ($6 million) and uncollectible expensemunicipal infrastructure support ($53 million).
Depreciation and amortizationincreased $15$18 million in the three months ended September 30, 20172019 compared with the 20162018 period due primarily to higher electric utility plant balances.
Taxes, other than income taxes increased $4$9 million in the three months ended September 30, 20172019 compared with the 20162018 period due primarily to higher property taxes ($1119 million) and payroll taxes ($2 million), offset, in part, by the reduction in the sales and use tax reserve upon conclusion of the audit assessment ($5 million), higher deferral of under-collected property taxes ($4 million) and lower state and local taxes ($52 million).
Gas
CECONY’s results of gas operations for the three months ended September 30, 20172019 compared with the 20162018 period iswere as follows:
| | | For the Three Months Ended | | For the Three Months Ended | |
| (Millions of Dollars) | September 30, 2017 | September 30, 2016 | Variation | September 30, 2019 | September 30, 2018 | Variation |
| Operating revenues | $268 | $208 | $60 | $275 | $264 | $11 |
| Gas purchased for resale | 58 | 34 | 24 | 52 | 66 | (14) |
| Other operations and maintenance | 104 | 102 | 2 | 102 | 101 | 1 |
| Depreciation and amortization | 47 | 41 | 6 | 58 | 52 | 6 |
| Taxes, other than income taxes | 71 | 59 | 12 | 87 | 79 | 8 |
| Gas operating income | $(12) | $(28) | $16 | $(24) | $(34) | $10 |
CECONY’s gas sales and deliveries, excluding off-system sales, for the three months ended September 30, 20172019 compared with the 20162018 period were:
| | | Thousands of Dt Delivered | | Revenues in Millions (a) | Thousands of Dt Delivered | | Revenues in Millions (a) |
| For the Three Months Ended | | | For the Three Months Ended | | For the Three Months Ended | | | For the Three Months Ended | |
| Description | September 30, 2017 |
| September 30, 2016 |
| Variation |
| Percent Variation |
| | September 30, 2017 | September 30, 2016 | Variation |
| Percent Variation |
| September 30, 2019 |
| September 30, 2018 |
| Variation |
| Percent Variation |
| | September 30, 2019 | September 30, 2018 | Variation |
| Percent Variation |
|
| Residential | 4,731 |
| 4,335 |
| 396 |
| 9.1 | % | | $104 | $88 | $16 | 18.2 | % | 4,032 |
| 4,469 |
| (437 | ) | (9.8 | )% | | $103 | $118 | $(15) | (12.7 | )% |
| General | 4,292 |
| 3,963 |
| 329 |
| 8.3 |
| | 49 | 41 | 8 | 19.5 |
| 4,097 |
| 4,191 |
| (94 | ) | (2.2 | ) | | 45 | 54 | (9) | (16.7 | ) |
| Firm transportation | 8,766 |
| 8,305 |
| 461 |
| 5.6 |
| | 67 | 53 | 14 | 26.4 |
| 9,071 |
| 9,211 |
| (140 | ) | (1.5 | ) | | 71 | — |
| — |
|
| Total firm sales and transportation | 17,789 |
| 16,603 |
| 1,186 |
| 7.1 |
| (b) | 220 | 182 | 38 | 20.9 |
| 17,200 |
| 17,871 |
| (671 | ) | (3.8 | ) | (b) | 219 | 243 | (24) | (9.9 | ) |
| Interruptible sales (c) | 2,108 |
| 1,664 |
| 444 |
| 26.7 |
| | 8 | 4 | 4 | Large |
| 1,974 |
| 1,481 |
| 493 |
| 33.3 |
| | 6 | — |
| — |
|
| NYPA | 10,148 |
| 12,800 |
| (2,652 | ) | (20.7 | ) | | 1 | — |
| — |
| 12,329 |
| 12,815 |
| (486 | ) | (3.8 | ) | | 1 | — |
| — |
|
| Generation plants | 24,068 |
| 35,745 |
| (11,677 | ) | (32.7 | ) | | 7 | — |
| — |
| 19,558 |
| 29,128 |
| (9,570 | ) | (32.9 | ) | | 7 | 9 | (2) | (22.2 | ) |
| Other | 4,487 |
| 4,975 |
| (488 | ) | (9.8 | ) | | 6 | — |
| — |
| 4,604 |
| 3,953 |
| 651 |
| 16.5 |
| | 6 | — |
| — |
|
| Other operating revenues (d) | — |
| — |
| — |
| — |
| | 26 | 8 | 18 | Large |
| — |
| — |
| — |
| — |
| | 36 | (1) | 37 | Large |
|
| Total | 58,600 |
| 71,787 |
| (13,187 | ) | (18.4 | )% | | $268 | $208 | $60 | 28.8 | % | 55,665 |
| 65,248 |
| (9,583 | ) | (14.7 | )% | | $275 | $264 | $11 | 4.2 | % |
| |
| (a) | Revenues from gas sales are subject to a weather normalization clause and a revenue decoupling mechanism, as a result of which delivery revenues are generally not affected by changes in delivery volumes from levels assumed when rates were approved. |
| |
| (b) | After adjusting for variations, primarily billing days, firm gas sales and transportation volumes in the company’s service area increased 6.012.1 percent in the three months ended September 30, 20172019 compared with the 20162018 period, reflecting primarily increased volumes attributable to the growth in the number of gas customers. |
| |
| (c) | Includes 1,5351,064 thousands and 915681 thousands of Dt for the 20172019 and 20162018 periods, respectively, which are also reflected in firm transportation and other. |
| |
| (d) | Other gas operating revenues generally reflect changes in the revenue decoupling mechanism and weather normalization clause current asset or regulatory liability and changes in regulatory assets and liabilities in accordance with other provisions of the company’s rate plans. |
Operating revenues increased $60$11 million in the three months ended September 30, 20172019 compared with the 20162018 period due primarily to higheran increase in revenues from the gas rate plan and growth($28 million), offset, in the number of customers ($29 million) and higherpart, by lower gas purchased for resale expense ($2414 million).
Gas purchased for resale increased $24 decreased $14 million in the three months ended September 30, 20172019 compared with the 20162018 period due to higherlower unit costs ($2011 million) and purchased volumes ($43 million).
Other operations and maintenance expenses increased $2$1 million in the three months ended September 30, 20172019 compared with the 20162018 period due primarily to higher stock-based compensation ($2 million) and municipal infrastructure support costs ($2 million), offset, in part, by surcharges for assessments and fees that wereare collected in revenues from customers.customers ($3 million).
Depreciation and amortization increased $6 million in the three months ended September 30, 20172019 compared with the 20162018 period due primarily to higher gas utility plant balances.
Taxes, other than income taxes increased $12$8 million in the three months ended September 30, 20172019 compared with the 20162018 period due primarily to higher property taxes ($67 million) and lower deferral of under-collected property taxes ($2 million), stateoffset, in part, by the reduction in the sales and local taxes ($4 million) and payroll taxesuse tax reserve upon conclusion of the audit assessment ($1 million).
Steam
CECONY’s results of steam operations for the three months ended September 30, 20172019 compared with the 20162018 period iswere as follows:
| | | For the Three Months Ended | | For the Three Months Ended | |
| (Millions of Dollars) | September 30, 2017 | September 30, 2016 | Variation | September 30, 2019 | September 30, 2018 | Variation |
|
| Operating revenues | $62 | $63 | $(1) | $58 | $64 | $(6) |
| Purchased power | 7 | 9 | (2) | 5 | 7 | (2) |
| Fuel | 6 | 8 | (2) | 4 | 5 | (1) |
| Other operations and maintenance | 40 | 44 | (4) | 45 | 47 | (2) |
| Depreciation and amortization | 21 | 20 | 1 | 22 | — |
|
| Taxes, other than income taxes | 31 | 29 | 2 | 38 | 35 | 3 |
| Steam operating income | $(43) | $(47) | $4 | $(56) | $(52) | $(4) |
CECONY’s steam sales and deliveries for the three months ended September 30, 20172019 compared with the 20162018 period were:
| | | Millions of Pounds Delivered | | Revenues in Millions | Millions of Pounds Delivered | | Revenues in Millions |
| For the Three Months Ended | | | For the Three Months Ended | | For the Three Months Ended | | | For the Three Months Ended | |
| Description | September 30, 2017 |
| September 30, 2016 |
| Variation |
| Percent Variation |
| | September 30, 2017 | September 30, 2016 | Variation |
| Percent Variation |
| September 30, 2019 |
| September 30, 2018 |
| Variation |
| Percent Variation |
| | September 30, 2019 | September 30, 2018 | Variation |
| Percent Variation |
|
| General | 13 |
| 10 |
| 3 |
| 30.0 | % | | $2 |
| $— |
| — | % | 6 |
| 12 |
| (6 | ) | (50.0 | )% | | $2 |
| $— |
| — | % |
| Apartment house | 748 |
| 776 |
| (28 | ) | (3.6 | ) | | 15 | — |
| — |
| 722 |
| 781 |
| (59 | ) | (7.6 | ) | | 13 | 16 | (3) | (18.8 | ) |
| Annual power | 2,439 |
| 2,950 |
| (511 | ) | (17.3 | ) | | 42 | 49 | (7) | (14.3 | ) | 2,443 |
| 2,711 |
| (268 | ) | (9.9 | ) | | 36 | 45 | (9) | (20.0 | ) |
| Other operating revenues (a) | — |
| — |
| — |
| — |
| | 3 | (3) | 6 | Large |
| — |
| — |
| — |
| — |
| | 7 | 1 | 6 | Large |
|
| Total | 3,200 |
| 3,736 |
| (536 | ) | (14.3 | )% | (b) | $62 | $63 | $(1) | (1.6 | )% | 3,171 |
| 3,504 |
| (333 | ) | (9.5 | )% | (b) | $58 | $64 | $(6) | (9.4 | )% |
| |
| (a) | Other steam operating revenues generally reflect changes in regulatory assets and liabilities in accordance with the company’s rate plan. |
| |
| (b) | After adjusting for variations, primarily weather and billing days, steam sales and deliveries decreased 8.67.0 percent in the three months ended September 30, 20172019 compared with the 20162018 period. |
Operating revenues decreased $1$6 million in the three months ended September 30, 20172019 compared with the 20162018 period due primarily to a higher reserve related to steam earnings sharing ($4 million), lower purchased power expenses ($2 million) and lower fuel expenses ($21 million), offset in part by a property tax refund incentive ($3 million).
Purchased power expenses decreased $2 million in the three months ended September 30, 20172019 compared with the 20162018 period due to lower unit costs ($1 million) and purchased volumes ($1 million).
Fuelexpensesdecreased $1 million in the three months ended September 30, 2019 compared with the 2018 period due to lower unit costs.
Other operations and maintenance expenses decreased $2 million in the three months ended September 30, 20172019 compared with the 2016 period due to lower unit costs ($1 million) and purchased volumes from the company's steam generating facilities ($1 million).
Other operations and maintenance expenses decreased $4 million in the three months ended September 30, 2017 compared with the 20162018 period due primarily to lowerthe absence of property damage, clean-up and other response costs related to a steam main rupture in 2018 ($9 million), offset, in part, by higher municipal infrastructure support costs.costs ($3 million), costs for pension and other postretirement benefits ($2 million) and stock-based compensation ($1 million).
Depreciation and amortization increased $1 million in the three months ended September 30, 2017 compared with the 2016 period due primarily to higher steam utility plant balances.
Taxes, other than income taxes increased $2 million in the three months ended September 30, 2017 compared with the 2016 period due primarily to higher property taxes.
Other Income (Deductions)
Other income (deductions) decreased $2 million in the three months ended September 30, 2017 compared with the 2016 period due primarily to a decrease in investment and other income.
Net Interest Expense
Net interest expense increased $3 million in the three months ended September 30, 20172019 compared with the 20162018 period due primarily to higher long-term debt balances in the 2017 period.property taxes.
Other Income Tax Expense(Deductions)
Income taxesOther income (deductions) increased $16$24 million in the three months ended September 30, 20172019 compared with the 20162018 period due primarily to higherlower costs associated with components of pension and other postretirement benefits other than service cost.
Net Interest Expense
Net interest expense increased $6 million in the three months ended September 30, 2019 compared with the 2018 period due primarily to an increase in interest accrued on the TCJA related regulatory liability.
Income Tax Expense
Income taxes decreased $6 million in the three months ended September 30, 2019 compared with the 2018 period due primarily to lower income before income tax expense ($115 million), a decreaselower state income taxes ($1 million) and an increase in the amortization of excess deferred federal income taxes due to the TCJA ($4 million), offset, in part, by lower tax benefits in 2019 for plant-related flow through items ($7 million), offset in part by higher research and development tax credits ($2 million) and higher non-deductible business expenses in the 2018 federal tax return due to the TCJA ($3 million). CECONY deferred as a regulatory liability its estimated net benefits for the 2018 period under the TCJA and continued to defer its estimated net benefits in 2019 for only its electric service. See “Other Regulatory Matters” in Note B to the Third Quarter Financial Statements.
O&R
| | | For the Three Months Ended
September 30, 2017 | | For the Three Months Ended
September 30, 2016 | | | For the Three Months Ended
September 30, 2019 | | For the Three Months Ended
September 30, 2018 | | |
| (Millions of Dollars) | Electric |
| Gas |
| 2017 Total | Electric |
| Gas |
| 2016 Total | 2017-2016
Variation |
| Electric |
| Gas |
| 2019 Total | Electric |
| Gas |
| 2018 Total | 2019-2018
Variation |
| Operating revenues | $206 | $28 | $234 | $213 | $27 | $240 | $(6) | $210 | $31 | $241 | $212 | $34 | $246 | $(5) |
| Purchased power | 60 | — |
| 60 | 69 | — |
| 69 | (9) | 61 | — |
| 61 | 73 | — |
| 73 | (12) |
| Gas purchased for resale | — |
| 10 | 10 | — |
| 8 | 8 | 2 | — |
| 10 | 10 | — |
| 12 | 12 | (2) |
| Other operations and maintenance | 63 | 17 | 80 | 63 | 14 | 77 | 3 | 63 | 18 | 81 | 60 | 20 | 80 | 1 |
| Depreciation and amortization | 13 | 5 | 18 | 12 | 5 | 17 | 1 | 16 | 6 | 22 | 14 | 5 | 19 | 3 |
| Taxes, other than income taxes | 14 | 7 | 21 | 14 | 7 | 21 | — |
| 14 | 7 | 21 | 13 | 7 | 20 | 1 |
| Operating income | $56 | $(11) | $45 | $55 | $(7) | $48 | $(3) | $56 | $(10) | $46 | $52 | $(10) | $42 | $4 |
Electric
O&R’s results of electric operations for the three months ended September 30, 20172019 compared with the 20162018 period iswere as follows:
48 |
| | | |
| For the Three Months Ended | |
| (Millions of Dollars) | September 30, 2019 | September 30, 2018 | Variation |
| Operating revenues | $210 | $212 | $(2) |
| Purchased power | 61 | 73 | (12) |
| Other operations and maintenance | 63 | 60 | 3 |
| Depreciation and amortization | 16 | 14 | 2 |
| Taxes, other than income taxes | 14 | 13 | 1 |
| Electric operating income | $56 | $52 | $4 |
48
|
| | | | | |
| For the Three Months Ended | |
| (Millions of Dollars) | September 30, 2017 | September 30, 2016 | Variation |
|
| Operating revenues | $206 | $213 | $(7) |
| Purchased power | 60 | 69 | (9) |
| Other operations and maintenance | 63 | 63 | — |
|
| Depreciation and amortization | 13 | 12 | 1 |
| Taxes, other than income taxes | 14 | 14 | — |
|
| Electric operating income | $56 | $55 |
| $1 |
|
O&R’s electric sales and deliveries for the three months ended September 30, 20172019 compared with the 20162018 period were:
| | | Millions of kWh Delivered | | Revenues in Millions (a) | Millions of kWh Delivered | | Revenues in Millions (a) |
| For the Three Months Ended | | | For the Three Months Ended | | For the Three Months Ended | | | For the Three Months Ended | |
| Description | September 30, 2017 |
| September 30, 2016 |
| Variation |
| Percent Variation |
| | September 30, 2017 |
| September 30, 2016 | Variation | Percent Variation |
| September 30, 2019 |
| September 30, 2018 |
| Variation |
| Percent Variation |
| | September 30, 2019 | September 30, 2018 | Variation | Percent Variation |
|
| Residential/Religious (b) | 500 |
| 585 |
| (85 | ) | (14.5 | )% | | $105 | $109 | $(4) | (3.7 | )% | 586 |
| 595 |
| (9 | ) | (1.5 | )% | | $106 | $115 | $(9) | (7.8 | )% |
| Commercial/Industrial | 206 |
| 216 |
| (10 | ) | (4.6 | ) | | 34 | 35 | (1) | (2.9 | ) | 235 |
| 219 |
| 16 |
| 7.3 |
| | 36 | 34 | 2 | 5.9 |
|
| Retail choice customers | 818 |
| 925 |
| (107 | ) | (11.6 | ) | | 64 | 70 | (6) | (8.6 | ) | 796 |
| 864 |
| (68 | ) | (7.9 | ) | | 62 | 67 | (5) | (7.5 | ) |
| Public authorities | 31 |
| 31 |
| — |
| — |
| | 3 | 2 | 1 | 50.0 |
| 30 |
| 32 |
| (2 | ) | (6.3 | ) | | 2 | 4 | (2) | (50.0 | ) |
| Other operating revenues (c) | — |
| — |
| — |
| — |
| | — |
| (3) | 3 | Large |
| — |
| — |
| — |
| — |
| | 4 | (8) | 12 | Large |
|
| Total | 1,555 |
| 1,757 |
| (202 | ) | (11.5 | )% | (d) | $206 | $213 | $(7) | (3.3 | )% | 1,647 |
| 1,710 |
| (63 | ) | (3.7 | )% | (d) | $210 | $212 | $(2) | (0.9 | )% |
| |
| (a) | O&R’s New York electric delivery revenues are subject to a revenue decoupling mechanism, as a result of which delivery revenues are generally not affected by changes in delivery volumes from levels assumed when rates were approved. O&R’s electric sales in New Jersey are not subject to a decoupling mechanism, and as a result, changes in such volumes do impact revenues. |
| |
| (b) | “Residential/Religious” generally includes single-family dwellings, individual apartments in multi-family dwellings, religious organizations and certain other not-for-profit organizations. |
| |
| (c) | Other electric operating revenues generally reflect changes in regulatory assets and liabilities in accordance with the company’s electric rate plan. |
| |
| (d) | After adjusting for weather and other variations, electric delivery volumes in O&R’s service area decreased 3.40.8 percent in the three months ended September 30, 20172019 compared with the 20162018 period. |
Operating revenues decreased $7$2 million in the three months ended September 30, 20172019 compared with the 20162018 period due primarily to lower purchased power expenses ($912 million), offset, in part, by higher revenues from the New York electric rate plan ($316 million).
Purchased power expenses decreased $9$12 million in the three months ended September 30, 20172019 compared with the 20162018 period due to lower unit costs ($11 million) and purchased volumes ($101 million).
Other operations and maintenance expenses increased $3 million in the three months ended September 30, 2019 compared with the 2018 period due primarily to the deferral as a regulatory asset of costs for storm preparation in 2018 ($5 million), offset by higher unitstorm-related costs ($1 million), higher uncollectible accounts ($1 million), and higher stock-based compensation ($1 million), offset, in part, by the reduction of a regulatory asset associated with certain site investigation and remediation costs in 2018 ($6 million).
Depreciation and amortization expenses increased $2 million in the three months ended September 30, 2019 compared with the 2018 period due primarily to higher electric utility plant balances.
Taxes, other than income taxes increased $1 million in the three months ended September 30, 20172019 compared with the 20162018 period due primarily to higher electric utility plant balances.property taxes.
Gas
O&R’s results of gas operations for the three months ended September 30, 20172019 compared with the 20162018 period iswere as follows:
| | | For the Three Months Ended | | For the Three Months Ended | |
| (Millions of Dollars) | September 30, 2017 | September 30, 2016 | Variation |
| September 30, 2019 | September 30, 2018 | Variation |
|
| Operating revenues | $28 | $27 | $1 | $31 | $34 | $(3) |
| Gas purchased for resale | 10 | 8 | 2 | 10 | 12 | (2) |
| Other operations and maintenance | 17 | 14 | 3 | 18 | 20 | (2) |
| Depreciation and amortization | 5 | — |
| 6 | 5 | 1 |
| Taxes, other than income taxes | 7 | — |
| 7 | — |
|
| Gas operating income | $(11) | $(7) | $(4) | $(10) |
| $— |
|
O&R’s gas sales and deliveries, excluding off-system sales, for the three months ended September 30, 20172019 compared with the 20162018 period were:
| | | Thousands of Dt Delivered | | Revenues in Millions (a) | Thousands of Dt Delivered | | Revenues in Millions (a) |
| For the Three Months Ended | | | For the Three Months Ended | | For the Three Months Ended | | | For the Three Months Ended | |
| Description | September 30, 2017 |
| September 30, 2016 |
| Variation |
| Percent Variation |
| | September 30, 2017 |
| September 30, 2016 |
| Variation |
| Percent Variation |
| September 30, 2019 |
| September 30, 2018 |
| Variation |
| Percent Variation |
| | September 30, 2019 |
| September 30, 2018 |
| Variation |
| Percent Variation |
|
| Residential | 579 |
| 550 |
| 29 |
| 5.3 | % | | $11 | $9 | $2 | 22.2 | % | 621 |
| 605 |
| 16 |
| 2.6 | % | | $11 | $13 | $(2) | (15.4 | )% |
| General | 198 |
| 177 |
| 21 |
| 11.9 |
| | 2 | — |
| — |
| 161 |
| 202 |
| (41 | ) | (20.3 | ) | | 1 | 3 | (2) | (66.7 | ) |
| Firm transportation | 898 |
| 884 |
| 14 |
| 1.6 |
| | 8 | — |
| — |
| 851 |
| 795 |
| 56 |
| 7.0 |
| | 6 | 8 | (2) | (25.0 | ) |
| Total firm sales and transportation | 1,675 |
| 1,611 |
| 64 |
| 4.0 |
| (b) | 21 | 19 | 2 | 10.5 |
| 1,633 |
| 1,602 |
| 31 |
| 1.9 |
| (b) | 18 | 24 | (6) | (25.0 | ) |
| Interruptible sales | 819 |
| 893 |
| (74 | ) | (8.3 | ) | | 1 | — |
| 1 | — |
| 798 |
| 772 |
| 26 |
| 3.4 |
| | 1 | — |
| — |
|
| Generation plants | 5 |
| 3 |
| 2 |
| 66.7 |
| | — |
| — |
| — |
| — |
| 6 |
| 1 |
| 5 |
| Large |
| | — |
| — |
| — |
| — |
|
| Other | 74 |
| 70 |
| 4 |
| 5.7 |
| | — |
| — |
| — |
| — |
| 74 |
| 62 |
| 12 |
| 19.4 |
| | 1 | — |
| 1 | — |
|
| Other gas revenues | — |
| — |
| — |
| — |
| | 6 | 8 | (2) | (25.0 | ) | — |
| — |
| — |
| — |
| | 11 | 9 | 2 | 22.2 |
|
| Total | 2,573 |
| 2,577 |
| (4 | ) | (0.2 | )% | | $28 | $27 | $1 | 3.7 | % | 2,511 |
| 2,437 |
| 74 |
| 3.0 | % | | $31 | $34 | $(3) | (8.8 | )% |
| |
| (a) | Revenues from New York gas sales are subject to a weather normalization clause and a revenue decoupling mechanism as a result of which delivery revenues are generally not affected by changes in delivery volumes from levels assumed when rates were approved. |
| |
| (b) | After adjusting for weather and other variations, total firm sales and transportation volumes increased 3.15.2 percent in the three months ended September 30, 20172019 compared with the 20162018 period. |
Operating revenues increased $1 decreased $3 million in the three months ended September 30, 20172019 compared with the 20162018 period due primarily to higherlower gas purchased for resale ($2 million), offset by and lower revenues from the New York gas rate plan ($1 million).
Gas purchased for resale decreased $2 million in the three months ended September 30, 2019 compared with the 2018 period due to lower purchased volumes ($1 million) and unit costs ($1 million).
Other operations and maintenance expenses decreased $2 million in the three months ended September 30, 2019 compared with the 2018 period due primarily to the reduction of a regulatory asset associated with certain site investigation and remediation costs in 2018.
Depreciation and amortization increased $1 million in the three months ended September 30, 2019 compared with the 2018 period due primarily to higher gas utility plant balances.
Income Tax Expense
Income taxes increased $2 million in the three months ended September 30, 20172019 compared with the 2016 period due to higher purchased volumes ($3 million), offset by lower unit costs ($1 million).
Other operations and maintenance expenses increased $3 million in the three months ended September 30, 2017 compared with the 20162018 period due primarily to higher pension costs.
Income Tax Expense
Income taxes increased $1 million in the three months ended September 30, 2017 compared with the 2016 period due primarily to the absence in 2017 of a tax benefit from a corporate-owned life insurance policy in 2016 ($2 million), offset in part by lower income before income tax expense ($12 million). O&R deferred as a regulatory liability its estimated net benefits for the 2018 period under the TCJA. See “Other Regulatory Matters” in Note B to the Third Quarter Financial Statements.
Clean Energy Businesses
The Clean Energy Businesses’ results of operations for the three months ended September 30, 20172019 compared with the 20162018 period iswere as follows:
| | | For the Three Months Ended | | For the Three Months Ended | |
| (Millions of Dollars) | September 30, 2017 |
| September 30, 2016 | Variation | September 30, 2019 | September 30, 2018 | Variation |
| Operating revenues | $177 | $350 | $(173) | $247 | $181 | $66 |
| Purchased power | — |
| 234 | (234) | |
| Gas purchased for resale | 47 | 39 | 8 | 36 | 85 | (49) |
| Other operations and maintenance | 79 | 40 | 39 | 53 | 50 | 3 |
| Depreciation and amortization | 19 | 11 | 8 | 53 | 18 | 35 |
| Taxes, other than income taxes | 3 | 5 | (2) | 5 | 3 | 2 |
| Gain on sale of retail electric supply business (2016) | — |
| (104) | 104 | |
| Operating income | $29 | $125 | $(96) | $100 | $25 | $75 |
Operating revenues decreased $173 increased $66 million in the three months ended September 30, 20172019 compared with the 20162018 period due primarily to lowerhigher renewable electric retailproduction project revenues of $256 millionresulting from the saleDecember 2018 acquisition of Sempra Solar Holdings, LLC, including the retailconsolidation of certain jointly-owned projects that were
previously accounted for as equity method investments ($126 million). Wholesale revenues decreased ($55 million) due to lower sales volumes, energy services revenues decreased ($12 million) and net mark-to-market values increased ($7 million).
Gas purchased for resale decreased $49 million in the three months ended September 30, 2019 compared with the 2018 period due to lower purchased volumes.
Other operations and maintenance expenses increased $3 million in the three months ended September 30, 2019 compared with the 2018 period due primarily to higher costs associated with additional renewable electric supply businessproduction projects in operation resulting from the December 2018 acquisition of Sempra Solar Holdings, LLC ($12 million), offset, in part, by lower energy services costs ($9 million).
Depreciation and amortization increased $35 million in the three months ended September 2016. Renewable revenues increased $56 million30, 2019 compared with the 2018 period due primarily to an increase in renewable electric production projects in operation and revenuesresulting from the engineering, procurement and constructionDecember 2018 acquisition of UptonSempra Solar Holdings, LLC (including the consolidation of certain jointly-owned projects that the Clean Energy Businesses previously accounted for as equity method investments).
2 (see Note O to the Third Quarter Financial Statements). Energy services revenues increased $9 million. Wholesale revenues increased $10 million due to higher sales volumes. Net mark-to-market values increased $32 million, due primarily to the sale of the retail electric supply business, of which $24 million in gains are reflected in purchased power costs and $8 million in gains are reflected in revenues.
Purchased power expenses decreased $234 million in the three months ended September 30, 2017 compared with the 2016 period due primarily to lower electric costs due to the sale of the retail electric supply business in September 2016 ($210 million) and changes in mark-to-market values ($24 million).
Gas purchased for resale increased $8 million in the three months ended September 30, 2017 compared with the 2016 period due to higher purchased volumes.
Other operations and maintenance expenses increased $39 million in the three months ended September 30, 2017 compared with the 2016 period due primarily to Upton 2 engineering, procurement and construction costs (see Note O to the Third Quarter Financial Statements) and an increase in energy services costs.
Depreciation and amortization increased $8 million in the three months ended September 30, 2017 compared with the 2016 period due to an increase in solar electric production projects in operation during 2017.
Taxes, other than income taxes decreased increased $2 million in the three months ended September 30, 20172019 compared with the 20162018 period due primarily due to lower gross receipts tax from the sale of the retail electric supply business.higher property taxes.
Other Income (Deductions)
Gain on sale of retail electric supply business was $104Other income (deductions) decreased $17 million in the three months ended September 30, 2016 reflecting2019 compared with the sale2018 period due primarily to the absence in 2019 of equity income from certain jointly-owned projects that were accounted for as equity investments in 2018 but consolidated after the Clean Energy Businesses' retail electric supply business.December 2018 acquisition of Sempra Solar Holdings, LLC.
Other Income (Deductions)Net Interest Expense
Other income (deductions) decreased $9Net interest expense increased $48 million in the three months ended September 30, 20172019 compared with the 20162018 period due primarily to an increase in debt resulting from the gain relatedDecember 2018 acquisition of Sempra Solar Holdings, LLC, including $825 million that was borrowed to fund a portion of the purchase price, $576 million of Sempra Solar Holdings, LLC subsidiaries' project debt that was outstanding at the time of the acquisition and the consolidation of a solar electric production investment in 2016.$506 million of project debt of certain jointly-owned projects that the Clean Energy Businesses previously accounted for as equity method investments.
Net InterestIncome Tax Expense
Net interest expense increased $5Income taxes decreased $15 million in the three months ended September 30, 20172019 compared with the 2016 period due primarily to increased debt on solar electric production projects.
Income Tax Expense
Income taxes decreased $58 million in the three months ended September 30, 2017 compared with the 20162018 period due primarily to lower income before income tax expense (excluding income attributable to non-controlling interest) ($444 million), higher renewable energy tax credits ($3 million), lower state income taxes ($1 million) and adjustments for prior period federal income tax returns primarily due to increased research and development credits ($14 million), offset, in part, by an increase in uncertain tax positions ($7 million).
Income Attributable to Non-Controlling Interest
Income attributable to non-controlling interest increased $30 million in the increasethree months ended September 30, 2019 compared with the 2018 period due primarily to the income attributable in the 2019 period to a tax equity investor in renewable electric production projects accounted for under the HLBV method of accounting. See Note N to the Third Quarter Financial Statements.
Con Edison Transmission
Income Tax Expense
Income taxes increased $1 million in the three months ended September 30, 2019 compared with the 2018 period due primarily to higher income before income tax expense.
Other
Income Tax Expense
Income taxes decreased $41 million in the three months ended September 30, 2019 compared with the 2018 period due primarily to the absence of the TCJA re-measurement of deferred tax assets with Con Edison’s 2017 federal net operating loss carryforward into 2018 ($42 million), offset, in part, by higher state income taxes in 2016 as a result of the sale of the retail electric supply business that increased the Clean Energy Businesses’ state apportionment factor on its cumulative temporary differences ($131 million).
Other
For Con Edison, “Other” includes parent company and consolidation adjustments.
Nine Months Ended September 30, 2017 Compared with Nine Months Ended September 30, 2016
The Companies’ results of operations in 2017 compared with 2016 were:for the nine months ended September 30, 2019 and 2018 were as follows:
| | | | CECONY | O&R | Clean Energy Businesses
| Con Edison
Transmission | Other (a) | Con Edison (b) | CECONY | O&R | Clean Energy Businesses | Con Edison
Transmission | Other (a) | Con Edison (b) |
| (Millions of Dollars) | Increases (Decreases) Amount | Increases (Decreases) Percent | Increases (Decreases) Amount | Increases (Decreases) Percent | Increases (Decreases) Amount | Increases (Decreases) Percent | Increases
(Decreases)
Amount | Increases
(Decreases)
Percent | Increases (Decreases) Amount | Increases (Decreases) Percent | Increases (Decreases) Amount | Increases (Decreases) Percent | 2019 |
| 2018 |
| 2019 |
| 2018 |
| 2019 |
| 2018 |
| 2019 |
| 2018 |
| 2019 |
| 2018 |
| 2019 | 2018 |
|
| Operating revenues | $207 | 2.7 | % | $37 | 5.9 | % | $(538) | (53.9 | )% | $1 | — | % | $(3) | Large |
| $(296) | (3.2 | )% | $8,248 | $8,121 | $678 | $691 | $696 | $573 | $3 | $3 | $(2) |
| $— |
| $9,623 | $9,388 |
| Purchased power | (106) | (8.7 | ) | (6) | (3.9 | ) | (679) | Large |
| — |
| — |
| (3) | Large |
| (794) | (38.8 | ) | 1,058 | 1,117 | 146 | 167 | — |
| 2 | — |
| — |
| (1) | 1 | 1,203 | 1,287 |
| Fuel | 36 | 27.1 |
| — |
| — |
| — |
| — |
| — |
| — |
| — |
| — |
| 36 | 27.1 |
| 163 | 201 | — |
| — |
| — |
| — |
| — |
| — |
| — |
| — |
| 163 | 201 |
| Gas purchased for resale | 155 | 71.4 |
| 20 | 62.5 |
| 89 | Large |
| — |
| — |
| — |
| — |
| 264 | 82.5 |
| 445 | 457 | 68 | 60 | 159 | 219 | — |
| — |
| (1) | — |
| 671 | 736 |
| Other operations and maintenance | (113) | (5.4 | ) | 16 | 7.3 |
| 50 | 40.3 |
| 6 | Large |
| — |
| — |
| (41) | (1.7 | ) | 2,022 | 1,926 | 225 | 234 | 168 | 226 | 7 | 7 | — |
| (4) | 2,422 | 2,389 |
| Depreciation and amortization | 66 | 8.0 |
| 3 | 6.0 |
| 24 | 80.0 |
| — |
| — |
| — |
| — |
| 93 | 10.3 |
| 1,020 | 949 | 63 | 57 | 169 | 55 | 1 | 1 | — |
| (1) | 1,253 | 1,061 |
| Taxes, other than income taxes | 77 | 5.3 |
| 2 | 3.3 |
| (4) | (25.0 | ) | — |
| — |
| (1) | Large |
| 74 | 4.9 |
| 1,715 | 1,621 | 63 | 63 | 17 | 12 | — |
| — |
| 5 | 11 | 1,800 | 1,707 |
Gain on sale of retail electric supply business (2016) and solar electric production project (2017)
| — |
| — |
| — |
| — |
| (103) | Large |
| — |
| — |
| — |
| — |
| (103) | Large |
| |
| Operating income | 92 | 5.1 |
| 2 | 1.8 |
| (121) | (65.8 | ) | (5) | Large |
| 1 | Large |
| (31) | (1.5 | ) | 1,825 | 1,850 | 113 | 110 | 183 | 59 | (5) | (5) | (5) | (7) | 2,111 | 2,007 |
| Other income less deductions | 4 | Large |
| (1) | Large |
| (2) | (5.7 | ) | 37 | Large |
| (1) | — |
| 37 | 60.7 |
| (31) | (99) | (8) | (15) | 3 | 34 | 76 | 67 | (9) | (16) | 31 | (29) |
| Net interest expense | 12 | 2.7 |
| (1) | (3.6 | ) | 11 | 47.8 |
| 8 | Large |
| (2) | (18.2 | ) | 28 | 5.4 |
| 545 | 508 | 30 | 29 | 170 | 39 | 18 | 14 | 9 | 7 | 772 | 597 |
| Income before income tax expense | 84 | 6.2 |
| 2 | 2.3 |
| (134) | (68.4 | ) | 24 | Large |
| 2 | (20.0 | ) | (22) | (1.3 | ) | 1,249 | 1,243 | 75 | 66 | 16 | 54 | 53 | 48 | (23) | (30) | 1,370 | 1,381 |
| Income tax expense | 60 | 12.2 |
| 4 | 12.5 |
| (68) | (89.5 | ) | 10 | Large |
| (9) | Large |
| (3) | (0.5 | ) | 271 | 274 | 15 | 14 | (44) | (4) | 15 | 13 | (14) | 33 | 243 | 330 |
| Net income | $24 | 2.8 | % | $(2) | (3.6 | )% | $(66) | (55.0 | )% | $14 | Large |
| $11 | Large |
| $(19) | (1.8 | )% | $978 | $969 | $60 | $52 | $60 | $58 | $38 | $35 | $(9) | $(63) | $1,127 | $1,051 |
Income attributable to non-controlling interest
| | — |
| — |
| — |
| — |
| 79 | — |
| — |
| — |
| — |
| — |
| 79 | — |
|
| Net income for common stock | | $978 | $969 | $60 | $52 | $(19) | $58 | $38 | $35 | $(9) | $(63) | $1,048 | $1,051 |
| |
| (a) | Includes parent company and consolidation adjustments. |
| |
| (b) | Represents the consolidated results of operations of Con Edison and its businesses. |
CECONY
| | | For the Nine Months Ended
September 30, 2017 | | For the Nine Months Ended
September 30, 2016 | | For the Nine Months Ended
September 30, 2019 | | For the Nine Months Ended
September 30, 2018 | |
| (Millions of Dollars) | Electric |
| Gas |
| Steam |
| 2017 Total | Electric |
| Gas |
| Steam |
| 2016 Total | 2017-2016
Variation | Electric |
| Gas |
| Steam |
| 2019 Total | Electric |
| Gas |
| Steam |
| 2018 Total | 2019-2018
Variation |
| Operating revenues | $6,079 | $1,421 | $448 | $7,948 | $6,222 | $1,113 | $406 | $7,741 | $207 | $6,174 | $1,605 | $469 | $8,248 | $6,107 | $1,540 | $474 | $8,121 | $127 |
| Purchased power | 1,084 | — |
| 26 | 1,110 | 1,191 | — |
| 25 | 1,216 | (106) | 1,033 | — |
| 25 | 1,058 | 1,091 | — |
| 26 | 1,117 | (59) |
| Fuel | 95 | — |
| 74 | 169 | 81 | — |
| 52 | 133 | 36 | 74 | — |
| 89 | 163 | 118 | — |
| 83 | 201 | (38) |
| Gas purchased for resale | — |
| 372 | — |
| 372 | — |
| 217 | — |
| 217 | 155 | — |
| 445 | — |
| 445 | — |
| 457 | — |
| 457 | (12) |
| Other operations and maintenance | 1,528 | 330 | 134 | 1,992 | 1,659 | 307 | 139 | 2,105 | (113) | 1,582 | 306 | 134 | 2,022 | 1,480 | 315 | 131 | 1,926 | 96 |
| Depreciation and amortization | 690 | 137 | 64 | 891 | 645 | 118 | 62 | 825 | 66 | 785 | 168 | 67 | 1,020 | 732 | 152 | 65 | 949 | 71 |
| Taxes, other than income taxes | 1,205 | 220 | 98 | 1,523 | 1,159 | 198 | 89 | 1,446 | 77 | 1,326 | 272 | 117 | 1,715 | 1,265 | 247 | 109 | 1,621 | 94 |
| Operating income | $1,477 | $362 | $52 | $1,891 | $1,487 | $273 | $39 | $1,799 | $92 | $1,374 | $414 | $37 | $1,825 | $1,421 | $369 | $60 | $1,850 | $(25) |
Electric
CECONY’s results of electric operations for the nine months ended September 30, 20172019 compared with the 20162018 period iswere as follows:
| | | For the Nine Months Ended | | For the Nine Months Ended | |
| (Millions of Dollars) | September 30, 2017 | September 30, 2016 | Variation | September 30, 2019 | September 30, 2018 | Variation |
| Operating revenues | $6,079 | $6,222 | $(143) | $6,174 | $6,107 | $67 |
| Purchased power | 1,084 | 1,191 | (107) | 1,033 | 1,091 | (58) |
| Fuel | 95 | 81 | 14 | 74 | 118 | (44) |
| Other operations and maintenance | 1,528 | 1,659 | (131) | 1,582 | 1,480 | 102 |
| Depreciation and amortization | 690 | 645 | 45 | 785 | 732 | 53 |
| Taxes, other than income taxes | 1,205 | 1,159 | 46 | 1,326 | 1,265 | 61 |
| Electric operating income | $1,477 | $1,487 | $(10) | $1,374 | $1,421 | $(47) |
CECONY’s electric sales and deliveries for the nine months ended September 30, 20172019 compared with the 20162018 period were:
| | | Millions of kWh Delivered | | Revenues in Millions (a) | Millions of kWh Delivered | | Revenues in Millions (a) |
| For the Nine Months Ended | | | For the Nine Months Ended | | For the Nine Months Ended | | | For the Nine Months Ended | |
| Description | September 30, 2017 |
| September 30, 2016 |
| Variation | Percent Variation | | September 30, 2017 | September 30, 2016 | Variation | Percent Variation | September 30, 2019 |
| September 30, 2018 |
| Variation | Percent Variation | | September 30, 2019 | September 30, 2018 | Variation | Percent Variation |
| Residential/Religious (b) | 7,576 |
| 8,130 |
| (554 | ) | (6.8 | )% | | $1,925 | $2,017 | $(92) | (4.6 | )% | 8,203 |
| 8,374 |
| (171 | ) | (2.0 | )% | | $2,060 | $2,211 | $(151) | (6.8 | )% |
| Commercial/Industrial | 6,965 |
| 7,220 |
| (255 | ) | (3.5 | ) | | 1,393 | 1,381 | 12 | 0.9 |
| 7,574 |
| 7,343 |
| 231 |
| 3.1 |
| | 1,405 | 1,433 | (28) | (2.0 | ) |
| Retail choice customers | 19,748 |
| 20,404 |
| (656 | ) | (3.2 | ) | | 2,092 | 2,114 | (22) | (1.0 | ) | 18,968 |
| 19,996 |
| (1,028 | ) | (5.1 | ) | | 1,879 | 2,030 | (151) | (7.4 | ) |
| NYPA, Municipal Agency and other sales | 7,548 |
| 7,641 |
| (93 | ) | (1.2 | ) | | 483 | 474 | 9 | 1.9 |
| 7,477 |
| 7,747 |
| (270 | ) | (3.5 | ) | | 511 | 509 | 2 | 0.4 |
|
| Other operating revenues (c) | — |
| — |
| — |
| — |
| | 186 | 236 | (50) | (21.2 | ) | — |
| — |
| — |
| — |
| | 319 | (76) | 395 | Large |
|
| Total | 41,837 |
| 43,395 |
| (1,558 | ) | (3.6 | )% | (d) | $6,079 | $6,222 | $(143) | (2.3 | )% | 42,222 |
| 43,460 |
| (1,238 | ) | (2.8 | )% | (d) | $6,174 | $6,107 | $67 | 1.1 | % |
| |
| (a) | Revenues from electric sales are subject to a revenue decoupling mechanism, as a result of which delivery revenues generally are not affected by changes in delivery volumes from levels assumed when rates were approved. |
| |
| (b) | “Residential/Religious” generally includes single-family dwellings, individual apartments in multi-family dwellings, religious organizations and certain other not-for-profit organizations. |
| |
| (c) | Other electric operating revenues generally reflect changes in the revenue decoupling mechanism current asset or regulatory liability and changes in regulatory assets and liabilities in accordance with the revenue decoupling mechanism and other provisions of the company’s rate plans. |
| |
| (d) | After adjusting for variations, primarily weather and billing days, electric delivery volumes in CECONY’s service area decreased 0.91.0 percent in the nine months ended September 30, 20172019 compared with the 20162018 period. |
Operating revenues decreased $143 increased $67 million in the nine months ended September 30, 20172019 compared with the 20162018 period due primarily to an increase in revenues from the rate plan ($161 million), offset, in part, by lower purchased power costsexpenses ($10758 million). The lower revenues reflected the decline in surcharges for assessments and fees that were collected in revenues from customersfuel expenses ($1344 million).
Purchased power expenses decreased $107$58 million in the nine months ended September 30, 20172019 compared with the 20162018 period due to lower unit costs ($152 million), offset, in part, by higher purchased volumes ($9594 million) and unit costs ($12 million).
Fuel expenses increased $14decreased $44 million in the nine months ended September 30, 20172019 compared with the 20162018 period due to higherlower unit costs ($1240 million) and purchased volumes from the company’s electric generating facilities ($24 million).
Other operations and maintenance expenses decreased $131increased $102 million in the nine months ended September 30, 20172019 compared with the 20162018 period due primarily to lowerhigher costs for pension and other postretirement benefits ($11449 million), surcharges for assessments and fees that are collected in revenues from customers ($13 million), environmental costs ($1736 million) and stock basedhigher stock-based compensation ($624 million), offset by higher costs for municipal infrastructure support ($20 million).
Depreciation and amortization increased $45$53 million in the nine months ended September 30, 20172019 compared with the 20162018 period due primarily to higher electric utility plant balances.
Taxes, other than income taxes increased $46$61 million in the nine months ended September 30, 20172019 compared with the 20162018 period due primarily to higher property taxes ($4353 million), the absence of a New York State sales and use tax refund received in 2018 ($14 million) and the absence in 2017lower deferral of a favorable state audit settlement in 2016under-collected property taxes ($5 million), offset, in part, by the reduction in the sales and use tax reserve upon conclusion of the audit assessment ($6 million) and lower state and local taxes ($45 million).
Gas
CECONY’s results of gas operations for the nine months ended September 30, 20172019 compared with the 20162018 period iswere as follows:
| | | For the Nine Months Ended | | For the Nine Months Ended | |
| (Millions of Dollars) | September 30, 2017 | September 30, 2016 | Variation | September 30, 2019 | September 30, 2018 | Variation |
| Operating revenues | $1,421 | $1,113 | $308 | $1,605 | $1,540 | $65 |
| Gas purchased for resale | 372 | 217 | 155 | 445 | 457 | (12) |
| Other operations and maintenance | 330 | 307 | 23 | 306 | 315 | (9) |
| Depreciation and amortization | 137 | 118 | 19 | 168 | 152 | 16 |
| Taxes, other than income taxes | 220 | 198 | 22 | 272 | 247 | 25 |
| Gas operating income | $362 | $273 | $89 | $414 | $369 | $45 |
CECONY’s gas sales and deliveries, excluding off-system sales, for the nine months ended September 30, 20172019 compared with the 20162018 period were:
| | | Thousands of Dt Delivered | | Revenues in Millions (a) | Thousands of Dt Delivered | | Revenues in Millions (a) |
| For the Nine Months Ended | | | For the Nine Months Ended | | For the Nine Months Ended | | | For the Nine Months Ended | |
| Description | September 30, 2017 |
| September 30, 2016 |
| Variation | Percent Variation | | September 30, 2017 | September 30, 2016 |
| Variation | Percent Variation | September 30, 2019 |
| September 30, 2018 |
| Variation | Percent Variation | | September 30, 2019 | September 30, 2018 | Variation | Percent Variation |
| Residential | 39,814 |
| 35,565 |
| 4,249 |
| 11.9 | % | | $613 | $506 | $107 | 21.1 | % | 41,035 |
| 43,731 |
| (2,696 | ) | (6.2 | )% | | $724 | $728 | $(4) | (0.5 | )% |
| General | 23,427 |
| 20,962 |
| 2,465 |
| 11.8 |
| | 255 | 200 | 55 | 27.5 |
| 25,018 |
| 25,894 |
| (876 | ) | (3.4 | ) | | 299 | 298 | 1 | 0.3 |
|
| Firm transportation | 53,952 |
| 51,333 |
| 2,619 |
| 5.1 |
| | 390 | 332 | 58 | 17.5 |
| 60,590 |
| 61,628 |
| (1,038 | ) | (1.7 | ) | | 444 | 448 | (4) | (0.9 | ) |
| Total firm sales and transportation | 117,193 |
| 107,860 |
| 9,333 |
| 8.7 |
| (b) | 1,258 | 1,038 | 220 | 21.2 |
| 126,643 |
| 131,253 |
| (4,610 | ) | (3.5 | ) | (b) | 1,467 | 1,474 | (7) | (0.5 | ) |
| Interruptible sales (c) | 6,526 |
| 7,587 |
| (1,061 | ) | (14.0 | ) | | 30 | 29 | 1 | 3.4 |
| 7,375 |
| 4,956 |
| 2,419 |
| 48.8 |
| | 34 | 31 | 3 | 9.7 |
|
| NYPA | 30,233 |
| 31,970 |
| (1,737 | ) | (5.4 | ) | | 2 | 2 | — |
| — |
| 30,296 |
| 27,528 |
| 2,768 |
| 10.1 |
| | 2 | 2 | — |
| — |
|
| Generation plants | 48,989 |
| 70,895 |
| (21,906 | ) | (30.9 | ) | | 19 | 19 | — |
| — |
| 41,545 |
| 55,949 |
| (14,404 | ) | (25.7 | ) | | 18 | 20 | (2) | (10.0 | ) |
| Other | 16,756 |
| 16,442 |
| 314 |
| 1.9 |
| | 24 | 25 | (1) | (4.0 | ) | 16,058 |
| 15,399 |
| 659 |
| 4.3 |
| | 24 | 24 | — |
| — |
|
| Other operating revenues (d) | — |
| — |
| — |
| — |
| | 88 | — |
| 88 | — |
| — |
| — |
| — |
| — |
| | 60 | (11) | 71 | Large |
|
| Total | 219,697 |
| 234,754 |
| (15,057 | ) | (6.4 | )% | | $1,421 | $1,113 | $308 | 27.7 | % | 221,917 |
| 235,085 |
| (13,168 | ) | (5.6 | )% | | $1,605 | $1,540 | $65 | 4.2 | % |
| |
| (a) | Revenues from gas sales are subject to a weather normalization clause and a revenue decoupling mechanism as a result of which delivery revenues are generally not affected by changes in delivery volumes from levels assumed when rates were approved. |
| |
| (b) | After adjusting for variations, primarily billing days, firm gas sales and transportation volumes in the company’s service area increased 6.41.9 percent in the nine months ended September 30, 20172019 compared with the 20162018 period, reflecting primarily increased volumes attributable to the growth in the number of gas customers. |
| |
| (c) | Includes 3,5633,797 thousands and 3,9401,798 thousands of Dt for the 20172019 and 20162018 periods, respectively, which are also reflected in firm transportation and other. |
| |
| (d) | Other gas operating revenues generally reflect changes in the revenue decoupling mechanism and weather normalization clause current asset or regulatory liability and changes in regulatory assets and liabilities in accordance with other provisions of the company’s rate plans. |
Operating revenues increased $308$65 million in the nine months ended September 30, 20172019 compared with the 20162018 period due primarily to higheran increase in revenues from the gas rate plan and growth($83 million), offset, in the number of customers ($133 million) and increasedpart, by lower gas purchased for resale expense ($15512 million).
Gas purchased for resale increased $155 decreased $12 million in the nine months ended September 30, 20172019 compared with the 20162018 period due to higherlower unit costs ($15113 million) and, offset, in part, by higher purchased volumes ($41 million).
Other operations and maintenance expenses increased $23decreased $9 million in the nine months ended September 30, 20172019 compared with the 20162018 period due primarily to higher pension and other postretirement benefits costs ($7 million), health and life expenses ($5 million),lower surcharges for assessments and fees that are collected in revenues from customers ($312 million) and costs forequipment maintenance of gas mainsexpenses ($24 million), offset, in part, by higher stock-based compensation ($5 million).
Depreciation and amortization increased $19$16 million in the nine months ended September 30, 20172019 compared with the 20162018 period due primarily to higher gas utility plant balances.
Taxes, other than income taxes increased $22$25 million in the nine months ended September 30, 20172019 compared with the 20162018 period due primarily to higher property taxes ($1227 million), the absence of a New York State sales and use tax refund received in 2018 ($3 million) and higher state and local taxes ($61 million), offset, in part, by higher deferral of under-collected property taxes ($4 million) and payroll taxesthe reduction in the sales and use tax reserve upon conclusion of the audit assessment ($31 million).
Steam
CECONY’s results of steam operations for the nine months ended September 30, 20172019 compared with the 20162018 period iswere as follows:
| | | For the Nine Months Ended | | For the Nine Months Ended | |
| (Millions of Dollars) | September 30, 2017 | September 30, 2016 | Variation | September 30, 2019 | September 30, 2018 | Variation |
| Operating revenues | $448 | $406 | $42 | $469 | $474 | $(5) |
| Purchased power | 26 | 25 | 1 | 25 | 26 | (1) |
| Fuel | 74 | 52 | 22 | 89 | 83 | 6 |
| Other operations and maintenance | 134 | 139 | (5) | 134 | 131 | 3 |
| Depreciation and amortization | 64 | 62 | 2 | 67 | 65 | 2 |
| Taxes, other than income taxes | 98 | 89 | 9 | 117 | 109 | 8 |
| Steam operating income | $52 | $39 | $13 | $37 | $60 | $(23) |
CECONY’s steam sales and deliveries for the nine months ended September 30, 20172019 compared with the 20162018 period were:
| | | Millions of Pounds Delivered | | Revenues in Millions | Millions of Pounds Delivered | | Revenues in Millions |
| For the Nine Months Ended | | | For the Nine Months Ended | | For the Nine Months Ended | | | For the Nine Months Ended | |
| Description | September 30, 2017 |
| September 30, 2016 |
| Variation | Percent Variation | | September 30, 2017 | September 30, 2016 | Variation | Percent Variation | September 30, 2019 |
| September 30, 2018 |
| Variation | Percent Variation | | September 30, 2019 | September 30, 2018 | Variation | Percent Variation |
| General | 364 |
| 345 |
| 19 |
| 5.5 | % | | $20 | $18 | $2 | 11.1 | % | 394 |
| 442 |
| (48 | ) | (10.9 | )% | | $20 | $23 | $(3) | (13.0 | )% |
| Apartment house | 4,248 |
| 4,251 |
| (3 | ) | (0.1 | ) | | 119 | 107 | 12 | 11.2 |
| 4,331 |
| 4,670 |
| (339 | ) | (7.3 | ) | | 120 | 129 | (9) | (7.0 | ) |
| Annual power | 10,074 |
| 10,640 |
| (566 | ) | (5.3 | ) | | 300 | 284 | 16 | 5.6 |
| 10,383 |
| 11,313 |
| (930 | ) | (8.2 | ) | | 304 | 333 | (29) | (8.7 | ) |
| Other operating revenues (a) | — |
| — |
| — |
| — |
| | 9 | (3) | 12 | Large |
| — |
| — |
| — |
| — |
| | 25 | (11) | 36 | Large |
|
| Total | 14,686 |
| 15,236 |
| (550 | ) | (3.6 | )% | (b) | $448 | $406 | $42 | 10.3 | % | 15,108 |
| 16,425 |
| (1,317 | ) | (8.0 | )% | (b) | $469 | $474 | $(5) | (1.1 | )% |
| |
| (a) | Other steam operating revenues generally reflect changes in regulatory assets and liabilities in accordance with the company’s rate plan. |
| |
| (b) | After adjusting for variations, primarily weather and billing days, steam sales and deliveries decreased 3.5 percent in the nine months ended September 30, 20172019 compared with the 20162018 period. |
Operating revenues increased $42 decreased $5 million in the nine months ended September 30, 20172019 compared with the 20162018 period due primarily to the impact of warmer winter weather ($21 million) and lower purchased power expenses ($1 million), offset, in part, by certain rate plan reconciliations ($12 million) and higher fuel expenses ($22 million), the weather impact on revenues ($6 million), lower regulatory reserve related to steam earnings sharing ($7 million), a property tax refund incentive ($3 million), and higher purchased power costs ($1 million).
Purchased power expenses increaseddecreased $1 million in the nine months ended September 30, 20172019 compared with the 20162018 period due to higherlower unit costs ($5 million), offset by lower purchased volumes ($4 million).costs.
Fuel expenses increased $22$6 million in the nine months ended September 30, 20172019 compared with the 20162018 period due to higher unit costs ($239 million), offset, in part, by lower purchased volumes from the company’s steam generating facilities ($13 million).
Other operations and maintenance expenses decreased $5increased $3 million in the nine months ended September 30, 20172019 compared with the 20162018 period due primarily to lower equipment maintenance expenses.higher municipal infrastructure support costs ($6 million), higher costs for pension and other postretirement benefits ($5 million) and stock-based compensation ($2 million), offset, in part, by the absence of property damage, clean-up and other response costs related to a steam main rupture in 2018 ($7 million).
Depreciation and amortization increased $2 million in the nine months ended September 30, 20172019 compared with the 20162018 period due primarily to higher steam utility plant balances.
Taxes, other than income taxes increased $9$8 million in the nine months ended September 30, 20172019 compared with the 20162018 period due primarily to higher property taxes ($7 million)taxes.
Other Income (Deductions)
Other income (deductions) increased $68 million in the nine months ended September 30, 2019 compared with the 2018 period due primarily to lower costs associated with components of pension and state and local taxes ($1 million).other postretirement benefits other than service cost.
Net Interest Expense
Net interest expense increased $12$37 million in the nine months ended September 30, 20172019 compared with the 20162018 period due primarily to higher interest expense for long-term ($10 million) and short-term ($7 million) debt, balancesan increase in interest accrued on the 2017 period.TCJA related regulatory liability ($9 million) and interest accrued on the system benefit charge liability ($6 million).
Income Tax Expense
Income taxes increased $60decreased $3 million in the nine months ended September 30, 20172019 compared with the 20162018 period due primarily to higheran increase in the amortization of excess deferred federal income before income tax expensetaxes due to the TCJA ($335 million), a decrease in tax benefits for plant-related flow through items ($27 million), lower and higher research and development tax credits ($10 million) and a higher reserve for injuries and damages ($91 million), offset, in part, by lower state income taxestax benefits in 2019 for plant-related flow through items ($71 million), and higher research and development tax credits includednon-deductible business expenses in Con Edison's filing of its 2016 consolidatedthe 2018 federal tax return due to the TCJA ($3 million). CECONY deferred as a regulatory liability its estimated net benefits for the 2018 period under the TCJA and continued to defer its estimated net benefits in September 2017 ($5 million), a decrease2019 for only its electric service. See “Other Regulatory Matters” in bad debt expense ($2 million) and a decrease in uncertain tax positions ($1 million).Note B to the Third Quarter Financial Statements.
O&R
| | | For the Nine Months Ended
September 30, 2017 | | For the Nine Months Ended
September 30, 2016 | | | For the Nine Months Ended
September 30, 2019 | | For the Nine Months Ended
September 30, 2018 | | |
| (Millions of Dollars) | Electric |
| Gas |
| 2017 Total | Electric |
| Gas |
| 2016 Total | 2017-2016
Variation | Electric |
| Gas |
| 2019 Total | Electric |
| Gas |
| 2018 Total | 2019-2018
Variation |
|
| Operating revenues | $495 | $172 | $667 | $497 | $133 | $630 | $37 | $493 | $185 | $678 | $505 | $186 | $691 | $(13) |
| Purchased power | 148 | — |
| 148 | 154 | — |
| 154 | (6) | 146 | — |
| 146 | 167 | — |
| 167 | (21) |
| Gas purchased for resale | — |
| 52 | 52 | — |
| 32 | 32 | 20 | — |
| 68 | 68 | — |
| 60 | 60 | 8 |
| Other operations and maintenance | 185 | 51 | 236 | 180 | 40 | 220 | 16 | 173 | 52 | 225 | 178 | 56 | 234 | (9) |
| Depreciation and amortization | 38 | 15 | 53 | 37 | 13 | 50 | 3 | 46 | 17 | 63 | 41 | 16 | 57 | 6 |
| Taxes, other than income taxes | 41 | 21 | 62 | 40 | 20 | 60 | 2 | 40 | 23 | 63 | 40 | 23 | 63 | — |
|
| Operating income | $83 | $33 | $116 | $86 | $28 | $114 | $2 | $88 | $25 | $113 | $79 | $31 | $110 |
| $3 |
|
Electric
O&R’s results of electric operations for the nine months ended September 30, 20172019 compared with the 20162018 period iswere as follows:
| | | For the Nine Months Ended | | For the Nine Months Ended | |
| (Millions of Dollars) | September 30, 2017 | September 30, 2016 | Variation | September 30, 2019 | September 30, 2018 | Variation |
|
| Operating revenues | $495 | $497 | $(2) | $493 | $505 | $(12) |
| Purchased power | 148 | 154 | (6) | 146 | 167 | (21) |
| Other operations and maintenance | 185 | 180 | 5 | 173 | 178 | (5) |
| Depreciation and amortization | 38 | 37 | 1 | 46 | 41 | 5 |
| Taxes, other than income taxes | 41 | 40 | 1 | 40 | — |
|
| Electric operating income | $83 | $86 | $(3) | $88 | $79 | $9 |
O&R’s electric sales and deliveries for the nine months ended September 30, 20172019 compared with the 20162018 period were:
| | | Millions of kWh Delivered | | Revenues in Millions (a) | Millions of kWh Delivered | | Revenues in Millions (a) |
| For the Nine Months Ended | | | For the Nine Months Ended | | For the Nine Months Ended | | | For the Nine Months Ended | |
| Description | September 30, 2017 |
| September 30, 2016 |
| Variation |
| Percent Variation | | September 30, 2017 | September 30, 2016 | Variation | Percent Variation | September 30, 2019 |
| September 30, 2018 |
| Variation |
| Percent Variation | | September 30, 2019 | September 30, 2018 | Variation | Percent Variation |
| Residential/Religious (b) | 1,208 |
| 1,307 |
| (99 | ) | (7.6 | )% | | $242 | $240 | $2 | 0.8 | % | 1,339 |
| 1,348 |
| (9 | ) | (0.7 | )% | | $243 | $260 | $(17) | (6.5 | )% |
| Commercial/Industrial | 574 |
| 607 |
| (33 | ) | (5.4 | ) | | 88 | 89 | (1) | (1.1 | ) | 621 |
| 609 |
| 12 |
| 2.0 |
| | 87 | 91 | (4) | (4.4 | ) |
| Retail choice customers | 2,255 |
| 2,434 |
| (179 | ) | (7.4 | ) | | 155 | 166 | (11) | (6.6 | ) | 2,194 |
| 2,274 |
| (80 | ) | (3.5 | ) | | 147 | 158 | (11) | (7.0 | ) |
| Public authorities | 79 |
| 76 |
| 3 |
| 3.9 |
| | 7 | 6 | 1 | 16.7 |
| 80 |
| 104 |
| (24 | ) | (23.1 | ) | | 7 | 10 | (3) | (30.0 | ) |
| Other operating revenues (c) | — |
| — |
| — |
| — |
| | 3 | (4) | 7 | Large |
| — |
| — |
| — |
| — |
| | 9 | (14) | 23 | Large |
|
| Total | 4,116 |
| 4,424 |
| (308 | ) | (7.0 | )% | (d) | $495 | $497 | $(2) | (0.4 | )% | 4,234 |
| 4,335 |
| (101 | ) | (2.3 | )% | (d) | $493 | $505 | $(12) | (2.4 | )% |
| |
| (a) | O&R’s New York electric delivery revenues are subject to a revenue decoupling mechanism, as a result of which delivery revenues are generally not affected by changes in delivery volumes from levels assumed when rates were approved. O&R’s electric sales in New Jersey are not subject to a decoupling mechanism, and as a result, changes in such volumes do impact revenues. |
| |
| (b) | “Residential/Religious” generally includes single-family dwellings, individual apartments in multi-family dwellings, religious organizations and certain other not-for-profit organizations. |
| |
| (c) | Other electric operating revenues generally reflect changes in regulatory assets and liabilities in accordance with the company’s electric rate plan. |
| |
| (d) | After adjusting for weather and other variations, electric delivery volumes in O&R’s service area decreased 2.21.7 percent in the nine months ended September 30, 20172019 compared with the 20162018 period. |
Operating revenues decreased $2$12 million in the nine months ended September 30, 20172019 compared with the 20162018 period due primarily to lower purchased power expense ($6 million) and lower revenues from rental property ($1 million), offset by higher revenues from the New York electric rate plan ($6 million).expenses.
Purchased power expenses decreased $6$21 million in the nine months ended September 30, 20172019 compared with the 20162018 period due to lower unit costs ($22 million), offset, in part, by higher purchased volumes ($5 million) and unit costs ($1 million).
Other operations and maintenance expenses decreased $5 million in the nine months ended September 30, 2019 compared with the 2018 period due primarily to the reduction of a regulatory asset associated with certain site investigation and remediation costs in 2018.
Depreciation and amortization increased $5 million in the nine months ended September 30, 20172019 compared with the 2016 period due primarily to operating costs related to weather events in 2017 ($2 million), higher surcharges for assessments and fees that are collected in revenues from customers ($1 million) and a higher reserve for injuries and damages ($1 million).
Depreciation and amortization increased $1 million in the nine months ended September 30, 2017 compared with the 20162018 period due primarily to higher electric utility plant balances.
Taxes, other than income taxes increased $1 million in the nine months ended September 30, 2017 compared with the 2016 period due primarily to higher property taxes.
Gas
O&R’s results of gas operations for the nine months ended September 30, 20172019 compared with the 20162018 period iswere as follows:
| | | For the Nine Months Ended | | For the Nine Months Ended | |
| (Millions of Dollars) | September 30, 2017 | September 30, 2016 | Variation | September 30, 2019 | September 30, 2018 | Variation |
|
| Operating revenues | $172 | $133 | $39 | $185 | $186 | $(1) |
| Gas purchased for resale | 52 | 32 | 20 | 68 | 60 | 8 |
| Other operations and maintenance | 51 | 40 | 11 | 52 | 56 | (4) |
| Depreciation and amortization | 15 | 13 | 2 | 17 | 16 | 1 |
| Taxes, other than income taxes | 21 | 20 | 1 | 23 | — |
|
| Gas operating income | $33 | $28 | $5 | $25 | $31 | $(6) |
O&R’s gas sales and deliveries, excluding off-system sales, for the nine months ended September 30, 20172019 compared with the 20162018 period were:
| | | Thousands of Dt Delivered | | Revenues in Millions (a) | Thousands of Dt Delivered | | Revenues in Millions (a) |
| For the Nine Months Ended | | | For the Nine Months Ended | | For the Nine Months Ended | | | For the Nine Months Ended | |
| Description | September 30, 2017 |
| September 30, 2016 |
| Variation | Percent Variation | | September 30, 2017 |
| September 30, 2016 |
| Variation | Percent Variation | September 30, 2019 |
| September 30, 2018 |
| Variation | Percent Variation | | September 30, 2019 |
| September 30, 2018 |
| Variation | Percent Variation |
| Residential | 5,556 |
| 5,266 |
| 290 |
| 5.5 | % | | $79 | $55 | $24 | 43.6 | % | 6,875 |
| 6,503 |
| 372 |
| 5.7 | % | | $98 | $96 | $2 | 2.1 | % |
| General | 1,447 |
| 1,224 |
| 223 |
| 18.2 |
| | 16 | 10 | 6 | 60.0 |
| 1,608 |
| 1,502 |
| 106 |
| 7.1 |
| | 18 | — |
| — |
|
| Firm transportation | 6,543 |
| 7,188 |
| (645 | ) | (9.0 | ) | | 50 | 49 | 1 | 2.0 |
| 6,430 |
| 6,867 |
| (437 | ) | (6.4 | ) | | 44 | 57 | (13) | (22.8 | ) |
| Total firm sales and transportation | 13,546 |
| 13,678 |
| (132 | ) | (1.0 | ) | (b) | 145 | 114 | 31 | 27.2 |
| 14,913 |
| 14,872 |
| 41 |
| 0.3 |
| (b) | 160 | 171 | (11) | (6.4 | ) |
| Interruptible sales | 2,966 |
| 3,020 |
| (54 | ) | (1.8 | ) | | 5 | 2 | 3 | Large |
| 2,690 |
| 2,842 |
| (152 | ) | (5.3 | ) | | 4 | 5 | (1) | (20.0 | ) |
| Generation plants | 6 |
| 15 |
| (9 | ) | (60.0 | ) | | — |
| — |
| — |
| — |
| 6 |
| 1 |
| 5 |
| Large |
| | — |
| — |
| — |
| — |
|
| Other | 589 |
| 583 |
| 6 |
| 1.0 |
| | 1 | — |
| 1 | — |
| 637 |
| 636 |
| 1 |
| 0.2 |
| | 1 | — |
| — |
|
| Other gas revenues | — |
| — |
| — |
| — |
| | 21 | 17 | 4 | 23.5 | % | — |
| — |
| — |
| — |
| | 20 | 9 | 11 | Large |
| Total | 17,107 |
| 17,296 |
| (189 | ) | (1.1 | )% | | $172 | $133 | $39 | 29.3 | % | 18,246 |
| 18,351 |
| (105 | ) | (0.6 | )% | | $185 | $186 | $(1) | (0.5 | )% |
| |
| (a) | Revenues from New York gas sales are subject to a weather normalization clause and a revenue decoupling mechanism as a result of which delivery revenues are generally not affected by changes in delivery volumes from levels assumed when rates were approved. |
| |
| (b) | After adjusting for weather and other variations, total firm sales and transportation volumes increased 0.11.8 percent in the nine months ended September 30, 20172019 compared with 20162018 period. |
Operating revenues increased $39 decreased $1 million in the nine months ended September 30, 20172019 compared with the 20162018 period due primarily to an increase in gas purchased for resale ($20 million) and higherlower revenues from the New York gas rate plan ($147 million), offset, by an increase in gas purchased for resale ($8 million).
Gas purchased for resale increased $20$8 million in the nine months ended September 30, 20172019 compared with the 20162018 period due to higher unit costs ($6 million) and purchased volumes ($122 million) and unit costs ($8 million).
Other operations and maintenance expenses increased $11decreased $4 million in the nine months ended September 30, 20172019 compared with the 20162018 period due primarily to higher pension costs.the reduction of a regulatory asset associated with certain site investigation and remediation costs in 2018.
Depreciation and amortization increased $2 million in the nine months ended September 30, 2017 compared with the 2016 period due primarily to higher gas utility plant balances.
Taxes, other than income taxesincreased $1 million in the nine months ended September 30, 20172019 compared with the 20162018 period due primarily to higher property taxes.gas utility plant balances.
Income Tax Expense
Income taxes increased $4$1 million in the nine months ended September 30, 20172019 compared with the 20162018 period due primarily to higher income before income tax expense ($12 million), a decreaseoffset, in tax benefits for plant-related flow through itemspart, by an increase in amortization of excess deferred federal income taxes due to TCJA ($1 million) and the absence in 2017 of a tax benefit from a corporate-owned life insurance policy in 2016 ($2 million).
Clean Energy Businesses
The Clean Energy Businesses’ results of operations for the nine months ended September 30, 20172019 compared with the 20162018 period iswere as follows:
| | | For the Nine Months Ended | | For the Nine Months Ended | |
| (Millions of Dollars) | September 30, 2017 | September 30, 2016 | Variation | September 30, 2019 |
| September 30, 2018 | Variation |
| Operating revenues | $460 | $998 | $(538) | $696 | $573 | $123 |
| Purchased power | (3) | 676 | (679) | — |
| 2 | (2) |
| Gas purchased for resale | 161 | 72 | 89 | 159 | 219 | (60) |
| Other operations and maintenance | 174 | 124 | 50 | 168 | 226 | (58) |
| Depreciation and amortization | 54 | 30 | 24 | 169 | 55 | 114 |
| Taxes, other than income taxes | 12 | 16 | (4) | 17 | 12 | 5 |
| Gain on sale of retail electric supply business (2016) and solar electric production project (2017) (a) | (1) | (104) | 103 | |
| Operating income | $63 | $184 | $(121) | $183 | $59 | $124 |
(a) See Note O to the Third Quarter Financial Statements.
Operating revenues decreased $538 increased $123 million in the nine months ended September 30, 20172019 compared with the 20162018 period due primarily to higher renewable electric production project revenues resulting from the December 2018
acquisition of Sempra Solar Holdings, LLC, including the consolidation of certain jointly-owned projects that were previously accounted for as equity method investments ($286 million), offset, in part, by lower engineering, procurement and construction services revenues due to the completion in 2018 of a solar electric production project developed for another company ($92 million). Wholesale revenues decreased ($66 million) due to lower sales volumes, energy services revenues decreased ($16 million) and net mark-to-market values increased ($12 million).
Purchased power expenses decreased $2 million in the nine months ended September 30, 2019 compared with the 2018 period due primarily to the absence in the 2019 period of the true-ups relating to the retail electric supply business sold in 2016.
Gas purchased for resale decreased $60 million in the nine months ended September 30, 2019 compared with the 2018 period due primarily to lower purchased volumes.
Other operations and maintenance expenses decreased $58 million in the nine months ended September 30, 2019 compared with the 2018 period due primarily to lower engineering, procurement and construction costs ($82 million) and lower energy services costs ($10 million), offset, in part, by higher costs associated with additional renewable electric retail revenues of $781 millionproduction projects in operation resulting from the saleDecember 2018 acquisition of Sempra Solar Holdings, LLC ($34 million).
Depreciation and amortization increased $114 million in the retail electric supply business innine months ended September 2016. Renewable revenues increased $112 million30, 2019 compared with the 2018 period due primarily to an increase in renewable electric production projects in operation and revenuesresulting from the engineering, procurement and constructionDecember 2018 acquisition of Upton 2 (see Note O toSempra Solar Holdings, LLC (including the Third Quarter Financial Statements).consolidation of certain jointly-owned projects that the Clean Energy services revenuesBusinesses previously accounted for as equity method investments).
Taxes, other than income taxes increased $21 million. Wholesale revenues increased $105 million due to higher sales volumes. Net mark-to-market values decreased $6 million of which $11 million in losses are reflected in purchased power costs and $5 million in gains are reflected in revenues.
Purchased power expenses decreased $679 million in the nine months ended September 30, 20172019 compared with the 20162018 period due primarily to lower electric costs due to the sale of the retail electric supply business in September 2016 ($689 million) offset by changes in mark-to-market values ($11 million).higher property taxes.
Gas purchased for resale increased $89Other Income (Deductions)
Other income (deductions) decreased $31 million in the nine months ended September 30, 20172019 compared with the 20162018 period due primarily to higher purchased volumes.the absence in 2019 of equity income from certain jointly-owned projects that were accounted for as equity investments in 2018 but consolidated after the December 2018 acquisition of Sempra Solar Holdings, LLC.
Other operations and maintenance expensesNet Interest Expense
Net interest expense increased $50$131 million in the nine months ended September 30, 20172019 compared with the 20162018 period due primarily to Upton 2 engineering, procurement and construction costs (see Note O to the Third Quarter Financial Statements) and an increase in energy services costs.debt resulting from the December 2018 acquisition of Sempra Solar Holdings, LLC, including $825 million that was borrowed to fund a portion of the purchase price, $576 million of Sempra Solar Holdings, LLC subsidiaries' project debt that was outstanding at the time of the acquisition and the consolidation of $506 million of project debt of certain jointly-owned projects that the Clean Energy Businesses previously accounted for as equity method investments.
Depreciation and amortization increased $24Income Tax Expense
Income taxes decreased $40 million in the nine months ended September 30, 20172019 compared with the 2016 period due to an increase in solar electric production projects in operation during 2017.
Taxes, other than income taxes decreased $4 million in the nine months ended September 30, 2017 compared with the 2016 period due to lower gross receipts tax from the sale of the retail electric supply business in September 2016.
Gain on sale of retail electric supply business was $104 million in the nine months ended September 30, 2016 reflecting the sale of the Clean Energy Businesses' retail electric supply business.
Other Income (Deductions)
Other income (deductions) decreased $2 million in the nine months ended September 30, 2017 compared with the 2016 period due primarily to earnings from equity investments.
Net Interest Expense
Net interest expense increased $11 million in the nine months ended September 30, 2017 compared with the 2016 period due primarily to increased debt on solar electric production projects.
Income Tax Expense
Income taxes decreased $68 million in the nine months ended September 30, 2017 compared with the 20162018 period due primarily to lower income before income tax expense (excluding income attributable to non-controlling interest) ($5425 million), higher renewable energy tax credits ($17 million) and the increase to deferred, lower state income taxes ($4 million) and adjustments for prior period federal income tax returns primarily due to increased research and development credits ($11 million), offset, in 2016 as a result of the sale of the retail electric supply business that increased the Clean Energy Businesses’ state apportionment factor on its cumulative temporary differencespart, by an increase in uncertain tax positions ($137 million).
Con Edison TransmissionIncome Attributable to Non-Controlling Interest
Other operations and maintenanceIncome attributable to non-controlling interest increased $6$79 million in the nine months ended September 30, 20172019 compared with the 20162018 period due primarily to CET having no employees or other direct costs until January 1, 2017.the income attributable in the 2019 period to a tax equity investor in renewable electric production projects accounted for under the HLBV method of accounting. See Note N to the Third Quarter Financial Statements.
Net Interest ExpenseCon Edison Transmission
Net interest expenseOther Income (Deductions)
Other income (deductions) increased $8$9 million in the nine months ended September 30, 20172019 compared with the 20162018 period due primarily to a new debt issuanceincreased earnings from equity investments in 2016.Mountain Valley Pipeline, LLC.
Other Income (Deductions)Tax Expense
Other income (deductions)Income taxes increased $37$2 million in the nine months ended September 30, 20172019 compared with the 2016 period due primarily to earnings from equity investments in Stagecoach Gas Services, LLC, substantially all of which were made in June 2016.
Income Tax Expense
Income taxes increased $10 million in the nine months ended September 30, 2017 compared with the 20162018 period due primarily to higher income before income tax expense.
Other
ForIncome Tax Expense
Income taxes decreased $47 million in the nine months ended September 30, 2019 compared with the 2018 period due primarily to the absence of the TCJA re-measurement of deferred tax assets associated with Con Edison, “Other” includes parent companyEdison’s 2017 federal net operating loss carryforward into 2018 ($42 million) and consolidation adjustments.lower state income taxes ($5 million).
Liquidity and Capital Resources
The Companies’ liquidity reflects cash flows from operating, investing and financing activities, as shown on their respective consolidated statement of cash flows and as discussed below.
Changes in the
The Companies’ cash, and temporary cash investments and restricted cash resulting from operating, investing and financing activities for the nine months ended September 30, 20172019 and 20162018 are summarized as follows:
| | | | For the Nine Months Ended September 30, | For the Nine Months Ended September 30, |
| | Con Edison | CECONY | CECONY | O&R | Clean Energy Businesses | Con Edison
Transmission | Other (a) | Con Edison (b) |
| (Millions of Dollars) | 2017 |
| 2016 | Variation | 2017 |
| 2016 |
| Variation |
| 2019 | 2018 | 2019 | 2018 | 2019 | 2018 | 2019 |
| 2018 |
| 2019 |
| 2018 | 2019 | 2018 |
| Operating activities | $2,227 | $2,336 | $(109) | $1,790 | $2,017 | $(227) | $1,490 | $1,085 | $168 | $102 | $285 | $(7) | $150 | $114 | $(133) | $306 | $1,960 | $1,600 |
| Investing activities | (2,572) | (3,717) | 1,145 | (2,197) | (1,943) | (254) | (2,437) | (2,498) | (163) | (147) | (142) | (195) | (143) | (106) | 1 |
| (1) | (2,884) | (2,947) |
| Financing activities | (362) | 583 | (945) | (278) | (891) | 613 | 144 | 700 | (20) | 22 | (79) | 198 | (9) | (8) | 135 | (164) | 171 | 748 |
| Net change for the period | (707) | (798) | 91 | (685) | (817) | 132 | (803) | (713) | (15) | (23) | 64 | (4) | (2) | — |
| 3 | 141 | (753) | (599) |
| Balance at beginning of period | 776 | 944 | (168) | 702 | 843 | (141) | 818 | 730 | 52 | 47 | 126 | 56 | 2 | 2 | 8 | 9 | 1,006 | 844 |
Balance at end of period | $69 | $146 | $(77) | $17 | $26 | $(9) | $15 | $17 | $37 | $24 | $190 | $52 |
| $— |
| $2 | $11 | $150 | $253 | $245 |
| Less: Change in cash balances held for sale | — |
| (4) | 4 | — |
| — |
| — |
| |
| Balance at end of period excluding held for sale | $69 | $150 | $(81) | $17 | $26 | $(9) | |
(a) Includes parent company and consolidation adjustments.
(b) Represents the consolidated results of operations of Con Edison and its businesses.
(c) See "Reconciliation of Cash, Temporary Cash Investments and Restricted Cash" in Note A to the Third Quarter Financial Statements.
Cash Flows from Operating Activities
The Utilities’ cash flows from operating activities reflect primarily their energy sales and deliveries and cost of operations. The volume of energy sales and deliveries is affected primarily by factors external to the Utilities, such as growth of customer demand, weather, market prices for energy and economic conditions. Measures that promote distributed energy resources, such as distributed generation, demand reduction and energy efficiency, also affect the volume of energy sales and deliveries. Under the revenue decoupling mechanisms in the Utilities’ New York electric and gas rate plans, changes in delivery volumes from levels assumed when rates were approved may affect the timing of cash flows, but generally not net income. The prices at which the Utilities provide energy to their customers are determined in accordance with their rate plans. In general, changes in the Utilities’ cost of purchased power, fuel and gas may affect the timing of cash flows, but not net income, because the costs are recovered in accordance with rate plans. Pursuant to their rate plans, the Utilities have recovered from customers a portion of the tax liability they will pay in the future as a result of temporary differences between the book and tax basis of assets and liabilities. These temporary differences affect the timing of cash flows, but not net income, as the Companies are required to record deferred tax assets and liabilities at the current corporate tax rate for the temporary differences. For the Utilities, credits to their customers of the net benefits of the TCJA, including the reduction of the corporate tax rate to 21 percent, decrease cash flows from operating activities. See “Other Regulatory Matters” in Note B to the Third Quarter Financial Statements.
Net income is the result of cash and non-cash (or accrual) transactions. Only cash transactions affect the Companies’ cash flows from operating activities. Principal non-cash charges or credits include depreciation, deferred income tax expense, and amortizations of certain regulatory assets and liabilities.liabilities, and accrued unbilled revenue. Non-cash charges or credits may also be accrued under the revenue decoupling and cost reconciliation mechanisms in the Utilities’ New York electric and gas rate plans.
Net cash flows from operating activities for the nine months ended September 30, 20172019 for Con Edison and CECONY were $109$360 million and $227$405 million lower,higher, respectively, than in the 20162018 period. The changechanges in net cash flows for Con Edison and CECONY reflectsreflect primarily higher cash paid for income taxesa change in the 2017 period as compared with the 2016 periodtiming of $110pension and retiree benefit contributions ($122 million and $226$114 million, respectively,respectively), lower storm restoration costs ($185 million and $124 million, respectively), lower MTA power reliability costs ($123 million and $123 million, respectively), reimbursement received for Puerto Rico related restoration costs ($95 million and $95 million, respectively), and for CECONY, lower net payments of refunds received. The income tax refund receivedto affiliated companies ($255 million), offset, in 2016 reflectedpart, by higher TCJA net benefits provided to customers in the extension of bonus depreciation in late 2015, resulting in a refund of the 2015 estimated federal tax payments.2019 period ($289 million and $287 million, respectively).
The change in net cash flows also reflects the timing of payments for and recovery of energy costs. This timing is reflected within changes to accounts receivable – customers and recoverable and refundable energy costs within other regulatory assets and liabilities and accounts payable balances.
The changes in regulatory assets primarily reflect changes in deferred pension costs in accordance with the accounting rules for retirement benefits.
Cash Flows Used in Investing Activities
Net cash flows used in investing activities for Con Edison and CECONY were $1,145$63 million lower and $254$61 million higher,lower, respectively, for the nine months ended September 30, 20172019 compared with the 20162018 period. The change for Con Edison reflects primarily lower newa decrease in non-utility construction expenditures at the Clean Energy Businesses ($50 million), the proceeds from the sale of a property formerly used by CECONY in its operations ($48 million) and a decrease in utility construction expenditures at CECONY ($44 million), offset, in part, by increases in investments in electric and gas transmission projects at Con Edison Transmission ($36 million), cost of removal less salvage at CECONY ($1,01131 million) and renewable electric production projects ($240 million), and a decreasean increase in non-utility construction expenditures ($148 million), offset in part by lower proceeds from sale of assets ($216 million). The change for CECONY primarily reflects absence of proceeds from the transfer of assets to NY Transco in 2016 ($122 million) and increased utility construction expenditures at O&R ($8815 million).
Cash Flows from Financing Activities
Net cash flows from financing activities for Con Edison and CECONY were $945$577 million lower and $613$556 million higher,lower, respectively, in the nine months ended September 30, 20172019 compared with the 20162018 period.
In August 2017,May 2019, Con Edison entered into a forward sale agreement relating to 5,800,000 shares of its common stock. In June 2019, the company issued 4,750,000 shares for $400 million upon physical settlement of shares subject to the forward sale agreement. Con Edison used the proceeds to invest in CECONY for funding of its capital requirements and other general corporate purposes. At September 30, 2019, 1,050,000 shares remain subject to the forward sale agreement. The company expects the remaining shares under the forward sale agreement to settle by December 28, 2020. See Note C to the Third Quarter Financial Statements.
In March 2019, Con Edison issued 4.15,649,369 shares of its common stock for $425 million commonupon physical settlement of the remaining shares resulting in net proceeds of $343 million, after issuance expenses, that were invested bysubject to its November 2018 forward sale agreements. Con Edison used the proceeds to invest in its subsidiaries principally CECONY and the Clean Energy Businesses, for funding of their construction expenditurescapital requirements and to repay short-term debt incurred for other general corporate purposes.that purpose.
In February 2019, Con Edison borrowed $825 million under a two-year variable-rate term loan to fund the repayment of a 6-month variable-rate term loan. In June 2017,2019, Con Edison pre-paid $150 million of the amount borrowed.
In May 2019, CECONY issued $500$700 million aggregate principal amount of 3.8754.125 percent debentures, due 2047,2049, the net proceeds from the sale of which were used to repay short-term borrowings and for other general corporate purposes.
In March 2017, Con EdisonApril 2019, CECONY redeemed at maturity $475 million of 6.65 percent 10-year debentures.
In June 2018, CECONY issued $400$640 million aggregate principal amount of 2.00 percent debentures, due 2020,2021, at a variable interest rate of 0.40 percent above three-month LIBOR and prepaidcalled for redemption on various dates in July and August 2018 the June 2016 $400$636 million variable rate term loan that wasof CECONY’s tax-exempt debt for which the interest rates were to mature in 2018.be determined pursuant to periodic auctions.
Also, in March 2017, a Con Edison Development subsidiaryIn May 2018, CECONY issued $97$700 million aggregate principal amount of 4.454.50 percent senior notes,debentures, due 2042, secured by the company’s Upton County Solar project.
In June 2016, CECONY issued $5502058, and $300 million aggregate principal amount of 3.853.80 percent debentures, due 2046,2028, the net proceeds from the sale of which were used to repay short-term borrowings and for other general corporate purposes.
In September 2016,April 2018, CECONY redeemed at maturity $400$600 million of 5.505.85 percent 10-year debentures.
In June 2016, a Con Edison Solutions subsidiary borrowed $2 million pursuantSeptember 2019, O&R agreed to a loan agreement with a New Jersey utility. The borrowing maturesissue in 2026, bears interest of 11.18 percent and may be repaid in cash or project Solar Renewable Energy Certificates.
In May 2016, Con Edison issued approximately 10 million common shares resulting in net proceeds, after issuance expenses, of $702 million and $500November 2019 $43 million aggregate principal amount of 2.003.73 percent debentures, due 2021,2049 and to issue in December 2019 $44 million aggregate principal amount of 2.94 percent debentures, due 2029 and $38 million aggregate principal amount of 3.46 percent debentures, due 2039.
In August and December 2018, O&R issued $150 million aggregate principal amount of 4.35 percent debentures, due 2048.
In September 2018, O&R redeemed at maturity $50 million of 6.15 percent 10-year debentures.
In October 2019, a Con Edison Development subsidiary issued $303 million aggregate principal amount of 3.82 percent senior notes, due 2038, secured by the company's Panoche Valley and Wistaria Solar renewable electric production projects.
In May 2019, a Con Edison Development subsidiary borrowed $464 million at a variable-rate, due 2026, secured by equity interests in solar electric production projects, the net proceeds from the sale of which were used to repay borrowings from Con Edison and for other general corporate purposes. Con Edison used a portion of the repayment to pre-pay $150 million of an $825 million two-year variable-rate term loan and the remainder to repay short-term borrowings and for other general corporate purposes. The company has entered into fixed-rate interest rate swaps in connection with this borrowing. See Note L to the acquisition by a CET Gas subsidiary of a 50 percent equity interest in a gas pipeline and storage joint venture (see "Con Edison Transmission", above) and for general corporate purposes.Third Quarter Financial Statements.
In May 2016,September 2018, a Con Edison Development subsidiary issued $95$140 million aggregate principal amount of 4.074.41 percent senior notes,Senior Notes, due 2036,2028, secured by five of the company's California Holdings 3 solar project.company’s wind electric production projects.
In February 2016, a Con Edison Development subsidiary issued $218 million aggregate principal amount of 4.21 percent senior notes, due 2041, secured by the company's Texas Solar 7 solar project.
Con Edison’s cash flows from financing for the nine months ended September 30, 20172019 and 20162018 also reflect the proceeds, and reduction in cash used for reinvested dividends, resulting from the issuance of common shares under the company’s dividend reinvestment, stock purchase and long-term incentive plans of $74$76 million and $77$75 million, respectively.
Cash flows used in financing activities of the Companies also reflect commercial paper issuances and repayments. The commercial paper amounts outstanding at September 30, 20172019 and 20162018 and the average daily balances for the nine months ended September 30, 20172019 and 20162018 for Con Edison and CECONY were as follows:
| | | 2017 | 2016 | 2019 | 2018 |
| (Millions of Dollars, except Weighted Average Yield) | Outstanding at September 30, | Daily average | Outstanding at September 30, | Daily average | Outstanding at September 30, | Daily average | Outstanding at September 30, | Daily average |
| Con Edison | $356 | $645 | $601 | $813 | $1,300 | $1,122 | $1,352 | $830 |
| CECONY | $147 | $323 | $480 | $385 | $930 | $743 | $1,004 | $447 |
| Weighted average yield | 1.3 | 1.1 | 0.7 | 0.6 | 2.3 | 2.6 | 2.3 | 2.1 |
Capital Requirements and Resources
Con Edison has decreased its estimatesCapital Requirements
The capital expenditures reflected in the October 2019 Joint Proposal for capital requirements for the retirement of long-term securities for 2018 from $1,688 million to $1,288 million. The decrease reflects the $400 million prepayment of a variablenew CECONY electric and gas rate term loan that was to matureplans (see “Rate Plans” in 2018. See Note CB to the Third Quarter Financial Statements.Statements) were:
For each of the Companies, the ratio of earnings |
| | | |
| (Millions of Dollars) | 2020 | 2021 | 2022 |
| Electric | $2,135 | $2,137 | $1,917 |
| Gas | $1,073 | $1,055 | $989 |
Contractual Obligations
Con Edison’s material obligations to fixed charges (Securitiesmake payments pursuant to contracts totaled $52,720 million and Exchange Commission (SEC) basis) for the nine months ended$49,264 million at September 30, 20172019 and 2016 and the twelve months ended December 31, 2016 was:2018, respectively. The increase at September 30, 2019 is due primarily to increases in long-term debt ($1,288 million) and interest on long-term debt ($828 million). See "Cash Flows from Financing Activities,” above.
|
| | | |
| Ratio of Earnings to Fixed Charges |
| For the Nine Months Ended September 30, 2017 | For the Nine Months Ended September 30, 2016 | For the Twelve Months Ended December 31, 2016 |
| Con Edison | 3.8 | 4.0 | 3.6 |
| CECONY | 3.9 | 3.8 | 3.6 |
Capital Resources
For each of the Companies, the common equity ratio at September 30, 20172019 and December 31, 20162018 was:
| | | Common Equity Ratio (Percent of total capitalization) | Common Equity Ratio (Percent of total capitalization) |
| September 30, 2017 | December 31, 2016 | September 30, 2019 | December 31, 2018 |
| Con Edison | 50.8 | 49.3 | 50.8 | 49.0 |
| CECONY | 50.9 | 49.5 | 50.1 | 48.6 |
Other Changes in Assets, Liabilities and LiabilitiesEquity
The following table shows changes in certainCompanies' assets, liabilities, and liabilitiesequity at September 30, 2017, compared with2019 and December 31, 2016.
2018 are summarized as follows. |
| | | |
| | Con Edison | CECONY |
| (Millions of Dollars) | 2017 vs. 2016 Variation | 2017 vs. 2016 Variation |
| Assets | | |
| Prepayments | $433 | $398 |
| Non-utility property, less accumulated depreciation | 204 | — |
|
| Regulatory asset - Unrecognized pension and other postretirement costs | (248) | (254) |
| Liabilities | | |
| Pension and retiree benefits | $(404) | $(394) |
| Deferred income taxes and unamortized investment tax credits | 539 | 610 |
| System benefit charge | 194 | 175 |
|
| | | | | | | | | | | | | | | | | | |
| | CECONY | O&R | Clean Energy
Businesses | Con Edison
Transmission | Other (a) | Con Edison (b) |
| (Millions of Dollars) | 2019 | 2018 | 2019 | 2018 | 2019 |
| 2018 |
| 2019 |
| 2018 | 2019 |
| 2018 |
| 2019 | 2018 |
| ASSETS | | | | | | | | | | | | |
Current assets | $3,005 | $3,357 | $255 | $263 | $458 | $372 |
| $— |
| $32 | $(137) | $(160) | $3,581 | $3,864 |
| Investments | 436 | 385 | 26 | 25 | — |
| — |
| 1,528 | 1,362 | (7) | (6) | 1,983 | 1,766 |
| Net plant | 36,885 | 35,374 | 2,299 | 2,210 | 4,033 | 4,148 | 17 | 17 | — |
| — |
| 43,234 | 41,749 |
| Other noncurrent assets | 4,482 | 3,992 | 355 | 394 | 1,885 | 1,736 | 14 | 14 | 406 | 405 | 7,142 | 6,541 |
| Total Assets | $44,808 | $43,108 | $2,935 | $2,892 | $6,376 | $6,256 | $1,559 | $1,425 | $262 | $239 | $55,940 | $53,920 |
| | | |
| | | |
| |
| |
| |
| LIABILITIES AND SHAREHOLDERS' EQUITY |
| | | |
| |
| |
| |
| Current liabilities | $3,813 | $4,200 | $410 | $392 | $1,819 | $1,608 | $94 | $5 | $83 | $2 | $6,219 | $6,207 |
| Noncurrent liabilities | 12,892 | 12,322 | 1,060 | 1,094 | 44 | (32) | 82 | 66 | (28) | (71) | 14,050 | 13,379 |
| Long-term debt | 14,024 | 13,676 | 694 | 694 | 2,124 | 2,330 | 500 | 500 | 195 | 295 | 17,537 | 17,495 |
| Equity | 14,079 | 12,910 | 771 | 712 | 2,389 | 2,350 | 883 | 854 | 12 | 13 | 18,134 | 16,839 |
| Total Liabilities and Equity | $44,808 | $43,108 | $2,935 | $2,892 | $6,376 | $6,256 | $1,559 | $1,425 | $262 | $239 | $55,940 | $53,920 |
(a) Includes parent company and consolidation adjustments.
Prepayments
The increase in prepayments for(b) Represents the consolidated results of operations of Con Edison and its businesses.
CECONY
Current assets at September 30, 2019 were $352 million lower than at December 31, 2018. The change in current assets reflects a decrease in cash and temporary cash investments primarily the portion allocabledue to the 2017 fourth quarter of CECONY's July 20172019 payment of its New York City semi-annual property taxes.
Non-Utility Property, Less Accumulated Depreciation
taxes ($803 million) and a decrease in other receivables ($107 million). The decrease in other receivables reflects primarily the receipt of payments related to costs for aid provided by CECONY for the restoration of power in Puerto Rico in the aftermath of the September 2017 hurricanes ($95 million). These decreases are offset, in part, by an increase in non-utilityprepayments reflecting primarily the July 2019 payment of New York City semi-annual property lesstaxes, offset, in part, by three months of amortization, while the December 2018 balance reflects the amortization of the entire previous semi-annual payment ($499 million).
Investments at September 30, 2019 were $51 million higher than at December 31, 2018. The change in investments reflects primarily an increase in supplemental retirement income plan assets. See Note E to the Third Quarter Financial Statements.
Net plant at September 30, 2019 was $1,511 million higher than at December 31, 2018. The change in net plant reflects primarily an increase in electric ($1,141 million) and gas ($717 million) plant balances, offset, in part, by an increase in accumulated depreciation for Con Edison reflects the completion of construction of Con Edison Development's Upton County Solar renewable electric production project (see Con Edison Development, below)($516 million).
Other noncurrent assets at September 30, 2019 were $490 million higher than at December 31, 2018. The change in other noncurrent assets reflects primarily the adoption of ASU No. 2016-02, “Leases (Topic 842)” ($610 million). See Note I to the Third Quarter Financial Statements. The change also reflects primarily an increase in the regulatory asset for deferred derivative losses ($79 million), property tax reconciliation ($64 million) and MTA power reliability deferral ($16 million) which reflects costs incurred and deferred as a regulatory asset in the 2019 period. See “Other Regulatory Asset for Unrecognized Pension and Other Postretirement Costs and Liability for Pension and Retiree Benefits
TheMatters” in Note B to the Third Quarter Financial Statements. These increases are offset, in part, by a decrease in the regulatory asset for unrecognized pension and other postretirement costs and the liability for pension and retiree benefits reflectsto reflect the final actuarial valuation, as measured at December 31, 2018, of the pension and other retiree benefit plans in accordance with the accounting rules for retirement benefits ($295 million). See Notes B, E and F to the Third Quarter Financial Statements. The change in the regulatory asset also reflects the year's amortization of accounting costs.
Current liabilities at September 30, 2019 were $387 million lower than at December 31, 2018. The change in current liabilities reflects primarily a decrease in notes payable ($262 million) (see Note D to the Third Quarter Financial Statements) and lower debt due within one year as of September 30, 2019 ($125 million).
Noncurrent liabilities at September 30, 2019 were $570 million higher than at December 31, 2018. The change in noncurrent liabilities reflects primarily the adoption of ASU No. 2016-02, “Leases (Topic 842)” ($595 million). See Note I to the Third Quarter Financial Statements. The change also reflects an increase in deferred income taxes and unamortized investment tax credits ($343 million), which reflects primarily the accelerated method/life of tax depreciation, repair deductions and the prepayment of New York City property taxes. See Note J to the Third Quarter Financial Statements. These increases are offset, in part, by a decrease in the liability for pension and retiree benefits ($375 million), which primarily reflects contributions to the pension and other retiree benefit plans made by the Utilities in 2019 and the final actuarial valuation, as measured at December 31, 2016,2018, of the plans in accordance with the accounting rules for retirement benefits. See Notes E and F to the Third Quarter Financial Statements.
Long-term debt at September 30, 2019 was $348 million higher than at December 31, 2018. The change in long-term debt reflects primarily the May 2019 issuance of $700 million of debentures offset, in part, by the reclassification of $350 million of long-term debt due June 2020 to long-term debt due within one year. See "Liquidity and Capital Resources - Cash Flows From Financing Activities" above and Note C to the Third Quarter Financial Statements.
Equity at September 30, 2019 was $1,169 million higher than at December 31, 2018. The change in equity reflects primarily capital contributions from parent ($875 million) in 2019 and net income for the nine months ended September 30, 2019 ($978 million), offset, in part, by common stock dividends to parent ($685 million) in 2019.
O&R
Current assets at September 30, 2019 were $8 million lower than at December 31, 2018. The change in current assets reflects primarily a decrease in cash and temporary cash investments ($14 million) and customer accounts
receivables, less allowance for uncollectible accounts ($11 million). These decreases are offset, in part, by an increase in prepayments reflecting primarily the property tax payments made in the third quarter of 2019 that are amortized by year end ($18 million).
Net plant at September 30, 2019 was $89 million higher than at December 31, 2018. The change in net plant reflects primarily an increase in electric ($64 million) and gas ($47 million) plant balances, offset, in part, by an increase in accumulated depreciation ($29 million).
Other noncurrent assets at September 30, 2019 were $39 million lower than at December 31, 2018. The change in other noncurrent assets reflects primarily a decrease in the regulatory asset for unrecognized pension and other postretirement costs to reflect the final actuarial valuation, as measured at December 31, 2018, of the pension and other retiree benefit plans in accordance with the accounting rules for retirement benefits ($25 million). The change in the regulatory asset also reflects the year’syear's amortization of accounting costs. The change also reflects a decrease in the regulatory asset for deferred storm costs ($7 million), environmental remediation costs ($5 million) and property tax reconciliation ($5 million).
Current liabilities at September 30, 2019 were $18 million higher than at December 31, 2018. The change in current liabilities reflects primarily an increase in accounts payable.
Noncurrent liabilities at September 30, 2019 were $34 million lower than at December 31, 2018. The change in noncurrent liabilities reflects primarily a decrease in the liability for pension and retiree benefits that primarily reflects in part contributions to the pension and other retiree benefit plans made by the Utilities in 2017.2019. See Notes E and F to the Third Quarter Financial Statements.
Deferred Income TaxesEquity at September 30, 2019 was $59 million higher than at December 31, 2018. The change in equity reflects primarily net income for the nine months ended September 30, 2019 ($60 million), a capital contribution from parent ($30 million) in 2019 and Unamortized Investment Tax Credits
Thean increase in other comprehensive income ($5 million), offset, in part, by common stock dividends to parent ($35 million) in 2019.
Clean Energy Businesses
Current assets at September 30, 2019 were $86 million higher than at December 31, 2018. The change in current assets reflects primarily increases in restricted cash and accrued unbilled revenue.
Net plant at September 30, 2019 was $115 million lower than at December 31, 2018. The change in net plant reflects primarily depreciation during the liability for deferred income taxes and unamortizednine months ended September 30, 2019, investment tax credits and the reduction in the capitalized asset and related liability for Con Edison and CECONYasset retirement obligations for certain property leased by renewable electric production projects, offset, in part, by additional capital expenditures.
Other noncurrent assets at September 30, 2019 were $149 million higher than at December 31, 2018. The change in other noncurrent assets reflects primarily bonus depreciation in 2017, partially offset by the increase in deferred income tax assets associated with the federal tax attribute carryforwards related to the net operating loss and general business tax credits.adoption of ASU No. 2016-02, “Leases (Topic 842).” See Note I to the Third Quarter Financial Statements.
System Benefit ChargeCurrent liabilities at September 30, 2019 were $211 million higher than at December 31, 2018. The change in current liabilities reflects primarily the reclassification of the PG&E-related project debt from long-term debt to long-term debt due within one year ($990 million), offset, in part, by the repayment of a borrowing under a 6-month term loan agreement ($825 million). See Note C to the Third Quarter Financial Statements.
Noncurrent liabilities at September 30, 2019 were $76 million higher than at December 31, 2018. The change in noncurrent liabilities reflects primarily the adoption of ASU No. 2016-02 “Leases (Topic 842)” ($222 million), offset, in part, by the reduction in the capitalized asset and related liability for asset retirement obligations for certain property leased by renewable electric production projects ($98 million) and an increase in deferred income taxes and unamortized investment tax credits ($81 million), which reflects primarily the liabilityaccelerated method/life of tax depreciation and additional unamortized investment tax credits on renewable energy projects. See Note I to the Third Quarter Financial Statements.
Long-term debt at September 30, 2019 was $206 million lower than at December 31, 2018. The change in long-term debt reflects primarily the reclassification of the PG&E-related project debt to long-term debt due within one year ($990 million), offset, in part, by an $825 million borrowing from parent company of the proceeds of parent
company's February 2019 two-year variable-rate term loan agreement, $450 million of which was repaid to parent company, and a borrowing of $464 million, due 2026, secured by equity interests in solar electric production projects. See Note C to the Third Quarter Financial Statements.
Equity at September 30, 2019 was $39 million higher than at December 31, 2018. The change in equity reflects primarily an increase in noncontrolling interest ($62 million), offset, in part, by a net loss for the system benefit chargenine months ended September 30, 2019 ($19 million).
CET
Current assets at September 30, 2019 were $32 million lower than at December 31, 2018. The change in current assets reflects amounts collectedan increased investment in Mountain Valley Pipeline, LLC and a NY Transco transmission project. See "Con Edison Transmission" below.
Investments at September 30, 2019 were $166 million higher than at December 31, 2018. The change in investments reflects primarily increased investment in Mountain Valley Pipeline, LLC and a NY Transco transmission project.
Equity at September 30, 2019 was $29 million higher than at December 31, 2018. The change in equity reflects primarily net income for the nine months ended September 30, 2019 ($38 million), offset, in part, by the Utilities from their customers that will be requiredcommon stock dividends to be paid to NYSERDA.parent ($9 million) in 2019.
Off-Balance Sheet Arrangements
In May 2019, Con Edison entered into a forward sale agreement which met the SEC definition of an off-balance sheet arrangement. See Note C to the Third Quarter Financial Statements. None of the Companies’ other transactions, agreements or other contractual arrangements meetsmeet the SEC definition of off-balance sheet arrangements.
Regulatory Matters
In March 2017, the NYSPSC issued an order that changes the way distributed energy resources are compensated and begins to phase out net energy metering. In New York, net energy metering compensates kilowatt-hours exported to the electric distribution system at the full service rate (that is production plus delivery plus taxes and fees). To provide a gradual transition, the NYSPSC allowed all existing resources to keep their current rate treatment and will delay making significant changes to policies affecting new residential and small commercial rooftop solar until 2020. Larger installations, including new commercial and industrial projects and new community solar projects, will be paid for the value of their exports to the electricity distribution system. The new policy establishes a 2 percent limit on bill increases, reducing the shifting of avoided distribution costs to non-participating residential customers that would have occurred under net energy metering.
In October 2017, the Environmental Defense Fund and the Natural Resources Defense Council requested the NYSPSC to prohibit CECONY from recovering costs under the company’s 20-year transportation contract for 250,000 dekatherms per day of capacity on the Mountain Valley Pipeline unless CECONY demonstrates compliance with a public interest standard.
For additional information about the Utilities’ regulatory matters, see Note B to the Third Quarter Financial Statements.
Environmental Matters
In May 2017,2019, New York City enacted a transformer failure at alaw designed to reduce greenhouse gas (GHG) emissions from large buildings 40 percent from 2005 levels by 2030. Building owners may achieve compliance through operational changes, building retrofits, the purchase of greenhouse gas offsets, the purchase of renewable energy credits and the use of clean distributed energy resources. CECONY substation discharged thousands of gallons of transformer oil intois unable to predict the soil. Someimpact on it of the transformer oil, which contained small amountsimplementation of polychlorinated biphenyls (PCBs), leaked into the East River. The company,this law.
In June 2019, the U.S. Coast Guard,Environmental Protection Agency announced its Affordable Clean Energy (ACE) rule in conjunction with the repeal of its Clean Power Plan. In September 2019, Con Edison, as part of a coalition of public and private electric utilities, filed a petition in the United States Court of Appeals for the District of Columbia Circuit to challenge the Environmental Protection Agency’s ACE rule and the repeal of the Clean Power Plan. The ACE rule could have potential cost implications for the utilities because it has the effect of limiting flexibility to use measures such as emissions trading and averaging to cost-effectively meet emissions limits. The ACE rule could also adversely impact initiatives to develop renewable energy sources and promote the use of electric vehicles.
In July 2019, New York State enacted a law that establishes a program requiring 70 percent of the electricity procured by load serving entities regulated by the NYSPSC to be produced by renewable energy systems by 2030, and requiring the statewide electrical demand system to have zero emissions by 2040. The law also codifies state targets for energy efficiency (end-use energy savings of 185 trillion British thermal units below 2025 energy-use forecast), offshore wind (9,000 megawatts (MW) by 2035), solar (6,000 MW by 2025) and energy storage (3,000 MW by 2030). In addition, the law establishes a climate action council to recommend measures to attain the law’s GHG limits, including measures to reduce emissions by displacing fossil-fuel fired electricity with renewable electricity or energy efficiency. The law requires the New York State Department of Environmental Conservation to issue regulations establishing statewide GHG emissions limits that are 60 percent of 1990 emissions levels by 2030 and other agencies responded15 percent of 1990 emissions by 2050. The Utilities are unable to predict the incident. The company has replaced the transformer, and is continuing to remediate and monitor the site, the costs of which are not expected to have a material adverse effectimpact on its financial condition, results of operations or liquidity. In connection with the incident, the company may incur monetary sanctions of more than $0.1 million for violations of certain provisions regulating the discharge of materials into, and for the protectionthem of the environment.implementation of this law.
In June 2017, CECONY received a notice of potential liability from the U.S. Environmental Protection Agency (EPA) with respect to the Newtown Creek site that was listed in 2010 on the EPA’s National Priorities List of Superfund sites. The EPA has identified fourteen potentially responsible parties (PRPs) with respect to the site, including CECONY, and has indicated that it will notify the company as additional PRPs are identified and notified by the EPA. Newtown Creek and its tributaries (collectively, Newtown Creek) form a 3.8 mile border between Brooklyn and Queens, New York. Currently, the predominant land use around Newtown Creek includes industrial, petroleum, recycling, manufacturing and distribution facilities and warehouses. Other uses include trucking, concrete manufacture, transportation infrastructure and a wastewater treatment plant. Newtown Creek is near several residential neighborhoods. Six PRPs, not including CECONY, pursuant to an administrative settlement agreement and order on consent the EPA issued to them in 2011, have been performing a remedial investigation of the site. The EPA indicated that sampling events have shown the sediments in Newtown Creek to be contaminated with a wide variety of hazardous substances including PCBs, metals, pesticides, polycyclic aromatic hydrocarbons and volatile organic contaminants. The EPA also indicated that it has reason to believe that hazardous substances have come to be released from CECONY facilities into Newtown Creek. The EPA’s current schedule anticipates completion of a feasibility study for the site by late 2018 and issuance of its record of decision selecting a remedy for the site by late 2020. CECONY is unable to estimate its exposure to liability for the Newtown Creek site.
In the fourth quarter of 2016, CECONY and another utility responded to a reported dielectric fluid leak at a New Jersey marina on the Hudson River associated with one or two underwater transmission lines, the New Jersey portion of which is owned and operated by the other utility and the New York portion of which is owned and operated by CECONY. During the third quarter of 2017, after the marina owner had cleared substantial debris from its collapsed pier, a dielectric fluid leak was found and repaired on one of the underwater transmission lines. In the fourth quarter of 2017, it is anticipated that sediment regrading will be completed in underwater areas of the marina that had been disturbed during the leak search and repair efforts. Monitoring also will be conducted to evaluate whether any further action is necessary. CECONY expects that, consistent with the cost allocation provisions of their prior arrangements for the transmission lines, the costs to respond to the incident and repair the line, net of any recovery from the marina owner, will be shared by CECONY and the other utility. At September 30, 2017, the response and repair costs amounted to approximately $27 million, including those costs incurred by CECONY and those costs which the company has been notified have been incurred by the other utility and the U.S. Coast Guard.
CECONY does not expect that its ultimate share of the costs to respond to the discharge and repair the transmission line will have a material adverse effect on its financial condition, results of operation or liquidity.
For additional information about the Companies’ environmental matters, see Note G to the Third Quarter Financial Statements.
Con Edison DevelopmentClean Energy Businesses
The following table provides information about the Clean Energy Businesses' renewable electric production projects Con Edison Development ownedthat are in operation and/or in construction at September 30, 2017:2019:
|
| | | | | |
| Project Name | Production Technology | Generating Capacity (a) (MW AC) | Purchased Power Agreement (PPA)Term (In Years) (b) | Actual/Expected In-Service Date (c) | Location (State) |
| Wholly owned projects |
|
|
|
|
|
| Pilesgrove | Solar | 18 | (d) | 2011 | New Jersey |
| Flemington Solar | Solar | 8 | (d) | 2011 | New Jersey |
| Frenchtown I, II and III | Solar | 14 | (d) | 2011-13 | New Jersey |
| PA Solar | Solar | 10 | | 2012 | Pennsylvania |
| California Solar 2 (e) | Solar | 80 | 20 | 2014-16 | California |
| Oak Tree Wind | Wind | 20 | 20 | 2014 | South Dakota |
| Texas Solar 3 | Solar | 6 | 25 | 2015 | Texas |
| Texas Solar 5 (e) | Solar | 95 | 25 | 2015 | Texas |
| Campbell County Wind | Wind | 95 | 30 | 2015 | South Dakota |
| Texas Solar 7 (e) | Solar | 106 | 25 | 2016 | Texas |
| California Solar 3 (e) | Solar | 110 | 20 | 2016 | California |
| Adams Wind (e) | Wind | 23 | 7 | 2016 | Minnesota |
| Valley View (e) | Wind | 10 | 14 | 2016 | Minnesota |
| Coram (e) | Wind | 102 | 16 | 2016 | California |
| Upton County Solar (e) | Solar | 158 | 25 | 2017 | Texas |
| Projects of less than 5 MW | Solar / Wind | 25 | Various | Various | Various |
| Jointly owned projects (e) (f) |
|
|
|
|
|
| California Solar | Solar | 55 | 25 | 2012-13 | California |
| Mesquite Solar 1 | Solar | 83 | 20 | 2013 | Arizona |
| Copper Mountain Solar 2 | Solar | 75 | 25 | 2013-15 | Nevada |
| Copper Mountain Solar 3 | Solar | 128 | 20 | 2014-15 | Nevada |
| Broken Bow II | Wind | 38 | 25 | 2014 | Nebraska |
| Texas Solar 4 | Solar | 32 | 25 | 2014 | Texas |
| Total MW (AC) in Operation |
| 1,291 |
|
|
|
| Panoche Valley | Solar | 240 | 20 | 2018 | California |
| Total MW (AC) in Construction |
| 240 |
|
|
|
| Total MW (AC), All Projects |
| 1,531 |
|
|
|
|
| | | | | |
| Project Name | Generating
Capacity (MW AC) | Power Purchase Agreement (PPA) Term
(In Years) (a) | Actual/Expected
In-Service Date (b) | Location
(State) | PPA Counterparty (c) |
| Utility Scale |
|
|
|
|
|
| Solar |
|
|
|
|
|
| PJM assets | 53 | (d) | 2011/2013 | New Jersey/Pennsylvania | Various |
| New England assets | 24 | Various | 2011/2017 | Massachusetts/Rhode Island | Various |
| California Solar (e) (g) | 110 | 25 | 2012/2013 | California | PG&E |
| Mesquite Solar 1 (e) (g) | 165 | 20 | 2013 | Arizona | PG&E |
| Copper Mountain Solar 2 (e) (g) | 150 | 25 | 2013/2015 | Nevada | PG&E |
| Copper Mountain Solar 3 (e) (g) | 255 | 20 | 2014/2015 | Nevada | SCPPA |
| California Solar 2 (e) | 80 | 20 | 2014/2016 | California | SCE/PG&E |
| Texas Solar 4 (e) | 40 | 25 | 2014 | Texas | City of San Antonio |
| Texas Solar 5 (e) | 95 | 25 | 2015 | Texas | City of San Antonio |
| Texas Solar 7 (e) | 106 | 25 | 2016 | Texas | City of San Antonio |
| California Solar 3 (e) | 110 | 20 | 2016/2017 | California | SCE/PG&E |
| Upton Solar (e) | 158 | 25 | 2017 | Texas | City of Austin |
| Panoche Valley | 140 | 20 | 2017/2018 | California | SCE |
| Copper Mountain Solar 1 (e) | 58 | 12 | 2018 | Nevada | PG&E |
| Copper Mountain Solar 4 (f) (e) | 94 | 20 | 2018 | Nevada | SCE |
| Mesquite Solar 2 (f) (e) | 100 | 18 | 2018 | Arizona | SCE |
| Mesquite Solar 3 (f) (e) | 150 | 23 | 2018 | Arizona | WAPA (Navy) |
| Great Valley Solar (f) (e) | 200 | 17 | 2018 | California | MCE/SMUD/PG&E/SCE |
| Wistaria Solar | 100 | 20 | 2018 | California | SCE |
| Other | 26 | Various | Various | Various | Various |
| Total Solar | 2,214 |
|
|
|
|
| Wind |
|
|
|
|
|
| Broken Bow II (e) | 75 | 25 | 2014 | Nebraska | NPPD |
| Wind Holdings (e) | 180 | Various | Various | Various | NWE/Basin Electric |
| Adams Rose Wind | 23 | 7 | 2016 | Minnesota | Dairyland |
| Coram Wind (e) | 102 | 16 | 2016 | California | PG&E |
| Other | 22 | Various | Various | Various | Various |
| Total Wind | 402 |
|
|
|
|
| Total MW (AC) in Operation | 2,616 |
|
|
|
|
| Total MW (AC) in Construction | 18 |
|
|
|
|
| Total MW (AC) Utility Scale | 2,634 |
|
|
|
|
| Behind the Meter |
|
|
|
|
|
| Total MW (AC) in Operation | 46 |
|
|
|
|
| Total MW (AC) in Construction | 8 |
|
|
|
|
| Total MW Behind the Meter | 54 |
|
|
|
|
| |
| (a) | Represents Power Purchase Agreement (PPA) contractual term or remaining term from Con Edison Development’s date of acquisition. |
| |
| (b) | Represents Actual/Expected In-Service Date or Con Edison Development's date of acquisition. |
| |
| (c) | PPA Counterparties include: Pacific Gas and Electric Company (PG&E), Southern California Public Power Authority (SCPPA), Southern California Edison Company (SCE), Western Area Power Administration (WAPA), Marin Clean Energy (MCE), Sacramento Municipal Utility District (SMUD), Nebraska Public Power District (NPPD) and NorthWestern Energy (NWE) |
| |
| (d) | Solar renewable energy credit hedges are in place, in lieu of PPAs, through 2022. |
| |
| (e) | Project has been pledged as security for project debt financing. |
| |
| (f) | Projects are financed with tax equity. See Note N to the Third Quarter Financial Statements. |
| |
| (g) | Acquired remaining 50% interest in projects/portfolios in 2018. |
(a) Represents
Con Edison Development’s ownership interest inDevelopment
In January 2019, PG&E filed for reorganization under Chapter 11 of the project.
(b) Represents PPA contractual term or remaining term fromU.S. Bankruptcy Code. The output of Con Edison Development’s dateDevelopment renewable electric production projects with an aggregate of acquisition.
(c) Represents Actual/Expected In-Service Date or680 MW (AC) of generating capacity (PG&E Projects) is sold to PG&E under long-term power purchase agreements (PG&E PPAs). At September 30, 2019, Con Edison’s consolidated balance sheet included $827 million of net non-utility plant relating to the PG&E Projects, $1,075 million of intangible assets relating to the PG&E PPAs, $287 million of net non-utility plant of additional projects that secure the related project debt and $1,012 million of non-recourse related project debt. The PG&E bankruptcy is an event of default under the PG&E PPAs. Pursuant to the related project debt agreements, distributions from the related projects to Con Edison Development's date of acquisition.
(d) Have Solar Renewable Energy Credit hedges in place, in lieu of PPAs, out to 2020.
(e) Project hasDevelopment have been pledged to secure financingsuspended. Unless the lenders for the project.
(f) All ofrelated project debt otherwise agree, the jointly-owned projectslenders may, upon written notice, declare principal and interest on the related project debt to be due and payable immediately and, if such amounts are 50 percent owned, except for Texas Solar 4 (which is 80 percent owned).not timely paid, foreclose on the related projects. See “Long-Lived and Intangible Assets” in Note MA and Note C to the Third
Quarter Financial Statements.
Con Edison Development's renewable electric production volumes generated for the three and nine months ended September 30, 20172019 compared with the 20162018 period were:
| | | | Millions of kWh Generated | Millions of kWh |
| | For the Three Months Ended | For the Nine Months Ended | For the Three Months Ended | For the Nine Months Ended |
| Description | September 30, 2017 |
| September 30, 2016 |
| Variation |
| Percent Variation |
| September 30, 2017 | September 30, 2016 | Variation | Percent Variation |
| September 30, 2019 |
| September 30, 2018 |
| Variation |
| Percent Variation |
| September 30, 2019 | September 30, 2018 | Variation | Percent Variation |
|
| Renewable electric production projects | | | | | | |
| Solar | 668 |
| 458 |
| 210 |
| 45.9 | % | 1,679 | 1,215 | 464 | 38.2 | % | 1,710 |
| 752 |
| 958 |
| Large |
| 4,443 | 2,087 | 2,356 | Large |
|
| Wind | 217 |
| 137 |
| 80 |
| 58.4 | % | 734 | 464 | 270 | 58.2 | % | 317 |
| 245 |
| 72 |
| 29.4 | % | 978 | 776 | 202 | 26.0 | % |
| Total | 885 |
| 595 |
| 290 |
| 48.7 | % | 2,413 | 1,679 | 734 | 43.7 | % | 2,027 |
| 997 | 1,030 | Large |
| 5,421 | 2,863 | 2,558 | 89.3 | % |
Con Edison Transmission
CET Electric
In April 2019, the New York Independent System Operator (NYISO) selected a transmission project that was jointly proposed by National Grid and NY Transco ($600 million estimated cost, excluding certain interconnection costs that are not yet determined) that would increase transmission capacity by 1,850 MW between upstate and downstate when combined with another developer’s project that was also selected by the NYISO. The siting, construction and operation of the projects will require approvals and permits from appropriate governmental agencies and authorities, including the NYSPSC. The NYISO indicated it will work with the developers to enter into agreements for the development and operation of the projects, including a schedule for entry into service by December 2023.
CET Gas
In October 2019, the operator of the Mountain Valley Pipeline, which is being constructed by a joint venture in which CET Gas has a 12.5 percent ownership interest, indicated that it now expects a late 2020 full in-service date for the project at an overall project cost of $5,300 million to $5,500 million, excluding allowance for funds used during construction. CET Gas, as it is permitted to do under the joint venture agreement, plans to limit its cash contributions to the joint venture to approximately $530 million, in which case its ownership interest in the joint venture would be reduced to approximately 10 percent (based on the current project cost estimate). At September 30, 2019, CET Gas’s cash contributions to the joint venture amounted to $488 million.
Financial and Commodity Market Risks
The Companies are subject to various risks and uncertainties associated with financial and commodity markets. The most significant market risks include interest rate risk, commodity price risk credit risk and investment risk.
Interest Rate Risk
The Companies’ interest rate risk relates primarily to variable rate debt and to new debt financing needed to fund capital requirements, including the construction expenditures of the Utilities and maturing debt securities. Con Edison and its businessessubsidiaries manage interest rate risk through the issuance of mostly fixed-rate debt with varying maturities and through opportunistic refinancing of debt. The Clean Energy Businesses also use interest rate swaps. See Note L to the Third Quarter Financial Statements. Con Edison and CECONY estimate that at September 30, 2017,2019, a 10 percent increase in interest rates applicable to its variable rate debt would result in an increase in annual interest expense of $2 million.$7 million and $4 million, respectively. Under CECONY’s current electric, gas
and steam rate plans, variations in actual variable rate tax-exempt debt interest expense are reconciled to levels reflected in rates.
Commodity Price Risk
Con Edison’s commodity price risk relates primarily to the purchase and sale of electricity, gas and related derivative instruments. The Utilities and the Clean Energy Businesses apply risk management strategies to mitigate their related exposures. See Note KL to the Third Quarter Financial Statements.
Con Edison estimates that, as of September 30, 2017,2019, a 10 percent decline in market prices would result in a decline in fair value of $66$83 million for the derivative instruments used by the Utilities to hedge purchases of electricity and gas, of which $60$78 million is for CECONY and $6$5 million is for O&R. Con Edison expects that any such change in fair value would be largely offset by directionally opposite changes in the cost of the electricity and gas purchased. In accordance with provisions approved by state regulators, the Utilities generally recover from customers the costs they incur for energy purchased for their customers, including gains and losses on certain derivative instruments used to hedge energy purchased and related costs.
The Clean Energy Businesses use a value-at-risk (VaR) model to assess the market price risk of their portfolio of electricity and gas commodity fixed-price purchase and sales commitments, physical forward contracts, generating assets and commodity derivative instruments. VaR represents the potential change in fair value of the portfolio due to changes in market prices, for a specified time period and confidence level. These businesses estimate VaR across their portfolio using a delta-normal variance/covariance model with a 95 percent confidence level, and compare the measured VaR results against performance due to actual prices and stress test the portfolio each quarter using an assumed 30 percent price change from forecast. Since the VaR calculation involves complex methodologies and estimates and assumptions that are based on past experience, it is not necessarily indicative of future results. VaR for the portfolio, assuming a one-day holding period, for the nine months ended September 30, 20172019 and the year ended December 31, 2016,2018, respectively, was as follows:
| | | 95% Confidence Level, One-Day Holding Period | September 30, 2017 |
| December 31, 2016 | September 30, 2019 |
| December 31, 2018 |
|
| | (Millions of Dollars) | (Millions of Dollars) |
| Average for the period |
| $— |
| $2 |
| $— |
|
| $— |
|
| High | 1 | 4 | 1 |
| 1 |
|
| Low | — |
| 1 | — |
| — |
|
Credit Risk
The Companies are exposed to credit risk related to transactions entered into primarily for the various energy supply and hedging activities by the Utilities and the Clean Energy Businesses. See the discussion of credit exposure in Note K to the Third Quarter Financial Statements.
Investment Risk
The Companies’ investment risk relates to the investment of plan assets for their pension and other postretirement benefit plans and to the investments of the Clean Energy Businesses and Con Edison Transmission that are accounted for under the equity method.
The Companies’ current investment policy for pension plan assets includes investment targets of 5345 to 6355 percent equitiesequity securities, 33 to 43 percent debt securities and 3510 to 4914 percent fixed income and other securities.real estate. At September 30, 2017,2019, the pension plan investments consisted of 5850 percent equity securities, 39 percent debt securities and 4211 percent fixed income and other securities.real estate.
For the Utilities’ pension and other postretirement benefit plans, regulatory accounting treatment is generally applied in accordance with the accounting rules for regulated operations. In accordance with the Statement of Policy issued by the NYSPSC and its current electric, gas and steam rate plans, CECONY defers for payment to or recovery from customers the difference between the pension and other postretirement benefit expenses and the amounts for such expenses reflected in rates. Generally, O&R also defers such difference pursuant to its rate plans.
Material Contingencies
For information about the PG&E bankruptcy, see “Long-Lived and Intangible Assets” in Note A and Note C to the Third Quarter Financial Statements. For information concerning potential liabilities arising from the Companies’ other material contingencies, see "Other Regulatory Matters" in Note B and Notes G and H to the Third Quarter Financial Statements.
Item 3: Quantitative and Qualitative Disclosures About Market Risk
For information about the Companies’ primary market risks associated with activities in derivative financial instruments, other financial instruments and derivative commodity instruments, see “Financial and Commodity Market Risks,” in Part I, Item 2 of this report, which information is incorporated herein by reference.
Item 4: Controls and Procedures
The Companies maintain disclosure controls and procedures designed to provide reasonable assurance that the information required to be disclosed in the reports that they submit to the Securities and Exchange Commission (SEC) is recorded, processed, summarized and reported within the time periods specified in the rules and forms of the SEC. Disclosure controls and procedures include, without limitation, controls and procedures designed to ensure that information required to be disclosed by an issuer in the reports that it files or submits under the Securities Exchange Act of 1934, as amended, is accumulated and communicated to the issuer’s management, including its principal executive and principal financial officers, or persons performing similar functions, as appropriate to allow timely decisions regarding required disclosure. For each of the Companies, its management, with the participation of its principal executive officer and principal financial officer, has evaluated its disclosure controls and procedures as of the end of the period covered by this report and, based on such evaluation, has concluded that the controls and procedures are effective to provide such reasonable assurance. Reasonable assurance is not absolute assurance, however, and there can be no assurance that any design of controls or procedures would be effective under all potential future conditions, regardless of how remote.
There was no change in the Companies’ internal control over financial reporting that occurred during the Companies’ most recent fiscal quarter that has materially affected, or is reasonably likely to materially affect, the Companies’ internal control over financial reporting.
Part II Other Information
Item 1: Legal Proceedings
For information about certain legal proceedings affecting the Companies, see the information on the PG&E
bankruptcy under "Long-Lived and Intangible Assets" in Note A and Note C, "Other Regulatory Matters" in Note B and Notes G and H to the financial statements in Part I, Item 1 of this report, and "Environmental Matters" in Part I, Item 2 of this report, which information is incorporated herein by reference.
Item 1A: Risk Factors
There were no material changes in the Companies’ risk factors compared to those disclosed in Item 1A of the Form 10-K.
Item 6: Exhibits
Con Edison
|
| |
| Exhibit 10.1 | | Amendment to the Consolidated Edison, Retirement Plan.Inc. Supplemental Defined Contribution Pension Plan
|
| 31.1.1 | Amendment to the Consolidated Edison Retirement Plan. |
| Statement of computation of Con Edison’s ratio of earnings to fixed charges for the nine-month periods ended September 30, 2017 and 2016, and the 12-month period ended December 31, 2016. |
| Rule 13a-14(a)/15d-14(a) Certifications – Chief Executive Officer. |
| |
| |
| |
| Exhibit 101.INS | XBRL Instance Document.Document - the instance document does not appear in the Interactive Data File because its XBRL tags are embedded within the Inline XBRL document. |
| Exhibit 101.SCH | XBRL Taxonomy Extension Schema. |
| Exhibit 101.CAL | XBRL Taxonomy Extension Calculation Linkbase. |
| Exhibit 101.DEF | XBRL Taxonomy Extension Definition Linkbase. |
| Exhibit 101.LAB | XBRL Taxonomy Extension Label Linkbase. |
| Exhibit 101.PRE | XBRL Taxonomy Extension Presentation Linkbase. |
CECONY
|
| |
| 31.2.1 | CECONY Supplemental Medical Benefits. |
| Statement of computation of CECONY’s ratio of earnings to fixed charges for the nine-month periods ended September 30, 2017 and 2016, and the 12-month period ended December 31, 2016. |
| Rule 13a-14(a)/15d-14(a) Certifications – Chief Executive Officer. |
| |
| |
| |
| Exhibit 101.INS | XBRL Instance Document.Document - the instance document does not appear in the Interactive Data File because its XBRL tags are embedded within the Inline XBRL document. |
| Exhibit 101.SCH | XBRL Taxonomy Extension Schema. |
| Exhibit 101.CAL | XBRL Taxonomy Extension Calculation Linkbase. |
| Exhibit 101.DEF | XBRL Taxonomy Extension Definition Linkbase. |
| Exhibit 101.LAB | XBRL Taxonomy Extension Label Linkbase. |
| Exhibit 101.PRE | XBRL Taxonomy Extension Presentation Linkbase. |
Pursuant to Item 601(b)(4)(iii)(A) of Regulation S-K, instruments defining the rights of holders of long-term debt of Con Edison’s subsidiaries other than CECONY, the total amount of which does not exceed ten percent of the total assets of Con Edison and its subsidiaries on a consolidated basis, are not filed as exhibits to Con Edison’s Form 10-K or Form 10-Q. Con Edison agrees to furnish to the SEC upon request a copy of any such instrument.
Signatures
Pursuant to the requirements of the Securities Exchange Act of 1934, each Registrant has duly caused this report to be signed on its behalf by the undersigned thereunto duly authorized.
|
| | |
| | Consolidated Edison, Inc. |
| | Consolidated Edison Company of New York, Inc. |
| | | |
Date: November 2, 20174, 2019 | By | /s/ Robert Hoglund |
| | | Robert Hoglund Senior Vice President, Chief Financial Officer and Duly Authorized Officer |