0001047862 ed:ElectricEnergyDerivativeMember 2019-06-30
UNITED STATES
SECURITIES AND EXCHANGE COMMISSION
WASHINGTON, D.C. 20549
FORM 10-Q
|
| |
| ☒ | Quarterly Report Pursuant To Section 13 or 15(d) of the Securities Exchange Act of 1934 |
FOR THE QUARTERLY PERIOD ENDED June 30, 2019March 31, 2020
OR
|
| |
| ☐ | Transition Report Pursuant to Section 13 or 15(d) of the Securities Exchange Act of 1934 |
For the transition period from to
|
| | | | | | | | | | |
Commission File Number | | Exact name of registrant as specified in its charter and principal executive office address and telephone number | | State of Incorporation | | I.R.S. Employer ID. Number |
| 1-14514 | | Consolidated Edison, Inc. | | New York | | 13-3965100 |
| | | 4 Irving Place, | New York, | New York | 10003 | | | | |
| | | (212) | 460-4600 | | | | | | |
| 1-1217 | | Consolidated Edison Company of New York, Inc. | | New York | | 13-5009340 |
| | | 4 Irving Place, | New York, | New York | 10003 | | | | |
| | | (212) | 460-4600 | | | | | | |
Securities Registered Pursuant to Section 12(b) of the Act:
|
| | | | |
| Title of each class | | Trading Symbol | | Name of each exchange on which registered |
| Consolidated Edison, Inc., | | ED | | New York Stock Exchange |
| Common Shares ($.10 par value) | | | | |
Indicate by check mark whether the registrant (1) has filed all reports required to be filed by Section 13 or 15(d) of the Securities Exchange Act of 1934 during the preceding 12 months (or for such shorter period that the registrant was required to file such reports), and (2) has been subject to such filing requirements for the past 90 days.
|
| | | |
| Consolidated Edison, Inc. (Con Edison) | Yes | ☒ | No ☐ |
| Consolidated Edison Company of New York, Inc. (CECONY) | Yes | ☒ | No ☐ |
Indicate by check mark whether the registrant has submitted electronically every Interactive Data File required to be submitted pursuant to Rule 405 of Regulation S-T (§232.405 of this chapter) during the preceding 12 months (or for such shorter period that the registrant was required to submit such files).
|
| | | |
| Con Edison | Yes | ☒ | No ☐ |
| CECONY | Yes | ☒ | No ☐ |
Indicate by check mark whether the registrant is a large accelerated filer, an accelerated filer, a non-accelerated filer, smaller reporting company, or an emerging growth company. See the definitions of “large accelerated filer”, “accelerated filer,” “smaller reporting company,” and "emerging growth company" in Rule 12b-2 of the Exchange Act.
|
| | | | | | |
| Con Edison |
| Large accelerated filer | ☒ | | Accelerated filer ☐
| | Non-accelerated filer | ☐ |
| Smaller reporting company | ☐ | Emerging growth company | ☐ | | |
| CECONY |
Large accelerated filer | ☐ | | Accelerated filer ☐ | | Non-accelerated filer | ☒ |
Smaller reporting company | ☐ | Emerging growth company | ☐ | | |
If an emerging growth company, indicate by check mark if the registrant has elected not to use the extended transition period for complying with any new or revised financial accounting standards provided pursuant to Section 13(a) of the Exchange Act. ¨
Indicate by check mark whether the registrant is a shell company (as defined in Rule 12b-2 of the Exchange Act).
|
| | | | |
| Con Edison | Yes | ☐ | No | ☒ |
| CECONY | Yes | ☐ | No | ☒ |
As of July 31, 2019,April 30, 2020, Con Edison had outstanding 332,144,207334,102,042 Common Shares ($.10 par value). All of the outstanding common equity of CECONY is held by Con Edison.
Filing Format
This Quarterly Report on Form 10-Q is a combined report being filed separately by two different registrants: Consolidated Edison, Inc. (Con Edison) and Consolidated Edison Company of New York, Inc. (CECONY). CECONY is a wholly-owned subsidiary of Con Edison and, as such, the information in this report about CECONY also applies to Con Edison. As used in this report, the term the “Companies” refers to Con Edison and CECONY. However, CECONY makes no representation as to the information contained in this report relating to Con Edison or the subsidiaries of Con Edison other than itself.
Glossary of Terms
The following is a glossary of abbreviations or acronyms that are used in the Companies’ SEC reports:
|
| | |
| Con Edison Companies |
| Con Edison | | Consolidated Edison, Inc. |
| CECONY | | Consolidated Edison Company of New York, Inc. |
| Clean Energy Businesses | | Con Edison Clean Energy Businesses, Inc., together with its subsidiaries |
Con Edison Development | | Consolidated Edison Development, Inc. |
Con Edison Energy | | Consolidated Edison Energy, Inc. |
Con Edison Solutions | | Consolidated Edison Solutions, Inc. |
Con Edison Transmission | | Con Edison Transmission, Inc., together with its subsidiaries |
| CET Electric | | Consolidated Edison Transmission, LLC |
| CET Gas | | Con Edison Gas Pipeline and Storage, LLC |
| O&R | | Orange and Rockland Utilities, Inc. |
| RECO | | Rockland Electric Company |
| The Companies | | Con Edison and CECONY |
| The Utilities | | CECONY and O&R |
| |
| Regulatory Agencies, Government Agencies and Other Organizations |
| CPUC | | California Public Utilities Commission |
| EPA | | U.S. Environmental Protection Agency |
| FASB | | Financial Accounting Standards Board |
| FERC | | Federal Energy Regulatory Commission |
| IASB | | International Accounting Standards Board |
| IRS | | Internal Revenue Service |
| NERC | | North American Electric Reliability Corporation |
| NJBPU | | New Jersey Board of Public Utilities |
| NJDEP | | New Jersey Department of Environmental Protection |
| NYISO | | New York Independent System Operator |
| NYPA | | New York Power Authority |
| NYSDEC | | New York State Department of Environmental Conservation |
| NYSERDA | | New York State Energy Research and Development Authority |
| NYSPSC | | New York State Public Service Commission |
| NYSRC | | New York State Reliability Council, LLC |
| PHMSA | | U.S. Department of Transportation’s Pipeline and Hazardous Materials Safety Administration |
| PJM | | PJM Interconnection LLC |
| SEC | | U.S. Securities and Exchange Commission |
| | |
| Accounting | | |
| AFUDC | | Allowance for funds used during construction |
| ASU | | Accounting Standards Update |
| GAAP | | Generally Accepted Accounting Principles in the United States of America |
| HLBV | | Hypothetical liquidation at book value |
| OCI | | Other Comprehensive Income |
| VIE | | Variable Interest Entity |
|
| | |
| Environmental | | |
| CO2 | | Carbon dioxide |
| GHG | | Greenhouse gases |
| MGP Sites | | Manufactured gas plant sites |
| PCBs | | Polychlorinated biphenyls |
| PRP | | Potentially responsible party |
| RGGI | | Regional Greenhouse Gas Initiative |
| Superfund | | Federal Comprehensive Environmental Response, Compensation and Liability Act of 1980 and similar state statutes |
| | | |
| Units of Measure | | |
| AC | | Alternating current |
| Bcf | | Billion cubic feet |
| Dt | | Dekatherms |
| kV | | Kilovolt |
| kWh | | Kilowatt-hour |
| MDt | | Thousand dekatherms |
| MMlb | | Million pounds |
| MVA | | Megavolt ampere |
| MW | | Megawatt or thousand kilowatts |
| MWh | | Megawatt hour |
| | | |
| Other | | |
| AMI | | Advanced metering infrastructure |
| CARES Act | | Coronavirus Aid, Relief, and Economic Security Act, as enacted on March 27, 2020 |
| COSO | | Committee of Sponsoring Organizations of the Treadway Commission |
| COVID-19 | | Coronavirus Disease 2019 |
| DER | | Distributed energy resources |
| Fitch | | Fitch Ratings |
| First Quarter Form 10-Q | | The Companies' combined Quarterly Report on Form 10-Q for the quarterly period ended March 31 of the current year |
| Form 10-K | | The Companies’ combined Annual Report on Form 10-K for the year ended December 31, 20182019 |
| LTIP | | Long Term Incentive Plan |
| Moody’s | | Moody’s Investors Service |
| REV | | Reforming the Energy Vision |
| S&P | | S&P Global Ratings |
| TCJA | | The federal Tax Cuts and Jobs Act of 2017, as enacted on December 22, 2017 |
| VaR | | Value-at-Risk |
TABLE OF CONTENTS
|
| | |
| | PAGE |
| |
| ITEM 1 | Financial Statements (Unaudited) | |
| | Con Edison | |
| | | |
| | | |
| | | |
| | | |
| | | |
| | CECONY | |
| | | |
| | | |
| | | |
| | | |
| | | |
| | | |
| ITEM 2 | | |
| ITEM 3 | | |
| ITEM 4 | | |
| |
| ITEM 1 | | |
| ITEM 1A | | |
| ITEM 6 | | |
| | | |
FORWARD-LOOKING STATEMENTS
This report includes forward-looking statements intended to qualify for the safe-harbor provisions of Section 27A of the Securities Act of 1933, as amended, and Section 21E of the Securities Exchange Act of 1934, as amended. Forward-looking statements are statements of future expectation and not facts. Words such as “forecasts,” “expects,” “estimates,” “anticipates,” “intends,” “believes,” “plans,” “will” and similar expressions identify forward-looking statements. Forward-looking statements are based on information available at the time the statements are made, and accordingly speak only as of that time. Actual results or developments might differ materially from those included in the forward-looking statements because of various factors including, but not limited to:
the Companies are extensively regulated and are subject to penalties;
the Utilities’ rate plans may not provide a reasonable return;
the Companies may be adversely affected by changes to the Utilities’ rate plans;
the intentional misconduct of employees or contractors could adversely affect the Companies;
the failure of, or damage to, the Companies’ facilities could adversely affect the Companies;
a cyber attack could adversely affect the Companies;
the Companies are exposed to risks from the environmental consequences of their operations;operations, including increased costs related to climate change;
a disruption in the wholesale energy markets or failure by an energy supplier or customer could adversely affect the Companies;
the Companies have substantial unfunded pension and other postretirement benefit liabilities;
Con Edison’s ability to pay dividends or interest depends on dividends from its subsidiaries;
the Companies require access to capital markets to satisfy funding requirements;
changes to tax laws could adversely affect the Companies;
the Companies’ strategies may not be effective to address changes in the external business environment;
the Companies face risks related to health epidemics and other outbreaks, including the COVID-19 pandemic; and
the Companies also face other risks that are beyond their control.
The Companies assume no obligation to update forward-looking statements.
Consolidated Edison, Inc.
CONSOLIDATED INCOME STATEMENT (UNAUDITED)
| | | | For the Three Months Ended June 30, | For the Six Months Ended June 30, | For the Three Months Ended March 31, |
| (Millions of Dollars/Except Share Data) | 2019 | 2018 |
| 2019 | 2018 |
| 2020 | 2019 |
| OPERATING REVENUES | | | | | |
| Electric | $1,971 | $1,951 | $3,912 | $3,828 | $1,906 | $1,941 |
| Gas | 449 | 489 | 1,484 | 1,428 | 931 | 1,034 |
| Steam | 90 | 96 | 411 | 410 | 250 | 321 |
| Non-utility | 234 | 160 | 451 | 394 | 147 | 218 |
| TOTAL OPERATING REVENUES | 2,744 | 2,696 | 6,258 | 6,060 | 3,234 | 3,514 |
| OPERATING EXPENSES | | | | | |
| Purchased power | 352 | 388 | 719 | 742 | 308 | 368 |
| Fuel | 26 | 38 | 133 | 162 | 78 | 106 |
| Gas purchased for resale | 131 | 194 | 573 | 572 | 232 | 442 |
| Other operations and maintenance | 781 | 756 | 1,575 | 1,592 | 700 | 794 |
| Depreciation and amortization | 418 | 354 | 831 | 702 | 470 | 413 |
| Taxes, other than income taxes | 578 | 540 | 1,183 | 1,110 | 638 | 605 |
| TOTAL OPERATING EXPENSES | 2,286 | 2,270 | 5,014 | 4,880 | 2,426 | 2,728 |
| OPERATING INCOME | 458 | 426 | 1,244 | 1,180 | 808 | 786 |
| OTHER INCOME (DEDUCTIONS) | | | | | | |
| Investment income | 22 | 36 | 45 | 57 | 26 | 24 |
| Other income | 4 | 6 | 15 | 11 | 2 | 11 |
| Allowance for equity funds used during construction | 4 | 3 | 7 | 7 | 5 | 3 |
| Other deductions | (27) | (48) | (50) | (92) | (72) | (24) |
| TOTAL OTHER INCOME (DEDUCTIONS) | 3 | (3) | 17 | (17) | (39) | 14 |
| INCOME BEFORE INTEREST AND INCOME TAX EXPENSE | 461 | 423 | 1,261 | 1,163 | 769 | 800 |
| INTEREST EXPENSE | | | | | |
| Interest on long-term debt | 219 | 190 | 440 | 380 | 224 | 221 |
| Other interest | 47 | 9 | 77 | 16 | 101 | 29 |
| Allowance for borrowed funds used during construction | (3) | (2) | (7) | (5) | (3) |
| NET INTEREST EXPENSE | 263 | 197 | 510 | 391 | 322 | 247 |
| INCOME BEFORE INCOME TAX EXPENSE | 198 | 226 | 751 | 772 | 447 | 553 |
| INCOME TAX EXPENSE | 19 | 38 | 127 | 156 | 55 | 108 |
| NET INCOME | $179 | $188 | $624 | $616 | $392 | $445 |
| Income attributable to non-controlling interest | 27 | — |
| 48 | — |
| 17 | 21 |
| NET INCOME FOR COMMON STOCK | $152 | $188 | $576 | $616 | $375 | $424 |
| Net income per common share—basic | $0.46 | $0.60 | $1.77 | $1.98 | $1.13 | $1.31 |
| Net income per common share—diluted | $0.46 | $0.60 | $1.77 | $1.98 | $1.12 | $1.31 |
| AVERAGE NUMBER OF SHARES OUTSTANDING—BASIC (IN MILLIONS) | 328.3 | 310.8 | 325.2 | 310.6 | 333.6 | 322.5 |
| AVERAGE NUMBER OF SHARES OUTSTANDING—DILUTED (IN MILLIONS) | 329.2 | 311.9 | 326.1 | 311.7 | 334.6 | 323.4 |
The accompanying notes are an integral part of these financial statements.
Consolidated Edison, Inc.
CONSOLIDATED STATEMENT OF COMPREHENSIVE INCOME (UNAUDITED)
| | | | Three Months Ended June 30, | Six Months Ended June 30, | Three Months Ended March 31, |
| (Millions of Dollars) | 2019 | 2018 |
| 2019 | 2018 |
| 2020 | 2019 |
| NET INCOME | $179 | $188 | $624 | $616 | $392 | $445 |
| INCOME ATTRIBUTABLE TO NON-CONTROLLING INTEREST | (27) | — |
| (48) | — |
| (17) | (21) |
| OTHER COMPREHENSIVE INCOME, NET OF TAXES | | |
|
| |
| Pension and other postretirement benefit plan liability adjustments, net of taxes | 1 | 2 | 5 | 6 | 5 | 4 |
| TOTAL OTHER COMPREHENSIVE INCOME, NET OF TAXES | 1 | 2 | 5 | 6 | 5 | 4 |
| COMPREHENSIVE INCOME | $153 | $190 | $581 | $622 | $380 | $428 |
The accompanying notes are an integral part of these financial statements.
Consolidated Edison, Inc.
CONSOLIDATED STATEMENT OF CASH FLOWS (UNAUDITED)
| | | For the Six Months Ended June 30, | | For the Three Months Ended March 31, | |
| (Millions of Dollars) | 2019 | 2018 |
| 2020 |
| 2019 |
|
| OPERATING ACTIVITIES | | | |
| Net income | $624 | $616 | $392 | $445 |
| PRINCIPAL NON-CASH CHARGES/(CREDITS) TO INCOME | | | |
| Depreciation and amortization | 831 | 702 | 470 | 413 |
| Deferred income taxes | 126 | 155 | 60 | 108 |
| Rate case amortization and accruals | (59) | (56) | (11) | (29) |
| Common equity component of allowance for funds used during construction | (7) | (7) | (5) | (3) |
| Net derivative gains | 31 | 2 | |
| Net derivative losses | | 83 | 10 |
| Unbilled revenue and net unbilled revenue deferrals | (4) | 113 | 51 | 11 |
| Gain on sale of assets | (5) | — |
| — |
| (5) |
| Other non-cash items, net | (17) | (55 | ) | 45 | (4) |
| CHANGES IN ASSETS AND LIABILITIES | | | |
| Accounts receivable – customers | 165 | 5 | (87) | (43) |
| Materials and supplies, including fuel oil and gas in storage | 14 | 16 | 26 | 31 |
| Revenue decoupling mechanism | (127) | — |
| |
| Revenue decoupling mechanism receivable | | (32) | (55) |
| Other receivables and other current assets | 125 | (68) | 28 | 19 |
| Taxes receivable | $19 | 49 | (1) | — |
|
| Prepayments | (35) | (36) | (479) | (448) |
| Accounts payable | (156) | (61) | (156) | (108) |
| Pensions and retiree benefits obligations, net | 168 | 171 | 4 | 93 |
| Pensions and retiree benefits contributions | (78) | (368) | (4) |
| Accrued taxes | (15) | (63) | (45) | (19) |
| Accrued interest | 25 | (4) | 85 | 97 |
| Superfund and environmental remediation costs, net | (7) | (6) | (3) | (1) |
| Distributions from equity investments | 27 | 54 | 11 | 14 |
| System benefit charge | (1) | 94 | (19) | 6 |
| Deferred charges, noncurrent assets and other regulatory assets | (213) | (233) | (38) | (34) |
| Deferred credits and other regulatory liabilities | 162 | 244 | 116 | 94 |
| Other current and noncurrent liabilities | (55) | (224) | (79) | (124) |
| NET CASH FLOWS FROM OPERATING ACTIVITIES | 1,538 | 1,040 | 412 | 464 |
| INVESTING ACTIVITIES | | | |
| Utility construction expenditures | (1,613) | (1,602) | (767) | (783) |
| Cost of removal less salvage | (142) | (121) | (68) | (72) |
| Non-utility construction expenditures | (92) | (109) | (130) | (48) |
| Investments in electric and gas transmission projects | (88) | (51) | (8) | (38) |
| Proceeds from sale of assets | 48 | — |
| — |
| 48 |
| Other investing activities | 11 | 17 | 5 |
| NET CASH FLOWS USED IN INVESTING ACTIVITIES | (1,876) | (1,866) | (968) | (888) |
| FINANCING ACTIVITIES | | | |
| Net issuance/(payment) of short-term debt | (1,405) | 292 | |
| Net payment of short-term debt | | (484) | (1,131) |
| Issuance of long-term debt | 1,989 | 1,640 | 1,600 | 825 |
| Retirement of long-term debt | (657) | (619) | (38) | (11) |
| Debt issuance costs | (17) | (16) | (22) | (1) |
| Common stock dividends | (455) | (420) | (243) | (226) |
| Issuance of common shares - public offering | 825 | — |
| 88 | 425 |
| Issuance of common shares for stock plans | 27 | 26 | 14 | 13 |
| Distribution to noncontrolling interest | (5) | — |
| (2) |
| NET CASH FLOWS FROM FINANCING ACTIVITIES | 302 | 903 | |
| NET CASH FLOWS FROM (USED IN) FINANCING ACTIVITIES | | 913 | (108) |
| CASH, TEMPORARY CASH INVESTMENTS, AND RESTRICTED CASH: | | | |
| NET CHANGE FOR THE PERIOD | (36) | 77 | 357 | (532) |
| BALANCE AT BEGINNING OF PERIOD | 1,006 | 844 | 1,217 | 1,006 |
| BALANCE AT END OF PERIOD | $970 | $921 | $1,574 | $474 |
| SUPPLEMENTAL DISCLOSURE OF CASH INFORMATION | | | |
| Cash paid/(received) during the period for: | | | |
| Cash paid during the period for: | | |
| Interest | $422 | $389 | $143 | $130 |
| Income taxes | $(15) | $(2) | $2 | $3 |
| SUPPLEMENTAL DISCLOSURE OF NON-CASH INFORMATION | | | |
| Construction expenditures in accounts payable | $332 | $333 | $343 | $300 |
| Issuance of common shares for dividend reinvestment | $24 | $24 | $12 |
| Software licenses acquired but unpaid as of end of period | $80 | $94 | $80 | $100 |
| Equipment acquired but unpaid as of end of period | | $33 | — |
|
The accompanying notes are an integral part of these financial statements.
Consolidated Edison, Inc.
CONSOLIDATED BALANCE SHEET (UNAUDITED)
| | | (Millions of Dollars) | June 30,
2019 | December 31,
2018 |
| March 31,
2020 | December 31,
2019 |
| ASSETS | | | |
| CURRENT ASSETS | | | |
| Cash and temporary cash investments | $831 | $895 | $1,395 | $981 |
| Accounts receivable – customers, less allowance for uncollectible accounts of $65 and $62 in 2019 and 2018, respectively | 1,099 | 1,267 | |
| Other receivables, less allowance for uncollectible accounts of $4 and $5 in 2019 and 2018, respectively | 148 | 285 | |
| Accounts receivable – customers, less allowance for uncollectible accounts of $75 and $70 in 2020 and 2019, respectively | | 1,318 | 1,236 |
| Other receivables, less allowance for uncollectible accounts of $5 and $4 in 2020 and 2019, respectively | | 188 | 184 |
| Taxes receivable | 30 | 49 | 21 | 20 |
| Accrued unbilled revenue | 550 | 514 | 443 | 599 |
| Fuel oil, gas in storage, materials and supplies, at average cost | 344 | 358 | 326 | 352 |
| Prepayments | 222 | 187 | 739 | 260 |
| Regulatory assets | 97 | 76 | 143 | 128 |
| Restricted cash | 139 | 111 | 179 | 236 |
| Revenue decoupling mechanism receivable | 127 | — |
| |
| Revenue decoupling mechanism | | 108 | 76 |
| Other current assets | 120 | 122 | 166 | 200 |
| TOTAL CURRENT ASSETS | 3,707 | 3,864 | 5,026 | 4,272 |
| INVESTMENTS | 1,899 | 1,766 | 2,011 | 2,065 |
| UTILITY PLANT, AT ORIGINAL COST | | | |
| Electric | 31,245 | 30,378 | 32,186 | 31,866 |
| Gas | 9,614 | 9,100 | 10,300 | 10,107 |
| Steam | 2,580 | 2,562 | 2,625 | 2,601 |
| General | 3,428 | 3,331 | 3,606 | 3,562 |
| TOTAL | 46,867 | 45,371 | 48,717 | 48,136 |
| Less: Accumulated depreciation | 10,149 | 9,769 | 10,530 | 10,322 |
| Net | 36,718 | 35,602 | 38,187 | 37,814 |
| Construction work in progress | 1,898 | 1,978 | 2,005 | 1,937 |
| NET UTILITY PLANT | 38,616 | 37,580 | 40,192 | 39,751 |
| NON-UTILITY PLANT | | | |
| Non-utility property, less accumulated depreciation of $329 and $275 in 2019 and 2018, respectively | 3,961 | 4,000 | |
| Non-utility property, less accumulated depreciation of $423 and $391 in 2020 and 2019, respectively | | 3,797 | 3,829 |
| Construction work in progress | 168 | 169 | 446 | 309 |
| NET PLANT | 42,745 | 41,749 | 44,435 | 43,889 |
| OTHER NONCURRENT ASSETS | | | |
| Goodwill | 440 | 440 | 446 |
| Intangible assets, less accumulated amortization of $79 and $29 in 2019 and 2018, respectively | 1,605 | 1,654 | |
| Intangible assets, less accumulated amortization of $152 and $126 in 2020 and 2019, respectively | | 1,532 | 1,557 |
| Regulatory assets | 4,237 | 4,294 | 4,732 | 4,859 |
| Operating lease right-of-use asset | 842 | — |
| 848 | 857 |
| Other deferred charges and noncurrent assets | 127 | 153 | 129 | 134 |
| TOTAL OTHER NONCURRENT ASSETS | 7,251 | 6,541 | 7,687 | 7,853 |
| TOTAL ASSETS | $55,602 | $53,920 | $59,159 | $58,079 |
The accompanying notes are an integral part of these financial statements.
Consolidated Edison, Inc.
CONSOLIDATED BALANCE SHEET (UNAUDITED)
| | | (Millions of Dollars) | June 30,
2019 |
| December 31,
2018 |
| March 31,
2020 | December 31,
2019 |
| LIABILITIES AND SHAREHOLDERS’ EQUITY | | |
| CURRENT LIABILITIES | | |
| Long-term debt due within one year | $1,972 | $650 | $2,093 | $1,446 |
| Term loan | — |
| 825 | |
| Notes payable | 1,161 | 1,741 | 1,208 | 1,692 |
| Accounts payable | 994 | 1,187 | 1,015 | 1,164 |
| Customer deposits | 350 | 351 | 344 | 346 |
| Accrued taxes | 47 | 61 | 31 | 76 |
| Accrued interest | 154 | 129 | 238 | 153 |
| Accrued wages | 111 | 109 | 116 | 102 |
| Fair value of derivative liabilities | 68 | 50 | 153 | 123 |
| Regulatory liabilities | 104 | 114 | 123 | 102 |
| System benefit charge | 626 | 627 | 628 | 647 |
| Operating lease liabilities | 55 | — |
| 77 | 65 |
| Other current liabilities | 327 | 363 | 285 | 371 |
| TOTAL CURRENT LIABILITIES | 5,969 | 6,207 | 6,311 | 6,287 |
| NONCURRENT LIABILITIES | | |
| Provision for injuries and damages | 144 | 146 | 129 | 130 |
| Pensions and retiree benefits | 1,120 | 1,228 | 1,329 | 1,516 |
| Superfund and other environmental costs | 770 | 779 | 737 | 734 |
| Asset retirement obligations | 427 | 450 | 429 | 425 |
| Fair value of derivative liabilities | 130 | 16 | 228 | 105 |
| Deferred income taxes and unamortized investment tax credits | 6,011 | 5,820 | 6,348 | 6,227 |
| Operating lease liabilities | 821 | — |
| 799 | 809 |
| Regulatory liabilities | 4,604 | 4,641 | 4,689 | 4,827 |
| Other deferred credits and noncurrent liabilities | 245 | 299 | 270 | 279 |
| TOTAL NONCURRENT LIABILITIES | 14,272 | 13,379 | 14,958 | 15,052 |
| LONG-TERM DEBT | 17,496 | 17,495 | 19,423 | 18,527 |
| EQUITY | | |
| Common shareholders’ equity | 17,709 | 16,726 | 18,261 | 18,022 |
| Noncontrolling interest | 156 | 113 | 206 | 191 |
| TOTAL EQUITY (See Statement of Equity) | 17,865 | 16,839 | 18,467 | 18,213 |
| TOTAL LIABILITIES AND EQUITY | $55,602 | $53,920 | $59,159 | $58,079 |
The accompanying notes are an integral part of these financial statements.
Consolidated Edison, Inc.
CONSOLIDATED STATEMENT OF EQUITY (UNAUDITED)
|
| | | | | | | | | | |
| (In Millions, except for dividends per share) | Common Stock | Additional
Paid-In
Capital | Retained
Earnings | Treasury Stock | Capital
Stock
Expense | Accumulated
Other
Comprehensive
Income/(Loss) | Non- controlling
Interest | Total |
| Shares | Amount | Shares | Amount |
| BALANCE AS OF DECEMBER 31, 2018 | 321 | $34 | $7,117 | $10,728 | 23 | $(1,038) | $(99) | $(16) | $113 | $16,839 |
| Net income |
|
|
| 424 |
|
|
|
| 21 | 445 |
| Common stock dividends ($0.74 per share) |
|
|
| (237) |
|
|
|
|
| (237) |
| Issuance of common shares – public offering | 6 |
| 433 |
|
|
| (8) |
|
| 425 |
| Issuance of common shares for stock plans |
|
| 27 |
|
|
|
|
|
| 27 |
| Other comprehensive income |
|
|
|
|
|
|
| 4 |
| 4 |
| Distributions to noncontrolling interest |
|
|
|
|
|
|
|
| (2) | (2) |
| BALANCE AS OF MARCH 31, 2019 | 327 | $34 | $7,577 | $10,915 | 23 | $(1,038) | $(107) | $(12) | $132 | $17,501 |
| | | | | | | | | | | |
| BALANCE AS OF BALANCE AS OF DECEMBER 31, 2019 | 333 | $35 | $8,054 | $11,100 | 23 | $(1,038) | $(110) | $(19) | $191 | $18,213 |
| Net income |
|
|
| 375 |
|
|
|
| 17 | 392 |
| Common stock dividends ($0.76 per share) |
|
|
| (255) |
|
|
|
|
| (255) |
| Issuance of common shares - public offering | 1 |
| $88 |
|
|
|
|
|
| 88 |
| Issuance of common shares for stock plans |
|
| 26 |
|
|
|
|
|
| 26 |
| Other comprehensive income |
|
|
|
|
|
|
| 5 |
| 5 |
| Distributions to noncontrolling interest |
|
|
|
|
|
|
|
| (2) | (2) |
| BALANCE AS OF MARCH 31, 2020 | 334 | $35 | $8,168 | $11,220 | 23 | $(1,038) | $(110) | $(14) | $206 | $18,467 |
|
| | | | | | | | | | | | |
| (In Millions, except for dividends per share) | Common Stock | Additional
Paid-In
Capital | Retained
Earnings | Treasury Stock | Capital
Stock
Expense | Accumulated
Other
Comprehensive
Income/(Loss) | Non- controlling
Interest | Total |
| Shares | Amount | Shares | Amount |
| BALANCE AS OF DECEMBER 31, 2017 | 310 | $34 | $6,298 | $10,235 | 23 | $(1,038) | $(85) | $(26) | $7 | $15,425 |
| Net income |
|
|
| 428 |
|
|
|
|
| 428 |
| Common stock dividends ($0.715 per share) |
|
|
| (221) |
|
|
|
|
| (221) |
| Issuance of common shares for stock plans | 1 |
| 25 |
|
|
|
|
|
| 25 |
| Other comprehensive income |
|
|
|
|
|
|
| 4 |
| 4 |
| Noncontrolling interest |
|
|
|
|
|
|
|
|
| — |
|
| BALANCE AS OF MARCH 31, 2018 | 311 | $34 | $6,323 | $10,442 | 23 | $(1,038) | $(85) | $(22) | $7 | $15,661 |
| Net income |
|
|
| 188 |
|
|
|
|
| 188 |
| Common stock dividends ($0.715 per share) |
|
|
| (223) |
|
|
|
|
| (223) |
| Issuance of common shares for stock plans |
|
| 27 |
|
|
|
|
|
| 27 |
| Other comprehensive income |
|
|
|
|
|
|
| 2 |
| 2 |
| Noncontrolling interest |
|
|
|
|
|
|
|
|
| — |
|
| BALANCE AS OF JUNE 30, 2018 | 311 | $34 | $6,350 | $10,407 | 23 | $(1,038) | $(85) | $(20) | $7 | $15,655 |
| | | | | | | | | | | |
| BALANCE AS OF DECEMBER 31, 2018 | 321 | $34 | $7,117 | $10,728 | 23 | $(1,038) | $(99) | $(16) | $113 | $16,839 |
| Net income |
|
|
| 424 |
|
|
|
| 21 | 445 |
| Common stock dividends ($0.74 per share) |
|
|
| (237) |
|
|
|
|
| (237) |
| Issuance of common shares – public offering | 6 |
| 433 |
|
|
| (8) |
|
| 425 |
| Issuance of common shares for stock plans |
|
| 27 |
|
|
|
|
|
| 27 |
| Other comprehensive income |
|
|
|
|
|
|
| 4 |
| 4 |
| Distributions to noncontrolling interest |
|
|
|
|
|
|
|
| (2) | (2) |
| BALANCE AS OF MARCH 31, 2019 | 327 | $34 | $7,577 | $10,915 | 23 | $(1,038) | $(107) | $(12) | $132 | $17,501 |
| Net income |
|
|
| 152 |
|
|
|
| 27 | 179 |
| Common stock dividends ($0.74 per share) |
|
|
| (242) |
|
|
|
|
| (242) |
| Issuance of common shares – public offering | 5 | 1 | 402 |
|
|
| (3) |
|
| 400 |
| Issuance of common shares for stock plans |
|
| 29 |
|
|
|
|
|
| 29 |
| Other comprehensive income |
|
|
|
|
|
|
| 1 |
|
| 1 |
| Distributions to noncontrolling interest |
|
|
|
|
|
|
|
| (3) | (3) |
| BALANCE AS OF JUNE 30, 2019 | 332 | $35 | $8,008 | $10,825 | 23 | $(1,038) | $(110) | $(11) | $156 | $17,865 |
The accompanying notes are an integral part of these financial statements.
Consolidated Edison Company of New York, Inc.
CONSOLIDATED INCOME STATEMENT (UNAUDITED)
| | | | For the Three Months Ended June 30, | For the Six Months Ended June 30, | For the Three Months Ended March 31, |
| (Millions of Dollars) | 2019 | 2018 | 2019 | 2018 | 2020 | 2019 |
| OPERATING REVENUES | | |
| Electric | $1,833 | $1,807 | $3,630 | $3,536 | $1,770 | $1,797 |
| Gas | 408 | 435 | 1,330 | 1,276 | 834 | 921 |
| Steam | 90 | 96 | 411 | 410 | 250 | 321 |
| TOTAL OPERATING REVENUES | 2,331 | 2,338 | 5,371 | 5,222 | 2,854 | 3,039 |
| OPERATING EXPENSES | | |
| Purchased power | 313 | 343 | 635 | 645 | 273 | 322 |
| Fuel | 26 | 38 | 133 | 162 | 78 | 106 |
| Gas purchased for resale | 76 | 118 | 393 | 391 | 195 | 317 |
| Other operations and maintenance | 651 | 629 | 1,311 | 1,260 | 569 | 659 |
| Depreciation and amortization | 339 | 316 | 673 | 626 | 390 | 334 |
| Taxes, other than income taxes | 550 | 512 | 1,125 | 1,051 | 607 | 575 |
| TOTAL OPERATING EXPENSES | 1,955 | 1,956 | 4,270 | 4,135 | 2,112 | 2,313 |
| OPERATING INCOME | 376 | 382 | 1,101 | 1,087 | 742 | 726 |
| OTHER INCOME (DEDUCTIONS) | | |
| Investment and other income | 4 | 13 | 8 | 2 | 9 |
| Allowance for equity funds used during construction | 3 | 6 | 4 | 3 |
| Other deductions | (22) | (42) | (41) | (81) | (67) | (19) |
| TOTAL OTHER INCOME (DEDUCTIONS) | (15) | (35) | (22) | (67) | (61) | (7) |
| INCOME BEFORE INTEREST AND INCOME TAX EXPENSE | 361 | 347 | 1,079 | 1,020 | 681 | 719 |
| INTEREST EXPENSE | | |
| Interest on long-term debt | 165 | 162 | 334 | 324 | 172 | 169 |
| Other interest | 19 | 7 | 36 | 12 | 11 | 17 |
| Allowance for borrowed funds used during construction | (2) | (6) | (4) | (3) |
| NET INTEREST EXPENSE | 182 | 167 | 364 | 332 | 180 | 183 |
| INCOME BEFORE INCOME TAX EXPENSE | 179 | 180 | 715 | 688 | 501 | 536 |
| INCOME TAX EXPENSE | 27 | 31 | 151 | 150 | 95 | 124 |
| NET INCOME | $152 | $149 | $564 | $538 | $406 | $412 |
The accompanying notes are an integral part of these financial statements.
Consolidated Edison Company of New York, Inc.
CONSOLIDATED STATEMENT OF COMPREHENSIVE INCOME (UNAUDITED)
| | | | Three Months Ended June 30, | Six Months Ended June 30, | Three Months Ended March 31, |
| (Millions of Dollars) | 2019 |
| 2018 | 2019 |
| 2018 | 2020 | 2019 |
|
| NET INCOME | $152 | $149 | $564 | $538 | $406 | $412 |
| Pension and other postretirement benefit plan liability adjustments, net of taxes | — |
| 1 | — |
| 1 | 1 | — |
|
| TOTAL OTHER COMPREHENSIVE INCOME, NET OF TAXES | — |
| 1 | — |
| 1 | 1 | — |
|
| COMPREHENSIVE INCOME | $152 | $150 | $564 | $539 | $407 | $412 |
The accompanying notes are an integral part of these financial statements.
Consolidated Edison Company of New York, Inc.
CONSOLIDATED STATEMENT OF CASH FLOWS (UNAUDITED)
| | | For the Six Months Ended June 30, | | For the Three Months Ended March 31, | |
| (Millions of Dollars) | 2019 |
| 2018 |
| 2020 |
| 2019 |
|
| OPERATING ACTIVITIES | | |
| Net income | $564 | $538 | $406 | $412 |
| PRINCIPAL NON-CASH CHARGES/(CREDITS) TO INCOME | | |
| Depreciation and amortization | 673 | 626 | 390 | 334 |
| Deferred income taxes | 90 | 149 | 94 | 122 |
| Rate case amortization and accruals | (58) | (65) | (11) | (29) |
| Common equity component of allowance for funds used during construction | (6) | (4) | (3) |
| Unbilled revenue and net unbilled revenue deferrals | 21 | 36 | 41 | 19 |
| Gain on sale of assets | (5) | — |
| — |
| (5) |
| Other non-cash items, net | (10) | (13) | 35 | (11) |
| CHANGES IN ASSETS AND LIABILITIES | | |
| Accounts receivable – customers | 143 | 14 | (78) | (36) |
| Materials and supplies, including fuel oil and gas in storage | 17 | 10 | 20 | 24 |
| Revenue decoupling mechanism | (126) | — |
| (22) | (55) |
| Other receivables and other current assets | 115 | (74) | 25 | 31 |
| Accounts receivable from affiliated companies | 83 | (149) | (8) | (6) |
| Prepayments | (33) | (17) | (473) | (438) |
| Accounts payable | (140) | (71) | (115) | (75) |
| Accounts payable to affiliated companies | (2) | 9 | |
| Pensions and retiree benefits obligations, net | 157 | 3 | 87 |
| Pensions and retiree benefits contributions | (77) | (367) | (4) | (3) |
| Superfund and environmental remediation costs, net | (8) | (9) | (5) | (2) |
| Accrued taxes | (18) | (66) | (42) | (18) |
| Accrued taxes to affiliated companies | — |
| (72) | |
| Accrued interest | (2) | (1) | 75 | 72 |
| System benefit charge | — |
| 86 | (20) | 7 |
| Deferred charges, noncurrent assets and other regulatory assets | (216) | (164) | (39) | (47) |
| Deferred credits and other regulatory liabilities | 146 | 229 | 122 | 92 |
| Other current and noncurrent liabilities | (17) | (125) | (50) | (77) |
| NET CASH FLOWS FROM OPERATING ACTIVITIES | 1,291 | 655 | 340 | 395 |
| INVESTING ACTIVITIES | | |
| Utility construction expenditures | (1,501) | (1,509) | (719) | (728) |
| Cost of removal less salvage | (138) | (118) | (67) | (70) |
| Proceeds from sale of assets | 48 | — |
| — |
| 48 |
| NET CASH FLOWS USED IN INVESTING ACTIVITIES | (1,591) | (1,627) | (786) | (750) |
| FINANCING ACTIVITIES | | |
| Net issuance/(payment) of short-term debt | (343) | 400 | |
| Net payment of short-term debt | | (540) | (107) |
| Issuance of long-term debt | 700 | 1,640 | 1,600 | — |
|
| Retirement of long-term debt | (475) | (600) | |
| Debt issuance costs | (8) | (16) | (23) | (1) |
| Capital contribution by parent | 850 | 70 | 25 | 225 |
| Dividend to parent | (456) | (423) | (246) | (228) |
| NET CASH FLOWS FROM FINANCING ACTIVITIES | 268 | 1,071 | |
| CASH, TEMPORARY CASH INVESTMENTS, AND RESTRICTED CASH: | | |
| NET CASH FLOWS FROM (USED) FINANCING ACTIVITIES | | 816 | (111) |
| CASH AND TEMPORARY CASH INVESTMENTS | | |
| NET CHANGE FOR THE PERIOD | (32) | 99 | 370 | (466) |
| BALANCE AT BEGINNING OF PERIOD | 818 | 730 | 933 | 818 |
| BALANCE AT END OF PERIOD | $786 | $829 | $1,303 | $352 |
| SUPPLEMENTAL DISCLOSURE OF CASH INFORMATION | | |
| Cash paid/(received) during the period for: | | |
| Cash paid during the period for: | | |
| Interest | $340 | $324 | $97 | $101 |
| Income taxes | $(20) | $227 | $12 | $8 |
| SUPPLEMENTAL DISCLOSURE OF NON-CASH INFORMATION | | |
| Construction expenditures in accounts payable | $297 | $284 | $292 | $267 |
| Software licenses acquired but unpaid as of end of period | $76 | $89 | $76 | $95 |
| Equipment acquired but unpaid as of end of period | | $33 | — |
|
The accompanying notes are an integral part of these financial statements.
Consolidated Edison Company of New York, Inc.
CONSOLIDATED BALANCE SHEET (UNAUDITED)
| | | (Millions of Dollars) | June 30,
2019 | December 31,
2018 |
| March 31,
2020 | December 31,
2019 |
| ASSETS | | | |
| CURRENT ASSETS | | | |
| Cash and temporary cash investments | $786 | $818 | $1,303 | $933 |
| Accounts receivable – customers, less allowance for uncollectible accounts of $60 and $57 in 2019 and 2018, respectively | 1,016 | 1,163 | |
| Other receivables, less allowance for uncollectible accounts of $3 in 2019 and 2018 | 89 | 211 | |
| Taxes receivable | 5 | 5 | |
| Accounts receivable – customers, less allowance for uncollectible accounts of $70 and $65 in 2020 and 2019, respectively | | 1,226 | 1,153 |
| Other receivables, less allowance for uncollectible accounts of $3 in 2020 and 2019 | | 118 | 120 |
| Accrued unbilled revenue | 403 | 392 | 331 | 477 |
| Accounts receivable from affiliated companies | 131 | 214 | 81 | 73 |
| Fuel oil, gas in storage, materials and supplies, at average cost | 287 | 304 | 273 | 293 |
| Prepayments | 150 | 117 | 651 | 178 |
| Regulatory assets | 82 | 64 | 125 | 113 |
| Revenue decoupling mechanism receivable | 127 | — |
| 98 | 76 |
| Other current assets | 67 | 69 | 100 | 127 |
| TOTAL CURRENT ASSETS | 3,143 | 3,357 | 4,306 | 3,543 |
| INVESTMENTS | 422 | 385 | 417 | 461 |
| UTILITY PLANT, AT ORIGINAL COST | | | |
| Electric | 29,416 | 28,595 | 30,292 | 29,989 |
| Gas | 8,762 | 8,295 | 9,411 | 9,229 |
| Steam | 2,580 | 2,562 | 2,625 | 2,601 |
| General | 3,140 | 3,056 | 3,314 | 3,271 |
| TOTAL | 43,898 | 42,508 | 45,642 | 45,090 |
| Less: Accumulated depreciation | 9,333 | 8,988 | 9,682 | 9,490 |
| Net | 34,565 | 33,520 | 35,960 | 35,600 |
| Construction work in progress | 1,780 | 1,850 | 1,874 | 1,812 |
| NET UTILITY PLANT | 36,345 | 35,370 | 37,834 | 37,412 |
| NON-UTILITY PROPERTY | | | |
| Non-utility property, less accumulated depreciation of $25 in 2019 and 2018 | 3 | 4 | |
| Non-utility property, less accumulated depreciation of $25 in 2020 and 2019 | | 2 |
| NET PLANT | 36,348 | 35,374 | 37,836 | 37,414 |
| OTHER NONCURRENT ASSETS | | | |
| Regulatory assets | 3,894 | 3,923 | 4,365 | 4,487 |
| Operating lease right-of-use asset | 617 | — |
| 591 | 601 |
| Other deferred charges and noncurrent assets | 51 | 69 | 53 | 51 |
| TOTAL OTHER NONCURRENT ASSETS | 4,562 | 3,992 | 5,009 | 5,139 |
| TOTAL ASSETS | $44,475 | $43,108 | $47,568 | $46,557 |
The accompanying notes are an integral part of these financial statements.
Consolidated Edison Company of New York, Inc.
CONSOLIDATED BALANCE SHEET (UNAUDITED)
| | | (Millions of Dollars) | June 30,
2019 | December 31,
2018 |
| March 31,
2020 | December 31,
2019 |
| LIABILITIES AND SHAREHOLDER’S EQUITY | | | |
| CURRENT LIABILITIES | | | |
| Long-term debt due within one year | $350 | $475 | $350 |
| Notes payable | 849 | 1,192 | 597 | 1,137 |
| Accounts payable | 835 | 977 | 848 | 956 |
| Accounts payable to affiliated companies | 15 | 17 | 13 |
| Customer deposits | 337 | 339 | 331 | 334 |
| Accrued taxes | 38 | 55 | 29 | 71 |
| Accrued interest | 110 | 112 | 188 | 113 |
| Accrued wages | 101 | 99 | 105 | 92 |
| Fair value of derivative liabilities | 41 | 25 | 99 | 81 |
| Regulatory liabilities | 61 | 73 | 93 | 63 |
| System benefit charge | 569 | 569 | 567 | 587 |
| Operating lease liabilities | 46 | — |
| 59 | 54 |
| Other current liabilities | 256 | 267 | 224 | 280 |
| TOTAL CURRENT LIABILITIES | 3,608 | 4,200 | 3,503 | 4,131 |
| NONCURRENT LIABILITIES | | | |
| Provision for injuries and damages | 140 | 141 | 124 | 125 |
| Pensions and retiree benefits | 858 | 952 | 1,080 | 1,241 |
| Superfund and other environmental costs | 686 | 693 | 657 | 654 |
| Asset retirement obligations | 298 | 292 | 366 | 362 |
| Fair value of derivative liabilities | 86 | 6 | 113 | 65 |
| Deferred income taxes and unamortized investment tax credits | 5,893 | 5,739 | 6,155 | 6,000 |
| Operating lease liabilities | 595 | — |
| 548 | 551 |
| Regulatory liabilities | 4,214 | 4,258 | 4,262 | 4,427 |
| Other deferred credits and noncurrent liabilities | 206 | 241 | 233 | 240 |
| TOTAL NONCURRENT LIABILITIES | 12,976 | 12,322 | 13,538 | 13,665 |
| LONG-TERM DEBT | 14,023 | 13,676 | 16,194 | 14,614 |
| SHAREHOLDER’S EQUITY (See Statement of Shareholder’s Equity) | 13,868 | 12,910 | 14,333 | 14,147 |
| TOTAL LIABILITIES AND SHAREHOLDER’S EQUITY | $44,475 | $43,108 | $47,568 | $46,557 |
The accompanying notes are an integral part of these financial statements.
Consolidated Edison Company of New York, Inc.
CONSOLIDATED STATEMENT OF SHAREHOLDER’S EQUITY (UNAUDITED) | | | | Common Stock | Additional
Paid-In
Capital | Retained
Earnings | Repurchased
Con Edison
Stock | Capital
Stock
Expense | Accumulated
Other
Comprehensive
Income/(Loss) | Total | Common Stock | Additional
Paid-In
Capital | Retained
Earnings | Repurchased
Con Edison
Stock | Capital
Stock
Expense | Accumulated
Other
Comprehensive
Income/(Loss) | Total |
| (In Millions, except for dividends per share) | Shares | Amount | |
| BALANCE AS OF DECEMBER 31, 2017 | 235 | $589 | $4,649 | $8,231 | $(962) | $(62) | $(6) | $12,439 | |
| (In Millions | | Shares | Amount | Additional
Paid-In
Capital | Retained
Earnings | Repurchased
Con Edison
Stock | Capital
Stock
Expense | Accumulated
Other
Comprehensive
Income/(Loss) | Total |
| BALANCE AS OF DECEMBER 31, 2018 | | 235 | $589 |
| Net income | | | 412 | | 412 |
| Common stock dividend to parent | | | (228) | | (228) |
| Capital contribution by parent | | | 225 | | 225 |
| BALANCE AS OF MARCH 31, 2019 | | 235 | $589 | $4,994 | $8,765 | $(962) | $(62) | $(5) | $13,319 |
| | | |
| BALANCE AS OF DECEMBER 31, 2019 | | 235 | $589 | $5,669 | $8,919 | $(962) | $(62) | $(6) | $14,147 |
| Net income |
|
| 389 |
|
| 389 |
| 406 |
| 406 |
| Common stock dividend to parent |
|
| (211) |
|
| (211) |
| (246) |
| (246) |
| Capital contribution by parent |
| 45 |
|
|
| 45 |
| 25 |
| 25 |
| Other comprehensive income |
|
|
|
|
| — |
|
| 1 |
| BALANCE AS OF MARCH 31, 2018 | 235 | $589 | $4,694 | $8,409 | $(962) | $(62) | $(6) | $12,662 | |
| Net income |
|
| 149 |
|
|
| 149 | |
| Common stock dividend to parent |
|
| (212 | ) |
|
| (212) | |
| Capital contribution by parent |
| 25 |
|
|
|
| 25 | |
| Other comprehensive income |
|
|
| 1 |
| 1 | |
| BALANCE AS OF JUNE 30, 2018 | 235 | $589 | $4,719 | $8,346 | $(962) | $(62) | $(5) | $12,625 | |
| | | | | | |
| BALANCE AS OF DECEMBER 31, 2018 | 235 | $589 | $4,769 | $8,581 | $(962) | $(62) | $(5) | $12,910 | |
| Net income | | | 412 | | | 412 | |
| Common stock dividend to parent | | | (228) | | | (228) | |
| Capital contribution by parent | | 225 | | | | 225 | |
| Other comprehensive income | | | | | — |
| |
| BALANCE AS OF MARCH 31, 2019 | 235 | $589 | $4,994 | $8,765 | $(962) | $(62) | $(5) | $13,319 | |
| Net income |
|
| 152 |
|
| 152 | |
| Common stock dividend to parent |
|
| (228) |
|
| (228) | |
| Capital contribution by parent |
| 625 |
|
|
| 625 | |
| Other comprehensive income |
|
|
|
|
| — |
| |
| BALANCE AS OF JUNE 30, 2019 | 235 | $589 | $5,619 | $8,689 | $(962) | $(62) | $(5) | $13,868 | |
| BALANCE AS OF MARCH 31, 2020 | | 235 | $589 | $5,694 | $9,079 | $(962) | $(62) | $(5) | $14,333 |
The accompanying notes are an integral part of these financial statements.
NOTES TO THE FINANCIAL STATEMENTS (UNAUDITED)
General
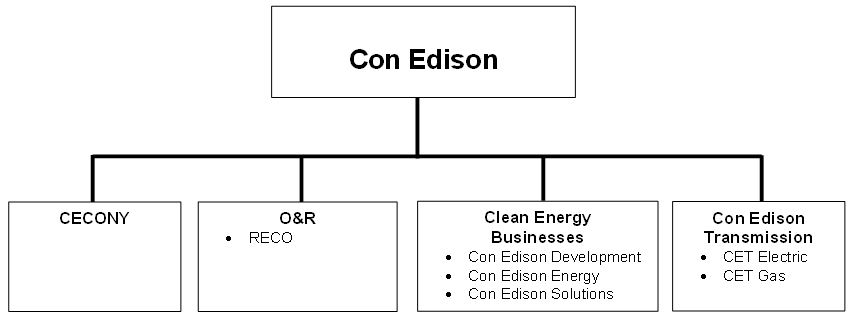
These combined notes accompany and form an integral part of the separate consolidated financial statements of each of the two2 separate registrants: Consolidated Edison, Inc. and its subsidiaries (Con Edison) and Consolidated Edison Company of New York, Inc. and its subsidiaries (CECONY). CECONY is a subsidiary of Con Edison and as such its financial condition and results of operations and cash flows, which are presented separately in the CECONY consolidated financial statements, are also consolidated, along with those of Orange and Rockland Utilities, Inc. (O&R), Con Edison Clean Energy Businesses, Inc. (together with its subsidiaries, the Clean Energy Businesses) and Con Edison Transmission, Inc. (together with its subsidiaries, Con Edison Transmission) in Con Edison’s consolidated financial statements. The term “Utilities” is used in these notes to refer to CECONY and O&R.
As used in these notes, the term “Companies” refers to Con Edison and CECONY and, except as otherwise noted, the information in these combined notes relates to each of the Companies. However, CECONY makes no representation as to information relating to Con Edison or the subsidiaries of Con Edison other than itself.
The separate interim consolidated financial statements of each of the Companies are unaudited but, in the opinion of their respective managements, reflect all adjustments (which include only normally recurring adjustments) necessary for a fair presentationstatement of the results for the interim periods presented. The Companies’ separate interim consolidated financial statements should be read together with their separate audited financial statements (including the combined notes thereto) included in Item 8 of their combined Annual Report on Form 10-K for the year ended December 31, 2018 and their separate unaudited financial statements (including the combined notes thereto) included in Part 1, Item 1 of their combined Quarterly Report on Form 10-Q for the quarterly period ended March 31, 2019. Certain prior period amounts have been reclassified to conform to the current period presentation.
Con Edison has two2 regulated utility subsidiaries: CECONY and O&R. CECONY provides electric service and gas service in New York City and Westchester County. The company also provides steam service in parts of Manhattan. O&R, along with its regulated utility subsidiary, provides electric service in southeastern New York and northern New Jersey and gas service in southeastern New York. Con Edison Clean Energy Businesses, Inc. has three subsidiaries: Consolidated Edison Development, Inc. (Con Edison Development), a company thatthrough its subsidiaries, develops, owns and operates renewable and energy infrastructure projects; Consolidated Edison Energy, Inc. (Con Edison Energy), a company thatprojects and provides energy-related products and services to wholesale customers; and Consolidated Edison Solutions, Inc. (Con Edison Solutions), a company that provides energy-related products and services to retail customers. Con Edison Transmission, Inc. invests in electric transmission facilities through its subsidiary, Consolidated Edison Transmission, LLC (CET Electric), and invests in gas pipeline and storage facilities through its subsidiary Con Edison Gas Pipeline and Storage, LLC (CET Gas).
Note A – Summary of Significant Accounting Policies and Other Matters
Revenue RecognitionFinancial Instruments – Credit Losses
Adoption of New Standard
In January 2020, the Companies adopted ASU 2016-13, “Financial Instruments-Credit Losses (Topic 326): Measurement of Credit Losses on Financial Instruments” (CECL). The following table presents, foramendments replace the threeincurred loss impairment methodology which involved delayed recognition of credit losses. The amendments introduce an expected credit loss impairment model which requires immediate recognition of anticipated losses over the instrument’s life. A broader range of reasonable and six months ended June 30, 2019supportable information must be considered in developing the credit loss estimates. The Companies' financial instruments subject to the amendments are included in the lines “Accounts receivable – customers” and 2018, revenue from contracts with customers as defined in Accounting Standards Codification (ASC) Topic 606, "Revenue from Contracts with Customers," as well as additional revenue from sources other than contracts with customers, disaggregated by major source.“Other receivables.” Substantially all of these in-scope financial instruments are expected to be collected within one year of billing.
The Companies adopted the amendments using the modified retrospective method for all financial instruments measured at amortized costs. Results for reporting periods beginning after January 1, 2020 are presented under ASC 326 while prior period amounts continue to be reported in accordance with previously applicable GAAP. No prior period adjustment or charge to retained earnings for cumulative impact was required as a result of the Companies’ adoption of the amendments.
The Utilities’ “Account receivable – customers” balance consists of utility bills due (bills are generally due the month following billing) from customers who have energy delivered, generated, or services provided by the Utilities. The balance also reflects the Utilities’ purchase of receivables from energy service companies to support the retail choice programs.
“Other receivables” balance generally reflects costs billed by the Utilities for goods and services provided to external parties, such as accommodation work for private parties and certain governmental entities, real estate rental and pole attachments.
|
| | | | | | | | | | | | | | |
| | For the Three Months Ended June 30, 2019 | For the Three Months Ended June 30, 2018 |
| (Millions of Dollars) | Revenues from contracts with customers | | Other revenues (a) | Total operating revenues | Revenues from contracts with customers | | Other revenues (a) | Total operating revenues |
| CECONY | | | | | | | | |
| Electric | $1,751 | | $82 | $1,833 | $1,771 | | $36 | $1,807 |
| Gas | 400 | | 8 | 408 | 428 | | 7 | 435 |
| Steam | 86 | | 4 | 90 | 93 | | 3 | 96 |
| Total CECONY | $2,237 | | $94 | $2,331 | $2,292 | | $46 | $2,338 |
| O&R | | | | | | | | |
| Electric | 140 | | (2) | 138 | 146 | | (2) | 144 |
| Gas | 39 | | 2 | 41 | 47 | | 7 | 54 |
| Total O&R | $179 | |
| $— |
| $179 | $193 | | $5 | $198 |
| Clean Energy Businesses | | | | | | | | |
| Renewables | 171 | (b) | — |
| 171 | 73 | (b) | — |
| 73 |
| Energy services | 16 | | — |
| 16 | 23 | | — |
| 23 |
| Other | — |
| | 46 | 46 | — |
| | 62 | 62 |
| Total Clean Energy Businesses | $187 | | $46 | $233 | $96 | | $62 | $158 |
| Con Edison Transmission | 1 | | — |
| 1 | 1 | | — |
| 1 |
| Other (c) | — |
|
| — |
| — |
| — |
|
| 1 | 1 |
| Total Con Edison | $2,604 | | $140 | $2,744 | $2,582 | | $114 | $2,696 |
(a) ForThe Clean Energy Businesses’ accounts receivable balance generally reflects bills related to the Utilities, this includes revenuesale of energy from alternative revenue programs, such asrenewable electric production projects, the revenue decoupling mechanisms under their New York electricmanagement of energy supply assets, energy-efficiency services to government and gas rate plans.Forcommercial customers, and the engineering, procurement, and construction services of renewable energy projects. The Clean Energy Businesses this includes revenue from wholesale services.calculate an allowance for uncollectible accounts related to their energy services customers based on an aging and customer-specific analysis. The amount of such reserves was not material at March 31, 2020.
(b) Included withinThe Companies develop expected loss estimates using past events data and consider current conditions and future reasonable and supportable forecasts. Changes to the totalsUtilities’ reserve balances which result in write-offs of customer accounts receivable balances above existing rate allowances are not reflected in rates during the term of the current rate plans and are considered in a future rate proceeding. For the Utilities’ customer accounts receivable allowance for Renewables revenue atuncollectible accounts, past events considered include write-offs relative to total customer accounts receivable; current conditions include macro-and micro-economic conditions related to trends in the Clean Energy Businesseslocal economy and bankruptcy rates, among other factors; and forecasts about the future include assumptions related to the level of write-offs and recoveries.
Other receivables allowance for uncollectible accounts is $4calculated based on a historical average of collections relative to total other receivables, including current receivables. Current macro- and micro-economic conditions are also considered when calculating the current reserve. Probable outcomes of pending litigation, whether favorable or unfavorable to the Companies, are also included in the consideration.
During the first quarter of 2020, the potential economic impact of the COVID-19 pandemic was also considered in forward looking projections related to write-off and recovery rates, and resulted in increases to the allowance for uncollectible accounts of $5 million for Con Edison, substantially all of which related to CECONY.
Customer accounts receivable and $9 millionthe associated allowance for uncollectible accounts are included in the line “Accounts receivable – customers” on the Companies’ consolidated balance sheets. Other receivables and the associated allowance for uncollectible accounts are included in “Other receivables” on the consolidated balance sheets.
The table below presents a rollforward by major portfolio segment type for the three months ended June 30, 2019 and 2018, respectively, of revenue related to engineering, procurement and construction services.
| |
(c) | Parent company and consolidation adjustments. |
|
| | | | | | | | | | | | | |
| | For the Six Months Ended June 30, 2019 | For the Six Months Ended June 30, 2018 |
| | Revenues from contracts with customers | | Other revenues (a) | Total operating revenues | Revenues from contracts with customers | | Other revenues (a) | Total operating revenues |
| CECONY | | | | | | | | |
| Electric | $3,465 | | $165 | $3,630 | $3,474 | | $62 | $3,536 |
| Gas | 1,310 | | 20 | 1,330 | 1,252 | | 24 | 1,276 |
| Steam | 402 | | 9 | 411 | 404 | | 6 | 410 |
| Total CECONY | $5,177 | | $194 | $5,371 | $5,130 | | $92 | $5,222 |
| O&R | | | | | | | | |
| Electric | 283 | | — |
| 283 | 293 | | — |
| 293 |
| Gas | 153 | | 1 | 154 | 148 | | 4 | 152 |
| Total O&R | $436 | | $1 | $437 | $441 | | $4 | $445 |
| Clean Energy Businesses | | | | | | | | |
| Renewables | 278 | (b) | — |
| 278 | 205 | (b) | — |
| 205 |
| Energy services | 39 | | — |
| 39 | 41 | | — |
| 41 |
| Other | — |
| | 133 | 133 | — |
| | 145 | 145 |
| Total Clean Energy Businesses | $317 | | $133 | $450 | $246 | | $145 | $391 |
| Con Edison Transmission | 2 | | — |
| 2 | 2 | | — |
| 2 |
| Other (c) | — |
| | (2) | (2) | — |
| | — |
| — |
|
| Total Con Edison | $5,932 | | $326 | $6,258 | $5,819 | | $241 | $6,060 |
(a) For the Utilities, this includes revenue from alternative revenue programs, such as the revenue decoupling mechanisms under their New York electric and gas rate plans.For the Clean Energy Businesses, this includes revenue from wholesale services.
(b) Included within the totals for Renewables revenue at the Clean Energy Businesses is $6 millionand $97 millionfor the six months ended June 30, 2019 and 2018, respectively, of revenue related to engineering, procurement and construction services.
| |
(c) | Parent company and consolidation adjustments. |
|
| | | | | | |
| | For the Three Months Ended March 31, 2020 |
| | Con Edison | CECONY |
| (Millions of Dollars) | Accounts receivable - customers | Other receivables | Accounts receivable - customers | Other receivables |
| Allowance for credit losses | | | | |
| Beginning Balance at January 1, 2020 | $70 | $4 | $65 | $3 |
| Recoveries | 2 | — |
| 2 | — |
|
| Write-offs | (18) | — |
| (18) | — |
|
| Reserve adjustments | 21 | 1 | 21 | — |
|
| Ending Balance March 31, 2020 | $75 | $5 | $70 | $3 |
20
|
| | | | | | | |
| | 2019 | 2018 |
| (Millions of Dollars) | Unbilled contract revenue (a) | Unearned revenue (b) |
| | Unbilled contract revenue (a) | Unearned revenue (b) | |
| Beginning balance as of January 1, | $29 | $20 | | $58 | $87 | |
| Additions (c) | 44 | — |
| | 73 | 31 | |
| Subtractions (c) | 38 | 2 | (d) | 88 | 105 | (d) |
| Ending balance as of June 30, | $35 | $18 | | $43 | $13 | |
| |
(a) | Unbilled contract revenue represents accumulated incurred costs and earned profits on contracts (revenue arrangements), which have been recorded as revenue, but have not yet been billed to customers, and which represent contract assets as defined in Topic 606. Substantially all accrued unbilled contract revenue is expected to be collected within one year. Unbilled contract revenue arises from the cost-to-cost method of revenue recognition. Unbilled contract revenue from fixed-price type contracts is converted to billed receivables when amounts are invoiced to customers according to contractual billing terms, which generally occur when deliveries or other performance milestones are completed. |
| |
(b) | Unearned revenue represents a liability for billings to customers in excess of earned revenue, which are contract liabilities as defined in Topic 606. |
| |
(c) | Additions for unbilled contract revenue and subtractions for unearned revenue represent additional revenue earned. Additions for unearned revenue and subtractions for unbilled contract revenue represent billings. Activity also includes appropriate balance sheet classification for the period. |
| |
(d) | Of the subtractions from unearned revenue, $2 million and $50 million were included in the balance as of January 1, 2019 and 2018, respectively. |
As of June 30, 2019, the aggregate amount of the remaining fixed performance obligations of the Clean Energy Businesses under contracts with customers for energy services is $67 million, of which $31 million will be recognized within the next two years, and the remaining $36 million will be recognized pursuant to long-term service and maintenance agreements.
General Utility Plant
General utility plant of Con Edison and CECONY included $97$91 million and $92$87 million, respectively, at June 30, 2019March 31, 2020 and $100$93 million and $95$88 million, respectively, at December 31, 2018,2019, related to a May 2018 acquisition of software licenses. The estimated aggregate annual amortization expense related to the software licenses for Con Edison and CECONY is $7 million. The accumulated amortization for Con Edison and CECONY was $7$12 million and $6$11 million, respectively at June 30, 2019March 31, 2020 and was $3$10 million at December 31, 2018.2019.
Goodwill
The Companies test goodwill for impairment at least annually or whenever there is a triggering event, and test long-lived and intangible assets for recoverability when events or changes in circumstances indicate that the carrying value of long-lived or intangible assets may not be recoverable. The Companies identified no triggering events or changes in circumstances related to the COVID-19 pandemic that would indicate that the carrying value of long-lived or intangible assets may not be recoverable at March 31, 2020.
Long-Lived and Intangible Assets
In January 2019, Pacific Gas and Electric Company (PG&E) filed in the United States Bankruptcy Court for the Northern District of California for reorganization under Chapter 11 of the U.S. Bankruptcy Code. The output of Con Edison Developmentcertain of the Clean Energy Businesses' renewable electric production projects with an aggregate generating capacity of 680 MW (AC) of generating capacity (PG&E Projects) is sold to PG&E under long-term power purchase agreements (PG&E PPAs). Most of the PG&E PPAs have contract prices that are higher than estimated market prices. PG&E, as a debtor in possession, may assume or reject the PG&E PPAs, subject to review by the bankruptcy court.
In March 2020, PG&E and certain PG&E shareholders submitted a joint plan of reorganization to the bankruptcy court. The plan includes the assumption by PG&E of all of its power purchase agreements. The plan is subject to, among other things: confirmation by the bankruptcy court by June 30, 2020 (or any extension of the date by which PG&E’s bankruptcy must be resolved for PG&E to participate in the insurance fund described below); approval by the California Public Utilities Commission (CPUC) of PG&E’s implementation of the plan and participation in the insurance fund; PG&E obtaining funding for distributions under the plan; and the continuation in full force and effect of the September 2019 subrogation claims restructuring support agreement, the December 2019 tort claimants restructuring support agreement and the January 2020 noteholder restructuring support agreement. The plan is supported by the parties to these restructuring support agreements, subject to their terms, and includes the assumption by PG&E of all of its power purchase agreements. A plan of reorganization can be revoked, amended, withdrawn or pursuantdelayed prior to aits confirmation by the bankruptcy court. The bankruptcy court has authorized PG&E to send the plan to creditors for consideration, and the current deadline for creditors to return ballots is May 15, 2020. The hearing to consider confirmation of the plan is scheduled to commence later in May 2020.
In January and May 2019, FERC orderissued orders (which PG&E is challenging), the bankruptcy court and FERC. In a May 2019 order, FERC denied PG&E’s request for a rehearing of the January 2019 order and reaffirmed affirming its jurisdiction to review and approve the modification or abrogation of wholesale power contracts that are the subject of rejection in bankruptcy. In June 2019, the bankruptcy court ruled that FERC does not have concurrent jurisdiction with it and that FERC’s January and May 2019 orders are of no force and effect in the bankruptcy proceeding. FERC and additional parties, including Con Edison Development,the Clean Energy Businesses, are challenging the bankruptcy court’s June 2019 ruling. ruling in appeals that are pending in the United States Court of Appeals for the Ninth Circuit.
In July 2019, California enacted a law addressing future California wildfires. The law includes provisions for the establishment of wildfire liquidity and insurance funds and possible limitation of future wildfire liabilities for California utilities. PG&E, Southern California Edison Company and San Diego Gas & Electric Company have agreed to participate in the insurance fund. PG&E’s participation will require bankruptcy court approval and is conditioned on, among other things, resolution of PG&E’s bankruptcy by June 30, 2020, and a determination by the California Public Utilities CommissionCPUC that PG&E’s bankruptcy reorganization plan is consistent with the state’s climate goals as required under the California Renewables Portfolio Standard Program and related procurement requirements of the state.
The PG&E bankruptcy is an event of default under the PG&E PPAs. Unless the lenders for the related project debt otherwise agree, distributions from the related projects to Con Edison Developmentthe Clean Energy Businesses will not be made during the pendency of the bankruptcy. See “Reconciliation of Cash, Temporary Cash Investments and Restricted Cash,” below.
At June 30,March 31, 2020 and December 31, 2019, Con Edison’s consolidated balance sheet included $853$802 million and $819 million of net non-utility plant relating to the PG&E Projects, $1,090$1,039 million and $1,057 million of intangible assets relating to the PG&E PPAs, $288$274 million and $282 million of net non-utility plant of additional projects that secure the related project debt and $1,032$980 million of
non-recourse related project debt.debt, respectively. See "Long-term Debt" in Note C. Con Edison has tested whether its net non-utility plant relating to the PG&E Projects and intangible assets relating to the PG&E PPAs have been impaired. The projected future cash flows used in the test reflected Con Edison’s expectation that the PG&E PPAs are not likely to be rejected. Based on the test, Con Edison has determined that there was no impairment. If, in the future, one or more of the PG&E PPAs is rejected or any such rejection becomes likely, there will be an impairment of the related intangible assets and could be an impairment of the related non-utility plant. The amount of any such impairment could be material.
Earnings Per Common Share
Con Edison presents basic and diluted earnings per share (EPS) on the face of its consolidated income statement. Basic EPS is calculated by dividing earnings available to common shareholders (“Net income for common stock” on Con Edison’s consolidated income statement) by the weighted average number of Con Edison common shares outstanding during the period. In the calculation of diluted EPS, weighted average shares outstanding are increased for additional shares that would be outstanding if potentially dilutive securities were converted to common stock.
Potentially dilutive securities for Con Edison consist of restricted stock units and deferred stock units for which the average market price of the common shares for the period was greater than the exercise price and its common shares that are subject to a May 2019 forward sale agreement (see Note C). Before the issuance of common shares upon settlement of the forward sale agreement, the shares will be reflected in the company’s diluted earnings per share calculations using the treasury stock method. Under this method, the number of common shares used in calculating diluted earnings per share is deemed to be increased by the excess, if any, of the number of shares that would be issued upon physical settlement of the forward sale agreement over the number of shares that could be purchased by the company in the market (based on the average market price during the period) using the proceeds due upon physical settlement (based on the adjusted forward sale price at the end of the reporting period).price.
For the three and six months ended June 30,March 31, 2020 and 2019, and 2018, basic and diluted EPS for Con Edison are calculated as follows:
|
| | | | |
| | For the Three Months Ended June 30, | For the Six Months Ended June 30, |
| (Millions of Dollars, except per share amounts/Shares in Millions) | 2019 | 2018 | 2019 | 2018 |
| Net income for common stock | $152 | $188 | $576 | $616 |
| Weighted average common shares outstanding – basic | 328.3 | 310.8 | 325.2 | 310.6 |
| Add: Incremental shares attributable to effect of potentially dilutive securities | 0.9 | 1.1 | 0.9 | 1.1 |
| Adjusted weighted average common shares outstanding – diluted | 329.2 | 311.9 | 326.1 | 311.7 |
| Net Income per common share – basic | $0.46 | $0.60 | $1.77 | $1.98 |
| Net Income per common share – diluted | $0.46 | $0.60 | $1.77 | $1.98 |
|
| | |
| | For the Three Months Ended March 31, |
| (Millions of Dollars, except per share amounts/Shares in Millions) | 2020 | 2019 |
| Net income for common stock | $375 | $424 |
| Weighted average common shares outstanding – basic | 333.6 | 322.5 |
| Add: Incremental shares attributable to effect of potentially dilutive securities | 1.0 | 0.9 |
| Adjusted weighted average common shares outstanding – diluted | 334.6 | 323.4 |
| Net Income per common share – basic | $1.13 | $1.31 |
| Net Income per common share – diluted | $1.12 | $1.31 |
The computation of diluted EPS for the three and six months ended June 30,March 31, 2020 and 2019 and 2018 excludes immaterial amounts of performance share awards that were not included because of their anti-dilutive effect.
Changes in Accumulated Other Comprehensive Income/(Loss) by Component
For the three and six months ended June 30,March 31, 2020 and 2019, and 2018, changes to accumulated other comprehensive income/(loss) (OCI) for Con Edison and CECONY are as follows:
|
| | | | | |
| | For the Three Months Ended June 30, |
| | Con Edison | CECONY |
| (Millions of Dollars) | 2019 | 2018 | 2019 |
| 2018 |
| Beginning balance, accumulated OCI, net of taxes (a) | $(12) | $(22) | $(5) | $(6) |
| Amounts reclassified from accumulated OCI related to pension plan liabilities, net of tax of $(1) for Con Edison in 2018 (a)(b) | 1 | 2 | — |
| 1 |
| Current period OCI, net of taxes | 1 | 2 | — |
| 1 |
| Ending balance, accumulated OCI, net of taxes | $(11) | $(20) | $(5) | $(5) |
| | | | For the Six Months Ended June 30, | For the Three Months Ended March 31, |
| | Con Edison | CECONY | Con Edison | CECONY |
| (Millions of Dollars) | 2019 | 2018 | 2019 |
| 2018 |
| 2020 | 2019 | 2020 |
| 2019 |
|
| Beginning balance, accumulated OCI, net of taxes (a) | $(16) | $(26) | $(5) | $(6) | $(19) | $(16) | $(6) | $(5) |
| OCI before reclassifications, net of tax of $(1) for Con Edison in 2019 and 2018 | 2 | 3 | — |
| — |
| |
| Amounts reclassified from accumulated OCI related to pension plan liabilities, net of tax of $(1) for Con Edison in 2019 and 2018 (a)(b) | 3 | 3 | — |
| 1 | |
| OCI before reclassifications, net of tax of $(1) for Con Edison in 2020 and 2019 | | 4 | 2 | — |
| — |
|
| Amounts reclassified from accumulated OCI related to pension plan liabilities, net of tax of $(1) for Con Edison in 2020 (a)(b) | | 1 | 2 | 1 | — |
|
| Current period OCI, net of taxes | 5 | 6 | — |
| 1 | 5 | 4 | 1 | — |
|
| Ending balance, accumulated OCI, net of taxes | $(11) | $(20) | $(5) | $(5) | $(14) | $(12) | $(5) | $(5) |
| |
| (a) | Tax reclassified from accumulated OCI is reported in the income tax expense line item of the consolidated income statement. |
| |
| (b) | For the portion of unrecognized pension and other postretirement benefit costs relating to the Utilities, costs are recorded into, and amortized out of, regulatory assets and liabilities instead of OCI. The net actuarial losses and prior service costs recognized during the period are included in the computation of total periodic pension and other postretirement benefit cost. See Notes E and F. |
Reconciliation of Cash, Temporary Cash Investments and Restricted Cash
Cash, temporary cash investments and restricted cash are presented on a combined basis in the Companies’ consolidated statements of cash flows. At June 30,March 31, 2020 and 2019, and 2018, cash, temporary cash investments and restricted cash for Con Edison and CECONY arewere as follows:
| | | | At June 30, | At March 31, |
| | Con Edison | CECONY | Con Edison | CECONY |
| (Millions of Dollars) | 2019 | 2018 | 2019 |
| 2018 |
| 2020 | 2019 | 2020 |
| 2019 |
|
| Cash and temporary cash investments | $831 | $866 | $786 | $829 | $1,395 | $406 | $1,303 | $352 |
| Restricted cash (a) | 139 | 55 | — |
| — |
| 179 | 68 | — |
| — |
|
| Total cash, temporary cash investments and restricted cash | $970 | $921 | $786 | $829 | $1,574 | $474 | $1,303 | $352 |
| |
| (a) | Restricted cash included cash of Con Edison Developmentthe Clean Energy Businesses' renewable electric production project subsidiaries ($138179 million and $54$67 million at June 30,March 31, 2020 and 2019, and 2018, respectively) that, under the related project debt agreements, is either restricted until the various maturity dates of the project debt to being used for normal operating expenses and capital expenditures, debt service, and required reserves.reserves or restricted as a result of the PG&E bankruptcy. During the pendency of the PG&E bankruptcy, unless the lenders for the related project debt otherwise agree, cash may not be distributed from the related projects to Con Edison Development.the Clean Energy Businesses. See “Long-Lived and Intangible Assets,” above, and Note C. In addition, restricted cash included O&R's New Jersey utility subsidiary, Rockland Electric Company transition bond charge collections, net of principal, interest, trustee and service fees ($1 million at June 30, 2019 and 2018)March 31, 2019). |
Note B – Regulatory Matters
Rate PlansCOVID-19 Regulatory Matters
CECONY – ElectricGovernors, public utility commissions, federal authorities and other regulatory agencies in the states in which the Utilities operate have issued orders related to the COVID-19 pandemic that impact the Utilities as described below.
In May 2019, the
New York State Public Service Commission (NYSPSC) staff submitted testimonyRegulation
In March 2020, New York State Governor Cuomo declared a State disaster emergency for the State of New York. Since that declaration, the NYSPSC and the Utilities have taken actions to mitigate the impact of the COVID-19 pandemic on the Utilities, their customers and other stakeholders. New York State has designated utilities, including CECONY and O&R, as essential businesses that may continue their work. The Utilities have modified or suspended certain work in the state.
In March 2020, the Utilities began suspending service disconnections, certain collection notices, final bill collection agency activity, new late payment charges and certain other fees for all customers. Historically, these fees have amounted to approximately $6 million and $0.4 million per month for CECONY and O&R, respectively. The suspension of these fees is expected to result in a reduction in revenues during the suspension period, the length of which has not yet been determined. The Utilities also began providing payment extensions for all customers that were scheduled to be disconnected prior to the start of the COVID-19 pandemic. All customer walk-in centers have been closed to the public and in-person investigations of billing issues at customer residences and businesses have been suspended. In April 2020, the NYSPSC proceedingalso suspended certain interconnection payment deadlines to mitigate the impact of the COVID-19 pandemic on developers of distributed renewable generation and energy storage. See Note K to the First Quarter Financial Statements.
In March 2020, the Utilities requested and the NYSPSC granted extensions until July 31, 2020 to file their 2019 Earnings Adjustment Mechanisms (EAMs) reports, which would delay the start of collection of earned EAM incentives of approximately $46 million and $3 million for CECONY and O&R, respectively, from the twelve-month period beginning June 2020 until the twelve-month period beginning September 2020.
The Utilities’ rate plans have revenue decoupling mechanisms in which CECONY requested antheir New York electric and gas businesses that reconcile actual energy delivery revenues to the authorized delivery revenues approved by the NYSPSC on a monthly basis and accumulate the deferred balances semi-annually under CECONY's electric rate increase, effective January 2020.plan (January through June and July through December, respectively) and annually under CECONY's gas rate plan and O&R New York's electric and gas rate plans (January through December). The NYSPSC staff testimony supportsdifference is accrued with interest on a monthly basis for CECONY and O&R New York’s electric customers and after the annual deferral period ends for CECONY and O&R New York’s gas customers for refund to, or recovery from customers, as applicable. Generally, the refund to or recovery from customers begins August and February of each year over an ensuing six-month period for CECONY's electric rate increasecustomers and February of $58 million reflecting, among other things,each year over an 8.3 percent return on common equityensuing twelve-month period for CECONY's gas and a common equity ratio of 47.3 percent. In June 2019, CECONY filed an update to the request it filed in January 2019. The company decreased its requested January 2020 rate increase by $15 million to $470 million, increased its illustrated January 2021 rate increase by $27 million to $379 millionO&R New York's electric and increased its illustrated January 2022 rate increase by $7 million to $270 million. This updated filing reflects a 9.75 percent return on common equity and a common equity ratio of 50 percent.gas customers.
CECONY – GasNew Jersey State Regulation
In May 2019,March 2020, New Jersey Governor Murphy declared a Public Health Emergency and State of Emergency for the NYSPSC staff submitted testimonyState of New Jersey. Since that declaration, the NJBPU and RECO have taken actions to mitigate the impact of the COVID-19 pandemic on RECO, its customers and other stakeholders. New Jersey has designated utilities, including RECO, as essential businesses that may continue their work. RECO has modified or suspended certain work in the NYSPSC proceeding in which CECONY requested a gas rate increase, effective January 2020.state. In March 2020, RECO began suspending late payment charges, terminations for non-payment, and no access fees during the COVID-19 pandemic. The NYSPSC staff testimony supports a gas rate increasesuspension of $83 million reflecting, among other things, an 8.3 percent return on common equity and a common equity ratio of 47.3 percent. In June 2019, CECONY filed an updatethese fees is not expected to the request it filed in January 2019. The company decreased its requested January 2020 rate increase by $4 million to $206 million, decreased its illustrated January 2021 rate increase by $4 million to $134 million and increased its illustrated January 2022 rate increase by $5 million to $160 million. This updated filing reflects a 9.75 percent return on common equity and a common equity ratio of 50 percent.be material.
Federal Regulation
In March 2020, the North American Electric Reliability Corporation (NERC) issued guidance that the effects of the COVID-19 pandemic will be considered an acceptable basis for non-compliance with certain NERC Reliability
O&R New York – ElectricStandards requirements that would have required action between March 1, 2020 and July 31, 2020. In addition, it suspended on-site NERC compliance audits until at least July 31, 2020.
Also in March 2020, FERC announced several actions to ease regulatory obligations in response to the COVID-19 pandemic. These include postponement of certain filing deadlines and the suspension of all audit site visits and investigative testimony.
In April 2020, FERC announced it would expeditiously review and act on requests for relief in response to the COVID-19 pandemic, give priority to processing filings that contribute to the business continuity of regulated entities’ energy infrastructure and will exercise prosecutorial discretion when addressing events arising during the emergency period. FERC also approved a blanket waiver of requirements in Open Access Transmission Tariffs that require entities to hold meetings in-person and to provide or obtain notarized documents.
Gas Safety
In March 2019,2020, the U.S. Department of Transportation’s Pipeline and Hazardous Materials Safety Administration (PHMSA) issued a notice staying enforcement of certain federal operator qualification, control room management and drug testing requirements during the COVID-19 pandemic. The notice also announced that PHMSA would exercise discretion in its overall enforcement of other parts of the pipeline safety regulations. The NYSPSC also provided guidance that it was staying enforcement of many of the same pipeline safety requirements identified in the March 2020 PHMSA notice.
In April 2020, the NYSPSC approvedissued an order that extended the November 2018 joint proposal for new electricdeadlines to complete certain gas inspections by all New York gas utilities, including CECONY and gas rates. The joint proposal provides for electric rate increases of $13.4 million, $8.0 million and $5.8 million, effective January 1, 2019, 2020 and 2021, respectively. The joint proposal provides for a gas rate decrease of $7.5 million, effective January 1, 2019, and gas rate increases of $3.6 million and $0.7 million, effective JanuaryO&R, from April 1, 2020 and 2021.
Rockland Electric Company (RECO)
In May 2019, RECO filed a request with the New Jersey Board of Public Utilities for an electric rate increase of $19.9 million, effective Februaryto August 1, 2020. The filing reflected a return on common equity of 10.00 percent and a common equity ratio of 49.93 percent. In July 2019, RECO filed an update to the request it filed in May 2019. The company increased its requested February 2020 rate increase to $20.4 million and reduced the common equity ratio to 49.04 percent. The updated filing continues to reflect a return on common equity of 10.00 percent.
Other Regulatory Matters
In August and November 2017, the NYSPSC issued orders in its proceeding investigating an April 21, 2017 Metropolitan Transportation Authority (MTA) subway power outage. The orders indicated that the investigation determined that the outage was caused by a failure of CECONY’s electricity supply to a subway station, which led to a loss of the subway signals, and that one of the secondary services to the MTA facility had been improperly rerouted and was not properly documented by the company. The orders also indicated that the loss of power to the subway station affected multiple subway lines and caused widespread delays across the subway system. Pursuant to the orders, the company was required to take certain actions, including inspecting, repairing and installing certain electrical equipment that serves the subway system, analyzing power supply and power quality events affecting the MTA’s signaling services, and filing monthly reports with the NYSPSC on all of the company's activities related to the subway system. The company completed the required actions in 2018. Through June 30, 2019, the company incurred costs related to this matter of $273 million. Included in this amount is $32 million in capital and operating and maintenance costs reflected in the company's electric rate plan and $241 million deferred as a regulatory asset that the company is seeking to recover in its pending electric rate proceeding. The company is unable to estimate the amount or range of its possible loss related to this matter. At June 30, 2019, the company had not accrued a liability related to this matter.
In August 2018, the NYSPSC ordered CECONY to begin on January 1, 2019 to credit the company's electric and gas customers, and to begin on October 1, 2018 to credit its steam customers, with the net benefits of the federal Tax Cuts and Jobs Act of 2017 (TCJA) as measured based on amounts reflected in its rate plans prior to the enactment of the TCJA in December 2017. The net benefits include the revenue requirement impact of the reduction in the corporate federal income tax rate to 21 percent, the elimination for utilities of bonus depreciation and the amortization of excess deferred federal income taxes.
CECONY, estimates that its credit of net benefits of the TCJA tounder its electric gas and steam customersrate plan that was approved in 2019 will amount to $259 million, $113 million and $25 million, respectively. CECONY’sJanuary 2020, is amortizing its TCJA net benefits prior to January 1, 2019 allocable to the company’sits electric customers ($311377 million) areover a three-year period, the “protected” portion of its net regulatory liability for future income taxes related to be deferredcertain accelerated tax depreciation benefits allocable to its electric customers ($1,663 million) over the remaining lives of the related assets and addressedthe remainder, or “unprotected” portion of the net regulatory liability allocable to its electric customers ($784 million) over a five-year period. CECONY, under its gas rate plan that was approved in January 2020, is amortizing its pending electric rate proceeding. CECONY’sremaining TCJA net benefits prior to January 1, 2019 allocable to the company’sits gas customers ($9063 million) over a two-year period, the protected portion of its net regulatory liability for future income taxes allocable to its gas customers ($725 million) over the remaining lives of the related assets and the unprotected portion of the net regulatory liability allocable to its gas customers ($107 million) over a five-year period.
CECONY's net benefits prior to October 1, 2018 allocable to the company’s steam customers ($15 million) are to bebeing amortized over a three-year period. CECONY’s net regulatory liability for future income taxes, including both the protected and unprotected portions, allocable to the company’s electric customers ($2,489 million) is to continue to be deferred and addressed in its pending electric rate proceeding and the amounts allocable to its gas and steam customers ($804 million and $185 million, respectively) are to be185 million) is being amortized over the remaining lives of the related assets (with the amortization period for the unprotected portion subject to review in its pending gas rate proceeding and next steam rate proceeding).
O&R, under its current electric and gas rate plans, has reflected its TCJA net benefits in its electric and gas rates beginning as of January 1, 2019. Under the rate plans, O&R is amortizing its net benefits prior to January 1, 2019 ($22 million) over a three-year period, the protected portion of its net regulatory liability for future income taxes ($123 million) over the remaining lives of the related assets and the unprotected portion ($30 million) over a fifteen-year period.
In January 2018, the NYSPSC issued an order initiating a focused operations audit of the income tax accounting of certain utilities, including CECONY and O&R. The Utilities are unable to estimate the amount or range of their possible loss related to this matter. At June 30, 2019,March 31, 2020, the Utilities had not accrued a liability related to this matter.
In March 2018, Winter Storms Riley and Quinn caused damage to the Utilities’ electric distribution systems and interrupted service to approximately 209,000 CECONY customers, 93,000 O&R customers and 44,000 RECO customers. At June 30, 2019,March 31, 2020, CECONY's costs related to March 2018 storms, including Riley and Quinn, amounted to $134 million, including operation and maintenance expenses reflected in its electric rate plan ($15 million), operation and maintenance expenses charged against a storm reserve pursuant to its electric rate plan ($84 million), capital expenditures ($29 million) and removal costs ($6 million). At June 30, 2019,March 31, 2020, O&R and RECO costs related to 2018 storms amounted to $43 million and $17 million, respectively, most of which were deferred as
regulatory assets pursuant to their electric rate plans. In January 2019, O&R began recovering its deferred storm costs over a six yearsix-year period in accordance with its New York electric rate plan. In February 2020, RECO began recovering its deferred storm costs over a four-year period in accordance with its New Jersey electric rate plan. The NYSPSC investigated the preparation and response to the storms by CECONY, O&R, and other New York electric utilities, including all aspects of their emergency response plans. In April 2019, following the issuance of a NYSPSC staff report on the investigation, the NYSPSC ordered the utilities to show cause why the NYSPSC should not commence a penalty action against them for violating their emergency response plans. The Utilities are unable to estimate the amount or range of their possible loss related to this matter. At June 30, 2019,March 31, 2020, the Utilities had not accrued a liability related to this matter.
In May 2018, FERC denied a complaint the NJBPU filed with FERC seeking the re-allocation to CECONY of certain PJM Interconnection LLC (PJM) transmission costs that had been allocated to the company prior to April 2017 when transmission service provided to the company pursuant to the PJM open access transmission tariff terminated. The transmission service terminated because the company did not exercise its option to continue the service following a series of requests PJM had submitted to FERC that substantially increased the charges for the transmission service. CECONY challenged each of these requests. FERC rejected all but one of CECONY’s protests. In June 2015 and May 2016, CECONY filed appeals of certain FERC decisions with the U.S. Court of Appeals. In July 2018, FERC established a settlement proceeding relating to the allocation of PJM transmission costs. Under CECONY’s electric rate plan, unless and until changed by the NYSPSC, the company will recover all charges incurred associated with the transmission service.
In July 2018, the NYSPSC commenced an investigation into the rupture of a CECONY steam main (see Note H).located on Fifth Avenue and 21st Street in Manhattan. Debris from the incident included dirt and mud containing asbestos. The response to the incident required the closing of buildings and streets for various periods. The NYSPSC has commenced an investigation. As of March 31, 2020, with respect to the incident, the company incurred operating costs of $17 million for property damage, clean-up and other response costs and invested $9 million in capital and retirement costs. The company is unable to estimate the amount or range of its possible loss related to the incident. At March 31, 2020, the company had not accrued a liability related to the incident.
In March 2019, the NYSPSC ordered CECONY to show cause why the NYSPSC should not commence a penalty action and prudence proceeding against CECONY for alleged violations of gas operator qualification, performance, and inspection requirements. The company is seeking to resolve this matter through settlement negotiations with the NYSPSC staff. Any settlement would be subject to NYSPSC approval. The company is unable to estimate the amount or range of its possible loss related to this matter. At June 30, December 31, 2019, the company had notan accrued aregulatory liability related to this matter of $10 million, and at March 31, 2020, the company accrued an additional regulatory liability of $5 million. In April 2020, the NYSPSC approved a $15 million settlement agreement for the benefit of CECONY’s gas customers between CECONY and NYSPSC staff related to this matter.
On July 13, 2019, electric service was interrupted to approximately 72,000 CECONY customers on the west side of Manhattan. The NYSPSC and the Northeast Power Coordinating Council, a regional reliability entity, are investigating the July 13, 2019 power outage. The NYSPSC is also investigating other CECONY power outages that occurred in July 2019. Pursuant to the major outage reliability performance provisions of its electric rate plan, as a result of the July 13, 2019 power outage, the company is subject torecorded a $5 million negative revenue adjustment (which it expects to recognizeadjustment. The NYSPSC is also investigating other CECONY power outages that occurred in July 2019, primarily in the third quarterFlatbush area of 2019).Brooklyn. Primarily due to these outages, pursuant to the rate plan’s annual non-network outage frequency and non-network outage duration reliability performance provisions, the company recorded a $10 million negative revenue adjustment at December 31, 2019. The company is unable to estimate the amount or range of its possible additional loss related to the power outages. At June 30, 2019, the company had not accrued a liability related to thethese power outages.
Regulatory Assets and Liabilities
Regulatory assets and liabilities at June 30, 2019March 31, 2020 and December 31, 20182019 were comprised of the following items:
| | | Con Edison | | CECONY | Con Edison | | CECONY |
| (Millions of Dollars) | 2019 |
| 2018 | | 2019 |
| 2018 |
| 2020 | 2019 |
| | 2020 |
| 2019 |
|
| Regulatory assets | | | | | | | | |
| Unrecognized pension and other postretirement costs | $2,042 | $2,238 |
| $1,934 | $2,111 | $2,246 | $2,541 |
| $2,113 | $2,403 |
| Environmental remediation costs | 787 | 810 |
| 696 | 716 | 735 | 732 |
| 652 | 647 |
| Revenue taxes | 304 | 291 |
| 291 | 278 | 333 | 321 |
| 318 | 308 |
| Property tax reconciliation | | 229 | 219 |
| 222 | 210 |
| MTA power reliability deferral | 241 | 229 | | 241 | 229 | 224 | 248 | | 224 | 248 |
| Property tax reconciliation | 127 | 101 |
| 115 | 86 | |
| Pension and other postretirement benefits deferrals | | 197 | 71 | | 169 | 47 |
| Deferred derivative losses | 117 | 17 | | 106 | 11 | 128 | 83 | | 118 | 76 |
| System peak reduction and energy efficiency programs | | 115 | 131 | | 114 | 130 |
| Municipal infrastructure support costs | 76 | 67 | | 76 | 67 | 78 | 75 | | 78 | 75 |
| Pension and other postretirement benefits deferrals | 73 | 73 | | 54 | 56 | |
| Deferred storm costs | 72 | 76 |
| — |
| — |
| 73 | 77 |
| — |
| — |
|
| System peak reduction and energy efficiency programs | 48 | 72 | | 47 | 70 | |
| Brooklyn Queens demand management program | | 39 | 39 | | 39 |
| Meadowlands heater odorization project | 35 | 36 | | 35 | 36 | 34 | 35 | | 34 | 35 |
| Brooklyn Queens demand management program | 34 | 39 | | 34 | 39 | |
| Unamortized loss on reacquired debt | 32 | 36 |
| 30 | 34 | 26 | 28 |
| 24 | 26 |
| Recoverable REV demonstration project costs | | 23 | 21 | | 20 | 19 |
| Preferred stock redemption | 23 | 23 | | 23 | 22 | 22 | | 22 |
| Recoverable REV demonstration project costs | 20 | 20 | | 18 | |
| Gate station upgrade project | 17 | 17 | | 17 | 19 | 19 | | 19 |
| Non-wire alternative projects | | 14 | 14 | | 14 | 14 |
| Workers’ compensation | 4 | 5 | | 4 | 5 | 2 | 3 | | 2 | 3 |
| O&R transition bond charges | 1 | 2 |
| — |
| — |
| |
| Indian Point Energy Center program costs | — |
| 13 | | — |
| 13 | |
| Other | 184 | 129 |
| 173 | 114 | 195 | 180 |
| 183 | 166 |
| Regulatory assets – noncurrent | 4,237 | 4,294 |
| 3,894 | 3,923 | 4,732 | 4,859 |
| 4,365 | 4,487 |
| Deferred derivative losses | 75 | 36 |
| 63 | 29 | 142 | 128 |
| 125 | 113 |
| Recoverable energy costs | 22 | 40 |
| 19 |
| 35 | 1 | — |
|
| — |
| — |
|
| Regulatory assets – current | 97 | 76 |
| 82 | 64 | 143 | 128 |
| 125 | 113 |
| Total Regulatory Assets | $4,334 | $4,370 |
| $3,976 | $3,987 | $4,875 | $4,987 |
| $4,490 | $4,600 |
| Regulatory liabilities |
|
|
|
|
|
|
|
|
| Future income tax | $2,470 | $2,515 | | $2,323 | $2,363 | $2,374 | $2,426 | | $2,224 | $2,275 |
| Allowance for cost of removal less salvage | 947 | 928 |
| 805 | 790 | 1,007 | 989 |
| 859 | 843 |
| TCJA net benefits* | 449 | 434 | | 429 | 411 | 421 | 471 | | 407 | 454 |
| Net proceeds from sale of property | | 166 | 173 | | 166 | 173 |
| Energy efficiency portfolio standard unencumbered funds | | 120 | 122 | | 117 | 118 |
| Net unbilled revenue deferrals | 155 | 117 |
| 155 | 117 | 95 | 199 |
| 95 | 199 |
| Energy efficiency portfolio standard unencumbered funds | 124 | 127 | | 119 | 122 | |
| Pension and other postretirement benefit deferrals | 63 | 62 | | 39 | 40 | 65 | 75 | | 35 | 46 |
| Net proceeds from sale of property | 45 | 6 | | 45 | 6 | |
| System benefit charge carrying charge | | 53 | 48 | | 47 | 44 |
| Property tax refunds | 45 | 45 | | 45 | 41 | 45 | | 41 | 45 |
| System benefit charge carrying charge | 37 | 27 | | 33 | 24 | |
| Unrecognized other postretirement costs | | 37 | 9 | | 3 | — |
|
| BQDM and REV Demo reconciliations | | 27 | 27 | | 25 | 26 |
| Settlement of gas proceedings | | 24 | 10 | | 24 | 10 |
| Sales and use tax refunds | | 19 | 8 | | 19 | 8 |
| Earnings sharing - electric, gas and steam | 25 | 36 |
| 17 | 27 | 18 | 22 |
| 10 | 15 |
| Settlement of prudence proceeding | 22 | 37 |
| 22 | 37 | 7 | 8 |
| 7 | 8 |
| BQDM and REV Demo reconciliations | 22 | 18 | | 22 | 18 | |
| Settlement of gas proceedings | 12 | 15 | | 12 | 15 | |
| Carrying charges on repair allowance and bonus depreciation | 10 | 21 | | 9 | 21 | |
| New York State income tax rate change | 8 | 17 |
| 8 | 17 | |
| Unrecognized other postretirement costs | 8 | 7 | | 3 | 7 | |
| Base rate change deferrals | 4 | 10 |
| 4 | 10 | |
| Property tax reconciliation | 2 | 36 |
| 2 | 36 | |
| Other | 156 | 183 |
| 122 | 152 | 215 | 195 |
| 183 | 163 |
| Regulatory liabilities – noncurrent | 4,604 | 4,641 |
| 4,214 | 4,258 | 4,689 | 4,827 |
| 4,262 | 4,427 |
| Refundable energy costs | 50 | 31 | | 22 | 8 | 68 | 44 | | 38 | 12 |
| Deferred derivative gains | | 33 | 34 |
| 33 | 34 |
| Revenue decoupling mechanism | 36 | 53 |
| 22 | 36 | 22 | 24 |
| 22 | 17 |
| Deferred derivative gains | 18 | 30 |
| 17 | 29 | |
| Regulatory liabilities – current | 104 | 114 |
| 61 | 73 | 123 | 102 |
| 93 | 63 |
| Total Regulatory Liabilities | $4,708 | $4,755 |
| $4,275 | $4,331 | $4,812 | $4,929 |
| $4,355 | $4,490 |
* See "Other Regulatory Matters," above.
Note C – Capitalization
In February 2019, Con Edison borrowed $825 million under a two-year variable-rate term loan to fund the repayment of a 6-month variable-rate term loan. In June 2019, Con Edison pre-paid $150 million of the amount borrowed.
In March 2019,January 2020, Con Edison issued 5,649,3691,050,000 shares of its common stock for $425$88 million upon physical settlement of the remaining shares subject to its November 2018May 2019 forward sale agreements.agreement.
In May 2019, Con Edison entered into a forward sale agreement relating to 5,800,000 shares of its common stock. In June 2019, the company issued 4,750,000 shares for $400 million upon physical settlement of shares subject to the forward sale agreement. At June 30, 2019, 1,050,000 shares remain subject to the forward sale agreement. The company expects the remaining shares under the forward sale agreement to settle by December 28, 2020. The company or the forward purchaser may accelerate the forward sale agreement upon the occurrence of certain events. On a settlement date, if the company decides to physically settle, it will issue shares to the forward purchaser at the then-applicable forward sale price. The forward sale price is equal to $84.83 per share subject to adjustment on a daily basis based on a floating interest rate factor less a spread and will be subject to decrease by amounts related to expected dividends. The remaining shares under the forward sale agreement will be physically settled, unless the company elects cash or net share settlement (which it has the right to do, subject to certain conditions, other than in limited circumstances). In the event the company elects to cash settle or net share settle, the settlement amount will be generally related to (1)(a) the market value of the common stock during the unwind period under the forward sale agreement minus (b) the applicable forward sale price; multiplied by (2) the number of shares subject to such cash settlement or net share settlement. If this settlement amount is a negative number, the forward purchaser will pay the company the absolute value of that amount or deliver to the company a number of shares having a value equal to the absolute value of such amount. If this settlement amount is a positive number, the company will pay the forward purchaser that amount or deliver to the forward purchaser a number of shares having a value equal to such amount.
In May 2019,March 2020, CECONY issued $700$600 million aggregate principal amount of 4.1253.35 percent debentures, due 2049. In April 2019, CECONY redeemed at maturity $4752030 and $1,000 million of 6.65 percent 10-year debentures.
In May 2019, O&R’s New Jersey utility subsidiary paid the remaining $1 millionaggregate principal amount of Transition Bonds issued in 2004.3.95 percent debentures, due 2050.
In May 2019, a Con Edison Development subsidiary borrowed $464 million, due 2026, secured by equity interests in solar electric production projects.
The carrying amounts and fair values of long-term debt at June 30, 2019March 31, 2020 and December 31, 20182019 were:
| | | (Millions of Dollars) | 2019 | 2018 | 2020 | 2019 |
| Long-Term Debt (including current portion) (a) | Carrying Amount | Fair Value | Carrying Amount | Fair Value | Carrying Amount | Fair Value | Carrying Amount | Fair Value |
| Con Edison | $19,468 | $21,626 | $18,145 | $18,740 | $21,516 | $23,381 | $19,973 | $22,738 |
| CECONY | $14,373 | $16,330 | $14,151 | $14,685 | $16,544 | $18,299 | $14,964 | $17,505 |
| |
| (a) | Amounts shown are net of unamortized debt expense and unamortized debt discount of $192$197 million and $142$170 million for Con Edison and CECONY, respectively, as of June 30, 2019March 31, 2020 and $185$178 million and $139$151 million for Con Edison and CECONY, respectively, as of December 31, 2018.2019. |
The fair values of the Companies' long-term debt have been estimated primarily using available market information and at June 30, 2019March 31, 2020 are classified as Level 2 (see Note M)N).
At December 31, 2018, the Clean Energy Businesses had $2,076 million of non-recourse project debt secured by the pledge of the applicable renewable energy production projects, of which $1,965 million was included in long-term debt and $111 million was included in long-term debt due within one year in Con Edison's consolidated balance sheet. As a result of the January 2019 PG&E bankruptcy (see "Long-Lived and Intangible Assets" in Note A), during the first quarter of 2019, Con Edison reclassified on its consolidated balance sheet the PG&E-related non-recourse project debt that was included in long-term debt to long-term debt due within one year. At June 30,March 31, 2020 and December 31, 2019, long-term debt due within one year included $1,032$980 million and $1,001 million of PG&E-related project debt.debt, respectively. The lenders for the PG&E-related project debt may, upon written notice, declare principal and interest on the PG&E-related project debt to be due and payable immediately and, if such amounts are not timely paid, foreclose on the related projects. The company is seeking to
negotiate agreements with the PG&E-related project debt lenders pursuant to which the lenders would defer exercising these remedies.
Note D – Short-Term Borrowing
At June 30, 2019,March 31, 2020, Con Edison had $1,161$1,208 million of commercial paper outstanding of which $849$597 million was outstanding under CECONY’s program. The weighted average interest rate at June 30, 2019March 31, 2020 was 2.63.5 percent for both Con Edison and CECONY. At December 31, 2018,2019, Con Edison had $1,741$1,692 million of commercial paper outstanding of which $1,192$1,137 million was outstanding under CECONY’s program. The weighted average interest rate at December 31, 20182019 was 3.02.0 percent for both Con Edison and CECONY.
At June 30, 2019March 31, 2020 and December 31, 2018, no2019, 0 loans were outstanding under the Companies' December 2016 credit agreement (Credit Agreement). An immaterial amount of letters of credit were outstanding under the Credit Agreement as of June 30, 2019March 31, 2020 and December 31, 2018. In April 2019, the termination date of the Credit Agreement was extended from December 2022 to December 2023 with respect to banks with aggregate commitments of $2,200 million.2019.
In April 2020, Con Edison entered into a credit agreement (the Supplemental Credit Agreement) under which banks are committed to provide loans, on a revolving credit basis until July 2, 2020, with an option, subject to certain conditions, for Con Edison to convert all loans outstanding on July 2, 2020 into a 270-day term loan. The banks committed to provide an aggregate amount of up to $750 million of credit. Subject to certain conditions, Con Edison and one or more banks may increase by up to $250 million the aggregate principal amount of loans available under the Supplemental Credit Agreement. Subject to certain exceptions, the commitments and loans under the Supplemental Credit Agreement are subject to mandatory termination and prepayment with the net cash proceeds of debt or equity issuances by Con Edison or its non-regulated subsidiaries. Con Edison intends to use the Supplemental Credit Agreement as additional liquidity and for other general corporate purposes. Con Edison has not entered into any loans under the Supplemental Credit Agreement.
The banks’ commitments under the Supplemental Credit Agreement are subject to certain conditions, including that there be no event of default. The commitments are not subject to maintenance of credit rating levels or the absence of a material adverse change. Upon a change of control of, or upon an event of default by Con Edison, the banks may terminate their commitments and declare the loans outstanding under the Supplemental Credit Agreement immediately due and payable. Events of Default include Con Edison exceeding at any time a ratio of consolidated debt to consolidated total capital of 0.65 to 1; having liens on its assets in an aggregate amount exceeding 5 percent of its consolidated total capital, subject to certain exceptions; Con Edison or any of its subsidiaries failing to make one or more payments in respect of material financial obligations (in excess of an aggregate $150 million of debt or derivative obligations other than non-recourse debt); the occurrence of an event or condition which results in the acceleration of the maturity of any material debt (in excess of an aggregate $150 million of debt other than non-recourse debt) or enables the holders of such debt to accelerate the maturity thereof; and other customary events of default.
Note E – Pension Benefits
Total Periodic Benefit Cost
The components of the Companies’ total periodic benefit cost for the three and six months ended June 30,March 31, 2020 and 2019 and 2018 were as follows:
|
| | | | |
| | For the Three Months Ended June 30, |
| | Con Edison | CECONY |
| (Millions of Dollars) | 2019 | 2018 | 2019 | 2018 |
| Service cost – including administrative expenses | $62 | $72 | $58 | $68 |
| Interest cost on projected benefit obligation | 150 | 140 | 141 | 131 |
| Expected return on plan assets | (247) | (258) | (234) | (245) |
| Recognition of net actuarial loss | 130 | 172 | 123 | 163 |
| Recognition of prior service cost/(credit) | (4) | (4) | (5) | (5) |
| TOTAL PERIODIC BENEFIT COST | $91 | $122 | $83 | $112 |
| Cost capitalized | (29) | (31) | (27) | (29) |
| Reconciliation to rate level | (2) | (23) | (1) | (25) |
| Total expense recognized | $60 | $68 | $55 | $58 |
| | | | For the Six Months Ended June 30, | For the Three Months Ended March 31, |
| | Con Edison | CECONY | Con Edison | CECONY |
| (Millions of Dollars) | 2019 | 2018 | 2019 | 2018 | 2020 | 2019 | 2020 | 2019 |
| Service cost – including administrative expenses | $125 | $145 | $117 | $136 | $73 | $62 | $69 | $58 |
| Interest cost on projected benefit obligation | 301 | 280 | 282 | 263 | 137 | 150 | 129 | 141 |
| Expected return on plan assets | (494) | (516) | (468) | (490) | (258) | (247) | (245) | (234) |
| Recognition of net actuarial loss | 259 | 344 | 246 | 326 | 175 | 130 | 165 | 123 |
| Recognition of prior service cost/(credit) | (9) | (9) | (10) | (4) | (4) | (5) | (5) |
| TOTAL PERIODIC BENEFIT COST | $182 | $244 | $167 | $225 | $123 | $91 | $113 | $83 |
| Cost capitalized | (55) | (62) | (52) | (59) | (31) | (26) | (29) | (24) |
| Reconciliation to rate level | (7) | (46) | (6) | (50) | (64) | (5) | (62) | (4) |
| Total expense recognized | $120 | $136 | $109 | $116 | $28 | $60 | $22 | $55 |
Components of net periodic benefit cost other than service cost are presented outside of operating income on the Companies' consolidated income statements, and only the service cost component is eligible for capitalization. Accordingly, the service cost component is included in the line "Other operations and maintenance" and the non-service cost components are included in the line "Other deductions" in the Companies' consolidated income statements.
Expected Contributions
Based on estimates as of June 30, 2019, the CompaniesMarch 31, 2020, Con Edison and CECONY expect to make contributions to the pension plans during 20192020 of $350$474 million (of which $318$434 million is to be made by CECONY). The Companies’ policy is to fund the total periodic benefit cost of the qualified plan to the extent tax deductible and to also contribute to the non-qualified supplemental plans. During the first sixthree months of 2019,2020, the Companies contributed $78$4 million to the pension plans, nearly all of which $77 million was madecontributed by CECONY. CECONY also contributed $15 million to the external trust for its non-qualified supplemental plan.
Note F – Other Postretirement Benefits
Total Periodic Benefit Cost
The components of the Companies’ total periodic other postretirement benefit cost/(credit) for the three and six months ended June 30,March 31, 2020 and 2019 and 2018 were as follows:
| | | | For the Three Months Ended June 30, | For the Three Months Ended March 31, |
| Con Edison | CECONY | Con Edison | CECONY |
| (Millions of Dollars) | 2019 | 2018 | 2019 |
| 2018 | 2020 |
| 2019 | 2020 | 2019 |
|
| Service cost | $4 | $5 | $3 | $3 | $5 | $4 | $4 | $3 |
| Interest cost on accumulated other postretirement benefit obligation | 11 | 11 | 9 | 9 | 9 | 11 | 8 | 9 |
| Expected return on plan assets | (16) | (18) | (14) | (16) | (16) | (16) | (14) | (14) |
| Recognition of net actuarial loss/(gain) | (2) | 2 | (2) | 1 | 27 | (2) | 27 | (2) |
| Recognition of prior service cost/(credit) | (1) | (2) | — |
| (1) | |
| Recognition of prior service credit | | (1) | (1) | (1) | — |
|
| TOTAL PERIODIC OTHER POSTRETIREMENT BENEFIT COST/(CREDIT) | $(4) | $(2) | $(4) | $(4) | $24 | $(4) | $24 | $(4) |
| Cost capitalized | (2) | (2) | (2) | (1) | (2) | (2) | (1) | (2) |
| Reconciliation to rate level | 3 | 2 | 2 | 2 | (22) | 3 | (24) | 2 |
| Total expense/(credit) recognized | $(3) | $(2) | $(4) | $(3) | |
| Total credit recognized | |
| $— |
| $(3) | $(1) | $(4) |
|
| | | | |
| | For the Six Months Ended June 30, |
| | Con Edison | CECONY |
| (Millions of Dollars) | 2019 | 2018 | 2019 | 2018 |
| Service cost | $9 | $10 | $6 | $7 |
| Interest cost on accumulated other postretirement benefit obligation | 22 | 21 | 18 | 17 |
| Expected return on plan assets | (33) | (37) | (27) | (31) |
| Recognition of net actuarial loss/(gain) | (4) | 4 | (5) | 1 |
| Recognition of prior service cost/(credit) | (2) | (3) | (1) | (1) |
| TOTAL PERIODIC OTHER POSTRETIREMENT BENEFIT COST/(CREDIT) | $(8) | $(5) | $(9) | $(7) |
| Cost capitalized | (4) | (4) | (3) | (3) |
| Reconciliation to rate level | 7 | 5 | 4 | 5 |
| Total expense/(credit) recognized | $(5) | $(4) | $(8) | $(5) |
For information about the presentation of the components of other postretirement benefit costs, see Note E.
Expected Contributions
Based on estimates as of June 30, 2019,March 31, 2020, Con Edison and CECONY expect to make contributionsa contribution of $10$3 million (of(all of which $7 million is to be made by CECONY) to the other postretirement benefit plans in 2019.2020. The Companies' policy is to fund the total periodic benefit cost of the plans to the extent tax deductible.
Note G – Environmental Matters
Superfund Sites
Hazardous substances, such as asbestos, polychlorinated biphenyls (PCBs) and coal tar, have been used or generated in the course of operations of the Utilities and their predecessors and are present at sites and in facilities and equipment they currently or previously owned, including sites at which gas was manufactured or stored.
The Federal Comprehensive Environmental Response, Compensation and Liability Act of 1980 and similar state statutes (Superfund) impose joint and several liability, regardless of fault, upon generators of hazardous substances
for investigation and remediation costs (which include costs of demolition, removal, disposal, storage, replacement, containment and monitoring) and natural resource damages. Liability under these laws can be material and may be imposed for contamination from past acts, even though such past acts may have been lawful at the time they occurred. The sites at which the Utilities have been asserted to have liability under these laws, including their manufactured gas plant sites and any neighboring areas to which contamination may have migrated, are referred to herein as “Superfund Sites.”
For Superfund Sites where there are other potentially responsible parties and the Utilities are not managing the site investigation and remediation, the accrued liability represents an estimate of the amount the Utilities will need to pay to investigate and, where determinable, discharge their related obligations. For Superfund Sites (including the manufactured gas plant sites) for which one of the Utilities is managing the investigation and remediation, the accrued liability represents an estimate of the company’s share of the undiscounted cost to investigate the sites and, for sites that have been investigated in whole or in part, the cost to remediate the sites, if remediation is necessary and if a reasonable estimate of such cost can be made. Remediation costs are estimated in light of the information available, applicable remediation standards and experience with similar sites.
The accrued liabilities and regulatory assets related to Superfund Sites at June 30, 2019March 31, 2020 and December 31, 20182019 were as follows:
| | | | Con Edison | CECONY | Con Edison | CECONY |
| (Millions of Dollars) | 2019 | 2018 | 2019 | 2018 | 2020 | 2019 | 2020 | 2019 |
| Accrued Liabilities: | | | | | | |
| Manufactured gas plant sites | $681 | $689 | $598 | $603 | $636 | $640 | $557 | $561 |
| Other Superfund Sites | 89 | 90 | 88 | 90 | 101 | 94 | 100 | 93 |
| Total | $770 | $779 | $686 | $693 | $737 | $734 | $657 | $654 |
| Regulatory assets | $787 | $810 | $696 | $716 | $735 | $732 | $652 | $647 |
Most of the accrued Superfund Site liability relates to sites that have been investigated, in whole or in part. However, for some of the sites, the extent and associated cost of the required remediation has not yet been determined. As investigations progress and information pertaining to the required remediation becomes available, the Utilities expect that additional liability may be accrued, the amount of which is not presently determinable but may be material. The Utilities are permitted to recover or defer as regulatory assets (for subsequent recovery through rates) prudently incurred site investigation and remediation costs.
Environmental remediation costs incurred related to Superfund Sites for the three and six months ended June 30,March 31, 2020 and 2019 and 2018 were as follows:
| | | | For the Three Months Ended June 30, | For the Three Months Ended March 31, |
| | Con Edison | CECONY | Con Edison | CECONY |
| (Millions of Dollars) | 2019 | 2018 | 2019 | 2018 | 2020 | 2019 | 2020 | 2019 |
| Remediation costs incurred | $8 | $6 | $6 | $5 | $5 | $3 | $5 | $2 |
|
| | | | |
| | For the Six Months Ended June 30, |
| | Con Edison | CECONY |
| (Millions of Dollars) | 2019 | 2018 | 2019 | 2018 |
| Remediation costs incurred | $11 | $9 | $8 | $8 |
Insurance and other third-party recoveries received by Con Edison or CECONY were immaterial for the three and six months ended June 30, 2019March 31, 2020 and 2018.2019.
In 2018,2019, Con Edison and CECONY estimated that for their manufactured gas plant sites (including CECONY’s Astoria site), the aggregate undiscounted potential liability for the investigation and remediation of coal tar and/or other environmental contaminants could range up to $2.8 billion and $2.6 billion, respectively. These estimates were based on the assumption that there is contamination at all sites, including those that have not yet been fully
investigated and additional assumptions about the extent of the contamination and the type and extent of the remediation that may be required. Actual experience may be materially different.
Asbestos Proceedings
Suits have been brought in New York State and federal courts against the Utilities and many other defendants, wherein a large number of plaintiffs sought large amounts of compensatory and punitive damages for deaths and injuries allegedly caused by exposure to asbestos at various premises of the Utilities. The suits that have been resolved, which are many, have been resolved without any payment by the Utilities, or for amounts that were not, in the aggregate, material to them. The amounts specified in all the remaining thousands of suits total billions of dollars; however, the Utilities believe that these amounts are greatly exaggerated, based on the disposition of previous claims. At June 30, 2019,March 31, 2020, Con Edison and CECONY have accrued their estimated aggregate undiscounted potential liabilities for these suits and additional suits that may be brought over the next 15 years as shown in the following table. These estimates were based upon a combination of modeling, historical data analysis and risk factor assessment. Courts have begun, and unless otherwise determined on appeal may continue, to apply different standards for determining liability in asbestos suits than the standard that applied historically. As a result, the Companies currently believe that there is a reasonable possibility of an exposure to loss in excess of the liability accrued for the suits. The Companies are unable to estimate the amount or range of such loss. In addition, certain current and former employees have claimed or are claiming workers’ compensation benefits based on alleged disability from exposure to asbestos. CECONY is permitted to defer as regulatory assets (for subsequent recovery through rates) costs incurred for its asbestos lawsuits and workers’ compensation claims.
The accrued liability for asbestos suits and workers’ compensation proceedings (including those related to asbestos exposure) and the amounts deferred as regulatory assets for the Companies at June 30, 2019March 31, 2020 and December 31, 20182019 were as follows:
| | | | Con Edison | CECONY | Con Edison | CECONY |
| (Millions of Dollars) | 2019 | 2018 | 2019 | 2018 | 2020 | 2019 | 2020 | 2019 |
| Accrued liability – asbestos suits | $8 | $8 | $7 | $8 | $8 | $7 |
| Regulatory assets – asbestos suits | $8 | $8 | $7 | $8 | $8 | $7 |
| Accrued liability – workers’ compensation | $79 | $79 | $75 | $77 | $78 | $72 | $73 |
| Regulatory assets – workers’ compensation | $4 | $5 | $4 | $5 | $2 | $3 | $2 | $3 |
Note H – Other Material Contingencies
Manhattan Explosion and Fire
On March 12, 2014, two2 multi-use five-story tall buildings located on Park Avenue between 116th and 117th Streets in Manhattan were destroyed by an explosion and fire. CECONY had delivered gas to the buildings through service lines from a distribution main located below ground on Park Avenue. EightNaN people died and more than 50 people were injured. Additional buildings were also damaged. The National Transportation Safety Board (NTSB) investigated. The parties to the investigation included the company, the City of New York, the Pipeline and Hazardous Materials Safety Administration and the NYSPSC. In June 2015, the NTSB issued a final report concerning the incident, its probable cause and safety recommendations. The NTSB determined that the probable cause of the incident was (1) the failure of a defective fusion joint at a service tee (which joined a plastic service line to a plastic distribution main) installed by the company that allowed gas to leak from the distribution main and migrate into a building where it ignited and (2) a breach in a City sewer line that allowed groundwater and soil to flow into the sewer, resulting in a loss of support for the distribution main, which caused it to sag and overstressed the defective fusion joint. The NTSB also made safety recommendations, including recommendations to the company that addressed its procedures for the preparation and examination of plastic fusions, training of its staff on conditions for notifications to the City’s Fire Department and extension of its gas main isolation valve installation program. In February 2017, the NYSPSC approved a settlement agreement with the company related to the NYSPSC's investigations of the incident and the practices of qualifying persons to perform plastic fusions. Pursuant to the agreement, the company is providing $27$27 million of future benefits to customers (for which it has accrued a regulatory liability) and will not recover from customers $126 million of costs for gas emergency response activities that it had previously incurred and expensed. Approximately eighty80 suits are pending against the company seeking generally unspecified damages and, in some cases, punitive damages, for wrongful death, personal injury, property damage and business interruption. The company has notified its insurers of the incident and believes that the policies in force at the time of the incident will cover the company’s costs, in excess of a required retention (the amount of which is not material), to satisfy any liability it may have for damages in connection with the incident. The company is unable to estimate the amount or range of its possible loss for damages related to the incident. At June 30, 2019,March 31, 2020, the company had not accrued a liability for damages related to the incident.
Manhattan Steam Main Rupture
In July 2018, a CECONY steam main located on Fifth Avenue and 21st Street in Manhattan ruptured. Debris from the incident included dirt and mud containing asbestos. The response to the incident required the closing of buildings and streets for various periods. The NYSPSC has commenced an investigation. As of June 30, 2019, with respect to the incident, the company incurred estimated operating costs of $16 million for property damage, clean- up and other response costs and invested $10 million in capital and retirement costs. The company has notified its insurers of the incident and believes that the policies currently in force will cover the company’s costs, in excess of a required retention (the amount of which is not material), to satisfy any liability it may have for damages to others in connection with the incident. The company is unable to estimate the amount or range of its possible loss related to the incident. At June 30, 2019, the company had not accrued a liability related to the incident.
Other Contingencies
For information about the PG&E bankruptcy, see "Long-Lived and Intangible Assets" in Note A and Note C. Also, for additional contingencies, see "Other Regulatory Matters" in Note B and “Uncertain Tax Positions” in Note J.
Guarantees
Con Edison and its subsidiaries have entered into various agreements providing financial or performance assurance primarily to third parties on behalf of their subsidiaries. Maximum amounts guaranteed by Con Edison under these agreements totaled $1,967$1,913 million and $2,439$1,831 million at June 30, 2019March 31, 2020 and December 31, 2018,2019, respectively.
A summary, by type and term, of Con Edison’s total guarantees under these agreements at June 30, 2019March 31, 2020 is as follows:
| | | Guarantee Type | 0 – 3 years | 4 – 10 years |
| > 10 years |
| Total | 0 – 3 years | 4 – 10 years |
| > 10 years |
| Total |
| | (Millions of Dollars) | (Millions of Dollars) |
| Con Edison Transmission | $535 | $137 |
| $— |
| $672 | $362 | $186 |
| $— |
| $548 |
| Energy transactions | 494 | 21 | 197 | 712 | 432 | 30 | 209 | 671 |
| Renewable electric production projects | 128 | 9 | 376 | 513 | 218 | 9 | 397 | 624 |
| Other | 70 | — |
| — |
| 70 | 70 | — |
| — |
| 70 |
| Total | $1,227 | $167 | $573 | $1,967 | $1,082 | $225 | $606 | $1,913 |
Con Edison Transmission — Con Edison has guaranteed payment by CET Electric of the contributions CET Electric agreed to make to New York Transco LLC (NY Transco). CET Electric owns a 45.7 percent interest in NY Transco. In April 2019, the New York Independent System Operator (NYISO) selected a transmission project that was jointly proposed by National Grid and NY Transco. The siting, construction and operation of the project will require approvals and permits from appropriate governmental agencies and authorities, including the NYSPSC. The NYISO indicated it will work with the developers to enter into agreements for the development and operation of the projects, including a schedule for entry into service by December 2023. Guarantee amountamounts shown includes the maximum possible required amount of CET Electric’s contributions for this project as calculated based on the
assumptions that the project is completed at 175 percent of its estimated costs and NY Transco does not use any debt financing for the project. Also included within the table above are guarantees for $124 million from Con Edison on behalf of CET Gas in relation to Mountain Valley Pipeline (MVP), LLC, a company developing a proposed gas transmission project in West Virginia and Virginia.
Energy Transactions — Con Edison guarantees payments on behalf of the Clean Energy Businesses in order to facilitate physical and financial transactions in electricity, gas, pipeline capacity, transportation, oil, renewable energy credits and energy services. To the extent that liabilities exist under the contracts subject to these guarantees, such liabilities are included in Con Edison’s consolidated balance sheet.
Renewable Electric Production Projects — Con Edison Con Edison Development, and Con Edison Solutionsthe Clean Energy Businesses guarantee payments on behalf of their wholly-owned subsidiaries associated with their investment in, or development for others of, solar and wind energy facilities.
Other — Other guarantees include $70 million in guarantees provided by Con Edison to Travelers Insurance Company for indemnity agreements for surety bonds in connection with operation of solar energy facilities and energy service projects of Con Edison Development and Con Edison Solutions, respectively.the Clean Energy Businesses.
Note I – Leases
In January 2019, the Companies adopted Accounting Standards Update (ASU) No. 2016-02, “Leases (Topic 842),” including the amendments thereto, using a modified retrospective transition method of adoption that required no prior period adjustments or charges to retained earnings for cumulative impact. The standard supersedes the lease requirements within ASC Topic 840, “Leases.”
The Companies lease land, office buildings, equipment and access rights to support electric transmission facilities. Upon adoption of Topic 842, the Companies recognized lease right-of-use assets and lease liabilities on their consolidated balance sheets for virtually all of their leases (other than leases that meet the definition of a short-term lease, the expense for which was immaterial). A lease right-of-use asset represents a right to use an identifiable underlying asset and obtain substantially all of the economic benefits from the use of that asset for the lease term. A lease liability represents an obligation to make lease payments arising from the lease. Leases are classified as either operating leases or finance leases. Operating leases are included in operating lease right-of-use asset and operating lease liabilities on the Companies’ consolidated balance sheets. Finance leases are included in other noncurrent assets, other current liabilities and other noncurrent liabilities. The Utilities, as regulated entities, are permitted to continue to recognize expense for operating leases using the timing that conforms to the regulatory rate treatment as rental payments recovered from our customers and to account the same way for finance leases. Lessor accounting is similar to the previous model, but updated to align with ASC Topic 606 “Revenue from Contracts with Customers."
The Companies elected the following practical expedients: (1) a package of practical expedients that allows the Companies to not reassess: (a) whether expired or existing contracts contained leases; (b) the lease classification for expired or existing leases and (c) the initial direct costs for existing leases; (2) for all underlying asset classes, an expedient that allows the Companies to not apply the recognition requirements to short-term leases and an expedient that allows the Companies to account for lease and associated non-lease components as a single lease component; (3) an expedient that allows the use of hindsight to determine lease term; and (4) an expedient that allows the Companies to not evaluate under Topic 842 land easements that exist or expired before the entity’s adoption of Topic 842 and that were not previously accounted for as leases under Topic 840.
The Companies, upon adoption of Topic 842 recognized, and for new operating leases at commencement date recognize, operating lease right-of-use assets and operating lease liabilities based on the present value of the future minimum lease payments over the lease term. As most of the Companies’ leases do not provide an implicit rate, the Companies used their collateralized incremental borrowing rate based on the information available at the commencement date to determine the present value of future payments. Most of the Companies’ leases have remaining lease terms of one year to 35 years, and may include options to renew or extend the leases for up to five years at the fair rental value. The Companies' lease terms may include options to renew, extend or terminate the lease when it is reasonably certain that the Companies will exercise that option. There were no leases with material variable lease payments or residual value guarantees.
Operating lease cost and cash paid for amounts included in the measurement of lease liabilities for the three and six months ended June 30,March 31, 2020 and 2019 were as follows:
| | | | For the Three Months Ended June 30, 2019 | Con Edison | CECONY |
| (Millions of Dollars) | Con Edison | CECONY | 2020 | 2019 | 2020 | 2019 |
| Operating lease cost |
| $21 |
|
| $16 |
|
| $21 |
|
| $21 |
|
| $16 |
|
| $16 |
|
| Operating lease cash flows |
| $9 |
|
| $4 |
|
| $11 |
|
| $8 |
|
| $4 |
|
| $4 |
|
|
| | | | | | |
| | For the Six Months Ended June 30, 2019 |
| (Millions of Dollars) | Con Edison | CECONY |
| Operating lease cost |
| $41 |
|
| $32 |
|
| Operating lease cash flows |
| $17 |
|
| $8 |
|
As of June 30, 2019,March 31, 2020, assets recorded as finance leases were $1 million for Con Edison and an immaterial amount for CECONY, were $2 million and $1 million, respectively, and the accumulated amortization associated with finance leases for Con Edison and CECONY were $5$3 million and $3$1 million, respectively. As of December 31, 2019, assets recorded as finance leases were $1 million for Con Edison and an immaterial amount for CECONY, and the accumulated amortization associated with finance leases for Con Edison and CECONY were $5 million and $3 million, respectively.
For the three and six months ended June 30,March 31, 2020 and 2019, finance lease costs and cash flows for Con Edison and CECONY were immaterial.
Right-of-use assets obtained in exchange for lease obligations were immaterial for Con Edison and CECONYfor the three and six months ended June 30,March 31, 2020 and 2019.
Other information related to leases for Con Edison and CECONY at June 30,March 31, 2020 and December 31, 2019 waswere as follows:
| | | | Con Edison | CECONY |
| Con Edison | CECONY | 2020 | 2019 | 2020 | 2019 |
| Weighted Average Remaining Lease Term: | | | | | |
| Operating leases | 19.1 years | 14.5 years | 19.5 years | 19.8 years | 13.8 years | 14.0 years |
| Finance leases | 10.5 years | 2.3 years | 13.1 years | 12.2 years | 2.5 years | 2.4 years |
| Weighted Average Discount Rate: | | | | | |
| Operating leases | 4.3% | 3.6% | 4.3% | 4.3% | 3.6% |
| Finance leases | 4.0% | 5.1% | 3.2% | 3.5% | 3.5% | 4.1% |
Future minimum lease payments under non-cancellable leases at June 30, 2019March 31, 2020 were as follows:
| | | (Millions of Dollars) | Con Edison | CECONY | Con Edison | CECONY |
| Year Ending June 30, | Operating Leases | Finance Leases | Operating Leases | Finance Leases | |
| 2020 | $77 | $1 | $58 | $1 | |
| Year Ending March 31, | | Operating Leases | Finance Leases | Operating Leases | Finance Leases |
| 2021 | 74 | — |
| 57 | — |
| $77 |
| $— |
| $59 |
| $— |
|
| 2022 | 70 | — |
| 54 | — |
| 74 | — |
| 56 | — |
|
| 2023 | 68 | — |
| 53 | — |
| 72 | — |
| 54 | — |
|
| 2024 | 68 | — |
| 53 | — |
| 72 | — |
| 54 | — |
|
| 2025 | | 72 | — |
| 55 | — |
|
| All years thereafter | 970 | 1 | 551 | — |
| 983 | 1 | 499 | — |
|
| Total future minimum lease payments | $1,327 | $2 | $826 | $1 | $1,350 | $1 | $777 |
| $— |
|
| Less: imputed interest | (451) | — |
| (185) | — |
| (474) | — |
| (170) | — |
|
| Total | $876 | $2 | $641 | $1 | $876 | $1 | $607 |
| $— |
|
| Reported as of June 30, 2019 | | | | | |
| Reported as of March 31, 2020 | | | | | |
| Operating lease liabilities (current) | $55 |
| $— |
| $46 |
| $— |
| $77 |
| $— |
| $59 |
| $— |
|
| Operating lease liabilities (noncurrent) | 821 | — |
| 595 | — |
| 799 | — |
| 548 | — |
|
| Other current liabilities | — |
| 1 | — |
| 1 | |
| Other noncurrent liabilities | — |
| 1 | — |
| — |
| — |
| 1 | — |
| — |
|
| Total | $876 | $2 | $641 | $1 | $876 | $1 | $607 |
| $— |
|
At June 30, 2019,March 31, 2020, the Companies dodid not have material obligations under operating or finance leases that havehad not yet commenced.
Disclosures related to the three and six months ended June 30, 2019 are presented as required under Topic 842. Prior period disclosures for the year ended December 31, 2018 are presented under Topic 840. The Companies have elected to use a practical expedient provided by Topic 842 whereby comparative disclosures for prior periods are allowed to be presented under Topic 840. Prior period disclosures under Topic 840 have been provided on an annual basis. As a result, the disclosures presented under Topic 842 and Topic 840 will not be fully comparable in specific disclosure requirements or time period.
The future minimum lease commitments at December 31, 2018, accounted for under Topic 840, for the Companies’ operating lease agreements that are not cancellable by the Companies were as follows:
|
| | |
| (Millions of Dollars) | Con Edison | CECONY |
| 2019 | $72 | $56 |
| 2020 | 72 | 56 |
| 2021 | 71 | 54 |
| 2022 | 68 | 53 |
| 2023 | 68 | 53 |
| All years thereafter | 890 | 592 |
| Total | $1,241 | $864 |
The Companies are lessors under certain leases whereby the Companies own real estate and distribution poles and lease portions of them to others. Revenue under such leases was immaterial for Con Edison and CECONY for the three and six months ended June 30,March 31, 2020 and 2019.
Note J – Income Tax
In response to the economic impacts of the COVID-19 pandemic, the Coronavirus Aid, Relief, and Economic Security Act (CARES Act) was signed into law on March 27, 2020. The CARES Act provides relief to corporate taxpayers by permitting a five-year carryback of net operating losses (NOLs) for tax years 2018, 2019 and 2020, removing the 80 percent limitation when applying the NOLs to carryback years, increasing the 30 percent limitation on interest deductibility to 50 percent of adjusted taxable income for tax years 2019 and 2020, and provides for certain employment tax credits and refunds for eligible employers.
Under the CARES Act, Con Edison will carryback its $29 million NOL from tax year 2018 to tax year 2013 generating a $2.5 million net tax refund for which a tax receivable was established at March 31, 2020. In addition, Con Edison recognized a discrete income tax benefit of $4 million in the first quarter of 2020, due to the higher federal statutory tax rate in 2013. The 2018 federal NOL was recorded at 21 percent and will be carried back to tax year 2013, which had a 35 percent federal statutory tax rate. This tax benefit was primarily recognized at the Clean Energy Businesses.
Con Edison’s income tax expense decreased to $19$55 million for the three months ended June 30, 2019March 31, 2020 from $38$108 million for the three months ended June 30, 2018.March 31, 2019. The decrease in income tax expense is primarily due to lower income before income tax expense (excluding income attributable to noncontrolling interest (see Note N)O)), lower state income taxes, an increase in the amortization of excess deferred federal income taxes due to CECONY’s new rate plan beginning in the TCJAfirst quarter of 2020, and higher renewable energy credits, offset in part by an increase in uncertaina $4 million income tax positions.benefit due to the ability to carryback a net operating loss (NOL) from the 2018 tax year to the 2013 tax year as allowed under the CARES Act.
CECONY’s income tax expense decreased to $27$95 million for the three months ended June 30, 2019March 31, 2020 from $31$124 million for the three months ended June 30, 2018.March 31, 2019. The decrease in income tax expense is primarily due to lower state income taxes, higherbefore income tax benefits in 2019 for plant-related flow through items,expense and an increase in the amortization of excess deferred federal income taxes due to CECONY’s new rate plan beginning in the TCJA.first quarter of 2020, offset, in part, by higher state income taxes.
Reconciliation of the difference between income tax expense and the amount computed by applying the prevailing statutory income tax rate to income before income taxes for the three months ended June 30,March 31, 2020 and 2019 and 2018 is as follows:
|
| | | | | | | | |
| | Con Edison | CECONY |
| (% of Pre-tax income) | 2019 |
| 2018 |
| 2019 |
| 2018 |
|
| STATUTORY TAX RATE | | | | |
| Federal | 21 | % | 21 | % | 21 | % | 21 | % |
| Changes in computed taxes resulting from: | | | | |
| State income tax | 3 |
| 5 |
| 3 |
| 4 |
|
| Cost of removal | 2 |
| 2 |
| 2 |
| 2 |
|
| Other plant-related items | (2 | ) | (1 | ) | (1 | ) | (1 | ) |
| Renewable energy credits | (5 | ) | (3 | ) | — |
| — |
|
| Reserve for uncertain tax positions | 2 |
| — |
| — |
| — |
|
| Amortization of excess deferred federal income taxes | (10 | ) | (7 | ) | (9 | ) | (8 | ) |
| Other | — |
| — |
| (1 | ) | (1 | ) |
| Effective tax rate | 11 | % | 17 | % | 15 | % | 17 | % |
Con Edison’s income tax expense decreased to $127 million for the six months ended June 30, 2019 from $156 million for the six months ended June 30, 2018. The decrease in income tax expense is primarily due to lower income before income tax expense (excluding income attributable to noncontrolling interest (see Note N)), lower state income taxes, an increase in the amortization of excess deferred federal income taxes due to the TCJA and higher renewable energy credits.
CECONY’s income tax expense increased to $151 million for the six months ended June 30, 2019 from $150 million for the six months ended June 30, 2018. The increase in income tax expense is primarily due to higher income before income tax expense, offset in part by higher tax benefits in 2019 for plant-related flow through items, an increase in the amortization of excess deferred federal income taxes due to the TCJA, a decrease in non-deductible business expenses and an increase in research and development credits.
Reconciliation of the difference between income tax expense and the amount computed by applying the prevailing statutory income tax rate to income before income taxes for the six months ended June 30, 2019 and 2018 is as follows:
| | | | Con Edison | CECONY | Con Edison | CECONY |
| (% of Pre-tax income) | 2019 |
| 2018 |
| 2019 |
| 2018 |
| 2020 |
| 2019 |
| 2020 |
| 2019 |
|
| STATUTORY TAX RATE | | | | | | |
| Federal | 21 | % | 21 | % | 21 | % | 21 | % | 21 | % | 21 | % | 21 | % | 21 | % |
| Changes in computed taxes resulting from: | | | | | | |
| State income tax | 4 |
| 5 |
| 4 |
| 5 |
| 4 |
| 4 |
| 5 |
| 5 |
|
| Taxes attributable to non-controlling interest | | (1 | ) | (1 | ) | — |
| — |
|
| Cost of removal | 1 |
| 1 |
| 1 |
| 1 |
| 2 |
| 1 |
| 2 |
| 1 |
|
| Other plant-related items | (1 | ) | (1 | ) | (1 | ) | (1 | ) | (1 | ) | — |
| (1 | ) | — |
|
| Renewable energy credits | (2 | ) | (2 | ) | — |
| — |
| (2 | ) | (1 | ) | — |
| — |
|
| CARES Act NOL carryback | | (1 | ) | — |
| — |
| — |
|
| Amortization of excess deferred federal income taxes | (5 | ) | (4 | ) | (4 | ) | (4 | ) | (9 | ) | (3 | ) | (8 | ) | (3 | ) |
| Other | | (1 | ) | (1 | ) | — |
| (1 | ) |
| Effective tax rate | 18 | % | 20 | % | 21 | % | 22 | % | 12 | % | 20 | % | 19 | % | 23 | % |
CECONY and O&R deferred as regulatory liabilities theirits estimated net benefits under the TCJA for the six months ended June 30, 2018. CECONY's net benefits prior to January 1, 2019 for its electric service and amortization of excess deferred federal income taxes for its electric service for the six months ended June 30, 2019 continue to be deferred. RECO deferred as a regulatory liability its estimated net benefits under the TCJA for the three months ended March 31, 2018.2019. The net benefits include the revenue requirement impact of the reduction in the corporate federal income tax rate to 21 percent, the elimination for utilities of bonus depreciation and the amortization of excess deferred federal income taxes the utilities collected from customers that will not need to be paid to the Internal Revenue Service under the TCJA. See “Other Regulatory Matters” in Note B.
Under CECONY’s new electric rate plan that began in the first quarter of 2020, the deferral of its net benefits for its electric service ceased and is included in its new rates. Additionally, the amortization of the unprotected excess deferred federal income taxes for its electric and gas services is being amortized over a five-year period, which increased the tax benefit in the first quarter of 2020.
Uncertain Tax Positions
At June 30, 2019,March 31, 2020, the estimated liability for uncertain tax positions for Con Edison was $8$13 million ($53 million for CECONY). Con Edison reasonably expects to resolve within the next twelve months approximately $3$10 million of various federal and state uncertainties due to the expected completion of ongoing tax examinations, of which the entire amount, if recognized, would reduce Con Edison's effective tax rate. The amount related to CECONY is approximately $2$1 million, which, if recognized, would reduce CECONY’s effective tax rate. The total amount of unrecognized tax benefits, if recognized, that would reduce Con Edison’s effective tax rate is $8$13 million ($712 million, net of federal taxes). with $3 million attributable to CECONY.
The Companies recognize interest on liabilities for uncertain tax positions in interest expense and would recognize penalties, if any, in operating expenses in the Companies’ consolidated income statements. In the three and six months ended June 30, 2019,March 31, 2020, the Companies recognized an immaterial amount of interest expense orand penalties for uncertain tax positions in their consolidated income statements. At June 30, 2019March 31, 2020 and December 31, 2018,2019, the Companies recognized an immaterial amount of accrued interest on their consolidated balance sheets.
Note K – Revenue Recognition
The following table presents, for the three months ended March 31, 2020 and 2019, revenue from contracts with customers as defined in Accounting Standards Codification (ASC) Topic 606, "Revenue from Contracts with Customers," as well as additional revenue from sources other than contracts with customers, disaggregated by major source.
|
| | | | | | | | | | | | | |
| | For the Three Months Ended March 31, 2020 | For the Three Months Ended March 31, 2019 |
| (Millions of Dollars) | Revenues from contracts with customers | | Other revenues (a) | Total operating revenues | Revenues from contracts with customers | | Other revenues (a) | Total operating revenues |
| CECONY | | | | | | | | |
| Electric | $1,732 | | $38 | $1,770 | $1,714 | | $83 | $1,797 |
| Gas | 833 | | 1 | 834 | 910 | | 11 |
| 921 |
| Steam | 245 | | 5 | 250 | 317 | | 4 |
| 321 |
| Total CECONY | $2,810 | | $44 | $2,854 | $2,941 | | $98 | $3,039 |
| O&R | | | | | | | | |
| Electric | 128 | | 8 | 136 | 143 | | 2 | 145 |
| Gas | 93 | �� | 4 | 97 | 114 | | (1) | 113 |
| Total O&R | $221 | | $12 | $233 | $257 | | $1 | $258 |
| Clean Energy Businesses | | | | | | | | |
| Renewables | 114 | (b) | — |
| 114 | 106 | (b) | — |
| 106 |
| Energy services | 11 | | — |
| 11 | 23 | | — |
| 23 |
| Other | — |
| | 21 | 21 | — |
| | 88 | 88 |
| Total Clean Energy Businesses | $125 | | $21 | $146 | $129 | | $88 | $217 |
| Con Edison Transmission | 1 | | — |
| 1 | 1 | | — |
| 1 |
| Other (c) | — |
| | — |
| — |
| — |
| | (1) | (1) |
| Total Con Edison | $3,157 | | $77 | $3,234 | $3,328 | | $186 | $3,514 |
36(a) For the Utilities, this includes revenue from alternative revenue programs, such as the revenue decoupling mechanisms under their New York electric and gas rate plans.For the Clean Energy Businesses, this includes revenue from wholesale services.
(b) Included within the totals for Renewables revenue at the Clean Energy Businesses is $3 million and $2 million for the three months ended March 31, 2020 and 2019, respectively, of revenue related to engineering, procurement and construction services.
| |
| (c) | Parent company and consolidation adjustments. |
|
| | | | | | | | |
| | 2020 | 2019 |
| (Millions of Dollars) | Unbilled contract revenue (a) | Unearned revenue (b) |
| | Unbilled contract revenue (a) | Unearned revenue (b) |
| |
| Beginning balance as of January 1, | $29 | $17 | | $29 | $20 | |
| Additions (c) | 14 | — |
| | 24 | — |
| |
| Subtractions (c) | 18 | 1 | (d) | 15 | 1 | (d) |
| Ending balance as of March 31, | $25 | $16 | | $38 | $19 | |
| |
| (a) | Unbilled contract revenue represents accumulated incurred costs and earned profits on contracts (revenue arrangements), which have been recorded as revenue, but have not yet been billed to customers, and which represent contract assets as defined in Topic 606. Substantially all accrued unbilled contract revenue is expected to be collected within one year. Unbilled contract revenue arises from the cost-to-cost method of revenue recognition. Unbilled contract revenue from fixed-price type contracts is converted to billed receivables when amounts are invoiced to customers according to contractual billing terms, which generally occur when deliveries or other performance milestones are completed. |
| |
| (b) | Unearned revenue represents a liability for billings to customers in excess of earned revenue, which are contract liabilities as defined in Topic 606. |
| |
| (c) | Additions for unbilled contract revenue and subtractions for unearned revenue represent additional revenue earned. Additions for unearned revenue and subtractions for unbilled contract revenue represent billings. Activity also includes appropriate balance sheet classification for the period. |
| |
| (d) | Of the subtractions from unearned revenue, $1 million was included in the balances as of January 1, 2020 and 2019. |
As of March 31, 2020, the aggregate amount of the remaining fixed performance obligations of the Clean Energy Businesses under contracts with customers for energy services is $74 million, of which $38 million will be recognized within the next two years, and the remaining $36 million will be recognized pursuant to long-term service and maintenance agreements.
In March 2020, the Utilities began suspending new late payment charges and certain other fees for all customers. The amount of these charges that was not collected for the three months ended March 31, 2020 was $3 million for Con Edison and CECONY. The Utilities also began providing payment extensions for all customers that were scheduled to be disconnected prior to the start of the COVID-19 pandemic. See "COVID-19 Regulatory Matters" in Note B.
Note KL – Financial Information by Business Segment
Con Edison’s principal business segments are CECONY’s regulated utility activities, O&R’s regulated utility activities, the Clean Energy Businesses and Con Edison Transmission. CECONY’s principal business segments are its regulated electric, gas and steam utility activities. The financial data for the business segments for the three and six months ended June 30,March 31, 2020 and 2019 and 2018 were as follows:
|
| | | | | | | | | | | | | | | | | | |
| | For the Three Months Ended June 30, |
| | Operating
revenues | Inter-segment
revenues | Depreciation and
amortization | Operating
income/(loss) |
| (Millions of Dollars) | 2019 |
| 2018 |
| 2019 |
| 2018 |
| 2019 |
| 2018 |
| 2019 |
| 2018 |
|
| CECONY | | | | | | | | |
| Electric | $1,833 | $1,807 | $5 | $4 | $261 | $243 | $314 | $318 |
| Gas | 408 | 435 | 2 | 2 | 56 | 51 | 94 | 82 |
| Steam | 90 | 96 | 16 | 18 | 22 | 22 | (32) | (18) |
| Consolidation adjustments | — |
| — |
| (23) | (24) | — |
| — |
| — |
| — |
|
| Total CECONY | $2,331 | $2,338 |
| $— |
|
| $— |
| $339 | $316 | $376 | $382 |
| O&R | | | | | | | | |
| Electric | $138 | $144 |
| $— |
|
| $— |
| $15 | $14 | $16 | $18 |
| Gas | 41 | 54 | — |
| — |
| 6 | 5 | (3) | 5 |
| Total O&R | $179 | $198 |
| $— |
|
| $— |
| $21 | $19 | $13 | $23 |
| Clean Energy Businesses | $233 | $158 |
| $— |
|
| $— |
| $58 | $19 | $72 | $24 |
| Con Edison Transmission | 1 | 1 | — |
| — |
| — |
| — |
| (2) | (1) |
| Other (a) | — |
| 1 | — |
| — |
| — |
| — |
| (1) | (2) |
| Total Con Edison | $2,744 | $2,696 |
| $— |
|
| $— |
| $418 | $354 | $458 | $426 |
(a) Parent company and consolidation adjustments. Other does not represent a business segment.
| | | | For the Six Months Ended June 30, | For the Three Months Ended March 31, |
| | Operating
revenues | Inter-segment
revenues | Depreciation and
amortization | Operating
income/(loss) | Operating
revenues | Inter-segment
revenues | Depreciation and
amortization | Operating
income/(loss) |
| (Millions of Dollars) | 2019 |
| 2018 |
| 2019 |
| 2018 |
| 2019 |
| 2018 |
| 2019 |
| 2018 |
| 2020 |
| 2019 |
| 2020 |
| 2019 |
| 2020 |
| 2019 |
| 2020 |
| 2019 |
|
| CECONY | | | | | | |
| Electric | $3,630 | $3,536 | $9 | $8 | $518 | $483 | $571 | $1,770 | $1,797 | $4 | $297 | $257 | $282 | $257 |
| Gas | 1,330 | 1,276 | 3 | 4 | 111 | 100 | 438 | 404 | 834 | 921 | 2 | 71 | 55 | 369 | 344 |
| Steam | 411 | 410 | 35 | 37 | 44 | 43 | 92 | 112 | 250 | 321 | 19 | 18 | 22 | 91 | 125 |
| Consolidation adjustments | — |
| — |
| (47) | (49) | — |
| — |
| — |
| — |
| — |
| — |
| (25) | (24) | — |
| — |
| — |
| — |
|
| Total CECONY | $5,371 | $5,222 |
| $— |
|
| $— |
| $673 | $626 | $1,101 | $1,087 | $2,854 | $3,039 |
| $— |
|
| $— |
| $390 | $334 | $742 | $726 |
| O&R |
|
|
| | | |
| Electric | $283 | $293 |
| $— |
|
| $— |
| $30 | $28 | $31 | $26 | $136 | $145 |
| $— |
|
| $— |
| $16 | $15 | $14 | $16 |
| Gas | 154 | 152 | — |
| — |
| 12 | 10 | 36 | 42 | 97 | 113 | — |
| — |
| 6 | 41 | 38 |
| Total O&R | $437 | $445 |
| $— |
|
| $— |
| $42 | $38 | $67 | $68 | $233 | $258 |
| $— |
|
| $— |
| $22 | $21 | $55 | $54 |
| Clean Energy Businesses | 450 | 391 | — |
| — |
| 116 | 38 | 83 | 33 | $146 | $217 |
| $— |
|
| $— |
| $57 | $58 | $14 | $11 |
| Con Edison Transmission | 2 | — |
| — |
| — |
| — |
| (3) | 1 | — |
| — |
| 1 | — |
| (2) |
| Other (a) | (2 | ) | — |
| — |
| — |
| — |
| — |
| (4) | (5) | — |
| (1) | — |
| — |
| — |
| — |
| (1) | (3) |
| Total Con Edison | $6,258 | $6,060 |
| $— |
|
| $— |
| $831 | $702 | $1,244 | $1,180 | $3,234 | $3,514 |
| $— |
|
| $— |
| $470 | $413 | $808 | $786 |
(a) Parent company and consolidation adjustments. Other does not represent a business segment.
Note LM – Derivative Instruments and Hedging Activities
The Utilities and the Clean Energy BusinessesCon Edison’s subsidiaries hedge market price fluctuations associated with physical purchases and sales of electricity, natural gas, steam and, to a lesser extent, refined fuels by using derivative instruments including futures, forwards, basis swaps, options, transmission congestion contracts and financial transmission rights contracts. These are economic hedges, for which the Utilities and the Clean Energy Business do not elect hedge accounting. The Clean Energy Businesses use interest rate swaps to manage the risks associated with interest rates related to outstanding and expected future debt issuances and borrowings. Derivatives are recognized on the consolidated balance sheet at fair value (see Note M)N), unless an exception is available under the accounting rules for derivatives and hedging. Qualifying derivative contracts that have been designated as normal purchases or normal sales contracts are not reported at fair value under the accounting rules.
In August 2017, the FASB issued amendments to the guidance for derivatives and hedging through ASU 2017-12, “Derivatives and Hedging (Topic 815): Targeted Improvements to Accounting for Hedging Activities.” The amendments in this update provide greater clarification on hedge accounting for risk components, presentation and disclosure of hedging instruments, and overall targeted improvements to simplify hedge accounting. The amendments were effective for reporting periods beginning after December 15, 2018. The application of the guidance did not have a material impact on the Companies’ financial position, results of operations and liquidity because the Companies do not elect hedge accounting for their derivative instruments and hedging activities.
The fair values of the Companies’ derivatives including the offsetting of assets and liabilities on the consolidated balance sheet at June 30, 2019March 31, 2020 and December 31, 20182019 were:
| | | (Millions of Dollars) | 2019 | | 2018 | | 2020 | | 2019 | |
| Balance Sheet Location | Gross Amounts of Recognized Assets/(Liabilities) | Gross Amounts Offset | Net Amounts of Assets/ (Liabilities) (a) | | Gross Amounts of Recognized Assets/(Liabilities) | Gross Amounts Offset | Net Amounts of Assets/ (Liabilities) (a) | | Gross Amounts of Recognized Assets/(Liabilities) | Gross Amounts Offset | Net Amounts of Assets/ (Liabilities) (a) | | Gross Amounts of Recognized Assets/(Liabilities) | Gross Amounts Offset | Net Amounts of Assets/ (Liabilities) (a) | |
| Con Edison | | | | | | | | | |
| Fair value of derivative assets | | | | | | | |
| Current | $37 | $(24) | $13 | (b) | $43 | $(14) | $29 | (b) | $61 | $(4) | $57 | (b) | $60 | $(3) | $57 | (b) |
| Noncurrent | 6 | (6) | — |
| | 16 | (7) | 9 | (d) | 17 | (9) | 8 | | 19 | (13) | 6 | (d) |
| Total fair value of derivative assets | $43 | $(30) | $13 | | $59 | $(21) | $38 | | $78 | $(13) | $65 | | $79 | $(16) | $63 | |
| Fair value of derivative liabilities | | | | | | | |
| Current | $(97) | $29 | $(68) | (c) | $(61) | $11 | $(50) | | $(167) | $14 | $(153) | (c) | $(140) | $17 | $(123) | (d) |
| Noncurrent | (152) | 22 | (130) | (c) | (25) | 9 | (16) | (d) | (241) | 13 | (228) | (c) | (122) | 16 | (106) | (d) |
| Total fair value of derivative liabilities | $(249) | $51 | $(198) | | $(86) | $20 | $(66) | | $(408) | $27 | $(381) | | $(262) | $33 | $(229) | |
| Net fair value derivative assets/(liabilities) | $(206) | $21 | $(185) | | $(27) | $(1) | $(28) | | $(330) | $14 | $(316) | | $(183) | $17 | $(166) | |
| CECONY | | | | | | | | | |
| Fair value of derivative assets | | | | | | | |
| Current | $26 | $(16) | $10 | (b) | $25 | $(6) | $19 | (b) | $44 | $(14) | $30 | (b) | $39 | $(6) | $33 | (b) |
| Noncurrent | 4 | (4) | — |
| | 11 | (5) | 6 | | 16 | (8) | 8 | | 17 | (12) | 5 | |
| Total fair value of derivative assets | $30 | $(20) | $10 | | $36 | $(11) | $25 | | $60 | $(22) | $38 | | $56 | $(18) | $38 | |
| Fair value of derivative liabilities | | | | | | | |
| Current | $(66) | $25 | $(41) | | $(31) | $6 | $(25) | | $(123) | $24 | $(99) | | $(100) | $19 | $(81) | |
| Noncurrent | (106) | 20 | (86) | | (12) | 6 | (6) | | (122) | 9 | (113) | | (80) | 16 | (64) | |
| Total fair value of derivative liabilities | $(172) | $45 | $(127) | | $(43) | $12 | $(31) | | $(245) | $33 | $(212) | | $(180) | $35 | $(145) | |
| Net fair value derivative assets/(liabilities) | $(142) | $25 | $(117) | | $(7) | $1 | $(6) | | $(185) | $11 | $(174) | | $(124) | $17 | $(107) | |
| |
| (a) | Derivative instruments and collateral were offset on the consolidated balance sheet as applicable under the accounting rules. The Companies enter into master agreements for their commodity derivatives. These agreements typically provide offset in the event of contract termination. In such case, generally the non-defaulting party’s payable will be offset by the defaulting party’s payable. The non-defaulting party will customarily notify the defaulting party within a specific time period and come to an agreement on the early termination amount. |
| |
| (b) | At June 30, 2019March 31, 2020 and December 31, 2018,2019, margin deposits for Con Edison ($68 million and $7$9 million, respectively) and CECONY ($67 million and $6$8 million, respectively) were classified as derivative assets on the consolidated balance sheet, but not included in the table. Margin is collateral, typically cash, that the holder of a derivative instrument is required to deposit in order to transact on an exchange and to cover its potential losses with its broker or the exchange. |
| |
| (c) | Includes amounts for interest rate swaps of $(5) $(17) million in current liabilities and $(32)$(109) million in noncurrent liabilities. At June 30, 2019March 31, 2020, the Clean Energy Businesses had interest rate swaps with notional amounts of $829$910 million. The expiration dates of the swaps range from 2024-2041. |
| |
| (d) | Includes amounts for interest rate swaps of $2$1 million in noncurrent assets, $(7) million in current liabilities and $(6)$(34) million in noncurrent liabilities. At December 31, 20182019, the Clean Energy BusinessBusinesses had interest rate swaps with notional amounts of $499$919 million. The expiration dates of the swaps range from 2024-2035.2024-2041. |
The Utilities generally recover their prudently incurred fuel, purchased power and gas costs, including hedging gains and losses, in accordance with rate provisions approved by the applicable state utility regulators. In accordance with the accounting rules for regulated operations, the Utilities record a regulatory asset or liability to defer recognition of unrealized gains and losses on their electric and gas derivatives. As gains and losses are realized in future periods, they will be recognized as purchased power, gas and fuel costs in the Companies’ consolidated income statements.
The Clean Energy Businesses record realized and unrealized gains and losses on their derivative contracts in purchased power, gas purchased for resale and non-utility revenue in the reporting period in which they occur. The
Clean Energy Businesses record changes in the fair value of their interest rate swaps in other interest expense at the end of each reporting period. Management believes that these derivative instruments represent economic hedges that mitigate exposure to fluctuations in commodity prices and interest rates.
The following table presents the realized and unrealized gains or losses on derivatives that have been deferred or recognized in earnings for the three and six months ended June 30, 2019March 31, 2020 and 2018:2019:
|
| | | | | | | | | | | | | | |
| | | For the Three Months Ended June 30, |
| | | Con Edison | | CECONY |
| (Millions of Dollars) | Balance Sheet Location | 2019 |
| 2018 |
| | 2019 |
| 2018 |
|
| Pre-tax gains/(losses) deferred in accordance with accounting rules for regulated operations: | | | |
| Current | Deferred derivative gains | $(16) | $5 | | $(15) | $6 |
| Noncurrent | Deferred derivative gains | (2) | 7 | | — |
| 3 |
| Total deferred gains/(losses) | | $(18) | $12 | | $(15) | $9 |
| Current | Deferred derivative losses | $(36) | $44 | | $(34) | $42 |
| Current | Recoverable energy costs | (41) | (34) | | (37) | (34) |
| Noncurrent | Deferred derivative losses | (74) | 59 | | (68) | 56 |
| Total deferred gains/(losses) | | $(151) | $69 | | $(139) | $64 |
| Net deferred gains/(losses) | | $(169) | $81 | | $(154) | $73 |
| | Income Statement Location | | | | | |
| Pre-tax gains/(losses) recognized in income | | | | | |
| | Purchased power expense |
| $— |
|
| $— |
| |
| $— |
|
| $— |
|
| | Gas purchased for resale | — |
| (1) | | — |
| — |
|
| | Non-utility revenue | 7 | (3) | | — |
| — |
|
| | Other interest expense | (24) | — |
| | — |
| — |
|
| Total pre-tax gains/(losses) recognized in income | $(17) | $(4) | |
| $— |
|
| $— |
|
|
| | | | | | | | | | | | | | |
| | | For the Six Months Ended June 30, |
| | | Con Edison | | CECONY |
| (Millions of Dollars) | Balance Sheet Location | 2019 |
| 2018 |
| | 2019 |
| 2018 |
|
| Pre-tax gains/(losses) deferred in accordance with accounting rules for regulated operations: | | | |
| Current | Deferred derivative gains | $(12) | $(17) | | $(11) | $(16) |
| Noncurrent | Deferred derivative gains | (8) | 5 | | (6) | 3 |
| Total deferred gains/(losses) | $(20) | $(12) | | $(17) | $(13) |
| Current | Deferred derivative losses | $(39) | $(4) | | $(34) | $(2) |
| Current | Recoverable energy costs | (59) | (9) | | (51) | (8) |
| Noncurrent | Deferred derivative losses | (100) | 8 | | (95) | 7 |
| Total deferred gains/(losses) | $(198) | $(5) | | $(180) | $(3) |
| Net deferred gains/(losses) | $(218) | $(17) | | $(197) | $(16) |
| | Income Statement Location | | | | | |
| Pre-tax gains/(losses) recognized in income | | | |
| | Purchased power expense |
| $— |
|
| $— |
| |
| $— |
|
| $— |
|
| | Gas purchased for resale | (2) | (1) | | — |
| — |
|
| | Non-utility revenue | 15 | — |
| | — |
| — |
|
| | Other operations and maintenance expense | 1 | — |
| | 1 | — |
|
| | Other interest expense | (34) | — |
| | — |
| — |
|
| Total pre-tax gains/(losses) recognized in income | $(20) |
| ($1 | ) | | $1 |
| $— |
|
|
| | | | | | | | | | |
| | | For the Three Months Ended March 31, |
| | | Con Edison | | CECONY |
| (Millions of Dollars) | Balance Sheet Location | 2020 | 2019 | | 2020 |
| 2019 |
|
| Pre-tax gains/(losses) deferred in accordance with accounting rules for regulated operations: | | | |
| Current | Deferred derivative gains | $(1) | $5 | | $(1) | $3 |
| Noncurrent | Deferred derivative gains | 3 | (6) | | 3 | (5) |
| Total deferred gains/(losses) | | $2 | $(1) | | $2 | $(2) |
| Current | Deferred derivative losses | $(14) | $(3) | | $(12) |
| $— |
|
| Current | Recoverable energy costs | (96) | (18) | | (86) | (14) |
| Noncurrent | Deferred derivative losses | (45) | (26) | | (42) | (26) |
| Total deferred gains/(losses) | | $(155) | $(47) | | $(140) | $(40) |
| Net deferred gains/(losses) | | $(153) | $(48) | | $(138) | $(42) |
| | Income Statement Location | | | | | |
| Pre-tax gains/(losses) recognized in income | | | | | |
| | Gas purchased for resale | $(2) | $(3) | |
| $— |
|
| $— |
|
| | Non-utility revenue | 5 | 9 | | — |
| — |
|
| | Other operations and maintenance expense | (7) | 2 | | (7) | 2 |
|
| | Other interest expense | (86) | (9) | | — |
|
|
|
| Total pre-tax gains/(losses) recognized in income | $(90) | $(1) | | $(7) |
| $2 |
|
The following table presents the hedged volume of Con Edison’s and CECONY’s commodity derivative transactions at June 30, 2019:March 31, 2020:
| | | | Electric Energy (MWh) (a)(b) | Capacity (MW) (a) | Natural Gas (Dt) (a)(b) | Refined Fuels (gallons) | Electric Energy (MWh) (a)(b) | Capacity (MW) (a) | Natural Gas (Dt) (a)(b) | Refined Fuels (gallons) |
| Con Edison | 32,178,387 |
| 19,324 |
| 202,435,409 |
| 7,728,000 |
| 21,682,575 |
| 26,614 |
| 260,204,579 |
| 10,752,000 |
|
| CECONY | 29,476,875 |
| 8,550 |
| 187,910,000 |
| 7,728,000 |
| 19,582,075 |
| 21,900 |
| 241,100,000 |
| 10,752,000 |
|
| |
| (a) | Volumes are reported net of long and short positions, except natural gas collars where the volumes of long positions are reported. |
| |
| (b) | Excludes electric congestion and gas basis swap contracts, which are associated with electric and gas contracts and hedged volumes. |
The Companies are exposed to credit risk related to transactions entered into primarily for the various energy supply and hedging activities by the Utilities and the Clean Energy Businesses. Credit risk relates to the loss that may result from a counterparty’s nonperformance. The Companies use credit policies to manage this risk, including an established credit approval process, monitoring of counterparty limits, netting provisions within agreements, collateral or prepayment arrangements, credit insurance and credit default swaps. The Companies measure credit risk exposure as the replacement cost for open energy commodity and derivative positions plus amounts owed from counterparties for settled transactions. The replacement cost of open positions represents unrealized gains, net of any unrealized losses where the Companies have a legally enforceable right to offset.
At June 30, 2019,March 31, 2020, Con Edison and CECONY had $128$120 million and $7 million of credit exposure in connection with open energy supply net receivables and hedging activities, net of collateral, respectively. Con Edison’s net credit exposure consisted of $55$47 million with independent system operators, $36 million with non-investment grade/non-rated counterparties, $34 million with independent system operators, $29$28 million with investment-grade counterparties and $10$9 million with commodity exchange brokers. CECONY’s net credit exposure consisted of $6$7 million with commodity exchange brokers and $1 millionan immaterial amount with investment-gradenon-investment-grade counterparties.
The collateral requirements associated with, and settlement of, derivative transactions are included in net cash flows from operating activities in the Companies’ consolidated statement of cash flows. Most derivative instrument contracts contain provisions that may require a party to provide collateral on its derivative instruments that are in a net liability position. The amount of collateral to be provided will depend on the fair value of the derivative instruments and the party’s credit ratings.
The following table presents the aggregate fair value of the Companies’ derivative instruments with credit-risk-related contingent features that are in a net liability position, the collateral posted for such positions and the additional collateral that would have been required to be posted had the lowest applicable credit rating been reduced one level and to below investment grade at June 30, 2019:March 31, 2020:
| | | (Millions of Dollars) | Con Edison (a) | | CECONY (a) | | Con Edison (a) | | CECONY (a) | |
| Aggregate fair value – net liabilities | $159 | | $137 | | $232 | | $210 | |
| Collateral posted | 34 | | 27 | | 134 | | 128 | |
| Additional collateral (b) (downgrade one level from current ratings) | 37 | | 31 | | 39 | | 31 | |
| Additional collateral (b) (downgrade to below investment grade from current ratings) | 140 | (c) | 118 | (c) | 123 | (c) | 102 | (c) |
| |
| (a) | Non-derivative transactions for the purchase and sale of electricity and gas and qualifying derivative instruments, which have been designated as normal purchases or normal sales, are excluded from the table. These transactions primarily include purchases of electricity from independent system operators. In the event the Utilities and the Clean Energy Businesses were no longer extended unsecured credit for such purchases, the Companies would be required to post an immaterial amount of additional collateral at June 30, 2019.March 31, 2020. For certain other such non-derivative transactions, the Companies could be required to post collateral under certain circumstances, including in the event counterparties had reasonable grounds for insecurity. |
| |
| (b) | The Companies measure the collateral requirements by taking into consideration the fair value amounts of derivative instruments that contain credit-risk-related contingent features that are in a net liability position plus amounts owed to counterparties for settled transactions and amounts required by counterparties for minimum financial security. The fair value amounts represent unrealized losses, net of any unrealized gains where the Companies have a legally enforceable right to offset. |
| |
| (c) | Derivative instruments that are net assets have been excluded from the table. At June 30, 2019,March 31, 2020, if Con Edison had been downgraded to below investment grade, it would have been required to post additional collateral for such derivative instruments of $15$32 million. |
Note MN – Fair Value Measurements
The accounting rules for fair value measurements and disclosures define fair value as the price that would be received to sell an asset or paid to transfer a liability in an orderly transaction between market participants at the measurement date in a principal or most advantageous market. Fair value is a market-based measurement that is determined based on inputs, which refer broadly to assumptions that market participants use in pricing assets or
liabilities. These inputs can be readily observable, market corroborated, or generally unobservable firm inputs. The Companies often make certain assumptions that market participants would use in pricing the asset or liability, including assumptions about risk, and the risks inherent in the inputs to valuation techniques. The Companies use valuation techniques that maximize the use of observable inputs and minimize the use of unobservable inputs.
The accounting rules for fair value measurements and disclosures established a fair value hierarchy, which prioritizes the inputs to valuation techniques used to measure fair value in three broad levels. The rules require that assets and liabilities be classified in their entirety based on the level of input that is significant to the fair value measurement. Assessing the significance of a particular input may require judgment considering factors specific to the asset or liability and may affect the valuation of the asset or liability and their placement within the fair value hierarchy. The Companies classify fair value balances based on the fair value hierarchy defined by the accounting rules for fair value measurements and disclosures as follows:
Level 1 – Consists of assets or liabilities whose value is based on unadjusted quoted prices in active markets at the measurement date. An active market is one in which transactions for assets or liabilities occur with sufficient frequency and volume to provide pricing information on an ongoing basis. This category includes contracts traded on active exchange markets valued using unadjusted prices quoted directly from the exchange.
Level 2 – Consists of assets or liabilities valued using industry standard models and based on prices, other than quoted prices within Level 1, that are either directly or indirectly observable as of the measurement date. The industry standard models consider observable assumptions including time value, volatility factors and current market and contractual prices for the underlying commodities, in addition to other economic measures. This category includes contracts traded on active exchanges or in over-the-counter markets priced with industry standard models.
Level 3 – Consists of assets or liabilities whose fair value is estimated based on internally developed models or methodologies using inputs that are generally less readily observable and supported by little, if any, market activity at the measurement date. Unobservable inputs are developed based on the best available information and subject to cost benefit constraints. This category includes contracts priced using models that are internally developed and contracts placed in illiquid markets. It also includes contracts that expire after the period of time for which quoted prices are available and internal models are used to determine a significant portion of the value.
Assets and liabilities measured at fair value on a recurring basis as of June 30, 2019March 31, 2020 and December 31, 20182019 are summarized below.
| | | | 2019 | 2018 | 2020 | 2019 |
| (Millions of Dollars) | Level 1 | Level 2 | Level 3 | Netting Adjustment (e) | Total | Level 1 | Level 2 | Level 3 | Netting Adjustment (e) | Total | Level 1 | Level 2 | Level 3 | Netting Adjustment (e) | Total | Level 1 | Level 2 | Level 3 | Netting Adjustment (e) | Total |
| Con Edison | | | | | | | | | | | | | | |
| Derivative assets: | | | | | | | | | | | | | | |
| Commodity (a)(b)(c) | $3 | $22 | $2 | $(8) | $19 | $6 | $36 | $7 | $(6) | $43 | $8 | $64 | $2 | $(1) | $73 | $4 | $61 | $2 | $4 | $71 |
| Interest rate swaps (a)(b)(c) | — |
| — |
| — |
| — |
| — |
| — |
| 2 | — |
| — |
| 2 | — |
| — |
| — |
| — |
| — |
| — |
| 1 | — |
| — |
| 1 |
| Other (a)(b)(d) | 321 | 118 | — |
| — |
| 439 | 287 | 114 | — |
| — |
| 401 | 308 | 125 | — |
| — |
| 433 | 353 | 125 | — |
| — |
| 478 |
| Total assets | $324 | $140 | $2 | $(8) | $458 | $293 | $152 | $7 | $(6) | $446 | $316 | $189 | $2 | $(1) | $506 | $357 | $187 | $2 | $4 | $550 |
| Derivative liabilities: | | | | | | | | | | | | | | |
| Commodity (a)(b)(c) | $15 | $135 | $48 | $(37) | $161 | $8 | $43 | $20 | $(11) | $60 | $18 | $245 | $15 | $(23) | $255 | $18 | $174 | $18 | $(22) | $188 |
| Interest rate swaps (a)(b)(c) | — |
| 37 | — |
| — |
| 37 | — |
| 6 | — |
| — |
| 6 | — |
| 126 | — |
| — |
| 126 | — |
| 41 | — |
| — |
| 41 |
| Total liabilities | $15 | $172 | $48 | $(37) | $198 | $8 | $49 | $20 | $(11) | $66 | $18 | $371 | $15 | $(23) | $381 | $18 | $215 | $18 | $(22) | $229 |
| CECONY | | | | | | | | | | | | | | |
| Derivative assets: | | | | | | | | | | | | | | |
| Commodity (a)(b)(c) | $2 | $13 | $1 |
| $— |
| $16 | $3 | $28 | $1 | $(1) | $31 | $6 | $49 | $1 | $(11) | $45 | $3 | $42 | $1 |
| $— |
| $46 |
| Other (a)(b)(d) | 301 | 112 | — |
| — |
| 413 | 267 | 109 | — |
| — |
| 376 | 289 | 119 | — |
| — |
| 408 | 333 | 119 | — |
| — |
| 452 |
| Total assets | $303 | $125 | $1 |
| $— |
| $429 | $270 | $137 | $1 | $(1) | $407 | $295 | $168 | $1 | $(11) | $453 | $336 | $161 | $1 |
| $— |
| $498 |
| Derivative liabilities: | | | | | | | | | | | | | | |
| Commodity (a)(b)(c) | $13 | $114 | $31 | $(31) | $127 | $5 | $30 | $3 | $(6) | $32 | $16 | $218 | $7 | $(29) | $212 | $15 | $147 | $7 | $(24) | $145 |
| |
| (a) | The Companies’ policy is to review the fair value hierarchy and recognize transfers into and transfers out of the levels at the end of each reporting period. Con Edison and CECONY had no transfers between levels 1, 2, and 3 during the sixthree months ended JuneMarch 31, 2020. Con Edison and CECONY had $24 million and $22 million of commodity derivative liabilities transferred from level 3 to level 2 during the year ended December 31, 2019 because of availability of observable market data due to the decrease in the terms of certain contracts from beyond three years as of September 30, 2019 to less than three years as of December 31, 2019. Con |
Edison and CECONY had $2 million of commodity derivative liabilities transferred from level 3 to level 2 during the year ended December 31, 2018 because of availability of observable market data due to the decrease in the terms of certain contracts from beyond three years as of September 30, 2018 to less than three years as of December 31, 2018.
| |
| (b) | Level 2 assets and liabilities include investments held in the deferred compensation plan and/or non-qualified retirement plans, exchange-traded contracts where there is insufficient market liquidity to warrant inclusion in Level 1, certain over-the-counter derivative instruments for electricity, refined products and natural gas. Derivative instruments classified as Level 2 are valued using industry standard models that incorporate corroborated observable inputs; such as pricing services or prices from similar instruments that trade in liquid markets, time value and volatility factors. |
| |
| (c) | The accounting rules for fair value measurements and disclosures require consideration of the impact of nonperformance risk (including credit risk) from a market participant perspective in the measurement of the fair value of assets and liabilities. At June 30, 2019March 31, 2020 and December 31, 2018,2019, the Companies determined that nonperformance risk would have no material impact on their financial position or results of operations. |
| |
| (d) | Other assets are comprised of assets such as life insurance contracts within the deferred compensation plan and non-qualified retirement plans. |
| |
| (e) | Amounts represent the impact of legally-enforceable master netting agreements that allow the Companies to net gain and loss positions and cash collateral held or placed with the same counterparties. |
The employees in the Companies’ risk management group develop and maintain the Companies’ valuation policies and procedures for, and verify pricing and fair value valuation of, commodity derivatives and interest rate swaps. Under the Companies’ policies and procedures, multiple independent sources of information are obtained for forward price curves used to value commodity derivatives and interest rate swaps. Fair value and changes in fair value of commodity derivatives and interest rate swaps are reported on a monthly basis to the Companies’ risk committees, comprised of officers and employees of the Companies that oversee energy hedging at the Utilities and the Clean Energy Businesses. The risk management group reports to the Companies’ Vice President and Treasurer.
|
| | | | |
| | Fair Value of Level 3 at June 30, 2019March 31, 2020 | Valuation Techniques | Unobservable Inputs | Range |
| | (Millions of Dollars) |
| Con Edison – Commodity |
| Electricity | $(27) | Discounted Cash Flow | Forward energy prices (a) | $20.00-$71.70 per MWh |
| (16)(14) | Discounted Cash Flow | Forward capacity prices (a) | $0.70-0.10-$4.838.75 per kW-month |
Natural Gas | (4) | Discounted Cash Flow | Forward natural gas prices (a) | $1.45-$2.31 per Dt |
| Transmission Congestion Contracts/Financial Transmission Rights | 1 | Discounted Cash Flow | Inter-zonal forward price curves adjusted for historical zonal losses (b) | $0.03-(2.40)-$4.293.50 per MWh |
| Total Con Edison—Commodity | $(46)(13) | | | |
| CECONY – Commodity |
| Electricity | $(25) | Discounted Cash Flow | Forward energy prices (a) | $21.70-$71.70 per MWh |
| (6)(7) | Discounted Cash Flow | Forward capacity prices (a) | $0.70-0.36-$4.808.75 per kW-month |
| Transmission Congestion Contracts | 1 | Discounted Cash Flow | Inter-zonal forward price curves adjusted for historical zonal losses (b) | $0.43-0.13-$3.132.10 per MWh |
| Total CECONY—Commodity | $(30)(6) | | | |
| |
| (a) | Generally, increases/(decreases) in this input in isolation would result in a higher/(lower) fair value measurement. |
| |
| (b) | Generally, increases/(decreases) in this input in isolation would result in a lower/(higher) fair value measurement. |
The table listed below provides a reconciliation of the beginning and ending net balances for assets and liabilities measured at fair value as of June 30,March 31, 2020 and 2019 and 2018 and classified as Level 3 in the fair value hierarchy:
| | | | For the Three Months Ended June 30, | For the Three Months Ended March 31, |
| | Con Edison | CECONY | Con Edison | CECONY |
| (Millions of Dollars) | 2019 |
| 2018 | 2019 | 2018 |
| 2020 | 2019 | 2020 |
| 2019 |
|
| Beginning balance as of April 1, | $(19) | $3 | $(5) | $2 | |
| Beginning balance as of January 1, | | $(16) | $(13) | $(6) | $(2) |
| Included in earnings | — |
| (3) | 1 | 1 | (5) | (4) | (2) | — |
|
| Included in regulatory assets and liabilities | (27) | (1) | (25) | (2) | 1 | (5) | — |
| (3) |
| Settlements | — |
| (3) | (1) | (1) | 7 | 3 | 2 | — |
|
| Ending balance as of June 30, | $(46) | $(4) | $(30) |
| $— |
| |
| Ending balance as of March 31, | | $(13) | $(19) | $(6) | $(5) |
|
| | | | | | | | |
| | For the Six Months Ended June 30, |
| | Con Edison | CECONY |
| (Millions of Dollars) | 2019 |
| 2018 | 2019 |
| 2018 |
|
| Beginning balance as of January 1, | $(13) | $1 | $(2) | $4 |
| Included in earnings | (4) | 1 | 1 | 3 |
| Included in regulatory assets and liabilities | (31) | (1) | (28) | (5) |
| Settlements | 2 | (6) | (1) | (3) |
| Transfer out of level 3 | — |
| 1 | — |
| 1 |
| Ending balance as of June 30, | $(46) | $(4) | $(30) |
| $— |
|
For the Utilities, realized gains and losses on Level 3 commodity derivative assets and liabilities are reported as part of purchased power, gas and fuel costs. The Utilities generally recover these costs in accordance with rate provisions approved by the applicable state public utilities regulators. Unrealized gains and losses for commodity derivatives are generally deferred on the consolidated balance sheet in accordance with the accounting rules for regulated operations.
For the Clean Energy Businesses, realized and unrealized gains and losses on Level 3 commodity derivative assets and liabilities are reported in non-utility revenues (immaterial($1 million gain and $6$1 million loss) and purchased power costs (immaterial for both periods) on the consolidated income statement for the three months ended June 30,March 31, 2020 and 2019, and 2018, respectively. Realized and unrealized gains and losses on Level 3 commodity derivative assets and liabilities are reported in non-utility revenues ($1 million loss and $4 million loss) and purchased power costs (immaterial for both periods) on the consolidated income statement for the six months ended June 30, 2019 and 2018, respectively. The change in fair value relating to Level 3 commodity derivative assets and liabilities held at June 30,March 31, 2020 and 2019 and 2018 is included in non-utility revenues (immaterial($1 million gain and $5$1 million loss) and purchased power costs (immaterial for both periods) on the consolidated income statement for the three months ended June 30,March 31, 2020 and 2019, and 2018, respectively. For the six months ended June 30, 2019 and 2018, the change in fair value relating to Level 3 commodity derivatives assets and liabilities is included in non-utility revenues ($1 million loss and $4 million loss) and purchased power costs (immaterial for both periods), respectively, on the consolidated income statement.
Note NO – Variable Interest Entities
The accounting rules for consolidation address the consolidation of a variable interest entity (VIE) by a business enterprise that is the primary beneficiary. A VIE is an entity that does not have a sufficient equity investment at risk to permit it to finance its activities without additional subordinated financial support, or whose equity investors lack the characteristics of a controlling financial interest. The primary beneficiary is the business enterprise that has the power to direct the activities of the VIE that most significantly impact the VIE’s economic performance and either absorbs a significant amount of the VIE’s losses or has the right to receive benefits that could be significant to the VIE.
The Companies enter into arrangements including leases, partnerships and electricity purchase agreements, with various entities. As a result of these arrangements, the Companies retain or may retain a variable interest in these entities.
CECONY
CECONY has an ongoing long-term electricity purchase agreement with Brooklyn Navy Yard Cogeneration Partners, LP, a potential VIE. In 2018,2019, a request was made of this counterparty for information necessary to determine whether the entity was a VIE and whether CECONY is the primary beneficiary; however, the information
was not made available. The payments for this contract constitute CECONY’s maximum exposure to loss with respect to the potential VIE.
Con Edison DevelopmentClean Energy Businesses
Con Edison has a variableIn September 2019, the Clean Energy Businesses, which previously owned an 80 percent membership interest in OCI Solar San Antonio 4 LLC (Texas Solar 4), whichacquired the remaining 20 percent interest. As a result of the acquisition, Texas Solar 4 is a consolidated entityentity. Prior to the acquisition, Con Edison had a variable interest in Texas Solar 4, as to which Con Edison Development has an 80 percent membership interest. Con Edison iswas the primary beneficiary since the power to direct the activities that most significantly impact the economics of Texas Solar 4 iswas held by a Con Edison Development subsidiary.the Clean Energy Businesses. Texas Solar 4 owns a project company that developed a 40 MW (AC) solar electric production project. Electricity generated by the project is sold pursuant to a long-term power purchase agreement. Con Edison's earnings from Texas Solar 4 for the three and six months ended June 30,March 31, 2019 and 2018 were immaterial.
In December 2018, a Con Edison Development subsidiarythe Clean Energy Businesses completed its acquisition of Sempra Solar Holdings, LLC. Included in the acquisition were certain operating projects (Tax Equity Projects) with a noncontrolling tax equity investor to which a percentage of earnings, tax attributes and cash flows are allocated. The Tax Equity Projects are consolidated entities in which Con Edison has less than a 100 percent membership interest. Con Edison is the primary beneficiary since the power to direct the activities that most significantly impact the economics of the Tax Equity Projects is held by Con Edison Development subsidiaries.the Clean Energy Businesses. Electricity generated by the Tax Equity Projects is sold to utilities and municipalities pursuant to long-term power purchase agreements. For the three months ended June 30, 2019,March 31, 2020, the hypothetical liquidation at book value (HLBV) method of accounting for the Tax Equity Projects resulted in $28$17 million of income ($2113 million, after tax) for the tax equity investor and a $15$14 million loss ($1210 million, after tax) for Con Edison. For the sixthree months ended June 30,March 31, 2019, the HLBV method of accounting for the Tax Equity Projects resulted in $49$21 million of income ($3716 million, after-tax)after tax) for the tax equity investor and a $34$19 million loss ($2614 million, after-tax)after tax) for Con Edison.
Con Edison has determined that the use of HLBV accounting is reasonable and appropriate to attribute income and loss to the tax equity investors. Using the HLBV method, the company's earnings from the projects are adjusted to reflect the income or loss allocable to the tax equity investors calculated based on how the project would allocate and distribute its cash if it were to sell all of its assets for their carrying amounts and liquidate at a particular point in time. Under the HLBV method, the company calculates the liquidation value allocable to the tax equity investors at the beginning and end of each period based on the contractual liquidation waterfall and adjusts its income for the period to reflect the change in the liquidation value allocable to the tax equity investors.
At June 30, 2019March 31, 2020 and December 31, 2018,2019, Con Edison’s consolidated balance sheet included the following amounts associated with its VIEs:
| | | | Tax Equity Projects | | Tax Equity Projects |
| | Great Valley Solar
(c)(d) | Copper Mountain - Mesquite Solar
(c)(e) | Texas Solar 4
(c)(f) | Great Valley Solar
(c)(d) | Copper Mountain - Mesquite Solar
(c)(e) |
| (Millions of Dollars) | 2019 | 2018 | 2019 | 2018 | 2019 | 2018 | 2020 | 2019 | 2020 | 2019 |
| Restricted cash |
| $— |
|
| $— |
|
| $— |
|
| $— |
| $7 | $4 | |
| Non-utility property, less accumulated depreciation (g)(h) | 309 | 313 | 488 | 492 | 96 | 98 | |
| Non-utility property, less accumulated depreciation (f)(g) | | $291 | $293 | $456 | $461 |
| Other assets | 39 | 18 | 109 | 97 | 10 | 9 | 41 | 40 | 181 | 128 |
| Total assets (a) | $348 | $331 | $597 | $589 | $113 | $111 | $332 | $333 | $637 | $589 |
| Long-term debt due within one year |
| $— |
|
| $— |
|
| $— |
|
| $— |
| $57 | $2 | |
| Other liabilities | 32 | 17 | 43 | 33 | 28 | 26 | 16 | 17 | 67 | 18 |
| Long-term debt | — |
| — |
| — |
| — |
| — |
| 56 | |
| Total liabilities (b) | $32 | $17 | $43 | $33 | $85 | $84 | $16 | $17 | $67 | $18 |
| |
| (a) | The assets of the Tax Equity Projects and Texas Solar 4 represent assets of a consolidated VIE that can be used only to settle obligations of the consolidated VIE. |
| |
| (b) | The liabilities of the Tax Equity Projects and Texas Solar 4 represent liabilities of a consolidated VIE for which creditors do not have recourse to the general credit of the primary beneficiary. |
| |
| (c) | Con Edison did not provide any financial or other support during the year that was not previously contractually required. |
| |
| (d) | Great Valley Solar consists of the Great Valley Solar 1, Great Valley Solar 2, Great Valley Solar 3 and Great Valley Solar 4 projects, for which the noncontrolling interest of the tax equity investor was $66 million and $62 million at March 31, 2020 and December 31, 2019, respectively. |
for which the noncontrolling interest of the tax equity investor was $48 million and $33 million at June 30, 2019 and December 31, 2018, respectively.
| |
| (e) | Copper Mountain - Mesquite Solar consists of the Copper Mountain Solar 4, Mesquite Solar 2 and Mesquite Solar 3 projects for which the noncontrolling interest of the tax equity investor was $99$137 million and $71$126 million at June 30, 2019March 31, 2020 and December 31, 2018,2019, respectively. |
| |
| (f) | Noncontrolling interestNon-utility property is reduced by accumulated depreciation of the third party was $7$11 million for Great Valley Solar and $19 million for Copper Mountain - Mesquite Solar at June 30, 2019 and DecemberMarch 31, 2018.2020. |
| |
| (g) | Non-utility property is reduced by accumulated depreciation of $5$9 million for Great Valley Solar $8and $15 million for Copper Mountain - Mesquite Solar and $17 million for Texas Solar 4 at June 30, 2019. |
| |
(h) | Non-utility property is reduced by accumulated depreciation of $1 million for Great Valley Solar, $1 million for Copper Mountain - Mesquite Solar and $15 million for Texas Solar 4 at December 31, 2018.2019. |
Note O – New Financial Accounting Standards
In June 2016, the FASB issued amendments to the guidance for recognition of credit losses for financial instruments through ASU 2016-13, “Financial Instruments-Credit Losses (Topic 326): Measurement of Credit Losses on Financial Instruments.” The amendments replace the incurred loss impairment methodology which involved delayed recognition of credit losses. The amendments introduce an expected credit loss impairment model which requires immediate recognition of anticipated losses over the instrument’s life. A broader range of reasonable and supportable information must be considered in developing the credit loss estimates. The Companies' financial instruments that would be subject to the amendments include their accounts receivable - customers and other receivables. For public entities, the amendments are effective, and the Companies plan to adopt the amendments, for reporting periods beginning after December 15, 2019. The adoption of this guidance is not expected to have a material impact on the Companies’ liquidity. The Companies are continuing to evaluate the potential impact of the amendments on the Companies’ results of operations and financial position.
In January 2017, the FASB issued amendments to the guidance for the subsequent measurement of goodwill through ASU 2017-04, “Intangibles-Goodwill and Other (Topic 350): Simplifying the Test for Goodwill Impairment.” The amendments in this update simplify goodwill impairment testing by eliminating Step 2 of the goodwill
impairment test wherein
Note P – New Financial Accounting Standards
In December 2019, the FASB issued amendments to the guidance for income taxes through ASU 2019-12, “Income Taxes (Topic 740): Simplifying the Accounting for Income Taxes.” The amendments in this update simplify the accounting for income taxes by removing certain exceptions such as: 1) the incremental approach for intraperiod tax allocation when there is a loss from continuing operations and income or a gain from other items, 2) the requirement to recognize a deferred tax liability for equity method investments when a foreign subsidiary becomes an entity hasequity method investment, 3) the ability not to computerecognize a deferred tax liability for a foreign subsidiary when a foreign equity method investment becomes a subsidiary, and 4) the implied fair value of goodwill by performing procedures to determinegeneral methodology for calculating income taxes in an interim period when a year-to-date loss exceeds the fair value of its assets and liabilities. Under the new guidance, an entity should recognize an impairment chargeanticipated loss for the amount by which the carrying amount exceeds the reporting unit’s fair value up to the total amount of goodwill allocated to that reporting unit.year. For public entities, the amendments are effective for reporting periods beginning after December 15, 2019.2020. Early adoption is permitted. The applicationCompanies are in the process of thisevaluating the potential impact of the new guidance is not expected to have a material impact on the Companies’ financial position, results of operations and liquidity.
In August 2018,March 2020, the FASB issued amendmentsASU 2020-04, Reference Rate Reform (Topic 848): Facilitation of the Effects of Reference Rate Reform on Financial Reporting ("ASU 2020-04"). The United Kingdom’s Financial Conduct Authority has announced that it intends to stop persuading or compelling banks to submit the guidance for internal use software through ASU 2018-15, “Intangibles - Goodwill and Other - Internal-Use Software (Subtopic 350-40): Customer’s Accounting for Implementation Costs IncurredLondon Interbank Offered Rate (“LIBOR”), a benchmark interest rate referenced in a Cloud Computing Arrangement Thatvariety of agreements, after 2021. ASU 2020-04 provides entities with optional expedients and exceptions for applying generally accepted accounting principles to contract modifications and hedging relationships, subject to meeting certain criteria, that reference LIBOR or another reference rate expected to be discontinued. The guidance is a Service Contract.”applied prospectively from any date beginning March 12, 2020. The amendments align the requirements for capitalizing implementation costs incurred in a hosting arrangement thatoptional relief is a servicetemporary and generally cannot be applied to contract with the requirements for capitalizing implementation costs incurred to developmodifications and hedging relationships entered into or obtain internal-use software. For public entities, the amendments are effective for reporting periods beginningevaluated after, December 15, 2019, with early adoption permitted.31, 2022. The Companies electeddo not expect the new guidance to adopt the amendments in 2018, prospectively for all in-scope implementation costs incurred after the date of adoption. Thehave a material impact of adoption on the Companies’their financial position, results of operations and liquidity was immaterial.or liquidity.
Item 2: Management’s Discussion and Analysis of Financial Condition and Results of Operations
This combined management’s discussion and analysis of financial condition and results of operations (MD&A) relates to the consolidated financial statements (the SecondFirst Quarter Financial Statements) included in this report of two separate registrants: Consolidated Edison, Inc. (Con Edison) and Consolidated Edison Company of New York, Inc. (CECONY). As used in this report, the term the “Companies” refers to Con Edison and CECONY. CECONY is a subsidiary of Con Edison and, as such, information in this management’s discussion and analysis about CECONY applies to Con Edison.
This MD&A should be read in conjunction with the SecondFirst Quarter Financial Statements and the notes thereto and the MD&A in Item 7 of the Companies’ combined Annual Report on Form 10-K for the year ended December 31, 20182019 (File Nos. 1-14514 and 1-1217, the Form 10-K) and the MD&A in Part 1, Item 2 of the Companies' combined Quarterly Report on Form 10-Q for the quarterly period ended March 31, 2019 (File Nos. 1-14514 and 1-1217).
Information in any item of this report referred to in this discussion and analysis is incorporated by reference herein. The use of terms such as “see” or “refer to” shall be deemed to incorporate by reference into this discussion and analysis the information to which reference is made.
Con Edison, incorporated in New York State in 1997, is a holding company that owns all of the outstanding common stock of CECONY, Orange and Rockland Utilities, Inc. (O&R), Con Edison Clean Energy Businesses, Inc. and Con Edison Transmission, Inc. As used in this report, the term the “Utilities” refers to CECONY and O&R.
|
| | | | | | | | | | |
| | | | Con Edison | | | | |
| | | | | | | | | | |
| | | | | | | | | | |
| CECONY | | O&R | | Clean Energy Businesses | | Con Edison Transmission |
| |
| | | | |
| | | | | |
|
Con Edison’s principal business operations are those of CECONY, O&R, the Clean Energy Businesses and Con Edison Transmission. CECONY’s principal business operations are its regulated electric, gas and steam delivery businesses. O&R’s principal business operations are its regulated electric and gas delivery businesses. The Clean Energy Businesses develop, own and operate renewable and energy infrastructure projects and provide energy-related products and services to wholesale and retail customers. Con Edison Transmission invests in electric transmission facilities and gas pipeline and storage facilities.
Con Edison seeks to provide shareholder value through continued dividend growth, supported by earnings growth in regulated utilities and contracted electric and gas assets. The company invests to provide reliable, resilient, safe and clean energy critical for New York City’s growing economy. The company is an industry leading owner and operator of contracted, large-scale solar generation in the United States. Con Edison is a responsible neighbor, helping the communities it serves become more sustainable.
CECONY
Electric
CECONY provides electric service to approximately 3.5 million customers in all of New York City (except a part of Queens) and most of Westchester County, an approximately 660 square mile service area with a population of more than nine million.
Gas
CECONY delivers gas to approximately 1.1 million customers in Manhattan, the Bronx, parts of Queens and most of Westchester County.
In May 2019, the company increased its five-year forecast of average annual growth of the peak gas demand in its service area at design conditions from approximately 1.3 percent(for 2019 to 2023) to approximately 1.5 percent (for 2020 to 2024). The increase reflects increased applications for firm gas service in advance of the March 15, 2019 start of a temporary moratorium on new applications in most of Westchester County.
Steam
CECONY operates the largest steam distribution system in the United States by producing and delivering approximately 20,77818,194 MMlb of steam annually to approximately 1,6041,584 customers in parts of Manhattan.
In July 2019, the company's five-year forecast of average annual change in the peak steam demand in its service area at design conditions increased from approximately (0.5) percent (for 2019 to 2023) to (0.4) percent (for 2020 to 2024).
O&R
Electric
O&R and its utility subsidiary, Rockland Electric Company (RECO) (together referred to herein as O&R) provide electric service to approximately 0.3 million customers in southeastern New York and northern New Jersey, an approximately 1,300 square mile service area.
Gas
O&R delivers gas to over 0.1 million customers in southeastern New York.
In May 2019, the company increased its five-year forecast of average annual growth of the peak gas demand in its service area at design conditions from approximately 0.6 percent (for 2019 to 2023) to 0.7 percent (for 2020 to 2024).
Clean Energy Businesses
Con Edison Clean Energy Businesses, Inc. has three wholly-owned subsidiaries: Consolidated Edison Development, Inc. (Con Edison Development), Consolidated Edison Energy, Inc. (Con Edison Energy) and Consolidated Edison Solutions, Inc. (Con Edison Solutions). Con Edison Clean Energy Businesses, Inc., together with theseits subsidiaries, are referred to in this report as the Clean Energy Businesses. The Clean Energy Businesses develop, own and operate renewable and energy infrastructure projects and provide energy-related
products and services to wholesale and retail customers. In December 2018, a Con Edison Development subsidiarythe Clean Energy Businesses acquired Sempra Solar Holdings, LLC.
Con Edison Transmission
Con Edison Transmission, Inc. invests in electric and gas transmission projects through its wholly-owned subsidiaries, Consolidated Edison Transmission, LLC (CET Electric) and Con Edison Gas Pipeline and Storage, LLC (CET Gas). CET Electric owns a 45.7 percent interest in New York Transco LLC (NY Transco), which owns and is proposinghas been selected to build additional electric transmission assets in New York. CET Gas owns, through subsidiaries, a 50 percent interest in Stagecoach Gas Services, LLC, a joint venture that owns and operates an existing gas pipeline and storage business located in northern Pennsylvania and southern New York. Also, CET Gas and CECONY own 71.2 percent and 28.8 percent interests, respectively, in Honeoye Storage Corporation, which owns and operates a gas storage facility in upstate New York. In addition, CET Gas owns a 12.512.25 percent interest (that is expected to be reduced to approximately 10 percent based on the current project cost estimate) in Mountain Valley Pipeline LLC, a joint venture developing a proposed 300-mile gas transmission project in West Virginia and Virginia. Con Edison Transmission, Inc., together with CET Electric and CET Gas, are referred to in this report as Con Edison Transmission.
Certain financial data of Con Edison’s businesses are presented below:
| | | For the Three Months Ended
June 30, 2019 | For the Six Months Ended
June 30, 2019 | At June 30, 2019 | For the Three Months Ended
March 31, 2020 | At March 31, 2020 |
| (Millions of Dollars, except percentages) | Operating Revenues | Net Income for Common Stock | Operating Revenues | Net Income for
Common Stock | Assets | Operating Revenues | Net Income for Common Stock | Assets |
| CECONY | $2,331 | 85 | % | $152 | 100 | % | $5,371 | 86 | % | $564 | 98 | % | $44,475 | 80 | % | $2,854 | 88 | % | $406 | 108 | % | $47,568 | 80 | % |
| O&R | 179 | 7 |
| 2 | 1 |
| 437 | 7 |
| 34 | 6 |
| 2,881 | 5 |
| 233 | 7 |
| 31 | 8 |
| 3,027 | 5 |
|
| Total Utilities | 2,510 | 92 |
| 154 | 101 |
| 5,808 | 93 |
| 598 | 104 |
| 47,356 | 85 |
| 3,087 | 95 |
| 437 | 116 |
| 50,595 | 85 |
|
| Clean Energy Businesses (a) | 233 | 8 |
| (6) | (4 | ) | 450 | 7 |
| (41) | (7 | ) | 6,419 | 12 |
| 146 | 5 |
| (82) | (22 | ) | 6,547 | 11 |
|
| Con Edison Transmission | 1 | — |
| 12 | 8 |
| 2 | — |
| 25 | 4 |
| 1,489 | 3 |
| 1 | — |
| 14 | 4 |
| 1,631 | 3 |
|
| Other (b) | — |
| — |
| (8) | (5 | ) | (2) | — |
| (6) | (1 | ) | 338 | — |
| — |
| — |
| 6 | 2 |
| 386 | 1 |
|
| Total Con Edison | $2,744 | 100 | % | $152 | 100 | % | $6,258 | 100 | % | $576 | 100 | % | $55,602 | 100 | % | $3,234 | 100 | % | $375 | 100 | % | $59,159 | 100 | % |
| |
| (a) | Net income for common stock from the Clean Energy Businesses for the three and six months ended June 30, 2019March 31, 2020 includes $(16)$(63) million and $(24) million, respectively, of net after-tax mark-to-market losses and reflects $21$13 million (after-tax) and $37 million (after-tax), respectively, of income attributable to the non-controlling interest of a tax equity investor in renewable electric production projects accounted for under the HLBV method of accounting. See Note NO to the SecondFirst Quarter Financial Statements. |
| |
| (b) | Other includes parent company and consolidation adjustments. |
Coronavirus Disease 2019 (COVID-19) Impacts
The Companies are responding to the Coronavirus Disease 2019 (COVID-19) global pandemic by taking steps to mitigate the potential risks posed to employees, customers and other stakeholders by its spread. The Companies have mobilized a pandemic planning team and an incident command system structure. The Companies have taken precautions with regard to employee and facility hygiene, such as performing a temperature check on employees arriving at critical locations, cleaning and disinfecting all work and common areas, separating crews into multiple vehicles, promoting social distancing, imposing travel limitations on employees and directing employees to work remotely whenever possible. Employees who test positive for COVID-19 remain home from work and are closely evaluated to determine if any other employees may have had close, prolonged contact that would require other employees to quarantine at home and, following the Centers for Disease Control and Prevention guidelines, sick or quarantined employees return to work when they can safely do so. In addition, critical operators of the bulk power system have been sequestered in order to limit their exposure to COVID-19. The Utilities have continued to provide critical electric, gas and steam service to customers during the pandemic, and additional protocols have been implemented for required work at customer premises to protect employees, customers and the public.
Below is additional information related to the effects of the COVID-19 pandemic and the Companies’ actions.
New York State Regulation
In March 2020, New York State Governor Cuomo declared a State disaster emergency for the State of New York. Since that declaration, the NYSPSC and the Utilities have taken actions to mitigate the impact of the COVID-19 pandemic on the Utilities, their customers and other stakeholders. New York State has designated utilities, including CECONY and O&R, as essential businesses that may continue their work. The Utilities have modified or suspended certain work in the state. See "COVID-19 Regulatory Matters" in Note B to the First Quarter Financial Statements.
In March 2020, the Utilities began suspending service disconnections, certain collection notices, final bill collection agency activity, new late payment charges and certain other fees for all customers. Historically, these fees have amounted to approximately $6 million and $0.4 million per month for CECONY and O&R, respectively. The suspension of these fees is expected to result in a reduction in revenues during the suspension period, the length of which has not yet been determined. The Utilities also began providing payment extensions for all customers that were scheduled to be disconnected prior to the start of the COVID-19 pandemic. All customer walk-in centers have been closed to the public and in-person investigations of billing issues at customer residences and businesses have been suspended. In April 2020, the NYSPSC also suspended certain interconnection payment deadlines to mitigate the impact of the COVID-19 pandemic on developers of distributed renewable generation and energy storage. See "COVID-19 Regulatory Matters" in Note B and Note K to the First Quarter Financial Statements.
Also in March 2020, the Utilities requested and the NYSPSC granted extensions until July 31, 2020 to file their 2019 Earnings Adjustment Mechanisms (EAMs) reports, which would delay the start of collection of earned EAM incentives of approximately $46 million and $3 million for CECONY and O&R, respectively, from the twelve-month period beginning June 2020 until the twelve-month period beginning September 2020. See "COVID-19 Regulatory Matters" in Note B and Note K to the First Quarter Financial Statements.
The Utilities’ rate plans have revenue decoupling mechanisms in their New York electric and gas businesses that reconcile actual energy delivery revenues to the authorized delivery revenues approved by the NYSPSC. See "COVID-19 Regulatory Matters" in Note B to the First Quarter Financial Statements and “Liquidity and Financing,” below.
New Jersey State Regulation
In March 2020, New Jersey Governor Murphy declared a Public Health Emergency and State of Emergency for the State of New Jersey. Since that declaration, the NJBPU and RECO have taken actions to mitigate the impact of the COVID-19 pandemic on RECO, its customers and other stakeholders. New Jersey has designated utilities, including RECO, as essential businesses that may continue their work. RECO has modified or suspended certain work in the state. RECO has also suspended late payment charges, terminations for non-payment, and no access fees during the COVID-19 pandemic. The suspension of these fees is not expected to be material. See "COVID-19 Regulatory Matters" in Note B and Note K to the First Quarter Financial Statements.
Federal Regulation
In March 2020, the North American Electric Reliability Corporation (NERC) issued guidance that the effects of the COVID-19 pandemic will be considered an acceptable basis for non-compliance with certain NERC Reliability Standards requirements that would have required action between March 1, 2020 and July 31, 2020. In addition, it suspended on-site NERC compliance audits until at least July 31, 2020.
Also in March 2020, FERC announced several actions to ease regulatory obligations in response to the COVID-19 pandemic. These include postponement of certain filing deadlines and the suspension of all audit site visits and investigative testimony.
In April 2020, FERC announced it would expeditiously review and act on requests for relief in response to the COVID-19 pandemic, give priority to processing filings that contribute to the business continuity of regulated entities’ energy infrastructure and will exercise prosecutorial discretion when addressing events arising during the emergency period. FERC also approved a blanket waiver of requirements in Open Access Transmission Tariffs that require entities to hold meetings in-person and to provide or obtain notarized documents. See "COVID-19 Regulatory Matters" in Note B” to the First Quarter Financial Statements.
Gas Safety
In March 2020, the U.S. Department of Transportation’s Pipeline and Hazardous Materials Safety Administration (PHMSA) issued a notice staying enforcement of certain federal operator qualification, control room management and drug testing requirements during the COVID-19 pandemic. The notice also announced that PHMSA would exercise discretion in its overall enforcement of other parts of the pipeline safety regulations. The NYSPSC also provided guidance that it was staying enforcement of many of the same pipeline safety requirements identified in the March 2020 PHMSA notice.
In April 2020, the NYSPSC issued an order that extended the deadlines to complete certain gas inspections by all New York gas utilities, including CECONY and O&R, from April 1, 2020 to August 1, 2020. See "COVID-19 Regulatory Matters" in Note B to the First Quarter Financial Statements.
Impact of CARES Act on Accounting for Income Taxes
In response to the economic impacts of the COVID-19 pandemic, the Coronavirus Aid, Relief, and Economic Security (CARES) Act became law on March 27, 2020. The CARES Act has several key business tax relief measures that may present potential cash benefits and/or refund opportunities for Con Edison and its subsidiaries, including permitting a five-year carryback of a net operating loss (NOL) for tax years 2018, 2019 and 2020, temporary removal of the 80 percent limitation of NOL carryforwards against taxable income for tax years before 2021, temporary relaxation of the limitations on interest deductions, employee retention tax credits and defer payments of employer payroll taxes.
Con Edison will carryback its NOL of $29 million from 2018 back to 2013. This will allow Con Edison, mostly at the Clean Energy Businesses, to receive a $2.5 million cash refund and to recognize an income tax benefit of $4 million in March 2020, due to the higher federal tax rate in 2013. See Note J to the First Quarter Financial Statements. Con Edison and its subsidiaries are not expecting to have a federal NOL in tax years 2019 or 2020.
Con Edison and its subsidiaries expect to benefit by the increase in the percentage for calculating the limitation on the interest expense deduction from 30 percent of Adjusted Taxable Income (ATI) to 50 percent of ATI in 2019 and 2020, which may allow the Companies to deduct 100 percent of interest expense.
The Companies qualify for an employee retention tax credit created under the CARES Act for "eligible employers" related to a portion of its workforce that cannot perform their regular jobs due to the COVID-19 pandemic but that the Companies continue to pay.
The CARES Act also allows employers to defer payments of the employer share of Social Security payroll taxes that would have otherwise been owed from March 27, 2020 through December 31, 2020. The Companies intend to defer the payment of employer payroll taxes for the period April 1, 2020 through December 31, 2020 of approximately $73 million ($65 million of which is for CECONY). The Companies will repay one-half of this liability by December 31, 2021 and the other half by December 31, 2022.
Supply Chain Matters
The Utilities maintain regular communications with their supply base to minimize any potential impact to their supply chain from the COVID-19 pandemic. They have been pursuing alternatives with vendors, engaging additional vendors for newly identified supply needs, and are considering ordering additional critical supplies that may become scarce based on demand or if manufacturing facilities decrease operations.
The Clean Energy Businesses have appropriate assets available to them and currently do not anticipate constraints in completing and placing into service wind and solar projects currently under construction.
Cybersecurity
In April 2020, the United States Homeland Security Cybersecurity and Infrastructure Security Agency issued a joint alert with another agency stating that there has been a growing use of COVID-19 related themes by malicious cyber actors and the surge in teleworking has increased the use of potentially vulnerable services, amplifying the threat to individuals and organizations. The Companies, their contractors and vendors have experienced cyber threats, but none have had a material impact on the Companies. The Companies continue to closely monitor cybersecurity threats.
Accounting Considerations
As a result of the COVID-19 pandemic, both commercial and residential customers may have increased difficulty paying their utility bills, as a result of, among other factors, a decline in business, bankruptcies, layoffs and furloughs. CECONY and O&R have existing allowances for uncollectible accounts established against their customer accounts receivable balances which are reevaluated on a quarterly basis and updated accordingly. Changes to the Utilities’ reserve balances which result in write-offs of customer accounts receivable balances are not reflected in rates during the term of the current rate plans and will be addressed during a future rate proceeding. During the first quarter of 2020, the potential economic impact of the COVID-19 pandemic was also considered in forward looking projections related to write-off and recovery rates, resulting in increases to the allowance for uncollectible accounts as detailed herein. CECONY’s and O&R’s allowances for uncollectible accounts reserve increased from $65 million and $4.6 million at December 31, 2019 to $70 million and $4.8 million at March 31, 2020, respectively. See Note A to the First Quarter Financial Statements.
The Companies test goodwill for impairment at least annually or whenever there is a triggering event, and test long-lived and intangible assets for recoverability when events or changes in circumstances indicate that the carrying value of long-lived or intangible assets may not be recoverable. The Companies identified no triggering events or changes in circumstances related to the COVID-19 pandemic that would indicate that the carrying value of long-lived or intangible assets may not be recoverable at March 31, 2020. See Note A to the First Quarter Financial Statements.
Liquidity and Financing
The Companies continue to closely monitor the impacts of the COVID-19 pandemic on the financial markets including borrowing rates and daily cash collections. The Companies have been able to issue commercial paper as needed since the start of the COVID-19 pandemic in March 2020. See Note D to the First Quarter Financial Statements.
In addition, the decline in business activity in the Utilities’ service territory as a result of the COVID-19 pandemic could result in lower billed sales revenues. The Utilities’ rate plans have revenue decoupling mechanisms in their New York electric and gas businesses that reconcile actual energy delivery revenues to the authorized delivery revenues approved by the NYSPSC on a monthly basis and accumulate the deferred balances semi-annually under CECONY's electric rate plan (January through June and July through December, respectively) and annually under CECONY's gas rate plan and O&R New York's electric and gas rate plans (January through December). The difference is accrued with interest on a monthly basis for CECONY and O&R New York’s electric customers and after the annual deferral period ends for CECONY and O&R New York’s gas customers for refund to, or recovery from customers, as applicable. Generally, the refund to or recovery from customers begins August and February of each year over an ensuing six-month period for CECONY's electric customers and February of each year over an ensuing twelve-month period for CECONY's gas and O&R New York's electric and gas customers. Although these revenue decoupling mechanisms are in place, lower billed sales revenues and higher uncollectible accounts could impact liquidity at the Utilities. See Note A to the First Quarter Financial Statements and "COVID-19 Regulatory Matters" in Note B to the First Quarter Financial Statements.
In April 2020, in order to prepare for any potential limitations on access to external capital resulting from the COVID-19 pandemic, Con Edison entered into a $750 million credit agreement (the Supplemental Credit Agreement) under which banks are committed to provide loans, on a revolving credit basis until July 2, 2020, with an option, subject to certain conditions, for Con Edison to convert all loans outstanding on July 2, 2020 into a 270-day term loan. Con Edison has not entered into any loans under the Supplemental Credit Agreement. See Note D to the First Quarter Financial Statements.
Con Edison and the Utilities also have a $2,250 million credit agreement (Credit Agreement) in place under which banks are committed to provide loans on a revolving credit basis until December 2023 ($2,200 million of commitments from December 2022). Con Edison and the Utilities have not entered into any loans under the Credit Agreement. See Note D to the First Quarter Financial Statements.
Results of Operations
Net income for common stock and earnings per share for the three and six months ended June 30,March 31, 2020 and 2019 and 2018 were as follows:
| | | | For the Three Months Ended June 30, | For the Six Months Ended June 30, | For the Three Months Ended March 31, |
| | 2019 | 2018 | 2019 | 2018 | 2019 | 2018 | 2019 |
| 2018 |
| 2020 | 2019 | 2020 | 2019 |
| (Millions of Dollars, except per share amounts) | Net Income for Common Stock | Earnings
per Share | Net Income for Common Stock | Earnings
per Share | Net Income for Common Stock | Earnings per Share |
| CECONY | $152 | $149 | $0.46 | $0.48 | $564 | $538 |
| $1.73 |
|
| $1.73 |
| $406 | $412 | $1.22 | $1.28 |
| O&R | 2 | 8 | 0.01 | 0.02 | 34 | 31 | 0.11 |
| 0.10 |
| 31 | 32 | 0.09 | 0.10 |
| Clean Energy Businesses (a) | (6) | 25 | (0.03) | 0.08 | (41) | 31 | (0.13 | ) | 0.10 |
| (82) | (35) | (0.24) | (0.12) |
| Con Edison Transmission | 12 | 0.04 | 25 | 23 | 0.08 |
| 0.07 |
| 14 | 13 | 0.04 |
| Other (b) | (8) | (6) | (0.02) | (0.02) | (6) | (7) | (0.02 | ) | (0.02 | ) | 6 | 2 | 0.02 | 0.01 |
| Con Edison (c) | $152 | $188 | $0.46 | $0.60 | $576 | $616 |
| $1.77 |
|
| $1.98 |
| $375 | $424 | $1.13 | $1.31 |
| |
| (a) | Net income for common stock from the Clean Energy Businesses for the three and six months ended June 30,March 31, 2020 and 2019 includes $(16)$(63) million or $(0.05)$(0.18) a share and $(24)$(8) million or $(0.08)$(0.03) a share, respectively, of net after-tax mark-to-market losses and reflects $21$13 million or $0.07$0.04 a share (after-tax) and $37$16 million or $0.11$0.05 a share (after-tax), respectively, of income attributable to the non-controlling interest of a tax equity investor in renewable electric production projects accounted for under the HLBV method of accounting. See Note NO to the SecondFirst Quarter Financial Statements. Net income for common stock from the Clean Energy Businesses for the three and six months ended June 30, 2018 includes $(1) million or $(0.01) a share, respectively, of net after-tax mark-to-market losses. |
| |
| (b) | Other includes parent company and consolidation adjustments. |
| |
| (c) | Earnings per share on a diluted basis were $0.46$1.12 a share and $0.60$1.31 a share for the three months ended June 30,March 31, 2020 and 2019, and 2018, respectively, and $1.77 a share and $1.98 a share for the six months ended June 30, 2019 and 2018, respectively. |
The following tables presenttable presents the estimated effect of major factors on earnings per share and net income for common stock for the three and six months ended June 30, 2019March 31, 2020 as compared with the 2018 periods.2019 period.
|
| | | | | |
| Variation for the Three Months Ended June 30, 2019 vs. 2018 |
| | Earnings
per Share | Net Income for Common Stock (Millions of Dollars) | |
| CECONY (a) | | | |
| Changes in rate plans | $0.23 | $71 | Reflects higher electric and gas net base revenues of $0.12 a share and $0.03 a share, respectively, due primarily to electric and gas base rates increases in January 2019 under the company's rate plans. |
| Weather impact on steam revenues | (0.03) | (9) | Reflects the impact of warmer April weather in 2019. |
| Operations and maintenance expenses | (0.05) | (16) | Reflects higher costs for pension and other postretirement benefits of $(0.04) a share and regulatory assessments and fees that are collected in revenues from customers of $(0.04) a share, offset, in part, by lower storm-related costs of $0.03 a share. |
| Depreciation, property taxes and other tax matters | (0.15) | (46) | Reflects higher property taxes of $(0.07) a share, higher depreciation and amortization expense of $(0.06) a share and the absence of a New York State sales and use tax refund received in 2018 of $(0.02) a share. |
| Other | (0.02) | 3 | Reflects primarily higher interest expense on long-term debt of $(0.04) a share and the dilutive effect of Con Edison's stock issuances of $(0.03) a share, offset, in part, by lower costs associated with components of pension and other postretirement benefits other than service cost of $0.05 a share. |
| Total CECONY | (0.02) | 3 |
|
| O&R (a) | | | |
| Changes in rate plans | (0.01) | (4) | Reflects primarily a gas base rate decrease, offset, in part, by an electric base rate increase under the company's new rate plans, effective January 1, 2019. |
| Depreciation, property taxes and other tax matters | — |
| (2) |
|
| Total O&R | (0.01) | (6) |
|
| Clean Energy Businesses |
|
|
|
|
| Operating revenues less energy costs | 0.22 | 67 | Reflects primarily higher renewable electric production projects revenue due to the December 2018 acquisition of Sempra Solar Holdings, LLC, including the consolidation of certain jointly-owned projects that were previously accounted for as equity investments of $0.24 a share, offset, in part, by lower wholesale revenues of $(0.04) a share. |
| Operations and maintenance expenses | — |
| (1) |
|
| Depreciation and amortization | (0.10) | (29) | Reflects an increase in renewable electric production projects due to the December 2018 acquisition of Sempra Solar Holdings, LLC. |
| Net interest expense | (0.12) | (36) | Reflects primarily an increase in debt due to the December 2018 acquisition of Sempra Solar Holdings, LLC. |
| HLBV effects | (0.07) | (21) |
|
| Other | (0.04) | (11) | Reflects primarily the absence in 2019 of equity income from certain jointly-owned projects that were accounted for as equity investments in 2018 but consolidated after the December 2018 acquisition of Sempra Solar Holdings, LLC. |
| Total Clean Energy Businesses | (0.11) | (31) |
|
| Con Edison Transmission | — |
| — |
|
|
| Other, including parent company expenses | — |
| (2) |
|
| Total Reported (GAAP basis) | $(0.14) | $(36) |
|
| | | | |
a. Under the revenue decoupling mechanisms in the Utilities’ New York electric and gas rate plans and the weather-normalization clause applicable to their gas businesses, revenues are generally not affected by changes in delivery volumes from levels assumed when rates were approved. In general, the utilities recover on a current basis the fuel, gas purchased for resale and purchased power costs they incur in supplying energy to their full-service customers. Accordingly, such costs do not generally affect Con Edison’s results of operations. |
| | | Variation for the Six Months Ended June 30, 2019 vs. 2018 | |
| Variation for the Three Months Ended March 31, 2020 vs. 2019 | | Variation for the Three Months Ended March 31, 2020 vs. 2019 |
| | Earnings
per Share | Net Income for Common Stock (Millions of Dollars) | | Earnings
per Share | Net Income for Common Stock (Millions of Dollars) | |
| CECONY (a) | | |
|
|
|
| Changes in rate plans | $0.48 | $150 | Reflects higher electric and gas net base revenues of $0.24 a share and $0.10 a share, respectively, due primarily to electric and gas base rates increases in January 2019 under the company's rate plans, and growth in the number of gas customers of $0.02 a share. | $0.12 | $38 | Reflects higher electric and gas net base revenues of $0.03 a share and $0.09 a share, respectively, due primarily to electric and gas base rate increases in January 2020 under the company's rate plans. |
| Weather impact on steam revenues | (0.05) | (15) | Reflects the impact of warmer winter weather in 2019. | (0.08) | (25) | Reflects the impact of warmer winter weather in 2020. |
| Operations and maintenance expenses | (0.12) | (37) | Reflects higher costs for pension and other postretirement benefits of $(0.07) a share, stock-based compensation of $(0.05) a share and regulatory assessments and fees that are collected in revenues from customers of $(0.05) a share, offset, in part, by lower storm-related costs of $0.05 a share. | 0.21 | 67 | Reflects lower costs for pension and other postretirement benefits of $0.18 a share, which are reconciled under the rate plans, lower stock-based compensation of $0.02 a share, and lower consultant cost of $0.01 a share, offset, in part, by a higher reserve for uncollectibles and incremental costs associated with the Coronavirus Disease 2019 (COVID-19) of $(0.02) a share. |
| Depreciation, property taxes and other tax matters | (0.29) | (90) | Reflects higher property taxes of $(0.14) a share, higher depreciation and amortization expense of $(0.11) a share and the absence of New York State sales and use tax refunds received in 2018 of $(0.04) a share. | (0.21) | (67) | Reflects higher property taxes of $(0.08) a share and higher depreciation and amortization expense of $(0.13) a share, both of which are recoverable under the rate plans. |
| Other | (0.02) | 18 | Reflects primarily the dilutive effect of Con Edison's stock issuances of $(0.09) a share, offset by lower costs associated with components of pension and other postretirement benefits other than service cost of $0.09 a share. | (0.10) | (20) | Reflects primarily higher costs associated with components of pension and other postretirement benefits other than service cost of $(0.11) a share, which are reconciled under the rate plans, suspension of customers' late payment charges and certain other fees associated with COVID-19 of $(0.01) a share and the dilutive effect of Con Edison's stock issuances of $(0.03). |
| Total CECONY | — |
| 26 |
| (0.06) | (7) |
|
| O&R (a) | | |
|
|
|
| Changes in rate plans | — |
| (2) |
| 0.02 | 6 | Reflects an electric base rate increase of $0.02 a share under the company's rate plans. |
| Operations and maintenance expenses | 0.02 | 7 | Reflects primarily lower storm-related costs of $0.01 a share and lower pension costs of $0.01 a share. | (0.01) | (3) | Reflects primarily lower recoveries for workers' compensation. |
| Depreciation, property taxes and other tax matters | (0.01) | (2) | Reflects higher depreciation and amortization expense. | (0.01) | (2) | Reflects higher depreciation and amortization expense. |
| Other | | (0.01) | (2) | Reflects primarily the dilutive effect of Con Edison's stock issuances. |
| Total O&R | 0.01 | 3 |
| (0.01) | (1) |
|
| Clean Energy Businesses | | |
|
|
|
|
| Operating revenues less energy costs | 0.17 | 52 | Reflects primarily higher renewable electric production projects revenues due to the December 2018 acquisition of Sempra Solar Holdings, LLC, including the consolidation of certain jointly-owned projects that were previously accounted for as equity investments of $0.38 a share, offset, in part, by lower engineering, procurement and construction services revenues of $(0.22) a share. | — |
| (2) |
|
| Operations and maintenance expenses | 0.15 | 45 | Reflects primarily lower engineering, procurement and construction costs. | 0.02 | 4 | Reflects primarily lower energy services costs. |
| Depreciation and amortization | (0.19) | (58) | Reflects an increase in renewable electric production projects due to the December 2018 acquisition of Sempra Solar Holdings, LLC. | — |
| 1 |
|
| Net interest expense | (0.20) | (61) | Reflects primarily an increase in debt due to the December 2018 acquisition of Sempra Solar Holdings, LLC. | (0.16) | (57) | Reflects primarily unrealized losses on interest rate swaps. |
| HLBV effects | (0.11) | (37) |
| 0.01 | 3 |
|
| Other | (0.05) | (13) | Reflects primarily the absence in 2019 of equity income from certain jointly-owned projects that were accounted for as equity investments in 2018 but consolidated after the December 2018 acquisition of Sempra Solar Holdings, LLC. | 0.01 | 4 | Reflects re-measurement of deferred tax assets under the Coronavirus Aid, Relief, and Economic Security Act. |
| Total Clean Energy Businesses | (0.23) | (72) |
| (0.12) | (47) |
|
| Con Edison Transmission | 0.01 | 2 | Reflects income from equity investments. | — |
| 1 |
|
| Other, including parent company expenses | — |
| 1 |
| 0.01 | 4 | Reflects primarily New York State combined income tax benefits. |
| Total Reported (GAAP basis) | $(0.21) | $(40) |
| $(0.18) | $(50) |
|
| | | | | |
a. Under the revenue decoupling mechanisms in the Utilities’ New York electric and gas rate plans and the weather-normalization clause applicable to their gas businesses, revenues are generally not affected by changes in delivery volumes from levels assumed when rates were approved. In general, the utilities recover on a current basis the fuel, gas purchased for resale and purchased power costs they incur in supplying energy to their full-service customers. Accordingly, such costs do not generally affect Con Edison’s results of operations. | a. Under the revenue decoupling mechanisms in the Utilities’ New York electric and gas rate plans and the weather-normalization clause applicable to their gas businesses, revenues are generally not affected by changes in delivery volumes from levels assumed when rates were approved. In general, the utilities recover on a current basis the fuel, gas purchased for resale and purchased power costs they incur in supplying energy to their full-service customers. Accordingly, such costs do not generally affect Con Edison’s results of operations. | a. Under the revenue decoupling mechanisms in the Utilities’ New York electric and gas rate plans and the weather-normalization clause applicable to their gas businesses, revenues are generally not affected by changes in delivery volumes from levels assumed when rates were approved. In general, the utilities recover on a current basis the fuel, gas purchased for resale and purchased power costs they incur in supplying energy to their full-service customers. Accordingly, such costs do not generally affect Con Edison’s results of operations. |
The Companies’ other operations and maintenance expenses for the three and six months ended June 30,March 31, 2020 and 2019 and 2018 were as follows:
| | | | For the Three Months Ended June 30, | For the Six Months Ended June 30, | For the Three Months Ended March 31, |
| (Millions of Dollars) | 2019 | 2018 | 2019 |
| 2018 | 2020 |
| 2019 |
|
| CECONY | | | | |
| Operations | $378 | $401 | $776 | $794 | $404 | $398 |
| Pensions and other postretirement benefits | 33 | 18 | 67 | 35 | (44) | 33 |
| Health care and other benefits | 42 | 47 | 80 | 86 | 37 | 38 |
| Regulatory fees and assessments (a) | 109 | 94 | 222 | 203 | 85 | 114 |
| Other | 89 | 69 | 166 | 142 | 87 | 76 |
| Total CECONY | 651 | 629 | 1,311 | 1,260 | 569 | 659 |
| O&R | 73 | 74 | 144 | 154 | 74 | 71 |
Clean Energy Businesses (b) | 55 | 52 | 115 | 176 | 55 | 61 |
| Con Edison Transmission | 3 | 2 | 5 | 5 | 2 | 3 |
Other (c)(b) | (1) | — |
| (3) | — |
| — |
|
| Total other operations and maintenance expenses | $781 | $756 | $1,575 | $1,592 | $700 | $794 |
| |
| (a) | Includes Demand Side Management, System Benefit Charges and Public Service Law 18A assessments which are collected in revenues. |
| |
| (b) | The decrease in operations and maintenance for the six months ended June 30, 2019 compared with the 2018 period is due primarily to lower engineering, procurement and construction costs. |
| |
(c) | Includes parent company and consolidation adjustments. |
A discussion of the results of operations by principal business segment for the three and six months ended June 30,March 31, 2020 and 2019 and 2018 follows. For additional business segment financial information, see Note KL to the SecondFirst Quarter Financial Statements.
The Companies’ results of operations for the three months ended June 30,March 31, 2020 and 2019 and 2018 were as follows:
| | | | CECONY | O&R | Clean Energy Businesses | Con Edison
Transmission | Other (a) | Con Edison (b) | CECONY | O&R | Clean Energy Businesses | Con Edison
Transmission | Other (a) | Con Edison (b) |
| (Millions of Dollars) | 2019 |
| 2018 |
| 2019 |
| 2018 |
| 2019 |
| 2018 |
| 2019 |
| 2018 |
| 2019 |
| 2018 |
| 2019 | 2018 |
| 2020 |
| 2019 |
| 2020 |
| 2019 |
| 2020 |
| 2019 |
| 2020 |
| 2019 |
| 2020 |
| 2019 |
| 2020 | 2019 |
| Operating revenues | $2,331 | $2,338 | $179 | $198 | $233 | $158 | $1 | $1 |
| $— |
| $1 | $2,744 | $2,696 | $2,854 | $3,039 | $233 | $258 | $146 | $217 | $1 | $1 |
| $— |
| $(1) | $3,234 | $3,514 |
| Purchased power | 313 | 343 | 39 | 43 | — |
| 2 | — |
| — |
| — |
| — |
| 352 | 388 | 273 | 322 | 35 | 46 | — |
| — |
| — |
| — |
| — |
| — |
| 308 | 368 |
| Fuel | 26 | 38 | — |
| — |
| — |
| — |
| — |
| — |
| — |
| — |
| 26 | 38 | 78 | 106 | — |
| — |
| — |
| — |
| — |
| — |
| — |
| — |
| 78 | 106 |
| Gas purchased for resale | 76 | 118 | 13 | 19 | 42 | 57 | — |
| — |
| — |
| — |
| 131 | 194 | 195 | 317 | 24 | 44 | 13 | 81 | — |
| — |
| — |
| — |
| 232 | 442 |
| Other operations and maintenance | 651 | 629 | 73 | 74 | 55 | 52 | 3 | 2 | (1) | (1) | 781 | 756 | 569 | 659 | 74 | 71 | 55 | 61 | 2 | 3 | — |
| — |
| 700 | 794 |
| Depreciation and amortization | 339 | 316 | 21 | 19 | 58 | 19 | — |
| — |
| — |
| — |
| 418 | 354 | 390 | 334 | 22 | 21 | 57 | 58 | 1 | — |
| — |
| — |
| 470 | 413 |
| Taxes, other than income taxes | 550 | 512 | 20 | 20 | 6 | 4 | — |
| — |
| 2 | 4 | 578 | 540 | 607 | 575 | 23 | 22 | 7 | 6 | — |
| — |
| 1 | 2 | 638 | 605 |
| Operating income | 376 | 382 | 13 | 23 | 72 | 24 | (2) | (1) | (1) | (2) | 458 | 426 | 742 | 726 | 55 | 54 | 14 | 11 | (2) | (2) | (1) | (3) | 808 | 786 |
| Other income less deductions | (15) | (35) | (2) | (5) | — |
| 16 | 24 | 22 | (4) | (1) | 3 | (3) | (61) | (7) | (4) | (3) | 1 | 1 | 26 | 25 | (1) | (2) | (39) | 14 |
| Net interest expense | 182 | 167 | 10 | 9 | 63 | 14 | 5 | 4 | 3 | 3 | 263 | 197 | 180 | 183 | 11 | 10 | 122 | 46 | 5 | 5 | 4 | 3 | 322 | 247 |
| Income before income tax expense | 179 | 180 | 1 | 9 | 9 | 26 | 17 | 17 | (8) | (6) | 198 | 226 | 501 | 536 | 40 | 41 | (107) | (34) | 19 | 18 | (6) | (8) | 447 | 553 |
| Income tax expense | 27 | 31 | (1) | 1 | (12) | 1 | 5 | 5 | — |
| — |
| 19 | 38 | 95 | 124 | 9 | 9 | (42) | (20) | 5 | 5 | (12) | (10) | 55 | 108 |
| Net income | $152 | $149 | $2 | $8 | $21 | $25 | $12 | $12 | $(8) | $(6) | $179 | $188 | $406 | $412 | $31 | $32 | $(65) | $(14) | $14 | $13 | $6 | $2 | $392 | $445 |
Income attributable to non-controlling interest
| — |
| — |
| — |
| — |
| 27 | — |
| — |
| — |
| — |
| — |
| 27 | — |
| — |
| — |
| — |
| — |
| 17 | 21 | — |
| — |
| — |
| — |
| 17 | 21 |
| Net income for common stock | $152 | $149 | $2 | $8 | $(6) | $25 | $12 | $(8) | $(6) | $152 | $188 | $406 | $412 | $31 | $32 | $(82) | $(35) | $14 | $13 | $6 | $2 | $375 | $424 |
| |
| (a) | Includes parent company and consolidation adjustments. |
| |
| (b) | Represents the consolidated results of operations of Con Edison and its businesses. |
CECONY
| | | For the Three Months Ended
June 30, 2019 | | For the Three Months Ended
June 30, 2018 | | For the Three Months Ended
March 31, 2020 | | For the Three Months Ended
March 31, 2019 | |
| (Millions of Dollars) | Electric |
| Gas |
| Steam |
| 2019 Total | Electric |
| Gas |
| Steam |
| 2018 Total | 2019-2018
Variation | Electric |
| Gas |
| Steam |
| 2020 Total | Electric |
| Gas |
| Steam |
| 2019 Total | 2020-2019
Variation |
| Operating revenues | $1,833 | $408 | $90 | $2,331 | $1,807 | $435 | $96 | $2,338 | $(7) | $1,770 | $834 | $250 | $2,854 | $1,797 | $921 | $321 | $3,039 | $(185) |
| Purchased power | 306 | — |
| 7 | 313 | 337 | — |
| 6 | 343 | (30) | 264 | — |
| 9 | 273 | 310 | — |
| 12 | 322 | (49) |
| Fuel | 14 | — |
| 12 | 26 | 26 | — |
| 12 | 38 | (12) | 30 | — |
| 48 | 78 | 33 | — |
| 73 | 106 | (28) |
| Gas purchased for resale | — |
| 76 | — |
| 76 | — |
| 118 | — |
| 118 | (42) | — |
| 195 | — |
| 195 | — |
| 317 | — |
| 317 | (122) |
| Other operations and maintenance | 510 | 97 | 44 | 651 | 483 | 106 | 40 | 629 | 22 | 431 | 96 | 42 | 569 | 507 | 106 | 46 | 659 | (90) |
| Depreciation and amortization | 261 | 56 | 22 | 339 | 243 | 51 | 22 | 316 | 23 | 297 | 71 | 22 | 390 | 257 | 55 | 22 | 334 | 56 |
| Taxes, other than income taxes | 428 | 85 | 37 | 550 | 400 | 78 | 34 | 512 | 38 | 466 | 103 | 38 | 607 | 433 | 99 | 43 | 575 | 32 |
| Operating income | $314 | $94 | $(32) | $376 | $318 | $82 | $(18) | $382 | $(6) | $282 | $369 | $91 | $742 | $257 | $344 | $125 | $726 | $16 |
Electric
CECONY’s results of electric operations for the three months ended June 30, 2019March 31, 2020 compared with the 20182019 period were as follows:
| | | For the Three Months Ended | | |
�� | | For the Three Months Ended | |
| (Millions of Dollars) | June 30, 2019 | June 30, 2018 | Variation | March 31, 2020 | March 31, 2019 | Variation |
| Operating revenues | $1,833 | $1,807 | $26 | $1,770 | $1,797 | $(27) |
| Purchased power | 306 | 337 | (31) | 264 | 310 | (46) |
| Fuel | 14 | 26 | (12) | 30 | 33 | (3) |
| Other operations and maintenance | 510 | 483 | 27 | 431 | 507 | (76) |
| Depreciation and amortization | 261 | 243 | 18 | 297 | 257 | 40 |
| Taxes, other than income taxes | 428 | 400 | 28 | 466 | 433 | 33 |
| Electric operating income | $314 | $318 | $(4) | $282 | $257 | $25 |
CECONY’s electric sales and deliveries for the three months ended June 30, 2019March 31, 2020 compared with the 20182019 period were:
| | | Millions of kWh Delivered | | Revenues in Millions (a) | Millions of kWh Delivered | | Revenues in Millions (a) |
| For the Three Months Ended | | | For the Three Months Ended | | For the Three Months Ended | | | For the Three Months Ended | |
| Description | June 30, 2019 |
| June 30, 2018 |
| Variation |
| Percent Variation |
| | June 30, 2019 | June 30, 2018 | Variation | Percent Variation |
| March 31, 2020 |
| March 31, 2019 |
| Variation |
| Percent Variation |
| | March 31, 2020 | March 31, 2019 | Variation | Percent Variation |
|
| Residential/Religious (b) | 2,101 |
| 2,187 |
| (86) |
| (3.9 | )% | | $541 | $601 | $(60) | (10.0 | )% | 2,343 |
| 2,415 |
| (72) |
| (3.0 | )% | | $609 | $596 | $13 | 2.2 | % |
| Commercial/Industrial | 2,283 |
| 2,222 |
| 61 |
| 2.7 |
| | 429 | 438 | (9) | (2.1 | ) | 2,401 |
| 2,460 |
| (59) |
| (2.4 | ) | | 433 | 421 | 12 | 2.9 |
|
| Retail choice customers | 5,691 |
| 5,966 |
| (275) |
| (4.6 | ) | | 516 | 563 | (47) | (8.3 | ) | 5,713 |
| 5,979 |
| (266) |
| (4.4 | ) | | 555 | 507 | 48 | 9.5 |
|
| NYPA, Municipal Agency and other sales | 2,312 |
| 2,403 |
| (91) |
| (3.8 | ) | | 148 | 152 | (4) | (2.6 | ) | 2,375 |
| 2,410 |
| (35) |
| (1.5 | ) | | 144 | 135 | 9 | 6.7 |
|
| Other operating revenues (c) | — |
| — |
| — |
| — |
| | 199 | 53 | 146 | Large |
| — |
| — |
| — |
| — |
| | 29 | 138 | (109) | (79.0 | ) |
| Total | 12,387 |
| 12,778 |
| (391) |
| (3.1 | )% | (d) | $1,833 | $1,807 | $26 | 1.4 | % | 12,832 |
| 13,264 |
| (432) |
| (3.3 | )% | (d) | $1,770 | $1,797 | $(27) | (1.5 | )% |
| |
| (a) | Revenues from electric sales are subject to a revenue decoupling mechanism, as a result of which delivery revenues generally are not affected by changes in delivery volumes from levels assumed when rates were approved. |
| |
| (b) | “Residential/Religious” generally includes single-family dwellings, individual apartments in multi-family dwellings, religious organizations and certain other not-for-profit organizations. |
| |
| (c) | Other electric operating revenues generally reflect changes in the revenue decoupling mechanism current asset or regulatory liability and changes in regulatory assets and liabilities in accordance with other provisions of the company’s rate plans. |
| |
| (d) | After adjusting for variations, primarily weather and billing days, electric delivery volumes in CECONY’s service area decreased 1.4 percentremained the same in the three months ended June 30, 2019March 31, 2020 compared with the 20182019 period. |
Operating revenues increased $26decreased $27 million in the three months ended June 30, 2019March 31, 2020 compared with the 20182019 period due primarily to lower purchased power expenses ($46 million) and fuel expenses ($3 million), offset, in part, by an increase in revenues from the new electric rate plan ($71 million), offset, in part, by lower purchased power expenses ($31 million) and fuel expenses ($1218 million).
Purchased power expenses decreased $31$46 million in the three months ended June 30, 2019March 31, 2020 compared with the 20182019 period due to lower unit costspurchased volumes ($3854 million), offset, in part, by higher purchased volumesunit costs ($78 million).
Fuel expenses decreased $12$3 million in the three months ended June 30, 2019March 31, 2020 compared with the 20182019 period due to lower unit costs ($105 million) and, offset, in part, by higher purchased volumes from the company's electric generating facilities ($2 million).
Other operations and maintenance expenses increased $27decreased $76 million in the three months ended June 30, 2019March 31, 2020 compared with the 20182019 period due primarily to higher surcharges for assessments and fees that are collected in revenues from customers ($28 million) and higher costlower costs for pension and other postretirement benefits ($14 million), offset, in part, by lower municipal infrastructure support costs ($14 million).benefits.
Depreciation and amortization increased $18$40 million in the three months ended June 30, 2019March 31, 2020 compared with the 20182019 period due primarily to higher electric utility plant balances.balances and higher depreciation rates.
Taxes, other than income taxes increased $28$33 million in the three months ended June 30, 2019March 31, 2020 compared with the 20182019 period due primarily to higher property taxes ($1626 million), the absence of a New York State saleshigher state and use tax refund received in 2018local taxes ($84 million) and lower deferral of under-collected property taxes ($54 million), offset, in part, by lower state and local taxes ($1 million) and payroll taxes ($1 million).
Gas
CECONY’s results of gas operations for the three months ended June 30, 2019March 31, 2020 compared with the 20182019 period were as follows:
| | | For the Three Months Ended | | For the Three Months Ended | |
| (Millions of Dollars) | June 30, 2019 | June 30, 2018 | Variation | March 31, 2020 | March 31, 2019 | Variation |
| Operating revenues | $408 | $435 | $(27) | $834 | $921 | $(87) |
| Gas purchased for resale | 76 | 118 | (42) | 195 | 317 | (122) |
| Other operations and maintenance | 97 | 106 | (9) | 96 | 106 | (10) |
| Depreciation and amortization | 56 | 51 | 5 | 71 | 55 | 16 |
| Taxes, other than income taxes | 85 | 78 | 7 | 103 | 99 | 4 |
| Gas operating income | $94 | $82 | $12 | $369 | $344 | $25 |
CECONY’s gas sales and deliveries, excluding off-system sales, for the three months ended June 30, 2019March 31, 2020 compared with the 20182019 period were:
| | | Thousands of Dt Delivered | | Revenues in Millions (a) | Thousands of Dt Delivered | | Revenues in Millions (a) |
| For the Three Months Ended | | | For the Three Months Ended | | For the Three Months Ended | | | For the Three Months Ended | |
| Description | June 30, 2019 |
| June 30, 2018 |
| Variation |
| Percent Variation |
| | June 30, 2019 | June 30, 2018 | Variation |
| Percent Variation |
| March 31, 2020 |
| March 31, 2019 |
| Variation |
| Percent Variation |
| | March 31, 2020 | March 31, 2019 | Variation |
| Percent Variation |
|
| Residential | 9,816 |
| 11,973 |
| (2,157 | ) | (18.0 | )% | | $183 | $217 | $(34) | (15.7 | )% | 22,622 |
| 27,306 |
| (4,684 | ) | (17.2 | )% | | $383 | $438 | $(55) | (12.6 | )% |
| General | 6,550 |
| 7,252 |
| (702 | ) | (9.7 | ) | | 76 | 90 | (14) | (15.6 | ) | 11,957 |
| 14,425 |
| (2,468 | ) | (17.1 | ) | | 138 | 178 | (40) | (22.5 | ) |
| Firm transportation | 16,037 |
| 17,627 |
| (1,590 | ) | (9.0 | ) | | 120 | 118 | 2 | 1.7 |
| 32,984 |
| 35,308 |
| (2,324 | ) | (6.6 | ) | | 292 | 253 | 39 | 15.4 |
|
| Total firm sales and transportation | 32,403 |
| 36,852 |
| (4,449 | ) | (12.1 | ) | (b) | 379 | 425 | (46) | (10.8 | ) | 67,563 |
| 77,039 |
| (9,476 | ) | (12.3 | ) | (b) | 813 | 869 | (56) | (6.4 | ) |
| Interruptible sales (c) | 1,860 |
| 1,983 |
| (123 | ) | (6.2 | ) | | 9 | 13 | (4) | (30.8 | ) | 2,486 |
| 3,730 |
| (1,244 | ) | (33.4 | ) | | 11 | 20 | (9) | (45.0 | ) |
| NYPA | 10,515 |
| 9,900 |
| 615 |
| 6.2 |
| | 1 | — |
| — |
| 8,079 |
| 7,452 |
| 627 |
| 8.4 |
| | 1 | — |
| — |
|
| Generation plants | 10,288 |
| 14,418 |
| (4,130 | ) | (28.6 | ) | | 5 | 6 | (1) | (16.7 | ) | 10,157 |
| 11,699 |
| (1,542 | ) | (13.2 | ) | | 5 | — |
| — |
|
| Other | 5,140 |
| 5,430 |
| (290 | ) | (5.3 | ) | | 7 | 10 | (3) | (30.0 | ) | 6,946 |
| 6,313 |
| 633 |
| 10.0 |
| | 12 | 10 | 2 | 20.0 |
|
| Other operating revenues (d) | — |
| — |
| — |
| — |
| | 7 | (20) | 27 | Large |
| — |
| — |
| — |
| — |
| | (8) | 16 | (24) | Large |
|
| Total | 60,206 |
| 68,583 |
| (8,377 | ) | (12.2 | )% | | $408 | $435 | $(27) | (6.2 | )% | 95,231 |
| 106,233 |
| (11,002 | ) | (10.4 | )% | | $834 | $921 | $(87) | (9.4 | )% |
| |
| (a) | Revenues from gas sales are subject to a weather normalization clause and a revenue decoupling mechanism, as a result of which delivery revenues are generally not affected by changes in delivery volumes from levels assumed when rates were approved. |
| |
| (b) | After adjusting for variations, primarily billing days, firm gas sales and transportation volumes in the company’s service area decreased 3.1increased 0.4 percent in the three months ended June 30, 2019March 31, 2020 compared with the 20182019 period, reflecting primarily increased volumes attributable to the growth in the number of gas customers. |
| |
| (c) | Includes 753 thousands970 thousand and 849 thousands1,213 thousand of Dt for the 20192020 and 20182019 periods, respectively, which are also reflected in firm transportation and other. |
| |
| (d) | Other gas operating revenues generally reflect changes in the revenue decoupling mechanism and weather normalization clause current asset or regulatory liability and changes in regulatory assets and liabilities in accordance with other provisions of the company’s rate plans. |
Operating revenues decreased $27$87 million in the three months ended June 30, 2019March 31, 2020 compared with the 20182019 period due primarily to lower gas purchased for resale expense ($42122 million), offset, in part, by an increase in revenues from the new gas rate plan ($2135 million).
Gas purchased for resale decreased $42$122 million in the three months ended June 30, 2019March 31, 2020 compared with the 20182019 period due to lower unit costs.costs ($83 million) and purchased volumes ($39 million).
Other operations and maintenance expenses decreased $9$10 million in the three months ended June 30, 2019March 31, 2020 compared with the 20182019 period due primarily to lower equipment maintenance expenses ($3 million), surchargescosts for assessmentspension and fees that are collected in revenues from customers ($1 million) and municipal infrastructure support costs ($1 million).other postretirement benefits.
Depreciation and amortization increased $5$16 million in the three months ended June 30, 2019March 31, 2020 compared with the 20182019 period due primarily to higher gas utility plant balances.balances and higher depreciation rates.
Taxes, other than income taxes increased $7$4 million in the three months ended June 30, 2019March 31, 2020 compared with the 20182019 period due primarily to higher property taxes ($109 million) and the absence of a New York State salesstate and use tax refund received in 2018local taxes ($21 million), offset, in part, by higher deferral of under-collected property taxes ($35 million).
Steam
CECONY’s results of steam operations for the three months ended June 30, 2019March 31, 2020 compared with the 20182019 period were as follows:
| | | For the Three Months Ended | | For the Three Months Ended | |
| (Millions of Dollars) | June 30, 2019 | June 30, 2018 | Variation |
| March 31, 2020 | March 31, 2019 | Variation |
|
| Operating revenues | $90 | $96 | $(6) | $250 | $321 | $(71) |
| Purchased power | 7 | 6 | 1 | 9 | 12 | (3) |
| Fuel | 12 | — |
| 48 | 73 | (25) |
| Other operations and maintenance | 44 | 40 | 4 | 42 | 46 | (4) |
| Depreciation and amortization | 22 | — |
| 22 | — |
|
| Taxes, other than income taxes | 37 | 34 | 3 | 38 | 43 | (5) |
| Steam operating income | $(32) | $(18) | $(14) | $91 | $125 | $(34) |
CECONY’s steam sales and deliveries for the three months ended June 30, 2019March 31, 2020 compared with the 20182019 period were:
| | | Millions of Pounds Delivered | | Revenues in Millions | Millions of Pounds Delivered | | Revenues in Millions |
| For the Three Months Ended | | | For the Three Months Ended | | For the Three Months Ended | | | For the Three Months Ended | |
| Description | June 30, 2019 |
| June 30, 2018 |
| Variation |
| Percent Variation |
| | June 30, 2019 | June 30, 2018 | Variation | Percent Variation |
| March 31, 2020 |
| March 31, 2019 |
| Variation |
| Percent Variation |
| | March 31, 2020 | March 31, 2019 | Variation | Percent Variation |
|
| General | 60 |
| 92 |
| (32 | ) | (34.8 | )% | | $4 | $5 | $(1) | (20.0 | )% | 262 |
| 327 |
| (65 | ) | (19.9 | )% | | $12 | $15 | $(3) | (20.0 | )% |
| Apartment house | 1,033 |
| 1,177 |
| (144 | ) | (12.2 | ) | | 25 | 29 | (4) | (13.8 | ) | 2,176 |
| 2,576 |
| (400 | ) | (15.5 | ) | | 65 | 82 | (17) | (20.7 | ) |
| Annual power | 2,286 |
| 2,655 |
| (369 | ) | (13.9 | ) | | 60 | 72 | (12) | (16.7 | ) | 4,519 |
| 5,654 |
| (1,135 | ) | (20.1 | ) | | 161 | 208 | (47) | (22.6 | ) |
| Other operating revenues (a) | — |
| — |
| — |
| — |
| | 1 | (10) | 11 | Large |
| — |
| — |
| — |
| — |
| | 12 | 16 | (4) | (25.0 | ) |
| Total | 3,379 |
| 3,924 |
| (545 | ) | (13.9 | )% | (b) | $90 | $96 | $(6) | (6.3 | )% | 6,957 |
| 8,557 |
| (1,600 | ) | (18.7 | )% | (b) | $250 | $321 | $(71) | (22.1 | )% |
| |
| (a) | Other steam operating revenues generally reflect changes in regulatory assets and liabilities in accordance with the company’s rate plan. |
| |
| (b) | After adjusting for variations, primarily weather and billing days, steam sales and deliveries decreased 0.30.1 percent in the three months ended June 30, 2019March 31, 2020 compared with the 20182019 period. |
Operating revenues decreased $6$71 million in the three months ended June 30, 2019March 31, 2020 compared with the 20182019 period due primarily to the impact of warmer Aprilwinter weather ($1333 million), offset, in part, by a lower reserve related to steam earnings sharingfuel expenses ($125 million), higher and purchased power expenses ($1 million) and certain rate plan reconciliations ($43 million).
Purchased power increased $1decreased $3 million in the three months ended June 30, 2019March 31, 2020 compared with the 20182019 period due to lower unit costs ($4 million), offset, in part, by higher purchased volumes.volumes ($1 million).
Fuel expensesdecreased $25 million in the three months ended March 31, 2020 compared with the 2019 period due to lower purchased volumes ($13 million) and unit costs ($12 million).
Other operations and maintenance expenses increaseddecreased $4 million in the three months ended June 30, 2019March 31, 2020 compared with the 20182019 period due primarily to higher municipal infrastructure support costs.lower costs for pension and other postretirement benefits.
Taxes, other than income taxes increased $3decreased $5 million in the three months ended June 30, 2019March 31, 2020 compared with the 20182019 period due primarily to higher deferral of under-collected property taxes.taxes ($6 million) and lower state and local taxes ($2 million), offset, in part, by higher property taxes ($3 million).
Other Income (Deductions)
Other income (deductions) increased $20decreased $54 million in the three months ended June 30, 2019March 31, 2020 compared with the 20182019 period due primarily to lowerhigher costs associated with components of pension and other postretirement benefits other than service cost.cost ($47 million) due to a decrease in the discount rate and the absence of the company’s share of a gain on sale of property in 2019 ($5 million).
Net Interest Expense
Net interest expense increased $15decreased $3 million in the three months ended June 30, 2019March 31, 2020 compared with the 20182019 period due primarily to higher interest expense for long-term ($3 million) and short-term ($1 million) debt, an increasea decrease in interest accrued on the TCJA related regulatory liability ($3 million) and lower interest accrued on the system benefit charge liabilityexpense for short-term debt ($2 million), offset, in part, by higher interest on long-term debt ($3 million).
Income Tax Expense
Income taxes decreased $4$29 million in the three months ended June 30, 2019March 31, 2020 compared with the 20182019 period due primarily to lower state income taxesbefore income tax expense ($2 million), higher tax benefits in 2019 for plant-related flow through items ($17 million) and an increase in the amortization of excess deferred federal income taxes due to the TCJACECONY's new rate plan beginning in January 2020 ($25 million), offset, in part, by higher state income taxes ($1 million). CECONY deferred as a regulatory liability its estimated net benefits for the 2018 period under the TCJA and continued to defer its estimated net benefits in 2019 for only its electric service. See “Other Regulatory Matters” in Note B to the Second Quarter Financial Statements.lower research and development credits ($1 million).
O&R
| | | For the Three Months Ended
June 30, 2019 | | For the Three Months Ended
June 30, 2018 | | | For the Three Months Ended
March 31, 2020 | | For the Three Months Ended
March 31, 2019 | | |
| (Millions of Dollars) | Electric |
| Gas |
| 2019 Total | Electric |
| Gas |
| 2018 Total | 2019-2018
Variation |
| Electric |
| Gas |
| 2020 Total | Electric |
| Gas |
| 2019 Total | 2020-2019
Variation |
| Operating revenues | $138 | $41 | $179 | $144 | $54 | $198 | $(19) | $136 | $97 | $233 | $145 | $113 | $258 | $(25) |
| Purchased power | 39 | — |
| 39 | 43 | — |
| 43 | (4) | 35 | — |
| 35 | 46 | — |
| 46 | (11) |
| Gas purchased for resale | — |
| 13 | 13 | — |
| 19 | 19 | (6) | — |
| 24 | 24 | — |
| 44 | 44 | (20) |
| Other operations and maintenance | 55 | 18 | 73 | 56 | 18 | 74 | (1) | 57 | 17 | 74 | 55 | 16 | 71 | 3 |
| Depreciation and amortization | 15 | 6 | 21 | 14 | 5 | 19 | 2 | 16 | 6 | 22 | 15 | 6 | 21 | 1 |
| Taxes, other than income taxes | 13 | 7 | 20 | 13 | 7 | 20 | — |
| 14 | 9 | 23 | 13 | 9 | 22 | 1 |
| Operating income | $16 | $(3) | $13 | $18 | $5 | $23 | $(10) | $14 | $41 | $55 | $16 | $38 | $54 | $1 |
Electric
O&R’s results of electric operations for the three months ended June 30, 2019March 31, 2020 compared with the 20182019 period were as follows:
|
| | | | |
| For the Three Months Ended | |
| (Millions of Dollars) | June 30, 2019 | June 30, 2018 | Variation |
|
| Operating revenues | $138 | $144 | $(6) |
| Purchased power | 39 | 43 | (4) |
| Other operations and maintenance | 55 | 56 | (1) |
| Depreciation and amortization | 15 | 14 | 1 |
| Taxes, other than income taxes | 13 | 13 | — |
|
| Electric operating income | $16 | $18 | $(2) |
|
| | | |
| For the Three Months Ended | |
| (Millions of Dollars) | March 31, 2020 | March 31, 2019 | Variation |
| Operating revenues | $136 | $145 | $(9) |
| Purchased power | 35 | 46 | (11) |
| Other operations and maintenance | 57 | 55 | 2 |
| Depreciation and amortization | 16 | 15 | 1 |
| Taxes, other than income taxes | 14 | 13 | 1 |
| Electric operating income | $14 | $16 | $(2) |
O&R’s electric sales and deliveries for the three months ended June 30, 2019March 31, 2020 compared with the 20182019 period were:
| | | Millions of kWh Delivered | | Revenues in Millions (a) | Millions of kWh Delivered | | Revenues in Millions (a) |
| For the Three Months Ended | | | For the Three Months Ended | | For the Three Months Ended | | | For the Three Months Ended | |
| Description | June 30, 2019 |
| June 30, 2018 |
| Variation |
| Percent Variation |
| | June 30, 2019 | June 30, 2018 | Variation | Percent Variation |
| March 31, 2020 |
| March 31, 2019 |
| Variation |
| Percent Variation |
| | March 31, 2020 | March 31, 2019 | Variation |
| Percent Variation |
|
| Residential/Religious (b) | 356 |
| 376 |
| (20 | ) | (5.3 | )% | | $64 | $71 | $(7) | (9.9 | )% | 352 |
| 397 |
| (45 | ) | (11.3 | )% | | $67 | $73 | $(6) | (8.2 | )% |
| Commercial/Industrial | 190 |
| 192 |
| (2 | ) | (1.0 | ) | | 25 | 27 | (2) | (7.4 | ) | 208 |
| 196 |
| 12 |
| 6.1 |
| | 27 | — |
| — |
|
| Retail choice customers | 712 |
| 713 |
| (1 | ) | (0.1 | ) | | 45 | 47 | (2) | (4.3 | ) | 638 |
| 685 |
| (47 | ) | (6.9 | ) | | 39 | 40 | (1 | ) | (2.5 | ) |
| Public authorities | 24 |
| 43 |
| (19 | ) | (44.2 | ) | | 2 | 3 | (1) | (33.3 | ) | 26 |
| 26 |
| — |
| — |
| | 2 | — |
| — |
|
| Other operating revenues (c) | — |
| — |
| — |
| — |
| | 2 | (4) | 6 | Large |
| — |
| — |
| — |
| — |
| | 1 | 3 | (2) | (66.7 | ) |
| Total | 1,282 |
| 1,324 |
| (42 | ) | (3.2 | )% | (d) | $138 | $144 | $(6) | (4.2 | )% | 1,224 |
| 1,304 |
| (80 | ) | (6.1 | )% | (d) | $136 | $145 | $(9) | (6.2 | )% |
| |
| (a) | O&R’s New York electric delivery revenues are subject to a revenue decoupling mechanism, as a result of which delivery revenues are generally not affected by changes in delivery volumes from levels assumed when rates were approved. O&R’s electric sales in New Jersey are not subject to a decoupling mechanism, and as a result, changes in such volumes do impact revenues. |
| |
| (b) | “Residential/Religious” generally includes single-family dwellings, individual apartments in multi-family dwellings, religious organizations and certain other not-for-profit organizations. |
| |
| (c) | Other electric operating revenues generally reflect changes in regulatory assets and liabilities in accordance with the company’s electric rate plan. |
| |
| (d) | After adjusting for weather and other variations, electric delivery volumes in O&R’s service area decreased 2.2increased 2.7 percent in the three months ended June 30, 2019March 31, 2020 compared with the 20182019 period. |
Operating revenues decreased $6$9 million in the three months ended June 30, 2019March 31, 2020 compared with the 20182019 period due primarily to lower purchased power expenses.
Purchased power expenses decreased $4$11 million in the three months ended June 30, 2019March 31, 2020 compared with the 20182019 period due to lower unit costs ($39 million) and purchased volumes ($12 million).
Other operations and maintenance expenses decreased $1increased $2 million in the three months ended June 30, 2019March 31, 2020 compared with the 20182019 period due primarily to lower pension costs.workers’ compensation recoveries ($1 million) and the amortization of prior deferred storm costs ($1 million).
Depreciation and amortization increased $1 million in the three months ended June 30, 2019March 31, 2020 compared with the 20182019 period due primarily to higher electric utility plant balances.
Taxes, other than income taxes increased $1 million in the three months ended March 31, 2020 compared with the 2019 period due primarily to higher property taxes.
Gas
O&R’s results of gas operations for the three months ended June 30, 2019March 31, 2020 compared with the 20182019 period were as follows:
|
| | | | |
| For the Three Months Ended | |
| (Millions of Dollars) | June 30, 2019 | June 30, 2018 | Variation |
|
| Operating revenues | $41 | $54 | $(13) |
| Gas purchased for resale | 13 | 19 | (6) |
| Other operations and maintenance | 18 | 18 | — |
|
| Depreciation and amortization | 6 | 5 | 1 |
| Taxes, other than income taxes | 7 | 7 | — |
|
| Gas operating income | $(3) | $5 | $(8) |
|
| | | | |
| For the Three Months Ended | |
| (Millions of Dollars) | March 31, 2020 | March 31, 2019 | Variation |
|
| Operating revenues | $97 | $113 | $(16) |
| Gas purchased for resale | 24 | 44 | (20) |
| Other operations and maintenance | 17 | 16 | 1 |
| Depreciation and amortization | 6 | 6 | — |
|
| Taxes, other than income taxes | 9 | 9 | — |
|
| Gas operating income | $41 | $38 | $3 |
O&R’s gas sales and deliveries, excluding off-system sales, for the three months ended June 30, 2019March 31, 2020 compared with the 20182019 period were:
| | | Thousands of Dt Delivered | | Revenues in Millions (a) | Thousands of Dt Delivered | | Revenues in Millions (a) |
| For the Three Months Ended | | | For the Three Months Ended | | For the Three Months Ended | | | For the Three Months Ended | |
| Description | June 30, 2019 |
| June 30, 2018 |
| Variation |
| Percent Variation |
| | June 30, 2019 |
| June 30, 2018 |
| Variation |
| Percent Variation |
| March 31, 2020 |
| March 31, 2019 |
| Variation |
| Percent Variation |
| | March 31, 2020 |
| March 31, 2019 |
| Variation |
| Percent Variation |
|
| Residential | 1,287 |
| 1,435 |
| (148 | ) | (10.3 | )% | | $18 | $25 | $(7) | (28.0 | )% | 4,074 |
| 4,966 |
| (892 | ) | (18.0 | )% | | $51 | $69 | $(18) | (26.1 | )% |
| General | 337 |
| 338 |
| (1 | ) | (0.3 | ) | | 4 | — |
| — |
| 931 |
| 1,111 |
| (180 | ) | (16.2 | ) | | 9 | 13 | (4) | (30.8 | ) |
| Firm transportation | 1,361 |
| 1,623 |
| (262 | ) | (16.1 | ) | | 10 | 14 | (4) | (28.6 | ) | 3,543 |
| 4,219 |
| (676 | ) | (16.0 | ) | | 27 | — |
| — |
|
| Total firm sales and transportation | 2,985 |
| 3,396 |
| (411 | ) | (12.1 | ) | (b) | 32 | 43 | (11) | (25.6 | ) | 8,548 |
| 10,296 |
| (1,748 | ) | (17.0 | ) | (b) | 87 | 109 | (22) | (20.2 | ) |
| Interruptible sales | 840 |
| 928 |
| (88 | ) | (9.5 | ) | | 1 | 2 | (1) | (50.0 | ) | 1,165 |
| 1,051 |
| 114 |
| 10.8 |
| | 2 | — |
| — |
|
| Generation plants | — |
| — |
| — |
| — |
| | — |
| — |
| — |
| — |
| — |
| — |
| — |
| — |
| | — |
| — |
| — |
| — |
|
| Other | 126 |
| 147 |
| (21 | ) | (14.3 | ) | | — |
| — |
| — |
| — |
| 373 |
| 437 |
| (64 | ) | (14.6 | ) | | — |
| — |
| — |
| — |
|
| Other gas revenues | — |
| — |
| — |
| — |
| | 8 | 9 | (1) | (11.1 | ) | — |
| — |
| — |
| — |
| | 8 | 2 | 6 | Large |
|
| Total | 3,951 |
| 4,471 |
| (520 | ) | (11.6 | )% | | $41 | $54 | $(13) | (24.1 | )% | 10,086 |
| 11,784 |
| (1,698 | ) | (14.4 | )% | | $97 | $113 | $(16) | (14.2 | )% |
| |
| (a) | Revenues from New York gas sales are subject to a weather normalization clause and a revenue decoupling mechanism as a result of which delivery revenues are generally not affected by changes in delivery volumes from levels assumed when rates were approved. |
| |
| (b) | After adjusting for weather and other variations, total firm sales and transportation volumes increased 3.31.5 percent in the three months ended June 30, 2019March 31, 2020 compared with the 20182019 period. |
Operating revenues decreased $13$16 million in the three months ended June 30, 2019March 31, 2020 compared with the 20182019 period due primarily to lower gas purchased for resale ($20 million), offset, in part, by higher revenues from the New York gas rate plan ($7 million) and gas purchased for resale ($62 million).
Gas purchased for resale decreased $6$20 million in the three months ended June 30, 2019March 31, 2020 compared with the 20182019 period due to lower unit costs ($511 million) and purchased volumes ($19 million).
DepreciationOther operations and amortizationmaintenance expenses increased $1 million in the three months ended June 30, 2019March 31, 2020 compared with the 2018 period due primarily to higher gas utility plant balances.
Income Tax Expense
Income taxes decreased $2 million in the three months ended June 30, 2019 compared with the 2018 period due primarily to lower income before income tax expense ($2 million)workers’ compensation recoveries and an increase in the amortization of excess deferred federal income taxes due to the TCJA ($1 million). O&R deferred as a regulatory liability its estimated net benefits for the 2018 period under the TCJA. See “Other Regulatory Matters” in Note B to the Second Quarter Financial Statements.higher gas program spending.
Clean Energy Businesses
The Clean Energy Businesses’ results of operations for the three months ended June 30, 2019March 31, 2020 compared with the 20182019 period were as follows:
| | | For the Three Months Ended | | For the Three Months Ended | |
| (Millions of Dollars) | June 30, 2019 |
| June 30, 2018 | Variation | March 31, 2020 | March 31, 2019 | Variation |
| Operating revenues | $233 | $158 | $75 | $146 | $217 | $(71) |
| Purchased power | — |
| 2 | (2) | |
| Gas purchased for resale | 42 | 57 | (15) | 13 | 81 | (68) |
| Other operations and maintenance | 55 | 52 | 3 | 55 | 61 | (6) |
| Depreciation and amortization | 58 | 19 | 39 | 57 | 58 | (1) |
| Taxes, other than income taxes | 6 | 4 | 2 | 7 | 6 | 1 |
| Operating income | $72 | $24 | $48 | $14 | $11 | $3 |
Operating revenues increased $75decreased $71 million in the three months ended June 30, 2019March 31, 2020 compared with the 20182019 period due primarily to higher renewable electric production projectlower wholesale revenues due to the December 2018 acquisition of Sempra Solar Holdings, LLC, including the consolidation of certain jointly-owned projects that were previously accounted for as equity method investments ($10174 million), offset, in part, by and lower engineering, procurement and constructionenergy services revenues due to the completion in 2018 of a solar electric production project developed for($12 million)
another companyoffset, in part, by higher renewable electric production revenues ($5 million). Wholesale revenues decreased ($19 million) due to lower sales volumes, energy services revenues decreased ($811 million) and net mark-to-market values increased ($64 million).
Purchased power expenses decreased $2 million in the three months ended June 30, 2019 compared with the 2018 period due to the absence in the 2019 period of the true-ups relating to the retail electric supply business sold in 2016.
Gas purchased for resale decreased $15$68 million in the three months ended June 30, 2019March 31, 2020 compared with the 20182019 period due to lower purchased volumes.
Other operations and maintenance expenses increased $3decreased $6 million in the three months ended June 30, 2019March 31, 2020 compared with the 20182019 period due primarily to higher costs associated with additional renewable electric production projects in operation due to the December 2018 acquisition of Sempra Solar Holdings, LLC.lower energy services costs.
Depreciation and amortizationNet Interest Expense
Net interest expense increased $39$76 million in the three months ended June 30, 2019March 31, 2020 compared with the 20182019 period due primarily to an increase in renewable electric production projects resulting from the December 2018 acquisition of Sempra Solar Holdings, LLC (including the consolidation of certain jointly-owned projects that the Clean Energy Businesses previously accounted for as equity method investments).
Taxes, other than income taxes increased $2 million in the three months ended June 30, 2019 compared with the 2018 period due primarily to higher property taxes.
Other Income (Deductions)
Other income (deductions) decreased $16 million in the three months ended June 30, 2019 compared with the 2018 period due primarily to the absence in 2019 of equity income from certain jointly-owned projects that were accounted for as equity investments in 2018 but consolidated after the December 2018 acquisition of Sempra Solar Holdings, LLC.
Net Interest Expense
Netunrealized losses on interest expense increased $49 million in the three months ended June 30, 2019 compared with the 2018 period due primarily to an increase in debt resulting from the December 2018 acquisition of Sempra Solar Holdings, LLC, including $825 million that was borrowed to fund a portion of the purchase price, $576 million of Sempra Solar Holdings, LLC subsidiaries' project debt that was outstanding at the time of the acquisition and the consolidation of $506 million of project debt of certain jointly-owned projects that the Clean Energy Businesses previously accounted for as equity method investments.rate swaps.
Income Tax Expense
Income taxes decreased $13$22 million in the three months ended June 30, 2019March 31, 2020 compared with the 20182019 period due primarily to lower income before income tax expense (excluding income attributable to non-controlling interest) ($915 million) and, higher renewable energy credits ($2 million) and lower state income taxes ($1 million).
Income Attributable to Non-Controlling Interest
Income attributable to non-controlling interest increased $27 million in the three months ended June 30, 2019 compared with the 2018 period due primarily to the income attributable in the 2019 period to a tax equity investor in renewable electric production projects accounted for under the HLBV method of accounting. See Note N to the Second Quarter Financial Statements.
Other
Income Tax Expense
Income taxes remained unchanged in the three months ended June 30, 2019 compared with the 2018 period due primarily to, lower state income taxes ($2 million) being entirely offset by an increase in uncertainand a tax positions ($2 million, net of federal taxes).
The Companies’ results of operations for the six months ended June 30, 2019 and 2018 were as follows:
|
| | | | | | | | | | | | | | | | | | | | | | | | |
| | CECONY | O&R | Clean Energy Businesses | Con Edison
Transmission | Other (a) | Con Edison (b) |
| (Millions of Dollars) | 2019 |
| 2018 |
| 2019 |
| 2018 |
| 2019 |
| 2018 |
| 2019 |
| 2018 |
| 2019 |
| 2018 |
| 2019 | 2018 |
|
| Operating revenues | $5,371 | $5,222 | $437 | $445 | $450 | $391 | $2 | $2 | $(2) |
| $— |
| $6,258 | $6,060 |
| Purchased power | 635 | 645 | 85 | 94 | — |
| 2 | — |
| — |
| (1) | 1 | 719 | 742 |
| Fuel | 133 | 162 | — |
| — |
| — |
| — |
| — |
| — |
| — |
| — |
| 133 | 162 |
| Gas purchased for resale | 393 | 391 | 57 | 48 | 124 | 133 | — |
| — |
| (1) | — |
| 573 | 572 |
| Other operations and maintenance | 1,311 | 1,260 | 144 | 154 | 115 | 176 | 5 | 5 | — |
| (3) | 1,575 | 1,592 |
| Depreciation and amortization | 673 | 626 | 42 | 38 | 116 | 38 | — |
| — |
| — |
| — |
| 831 | 702 |
| Taxes, other than income taxes | 1,125 | 1,051 | 42 | 43 | 12 | 9 | — |
| — |
| 4 | 7 | 1,183 | 1,110 |
| Operating income | 1,101 | 1,087 | 67 | 68 | 83 | 33 | (3) | (3) | (4) | (5) | 1,244 | 1,180 |
| Other income less deductions | (22) | (67) | (5) | (10) | 1 | 18 | 49 | 44 | (6) | (2) | 17 | (17) |
| Net interest expense | 364 | 332 | 20 | 19 | 109 | 26 | 12 | 9 | 5 | 5 | 510 | 391 |
| Income before income tax expense | 715 | 688 | 42 | 39 | (25) | 25 | 34 | 32 | (15) | (12) | 751 | 772 |
| Income tax expense | 151 | 150 | 8 | 8 | (32) | (6) | 9 | 9 | (9) | (5) | 127 | 156 |
| Net income | $564 | $538 | $34 | $31 | $7 | $31 | $25 | $23 | $(6) | $(7) | $624 | $616 |
Income attributable to non-controlling interest
| — |
| — |
| — |
| — |
| 48 | — |
| — |
| — |
| — |
| — |
| 48 | — |
|
| Net income for common stock | $564 | $538 | $34 | $31 | $(41) | $31 | $25 | $23 | $(6) | $(7) | $576 | $616 |
| |
(a) | Includes parent company and consolidation adjustments. |
| |
(b) | Represents the consolidated results of operations of Con Edison and its businesses. |
CECONY
|
| | | | | | | | | | | | | | | |
| For the Six Months Ended
June 30, 2019 | | For the Six Months Ended
June 30, 2018 | | |
| (Millions of Dollars) | Electric |
| Gas |
| Steam |
| 2019 Total | Electric |
| Gas |
| Steam |
| 2018 Total | 2019-2018
Variation |
| Operating revenues | $3,630 | $1,330 | $411 | $5,371 | $3,536 | $1,276 | $410 | $5,222 | $149 |
| Purchased power | 616 | — |
| 19 | 635 | 626 | — |
| 19 | 645 | (10) |
| Fuel | 47 | — |
| 86 | 133 | 84 | — |
| 78 | 162 | (29) |
| Gas purchased for resale | — |
| 393 | — |
| 393 | — |
| 391 | — |
| 391 | 2 |
| Other operations and maintenance | 1,017 | 204 | 90 | 1,311 | 962 | 214 | 84 | 1,260 | 51 |
| Depreciation and amortization | 518 | 111 | 44 | 673 | 483 | 100 | 43 | 626 | 47 |
| Taxes, other than income taxes | 861 | 184 | 80 | 1,125 | 810 | 167 | 74 | 1,051 | 74 |
| Operating income | $571 | $438 | $92 | $1,101 | $571 | $404 | $112 | $1,087 | $14 |
Electric
CECONY’s results of electric operations for the six months ended June 30, 2019 compared with the 2018 period were as follows:
|
| | | | | |
| For the Six Months Ended | |
| (Millions of Dollars) | June 30, 2019 | June 30, 2018 | Variation |
|
| Operating revenues | $3,630 | $3,536 | $94 |
| Purchased power | 616 | 626 | (10) |
| Fuel | 47 | 84 | (37) |
| Other operations and maintenance | 1,017 | 962 | 55 |
| Depreciation and amortization | 518 | 483 | 35 |
| Taxes, other than income taxes | 861 | 810 | 51 |
| Electric operating income | $571 | $571 |
| $— |
|
CECONY’s electric sales and deliveries for the six months ended June 30, 2019 compared with the 2018 period were:
|
| | | | | | | | | | | | | | |
| Millions of kWh Delivered | | Revenues in Millions (a) |
| For the Six Months Ended | | | For the Six Months Ended | |
| Description | June 30, 2019 |
| June 30, 2018 |
| Variation | Percent Variation | | June 30, 2019 | June 30, 2018 | Variation | Percent Variation |
| Residential/Religious (b) | 4,516 |
| 4,597 |
| (81 | ) | (1.8 | )% | | $1,137 | $1,225 | $(88) | (7.2 | )% |
| Commercial/Industrial | 4,743 |
| 4,637 |
| 106 |
| 2.3 |
| | 848 | 890 | (42) | (4.7 | ) |
| Retail choice customers | 11,629 |
| 12,241 |
| (612 | ) | (5.0 | ) | | 1,024 | 1,121 | (97) | (8.7 | ) |
| NYPA, Municipal Agency and other sales | 4,722 |
| 4,989 |
| (267 | ) | (5.4 | ) | | 284 | 282 | 2 | 0.7 |
|
| Other operating revenues (c) | — |
| — |
| — |
| — |
| | 337 | 18 | 319 | Large |
|
| Total | 25,610 |
| 26,464 |
| (854 | ) | (3.2 | )% | (d) | $3,630 | $3,536 | $94 | 2.7 | % |
| |
(a) | Revenues from electric sales are subject to a revenue decoupling mechanism, as a result of which delivery revenues generally are not affected by changes in delivery volumes from levels assumed when rates were approved. |
| |
(b) | “Residential/Religious” generally includes single-family dwellings, individual apartments in multi-family dwellings, religious organizations and certain other not-for-profit organizations. |
| |
(c) | Other electric operating revenues generally reflect changes in the revenue decoupling mechanism current asset or regulatory liability and changes in regulatory assets and liabilities in accordance with other provisions of the company’s rate plans. |
| |
(d) | After adjusting for variations, primarily weather and billing days, electric delivery volumes in CECONY’s service area decreased 2.1 percent in the six months ended June 30, 2019 compared with the 2018 period. |
Operating revenues increased $94 million in the six months ended June 30, 2019 compared with the 2018 period due primarily to an increase in revenues from the rate plan ($140 million), offset, in part, by lower fuel expenses ($37 million) and purchased power expenses ($10 million).
Purchased power expenses decreased $10 million in the six months ended June 30, 2019 compared with the 2018 period due to lower unit costs ($69 million), offset, in part, by higher purchased volumes ($59 million).
Fuel expenses decreased $37 million in the six months ended June 30, 2019 compared with the 2018 period due to lower unit costs ($32 million) and purchased volumes from the company’s electric generating facilities ($5 million).
Other operations and maintenance expenses increased $55 million in the six months ended June 30, 2019 compared with the 2018 period due primarily to higher surcharges for assessments and fees that are collected in revenues from customers ($37 million) and higher cost for pension and other postretirement benefits ($31 million), offset, in part, by lower municipal infrastructure support costs ($13 million).
Depreciation and amortization increased $35 million in the six months ended June 30, 2019 compared with the 2018 period due primarily to higher electric utility plant balances.
Taxes, other than income taxes increased $51 million in the six months ended June 30, 2019 compared with the 2018 period due primarily to higher property taxes ($33 million), the absence of a New York State sales and use tax refund received in 2018 ($14 million) and lower deferral of under-collected property taxes ($10 million), offset, in part, by lower state and local taxes ($3 million) and payroll taxes ($3 million).
Gas
CECONY’s results of gas operations for the six months ended June 30, 2019 compared with the 2018 period were as follows:
|
| | | |
| For the Six Months Ended | |
| (Millions of Dollars) | June 30, 2019 | June 30, 2018 | Variation |
| Operating revenues | $1,330 | $1,276 | $54 |
| Gas purchased for resale | 393 | 391 | 2 |
| Other operations and maintenance | 204 | 214 | (10) |
| Depreciation and amortization | 111 | 100 | 11 |
| Taxes, other than income taxes | 184 | 167 | 17 |
| Gas operating income | $438 | $404 | $34 |
CECONY’s gas sales and deliveries, excluding off-system sales, for the six months ended June 30, 2019 compared with the 2018 period were:
|
| | | | | | | | | | | | | | | |
| Thousands of Dt Delivered | | Revenues in Millions (a) |
| For the Six Months Ended | | | For the Six Months Ended | |
| Description | June 30, 2019 |
| June 30, 2018 |
| Variation | Percent Variation | | June 30, 2019 | June 30, 2018 | Variation | Percent Variation |
| Residential | 36,940 |
| 39,272 |
| (2,332 | ) | (5.9 | )% | | $621 | $610 | $11 | 1.8 | % |
| General | 20,983 |
| 21,693 |
| (710 | ) | (3.3 | ) | | 254 | 244 | 10 | 4.1 |
|
| Firm transportation | 51,518 |
| 52,417 |
| (899 | ) | (1.7 | ) | | 388 | 378 | 10 | 2.6 |
|
| Total firm sales and transportation | 109,441 |
| 113,382 |
| (3,941 | ) | (3.5 | ) | (b) | 1,263 | 1,232 | 31 | 2.5 |
|
| Interruptible sales (c) | 5,401 |
| 3,474 |
| 1,927 |
| 55.5 |
| | 28 | 24 | 4 | 16.7 |
|
| NYPA | 17,966 |
| 14,713 |
| 3,253 |
| 22.1 |
| | 1 | 1 | — |
| — |
|
| Generation plants | 21,987 |
| 26,821 |
| (4,834 | ) | (18.0 | ) | | 11 | 12 | (1) | (8.3 | ) |
| Other | 11,454 |
| 11,446 |
| 8 |
| 0.1 |
| | 18 | 18 | — |
| — |
|
| Other operating revenues (d) | — |
| — |
| — |
| — |
| | 9 | (11) | 20 | Large |
|
| Total | 166,249 |
| 169,836 |
| (3,587 | ) | (2.1 | )% | | $1,330 | $1,276 | $54 | 4.2 | % |
| |
(a) | Revenues from gas sales are subject to a weather normalization clause and a revenue decoupling mechanism as a result of which delivery revenues are generally not affected by changes in delivery volumes from levels assumed when rates were approved. |
| |
(b) | After adjusting for variations, primarily billing days, firm gas sales and transportation volumes in the company’s service area increased 0.5 percent in the six months ended June 30, 2019 compared with the 2018 period, reflecting primarily increased volumes attributable to the growth in the number of gas customers. |
| |
(c) | Includes 2,733 thousands and 1,117 thousands of Dt for the 2019 and 2018 periods, respectively, which are also reflected in firm transportation and other. |
| |
(d) | Other gas operating revenues generally reflect changes in the revenue decoupling mechanism and weather normalization clause current asset or regulatory liability and changes in regulatory assets and liabilities in accordance with other provisions of the company’s rate plans. |
Operating revenues increased $54 million in the six months ended June 30, 2019 compared with the 2018 period due primarily to an increase in revenues from the rate plan ($55 million) and higher gas purchased for resale expense ($2 million).
Gas purchased for resale increased $2 million in the six months ended June 30, 2019 compared with the 2018 period due to higher purchased volumes ($5 million), offset, in part, by lower unit costs ($3 million).
Other operations and maintenance expenses decreased $10 million in the six months ended June 30, 2019 compared with the 2018 period due primarily to lower surcharges for assessments and fees that are collected in revenues from customers ($9 million) and equipment maintenance expenses ($4 million), offset, in part, by higher stock-based compensation ($3 million).
Depreciation and amortization increased $11 million in the six months ended June 30, 2019 compared with the 2018 period due primarily to higher gas utility plant balances.
Taxes, other than income taxes increased $17 million in the six months ended June 30, 2019 compared with the 2018 period due primarily to higher property taxes ($20 million), the absence of a New York State sales and use tax refund received in 2018 ($3 million) and higher state and local taxes ($2 million), offset, in part, by higher deferral of under-collected property taxes ($6 million).
Steam
CECONY’s results of steam operations for the six months ended June 30, 2019 compared with the 2018 period were as follows:
|
| | | | |
| For the Six Months Ended | |
| (Millions of Dollars) | June 30, 2019 | June 30, 2018 | Variation |
|
| Operating revenues | $411 | $410 | $1 |
| Purchased power | 19 | 19 | — |
|
| Fuel | 86 | 78 | 8 |
| Other operations and maintenance | 90 | 84 | 6 |
| Depreciation and amortization | 44 | 43 | 1 |
| Taxes, other than income taxes | 80 | 74 | 6 |
| Steam operating income | $92 | $112 | $(20) |
CECONY’s steam sales and deliveries for the six months ended June 30, 2019 compared with the 2018 period were:
|
| | | | | | | | | | | | | | |
| Millions of Pounds Delivered | | Revenues in Millions |
| For the Six Months Ended | | | For the Six Months Ended | |
| Description | June 30, 2019 |
| June 30, 2018 |
| Variation | Percent Variation | | June 30, 2019 | June 30, 2018 | Variation | Percent Variation |
| General | 388 |
| 430 |
| (42 | ) | (9.8 | )% | | $19 | $21 | $(2) | (9.5 | )% |
| Apartment house | 3,609 |
| 3,889 |
| (280 | ) | (7.2 | ) | | 107 | 113 | (6) | (5.3 | ) |
| Annual power | 7,940 |
| 8,602 |
| (662 | ) | (7.7 | ) | | 268 | 288 | (20) | (6.9 | ) |
| Other operating revenues (a) | — |
| — |
| — |
| — |
| | 17 | (12) | 29 | Large |
|
| Total | 11,937 |
| 12,921 |
| (984 | ) | (7.6 | )% | (b) | $411 | $410 | $1 | 0.2 | % |
| |
(a) | Other steam operating revenues generally reflect changes in regulatory assets and liabilities in accordance with the company’s rate plan. |
| |
(b) | After adjusting for variations, primarily weather and billing days, steam sales and deliveries decreased 2.6 percent in the six months ended June 30, 2019 compared with the 2018 period. |
Operating revenues increased $1 million in the six months ended June 30, 2019 compared with the 2018 period due primarily to higher fuel expenses ($8 million) and certain rate plan reconciliations ($8 million), a lower reserve related to steam earnings sharing ($5 million), offset, in part, by the impact of warmer winter weather ($20 million).
Fuel expenses increased $8 million in the six months ended June 30, 2019 compared with the 2018 period due to higher unit costs ($11 million), offset, in part, by lower purchased volumes from the company’s steam generating facilities ($3 million).
Other operations and maintenance expenses increased $6 million in the six months ended June 30, 2019 compared with the 2018 period due primarily to higher costs for pension and other postretirement benefits ($3 million) and higher municipal infrastructure support costs ($3 million).
Depreciation and amortization increased $1 million in the six months ended June 30, 2019 compared with the 2018 period due primarily to higher steam utility plant balances.
Taxes, other than income taxes increased $6 million in the six months ended June 30, 2019 compared with the 2018 period due primarily to higher property taxes.
Other Income (Deductions)
Other income (deductions) increased $45 million in the six months ended June 30, 2019 compared with the 2018 period due primarily to lower costs associated with components of pension and other postretirement benefits other than service cost.
Net Interest Expense
Net interest expense increased $32 million in the six months ended June 30, 2019 compared with the 2018 period due primarily to higher interest expense for long-term ($10 million) and short-term ($6 million) debt, an increase in interest accrued on the TCJA related regulatory liability ($6 million) and interest accrued on the system benefit charge liability ($4 million).
Income Tax Expense
Income taxes increased $1 million in the six months ended June 30, 2019 compared with the 2018 period due primarily to higher income before income tax expense ($6 million), offset, in part, by higher tax benefits in 2019 for plant-related flow through items ($1 million), an increase in the amortization of excess deferred federal income taxes due to the TCJA ($1 million), an increasechange in research and development credits ($1 million) andthe federal corporate income tax rate recognized for a decrease in non-deductible business expenses ($1 million). CECONY deferred as a regulatory liability its estimated net benefits forloss carryback from the 2018 periodtax year to the 2013 tax year as allowed under the TCJA and continued to defer its estimated net benefitsCARES Act signed into law in 2019 for only its electric service. See “Other Regulatory Matters” in Note B to the Second Quarter Financial Statements.
O&R
|
| | | | | | | | | | | |
| For the Six Months Ended
June 30, 2019 | | For the Six Months Ended
June 30, 2018 | | |
| (Millions of Dollars) | Electric |
| Gas |
| 2019 Total | Electric |
| Gas |
| 2018 Total | 2019-2018
Variation |
| Operating revenues | $283 | $154 | $437 | $293 | $152 | $445 | $(8) |
| Purchased power | 85 | — |
| 85 | 94 | — |
| 94 | (9) |
| Gas purchased for resale | — |
| 57 | 57 | — |
| 48 | 48 | 9 |
| Other operations and maintenance | 110 | 34 | 144 | 118 | 36 | 154 | (10) |
| Depreciation and amortization | 30 | 12 | 42 | 28 | 10 | 38 | 4 |
| Taxes, other than income taxes | 27 | 15 | 42 | 27 | 16 | 43 | (1) |
| Operating income | $31 | $36 | $67 | $26 | $42 | $68 | $(1) |
Electric
O&R’s results of electric operations for the six months ended June 30, 2019 compared with the 2018 period were as follows:
|
| | | | |
| For the Six Months Ended | |
| (Millions of Dollars) | June 30, 2019 | June 30, 2018 | Variation |
|
| Operating revenues | $283 | $293 | $(10) |
| Purchased power | 85 | 94 | (9) |
| Other operations and maintenance | 110 | 118 | (8) |
| Depreciation and amortization | 30 | 28 | 2 |
| Taxes, other than income taxes | 27 | 27 | — |
|
| Electric operating income | $31 | $26 | $5 |
O&R’s electric sales and deliveries for the six months ended June 30, 2019 compared with the 2018 period were:
|
| | | | | | | | | | | | | | |
| Millions of kWh Delivered | | Revenues in Millions (a) |
| For the Six Months Ended | | | For the Six Months Ended | |
| Description | June 30, 2019 |
| June 30, 2018 |
| Variation |
| Percent Variation | | June 30, 2019 | June 30, 2018 | Variation | Percent Variation |
| Residential/Religious (b) | 753 |
| 753 |
| — |
| — | % | | $137 | $145 | $(8) | (5.5 | )% |
| Commercial/Industrial | 386 |
| 390 |
| (4 | ) | (1.0 | ) | | 51 | 57 | (6) | (10.5 | ) |
| Retail choice customers | 1,397 |
| 1,410 |
| (13 | ) | (0.9 | ) | | 85 | 91 | (6) | (6.6 | ) |
| Public authorities | 50 |
| 72 |
| (22 | ) | (30.6 | ) | | 4 | 6 | (2) | (33.3 | ) |
| Other operating revenues (c) | — |
| — |
| — |
| — |
| | 6 | (6) | 12 | Large |
|
| Total | 2,586 |
| 2,625 |
| (39 | ) | (1.5 | )% | (d) | $283 | $293 | $(10) | (3.4 | )% |
| |
(a) | O&R’s New York electric delivery revenues are subject to a revenue decoupling mechanism, as a result of which delivery revenues are generally not affected by changes in delivery volumes from levels assumed when rates were approved. O&R’s electric sales in New Jersey are not subject to a decoupling mechanism, and as a result, changes in such volumes do impact revenues. |
| |
(b) | “Residential/Religious” generally includes single-family dwellings, individual apartments in multi-family dwellings, religious organizations and certain other not-for-profit organizations. |
| |
(c) | Other electric operating revenues generally reflect changes in regulatory assets and liabilities in accordance with the company’s electric rate plan. |
| |
(d) | After adjusting for weather and other variations, electric delivery volumes in O&R’s service area decreased 2.2 percent in the six months ended June 30, 2019 compared with the 2018 period. |
Operating revenues decreased $10 million in the six months ended June 30, 2019 compared with the 2018 period due primarily to lower purchased power expenses.
Purchased power expenses decreased $9 million in the six months ended June 30, 2019 compared with the 2018 period due to lower unit costs ($11 million), offset, in part, by higher purchased volumes ($2 million).
Other operations and maintenance expenses decreased $8 million in the six months ended June 30, 2019 compared with the 2018 period due primarily to higher storm-related costs in 2018 ($6 million) and lower pension costs ($1 million).
Depreciation and amortization increased $2 million in the six months ended June 30, 2019 compared with the 2018 period due primarily to higher electric utility plant balances.
Gas
O&R’s results of gas operations for the six months ended June 30, 2019 compared with the 2018 period were as follows:
|
| | | |
| For the Six Months Ended | |
| (Millions of Dollars) | June 30, 2019 | June 30, 2018 | Variation |
| Operating revenues | $154 | $152 | $2 |
| Gas purchased for resale | 57 | 48 | 9 |
| Other operations and maintenance | 34 | 36 | (2) |
| Depreciation and amortization | 12 | 10 | 2 |
| Taxes, other than income taxes | 15 | 16 | (1) |
| Gas operating income | $36 | $42 | $(6) |
O&R’s gas sales and deliveries, excluding off-system sales, for the six months ended June 30, 2019 compared with the 2018 period were:
|
| | | | | | | | | | | | | | | | | |
| Thousands of Dt Delivered | | Revenues in Millions (a) |
| For the Six Months Ended | | | For the Six Months Ended | |
| Description | June 30, 2019 |
| June 30, 2018 |
| Variation | Percent Variation | | June 30, 2019 |
| June 30, 2018 |
| Variation | Percent Variation |
| Residential | 6,253 |
| 5,898 |
| 355 |
| 6.0 | % | | $87 | $83 | $4 | 4.8 | % |
| General | 1,448 |
| 1,300 |
| 148 |
| 11.4 |
| | 17 | 15 | 2 | 13.3 |
|
| Firm transportation | 5,579 |
| 6,072 |
| (493 | ) | (8.1 | ) | | 37 | 49 | (12) | (24.5 | ) |
| Total firm sales and transportation | 13,280 |
| 13,270 |
| 10 |
| 0.1 |
| (b) | 141 | 147 | (6) | (4.1 | ) |
| Interruptible sales | 1,892 |
| 2,071 |
| (179 | ) | (8.6 | ) | | 3 | 4 | (1) | (25.0 | ) |
| Generation plants | — |
| — |
| — |
| — |
| | — |
| — |
| — |
| — |
|
| Other | 563 |
| 573 |
| (10 | ) | (1.7 | ) | | — |
| 1 | (1) | Large |
|
| Other gas revenues | — |
| — |
| — |
| — |
| | 10 | — |
| 10 | — |
|
| Total | 15,735 |
| 15,914 |
| (179 | ) | (1.1 | )% | | $154 | $152 | $2 | 1.3 | % |
| |
(a) | Revenues from New York gas sales are subject to a weather normalization clause and a revenue decoupling mechanism as a result of which delivery revenues are generally not affected by changes in delivery volumes from levels assumed when rates were approved. |
| |
(b) | After adjusting for weather and other variations, total firm sales and transportation volumes increased 1.4 percent in the six months ended June 30, 2019 compared with 2018 period. |
Operating revenues increased $2 million in the six months ended June 30, 2019 compared with the 2018 period due primarily to an increase in gas purchased for resale ($9 million), offset, in part, by lower revenues from the New York gas rate plan ($6 million).
Gas purchased for resale increased $9 million in the six months ended June 30, 2019 compared with the 2018 period due to higher unit costs ($5 million) and purchased volumesMarch 2020 ($4 million).
Other operations and maintenance expenses decreased $2 million in the six months ended June 30, 2019 compared with the 2018 period due primarily to lower pension costs.
Depreciation and amortization increased $2 million in the six months ended June 30, 2019 compared with the 2018 period due primarily to higher gas utility plant balances.
Taxes, other than income taxes decreased $1 million in the six months ended June 30, 2019 compared with the 2018 period due primarily to lower property taxes.
Income Tax Expense
Income taxes remained unchanged in the six months ended June 30, 2019 compared with the 2018 period due primarily to higher income before income tax expense ($1 million) being entirely offset by an increase in amortization of excess deferred federal income taxes due to TCJA ($1 million).
Clean Energy Businesses
The Clean Energy Businesses’ results of operations for the six months ended June 30, 2019 compared with the 2018 period were as follows:
|
| | | | |
| For the Six Months Ended | |
| (Millions of Dollars) | June 30, 2019 |
| June 30, 2018 | Variation |
| Operating revenues | $450 | $391 | $59 |
| Purchased power | — |
| 2 | (2) |
| Gas purchased for resale | 124 | 133 | (9) |
| Other operations and maintenance | 115 | 176 | (61) |
| Depreciation and amortization | 116 | 38 | 78 |
| Taxes, other than income taxes | 12 | 9 | 3 |
| Operating income | $83 | $33 | $50 |
Operating revenues increased $59 million in the six months ended June 30, 2019 compared with the 2018 period due primarily to higher renewable electric production project revenues due to the December 2018 acquisition of Sempra Solar Holdings, LLC, including the consolidation of certain jointly-owned projects that were previously accounted for as equity method investments ($160 million), offset, in part, by lower engineering, procurement and construction services revenues due to the completion in 2018 of a solar electric production project developed for another company ($91 million). Wholesale revenues decreased ($10 million) due to lower sales volumes, energy services revenues decreased ($4 million) and net mark-to-market values increased ($4 million).
Purchased power expenses decreased $2 million in the six months ended June 30, 2019 compared with the 2018 period due primarily to the absence in the 2019 period of the true-ups relating to the retail electric supply business sold in 2016.
Gas purchased for resale decreased $9 million in the six months ended June 30, 2019 compared with the 2018 period due primarily to lower purchased volumes.
Other operations and maintenance expenses decreased $61 million in the six months ended June 30, 2019 compared with the 2018 period due primarily to lower engineering, procurement and construction costs.
Depreciation and amortization increased $78 million in the six months ended June 30, 2019 compared with the 2018 period due primarily to an increase in renewable electric production projects resulting from the December 2018 acquisition of Sempra Solar Holdings, LLC (including the consolidation of certain jointly-owned projects that the Clean Energy Businesses previously accounted for as equity method investments).
Taxes, other than income taxes increased $3 million in the six months ended June 30, 2019 compared with the 2018 period due primarily to higher property taxes.
Other Income (Deductions)
Other income (deductions) decreased $17 million in the six months ended June 30, 2019 compared with the 2018 period due primarily to the absence in 2019 of equity income from certain jointly-owned projects that were accounted for as equity investments in 2018 but consolidated after the December 2018 acquisition of Sempra Solar Holdings, LLC.
Net Interest Expense
Net interest expense increased $83 million in the six months ended June 30, 2019 compared with the 2018 period due primarily to an increase in debt resulting from the December 2018 acquisition of Sempra Solar Holdings, LLC, including $825 million that was borrowed to fund a portion of the purchase price, $576 million of Sempra Solar Holdings, LLC subsidiaries' project debt that was outstanding at the time of the acquisition and the consolidation of $506 million of project debt of certain jointly-owned projects that the Clean Energy Businesses previously accounted for as equity method investments.
Income Tax Expense
Income taxes decreased $26 million in the six months ended June 30, 2019 compared with the 2018 period due primarily to lower income before income tax expense (excluding income attributable to non-controlling interest) ($21 million), lower state income taxes ($3 million) and higher renewable energy credits ($4 million), offset, in part, by the absence of an income tax benefit in 2018 related to the extension of energy efficiency programs ($2 million).
Income Attributable to Non-Controlling Interest
Income attributable to non-controlling interest increased $48 million in the six months ended June 30, 2019 compared with the 2018 period due primarily to the income attributable in the 2019 period to a tax equity investor in renewable electric production projects accounted for under the HLBV method of accounting. See Note N to the Second Quarter Financial Statements.
Con Edison Transmission
Other Income (Deductions)
Other income (deductions) increased $5 million in the six months ended June 30, 2019 compared with the 2018 period due primarily to increased earnings from equity investments in Mountain Valley Pipeline, LLC.
Other
Income Tax Expense
Income taxes decreased $4$2 million in the sixthree months ended June 30, 2019March 31, 2020 compared with the 20182019 period due primarily to lower income before income tax expense ($1 million) and lower state income taxes ($5 million), offset, in part, by higher uncertain tax positions ($2 million, net of federal tax benefit).taxes.
Liquidity and Capital Resources
The Companies’ liquidity reflects cash flows from operating, investing and financing activities, as shown on their respective consolidated statement of cash flows and as discussed below.
The Companies’ cash, temporary cash investments and restricted cash resulting from operating, investing and financing activities for the sixthree months ended June 30,March 31, 2020 and 2019 and 2018 are summarized as follows:
| | | | For the Six Months Ended June 30, | For the Three Months Ended March 31, |
| | CECONY | O&R | Clean Energy Businesses | Con Edison
Transmission | Other (a) | Con Edison (b) | CECONY | O&R | Clean Energy Businesses | Con Edison
Transmission | Other (a) | Con Edison (b) |
| (Millions of Dollars) | 2019 | 2018 | 2019 | 2018 | 2019 | 2018 | 2019 |
| 2018 |
| 2019 | 2018 |
| 2019 | 2018 | 2020 | 2019 | 2020 | 2019 | 2020 | 2019 | 2020 |
| 2019 |
| 2020 | 2019 | 2020 | 2019 |
| Operating activities | $1,291 | $655 | $124 | $96 | $154 | $127 | $82 | $45 | $(113) | $117 | $1,538 | $1,040 | $340 | $395 | $41 | $62 | $527 | $22 | $(2) | $36 | $(494) | $(51) | $412 | $464 |
Investing activities | (1,591) | (1,627) | (116) | (97) | (92) | (102) | (78) | (40) | 1 | — |
| (1,876) | (1,866) | (786) | (750) | (50) | (58) | (138) | (48) | 5 | (35) | 1 | 3 | (968) | (888) |
| Financing activities | 268 | 1,071 | (36) | (17) | (32) | (23) | (6) | (5) | 108 | (123) | 302 | 903 | 816 | (111) | 15 | (39) | (446) | (14) | (3) | (3) | 531 | 59 | 913 | (108) |
| Net change for the period | (32) | 99 | (28) | (18) | 30 | 2 | (2) | — |
| (4) | (6) | (36) | 77 | 370 | (466) | 6 | (35) | (57) | (40) | — |
| (2) | 38 | 11 | 357 | (532) |
| Balance at beginning of period | 818 | 730 | 52 | 47 | 126 | 56 | 2 | 2 | 8 | 9 | 1,006 | 844 | 933 | 818 | 32 | 52 | 251 | 126 | — |
| 2 | 1 | 8 | 1,217 | 1,006 |
| Balance at end of period (c) | $786 | $829 | $24 | $29 | $156 | $58 |
| $— |
| $2 | $4 | $3 | $970 | $921 | $1,303 | $352 | $38 | $17 | $194 | $86 |
| $— |
|
| $— |
| $39 | $19 | $1,574 | $474 |
(a) Includes parent company and consolidation adjustments.
(b) Represents the consolidated results of operations of Con Edison and its businesses.
(c) See "Reconciliation of Cash, Temporary Cash Investments and Restricted Cash" in Note A to the SecondFirst Quarter Financial Statements.
Cash Flows from Operating Activities
The Utilities’ cash flows from operating activities reflect primarily their energy sales and deliveries and cost of operations. The volume of energy sales and deliveries is affected primarily by factors external to the Utilities, such as growth of customer demand, weather, market prices for energy and economic conditions. Measures that promote distributed energy resources, such as distributed generation, demand reduction and energy efficiency, also affect the volume of energy sales and deliveries. In addition, the decline in business activity in the Utilities’ service territory as a result of the COVID-19 pandemic could result in lower billed sales revenues. Under the revenue decoupling mechanisms in the Utilities’ New York electric and gas rate plans, changes in delivery volumes from levels assumed when rates were approved may affect the timing of cash flows, but generally not net income. The prices at which the Utilities provide energy to their customers are determined in accordance with their rate plans. In general, changes in the Utilities’ cost of purchased power, fuel and gas may affect the timing of cash flows, but not net income, because the costs are recovered in accordance with rate plans. Pursuant to their rate plans, the Utilities have recovered from customers a portion of the tax liability they will pay in the future as a result of temporary differences between the book and tax basis of assets and liabilities. These temporary differences affect the timing of cash flows, but not net income, as the Companies are required to record deferred tax assets and liabilities at the current corporate tax rate for the temporary differences. For the Utilities, credits to their customers of the net benefits of the TCJA, including the reduction of the corporate tax rate to 21 percent, decrease cash flows from operating activities. See “COVID-19 Regulatory Matters” and “Other Regulatory Matters” in Note B to the SecondFirst Quarter Financial Statements.Statements and “Coronavirus Disease 2019 (COVID-19) Impacts - Liquidity and Financing,” above.
Net income is the result of cash and non-cash (or accrual) transactions. Only cash transactions affect the Companies’ cash flows from operating activities. Principal non-cash charges or credits include depreciation, deferred income tax expense, amortizations of certain regulatory assets and liabilities, and accrued unbilled revenue. Non-cash charges or credits may also be accrued under the revenue decoupling and cost reconciliation mechanisms in the Utilities’ New York electric and gas rate plans.
Net cash flows from operating activities for the sixthree months ended June 30, 2019March 31, 2020 for Con Edison and CECONY were $498$52 million and $636$55 million higher,lower, respectively, than in the 20182019 period. The changes in net cash flows for Con Edison and CECONY reflect primarily a change in the timing of pension and retiree benefit contributionsobligations ($29089 million and $290$84 million, respectively), and lower storm restoration costsaccounts payables ($19148 million and $125$40 million, respectively), related primarily to lower MTA power reliability costs ($88 million and $88 million, respectively), reimbursement received for Puerto Rico related restoration costs ($95 million and $95 million, respectively), and for CECONY, lower net payments of income tax to affiliated companies ($247 million),utility construction expenditures, offset, in part, by higherlower TCJA net benefits provided to customers in the 20192020 period ($19266 million and $190$66 million, respectively).
The change in net cash flows also reflects the timing of payments for and recovery of energy costs. This timing is reflected within changes to accounts receivable – customers and recoverable and refundable energy costs within other regulatory assets and liabilities and accounts payable balances.
Cash Flows Used in Investing Activities
Net cash flows used in investing activities for Con Edison and CECONY were $10$80 million higher and $36 million lower,higher, respectively, for the sixthree months ended June 30, 2019March 31, 2020 compared with the 20182019 period. The change for Con Edison reflects primarily increases in investments in electric and gas transmission projects at Con Edison Transmission ($37 million), cost of removal less salvage at CECONY ($20 million) and an increase in utilitynon-utility construction expenditures at O&Rthe Clean Energy Businesses ($1982 million), offset, in part, by and the proceeds from the sale of a property formerly used by CECONY in its operations ($in 2019 ($48 million)million), a decreaseoffset, in non-utility construction expenditurespart, by lower investments in electric and gas transmission projects at Con Edison Transmission in the Clean Energy Businesses ($17 million)2020 period ($30 million) and a decrease in utility construction expenditures at CECONY ($($9 million) and O&R ($8 million)million).
Cash Flows from Financing Activities
Net cash flows from financing activities for Con Edison and CECONY were $601$1,021 million and $803$927 million lower,higher, respectively, in the sixthree months ended June 30, 2019March 31, 2020 compared with the 20182019 period.
In May 2019, Con Edison entered into a forwardMarch 2020, CECONY issued $600 million aggregate principal amount of 3.35 percent debentures, due 2030 and $1,000 million aggregate principal amount of 3.95 percent debentures, due 2050, the net proceeds from the sale agreement relatingof which will be used to 5,800,000 sharespay or reimburse the payment of, its common stock. In June 2019,in whole or in part, existing and new qualifying eligible green expenditures, such as energy efficiency and clean transportation expenditures, that include those funded on or after January 1, 2018 until the company issued 4,750,000 shares for $400 million upon physical settlementmaturity date of shares subjecteach series of the debentures. Pending the allocation of the net proceeds to the forward sale agreement. Con Edisonfinance or refinance eligible green expenditures, CECONY used the net proceeds to invest in CECONY for fundingrepayment of its capital requirements and other general corporate purposes. At June 30, 2019, 1,050,000 shares remain subject to the forward sale agreement. The company expects the remaining shares under the forward sale agreement to settle by December 28, 2020. See Note C to the Second Quarter Financial Statements.
debt and temporarily placed the remaining net proceeds in short-term interest-bearing instruments. See Note C to the First Quarter Financial Statements.
In January 2020, Con Edison issued 1,050,000 shares of its common stock for $88 million upon physical settlement of the remaining shares subject to its May 2019 forward sale agreement. See Note C to the First Quarter Financial Statements.
In March 2019, Con Edison issued 5,649,369 shares of its common stock for $425 million upon physical settlement of the remaining shares subject to its November 2018 forward sale agreements. Con Edison used the proceeds to invest in its subsidiaries for funding of their capital requirements and to repay short-term debt incurred for that purpose.
In February 2019, Con Edison borrowed $825 million under a two-year variable-rate term loan to fund the repayment of a 6-monthsix-month variable-rate term loan. In June 2019, Con Edison pre-paid $150 million of the amount borrowed.
In May 2019, CECONY issued $700 million aggregate principal amount of 4.125 percent debentures, due 2049, the net proceeds from the sale of which were used to repay short-term borrowings and for other general corporate purposes.
In April 2019, CECONY redeemed at maturity $475 million of 6.65 percent 10-year debentures.
In June 2018, CECONY issued $640 million aggregate principal amount of debentures, due 2021, at a variable interest rate of 0.40 percent above three-month LIBOR and called for redemption on various dates in July and August 2018 the $636 million of CECONY’s tax-exempt debt for which the interest rates were to be determined pursuant to periodic auctions.
In May 2018, CECONY issued $700 million aggregate principal amount of 4.50 percent debentures, due 2058, and $300 million aggregate principal amount of 3.80 percent debentures, due 2028, the net proceeds from the sale of which were used to repay short-term borrowings and for other general corporate purposes.
In April 2018, CECONY redeemed at maturity $600 million of 5.85 percent 10-year debentures.
In May 2019, a Con Edison Development subsidiary borrowed $464 million, due 2026, secured by equity interests in solar electric production projects, the net proceeds from the sale of which were used to repay borrowings from Con Edison and for other general corporate purposes. Con Edison used a portion of the repayment to pre-pay $150 million of an $825 million two-year variable-rate term loan and the remainder to repay short-term borrowings and for other general corporate purposes.
Con Edison’s cash flows from financing for the sixthree months ended June 30,March 31, 2020 and 2019 and 2018 also reflect the proceeds, and reduction in cash used for reinvested dividends, resulting from the issuance of common shares under the company’s dividend reinvestment, stock purchase and long-term incentive plans of $51$26 million and $50$25 million, respectively.
Cash flows used in financing activities of the Companies also reflect commercial paper issuances and repayments. The commercial paper amounts outstanding at June 30,March 31, 2020 and 2019 and 2018 and the average daily balances for the sixthree months ended June 30,March 31, 2020 and 2019 and 2018 for Con Edison and CECONY were as follows:
| | | 2019 | 2018 | 2020 | 2019 |
| (Millions of Dollars, except Weighted Average Yield) | Outstanding at June 30, | Daily average | Outstanding at June 30, | Daily average | Outstanding at March 31, | Daily average | Outstanding at March 31, | Daily average |
| Con Edison | $1,161 | $1,111 | $869 | $722 | $1,208 | $1,428 | $1,435 | $1,400 |
| CECONY | $849 | $711 | $550 | $354 | $597 | $906 | $1,085 | $920 |
| Weighted average yield | 2.6 | 2.7 | 2.2 | 2.1 | 3.5 | 2.1 | 2.7 | 2.8 |
Capital Requirements and Resources
Contractual Obligations
Con Edison’s material obligations to make payments pursuant to contracts totaled $52,661$57,333 million and $49,264$54,144 million at June 30, 2019March 31, 2020 and December 31, 2018,2019, respectively. The increase at June 30, 2019March 31, 2020 is due primarily to increases in long-term debt ($1,3321,563 million) and interest on long-term debt ($8691,357 million). See ”Cash"Cash Flows from Financing Activities,” above.
Capital Resources
For each of the Companies, the common equity ratio at June 30, 2019March 31, 2020 and December 31, 20182019 was:
| | | Common Equity Ratio (Percent of total capitalization) | Common Equity Ratio (Percent of total capitalization) |
| June 30, 2019 | December 31, 2018 | March 31, 2020 | December 31, 2019 |
| Con Edison | 50.5 | 49.0 | 48.7 | 49.6 |
| CECONY | 49.7 | 48.6 | 47.0 | 49.2 |
In March 2020, Moody's Investors Service Inc. (Moody’s) lowered its ratings of Con Edison's senior unsecured debt to Baa2 from Baa1 and CECONY's senior unsecured debt to Baa1 from A3 and affirmed O&R's senior unsecured debt of Baa1. Moody's also affirmed its ratings of Con Edison's, CECONY's and O&R's commercial paper at P-2. Securities ratings assigned by rating organizations are expressions of opinion and are not recommendations to buy, sell or hold securities. A securities rating is subject to revision or withdrawal at any time by the assigning rating organization. Each rating should be evaluated independently of any other rating.
Assets, Liabilities and Equity
The Companies' assets, liabilities, and equity at June 30, 2019March 31, 2020 and December 31, 20182019 are summarized as follows. | | | | CECONY | O&R | Clean Energy
Businesses | Con Edison
Transmission | Other (a) | Con Edison (b) | CECONY | O&R | Clean Energy
Businesses | Con Edison
Transmission | Other (a) | Con Edison (b) |
| (Millions of Dollars) | 2019 | 2018 | 2019 | 2018 | 2019 |
| 2018 |
| 2019 |
| 2018 | 2019 |
| 2018 |
| 2019 | 2018 | 2020 | 2019 | 2020 | 2019 | 2020 |
| 2019 |
| 2020 | 2019 | 2020 |
| 2019 | 2020 | 2019 |
| ASSETS | | | | | | | | | | | |
|
|
|
|
|
|
|
|
|
|
|
Current assets | $3,143 | $3,357 | $218 | $263 | $407 | $372 |
| $— |
| $32 | $(61) | $(160) | $3,707 | $3,864 | $4,306 | $3,543 | $259 | $243 | $450 | $511 | $24 | $2 | $(13) | $(27) | $5,026 | $4,272 |
| Investments | 422 | 385 | 26 | 25 | — |
| — |
| 1,458 | 1,362 | (7) | (6) | 1,899 | 1,766 | 417 | 461 | 25 | 26 | — |
| — |
| 1,576 | 1,585 | (7) | (7) | 2,011 | 2,065 |
| Net plant | 36,348 | 35,374 | 2,269 | 2,210 | 4,111 | 4,148 | 17 | 17 | — |
| — |
| 42,745 | 41,749 | 37,836 | 37,414 | 2,355 | 2,336 | 4,227 | 4,121 | 17 | 17 | — |
| 1 | 44,435 | 43,889 |
| Other noncurrent assets | 4,562 | 3,992 | 368 | 394 | 1,901 | 1,736 | 14 | 14 | 406 | 405 | 7,251 | 6,541 | 5,009 | 5,139 | 388 | 401 | 1,870 | 1,896 | 14 | 14 | 406 | 403 | 7,687 | 7,853 |
| Total Assets | $44,475 | $43,108 | $2,881 | $2,892 | $6,419 | $6,256 | $1,489 | $1,425 | $338 | $239 | $55,602 | $53,920 | $47,568 | $46,557 | $3,027 | $3,006 | $6,547 | $6,528 | $1,631 | $1,618 | $386 | $370 | $59,159 | $58,079 |
| | | |
| | | |
| |
| |
| |
|
|
|
|
|
|
|
|
|
|
|
| LIABILITIES AND SHAREHOLDERS' EQUITY | LIABILITIES AND SHAREHOLDERS' EQUITY |
| | | |
| |
| |
| | LIABILITIES AND SHAREHOLDERS' EQUITY |
|
|
|
|
|
|
|
|
|
| Current liabilities | $3,608 | $4,200 | $352 | $392 | $1,807 | $1,608 | $40 | $5 | $162 | $2 | $5,969 | $6,207 | $3,503 | $4,131 | $301 | $311 | $1,974 | $1,525 | $131 | $135 | $402 | $185 | $6,311 | $6,287 |
| Noncurrent liabilities | 12,976 | 12,322 | 1,098 | 1,094 | 174 | (32) | 76 | 66 | (52) | (71) | 14,272 | 13,379 | 13,538 | 13,665 | 1,122 | 1,115 | 252 | 201 | 95 | 88 | (49) | (17) | 14,958 | 15,052 |
| Long-term debt | 14,023 | 13,676 | 694 | 694 | 2,086 | 2,330 | 500 | 500 | 193 | 295 | 17,496 | 17,495 | 16,194 | 14,614 | 818 | 818 | 1,991 | 2,400 | 500 | 500 | (80) | 195 | 19,423 | 18,527 |
| Equity | 13,868 | 12,910 | 737 | 712 | 2,352 | 2,350 | 873 | 854 | 35 | 13 | 17,865 | 16,839 | 14,333 | 14,147 | 786 | 762 | 2,330 | 2,402 | 905 | 895 | 113 | 7 | 18,467 | 18,213 |
| Total Liabilities and Equity | $44,475 | $43,108 | $2,881 | $2,892 | $6,419 | $6,256 | $1,489 | $1,425 | $338 | $239 | $55,602 | $53,920 | $47,568 | $46,557 | $3,027 | $3,006 | $6,547 | $6,528 | $1,631 | $1,618 | $386 | $370 | $59,159 | $58,079 |
(a) Includes parent company and consolidation adjustments.
(b) Represents the consolidated results of operations of Con Edison and its businesses.
CECONY
Current assets at June 30, 2019March 31, 2020 were $214$763 million lowerhigher than at December 31, 2018.2019. The change in current assets reflects primarily decreasesan increase in customerprepayments due primarily to the January 2020 payment of the New York City semi-annual property taxes, offset, in part, by three months of amortization, while the December 2019 balance reflects the full amortization of the previous semi-annual payment made in July 2019 ($473 million). The change also reflects an increase in cash and temporary cash investments ($370 million) and accounts receivables, less allowance for uncollectible accounts ($14773 million), other receivables ($122 million) and accounts receivable from affiliated companies ($83 million). These increases are offset, in part, by an increase in the revenue decoupling mechanism receivable ($127 million). Thea decrease in other receivables reflects primarily the receipt of payments related to costs for aid provided by CECONY for the restoration of power in Puerto Rico in the aftermath of the September 2017 hurricanesaccrued unbilled revenue ($95146 million).
Investments at June 30, 2019March 31, 2020 were $37$44 million higherlower than at December 31, 2018.2019. The change in investments reflects primarily an increasea decrease in supplemental retirement income plan assets. See Note E to the SecondFirst Quarter Financial Statements.
Net plant at June 30, 2019March 31, 2020 was $974$422 million higher than at December 31, 2018.2019. The change in net plant reflects primarily an increase in electric ($821303 million), gas ($182 million) and gassteam ($46724 million) plant balances and an increase in construction work in progress ($62 million), offset, in part, by an increase in accumulated depreciation ($345 million).
Other noncurrent assets at June 30, 2019 were $570 million higher than at December 31, 2018. The change in other noncurrent assets reflects primarily the adoption of ASU No. 2016-02, “Leases (Topic 842)” ($617 million). See Note I to the Second Quarter Financial Statements. The change also reflects primarily an increase in the regulatory asset for deferred derivative losses ($95 million) and MTA power reliability deferral ($12 million) which reflects costs incurred and deferred as a regulatory asset in the 2019 period. See “Other Regulatory Matters” in Note B to the Second Quarter Financial Statements. These increases are offset, in part, by a decrease in the regulatory asset for unrecognized pension and other postretirement costs to reflect the final actuarial valuation, as measured at December 31, 2018, of the pension and other retiree benefit plans in accordance with the accounting
rules for retirement benefits ($177 million). See Notes B, E and F to the Second Quarter Financial Statements. The change in the regulatory asset also reflects the year's amortization of accounting costs.
Current liabilities at June 30, 2019 were $592 million lower than at December 31, 2018. The change in current liabilities reflects primarily a decrease in notes payable ($343 million) (see Note D to the Second Quarter Financial Statements) and accounts payable ($142 million) and lower debt due within one year as of June 30, 2019 ($125 million).
Noncurrent liabilities at June 30, 2019 were $654 million higher than at December 31, 2018. The change in noncurrent liabilities reflects primarily the adoption of ASU No. 2016-02, “Leases (Topic 842)” ($595 million). See Note I to the Second Quarter Financial Statements. The change also reflects an increase in deferred income taxes and unamortized investment tax credits ($154 million), which reflects primarily accelerated tax deductions on plant-related items and the timing of revenue recognition in accordance with the Company’s rate plans. See Note J to the Second Quarter Financial Statements. These increases are offset, in part, by a decrease in the liability for pension and retiree benefits to reflect the final actuarial valuation, as measured at December 31, 2018, of the pension and other retiree benefit plans in accordance with the accounting rules for retirement benefits ($94 million). The change in the liability for pension and retiree benefits reflects in part contributions to the plans made by the Utilities in 2019. See Notes E and F to the Second Quarter Financial Statements.
Long-term debt at June 30, 2019 was $347 million higher than at December 31, 2018. The change in long-term debt reflects primarily the May 2019 issuance of $700 million of debentures offset, in part, by the reclassification of $350 million of long-term debt due June 2020 to long-term debt due within one year. See "Liquidity and Capital Resources - Cash Flows From Financing Activities" above and Note C to the Second Quarter Financial Statements.
Equity at June 30, 2019 was $958 million higher than at December 31, 2018. The change in equity reflects primarily capital contributions from parent ($850 million) in 2019 and net income for the six months ended June 30, 2019 ($564 million), offset, in part, by common stock dividends to parent ($456 million) in 2019.
O&R
Current assets at June 30, 2019 were $45 million lower than at December 31, 2018. The change in current assets reflects primarily a decrease in cash and temporary cash investments ($27 million) and customer accounts receivables, less allowance for uncollectible accounts ($14 million).
Net plant at June 30, 2019 was $59 million higher than at December 31, 2018. The change in net plant reflects primarily an increase in electric ($46 million) and gas ($33 million) plant balances, offset, in part, by an increase in accumulated depreciation ($21192 million).
Other noncurrent assets at June 30, 2019March 31, 2020 were $26$130 million lower than at December 31, 2018.2019. The change in other noncurrent assets reflects primarily a decrease in the regulatory asset for unrecognized pension and other postretirement costs to reflect the final actuarial valuation, as measured at December 31, 2018,2019, of the pension and other retiree benefit plans in accordance with the accounting rules for retirement benefits ($19290 million). See Notes B, E and F to the First Quarter Financial Statements. The change in the regulatory asset also reflects the year's amortization of accounting costs. The change also reflects aThis decrease is offset, in part, by an increase in the regulatory asset for recoverable energy costsdeferred pension and other postretirement benefits ($3122 million) and deferred derivative losses ($42 million). See “Other Regulatory Matters” in Note B to the First Quarter Financial Statements.
Current liabilities at June 30, 2019March 31, 2020 were $40$628 million lower than at December 31, 2018.2019. The change in current liabilities reflects primarily a decrease in notes payable ($20540 million) (see Note D to the First Quarter Financial Statements) and accounts payable ($15108 million).
Noncurrent liabilities at June 30,March 31, 2020 were $127 million lower than at December 31, 2019. The change in noncurrent liabilities reflects primarily a decrease in the liability for pension and retiree benefits ($161 million), which primarily reflects the final actuarial valuation, as measured at December 31, 2019, of the plans in accordance with the accounting rules for retirement benefits. See Notes E and F to the First Quarter Financial Statements. The change also reflects a decrease in the regulatory liability for deferral of net unbilled revenue ($104 million). These decreases are offset, in part, by a change in deferred income taxes and unamortized investment tax credits ($155 million), which reflects primarily accelerated tax depreciation, repair deductions and the prepayment of New York City property taxes. See Note J to the First Quarter Financial Statements.
Long-term debt at March 31, 2020 was $25$1,580 million higher than at December 31, 2018.2019. The change in long-term debt reflects primarily the March 2020 issuance of $1,600 million of debentures. See "Liquidity and Capital Resources – Cash Flows From Financing Activities" above and Note C to the First Quarter Financial Statements.
Equity at March 31, 2020 was $186 million higher than at December 31, 2019. The change in equity reflects primarily net income for the sixthree months ended June 30, 2019March 31, 2020 ($34406 million), a and capital contributioncontributions from parent ($25 million) in 2020, offset, in part, by common stock dividends to parent ($246 million) in 2020.
O&R
Current assets at March 31, 2020 were $16 million higher than at December 31, 2019. The change in current assets reflects primarily an increase in revenue decoupling mechanism receivable ($10 million) and customer accounts receivables, less allowance for uncollectible accounts ($8 million).
Net plant at March 31, 2020 was $19 million higher than at December 31, 2019. The change in 2019net plant reflects primarily an increase in electric ($16 million) and gas ($10 million) plant balances and an increase in construction work in progress ($8 million), offset, in part, by an increase in accumulated depreciation ($16 million).
Other noncurrent assets at March 31, 2020 were $13 million lower than at December 31, 2019. The change in other noncurrent assets reflects primarily a decrease in other work in progress ($6 million) and the regulatory asset for recoverable energy costs ($5 million).
Current liabilities at March 31, 2020 were $10 million lower than at December 31, 2019. The change in current liabilities reflects primarily a decrease in accounts payable ($16 million), billing overcollections ($10 million) and the current other regulatory liability for revenue decoupling mechanism reconciliation ($7 million), offset, in part, by higher notes payable ($27 million).
Equity at March 31, 2020 was $24 million higher than at December 31, 2019. The change in equity reflects net income for the three months ended March 31, 2020 ($31 million) and an increase in other comprehensive income ($45 million), offset, in part, by common stock dividends to parent ($2412 million) in 2019.2020.
Clean Energy Businesses
Current assets at June 30, 2019March 31, 2020 were $35$61 million higherlower than at December 31, 2018.2019. The change in current assets reflects primarily an increasedecreases in cash and restricted cash.
Net plant at June 30, 2019March 31, 2020 was $37$106 million lowerhigher than at December 31, 2018.2019. The change in net plant reflects primarily depreciation duringadditional capital expenditures, offset, in part, by an increase in accumulated depreciation.
Other noncurrent assets at March 31, 2020 were $26 million lower than at December 31, 2019. The change in other noncurrent assets reflects primarily the six months ended June 30, 2019 ($69 million)amortization of the purchase power agreement intangible assets.
Current liabilities at March 31, 2020 were $449 million higher than at December 31, 2019. The change in current liabilities reflects primarily the reclassification of an intercompany loan agreement from the parent company from long-term debt to current liabilities, as described below, and additional working capital requirements.
Noncurrent liabilities at March 31, 2020 were $51 million higher than at December 31, 2019. The change in noncurrent liabilities reflects primarily the change in fair value of derivative liabilities, offset, in part, by the reduction inof lease liability associated with the capitalizedadoption of ASU No. 2016-02 “Leases (Topic 842)".
assetLong-term debt at March 31, 2020 was $409 million lower than at December 31, 2019. The change in long-term debt primarily reflects the reclassification of an intercompany loan agreement from the parent company from long-term debt to current liabilities, as described above.
Equity at March 31, 2020 was $72 million lower than at December 31, 2019. The change in equity reflects primarily net loss for the three months ended March 31, 2020 ($82 million) and related liabilitycommon stock dividends to parent ($5 million) in 2020, offset, in part, by an increase in noncontrolling interest ($17 million) in 2020.
CET
Current assets at March 31, 2020 were $22 million higher than at December 31, 2019. The change in current assets reflects primarily a receivable of $19 million from Crestwood Pipeline and Storage Northeast LLC (Crestwood), the joint venture partner in Stagecoach Gas Services, LLC. The agreement between Crestwood and Con Edison Gas Pipeline and Storage, LLC (CET Gas) provides for asset retirement obligationspayments from Crestwood to CET Gas for shortfalls in meeting certain property leasedearnings growth performance targets. The payment is expected to total $57 million ($19 million of which is due in the first quarter 2021 and was recorded as a receivable by renewable electric production projectsCET in March 2020, with an additional $19 million plus interest due in each of January 2022 and January 2023). See "Con Edison Transmission" below.
Investments at March 31, 2020 were $9 million lower than at December 31, 2019. The change in investments reflects primarily the decrease in CET Gas' investment in Stagecoach Gas Services, LLC due to the receivable from Crestwood described above ($3119 million), offset, in part, by additional capital expendituresincreased allowance for funds used during construction (AFUDC) income from Mountain Valley Pipeline, LLC ($6514 million).
Other noncurrent assetsEquity at June 30, 2019 were $165March 31, 2020 was $10 million higher than at December 31, 2018. The change in other noncurrent assets reflects primarily the adoption of ASU No. 2016-02, “Leases (Topic 842).” See Note I to the Second Quarter Financial Statements.
Current liabilities at June 30, 2019 were $199 million higher than at December 31, 2018. The change in current liabilities reflects primarily the reclassification of the PG&E-related project debt from long-term debt to long-term debt due within one year ($990 million), offset, in part, by the repayment of a borrowing under a 6-month term loan agreement ($825 million). See Note C to the Second Quarter Financial Statements.
Noncurrent liabilities at June 30, 2019 were $206 million higher than at December 31, 2018. The change in noncurrent liabilities reflects primarily the adoption of ASU No. 2016-02 “Leases (Topic 842).” See Note I to the Second Quarter Financial Statements.
Long-term debt at June 30, 2019 was $244 million lower than at December 31, 2018. The change in long-term debt reflects primarily the reclassification of the PG&E-related project debt to long-term debt due within one year ($990 million), offset, in part, by an $825 million borrowing from parent company of the proceeds of parent company's February 2019 two-year variable-rate term loan agreement, $450 million of which was repaid to parent company, and a borrowing of $464 million, due 2026, secured by equity interests in solar electric production projects. See Note C to the Second Quarter Financial Statements.
Equity at June 30, 2019 was $2 million higher than at December 31, 2018.2019. The change in equity reflects primarily net income for the sixthree months ended June 30, 2019March 31, 2020 ($714 million), offset, in part, by common stock dividends to parent ($23 million) in 2019.
CET
Current assets at June 30, 2019 were $32 million lower than at December 31, 2018. The change in current assets reflects an increased investment in Mountain Valley Pipeline, LLC and a NY Transco transmission project. See "Con Edison Transmission" below.
Investments at June 30, 2019 were $96 million higher than at December 31, 2018. The change in investments reflects primarily increased investment in Mountain Valley Pipeline, LLC and a NY Transco transmission project.
Equity at June 30, 2019 was $19 million higher than at December 31, 2018. The change in equity reflects primarily net income for the six months ended June 30, 2019 ($25 million), offset, in part, by common stock dividends to parent ($6 million) in 2019.2020.
Off-Balance Sheet Arrangements
In May 2019, Con Edison entered into a forward sale agreement which met the SEC definition of an off-balance sheet arrangement. See Note C to the Second Quarter Financial Statements. NoneAt March 31, 2020, none of the Companies’ other transactions, agreements or other contractual arrangements meet the SEC definition of off-balance sheet arrangements.
Regulatory Matters
For information about the Utilities’ regulatory matters, see Note B to the SecondFirst Quarter Financial Statements.
Environmental Matters
In May 2019, New York City enacted a law designed to reduce greenhouse gas (GHG) emissions from large buildings 40 percent from 2005 levels by 2030. Building owners may achieve compliance through operational changes, building retrofits, the purchase of greenhouse gas offsets, the purchase of renewable energy credits and the use of clean distributed energy resources.
In June 2019, the U.S. Environmental Protection Agency announced its Affordable Clean Energy (ACE) rule in conjunction with the repeal of its Clean Power Plan. The ACE rule is focused primarily on coal-fired power plants and is unlikely to impact the Companies' operations.
In July 2019, New York State enacted a law that establishes a program requiring 70 percent of the electricity procured by load serving entities regulated by the NYSPSC to be produced by renewable energy systems by 2030, and requiring the statewide electrical demand system to have zero emissions by 2040. The law also codifies state targets for energy efficiency (end-use energy savings of 185 trillion British thermal units below 2025 energy-use forecast), offshore wind (9,000 megawatts (MW) by 2035), solar (6,000 MW by 2025) and energy storage (3,000 MW by 2030). In addition, the law establishes a climate action council to recommend measures to attain the law’s GHG limits, including measures to reduce emissions by displacing fossil-fuel fired electricity with renewable electricity or energy efficiency. The law requires the New York State Department of Environmental Conservation to issue regulations establishing statewide GHG emissions limits that are 60 percent of 1990 emissions levels by 2030 and 15 percent of 1990 emissions by 2050.
For additional information about the Companies’ environmental matters, see Note G to the SecondFirst Quarter Financial Statements.
Clean Energy Businesses
The following table provides information about the Clean Energy Businesses' renewable electric production projects that are in operation and/or in construction at June 30, 2019:March 31, 2020:
| | | Project Name | Generating
Capacity (a)
(MW AC) | Power Purchase Agreement (PPA) Term
(In Years) (b) | Actual/Expected
In-Service Date (c) | Location
(State) | PPA Counterparty (d) | Generating
Capacity
(MW AC) | Power Purchase Agreement (PPA) Term (In Years) (a) | Actual/Expected
In-Service Date (b) | State | PPA Counterparty (c) |
| Utility Scale |
|
|
| Solar |
|
|
|
|
|
|
|
|
|
|
| Wholly owned projects |
|
| |
| PJM assets | 53 | (e) | 2011/2013 | New Jersey/Pennsylvania | Various | 54 | (d) | 2011/2013 | New Jersey/Pennsylvania | Various |
| New England assets | 24 | Various | 2011/2017 | Massachusetts/Rhode Island | Various | 24 | Various | 2011/2017 | Massachusetts/Rhode Island | Various |
| California Solar (f) (j) | 110 | 25 | 2012/2013 | California | PG&E | |
| Mesquite Solar 1 (f) (j) | 165 | 20 | 2013 | Arizona | PG&E | |
| Copper Mountain Solar 2 (f) (j) | 150 | 25 | 2013/2015 | Nevada | PG&E | |
| Copper Mountain Solar 3 (f) (j) | 255 | 20 | 2014/2015 | Nevada | SCPPA | |
| California Solar 2 (f) | 80 | 20 | 2014/2016 | California | SCE/PG&E | |
| California Solar (e) | | 110 | 25 | 2012/2013 | California | PG&E |
| Mesquite Solar 1 (e) | | 165 | 20 | 2013 | Arizona | PG&E |
| Copper Mountain Solar 2 (e) | | 150 | 25 | 2013/2015 | Nevada | PG&E |
| Copper Mountain Solar 3 (e) | | 255 | 20 | 2014/2015 | Nevada | SCPPA |
| California Solar 2 (e) | | 80 | 20 | 2014/2016 | California | SCE/PG&E |
| Texas Solar 4 (e) | | 40 | 25 | 2014 | Texas | City of San Antonio |
Texas Solar 5 (f)(e) | 95 | 25 | 2015 | Texas | City of San Antonio | 100 | 25 | 2015 | Texas | City of San Antonio |
Texas Solar 7 (f)(e) | 106 | 25 | 2016 | Texas | City of San Antonio | 112 | 25 | 2016 | Texas | City of San Antonio |
California Solar 3 (f)(e) | 110 | 20 | 2016/2017 | California | SCE/PG&E | 110 | 20 | 2016/2017 | California | SCE/PG&E |
Upton Solar (f)(e) | 158 | 25 | 2017 | Texas | City of Austin | 158 | 25 | 2017 | Texas | City of Austin |
| Panoche Valley | 140 | 20 | 2017/2018 | California | SCE | |
| California Solar 4 (e) | | 240 | 20 | 2017/2018 | California | SCE |
Copper Mountain Solar 1 (f)(e) | 58 | 12 | 2018 | Nevada | PG&E | 58 | 12 | 2018 | Nevada | PG&E |
| Copper Mountain Solar 4 (h) | 94 | 20 | 2018 | Nevada | SCE | |
| Mesquite Solar 2 (h) | 100 | 18 | 2018 | Arizona | SCE | |
| Mesquite Solar 3 (h) | 150 | 23 | 2018 | Arizona | WAPA (Navy) | |
| Great Valley Solar (h) | 200 | 17 | 2018 | California | MCE/SMUD/PG&E/SCE | |
| Wistaria Solar | 100 | 20 | 2018 | California | SCE | |
| Copper Mountain Solar 4 (e) (f) | | 94 | 20 | 2018 | Nevada | SCE |
| Mesquite Solar 2 (e) (f) | | 100 | 18 | 2018 | Arizona | SCE |
| Mesquite Solar 3 (e) (f) | | 150 | 23 | 2018 | Arizona | WAPA (U.S. Navy) |
| Great Valley Solar (e) (f) | | 200 | 17 | 2018 | California | MCE/SMUD/PG&E/SCE |
| Other | 26 | Various | Various | Various | 26 | Various | Various | Various |
| Jointly owned projects (f) (g) |
|
| |
| Texas Solar 4 | 32 | 25 | 2014 | Texas | City of San Antonio | |
| Total Solar | 2,206 |
|
|
| 2,226 |
|
|
| Wind |
|
|
|
|
|
|
Wholly owned projects
|
|
|
| |
| Broken Bow II (f) | 75 | 25 | 2014 | Nebraska | NPPD | |
| Wind Holdings (f) | 180 | Various | Various | Various | NWE/Basin Electric | |
| Adams Rose Wind | 23 | 7 | 2016 | Minnesota | Dairyland | |
| Coram Wind (f) | 102 | 16 | 2016 | California | PG&E | |
| Broken Bow II (e) | | 75 | 25 | 2014 | Nebraska | NPPD |
| Wind Holdings (e) | | 180 | Various | Various | South Dakota/ Montana | NWE/Basin Electric |
| Adams Rose Wind (e) | | 23 | 7 | 2016 | Minnesota | Dairyland |
| Coram Wind (e) | | 102 | 16 | 2016 | California | PG&E |
| Other | 22 | Various | Various | Various | 22 | Various | Various |
| Total Wind | 402 |
|
| 402 |
|
|
|
|
| Total MW (AC) in Operation | 2,608 |
|
|
|
| 2,628 |
|
|
| Total MW (AC) in Construction | | 607 |
|
| Total MW (AC) Utility Scale | 2,608 |
| 3,235 |
|
| Behind the Meter |
|
|
|
|
|
|
|
| Total MW (AC) in Operation | 46 |
|
|
|
| 54 |
|
| Total MW (AC) in Construction | 7 |
| 6 |
|
| Total MW Behind the Meter | 53 |
| 60 |
|
| |
| (a) | Represents Con Edison Development’s ownership interest inPPA contractual term or remaining term from the project.date of acquisition. |
| |
| (b) | Represents Power Purchase Agreement (PPA) contractual termActual/Expected In-Service Date or remaining term from Con Edison Development’s date of acquisition. |
| |
| (c) | Represents Actual/Expected In-Service Date or Con Edison Development's date of acquisition. |
| |
(d) | PPA Counterparties include: Pacific Gas and Electric Company (PG&E), Southern California Public Power Authority (SCPPA), Southern California Edison Company (SCE), Western Area Power Administration (WAPA), Marin Clean Energy (MCE), Sacramento Municipal Utility District (SMUD), Nebraska Public Power District (NPPD) and NorthWestern Energy (NWE). For information about PG&E’s bankruptcy, see “Long-Lived and Intangible Assets” in Note A to the First Quarter Financial Statements. |
| |
(e)(d) | Solar renewable energy credit hedges are in place, in lieu of PPAs, through 2022.2023. |
| |
(f)(e) | Project has been pledged as security for project debt financing. |
| |
(g) | Texas Solar 4 is 80 percent owned. See Note N to the Second Quarter Financial Statements. |
| |
(h)(f) | Projects are financed with tax equity. See Note NO to the SecondFirst Quarter Financial Statements. |
| |
(i) | Solar renewable energy hedges in place through 2019. |
| |
(j) | Acquired remaining 50% interest in projects/portfolios in 2018. |
Con Edison DevelopmentRenewable Electric Generation
In January 2019, PG&E filed for reorganization under Chapter 11 of the U.S. Bankruptcy Code. The output of Con Edison Developmentcertain of the Clean Energy Businesses' renewable electric production projects with an aggregate of 680 MW (AC)
of generating capacity (PG&E Projects) is sold to PG&E under long-term power purchase agreements (PG&E PPAs). At June 30, 2019,March 31, 2020, Con Edison’s consolidated balance sheet included $853$802 million of net non-utility plant relating to the PG&E Projects $1,090and $274 million of additional projects that secure the PG&E-related project debt, $1,039 million of intangible assets relating to the PG&E PPAs $288 million of net non-utility plant of additional projects that secure the related project debt and $1,032$980 million of non-recourse related project debt. The PG&E bankruptcy is an event of default under the PG&E PPAs. Pursuant to the related project debt agreements, distributions from the related projects to Con Edison Developmentthe Clean Energy Businesses have been suspended. Unless the lenders for the related project debt otherwise agree, the lenders may, upon written notice, declare principal and interest on the related project debt to be due and payable immediately and, if such amounts are not timely paid, foreclose on the related projects. See “Long-Lived and Intangible Assets” in Note A and Note C to the SecondFirst Quarter Financial Statements.
Con Edison Development's renewableRenewable electric production volumes from utility scale assets for the three and six months ended June 30, 2019March 31, 2020 compared with the 20182019 period were:
|
| | | | | | | | | | | | | |
| | Millions of kWh |
| | For the Three Months Ended | For the Six Months Ended |
| Description | June 30, 2019 |
| June 30, 2018 |
| Variation |
| Percent Variation |
| June 30, 2019 | June 30, 2018 | Variation | Percent Variation |
|
| Renewable electric production projects | | | | | | | | |
| Solar | 1,688 |
| 804 |
| 884 |
| Large |
| 2,732 | 1,335 | 1,397 | Large |
|
| Wind | 354 |
| 296 |
| 58 |
| 19.6 | % | 661 | 530 | 131 | 24.7 | % |
| Total | 2,042 |
| 1,100 | 942 | 85.6 | % | 3,393 | 1,865 | 1,528 | 81.9 | % |
Con Edison Transmission
CET Electric
In April 2019, the New York Independent System Operator (NYISO) selected a transmission project that was jointly proposed by National Grid and NY Transco ($600 million estimated cost, excluding certain interconnection costs that are not yet determined) that would increase transmission capacity by 1,850 MW between upstate and downstate when combined with another developer’s project that was also selected by the NYISO. The siting, construction and operation of the projects will require approvals and permits from appropriate governmental agencies and authorities, including the NYSPSC. The NYISO indicated it will work with the developers to enter into agreements for the development and operation of the projects, including a schedule for entry into service by December 2023.
CET Gas
In June 2019, the operator of the Mountain Valley Pipeline, which is being constructed by a joint venture in which CET Gas has a 12.5 percent ownership interest, indicated that it now expects a mid-2020 full in-service date for the project at an overall project cost of $4,800 million to $5,000 million, excluding allowance for funds used during construction. |
| | | | | |
| | Millions of kWh |
| | For the Three Months Ended |
| Description | March 31, 2020 | March 31, 2019 | Variation | Percent Variation |
|
| Renewable electric production projects | | | | |
| Solar | 1,154 | 1,043 | 111 | 10.6 | % |
| Wind | 351 | 307 | 44 | 14.3 | % |
| Total | 1,505 | 1,350 | 155 | 11.5 | % |
Financial and Commodity Market Risks
The Companies are subject to various risks and uncertainties associated with financial and commodity markets. The most significant market risks include interest rate risk, commodity price risk and investment risk.
Interest Rate Risk
The Companies’ interest rate risk relates primarily to variable rate debt and to new debt financing needed to fund capital requirements, including the construction expenditures of the Utilities and maturing debt securities.securities, and variable-rate debt. Con Edison and its subsidiaries manage interest rate risk through the issuance of mostly fixed-rate debt with varying maturities and through opportunistic refinancing of debt. The Clean Energy Businesses also use interest rate swaps.swaps to exchange variable-rate project financed debt for a fixed interest rate. See Note LM to the SecondFirst Quarter Financial Statements. Con Edison and CECONY estimate that at June 30, 2019,March 31, 2020, a 10 percent increase in interest rates applicable to its variable rate debt would result in an increase in annual interest expense of $8 million and $5 million, respectively. Under CECONY’s current electric, gas and
steam rate plans, variations in actual variable rate tax-exempt debt interest expense, including costs associated with the refinancing of the variable-rate tax-exempt debt, are reconciled to levels reflected in rates.
Commodity Price Risk
Con Edison’s commodity price risk relates primarily to the purchase and sale of electricity, gas and related derivative instruments. The Utilities and the Clean Energy Businesses apply risk management strategies to mitigate their related exposures. See Note LM to the SecondFirst Quarter Financial Statements.
Con Edison estimates that, as of June 30, 2019,March 31, 2020, a 10 percent decline in market prices would result in a decline in fair value of $62$71 million for the derivative instruments used by the Utilities to hedge purchases of electricity and gas, of which $57$67 million is for CECONY and $5$4 million is for O&R. Con Edison expects that any such change in fair value would be largely offset by directionally opposite changes in the cost of the electricity and gas purchased. In accordance with provisions approved by state regulators, the Utilities generally recover from customers the costs they incur for energy purchased for their customers, including gains and losses on certain derivative instruments used to hedge energy purchased and related costs.
The Clean Energy Businesses use a value-at-risk (VaR) model to assess the market price risk of their portfolio of electricity and gas commodity fixed-price purchase and sales commitments, physical forward contracts, generating assets and commodity derivative instruments. VaR represents the potential change in fair value of the portfolio due to changes in market prices, for a specified time period and confidence level. These businesses estimate VaR across their portfolio using a delta-normal variance/covariance model with a 95 percent confidence level, compare the measured VaR results against performance due to actual prices and stress test the portfolio each quarter using an assumed 30 percent price change from forecast. Since the VaR calculation involves complex methodologies and estimates and assumptions that are based on past experience, it is not necessarily indicative of future results. VaR for the portfolio, assuming a one-day holding period, for the sixthree months ended June 30, 2019March 31, 2020 and the year ended December 31, 2018,2019, respectively, was as follows:
|
| | | | | | |
| 95% Confidence Level, One-Day Holding Period | June 30, 2019 |
| December 31, 2018 |
|
| | (Millions of Dollars) |
| Average for the period |
| $— |
|
| $— |
|
| High | 1 |
| 1 |
|
| Low | — |
| — |
|
|
| | | | | | |
| 95% Confidence Level, One-Day Holding Period | March 31, 2020 |
| December 31, 2019 |
|
| (Millions of Dollars) |
| Average for the period |
| $— |
|
| $— |
|
| High | — |
| 1 |
|
| Low | — |
| — |
|
Investment Risk
The Companies’ investment risk relates to the investment of plan assets for their pension and other postretirement benefit plans and to the investments of Con Edison Transmission that are accounted for under the equity method.
The Companies’ current investment policy for pension plan assets includes investment targets of 45 to 55 percent equity securities, 33 to 43 percent debt securities and 10 to 14 percent real estate. At June 30, 2019,March 31, 2020, the pension plan investments consisted of 5149 percent equity securities, 3938 percent debt securities and 1013 percent real estate.
For the Utilities’ pension and other postretirement benefit plans, regulatory accounting treatment is generally applied in accordance with the accounting rules for regulated operations. In accordance with the Statement of Policy issued by the NYSPSC and its current electric, gas and steam rate plans, CECONY defers for payment to or recovery from customers the difference between the pension and other postretirement benefit expenses and the amounts for such expenses reflected in rates. Generally, O&R also defers such difference pursuant to its New York rate plans.
Material Contingencies
For information about the PG&E bankruptcy, see “Long-Lived and Intangible Assets” in Note A and Note C to the SecondFirst Quarter Financial Statements. For information concerning potential liabilities arising from the Companies’ other material contingencies, see "Other Regulatory Matters" in Note B and Notes G and H to the SecondFirst Quarter Financial Statements.
Item 3: Quantitative and Qualitative Disclosures About Market Risk
For information about the Companies’ primary market risks associated with activities in derivative financial instruments, other financial instruments and derivative commodity instruments, see “Financial and Commodity Market Risks,” in Part I, Item 2 of this report, which information is incorporated herein by reference.
Item 4: Controls and Procedures
The Companies maintain disclosure controls and procedures designed to provide reasonable assurance that the information required to be disclosed in the reports that they submit to the Securities and Exchange Commission (SEC) is recorded, processed, summarized and reported within the time periods specified in the rules and forms of the SEC. Disclosure controls and procedures include, without limitation, controls and procedures designed to ensure that information required to be disclosed by an issuer in the reports that it files or submits under the Securities Exchange Act of 1934, as amended, is accumulated and communicated to the issuer’s management, including its principal executive and principal financial officers, or persons performing similar functions, as appropriate to allow timely decisions regarding required disclosure. For each of the Companies, its management, with the participation of its principal executive officer and principal financial officer, has evaluated its disclosure controls and procedures as of the end of the period covered by this report and, based on such evaluation, has concluded that the controls and procedures are effective to provide such reasonable assurance. Reasonable assurance is not absolute assurance, however, and there can be no assurance that any design of controls or procedures would be effective under all potential future conditions, regardless of how remote.
There was no change in the Companies’ internal control over financial reporting that occurred during the Companies’ most recent fiscal quarter that has materially affected, or is reasonably likely to materially affect, the Companies’ internal control over financial reporting.
Part II Other Information
Item 1: Legal Proceedings
For information about certain legal proceedings affecting the Companies, see the information on the PG&E
bankruptcy under "Long-Lived and Intangible Assets" in Note A and Note C, "Other Regulatory Matters" in Note B and Notes G and H to the financial statements in Part I, Item 1 of this report, which information is incorporated herein by reference.
Item 1A: Risk Factors
There were no material changes inPlease see below the new risk factor affecting the Companies’ risk factors comparedbusinesses, in addition to those discloseddiscussed in Item 1A of the Form 10-K.
We face risks related to health epidemics and other outbreaks, including the COVID-19 pandemic.
The COVID-19 pandemic is currently impacting countries, communities, supply chains and markets. Our service territories include some of the most severely impacted counties in the United States. As a result of the COVID-19 pandemic, we may face an extended economic slowdown in our service territories which could have a material impact on our liquidity, financial condition, and results of operations.
We will continue to monitor developments relating to the COVID-19 pandemic, however, we cannot predict the extent to which COVID-19 may have a material impact on our business operations, liquidity, financial condition, and results of operations. The extent to which COVID-19 may impact these matters will depend on future developments, which are highly uncertain and cannot be predicted, including new information concerning the severity of COVID-19, actions that federal, state and local governmental or regulatory agencies may take in response to COVID-19, and other actions taken to contain it or treat its impact, among others. See “Coronavirus Disease 2019 (COVID-19) Impacts” in Item 2 and “COVID-19 Regulatory Matters” in Note B.
Item 6: Exhibits
Con Edison
|
| |
| Exhibit 10 | ConfirmationSupplemental Credit Agreement, dated as of Forward Sale Transaction, dated May 7, 2019, betweenApril 6, 2020, among Con Edison, the lenders party thereto and Wells Fargo Bank National Association.of America, N.A., as Administrative Agent. (Incorporated by reference to Exhibit 10 to Con Edison’s Current Report on Form 8-K, dated May 7, 2019April 6, 2020 (File No. 1-145141-14514).).
|
| Exhibit 31.1.1 | |
| Exhibit 31.1.2 | |
| Exhibit 32.1.1 | |
| Exhibit 32.1.2 | |
| Exhibit 101.INS | XBRL Instance Document - the instance document does not appear in the Interactive Data File because its XBRL tags are embedded within the Inline XBRL document. |
| Exhibit 101.SCH | XBRL Taxonomy Extension Schema. |
| Exhibit 101.CAL | XBRL Taxonomy Extension Calculation Linkbase. |
| Exhibit 101.DEF | XBRL Taxonomy Extension Definition Linkbase. |
| Exhibit 101.LAB | XBRL Taxonomy Extension Label Linkbase. |
| Exhibit 101.PRE | XBRL Taxonomy Extension Presentation Linkbase. |
| Exhibit 104 | Cover Page Interactive Data File - the cover page XBRL tags are embedded within the Inline XBRL document. |
CECONY
|
| |
Exhibit 44.2.1 |
|
| Exhibit 4.2.2 |
|
| Exhibit 31.2.1 | |
| Exhibit 31.2.2 | |
| Exhibit 32.2.1 | |
| Exhibit 32.2.2 | |
| Exhibit 101.INS | XBRL Instance Document - the instance document does not appear in the Interactive Data File because its XBRL tags are embedded within the Inline XBRL document. |
| Exhibit 101.SCH | XBRL Taxonomy Extension Schema. |
| Exhibit 101.CAL | XBRL Taxonomy Extension Calculation Linkbase. |
| Exhibit 101.DEF | XBRL Taxonomy Extension Definition Linkbase. |
| Exhibit 101.LAB | XBRL Taxonomy Extension Label Linkbase. |
| Exhibit 101.PRE | XBRL Taxonomy Extension Presentation Linkbase. |
| Exhibit 104 | Cover Page Interactive Data File - the cover page XBRL tags are embedded within the Inline XBRL document. |
Pursuant to Item 601(b)(4)(iii)(A) of Regulation S-K, instruments defining the rights of holders of long-term debt of Con Edison’s subsidiaries other than CECONY, the total amount of which does not exceed ten percent of the total assets of Con Edison and its subsidiaries on a consolidated basis, are not filed as exhibits to Con Edison’s Form 10-K or Form 10-Q. Con Edison agrees to furnish to the SEC upon request a copy of any such instrument.
Signatures
Pursuant to the requirements of the Securities Exchange Act of 1934, each Registrant has duly caused this report to be signed on its behalf by the undersigned thereunto duly authorized.
|
| | |
| | Consolidated Edison, Inc. |
| | Consolidated Edison Company of New York, Inc. |
| | | |
Date: August 1, 2019May 7, 2020 | By | /s/ Robert Hoglund |
| | | Robert Hoglund Senior Vice President, Chief Financial Officer and Duly Authorized Officer |