Part I—Financial Information
Item 1. Financial Statements
MPLX LP
Consolidated Statements of Income (Unaudited)
| Three Months Ended September 30, | Nine Months Ended September 30, | ||||||||||||||||||||||
| (In millions, except per unit data) | 2021 | 2020 | 2021 | 2020 | |||||||||||||||||||
| Revenues and other income: | |||||||||||||||||||||||
| Service revenue | $ | 600 | $ | 604 | $ | 1,767 | $ | 1,779 | |||||||||||||||
| Service revenue - related parties | 902 | 909 | 2,681 | 2,694 | |||||||||||||||||||
| Service revenue - product related | 82 | 41 | 235 | 102 | |||||||||||||||||||
| Rental income | 88 | 102 | 286 | 296 | |||||||||||||||||||
| Rental income - related parties | 164 | 241 | 574 | 712 | |||||||||||||||||||
| Product sales | 448 | 165 | 1,034 | 454 | |||||||||||||||||||
| Product sales - related parties | 26 | 37 | 99 | 100 | |||||||||||||||||||
| Sales-type lease revenue - related parties | 132 | 38 | 305 | 114 | |||||||||||||||||||
Income/(loss) from equity method investments(1) | 92 | 83 | 228 | (1,012) | |||||||||||||||||||
| Other income (loss) | (2) | 2 | 2 | 5 | |||||||||||||||||||
| Other income - related parties | 27 | 25 | 82 | 76 | |||||||||||||||||||
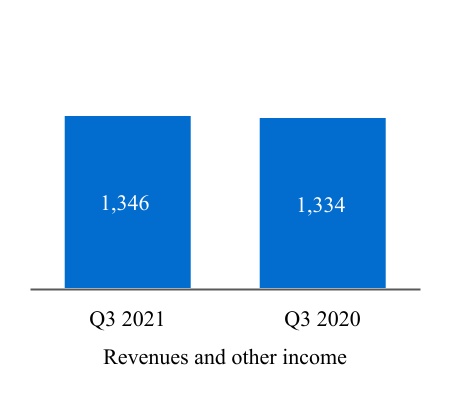
| Total revenues and other income | 2,559 | 2,247 | 7,293 | 5,320 | |||||||||||||||||||
| Costs and expenses: | |||||||||||||||||||||||
| Cost of revenues (excludes items below) | 298 | 323 | 864 | 1,006 | |||||||||||||||||||
| Purchased product costs | 421 | 152 | 1,035 | 374 | |||||||||||||||||||
| Rental cost of sales | 33 | 33 | 97 | 101 | |||||||||||||||||||
| Rental cost of sales - related parties | 24 | 32 | 86 | 119 | |||||||||||||||||||
| Purchases - related parties | 307 | 297 | 902 | 853 | |||||||||||||||||||
| Depreciation and amortization | 324 | 346 | 971 | 992 | |||||||||||||||||||
| Impairment expense | — | — | 42 | 2,165 | |||||||||||||||||||
| General and administrative expenses | 94 | 96 | 267 | 289 | |||||||||||||||||||
| Restructuring expenses | — | 36 | — | 36 | |||||||||||||||||||
| Other taxes | 27 | 33 | 93 | 94 | |||||||||||||||||||
| Total costs and expenses | 1,528 | 1,348 | 4,357 | 6,029 | |||||||||||||||||||
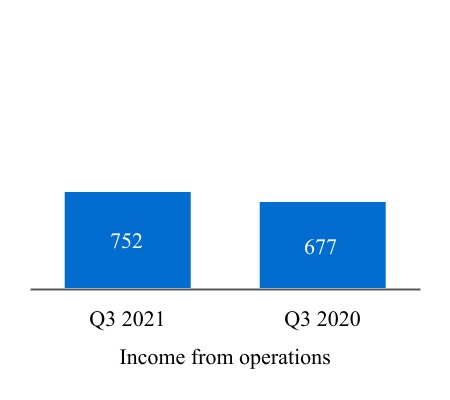
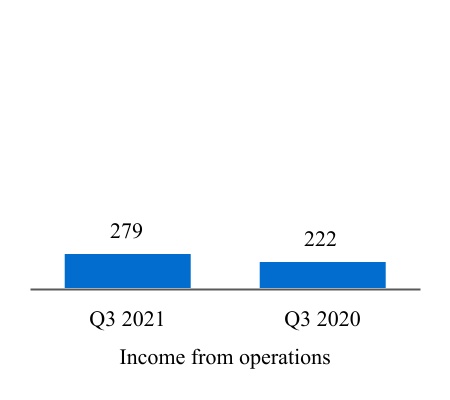
| Income/(loss) from operations | 1,031 | 899 | 2,936 | (709) | |||||||||||||||||||
| Related party interest and other financial costs | 2 | — | 4 | 4 | |||||||||||||||||||
| Interest expense (net of amounts capitalized of $2 million, $8 million, $12 million and $31 million respectively) | 197 | 207 | 590 | 624 | |||||||||||||||||||
| Other financial costs | 21 | 17 | 67 | 49 | |||||||||||||||||||
| Income/(loss) before income taxes | 811 | 675 | 2,275 | (1,386) | |||||||||||||||||||
| Provision for income taxes | — | 1 | 1 | 1 | |||||||||||||||||||
| Net income/(loss) | 811 | 674 | 2,274 | (1,387) | |||||||||||||||||||
| Less: Net income attributable to noncontrolling interests | 9 | 9 | 27 | 24 | |||||||||||||||||||
| Net income/(loss) attributable to MPLX LP | 802 | 665 | 2,247 | (1,411) | |||||||||||||||||||
| Less: Series A preferred unitholders interest in net income | 38 | 20 | 79 | 61 | |||||||||||||||||||
| Less: Series B preferred unitholders interest in net income | 10 | 10 | 31 | 31 | |||||||||||||||||||
| Limited partners’ interest in net income/(loss) attributable to MPLX LP | $ | 754 | $ | 635 | $ | 2,137 | $ | (1,503) | |||||||||||||||
| Per Unit Data (See Note 7) | |||||||||||||||||||||||
| Net income/(loss) attributable to MPLX LP per limited partner unit: | |||||||||||||||||||||||
| Common - basic | $ | 0.74 | $ | 0.61 | $ | 2.07 | $ | (1.43) | |||||||||||||||
| Common - diluted | $ | 0.74 | $ | 0.61 | $ | 2.07 | $ | (1.43) | |||||||||||||||
| Weighted average limited partner units outstanding: | |||||||||||||||||||||||
| Common - basic | 1,024 | 1,046 | 1,030 | 1,054 | |||||||||||||||||||
| Common - diluted | 1,025 | 1,047 | 1,030 | 1,054 | |||||||||||||||||||
| Three Months Ended September 30, | Nine Months Ended September 30, | ||||||||||||||
| (In millions, except per unit data) | 2017 | 2016(1) | 2017 | 2016(1) | |||||||||||
| Revenues and other income: | |||||||||||||||
| Service revenue | $ | 299 | $ | 250 | $ | 845 | $ | 712 | |||||||
| Service revenue - related parties | 276 | 253 | 801 | 676 | |||||||||||
| Rental income | 69 | 77 | 208 | 218 | |||||||||||
| Rental income - related parties | 70 | 68 | 207 | 172 | |||||||||||
| Product sales | 217 | 157 | 611 | 394 | |||||||||||
| Product sales - related parties | 2 | 2 | 6 | 8 | |||||||||||
| Gain on sale of assets | — | 1 | 1 | 1 | |||||||||||
| Income (loss) from equity method investments | 23 | 6 | 29 | (72 | ) | ||||||||||
| Other income | 2 | 2 | 5 | 5 | |||||||||||
| Other income - related parties | 22 | 22 | 69 | 67 | |||||||||||
| Total revenues and other income | 980 | 838 | 2,782 | 2,181 | |||||||||||
| Costs and expenses: | |||||||||||||||
| Cost of revenues (excludes items below) | 129 | 122 | 381 | 329 | |||||||||||
| Purchased product costs | 170 | 117 | 441 | 310 | |||||||||||
| Rental cost of sales | 19 | 13 | 44 | 42 | |||||||||||
| Rental cost of sales - related parties | — | — | 1 | 1 | |||||||||||
| Purchases - related parties | 114 | 109 | 330 | 286 | |||||||||||
| Depreciation and amortization | 164 | 151 | 515 | 438 | |||||||||||
| Impairment expense | — | — | — | 130 | |||||||||||
| General and administrative expenses | 59 | 56 | 174 | 172 | |||||||||||
| Other taxes | 14 | 12 | 40 | 37 | |||||||||||
| Total costs and expenses | 669 | 580 | 1,926 | 1,745 | |||||||||||
| Income from operations | 311 | 258 | 856 | 436 | |||||||||||
| Related party interest and other financial costs | 1 | — | 1 | 1 | |||||||||||
| Interest expense (net of amounts capitalized of $6 million, $7 million, $24 million and $21 million, respectively) | 77 | 51 | 217 | 158 | |||||||||||
| Other financial costs | 15 | 13 | 40 | 37 | |||||||||||
| Income before income taxes | 218 | 194 | 598 | 240 | |||||||||||
| Provision (benefit) for income taxes | 1 | — | 3 | (12 | ) | ||||||||||
| Net income | 217 | 194 | 595 | 252 | |||||||||||
| Less: Net income attributable to noncontrolling interests | 1 | 2 | 3 | 3 | |||||||||||
| Less: Net income attributable to Predecessor | — | 51 | 36 | 149 | |||||||||||
| Net income attributable to MPLX LP | 216 | 141 | 556 | 100 | |||||||||||
| Less: Preferred unit distributions | 16 | 16 | 49 | 25 | |||||||||||
| Less: General partner’s interest in net income attributable to MPLX LP | 86 | 51 | 222 | 136 | |||||||||||
| Limited partners’ interest in net income (loss) attributable to MPLX LP | $ | 114 | $ | 74 | $ | 285 | $ | (61 | ) | ||||||
| Per Unit Data (See Note 6) | |||||||||||||||
| Net income (loss) attributable to MPLX LP per limited partner unit: | |||||||||||||||
| Common - basic | $ | 0.29 | $ | 0.22 | $ | 0.75 | $ | (0.19 | ) | ||||||
| Common - diluted | 0.29 | 0.21 | 0.75 | (0.19 | ) | ||||||||||
| Weighted average limited partner units outstanding: | |||||||||||||||
| Common - basic | 394 | 341 | 378 | 324 | |||||||||||
| Common - diluted | 395 | 346 | 381 | 324 | |||||||||||
| Cash distributions declared per limited partner common unit | $ | 0.5875 | $ | 0.5150 | $ | 1.6900 | $ | 1.5300 | |||||||
(1) The accompanying notes are an integral partnine months ended September 30, 2021 and September 30, 2020 include $6 million and $1,264 million of these consolidated financial statements.impairment expense, respectively.
| (In millions) | September 30, 2017 | December 31, 2016 | |||||
| Assets | |||||||
| Current assets: | |||||||
| Cash and cash equivalents | $ | 3 | $ | 234 | |||
| Receivables, net | 320 | 299 | |||||
| Receivables - related parties | 152 | 247 | |||||
| Inventories | 64 | 55 | |||||
| Other current assets | 32 | 33 | |||||
| Total current assets | 571 | 868 | |||||
| Equity method investments | 3,997 | 2,471 | |||||
| Property, plant and equipment, net | 11,922 | 11,408 | |||||
| Intangibles, net | 463 | 492 | |||||
| Goodwill | 2,245 | 2,245 | |||||
| Long-term receivables - related parties | 18 | 11 | |||||
| Other noncurrent assets | 22 | 14 | |||||
| Total assets | $ | 19,238 | $ | 17,509 | |||
| Liabilities | |||||||
| Current liabilities: | |||||||
| Accounts payable | $ | 152 | $ | 140 | |||
| Accrued liabilities | 202 | 232 | |||||
| Payables - related parties | 317 | 87 | |||||
| Deferred revenue | 3 | 2 | |||||
| Deferred revenue - related parties | 42 | 38 | |||||
| Accrued property, plant and equipment | 183 | 146 | |||||
| Accrued taxes | 44 | 38 | |||||
| Accrued interest payable | 64 | 53 | |||||
| Other current liabilities | 41 | 27 | |||||
| Total current liabilities | 1,048 | 763 | |||||
| Long-term deferred revenue | 34 | 12 | |||||
| Long-term deferred revenue - related parties | 40 | 19 | |||||
| Long-term debt | 6,848 | 4,422 | |||||
| Deferred income taxes | 7 | 6 | |||||
| Deferred credits and other liabilities | 175 | 177 | |||||
| Total liabilities | 8,152 | 5,399 | |||||
| Commitments and contingencies (see Note 17) | |||||||
| Redeemable preferred units | 1,000 | 1,000 | |||||
| Equity | |||||||
| Common unitholders - public (289 million and 271 million units issued and outstanding) | 8,457 | 8,086 | |||||
| Class B unitholders (0 million and 4 million units issued and outstanding) | — | 133 | |||||
| Common unitholder - MPC (95 million and 86 million units issued and outstanding) | 1,302 | 1,069 | |||||
| Common unitholder - GP (23 million and 0 units issued and outstanding) | 822 | — | |||||
| General partner - MPC (8 million and 7 million units issued and outstanding) | (626 | ) | 1,013 | ||||
| Equity of Predecessor | — | 791 | |||||
| Accumulated other comprehensive loss | (14 | ) | — | ||||
| Total MPLX LP partners’ capital | 9,941 | 11,092 | |||||
| Noncontrolling interests | 145 | 18 | |||||
| Total equity | 10,086 | 11,110 | |||||
| Total liabilities, preferred units and equity | $ | 19,238 | $ | 17,509 | |||
The accompanying notes are an integral part of these consolidated financial statements.
3
MPLX LP
Consolidated Statements of Cash FlowsComprehensive Income (Unaudited)
| Nine Months Ended September 30, | |||||||
| (In millions) | 2017 | 2016(1) | |||||
| (Decrease) increase in cash and cash equivalents | |||||||
| Operating activities: | |||||||
| Net income | $ | 595 | $ | 252 | |||
| Adjustments to reconcile net income to net cash provided by operating activities: | |||||||
| Amortization of deferred financing costs | 38 | 34 | |||||
| Depreciation and amortization | 515 | 438 | |||||
| Impairment expense | — | 130 | |||||
| Deferred income taxes | 2 | (16 | ) | ||||
| Asset retirement expenditures | (2 | ) | (4 | ) | |||
| Gain on disposal of assets | (1 | ) | (1 | ) | |||
| (Income) loss from equity method investments | (29 | ) | 72 | ||||
| Distributions from unconsolidated affiliates | 136 | 111 | |||||
| Changes in: | |||||||
| Current receivables | (20 | ) | (43 | ) | |||
| Inventories | (3 | ) | (4 | ) | |||
| Fair value of derivatives | (3 | ) | 28 | ||||
| Current accounts payable and accrued liabilities | 6 | 64 | |||||
| Receivables from / liabilities to related parties | 61 | (104 | ) | ||||
| All other, net | 43 | 18 | |||||
| Net cash provided by operating activities | 1,338 | 975 | |||||
| Investing activities: | |||||||
| Additions to property, plant and equipment | (1,004 | ) | (943 | ) | |||
| Acquisitions, net of cash acquired | (249 | ) | — | ||||
| Disposal of assets | 4 | — | |||||
| Investments - net related party loans | 80 | 103 | |||||
| Investments in unconsolidated affiliates | (690 | ) | (56 | ) | |||
| Distributions from unconsolidated affiliates - return of capital | 24 | — | |||||
| All other, net | (2 | ) | 4 | ||||
| Net cash used in investing activities | (1,837 | ) | (892 | ) | |||
| Financing activities: | |||||||
| Long-term debt - borrowings | 2,661 | 434 | |||||
| - repayments | (251 | ) | (1,312 | ) | |||
| Related party debt - borrowings | 829 | 2,215 | |||||
| - repayments | (627 | ) | (2,223 | ) | |||
| Debt issuance costs | (25 | ) | — | ||||
| Net proceeds from equity offerings | 483 | 510 | |||||
| Issuance of redeemable preferred units | — | 984 | |||||
| Distribution to MPC for acquisition | (1,931 | ) | — | ||||
| Distributions to preferred unitholders | (49 | ) | (9 | ) | |||
| Distributions to unitholders and general partner | (800 | ) | (612 | ) | |||
| Distributions to noncontrolling interests | (4 | ) | (3 | ) | |||
| Contributions from noncontrolling interests | 128 | 4 | |||||
| Consideration payment to Class B unitholders | (25 | ) | (25 | ) | |||
| All other, net | (8 | ) | (2 | ) | |||
| Contribution from MPC | — | 225 | |||||
| Distributions to MPC from Predecessor | (113 | ) | (104 | ) | |||
| Net cash provided by financing activities | 268 | 82 | |||||
| Net (decrease) increase in cash and cash equivalents | (231 | ) | 165 | ||||
| Cash and cash equivalents at beginning of period | 234 | 43 | |||||
| Cash and cash equivalents at end of period | $ | 3 | $ | 208 | |||
| Three Months Ended September 30, | Nine Months Ended September 30, | ||||||||||||||||||||||||||||
| (In millions) | 2021 | 2020 | 2021 | 2020 | |||||||||||||||||||||||||
| Net income/(loss) | $ | 811 | $ | 674 | $ | 2,274 | $ | (1,387) | |||||||||||||||||||||
| Other comprehensive income/(loss), net of tax: | |||||||||||||||||||||||||||||
| Remeasurements of pension and other postretirement benefits related to equity method investments, net of tax | — | — | (2) | (1) | |||||||||||||||||||||||||
| Comprehensive income/(loss) | 811 | 674 | 2,272 | (1,388) | |||||||||||||||||||||||||
| Less comprehensive income attributable to: | |||||||||||||||||||||||||||||
| Noncontrolling interests | 9 | 9 | 27 | 24 | |||||||||||||||||||||||||
| Comprehensive income/(loss) attributable to MPLX LP | $ | 802 | $ | 665 | $ | 2,245 | $ | (1,412) | |||||||||||||||||||||
The accompanying notes are an integral part of these consolidated financial statements.
4
MPLX LP
Consolidated Statements of EquityBalance Sheets (Unaudited)
| (In millions) | September 30, 2021 | December 31, 2020 | |||||||||
| Assets | |||||||||||
| Current assets: | |||||||||||
| Cash and cash equivalents | $ | 39 | $ | 15 | |||||||
| Receivables, net | 617 | 452 | |||||||||
| Current assets - related parties | 645 | 677 | |||||||||
| Inventories | 141 | 118 | |||||||||
| Assets held for sale | 20 | 188 | |||||||||
| Other current assets | 54 | 65 | |||||||||
| Total current assets | 1,516 | 1,515 | |||||||||
| Equity method investments | 4,001 | 4,036 | |||||||||
| Property, plant and equipment, net | 20,158 | 21,218 | |||||||||
| Intangibles, net | 864 | 959 | |||||||||
| Goodwill | 7,657 | 7,657 | |||||||||
| Right of use assets, net | 282 | 309 | |||||||||
| Noncurrent assets - related parties | 1,160 | 672 | |||||||||
| Other noncurrent assets | 61 | 48 | |||||||||
| Total assets | 35,699 | 36,414 | |||||||||
| Liabilities | |||||||||||
| Current liabilities: | |||||||||||
| Accounts payable | 177 | 152 | |||||||||
| Accrued liabilities | 332 | 194 | |||||||||
| Current liabilities - related parties | 1,706 | 356 | |||||||||
| Accrued property, plant and equipment | 66 | 84 | |||||||||
| Long-term debt due within one year | 1 | 764 | |||||||||
| Accrued interest payable | 188 | 222 | |||||||||
| Operating lease liabilities | 61 | 63 | |||||||||
| Liabilities held for sale | — | 101 | |||||||||
| Other current liabilities | 190 | 150 | |||||||||
| Total current liabilities | 2,721 | 2,086 | |||||||||
| Long-term deferred revenue | 366 | 314 | |||||||||
| Long-term liabilities - related parties | 297 | 283 | |||||||||
| Long-term debt | 18,253 | 19,375 | |||||||||
| Deferred income taxes | 11 | 12 | |||||||||
| Long-term operating lease liabilities | 220 | 244 | |||||||||
| Deferred credits and other liabilities | 155 | 115 | |||||||||
| Total liabilities | 22,023 | 22,429 | |||||||||
| Commitments and contingencies (see Note 19) | 0 | 0 | |||||||||
| Series A preferred units | 986 | 968 | |||||||||
| Equity | |||||||||||
| Common unitholders - public (374 million and 391 million units issued and outstanding) | 8,919 | 9,384 | |||||||||
| Common unitholders - MPC (647 million and 647 million units issued and outstanding) | 2,944 | 2,792 | |||||||||
| Series B preferred units (.6 million and .6 million units issued and outstanding) | 601 | 611 | |||||||||
| Accumulated other comprehensive loss | (17) | (15) | |||||||||
| Total MPLX LP partners’ capital | 12,447 | 12,772 | |||||||||
| Noncontrolling interests | 243 | 245 | |||||||||
| Total equity | 12,690 | 13,017 | |||||||||
| Total liabilities, preferred units and equity | $ | 35,699 | $ | 36,414 | |||||||
| Partnership | |||||||||||||||||||||||||||||||||||
| (In millions) | Common Unit-holders Public | Class B Unit-holders Public | Common Unit-holder MPC | Common Unit-holder GP | General Partner MPC | Accumulated Other Comprehensive Loss | Non-controlling Interests | Equity of Predecessor(1) | Total | ||||||||||||||||||||||||||
| Balance at December 31, 2015 | $ | 7,691 | $ | 266 | $ | 465 | $ | — | $ | 819 | $ | — | $ | 13 | $ | 692 | $ | 9,946 | |||||||||||||||||
| Distributions to MPC from Predecessor | — | — | — | — | — | — | — | (104 | ) | (104 | ) | ||||||||||||||||||||||||
| Contribution from MPC | — | — | 84 | — | 141 | — | — | — | 225 | ||||||||||||||||||||||||||
| Contribution of MarkWest Hydrocarbon from MPC | — | — | — | — | (188 | ) | — | — | — | (188 | ) | ||||||||||||||||||||||||
| Distribution of MarkWest Hydrocarbon to MPC | — | — | — | — | 565 | — | — | — | 565 | ||||||||||||||||||||||||||
| Issuance of units under ATM Program | 499 | — | — | — | 11 | — | — | — | 510 | ||||||||||||||||||||||||||
| Net (loss) income | (51 | ) | — | (10 | ) | — | 136 | — | 3 | 149 | 227 | ||||||||||||||||||||||||
| Allocation of MPC's net investment at acquisition | — | — | 669 | — | (337 | ) | — | — | (332 | ) | — | ||||||||||||||||||||||||
| Distributions to unitholders and general partner | (378 | ) | — | (98 | ) | — | (136 | ) | — | — | — | (612 | ) | ||||||||||||||||||||||
| Distributions to noncontrolling interests | — | — | — | — | — | — | (3 | ) | — | (3 | ) | ||||||||||||||||||||||||
| Contributions from noncontrolling interests | — | — | — | — | — | — | 4 | — | 4 | ||||||||||||||||||||||||||
| Class B unit conversion | 133 | (133 | ) | — | — | — | — | — | — | — | |||||||||||||||||||||||||
| Non-cash contribution from MPC | — | — | — | — | — | — | — | 334 | 334 | ||||||||||||||||||||||||||
| Equity-based compensation | 6 | — | — | — | — | — | — | — | 6 | ||||||||||||||||||||||||||
| Deferred income tax impact from changes in equity | (2 | ) | — | (13 | ) | — | (2 | ) | — | — | — | (17 | ) | ||||||||||||||||||||||
| Balance at September 30, 2016 | $ | 7,898 | $ | 133 | $ | 1,097 | $ | — | $ | 1,009 | $ | — | $ | 17 | $ | 739 | $ | 10,893 | |||||||||||||||||
| Balance at December 31, 2016 | $ | 8,086 | $ | 133 | $ | 1,069 | $ | — | $ | 1,013 | $ | — | $ | 18 | $ | 791 | $ | 11,110 | |||||||||||||||||
| Distributions to MPC from Predecessor | — | — | — | — | — | — | — | (113 | ) | (113 | ) | ||||||||||||||||||||||||
| Distributions of cash received from Joint-Interest Acquisition entities to MPC | — | — | — | — | (13 | ) | — | — | — | (13 | ) | ||||||||||||||||||||||||
| Issuance of units under ATM Program | 473 | — | — | — | 10 | — | — | — | 483 | ||||||||||||||||||||||||||
| Net income | 212 | — | 68 | 5 | 222 | — | 3 | 36 | 546 | ||||||||||||||||||||||||||
| Contribution from MPC | — | — | — | — | — | (14 | ) | — | 689 | 675 | |||||||||||||||||||||||||
| Allocation of MPC's net investment at acquisition | — | — | 845 | 824 | (266 | ) | — | — | (1,403 | ) | — | ||||||||||||||||||||||||
| Distribution to MPC for acquisitions | — | — | (537 | ) | — | (1,394 | ) | — | — | — | (1,931 | ) | |||||||||||||||||||||||
| Distributions to unitholders and general partner | (452 | ) | — | (143 | ) | (7 | ) | (198 | ) | — | — | — | (800 | ) | |||||||||||||||||||||
| Distributions to noncontrolling interests | — | — | — | — | — | — | (4 | ) | — | (4 | ) | ||||||||||||||||||||||||
| Contributions from noncontrolling interests | — | — | — | — | — | — | 128 | — | 128 | ||||||||||||||||||||||||||
| Class B unit conversion | 133 | (133 | ) | — | — | — | — | — | — | — | |||||||||||||||||||||||||
| Equity-based compensation | 5 | — | — | — | — | — | — | — | 5 | ||||||||||||||||||||||||||
| Balance at September 30, 2017 | $ | 8,457 | $ | — | $ | 1,302 | $ | 822 | $ | (626 | ) | $ | (14 | ) | $ | 145 | $ | — | $ | 10,086 | |||||||||||||||
The accompanying notes are an integral part of these consolidated financial statements.
5
MPLX LP
Consolidated Statements of Cash Flows (Unaudited)
| Nine Months Ended September 30, | |||||||||||
| (In millions) | 2021 | 2020 | |||||||||
| Increase/(decrease) in cash, cash equivalents and restricted cash | |||||||||||
| Operating activities: | |||||||||||
| Net income/(loss) | $ | 2,274 | $ | (1,387) | |||||||
| Adjustments to reconcile net income/(loss) to net cash provided by operating activities: | |||||||||||
| Amortization of deferred financing costs | 53 | 44 | |||||||||
| Depreciation and amortization | 971 | 992 | |||||||||
| Impairment expense | 42 | 2,165 | |||||||||
| Deferred income taxes | (1) | (1) | |||||||||
| Loss on disposal of assets | 4 | 1 | |||||||||
(Income)/loss from equity method investments(1) | (228) | 1,012 | |||||||||
| Distributions from unconsolidated affiliates | 361 | 350 | |||||||||
| Changes in: | |||||||||||
| Current receivables | (162) | 69 | |||||||||
| Inventories | (22) | (8) | |||||||||
| Fair value of derivatives | 41 | 1 | |||||||||
| Current accounts payable and accrued liabilities | 166 | (27) | |||||||||
| Current assets/current liabilities - related parties | 94 | 36 | |||||||||
| Right of use assets/operating lease liabilities | 2 | (2) | |||||||||
| Deferred revenue | 65 | 85 | |||||||||
| All other, net | 11 | 6 | |||||||||
| Net cash provided by operating activities | 3,671 | 3,336 | |||||||||
| Investing activities: | |||||||||||
| Additions to property, plant and equipment | (374) | (982) | |||||||||
| Disposal of assets | 77 | 54 | |||||||||
| Investments in unconsolidated affiliates | (116) | (244) | |||||||||
| Distributions from unconsolidated affiliates - return of capital | 36 | 112 | |||||||||
| Net cash used in investing activities | (377) | (1,060) | |||||||||
| Financing activities: | |||||||||||
| Long-term debt - borrowings | 3,000 | 5,990 | |||||||||
| - repayments | (4,946) | (5,372) | |||||||||
| Related party debt - borrowings | 6,571 | 4,870 | |||||||||
| - repayments | (5,201) | (5,464) | |||||||||
| Debt issuance costs | — | (23) | |||||||||
| Unit repurchases | (465) | — | |||||||||
| Distributions to noncontrolling interests | (29) | (26) | |||||||||
| Distributions to Series A preferred unitholders | (61) | (61) | |||||||||
| Distributions to Series B preferred unitholders | (41) | (41) | |||||||||
| Distributions to unitholders and general partner | (2,126) | (2,162) | |||||||||
| Contributions from MPC | 31 | 34 | |||||||||
| All other, net | (3) | (8) | |||||||||
| Net cash used in financing activities | (3,270) | (2,263) | |||||||||
| Net increase in cash, cash equivalents and restricted cash | 24 | 13 | |||||||||
| Cash, cash equivalents and restricted cash at beginning of period | 15 | 15 | |||||||||
| Cash, cash equivalents and restricted cash at end of period | $ | 39 | $ | 28 | |||||||
(1) The nine months ended September 30, 2021 and September 30, 2020 include $6 million and $1,264 million of impairment expense, respectively.
The accompanying notes are an integral part of these consolidated financial statements.
6
MPLX LP
Consolidated Statements of Equity (Unaudited)
| Partnership | |||||||||||||||||||||||||||||||||||||||||
| (In millions) | Common Unit-holders Public | Common Unit-holder MPC | Series B Preferred Unit-holders | Accumulated Other Comprehensive Loss | Non-controlling Interests | Total | |||||||||||||||||||||||||||||||||||
| Balance at December 31, 2019 | $ | 10,800 | $ | 4,968 | $ | 611 | $ | (15) | $ | 249 | $ | 16,613 | |||||||||||||||||||||||||||||
| Net (loss)/income (excludes amounts attributable to Series A preferred units) | (1,022) | (1,733) | 11 | — | 8 | (2,736) | |||||||||||||||||||||||||||||||||||
| Distributions to: | |||||||||||||||||||||||||||||||||||||||||
| Unitholders | (271) | (446) | (21) | — | — | (738) | |||||||||||||||||||||||||||||||||||
| Noncontrolling interests | — | — | — | — | (9) | (9) | |||||||||||||||||||||||||||||||||||
| Contributions from: | |||||||||||||||||||||||||||||||||||||||||
| MPC | — | 225 | — | — | — | 225 | |||||||||||||||||||||||||||||||||||
| Other | 2 | — | — | (1) | — | 1 | |||||||||||||||||||||||||||||||||||
| Balance at March 31, 2020 | 9,509 | 3,014 | 601 | (16) | 248 | 13,356 | |||||||||||||||||||||||||||||||||||
| Net income (excludes amounts attributable to Series A preferred units) | 229 | 388 | 10 | — | 7 | 634 | |||||||||||||||||||||||||||||||||||
| Distributions to: | |||||||||||||||||||||||||||||||||||||||||
| Unitholders | (270) | (458) | — | — | — | (728) | |||||||||||||||||||||||||||||||||||
| Noncontrolling interests | — | — | — | — | (8) | (8) | |||||||||||||||||||||||||||||||||||
| Contributions from: | |||||||||||||||||||||||||||||||||||||||||
| MPC | — | 6 | — | — | — | 6 | |||||||||||||||||||||||||||||||||||
| Other | 1 | 1 | — | — | — | 2 | |||||||||||||||||||||||||||||||||||
| Balance at June 30, 2020 | 9,469 | 2,951 | 611 | (16) | 247 | 13,262 | |||||||||||||||||||||||||||||||||||
| Net income (excludes amounts attributable to Series A preferred units) | 236 | 399 | 10 | — | 9 | 654 | |||||||||||||||||||||||||||||||||||
| Distributions to: | |||||||||||||||||||||||||||||||||||||||||
| Unitholders | (271) | (445) | (20) | — | — | (736) | |||||||||||||||||||||||||||||||||||
| Noncontrolling interests | — | — | — | — | (9) | (9) | |||||||||||||||||||||||||||||||||||
| Contributions from: | |||||||||||||||||||||||||||||||||||||||||
| MPC | — | 13 | — | — | — | 13 | |||||||||||||||||||||||||||||||||||
| Wholesale Exchange | — | (90) | — | — | — | (90) | |||||||||||||||||||||||||||||||||||
| Other | 2 | (1) | — | — | — | 1 | |||||||||||||||||||||||||||||||||||
| Balance at September 30, 2020 | $ | 9,436 | $ | 2,827 | $ | 601 | $ | (16) | $ | 247 | $ | 13,095 | |||||||||||||||||||||||||||||
| The accompanying notes are an integral part of these consolidated financial statements. | |||||||||||||||||||||||||||||||||||||||||
7
| Partnership | |||||||||||||||||||||||||||||||||||||||||
| (In millions) | Common Unit-holders Public | Common Unit-holder MPC | Series B Preferred Unit-holders | Accumulated Other Comprehensive Loss | Non-controlling Interests | Total | |||||||||||||||||||||||||||||||||||
| Balance at December 31, 2020 | $ | 9,384 | $ | 2,792 | $ | 611 | $ | (15) | $ | 245 | $ | 13,017 | |||||||||||||||||||||||||||||
| Net income (excludes amounts attributable to Series A preferred units) | 266 | 443 | 11 | — | 9 | 729 | |||||||||||||||||||||||||||||||||||
| Unit Repurchases | (155) | — | — | — | — | (155) | |||||||||||||||||||||||||||||||||||
| Distributions to: | |||||||||||||||||||||||||||||||||||||||||
| Unitholders | (269) | (445) | (21) | — | — | (735) | |||||||||||||||||||||||||||||||||||
| Noncontrolling interests | — | — | — | — | (10) | (10) | |||||||||||||||||||||||||||||||||||
| Contributions from: | |||||||||||||||||||||||||||||||||||||||||
| MPC | — | 7 | — | — | — | 7 | |||||||||||||||||||||||||||||||||||
| Other | — | (1) | — | (2) | — | (3) | |||||||||||||||||||||||||||||||||||
| Balance at March 31, 2021 | 9,226 | 2,796 | 601 | (17) | 244 | 12,850 | |||||||||||||||||||||||||||||||||||
| Net income (excludes amounts attributable to Series A preferred units) | 251 | 423 | 10 | — | 9 | 693 | |||||||||||||||||||||||||||||||||||
| Unit Repurchases | (155) | — | — | — | — | (155) | |||||||||||||||||||||||||||||||||||
| Distributions to: | |||||||||||||||||||||||||||||||||||||||||
| Unitholders | (262) | (445) | — | — | — | (707) | |||||||||||||||||||||||||||||||||||
| Noncontrolling interests | — | — | — | — | (10) | (10) | |||||||||||||||||||||||||||||||||||
| Contributions from: | |||||||||||||||||||||||||||||||||||||||||
| MPC | — | 122 | — | — | — | 122 | |||||||||||||||||||||||||||||||||||
| Other | 1 | 1 | — | — | — | 2 | |||||||||||||||||||||||||||||||||||
| Balance at June 30, 2021 | 9,061 | 2,897 | 611 | (17) | 243 | 12,795 | |||||||||||||||||||||||||||||||||||
| Net income (excludes amounts attributable to Series A preferred units) | 278 | 476 | 10 | — | 9 | 773 | |||||||||||||||||||||||||||||||||||
| Unit Repurchases | (160) | — | — | — | — | (160) | |||||||||||||||||||||||||||||||||||
| Distributions to: | |||||||||||||||||||||||||||||||||||||||||
| Unitholders | (261) | (445) | (20) | — | — | (726) | |||||||||||||||||||||||||||||||||||
| Noncontrolling interests | — | — | — | — | (9) | (9) | |||||||||||||||||||||||||||||||||||
| Contributions from: | |||||||||||||||||||||||||||||||||||||||||
| MPC | — | 16 | — | — | — | 16 | |||||||||||||||||||||||||||||||||||
| Other | 1 | — | — | — | — | 1 | |||||||||||||||||||||||||||||||||||
| Balance at September 30, 2021 | $ | 8,919 | $ | 2,944 | $ | 601 | $ | (17) | $ | 243 | $ | 12,690 | |||||||||||||||||||||||||||||
The accompanying notes are an integral part of these consolidated financial statements.
8
Notes to Consolidated Financial Statements (Unaudited)
1. Description of the Business and Basis of Presentation
Description of the Business – MPLX LP is a diversified, growth-orientedlarge-cap master limited partnership formed by Marathon Petroleum Corporation.Corporation that owns and operates midstream energy infrastructure and logistics assets, and provides fuels distribution services. References in this report to “MPLX LP,” “MPLX,” “the Partnership,” “we,” “ours,” “us,” or like terms refer to MPLX LP and its subsidiaries (collectively, the “Partnership”) are engaged in the gathering, processing and transportation of natural gas; the gathering, transportation, fractionation, storage and marketing of NGLs; and the transportation, storage and distribution of crude oil and refined petroleum products, principally for our sponsor.subsidiaries. References to “MPC” refer collectively to Marathon Petroleum Corporation as our sponsor and its subsidiaries, other than the Partnership. We are engaged in the transportation, storage, marketing and distribution of crude oil, asphalt and refined petroleum products; the gathering, processing and transportation of natural gas; and the gathering, transportation, fractionation, storage and marketing of NGLs. MPLX’s principal executive office is located in Findlay, Ohio.
In the equity method. The Partnership’s investmentssecond quarter of 2021, we recognized impairment expense of $42 million within our G&P segment related to our continued emphasis on portfolio optimization with the anticipated divestiture of several non-core assets and the closure of other non-core assets.
During the first quarter of 2020, the overall deterioration in a VIEthe economy and the environment in which the Partnership exercises significant influence but does not controlMPLX and is not the primary beneficiary are also accounted for using the equity method.
| (In millions) | Impairment | Footnote Reference | ||||||||||||
| Goodwill | $ | 1,814 | 12 | |||||||||||
| Equity method investments | 1,264 | 4 | ||||||||||||
| Intangibles, net | 177 | 12 | ||||||||||||
| Property, plant and equipment, net | 174 | 11 | ||||||||||||
| Total impairments | $ | 3,429 | ||||||||||||
Basis of net income attributable to MPLX LP for purposes of calculating net income per limited partner unit is described in Note 6.
Presentation – The accompanying interim consolidated financial statements are unaudited; however, in the opinion of the Partnership’sMPLX’s management, these statements reflect all adjustments necessary for a fair statement of the results for the periods reported. All such adjustments are of a normal, recurring nature unless otherwise disclosed. These interim consolidated financial statements, including the notes, have been prepared in accordance with the rules and regulations of the SEC applicable to interim period financial statements and do not include all of the information and disclosures required by GAAP for complete financial statements. Certain amounts in prior years have been reclassified to conform to current year presentation.
These interim consolidated financial statements should be read in conjunction with the audited consolidated financial statements and notes thereto included in theour Annual Report on Form 10-K for the year ended December 31, 2016, as updated by our Current Report on Form 8-K filed on May 1, 2017.2020. The results of operations for the three and nine months ended September 30, 20172021 are not necessarily indicative of the results to be expected for the full year.
MPLX’s consolidated financial statements include all majority-owned and controlled subsidiaries. For non-wholly owned consolidated subsidiaries, the interests owned by third parties have been recorded as “Noncontrolling interests” on the accompanying Consolidated Balance Sheets. Intercompany investments, accounts and transactions have been eliminated.
9
MPLX’s investments in which MPLX exercises significant influence but does not control and does not have a controlling financial interest are accounted for using the equity method. MPLX’s investments in VIEs in which MPLX exercises significant influence but does not control and is not the primary beneficiary are also accounted for using the equity method.
2. Accounting Standards
Recently Adopted
3. Acquisitions and Dispositions
Sale of Javelina Assets and Liabilities
On February 12, 2021, MarkWest Energy Operating Company, L.L.C., (“MarkWest Energy”) a wholly owned subsidiary of MPLX, completed the consolidated financial statements.
On September 1, 2017, the PartnershipJuly 31, 2020, MPLX entered into a Membership Interests and Shares ContributionsRedemption Agreement (the “September 2017 Contributions“Redemption Agreement”) with MPLX GP LLCWestern Refining Southwest, Inc. (now known as Western Refining Southwest LLC) (“MPLX GP”WRSW”), MPLX Logistics Holdings LLC (“MPLX Logistics”), MPLX Holdings Inc. (“MPLX Holdings”) and MPC Investment LLC (“MPC Investment”), each a wholly-ownedwholly owned subsidiary of MPC, whereby the Partnershippursuant to which MPLX agreed to acquire certain ownership interests in joint venture entities indirectly held by MPC. Pursuanttransfer to the September 2017 Contributions Agreement, MPC Investment agreed to contribute:WRSW all of the outstanding membership interests in Western Refining Wholesale, LLC (“WRW”) in exchange for the redemption of Lincoln Pipeline LLC, which holds a 35 percent interest in Illinois Extension Pipeline Company, L.L.C. (“Illinois Extension”); allMPLX common units held by WRSW. The transaction effected the transfer to MPC of the membership interestsWestern wholesale distribution business that MPLX acquired as a result of MPL Louisiana Holdings LLC, which holds a 40.7 percent interest in LOOP LLCits acquisition of Andeavor Logistics LP (“LOOP”ANDX”); a 58.52 percent interest in LOCAP LLC (“LOCAP”); and a 24.51 percent interest in Explorer Pipeline Company (“Explorer”), through a series. Per the terms of intercompany contributions to the Partnership for an agreed upon purchase price of approximately $420 million in cash and equity consideration valued at approximately $630 million for total consideration of $1.05 billion (collectively, the “Joint-Interest Acquisition”Redemption Agreement, MPLX redeemed 18,582,088 common units (the “Redeemed Units”). held by WRSW on July 31, 2020. The number of common units representing the equity considerationRedeemed Units was then determinedcalculated by dividing the contribution amountWRW’s aggregate valuation of $340 million by the simple average of the ten day trading volume weighted average NYSE priceprices of aan MPLX common unit for the ten trading days ending at market close on August 31, 2017.July 27, 2020. MPLX canceled the Redeemed Units immediately following the Wholesale Exchange. The faircarrying value of the common and general partner units issuednet assets of WRW transferred to MPC was approximately $653$90 million based on the closing common unit price as of September 1, 2017, asJuly 31, 2020, resulting in $250 million being recorded onto “Common Unit-holder MPC” within the Consolidated Statements of Equity, for a total purchase price of $1.07 billion. The equity issued consisted of: (i) 13,719,017 common units to MPLX GP, (ii) 3,350,893 common units to MPLX Logistics and (iii) 1,441,224 common units to MPLX Holdings. The Partnership also issued 377,778 general partner units to MPLX GP in order to maintain its two percent general partner interest (“GP Interest”) innetted against the Partnership.
10
4. Investments and consisted of (i) 9,197,900 common units to MPLX GP, (ii) 2,630,427 common units to MPLX Logistics and (iii) 1,132,049 common units to MPLX Holdings. The Partnership also issued 264,497 general partner units to MPLX GP in order to maintain its two percent GP Interest in the Partnership. MPC agreed to waive two-thirds of the first quarter 2017 distributions on the common units issued in connection with the Transaction. As a result of this waiver, MPC did not receive two-thirds of the general partner distributions or IDRs that would have otherwise accrued on such common units with respect to the first quarter 2017 distributions. The value of these waived distributions was $6 million.Noncontrolling Interests
| Three Months Ended September 30, 2016 | |||||||||||||||||||
| (In millions, except per unit data) | MPLX LP (Previously Reported) | HST/WHC | MPLXT | Eliminations(1) | MPLX LP (Currently Reported) | ||||||||||||||
| Revenues and other income: | |||||||||||||||||||
| Service revenue | $ | 250 | $ | — | $ | — | $ | — | $ | 250 | |||||||||
| Service revenue - related parties | 153 | 28 | 72 | — | 253 | ||||||||||||||
| Rental income | 77 | — | — | — | 77 | ||||||||||||||
| Rental income - related parties | 29 | 13 | 26 | — | 68 | ||||||||||||||
| Product sales | 157 | — | — | — | 157 | ||||||||||||||
| Product sales - related parties | 2 | — | — | — | 2 | ||||||||||||||
| Income from equity method investments | 6 | — | — | — | 6 | ||||||||||||||
| Gain on sale of assets | 1 | — | — | — | 1 | ||||||||||||||
| Other income | 2 | — | — | — | 2 | ||||||||||||||
| Other income - related parties | 26 | — | — | (4 | ) | 22 | |||||||||||||
| Total revenues and other income | 703 | 41 | 98 | (4 | ) | 838 | |||||||||||||
| Costs and expenses: | |||||||||||||||||||
| Cost of revenues (excludes items below) | 90 | 10 | 22 | — | 122 | ||||||||||||||
| Purchased product costs | 117 | — | — | — | 117 | ||||||||||||||
| Rental cost of sales | 11 | 2 | — | — | 13 | ||||||||||||||
| Rental cost of sales - related parties | — | 1 | — | (1 | ) | — | |||||||||||||
| Purchases - related parties | 84 | 4 | 24 | (3 | ) | 109 | |||||||||||||
| Depreciation and amortization | 138 | 4 | 9 | — | 151 | ||||||||||||||
| General and administrative expenses | 46 | 2 | 8 | — | 56 | ||||||||||||||
| Other taxes | 10 | — | 2 | — | 12 | ||||||||||||||
| Total costs and expenses | 496 | 23 | 65 | (4 | ) | 580 | |||||||||||||
| Income from operations | 207 | 18 | 33 | — | 258 | ||||||||||||||
| Interest expense (net of amounts capitalized) | 51 | — | — | — | 51 | ||||||||||||||
| Other financial costs | 13 | — | — | — | 13 | ||||||||||||||
| Income before income taxes | 143 | 18 | 33 | — | 194 | ||||||||||||||
| Net income | 143 | 18 | 33 | — | 194 | ||||||||||||||
| Less: Net income attributable to noncontrolling interests | 2 | — | — | — | 2 | ||||||||||||||
| Less: Net income attributable to Predecessor | — | 18 | 33 | — | 51 | ||||||||||||||
| Net income attributable to MPLX LP | 141 | — | — | — | 141 | ||||||||||||||
| Less: Preferred unit distributions | 16 | — | — | — | 16 | ||||||||||||||
| Less: General partner’s interest in net income attributable to MPLX LP | 51 | — | — | — | 51 | ||||||||||||||
| Limited partners’ interest in net income attributable to MPLX LP | $ | 74 | $ | — | $ | — | $ | — | $ | 74 | |||||||||
| Nine Months Ended September 30, 2016 | |||||||||||||||||||
| (In millions, except per unit data) | MPLX LP (Previously Reported) | HST/WHC | MPLXT | Eliminations(1) | MPLX LP (Currently Reported) | ||||||||||||||
| Revenues and other income: | |||||||||||||||||||
| Service revenue | $ | 712 | $ | — | $ | — | $ | — | $ | 712 | |||||||||
| Service revenue - related parties | 448 | 82 | 146 | — | 676 | ||||||||||||||
| Rental income | 218 | — | — | — | 218 | ||||||||||||||
| Rental income - related parties | 84 | 36 | 52 | — | 172 | ||||||||||||||
| Product sales | 394 | — | — | — | 394 | ||||||||||||||
| Product sales - related parties | 8 | — | — | — | 8 | ||||||||||||||
| Loss from equity method investments | (72 | ) | — | — | — | (72 | ) | ||||||||||||
| Gain on sale of assets | 1 | — | — | — | 1 | ||||||||||||||
| Other income | 5 | — | — | — | 5 | ||||||||||||||
| Other income - related parties | 78 | — | — | (11 | ) | 67 | |||||||||||||
| Total revenues and other income | 1,876 | 118 | 198 | (11 | ) | 2,181 | |||||||||||||
| Costs and expenses: | |||||||||||||||||||
| Cost of revenues (excludes items below) | 263 | 24 | 42 | — | 329 | ||||||||||||||
| Purchased product costs | 310 | — | — | — | 310 | ||||||||||||||
| Rental cost of sales | 39 | 3 | — | — | 42 | ||||||||||||||
| Rental cost of sales - related parties | — | 2 | — | (1 | ) | 1 | |||||||||||||
| Purchases - related parties | 238 | 13 | 45 | (10 | ) | 286 | |||||||||||||
| Depreciation and amortization | 407 | 12 | 19 | — | 438 | ||||||||||||||
| Impairment expense | 130 | — | — | — | 130 | ||||||||||||||
| General and administrative expenses | 147 | 5 | 20 | — | 172 | ||||||||||||||
| Other taxes | 32 | 2 | 3 | — | 37 | ||||||||||||||
| Total costs and expenses | 1,566 | 61 | 129 | (11 | ) | 1,745 | |||||||||||||
| Income from operations | 310 | 57 | 69 | — | 436 | ||||||||||||||
| Related party interest and other financial income | 1 | — | — | — | 1 | ||||||||||||||
| Interest expense (net of amounts capitalized) | 158 | — | — | — | 158 | ||||||||||||||
| Other financial costs | 37 | — | — | — | 37 | ||||||||||||||
| Income before income taxes | 114 | 57 | 69 | — | 240 | ||||||||||||||
| Benefit for income taxes | (12 | ) | — | — | — | (12 | ) | ||||||||||||
| Net income | 126 | 57 | 69 | — | 252 | ||||||||||||||
| Less: Net income attributable to noncontrolling interests | 3 | — | — | — | 3 | ||||||||||||||
| Less: Net income attributable to Predecessor | 23 | 57 | 69 | — | 149 | ||||||||||||||
| Net income attributable to MPLX LP | 100 | — | — | — | 100 | ||||||||||||||
| Less: Preferred unit distributions | 25 | — | — | — | 25 | ||||||||||||||
| Less: General partner’s interest in net income attributable to MPLX LP | 136 | — | — | — | 136 | ||||||||||||||
| Limited partners’ interest in net loss attributable to MPLX LP | $ | (61 | ) | $ | — | $ | — | $ | — | $ | (61 | ) | |||||||
The following table presents the Partnership’s previously reported unaudited Consolidated Statements of Cash Flows, retrospectively adjusted for the acquisition of HST, WHC and MPLXT:
| Nine Months Ended September 30, 2016 | |||||||||||||||
| (In millions) | MPLX LP (Previously Reported) | HST/WHC | MPLXT | MPLX LP (Currently Reported) | |||||||||||
| Increase (decrease) in cash and cash equivalents | |||||||||||||||
| Operating activities: | |||||||||||||||
| Net income | $ | 126 | $ | 57 | $ | 69 | $ | 252 | |||||||
| Adjustments to reconcile net income to net cash provided by (used in) operating activities: | |||||||||||||||
| Amortization of deferred financing costs | 34 | — | — | 34 | |||||||||||
| Depreciation and amortization | 407 | 12 | 19 | 438 | |||||||||||
| Impairment expense | 130 | — | — | 130 | |||||||||||
| Deferred income taxes | (16 | ) | — | — | (16 | ) | |||||||||
| Asset retirement expenditures | (3 | ) | (1 | ) | — | (4 | ) | ||||||||
| Gain on disposal of assets | (1 | ) | — | — | (1 | ) | |||||||||
| Loss from equity method investments | 72 | — | — | 72 | |||||||||||
| Distributions from unconsolidated affiliates | 111 | — | — | 111 | |||||||||||
| Changes in: | |||||||||||||||
| Current receivables | (44 | ) | 1 | — | (43 | ) | |||||||||
| Inventories | (4 | ) | — | — | (4 | ) | |||||||||
| Fair value of derivatives | 28 | — | — | 28 | |||||||||||
| Current accounts payable and accrued liabilities | 59 | (1 | ) | 6 | 64 | ||||||||||
| Receivables from / liabilities to related parties | 15 | 3 | (122 | ) | (104 | ) | |||||||||
| All other, net | 18 | 2 | (2 | ) | 18 | ||||||||||
| Net cash provided by (used in) operating activities | 932 | 73 | (30 | ) | 975 | ||||||||||
| Investing activities: | |||||||||||||||
| Additions to property, plant and equipment | (874 | ) | (36 | ) | (33 | ) | (943 | ) | |||||||
| Investments - net related party loans | 77 | (37 | ) | 63 | 103 | ||||||||||
| Investments in unconsolidated affiliates | (56 | ) | — | — | (56 | ) | |||||||||
| All other, net | 4 | — | — | 4 | |||||||||||
| Net cash (used in) provided by investing activities | (849 | ) | (73 | ) | 30 | (892 | ) | ||||||||
| Financing activities: | |||||||||||||||
| Long-term debt - borrowings | 434 | — | — | 434 | |||||||||||
| - repayments | (1,312 | ) | — | — | (1,312 | ) | |||||||||
| Related party debt - borrowings | 2,215 | — | — | 2,215 | |||||||||||
| - repayments | (2,223 | ) | — | — | (2,223 | ) | |||||||||
| Net proceeds from equity offerings | 510 | — | — | 510 | |||||||||||
| Issuance of redeemable preferred units | 984 | — | — | 984 | |||||||||||
| Distributions to preferred unitholders | (9 | ) | — | — | (9 | ) | |||||||||
| Distributions to unitholders and general partner | (612 | ) | — | — | (612 | ) | |||||||||
| Distributions to noncontrolling interests | (3 | ) | — | — | (3 | ) | |||||||||
| Contributions from noncontrolling interests | 4 | — | — | 4 | |||||||||||
| Consideration payment to Class B unitholders | (25 | ) | — | — | (25 | ) | |||||||||
| All other, net | (2 | ) | — | — | (2 | ) | |||||||||
| Contribution from MPC | 225 | — | — | 225 | |||||||||||
| Distributions to MPC from Predecessor | (104 | ) | — | — | (104 | ) | |||||||||
| Net cash provided by financing activities | 82 | — | — | 82 | |||||||||||
| Net increase in cash and cash equivalents | 165 | — | — | 165 | |||||||||||
| Cash and cash equivalents at beginning of period | 43 | — | — | 43 | |||||||||||
| Cash and cash equivalents at end of period | $ | 208 | $ | — | $ | — | $ | 208 | |||||||
| Ownership as of | Carrying value at | ||||||||||||||||
| September 30, | September 30, | December 31, | |||||||||||||||
| (In millions, except ownership percentages) | 2021 | 2021 | 2020 | ||||||||||||||
| L&S | |||||||||||||||||
MarEn Bakken Company LLC(1) | 25% | $ | 457 | $ | 465 | ||||||||||||
| Illinois Extension Pipeline Company, L.L.C. | 35% | 253 | 254 | ||||||||||||||
| LOOP LLC | 41% | 268 | 252 | ||||||||||||||
Andeavor Logistics Rio Pipeline LLC(2) | 67% | 188 | 194 | ||||||||||||||
| Minnesota Pipe Line Company, LLC | 17% | 184 | 188 | ||||||||||||||
Whistler Pipeline LLC(2) | 38% | 146 | 185 | ||||||||||||||
| Explorer Pipeline Company | 25% | 68 | 72 | ||||||||||||||
W2W Holdings LLC(2)(3) | 50% | 66 | 72 | ||||||||||||||
Other(2) | 115 | 103 | |||||||||||||||
| Total L&S | 1,745 | 1,785 | |||||||||||||||
| G&P | |||||||||||||||||
MarkWest Utica EMG, L.L.C.(2) | 57% | 682 | 698 | ||||||||||||||
Sherwood Midstream LLC(2) | 50% | 548 | 557 | ||||||||||||||
MarkWest EMG Jefferson Dry Gas Gathering Company, L.L.C.(2) | 67% | 335 | 307 | ||||||||||||||
MarkWest Torñado GP, L.L.C.(2) | 60% | 223 | 188 | ||||||||||||||
Rendezvous Gas Services, L.L.C.(2) | 78% | 151 | 159 | ||||||||||||||
Sherwood Midstream Holdings LLC(2) | 51% | 138 | 148 | ||||||||||||||
| Centrahoma Processing LLC | 40% | 132 | 145 | ||||||||||||||
Other(2) | 47 | 49 | |||||||||||||||
| Total G&P | 2,256 | 2,251 | |||||||||||||||
| Total | $ | 4,001 | $ | 4,036 | |||||||||||||
(1) The Ozark pipeline is a 433-mile, 22-inch crude oil pipeline originatinginvestment in Cushing, Oklahoma, and terminating in Wood River, Illinois, capable of transporting approximately 230 mbpd. The Partnership accounts for the Ozark pipeline within its L&S segment.
| (In millions) | Three Months Ended September 30, 2017 | Seven Months Ended September 30, 2017 | |||||
| Revenues and other income | $ | 19 | $ | 45 | |||
| Income from operations | 6 | 17 | |||||
(2) Investments deemed to acquire a 36.75 percent indirectbe VIEs. Some investments included within “Other” have also been deemed to be VIEs.
(3) Through our ownership interest in the Bakken Pipeline system. The Partnership holds, throughW2W Holdings LLC, we have a subsidiary, a 2515 percent interest in MarEn Bakken, which equates to a 9.1875 percent indirect interest in the Bakken Pipeline system.
| Nine Months Ended September 30, 2017 | |||||||||||||||
| (In millions) | MarkWest Utica EMG | Other VIEs | Non-VIEs | Total | |||||||||||
| Revenues and other income | $ | 137 | $ | 49 | $ | 178 | $ | 364 | |||||||
| Costs and expenses | 72 | 29 | 115 | 216 | |||||||||||
| Income from operations | 65 | 20 | 63 | 148 | |||||||||||
| Net income | 65 | 19 | 28 | 112 | |||||||||||
Income from equity method investments(1) | 6 | 7 | 16 | 29 | |||||||||||
| Nine Months Ended September 30, 2016 | |||||||||||||||
| (In millions) | MarkWest Utica EMG | Other VIEs(2) | Non-VIEs | Total | |||||||||||
| Revenues and other income | $ | 165 | $ | 13 | $ | 108 | $ | 286 | |||||||
| Costs and expenses | 70 | 107 | 80 | 257 | |||||||||||
| Income (loss) from operations | 95 | (94 | ) | 28 | 29 | ||||||||||
| Net income (loss) | 94 | (94 | ) | 28 | 28 | ||||||||||
Income (loss) from equity method investments(1) | 10 | (88 | ) | 6 | (72 | ) | |||||||||
| September 30, 2017 | |||||||||||||||
| (In millions) | MarkWest Utica EMG(1) | Other VIEs | Non-VIEs | Total | |||||||||||
| Current assets | $ | 72 | $ | 47 | $ | 379 | $ | 498 | |||||||
| Noncurrent assets | 2,092 | 878 | 4,614 | 7,584 | |||||||||||
| Current liabilities | 37 | 55 | 492 | 584 | |||||||||||
| Noncurrent liabilities | 2 | 12 | 562 | 576 | |||||||||||
| December 31, 2016 | |||||||||||||||
| (In millions) | MarkWest Utica EMG(1) | Other VIEs | Non-VIEs | Total | |||||||||||
| Current assets | $ | 45 | $ | 2 | $ | 40 | $ | 87 | |||||||
| Noncurrent assets | 2,173 | 132 | 390 | 2,695 | |||||||||||
| Current liabilities | 30 | 4 | 26 | 60 | |||||||||||
| Noncurrent liabilities | 2 | 13 | — | 15 | |||||||||||
Sherwood Midstream LLC (“Sherwood Midstream”) has been deemed the primary beneficiary of Sherwood Midstream Holdings LLC (Sherwood Midstream Holdings”) due to its controlling financial interest through its authority to manage the joint venture. As a result, Sherwood Midstream consolidates Sherwood Midstream Holdings. Therefore, MPLX also reports its portion of Sherwood Midstream Holdings’ net assets as a component of its investment in MarkWest Utica EMG’s, which was $2.2 billion atSherwood Midstream. As of September 30, 2017 and December 31, 2016, is reported under the caption Equity method investments on the Consolidated Balance Sheets. The Partnership’s2021, MPLX has a 24.55 percent indirect ownership interest in Sherwood Midstream Holdings through Sherwood Midstream.
MPLX’s maximum exposure to loss as a result of its involvement with MarkWest Utica EMGequity method investments includes its equity investment, any additional capital contribution commitments and any operating expenses incurred by the subsidiary operator in excess of its compensation received for the performance of the operating services. The PartnershipMPLX did not provide any financial support to MarkWest Utica EMG that it was not contractually obligated to provide during the three and nine months ended September 30, 2017 and 2016, respectively. The Partnership receives management fee revenue for engineering and construction and administrative services for operating MarkWest Utica EMG, and is also reimbursed for personnel services (“Operational Service revenue”). Operational Service revenue is reported as Other income-related parties in the Consolidated Statements of Income. The amount of Operational Service revenue related to MarkWest Utica EMG for the three and nine months ended September 30, 2017, totaled $5 million and $13 million, respectively. The amount of Operational Service revenue related to MarkWest Utica EMG for the three and nine months ended September 30, 2016, totaled approximately $5 million and $12 million, respectively.
11
During the first quarter of 2020, we recorded an other than temporary impairment for operating Sherwood Midstream. The amountthree joint ventures in which we have an interest as discussed in Note 1. Impairment of Operational Service revenuethese investments was $1,264 million, of which $1,251 million was related to Sherwood Midstream for the threeMarkWest Utica EMG, L.L.C. and nine months ended September 30, 2017, totaled approximately $2 million and $6 million, respectively, and is reported as Other income-related parties in the Consolidated Statements of Income.
| Nine Months Ended September 30, 2021 | |||||||||||||||||
| (In millions) | VIEs | Non-VIEs | Total | ||||||||||||||
| Revenues and other income | $ | 565 | $ | 940 | $ | 1,505 | |||||||||||
| Costs and expenses | 350 | 427 | 777 | ||||||||||||||
| Income from operations | 215 | 513 | 728 | ||||||||||||||
| Net income | 172 | 449 | 621 | ||||||||||||||
Income from equity method investments(1) | $ | 120 | $ | 108 | $ | 228 | |||||||||||
| Nine Months Ended September 30, 2020 | |||||||||||||||||
| (In millions) | VIEs | Non-VIEs | Total | ||||||||||||||
| Revenues and other income | $ | 132 | $ | 933 | $ | 1,065 | |||||||||||
| Costs and expenses | 308 | 405 | 713 | ||||||||||||||
| (Loss)/income from operations | (176) | 528 | 352 | ||||||||||||||
| Net (loss)/income | (230) | 477 | 247 | ||||||||||||||
(Loss)/income from equity method investments(1) | $ | (1,138) | $ | 126 | $ | (1,012) | |||||||||||
(1) Includes impairment expense of Sherwood Midstream Holdings’ net assets$1,264 million.
Summarized balance sheet information for MPLX’s equity method investments as a component of its investment in Sherwood Midstream. As of September 30, 2017, the Partnership has a 14.7 percent indirect ownership interest in Sherwood Midstream Holdings through Sherwood Midstream.2021 and December 31, 2020 is as follows:
| September 30, 2021 | |||||||||||||||||
| (In millions) | VIEs | Non-VIEs | Total | ||||||||||||||
| Current assets | $ | 328 | $ | 444 | $ | 772 | |||||||||||
| Noncurrent assets | 7,426 | 4,907 | 12,333 | ||||||||||||||
| Current liabilities | 216 | 254 | 470 | ||||||||||||||
| Noncurrent liabilities | $ | 2,448 | $ | 873 | $ | 3,321 | |||||||||||
| December 31, 2020 | |||||||||||||||||
| (In millions) | VIEs | Non-VIEs | Total | ||||||||||||||
| Current assets | $ | 530 | $ | 318 | $ | 848 | |||||||||||
| Noncurrent assets | 6,889 | 4,997 | 11,886 | ||||||||||||||
| Current liabilities | 323 | 187 | 510 | ||||||||||||||
| Noncurrent liabilities | $ | 1,904 | $ | 830 | $ | 2,734 | |||||||||||
5. Related Party Agreements and Transactions
12
storage volumescapacity; operating and management fees; as well as reimbursements for certain direct and indirect costs. MPC has also committed to provide a fixed fee for 100 percent of crude oil, refined productsavailable capacity for boats, barges and butane.third-party chartered equipment under the marine transportation service agreement. MPLX also has a keep-whole commodity agreement with MPC under which MPC pays us a processing fee for NGLs related to keep-whole agreements and delivers shrink gas to the producers on our behalf. We pay MPC a marketing fee in exchange for assuming the commodity risk. Additionally, MPLX has obligations to MPC for services provided to MPLX by MPC under omnibus and employee services-type agreements as well as other various agreements.
MPLX is party to a loan agreement with MPC Investment a wholly-owned subsidiary of MPC.LLC (“MPC Investment”) (the “MPC Loan Agreement”). Under the terms of the agreement, MPC Investment will make a loan orextends loans to the PartnershipMPLX on a revolving basis as requested by the PartnershipMPLX and as agreed to by MPC Investment, in an amount or amounts that do not result inInvestment. The borrowing capacity of the MPC Loan Agreement is $1.5 billion aggregate principal amount of all loans outstanding exceeding $500 million at any one time. The entire unpaid principal amount ofloan agreement is scheduled to expire, and borrowings under the loan together with all accruedagreement are scheduled to mature and unpaid interest and other amounts (if any), shall become due and payable, on December 4, 2020.July 31, 2024, provided that MPC Investment may demand payment of all or any portion of the outstanding principal amount of the loan, together with all accrued and unpaid interest and other amounts (if any), at any time prior to December 4, 2020.maturity. Borrowings under the loan willMPC Loan Agreement bear interest at LIBOR plus 1.50 percent. During1.25 percent or such lower rate as would be applicable to such loans under the nine months ended September 30, 2017,MPLX Credit Agreement as discussed in Note 15. Activity on the Partnership borrowed $829 million and repaid $627 million, resultingMPC Loan Agreement was as follows:
| (In millions) | Nine Months Ended September 30, 2021 | Year Ended December 31, 2020 | |||||||||
| Borrowings | $ | 6,571 | $ | 6,264 | |||||||
| Average interest rate of borrowings | 1.345 | % | 2.278 | % | |||||||
| Repayments | $ | 5,201 | $ | 6,858 | |||||||
Outstanding balance at end of period(1) | $ | 1,370 | $ | — | |||||||
(1) Included in $202 million outstanding balance at September 30, 2017, which is included in Payables-related parties“Current liabilities - related parties” on the Consolidated Balance Sheets. Borrowings were at an average interest rate of 2.721 percent, per annum, for the nine months ended September 30, 2017. During the year ended December 31, 2016, the Partnership borrowed $2.5 billion and repaid $2.5 billion, resulting in no outstanding balance at December 31, 2016. Borrowings were at an average interest rate of 1.939 percent, per annum, for the year ended December 31, 2016. For additional information regarding the Partnership’s commercial and other agreements with MPC, see Item 1. Business in the Annual Report on Form 10-K for the year ended December 31, 2016.
Related Party TransactionsRevenue
| Three Months Ended September 30, | Nine Months Ended September 30, | ||||||||||||||
| (In millions) | 2017 | 2016 | 2017 | 2016 | |||||||||||
| Service revenues | |||||||||||||||
| MPC | $ | 276 | $ | 253 | $ | 801 | $ | 676 | |||||||
| Rental income | |||||||||||||||
| MPC | $ | 70 | $ | 68 | $ | 207 | $ | 172 | |||||||
Product sales(1) | |||||||||||||||
| MPC | $ | 2 | $ | 2 | $ | 6 | $ | 8 | |||||||
Related party sales to MPC consist of crude oil and refined products pipeline and trucking transportation services based on regulated tariff rates,tariff/contracted rates; storage, terminal and fuels distribution services based on contracted ratesrates; and marine transportation services. Related party sales to MPC also includes revenue related to volume deficiency credits.
Certain product sales to MPC net to zero within the consolidated financial statements as the transactions are recorded net due to the terms of the agreements under which such product was sold. For the three and nine months ended September 30, 2021, these sales totaled $203 million and $548 million, respectively. For the three and nine months ended September 30, 2020, these sales totaled $107 million and $332 million, respectively.
MPLX also has operating agreements with MPC under which it receives a fee for operating MPC’s retained pipeline assets and a fixed annual fee for providing oversight and management services provided by HSM. Underrequired to run the Partnership’s pipeline transportationmarine business. MPLX also receives management fee revenue for engineering, construction and administrative services for operating certain of its equity method investments. These agreements are classified as “Other income - related parties” on the Consolidated Statements of Income.
Related Party Expenses
MPC charges MPLX for executive management services and certain general and administrative services that MPC provides to MPLX under the terms of our omnibus agreements (“Omnibus charges”). Omnibus charges included in “Rental cost of sales - related parties” primarily relate to services that support MPLX’s rental operations and maintenance of assets available for rent, as well as compensation expenses. Omnibus charges included in “Purchases - related parties” primarily relate to services that support MPLX’s operations and maintenance activities, as well as compensation expenses. Omnibus charges included in “General and administrative expenses” primarily relate to services that support MPLX’s executive management, accounting and human resources activities. MPLX also obtains employee services from MPC under employee services agreements if(“ESA charges”). ESA charges for personnel directly involved in or supporting operations and maintenance activities related to rental services are classified as “Rental cost of sales - related parties.” ESA charges for personnel directly involved in or supporting operations and maintenance activities related to other services are classified as “Purchases - related parties.” ESA charges for personnel involved in executive management, accounting and human resources activities are classified as “General and
13
administrative expenses.” In addition to these agreements, MPLX purchases products from MPC, makes payments to MPC in its capacity as general contractor to MPLX, and has certain lease agreements with MPC.
For the three and nine months ended September 30, 2021, “General and administrative expenses” incurred from MPC totaled $70 million and $190 million, respectively. For the three and nine months ended September 30, 2020, “General and administrative expenses” incurred from MPC totaled $63 million and $195 million, respectively.
Some charges incurred under the omnibus and ESA agreements are related to engineering services and are associated with assets under construction. These charges are added to “Property, plant and equipment, net” on the Consolidated Balance Sheets. For the three and nine months ended September 30, 2021, these charges totaled $13 million and $40 million, respectively. For the three and nine months ended September 30, 2020, these charges totaled $29 million and $80 million, respectively.
MPC has also been advancing certain strategic priorities to lay a foundation for long-term success, including plans to optimize its assets and structurally lower costs in 2021 and beyond. In 2020, MPC approved and executed an involuntary workforce reduction plan, which together with employee reductions resulting from MPC’s indefinite idling of its Martinez, California and Gallup, New Mexico refineries, affected approximately 2,050 employees. All of the employees that conduct MPLX’s business are directly employed by affiliates of MPC, and certain of those employees were affected by MPC’s workforce reductions. During the third quarter of 2020, MPLX reimbursed MPC for $36 million related to severance and employee benefits related expenses that MPC recorded in connection with its workforce reductions. There were no such costs in the first nine months of 2021.
Related Party Assets and Liabilities
Assets and liabilities with related parties appearing on the Consolidated Balance Sheets are detailed in the table below. This table identifies the various components of related party assets and liabilities, including those associated with leases (see Note 18 for additional information) and deferred revenue on minimum volume commitments. If MPC fails to transportmeet its minimum throughputcommitted volumes, during any quarter, then MPC will pay the PartnershipMPLX a deficiency payment equal tobased on the volumeterms of the deficiency multiplied by the tariff rate then in effect.agreement. The deficiency amounts received under these agreements (excluding payments received under agreements classified as sales-type leases) are recorded as Deferred revenue-related parties.“Current liabilities - related parties.” In many cases, MPC may then apply the amount of any such deficiency payments as a credit for volumes transported on the applicable pipeline system in excess of its minimum volume commitment during the following four or eight quartersin future periods under the terms of the applicable transportation services agreement. The Partnershipagreements. MPLX recognizes related party revenues for the deficiency payments when credits are used for volumes transported in excess of minimum quarterly volume commitments, whenwhere it becomes impossible to physically transport volumes necessary to utilizeis probable the creditscustomer will not use the credit in future periods or upon the expiration of the credits. The use or expiration of the credits is a decrease in Deferred revenue-related parties.
| Three Months Ended September 30, | Nine Months Ended September 30, | ||||||||||||||
| (In millions) | 2017 | 2016 | 2017 | 2016 | |||||||||||
| MPC | $ | 9 | $ | 10 | $ | 30 | $ | 36 | |||||||
| MarkWest Utica EMG | 5 | 5 | 13 | 12 | |||||||||||
| Ohio Gathering | 4 | 5 | 12 | 12 | |||||||||||
| Other | 4 | 2 | 14 | 7 | |||||||||||
| Total | $ | 22 | $ | 22 | $ | 69 | $ | 67 | |||||||
| Three Months Ended September 30, | Nine Months Ended September 30, | ||||||||||||||
| (In millions) | 2017 | 2016 | 2017 | 2016 | |||||||||||
| Purchases - related parties | $ | 17 | $ | 11 | $ | 50 | $ | 29 | |||||||
| General and administrative expenses | 9 | 11 | 28 | 33 | |||||||||||
| Total | $ | 26 | $ | 22 | $ | 78 | $ | 62 | |||||||
| Three Months Ended September 30, | Nine Months Ended September 30, | ||||||||||||||
| (In millions) | 2017 | 2016 | 2017 | 2016 | |||||||||||
| MPC | $ | 11 | $ | 14 | $ | 33 | $ | 36 | |||||||
| Three Months Ended September 30, | Nine Months Ended September 30, | ||||||||||||||
| (In millions) | 2017 | 2016 | 2017 | 2016 | |||||||||||
| Purchases - related parties | $ | 97 | $ | 98 | $ | 280 | $ | 257 | |||||||
| General and administrative expenses | 25 | 27 | 74 | 75 | |||||||||||
| Total | $ | 122 | $ | 125 | $ | 354 | $ | 332 | |||||||
| (In millions) | September 30, 2017 | December 31, 2016 | |||||
| MPC | $ | 144 | $ | 242 | |||
| MarkWest Utica EMG | 2 | 2 | |||||
| Ohio Gathering | 2 | 2 | |||||
| Other | 4 | 1 | |||||
| Total | $ | 152 | $ | 247 | |||
| (In millions) | September 30, 2017 | December 31, 2016 | |||||
| MPC | $ | 18 | $ | 11 | |||
| (In millions) | September 30, 2017 | December 31, 2016 | |||||
MPC(1) | $ | 277 | $ | 63 | |||
| MarkWest Utica EMG | 30 | 24 | |||||
| Other | 10 | — | |||||
| Total | $ | 317 | $ | 87 | |||
14
| (In millions) | (In millions) | September 30, 2021 | December 31, 2020 | |||||||||||||||
| Current assets - related parties | Current assets - related parties | |||||||||||||||||
| Receivables - MPC | Receivables - MPC | $ | 547 | $ | 615 | |||||||||||||
| (In millions) | September 30, 2017 | December 31, 2016 | ||||||||||||||||
| Minimum volume deficiencies - MPC | $ | 55 | $ | 48 | ||||||||||||||
| Project reimbursements - MPC | 27 | 9 | ||||||||||||||||
| Receivables - Other | Receivables - Other | 7 | 27 | |||||||||||||||
| Prepaid - MPC | Prepaid - MPC | 13 | 4 | |||||||||||||||
| Other - MPC | Other - MPC | 2 | 1 | |||||||||||||||
| Lease Receivables - MPC | Lease Receivables - MPC | 76 | 30 | |||||||||||||||
| Total | $ | 82 | $ | 57 | Total | 645 | 677 | |||||||||||
| Noncurrent assets - related parties | Noncurrent assets - related parties | |||||||||||||||||
| Long-term receivables - MPC | Long-term receivables - MPC | 32 | 32 | |||||||||||||||
| Right of use assets - MPC | Right of use assets - MPC | 230 | 231 | |||||||||||||||
| Long-term lease receivables - MPC | Long-term lease receivables - MPC | 857 | 386 | |||||||||||||||
| Unguaranteed residual asset - MPC | Unguaranteed residual asset - MPC | 41 | 23 | |||||||||||||||
| Total | Total | 1,160 | 672 | |||||||||||||||
| Current liabilities - related parties | Current liabilities - related parties | |||||||||||||||||
| Payables - MPC | Payables - MPC | 1,577 | 215 | |||||||||||||||
| Payables - Other | Payables - Other | 36 | 43 | |||||||||||||||
| Operating lease liabilities - MPC | Operating lease liabilities - MPC | 1 | 1 | |||||||||||||||
| Deferred revenue - Minimum volume deficiencies - MPC | Deferred revenue - Minimum volume deficiencies - MPC | 43 | 66 | |||||||||||||||
| Deferred revenue - Project reimbursements - MPC | Deferred revenue - Project reimbursements - MPC | 48 | 30 | |||||||||||||||
| Deferred revenue - Project reimbursements - Other | Deferred revenue - Project reimbursements - Other | 1 | 1 | |||||||||||||||
| Total | Total | 1,706 | 356 | |||||||||||||||
| Long-term liabilities - related parties | Long-term liabilities - related parties | |||||||||||||||||
| Long-term operating lease liabilities - MPC | Long-term operating lease liabilities - MPC | 228 | 229 | |||||||||||||||
| Long-term deferred revenue - Project reimbursements - MPC | Long-term deferred revenue - Project reimbursements - MPC | 62 | 47 | |||||||||||||||
| Long-term deferred revenue - Project reimbursements - Other | Long-term deferred revenue - Project reimbursements - Other | 7 | 7 | |||||||||||||||
| Total | Total | $ | 297 | $ | 283 | |||||||||||||
| Three Months Ended September 30, | Nine Months Ended September 30, | ||||||||||||||
| (In millions) | 2017 | 2016 | 2017 | 2016 | |||||||||||
| Net income attributable to MPLX LP | $ | 216 | $ | 141 | $ | 556 | $ | 100 | |||||||
Less: Limited partners’ distributions declared on Preferred units(1) | 16 | 16 | 49 | 25 | |||||||||||
General partner’s distributions declared (including IDRs)(1) | 88 | 54 | 229 | 148 | |||||||||||
Limited partners’ distributions declared on common units(1) | 232 | 179 | 648 | 507 | |||||||||||
| Undistributed net loss attributable to MPLX LP | $ | (120 | ) | $ | (108 | ) | $ | (370 | ) | $ | (580 | ) | |||
| Three Months Ended September 30, 2017 | |||||||||||||||
| (In millions, except per unit data) | General Partner | Limited Partners’ Common Units | Redeemable Preferred Units | Total | |||||||||||
| Basic and diluted net income attributable to MPLX LP per unit: | |||||||||||||||
| Net income attributable to MPLX LP: | |||||||||||||||
| Distributions declared (including IDRs) | $ | 88 | $ | 232 | $ | 16 | $ | 336 | |||||||
| Undistributed net loss attributable to MPLX LP | (2 | ) | (118 | ) | — | (120 | ) | ||||||||
Net income attributable to MPLX LP(1) | $ | 86 | $ | 114 | $ | 16 | $ | 216 | |||||||
| Weighted average units outstanding: | |||||||||||||||
| Basic | 8 | 394 | 31 | 433 | |||||||||||
| Diluted | 8 | 395 | 31 | 434 | |||||||||||
| Net income attributable to MPLX LP per limited partner unit: | |||||||||||||||
| Basic | $ | 0.29 | |||||||||||||
| Diluted | $ | 0.29 | |||||||||||||
| Three Months Ended September 30, 2016 | |||||||||||||||
| (In millions, except per unit data) | General Partner | Limited Partners’ Common Units | Redeemable Preferred Units | Total | |||||||||||
| Basic and diluted net income attributable to MPLX LP per unit: | |||||||||||||||
| Net income attributable to MPLX LP: | |||||||||||||||
| Distributions declared (including IDRs) | $ | 54 | $ | 179 | $ | 16 | $ | 249 | |||||||
| Undistributed net loss attributable to MPLX LP | (3 | ) | (105 | ) | — | (108 | ) | ||||||||
Net income attributable to MPLX LP(1) | $ | 51 | $ | 74 | $ | 16 | $ | 141 | |||||||
| Weighted average units outstanding: | |||||||||||||||
| Basic | 7 | 341 | 31 | 379 | |||||||||||
| Diluted | 7 | 346 | 31 | 384 | |||||||||||
| Net income attributable to MPLX LP per limited partner unit: | |||||||||||||||
| Basic | $ | 0.22 | |||||||||||||
| Diluted | $ | 0.21 | |||||||||||||
| Nine Months Ended September 30, 2017 | |||||||||||||||
| (In millions, except per unit data) | General Partner | Limited Partners’ Common Units | Redeemable Preferred Units | Total | |||||||||||
| Basic and diluted net income attributable to MPLX LP per unit: | |||||||||||||||
| Net income attributable to MPLX LP: | |||||||||||||||
| Distributions declared (including IDRs) | $ | 229 | $ | 648 | $ | 49 | $ | 926 | |||||||
| Undistributed net loss attributable to MPLX LP | (7 | ) | (363 | ) | — | (370 | ) | ||||||||
Net income attributable to MPLX LP(1) | $ | 222 | $ | 285 | $ | 49 | $ | 556 | |||||||
| Weighted average units outstanding: | |||||||||||||||
| Basic | 8 | 378 | 31 | 417 | |||||||||||
| Diluted | 8 | 381 | 31 | 420 | |||||||||||
| Net income attributable to MPLX LP per limited partner unit: | |||||||||||||||
| Basic | $ | 0.75 | |||||||||||||
| Diluted | $ | 0.75 | |||||||||||||
| Nine Months Ended September 30, 2016 | |||||||||||||||
| (In millions, except per unit data) | General Partner | Limited Partners’ Common Units | Redeemable Preferred Units | Total | |||||||||||
| Basic and diluted net loss attributable to MPLX LP per unit: | |||||||||||||||
| Net income (loss) attributable to MPLX LP: | |||||||||||||||
| Distributions declared (including IDRs) | $ | 148 | $ | 507 | $ | 25 | $ | 680 | |||||||
| Undistributed net loss attributable to MPLX LP | (12 | ) | (568 | ) | — | (580 | ) | ||||||||
Net income (loss) attributable to MPLX LP(1) | $ | 136 | $ | (61 | ) | $ | 25 | $ | 100 | ||||||
| Weighted average units outstanding: | |||||||||||||||
| Basic | 7 | 324 | 16 | 347 | |||||||||||
| Diluted | 7 | 324 | 16 | 347 | |||||||||||
| Net loss attributable to MPLX LP per limited partner unit: | |||||||||||||||
| Basic | $ | (0.19 | ) | ||||||||||||
| Diluted | $ | (0.19 | ) | ||||||||||||
The changes in the number of common units outstanding during the nine months ended September 30, 20172021 are summarized below:
| (In units) | Common | Class B | General Partner | Total | |||||||
| Balance at December 31, 2016 | 357,193,288 | 3,990,878 | 7,371,105 | 368,555,271 | |||||||
Unit-based compensation awards(1) | 183,509 | — | 3,745 | 187,254 | |||||||
Issuance of units under the ATM Program(2) | 13,846,998 | — | 282,591 | 14,129,589 | |||||||
Contribution of HST/WHC/MPLXT(3) | 12,960,376 | — | 264,497 | 13,224,873 | |||||||
Contribution of the Joint-Interest Acquisition(3) | 18,511,134 | — | 377,778 | 18,888,912 | |||||||
Class B conversion(4) | 4,350,057 | (3,990,878 | ) | 7,330 | 366,509 | ||||||
| Balance at September 30, 2017 | 407,045,362 | — | 8,307,046 | 415,352,408 | |||||||
| Balance at September 30, 2021 | 1,021,427,850 | ||||||||||||||||||||||
Unit Repurchase Program
On November 2, 2020, MPLX announced the board authorization of a unit repurchase program for the repurchase of up to $1 billion of MPLX’s outstanding common units held by the public. MPLX may utilize various methods to effect the repurchases, which could include open market repurchases, negotiated block transactions, tender offers, accelerated unit repurchases or open market solicitations for units, some of which may be effected through Rule 10b5-1 plans. The timing and
15
amount of repurchases will depend upon several factors, including market and business conditions, and repurchases may be initiated, suspended or discontinued at any time. The repurchase authorization has no expiration date. During the nine months ended September 1, 2016, the Partnership30, 2021, we repurchased 17,563,855 common units at an average cost per unit of $26.79 and various affiliates initiated a seriespaid $465 million of reorganization transactionscash, with an additional $5 million of cash paid in order to simplify the Partnership’s ownership structure and its financial and tax reporting requirements. Inearly October in connection with these transactions, the issued andsettlement of certain late September purchases. As of September 30, 2021, we had $497 million remaining under our repurchase authorization.
Series B Preferred Units
MPLX has outstanding MPLX LP Class A600,000 units all of which were held by MarkWest Hydrocarbon, were either distributed to or purchased by MPC in exchange for $84 million in cash, 21,401,137 MPLX LP common units and 436,758 MPLX LP general partner units. Following these initial transactions, all of the MPLX LP Class A units were exchanged on a one-for-one basis for newly issued common units6.875 percent Fixed-to-Floating Rate Cumulative Redeemable Perpetual Preferred Units representing limited partner interests of MPLX with a price to the public of $1,000 per unit (the “Series B preferred units”). The Series B preferred units are pari passu with the Series A preferred units with respect to distribution rights and rights upon liquidation. Series B preferred unitholders are entitled to receive a fixed distribution of $68.75 per unit, per annum, payable semi-annually in MPLX LP. MPC also contributed $141 millionarrears on the 15th day, or the first business day thereafter, of February and August of each year up to facilitateand including February 15, 2023. After February 15, 2023, the repaymentholders of intercompany debt between MarkWest HydrocarbonSeries B preferred units are entitled to receive cumulative, quarterly distributions payable in arrears on the 15th day of February, May, August and MarkWest. As a resultNovember of these transactions,each year, or the MPLX LP Class A units were eliminated, are no longer outstanding and no longer participate in distributions of cash from the Partnership. Cash that is derived from or attributable to MarkWest Hydrocarbon’s operations is now treated in the same manner as cash derived from or attributable to other operations of the Partnership and its subsidiaries.
| Three Months Ended September 30, | Nine Months Ended September 30, | ||||||||||||||
| (In millions) | 2017 | 2016 | 2017 | 2016 | |||||||||||
| Net income attributable to MPLX LP | $ | 216 | $ | 141 | $ | 556 | $ | 100 | |||||||
| Less: Preferred unit distributions | 16 | 16 | 49 | 25 | |||||||||||
| General partner's IDRs and other | 83 | 49 | 216 | 137 | |||||||||||
| Net income (loss) attributable to MPLX LP available to general and limited partners | $ | 117 | $ | 76 | $ | 291 | $ | (62 | ) | ||||||
| General partner's two percent GP Interest in net income (loss) attributable to MPLX LP | $ | 3 | $ | 2 | $ | 6 | $ | (1 | ) | ||||||
| General partner's IDRs and other | 83 | 49 | 216 | 137 | |||||||||||
| General partner's GP Interest in net income attributable to MPLX LP | $ | 86 | $ | 51 | $ | 222 | $ | 136 | |||||||
Cash distributions–The Partnership Agreement sets forth the calculation to be used to determine the amount and priority of cash distributions that the common unitholders, Preferred unitholders and general partner will receive. In accordance with the Partnership Agreement, on October 25, 2017, the PartnershipOn November 2, 2021, MPLX declared a quarterly cash distribution based on the results offor the third quarter of 2017,2021, totaling $320$1,305 million, or $0.5875$1.28 per common unit. These distributionsunit, consisting of a base distribution amount of $0.705 per common unit and a special distribution amount of $0.575 per common unit (the “Special Distribution Amount”). This distribution will be paid on November 14, 201719, 2021 to common unitholders of record on November 6, 2017.12, 2021. This rate will also be received by Series A preferred unitholders.
Quarterly distributions for 2021 and 2020 are summarized below:
| (Per common unit) | 2021 | 2020 | |||||||||
| March 31, | $ | 0.6875 | $ | 0.6875 | |||||||
| June 30, | 0.6875 | 0.6875 | |||||||||
| September 30, | $ | 1.2800 | $ | 0.6875 | |||||||
In accordance with the distribution rights discussed above, MPLX made a cash distribution totaling $21 million to Series B unitholders on August 16, 2021.
The allocation of total quarterly cash distributions to general, limited and Preferredpreferred unitholders is as follows for the three and nine months ended September 30, 20172021 and 2016. The Partnership’s2020. Distributions, although earned, are not accrued until declared. MPLX’s distributions are declared subsequent to quarter end; therefore, the following table represents total cash distributions applicable to the period in which the distributions were earned.
| Three Months Ended September 30, | Nine Months Ended September 30, | ||||||||||||||||||||||
| (In millions) | 2021 | 2020 | 2021 | 2020 | |||||||||||||||||||
| Common and preferred unit distributions: | |||||||||||||||||||||||
Common unitholders, includes common units of general partner (1) | $ | 1,305 | $ | 715 | $ | 2,717 | $ | 2,158 | |||||||||||||||
Series A preferred unit distributions (1) | 38 | 20 | 79 | 61 | |||||||||||||||||||
| Series B preferred unit distributions | 10 | 10 | 31 | 31 | |||||||||||||||||||
| Total cash distributions declared | $ | 1,353 | $ | 745 | $ | 2,827 | $ | 2,250 | |||||||||||||||
(1) 2021 periods include the Special Distribution Amount.
16
| Three Months Ended September 30, | Nine Months Ended September 30, | ||||||||||||||
| (In millions) | 2017 | 2016 | 2017 | 2016 | |||||||||||
| General partner's distributions: | |||||||||||||||
| General partner's distributions on general partner units | $ | 7 | $ | 5 | $ | 18 | $ | 13 | |||||||
| General partner's distributions on IDRs | 81 | 49 | 211 | 135 | |||||||||||
| Total distribution on general partner units and IDRs | $ | 88 | $ | 54 | $ | 229 | $ | 148 | |||||||
| Common and preferred unit distributions: | |||||||||||||||
| Common unitholders, includes common units of general partner | $ | 232 | $ | 179 | $ | 648 | $ | 507 | |||||||
| Preferred unit distributions | 16 | 16 | 49 | 25 | |||||||||||
| Total cash distributions declared | $ | 336 | $ | 249 | $ | 926 | $ | 680 | |||||||
7. Net Income/(Loss) Per Limited Partner Unit
Net income/(loss) per unit applicable to common units is computed by dividing net income/(loss) attributable to MPLX LP less income/(loss) allocated to participating securities by the weighted average number of common units outstanding.
During the three and nine months ended September 30, 2021 and 2020, MPLX had participating securities consisting of common units, certain equity-based compensation awards, Series A preferred units and Series B preferred units and had dilutive potential common units consisting of certain equity-based compensation awards. Potential common units omitted from the diluted earnings per unit calculation for the three and nine months ended September 30, 2021 and 2020 were less than 1 million.
| Three Months Ended September 30, | Nine Months Ended September 30, | ||||||||||||||||||||||
| (In millions) | 2021 | 2020 | 2021 | 2020 | |||||||||||||||||||
| Net income/(loss) attributable to MPLX LP | $ | 802 | $ | 665 | $ | 2,247 | $ | (1,411) | |||||||||||||||
Less: Distributions declared on Series A preferred units(1) | 38 | 20 | 79 | 61 | |||||||||||||||||||
| Distributions declared on Series B preferred units | 10 | 10 | 31 | 31 | |||||||||||||||||||
Limited partners’ distributions declared on MPLX common units (including common units of general partner)(1) | 1,305 | 715 | 2,717 | 2,158 | |||||||||||||||||||
| Undistributed net loss attributable to MPLX LP | $ | (551) | $ | (80) | $ | (580) | $ | (3,661) | |||||||||||||||
(1) 2021 periods include the Special Distribution Amount. See Note 6 for distribution information.
| Three Months Ended September 30, 2021 | |||||||||||||||||||||||||||||||||||
| (In millions, except per unit data) | Limited Partners’ Common Units | Series A Preferred Units | Series B Preferred Units | Total | |||||||||||||||||||||||||||||||
| Basic and diluted net income attributable to MPLX LP per unit | |||||||||||||||||||||||||||||||||||
| Net income attributable to MPLX LP: | |||||||||||||||||||||||||||||||||||
Distributions declared(1) | $ | 1,305 | $ | 38 | $ | 10 | $ | 1,353 | |||||||||||||||||||||||||||
| Undistributed net loss attributable to MPLX LP | (551) | — | — | (551) | |||||||||||||||||||||||||||||||
Net income attributable to MPLX LP(2) | $ | 754 | $ | 38 | $ | 10 | $ | 802 | |||||||||||||||||||||||||||
| Weighted average units outstanding: | |||||||||||||||||||||||||||||||||||
| Basic | 1,024 | ||||||||||||||||||||||||||||||||||
| Diluted | 1,025 | ||||||||||||||||||||||||||||||||||
| Net income attributable to MPLX LP per limited partner unit: | |||||||||||||||||||||||||||||||||||
| Basic | $ | 0.74 | |||||||||||||||||||||||||||||||||
| Diluted | $ | 0.74 | |||||||||||||||||||||||||||||||||
(1) Includes the Special Distribution Amount.
(2) Allocation of net income attributable to MPLX LP assumes all earnings for the period had been distributed based on the distribution priorities applicable to the period.
17
| Three Months Ended September 30, 2020 | |||||||||||||||||||||||
| (In millions, except per unit data) | Limited Partners’ Common Units | Series A Preferred Units | Series B Preferred Units | Total | |||||||||||||||||||
| Basic and diluted net income attributable to MPLX LP per unit | |||||||||||||||||||||||
| Net income attributable to MPLX LP: | |||||||||||||||||||||||
| Distributions declared | $ | 715 | $ | 20 | $ | 10 | $ | 745 | |||||||||||||||
| Undistributed net loss attributable to MPLX LP | (80) | — | — | (80) | |||||||||||||||||||
Net income attributable to MPLX LP(1) | $ | 635 | $ | 20 | $ | 10 | $ | 665 | |||||||||||||||
| Weighted average units outstanding: | |||||||||||||||||||||||
| Basic | 1,046 | ||||||||||||||||||||||
| Diluted | 1,047 | ||||||||||||||||||||||
| Net income attributable to MPLX LP per limited partner unit: | |||||||||||||||||||||||
| Basic | $ | 0.61 | |||||||||||||||||||||
| Diluted | $ | 0.61 | |||||||||||||||||||||
(1) Allocation of net income attributable to MPLX LP assumes all earnings for the period had been distributed based on the distribution priorities applicable to the period.
| Nine Months Ended September 30, 2021 | |||||||||||||||||||||||||||||
| (In millions, except per unit data) | Limited Partners’ Common Units | Series A Preferred Units | Series B Preferred Units | Total | |||||||||||||||||||||||||
| Basic and diluted net income attributable to MPLX LP per unit | |||||||||||||||||||||||||||||
| Net income attributable to MPLX LP: | |||||||||||||||||||||||||||||
Distributions declared(1) | $ | 2,717 | $ | 79 | $ | 31 | $ | 2,827 | |||||||||||||||||||||
| Undistributed net loss attributable to MPLX LP | (580) | — | — | (580) | |||||||||||||||||||||||||
Net income attributable to MPLX LP(2) | $ | 2,137 | $ | 79 | $ | 31 | $ | 2,247 | |||||||||||||||||||||
| Weighted average units outstanding: | |||||||||||||||||||||||||||||
| Basic | 1,030 | ||||||||||||||||||||||||||||
| Diluted | 1,030 | ||||||||||||||||||||||||||||
| Net income attributable to MPLX LP per limited partner unit: | |||||||||||||||||||||||||||||
| Basic | $ | 2.07 | |||||||||||||||||||||||||||
| Diluted | $ | 2.07 | |||||||||||||||||||||||||||
(1) Includes the Special Distribution Amount.
(2) Allocation of net income attributable to MPLX LP assumes all earnings for the period had been distributed based on the distribution priorities applicable to the period.
18
| Nine Months Ended September 30, 2020 | |||||||||||||||||||||||
| (In millions, except per unit data) | Limited Partners’ Common Units | Series A Preferred Units | Series B Preferred Units | Total | |||||||||||||||||||
| Basic and diluted net income attributable to MPLX LP per unit | |||||||||||||||||||||||
| Net income attributable to MPLX LP: | |||||||||||||||||||||||
| Distributions declared | $ | 2,158 | $ | 61 | $ | 31 | $ | 2,250 | |||||||||||||||
| Undistributed net loss attributable to MPLX LP | (3,661) | — | — | (3,661) | |||||||||||||||||||
Net (loss)/income attributable to MPLX LP(1) | $ | (1,503) | $ | 61 | $ | 31 | $ | (1,411) | |||||||||||||||
| Weighted average units outstanding: | |||||||||||||||||||||||
| Basic | 1,054 | ||||||||||||||||||||||
| Diluted | 1,054 | ||||||||||||||||||||||
| Net income attributable to MPLX LP per limited partner unit: | |||||||||||||||||||||||
| Basic | $ | (1.43) | |||||||||||||||||||||
| Diluted | $ | (1.43) | |||||||||||||||||||||
(1) Allocation of net income attributable to MPLX LP assumes all earnings for the period had been distributed based on the distribution priorities applicable to the period.
8. RedeemableSeries A Preferred Units
The changes in the redeemable preferred balance from December 31, 20162020 through September 30, 20172021 are summarized below:
| (In millions) | Redeemable Series A Preferred Units | ||||
| Balance at December 31, 2020 | $ | 968 | |||
Net income allocated (1) | 79 | ||||
| Distributions received by Series A preferred unitholders | (61) | ||||
| Balance at September 30, 2021 | $ | 986 | |||
| (In millions) | Redeemable Preferred Units | ||
| Balance at December 31, 2016 | $ | 1,000 | |
| Net income | 49 | ||
| Distributions received by Preferred unitholders | (49 | ) | |
| Balance at September 30, 2017 | $ | 1,000 | |
9. Segment Information
•L&S – transports, stores, distributes and distributesmarkets crude oil, andasphalt, refined petroleum products. Segment information for prior periodsproducts and water. Also includes retrospective adjustments in connection with the acquisition of HST, WHCan inland marine business, terminals, rail facilities, storage caverns and MPLXT. Segment information is not included for periods prior to the Joint-Interest Acquisition and the Ozark pipeline acquisition. See Note 3 for more detail of these acquisitions.refining logistics.
•G&P – gathers, processes and transports natural gas; and gathers, transports, fractionates, stores and markets NGLs.
19
The tables below present information about revenues and other income, from operations andSegment Adjusted EBITDA, restructuring expenses, capital expenditures for the reported segments:
| Three Months Ended September 30, 2017 | |||||||||||
| (In millions) | L&S | G&P | Total | ||||||||
| Revenues and other income: | |||||||||||
| Segment revenues | $ | 378 | $ | 669 | $ | 1,047 | |||||
| Segment other income | 11 | 1 | 12 | ||||||||
| Total segment revenues and other income | 389 | 670 | 1,059 | ||||||||
| Costs and expenses: | |||||||||||
| Segment cost of revenues | 176 | 276 | 452 | ||||||||
| Segment operating income before portion attributable to noncontrolling interests and Predecessor | 213 | 394 | 607 | ||||||||
| Segment portion attributable to noncontrolling interests and Predecessor | — | 45 | 45 | ||||||||
| Segment operating income attributable to MPLX LP | $ | 213 | $ | 349 | $ | 562 | |||||
| Three Months Ended September 30, 2016 | |||||||||||
| (In millions) | L&S | G&P | Total | ||||||||
| Revenues and other income: | |||||||||||
| Segment revenues | $ | 339 | $ | 567 | $ | 906 | |||||
| Segment other income | 12 | 1 | 13 | ||||||||
| Total segment revenues and other income | 351 | 568 | 919 | ||||||||
| Costs and expenses: | |||||||||||
| Segment cost of revenues | 153 | 239 | 392 | ||||||||
| Segment operating income before portion attributable to noncontrolling interests and Predecessor | 198 | 329 | 527 | ||||||||
| Segment portion attributable to noncontrolling interests and Predecessor | 74 | 36 | 110 | ||||||||
| Segment operating income attributable to MPLX LP | $ | 124 | $ | 293 | $ | 417 | |||||
| Nine Months Ended September 30, 2017 | |||||||||||
| (In millions) | L&S | G&P | Total | ||||||||
| Revenues and other income: | |||||||||||
| Segment revenues | $ | 1,095 | $ | 1,869 | $ | 2,964 | |||||
| Segment other income | 35 | 2 | 37 | ||||||||
| Total segment revenues and other income | 1,130 | 1,871 | 3,001 | ||||||||
| Costs and expenses: | |||||||||||
| Segment cost of revenues | 500 | 781 | 1,281 | ||||||||
| Segment operating income before portion attributable to noncontrolling interests and Predecessor | 630 | 1,090 | 1,720 | ||||||||
| Segment portion attributable to noncontrolling interests and Predecessor | 53 | 119 | 172 | ||||||||
| Segment operating income attributable to MPLX LP | $ | 577 | $ | 971 | $ | 1,548 | |||||
| Nine Months Ended September 30, 2016 | |||||||||||
| (In millions) | L&S | G&P | Total | ||||||||
| Revenues and other income: | |||||||||||
| Segment revenues | $ | 901 | $ | 1,595 | $ | 2,496 | |||||
| Segment other income | 42 | 1 | 43 | ||||||||
| Total segment revenues and other income | 943 | 1,596 | 2,539 | ||||||||
| Costs and expenses: | |||||||||||
| Segment cost of revenues | 392 | 662 | 1,054 | ||||||||
| Segment operating income before portion attributable to noncontrolling interests and Predecessor | 551 | 934 | 1,485 | ||||||||
| Segment portion attributable to noncontrolling interests and Predecessor | 216 | 113 | 329 | ||||||||
| Segment operating income attributable to MPLX LP | $ | 335 | $ | 821 | $ | 1,156 | |||||
| Three Months Ended September 30, | Nine Months Ended September 30, | ||||||||||||||
| (In millions) | 2017 | 2016 | 2017 | 2016 | |||||||||||
| Reconciliation to Income from operations: | |||||||||||||||
| L&S segment operating income attributable to MPLX LP | $ | 213 | $ | 124 | $ | 577 | $ | 335 | |||||||
| G&P segment operating income attributable to MPLX LP | 349 | 293 | 971 | 821 | |||||||||||
| Segment operating income attributable to MPLX LP | 562 | 417 | 1,548 | 1,156 | |||||||||||
| Segment portion attributable to unconsolidated affiliates | (47 | ) | (41 | ) | (125 | ) | (130 | ) | |||||||
| Segment portion attributable to Predecessor | — | 74 | 53 | 216 | |||||||||||
| Income (loss) from equity method investments | 23 | 6 | 29 | (72 | ) | ||||||||||
| Other income - related parties | 13 | 11 | 38 | 29 | |||||||||||
Unrealized derivative (losses) gains(1) | (17 | ) | (2 | ) | 2 | (23 | ) | ||||||||
| Depreciation and amortization | (164 | ) | (151 | ) | (515 | ) | (438 | ) | |||||||
| Impairment expense | — | — | — | (130 | ) | ||||||||||
| General and administrative expenses | (59 | ) | (56 | ) | (174 | ) | (172 | ) | |||||||
| Income from operations | $ | 311 | $ | 258 | $ | 856 | $ | 436 | |||||||
| Three Months Ended September 30, | Nine Months Ended September 30, | ||||||||||||||
| (In millions) | 2017 | 2016 | 2017 | 2016 | |||||||||||
| Reconciliation to Total revenues and other income: | |||||||||||||||
| Total segment revenues and other income | $ | 1,059 | $ | 919 | $ | 3,001 | $ | 2,539 | |||||||
| Revenue adjustment from unconsolidated affiliates | (107 | ) | (100 | ) | (287 | ) | (303 | ) | |||||||
| Income (loss) from equity method investments | 23 | 6 | 29 | (72 | ) | ||||||||||
| Other income - related parties | 13 | 11 | 38 | 29 | |||||||||||
Unrealized derivative (losses) gains related to product sales(1) | (8 | ) | 2 | 1 | (12 | ) | |||||||||
| Total revenues and other income | $ | 980 | $ | 838 | $ | 2,782 | $ | 2,181 | |||||||
| Three Months Ended September 30, | Nine Months Ended September 30, | ||||||||||||||
| (In millions) | 2017 | 2016 | 2017 | 2016 | |||||||||||
| Reconciliation to Net income attributable to noncontrolling interests and Predecessor: | |||||||||||||||
| Segment portion attributable to noncontrolling interests and Predecessor | $ | 45 | $ | 110 | $ | 172 | $ | 329 | |||||||
| Portion of noncontrolling interests and Predecessor related to items below segment income from operations | (21 | ) | (39 | ) | (84 | ) | (157 | ) | |||||||
| Portion of operating income attributable to noncontrolling interests of unconsolidated affiliates | (23 | ) | (18 | ) | (49 | ) | (20 | ) | |||||||
| Net income attributable to noncontrolling interests and Predecessor | $ | 1 | $ | 53 | $ | 39 | $ | 152 | |||||||
| Three Months Ended September 30, | Nine Months Ended September 30, | ||||||||||||||
| (In millions) | 2017 | 2016 | 2017 | 2016 | |||||||||||
| L&S segment capital expenditures | $ | 120 | $ | 188 | $ | 353 | $ | 369 | |||||||
| G&P segment capital expenditures | 333 | 183 | 957 | 668 | |||||||||||
| Total segment capital expenditures | 453 | 371 | 1,310 | 1,037 | |||||||||||
| Less: Capital expenditures for Partnership-operated, non-wholly-owned subsidiaries in G&P segment | 101 | 34 | 306 | 94 | |||||||||||
| Total capital expenditures | $ | 352 | $ | 337 | $ | 1,004 | $ | 943 | |||||||
| (In millions) | September 30, 2017 | December 31, 2016 | |||||
| Cash and cash equivalents | $ | 3 | $ | 234 | |||
| L&S | 4,520 | 2,978 | |||||
| G&P | 14,715 | 14,297 | |||||
| Total assets | $ | 19,238 | $ | 17,509 | |||
| (In millions) | September 30, 2017 | December 31, 2016 | |||||
| NGLs | $ | 3 | $ | 2 | |||
| Line fill | 9 | 9 | |||||
| Spare parts, materials and supplies | 52 | 44 | |||||
| Total inventories | $ | 64 | $ | 55 | |||
| (In millions) | September 30, 2017 | December 31, 2016 | |||||
| Natural gas gathering and NGL transportation pipelines and facilities | $ | 5,101 | $ | 4,748 | |||
Processing, fractionation and storage facilities(1) | 3,753 | 3,547 | |||||
| Pipelines and related assets | 2,181 | 1,799 | |||||
| Barges and towing vessels | 484 | 479 | |||||
Terminals and related assets(1) | 794 | 759 | |||||
| Land, building, office equipment and other | 755 | 757 | |||||
| Construction-in-progress | 986 | 1,013 | |||||
| Total | 14,054 | 13,102 | |||||
| Less accumulated depreciation | 2,132 | 1,694 | |||||
| Property, plant and equipment, net | $ | 11,922 | $ | 11,408 | |||
| September 30, 2017 | December 31, 2016 | ||||||||||||||
| (In millions) | Assets | Liabilities | Assets | Liabilities | |||||||||||
| Significant other observable inputs (Level 2) | |||||||||||||||
| Commodity contracts | $ | — | $ | — | $ | — | $ | — | |||||||
| Significant unobservable inputs (Level 3) | |||||||||||||||
| Commodity contracts | — | (5 | ) | — | (6 | ) | |||||||||
| Embedded derivatives in commodity contracts | — | (52 | ) | — | (54 | ) | |||||||||
| Total carrying value in Consolidated Balance Sheets | $ | — | $ | (57 | ) | $ | — | $ | (60 | ) | |||||
| Three Months Ended September 30, | Nine Months Ended September 30, | ||||||||||||||||||||||
| (In millions) | 2021 | 2020 | 2021 | 2020 | |||||||||||||||||||
| L&S | |||||||||||||||||||||||
| Service revenue | $ | 983 | $ | 989 | $ | 2,928 | $ | 2,924 | |||||||||||||||
| Rental income | 172 | 249 | 597 | 737 | |||||||||||||||||||
| Product related revenue | 3 | 9 | 11 | 49 | |||||||||||||||||||
| Sales-type lease revenue - related parties | 132 | 38 | 305 | 114 | |||||||||||||||||||
| Income from equity method investments | 41 | 36 | 112 | 126 | |||||||||||||||||||
| Other income | 15 | 13 | 46 | 40 | |||||||||||||||||||
Total segment revenues and other income(1) | 1,346 | 1,334 | 3,999 | 3,990 | |||||||||||||||||||
Segment Adjusted EBITDA(2) | 904 | 893 | 2,747 | 2,604 | |||||||||||||||||||
| Restructuring expenses | — | 27 | — | 27 | |||||||||||||||||||
| Capital expenditures | 85 | 118 | 220 | 410 | |||||||||||||||||||
| Investments in unconsolidated affiliates | 9 | 4 | 31 | 132 | |||||||||||||||||||
| G&P | |||||||||||||||||||||||
| Service revenue | 519 | 524 | 1,520 | 1,549 | |||||||||||||||||||
| Rental income | 80 | 94 | 263 | 271 | |||||||||||||||||||
| Product related revenue | 553 | 234 | 1,357 | 607 | |||||||||||||||||||
| Income/(loss) from equity method investments | 51 | 47 | 116 | (1,138) | |||||||||||||||||||
| Other income | 10 | 14 | 38 | 41 | |||||||||||||||||||
Total segment revenues and other income(1) | 1,213 | 913 | 3,294 | 1,330 | |||||||||||||||||||
Segment Adjusted EBITDA(2) | 485 | 442 | 1,368 | 1,252 | |||||||||||||||||||
| Restructuring expenses | — | 9 | — | 9 | |||||||||||||||||||
| Capital expenditures | 69 | 131 | 135 | 375 | |||||||||||||||||||
| Investments in unconsolidated affiliates | $ | 23 | $ | 18 | $ | 85 | $ | 112 | |||||||||||||||
(1) Within the historical relationships between forward NGLtotal segment revenues and natural gas prices and the forward market data that is availableother income amounts presented above, third party revenues for the required period, such as crude oil pricingL&S segment were $138 million and natural gas pricing from other markets. However, there is very limited actual market data available to validate the Risk Department’s estimated price curves. Management also assesses the probability of the producer customer’s renewal of the contracts, which includes consideration of:
(2) See below for assets and liabilities classified by the Partnership within Level 3 of the valuation hierarchy.reconciliation from Segment Adjusted EBITDA to “Net income/(loss).”
| (In millions) | September 30, 2021 | December 31, 2020 | |||||||||
| Segment assets | |||||||||||
| Cash and cash equivalents | $ | 39 | $ | 15 | |||||||
| L&S | 20,729 | 20,938 | |||||||||
| G&P | 14,931 | 15,461 | |||||||||
| Total assets | $ | 35,699 | $ | 36,414 | |||||||
20
| Three Months Ended September 30, 2017 | Nine Months Ended September 30, 2017 | ||||||||||||||
| (In millions) | Commodity Derivative Contracts (net) | Embedded Derivatives in Commodity Contracts (net) | Commodity Derivative Contracts (net) | Embedded Derivatives in Commodity Contracts (net) | |||||||||||
| Fair value at beginning of period | $ | 2 | $ | (43 | ) | $ | (6 | ) | $ | (54 | ) | ||||
Total losses (realized and unrealized) included in earnings(1) | (10 | ) | (12 | ) | (3 | ) | (4 | ) | |||||||
| Settlements | 3 | 3 | 4 | 6 | |||||||||||
| Fair value at end of period | $ | (5 | ) | $ | (52 | ) | $ | (5 | ) | $ | (52 | ) | |||
| The amount of total losses for the period included in earnings attributable to the change in unrealized losses relating to liabilities still held at end of period | $ | (7 | ) | $ | (10 | ) | $ | (4 | ) | $ | (4 | ) | |||
| Three Months Ended September 30, 2016 | Nine Months Ended September 30, 2016 | ||||||||||||||
| (In millions) | Commodity Derivative Contracts (net) | Embedded Derivatives in Commodity Contracts (net) | Commodity Derivative Contracts (net) | Embedded Derivatives in Commodity Contracts (net) | |||||||||||
| Fair value at beginning of period | $ | (4 | ) | $ | (40 | ) | $ | 7 | $ | (32 | ) | ||||
Total gains (losses) (realized and unrealized) included in earnings(1) | 2 | (6 | ) | (5 | ) | (17 | ) | ||||||||
| Settlements | (1 | ) | 2 | (6 | ) | 5 | |||||||||
Netting adjustment(2) | — | — | 1 | — | |||||||||||
| Fair value at end of period | $ | (3 | ) | $ | (44 | ) | $ | (3 | ) | $ | (44 | ) | |||
| The amount of total losses for the period included in earnings attributable to the change in unrealized losses relating to liabilities still held at end of period | $ | — | $ | (4 | ) | $ | (4 | ) | $ | (15 | ) | ||||
The fair value oftable below provides a reconciliation between “Net income/(loss)” and Segment Adjusted EBITDA.
| Three Months Ended September 30, | Nine Months Ended September 30, | ||||||||||||||||||||||
| (In millions) | 2021 | 2020 | 2021 | 2020 | |||||||||||||||||||
| Reconciliation to Net income/(loss): | |||||||||||||||||||||||
| L&S Segment Adjusted EBITDA | $ | 904 | $ | 893 | $ | 2,747 | $ | 2,604 | |||||||||||||||
| G&P Segment Adjusted EBITDA | 485 | 442 | 1,368 | 1,252 | |||||||||||||||||||
| Total reportable segments | 1,389 | 1,335 | 4,115 | 3,856 | |||||||||||||||||||
Depreciation and amortization(1) | (324) | (346) | (971) | (992) | |||||||||||||||||||
| Provision for income taxes | — | (1) | (1) | (1) | |||||||||||||||||||
| Amortization of deferred financing costs | (18) | (15) | (53) | (44) | |||||||||||||||||||
| Non-cash equity-based compensation | (1) | (4) | (6) | (12) | |||||||||||||||||||
| Impairment expense | — | — | (42) | (2,165) | |||||||||||||||||||
| Net interest and other financial costs | (200) | (223) | (618) | (647) | |||||||||||||||||||
| Gain on extinguishment of debt | (2) | 14 | 10 | 14 | |||||||||||||||||||
| Income/(loss) from equity method investments | 92 | 83 | 228 | (1,012) | |||||||||||||||||||
| Distributions/adjustments related to equity method investments | (129) | (130) | (371) | (369) | |||||||||||||||||||
Unrealized derivative losses(2) | (2) | (10) | (41) | (1) | |||||||||||||||||||
| Restructuring expenses | — | (36) | — | (36) | |||||||||||||||||||
| Other | (3) | (3) | (5) | (5) | |||||||||||||||||||
| Adjusted EBITDA attributable to noncontrolling interests | 9 | 10 | 29 | 27 | |||||||||||||||||||
| Net income/(loss) | $ | 811 | $ | 674 | $ | 2,274 | $ | (1,387) | |||||||||||||||
(1) Depreciation and amortization attributable to L&S was $131 million and $414 million for the Partnership’s long-term debt is estimated based on recent market non-binding indicative quotes. The fair value ofthree and nine months ended September 30, 2021, respectively, and $164 million and $440 million for the SMR liability is estimated using a discounted cash flow approach based onthree and nine months ended September 30, 2020, respectively. Depreciation and amortization attributable to G&P was $193 million and $557 million for the contractual cash flowsthree and nine months ended September 30, 2021, respectively, and $182 million and $552 million for the Partnership’s unsecured borrowing rate. The long-term debtthree and SMR liability fair values are considered Level 3 measurements. The following table summarizes the fair value and carrying value of the long-term debt, excluding capital leases, and SMR liability:nine months ended September 30, 2020, respectively.
| September 30, 2017 | December 31, 2016 | ||||||||||||||
| (In millions) | Fair Value | Carrying Value | Fair Value | Carrying Value | |||||||||||
| Long-term debt | $ | 7,619 | $ | 6,869 | $ | 4,953 | $ | 4,422 | |||||||
| SMR liability | 106 | 92 | 108 | 96 | |||||||||||
10. Inventories
Inventories consist of Commoditythe following:
| (In millions) | September 30, 2021 | December 31, 2020 | |||||||||
| NGLs | $ | 10 | $ | 5 | |||||||
| Line fill | 24 | 13 | |||||||||
| Spare parts, materials and supplies | 107 | 100 | |||||||||
| Total inventories | $ | 141 | $ | 118 | |||||||
21
11. Property, Plant and Equipment
Property, plant and equipment with associated accumulated depreciation is shown below:
| September 30, 2021 | December 31, 2020 | ||||||||||||||||||||||||||||||||||||||||
| (In millions) | Gross PP&E | Accumulated Depreciation | Net PP&E | Gross PP&E | Accumulated Depreciation | Net PP&E | |||||||||||||||||||||||||||||||||||
| L&S | $ | 12,296 | $ | 3,108 | $ | 9,188 | $ | 12,813 | $ | 2,997 | $ | 9,816 | |||||||||||||||||||||||||||||
| G&P | 14,115 | 3,145 | 10,970 | 14,062 | 2,660 | 11,402 | |||||||||||||||||||||||||||||||||||
| Total | $ | 26,411 | $ | 6,253 | $ | 20,158 | $ | 26,875 | $ | 5,657 | $ | 21,218 | |||||||||||||||||||||||||||||
Long-lived assets used in operations are assessed for impairment whenever changes in facts and circumstances indicate that the carrying value of the assets may not be recoverable based on the expected undiscounted future cash flow of an asset group. For purposes of impairment evaluation, long-lived assets must be grouped at the lowest level for which independent cash flows can be identified, which is at least at the segment level and in some cases for similar assets in the same geographic region where cash flows can be separately identified. If the sum of the undiscounted cash flows is less than the carrying value of an asset group, fair value is calculated, and the carrying value is written down if greater than the calculated fair value.
During the first quarter of 2020, we identified an impairment trigger relating to asset groups within our Western G&P reporting unit as a result of significant impacts to forecasted cash flows for these asset groups resulting from the first quarter of 2020 events and circumstances as discussed in Note 1. The cash flows associated with these assets were significantly impacted by volume declines reflecting decreased forecasted producer customer production as a result of lower commodity prices. After assessing each asset group within the Western G&P reporting unit for impairment, only the East Texas G&P asset group resulted in the fair value of the underlying assets being less than the carrying value. As a result, an impairment of $174 million was recorded to “Impairment expense” on the Consolidated Statements of Income in the first quarter of 2020. See Note 1 for discussion of 2021 impairments.
12. Goodwill and Intangibles
Goodwill
During the first quarter of 2020, we performed an interim impairment analysis of the goodwill recorded based on consideration of a number of first quarter events and circumstances as discussed in Note 1. Our producer customers in our Eastern G&P region reduced production forecasts and drilling activity in response to the global economic downturn. Additionally, a decline in NGL prices impacted our future revenue forecast. As a result of the interim impairment analysis, we recorded an impairment of $1,814 million within the Eastern G&P reporting unit, which was recorded to “Impairment expense” on the Consolidated Statements of Income. The impairment was primarily driven by additional guidance related to the slowing of drilling activity, which reduced production growth forecasts from our producer customers.
Changes in the carrying amount of goodwill were as follows:
| (In millions) | L&S | G&P | Total | ||||||||||||||
| Gross goodwill as of December 31, 2019 | $ | 7,722 | $ | 3,141 | $ | 10,863 | |||||||||||
| Accumulated impairment losses | — | (1,327) | (1,327) | ||||||||||||||
| Balance as of December 31, 2019 | 7,722 | 1,814 | 9,536 | ||||||||||||||
| Impairment losses | — | (1,814) | (1,814) | ||||||||||||||
| Wholesale Exchange (Note 3) | (65) | — | (65) | ||||||||||||||
| Balance as of December 31, 2020 | 7,657 | — | 7,657 | ||||||||||||||
| Balance as of September 30, 2021 | 7,657 | — | 7,657 | ||||||||||||||
| Gross goodwill as of September 30, 2021 | 7,657 | 3,141 | 10,798 | ||||||||||||||
| Accumulated impairment losses | — | (3,141) | (3,141) | ||||||||||||||
| Balance as of September 30, 2021 | $ | 7,657 | $ | — | $ | 7,657 | |||||||||||
22
Intangible Assets
During the first quarter of 2020, we also determined that an impairment analysis of intangibles within our Western G&P reporting unit was necessary. See Note 11 for additional information regarding our assessment around the Western G&P reporting unit, and more specifically our East Texas G&P asset group. The fair value of the intangibles in our East Texas G&P asset group was determined based on applying the multi-period excess earnings method, which is an income approach. Key assumptions included management’s best estimates of the expected future cash flows from existing customers, customer attrition rates and the discount rate. After performing our evaluations related to the impairment of intangible assets associated with our East Texas G&P asset group during the first quarter of 2020, we recorded an impairment of $177 million to “Impairment expense” on the Consolidated Statements of Income related to our customer relationships. No additional impairments have been recorded since that time.
13. Fair Value Measurements
Fair Values – Recurring
Fair value measurements and disclosures relate primarily to MPLX’s derivative positions as discussed in Note 14. The following table presents the financial instruments carried at fair value on a recurring basis as of September 30, 2021 and December 31, 2020 by fair value hierarchy level. MPLX has elected to offset the fair value amounts recognized for multiple derivative contracts executed with the same counterparty.
| September 30, 2021 | December 31, 2020 | ||||||||||||||||||||||
| (In millions) | Assets | Liabilities | Assets | Liabilities | |||||||||||||||||||
| Significant unobservable inputs (Level 3) | |||||||||||||||||||||||
| Embedded derivatives in commodity contracts | $ | — | $ | (104) | $ | — | $ | (63) | |||||||||||||||
| Total carrying value on Consolidated Balance Sheets | $ | — | $ | (104) | $ | — | $ | (63) | |||||||||||||||
Level 3 instruments include an embedded derivative in commodity contracts. The embedded derivative liability relates to a natural gas purchase commitment embedded in a keep-whole processing agreement. The fair value calculation for these Level 3 instruments used significant unobservable inputs including: (1) NGL prices interpolated and extrapolated due to inactive markets ranging from $0.68 to $1.80 per gallon with a weighted average of $0.88 per gallon and (2) the probability of renewal of 100 percent for the first five-year term and second five-year term of the gas purchase commitment and related keep-whole processing agreement. Increases or decreases in the fractionation spread result in an increase or decrease in the fair value of the embedded derivative liability, respectively. Beyond the embedded derivative discussed above, we had no outstanding commodity derivative contracts as of September 30, 2021 or December 31, 2020.
Changes in Level 3 Fair Value Measurements
The following table is a reconciliation of the net beginning and ending balances recorded for net assets and liabilities classified as Level 3 in the fair value hierarchy.
| Three Months Ended September 30, 2021 | Three Months Ended September 30, 2020 | ||||||||||||||||||||||||||||||||||
| (In millions) | Commodity Derivative Contracts (net) | Embedded Derivatives in Commodity Contracts (net) | Commodity Derivative Contracts (net) | Embedded Derivatives in Commodity Contracts (net) | |||||||||||||||||||||||||||||||
| Fair value at beginning of period | $ | — | $ | (102) | $ | — | $ | (51) | |||||||||||||||||||||||||||
Total losses (realized and unrealized) included in earnings(1) | — | (7) | — | (12) | |||||||||||||||||||||||||||||||
| Settlements | — | 5 | — | 2 | |||||||||||||||||||||||||||||||
| Fair value at end of period | — | (104) | — | (61) | |||||||||||||||||||||||||||||||
| The amount of total losses for the period included in earnings attributable to the change in unrealized losses relating to liabilities still held at end of period | $ | — | $ | (6) | $ | — | $ | (11) | |||||||||||||||||||||||||||
23
| Nine Months Ended September 30, 2021 | Nine Months Ended September 30, 2020 | ||||||||||||||||||||||
| (In millions) | Commodity Derivative Contracts (net) | Embedded Derivatives in Commodity Contracts (net) | Commodity Derivative Contracts (net) | Embedded Derivatives in Commodity Contracts (net) | |||||||||||||||||||
| Fair value at beginning of period | $ | — | $ | (63) | $ | — | $ | (60) | |||||||||||||||
Total losses (realized and unrealized) included in earnings(1) | — | (52) | — | (5) | |||||||||||||||||||
| Settlements | — | 11 | — | 4 | |||||||||||||||||||
| Fair value at end of period | — | (104) | — | (61) | |||||||||||||||||||
| The amount of total losses for the period included in earnings attributable to the change in unrealized losses relating to liabilities still held at end of period | $ | — | $ | (44) | $ | — | $ | (2) | |||||||||||||||
(1) Gains and losses on derivatives embedded in commodity contracts are recorded in “Purchased product costs” on the Consolidated Statements of Income.
Fair Values – Reported
MPLX’s primary financial instruments are cash and cash equivalents, receivables, receivables from related parties, lease receivables from related parties, accounts payable, payables to related parties and debt. MPLX’s fair value assessment incorporates a variety of considerations, including (1) the duration of the instruments, (2) MPC’s investment-grade credit rating and (3) the historical incurrence of and expected future insignificance of bad debt expense, which includes an evaluation of counterparty credit risk. MPLX believes the carrying values of its current assets and liabilities approximate fair value. The recorded value of the amounts outstanding under the bank revolving credit facility, if any, approximate fair value due to the variable interest rate that approximates current market rates. Derivative Activityinstruments are recorded at fair value, based on available market information (see Note 14).
The fair value of MPLX’s debt is estimated based on recent market non-binding indicative quotes. The debt fair values are considered Level 3 measurements. The following table summarizes the fair value and carrying value of our third-party debt, excluding finance leases:
| September 30, 2021 | December 31, 2020 | ||||||||||||||||||||||
| (In millions) | Fair Value | Carrying Value | Fair Value | Carrying Value | |||||||||||||||||||
Outstanding debt(1) | $ | 20,553 | $ | 18,350 | $ | 22,951 | $ | 20,244 | |||||||||||||||
(1) Amounts outstanding under the MPC Loan Agreement are not included in the table above, as the carrying value approximates fair value. This balance is reflected in “Current liabilities - related parties” on the Consolidated Balance Sheets.
14. Derivative Financial Instruments
As of September 30, 2017, the Partnership2021, MPLX had the followingno outstanding commodity contracts that were executed to managebeyond the cash flow risk associated with future sales of NGLs and purchases of natural gas:embedded derivative discussed below.
Embedded Derivatives in Commodity Contracts
24
| (In millions) | September 30, 2017 | December 31, 2016 | ||||||||||||||
| Derivative contracts not designated as hedging instruments and their balance sheet location | Asset | Liability | Asset | Liability | ||||||||||||
Commodity contracts(1) | ||||||||||||||||
| Other current assets / other current liabilities | $ | — | $ | (15 | ) | $ | — | $ | (13 | ) | ||||||
| Other noncurrent assets / deferred credits and other liabilities | — | (42 | ) | — | (47 | ) | ||||||||||
| Total | $ | — | $ | (57 | ) | $ | — | $ | (60 | ) | ||||||
Certain derivative positions are subject to master netting agreements, therefore, the PartnershipMPLX has elected to offset derivative assets and liabilities that are legally permissible to be offset. The net amounts in the table below equal the balances presented inAs of September 30, 2021 and December 31, 2020, there were no derivative assets or liabilities that were offset on the Consolidated Balance Sheets:Sheets. The impact of MPLX’s derivative instruments on its Consolidated Balance Sheets is summarized below:
| September 30, 2017 | |||||||||||||||||||||||
| Assets | Liabilities | ||||||||||||||||||||||
| (In millions) | Gross Amount | Gross Amounts Offset in the Consolidated Balance Sheets | Net Amount of Assets in the Consolidated Balance Sheets | Gross Amount | Gross Amounts Offset in the Consolidated Balance Sheets | Net Amount of Liabilities in the Consolidated Balance Sheets | |||||||||||||||||
| Current | |||||||||||||||||||||||
| Commodity contracts | $ | — | $ | — | $ | — | $ | (5 | ) | $ | — | $ | (5 | ) | |||||||||
| Embedded derivatives in commodity contracts | — | — | — | (10 | ) | — | (10 | ) | |||||||||||||||
| Total current derivative instruments | — | — | — | (15 | ) | — | (15 | ) | |||||||||||||||
| Non-current | |||||||||||||||||||||||
| Commodity contracts | — | — | — | — | — | — | |||||||||||||||||
| Embedded derivatives in commodity contracts | — | — | — | (42 | ) | — | (42 | ) | |||||||||||||||
| Total non-current derivative instruments | — | — | — | (42 | ) | — | (42 | ) | |||||||||||||||
| Total derivative instruments | $ | — | $ | — | $ | — | $ | (57 | ) | $ | — | $ | (57 | ) | |||||||||
| (In millions) | September 30, 2021 | December 31, 2020 | |||||||||||||||||||||
| Derivative contracts not designated as hedging instruments and their balance sheet location | Asset | Liability | Asset | Liability | |||||||||||||||||||
Commodity contracts(1) | |||||||||||||||||||||||
| Other current assets / Other current liabilities | $ | — | $ | (15) | $ | — | $ | (7) | |||||||||||||||
| Other noncurrent assets / Deferred credits and other liabilities | — | (89) | — | (56) | |||||||||||||||||||
| Total | $ | — | $ | (104) | $ | — | $ | (63) | |||||||||||||||
The impact of the Partnership’sMPLX’s derivative contracts not designated as hedging instruments and the location of gain or (loss)gains and losses recognized inon the Consolidated Statements of Income is summarized below:
| Three Months Ended September 30, | Nine Months Ended September 30, | ||||||||||||||||||||||
| (In millions) | 2021 | 2020 | 2021 | 2020 | |||||||||||||||||||
| Purchased product costs | |||||||||||||||||||||||
| Realized loss | $ | (5) | $ | (2) | $ | (11) | $ | (4) | |||||||||||||||
| Unrealized loss | (2) | (10) | (41) | (1) | |||||||||||||||||||
| Purchased product costs derivative loss | (7) | (12) | (52) | (5) | |||||||||||||||||||
| Total derivative loss | $ | (7) | $ | (12) | $ | (52) | $ | (5) | |||||||||||||||
| Three Months Ended September 30, | Nine Months Ended September 30, | ||||||||||||||
| (In millions) | 2017 | 2016 | 2017 | 2016 | |||||||||||
| Product sales | |||||||||||||||
| Realized (loss) gain | $ | (2 | ) | $ | — | $ | (3 | ) | $ | 6 | |||||
| Unrealized (loss) gain | (8 | ) | 2 | 1 | (12 | ) | |||||||||
| Total derivative (loss) gain related to product sales | (10 | ) | 2 | (2 | ) | (6 | ) | ||||||||
| Purchased product costs | |||||||||||||||
Realized loss(1) | (2 | ) | (1 | ) | (6 | ) | (4 | ) | |||||||
| Unrealized (loss) gain | (9 | ) | (3 | ) | 1 | (12 | ) | ||||||||
| Total derivative loss related to purchased product costs | (11 | ) | (4 | ) | (5 | ) | (16 | ) | |||||||
| Cost of revenues | |||||||||||||||
Realized loss(1) | — | — | — | (2 | ) | ||||||||||
| Unrealized (loss) gain | — | (1 | ) | — | 1 | ||||||||||
| Total derivative loss related to cost of revenues | — | (1 | ) | — | (1 | ) | |||||||||
| Total derivative losses | $ | (21 | ) | $ | (3 | ) | $ | (7 | ) | $ | (23 | ) | |||
| (In millions) | September 30, 2021 | December 31, 2020 | |||||||||
| MPLX LP: | |||||||||||
| Bank revolving credit facility | $ | — | $ | 175 | |||||||
| Floating rate senior notes | — | 1,000 | |||||||||
| Fixed rate senior notes | 18,532 | 19,240 | |||||||||
| Consolidated subsidiaries: | |||||||||||
| MarkWest | 23 | 23 | |||||||||
| ANDX | 45 | 87 | |||||||||
| Financing lease obligations | 9 | 11 | |||||||||
| Total | 18,609 | 20,536 | |||||||||
| Unamortized debt issuance costs | (105) | (116) | |||||||||
| Unamortized discount/premium | (250) | (281) | |||||||||
| Amounts due within one year | (1) | (764) | |||||||||
| Total long-term debt due after one year | $ | 18,253 | $ | 19,375 | |||||||
| (In millions) | September 30, 2017 | December 31, 2016 | |||||
| MPLX LP: | |||||||
| Bank revolving credit facility due 2022 | $ | 420 | $ | — | |||
| Term loan facility due 2019 | — | 250 | |||||
| 5.500% senior notes due February 2023 | 710 | 710 | |||||
| 4.500% senior notes due July 2023 | 989 | 989 | |||||
| 4.875% senior notes due December 2024 | 1,149 | 1,149 | |||||
| 4.000% senior notes due February 2025 | 500 | 500 | |||||
| 4.875% senior notes due June 2025 | 1,189 | 1,189 | |||||
| 4.125% senior notes due March 2027 | 1,250 | — | |||||
| 5.200% senior notes due March 2047 | 1,000 | — | |||||
| Consolidated subsidiaries: | |||||||
| MarkWest - 4.500% - 5.500% senior notes, due 2023-2025 | 63 | 63 | |||||
| MPL - capital lease obligations due 2020 | 7 | 8 | |||||
| Total | 7,277 | 4,858 | |||||
| Unamortized debt issuance costs | (27 | ) | (7 | ) | |||
| Unamortized discount | (401 | ) | (428 | ) | |||
| Amounts due within one year | (1 | ) | (1 | ) | |||
| Total long-term debt due after one year | $ | 6,848 | $ | 4,422 | |||
Credit AgreementsAgreement
25
Floating Rate Senior Notes
On February 10, 2017,September 3, 2021 MPLX redeemed, at par value, all of the Partnership completed a public offering of $2.25 billion aggregate principal amount of unsecured senior notes, consisting of (i) $1.25 billion aggregate principal amount of 4.125 percent senior notes due in March 2027 and (ii) $1.0 billion aggregate principal amount of 5.200 percentfloating rate senior notes due September 2022, which resulted in March 2047 (collectively, the “New Senior Notes”). The net proceeds fromimmediate expense recognition of $2 million of unamortized debt issuance costs. These costs are included on the NewConsolidated Statements of Income as “Other financial costs.” This redemption was funded primarily by borrowings under the MPC Loan Agreement.
Fixed Rate Senior Notes totaled approximately $2.22 billion, after deducting underwriting discounts,
MPLX’s senior notes, including those issued by consolidated subsidiaries, consist of various series of senior notes expiring between 2022 and were used for general partnership purposes and capital expenditures.2058 with interest rates ranging from 1.750 percent to 5.500 percent. Interest on each series of the notes is payable semi-annually in arrears on March 1various dates depending on the series of the notes.
On January 15, 2021 MPLX redeemed all of the $750 million outstanding aggregate principal amount of 5.250 percent senior notes due January 15, 2025, including approximately $42 million aggregate principal amount of senior notes issued by ANDX at a price equal to 102.625 percent of the principal amount. The payment of $20 million related to the note premium, offset by the immediate expense recognition of $12 million of unamortized debt premium and issuance costs, resulted in a loss on extinguishment of debt of $8 million that is included on the Consolidated Statements of Income as “Other financial costs.”
16. Revenue
Disaggregation of Revenue
The following tables represent a disaggregation of revenue for each reportable segment for the three and nine months ended September 1, commencing on September 1, 2017.30, 2021 and 2020:
| Three Months Ended September 30, 2021 | |||||||||||||||||
| (In millions) | L&S | G&P | Total | ||||||||||||||
| Revenues and other income: | |||||||||||||||||
| Service revenue | $ | 87 | $ | 513 | $ | 600 | |||||||||||
| Service revenue - related parties | 896 | 6 | 902 | ||||||||||||||
| Service revenue - product related | — | 82 | 82 | ||||||||||||||
| Product sales | 1 | 447 | 448 | ||||||||||||||
| Product sales - related parties | 2 | 24 | 26 | ||||||||||||||
| Total revenues from contracts with customers | $ | 986 | $ | 1,072 | 2,058 | ||||||||||||
Non-ASC 606 revenue(1) | 501 | ||||||||||||||||
| Total revenues and other income | $ | 2,559 | |||||||||||||||
| Three Months Ended September 30, 2020 | |||||||||||||||||
| (In millions) | L&S | G&P | Total | ||||||||||||||
| Revenues and other income: | |||||||||||||||||
| Service revenue | $ | 87 | $ | 517 | $ | 604 | |||||||||||
| Service revenue - related parties | 902 | 7 | 909 | ||||||||||||||
| Service revenue - product related | — | 41 | 41 | ||||||||||||||
| Product sales | 7 | 158 | 165 | ||||||||||||||
| Product sales - related parties | 2 | 35 | 37 | ||||||||||||||
| Total revenues from contracts with customers | $ | 998 | $ | 758 | 1,756 | ||||||||||||
Non-ASC 606 revenue(1) | 491 | ||||||||||||||||
| Total revenues and other income | $ | 2,247 | |||||||||||||||
26
| Nine Months Ended September 30, 2021 | |||||||||||||||||
| (In millions) | L&S | G&P | Total | ||||||||||||||
| Revenues and other income: | |||||||||||||||||
| Service revenue | $ | 262 | $ | 1,505 | $ | 1,767 | |||||||||||
| Service revenue - related parties | 2,666 | 15 | 2,681 | ||||||||||||||
| Service revenue - product related | — | 235 | 235 | ||||||||||||||
| Product sales | 3 | 1,031 | 1,034 | ||||||||||||||
| Product sales - related parties | 8 | 91 | 99 | ||||||||||||||
| Total revenues from contracts with customers | $ | 2,939 | $ | 2,877 | 5,816 | ||||||||||||
Non-ASC 606 revenue(1) | 1,477 | ||||||||||||||||
| Total revenues and other income | $ | 7,293 | |||||||||||||||
| Nine Months Ended September 30, 2020 | |||||||||||||||||
| (In millions) | L&S | G&P | Total | ||||||||||||||
| Revenues and other income: | |||||||||||||||||
| Service revenue | $ | 248 | $ | 1,531 | $ | 1,779 | |||||||||||
| Service revenue - related parties | 2,676 | 18 | 2,694 | ||||||||||||||
| Service revenue - product related | — | 102 | 102 | ||||||||||||||
| Product sales | 39 | 415 | 454 | ||||||||||||||
| Product sales - related parties | 10 | 90 | 100 | ||||||||||||||
| Total revenues from contracts with customers | $ | 2,973 | $ | 2,156 | 5,129 | ||||||||||||
Non-ASC 606 loss(1) | 191 | ||||||||||||||||
| Total revenues and other income | $ | 5,320 | |||||||||||||||
(1) Non-ASC 606 Revenue includes rental income, sales-type lease revenue, income/(loss) from equity method investments, derivative gains and losses, mark-to-market adjustments, and other income.
Contract Balances
Contract assets typically relate to aid in construction agreements where the revenue recognized and MPLX’s rights to consideration for work completed exceeds the amount billed to the customer. Contract assets are included in “Other current assets” and “Other noncurrent assets” on the Consolidated Balance Sheets.
Contract liabilities, which we refer to as “Deferred revenue” and “Long-term deferred revenue,” typically relate to advance payments for aid in construction agreements and deferred customer credits associated with makeup rights and minimum volume commitments. Related to minimum volume commitments, breakage is estimated and recognized into service revenue in instances where it is probable the customer will not use the credit in future periods. We classify contract liabilities as current or long-term based on the timing of when we expect to recognize revenue.
“Receivables, net” primarily relate to our commodity sales. Portions of the “Receivables, net” balance are attributed to the sale of commodity product controlled by MPLX prior to sale while a significant portion of the balance relates to the sale of commodity product on behalf of our producer customers. The sales and related “Receivable, net” are commingled and excluded from the table below. MPLX remits the net sales price back to our producer customers upon completion of the sale. Each period end, certain amounts within accounts payable relate to our payments to producer customers. Such amounts are not deemed material at period end as a result of when we settle with each producer.
27
The tables below reflect the changes in our contract balances for the nine-month periods ended September 30, 2021 and 2020:
| (In millions) | Balance at December 31, 2020(1) | Additions/ (Deletions) | Revenue Recognized(2) | Balance at September 30, 2021 | |||||||||||||||||||||||||||||||||||||
| Contract assets | $ | 40 | $ | (21) | $ | 1 | $ | 20 | |||||||||||||||||||||||||||||||||
| Long-term contract assets | 2 | — | — | 2 | |||||||||||||||||||||||||||||||||||||
| Deferred revenue | 37 | 40 | (27) | 50 | |||||||||||||||||||||||||||||||||||||
| Deferred revenue - related parties | 91 | 59 | (77) | 73 | |||||||||||||||||||||||||||||||||||||
| Long-term deferred revenue | 119 | 11 | — | 130 | |||||||||||||||||||||||||||||||||||||
| Long-term deferred revenue - related parties | 48 | (12) | — | 36 | |||||||||||||||||||||||||||||||||||||
| Long-term contract liability | $ | 6 | $ | — | $ | — | $ | 6 | |||||||||||||||||||||||||||||||||
| (In millions) | Balance at December 31, 2019(1) | Additions/ (Deletions) | Revenue Recognized(2) | Balance at September 30, 2020 | |||||||||||||||||||||||||||||||||||||
| Contract assets | $ | 39 | $ | (9) | $ | (1) | $ | 29 | |||||||||||||||||||||||||||||||||
| Deferred revenue | 23 | 16 | (6) | 33 | |||||||||||||||||||||||||||||||||||||
| Deferred revenue - related parties | 53 | 77 | (60) | 70 | |||||||||||||||||||||||||||||||||||||
| Long-term deferred revenue | 90 | 25 | — | 115 | |||||||||||||||||||||||||||||||||||||
| Long-term deferred revenue - related parties | $ | 55 | $ | (7) | $ | — | $ | 48 | |||||||||||||||||||||||||||||||||
(1) Balance represents ASC 606 portion of each respective line item.
(2) No significant revenue was recognized related to past performance obligations in the current periods.
Remaining Performance Obligations
The table below includes estimated revenue expected to be recognized in the future related to performance obligations that are unsatisfied (or partially unsatisfied) at the end of the reporting period.
As of September 30, 2021, the amounts allocated to contract assets and contract liabilities on the Consolidated Balance Sheets are $288 million and are reflected in the amounts below. This will be recognized as revenue as the obligations are satisfied, which is expected to occur over the next 22 years. Further, MPLX does not disclose variable consideration due to volume variability in the table below.
| (In millions) | |||||
| 2021 | $ | 476 | |||
| 2022 | 1,795 | ||||
| 2023 | 1,656 | ||||
| 2024 | 1,524 | ||||
| 2025 and thereafter | 4,484 | ||||
Total revenue on remaining performance obligations(1),(2),(3) | $ | 9,935 | |||
(1) All fixed consideration from contracts with customers is included in the amounts presented above. Variable consideration that is constrained or not required to be estimated as it reflects our efforts to perform is excluded.
(2) Arrangements deemed implicit leases and sales-type leases are excluded from this table, see further discussion about leases in Note 18.
(3) Only minimum volume commitments that are deemed fixed are included in the table above. MPLX has various minimum volume commitments in processing arrangements that vary based on the actual Btu content of the gas received. These amounts are deemed variable consideration and are excluded from the table above.
We do not disclose information on the future performance obligations for any contract with an original expected duration of one year or less.
28
17. Supplemental Cash Flow Information
| Nine Months Ended September 30, | |||||||||||
| (In millions) | 2021 | 2020 | |||||||||
| Net cash provided by operating activities included: | |||||||||||
| Interest paid (net of amounts capitalized) | $ | 627 | $ | 631 | |||||||
| Income taxes paid | 2 | 1 | |||||||||
| Non-cash investing and financing activities: | |||||||||||
| Net transfers of property, plant and equipment (to)/from materials and supplies inventories | 1 | (1) | |||||||||
| Fair value of common units redeemed for Wholesale Exchange | $ | — | $ | 340 | |||||||
| Nine Months Ended September 30, | |||||||
| (In millions) | 2017 | 2016 | |||||
| Net cash provided by operating activities included: | |||||||
| Interest paid (net of amounts capitalized) | $ | 207 | $ | 158 | |||
| Non-cash investing and financing activities: | |||||||
| Net transfers of property, plant and equipment from materials and supplies inventories | $ | 6 | $ | (4 | ) | ||
Contribution of fixed assets to joint venture(1) | 337 | — | |||||
The Consolidated Statements of Cash Flows exclude changes to the Consolidated Balance Sheets that diddo not affect cash. The following is the change of additions to property, plant and equipment related to capital accruals:
| Nine Months Ended September 30, | |||||||||||
| (In millions) | 2021 | 2020 | |||||||||
| Decrease in capital accruals | $ | (19) | $ | (197) | |||||||
18. Leases
During the second quarter of 2021 and during the first quarter of 2020, reimbursements for projects and changes to minimum volume commitments at certain L&S locations were agreed to between MPLX and MPC. These reimbursements and minimum volume commitments relate to the storage services agreements between MPLX and MPC at these locations and required the embedded leases within these agreements to be reassessed under ASC 842. As a result of the reassessment, certain leases were reclassified from an operating lease to a sales-type lease. Accordingly, the underlying assets previously shown on the Consolidated Balance Sheets associated with the sales-type leases were derecognized and the net investment in the lease (i.e., the sum of the present value of the future lease payments and the unguaranteed residual value of the assets) was recorded as a lease receivable during the respective periods. See Note 5 for the location of lease receivables and unguaranteed residual assets on the Consolidated Balance Sheets. The difference between the net book value of the underlying assets and the net investment in the lease has been recorded as a “Contribution from MPC” in the Consolidated Statements of Equity given the impacted storage services agreements are related to a common control transaction. During the second quarter of 2021, MPLX derecognized approximately $421 million of property, plant and equipment, recorded a lease receivable of approximately $519 million, recorded an unguaranteed residual asset of approximately $14 million with the difference recorded as a deemed “Contribution from MPC” of $112 million. During the first quarter of 2020, MPLX derecognized approximately $171 million of property, plant and equipment, recorded a lease receivable of approximately $370 million, recorded an unguaranteed residual asset of approximately $10 million with the difference recorded as a deemed “Contribution from MPC” of $209 million.
Lease revenues included on the Consolidated Statements of Income were as follows:
| Three Months Ended September 30, 2021 | Three Months Ended September 30, 2020 | ||||||||||||||||||||||
| (In millions) | Related Party | Third Party | Related Party | Third Party | |||||||||||||||||||
| Operating leases: | |||||||||||||||||||||||
Operating lease revenue(1) | $ | 139 | $ | 56 | $ | 208 | $ | 70 | |||||||||||||||
| Sales-type leases: | |||||||||||||||||||||||
| Profit/(loss) recognized at the commencement date | — | — | — | — | |||||||||||||||||||
| Interest income (Sales-type lease revenue- fixed minimum) | 133 | — | 37 | — | |||||||||||||||||||
| Interest income (Revenue from variable lease payments) | $ | — | $ | — | $ | 1 | $ | — | |||||||||||||||
29
| Nine Months Ended September 30, | Nine Months Ended September 30, 2021 | Nine Months Ended September 30, 2020 | ||||||||||||||||||||||||||||
| (In millions) | 2017 | 2016 | (In millions) | Related Party | Third Party | Related Party | Third Party | |||||||||||||||||||||||
| Increase in capital accruals | $ | 55 | $ | — | ||||||||||||||||||||||||||
| Operating leases: | Operating leases: | |||||||||||||||||||||||||||||
Operating lease revenue(1) | Operating lease revenue(1) | $ | 485 | $ | 192 | $ | 589 | $ | 199 | |||||||||||||||||||||
| Sales-type leases: | Sales-type leases: | |||||||||||||||||||||||||||||
| Profit/(loss) recognized at the commencement date | Profit/(loss) recognized at the commencement date | — | — | — | — | |||||||||||||||||||||||||
| Interest income (Sales-type lease revenue- fixed minimum) | Interest income (Sales-type lease revenue- fixed minimum) | 305 | — | 113 | — | |||||||||||||||||||||||||
| Interest income (Revenue from variable lease payments) | Interest income (Revenue from variable lease payments) | $ | — | $ | — | $ | 1 | $ | — | |||||||||||||||||||||
(1) These amounts are presented net of executory costs.
| (In millions) | Related Party | ||||||||||||||||
| 2021 | $ | 136 | |||||||||||||||
| 2022 | 543 | ||||||||||||||||
| 2023 | 544 | ||||||||||||||||
| 2024 | 538 | ||||||||||||||||
| 2025 | 525 | ||||||||||||||||
| 2026 and thereafter | 1,018 | ||||||||||||||||
| Total minimum future rentals | 3,304 | ||||||||||||||||
| Less: present value discount | 2,371 | ||||||||||||||||
| Lease receivable | $ | 933 | |||||||||||||||
| Number of Units | Weighted Average Fair Value | |||||
| Outstanding at December 31, 2016 | 1,173,411 | $ | 33.09 | |||
| Granted | 653,721 | 36.36 | ||||
| Settled | (288,584 | ) | 33.50 | |||
| Forfeited | (113,107 | ) | 34.59 | |||
| Outstanding at September 30, 2017 | 1,425,441 | 34.39 | ||||
Environmental Matters – The PartnershipMPLX is subject to federal, state and local laws and regulations relating to the environment. These laws generally provide for control of pollutants released into the environment and require responsible parties to undertake remediation of hazardous waste disposal sites. Penalties may be imposed for non-compliance.
At September 30, 20172021 and December 31, 2016,2020, accrued liabilities for remediation totaled $14$22 million and $3$17 million, respectively. However, itIt is not presently possible to estimate the ultimate amount of all remediation costs that might be incurred or the penalties, if any, whichthat may be imposed. At September 30, 2021 and December 31, 2016,2020, there was less than $1 million in receivables fromwere no balances with MPC for indemnification of environmental costs related to incidents occurring prior to the Initial Offering. There were no such receivables at September 30, 2017.costs.
30
Guarantees– Over the years, the PartnershipMPLX has sold various assets in the normal course of its business. Certain of the related agreements contain performance and general guarantees, including guarantees regarding inaccuracies in representations, warranties, covenants and agreements, and environmental and general indemnifications that require the PartnershipMPLX to perform upon the occurrence of a triggering event or condition. These guarantees and indemnifications are part of the normal course of selling assets. The PartnershipMPLX is typically not able to calculate the maximum potential amount of future payments that could be made under such contractual provisions because of the variability inherent in the guarantees and indemnities. Most often, the nature of the guarantees and indemnities is such that there is no appropriate method for quantifying the exposure because the underlying triggering event has little or no past experience upon which a reasonable prediction of the outcome can be based.
We hold a 9.19 percent indirect interest in a joint venture (“Dakota Access”) that owns and operates the Dakota Access Pipeline and Energy Transfer Crude Oil Pipeline projects, collectively referred to as the Bakken Pipeline system or DAPL. In 2020, the U.S. District Court for the District of Columbia (the “D.D.C.”) ordered the U.S. Army Corps of Engineers (“Army Corps”), which granted permits and an easement for the Bakken Pipeline system, to prepare an environmental impact statement (“EIS”) relating to an easement under Lake Oahe in North Dakota. The D.D.C. later ordered vacatur of the easement during the pendency of the EIS and further ordered a shut down of the pipeline by August 5, 2020. On August 5, 2020, the U.S. Court of Appeals for the District of Columbia (the “Court of Appeals”) stayed the D.D.C.’s injunction that required the pipeline be shutdown and emptied of oil by August 5, 2020. On January 26, 2021, the Court of Appeals upheld the D.D.C.’s order vacating the easement while the Army Corps prepares the EIS. The Court of Appeals reversed the D.D.C.’s order to the extent it directed that the pipeline be shutdown and emptied of oil. In May 2021, the D.D.C. denied a renewed request for an injunction to shut down the pipeline while the EIS is being prepared. In June 2021, the D.D.C. issued an order dismissing without prejudice the tribes’ claims against the Dakota Access Pipeline. The judge noted that the plaintiffs may move to reopen the case in the event of a violation of the court’s prior orders. Dakota Access has petitioned the U.S. Supreme Court for review of the Court of Appeal’s decision upholding the D.D.C.’s order vacating the easement. The pipeline remains operational.
We have entered into a Contingent Equity Contribution Agreement whereby MPLX LP, along with the other joint venture owners in the Bakken Pipeline system, has agreed to make equity contributions to the joint venture upon certain events occurring to allow the entities that own and operate the Bakken Pipeline system to satisfy their senior note payment obligations. The senior notes were issued to repay amounts owed by the pipeline companies to fund the cost of construction of the Bakken Pipeline system. If the pipeline were temporarily shut down, MPLX would have to contribute its 9.19 percent pro rata share of funds required to pay interest accruing on the notes and any portion of the principal that matures while the pipeline is shutdown. MPLX also expects to contribute its 9.19 percent pro rata share of any costs to remediate any deficiencies to reinstate the permit and/or return the pipeline into operation. If the vacatur of the easement permit results in a permanent shutdown of the pipeline, MPLX would have to contribute its 9.19 percent pro rata share of the cost to redeem the bonds (including the 1% redemption premium required pursuant to the indenture governing the notes) and any accrued and unpaid interest. As of September 30, 2021, our maximum potential undiscounted payments under the Contingent Equity Contribution Agreement were approximately $230 million.
Other Legal Proceedings – In early July 2020, Tesoro High Plains Pipeline Company, LLC (“THPP”), a subsidiary of MPLX, received a Notification of Trespass Determination from the Bureau of Indian Affairs (“BIA”) relating to a portion of the Tesoro High Plains Pipeline that crosses the Fort Berthold Reservation in North Dakota. The notification covered the rights of way for 23 tracts of land and demanded the immediate cessation of pipeline operations. The notification also assessed trespass damages of approximately $187 million. THPP appealed this determination, which triggered an automatic stay of the requested pipeline shutdown and payment. On October 29, 2020, the Assistant Secretary - Indian Affairs issued an order vacating the BIA’s trespass order and requiring the Regional Director for the BIA Great Plains Region to issue a new decision on or before December 15 covering all 34 tracts at issue. On December 15, 2020, the Regional Director of the BIA issued a new trespass notice to THPP consistent with the Assistant Secretary - Indian Affairs order vacating the prior trespass order. The new order found that THPP was in trespass and assessed trespass damages of approximately $4 million (including interest), which has been paid. The order also required THPP to immediately cease and desist use of the portion of the pipeline that crosses the property at issue. THPP has complied with the Regional Director’s December 15, 2020 notice. On February 12, 2021, landowners filed suit in the U.S. District Court for the District of North Dakota (the “District of North Dakota”) against THPP, the Department of the Interior, the Assistant Secretary - Indian Affairs, the Interior Board of Indian Appeals and the BIA, requesting, among other things, that decisions by the Assistant Secretary - Indian Affairs and the Interior Board of Indian Appeals be vacated as to the award of damages to plaintiffs. In March 2021, THPP received a copy of an order purporting to vacate all orders related to THPP’s alleged trespass issued by the BIA between July 2, 2020 and January 14, 2021. The order
31
directs the Regional Director of the BIA to reconsider the issue of THPP’s alleged trespass and issue a new order, if necessary, after all interested parties have had an opportunity to be heard. Subsequently, landowners voluntarily dismissed the suit filed in the District of North Dakota. On April 23, 2021, THPP filed a lawsuit in the District of North Dakota against the United States of America, the U.S. Department of the Interior and the BIA challenging the March order purporting to vacate all previous orders related to THPP’s alleged trespass.
We continue to work towards a settlement of this matter with holders of the property rights at issue.
Contractual Commitments and Contingencies – At September 30, 2017, the Partnership’s contractual commitments to acquire property, plant and equipment totaled $520 million. These commitments at September 30, 2017 were primarily related to plant expansion projects for the Marcellus and Southwest Operations. In addition, from time to time and in the ordinary course of business, the PartnershipMPLX and its affiliates provide guarantees of the Partnership’sMPLX’s subsidiaries payment and performance obligations in the G&P segment. Certain natural gas processing and gathering arrangements require the PartnershipMPLX to construct new natural gas processing plants, natural gas gathering pipelines and NGL pipelines and contain certain fees and charges if specified construction milestones are not achieved for reasons other than force majeure. In certain cases, certain producers may have the right to cancel the processing arrangements if there are significant delays that are not due to force majeure. As of September 30, 2017,2021, management does not believe there are any indications that the PartnershipMPLX will not be able to meet the construction milestones, that force majeure does not apply or that such fees and charges will otherwise be triggered.
Item 2. Management’s Discussion and Analysis of Financial Condition and Results of Operations
Management’s Discussion and Analysis of Financial Condition and Results of Operations should also be read in conjunction with the unaudited consolidated financial statements and accompanying footnotes included under Item 1. Financial Statements and in conjunction with our Annual Report on Form 10-K for the year ended December 31, 2016, as updated by our Current2020.
Disclosures Regarding Forward-Looking Statements
This Quarterly Report on Form 8-K filed on May 1, 2017.
10-Q, particularly Management’s Discussion and Analysis of Financial Condition and Results of Operations and Quantitative and Qualitative Disclosures about Market Risk, includes various forward-looking statements concerning trendsthat are subject to risks, contingencies or events potentially affecting our business.uncertainties. You can identify our forward-looking statements by words such as “anticipate,” “believe,” “estimate,“commitment,” “objective,“could,” “design,” “estimate,” “expect,” “forecast,” “goal,” “guidance,” “imply,” “intend,” “may,” “objective,” “opportunity,” “outlook,” “plan,” “policy,” “position,” “potential,” “predict,” “priority,” “project,” “potential,“proposition,” “prospective,” “pursue,” “seek,” “should,” “strategy,” “target,” “could,“will,” “may,” “should,” “would,” “will”“would” or other similar expressions that convey the uncertainty of future events or outcomes. In accordance with “safe harbor” provisions
Forward-looking statements include, among other things, statements regarding:
•future financial and operating results;
•environmental, social and governance (“ESG”) goals and targets, including those related to greenhouse gas emissions, diversity and inclusion and ESG reporting;
•our plans to achieve our ESG goals and targets and to monitor and report progress thereon;
•the success or timing of completion of ongoing or anticipated capital or maintenance projects;
•the timing and amount of future distributions or unit repurchases; and
•the anticipated effects of actions of third parties such as competitors, activist investors, federal, foreign, state or local regulatory authorities, or plaintiffs in litigation.
Our forward-looking statements are not guarantees of future performance and you should not rely unduly on them, as they involve risks, uncertainties and assumptions. Material differences between actual results and any future performance suggested in our forward-looking statements could result from a variety of factors, including the following:
•general economic, political or regulatory developments, including inflation, changes in governmental policies relating to refined petroleum products, crude oil, natural gas or NGLs, or taxation;
•the magnitude, duration and extent of future resurgences of the Private Securities Litigation Reform ActCOVID-19 pandemic and its restrictions, including travel restrictions, business and school closures, increased remote work, stay-at-home orders and other actions taken by individuals, governments and the private sector to stem the spread of 1995, these statements are accompaniedthe virus;
•the ability of MPC to achieve its strategic objectives and the effects of those strategic decisions on us;
•further impairments;
•negative capital market conditions, including an increase of the current yield on common units;
32
•the ability to achieve strategic and financial objectives, including with respect to distribution coverage, future distribution levels, proposed projects and completed transactions;
•the success of MPC’s portfolio optimization, including the ability to complete any divestitures on commercially reasonable terms and/or within the expected timeframe, and the effects of any such divestitures on our business, financial condition, results of operations and cash flows;
•the adequacy of capital resources and liquidity, including the availability of sufficient cash flow to pay distributions and access to debt on commercially reasonable terms, and the ability to successfully execute business plans, growth strategies and self-funding models;
•the timing and extent of changes in commodity prices and demand for crude oil, refined products, feedstocks or other hydrocarbon-based products;
•volatility in or degradation of market and industry conditions;
•changes to the expected construction costs and timing of projects and planned investments, and the ability to obtain regulatory and other approvals with respect thereto;
•completion of midstream infrastructure by cautionary language identifying important factors, though not necessarily allcompetitors;
•disruptions due to equipment interruption or failure, including electrical shortages and power grid failures;
•the suspension, reduction or termination of MPC’s obligations under MPLX’s commercial agreements;
•modifications to financial policies, capital budgets, and earnings and distributions;
•the ability to manage disruptions in credit markets or changes to credit ratings;
•compliance with federal and state environmental, economic, health and safety, energy and other policies and regulations or enforcement actions initiated thereunder;
•adverse results in litigation;
•the effect of restructuring or reorganization of business components;
•the potential effects of changes in tariff rates on our business, financial condition, results of operations and cash flows;
•changes in foreign imports and exports of crude oil, refined products, natural gas and NGLs;
•changes in producer customers’ drilling plans or in volumes of throughput of crude oil, natural gas, NGLs, refined products or other hydrocarbon-based products;
•changes in the cost or availability of third-party vessels, pipelines, railcars and other means of transportation for crude oil, natural gas, NGLs, feedstocks and refined products;
•the price, availability and acceptance of alternative fuels and alternative-fuel vehicles and laws mandating such factors, whichfuels or vehicles;
•actions taken by our competitors, including pricing adjustments and the expansion and retirement of pipeline capacity, processing, fractionation and treating facilities in response to market conditions;
•expectations regarding joint venture arrangements and other acquisitions or divestitures of assets;
•midstream and refining industry overcapacity or under capacity;
•accidents or other unscheduled shutdowns affecting our machinery, pipelines, processing, fractionation and treating facilities or equipment, means of transportation, or those of our suppliers or customers;
•acts of war, terrorism or civil unrest that could cause future outcomesimpair our ability to differ materially from those set forth in forward-looking statements. gather, process, fractionate or transport crude oil, natural gas, NGLs or refined products; and
•political pressure and influence of environmental groups upon policies and decisions related to the production, gathering, refining, processing, fractionation, transportation and marketing of crude oil or other feedstocks, refined products, natural gas, NGLs or other hydrocarbon-based products.
For additional risk factors affecting our business, see Item 1A. Risk Factorsthe risk factors described in our Annual Report on Form 10-K for the year ended December 31, 2016.2020. We undertake no obligation to update any forward-looking statement except to the extent required by applicable law.
We are a diversified, growth-oriented master limited partnershiplarge-cap MLP formed by MPC, to own, operate, developthat owns and acquireoperates midstream energy infrastructure assets. We areand logistics assets, and provides fuels distribution services. The business consists of two segments based on the nature of services it offers: Logistics and Storage (“L&S”), and Gathering and Processing (“G&P”). The L&S segment is engaged in the transportation, storage, distribution and marketing of crude oil, asphalt, refined petroleum products and water. The G&P segment provides
33
gathering, processing and transportation of natural gas; and the gathering, transportation, fractionation, storage and marketing of NGLs; and the transportation, storage and distribution of crude oil and refined petroleum products.NGLs.
SIGNIFICANT FINANCIAL AND OTHER HIGHLIGHTS
Significant financial highlights including revenues and other highlightsincome, income from operations, net income, adjusted EBITDA attributable to MPLX and DCF attributable to GP and LP unitholders for the three months ended September 30, 20172021 and September 30, 2020 are listedshown in the chart below. Refer toSee the Non-GAAP Financial Information section below for the definitions of Adjusted EBITDA and DCF and the Results of Operations and Liquidity and Capital Resourcessection for further details.details regarding changes in these metrics.
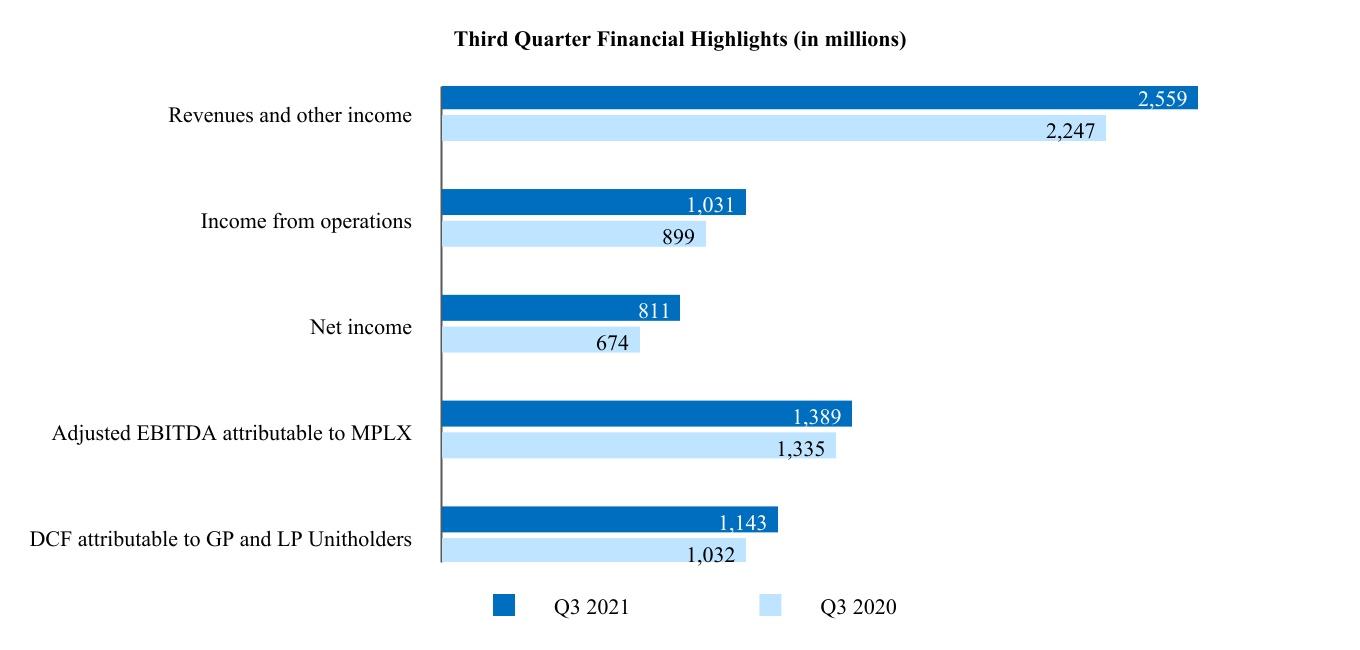
Other Highlights
•Announced a third quarter 2021 distribution of 2016 due to $74 million from the inclusion$1.28 per common unit, which consists of HST, WHCa base distribution amount of $0.705 per common unit and MPLXT results after our acquisition asa special distribution amount of March 1, 2017and$7 million from the acquisition of the Ozark pipeline.
$0.575 per common unit.