UNITED STATES
SECURITIES AND EXCHANGE COMMISSION
Washington, D.C. 20549
_____________________________________________
FORM 10-Q
____________________________________________
|
| |
| (Mark One) |
| ☒ | QUARTERLY REPORT PURSUANT TO SECTION 13 OR 15(d) OF THE SECURITIES EXCHANGE ACT OF 1934 |
For the quarterly period ended September 30, 2019March 31, 2020
OR
|
| |
| ☐ | TRANSITION REPORT PURSUANT TO SECTION 13 OR 15(d) OF THE SECURITIES EXCHANGE ACT OF 1934 |
For the transition period from to
Commission file number 001-35714
_____________________________________________
MPLX LP
(Exact name of registrant as specified in its charter)
_____________________________________________
|
| | | | | | |
| | Delaware | | | 27-0005456 |
(State or other jurisdiction of incorporation or organization) | | (I.R.S. Employer Identification No.) |
|
| | | | | |
| 200 E. Hardin Street, | Findlay, | Ohio | | 45840 | |
| (Address of principal executive offices) | | (Zip code) | |
(419) 421-2414
(Registrant’s telephone number, including area code)
_____________________________________________
|
| | |
| Securities Registered pursuant to Section 12(b) of the Act |
| Title of each class | Trading symbol(s) | Name of each exchange on which registered |
| Common Units Representing Limited Partnership Interests | MPLX | New York Stock Exchange |
Indicate by check mark whether the registrant (1) has filed all reports required to be filed by Section 13 or 15(d) of the Securities Exchange Act of 1934 during the preceding 12 months (or for such shorter period that the registrant was required to file such reports), and (2) has been subject to such filing requirements for the past 90 days. Yes x No ¨
Indicate by check mark whether the registrant has submitted electronically every Interactive Data File required to be submitted pursuant to Rule 405 of Regulation S-T (§232.405 of this chapter) during the preceding 12 months (or for such shorter period that the registrant was required to submit such files.) Yes x No ¨
Indicate by check mark whether the registrant is a large accelerated filer, an accelerated filer, a non-accelerated filer, a smaller reporting company, or an emerging growth company. See the definitions of “large accelerated filer,” “accelerated filer,” “smaller reporting company,” and “emerging growth company” in Rule 12b-2 of the Exchange Act.
|
| | | |
| Large accelerated filer | x | Accelerated filer | ☐ |
| Non-accelerated filer | ☐ | Smaller reporting company | ☐ |
| | | Emerging growth company | ☐ |
If an emerging growth company, indicate by check mark if the registrant has elected not to use the extended transition period for complying with any new or revised financial accounting standards provided pursuant to Section 13(a) of the Exchange Act. ¨
Indicate by check mark whether the registrant is a shell company (as defined in Rule 12b-2 of the Exchange Act) Yes ☐ No x
MPLX LP had 1,058,355,3041,058,603,592 common units outstanding at October 31, 2019.May 1, 2020.
Table of Contents
Unless the context otherwise requires, references in this report to “MPLX LP,” “MPLX,” “the Partnership,” “we,” “our,” “us,” or like terms refer to MPLX LP and its subsidiaries. Additionally, throughout this Quarterly Report on Form 10-Q, we have used terms in our discussion of the business and operating results that have been defined in our Glossary of Terms.
Glossary of Terms
The abbreviations, acronyms and industry technology used in this report are defined as follows. |
| |
| ASC | Accounting Standards Codification |
| ASU | Accounting Standards Update |
| ATM Program | An at-the-market program for the issuance of common units |
| Barrel | One stock tank barrel, or 42 United States gallons of liquid volume, used in reference to crude oil or other liquid hydrocarbons |
| Bcf/d | One billion cubic feet per day |
| Btu | One British thermal unit, an energy measurement |
| Condensate | A natural gas liquid with a low vapor pressure mainly composed of propane, butane, pentane and heavier hydrocarbon fractions |
| DCF (a non-GAAP financial measure) | Distributable Cash Flow |
| EBITDA (a non-GAAP financial measure) | Earnings Before Interest, Taxes, Depreciation and Amortization |
| FASB | Financial Accounting Standards Board |
| GAAP | Accounting principles generally accepted in the United States of America |
Gal | Gallon |
Gal/d | Gallons per day |
| LIBOR | London Interbank Offered Rate |
| mbpd | Thousand barrels per day |
| Merger | MPLX acquisition by merger of Andeavor Logistics LP (“ANDX”) on July 30, 2019 |
| MMBtu | One million British thermal units, an energy measurement |
| MMcf/d | One million cubic feet of natural gas per day |
| NGL | Natural gas liquids, such as ethane, propane, butanes and natural gasoline |
| NYSE | New York Stock Exchange |
| Predecessor | Collectively:
- The related assets, liabilities and results of operations of Hardin Street Marine LLC (“HSM”) prior to the date of the acquisition, March 31, 2016, effective January 1, 2015
- The related assets, liabilities and results of operations of Hardin Street Transportation LLC (“HST”), Woodhaven Cavern LLC (“WHC”) and MPLX Terminals LLC (“MPLXT”) prior to the date of the acquisition, March 1, 2017, effective January 1, 2015 for HST and WHC and April 1, 2016 for MPLXT
- The related assets, liabilities and results of operations of Andeavor Logistics LP (“ANDX”) prior to the date of the acquisition, July 30, 2019, effective October 1, 2018
|
| Realized derivative gain/loss | The gain or loss recognized when a derivative matures or is settled |
| SEC | United States Securities and Exchange Commission |
| SMR | Steam methane reformer, operated by a third party and located at the Javelina gas processing and fractionation complex in Corpus Christi, Texas |
| Unrealized derivative gain/loss | The gain or loss recognized on a derivative due to changes in fair value prior to the instrument maturing or settling |
| VIE | Variable interest entity |
Part I—Financial Information
Item 1. Financial Statements
MPLX LP
Consolidated Statements of Income (Unaudited) | | | | Three Months Ended
September 30, | | Nine Months Ended
September 30, | Three Months Ended
March 31, |
| (In millions, except per unit data) | 2019 | | 2018 | | 2019 | | 2018 | 2020 | | 2019(1) |
| Revenues and other income: | | | | | | | | | | |
| Service revenue | $ | 632 |
| | $ | 456 |
| | $ | 1,865 |
| | $ | 1,248 |
| $ | 612 |
| | $ | 614 |
|
| Service revenue - related parties | 899 |
| | 568 |
| | 2,549 |
| | 1,588 |
| 928 |
| | 803 |
|
| Service revenue - product related | 26 |
| | 59 |
| | 86 |
| | 154 |
| 39 |
| | 34 |
|
| Rental income | 99 |
| | 89 |
| | 291 |
| | 252 |
| 96 |
| | 99 |
|
| Rental income - related parties | 293 |
| | 190 |
| | 904 |
| | 525 |
| 234 |
| | 325 |
|
| Product sales | 171 |
| | 239 |
| | 576 |
| | 652 |
| 169 |
| | 216 |
|
| Product sales - related parties | 32 |
| | 18 |
| | 109 |
| | 35 |
| 33 |
| | 41 |
|
| Income from equity method investments | 95 |
| | 64 |
| | 255 |
| | 175 |
| |
Income/(loss) from equity method investments(2) | | (1,184 | ) | | 77 |
|
| Other income | 2 |
| | 3 |
| | 6 |
| | 8 |
| 1 |
| | — |
|
| Other income - related parties | 31 |
| | 26 |
| | 84 |
| | 73 |
| 64 |
| | 26 |
|
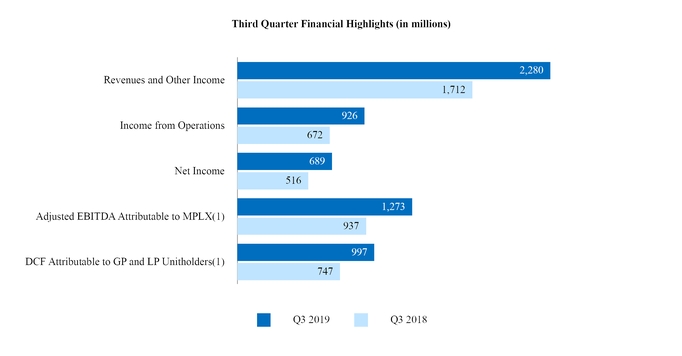
| Total revenues and other income | 2,280 |
| | 1,712 |
| | 6,725 |
| | 4,710 |
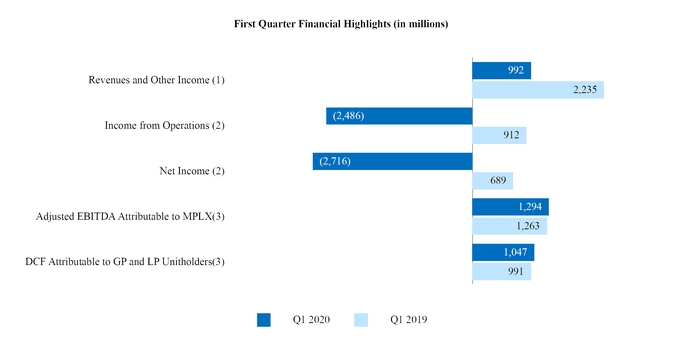
| 992 |
| | 2,235 |
|
| Costs and expenses: | | | | | | | | | | |
| Cost of revenues (excludes items below) | 407 |
| | 241 |
| | 1,099 |
| | 680 |
| 368 |
| | 339 |
|
| Purchased product costs | 129 |
| | 241 |
| | 489 |
| | 632 |
| 135 |
| | 194 |
|
| Rental cost of sales | 37 |
| | 32 |
| | 103 |
| | 94 |
| 35 |
| | 37 |
|
| Rental cost of sales - related parties | 45 |
| | 1 |
| | 124 |
| | 2 |
| 46 |
| | 43 |
|
| Purchases - related parties | 303 |
| | 228 |
| | 894 |
| | 628 |
| 276 |
| | 278 |
|
| Depreciation and amortization | 302 |
| | 201 |
| | 916 |
| | 565 |
| 325 |
| | 301 |
|
| Impairment expense | | 2,165 |
| | — |
|
| General and administrative expenses | 102 |
| | 76 |
| | 293 |
| | 217 |
| 97 |
| | 101 |
|
| Other taxes | 29 |
| | 20 |
| | 84 |
| | 55 |
| 31 |
| | 30 |
|
| Total costs and expenses | 1,354 |
| | 1,040 |
| | 4,002 |
| | 2,873 |
| 3,478 |
| | 1,323 |
|
| Income from operations | 926 |
| | 672 |
| | 2,723 |
| | 1,837 |
| |
| Income/(loss) from operations | | (2,486 | ) | | 912 |
|
| Related party interest and other financial costs | 5 |
| | 2 |
| | 8 |
| | 4 |
| 3 |
| | 1 |
|
| Interest expense (net of amounts capitalized of $13 million, $9 million, $36 million and $27 million, respectively) | 212 |
| | 134 |
| | 640 |
| | 381 |
| |
| Interest expense (net of amounts capitalized of $13 million and $11 million, respectively) | | 211 |
| | 214 |
|
| Other financial costs | 16 |
| | 17 |
| | 38 |
| | 49 |
| 16 |
| | 9 |
|
| Income before income taxes | 693 |
| | 519 |
| | 2,037 |
| | 1,403 |
| |
| Provision for income taxes | 4 |
| | 3 |
| | 2 |
| | 8 |
| |
| Net income | 689 |
| | 516 |
| | 2,035 |
| | 1,395 |
| |
| Income/(loss) before income taxes | | (2,716 | ) | | 688 |
|
| (Benefit)/provision for income taxes | | — |
| | (1 | ) |
| Net income/(loss) | | (2,716 | ) | | 689 |
|
| Less: Net income attributable to noncontrolling interests | 8 |
| | 6 |
| | 20 |
| | 11 |
| 8 |
| | 6 |
|
| Less: Net income attributable to Predecessor | 52 |
| | — |
| | 401 |
| | — |
| — |
| | 180 |
|
| Net income attributable to MPLX LP | 629 |
| | 510 |
| | 1,614 |
| | 1,384 |
| |
| Net income/(loss) attributable to MPLX LP | | (2,724 | ) | | 503 |
|
| Less: Series A preferred unit distributions | 20 |
| | 19 |
| | 61 |
| | 55 |
| 20 |
| | 20 |
|
| Less: Series B preferred unit distributions | 7 |
| | — |
| | 7 |
| | — |
| 11 |
| | — |
|
| Limited partners’ interest in net income attributable to MPLX LP | $ | 602 |
| | $ | 491 |
| | $ | 1,546 |
| | $ | 1,329 |
| |
| Limited partners’ interest in net income/(loss) attributable to MPLX LP | | $ | (2,755 | ) | | $ | 483 |
|
| Per Unit Data (See Note 6) | | | | | | | | | | |
| Net income attributable to MPLX LP per limited partner unit: | | | | | | | | |
| Net income/(loss) attributable to MPLX LP per limited partner unit: | | | | |
| Common - basic | $ | 0.61 |
| | $ | 0.62 |
| | $ | 1.78 |
| | $ | 1.77 |
| $ | (2.60 | ) | | $ | 0.61 |
|
| Common - diluted | $ | 0.61 |
| | $ | 0.62 |
| | $ | 1.78 |
| | $ | 1.77 |
| $ | (2.60 | ) | | $ | 0.61 |
|
| Weighted average limited partner units outstanding: | | | | | | | | | | |
| Common - basic | 974 |
| | 794 |
| | 855 |
| | 750 |
| 1,058 |
| | 794 |
|
| Common - diluted | 975 |
| | 794 |
| | 855 |
| | 750 |
| 1,058 |
| | 795 |
|
| |
| (1) | Financial information for the first quarter of 2019 has been retrospectively adjusted for the acquisition of ANDX. See Notes 1 and 3. |
| |
| (2) | The 2020 period includes $1,264 million of impairment expense. See Note 4. |
The accompanying notes are an integral part of these consolidated financial statements.
MPLX LP
Consolidated Statements of Comprehensive Income (Unaudited)
| | | | Three Months Ended
September 30, | | Nine Months Ended
September 30, | Three Months Ended
March 31, |
| (In millions) | 2019 | | 2018 | | 2019 | | 2018 | 2020 | | 2019(1) |
| Net income | $ | 689 |
| | $ | 516 |
| | $ | 2,035 |
| | $ | 1,395 |
| |
| Net income/(loss) | | $ | (2,716 | ) | | $ | 689 |
|
| Other comprehensive income/(loss), net of tax: | | | | | | | | | | |
| Remeasurements of pension and other postretirement benefits related to equity method investments, net of tax | — |
| | — |
| | 1 |
| | (2 | ) | (1 | ) | | 1 |
|
| Comprehensive income | 689 |
| | 516 |
| | 2,036 |
| | 1,393 |
| |
| Comprehensive income/(loss) | | (2,717 | ) | | 690 |
|
| Less comprehensive income attributable to: | | | | | | | | | | |
| Noncontrolling interests | 8 |
| | 6 |
| | 20 |
| | 11 |
| 8 |
| | 6 |
|
| Income attributable to Predecessor | 52 |
| | — |
| | 401 |
| | — |
| — |
| | 180 |
|
| Comprehensive income attributable to MPLX LP | $ | 629 |
| | $ | 510 |
| | $ | 1,615 |
| | $ | 1,382 |
| |
| Comprehensive income/(loss) attributable to MPLX LP | | $ | (2,725 | ) | | $ | 504 |
|
| |
| (1) | Financial information for the first quarter of 2019 has been retrospectively adjusted for the acquisition of ANDX. See Notes 1 and 3. |
The accompanying notes are an integral part of these consolidated financial statements.
MPLX LP
Consolidated Balance Sheets (Unaudited)
| | | (In millions) | September 30, 2019 | | December 31, 2018(1) | March 31, 2020 | | December 31, 2019 |
| Assets | | | | | | |
| Current assets: | | | | | | |
| Cash and cash equivalents | $ | 41 |
| | $ | 77 |
| $ | 57 |
| | $ | 15 |
|
| Receivables, net | 570 |
| | 611 |
| 522 |
| | 593 |
|
| Current assets - related parties | 660 |
| | 556 |
| 600 |
| | 656 |
|
| Inventories | 104 |
| | 98 |
| 105 |
| | 110 |
|
| Other current assets | 65 |
| | 98 |
| 45 |
| | 110 |
|
| Total current assets | 1,440 |
| | 1,440 |
| 1,329 |
| | 1,484 |
|
| Equity method investments | 5,182 |
| | 4,901 |
| 3,992 |
| | 5,275 |
|
| Property, plant and equipment, net | 21,892 |
| | 21,525 |
| 21,829 |
| | 22,145 |
|
| Intangibles, net | 1,309 |
| | 1,359 |
| 1,055 |
| | 1,270 |
|
| Goodwill | 10,735 |
| | 10,016 |
| 7,722 |
| | 9,536 |
|
| Right of use assets | 366 |
| | — |
| |
| Right of use assets, net | | 352 |
| | 365 |
|
| Noncurrent assets - related parties | 302 |
| | 24 |
| 677 |
| | 303 |
|
| Other noncurrent assets | 55 |
| | 60 |
| 50 |
| | 52 |
|
| Total assets | 41,281 |
| | 39,325 |
| 37,006 |
| | 40,430 |
|
| Liabilities | | | | | | |
| Current liabilities: | | | | | | |
| Accounts payable | 196 |
| | 266 |
| 138 |
| | 242 |
|
| Accrued liabilities | 185 |
| | 272 |
| 135 |
| | 187 |
|
| Current liabilities - related parties | 562 |
| | 502 |
| 297 |
| | 1,008 |
|
| Accrued property, plant and equipment | 346 |
| | 399 |
| 234 |
| | 283 |
|
| Accrued interest payable | 226 |
| | 184 |
| 214 |
| | 210 |
|
| Operating lease liabilities | 61 |
| | — |
| 67 |
| | 66 |
|
| Other current liabilities | 656 |
| | 645 |
| 129 |
| | 136 |
|
| Total current liabilities | 2,232 |
| | 2,268 |
| 1,214 |
| | 2,132 |
|
| Long-term deferred revenue | 189 |
| | 132 |
| 241 |
| | 217 |
|
| Long-term liabilities - related parties | 293 |
| | 46 |
| 290 |
| | 290 |
|
| Long-term debt | 19,190 |
| | 17,922 |
| 20,467 |
| | 19,704 |
|
| Deferred income taxes | 15 |
| | 14 |
| 11 |
| | 12 |
|
| Long-term operating lease liabilities | 309 |
| | — |
| 284 |
| | 302 |
|
| Deferred credits and other liabilities | 193 |
| | 208 |
| 175 |
| | 192 |
|
| Total liabilities | 22,421 |
| | 20,590 |
| 22,682 |
| | 22,849 |
|
| Commitments and contingencies (see Note 20) |
| |
| |
| Commitments and contingencies (see Note 21) | |
| |
|
| Series A preferred units | 968 |
| | 1,004 |
| 968 |
| | 968 |
|
| Equity | | | | | | |
| Common unitholders - public (392 million and 289 million units issued and outstanding) | 11,289 |
| | 8,336 |
| |
| Common unitholder - MPC (666 million and 505 million units issued and outstanding) | 5,767 |
| | (1,612 | ) | |
| Series B preferred units | 601 |
| | — |
| |
| Equity of Predecessor | — |
| | 10,867 |
| |
| Common unitholders - public (393 million and 392 million units issued and outstanding) | | 9,509 |
| | 10,800 |
|
| Common unitholder - MPC (666 million and 666 million units issued and outstanding) | | 3,014 |
| | 4,968 |
|
| Series B preferred units (.6 million and .6 million units issued and outstanding) | | 601 |
| | 611 |
|
| Accumulated other comprehensive loss | (15 | ) | | (16 | ) | (16 | ) | | (15 | ) |
| Total MPLX LP partners’ capital | 17,642 |
| | 17,575 |
| 13,108 |
| | 16,364 |
|
| Noncontrolling interests | 250 |
| | 156 |
| 248 |
| | 249 |
|
| Total equity | 17,892 |
| | 17,731 |
| 13,356 |
| | 16,613 |
|
| Total liabilities, preferred units and equity | $ | 41,281 |
| | $ | 39,325 |
| $ | 37,006 |
| | $ | 40,430 |
|
(1) Financial information has been retrospectively adjusted for the acquisition of ANDX. See Notes 1 and 3.
The accompanying notes are an integral part of these consolidated financial statements.
MPLX LP
Consolidated Statements of Cash Flows (Unaudited) | | | | Nine Months Ended
September 30, | Three Months Ended
March 31, |
| (In millions) | 2019 | | 2018 | 2020 | | 2019(1) |
| Increase/(decrease) in cash, cash equivalents and restricted cash | | | | | | |
| Operating activities: | | | | | | |
| Net income | $ | 2,035 |
| | $ | 1,395 |
| |
| Adjustments to reconcile net income to net cash provided by operating activities: | | | | |
| Net income/(loss) | | $ | (2,716 | ) | | $ | 689 |
|
| Adjustments to reconcile net income/(loss) to net cash provided by operating activities: | | | | |
| Amortization of deferred financing costs | 29 |
| | 45 |
| 14 |
| | 7 |
|
| Depreciation and amortization | 916 |
| | 565 |
| 325 |
| | 301 |
|
| Impairment expense | | 2,165 |
| | — |
|
| Deferred income taxes | 1 |
| | 7 |
| — |
| | (2 | ) |
| Asset retirement expenditures | (1 | ) | | (7 | ) | |
| (Gain)/loss on disposal of assets | (3 | ) | | 1 |
| — |
| | 1 |
|
| Income from equity method investments | (255 | ) | | (175 | ) | |
Loss/(income) from equity method investments(2) | | 1,184 |
| | (77 | ) |
| Distributions from unconsolidated affiliates | 379 |
| | 279 |
| 119 |
| | 115 |
|
| Changes in: | | | | | | |
| Current receivables | 38 |
| | (157 | ) | 71 |
| | 6 |
|
| Inventories | (3 | ) | | (10 | ) | 3 |
| | 4 |
|
| Fair value of derivatives | (4 | ) | | 16 |
| (15 | ) | | 7 |
|
| Current accounts payable and accrued liabilities | (81 | ) | | 151 |
| (142 | ) | | (69 | ) |
| Current assets/current liabilities - related parties | (148 | ) | | (108 | ) | (52 | ) | | (157 | ) |
| Right of use assets/operating lease liabilities | 6 |
| | — |
| (4 | ) | | — |
|
| Deferred revenue | 58 |
| | 30 |
| 27 |
| | 13 |
|
| All other, net | 23 |
| | (5 | ) | 30 |
| | 15 |
|
| Net cash provided by operating activities | 2,990 |
| | 2,027 |
| 1,009 |
| | 853 |
|
| Investing activities: | | | | | | |
| Additions to property, plant and equipment | (1,720 | ) | | (1,383 | ) | (379 | ) | | (575 | ) |
| Acquisitions, net of cash acquired | 6 |
| | (451 | ) | — |
| | 1 |
|
| Disposal of assets | 14 |
| | 5 |
| 39 |
| | 7 |
|
| Investments in unconsolidated affiliates | (494 | ) | | (215 | ) | (91 | ) | | (135 | ) |
| Distributions from unconsolidated affiliates - return of capital | 2 |
| | 16 |
| 69 |
| | 2 |
|
| All other, net | 3 |
| | 1 |
| |
| Net cash used in investing activities | (2,189 | ) | | (2,027 | ) | (362 | ) | | (700 | ) |
| Financing activities: | | | | | | |
| Long-term debt - borrowings | 8,674 |
| | 10,735 |
| 1,325 |
| | 1,404 |
|
| - repayments | (7,423 | ) | | (4,781 | ) | (581 | ) | | (821 | ) |
| Related party debt - borrowings | 7,708 |
| | 2,395 |
| 1,667 |
| | 1,405 |
|
| - repayments | (7,583 | ) | | (2,781 | ) | (2,261 | ) | | (1,405 | ) |
| Debt issuance costs | (20 | ) | | (53 | ) | |
| Distributions to MPC for acquisitions | — |
| | (4,111 | ) | |
| Distributions to noncontrolling interests | (20 | ) | | (10 | ) | (9 | ) | | (6 | ) |
| Distributions to Series A preferred unitholders | (61 | ) | | (52 | ) | (20 | ) | | (20 | ) |
| Distributions to Series B preferred unitholders | (21 | ) | | — |
| (21 | ) | | — |
|
| Distributions to unitholders and general partner | (1,731 | ) | | (1,312 | ) | (717 | ) | | (515 | ) |
Distributions to common and Series B preferred unitholders from Predecessor
| (502 | ) | |
|
| — |
| | (259 | ) |
| Contributions from MPC | 52 |
| | — |
| 14 |
| | 12 |
|
| Contributions from noncontrolling interests | 94 |
| | 8 |
| — |
| | 94 |
|
| All other, net | (12 | ) | | (8 | ) | (2 | ) | | (5 | ) |
| Net cash used in financing activities | (845 | ) | | 30 |
| (605 | ) | | (116 | ) |
| Net (decrease)/increase in cash, cash equivalents and restricted cash | (44 | ) | | 30 |
| 42 |
| | 37 |
|
| Cash, cash equivalents and restricted cash at beginning of period | 85 |
| | 9 |
| 15 |
| | 85 |
|
| Cash, cash equivalents and restricted cash at end of period | $ | 41 |
| | $ | 39 |
| $ | 57 |
| | $ | 122 |
|
| |
| (1) | Financial information for the first quarter of 2019 has been retrospectively adjusted for the acquisition of ANDX. See Notes 1 and 3. |
| |
| (2) | The 2020 period includes $1,264 million of impairment expense. See Note 4. |
The accompanying notes are an integral part of these consolidated financial statements.
MPLX LP
Consolidated Statements of Equity (Unaudited)
|
| | | | | | | | | | | | | | | | | | | | | | | | | | | |
| | Partnership | | | | | | | | |
| (In millions) | Common
Unit-holders
Public | | Common
Unit-holder
MPC | | General
Partner
MPC | | Accumulated Other Comprehensive Loss | | Non-controlling
Interests | | Equity of Predecessor | | Total |
| Balance at December 31, 2017 | $ | 8,379 |
| | $ | 2,099 |
| | $ | (637 | ) | | $ | (14 | ) | | $ | 146 |
| | $ | — |
| | $ | 9,973 |
|
| Net income (excludes amounts attributable to preferred units) | 180 |
| | 225 |
| | — |
| | — |
| | 2 |
| | — |
| | 407 |
|
| Allocation of MPC's net investment at acquisition | — |
| | 5,172 |
| | (4,126 | ) | | — |
| | — |
| | (1,046 | ) | | — |
|
| Distributions to: | | | | | | | | | | | | | |
| MPC for acquisition | — |
| | (936 | ) | | (3,164 | ) | | — |
| | — |
| | — |
| | (4,100 | ) |
| Unitholders and general partner | (176 | ) | | (171 | ) | | — |
| | — |
| | — |
| | — |
| | (347 | ) |
| Noncontrolling interests | — |
| | — |
| | — |
| | — |
| | (3 | ) | | — |
| | (3 | ) |
| Contributions from: | | | | | | | | | | | | | |
| MPC | — |
| | — |
| | — |
| | — |
| | — |
| | 1,046 |
| | 1,046 |
|
| Noncontrolling interests | — |
| | — |
| | — |
| | — |
| | 1 |
| | — |
| | 1 |
|
| Conversion of GP economic interests | — |
| | (7,926 | ) | | 7,926 |
| | — |
| | — |
| | — |
| | — |
|
| Other | 2 |
| | — |
| | 1 |
| | (2 | ) | | — |
| | — |
| | 1 |
|
| Balance at March 31, 2018 | 8,385 |
| | (1,537 | ) | | — |
| | (16 | ) | | 146 |
| | — |
| | 6,978 |
|
| Net income (excludes amounts attributable to preferred units) | 157 |
| | 276 |
| | — |
| | — |
| | 3 |
| | — |
| | 436 |
|
| Distributions to: | | | | | | | | | | | | | |
| Unitholders and general partner | (179 | ) | | (288 | ) | | — |
| | — |
| | — |
| | — |
| | (467 | ) |
| Noncontrolling interests | — |
| | — |
| | — |
| | — |
| | (3 | ) | | — |
| | (3 | ) |
| Contributions from: | | | | | | | | | | | | | |
| Noncontrolling interests | — |
| | — |
| | — |
| | — |
| | 4 |
| | — |
| | 4 |
|
| Other | 3 |
| | 1 |
| | — |
| | — |
| | — |
| | — |
| | 4 |
|
| Balance at June 30, 2018 | 8,366 |
| | (1,548 | ) | | — |
| | (16 | ) | | 150 |
| | — |
| | 6,952 |
|
| Net income (excludes amounts attributable to preferred units) | 179 |
| | 312 |
| | — |
| | — |
| | 6 |
| | — |
| | 497 |
|
| Distributions to: | | | | | | | | | | | | | |
| Unitholders and general partner | (182 | ) | | (316 | ) | | — |
| | — |
| | — |
| | — |
| | (498 | ) |
| Noncontrolling interests | — |
| | — |
| | — |
| | — |
| | (4 | ) | | — |
| | (4 | ) |
| Contributions from: | | | | | | | | | | | | | |
| Noncontrolling interests | — |
| | — |
| | — |
| | — |
| | 3 |
| | — |
| | 3 |
|
| Other | 4 |
| | (1 | ) | | — |
| | — |
| | — |
| | — |
| | 3 |
|
| Balance at September 30, 2018 | $ | 8,367 |
| | $ | (1,553 | ) | | $ | — |
| | $ | (16 | ) | | $ | 155 |
| | $ | — |
| | $ | 6,953 |
|
|
| | | | | | | | | | | | | | | | | | | | | | | | | | | |
| | Partnership | | | | | | | | |
| (In millions) | Common
Unit-holders
Public | | Common
Unit-holder
MPC | | Series B Preferred Unit-holders | | Accumulated Other Comprehensive Loss | | Non-controlling
Interests | | Equity of Predecessor | | Total(1) |
| Balance at December 31, 2018 | $ | 8,336 |
| | $ | (1,612 | ) | | $ | — |
| | $ | (16 | ) | | $ | 156 |
| | 10,867 |
| | $ | 17,731 |
|
| Net income (excludes amounts attributable to Series A preferred units) | 176 |
| | 307 |
| | — |
| | — |
| | 6 |
| | 180 |
| | 669 |
|
| Distributions to: | | | | | | | | | | | | | |
| Unitholders | (188 | ) | | (327 | ) | | — |
| | — |
| | — |
| | (261 | ) | | (776 | ) |
| Noncontrolling interests | — |
| | — |
| | — |
| | — |
| | (6 | ) | | — |
| | (6 | ) |
| Contributions from: | | | | | | | | | | | | | |
| MPC | — |
| | — |
| | — |
| | — |
| | — |
| | 15 |
| | 15 |
|
| Noncontrolling interests | — |
| | — |
| | — |
| | — |
| | 94 |
| | — |
| | 94 |
|
| Other | 2 |
| | — |
| | — |
| | 1 |
| | — |
| | — |
| | 3 |
|
| Balance at March 31, 2019 | 8,326 |
| | (1,632 | ) | | — |
| | (15 | ) | | 250 |
| | 10,801 |
| | 17,730 |
|
| | | | | | | | | | | | | | |
| Balance at December 31, 2019 | 10,800 |
| | 4,968 |
| | 611 |
| | (15 | ) | | 249 |
| | — |
| | 16,613 |
|
| Net income (excludes amounts attributable to Series A preferred units) | (1,022 | ) | | (1,733 | ) | | 11 |
| | — |
| | 8 |
| | — |
| | (2,736 | ) |
| Distributions to: | | | | | | | | | | | | | |
| Unitholders | (271 | ) | | (446 | ) | | (21 | ) | | — |
| | — |
| | — |
| | (738 | ) |
| Noncontrolling interests | — |
| | — |
| | — |
| | — |
| | (9 | ) | | — |
| | (9 | ) |
| Contributions from: | | | | | | | | | | | | | |
| MPC | — |
| | 225 |
| | — |
| | — |
| | — |
| | — |
| | 225 |
|
| Other | 2 |
| | — |
| | — |
| | (1 | ) | | — |
| | — |
| | 1 |
|
| Balance at March 31, 2020 | $ | 9,509 |
| | $ | 3,014 |
| | $ | 601 |
| | $ | (16 | ) | | $ | 248 |
| | $ | — |
| | $ | 13,356 |
|
The accompanying notes are an integral part of these consolidated financial statements.
MPLX LP
Consolidated Statements of Equity (Unaudited)
|
| | | | | | | | | | | | | | | | | | | | | | | | | | | |
| | Partnership | | | | | | | | |
| (In millions) | Common
Unit-holders
Public | | Common
Unit-holder
MPC | | Series B Preferred Unit-holders | | Accumulated Other Comprehensive Loss | | Non-controlling
Interests | | Equity of Predecessor | | Total(1) |
| Balance at December 31, 2018 | $ | 8,336 |
| | $ | (1,612 | ) | | $ | — |
| | $ | (16 | ) | | $ | 156 |
| | 10,867 |
| | $ | 17,731 |
|
| Net income (excludes amounts attributable to preferred units) | 176 |
| | 307 |
| | — |
| | — |
| | 6 |
| | 180 |
| | 669 |
|
| Distributions to: | | | | | | | | | | | | | |
| Unitholders | (188 | ) | | (327 | ) | | — |
| | — |
| | — |
| | (261 | ) | | (776 | ) |
| Noncontrolling interests | — |
| | — |
| | — |
| | — |
| | (6 | ) | | — |
| | (6 | ) |
| Contributions from: | | | | | — |
| | | | | | | | |
| MPC | — |
| | — |
| | — |
| | — |
| | — |
| | 15 |
| | 15 |
|
| Noncontrolling interests | — |
| | — |
| | — |
| | — |
| | 94 |
| | — |
| | 94 |
|
| Other | 2 |
| | — |
| | — |
| | 1 |
| | — |
| | — |
| | 3 |
|
| Balance at March 31, 2019 | 8,326 |
| | (1,632 | ) | | — |
| | (15 | ) | | 250 |
| | $ | 10,801 |
| | 17,730 |
|
| Net income (excludes amounts attributable to preferred units) | 168 |
| | 293 |
| | — |
| | — |
| | 6 |
| | 169 |
| | 636 |
|
| Distributions to: | | | | | | | | | | | | | |
| Unitholders | (191 | ) | | (332 | ) | | — |
| | — |
| | — |
| | (241 | ) | | (764 | ) |
| Noncontrolling interests | — |
| | — |
| | — |
| | — |
| | (6 | ) | | — |
| | (6 | ) |
| Contributions from: |
|
| |
|
| | | |
|
| |
|
| |
|
| |
|
|
| MPC | — |
| | — |
| | — |
| | — |
| | — |
| | 13 |
| | 13 |
|
| Other | 2 |
| | — |
| | — |
| | — |
| | — |
| | — |
| | 2 |
|
| Balance at June 30, 2019 | 8,305 |
| | (1,671 | ) | | — |
| | (15 | ) | | 250 |
| | $ | 10,742 |
| | 17,611 |
|
| Net income (excludes amounts attributable to Series A preferred units) | 222 |
| | 380 |
| | 7 |
| | — |
| | 8 |
| | 52 |
| | 669 |
|
| Allocation of MPC's net investment at acquisition | 2,983 |
| | 7,199 |
| | 615 |
| | — |
| | — |
| | (10,797 | ) | | — |
|
| Distributions to: | | | | | | | | | | | | | |
| Unitholders | (262 | ) | | (432 | ) | | (21 | ) | | — |
| | — |
| | — |
| | (715 | ) |
| Noncontrolling interests | — |
| | — |
| | — |
| | — |
| | (8 | ) | | — |
| | (8 | ) |
| Contributions from: | | | | | | | | | | | | | |
| MPC | — |
| | 292 |
| | — |
| | — |
| | — |
| | 3 |
| | 295 |
|
| Conversion of Series A preferred units | 36 |
| | — |
| | — |
| | — |
| | — |
| | — |
| | 36 |
|
| Other | 5 |
| | (1 | ) | | — |
| | — |
| | — |
| | — |
| | 4 |
|
| Balance at September 30, 2019 | $ | 11,289 |
| | $ | 5,767 |
| | $ | 601 |
| | $ | (15 | ) | | $ | 250 |
| | $ | — |
| | $ | 17,892 |
|
(1) Financial information has been retrospectively adjusted for the acquisition of ANDX for the first and second quarters of 2019. See Notes 1 and 3.
| |
| (1) | Financial information for the first quarter of 2019 has been retrospectively adjusted for the acquisition of ANDX. See Notes 1 and 3. |
The accompanying notes are an integral part of these consolidated financial statements.
Notes to Consolidated Financial Statements (Unaudited)
1. Description of the Business and Basis of Presentation
Description of the Business – MPLX LP is a diversified, large-cap master limited partnership formed by Marathon Petroleum Corporation that owns and operates midstream energy infrastructure and logistics assets, and provides fuels distribution services. References in this report to “MPLX LP,” “MPLX,” “the Partnership,” “we,” “ours,” “us,” or like terms refer to MPLX LP and its subsidiaries. References to “MPC” refer collectively to Marathon Petroleum Corporation as our sponsor and its subsidiaries, other than the Partnership. We are engaged in the transportation, storage and distribution of crude oil, asphalt and refined petroleum products; the gathering, processing and transportation of natural gas; and the gathering, transportation, fractionation, storage and marketing of NGLs. MPLX’s principal executive office is located in Findlay, Ohio.
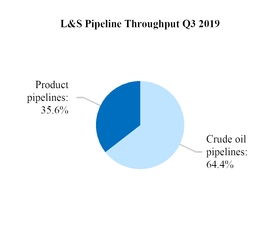
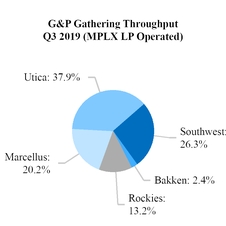
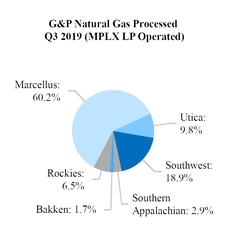
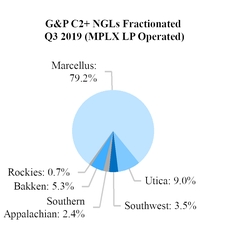
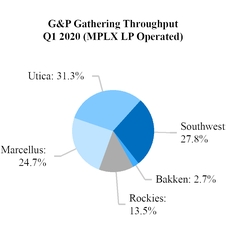
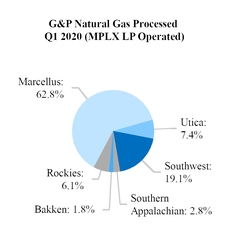
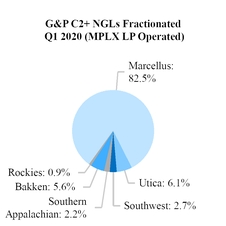
MPLX’s business consists of 2 segments based on the nature of services it offers: Logistics and Storage (“L&S”), which relates primarily to crude oil, asphalt and refined petroleum products; and Gathering and Processing (“G&P”), which relates primarily to natural gas and NGLs. See Note 9 for additional information regarding the operations and results of these segments.
On July 30, 2019, MPLX completed its acquisition by merger (the “Merger”) of Andeavor Logistics LP (“ANDX”). At the effective time of the Merger, each common unit held by ANDX’s public unitholders was converted into the right to receive 1.135 MPLX common units. ANDX common units held by certain affiliates of MPC were converted into the right to receive 1.0328 MPLX common units. See Note 3 for additional information regarding the Merger.
Impairments – The recent outbreak of COVID-19 and its development into a pandemic in March 2020 has resulted in significant economic disruption globally. Actions taken by various governmental authorities, individuals and companies around the world to prevent the spread of COVID-19 through social distancing have restricted travel, many business operations, public gatherings and the overall level of individual movement and in-person interaction across the globe. This has significantly reduced global economic activity and resulted in a decline in the demand for the midstream services we provide. Macroeconomic conditions and global geopolitical events have also resulted in significant price volatility related to those aforementioned products.
The overall deterioration in the economy and the environment in which MPLX and our customers operate, as well as a sustained decrease in unit price, were considered triggering events resulting in impairments of the carrying value of certain assets. During the first quarter of 2020 we recognized impairments related to goodwill, certain equity method investments and certain long-lived assets (including intangibles), within our G&P segment. Many of our producer customers have continued to refine and update production forecasts in response to the current environment, which has impacted their current and expected future demand for our services, including the future utilization of our assets. Additionally, certain of our contracts have commodity price exposure, including NGL prices, which have experienced increased volatility as noted above. The table below provides information related to the impairments recognized during the first quarter of 2020 as well as the corresponding footnote where additional information can be found.
|
| | | | | | |
| (In millions) | | Impairment | | Footnote Reference |
| Goodwill | | $ | 1,814 |
| | 12 |
| Equity method investments | | 1,264 |
| | 4 |
| Intangibles, net | | 177 |
| | 12 |
| Property, plant and equipment, net | | 174 |
| | 11 |
| Total impairments | | $ | 3,429 |
| | |
Basis of Presentation – The accompanying interim consolidated financial statements are unaudited; however, in the opinion of MPLX’s management, these statements reflect all adjustments necessary for a fair statement of the results for the periods reported. All such adjustments are of a normal, recurring nature unless otherwise disclosed. These interim consolidated financial statements, including the notes, have been prepared in accordance with the rules and regulations of the SEC applicable to interim period financial statements and do not include all of the information and disclosures required by GAAP for complete financial statements. Certain amounts in prior years have been reclassified to conform to current year presentation.
These interim consolidated financial statements should be read in conjunction with the audited consolidated financial statements and notes thereto included in the Annual Report on Form 10-K for the year ended December 31, 2018.2019. The results of
operations for the three and nine months ended September 30, 2019March 31, 2020 are not necessarily indicative of the results to be expected for the full year.
In relation to the Merger described above and in Note 3, ANDX’s assets, liabilities and results of operations prior to the Merger are collectively included in what we refer to as the “Predecessor” from October 1, 2018, which was the date that MPC acquired Andeavor. MPLX’s acquisition of ANDX is considered a transfer between entities under common control due to MPC’s relationship with ANDX prior to the Merger. As an entity under common control with MPC, MPLX recorded the assets acquired and liabilities assumed on its consolidated balance sheets at MPC’s historical carrying value. Transfers of businesses between entities under common control require prior periods to be retrospectively adjusted for those dates that the entity was under common control. Accordingly, the accompanying financial statements and related notes of MPLX LP have been retrospectively adjusted to include the historical results of ANDX beginning October 1, 2018.
MPLX’s consolidated financial statements include all majority-owned and controlled subsidiaries. For non wholly-ownedwholly owned consolidated subsidiaries, the interests owned by third parties have been recorded as “Noncontrolling interests” on the accompanying Consolidated Balance Sheets. Intercompany investments, accounts and transactions have been eliminated. MPLX’s investments in which MPLX exercises significant influence but does not control and does not have a controlling financial interest are accounted for using the equity method. MPLX’s investments in a VIEVIEs in which MPLX exercises significant influence but does not control and is not the primary beneficiary are also accounted for using the equity method.
In preparing the Consolidated Statements of Equity, net income attributable to MPLX LP is allocated to Series A and Series B preferred unitholders based on a fixed distribution schedule. Distributions, although earned, are not accrued until declared. The allocation of net income attributable to MPLX LP for purposes of calculating net income per limited partner unit is described in Note 6.
2. Accounting Standards
Recently Adopted
ASU 2016-02, Leases2016-13, Credit Losses - Measurement of Credit Losses on Financial Instruments
WeEffective January 1, 2020, we adopted ASU No. 2016-02, Leases (Topic 842), as of January 1, 2019, electing the transition method which permits entities to adopt the provisions of the standard2016-13 using the modified retrospective approach without adjusting comparative periods. We also electedtransition method. This ASU requires entities to consider a broader range of information to estimate expected credit losses, which may result in earlier recognition of losses. The ASU requires the package of practical expedients permitted under the transition guidance within the new standard, which among other things, allowed uscompany to grandfather the historical accounting conclusions until a reassessment event is present. We have also elected the practical expedient to not recognize short-term leases on the balance sheet, the practical expedient related to right of way permits and land easements which allows us to carry forward our accounting treatment for those existing agreements, and the practical expedient to combine lease and non-lease components for the majority of our underlying classes of assets except for our third-party contractor service and equipment agreements and boat and barge equipment agreementsutilize an expected loss methodology in which we are the lessee. We did not elect the practical expedient to combine lease and non-lease components for arrangements in which we are the lessor. In instances where the practical expedient was not elected, lease and non-lease consideration is allocated based on relative standalone selling price.
Right of use (“ROU”) assets represent our right to use an underlying asset in which we obtain substantially allplace of the economic benefitsincurred loss methodology for financial instruments, including trade receivables, and the right to direct the use of the asset during the lease term. Lease liabilities represent our obligation to make lease payments arising from the lease. Operating lease ROU assets and lease liabilities are recognized at the commencement date based on the present value of lease payments over the lease term. We recognize ROU assets and lease liabilities on the balanceoff-balance sheet for leases with a lease term of greater than one year. Payments that are not fixed at the commencement of the lease are considered variable and are excluded from the ROU asset and lease liability calculations. In the measurement of our ROU assets and lease liabilities, the fixed lease payments in the agreement are discounted using a secured incremental borrowing rate for a term similar to the duration of the lease, as our leases do not provide implicit rates. Operating lease expense is recognized on a straight-line basis over the lease term.
credit exposures. Adoption of the new standard resulted in the recording of ROU assets and lease liabilities of approximately $629 million and $629 million, respectively, as of January 1, 2019. This is inclusive of ROU assets and lease liabilities related to ANDX of $124 million and $127 million respectively. The standard did not materiallyhave a material impact on our consolidated statements of income, cash flows or equityfinancial statements.
We are exposed to credit losses, primarily as a result of adoption.the midstream services that we provide. We assess each customer’s ability to pay through our credit review process, which considers various factors such as external credit ratings; a review of financial statements to determine liquidity, leverage, trends and business specific risks; market information; pay history and our business strategy. We monitor our ongoing credit exposure through timely review of customer payment activity. At March 31, 2020, we reported $522 million of accounts receivable, net of allowances of $1 million.
As a lessor under ASC 842, MPLX may be required
We are also exposed to re-classify existing operating leases to sales-type leases upon modification and related reassessmentcredit losses from off-balance sheet exposures, such as guarantees of the leases.joint venture debt. See Note 1921 for furthermore information regarding our ongoing evaluation of the impacts of lease reassessments as modifications occur.on these off-balance sheet exposures.
We also adopted the following standardASU during the first ninethree months of 2019,2020, which did not have a material impact to our financial statements or financial statement disclosures:
|
| | | |
| ASU | | | Effective Date |
2017-122018-13 | Derivatives and HedgingFair Value Measurement (Topic 820): Disclosure Framework - Targeted ImprovementsChanges to Accountingthe Disclosure Requirements for Hedging ActivitiesFair Value Measurement | | January 1, 20192020 |
| | | |
Not Yet Adopted
ASU 2017-04, Intangibles - Goodwill and Other - Simplifying the Test for Goodwill Impairment
In January 2017, the FASB issued an ASU which simplifies the subsequent measurement of goodwill by eliminating Step 2 from the goodwill impairment test. Under the new guidance, the recognition of an impairment charge is calculated based on the amount by which the carrying amount exceeds the reporting unit’s fair value, which could be different from the amount calculated under the current method using the implied fair value of the goodwill; however, the loss recognized should not exceed the total amount of goodwill allocated to that reporting unit. The guidance should be applied on a prospective basis, and is effective for annual or any interim goodwill impairment tests in fiscal years beginning after December 15, 2019. Early adoption is permitted for interim or annual goodwill impairment tests performed on testing dates after January 1, 2017.
ASU 2016-13, Credit Losses - Measurement of Credit Losses on Financial Instruments
In June 2016, the FASB issued an ASU related to the accounting for credit losses on certain financial instruments. The guidance requires that for most financial assets, losses be based on an expected loss approach which includes estimates of losses over the life of exposure that considers historical, current and forecasted information. Expanded disclosures related to the methods used
to estimate the losses as well as a specific disaggregation of balances for financial assets are also required. The change is effective for fiscal years beginning after December 15, 2019, and interim periods within those fiscal years, with early adoption permitted for fiscal years beginning after December 15, 2018, and interim periods within those fiscal years. We do not expect application of this ASU to have a material impact on our consolidated financial statements.
3. Acquisitions
Acquisition of Andeavor Logistics LP
As previously disclosed, on May 7, 2019, ANDX, Tesoro Logistics GP, LLC, then the general partner of ANDX (“TLGP”), MPLX, MPLX GP LLC, the general partner of MPLX (“MPLX GP”), and MPLX MAX LLC, a wholly-ownedwholly owned subsidiary of MPLX (“Merger Sub”), entered into an Agreement and Plan of Merger (the “Merger Agreement”) that provided for, among other things, the merger of Merger Sub with and into ANDX. On July 30, 2019, the Merger was completed, and ANDX survived the Merger as a wholly-ownedwholly owned subsidiary of MPLX. At the effective time of the Merger, each common unit held by ANDX’s public unitholders was converted into the right to receive 1.135 MPLX common units. ANDX common units held by certain affiliates of MPC were converted into the right to receive 1.0328 MPLX common units. See Note 7 for information on units issued in connection with the Merger.
Additionally, as a result of the Merger, each ANDX TexNew Mex Unit issued and outstanding immediately prior to the effective time of the Merger was converted into a right for Western Refining Southwest, Inc. (“Southwest, Inc.”), a wholly-ownedwholly owned subsidiary of MPC, as the holder of all such units, to receive a unit representing a substantially equivalent limited partner interest in MPLX (the “MPLX TexNew Mex Units”). By virtue of the conversion, all ANDX TexNew Mex Units were cancelled and ceased to exist as of the effective time of the Merger. The MPLX TexNew Mex Units are a new class of units in MPLX substantially equivalent to the ANDX TexNew Mex Units, including substantially equivalent rights, powers, duties and obligations that the ANDX TexNew Mex Units had immediately prior to the closing of the Merger. As a result of the Merger, the ANDX Special Limited Partner Interest outstanding immediately prior to the effective time of the Merger was converted into a right for Southwest Inc., as the holder of all such interest, to receive a substantially equivalent special limited partner interest in MPLX (the “MPLX Special Limited Partner Interest”). By virtue of the conversion, the ANDX Special Limited Partner Interest was cancelled and ceased to exist as of the effective time of the Merger. For information on ANDX’s preferred units, please see Note 7.
The assets of ANDX consist of a network of owned and operated crude oil, refined product and natural gas pipelines; crude oil and water gathering systems; refining logistics assets; terminals with crude oil and refined products storage capacity; rail facilities; marine terminals including storage; bulk petroleum distribution facilities; a trucking fleet; and natural gas processing and fractionation systems and complexes. The assets are located in the western and inland regions of the United States and complement MPLX’s existing business and assets.
MPC accounted for its October 1, 2018 acquisition of Andeavor (including acquiring control of ANDX), using the acquisition method of accounting, which required Andeavor assets and liabilities to be recorded by MPC at the acquisition date fair value. The Merger was closed on July 30, 2019, and the results of ANDX have been incorporated into the results of MPLX as of October 1, 2018, which is the date that common control was established. As a result of MPC’s relationship with both MPLX and ANDX, the Merger has been treated as a common control transaction, which requires the recasting of MPLX’s historical results and the recognition of assets acquired and liabilities assumed using MPC’s historical carrying value. The fair value of assets acquired and liabilities assumed shown below represents MPC’s historical carrying values as of October 1, 2018.
|
| | | | | | | | | | | |
| (In millions) | As Originally Reported | | Adjustments(1) | | As Adjusted |
| Cash and cash equivalents | $ | 83 |
| | $ | (53 | ) | | $ | 30 |
|
| Receivables, net | 241 |
| | 256 |
| | 497 |
|
| Inventories | 21 |
| | — |
| | 21 |
|
Other current assets(2) | 59 |
| | (7 | ) | | 52 |
|
| Equity method investments | 731 |
| | (89 | ) | | 642 |
|
| Property, plant and equipment, net | 6,709 |
| | (427 | ) | | 6,282 |
|
| Intangibles, net | 960 |
| | 74 |
| | 1,034 |
|
Other noncurrent assets(3) | 31 |
| | (8 | ) | | 23 |
|
| Total assets acquired | 8,835 |
| | (254 | ) | | 8,581 |
|
| Accounts payable | 198 |
| | 265 |
| | 463 |
|
Other current liabilities(4) | 188 |
| | (41 | ) | | 147 |
|
| Long-term debt | 4,916 |
| | — |
| | 4,916 |
|
Deferred credits and other long-term liabilities(5) | 75 |
| | 1 |
| | 76 |
|
| Total liabilities assumed | 5,377 |
| | 225 |
| | 5,602 |
|
| Net assets acquired excluding goodwill | 3,458 |
| | (479 | ) | | 2,979 |
|
| Goodwill | 7,428 |
| | 727 |
| | 8,155 |
|
| Net assets acquired | $ | 10,886 |
| | $ | 248 |
| | $ | 11,134 |
|
(1)Inclusive of activity recorded subsequent to the acquisition of ANDX on July 30, 2019, a portion of which was recorded as a non-cash contribution from MPC.
(2)Includes both related party and third party other current assets.
(3) Includes both related party and third party other noncurrent assets.
(4) Includes accrued liabilities, operating lease liabilities and long-term debt due within one year, as well as related party and third party other current liabilities.
(5) Includes deferred revenue and deferred income taxes, as well as related party and third party other noncurrent liabilities.
Details of the valuation methodology and significant inputs for fair value measurements are included below. The fair value measurements for equity method investments; property, plant and equipment; intangible assets and long-term debt are based on significant inputs that are not observable in the market and, therefore, represent Level 3 measurements.
Goodwill
The purchase consideration allocation resulted in the recognition of $8.2 billion in goodwill, which has been allocated between the L&S segment and the G&P segment at $7.2 billion and $1.0 billion, respectively.
Inventory
The fair value of inventory was recorded at cost as of October 1, 2018, as these items are related to spare parts as well as materials and supplies and approximate fair value.
Equity Method Investments
The fair value of the equity method investments is $642 million, which was determined based on applying income and market approaches. The income approach relied on the discounted cash flow method and the market approach relied on a market multiple approach considering historical and projected financial results. Discount rates for the discounted cash flow models were based on capital structures for similar market participants and included various risk premiums that account for risks associated with the specific investments.
Property, Plant and Equipment
The fair value of property, plant and equipment is $6.3 billion, which is based primarily on the cost approach. Key assumptions in the cost approach include determining the replacement cost by evaluating recent purchases of similar assets or published data, and adjusting replacement cost for economic and functional obsolescence, location, normal useful lives, and capacity (if applicable).
Acquired Intangible Assets
The fair value of the acquired identifiable intangible assets is $1.0 billion, which represents the value of various customer contracts and relationships and other intangible assets. The fair value of customer contracts and relationships is $950 million, which was valued by applying the multi-period excess earnings method, which is an income approach. Key assumptions in the income approach include the underlying contract cash flow estimates, remaining contract term, probability of renewal, growth rates and discount rates. The intangible assets are all finite lived and will be amortized over 2 to 10 years.
Debt
The fair value of the ANDX unsecured notes was measured using a market approach, based upon the average of quotes for the acquired debt from major financial institutions and a third-party valuation service. Additionally, approximately $1.1 billion of borrowings under revolving credit agreements approximate fair value. The ANDX revolving credit facilities with total capacity of $2.1 billion were terminated upon closing of the Merger and were repaid with borrowings under the MPLX revolving credit facility.
Acquisition Costs
We recognized $14$1 million in acquisition costs during the first quarter of 2019 related to the Merger, which are reflected in general and administrative expenses.
ANDX Revenue and Net Income
For the three and nine months ended September 30,March 31, 2019, we recognized $612 million and $1,789$589 million of revenues and other income respectively, related to ANDX. For the three and nine months ended September 30, 2019, we recognized $191 million and $539$180 million of net income respectively, related to ANDX.
Pro Forma Financial Information
The following unaudited pro forma information combines the historical operations of MPLX and ANDX, giving effect to the Merger as if it had been consummated on January 1, 2018, the beginning of the earliest period presented.
|
| | | | | | | | | | | | | | | |
| | Three Months Ended
September 30, | | Nine Months Ended
September 30, |
| (In millions) | 2019 | | 2018 | | 2019 | | 2018 |
| Total revenues and other income | $ | 2,280 |
| | $ | 2,312 |
| | $ | 6,725 |
| | $ | 6,371 |
|
| Net income attributable to MPLX LP | $ | 681 |
| | $ | 679 |
| | $ | 2,015 |
| | $ | 1,840 |
|
The pro forma information includes adjustments to align accounting policies, which include adjustments for capitalization of assets and treatment of turnaround and planned major maintenance costs. The pro forma information also includes adjustments related to: eliminating transactions between MPLX and ANDX which previously would have been recorded as transactions between related parties; basis differences on equity method investments as a result of recognition of MPC’s investments in ANDX’s equity method investments; depreciation and amortization expense to reflect the increased fair value of property, plant and equipment and increased amortization expense related to identifiable intangible assets; as well as adjustments to interest expense for the amortization of fair value adjustments over the remaining term of ANDX’s outstanding debt, reversal of ANDX’s historical amortization of debt issuance costs and debt discounts and to adjust for the difference in the weighted average interest rate between MPLX’s revolving credit facility and the ANDX revolving credit facilities.
The following table presents MPLX’s previously reported Consolidated Balance Sheet Data as of December 31, 2018 retrospectively adjusted for the Merger:
|
| | | | | | | | | | | |
| | December 31, 2018 |
| (In millions) | MPLX LP (Previously Reported) | | Predecessor | | MPLX LP (Currently Reported) |
| Assets | | | | | |
| Current assets: | | | | | |
| Cash and cash equivalents | $ | 68 |
| | $ | 9 |
| | $ | 77 |
|
| Receivables, net | 417 |
| | 194 |
| | 611 |
|
| Current assets - related parties | 290 |
| | 266 |
| | 556 |
|
| Inventories | 77 |
| | 21 |
| | 98 |
|
| Other current assets | 45 |
| | 53 |
| | 98 |
|
| Total current assets | 897 |
| | 543 |
| | 1,440 |
|
| Equity method investments | 4,174 |
| | 727 |
| | 4,901 |
|
| Property, plant and equipment, net | 14,639 |
| | 6,886 |
| | 21,525 |
|
| Intangibles, net | 424 |
| | 935 |
| | 1,359 |
|
| Goodwill | 2,586 |
| | 7,430 |
| | 10,016 |
|
| Noncurrent assets - related parties | 24 |
| | — |
| | 24 |
|
| Other noncurrent assets | 35 |
| | 25 |
| | 60 |
|
| Total assets | 22,779 |
| | 16,546 |
| | 39,325 |
|
| Liabilities | | | | | |
| Current liabilities: | | | | | |
| Accounts payable | 162 |
| | 104 |
| | 266 |
|
| Accrued liabilities | 250 |
| | 22 |
| | 272 |
|
| Current liabilities - related parties | 254 |
| | 248 |
| | 502 |
|
| Accrued property, plant and equipment | 294 |
| | 105 |
| | 399 |
|
| Accrued interest payable | 143 |
| | 41 |
| | 184 |
|
| Other current liabilities | 83 |
| | 562 |
| | 645 |
|
| Total current liabilities | 1,186 |
| | 1,082 |
| | 2,268 |
|
| Long-term deferred revenue | 80 |
| | 52 |
| | 132 |
|
| Long-term liabilities - related parties | 43 |
| | 3 |
| | 46 |
|
| Long-term debt | 13,392 |
| | 4,530 |
| | 17,922 |
|
| Deferred income taxes | 13 |
| | 1 |
| | 14 |
|
| Deferred credits and other liabilities | 197 |
| | 11 |
| | 208 |
|
| Total liabilities | 14,911 |
| | 5,679 |
| | 20,590 |
|
| Commitments and contingencies (see Note 20) | | | | | |
| Series A preferred units | 1,004 |
| | — |
| | 1,004 |
|
| Equity | | | | | |
| Common unitholders - public | 8,336 |
| | — |
| | 8,336 |
|
| Common unitholder - MPC | (1,612 | ) | | — |
| | (1,612 | ) |
| Equity of Predecessor | — |
| | 10,867 |
| | 10,867 |
|
| Accumulated other comprehensive loss | (16 | ) | | — |
| | (16 | ) |
| Total MPLX LP partners’ capital | 6,708 |
| | 10,867 |
| | 17,575 |
|
| Noncontrolling interests | 156 |
| | — |
| | 156 |
|
| Total equity | 6,864 |
| | 10,867 |
| | 17,731 |
|
| Total liabilities, preferred units and equity | $ | 22,779 |
| | $ | 16,546 |
| | $ | 39,325 |
|
Mt. Airy Terminal
On September 26, 2018, MPLX acquired an eastern U.S. Gulf Coast export terminal (the “Mt. Airy Terminal”) from Pin Oak Holdings, LLC for total consideration of $451 million. At the time of the acquisition, the terminal included tanks with 4 million barrels of third-party leased storage capacity and a dock with 120 mbpd of capacity. The Mt. Airy Terminal is located on the Mississippi River between New Orleans and Baton Rouge, is in close proximity to several Gulf Coast refineries including MPC’s Garyville Refinery and is near numerous rail lines and pipelines. The Mt. Airy Terminal is accounted for within the L&S segment. In the first quarter of 2019, an adjustment to the initial purchase price was made for approximately $5 million related to the final settlement of the acquisition, which was paid in the first six months of 2019 as shown on the statement of
cash flow. This reduced the total purchase price to $446 million and resulted in $336 million of property, plant and equipment, $121 million of goodwill and the remainder being attributable to net liabilities assumed.
Goodwill represents the significant growth potential of the terminal due to the multiple pipelines and rail lines which cross the property, the terminal’s position as an aggregation point for liquids growth in the region for both ocean-going vessels and inland barges, the proximity of the terminal to MPC’s Garyville refinery and other refineries in the region as well as the opportunity to construct an additional dock at the site.
Refining Logistics and Fuels Distribution Acquisition
On February 1, 2018, MPC and MPLX closed on an agreement for the dropdown of refining logistics assets and fuels distribution services to MPLX. MPC contributed these assets and services in exchange for $4.1 billion in cash and a fixed number of MPLX common units and general partner units of 111,611,111 and 2,277,778, respectively. The fair value of the common and general partner units issued as of the acquisition date was $4.3 billion based on the closing common unit price as of February 1, 2018, as recorded on the Consolidated Statements of Equity, for a total purchase price of $8.4 billion. The equity issued consisted of: (i) 85,610,278 common units to MPLX GP, (ii) 18,176,666 common units to MPLX Logistics Holdings LLC and (iii) 7,824,167 common units to MPLX Holdings Inc. MPLX also issued 2,277,778 general partner units to MPLX GP in order to maintain its 2 percent general partner interest (“GP Interest”) in MPLX. MPC agreed to waive approximately one-third of the first quarter 2018 distributions on the common units issued in connection with this transaction. As a result of this waiver, MPC did not receive $23.7 million of the distributions that would have otherwise accrued on such common units with respect to the first quarter of 2018. Immediately following this transaction, the GP Interest was converted into a non-economic general partner interest.
MPLX recorded this transaction on a historical basis as required for transactions between entities under common control. No effect was given to the prior periods as these entities were not considered businesses prior to the February 1, 2018 dropdown. In connection with the dropdown, approximately $830 million of net property, plant and equipment was recorded in addition to $85 million and $130 million of goodwill allocated to MPLX Refining Logistics LLC (“Refining Logistics”) and MPLX Fuels Distribution LLC (“Fuels Distribution”), respectively. Both the refining logistics assets and the fuels distribution services are accounted for within the L&S segment.
As of the transaction date, the Refining Logistics assets included 619 tanks with approximately 56 million barrels of storage capacity (crude, finished products and intermediates), 32 rail and truck racks, 18 docks, and gasoline blenders. These assets generate revenue through storage services agreements with MPC. Refining Logistics provides certain services to MPC related to the receipt, storage, throughput, custody and delivery of petroleum products in and through certain storage and logistical facilities and assets associated with MPC’s refineries.
Fuels Distribution, which is a wholly-owned subsidiary of MPLXT, generates revenue through a fuels distribution services agreement with MPC. Fuels Distribution is structured to provide a broad range of scheduling and marketing services as MPC’s agent.
4. Investments and Noncontrolling Interests
The following table presents MPLX’s equity method investments at the dates indicated:
| | | | Ownership as of | | Carrying value at | Ownership as of | | Carrying value at |
| | September 30, | | September 30, | | December 31, | March 31, | | March 31, | | December 31, |
| (In millions, except ownership percentages) | 2019 | | 2019 | | 2018 | 2020 | | 2020 | | 2019 |
| L&S | | | | | | | | |
| MarEn Bakken Company LLC | 25% | | $ | 483 |
| | $ | 498 |
| 25% | | $ | 479 |
| | $ | 481 |
|
| Illinois Extension Pipeline Company, L.L.C. | 35% | | 275 |
| | 275 |
| 35% | | 271 |
| | 265 |
|
| LOOP LLC | 41% | | 239 |
| | 226 |
| 41% | | 239 |
| | 238 |
|
Andeavor Logistics Rio Pipeline LLC(1) | 67% | | 201 |
| | 181 |
| 67% | | 200 |
| | 202 |
|
Minnesota Pipe Line Company, LLC(1) | 17% | | 192 |
| | 197 |
| 17% | | 190 |
| | 190 |
|
Whistler Pipeline LLC(1) | | 38% | | 163 |
| | 134 |
|
W2W Holdings LLC(1)(2) | | 50% | | 76 |
| | — |
|
Wink to Webster Pipeline LLC(1)(2) | | 15% | | — |
| | 126 |
|
| Explorer Pipeline Company | 25% | | 83 |
| | 90 |
| 25% | | 81 |
| | 83 |
|
Other(1) | | 199 |
| | 51 |
| | 55 |
| | 55 |
|
| Total L&S | | 1,672 |
| | 1,518 |
| | 1,754 |
| | 1,774 |
|
| G&P | | | | | | | | |
| MarkWest Utica EMG, L.L.C. | 56% | | 2,017 |
| | 2,039 |
| |
| Sherwood Midstream LLC | 50% | | 502 |
| | 366 |
| |
| MarkWest EMG Jefferson Dry Gas Gathering Company, L.L.C. | 67% | | 291 |
| | 236 |
| |
MarkWest Utica EMG, L.L.C.(1) | | 57% | | 712 |
| | 1,984 |
|
Sherwood Midstream LLC(1) | | 50% | | 546 |
| | 537 |
|
MarkWest EMG Jefferson Dry Gas Gathering Company, L.L.C.(1) | | 67% | | 302 |
| | 302 |
|
Rendezvous Gas Services, L.L.C.(1) | 78% | | 174 |
| | 248 |
| 78% | | 167 |
| | 170 |
|
| Sherwood Midstream Holdings LLC | 54% | | 159 |
| | 157 |
| |
Sherwood Midstream Holdings LLC(1) | | 52% | | 155 |
| | 157 |
|
| Centrahoma Processing LLC | 40% | | 155 |
| | 160 |
| 40% | | 150 |
| | 153 |
|
Other(1) | | 212 |
| | 177 |
| | 206 |
| | 198 |
|
| Total G&P | | 3,510 |
| | 3,383 |
| | 2,238 |
| | 3,501 |
|
| Total | | $ | 5,182 |
| | $ | 4,901 |
| | $ | 3,992 |
| | $ | 5,275 |
|
| |
| (1) | These investments as well as certainInvestments deemed to be VIE’s. Some investments included within “Other” for both L&S and G&P are investments acquired as part ofhave also been deemed to be VIE’s. |
| |
| (2) | During the Merger. The September 30, 2019 balance reflects all purchase accounting adjustments identified by MPC as part of its acquisition of Andeavor.three months ended March 31, 2020, we contributed our ownership in Wink to Webster Pipeline LLC to W2W Holdings LLC. |
As a result of the Merger, MPLX LP acquired an ownership interest in Rendezvous Gas Services, L.L.C. (“RGS”), Minnesota Pipe Line Company, LLC (“MNPL”) and Andeavor Logistics Rio Pipeline LLC (“ALRP”), among others. RGS and ALRPFor those entities that have been deemed to be VIEs, however,VIE’s, neither MPLX nor any of its subsidiaries have been deemed to be the primary beneficiary due to voting rights on significant matters. For all of the investments acquired through the Merger,While we have the ability to exercise influence through participation in the management committees which make all significant decisions. However,decisions, since we have equal or proportionate influence over each committee as a joint interest partner and all significant decisions require the consent of the other investors without regard to economic interest, we have determined that these entities should not be consolidated and apply the equity method of accounting with respect to our investments in each entity.
In addition to the investments acquired through the Merger, MarkWest Utica EMG, L.L.C. (“MarkWest Utica EMG”), Sherwood Midstream LLC (“Sherwood Midstream”), MarkWest EMG Jefferson Dry Gas Gathering Company, L.L.C. (“Jefferson Dry Gas”) and Sherwood Midstream Holdings LLC (“Sherwood Midstream Holdings”) are also deemed to be VIEs. However, consistent with the investments above, neither MPLX nor any of its subsidiaries are deemed to be the primary beneficiary due to voting rights on significant matters. Sherwood Midstream has been deemed the primary beneficiary of Sherwood Midstream Holdings due to its controlling financial interest through its authority to manage the joint venture. As a result, Sherwood Midstream consolidates Sherwood Midstream Holdings. Therefore, MPLX also reports its portion of Sherwood Midstream Holdings’ net assets as a component of its investment in Sherwood Midstream. As of September 30, 2019,March 31, 2020, MPLX has a 22.924.1 percent indirect ownership interest in Sherwood Midstream Holdings through Sherwood Midstream.
MPLX’s maximum exposure to loss as a result of its involvement with equity method investments includes its equity investment, any additional capital contribution commitments and any operating expenses incurred by the subsidiary operator in excess of its compensation received for the performance of the operating services. MPLX did not provide any financial support to equity method investments that it was not contractually obligated to provide during the ninethree months ended September 30, 2019.March 31, 2020.
During the first quarter of 2020, we assessed certain of our equity method investments for impairment as a result of a number of first quarter events and circumstances as discussed in Note 1. During the first quarter of 2020, we recorded an other than temporary impairment for three joint ventures in which we have an interest. Impairment of these investments was $1,264 million, of which $1,251 million was related to MarkWest Utica EMG, L.L.C. and its investment in Ohio Gathering Company, L.L.C. The fair value of the investments was determined based upon applying the discounted cash flow method, which is an income approach. The discounted cash flow fair value estimate is based on known or knowable information at the interim measurement date. The significant assumptions that were used to develop the estimate of the fair value under the discounted cash flow method include management’s best estimates of the expected future cash flows, including prices and volumes, the weighted average cost of capital and the long-term growth rate. Fair value determinations require considerable judgment and are sensitive to changes in underlying assumptions and factors. As such, the fair value of these equity method investments represents a Level 3 measurement. As a result, there can be no assurance that the estimates and assumptions made for purposes of the impairment test will prove to be an accurate prediction of the future. The impairment was recorded through “Income from equity method investments.” The impairments were largely due to a reduction in forecasted volumes gathered and processed by the systems operated by the joint ventures.
Summarized financial information for MPLX’s equity method investments for the ninethree months ended September 30,March 31, 2020 and 2019 and 2018 is as follows:
|
| | | | | | | | | | | |
| | Nine Months Ended September 30, 2019(1) |
| (In millions) | VIEs | | Non-VIEs | | Total |
| Revenues and other income | $ | 479 |
| | $ | 1,116 |
| | $ | 1,595 |
|
| Costs and expenses | 251 |
| | 434 |
| | 685 |
|
| Income from operations | 228 |
| | 682 |
| | 910 |
|
| Net income | 192 |
| | 605 |
| | 797 |
|
Income from equity method investments(2) | $ | 89 |
| | $ | 166 |
| | $ | 255 |
|
| | | | Nine Months Ended September 30, 2018(1) | Three Months Ended March 31, 2020 |
| (In millions) | VIEs | | Non-VIEs | | Total | VIEs | | Non-VIEs | | Total |
| Revenues and other income | $ | 340 |
| | $ | 967 |
| | $ | 1,307 |
| $ | (217 | ) | | $ | 337 |
| | $ | 120 |
|
| Costs and expenses | 202 |
| | 495 |
| | 697 |
| 104 |
| | 132 |
| | 236 |
|
| Income from operations | 138 |
| | 472 |
| | 610 |
| (321 | ) | | 205 |
| | (116 | ) |
| Net income | 135 |
| | 417 |
| | 552 |
| (337 | ) | | 186 |
| | (151 | ) |
Income from equity method investments(2) | $ | 44 |
| | $ | 131 |
| | $ | 175 |
| |
(Loss)/income from equity method investments(1) | | $ | (1,222 | ) | | $ | 38 |
| | $ | (1,184 | ) |
| |
| (1) | The financial information for equity method investments for the nine months ended September 30, 2019 includes the financial information of equity method investments acquired as part of the Merger while the financial information for the nine months ended September 30, 2018 does not. See Note 3 for additional details. |
| |
(2) | Includes the impact of any basis differential amortization or accretion.accretion in addition to the impairment of $1,264 million. |
|
| | | | | | | | | | | |
| | Three Months Ended March 31, 2019(1) |
| (In millions) | VIEs | | Non-VIEs | | Total |
| Revenues and other income | $ | 155 |
| | $ | 391 |
| | $ | 546 |
|
| Costs and expenses | 77 |
| | 198 |
| | 275 |
|
| Income from operations | 78 |
| | 193 |
| | 271 |
|
| Net income | 71 |
| | 181 |
| | 252 |
|
| Income from equity method investments | $ | 27 |
| | $ | 50 |
| | $ | 77 |
|
| |
| (1) | Financial information for the first quarter of 2019 has been retrospectively adjusted for the acquisition of ANDX. See Notes 1 and 3. |
Summarized balance sheet information for MPLX’s equity method investments as of September 30, 2019March 31, 2020 and December 31, 20182019 is as follows:
| | | | September 30, 2019(1) | March 31, 2020 |
| (In millions) | VIEs | | Non-VIEs | | Total | VIEs | | Non-VIEs | | Total |
| Current assets | $ | 378 |
| | $ | 388 |
| | $ | 766 |
| $ | 320 |
| | $ | 325 |
| | $ | 645 |
|
| Noncurrent assets | 5,469 |
| | 5,164 |
| | 10,633 |
| 5,384 |
| | 5,115 |
| | 10,499 |
|
| Current liabilities | 328 |
| | 254 |
| | 582 |
| 153 |
| | 195 |
| | 348 |
|
| Noncurrent liabilities | $ | 265 |
| | $ | 843 |
| | $ | 1,108 |
| $ | 544 |
| | $ | 859 |
| | $ | 1,403 |
|
| | | | December 31, 2018(1) | December 31, 2019 |
| (In millions) | VIEs | | Non-VIEs | | Total | VIEs | | Non-VIEs | | Total |
| Current assets | $ | 252 |
| | $ | 415 |
| | $ | 667 |
| $ | 534 |
| | $ | 330 |
| | $ | 864 |
|
| Noncurrent assets | 3,796 |
| | 5,290 |
| | 9,086 |
| 5,862 |
| | 5,134 |
| | 10,996 |
|
| Current liabilities | 158 |
| | 280 |
| | 438 |
| 192 |
| | 245 |
| | 437 |
|
| Noncurrent liabilities | $ | 191 |
| | $ | 845 |
| | $ | 1,036 |
| $ | 305 |
| | $ | 822 |
| | $ | 1,127 |
|
| |
(1) | The financial information for equity method investments at September 30, 2019 and December 31, 2018 is inclusive of financial information of equity method investments acquired as part of the Merger. See Note 3 for additional details.
|
As of September 30, 2019 andMarch 31, 2020, the underlying net assets of MPLX’s investees in the G&P segment exceeded the carrying value of its equity method investments by approximately $60 million, after the impairment charges recognized during the quarter. At December 31, 2018,2019, the carrying value of MPLX’s equity method investments in the G&P segment exceeded the underlying net assets of its investees by approximately $1.0 billion and $1.3 billion, respectively.billion. As of September 30, 2019March 31, 2020 and December 31, 2018,2019, the carrying value of MPLX’s equity method investments in the L&S segment exceeded the underlying net assets of its investees by $330 million and $329 million, respectively. At March 31, 2020 and $187 million, respectively. ThisDecember 31, 2019, the G&P basis difference iswas being amortized into net income over the remaining estimated useful lives of the underlying assets, except for $542$31 million and $498 million of excess related to goodwill, respectively. At March 31, 2020 and December 31, 2019, the L&S basis difference was being amortized into net income over the remaining estimated useful lives of the underlying assets, except for $167 million of excess related to goodwill, for the G&P and L&S segments, respectively.
5. Related Party Agreements and Transactions
MPLX engages in transactions with both MPC and certain of its equity method investments as part of its normal business; however, transactions with MPC make up the majority of MPLX’s related party transactions. Transactions with related parties are further described below.
Related Party Agreements
MPLX has various long-term, fee-based commercial agreements with MPC. Under these agreements, MPLX provides transportation, terminal, fuels distribution, marketing, storage, management, operational and other services to MPC. MPC has committed to provide MPLX with minimum throughput volumes on crude oil and refined products and other fees for storage capacity; a fixed fee for substantially all available capacity for boats and barges under the marine transportation services agreement; operating and management fees; as well as reimbursements for certain direct and indirect costs. In addition,MPC has also committed to provide a fixed fee for 100 percent of available capacity for boats, barges and third-party chartered equipment under the marine transportation service agreement. MPLX also has a keep-whole commodity agreement with MPC under which MPC pays us a processing fee for NGLs related to keep-whole agreements and delivers shrink gas to the producers on our behalf. We pay MPC a marketing fee in exchange for assuming the commodity risk. Additionally, MPLX has obligations to MPC for services provided to MPLX by MPC under omnibus and employee services type agreements as well as other various agreements.
Many of the material related party agreements acquired through the merger were consistent with MPLX’s existing agreements; however, one additional agreement that MPLX is now a party to is a keep-whole commodity agreement. ANDX was responsible for processing gas for certain producers under keep-whole processing agreements. Under a keep-whole agreement, the producer transfers title to the NGLs produced during gas processing, and the processor, in exchange, delivers to the producer natural gas with a BTU content equivalent to the NGLs removed. The operating margin for these contracts is typically determined by the spread between NGLs sales prices and the price paid to purchase the replacement natural gas (“Shrink Gas”). ANDX entered into the “Keep-Whole Commodity Agreement” with its sponsor at that time, whereby the sponsor paid ANDX a processing fee for NGLs related to keep-whole agreements and delivered Shrink Gas to the producers on its behalf. ANDX then paid its Sponsor a marketing fee in exchange for assuming the commodity risk. This agreement was modified in 2016 which adjusted the contract to provide for a tiered pricing structure for different NGL production levels. This contract continued as part of MPC’s acquisition of Andeavor, and MPLX is now party to this agreement.Related Party Loan
MPLX is also party to a loan agreement with MPC Investment LLC (“MPC Investment”) (the “MPC Loan Agreement”). Under the terms of the MPC Loan Agreement,agreement, MPC Investment makes a loan or loans to MPLX on a revolving basis as requested by MPLX and as agreed to by MPC Investment. On April 27, 2018, MPLX and MPC Investment amended and restated the MPC Loan Agreement to, among other things, increase the borrowing capacity under the MPC Loan Agreement from $500 million to $1.0 billion. In connection with the Merger, on July 31, 2019, MPLX and MPC Investment entered into a second amendment toamended and restated the MPC Loan Agreement to increase the borrowing capacity under the MPC Loan Agreement to $1.5 billion in aggregate principal amount of all loans outstanding at any one time. The entire unpaid principal amount of the loan, together with all accrued and unpaid interest and other amounts (if any), shall become due and payable on July 31, 2024, provided that MPC Investment may demand payment of all or any portion of the outstanding principal amount of the loan, together with all accrued and unpaid interest and other amounts (if any), at any time prior to July 31, 2024. Borrowings under the MPC Loan Agreement prior to July 31, 2019 bore interest at LIBOR plus 1.50 percent while borrowings as of and after July 31, 2019 will bear interest at LIBOR plus 1.25 percent or such lower rate as would be applicable to such loans under the MPLX Credit Agreement. Activity on the MPC Loan Agreement was as follows:
| | | (In millions) | Nine Months Ended September 30, 2019 | | Year Ended December 31, 2018 | Three Months Ended March 31, 2020 | | Year Ended December 31, 2019 |
| Borrowings | $ | 6,935 |
| | $ | 3,962 |
| $ | 1,667 |
| | $ | 8,540 |
|
| Average interest rate of borrowings | 3.640 | % | | 3.473 | % | 2.833 | % | | 3.441 | % |
| Repayments | $ | 6,810 |
| | $ | 4,347 |
| $ | 2,261 |
| | $ | 7,946 |
|
Outstanding balance at end of period(1) | $ | 125 |
| | $ | — |
| $ | — |
| | $ | 594 |
|
(1) Included in “Current liabilities - related parties” on the Consolidated Balance Sheets.
| |
| (1) | Included in “Current liabilities - related parties” on the Consolidated Balance Sheets. |
Prior to the Merger, ANDX was also party to a loan agreement with MPC (“ANDX-MPC Loan Agreement”). This facility was entered into on December 21, 2018, with a borrowing capacity of $500 million. In connection with the Merger, on July 31, 2019, MPLX repaid the entire outstanding balance and terminated the ANDX-MPC Loan Agreement. Activity on the ANDX-MPC Loan Agreement prior to the Merger was as follows:
| | | (In millions) | Nine Months Ended September 30, 2019 | Year Ended December 31, 2019 |
| Borrowings | $ | 773 |
| $ | 773 |
|
| Average interest rate of borrowings | 4.249 | % | 4.249 | % |
| Repayments | $ | 773 |
| $ | 773 |
|
| Outstanding balance at end of period | $ | — |
| $ | — |
|
Related Party Revenue
Related party sales to MPC consist of crude oil and refined products pipeline and trucking transportation services based on tariff/contracted rates; storage, terminal and fuels distribution services based on contracted rates; and marine transportation services. Related party sales to MPC also consist of revenue related to volume deficiency credits.
MPLX also has operating agreements with MPC under which it receives a fee for operating MPC’s retained pipeline assets and a fixed annual fee for providing oversight and management services required to run the marine business. MPLX also receives management fee revenue for engineering, construction and administrative services for operating certain of its equity method investments.
Revenue received from related parties included on the Consolidated Statements of Income was as follows:
| | | | Three Months Ended September 30, | | Nine Months Ended September 30, | Three Months Ended March 31, |
| (In millions) | 2019 | | 2018 | | 2019 | | 2018 | 2020 | | 2019 |
| Service revenues - related parties | | | | | | | | | | |
| MPC | $ | 899 |
| | $ | 568 |
| | $ | 2,549 |
| | $ | 1,588 |
| $ | 927 |
| | $ | 803 |
|
| Other | | 1 |
| | — |
|
| Total Service revenue - related parties | | 928 |
| | 803 |
|
| Rental income - related parties | | | | | | | | | | |
| MPC | 293 |
| | 190 |
| | 904 |
| | 525 |
| 234 |
| | 325 |
|
Product sales - related parties(1) | | | | | | | | | | |
| MPC | 32 |
| | 18 |
| | 109 |
| | 35 |
| 33 |
| | 41 |
|
| Other income - related parties | | | | | | | | | | |
| MPC | 14 |
| | 11 |
| | 34 |
| | 31 |
| 48 |
| | 10 |
|
| Other | 17 |
| | 15 |
| | 50 |
| | 42 |
| 16 |
| | 16 |
|
| Total Other income - related parties | $ | 31 |
| | $ | 26 |
| | $ | 84 |
| | $ | 73 |
| $ | 64 |
| | $ | 26 |
|
(1) There were additional product sales to MPC that net to zero within the consolidated financial statements as the transactions are recorded net due to the terms of the agreements under which such product was sold. For the three and nine months ended September 30, 2019, these sales totaled $301 million and $819 million, respectively. For the three and nine months ended September 30, 2018, these sales totaled $137 million and $328 million, respectively.
| |
| (1) | There were additional product sales to MPC that net to zero within the consolidated financial statements as the transactions are recorded net due to the terms of the agreements under which such product was sold. For the three months ended March 31, 2020, these sales totaled $173 million. For the three months ended March 31, 2019, these sales totaled $223 million. |
Related Party Expenses
MPC provides executive management services and certain general and administrative services to MPLX under the terms of our omnibus agreements (“Omnibus charges”). Omnibus charges included in “Rental cost of sales - related parties” primarily relate to services that support MPLX’s rental operations and maintenance of assets available for rent. Omnibus charges included in “Purchases - related parties” primarily relate to services that support MPLX’s operations and maintenance activities, as well as compensation expenses. Omnibus charges included in “General and administrative expenses” primarily relate to services that support MPLX’s executive management, accounting and human resources activities. MPLX LP also obtains employee services from MPC under employee services agreements (“ESA charges”). ESA charges for personnel directly involved in or supporting operations and maintenance activities related to rental services are classified as “Rental cost of sales - related parties.” ESA charges for personnel directly involved in or supporting operations and maintenance activities related to other services are classified as “Purchases - related parties.” ESA charges for personnel involved in executive management, accounting and human resources activities are classified as “General and administrative expenses.” In addition to these agreements, MPLX purchases products from MPC, makes payments to MPC in its capacity as general contractor to MPLX, and has certain rent and lease agreements with MPC.
Expenses incurred from MPC under the omnibus and employee services agreements as well as other purchases from MPC included on the Consolidated Statements of Income are as follows:
| | | | Three Months Ended September 30, | | Nine Months Ended September 30, | Three Months Ended March 31, |
| (In millions) | 2019 | | 2018 | | 2019 | | 2018 | 2020 | | 2019 |
| Rental cost of sales - related parties | $ | 45 |
| | $ | 1 |
| | $ | 124 |
| | $ | 2 |
| | | |
| MPC | | $ | 46 |
| | $ | 43 |
|
| Purchases - related parties | | | | | | | | | | |
| MPC | 297 |
| | 228 |
| | 878 |
| | 628 |
| 271 |
| | 273 |
|
| Other | 6 |
| | — |
| | 16 |
| | — |
| 5 |
| | 5 |
|
| Total Purchase - related parties | | 276 |
| | 278 |
|
| General and administrative expenses | 59 |
| | 48 |
| | 174 |
| | 131 |
| | | |
| Total | $ | 407 |
| | $ | 277 |
| | $ | 1,192 |
| | $ | 761 |
| |
| MPC | | $ | 64 |
| | $ | 62 |
|
Some charges incurred under the omnibus and ESA agreements are related to engineering services and are associated with assets under construction. These charges are added to “Property, plant and equipment, net” on the Consolidated Balance Sheets. For the three and nine months ended September 30,March 31, 2020 and 2019, these charges totaled $48$36 million and $127 million, respectively. For the three and nine months ended September 30, 2018, these charges totaled $46 million and $109$41 million, respectively.
Related Party Assets and Liabilities
Assets and liabilities with related parties appearing on the Consolidated Balance Sheets are detailed in the table below. This table identifies the various components of related party assets and liabilities, including those associated with leases (see Note 1920 for additional information) and deferred revenue on minimum volume commitments. During the nine months ended September 30, 2019 and the year ended December 31, 2018, MPC did not meet its minimum committed volumes based on the agreements identified above. If MPC fails to meet its minimum committed volumes, MPC will pay MPLX a deficiency payment based on the terms of the agreement. The deficiency amounts are recorded as “Current liabilities - related parties.” In many cases, MPC may then apply the amount of any such deficiency payments as a credit for volumes in excess of its minimum volume commitment in future periods under the terms of the applicable agreements. MPLX recognizes related party revenues for the deficiency payments when credits are used for volumes in excess of minimum quarterly volume commitments, where it is probable the customer will not use the credit in future periods or upon the expiration of the credits. The use or expiration of the credits is a decrease in “Current liabilities - related parties.” In addition, capital projects MPLX is undertaking at the request of MPC are reimbursed in cash and recognized in income over the remaining term of the applicable agreements or in some cases as an equity contribution from its sponsor.
| | | (In millions) | September 30, 2019 | | December 31, 2018 | March 31, 2020 | | December 31, 2019 |
| Current assets - related parties | | | | | | |
| Receivables - MPC | $ | 623 |
| | $ | 542 |
| $ | 538 |
| | $ | 621 |
|
| Receivables - Other | 22 |
| | 9 |
| 21 |
| | 22 |
|
| Prepaid - MPC | 6 |
| | 5 |
| 15 |
| | 9 |
|
| Other - MPC | 6 |
| | — |
| |
| Lease Receivables - MPC | 3 |
| | — |
| 26 |
| | 4 |
|
| Total | 660 |
| | 556 |
| 600 |
| | 656 |
|
| Noncurrent assets - related parties | | | | | | |
| Long-term receivables - MPC | 20 |
| | 24 |
| 28 |
| | 21 |
|
| Right of use assets - MPC | 232 |
| | — |
| 231 |
| | 232 |
|
| Long-term lease receivables - MPC | 44 |
| | — |
| 399 |
| | 43 |
|
| Unguaranteed residual asset - MPC | 6 |
| | — |
| 19 |
| | 7 |
|
| Total | 302 |
| | 24 |
| 677 |
| | 303 |
|
| Current liabilities - related parties | | | | | | |
| Payables - MPC | 477 |
| | 360 |
| 227 |
| | 911 |
|
| Payables - Other | 34 |
| | 76 |
| 16 |
| | 37 |
|
| Operating lease liabilities - MPC | 1 |
| | — |
| 1 |
| | 1 |
|
| Deferred revenue - Minimum volume deficiencies - MPC | 40 |
| | 57 |
| 38 |
| | 42 |
|
| Deferred revenue - Project reimbursements - MPC | 9 |
| | 9 |
| 14 |
| | 16 |
|
| Deferred revenue - Other | 1 |
| | — |
| |
| Deferred revenue - Project reimbursements - Other | | 1 |
| | 1 |
|
| Total | 562 |
| | 502 |
| 297 |
| | 1,008 |
|
| Long-term liabilities - related parties | | | | | | |
| Long-term operating lease liabilities - MPC | 231 |
| | — |
| 230 |
| | 230 |
|
| Long-term deferred revenue - Project reimbursements - MPC | 53 |
| | 46 |
| 54 |
| | 53 |
|
| Long-term deferred revenue - Other | 9 |
| | — |
| |
| Long-term deferred revenue - Project reimbursements - Other | | 6 |
| | 7 |
|
| Total | $ | 293 |
| | $ | 46 |
| $ | 290 |
| | $ | 290 |
|
Other Related Party Transactions
From time to time, MPLX may also sell to or purchase from related parties, assets and inventory at the lesser of average unit cost or net realizable value. Sales to related parties for the nine months ended September 30, 2019 and 2018 were $1 million and $3 million, respectively. Purchasespurchases from related parties were not material for the ninethree months ended September 30, 2019March 31, 2020 and 2018 were less than $1 million and $2 million, respectively.2019.
6. Net Income/(Loss) Per Limited Partner Unit
Net income/(loss) per unit applicable to common units is computed by dividing net income/(loss) attributable to MPLX LP less income/(loss) allocated to participating securities by the weighted average number of common units outstanding. Additional MPLX common units, and MPLX Series B preferred units, and TexNew Mex units were issued on July 30, 2019 as a result of the merger with ANDX as discussed in Note 3. Distributions declared on these newly issued common and Series B preferred units are a reduction to income available to MPLX common unit holders due to their participation in distributions of income. The classes
Classes of participating securities include common units, certain equity-based compensation awards, Series A preferred units and Series B preferred units for the three and nine months ended September 30,March 31, 2020 and 2019 and common units, certain equity-based compensation awards and Series A preferred units for the three and nine months ended September 30, 2018.include:
|
| | | |
| | Three Months Ended March 31, |
| | 2020 | | 2019 |
| Common Units | ü
| | ü
|
| Equity-based compensation awards | ü | | ü |
| Series A preferred units | ü
| | ü
|
| Series B preferred units | ü | | |
| TexNew Mex units | ü
| | |
For the three and nine months ended September 30,March 31, 2020 and 2019, and 2018, MPLX had dilutive potential common units consisting of certain equity-based compensation awards. Potential common units omitted from the diluted earnings per unit calculation for the three and nine months ended September 30,March 31, 2020 and 2019 were 1 million and 2018 were less than 1 million.million, respectively.
|
| | | | | | | |
| | Three Months Ended March 31, |
| (In millions) | 2020 | | 2019 |
| Net income attributable to MPLX LP | $ | (2,724 | ) | | $ | 503 |
|
Less: Distributions declared on Series A preferred units(1) | 20 |
| | 20 |
|
Distributions declared on Series B preferred units(1) | 11 |
| | — |
|
Limited partners’ distributions declared on MPLX common units (including common units of general partner)(1) | 728 |
| | 523 |
|
| Undistributed net loss attributable to MPLX LP | $ | (3,483 | ) |
| $ | (40 | ) |
| |
| (1) | See Note 7 for distribution information. |
|
| | | | | | | | | | | | | | | |
| | Three Months Ended March 31, 2020 |
| (In millions, except per unit data) | Limited Partners’ Common Units | | Series A Preferred Units | | Series B Preferred Units | | Total |
| Basic and diluted net income attributable to MPLX LP per unit | | | | | | | |
| Net income attributable to MPLX LP: | | | | | | | |
| Distributions declared | $ | 728 |
| | $ | 20 |
| | $ | 11 |
| | $ | 759 |
|
| Undistributed net loss attributable to MPLX LP | (3,483 | ) | | — |
| | — |
| | (3,483 | ) |
Net income attributable to MPLX LP(1) | $ | (2,755 | ) | | $ | 20 |
| | $ | 11 |
| | $ | (2,724 | ) |
| Weighted average units outstanding: | | | | | | | |
| Basic | 1,058 |
| | | | | |
|
| Diluted | 1,058 |
| | | | | |
|
| Net income attributable to MPLX LP per limited partner unit: | | | | | | | |
| Basic | $ | (2.60 | ) | | | | | | |
| Diluted | $ | (2.60 | ) | | | | | | |
| |
| (1) | Allocation of net income attributable to MPLX LP assumes all earnings for the period had been distributed based on the distribution priorities applicable to the period. |
|
| | | | | | | | | | | | | | | |
| | Three Months Ended September 30, | | Nine Months Ended September 30, |
| (In millions) | 2019 | | 2018 | | 2019 | | 2018 |
| Net income attributable to MPLX LP | $ | 629 |
| | $ | 510 |
| | $ | 1,614 |
| | $ | 1,384 |
|
Less: Distributions declared on Series A preferred units(1) | 20 |
| | 19 |
| | 61 |
| | 55 |
|
Distributions declared on Series B preferred units(1) | 10 |
| | — |
| | 31 |
| | — |
|
Limited partners’ distributions declared on MPLX common units (including common units of general partner)(1)(2) | 704 |
| | 507 |
| | 1,919 |
| | 1,471 |
|
| Undistributed net loss attributable to MPLX LP | $ | (105 | ) |
| $ | (16 | ) | | $ | (397 | ) | | $ | (142 | ) |
(1) See Note 7 for distribution information.
(2) The three and nine months ended September 30, 2019 amounts are net of $12.5 million and $25 million of quarterly waived distributions with respect to units held by MPC and its affiliates.
|
| | | | | | | | | | | | | | | |
| | Three Months Ended September 30, 2019 |
| (In millions, except per unit data) | Limited Partners’ Common Units | | Series A Preferred Units | | Series B Preferred Units | | Total |
| Basic and diluted net income attributable to MPLX LP per unit | | | | | | | |
| Net income attributable to MPLX LP: | | | | | | | |
| Distributions declared | $ | 704 |
| | $ | 20 |
| | $ | 10 |
| | $ | 734 |
|
| Undistributed net loss attributable to MPLX LP | (105 | ) | | — |
| | — |
| | (105 | ) |
Net income attributable to MPLX LP(1) | $ | 599 |
| | $ | 20 |
| | $ | 10 |
| | $ | 629 |
|
| Weighted average units outstanding: | | | | | | | |
Basic(2) | 974 |
| | 31 |
| | — |
| | 1,005 |
|
Diluted(2) | 975 |
| | 31 |
| | — |
| | 1,006 |
|
| Net income attributable to MPLX LP per limited partner unit: | | | | | | | |
| Basic | $ | 0.61 |
| | | | | | |
| Diluted | $ | 0.61 |
| | | | | | |
(1) Allocation of net income attributable to MPLX LP assumes all earnings for the period had been distributed based on the distribution priorities applicable to the period.
(2) The Series B preferred units and the MPLX common units issued in connection with the Merger were not outstanding during the entire three months ended September 30, 2019. See Notes 3 and 7 for additional information about the treatment of these units.
|
| | | | | | | | | | | |
| | Three Months Ended September 30, 2018 |
| (In millions, except per unit data) | Limited Partners’ Common Units | | Series A Preferred Units | | Total |
| Basic and diluted net income attributable to MPLX LP per unit | | | | | |
| Net income attributable to MPLX LP: | | | | | |
| Distributions declared | $ | 507 |
| | $ | 19 |
| | $ | 526 |
|
| Undistributed net loss attributable to MPLX LP | (16 | ) | | — |
| | (16 | ) |
Net income attributable to MPLX LP(1) | $ | 491 |
| | $ | 19 |
| | $ | 510 |
|
| Weighted average units outstanding: | | | | | |
| Basic | 794 |
| | 31 |
| | 825 |
|
| Diluted | 794 |
| | 31 |
| | 825 |
|
| Net income attributable to MPLX LP per limited partner unit: | | | | | |
| Basic | $ | 0.62 |
| |
|
| | |
| Diluted | $ | 0.62 |
| |
|
| | |
(1) Allocation of net income attributable to MPLX LP assumes all earnings for the period had been distributed based on the distribution priorities applicable to the period.
| | | | Nine Months Ended September 30, 2019 | Three Months Ended March 31, 2019 |
| (In millions, except per unit data) | Limited Partners’ Common Units | | Series A Preferred Units | | Series B Preferred Units | | Total | Limited Partners’ Common Units | | Series A Preferred Units | | Total |
| Basic and diluted net income attributable to MPLX LP per unit: | | | | | | | | |
| Basic and diluted net income attributable to MPLX LP per unit | | | | | | |
| Net income attributable to MPLX LP: | | | | | | | | | | | | |
| Distributions declared | $ | 1,919 |
| | $ | 61 |
| | $ | 31 |
| | $ | 2,011 |
| $ | 523 |
| | $ | 20 |
| | $ | 543 |
|
| Undistributed net loss attributable to MPLX LP | (397 | ) | | — |
| | — |
| | (397 | ) | (40 | ) | | — |
| | (40 | ) |
Net income attributable to MPLX LP(1) | $ | 1,522 |
| | $ | 61 |
| | $ | 31 |
| | $ | 1,614 |
| $ | 483 |
| | $ | 20 |
| | $ | 503 |
|
| Weighted average units outstanding: | | | | | | | | | | | | |
Basic(2) | 855 |
| | 31 |
| | — |
| | 886 |
| 794 |
| | | |
|
Diluted(2) | 855 |
| | 31 |
| | — |
| | 886 |
| 795 |
| | | |
|
| Net income attributable to MPLX LP per limited partner unit: | | | | | | | | | | | | |
| Basic | $ | 1.78 |
| | | | | | | $ | 0.61 |
| |
|
| | |
| Diluted | $ | 1.78 |
| | | | | | | $ | 0.61 |
| |
|
| | |
(1) Allocation of net income attributable to MPLX LP assumes all earnings for the period had been distributed based on the distribution priorities applicable to the period.
(2) The Series B preferred units and the MPLX common units issued in connection with the Merger were not outstanding during the entire nine months ended September 30, 2019. See Notes 3 and 7 for additional information about the treatment of these units.
|
| | | | | | | | | | | |
| | Nine Months Ended September 30, 2018 |
| (In millions, except per unit data) | Limited Partners’ Common Units | | Series A Preferred Units | | Total |
| Basic and diluted net income attributable to MPLX LP per unit: | | | | | |
| Net income attributable to MPLX LP: | | | | | |
| Distributions declared | $ | 1,471 |
| | $ | 55 |
| | $ | 1,526 |
|
| Undistributed net loss attributable to MPLX LP | (142 | ) | | — |
| | (142 | ) |
Net income attributable to MPLX LP(1) | $ | 1,329 |
| | $ | 55 |
| | $ | 1,384 |
|
| Weighted average units outstanding: | | | | | |
| Basic | 750 |
| | 31 |
| | 781 |
|
| Diluted | 750 |
| | 31 |
| | 781 |
|
| Net income attributable to MPLX LP per limited partner unit: | | | | | |
| Basic | $ | 1.77 |
| | | | |
| Diluted | $ | 1.77 |
| | | | |
(1) Allocation of net income attributable to MPLX LP assumes all earnings for the period had been distributed based on the distribution priorities applicable to the period.
| |
| (1) | Allocation of net income attributable to MPLX LP assumes all earnings for the period had been distributed based on the distribution priorities applicable to the period. |
7. Equity
The changes in the number of common units outstanding during the ninethree months ended September 30, 2019March 31, 2020 are summarized below:
|
| | |
| (In units) | Common |
Balance at December 31, 20182019 | 794,089,5181,058,355,471 |
|
| Unit-based compensation awards | 287,019 |
|
Issuance of units in connection with the Merger | 262,829,592 |
|
Conversion of Series A preferred units | 1,148,330151,878 |
|
Balance at September 30, 2019March 31, 2020 | 1,058,354,4591,058,507,349 |
|
In connection with the Merger and as discussed in Note 3, each common unit held by ANDX’s public unitholders was converted into the right to receive 1.135 MPLX common units while ANDX common units held by certain affiliates of MPC were converted into the right to receive 1.0328 MPLX common units. This resulted in the issuance of MPLX common units of approximately 102 million units to public unitholders and approximately 161 million units to MPC in connection with MPLX's acquisition of ANDX on July 30, 2019. Also during the quarter, certain holders of Series A preferred units exercised their rights to convert their Series A preferred units into common units as discussed in Note 8.
Series B Preferred Units
Prior to the Merger, ANDX issuedhad outstanding 600,000 units of 6.875 percent Fixed-to-Floating Rate Cumulative Redeemable Perpetual Preferred Units representing limited partner interests of ANDX at a price to the public of $1,000 per unit. Upon completion of the Merger, the ANDX preferred units converted to preferred units of MPLX representing substantially equivalent limited partnership interests in MPLX (the “Series B preferred units”). The Series B preferred units are pari passu with the Series A preferred units with respect to distribution rights and rights upon liquidation. Distributions on the Series B preferred units are payable semi-annually in arrears on the 15th day, or the first business day thereafter, of February and August of each year throughup to and including February 15, 2023. After February 15, 2023, the distribution will be madeholders of Series B preferred units are entitled to receive cumulative, quarterly distributions payable in arrears on the 15th day or the first business day thereafter, of February, May, August and November of each year, to holders of record as of the record date, which is generally the close of business onor the first business day ofthereafter, based on a floating annual rate equal to the month of the applicable payment date.three-month LIBOR plus 4.652 percent.
The changes in the Series B preferred unit balance from the MergerDecember 31, 2019 through September 30, 2019March 31, 2020 are summarized below andbelow. Series B preferred units are included in the Consolidated Balance Sheets and Consolidated Statements of Equity within “Equity of Predecessor” for the period prior to the Merger and within “Series B preferred units” for the period following the Merger. The Series B preferred units are recorded at fair value as
| | | (In millions) | Series B Preferred Units | Series B Preferred Units |
| Beginning Balance at the Merger date | $ | 615 |
| |
| Balance at December 31, 2019 | | $ | 611 |
|
| Net income allocated | 7 |
| 11 |
|
| Distributions received by Series B preferred unitholders | (21 | ) | (21 | ) |
| Balance at September 30, 2019 | $ | 601 |
| |
| Balance at March 31, 2020 | | $ | 601 |
|
TexNew Mex Units - Prior to the Merger, MPC held 80,000 Andeavor Logistics TexNew Mex units, representing all outstanding units. At the time of the Merger, each Andeavor Logistics TexNew Mex unit was automatically converted into TexNew Mex units of MPLX with substantially the same rights and obligations as the Andeavor Logistics TexNew Mex units. The TexNew Mex units represent the right to receive quarterly distribution payments in an amount calculated using the distributable cash flow generated by a particular portion of the TexNew Mex pipeline system, in excess of a base amount and adjusted for previously agreed upon stipulations and contingencies. In 2019, distributions of less than $1 million were earned by the TexNew Mex units, which were declared in January of 2020 and paid in February 2020. NaN distributions were earned by the TexNew Mex units in the first quarter of 2020.
Cash distributions – In accordance with the MPLX partnership agreement, on October 25, 2019April 28, 2020, MPLX declared a quarterly cash distribution for the thirdfirst quarter of 2019,2020, totaling $704$728 million, or $0.6775$0.6875 per common unit, which includes common units issued on July 30, 2019 as a result of the Merger.unit. This rate will also be received by Series A preferred unitholders. These distributions will be paid on November 14, 2019May 15, 2020 to common unitholders of record on November 4, 2019May 8, 2020. The $704 million of common unit distributions is net of $12.5 million in quarterly waived distributions by MPC. This waiver was instituted in 2017 under the terms of ANDX’s historical partnership agreement with Andeavor. The waiver will remain in effect through 2019 which is the original term of the waiver agreement.
Additionally, as a result of the Merger, 600,000 ANDX preferred units were converted into 600,000 preferred units of MPLX. Series B preferred unitholders are entitled to receive when and if declared by the board, a fixed distribution of $68.75 per unit, per annum, payable semi-annually in arrears on February 15 and August 15, or the first business day thereafter.thereafter, up to and including February 15, 2023. After February 15, 2023, the holders of Series B preferred units are entitled to receive cumulative, quarterly distributions payable in arrears on the 15th day of February, May, August and November of each year, or the first business day thereafter, based on a floating annual rate equal to the three-month LIBOR plus 4.652 percent, in each case assuming a distribution is declared by the Board of Directors. MPLX made a cash distribution to holders of the Series B preferred unitholders on August 15, 2019in February 2020 for approximately $21 million.
Quarterly distributions for 2019the first quarter of 2020 and 20182019 are summarized below:
| | | (Per common unit) | 2019 | | 2018 | 2020 | | 2019 |
| March 31, | $ | 0.6575 |
| | $ | 0.6175 |
| $ | 0.6875 |
| | $ | 0.6575 |
|
| June 30, | 0.6675 |
| | 0.6275 |
| |
| September 30, | $ | 0.6775 |
| | $ | 0.6375 |
| |
The allocation of total quarterly cash distributions to limited and preferred unitholders is as follows for the three and nine months ended September 30, 2019March 31, 2020 and 2018.2019. MPLX’s distributions are declared subsequent to quarter end; therefore, the following table represents total cash distributions applicable to the period in which the distributions were earned.
| | | | Three Months Ended September 30, | | Nine Months Ended September 30, | Three Months Ended March 31, |
| (In millions) | 2019 | | 2018 | | 2019 | | 2018 | 2020 | | 2019(1) |
| Common and preferred unit distributions: | | | | | | | | | | |
| Common unitholders, includes common units of general partner | $ | 704 |
| | $ | 507 |
| | $ | 1,919 |
| | $ | 1,471 |
| $ | 728 |
| | $ | 523 |
|
| Series A preferred unit distributions | 20 |
| | 19 |
| | 61 |
| | 55 |
| 20 |
| | 20 |
|
| Series B preferred unit distributions | 10 |
| | — |
| | 31 |
| | — |
| 11 |
| | — |
|
| Total cash distributions declared | $ | 734 |
| | $ | 526 |
| | $ | 2,011 |
| | $ | 1,526 |
| $ | 759 |
| | $ | 543 |
|
The distribution on common units for the three and nine months ended September 30, 2019 includes the impact of the issuance of approximately 102 million units issued to public unitholders and approximately 161 million units issued to MPC in connection with the Merger. Due to the timing of the closing, distributions presented in the table above for the second quarter include distributions on MPLX common units issued to former ANDX unitholders in connection with the Merger. Due to the waiver mentioned above, the distributions on common units exclude $12.5 million of waived distributions for the three months ended September 30, 2019 and $25 million of waived distributions for the nine months ended September 30, 2019. Also included in the table above is $10 million of distributions earned by the Series B preferred units for the three months ended September 30, 2019 as well as $21 million of distributions earned on the Series B units and declared and paid by MPLX during the third quarter.
| |
| (1) | The distribution on common units for the three months ended March 31, 2019 does not include the impact of the issuance of units in connection with the merger. |
8. Series A Preferred Units
On May 13, 2016, MPLX LP completed the private placement ofissued approximately 30.8 million 6.5 percent Series A Convertible preferred units for a cash purchase price of $32.50 per unit. The aggregate net proceeds of approximately $984 million from the sale of the preferred units were used for capital expenditures, repayment of debt and general business purposes. The Series A preferred units rank senior to all common units and pari passu with all Series B preferred units with respect to distributions and rights upon liquidation. The holders of the Series A preferred units received cumulative quarterly distributions equal to $0.528125 per unit for each quarter prior to the second quarter of 2018. Beginning with the second quarter of 2018, the holders of the Series A preferred units are entitled to receive, when and if declared by the board, a quarterly distribution equal to the greater of $0.528125 per unit or the amount of distributions they would have received on an as converted basis. On October 25, 2019April 28, 2020, MPLX declared a quarterly cash distribution of $0.6775$0.6875 per common unit for the thirdfirst quarter of 2019.2020. Holders of the Series A preferred units will receive the common unit rate in lieu of the lower $0.528125 base amount.
The holders may convert their Series A preferred units into common units at any time, in full or in part, subject to minimum conversion amounts and conditions. After the fourth anniversary of the issuance date, MPLX may convert the Series A preferred units into common units at any time, in whole or in part, subject to certain minimum conversion amounts and conditions, if the closing price of MPLX LP common units is greater than $48.75 for the 20-day trading period immediately preceding the conversion notice date. The conversion rate for the Series A preferred units shall be the quotient of (a) the sum of (i) $32.50, plus (ii) any unpaid cash distributions on the applicable preferred unit, divided by (b) $32.50, subject to adjustment for unit distributions, unit splits and similar transactions. The holders of the Series A preferred units are entitled to vote on an as-converted basis with the common unitholders and have certain other class voting rights with respect to any amendment to the MPLX partnership agreement that would adversely affect any rights, preferences or privileges of the preferred units. In addition, upon certain events involving a change of control, the holders of preferred units may elect, among other potential elections, to convert their Series A preferred units to common units at the then change of control conversion rate.
On September 20, 2019, certain holders exercised their right to convert a total of 1.2 million Series A preferred units into common units. As a result of the transaction, approximatelyApproximately 29.6 million Series A preferred units remainremaining outstanding as of September 30, 2019.
March 31, 2020. The changes in the redeemable preferred balance from December 31, 20182019 through September 30, 2019March 31, 2020 are summarized below:
| | | (In millions) | Redeemable Series A Preferred Units | Redeemable Series A Preferred Units |
| Balance at December 31, 2018 | $ | 1,004 |
| |
| Balance at December 31, 2019 | | $ | 968 |
|
| Net income allocated | 61 |
| 20 |
|
| Distributions received by Series A preferred unitholders | (61 | ) | (20 | ) |
| Conversion of Series A preferred units to common units | (36 | ) | |
| Balance at September 30, 2019 | $ | 968 |
| |
| Balance at March 31, 2020 | | $ | 968 |
|
The Series A preferred units are considered redeemable securities under GAAP due to the existence of redemption provisions upon a deemed liquidation event which is outside MPLX’s control. Therefore, they are presented as temporary equity in the mezzanine section of the Consolidated Balance Sheets. The Series A preferred units have been recorded at their issuance date fair value, net of issuance costs. Income allocations increase the carrying value and declared distributions decrease the carrying value of the Series A preferred units. As the Series A preferred units are not currently redeemable and not probable of becoming redeemable, adjustment to the initial carrying amount is not necessary and would only be required if it becomes probable that the Series A preferred units would become redeemable.
9. Segment Information
MPLX’s chief operating decision maker is the chief executive officer (“CEO”) of its general partner. The CEO reviews MPLX’s discrete financial information, makes operating decisions, assesses financial performance and allocates resources on a type of service basis. MPLX has 2 reportable segments: L&S and G&P. Each of these segments is organized and managed based upon the nature of the products and services it offers.
L&S – transports, stores, distributes and markets crude oil, asphalt, refined petroleum products and water. Also includes an inland marine business, terminals, rail facilities, storage caverns and refining logistics.
G&P – gathers, processes and transports natural gas; and gathers, transports, fractionates, stores and markets NGLs.
Our CEO evaluates the performance of our segments using Segment Adjusted EBITDA. Amounts included in net income and excluded from Segment Adjusted EBITDA include: (i) depreciation and amortization; (ii) provision/(benefit) for income taxes; (iii) amortization of deferred financing costs; (iv) extinguishment of debt; (v) non-cash equity-based compensation; (vi) impairment expense; (vii) net interest and other financial costs; (viii) income/(loss) from equity method investments; (ix) distributions and adjustments related to equity method investments; (x) unrealized derivative gains/(losses); (xi) acquisition costs; (xii) noncontrolling interest; and (xiii) other adjustments as deemed necessary. These items are either: (i) believed to be non-recurring in nature; (ii) not believed to be allocable or controlled by the segment; or (iii) are not tied to the operational performance of the segment.
The tables below present information about revenues and other income, capital expenditures and investments in unconsolidated affiliates as well as total assets for our reportable segments:
| | | | Three Months Ended September 30, | | Nine Months Ended September 30, | Three Months Ended March 31, |
| (In millions) | 2019 | | 2018 | | 2019 | | 2018 | 2020 | | 2019(1) |
| L&S | | | | | | | | | | |
| Service revenue | $ | 976 |
| | $ | 602 |
| | $ | 2,787 |
| | $ | 1,682 |
| $ | 1,004 |
| | $ | 889 |
|
| Rental income | 304 |
| | 191 |
| | 935 |
| | 526 |
| 242 |
| | 335 |
|
| Product related revenue | 22 |
| | 5 |
| | 57 |
| | 10 |
| 19 |
| | 15 |
|
| Income from equity method investments | 60 |
| | 43 |
| | 159 |
| | 123 |
| 50 |
| | 45 |
|
| Other income | 17 |
| | 12 |
| | 45 |
| | 36 |
| 51 |
| | 12 |
|
Total segment revenues and other income(1) | 1,379 |
| | 853 |
| | 3,983 |
| | 2,377 |
| |
Segment Adjusted EBITDA(2) | 766 |
| | 547 |
| | 1,895 |
| | 1,510 |
| |
| Maintenance capital expenditures | 57 |
| | 31 |
| | 128 |
| | 78 |
| |
| Growth capital expenditures | 216 |
| | 78 |
| | 618 |
| | 325 |
| |
Total segment revenues and other income(2) | | 1,366 |
| | 1,296 |
|
Segment Adjusted EBITDA(3) | | 872 |
| | 559 |
|
| Capital expenditures | | 184 |
| | 198 |
|
| Investments in unconsolidated affiliates | | 54 |
| | 7 |
|
| G&P | | | | | | | | | | |
| Service revenue | 555 |
| | 422 |
| | 1,627 |
| | 1,154 |
| 536 |
| | 528 |
|
| Rental income | 88 |
| | 88 |
| | 260 |
| | 251 |
| 88 |
| | 89 |
|
| Product related revenue | 207 |
| | 311 |
| | 714 |
| | 831 |
| 222 |
| | 276 |
|
| Income from equity method investments | 35 |
| | 21 |
| | 96 |
| | 52 |
| |
| (Loss)/income from equity method investments | | (1,234 | ) | | 32 |
|
| Other income | 16 |
| | 17 |
| | 45 |
| | 45 |
| 14 |
| | 14 |
|
Total segment revenues and other income(1) | 901 |
| | 859 |
| | 2,742 |
| | 2,333 |
| |
Segment Adjusted EBITDA(2) | 399 |
| | 390 |
| | 1,120 |
| | 1,054 |
| |
| Maintenance capital expenditures | 18 |
| | 9 |
| | 46 |
| | 20 |
| |
| Growth capital expenditures | $ | 302 |
| | $ | 380 |
| | $ | 861 |
| | $ | 1,057 |
| |
Total segment revenues and other (loss)/income(2) | | (374 | ) | | 939 |
|
Segment Adjusted EBITDA(3) | | 422 |
| | 371 |
|
| Capital expenditures | | 134 |
| | 306 |
|
| Investments in unconsolidated affiliates | | $ | 37 |
| | $ | 128 |
|
(1) Within the total segment revenues and other income amounts presented above, third party revenues for the L&S segment were $182 million and $498 million for the three and nine months ended September 30, 2019, respectively, and $82 million and $227 million for the three and nine months ended September 30, 2018, respectively. Third party revenues for the G&P segment were $843 million and $2,581 million for the three and nine months ended September 30, 2019, respectively, and $828 million and $2,262 million for the three and nine months ended September 30, 2018, respectively.
(2) See below for the reconciliation from Segment Adjusted EBITDA to net income.
| |
| (1) | Financial information for the first quarter of 2019 has been retrospectively adjusted for the acquisition of ANDX. See Notes 1 and 3. |
| |
| (2) | Within the total segment revenues and other income amounts presented above, third party revenues for the L&S segment were $158 million and $153 million for the three months ended March 31, 2020 and 2019, respectively. Third party losses for the G&P segment were $425 million for the three months ended March 31, 2020 and third party revenues were $887 million for the three months ended March 31, 2019. |
| |
| (3) | See below for the reconciliation from Segment Adjusted EBITDA to net income. |
| | | (In millions) | September 30, 2019 | | December 31, 2018 | March 31, 2020 | | December 31, 2019 |
| Segment assets | | | | | | |
| Cash and cash equivalents | $ | 41 |
| | $ | 77 |
| $ | 57 |
| | $ | 15 |
|
| L&S | 20,579 |
| | 19,963 |
| 20,891 |
| | 20,810 |
|
| G&P | 20,661 |
| | 19,285 |
| 16,058 |
| | 19,605 |
|
| Total assets | $ | 41,281 |
| | $ | 39,325 |
| $ | 37,006 |
| | $ | 40,430 |
|
The table below provides a reconciliation between net (loss)/income and Segment Adjusted EBITDA.
| | | | Three Months Ended September 30, | | Nine Months Ended September 30, | Three Months Ended March 31, |
| (In millions) | 2019 | | 2018 | | 2019 | | 2018 | 2020 | | 2019(1) |
| Reconciliation to Net income: | | | | | | | | |
| Reconciliation to Net (loss)/income: | | | | |
| L&S Segment Adjusted EBITDA | $ | 766 |
| | $ | 547 |
| | $ | 1,895 |
| | $ | 1,510 |
| $ | 872 |
| | $ | 559 |
|
| G&P Segment Adjusted EBITDA | 399 |
| | 390 |
| | 1,120 |
| | 1,054 |
| 422 |
| | 371 |
|
| Total reportable segments | 1,165 |
| | 937 |
| | 3,015 |
| | 2,564 |
| 1,294 |
| | 930 |
|
Depreciation and amortization(1)(2) | (302 | ) | | (201 | ) | | (916 | ) | | (565 | ) | (325 | ) | | (301 | ) |
| Provision for income taxes | (4 | ) | | (3 | ) | | (2 | ) | | (8 | ) | |
| Benefit for income taxes | | — |
| | 1 |
|
| Amortization of deferred financing costs | (10 | ) | | (14 | ) | | (29 | ) | | (45 | ) | (14 | ) | | (7 | ) |
| Non-cash equity-based compensation | (5 | ) | | (6 | ) | | (17 | ) | | (15 | ) | (5 | ) | | (7 | ) |
| Impairment expense | | (2,165 | ) | | — |
|
| Net interest and other financial costs | (223 | ) | | (139 | ) | | (657 | ) | | (389 | ) | (216 | ) | | (217 | ) |
| Income from equity method investments | 95 |
| | 64 |
| | 255 |
| | 175 |
| |
| (Loss)/income from equity method investments | | (1,184 | ) | | 77 |
|
| Distributions/adjustments related to equity method investments | (145 | ) | | (112 | ) | | (399 | ) | | (314 | ) | (124 | ) | | (122 | ) |
Unrealized derivative gains/(losses)(2) | 11 |
| | (17 | ) | | 7 |
| | (18 | ) | |
Unrealized derivative gains/(losses)(3) | | 15 |
| | (4 | ) |
| Acquisition costs | (9 | ) | | — |
| | (14 | ) | | (3 | ) | — |
| | (1 | ) |
| Other | (1 | ) | | — |
| | (1 | ) | | — |
| (1 | ) | | — |
|
| Adjusted EBITDA attributable to noncontrolling interests | 9 |
| | 7 |
| | 23 |
| | 13 |
| 9 |
| | 7 |
|
Adjusted EBITDA attributable to Predecessor(3) | 108 |
| | — |
| | 770 |
| | — |
| |
| Net income | $ | 689 |
| | $ | 516 |
| | $ | 2,035 |
| | $ | 1,395 |
| |
Adjusted EBITDA attributable to Predecessor(4) | | — |
| | 333 |
|
| Net (loss)/income | | $ | (2,716 | ) | | $ | 689 |
|
(1) Depreciation and amortization attributable to L&S was $113 million and $373 million for the three and nine months ended September 30, 2019, respectively, and $62 million and $171 million for the three and nine months ended September 30, 2018, respectively. Depreciation and amortization attributable to G&P was $189 million and $543 million for the three and nine months ended September 30, 2019, respectively, and $139 million and $394 million for the three and nine months ended September 30, 2018, respectively.
(2) MPLX makes a distinction between realized and unrealized gains and losses on derivatives. During the period when a derivative contract is outstanding, changes in the fair value of the derivative are recorded as an unrealized gain or loss. When a derivative contract matures or is settled, the previously recorded unrealized gain or loss is reversed and the realized gain or loss of the contract is recorded.
(3) The adjusted EBITDA adjustments related to Predecessor are excluded from adjusted EBITDA attributable to MPLX LP prior to the Merger.
| |
| (1) | Financial information for the first quarter of 2019 has been retrospectively adjusted for the acquisition of ANDX. See Notes 1 and 3. |
| |
| (2) | Depreciation and amortization attributable to L&S was $138 million and $126 million for the three months ended March 31, 2020 and 2019, respectively. Depreciation and amortization attributable to G&P was $187 million and $175 million for the three months ended March 31, 2020 and 2019, respectively. |
| |
| (3) | MPLX makes a distinction between realized and unrealized gains and losses on derivatives. During the period when a derivative contract is outstanding, changes in the fair value of the derivative are recorded as an unrealized gain or loss. When a derivative contract matures or is settled, the previously recorded unrealized gain or loss is reversed and the realized gain or loss of the contract is recorded. |
| |
| (4) | The adjusted EBITDA adjustments related to Predecessor are excluded from adjusted EBITDA attributable to MPLX LP prior to the Merger. |
10. Inventories
Inventories consist of the following:
| | | (In millions) | September 30, 2019 | | December 31, 2018 | March 31, 2020 | | December 31, 2019 |
| NGLs | $ | 4 |
| | $ | 9 |
| $ | 1 |
| | $ | 5 |
|
| Line fill | 8 |
| | 9 |
| 6 |
| | 10 |
|
| Spare parts, materials and supplies | 92 |
| | 80 |
| 98 |
| | 95 |
|
| Total inventories | $ | 104 |
| | $ | 98 |
| $ | 105 |
| | $ | 110 |
|
11. Property, Plant and Equipment
Property, plant and equipment with associated accumulated depreciation is shown below:
|
| | | | | | | |
| (In millions) | September 30, 2019 | | December 31, 2018 |
| Natural gas gathering and NGL transportation pipelines and facilities | $ | 6,909 |
| | $ | 6,349 |
|
| Processing, fractionation and storage facilities | 6,113 |
| | 6,045 |
|
| Pipelines and related assets | 5,058 |
| | 5,111 |
|
| Barges and towing vessels | 675 |
| | 621 |
|
| Terminals and related assets | 2,422 |
| | 2,757 |
|
| Refinery related assets | 1,398 |
| | 1,447 |
|
| Land, building, office equipment and other | 2,324 |
| | 1,562 |
|
| Construction-in-progress | 1,429 |
| | 1,321 |
|
| Total | 26,328 |
| | 25,213 |
|
| Less accumulated depreciation | 4,436 |
| | 3,688 |
|
| Property, plant and equipment, net | $ | 21,892 |
| | $ | 21,525 |
|
|
| | | | | | | | | |
| (In millions) | Estimated Useful Lives | | March 31, 2020 | | December 31, 2019 |
| L&S | | | | | |
| Pipelines | 2-51 years | | $ | 5,637 |
| | $ | 5,572 |
|
| Refining Logistics | 13-40 years | | 2,308 |
| | 2,870 |
|
| Terminals | 2-40 years | | 1,176 |
| | 1,109 |
|
| Marine | 15-20 years | | 960 |
| | 906 |
|
| Land, building and other | 1-61 years | | 1,827 |
| | 1,817 |
|
| Construction-in progress | | | 618 |
| | 660 |
|
| Total L&S property, plant and equipment | | | 12,526 |
| | 12,934 |
|
| G&P | | | | | |
| Gathering and transportation | 5-40 years | | 7,349 |
| | 7,159 |
|
| Processing and fractionation | 15-40 years | | 5,605 |
| | 5,545 |
|
| Land, building and other | 3-40 years | | 491 |
| | 484 |
|
| Construction-in-progress | | | 616 |
| | 745 |
|
| Total G&P property, plant and equipment | | | 14,061 |
| | 13,933 |
|
| Total property, plant and equipment | | | 26,587 |
| | 26,867 |
|
Less accumulated depreciation(1) | | | 4,758 |
| | 4,722 |
|
| Property, plant and equipment, net | | | $ | 21,829 |
| | $ | 22,145 |
|
| |
| (1) | The March 31, 2020 balance includes property, plant and equipment impairment charges recorded during the first quarter of 2020 as discussed below. |
Long-lived assets used in operations are assessed for impairment whenever changes in facts and circumstances indicate that the carrying value of the assets may not be recoverable based on the expected undiscounted future cash flow of an asset group. For purposes of impairment evaluation, long-lived assets must be grouped at the lowest level for which independent cash flows can be identified, which is at least at the segment level and in some cases for similar assets in the same geographic region where cash flows can be separately identified. If the sum of the undiscounted cash flows is less than the carrying value of an asset group, fair value is calculated, and the carrying value is written down if greater than the calculated fair value.
During the first quarter of 2020, we identified an impairment trigger relating to asset groups within our Western G&P reporting unit as a result of significant impacts to forecasted cash flows for these asset groups resulting from the first quarter events and circumstances as discussed in Note 1. The cash flows associated with these assets were significantly impacted by volume declines reflecting decreased forecasted producer customer production as a result of lower commodity prices. After assessing each asset group within the Western G&P reporting unit for impairment, only the East Texas G&P asset group resulted in the fair value of the underlying assets being less than the carrying value. As a result, an impairment of $174 million was recorded to Impairment expense on the Consolidated Statements of Income. Fair value of the assets was determined using a combination of an income and cost approach. The income approach utilized significant assumptions including management’s best estimates of the expected future cash flows, the estimated useful life of the asset group and discount rate. The cost approach utilized assumptions for the current replacement costs of similar assets adjusted for estimated depreciation and deterioration of the existing equipment and economic obsolescence. Fair value determinations require considerable judgment and are sensitive to changes in underlying assumptions and factors. As a result, there can be no assurance that the estimates and assumptions made for purposes of our impairment analysis will prove to be an accurate prediction of the future. The fair value measurements for the asset group fair values represent Level 3 measurements.
12. Goodwill and Intangibles
Goodwill
MPLX annually evaluates goodwill for impairment as of November 30, as well as whenever events or changes in circumstances indicate it is more likely than not that the fair value of a reporting unit with goodwill is less than its carrying amount.
During the first quarter of 2020, we determined that an interim impairment analysis of the goodwill recorded was necessary based on consideration of a number of first quarter events and circumstances as discussed in Note 1. Our producer customers in our Eastern G&P region reduced production forecasts and drilling activity in response to the global economic downturn. Additionally, a decline in NGL prices impacted our future revenue forecast. After performing our evaluations related to the interim impairment of goodwill during the first quarter of 2020, we recorded an impairment of $1,814 million within the Eastern G&P reporting unit, which was recorded to Impairment expense on the Consolidated Statements of Income. The impairment was primarily driven by additional guidance related to the slowing of drilling activity, which has reduced production growth forecasts from our producer customers. This resulted in goodwill totaling approximately $7.7 billion as of March 31, 2020 within 4 reporting units. The fair value of the remaining reporting units with goodwill were in excess of their carrying value by percentages ranging from 8.5 percent to 270.0 percent. The reporting unit whose fair value exceeded its carrying amount by 8.5 percent, our Crude Gathering reporting unit, had goodwill totaling $1.1 billion at March 31, 2020. The operations which make up this reporting unit were acquired through the merger with ANDX. MPC accounted for its October 1, 2018 acquisition of Andeavor (including acquiring control of ANDX), using the acquisition method of accounting, which required Andeavor assets and liabilities to be recorded by MPC at the acquisition date fair value. The Merger was closed on July 30, 2019 and has been treated as a common control transaction, which required the recognition of assets acquired and liabilities assumed using MPC’s historical carrying value. As such, given the short amount of time from when fair value was established to the date of the impairment test, the amount by which the fair value exceeded the carrying value within this reporting unit is not unexpected.
Our reporting units are one level below our operating segments and are determined based on the way in which segment management operates and reviews each operating segment. The fair value of our 6 reporting units was determined based on applying both a discounted cash flow or income approach as well as a market approach. The discounted cash flow fair value estimate is based on known or knowable information at the measurement date. The significant assumptions that were used to develop the estimates of the fair values under the discounted cash flow method included management’s best estimates of the expected future results and discount rate, which ranged from 9.5 percent to 11.5 percent. Fair value determinations require considerable judgment and are sensitive to changes in underlying assumptions and factors. As a result, there can be no assurance that the estimates and assumptions made for purposes of the interim goodwill impairment test will prove to be an accurate prediction of the future. The fair value measurements for the individual reporting units represent Level 3 measurements.
After performing our evaluations related to the impairment of goodwill during the fiscal year ending December 31, 2019, we recorded an impairment of $1,197 million within the Western G&P reporting unit. The remainder of the reporting units’ fair values were in excess of their carrying values. The impairment was primarily driven by updated guidance related to the slowing of drilling activity, which has reduced production growth forecasts from our producer customers. This resulted in goodwill totaling approximately $9.5 billion as of December 31, 2019, with all but 1 of our 6 reporting units having goodwill.
The changes in carrying amount of goodwill were as follows:
|
| | | | | | | | | | | |
| (In millions) | L&S | | G&P | | Total |
| Gross goodwill as of December 31, 2018 | $ | 7,234 |
| | $ | 2,912 |
| | $ | 10,146 |
|
| Accumulated impairment losses | — |
| | (130 | ) | | (130 | ) |
| Balance as of December 31, 2018 | 7,234 |
| | 2,782 |
| | 10,016 |
|
| Impairment losses | — |
| | (1,197 | ) | | (1,197 | ) |
| Acquisitions | 488 |
| | 229 |
| | 717 |
|
| Balance as of December 31, 2019 | 7,722 |
| | 1,814 |
| | 9,536 |
|
| Impairment losses | — |
| | (1,814 | ) | | (1,814 | ) |
| Balance as of March 31, 2020 | 7,722 |
| | — |
| | 7,722 |
|
| | | | | | |
| Gross goodwill as of March 31, 2020 | 7,722 |
| | 3,141 |
| | 10,863 |
|
| Accumulated impairment losses | — |
| | (3,141 | ) | | (3,141 | ) |
| Balance as of March 31, 2020 | $ | 7,722 |
| | $ | — |
| | $ | 7,722 |
|
Intangible Assets
During the first quarter of 2020, we also determined that an impairment analysis of intangibles within our Western G&P reporting unit was necessary. See Note 11 for additional information regarding our assessment around the Western G&P reporting unit, and more specifically our East Texas G&P asset group. The fair value of the intangibles in our East Texas G&P asset group were determined based on applying the multi-period excess earnings method, which is an income approach. Key assumptions included management’s best estimates of the expected future cash flows from existing customers, customer attrition rates and the discount rate. After performing our evaluations related to the impairment of intangible assets associated with our East Texas G&P asset group during the first quarter of 2020, we recorded an impairment of $177 million to Impairment expense on the Consolidated Statements of Income related to our customer relationships.
MPLX’s remaining intangible assets are comprised of customer contracts and relationships. Gross intangible assets with accumulated amortization as of March 31, 2020 and December 31, 2019 is shown below:
|
| | | | | | | | | | | | | | | | | | | | | | | | | | |
| | | | | March 31, 2020 | | December 31, 2019 |
| (In millions) | | Useful Life | | Gross | | Accumulated Amortization(1)(2) | | Net | | Gross | | Accumulated Amortization | | Net |
| L&S | | 6 - 8 years | | $ | 283 |
| | $ | (54 | ) | | $ | 229 |
| | $ | 283 |
| | $ | (45 | ) | | $ | 238 |
|
| G&P | | 6 - 25 years | | 1,288 |
| | (462 | ) | | 826 |
| | 1,288 |
| | (256 | ) | | 1,032 |
|
| | | | | $ | 1,571 |
| | $ | (516 | ) | | $ | 1,055 |
| | $ | 1,571 |
| | $ | (301 | ) | | $ | 1,270 |
|
| |
| (1) | Amortization expense attributable to the G&P and L&S segments for the three months ended March 31, 2020 was $29 million and $9 million, respectively. |
| |
| (2) | Impairment charge of $177 million is included within the G&P accumulated amortization. |
Estimated future amortization expense related to the intangible assets at March 31, 2020 is as follows:
|
| | | | |
| (In millions) | | |
| 2020 | | $ | 96 |
|
| 2021 | | 128 |
|
| 2022 | | 128 |
|
| 2023 | | 128 |
|
| 2024 | | 124 |
|
| Thereafter | | 451 |
|
| Total | | $ | 1,055 |
|
12.13. Fair Value Measurements
Fair Values – Recurring
Fair value measurements and disclosures relate primarily to MPLX’s derivative positions as discussed in Note 13.14. The following table presents the financial instruments carried at fair value on a recurring basis as of September 30, 2019March 31, 2020 and December 31, 20182019 by fair value hierarchy level. MPLX has elected to offset the fair value amounts recognized for multiple derivative contracts executed with the same counterparty.
| | | | September 30, 2019 | | December 31, 2018 | March 31, 2020 | | December 31, 2019 |
| (In millions) | Assets | | Liabilities | | Assets | | Liabilities | Assets | | Liabilities | | Assets | | Liabilities |
| Significant unobservable inputs (Level 3) | | | | | | | | | | | | | | |
| Embedded derivatives in commodity contracts | $ | — |
| | $ | (54 | ) | | $ | — |
| | $ | (61 | ) | $ | — |
| | $ | (45 | ) | | $ | — |
| | $ | (60 | ) |
| Total carrying value on Consolidated Balance Sheets | $ | — |
| | $ | (54 | ) | | $ | — |
| | $ | (61 | ) | $ | — |
| | $ | (45 | ) | | $ | — |
| | $ | (60 | ) |
Level 3 instruments include all NGL transactions and embedded derivatives in commodity contracts. The embedded derivative liability relates to a natural gas purchase commitment embedded in a keep-whole processing agreement. The fair value calculation for these Level 3 instruments used significant unobservable inputs including: (1) NGL prices interpolated and extrapolated due to inactive markets ranging from $0.41$0.26 to $1.07$0.68 per gallon with a weighted average of $0.39 per gallon per the
current term of the embedded derivative and (2) the probability of renewal of 9395 percent for the first five-year term and 82.583.5 percent for the second five-year term of the gas purchase commitment and related keep-whole processing agreement. Increases or decreases in the fractionation spread result in an increase or decrease in the fair value of the embedded derivative liability, respectively. An increase in the probability of renewal would result in an increase in the fair value of the related embedded derivative liability. Beyond the embedded derivative discussed above, we had no outstanding commodity contracts as of September 30, 2019March 31, 2020 or December 31, 2018.2019.
Changes in Level 3 Fair Value Measurements
The following table is a reconciliation of the net beginning and ending balances recorded for net assets and liabilities classified as Level 3 in the fair value hierarchy.
| | | | Three Months Ended September 30, 2019 | | Three Months Ended September 30, 2018 | Three Months Ended March 31, 2020 | | Three Months Ended March 31, 2019 |
| (In millions) | Commodity Derivative Contracts (net) | | Embedded Derivatives in Commodity Contracts (net) | | Commodity Derivative Contracts (net) | | Embedded Derivatives in Commodity Contracts (net) | Commodity Derivative Contracts (net) | | Embedded Derivatives in Commodity Contracts (net) | | Commodity Derivative Contracts (net) | | Embedded Derivatives in Commodity Contracts (net) |
| Fair value at beginning of period | $ | — |
| | $ | (65 | ) | | $ | (2 | ) | | $ | (66 | ) | $ | — |
| | $ | (60 | ) | | $ | — |
| | $ | (61 | ) |
Total gains/(losses) (realized and unrealized) included in earnings(1) | — |
| | 9 |
| | (1 | ) | | (19 | ) | — |
| | 14 |
| | — |
| | (6 | ) |
| Settlements | — |
| | 2 |
| | 1 |
| | 3 |
| — |
| | 1 |
| | — |
| | 2 |
|
| Fair value at end of period | — |
| | (54 | ) | | (2 | ) | | (82 | ) | — |
| | (45 | ) | | — |
| | (65 | ) |
| The amount of total gains/(losses) for the period included in earnings attributable to the change in unrealized gains/(losses) relating to liabilities still held at end of period | $ | — |
| | $ | 9 |
| | $ | (2 | ) | | $ | (19 | ) | $ | — |
| | $ | 13 |
| | $ | — |
| | $ | (5 | ) |
| |
| (1) | (1) Gains and losses on commodity derivative contracts classified as Level 3 are recorded in “Product sales”on the Consolidated Statements of Income. Gains and losses on derivatives embedded in commodity contracts are recorded in “Purchased product costs” and “Cost of revenues” on the Consolidated Statements of Income.
| | | | | | | | | | | | | | | | | | | Nine Months Ended September 30, 2019 | | Nine Months Ended September 30, 2018 | | (In millions) | Commodity Derivative Contracts (net) | | Embedded Derivatives in Commodity Contracts (net) | | Commodity Derivative Contracts (net) | | Embedded Derivatives in Commodity Contracts (net) | | Fair value at beginning of period | $ | — |
| | $ | (61 | ) | | $ | (2 | ) | | $ | (64 | ) | Total gains/(losses) (realized and unrealized) included in earnings(1) | — |
| | 2 |
| | (2 | ) | | (27 | ) | | Settlements | — |
| | 5 |
| | 2 |
| | 9 |
| | Fair value at end of period | — |
| | (54 | ) | | (2 | ) | | (82 | ) | | The amount of total gains/(losses) for the period included in earnings attributable to the change in unrealized gains/(losses) relating to liabilities still held at end of period | $ | — |
| | $ | 5 |
| | $ | (1 | ) | | $ | (21 | ) |
(1) Gains and losses on commodity derivative contracts classified as Level 3 are recorded in “Product sales” on the Consolidated Statements of Income. Gains and losses on derivatives embedded in commodity contracts are recorded in “Purchased product costs” and “Cost of revenues” on the Consolidated Statements of Income.
|
Fair Values – Reported
MPLX’s primary financial instruments are cash and cash equivalents, receivables, receivables from related parties, lease receivables from related parties, accounts payable, payables to related parties and long-term debt. MPLX’s fair value assessment incorporates a variety of considerations, including (1) the duration of the instruments, (2) MPC’s investment-grade credit rating and (3) the historical incurrence of and expected future insignificance of bad debt expense, which includes an evaluation of counterparty credit risk. MPLX believes the carrying values of its current assets and liabilities approximate fair value. The recorded value of the amounts outstanding under the bank revolving credit facility, if any, approximates fair value due to the variable interest rate that approximates current market rates. Derivative instruments are recorded at fair value, based on available market information (see Note 13)14).
The fair value of MPLX’s long-term debt is estimated based on recent market non-binding indicative quotes. The fair value of the SMR liability is estimated using a discounted cash flow approach based on the contractual cash flows and MPLX’s unsecured borrowing rate. The long-term debt and SMR liability fair values are considered Level 3 measurements. The following table summarizes the fair value and carrying value of the long-term debt, excluding finance leases, and SMR liability:
| | | | September 30, 2019 | | December 31, 2018 | March 31, 2020 | | December 31, 2019 |
| (In millions) | Fair Value | | Carrying Value | | Fair Value | | Carrying Value | Fair Value | | Carrying Value | | Fair Value | | Carrying Value |
| Long-term debt | $ | 21,290 |
| | $ | 19,789 |
| | $ | 18,070 |
| | $ | 18,511 |
| $ | 18,352 |
| | $ | 20,560 |
| | $ | 21,054 |
| | $ | 19,800 |
|
| SMR liability | $ | 93 |
| | $ | 82 |
| | $ | 92 |
| | $ | 86 |
| $ | 77 |
| | $ | 79 |
| | $ | 90 |
| | $ | 80 |
|
13.14. Derivative Financial Instruments
As of September 30, 2019,March 31, 2020, MPLX had no outstanding commodity contracts beyond the embedded derivative discussed below.
Embedded Derivative - MPLX has a natural gas purchase commitment embedded in a keep-whole processing agreement with a producer customer in the Southern Appalachian region expiring in December 2022. The customer has the unilateral option to extend the agreement for 2 consecutive five-year terms through December 2032. For accounting purposes, the natural gas purchase commitment and the term extending options have been aggregated into a single compound embedded derivative. The probability of the customer exercising its options is determined based on assumptions about the customer’s potential business strategy decision points that may exist at the time they would elect whether to renew the contract. The changes in fair value of this compound embedded derivative are based on the difference between the contractual and index pricing, the probability of the producer customer exercising its option to extend and the estimated favorability of these contracts compared to current market conditions. The changes in fair value are recorded in earnings through “Purchased product costs” on the Consolidated Statements of Income. As of September 30, 2019March 31, 2020 and December 31, 2018,2019, the estimated fair value of this contract was a liability of $54$45 million and $61$60 million, respectively.
Certain derivative positions are subject to master netting agreements, therefore, MPLX has elected to offset derivative assets and liabilities that are legally permissible to be offset. As of September 30, 2019March 31, 2020 and December 31, 2018,2019, there were no derivative assets or liabilities that were offset on the Consolidated Balance Sheets. The impact of MPLX’s derivative instruments on its Consolidated Balance Sheets is summarized below: | | | (In millions) | September 30, 2019 | | December 31, 2018 | March 31, 2020 | | December 31, 2019 |
| Derivative contracts not designated as hedging instruments and their balance sheet location | Asset | | Liability | | Asset | | Liability | Asset | | Liability | | Asset | | Liability |
Commodity contracts(1) | | | | | | | | | | | | | | |
| Other current assets / Other current liabilities | $ | — |
| | $ | (5 | ) | | $ | — |
| | $ | (7 | ) | $ | — |
| | $ | (2 | ) | | $ | — |
| | $ | (5 | ) |
| Other noncurrent assets / Deferred credits and other liabilities | — |
| | (49 | ) | | — |
| | (54 | ) | — |
| | (43 | ) | | — |
| | (55 | ) |
| Total | $ | — |
| | $ | (54 | ) | | $ | — |
| | $ | (61 | ) | $ | — |
| | $ | (45 | ) | | $ | — |
| | $ | (60 | ) |
(1) Includes embedded derivatives in commodity contracts as discussed above.
| |
| (1) | Includes embedded derivatives in commodity contracts as discussed above. |
For further information regarding the fair value measurement of derivative instruments, including the effect of master netting arrangements or collateral, see Note 12.13. There were no material changes to MPLX’s policy regarding the accounting for Level 2 and Level 3 instruments as previously disclosed in MPLX’s Annual Report on Form 10-K for the year ended December 31, 2018.2019. MPLX does not designate any of its commodity derivative positions as hedges for accounting purposes.
The impact of MPLX’s derivative contracts not designated as hedging instruments and the location of gains and losses recognized on the Consolidated Statements of Income is summarized below: | | | | Three Months Ended September 30, | | Nine Months Ended September 30, | Three Months Ended March 31, |
| (In millions) | 2019 | | 2018 | | 2019 | | 2018 | 2020 | | 2019 |
| Product sales | | | | | | | | | | |
| Realized (loss)/gain | $ | — |
| | $ | (1 | ) | | $ | — |
| | $ | (2 | ) | $ | — |
| | $ | — |
|
| Unrealized (loss)/gain | — |
| | (1 | ) | | — |
| | — |
| — |
| | — |
|
| Product sales derivative (loss)/gain | — |
| | (2 | ) | | — |
| | (2 | ) | — |
| | — |
|
| Purchased product costs | | | | | | | | | | |
| Realized (loss)/gain | (2 | ) | | (4 | ) | | (5 | ) | | (10 | ) | (1 | ) | | (2 | ) |
| Unrealized gain/(loss) | 11 |
| | (16 | ) | | 7 |
| | (18 | ) | 15 |
| | (4 | ) |
| Purchased product costs derivative (loss)/gain | 9 |
| | (20 | ) | | 2 |
| | (28 | ) | |
| Purchased product costs derivative gain/(loss) | | 14 |
| | (6 | ) |
| Cost of revenues | | | | | | | | | | |
| Realized (loss)/gain | — |
| | — |
| | — |
| | — |
| — |
| | — |
|
| Unrealized (loss)/gain | — |
| | — |
| | — |
| | — |
| — |
| | — |
|
| Cost of revenues derivative (loss)/gain | — |
| | — |
| | — |
| | — |
| — |
| | — |
|
| Total derivative gain/(loss) | $ | 9 |
| | $ | (22 | ) | | $ | 2 |
| | $ | (30 | ) | $ | 14 |
| | $ | (6 | ) |
14.15. Debt
MPLX’s outstanding borrowings consist of the following: |
| | | | | | | |
| (In millions) | September 30, 2019 | | December 31, 2018 |
| MPLX LP: | | | |
| Bank revolving credit facility due 2024 | $ | — |
| | $ | — |
|
| Term loan facility due 2021 | 500 |
| | — |
|
| Floating rate senior notes due September 2021 | 1,000 |
| | — |
|
| Floating rate senior notes due September 2022 | 1,000 |
| | — |
|
| 6.250% senior notes due October 2022 | 266 |
| | — |
|
| 3.500% senior notes due December 2022 | 486 |
| | — |
|
| 3.375% senior notes due March 2023 | 500 |
| | 500 |
|
| 4.500% senior notes due July 2023 | 989 |
| | 989 |
|
| 6.375% senior notes due May 2024 | 381 |
| | — |
|
| 4.875% senior notes due December 2024 | 1,149 |
| | 1,149 |
|
| 5.250% senior notes due January 2025 | 708 |
| | — |
|
| 4.000% senior notes due February 2025 | 500 |
| | 500 |
|
| 4.875% senior notes due June 2025 | 1,189 |
| | 1,189 |
|
| 4.125% senior notes due March 2027 | 1,250 |
| | 1,250 |
|
| 4.250% senior notes due December 2027 | 732 |
| | — |
|
| 4.000% senior notes due March 2028 | 1,250 |
| | 1,250 |
|
| 4.800% senior notes due February 2029 | 750 |
| | 750 |
|
| 4.500% senior notes due April 2038 | 1,750 |
| | 1,750 |
|
| 5.200% senior notes due March 2047 | 1,000 |
| | 1,000 |
|
| 5.200% senior notes due December 2047 | 487 |
| | — |
|
| 4.700% senior notes due April 2048 | 1,500 |
| | 1,500 |
|
| 5.500% senior notes due February 2049 | 1,500 |
| | 1,500 |
|
| 4.900% senior notes due April 2058 | 500 |
| | 500 |
|
| Consolidated subsidiaries: | | | |
| MarkWest - 4.500% - 4.875% senior notes, due 2023-2025 | 23 |
| | 23 |
|
| ANDX - 3.500% - 6.375% senior notes, due 2019-2047 | 690 |
| | 3,750 |
|
| ANDX credit facilities | — |
| | 1,245 |
|
Financing lease obligations(1) | 20 |
| | 21 |
|
| Total | 20,120 |
| | 18,866 |
|
| Unamortized debt issuance costs | (109 | ) | | (97 | ) |
| Unamortized discount/premium | (311 | ) | | (334 | ) |
| Amounts due within one year | (510 | ) | | (513 | ) |
| Total long-term debt due after one year | $ | 19,190 |
| | $ | 17,922 |
|
|
| | | | | | | |
| (In millions) | March 31, 2020 | | December 31, 2019 |
| MPLX LP: | | | |
| Bank revolving credit facility | $ | 750 |
| | $ | — |
|
| Term loan facility | 1,000 |
| | 1,000 |
|
| Floating rate senior notes | 2,000 |
| | 2,000 |
|
| Fixed rate senior notes | 16,887 |
| | 16,887 |
|
| Consolidated subsidiaries: | | | |
| MarkWest | 23 |
| | 23 |
|
| ANDX | 190 |
| | 190 |
|
Financing lease obligations(1) | 14 |
| | 19 |
|
| Total | 20,864 |
| | 20,119 |
|
| Unamortized debt issuance costs | (103 | ) | | (106 | ) |
| Unamortized discount/premium | (290 | ) | | (300 | ) |
| Amounts due within one year | (4 | ) | | (9 | ) |
| Total long-term debt due after one year | $ | 20,467 |
| | $ | 19,704 |
|
1920 for lease information.
Credit Agreement
Effective July 30, 2019, in connection with the closing of the Merger, MPLX amended and restated its existing revolving credit facility (the “MPLX Credit Agreement”) to, among other things, increase borrowing capacity to up to $3.5 billion and extend its term from July 2022 to July 2024. During the ninethree months ended September 30, 2019,March 31, 2020, MPLX borrowed $5,310$1,325 million under the MPLX Credit Agreement, at an average interest rate of 3.5482.139 percent, and repaid $5,310$575 million. At September 30, 2019,March 31, 2020, MPLX had 0$750 million in outstanding borrowings and $3less than $1 million in letters of credit outstanding under the MPLX Credit Agreement, resulting in total availability of $3.497$2.75 billion, or 99.978.6 percent of the borrowing capacity.
Prior to the Merger, ANDX had revolving credit facilities (the “ANDX credit facilities”) totaling $2.1 billion in borrowing capacity which were set to mature January 29, 2021. The ANDX credit facilities were terminated upon closing of the Merger and repaid with borrowings under the MPLX revolving credit facility. During the nine months ended September 30, 2019, there were borrowings of $864 million under the ANDX credit facilities, at an average interest rate of 4.129 percent, and repayments of $2.1 billion.
Term Loan Agreement
On September 26, 2019, MPLX entered into a Term Loan Agreement which provides for a committed term loan facility for up to an aggregate of $1 billion available to be drawn in up to four separate borrowings, subject to the satisfaction or waiver of certain customary conditions. If not fully utilized, the term loan commitments expire 90 days after September 26, 2019.billion. Borrowings under the Term Loan Agreement bear interest, at MPLX’s election, at either (i) the Adjusted LIBO Rate (as defined in the Term Loan Agreement) plus a margin ranging from 75.0 basis points to 100.0 basis points per annum, depending on MPLX’s credit ratings, or (ii) the Alternate Base Rate (as defined in the Term Loan Agreement). The proceeds from borrowings under the Term Loan Agreement are to be used to fund the repayment of MPLX’s existing indebtedness and/or for general business purposes. Amounts borrowed under the Term Loan Agreement will be due and payable on September 26, 2021. As of September 30, 2019,March 31, 2020, MPLX had drawn $500 million$1.0 billion on the term loan at an average interest rate of 2.7952.273 percent.
The Term Loan Agreement contains representations and warranties, affirmative and negative covenants and events of default that we consider to be customary for an agreement of this type and are substantially similar to those contained in the MPLX Credit Agreement, including a covenant that requires MPLX’s ratio of Consolidated Total Debt to Consolidated EBITDA (as both terms are defined in the Term Loan Agreement) for the 4 prior fiscal quarters not to exceed 5.0 to 1.0 as of the last day of each fiscal quarter (or during the six-month period following certain acquisitions, 5.5 to 1.0). Consolidated EBITDA is subject to adjustments for certain acquisitions completed and capital projects undertaken during the relevant period.
Floating Rate Senior Notes
On September 9, 2019, MPLX issued $2.0 billion aggregate principal amount of floating rate senior notes in a public offering, consisting of $1.0 billion aggregate principal amount of notes due September 2021 and $1.0 billion aggregate principal amount of notes due September 2022 (collectively, the “Floating Rate Senior Notes”). The Floating Rate Senior Notes were offered at a price to the public of 100 percent of par. The proceeds were used to repay MPLX’s existing indebtedness and/Floating Rate Senior Notes are callable, in whole or for general business purposes.in part, at par plus accrued and unpaid interest at any time on or after September 10, 2020. Interest on the Floating Rate Senior Notes is payable quarterly in March, June, September and December, commencing on December 9, 2019. The interest rate applicable to the floating rate senior notes due September 2021 is LIBOR plus 0.9 percent per annum. The interest rate applicable to the floating rate senior notes due September 2022 is LIBOR plus 1.1 percent per annum.
Fixed Rate Senior Notes
In connection with the Merger, MPLX assumed ANDX’s outstandingMPLX’s senior notes, which had an aggregate principal amountincluding those issued by consolidated subsidiaries, consist of $3.75 billion,various series of senior notes expiring between 2022 and 2058 with interest rates ranging from 3.53.375 percent to 6.375 percent and maturity dates ranging from 2019 to 2047. On September 23, 2019, approximately $3.06 billion aggregate principal amount of ANDX’s outstanding senior notes were exchanged for an aggregate principal amount of approximately $3.06 billion new unsecured senior notes (the “Exchange Notes”) issued by MPLX in an exchange offer and consent solicitation undertaken by MPLX, leaving approximately $690 million aggregate principal of outstanding senior notes held by ANDX. Of this, $500 million is related to 5.5 percent unsecured senior notes due 2019. The principal amount of $500 million and accrued interest of $13.75 million was paid on October 15, 2019 using proceeds from the Floating Rate Senior Notes and borrowings under the Term Loan Agreement discussed above and includes interest through the payoff date.
The Exchange Notes consist of $266 million in aggregate principal amount of 6.25 percent unsecured senior notes due October 2022, $486 million in aggregate principal amount of 3.5 percent unsecured senior notes due December 2022, $381 million in aggregate principal amount of 6.375 percent unsecured senior notes due May 2024, $708 million in aggregate principal amount of 5.25 percent unsecured senior notes due January 2025, $732 million in aggregate principal amount of 4.25 percent unsecured senior notes due December 2027 and $487 million in aggregate principal amount of 5.2 percent unsecured senior notes due December 2047.percent. Interest on each series of Exchange Notesnotes is payable semi-annually in arrears according toon various dates depending on the table below.
|
| |
Senior Notes | Interest payable semi-annually in arrears |
6.250% senior notes due October 2022 | April 15th and October 15th
|
3.500% senior notes due December 2022 | June 1st and December 1st
|
6.375% senior notes due May 2024 | May 1st and November 1st
|
5.250% senior notes due January 2025 | January 15th and July 15th
|
4.250% senior notes due December 2027 | June 1st and December 1st
|
5.200% senior notes due December 2047 | June 1st and December 1st
|
On December 10, 2018, MPLX redeemed all $750 million of its 5.5 percent senior notes due February 15, 2023, $40 million of which was issued by its MarkWest subsidiary. These notes were redeemed at 101.833 percent of the principal amount, which resulted in a payment of $14 million related to the note premium and the immediate recognition of $46 million of unamortized debt issuance costs.
On November 15, 2018, MPLX issued $2.25 billion aggregate principal amount of senior notes in a public offering, consisting of $750 million aggregate principal amount of 4.8 percent unsecured senior notes due February 2029 and $1.5 billion aggregate principal amount of 5.5 percent unsecured senior notes due February 2049 (collectively, the “November 2018 New Senior Notes”). The November 2018 New Senior Notes were offered at a price to the public of 99.432 percent and 98.031 percent of par, respectively. The proceeds were used to repay outstanding borrowings under the MPLX Credit Agreement and the MPC Loan Agreement and to redeem all $750 million of its 5.5 percent senior notes due February 2023, as well as for general business purposes. Interest on each series of the November 2018 New Senior Notes is payable semi-annually in arrears, commencing on February 15, 2019.
On February 8, 2018, MPLX issued $5.5 billion aggregate principal amount of senior notes in a public offering, consisting of $500 million aggregate principal amount of 3.375 percent unsecured senior notes due March 2023, $1.25 billion aggregate principal amount of 4.0 percent unsecured senior notes due March 2028, $1.75 billion aggregate principal amount of 4.5 percent unsecured senior notes due April 2038, $1.5 billion aggregate principal amount of 4.7 percent unsecured senior notes due April 2048, and $500 million aggregate principal amount of 4.9 percent unsecured senior notes due April 2058 (collectively, the “February 2018 New Senior Notes”). The February 2018 New Senior Notes were offered at a price to the public of 99.931 percent, 99.551 percent, 98.811 percent, 99.348 percent, and 99.289 percent of par, respectively. Also on February 8, 2018, $4.1 billion of the net proceeds were used to repay a 364-day term loan facility, which was drawn on February 1, 2018 to fund the cash portion of the dropdown consideration for Refining Logistics and Fuels Distribution. The remaining proceeds were used to repay outstanding borrowings under the MPLX Credit Agreement and the MPC Loan Agreement, as well as for general business purposes. Interest on each series of notes due in 2023 and 2028 is payable semi-annually in arrears, commencing on September 15, 2018. Interest on each series of notes due in 2038, 2048 and 2058 is payable semi-annually in arrears, commencing on October 15, 2018.
15.16. Revenue
Disaggregation of Revenue
The following tables represent a disaggregation of revenue for each reportable segment for the three and nine months ended September 30, 2019March 31, 2020 and 2018:2019:
| | | | Three Months Ended September 30, 2019 | Three Months Ended March 31, 2020 |
| (In millions) | L&S | | G&P | | Total | L&S | | G&P | | Total |
| Revenues and other income: | | | | | | | | | | |
| Service revenue | $ | 95 |
| | $ | 537 |
| | $ | 632 |
| $ | 84 |
| | $ | 528 |
| | $ | 612 |
|
| Service revenue - related parties | 881 |
| | 18 |
| | 899 |
| 920 |
| | 8 |
| | 928 |
|
| Service revenue - product related | — |
| | 26 |
| | 26 |
| — |
| | 39 |
| | 39 |
|
Product sales(1) | 14 |
| | 157 |
| | 171 |
| 15 |
| | 154 |
| | 169 |
|
| Product sales - related parties | 8 |
| | 24 |
| | 32 |
| 4 |
| | 29 |
| | 33 |
|
| Total revenues from contracts with customers | $ | 998 |
| | $ | 762 |
| | 1,760 |
| $ | 1,023 |
| | $ | 758 |
| | 1,781 |
|
Non-ASC 606 revenue(2) | | | | | 520 |
| |
Non-ASC 606 (loss)/revenue(1) | | | | | | (789 | ) |
| Total revenues and other income | | | | | $ | 2,280 |
| | | | | $ | 992 |
|
|
| | | | | | | | | | | |
| | Three Months Ended September 30, 2018 |
| (In millions) | L&S | | G&P | | Total |
| Revenues and other income: | | | | | |
| Service revenue | $ | 34 |
| | $ | 422 |
| | $ | 456 |
|
| Service revenue - related parties | 568 |
| | — |
| | 568 |
|
| Service revenue - product related | — |
| | 59 |
| | 59 |
|
Product sales(1) | 3 |
| | 237 |
| | 240 |
|
| Product sales - related parties | 2 |
| | 16 |
| | 18 |
|
| Total revenues from contracts with customers | $ | 607 |
| | $ | 734 |
| | 1,341 |
|
Non-ASC 606 revenue(2) | | | | | 371 |
|
| Total revenues and other income | | | | | $ | 1,712 |
|
|
| | | | | | | | | | | |
| | Nine Months Ended September 30, 2019 |
| (In millions) | L&S | | G&P | | Total |
| Revenues and other income: | | | | | |
| Service revenue | $ | 260 |
| | $ | 1,605 |
| | $ | 1,865 |
|
| Service revenue - related parties | 2,527 |
| | 22 |
| | 2,549 |
|
| Service revenue - product related | — |
| | 86 |
| | 86 |
|
Product sales(1) | 40 |
| | 536 |
| | 576 |
|
| Product sales - related parties | 17 |
| | 92 |
| | 109 |
|
| Total revenues from contracts with customers | $ | 2,844 |
| | $ | 2,341 |
| | 5,185 |
|
Non-ASC 606 revenue(2) | | | | | 1,540 |
|
| Total revenues and other income | | | | | $ | 6,725 |
|
| | | | Nine Months Ended September 30, 2018 | Three Months Ended March 31, 2019(2) |
| (In millions) | L&S | | G&P | | Total | L&S | | G&P | | Total |
| Revenues and other income: | | | | | | | | | | |
| Service revenue | $ | 94 |
| | $ | 1,154 |
| | $ | 1,248 |
| $ | 86 |
| | $ | 528 |
| | $ | 614 |
|
| Service revenue - related parties | 1,588 |
| | — |
| | 1,588 |
| 803 |
| | — |
| | 803 |
|
| Service revenue - product related | — |
| | 154 |
| | 154 |
| — |
| | 34 |
| | 34 |
|
Product sales(1) | 5 |
| | 649 |
| | 654 |
| 11 |
| | 205 |
| | 216 |
|
| Product sales - related parties | 5 |
| | 30 |
| | 35 |
| 4 |
| | 37 |
| | 41 |
|
| Total revenues from contracts with customers | $ | 1,692 |
| | $ | 1,987 |
| | 3,679 |
| $ | 904 |
| | $ | 804 |
| | 1,708 |
|
Non-ASC 606 revenue(2)(1) | | | | | 1,031 |
| | | | | 527 |
|
| Total revenues and other income | | | | | $ | 4,710 |
| | | | | $ | 2,235 |
|
(1) G&P “Product sales” for the three and nine months ended September 30, 2018 includes approximately $1 million and $2 million of revenue related to derivative gains and losses and mark-to-market adjustments, respectively. There were 0 adjustments for the three and nine months ended September 30, 2019.
(2) Non-ASC 606 Revenue includes rental income, income from equity method investments, derivative gains and losses, mark-to-market adjustments, and other income.
| |
| (1) | Non-ASC 606 Revenue includes rental income, income/(loss) from equity method investments, derivative gains and losses, mark-to-market adjustments, and other income. |
| |
| (2) | Financial information for the first quarter of 2019 has been retrospectively adjusted for the acquisition of ANDX. See Notes 1 and 3. |
Contract Balances
Contract assets typically relate to aid in construction agreements where the revenue recognized and MPLX’s rights to consideration for work completed exceeds the amount billed to the customer or for deficiency payments associated with minimum volume commitments which have not been billed to customers. Contract assets are generally classified as current and included in “Other current assets” on the Consolidated Balance Sheets.
Contract liabilities, which we refer to as “Deferred revenue” and “Long-term deferred revenue,” typically relate to advance payments for aid in construction agreements and deferred customer credits associated with makeup rights and minimum volume commitments. Related to minimum volume commitments, breakage is estimated and recognized into service revenue in instances where it is probable the customer will not use the credit in future periods. We classify contract liabilities as current or long-term based on the timing of when we expect to recognize revenue.
“Receivables, net” primarily relate to our commodity sales. Portions of the “Receivables, net” balance are attributed to the sale of commodity product controlled by MPLX prior to sale while a significant portion of the balance relates to the sale of commodity product on behalf of our producer customers. Both types of transactions are commingled and excluded from the table below. MPLX remits the net sales price back to our producer customers upon completion of the sale. Each period end,
certain amounts within accounts payable relate to our payments to producer customers. Such amounts are not deemed material at period end as a result of when we settle with each producer.
The tabletables below reflectsreflect the changes in our contract balances for the nine-month periodthree-month periods ended September 30,March 31, 2020 and 2019:
| | | (In millions) | Balance at December 31, 2018(1) | | Additions/ (Deletions) | | Revenue Recognized(2) | | Balance at September 30, 2019 | Balance at December 31, 2019(1) | | Additions/ (Deletions) | | Revenue Recognized(2) | | Balance at March 31, 2020 |
| Contract assets | $ | 36 |
| | $ | (6 | ) | | $ | (2 | ) | | $ | 28 |
| $ | 39 |
| | $ | (27 | ) | | $ | — |
| | $ | 12 |
|
| Deferred revenue | 13 |
| | 11 |
| | (4 | ) | | 20 |
| 23 |
| | 5 |
| | (3 | ) | | 25 |
|
| Deferred revenue - related parties | 65 |
| | 34 |
| | (50 | ) | | 49 |
| 53 |
| | 12 |
| | (16 | ) | | 49 |
|
| Long-term deferred revenue | 56 |
| | 26 |
| | — |
| | 82 |
| 90 |
| | 6 |
| | — |
| | 96 |
|
| Long-term deferred revenue - related parties | $ | 52 |
| | $ | 5 |
| | $ | — |
| | $ | 57 |
| $ | 55 |
| | $ | 1 |
| | $ | — |
| | $ | 56 |
|
(1) Balance represents ASC 606 portion of each respective line item.
(2) NaN significant revenue was recognized related to past performance obligations in the current period. |
| | | | | | | | | | | | | | | |
| (In millions) | Balance at December 31, 2018(1) | | Additions/ (Deletions)(3) | | Revenue Recognized(2)(3) | | Balance at March 31, 2019(3) |
| Contract assets | $ | 36 |
| | $ | (17 | ) | | $ | — |
| | $ | 19 |
|
| Deferred revenue | 13 |
| | 1 |
| | (1 | ) | | 13 |
|
| Deferred revenue - related parties | 65 |
| | 9 |
| | (16 | ) | | 58 |
|
| Long-term deferred revenue | 56 |
| | 1 |
| | — |
| | 57 |
|
| Long-term deferred revenue - related parties | $ | 52 |
| | $ | — |
| | $ | — |
| | $ | 52 |
|
| |
| (1) | Balance represents ASC 606 portion of each respective line item. |
| |
| (2) | NaN significant revenue was recognized related to past performance obligations in the current periods. |
| |
| (3) | Financial information for the first quarter of 2019 has been retrospectively adjusted for the acquisition of ANDX. See Notes 1 and 3. |
Remaining Performance Obligations
The table below includes estimated revenue expected to be recognized in the future related to performance obligations that are unsatisfied (or partially unsatisfied) at the end of the reporting period.
As of September 30, 2019,March 31, 2020, the amounts allocated to contract assets and contract liabilities on the Consolidated Balance Sheets are $207$224 million and are reflected in the amounts below. This will be recognized as revenue as the obligations are satisfied, which is expected to occur over the next 2531 years. Further, MPLX does not disclose variable consideration due to volume variability in the table below.
| | | (In millions) | | |
| 2019 | $ | 408 |
| |
| 2020 | 1,620 |
| $ | 1,344 |
|
| 2021 | 1,601 |
| 1,747 |
|
| 2022 | 1,567 |
| 1,717 |
|
| 2023 and thereafter | 6,581 |
| |
| 2023 | | 1,638 |
|
| 2024 and thereafter | | 5,662 |
|
Total revenue on remaining performance obligations(1),(2),(3) | $ | 11,777 |
| $ | 12,108 |
|
(1) All fixed consideration from contracts with customers is included in the amounts presented above. Variable consideration that is constrained or not required to be estimated as it reflects our efforts to perform is excluded.
(2) Arrangements deemed implicit leases are included in “Rental income” and are excluded from this table.
(3) Only minimum volume commitments that are deemed fixed are included in the table above. MPLX has various minimum volume commitments in processing arrangements that vary based on the actual Btu content of the gas received. These amounts are deemed variable consideration and are excluded from the table above.
| |
| (1) | All fixed consideration from contracts with customers is included in the amounts presented above. Variable consideration that is constrained or not required to be estimated as it reflects our efforts to perform is excluded. |
| |
| (2) | Arrangements deemed implicit leases are included in “Rental income” and are excluded from this table. |
| |
| (3) | Only minimum volume commitments that are deemed fixed are included in the table above. MPLX has various minimum volume commitments in processing arrangements that vary based on the actual Btu content of the gas received. These amounts are deemed variable consideration and are excluded from the table above. |
We do not disclose information on the future performance obligations for any contract with an original expected duration of
one year or less.
17. Supplemental Cash Flow Information
|
| | | | | | | |
| (In millions) | September 30, 2019 | | December 31, 2018 |
| Cash and cash equivalents | $ | 41 |
| | $ | 77 |
|
Restricted cash(1) | — |
| | 8 |
|
| Cash, cash equivalents and restricted cash | $ | 41 |
| | $ | 85 |
|
(1) The restricted cash balance is included within “Other current assets” on the Consolidated Balance Sheets.
|
| | | | | | | |
| | Nine Months Ended September 30, |
| (In millions) | 2019 | | 2018 |
| Net cash provided by operating activities included: | | | |
| Interest paid (net of amounts capitalized) | $ | 648 |
| | $ | 293 |
|
| Income taxes paid | — |
| | 1 |
|
| Cash paid for amounts included in the measurement of lease liabilities | | | |
| Payments on operating leases | 62 |
| | — |
|
| Interest payment under finance lease obligations | 1 |
| | — |
|
| Net cash provided by financing activities included: | | | |
| Principal payments under finance lease obligations | 4 |
| | — |
|
| Non-cash investing and financing activities: | | | |
| Net transfers of property, plant and equipment from materials and supplies inventories | 1 |
| | 2 |
|
| MPLX terminal lease classification change | 21 |
| | — |
|
| ROU assets obtained in exchange for new operating lease obligations | 13 |
| | — |
|
| ROU assets obtained in exchange for new finance lease obligations | $ | 4 |
| | $ | — |
|
|
| | | | | | | |
| | Three Months Ended March 31, |
| (In millions) | 2020 | | 2019 |
| Net cash provided by operating activities included: | | | |
| Interest paid (net of amounts capitalized) | $ | 210 |
| | $ | 173 |
|
| Non-cash investing and financing activities: | | | |
| Net transfers of property, plant and equipment from (to) materials and supplies inventories | (1 | ) | | 1 |
|
The Consolidated Statements of Cash Flows exclude changes to the Consolidated Balance Sheets that did not affect cash. The following is the change of additions to property, plant and equipment related to capital accruals:
| | | | Nine Months Ended September 30, | Three Months Ended March 31, |
| (In millions) | 2019 | | 2018 | 2020 | | 2019 |
| (Decrease)/increase in capital accruals | $ | (67 | ) | | $ | 90 |
| $ | (61 | ) | | $ | (71 | ) |
17.18. Accumulated Other Comprehensive Loss
MPLX LP records an accumulated other comprehensive loss on the Consolidated Balance Sheets relating to pension and other post-retirement benefits provided by LOOP LLC (“LOOP”) and Explorer Pipeline Company (“Explorer”) to their employees. MPLX LP is not a sponsor of these benefit plans.
The following table shows the changes in “Accumulated other comprehensive loss” by component during the period December 31, 20182019 through September 30, 2019.
|
| | | | | | | | | | | |
| (In millions) | Pension
Benefits | | Other
Post-Retirement Benefits | | Total |
Balance at December 31, 2018(1) | $ | (14 | ) | | $ | (2 | ) | | $ | (16 | ) |
Other comprehensive income - remeasurements(2) | — |
| | 1 |
| | 1 |
|
Balance at September 30, 2019(1) | $ | (14 | ) | | $ | (1 | ) | | $ | (15 | ) |
|
| | | | | | | | | | | |
| (In millions) | Pension
Benefits | | Other
Post-Retirement Benefits | | Total |
Balance at December 31, 2019(1) | $ | (14 | ) | | $ | (1 | ) | | $ | (15 | ) |
Other comprehensive loss - remeasurements(2) | — |
| | (1 | ) | | (1 | ) |
Balance at March 31, 2020(1) | (14 | ) | | (2 | ) | | (16 | ) |
The following table shows the changes in “Accumulated other comprehensive loss” by component during the period December 31, 20172018 through September 30, 2018.March 31, 2019.
|
| | | | | | | | | | | |
| (In millions) | Pension Benefits | | Other Post-Retirement Benefits | | Total |
Balance at December 31, 2017(1) | $ | (13 | ) | | $ | (1 | ) | | $ | (14 | ) |
Other comprehensive loss - remeasurements(2) | (1 | ) | | (1 | ) | | (2 | ) |
Balance at September 30, 2018(1) | $ | (14 | ) |
| $ | (2 | ) |
| $ | (16 | ) |
|
| | | | | | | | | | | |
| (In millions) | Pension
Benefits | | Other
Post-Retirement Benefits | | Total |
Balance at December 31, 2018(1) | $ | (14 | ) | | $ | (2 | ) | | $ | (16 | ) |
Other comprehensive income - remeasurements(2) | — |
| | 1 |
| | 1 |
|
Balance at March 31, 2019(1) | $ | (14 | ) | | $ | (1 | ) | | $ | (15 | ) |
(1) These components of “Accumulated other comprehensive loss” are included in the computation of net periodic benefit cost by LOOP and Explorer and are therefore included on the Consolidated Statements of Income under the caption “Income/(loss) from equity method investments.”
(2) | |
| (1) | These components of “Accumulated other comprehensive loss” are included in the computation of net periodic benefit cost by LOOP and Explorer and are therefore included on the Consolidated Statements of Income under the caption “Income/(loss) from equity method investments.” |
| |
| (2) | Components of other comprehensive income/loss - remeasurements relate to actuarial gains and losses as well as amortization of prior service costs. MPLX records an adjustment to “Comprehensive income” in accordance with its ownership interest in LOOP and Explorer. |
19. Equity-Based Compensation
Phantom Units– Upon the completion of the Merger, each phantom unit held by employees of ANDX was converted into 1.135 MPLX phantom units. These units retained their original vesting terms and are accounted for using the fair value per unit calculated by MPC as of October 1, 2018.
The following is a summary of phantom unit award activity of MPLX LP common units for the ninethree months ended September 30, 2019March 31, 2020:
| | | | Number
of Units | | Weighted
Average
Fair Value | Number
of Units | | Weighted
Average
Fair Value |
| Outstanding at December 31, 2018 | 1,154,335 |
| | $ | 34.34 |
| |
| Outstanding at December 31, 2019 | | 1,109,568 |
| | $ | 35.97 |
|
| Granted | 207,515 |
| | 32.96 |
| 168,212 |
| | 20.49 |
|
| Legacy ANDX phantom units converted to MPLX phantom units at the Merger | 208,533 |
| | 43.64 |
| |
| Settled | (420,374 | ) | | 33.76 |
| (174,888 | ) | | 36.29 |
|
| Forfeited | (42,464 | ) | | 33.53 |
| (335 | ) | | 33.55 |
|
| Outstanding at September 30, 2019 | 1,107,545 |
| | $ | 36.09 |
| |
| Outstanding at March 31, 2020 | | 1,102,557 |
| | $ | 33.56 |
|
Performance Units – MPLX grants performance units to certain officers of the general partner and certain eligible MPC officers who make significant contributions to its business. These performance units pay out 75 percent in cash and 25 percent in MPLX LP common units and often contain both market and performance conditions based on various metrics. Market conditions are valued using a Monte Carlo valuation while performance conditions are reevaluated periodically and valued at the compensation cost associated with the performance outcome deemed most probable.
The performance units granted in 20192020 are hybrid awards having a three-year performance period of January 1, 20192020 through December 31, 2021.2022. The payout of the award is dependent on two independent conditions, each constituting 50 percent of the overall target units granted. The awards have a performance condition based on MPLX LP’s distributable cash flow, and a market condition based on MPLX LP’s total unitholder return. The market condition was valued using a Monte Carlo valuation, resulting in a grant date fair value of $0.68$0.80 per unit for the 20192020 equity-classified performance units. Grant date fair value of the performance condition is based on potential payouts per unit of up to $2.00 per unit. Compensation cost associated with the performance condition is based on the grant date fair value of the payout deemed most probable to occur and is adjusted as the expectation for payout changes.
During the first quarter of 2018, a performance award was granted; however, a grant date could not be established based ondue to the nature of the award terms. Giventerms, the grant date for this award was not established until the first quarter of 2020 and we began recognizing units and expense related to this award at that time. The performance units granted in 2018 are hybrid awards having a three-year performance period of January 1, 2018 through December 31, 2020. The payout of the award is dependent on two independent conditions, each constituting 50 percent of the overall target units granted. The awards have a performance condition based on an average of MPLX LP’s distributable cash flow and a market condition based on MPLX LP’s total unitholder return. The market condition was valued using a Monte Carlo valuation, resulting in a grant date cannot be established, no expense or units have been recorded. When a grantfair value of $0.45 per unit for the 2018 equity-classified performance units. Grant date is established, the fair value of the award will be recognized overperformance condition is based on potential payouts per unit of up to $2.00 per unit. Compensation cost associated with the remaining performance period.condition is based on the grant date fair value of the payout deemed most probable to occur and is adjusted as the expectation for payout changes.
The following is a summary of the activity for performance unit awards to be settled in MPLX LP common units for the ninethree months ended September 30, 2019March 31, 2020:
|
| | |
| | Number of
Units |
Outstanding at December 31, 20182019 | 1,941,7502,157,347 |
|
| Granted | 987,9942,147,211 |
|
| Settled | (772,3971,169,354 | ) |
| Forfeited | —(18,750 |
|
Outstanding at September 30, 2019March 31, 2020 | 2,157,3473,116,454 |
|
19. Leases
For further information regarding the adoption of ASC 842, including the method of adoption and practical expedients elected, see Note 2.
Lessee
We lease a wide variety of facilities and equipment under leases from third parties, including land and building space, office and field equipment, storage facilities and transportation equipment, while our related party leases primarily relate to ground leases associated with our refining logistics assets. Our remaining lease terms range from less than one year to 60 years. Some long-term leases include renewal options ranging from one to 50 years and, in certain leases, also include purchase options. Renewal options and termination options were not included in the measurement of ROU assets and lease liabilities since it was determined they were not reasonably certain to be exercised.
Under ASC 842, the components of lease cost were as follows:
|
| | | | | | | | | | | | | | | |
| | Three Months Ended September 30, 2019 | | Nine Months Ended September 30, 2019 |
| (In millions) | Related Party | | Third Party | | Related Party | | Third Party |
| Components of lease cost: | | | | | | | |
| Operating lease cost | $ | 4 |
| | $ | 19 |
| | $ | 11 |
| | $ | 56 |
|
| | | | | | | | |
| Finance lease cost: | | | | | | | |
| Amortization of ROU assets | — |
| | 1 |
| | — |
| | 4 |
|
| Interest on lease liabilities | — |
| | — |
| | — |
| | 1 |
|
| Total finance lease cost | — |
| | 1 |
| | — |
| | 5 |
|
| | | | | | | | |
| Variable lease cost | — |
| | 3 |
| | — |
| | 7 |
|
| Short-term lease cost | — |
| | 20 |
| | — |
| | 56 |
|
| Total lease cost | $ | 4 |
| | $ | 43 |
| | $ | 11 |
| | $ | 124 |
|
Supplemental balance sheet data related to leases is as follows:
|
| | | | | | | |
| | September 30, 2019 |
| (In millions) | Related Party | | Third Party |
| Operating leases | | | |
| Assets | | | |
| Right of use assets | $ | 232 |
| | $ | 366 |
|
| Liabilities | | | |
| Operating lease liabilities | 1 |
| | 61 |
|
| Long-term operating lease liabilities | 231 |
| | 309 |
|
| Total operating lease liabilities | $ | 232 |
| | $ | 370 |
|
| Weighted average remaining lease term | 47.44 years |
| | 8.86 years |
|
| Weighted average discount rate | 5.80 | % | | 4.48 | % |
| | | | |
| Finance leases | | | |
| Assets | | | |
| Property, plant and equipment, gross | | | $ | 49 |
|
| Accumulated depreciation | | | 21 |
|
| Property, plant and equipment, net | | | 28 |
|
| Liabilities | | | |
| Other current liabilities | | | 9 |
|
| Long-term debt | | | 11 |
|
| Total finance lease liabilities | | | $ | 20 |
|
| Weighted average remaining lease term | | | 10.00 years |
|
| Weighted average discount rate | | | 5.81 | % |
As of September 30, 2019, maturities of lease liabilities for operating lease obligations and finance lease obligations having initial or remaining non-cancellable lease terms in excess of one year are as follows:
|
| | | | | | | | | | | |
| (In millions) | Related Party Operating
Leases | | Third Party Operating
Leases | | Finance
Leases |
| 2019 | $ | 5 |
| | $ | 21 |
| | $ | 1 |
|
| 2020 | 14 |
| | 74 |
| | 10 |
|
| 2021 | 14 |
| | 68 |
| | 2 |
|
| 2022 | 14 |
| | 59 |
| | 2 |
|
| 2023 | 14 |
| | 55 |
| | 2 |
|
| 2024 and thereafter | 619 |
| | 173 |
| | 11 |
|
| Gross lease payments | 680 |
| | 450 |
| | 28 |
|
| Less: imputed interest | 448 |
| | 80 |
| | 8 |
|
| Total lease liabilities | $ | 232 |
| | $ | 370 |
| | $ | 20 |
|
Future minimum commitments as of December 31, 2018, for capital lease obligations and for operating lease obligations having initial or remaining non-cancellable lease terms in excess of one year are as follows:
|
| | | | | | | |
| (In millions) | Operating
Lease
Obligations | | Capital Lease Obligations |
| 2019 | $ | 90 |
| | $ | 5 |
|
| 2020 | 88 |
| | 8 |
|
| 2021 | 83 |
| | 3 |
|
| 2022 | 76 |
| | 2 |
|
| 2023 | 70 |
| | 2 |
|
| 2024 and thereafter | 825 |
| | 4 |
|
| Total minimum lease payments | $ | 1,232 |
| | 24 |
|
| Less: imputed interest costs | | | 3 |
|
| Present value of net minimum lease payments | | | $ | 21 |
|
Lessor
Based on the terms of fee-based transportation and storage services agreements with MPC as well as certain natural gas gathering, transportation and processing agreements, MPLX is considered to be the lessor under several operating lease arrangements in accordance with GAAP. The agreements with MPC have remaining terms ranging from less than one year to 12 years with renewal options ranging from zero to 10 years. MPLX’s primary natural gas lease operations relate to a natural gas gathering agreement in the Marcellus Shale for which we earn a fixed fee for providing gathering services to a single producer using a dedicated gathering system. As the gathering system is expanded, the fixed fee charged to the producer is adjusted to include the additional gathering assets in the lease with the fee being recorded on a straight-line basis over the life of the agreement. The primary term of the natural gas gathering arrangement expires in 2038 and will continue thereafter on a year-to-year basis until terminated by either party. Other significant natural gas implicit leases relate to a natural gas processing agreement in the Marcellus Shale and a natural gas processing agreement in the Southern Appalachia region for which MPLX earns minimum monthly fees for providing processing services to a single producer using a dedicated processing plant. The primary term of these natural gas processing agreements expires during 2023 and 2033 with the contracts continuing thereafter on a year-to-year basis until terminated by either party.
MPLX did not elect to use the practical expedient to combine lease and non-lease components for lessor arrangements. The tables below represent the portion of the contract allocated to the lease component based on relative standalone selling price. Some lessor agreements are currently deemed operating, as we elected the practical expedient to carry forward historical classification conclusions. If and when a modification of an existing agreement occurs and the agreement is required to be assessed under ASC 842, MPLX assesses the amended agreement and makes a determination as to whether a reclassification of the lease is required.
DuringFor the three months ended September 30, 2019, thereMarch 31, 2020, reimbursements for projects at certain MPLX refining logistics locations were agreed to between MPLX and MPC. These reimbursements relate to the storage services agreements between MPLX and MPC at these locations and required the embedded leases within these agreements to be reassessed under the leasing standard. As a result of the reassessment, one of our leases was a modification to MPLX terminal agreements with MPC. Based on the modification, certain terminals within the MPLX terminal agreement were reclassified from an operating leaseslease to a sales-type leases.lease. As a result, the underlying assets previously shown on the Consolidated Balance Sheets associated with the sales-typessales-type lease were derecognized and the net investment in the lease (i.e., the sum of the present value of the future lease payments and the unguaranteed residual value of the assets) was recorded as a lease receivable. When determiningSee Note 5 for the net investment inlocation of lease receivables and unguaranteed residual assets on the lease, certain variable payments were excluded from the total contract consideration, primarily related to fees for which there are no minimum volume commitments.Consolidated Balance Sheets. The difference between the net book value of the underlying assets and the net investment in the lease has been recorded through equityas a Contribution from MPC in the Consolidated Statements of Equity given that the dropdown of MPLXTtransaction related to refining logistics was a common control transaction. During the three months ended September 30, 2019,March 31, 2020, MPLX derecognized approximately $29$171 million of property, plant and equipment, derecognized approximately $3 million of existing deferred rent receivable, recorded a lease receivable of approximately $47$370 million, recorded an unguaranteed residual asset of approximately $6$10 million and equitya Contribution from MPC of $21$209 million.
Lease revenues included on the Consolidated Statements of Income were as follows:
| | | | Three Months Ended September 30, | | Nine Months Ended September 30, | Three Months Ended March 31, 2020 | | Three Months Ended March 31, 2019 |
| (In millions) | Related Party | | Third Party | | Related Party | | Third Party | Related Party | | Third Party | | Related Party | | Third Party |
| Operating leases: | | | | | | | | | | | | | | |
Operating lease revenue(1)(2) | $ | 248 |
| | $ | 63 |
| | $ | 773 |
| | $ | 196 |
| $ | 186 |
| | $ | 63 |
| | $ | 279 |
| | $ | 65 |
|
| | | | | | | | | | | | | | | |
| Sales-type leases: | | | | | | | | | | | | | | |
| Profit/(loss) recognized at the commencement date | — |
| | N/A |
| | — |
| | N/A |
| — |
| | N/A |
| | N/A |
| | N/A |
|
| Interest income (Sales-type lease revenue- fixed minimum) | 3 |
| | N/A |
| | 3 |
| | N/A |
| 38 |
| | N/A |
| | N/A |
| | N/A |
|
| Interest income (Revenue from variable lease payments) | $ | 1 |
| | N/A |
| | $ | 1 |
| | N/A |
| $ | — |
| | N/A |
| | N/A |
| | N/A |
|
| |
| (1) | These amounts are presented net of executory costs. |
| |
| (2) | Financial information for the first quarter of 2019 has been retrospectively adjusted for the acquisition of ANDX. See Notes 1 and 3. |
The following is a schedule of minimum future rental revenue on the non-cancellable operating leases as of September 30, 2019:
|
| | | | | | | | | | | |
| (In millions) | Related Party | | Third Party | | Total |
| 2019 | $ | 294 |
| | $ | 47 |
| | $ | 341 |
|
| 2020 | 1,179 |
| | 186 |
| | 1,365 |
|
| 2021 | 1,175 |
| | 178 |
| | 1,353 |
|
| 2022 | 1,171 |
| | 176 |
| | 1,347 |
|
| 2023 | 1,118 |
| | 170 |
| | 1,288 |
|
| 2024 and thereafter | 3,904 |
| | 1,269 |
| | 5,173 |
|
| Total minimum future rentals | $ | 8,841 |
| | $ | 2,026 |
| | $ | 10,867 |
|
The following is a schedule of minimum future rental revenue on the non-cancellable operating leases as of December 31, 2018:
|
| | | | | | | | | | | |
| (In millions) | Related Party | | Third Party | | Total |
| 2019 | $ | 1,277 |
| | $ | 171 |
| | $ | 1,448 |
|
| 2020 | 1,275 |
| | 163 |
| | 1,438 |
|
| 2021 | 1,146 |
| | 154 |
| | 1,300 |
|
| 2022 | 1,143 |
| | 151 |
| | 1,294 |
|
| 2023 | 1,094 |
| | 145 |
| | 1,239 |
|
| 2024 and thereafter | 3,786 |
| | 1,114 |
| | 4,900 |
|
| Total minimum future rentals | $ | 9,721 |
| | $ | 1,898 |
| | $ | 11,619 |
|
The following is a schedule of minimum future revenuepayments on the sales-type leases with MPC as of September 30, 2019:
|
| | | |
| (In millions) | Related Party |
| 2019 | $ | 3 |
|
| 2020 | 14 |
|
| 2021 | 14 |
|
| 2022 | 14 |
|
| 2023 | 15 |
|
| 2024 and thereafter | 34 |
|
| Total minimum future rentals | 94 |
|
| Less: present value discount | 47 |
|
| Lease receivable | $ | 47 |
|
The following schedule summarizes MPLX’s investment in assets held for operating lease by major classes as of September 30, 2019 and December 31, 2018:
|
| | | | | | | |
| (In millions) | September 30, 2019 | | December 31, 2018 |
| Natural gas gathering and NGL transportation pipelines and facilities | $ | 1,061 |
| | $ | 964 |
|
| Processing, fractionation and storage facilities | 1,911 |
| | 1,670 |
|
| Pipelines and related assets | 364 |
| | 376 |
|
| Barges and towing vessels | 674 |
| | 619 |
|
| Terminals and related assets | 1,316 |
| | 1,415 |
|
| Refinery related assets | 998 |
| | 981 |
|
| Land, building, office equipment and other | 270 |
| | 187 |
|
| Total | 6,594 |
| | 6,212 |
|
| Less accumulated depreciation | 2,271 |
| | 2,074 |
|
| Property, plant and equipment, net | $ | 4,323 |
| | $ | 4,138 |
|
|
| | | |
| (In millions) | Related Party |
| 2020 | $ | 129 |
|
| 2021 | 157 |
|
| 2022 | 157 |
|
| 2023 | 158 |
|
| 2024 | 158 |
|
| 2025 and thereafter | 461 |
|
| Total minimum future rentals | 1,220 |
|
| Less: present value discount | 795 |
|
| Lease receivable | $ | 425 |
|
20.21. Commitments and Contingencies
MPLX is the subject of, or a party to, a number of pending or threatened legal actions, contingencies and commitments involving a variety of matters, including laws and regulations relating to the environment. Some of these matters are discussed below. For matters for which MPLX has not recorded an accrued liability, MPLX is unable to estimate a range of possible losses because the issues involved have not been fully developed through pleadings, discovery or court proceedings. However, the ultimate resolution of some of these contingencies could, individually or in the aggregate, be material.
Environmental Matters – MPLX is subject to federal, state and local laws and regulations relating to the environment. These laws generally provide for control of pollutants released into the environment and require responsible parties to undertake remediation of hazardous waste disposal sites. Penalties may be imposed for non-compliance.
At September 30, 2019March 31, 2020 and December 31, 2018,2019, accrued liabilities for remediation totaled $19$17 million and $20$19 million, respectively. However, it is not presently possible to estimate the ultimate amount of all remediation costs that might be incurred or the penalties, if any, which may be imposed. At September 30, 2019March 31, 2020 and December 31, 2018,2019, there were 0 balances with MPC for indemnification of environmental costs.
MPLX is involved in environmental enforcement matters arising in the ordinary course of business. While the outcome and impact onto MPLX cannot be predicted with certainty, management believes the resolution of these environmental matters will not, individually or collectively, have a material adverse effect on its consolidated results of operations, financial position or cash flows.
Other Lawsuits – MPLX, MarkWest, MarkWest Liberty Midstream, MarkWest Liberty Bluestone, L.L.C., Ohio Fractionation and MarkWest Utica EMG (collectively, the “MPLX Parties”) are parties to various lawsuits with Bilfinger Westcon, Inc.
(“Westcon”) that were instituted in 2016 and 2017 in Pennsylvania, West Virginia and Ohio. The lawsuits relate to disputes regarding construction work performed by Westcon at the Bluestone, Mobley and Cadiz processing complexes in Pennsylvania, West Virginia and Ohio, respectively, and the Hopedale fractionation complex in Ohio. With respect to work performed by Westcon at the Mobley and Bluestone processing complexes, one or more of the MPLX Parties have asserted breach of contract, fraud, and with respect to work performed at the Mobley processing complex, MarkWest Liberty Midstream has also asserted negligent misrepresentation claims against Westcon. Westcon has also asserted claims against one or more of the MPLX Parties regarding these construction projects for breach of contract, unjust enrichment, promissory estoppel, fraud and constructive fraud, tortious interference with contractual relations, and civil conspiracy. Collectively, in the several cases, the MPLX Parties sought in excess of $10 million, plus an unspecified amount of punitive damages. Collectively, in the several cases, Westcon sought in excess of $40 million, plus an unspecified amount of punitive damages. On July 31, 2019, Westcon and the MPLX Parties reached an agreement to resolve the disputes among those parties relating to the Bluestone processing complex in Pennsylvania. The settlement resolves a significant portion of the disputes with Westcon. The settlement will not have a material adverse effect on MPLX’s consolidated financial position, results of operations or cash flows. While the ultimate outcome and impact to MPLX cannot be predicted with certainty, MPLX believes the resolution of the remaining litigation with Westcon will not have a material adverse effect on its consolidated financial position, results of operations, or cash flows.
In 2003, the State of Illinois brought an action against the Premcor Refining Group, Inc. (“Premcor”) and Apex Refining Company (“Apex”) asserting claims for environmental cleanup related to the refinery owned by these entities in the Hartford/Wood River, Illinois area. In 2006, Premcor and Apex filed third-party complaints against numerous owners and operators of petroleum products facilities in the Hartford/Wood River, Illinois area, including Marathon Pipe Line LLC (“MPL”). These complaints, which have been amended since filing, assert claims of common law nuisance and contribution under the Illinois Contribution Act and other laws for environmental cleanup costs that may be imposed on Premcor and Apex by the State of Illinois. On September 6, 2016, the trial court approved a settlement between Apex and the State of Illinois whereby Apex agreed to settle all claims against it for a $10 million payment. Premcor filed a motion for permissive appeal and requested a stay to the proceeding until the motion is ruled upon. Premcor reached a settlement with the State of Illinois in the second quarter of 2018, which has been objected to by certain third-party defendants, including MPL, and is subject to court approval. Several third-party defendants in the litigation including MPL have asserted cross-claims in contribution against the various third-party defendants. This litigation is currently pending in the Third Judicial Circuit Court, Madison County, Illinois. The trial concerning Premcor’s claims against third-party defendants, including MPL, previously scheduled to commence September 10, 2018, has been postponed and a new trial date has not been set. While the ultimate outcome and impact to MPLX cannot be predicted with certainty, MPLX does not consider it reasonably possible that a loss resulting from such lawsuits or other proceedings in excess of any amounts accrued has been incurred that is expected to have a material adverse effect on its consolidated financial position, results of operations, or cash flows. Under the omnibus agreement, MPC will indemnify MPLX for the full cost of any losses should MPL be deemed responsible for any damages in this lawsuit.
MPLX is also a party to a number of other lawsuits and other proceedings arising in the ordinary course of business. While the ultimate outcome and impact to MPLX cannot be predicted with certainty, MPLXmanagement believes the resolution of these other lawsuits and proceedings will not, individually or collectively, have a material adverse effect on its consolidated financial position, results of operations, financial position or cash flows.
Guarantees – Over the years, MPLX has sold various assets in the normal course of its business. Certain of the related agreements contain performance and general guarantees, including guarantees regarding inaccuracies in representations, warranties, covenants and agreements, and environmental and general indemnifications that require MPLX to perform upon the occurrence of a triggering event or condition. These guarantees and indemnifications are part of the normal course of selling assets. MPLX is typically not able to calculate the maximum potential amount of future payments that could be made under such contractual provisions because of the variability inherent in the guarantees and indemnities. Most often, the nature of the guarantees and indemnities is such that there is no appropriate method for quantifying the exposure because the underlying triggering event has little or no past experience upon which a reasonable prediction of the outcome can be based.
In connection with our approximate 99.19 percent indirect interest in a joint venture that owns and operates the Dakota Access Pipeline and Energy Transfer Crude Oil Pipeline projects, collectively referred to as the Bakken Pipeline system, we have entered into a Contingent Equity Contribution Agreement whereby MPLX LP, along with the other joint venture owners in the Bakken Pipeline system, have agreed to make equity contributions to the joint venture upon certain events occurring to allow the entities that own and operate the Bakken Pipeline system to satisfy their senior note payment obligations. The senior notes were issued to repay amounts owed by the pipeline companies to fund the cost of construction of the Bakken Pipeline system.
In March 2020, the U.S. District Court for the District of Columbia ordered the U.S. Army Corps of Engineers, which granted permits for the Bakken Pipeline system, to conduct a full environmental impact statement (“EIS”), and further requested briefing on whether an easement permit necessary for the operation of the Bakken Pipeline system should be vacated while the EIS is being prepared. If the permit is vacated pending completion of the EIS and the vacatur is deemed temporary, MPLX would have to contribute its 9.19 percent pro rata share of funds required to pay interest accruing on the notes while the pipeline is shutdown and its 9.19 percent pro rata share of any costs to remediate any deficiencies to reinstate the permit and/or return the pipeline into operation. If the court vacates the permit and such action results in a permanent shutdown of the pipeline, MPLX would have to contribute its 9.19 percent pro rata share of the cost to redeem the bonds (including the 1% redemption premium required pursuant to the indenture governing the notes) and any accrued and unpaid interest, if any. As of September 30, 2019,March 31, 2020, our maximum potential undiscounted payments under the Contingent Equity Contribution Agreement were approximately $230 million.
Contractual Commitments and Contingencies – At September 30, 2019,March 31, 2020, MPLX’s contractual commitments to acquire property, plant and equipment totaled $788$318 million. These commitments were primarily related to G&P plant expansion, terminal pipeline and refining logisticspipeline projects. In addition, from time to time and in the ordinary course of business, MPLX and its affiliates provide guarantees of MPLX’s subsidiaries payment and performance obligations in the G&P segment. Certain natural gas processing and gathering arrangements require MPLX to construct new natural gas processing plants, natural gas gathering pipelines and NGL pipelines and contain certain fees and charges if specified construction milestones are not achieved for reasons other than force majeure. In certain cases, certain producers may have the right to cancel the processing arrangements if there are significant delays that are not due to force majeure. As of September 30, 2019,March 31, 2020, management does not believe there are any indications that MPLX will not be able to meet the construction milestones, that force majeure does not apply or that such fees and charges will otherwise be triggered.
Also, in connection with the Merger, we assumed ANDX obligations related to future purchase obligations included in fuel costs associated with the wholesale product supply agreement, NGLs transportation costs, fractionation fees, and fixed charges with MPC. This increased our future obligations by approximately $11.9 billion as of September 30, 2019.
Item 2. Management’s Discussion and Analysis of Financial Condition and Results of Operations
Management’s Discussion and Analysis of Financial Condition and Results of Operations should also be read in conjunction with the unaudited consolidated financial statements and accompanying footnotes included under Item 1. Financial Statements and in conjunction with our Annual Report on Form 10-K for the year ended December 31, 2018.2019.
Disclosures Regarding Forward-Looking Statements
This Quarterly Report on Form 10-Q, particularly Management’s Discussion and Analysis of Financial Condition and Results of Operations and Quantitative and Qualitative Disclosures about Market Risk, includes various forward-looking statements concerning trendsthat are subject to risks, contingencies or events potentially affecting our business.uncertainties. You can identify our forward-looking statements by words such as “anticipate,” “believe,” “commitment,” “could,” “design,” “estimate,” “expect,” “forecast,” “goal,” “guidance,” “imply,” “intend,” “may,” “objective,” “opportunity,” “outlook,” “plan,” “policy,” “position,” “potential,” “predict,” “priority,” “project,” “proposition,” “prospective,” “pursue,” “seek,” “should,” “strategy,” “target,” “will,” “would” or other similar expressions that convey the uncertainty of future events or outcomes. These statements are accompanied by cautionary language identifying important factors, though not necessarily all such factors, that could cause future outcomes to differ materially from those set forth in the forward-looking statements. We undertake no obligation to update any forward-looking statements except to the extent required by applicable law.
Forward-looking statements include, but are not limited to,among other things, statements that relate to, or statements that are subject to risks, contingencies or uncertainties that relate to:regarding:
MPLX’s acquisition of ANDX;
MPC’s ongoing review of strategic alternatives for its midstream business;
future levels of revenues and other income, income from operations, net income attributable to MPLX LP, earnings per unit, Adjusted EBITDA or DCF (see the Non-GAAP Financial Information section below for the definitions of Adjusted EBITDA and DCF);
the regional, national and worldwide availability and pricing of refined products, crude oil, natural gas, NGLs and other feedstocks;
the timing and extent of changes in commodity prices and demand for crude oil, refined products, feedstocks or other hydrocarbon-based products;
our ability to manage disruptions in credit markets or changes to our credit rating;
anticipated levels of drilling activity, production rates and volumes of throughput of crude oil, natural gas, NGLs, refined products or other hydrocarbon-based products;
future levels of capital, environmental or maintenance expenditures, general and administrative and other expenses;
the success or timing of completion of ongoing or anticipated capital or maintenance projects;
the reliabilityamount and timing of processing units and other equipment;
expectations regarding joint venture arrangements and other acquisitions, including the dropdowns completed by MPC, or divestitures of assets;
business strategies, growth opportunities and expected investment;
the adequacy of our capital resources and liquidity, including but not limited to, availability of sufficient cash flow to pay distributions and access debt on commercially reasonable terms;
the effect of restructuring or reorganization of business components;
the potential effects of judicial or other proceedings on our business, financial condition, results of operations and cash flows;
the potential effects of changes in tariff rates on our business, financial condition, results of operations and cash flows;
continued or further volatility in and/or degradation of general economic, market, industry or business conditions;
compliance with federal and state environmental, economic, health and safety, energy and other policies and regulations and/or enforcement actions initiated thereunder;
our ability to successfully execute our business plans, growth strategy and self-funding model;
capital market conditions, including the cost of capital, and our ability to raise adequate capital to execute our business plan and implement our growth strategy;future distributions; and
the anticipated effects of actions of third parties such as competitors;competitors, activist investors or federal, foreign, state or local regulatory authorities;authorities or plaintiffs in litigation.
Our forward-looking statements are not guarantees of future performance and you should not rely unduly on them, as they involve risks, uncertainties and assumptions that we cannot predict. Material differences between actual results and any future performance suggested in our forward-looking statements could result from a variety of factors, including the following:
volatility or degradation in general economic, market,the effects of the recent outbreak of COVID-19 and the adverse impact thereof on our business, financial condition, results of operations and cash flows, including our growth, operating costs, labor availability, logistical capabilities, customer demand for our services and industry or business conditions;
risks and uncertainties associated with intangible assets, including any future goodwill or intangible assets impairment charges;
availability and pricing of domestic and foreign supplies of natural gas, NGLs and crude oil and other feedstocks;
availability and pricing of domestic and foreign supplies of refined products such as gasoline, diesel fuel, jet fuel, home heating oil and petrochemicals;
foreign imports and exports of crude oil, refined products, natural gas and NGLs;
completion of midstream infrastructure by competitors;
midstream and refining industry overcapacity or under capacity;
changes in the cost or availability of third-party vessels, pipelines, railcars and other means of transportation for crude oil, natural gas, NGLs, feedstocks and refined products;
demand generally, cash position, taxes, the price availabilityof our securities and acceptance of alternative fuels and alternative-fuel vehicles and laws mandating such fuels or vehicles;
fluctuations in consumer demand for refined products, natural gas and NGLs, including seasonal fluctuations;
changes to the expected construction costs and timing of projects and planned investments, andtrading markets with respect thereto, our ability to obtain regulatory and other approvals with respect thereto;
political and economic conditions in nations that consume refined products, natural gas and NGLs, including the United States, and in crude oil producing regions, including the Middle East, Africa, Canada and South America;
actions taken by our competitors, including pricing adjustmentsaccess capital markets, and the expansionglobal economy and retirementfinancial markets generally;
Marathon Petroleum Corporation’s (“MPC”) ability to achieve its strategic objectives and the effects of pipeline capacity, processing, fractionationthose strategic decisions on us;
the risk that anticipated opportunities and treating facilities in response to market conditions;
changes in fuel and utility costs for our facilities;
failureany other synergies from or anticipated benefits of the Andeavor Logistics LP (“ANDX”) acquisition may not be fully realized or may take longer to realize than expected, including whether the benefits projected fortransaction will be accretive within the expected timeframe or at all;
disruption from the ANDX acquisition making it more difficult to maintain relationships with customers, employees or suppliers;
risks relating to any unforeseen liabilities of ANDX;
further impairments;
negative capital projects, or cost overruns associated with such projects;market conditions, including an increase of the current yield on common units;
the ability to achieve strategic and financial objectives, including with respect to distribution coverage, future distribution levels, proposed projects and completed transactions;
accidents or other unscheduled shutdowns affecting our machinery, pipelines, processing, fractionation and treating facilities or equipment, or thosethe success of our suppliers or customers;
unusual weather conditions and natural disasters;
disruptions due to equipment interruption or failure,MPC’s portfolio optimization, including electrical shortages and power grid failures;
acts of war, terrorism or civil unrest that could impair our ability to gather, process, fractionate or transport crude oil, natural gas, NGLs or refined products;
state and federal environmental, economic, health and safety, energy and other policies and regulations, including the cost of compliance;
the ability to complete any divestitures on commercially reasonable terms and/or within the expected timeframe, and the effects of any such divestitures on the business, financial condition, results of operations and cash flows;
adverse changes in laws including with respect to tax and regulatory matters;
modificationsthe adequacy of capital resources and liquidity, including the availability of sufficient cash flow to financial policies, capital budgets,pay distributions and earningsaccess to debt on commercially reasonable terms, and distributions;the ability to successfully execute business plans, growth strategies and self-funding models; and
rulings, judgments or settlementsthe timing and related expensesextent of changes in litigationcommodity prices and demand for crude oil, refined products, feedstocks or other legal, taxhydrocarbon-based products;
volatility in or degradation of market and industry conditions as a result of the COVID-19 pandemic, other infectious disease outbreaks or otherwise;
changes to the expected construction costs and timing of projects and planned investments, and the ability to obtain regulatory matters,and other approvals with respect thereto;
completion of midstream infrastructure by competitors;
disruptions due to equipment interruption or failure, including unexpected environmental remediation costs, in excess of any reserves or insurance coverage;electrical shortages and power grid failures;
the suspension, reduction or termination of MPC’s obligations under MPLX’s commercial agreements;
modifications to financial policies, capital budgets, and earnings and distributions;
the ability to manage disruptions in credit markets or changes to credit ratings;
compliance with federal and state environmental, economic, health and safety, energy and other policies and regulations or enforcement actions initiated thereunder;
adverse results in litigation;
the reliability of processing units and other equipment;
the effect of restructuring or reorganization of business components;
the potential effects of changes in tariff rates on our business, financial condition, results of operations and cash flows;
foreign imports and exports of crude oil, refined products, natural gas and NGLs;
changes in producer customers’ drilling plans or in volumes of throughput of crude oil, natural gas, NGLs, refined products or other hydrocarbon-based products;
non-payment or non-performance by our producer and other customers;
changes in the cost or availability of third-party vessels, pipelines, railcars and other means of transportation for crude oil, natural gas, NGLs, feedstocks and refined products;
the price, availability and acceptance of alternative fuels and alternative-fuel vehicles and laws mandating such fuels or vehicles;
actions taken by our competitors, including pricing adjustments and the expansion and retirement of pipeline capacity, processing, fractionation and treating facilities in response to market conditions;
expectations regarding joint venture arrangements and other acquisitions, including the dropdowns completed by MPC, or divestitures of assets;
midstream and refining industry overcapacity or under capacity;
accidents or other unscheduled shutdowns affecting our machinery, pipelines, processing, fractionation and treating facilities or equipment, or those of our suppliers or customers;
acts of war, terrorism or civil unrest that could impair our ability to gather, process, fractionate or transport crude oil, natural gas, NGLs or refined products; and
political pressure and influence of environmental groups upon policies and decisions related to the production, gathering, refining, processing, fractionation, transportation and marketing of crude oil or other feedstocks, refined products, natural gas, NGLs or other hydrocarbon-based products;
labor and material shortages;
changes to our capital budget;
the ability and willingness of parties with whom we have material relationships to perform their obligations to us;
negative capital market conditions, including an increase of the current yield on MPLX LP common units, adversely affecting MPLX LP’s ability to meet its distribution growth guidance;
changes in the credit ratings assigned to our debt securities and trade credit, changes in the availability of unsecured credit, changes affecting the credit markets generally and our ability to manage such changes; andproducts.
For additional risk factors affecting our business, see “Item 1A. Risk Factors” below, together with the risk factors described in our Annual Report on Form 10-K for the year ended December 31, 2018, as updated in our Quarterly Report on Form 10-Q for2019. We undertake no obligation to update any forward-looking statements except to the quarter ended June 30, 2019.extent required by applicable law.
MPLX OVERVIEW
We are a diversified, large-cap MLP formed by MPC, that owns and operates midstream energy infrastructure and logistics assets, and provides fuels distribution services. We are engaged in the transportation, storage and distribution of crude oil and refined petroleum products; the gathering, processing and transportation of natural gas; and the gathering, transportation, fractionation, storage and marketing of NGLs. Our operations are conducted in our Logistics and Storage and Gathering and Processing segments.
SIGNIFICANT FINANCIAL AND OTHER HIGHLIGHTS
Significant financial highlights including revenues and other income, income from operations, net income, adjusted EBITDA attributable to MPLX and DCF attributable to GP and LP unitholders for the three months ended September 30,March 31, 2020 and March 31, 2019 and September 30, 2018 are shown in the chart below. These results include the recast of ANDX financial information into MPLX’s financial information as a result of the Merger. See the Non-GAAP Financial Information section below for the definitions of Adjusted EBITDA and DCF and the Results of Operations section for further details regarding changes in these metrics.
(1) Includes Adjusted EBITDA attributable to Predecessor and portion of DCF adjustments attributable to Predecessor.
| |
| (1) | Q1 2020 includes impairment related to equity method investments of approximately $1.3 billion within our G&P operating segment. |
| |
| (2) | Q1 2020 includes impairment related to equity method investments of approximately $1.3 billion, goodwill impairment of approximately $1.8 billion and long-lived asset impairments of approximately $0.3 billion, all within our G&P operating segment. |
| |
| (3) | Q1 2019 includes Adjusted EBITDA attributable to Predecessor and portion of DCF adjustments attributable to Predecessor. |
Other Highlights
MPLX completed the acquisitionRecognized approximately $3.4 billion of ANDX via Merger on July 30, 2019. The historical results of ANDX have been incorporated into the MPLX results from October 1, 2018, which is the date that MPC acquired Andeavor. At the effective time of the Merger, each common unit held by ANDX’s public unitholders was converted into the right to receive 1.135 MPLX common units. ANDX common units held by certain affiliates of MPC were converted into the right to receive 1.0328 MPLX common units. The assets of ANDX complement and enhance MPLX’s existing asset base and further expand MPLX’s existing footprint.
Duringimpairments during the quarter MPLX: entered intorelated to goodwill, equity method investments and long-lived assets (including intangibles).
MPC announced the unanimous decision of its board of directors to maintain MPC’s current midstream structure, with MPC remaining the general partner of MPLX. This was a Term Loan Agreement,result of a comprehensive evaluation by a special committee formed by MPC’s board of directors, which provides for a committed term loan facility for up to an aggregate of $1 billion; issued $2.0 billion aggregate principal amount of floating rate senior notes in a public offering; increased its borrowing capacity on the MPLX Credit Agreement to $3.5 billion;included extensive input from multiple external advisors and extended the MPLX Credit Agreement term to July 30, 2024.
In connection with the Merger, MPLX also assumed all outstanding ANDX senior notes, which had an aggregate principal amount of $3.75 billion with interest rates rangingsignificant feedback from 3.5 percent to 6.375 percent and maturity dates ranging from 2019 to 2047. On September 23, 2019, approximately $3.06 billion aggregate principal amount of ANDX’s outstanding senior notes were exchanged for an aggregate principal amount of approximately $3.06 billion new unsecured senior notes issued by MPLX in an exchange offer and consent solicitation undertaken by MPLX, leaving approximately $690 million aggregate principal of outstanding senior notes held by ANDX.
During the nine months ended September 30, 2019, we did not issue any common units under our ATM Program. As of September 30, 2019, $1.7 billion of common units remain available for issuance through the ATM Program.investors.
MPLX continues to focus on portfolio optimization, which could include asset divestitures.
RECENT DEVELOPMENTS
Announced plans to reduce 2020 capital spending to approximately $1.0 billion and expect to reduce forecasted annual operating expenses by approximately $200 million. Reduction in capital spending is primarily related to the BANGL project which is no longer being pursued as the company works with others to optimize existing pipeline capacity while continuing to meet producers’ needs for flow assurance and future growth. The reduction in operating expenses will be achieved through the deferral of certain expense projects.
Announced a first quarter distribution rate of $0.6875 per common unit.
RECENT DEVELOPMENTSCURRENT ECONOMIC ENVIRONMENT
MPC’s boardThe recent outbreak of directorsCOVID-19 and its development into a pandemic in March 2020 has formedresulted in significant economic disruption globally. Actions taken by various governmental authorities, individuals and companies around the world to prevent the spread of COVID-19 through social distancing have restricted travel, many business operations, public gatherings and the overall level of individual movement and in-person interaction across the globe. This has significantly reduced global economic activity and resulted in a special committeedecline in the demand for products for which we provide midstream services. Macroeconomic conditions and global geopolitical events have also resulted in significant price volatility related to enhancethose aforementioned products.
We are actively responding to the impacts that these matters are having on our business by:
Canceling or delaying certain capital expenditures that we had expected to make in 2020.
Taking actions to reduce operating expenses across the business.
Continuing to evaluate and high-grade our capital portfolio
Many uncertainties remain with respect to COVID-19, including its evaluationresulting economic effects, and we are unable to predict the ultimate economic impacts from COVID-19 and how quickly national economies can recover once the pandemic ultimately subsides. However, the adverse impact will likely continue to have an impact on our business and our customers’ businesses. We believe we have proactively addressed many of potential value-creating options for its Midstream business. Among other aspects, the special committeeknown impacts of COVID-19 to the extent possible and will analyzestrive to continue to do so, but there can be no guarantee the strategic fit of assets with MPC, the ability to realize full valuation credit for midstream earnings and cash flow, balance sheet impacts including liquidity and credit ratings, transaction tax impacts, separation costs, and overall complexity.measures will be fully effective.
On October 15, 2019, MPLX borrowed the remaining $500 million in term loan capacity under the Term Loan Agreement. On the same day, MPLX paid off $500 million of outstanding ANDX 5.5 percent unsecured senior notes due 2019 and related accrued interest of $13.75 million
NON-GAAP FINANCIAL INFORMATION
Our management uses a variety of financial and operating metrics to analyze our performance. These metrics are significant factors in assessing our operating results and profitability and include the non-GAAP financial measures of Adjusted EBITDA and DCF. The amount of Adjusted EBITDA and DCF generated is considered by the board of directors of our general partner in approving MPLX’s cash distributions.
We define Adjusted EBITDA as net income adjusted for: (i) depreciation and amortization; (ii) provision/(benefit) for income taxes; (iii) amortization of deferred financing costs; (iv) extinguishment of debt; (v) non-cash equity-based compensation; (vi) impairment expense; (vii) net interest and other financial costs; (viii) income/(loss) from equity method investments; (ix) distributions and adjustments related to equity method investments; (x) unrealized derivative gains/(losses); (xi) acquisition costs; (xii) noncontrolling interest; and (xiii) other adjustments as deemed necessary. We also use DCF, which we define as Adjusted EBITDA adjusted for: (i) deferred revenue impacts; (ii) net interest and other financial costs; (iii) maintenance capital expenditures; (iv) equity method investment capital expenditures paid out; and (v) other non-cash items. MPLX makes a distinction between realized and unrealized gains and losses on derivatives. During the period when a derivative contract is outstanding, changes in the fair value of the derivative are recorded as an unrealized gain or loss. When a derivative contract matures or is settled, the previously recorded unrealized gain or loss is reversed and the realized gain or loss of the contract is recorded.
We believe that the presentation of Adjusted EBITDA and DCF provides useful information to investors in assessing our financial condition and results of operations. The GAAP measures most directly comparable to Adjusted EBITDA and DCF are net income and net cash provided by operating activities. Adjusted EBITDA and DCF should not be considered alternatives to GAAP net income or net cash provided by operating activities. Adjusted EBITDA and DCF have important limitations as analytical tools because they exclude some but not all items that affect net income and net cash provided by operating activities or any other measure of financial performance or liquidity presented in accordance with GAAP. Adjusted EBITDA and DCF should not be considered in isolation or as substitutes for analysis of our results as reported under GAAP. Additionally, because Adjusted EBITDA and DCF may be defined differently by other companies in our industry, our definitions of Adjusted EBITDA and DCF may not be comparable to similarly titled measures of other companies, thereby diminishing their utility. For a reconciliation of Adjusted EBITDA and DCF to their most directly comparable measures calculated and presented in accordance with GAAP, see Results of Operations.
Management also utilizes Segment Adjusted EBITDA in evaluating the financial performance of our segments. The use of this measures allows investors to understand how management evaluates financial performance to make operating decisions and allocate resources.
COMPARABILITY OF OUR FINANCIAL RESULTS
Our acquisitions have impacted comparability of our financial results (see Note 3 of the Notes to Consolidated Financial Statements).
RESULTS OF OPERATIONS
The following tables and discussion isare a summary of our results of operations for the three and nine months ended September 30,March 31, 2020 and 2019, and 2018, including a reconciliation of Adjusted EBITDA and DCF from “Net income” and “Net cash provided by operating activities,” the most directly comparable GAAP financial measures. Prior period financial information has been retrospectively adjusted for common control transactions.
| | | | Three Months Ended September 30, | | Nine Months Ended September 30, | Three Months Ended March 31, |
| (In millions) | 2019 | | 2018 | | Variance | | 2019 | | 2018 | | Variance | 2020 | | 2019 | | Variance |
Total revenues and other income | $ | 2,280 |
| | $ | 1,712 |
| | $ | 568 |
| | $ | 6,725 |
| | $ | 4,710 |
| | $ | 2,015 |
| $ | 992 |
| | $ | 2,235 |
| | $ | (1,243 | ) |
| Costs and expenses: | | | | | | | | | | | | | | | | |
| Cost of revenues (excludes items below) | 407 |
| | 241 |
| | 166 |
| | 1,099 |
| | 680 |
| | 419 |
| 368 |
| | 339 |
| | 29 |
|
| Purchased product costs | 129 |
| | 241 |
| | (112 | ) | | 489 |
| | 632 |
| | (143 | ) | 135 |
| | 194 |
| | (59 | ) |
| Rental cost of sales | 37 |
| | 32 |
| | 5 |
| | 103 |
| | 94 |
| | 9 |
| 35 |
| | 37 |
| | (2 | ) |
| Rental cost of sales - related parties | 45 |
| | 1 |
| | 44 |
| | 124 |
| | 2 |
| | 122 |
| 46 |
| | 43 |
| | 3 |
|
| Purchases - related parties | 303 |
| | 228 |
| | 75 |
| | 894 |
| | 628 |
| | 266 |
| 276 |
| | 278 |
| | (2 | ) |
| Depreciation and amortization | 302 |
| | 201 |
| | 101 |
| | 916 |
| | 565 |
| | 351 |
| 325 |
| | 301 |
| | 24 |
|
| Impairment expense | | 2,165 |
| | — |
| | 2,165 |
|
| General and administrative expenses | 102 |
| | 76 |
| | 26 |
| | 293 |
| | 217 |
| | 76 |
| 97 |
| | 101 |
| | (4 | ) |
| Other taxes | 29 |
| | 20 |
| | 9 |
| | 84 |
| | 55 |
| | 29 |
| 31 |
| | 30 |
| | 1 |
|
| Total costs and expenses | 1,354 |
| | 1,040 |
| | 314 |
| | 4,002 |
| | 2,873 |
| | 1,129 |
| 3,478 |
| | 1,323 |
| | 2,155 |
|
| Income from operations | 926 |
| | 672 |
| | 254 |
| | 2,723 |
| | 1,837 |
| | 886 |
| |
| Income/(loss) from operations | | (2,486 | ) | | 912 |
| | (3,398 | ) |
| Related party interest and other financial costs | 5 |
| | 2 |
| | 3 |
| | 8 |
| | 4 |
| | 4 |
| 3 |
| | 1 |
| | 2 |
|
| Interest expense, net of amounts capitalized | 212 |
| | 134 |
| | 78 |
| | 640 |
| | 381 |
| | 259 |
| 211 |
| | 214 |
| | (3 | ) |
| Other financial costs | 16 |
| | 17 |
| | (1 | ) | | 38 |
| | 49 |
| | (11 | ) | 16 |
| | 9 |
| | 7 |
|
| Income before income taxes | 693 |
| | 519 |
| | 174 |
| | 2,037 |
| | 1,403 |
| | 634 |
| |
| Provision for income taxes | 4 |
| | 3 |
| | 1 |
| | 2 |
| | 8 |
| | (6 | ) | |
| Net income | 689 |
| | 516 |
| | 173 |
| | 2,035 |
| | 1,395 |
| | 640 |
| |
| Income/(loss) before income taxes | | (2,716 | ) | | 688 |
| | (3,404 | ) |
| (Benefit)/provision for income taxes | | — |
| | (1 | ) | | 1 |
|
| Net income/(loss) | | (2,716 | ) | | 689 |
| | (3,405 | ) |
| Less: Net income attributable to noncontrolling interests | 8 |
| | 6 |
| | 2 |
| | 20 |
| | 11 |
| | 9 |
| 8 |
| | 6 |
| | 2 |
|
| Less: Net income attributable to Predecessor | 52 |
| | — |
| | 52 |
| | 401 |
| | — |
| | 401 |
| — |
| | 180 |
| | (180 | ) |
| Net income attributable to MPLX LP | 629 |
| | 510 |
| | 119 |
| | 1,614 |
| | 1,384 |
| | 230 |
| |
| Net income/(loss) attributable to MPLX LP | | (2,724 | ) | | 503 |
| | (3,227 | ) |
| | | | | | | | | | | | | | | | | |
Adjusted EBITDA attributable to MPLX LP (excluding Predecessor results)(1) | 1,165 |
| | 937 |
| | 228 |
| | 3,015 |
| | 2,564 |
| | 451 |
| |
Adjusted EBITDA attributable to MPLX LP (including Predecessor results)(2) | 1,273 |
| | N/A |
| | N/A |
| | 3,785 |
| | N/A |
| | N/A |
| |
DCF attributable to GP and LP unitholders (including Predecessor results)(2) | $ | 997 |
| | $ | 747 |
| | $ | 250 |
| | $ | 2,963 |
| | $ | 2,025 |
| | $ | 938 |
| |
Adjusted EBITDA attributable to MPLX LP (excluding Predecessor results)(2) | | 1,294 |
| | 930 |
| | 364 |
|
Adjusted EBITDA attributable to MPLX LP (including Predecessor results)(3) | | N/A |
| | 1,263 |
| | N/A |
|
DCF attributable to GP and LP unitholders (including Predecessor results)(3) | | $ | 1,047 |
| | $ | 991 |
| | $ | 56 |
|
| |
| (1) | Includes impairment expense of approximately $1.3 billion related to three equity method investments in 2020. |
| |
| (2) | Non-GAAP measure. See reconciliation below to the most directly comparable GAAP measures. Excludes adjusted EBITDA and DCF adjustments attributable to Predecessor. |
| |
(2)(3) | Non-GAAP measure. See reconciliation below to the most directly comparable GAAP measures. Includes adjusted EBITDA and DCF adjustments attributable to Predecessor. |
| | | | Three Months Ended September 30, | | Nine Months Ended September 30, | Three Months Ended March 31, |
| (In millions) | 2019 | | 2018 | | Variance | | 2019 | | 2018 | | Variance | 2020 | | 2019 | | Variance |
| Reconciliation of Adjusted EBITDA attributable to MPLX LP and DCF attributable to GP and LP unitholders from Net income: | | | | | | | | | | | | | | | | |
| Net income | $ | 689 |
| | $ | 516 |
| | $ | 173 |
| | $ | 2,035 |
| | $ | 1,395 |
| | $ | 640 |
| $ | (2,716 | ) | | $ | 689 |
| | $ | (3,405 | ) |
| Provision for income taxes | 4 |
| | 3 |
| | 1 |
| | 2 |
| | 8 |
| | (6 | ) | — |
| | (1 | ) | | 1 |
|
| Amortization of deferred financing costs | 10 |
| | 14 |
| | (4 | ) | | 29 |
| | 45 |
| | (16 | ) | 14 |
| | 7 |
| | 7 |
|
| Net interest and other financial costs | 223 |
| | 139 |
| | 84 |
| | 657 |
| | 389 |
| | 268 |
| 216 |
| | 217 |
| | (1 | ) |
| Income from operations | 926 |
| | 672 |
| | 254 |
| | 2,723 |
| | 1,837 |
| | 886 |
| (2,486 | ) | | 912 |
| | (3,398 | ) |
| Depreciation and amortization | 302 |
| | 201 |
| | 101 |
| | 916 |
| | 565 |
| | 351 |
| 325 |
| | 301 |
| | 24 |
|
| Non-cash equity-based compensation | 5 |
| | 6 |
| | (1 | ) | | 17 |
| | 15 |
| | 2 |
| 5 |
| | 7 |
| | (2 | ) |
| Income from equity method investments | (95 | ) | | (64 | ) | | (31 | ) | | (255 | ) | | (175 | ) | | (80 | ) | |
| Impairment expense | | 2,165 |
| | — |
| | 2,165 |
|
| Loss (Income) from equity method investments | | 1,184 |
| | (77 | ) | | 1,261 |
|
| Distributions/adjustments related to equity method investments | 145 |
| | 112 |
| | 33 |
| | 399 |
| | 314 |
| | 85 |
| 124 |
| | 122 |
| | 2 |
|
Unrealized derivative (gains)/losses(1) | (11 | ) | | 17 |
| | (28 | ) | | (7 | ) | | 18 |
| | (25 | ) | (15 | ) | | 4 |
| | (19 | ) |
| Acquisition costs | 9 |
| | — |
| | 9 |
| | 14 |
| | 3 |
| | 11 |
| — |
| | 1 |
| | (1 | ) |
| Other | 1 |
| | — |
| | 1 |
| | 1 |
| | — |
| | 1 |
| 1 |
| | — |
| | 1 |
|
| Adjusted EBITDA | 1,282 |
| | 944 |
| | 338 |
| | 3,808 |
| | 2,577 |
| | 1,231 |
| 1,303 |
| | 1,270 |
| | 33 |
|
| Adjusted EBITDA attributable to noncontrolling interests | (9 | ) | | (7 | ) | | (2 | ) | | (23 | ) | | (13 | ) | | (10 | ) | (9 | ) | | (7 | ) | | (2 | ) |
Adjusted EBITDA attributable to Predecessor(2) | (108 | ) | | — |
| | (108 | ) | | (770 | ) | | — |
| | (770 | ) | — |
| | (333 | ) | | 333 |
|
Adjusted EBITDA attributable to MPLX LP(3) | 1,165 |
| | 937 |
| | 228 |
| | 3,015 |
| | 2,564 |
| | 451 |
| 1,294 |
| | 930 |
| | 364 |
|
| Deferred revenue impacts | 36 |
| | 13 |
| | 23 |
| | 67 |
| | 24 |
| | 43 |
| 23 |
| | 9 |
| | 14 |
|
| Net interest and other financial costs | (223 | ) | | (139 | ) | | (84 | ) | | (657 | ) | | (389 | ) | | (268 | ) | (216 | ) | | (217 | ) | | 1 |
|
| Maintenance capital expenditures | (75 | ) | | (40 | ) | | (35 | ) | | (174 | ) | | (98 | ) | | (76 | ) | (34 | ) | | (37 | ) | | 3 |
|
| Maintenance capital expenditures reimbursements | 18 |
| | — |
| | 18 |
| | 34 |
| | — |
| | 34 |
| 14 |
| | 7 |
| | 7 |
|
| Equity method investment capital expenditures paid out | (8 | ) | | (6 | ) | | (2 | ) | | (16 | ) | | (22 | ) | | 6 |
| (7 | ) | | (4 | ) | | (3 | ) |
| Other | 6 |
| | 1 |
| | 5 |
| | 16 |
| | 1 |
| | 15 |
| 4 |
| | — |
| | 4 |
|
Portion of DCF adjustments attributable to Predecessor(2) | 27 |
| | — |
| | 27 |
| | 159 |
| | — |
| | 159 |
| — |
| | 69 |
| | (69 | ) |
| DCF | 946 |
| | 766 |
| | 180 |
| | 2,444 |
| | 2,080 |
| | 364 |
| 1,078 |
| | 757 |
| | 321 |
|
| Preferred unit distributions | (30 | ) | | (19 | ) | | (11 | ) | | (92 | ) | | (55 | ) | | (37 | ) | (31 | ) | | (30 | ) | | (1 | ) |
| DCF attributable to GP and LP unitholders | 916 |
| | 747 |
| | 169 |
| | 2,352 |
| | 2,025 |
| | 327 |
| 1,047 |
| | 727 |
| | 320 |
|
| Adjusted EBITDA attributable to Predecessor | 108 |
| | — |
| | 108 |
| | 770 |
| | — |
| | 770 |
| |
| Portion of DCF adjustments attributable to Predecessor | (27 | ) | | — |
| | (27 | ) | | (159 | ) | | — |
| | (159 | ) | |
Adjusted EBITDA attributable to Predecessor(2) | | — |
| | 333 |
| | (333 | ) |
Portion of DCF adjustments attributable to Predecessor(2) | | — |
| | (69 | ) | | 69 |
|
| DCF attributable to GP and LP unitholders (including Predecessor results) | $ | 997 |
|
| $ | 747 |
|
| $ | 250 |
|
| $ | 2,963 |
|
| $ | 2,025 |
|
| $ | 938 |
| $ | 1,047 |
|
| $ | 991 |
|
| $ | 56 |
|
(1) MPLX makes a distinction between realized and unrealized gains and losses on derivatives. During the period when a derivative contract is outstanding, changes in the fair value of the derivative are recorded as an unrealized gain or loss. When a derivative contract matures or is settled, the previously recorded unrealized gain or loss is reversed and the realized gain or loss of the contract is recorded.
(2) The adjusted EBITDA and DCF adjustments related to Predecessor are excluded from adjusted EBITDA attributable to MPLX LP and DCF attributable to GP and LP unitholders prior to the acquisition date.
(3) For the three months ended September 30, 2019, the L&S and G&P segments made up $766 million and $399 million of Adjusted EBITDA attributable to MPLX LP, respectively. For the three months ended September 30, 2018, the L&S and G&P segments made up $547 million and $390 million of Adjusted EBITDA attributable to MPLX LP, respectively. For the nine months ended September 30, 2019, the L&S and G&P segments made up $1,895 million and $1,120 million of Adjusted EBITDA attributable to MPLX LP, respectively. For the
| |
| (1) | MPLX makes a distinction between realized and unrealized gains and losses on derivatives. During the period when a derivative contract is outstanding, changes in the fair value of the derivative are recorded as an unrealized gain or loss. When a derivative contract matures or is settled, the previously recorded unrealized gain or loss is reversed and the realized gain or loss of the contract is recorded. |
| |
| (2) | The adjusted EBITDA and DCF adjustments related to Predecessor are excluded from adjusted EBITDA attributable to MPLX LP and DCF attributable to GP and LP unitholders prior to the acquisition date. |
| |
| (3) | For the three months ended March 31, 2020, the L&S and G&P segments made up $872 million and $422 million of Adjusted EBITDA attributable to MPLX LP, respectively. For the three months ended March 31, 2019, the L&S and G&P segments made up $559 million and $371 million of Adjusted EBITDA attributable to MPLX LP, respectively. |
nine months ended September 30, 2018, the L&S and G&P segments made up $1,510 million and $1,054 million of Adjusted EBITDA attributable to MPLX LP, respectively.
| | | | Nine Months Ended September 30, | Three Months Ended March 31, |
| (In millions) | 2019 | | 2018 | | Variance | 2020 | | 2019 | | Variance |
| Reconciliation of Adjusted EBITDA attributable to MPLX LP and DCF attributable to GP and LP unitholders from Net cash provided by operating activities: | | | | | | | | | | |
| Net cash provided by operating activities | $ | 2,990 |
| | $ | 2,027 |
| | $ | 963 |
| $ | 1,009 |
| | $ | 853 |
| | $ | 156 |
|
| Changes in working capital items | 134 |
| | 78 |
| | 56 |
| 112 |
| | 196 |
| | (84 | ) |
| All other, net | (23 | ) | | 5 |
| | (28 | ) | (30 | ) | | (15 | ) | | (15 | ) |
| Non-cash equity-based compensation | 17 |
| | 15 |
| | 2 |
| 5 |
| | 7 |
| | (2 | ) |
| Net gain/(loss) on disposal of assets | 3 |
| | (1 | ) | | 4 |
| — |
| | (1 | ) | | 1 |
|
| Net interest and other financial costs | 657 |
| | 389 |
| | 268 |
| 216 |
| | 217 |
| | (1 | ) |
| Current income taxes | 1 |
| | 1 |
| | — |
| — |
| | 1 |
| | (1 | ) |
| Asset retirement expenditures | 1 |
| | 7 |
| | (6 | ) | |
Unrealized derivative (gains)/losses(1) | (7 | ) | | 18 |
| | (25 | ) | (15 | ) | | 4 |
| | (19 | ) |
| Acquisition costs | 14 |
| | 3 |
| | 11 |
| — |
| | 1 |
| | (1 | ) |
| Other adjustments to equity method investment distributions | 20 |
| | 35 |
| | (15 | ) | 5 |
| | 7 |
| | (2 | ) |
| Other | 1 |
| | — |
| | 1 |
| 1 |
| | — |
| | 1 |
|
| Adjusted EBITDA | 3,808 |
| | 2,577 |
| | 1,231 |
| 1,303 |
| | 1,270 |
| | 33 |
|
| Adjusted EBITDA attributable to noncontrolling interests | (23 | ) | | (13 | ) | | (10 | ) | (9 | ) | | (7 | ) | | (2 | ) |
Adjusted EBITDA attributable to Predecessor(2) | (770 | ) | | — |
| | (770 | ) | — |
| | (333 | ) | | 333 |
|
Adjusted EBITDA attributable to MPLX LP(3) | 3,015 |
| | 2,564 |
| | 451 |
| 1,294 |
| | 930 |
| | 364 |
|
| Deferred revenue impacts | 67 |
| | 24 |
| | 43 |
| 23 |
| | 9 |
| | 14 |
|
| Net interest and other financial costs | (657 | ) | | (389 | ) | | (268 | ) | (216 | ) | | (217 | ) | | 1 |
|
| Maintenance capital expenditures | (174 | ) | | (98 | ) | | (76 | ) | (34 | ) | | (37 | ) | | 3 |
|
| Maintenance capital expenditures reimbursements | 34 |
| | — |
| | 34 |
| 14 |
| | 7 |
| | 7 |
|
| Equity method investment capital expenditures paid out | (16 | ) | | (22 | ) | | 6 |
| (7 | ) | | (4 | ) | | (3 | ) |
| Other | 16 |
| | 1 |
| | 15 |
| 4 |
| | — |
| | 4 |
|
Portion of DCF adjustments attributable to Predecessor(2) | 159 |
| | — |
| | 159 |
| — |
| | 69 |
| | (69 | ) |
| DCF | 2,444 |
| | 2,080 |
| | 364 |
| 1,078 |
| | 757 |
| | 321 |
|
| Preferred unit distributions | (92 | ) | | (55 | ) | | (37 | ) | (31 | ) | | (30 | ) | | (1 | ) |
| DCF attributable to GP and LP unitholders | 2,352 |
| | 2,025 |
| | 327 |
| 1,047 |
| | 727 |
| | 320 |
|
| Adjusted EBITDA attributable to Predecessor | 770 |
| | — |
| | 770 |
| |
| Portion of DCF adjustments attributable to Predecessor | (159 | ) | | — |
| | (159 | ) | |
Adjusted EBITDA attributable to Predecessor(2) | | — |
| | 333 |
| | (333 | ) |
Portion of DCF adjustments attributable to Predecessor(2) | | — |
| | (69 | ) | | 69 |
|
| DCF attributable to GP and LP unitholders (including Predecessor results) | $ | 2,963 |
| | $ | 2,025 |
| | $ | 938 |
| $ | 1,047 |
| | $ | 991 |
| | $ | 56 |
|
(1) MPLX makes a distinction between realized and unrealized gains and losses on derivatives. During the period when a derivative contract is outstanding, changes in the fair value of the derivative are recorded as an unrealized gain or loss. When a derivative contract matures or is settled, the previously recorded unrealized gain or loss is reversed and the realized gain or loss of the contract is recorded.
(2) The adjusted EBITDA and DCF adjustments related to Predecessor are excluded from adjusted EBITDA attributable to MPLX LP and DCF attributable to GP and LP unitholders prior to the acquisition date.
(3) For the nine months ended September 30, 2019, the L&S and G&P segments made up $1,895 million and $1,120 million of Adjusted EBITDA attributable to MPLX LP, respectively. For the nine months ended September 30, 2018, the L&S and G&P segments made up $1,510 million and $1,054 million of Adjusted EBITDA attributable to MPLX LP, respectively.
| |
| (1) | MPLX makes a distinction between realized and unrealized gains and losses on derivatives. During the period when a derivative contract is outstanding, changes in the fair value of the derivative are recorded as an unrealized gain or loss. When a derivative contract matures or is settled, the previously recorded unrealized gain or loss is reversed and the realized gain or loss of the contract is recorded. |
| |
| (2) | The adjusted EBITDA and DCF adjustments related to Predecessor are excluded from adjusted EBITDA attributable to MPLX LP and DCF attributable to GP and LP unitholders prior to the acquisition date. |
| |
| (3) | For the three months ended March 31, 2020, the L&S and G&P segments made up $872 million and $422 million of Adjusted EBITDA attributable to MPLX LP, respectively. For the three months ended March 31, 2019, the L&S and G&P segments made up $559 million and $371 million of Adjusted EBITDA attributable to MPLX LP, respectively. |
Three months ended September 30, 2019March 31, 2020 compared to three months ended September 30, 2018March 31, 2019
Total revenues and other income increased $568decreased $1,243 million in the thirdfirst quarter of 20192020 compared to the same period of 2018,2019. The large decrease was driven by our ownership in MarkWest Utica EMG, L.L.C. (“Markwest Utica EMG”), our indirect ownership in Ohio Gathering Company, L.L.C. through our investment of which $611MarkWest Utica EMG and our ownership in Uintah Basin Field Services, L.L.C., as we recognized impairments related to these investments in the first quarter of 2020 in the amount of $1,264 million. The remaining increase of $21 million was primarily due to the Merger. There was also increased volumes and prices fora $32 million increase in pipeline transportation terminalsvolumes, prices and fees; $5 million from increased fees and shell capacity from Refining Logistics; a $13 million increase from additional marine of approximatelyvessels; $5 million from decreased expenses on the Explorer pipeline; and $38 million as well as an increase in equity method investments of $23 million which was mainly attributable toincreased volumes in MarEn Bakken Company, LLC, Sherwood Midstream, Jefferson Dry Gas, Lincoln Pipeline
LLC, and Utica EMG. G&Pfrom higher fees as a result of higher volumes in the Marcellus, Southwest, Bakken and Southwest also contributed to the increase in revenues of approximately $55 million.Rockies. These increases were partially offset by lower revenues in the G&P segmenta decrease of $71 million due to lower prices, primarily in the Marcellus,Southwest, Southern Appalachia and Southwest of approximately $151 million as well as by a decrease in the Delaware Basin Residue, LLC and LOCAP LLC joint ventures. The remainder of the increase relates to increased fees from Refining Logistics and Fuels Distribution, the Mt. Airy acquisition, the Robinson Butane Cavern and the recognition of revenue related to volume deficiencies.Marcellus.
Cost of Revenues increased $166$29 million in the thirdfirst quarter of 20192020 compared to the same period of 2018, of which $152 million was due to the Merger. The remaining variance was2019, primarily due to increasedhigher project-related costs, to operate newwhich include repairs, maintenance and expanded assets such asoperating cost, in the Mt. Airy Terminal, the expanded Ozark pipeline, additional marine vessels, and the completed Robinson Butane cavern,L&S segment as well as increased otherin the Marcellus region within the G&P segment. These were partially offset by lower repairs, maintenance and operating costs in the Southwest, Southern Appalachia and Rockies regions in the G&P segment and lower miscellaneous expenses.costs and expenses within the L&S segment.
Purchased product costs decreased $112$59 million in the thirdfirst quarter of 20192020 compared to the same period of 2018.2019. This was primarily due to lower prices of $98$46 million in the Southwest and Southern Appalachia, partially offset by higher volumes of $13$6 million in the same regions.Southwest. In addition, there was a decrease of $27$18 million in unrealized losses associated with derivatives which was driven by an unrealized gain in 2019 as a result of changes in commodity prices.
Rental Cost of Sales - related parties increased $44 million in the third quarter of 2019 compared to the same period of 2018 primarily due to the Merger, the acquisition of the Mt. Airy Terminal and to operate the new butane cavern.
Purchases - related parties increased $75 million in the third quarter of 2019 compared to the same period of 2018, of which $63 million was due to the Merger. The remainder of the change was due to increased employee-related costs.derivative gains from prior year.
Depreciation and amortization expense increased $101$24 million in the thirdfirst quarter of 20192020 compared to the same period of 2018, of which $88 million was due to the Merger. The remaining variance was2019, primarily due to the acquisition of the Mt. Airy Terminal and additions to in-service property, plant and equipment throughout 20182019 and the first ninethree months of 2019, slightly2020 as well as accelerated depreciation of certain gathering assets, partially offset by write-downsa decrease due to the classification of equipment no longer in use in the prior year.certain assets as a sales-type lease.
General and Administrative expensesImpairment expense increased $26$2,165 million in the thirdfirst quarter of 20192020 compared to the same period of 2018,2019. During the first quarter of 2020 we recorded impairment expense for goodwill, intangible assets and property, plant and equipment of $1,814 million, $177 million and $174 million, respectively. The impairment of goodwill related to our Eastern G&P reporting unit while the intangible asset and property, plant and equipment impairments relate to certain assets in our Southwest region. The impairments were primarily driven by the slowing of drilling activity, which was due to the Merger, including $9 million of transaction related costs.has reduced production growth forecasts from our producer customers.
Net interest expense and other financial costs increased $80$6 million in the thirdfirst quarter of 20192020 compared to the same period of 2018. The increase is mainly due to increased interest and financing costs related to the new senior notes issued in the fourth quarter of 2018, interest on the new variable rate notes and term loan issued in the third quarter of 2019, and inclusion of the exchange notes during the full year 2019 but not 2018.
Nine months ended September 30, 2019 compared to nine months ended September 30, 2018
Total revenues and other income increased $2,015 million in the first nine months of 2019 compared to the same period of 2018, of which $1,791 million was due to the Merger. The remaining variance was due mainly to a $114 million increase from the acquisition of Refining Logistics and Fuels Distribution and its annual fee escalation as well as increased volumes and prices for pipeline transportation, terminals and marine of $122 million. We also experienced higher revenues from G&P volume growth in the Marcellus and Southwest of approximately $255 million offset by decreased pricing on product sales of approximately $311 million in the Marcellus, Southern Appalachia and Southwest. Equity method investments provided a $50 million increase which was mainly attributable to increased volumes in MarEn Bakken Company, LLC, Sherwood Midstream, Jefferson Dry Gas, Lincoln Pipeline LLC, and Utica EMG. These increases were partially offset by a decrease in the Explorer Pipeline Co., Delaware Basin Residue, LLC, and LOCAP LLC ventures. There were also increase related to the Mt. Airy acquisition, the Robinson Butane Cavern and the recognition of revenue related to volume deficiencies of $30 million in total. The remainder of the difference is due to lower cost reimbursements in the Marcellus.
Cost of Revenues increased $419 million in the first nine months of 2019 compared to the same period of 2018, of which $400 million is due to the Merger. The remaining variance was primarily due to increased costs to operate new and expanded assets such as the Mt. Airy Terminal, the expanded Ozark pipeline, additional marine vessels, and the completed Robinson Butane cavern.
Purchased product costs decreased $143 million in the first nine months of 2019 compared to the same period of 2018. This was primarily due to lower prices of $216 million in the Southwest and Southern Appalachia as well as a decrease in unrealized derivative losses which was driven an unrealized gain in 2019 as a result of changes in commodity prices. These decreases were partially offset by higher volumes of $98 million in the Southwest and Southern Appalachia.
Rental Cost of Sales increased $9 million in the first nine months of 2019 compared to the same period of 2018 due to the acquisition of the Mt. Airy Terminal and to operate the new butane cavern.
Rental Cost of Sales - related parties increased $122 million in the first nine months of 2019 compared to the same period of 2018, of which $116 million is due to the Merger.
Purchases-related parties increased $266 million in the first nine months of 2019 compared to the same period of 2018, of which $204 million was due to the Merger. The remaining increase was primarily due to the acquisition of Refining Logistics and Fuels Distribution as well as to increases in employee-related costs
Depreciation and amortization expense increased $351 million in the first nine months of 2019 compared to the same period of 2018, of which $277 million was due to the Merger. The remaining variance was primarily due to the acquisitions of Refining Logistics and the Mt. Airy Terminal; additions to in-service property, plant and equipment throughout 2018 and the first nine months of 2019; slightly offset by write-downs of equipment no longer in use in the prior year.
General and administrative expenses increased $76 million in the first nine months of 2019 compared to the same period of 2018, of which $65 million was due to the Merger, including $14 million of acquisitions costs related to the Merger. The remaining variance was primarily due to the acquisition of Refining Logistics and Fuels Distribution and other employee-related costs.
Other taxes increased $29 million in the first nine months of 2019 compared to the same period of 2018, primarily due to the Merger.
Net interest expense and other financial costs increased $252 million in the first nine months of 2019 compared to the same period of 2018.2019. The increase is primarily due to increased interest and financing costs related to costs associated with debt facilities that were entered into during the new senior notes issued in the fourth quarter of 2018, interest on the new variable rate notes and term loan issued in the third quartersecond half of 2019 and inclusion of the exchange notes during the full year 2019 but not 2018.
SEGMENT RESULTS
We classify our business in the following reportable segments: L&S and G&P. Segment Adjusted EBITDA represents Adjusted EBITDA attributable to the reportable segments. Amounts included in net income and excluded from Segment Adjusted EBITDA include: (i) depreciation and amortization; (ii) provision/(benefit) for income taxes; (iii) amortization of deferred financing costs; (iv) extinguishment of debt; (v) non-cash equity-based compensation; (vi) impairment expense; (vii) net interest and other financial costs; (viii) income/(loss) from equity method investments; (ix) distributions and adjustments related to equity method investments; (x) unrealized derivative gains/(losses); (xi) acquisition costs; (xii) noncontrolling interests; and (xiii) other adjustments as deemed necessary. These items are either: (i) believed to be non-recurring in nature; (ii) not believed to be allocable or controlled by the segment; or (iii) are not tied to the operational performance of the segment.
The tables below present information about Segment Adjusted EBITDA for the reported segments for the three months ended March 31, 2020 and 2019. Prior period financial information has been retrospectively adjusted for common control transactions.
L&S Segment
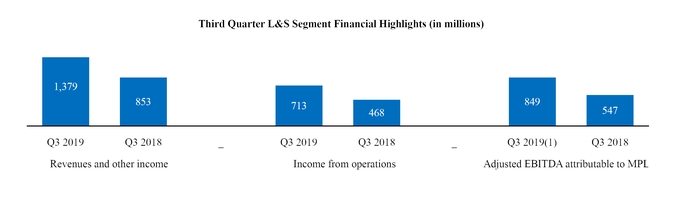
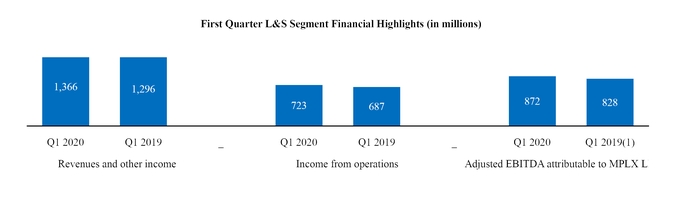
(1) | |
| (1) | Includes adjusted EBITDA attributable to Predecessor. |
|
| | | | | | | | | | | |
| Three Months Ended March 31, |
| (In millions) | 2020 |
| 2019 |
| Variance |
| Service revenue | $ | 1,004 |
|
| $ | 889 |
|
| $ | 115 |
|
| Rental income | 242 |
|
| 335 |
|
| (93 | ) |
| Product related revenue | 19 |
|
| 15 |
|
| 4 |
|
| Income from equity method investments | 50 |
|
| 45 |
|
| 5 |
|
| Other income | 51 |
|
| 12 |
|
| 39 |
|
| Total segment revenues and other income | 1,366 |
|
| 1,296 |
|
| 70 |
|
| Cost of revenues | 238 |
|
| 226 |
|
| 12 |
|
| Purchases - related parties | 199 |
|
| 190 |
|
| 9 |
|
| Depreciation and amortization | 138 |
|
| 126 |
|
| 12 |
|
| General and administrative expenses | 52 |
|
| 51 |
|
| 1 |
|
| Other taxes | 16 |
|
| 16 |
|
| — |
|
| Segment income from operations | 723 |
|
| 687 |
|
| 36 |
|
| Depreciation and amortization | 138 |
|
| 126 |
|
| 12 |
|
| Income from equity method investments | (50 | ) |
| (45 | ) |
| (5 | ) |
| Distributions/adjustments related to equity method investments | 57 |
|
| 54 |
|
| 3 |
|
| Acquisition costs | — |
|
| 1 |
|
| (1 | ) |
| Non-cash equity-based compensation | 3 |
|
| 5 |
|
| (2 | ) |
| Other | 1 |
| | — |
| | 1 |
|
| Adjusted EBITDA attributable to Predecessor | — |
|
| (269 | ) |
| 269 |
|
Segment adjusted EBITDA(1) | 872 |
|
| 559 |
|
| 313 |
|
|
|
|
|
|
|
| Capital expenditures | 184 |
|
| 198 |
|
| (14 | ) |
| Investments in unconsolidated affiliates | $ | 54 |
|
| $ | 7 |
|
| $ | 47 |
|
| |
| (1) | See the Reconciliation of Adjusted EBITDA attributable to MPLX LP and DCF attributable to GP and LP unitholders from Net income table for the reconciliation to the most directly comparable GAAP measure. |
Three months ended March 31, 2020 compared to three months ended March 31, 2019
Service revenue increased $115 million in the first quarter of 2020 compared to the same period of 2019. This was primarily due to a $55 million increase due to the classification of lease income between service revenue, rental income and other income based on the nature of the contract; a $32 million increase in pipeline transportation volumes, prices and fees; $5 million from increased fees and shell capacity from Refining Logistics; a $13 million increase from additional marine vessels; and $10 million from various immaterial items.
Rental income decreased $93 million in the first quarter of 2020 compared to the same period of 2019, primarily due to a net decrease of $93 million due to the classification of lease income between service revenue, rental income and other income based on the nature of the contract.
Income from equity method investments increased $5 million in the first quarter of 2020 compared to the same period of 2019, primarily due to lower expenses on the Explorer pipeline.
Other Income increased $39 million in the first quarter of 2020 compared to the same period of 2019, primarily due to an increase of $38 million due to the classification of lease income between service revenue, rental income and other income based on the nature of the contract.
Cost of Revenues increased $12 million in the first quarter of 2020 compared to the same period of 2019, primarily due to higher project-related costs partially offset by lower other miscellaneous expenses.
Purchases - related parties increased $9 million in the first quarter of 2020 compared to the same period of 2019, primarily due to increased employee-related costs and other miscellaneous expenses from MPC partially offset by higher reimbursements from MPC for reimbursable projects.
Depreciation and amortization increased $12 million in the first quarter of 2020 compared to the same period of 2019, primarily due to additions to in-service property, plant and equipment throughout 2019 and the first quarter of 2020 partially offset by a decrease due to the classification of certain assets as a sales-type lease.
G&P Segment
| |
| (1) | Includes impairment of equity method investments of $1,264 million. |
| |
| (2) | Includes impairment of goodwill of $1,814 million, long-lived assets including intangibles of $351 million and equity method investments of $1,264 million. |
| |
| (3) | Includes adjusted EBITDA attributable to Predecessor. |
| |
| Three Months Ended September 30, |
| Nine Months Ended September 30, | Three Months Ended March 31, |
| (In millions) | 2019 |
| 2018 |
| Variance |
| 2019 |
| 2018 |
| Variance | 2020 | | 2019 |
| Variance |
| Service revenue | $ | 976 |
|
| $ | 602 |
|
| $ | 374 |
|
| $ | 2,787 |
|
| $ | 1,682 |
|
| $ | 1,105 |
| $ | 536 |
|
| $ | 528 |
|
| $ | 8 |
|
| Rental income | 304 |
|
| 191 |
|
| 113 |
|
| 935 |
|
| 526 |
|
| 409 |
| 88 |
|
| 89 |
|
| (1 | ) |
| Product related revenue | 22 |
|
| 5 |
|
| 17 |
|
| 57 |
|
| 10 |
|
| 47 |
| 222 |
|
| 276 |
|
| (54 | ) |
| Income from equity method investments | 60 |
|
| 43 |
|
| 17 |
|
| 159 |
|
| 123 |
|
| 36 |
| |
| (Loss)/income from equity method investments | | (1,234 | ) |
| 32 |
|
| (1,266 | ) |
| Other income | 17 |
|
| 12 |
|
| 5 |
|
| 45 |
|
| 36 |
|
| 9 |
| 14 |
|
| 14 |
|
| — |
|
| Total segment revenues and other income | 1,379 |
|
| 853 |
|
| 526 |
|
| 3,983 |
|
| 2,377 |
|
| 1,606 |
| |
| Total segment revenues and other (loss)/income | | (374 | ) |
| 939 |
|
| (1,313 | ) |
| Cost of revenues | 262 |
|
| 92 |
|
| 170 |
|
| 707 |
|
| 282 |
|
| 425 |
| 211 |
|
| 193 |
|
| 18 |
|
| Purchased product costs | | 135 |
|
| 194 |
|
| (59 | ) |
| Purchases - related parties | 216 |
|
| 182 |
|
| 34 |
|
| 633 |
|
| 501 |
|
| 132 |
| 77 |
|
| 88 |
|
| (11 | ) |
| Depreciation and amortization | 113 |
|
| 62 |
|
| 51 |
|
| 373 |
|
| 171 |
|
| 202 |
| 187 |
|
| 175 |
|
| 12 |
|
| Impairment expense | | 2,165 |
| | — |
| | 2,165 |
|
| General and administrative expenses | 59 |
|
| 38 |
|
| 21 |
|
| 152 |
|
| 108 |
|
| 44 |
| 45 |
|
| 50 |
|
| (5 | ) |
| Other taxes | 16 |
|
| 11 |
|
| 5 |
|
| 43 |
|
| 28 |
|
| 15 |
| 15 |
|
| 14 |
|
| 1 |
|
| Segment income from operations | 713 |
|
| 468 |
|
| 245 |
|
| 2,075 |
|
| 1,287 |
|
| 788 |
| |
| Segment (loss)/income from operations | | (3,209 | ) |
| 225 |
|
| (3,434 | ) |
| Depreciation and amortization | 113 |
|
| 62 |
|
| 51 |
|
| 373 |
|
| 171 |
|
| 202 |
| 187 |
|
| 175 |
|
| 12 |
|
| Income from equity method investments | (60 | ) |
| (43 | ) |
| (17 | ) |
| (159 | ) |
| (123 | ) |
| (36 | ) | |
| Impairment expense | | 2,165 |
| | — |
| | 2,165 |
|
| Loss/(income) from equity method investments | | 1,234 |
|
| (32 | ) |
| 1,266 |
|
| Distributions/adjustments related to equity method investments | 70 |
|
| 57 |
|
| 13 |
|
| 184 |
|
| 164 |
|
| 20 |
| 67 |
|
| 68 |
|
| (1 | ) |
| Acquisition costs | 9 |
|
| — |
|
| 9 |
|
| 14 |
|
| 3 |
|
| 11 |
| |
Unrealized derivative (gains)/losses(1) | | (15 | ) |
| 4 |
|
| (19 | ) |
| Non-cash equity-based compensation | 3 |
|
| 3 |
|
| — |
|
| 10 |
|
| 8 |
|
| 2 |
| 2 |
|
| 2 |
|
| — |
|
| Other | 1 |
| | — |
| | 1 |
| | 1 |
| | — |
| | 1 |
| |
| Adjusted EBITDA attributable to Predecessor | (83 | ) |
| — |
|
| (83 | ) |
| (603 | ) |
| — |
|
| (603 | ) | — |
| | (64 | ) | | 64 |
|
Segment adjusted EBITDA(1) | 766 |
|
| 547 |
|
| 219 |
|
| 1,895 |
|
| 1,510 |
|
| 385 |
| |
| Adjusted EBITDA attributable to noncontrolling interests | | (9 | ) |
| (7 | ) |
| (2 | ) |
Segment Adjusted EBITDA(2) | | 422 |
|
| 371 |
|
| 51 |
|
| | Maintenance capital expenditures | $ | 57 |
|
| $ | 31 |
|
| $ | 26 |
|
| $ | 128 |
|
| $ | 78 |
|
| $ | 50 |
| |
| Capital expenditures | | 134 |
|
| 306 |
| | (172 | ) |
| Investments in unconsolidated affiliates | | $ | 37 |
|
| $ | 128 |
|
| $ | (91 | ) |
(1) See the Reconciliation of Adjusted EBITDA attributable to MPLX LP and DCF attributable to GP and LP unitholders from Net income table for the reconciliation to the most directly comparable GAAP measure.
| |
| (1) | MPLX makes a distinction between realized and unrealized gains and losses on derivatives. During the period when a derivative contract is outstanding, changes in the fair value of the derivative are recorded as an unrealized gain or loss. When a derivative contract matures or is settled, the previously recorded unrealized gain or loss is reversed and the realized gain or loss of the contract is recorded. |
| |
| (2) | See the Reconciliation of Adjusted EBITDA attributable to MPLX LP and DCF attributable to GP and LP unitholders from Net income table for the reconciliation to the most directly comparable GAAP measure. |
Three months ended September 30, 2019March 31, 2020 compared to three months ended September 30, 2018March 31, 2019
Service revenue increased $374$8 million in the thirdfirst quarter of 20192020 compared to the same period of 2018.2019. This was primarily due to the Merger which increased service revenue by $300 million. The remaining variance was primarily due to a $30 million increase in transportation volumes and prices, partially attributable to the completion of the Ozark expansion; $2 million from increased fees from Refining Logistics and Fuels Distribution; $1 million from additional storage capacity; a $6 million increase from additional marine vessels; a $30 million increase in service revenue with a corresponding decrease to rental income due to a change in marine lease income classification, and a $3 million increase in revenue recognized from volume deficiency payments.
Rental income increased $113 million in the third quarter of 2019 compared to the same period of 2018, of which $134 million was due to the Merger. The remaining variance was primarily due to a $30 million decrease to rental income with a corresponding increase to service revenue due to a change in marine lease income classification. There was also an increase of $7 million from the acquisition of the Mt. Airy Terminal and an increase of $2 million from the annual Refining Logistics fee escalation.
Product related revenue increased $17 million in the third quarter of 2019 compared to the same period of 2018, which was due to the Merger.
Income from Equity method investments increased $17 million in the third quarter of 2019 compared to the same period of 2018, of which $10 million was due to the Merger. The remaining variance was primarily due to increased income from MarEn Bakken, Explorer, and Lincoln, primarily due to increased throughput volumes, slightly offset by decreased income from LOCAP primarily due to lower throughput volumes.
Cost of Revenues increased $170 million in the third quarter of 2019 compared to the same period of 2018, of which $148 million was due to the Merger. The remaining variance was primarily due to increased costs to operate new and expanded assets such as the Mt. Airy Terminal, the expanded Ozark pipeline, additional marine vessels, the completed Robinson Butane cavern, increased employee related costs and other miscellaneous expenses.
Purchases - related parties increased $34 million in the third quarter of 2019 compared to the same period of 2018, of which $25 million was due to the Merger, with the remainder of the variance being due to employee-related costs.
Depreciation and amortization increased $51 million in the third quarter of 2019 compared to the same period of 2018, of which $42 million was due to the Merger. The remaining variance was primarily due to the acquisition of the Mt. Airy Terminal as well as additions to in-service property, plant and equipment throughout 2018 and the first nine months of 2019.
General and Administrative expenses increased $21 million in the third quarter of 2019 compared to the same period of 2018, which was due to the Merger, including $9 million of transaction related costs.
Nine months ended September 30, 2019 compared to nine months ended September 30, 2018
Service revenue increased $1,105 million in the first nine months of 2019 compared to the same period of 2018, of which $848 million was due to the Merger. The remaining variance was primarily due to an additional $71 million of revenue due to the acquisition of Refining Logistics and Fuels Distribution as well as from annual fee escalation; $83 million of revenue from increased transportation volumes and prices, partially attributable to the completion of the Ozark expansion; $4 million from increased revenue from volume deficiency credits; $7 million of revenue from additional storage capacity; $7 million from increased terminal throughput; $18 million from additional marine vessels; and a $57 million increase due to the reclassification of certain lease revenue from rental income to service revenue.
Rental income increased $409 million in the first nine months of 2019 compared to the same period of 2018, of which $402 million was due to the Merger. The remaining variance was primarily due to an additional $43 million of revenue from the acquisition of Refining Logistics, $5 million from the completion of a new butane cavern, and $20 million from the acquisition of the Mt. Airy Terminal. These increases were offset by a $57 million decrease due to the reclassification of certain lease revenue from rental income to service revenue and by a $7 million decrease due to the acceleration of straight-line rent, both due to a change in lease classification.
Product related revenue increased $47 million in the first nine months of 2019 compared to the same period of 2018, of which $46 million was due to the Merger.
Income from Equity method investments increased $36 million in the first nine months of 2019 compared to the same period of 2018, of which $19 million was due to the Merger. The remaining variance was due to increased income from MarEn Bakken and Lincoln, primarily due to increased throughput volumes, offset by decreased income from LOCAP primarily due to lower throughput volumes and decreased income from Explorer primarily due to an upward adjustment to income in 2018 for a change in the corporate tax rate.
Other income increased $9 million in the first nine months of 2019 compared to the same period of 2018, primarily related to a gain recognized on the sale of assets.
Cost of revenues increased $425 million in the first nine months of 2019 compared to the same period of 2018, of which $396 million was due to the Merger. The remaining variance was primarily due to increased costs to operate new and expanded assets such as the Mt. Airy Terminal, the expanded Ozark pipeline, additional marine vessels, and the completed Robinson Butane cavern.
Purchases - related parties increased $132 million in the first nine months of 2019 compared to the same period of 2018, of which $83 million was due to the Merger. The remainder was primarily related to the acquisition of Refining Logistics and Fuels Distribution and increased employee-related costs.
Depreciation and amortization increased $202 million in the first nine months of 2019 compared to the same period of 2018, of which $162 million was due to the Merger. The remaining variance was primarily due to the acquisitions of Refining Logistics and the Mt. Airy Terminal as well as additions to in-service property, plant and equipment throughout 2018 and the first nine months of 2019.
General and administrative expenses increased $44 million in the first nine months of 2019 compared to the same period of 2018, which was primarily due to the Merger and included $14 million of acquisitions costs related to the Merger.
Other taxes increased by $15 million in the first nine months of 2019 compared to the same period of 2018, primarily due to the Merger.
G&P Segment
(1) Includes adjusted EBITDA attributable to Predecessor.
|
| | | | | | | | | | | | | | | | | | | | | | | |
| Three Months Ended September 30, |
| Nine Months Ended September 30, |
| (In millions) | 2019 | | 2018 |
| Variance |
| 2019 | | 2018 | | Variance |
| Service revenue | $ | 555 |
|
| $ | 422 |
|
| $ | 133 |
|
| $ | 1,627 |
|
| $ | 1,154 |
| | $ | 473 |
|
| Rental income | 88 |
|
| 88 |
|
| — |
|
| 260 |
|
| 251 |
| | 9 |
|
| Product related revenue | 207 |
|
| 311 |
|
| (104 | ) |
| 714 |
|
| 831 |
| | (117 | ) |
| Income from equity method investments | 35 |
|
| 21 |
|
| 14 |
|
| 96 |
|
| 52 |
| | 44 |
|
| Other income | 16 |
|
| 17 |
|
| (1 | ) |
| 45 |
|
| 45 |
| | — |
|
| Total segment revenues and other income | 901 |
|
| 859 |
|
| 42 |
|
| 2,742 |
|
| 2,333 |
| | 409 |
|
| Cost of revenues | 227 |
|
| 182 |
|
| 45 |
|
| 619 |
|
| 494 |
| | 125 |
|
| Purchased product costs | 129 |
|
| 241 |
|
| (112 | ) |
| 489 |
|
| 632 |
| | (143 | ) |
| Purchases - related parties | 87 |
|
| 46 |
|
| 41 |
|
| 261 |
|
| 127 |
| | 134 |
|
| Depreciation and amortization | 189 |
|
| 139 |
|
| 50 |
|
| 543 |
|
| 394 |
| | 149 |
|
| General and administrative expenses | 43 |
|
| 38 |
|
| 5 |
|
| 141 |
|
| 109 |
| | 32 |
|
| Other taxes | 13 |
|
| 9 |
|
| 4 |
|
| 41 |
|
| 27 |
| | 14 |
|
| Segment income from operations | 213 |
|
| 204 |
|
| 9 |
|
| 648 |
|
| 550 |
| | 98 |
|
| Depreciation and amortization | 189 |
|
| 139 |
|
| 50 |
|
| 543 |
|
| 394 |
| | 149 |
|
| Income from equity method investments | (35 | ) |
| (21 | ) |
| (14 | ) |
| (96 | ) |
| (52 | ) | | (44 | ) |
| Distributions/adjustments related to equity method investments | 75 |
|
| 55 |
|
| 20 |
|
| 215 |
|
| 150 |
| | 65 |
|
Unrealized derivative (gains)/losses(1) | (11 | ) |
| 17 |
|
| (28 | ) |
| (7 | ) |
| 18 |
| | (25 | ) |
| Non-cash equity-based compensation | 2 |
|
| 3 |
|
| (1 | ) |
| 7 |
|
| 7 |
| | — |
|
| Adjusted EBITDA attributable to Predecessor | (25 | ) | | — |
| | (25 | ) | | (167 | ) | | — |
| | (167 | ) |
| Adjusted EBITDA attributable to noncontrolling interests | (9 | ) |
| (7 | ) |
| (2 | ) |
| (23 | ) |
| (13 | ) | | (10 | ) |
Segment Adjusted EBITDA(2) | 399 |
|
| 390 |
|
| 9 |
|
| 1,120 |
|
| 1,054 |
| | 66 |
|
|
|
|
|
|
|
|
|
|
| |
|
| Maintenance capital expenditures | $ | 18 |
|
| $ | 9 |
| | $ | 9 |
|
| $ | 46 |
|
| $ | 20 |
| | $ | 26 |
|
(1) MPLX makes a distinction between realized and unrealized gains and losses on derivatives. During the period when a derivative contract is outstanding, changes in the fair value of the derivative are recorded as an unrealized gain or loss. When a derivative contract matures or is settled, the previously recorded unrealized gain or loss is reversed and the realized gain or loss of the contract is recorded.
(2) See the Reconciliation of Adjusted EBITDA attributable to MPLX LP and DCF attributable to GP and LP unitholders from Net income table for the reconciliation to the most directly comparable GAAP measure.
Three months ended September 30, 2019 compared to three months ended September 30, 2018
Service revenue increased $133 million in the third quarter of 2019 compared to the same period of 2018. This was primarily due to the Merger which increased service revenue by $123 million. The remaining increase was due to higher fees from higher volumes in the Marcellus, Southwest and Southwest, partiallyBakken of $30 million, offset by lower cost reimbursement revenuevolumes of $5 million in the Marcellus.Rockies as well as other miscellaneous decreases.
Product related revenue decreased $104$54 million in the thirdfirst quarter of 20192020 compared to the same period of 2018.2019. This was primarily due to lower prices in the Southwest, Southern Appalachia and Marcellus of approximately $151 million$71 million. This was partially offset by $25$13 million of volume increases in the Southwest, Marcellus, Bakken and increased revenues due to the Merger of $22 million.Rockies as well as other miscellaneous increases.
Income from equity method investments increased $14decreased $1,266 million in the thirdfirst quarter of 20192020 compared to the same period of 2018. This2019. The large decrease was primarilydriven by our ownership in MarkWest Utica EMG, L.L.C. (“Markwest Utica EMG”), our indirect ownership in Ohio Gathering Company, L.L.C. through our investment of MarkWest Utica EMG and our ownership in Uintah Basin Field Services, L.L.C., as we recognized impairments related to these investments in the first quarter of 2020 in the amount of $1,264 million. Additionally, there was a decrease in various joint ventures due to growthlower volumes processed and lower NGL prices compared to the same period of 2019, offset by an increase in the Sherwood Midstream LLC joint venture due to additional plants coming online at the end of 2018, an increase in the Utica EMG joint venture as a result of assets written off in the prior period, an increase in the Jefferson Dry Gas joint venture as a result of higher dry gas gathering volumes and assets placed in service and a small increase due to the Merger. These increases were partially offset by a decrease in the Delaware Basin Residue, LLC joint venture driven by unrealized derivative losses.
Cost of revenues increased $45 million in the third quarter of 2019 compared to the same period of 2018, which is attributable to the Merger.
Purchased product costs decreased $112 million in the third quarter of 2019 compared to the same period of 2018. This was primarily due to lower prices of $98 million in the Southwest and Southern Appalachia, partially offset by higher volumes of $13 million in the same regions. In addition, there was a decrease of $27 million in unrealized losses associated with derivatives which was driven by an unrealized gain in 2019 as a result of changes in commodity prices.
Purchases - related parties increased $41 million in the third quarter of 2019 compared to the same period of 2018, with the majority of the increase being attributable to the Merger of approximately $38 million. The remainder of the variance relates to increased employee related costs.
Depreciation and amortization increased $50 million in the third quarter of 2019 compared to the same period of 2018, with the majority of the increase being attributable to the Merger of approximately $46 million. The remainder of the variance relates to additions to in-service property, plant and equipment throughout 2018 and the first nine month of 2019, slightly offset by write-downs of equipment no longer in use in the prior year.
Nine months ended September 30, 2019 compared to nine months ended September 30, 2018
Service revenue increased $473 million in the first nine months of 2019 compared to the same period of 2018. The increase was primarily due to the Merger which increased service revenue by $375 million. Higher fees from higher volumes in the Marcellus and Southwest, partially offset by lower cost reimbursement revenue in the Marcellus also increased service revenue.
Rental income increased $9 million in the first nine months of 2019 compared to the same period of 2018. This was primarily due to fees from higher volumes in the Marcellus.
Product related revenue decreased $117 million in the first nine months of 2019 compared to the same period of 2018. This was primarily due to lower prices in the Southwest, Southern Appalachia and Marcellus of $311 million offset by volume increases in the Southwest of $114 million. A portion of the volume increase in the Southwest was offset by a volume decrease due to downtime at the Javelina facility. The overall decrease was offset by higher revenues as a result of the Merger which increased product related revenue by $88 million.
Income from equity method investments increased $44 million in the first nine months of 2019 compared to the same period of 2018. This was primarily due to growth in the Sherwood Midstream joint venture due to additional plants coming online at the end of 2018, an increase in the Jefferson Dry Gas joint venture as a result of higher dry gas gathering volumes and assets placed in service, an increase in the Utica EMG joint venture as a result of assets written off in the prior period and income from three additional joint ventures acquired in the Merger which accounted for $11 million of the increase. These increases were partially offset by a decrease in the Delaware Basin Residue, LLC joint venture driven by unrealized derivative losses.during 2019.
Cost of revenues increased $125$18 million in the first nine monthsquarter of 20192020 compared to the same period of 2018.2019. The Merger increased costs by $122 million withmajority of the remaining increase beingis attributable to aligning various expenses as a result of the ANDX acquisition as well as higher repairs, maintenance and maintenanceoperating costs in the Southwest.Marcellus offset by lower repairs, maintenance and operating costs in the Southwest, Southern Appalachia and Rockies.
Purchased product costs decreased $143$59 million in the first nine monthsquarter of 20192020 compared to the same period of 2018.2019. This was primarily due to lower prices of $216$46 million in the Southwest and Southern Appalachia, as well as a decrease in unrealized derivative losses which was driven by an unrealized gain in 2019 as a result of changes in commodity prices. These decreases were partially offset by higher costs from higher volumes of $98$6 million in the Southwest and Southern Appalachia.Southwest. In addition, there was an increase of $18 million in unrealized derivative gains from prior year.
Purchases - related parties increased $134decreased $11 million in the first nine monthsquarter of 20192020 compared to the same period of 2018. This was2019, with this decrease primarily due to an increase of $121 million related to the Merger with a portion of the increase also being attributable to an increases in employee-related costs.aligning various expenses as a result of the ANDX acquisition.
Depreciation and amortization increased $149$12 million in the first nine monthsquarter of 20192020 compared to the same period of 2018. The Merger increased depreciation by $115 million2019, with the remaindermajority of the increase being attributabledue to additions to in-service property, plant and equipment throughout 20182019 and the first ninethree months of 2019 which was slightly offset by write-downs2020 as well as accelerated depreciation of equipment no longer in use in the prior year.certain gathering assets.
General and administrative expensesImpairment expense increased $32$2,165 million in the first nine monthsquarter of 20192020 compared to the same period of 2018.2019. During the first quarter of 2020 we recorded impairment expense for goodwill, intangible assets and property, plant and equipment of $1,814 million, $177 million and $174 million, respectively. The Merger increased generalimpairment of goodwill related to our Eastern G&P reporting unit while the intangible asset and administrative expensesproperty, plant and equipment impairments relate to certain assets in our Southwest region. The impairments were primarily driven by $20 million with the remainderslowing of the increase being attributable to higher employee related costs.drilling activity, which has reduced production growth forecasts from our producer customers.
Other taxes increased $14General and Administrative expenses decreased $5 million in the first nine monthsquarter of 20192020 compared to the same period of 2018. The Merger increased other taxes by $9 million with the remainder of the increase being attributable2019, primarily due to higher property taxes.lower employee related costs.
SEASONALITY
The volume of crude oil and refined products transported and stored utilizing our assets is directly affected by the level of supply and demand for crude oil and refined products in the markets served directly or indirectly by our assets. Many effects of seasonality on the L&S segment’s revenues will be mitigated through the use of our fee-based transportation and storage services agreements with MPC that include minimum volume commitments.
Our G&P segment can be affected by seasonal fluctuations in the demand for natural gas and NGLs and the related fluctuations in commodity prices caused by various factors.factors including variations in weather patterns from year to year. We are able to manage the aboveseasonality impacts through the execution of our marketing strategy and via our storage capabilities. Overall, our exposure to the seasonalseasonality fluctuations is declining due to our growth in fee-based business.
OPERATING DATA(1)
|
| | | | | | | | | | | | | | | |
| | Three Months Ended
September 30, | | Nine Months Ended
September 30, |
| | 2019 | | 2018 | | 2019 | | 2018 |
| L&S | | | | | | | |
| Pipeline throughput (mbpd) | | | | | | | |
| Crude oil pipelines | 3,367 |
| | 2,208 |
| | 3,240 |
| | 2,149 |
|
| Product pipelines | 1,859 |
| | 1,182 |
| | 1,875 |
| | 1,135 |
|
| Total pipelines | 5,226 |
| | 3,390 |
| | 5,115 |
| | 3,284 |
|
| | | | | | | | |
Average tariff rates ($ per barrel)(2) | | | | | | | |
| Crude oil pipelines | $ | 0.97 |
| | $ | 0.60 |
| | $ | 0.94 |
| | $ | 0.58 |
|
| Product pipelines | 0.77 |
| | 0.86 |
| | 0.73 |
| | 0.80 |
|
| Total pipelines | $ | 0.90 |
| | $ | 0.69 |
| | $ | 0.86 |
| | $ | 0.66 |
|
| | | | | | | | |
| Terminal throughput (mbpd) | 3,292 |
| | 1,474 |
| | 3,267 |
| | 1,468 |
|
| | | | | | | | |
Marine Assets (number in operation)(3) | | | | | | | |
| Barges | 264 |
| | 256 |
| | 264 |
| | 256 |
|
| Towboats | 23 |
| | 20 |
| | 23 |
| | 20 |
|
|
| | | | | | | |
| | Three Months Ended
March 31, |
| | 2020 | | 2019 |
| L&S | | | |
| Pipeline throughput (mbpd) | | | |
| Crude oil pipelines | 3,210 |
| | 3,105 |
|
| Product pipelines | 1,905 |
| | 1,897 |
|
| Total pipelines | 5,115 |
| | 5,002 |
|
| | | | |
Average tariff rates ($ per barrel)(2) | | | |
| Crude oil pipelines | $ | 0.93 |
| | $ | 0.96 |
|
| Product pipelines | 0.79 |
| | 0.68 |
|
| Total pipelines | $ | 0.88 |
| | $ | 0.85 |
|
| | | | |
| Terminal throughput (mbpd) | 2,966 |
| | 3,220 |
|
| | | | |
Marine Assets (number in operation)(3) | | | |
| Barges | 305 |
| | 256 |
|
| Towboats | 23 |
| | 23 |
|
| | | | Three Months Ended
September 30, 2019 | | Three Months Ended
September 30, 2018 | Three Months Ended
March 31, 2020 |
| | MPLX LP(4) | | MPLX LP Operated(5) | | MPLX LP(4) | | MPLX LP Operated(5) | MPLX LP(4) | | MPLX LP Operated(5) |
| G&P | | | | | | | | | | |
| Gathering Throughput (MMcf/d) | | | | | | | | | | |
| Marcellus Operations | 1,271 |
| | 1,271 |
| | 1,201 |
| | 1,201 |
| 1,420 |
| | 1,420 |
|
| Utica Operations | — |
| | 2,381 |
| | — |
| | 1,936 |
| — |
| | 1,800 |
|
| Southwest Operations | 1,653 |
| | 1,653 |
| | 1,599 |
| | 1,600 |
| 1,557 |
| | 1,601 |
|
| Bakken Operations | 149 |
| | 149 |
| | — |
| | — |
| 156 |
| | 156 |
|
| Rockies Operations | 627 |
| | 827 |
| | — |
| | — |
| 592 |
| | 775 |
|
| Total gathering throughput | 3,700 |
| | 6,281 |
| | 2,800 |
| | 4,737 |
| 3,725 |
| | 5,752 |
|
| | | | | | | | | | | |
| Natural Gas Processed (MMcf/d) | | | | | | | | | | |
| Marcellus Operations | 4,264 |
| | 5,300 |
| | 4,004 |
| | 4,609 |
| 4,198 |
| | 5,522 |
|
| Utica Operations | — |
| | 866 |
| | — |
| | 857 |
| — |
| | 648 |
|
| Southwest Operations | 1,667 |
| | 1,667 |
| | 1,479 |
| | 1,479 |
| 1,648 |
| | 1,679 |
|
| Southern Appalachian Operations | 254 |
| | 254 |
| | 226 |
| | 226 |
| 243 |
| | 243 |
|
| Bakken Operations | 149 |
| | 149 |
| | — |
| | — |
| 156 |
| | 156 |
|
| Rockies Operations | 568 |
| | 568 |
| | — |
| | — |
| 539 |
| | 539 |
|
| Total natural gas processed | 6,902 |
| | 8,804 |
| | 5,709 |
| | 7,171 |
| 6,784 |
| | 8,787 |
|
| | | | | | | | | | | |
| C2 + NGLs Fractionated (mbpd) | | | | | | | | | | |
Marcellus Operations(6) | 433 |
| | 433 |
| | 405 |
| | 405 |
| 456 |
| | 456 |
|
Utica Operations(6) | — |
| | 49 |
| | — |
| | 49 |
| — |
| | 34 |
|
| Southwest Operations | 19 |
| | 19 |
| | 20 |
| | 20 |
| 15 |
| | 15 |
|
Southern Appalachian Operations(7) | 13 |
| | 13 |
| | 14 |
| | 14 |
| 12 |
| | 12 |
|
| Bakken Operations | 29 |
| | 29 |
| | — |
| | — |
| 31 |
| | 31 |
|
| Rockies Operations | 4 |
| | 4 |
| | — |
| | — |
| 5 |
| | 5 |
|
Total C2 + NGLs fractionated(8) | 498 |
| | 547 |
| | 439 |
| | 488 |
| 519 |
| | 553 |
|
|
| | | | | |
| | Three Months Ended
March 31, 2019 |
| | MPLX LP(4) | | MPLX LP Operated(5) |
| G&P | | | |
| Gathering Throughput (MMcf/d) | | | |
| Marcellus Operations | 1,282 |
| | 1,282 |
|
| Utica Operations | — |
| | 2,109 |
|
| Southwest Operations | 1,581 |
| | 1,581 |
|
| Bakken Operations | 152 |
| | 152 |
|
| Rockies Operations | 642 |
| | 827 |
|
| Total gathering throughput | 3,657 |
| | 5,951 |
|
| | | | |
| Natural Gas Processed (MMcf/d) | | | |
| Marcellus Operations | 4,152 |
| | 5,148 |
|
| Utica Operations | — |
| | 817 |
|
| Southwest Operations | 1,599 |
| | 1,599 |
|
| Southern Appalachian Operations | 235 |
| | 235 |
|
| Bakken Operations | 152 |
| | 152 |
|
| Rockies Operations | 570 |
| | 570 |
|
| Total natural gas processed | 6,708 |
| | 8,521 |
|
| | | | |
| C2 + NGLs Fractionated (mbpd) | | | |
Marcellus Operations(6) | 420 |
| | 420 |
|
Utica Operations(6) | — |
| | 44 |
|
| Southwest Operations | 17 |
| | 17 |
|
Southern Appalachian Operations(7) | 13 |
| | 13 |
|
| Bakken Operations | 16 |
| | 16 |
|
| Rockies Operations | 4 |
| | 4 |
|
Total C2 + NGLs fractionated(8) | 470 |
| | 514 |
|
|
| | | | | | | | | | | |
| | Nine Months Ended
September 30, 2019 | | Nine Months Ended
September 30, 2018 |
| | MPLX LP(4) | | MPLX LP Operated(5) | | MPLX LP(4) | | MPLX LP Operated(5) |
| G&P | | | | | | | |
| Gathering Throughput (MMcf/d) | | | | | | | |
| Marcellus Operations | 1,273 |
| | 1,273 |
| | 1,157 |
| | 1,157 |
|
| Utica Operations | — |
| | 2,186 |
| | — |
| | 1,722 |
|
| Southwest Operations | 1,618 |
| | 1,618 |
| | 1,523 |
| | 1,524 |
|
| Bakken Operations | 149 |
| | 149 |
| | — |
| | — |
|
| Rockies Operations | 639 |
| | 835 |
| | — |
| | — |
|
| Total gathering throughput | 3,679 |
| | 6,061 |
| | 2,680 |
| | 4,403 |
|
| | | | | | | | |
| Natural Gas Processed (MMcf/d) | | | | | | | |
| Marcellus Operations | 4,211 |
| | 5,218 |
| | 3,775 |
| | 4,338 |
|
| Utica Operations | — |
| | 835 |
| | — |
| | 889 |
|
| Southwest Operations | 1,608 |
| | 1,608 |
| | 1,403 |
| | 1,403 |
|
| Southern Appalachian Operations | 244 |
| | 244 |
| | 244 |
| | 244 |
|
| Bakken Operations | 149 |
| | 149 |
| | — |
| | — |
|
| Rockies Operations | 575 |
| | 575 |
| | — |
| | — |
|
| Total natural gas processed | 6,787 |
| | 8,629 |
| | 5,422 |
| | 6,874 |
|
| | | | | | | | |
| C2 + NGLs Fractionated (mbpd) | | | | | | | |
Marcellus Operations(6) | 431 |
| | 431 |
| | 374 |
| | 374 |
|
Utica Operations(6) | — |
| | 45 |
| | — |
| | 46 |
|
| Southwest Operations | 13 |
| | 13 |
| | 18 |
| | 18 |
|
Southern Appalachian Operations(7) | 12 |
| | 12 |
| | 13 |
| | 13 |
|
| Bakken Operations | 22 |
| | 22 |
| | — |
| | — |
|
| Rockies Operations | 4 |
| | 4 |
| | — |
| | — |
|
Total C2 + NGLs fractionated(8) | 482 |
| | 527 |
| | 405 |
| | 451 |
|
|
| | | | | | | |
| | Three Months Ended
March 31, |
| | 2020 | | 2019 |
| Pricing Information | | | |
| Natural Gas NYMEX HH ($ per MMBtu) | $ | 1.87 |
| | $ | 2.87 |
|
C2 + NGL Pricing ($ per gallon)(9) | $ | 0.40 |
| | $ | 0.62 |
|
| |
| (1) | Operating data is inclusive of operating data for ANDX. |
| |
| (2) | Average tariff rates calculated using pipeline transportation revenues divided by pipeline throughput barrels. |
| |
| (3) | Represents total at end of period. |
| |
| (4) | This column represents operating data for entities that have been consolidated into the MPLX financial statements. |
| |
| (5) | This column represents operating data for entities that have been consolidated into the MPLX financial statements as well as operating data for MPLX-operated equity method investments. |
| |
| (6) | Hopedale is jointly owned by Ohio Fractionation and MarkWest Utica EMG. Ohio Fractionation is a subsidiary of MarkWest Liberty Midstream. MarkWest Liberty Midstream and MarkWest Utica EMG are entities that operate in the Marcellus and Utica regions, respectively. Marcellus Operations includes Ohio Fractionation’s portion utilized of the jointly owned Hopedale Fractionation Complex. Utica Operations includes MarkWest Utica EMG’s portion utilized of the jointly owned Hopedale Fractionation Complex. Additionally, Sherwood Midstream has the right to fractionation revenue and the obligation to pay expenses related to 40 mbpd of capacity in the Hopedale 3 and Hopedale 4 fractionators. |
| |
| (7) | Includes NGLs fractionated for the Marcellus Operations and Utica Operations. |
| |
| (8) | Purity ethane makes up approximately 190 mbpd and 189 mbpd of total MPLX Operated, fractionated products for the three months ended March 31, 2020 and 2019, respectively. Purity ethane makes up approximately 183 mbpd and 176 mbpd of total MPLX LP consolidated, fractionated products for the three months ended March 31, 2020 and 2019, respectively. |
| |
| (9) | C2 + NGL pricing based on Mont Belvieu prices assuming an NGL barrel of approximately 35 percent ethane, 35 percent propane, six percent Iso-Butane, 12 percent normal butane and 12 percent natural gasoline. |
|
| | | | | | | | | | | | | | | |
| | Three Months Ended
September 30, | | Nine Months Ended
September 30, |
| | 2019 | | 2018 | | 2019 | | 2018 |
| Pricing Information | | | | | | | |
| Natural Gas NYMEX HH ($ per MMBtu) | $ | 2.33 |
| | $ | 2.86 |
| | $ | 2.57 |
| | $ | 2.85 |
|
C2 + NGL Pricing ($ per gallon)(9) | $ | 0.44 |
| | $ | 0.90 |
| | $ | 0.53 |
| | $ | 0.81 |
|
(1) Operating data is inclusive of operating data for ANDX for all of 2019.
(2) Average tariff rates calculated using pipeline transportation revenues divided by pipeline throughput barrels.
(3) Represents total at end of period.
(4) This column represents operating data for entities that have been consolidated into the MPLX financial statements.
(5) This column represents operating data for entities that have been consolidated into the MPLX financial statements as well as operating data for MPLX-operated equity method investments.
(6) Hopedale is jointly owned by Ohio Fractionation and MarkWest Utica EMG. Ohio Fractionation is a subsidiary of MarkWest Liberty Midstream. MarkWest Liberty Midstream and MarkWest Utica EMG are entities that operate in the Marcellus and Utica regions, respectively. Marcellus Operations includes Ohio Fractionation’s portion utilized of the jointly owned Hopedale Fractionation Complex. Utica Operations includes MarkWest Utica EMG’s portion utilized of the jointly owned Hopedale Fractionation Complex. Additionally, Sherwood Midstream has the right to fractionation revenue and the obligation to pay expenses related to 40 mbpd of capacity in the Hopedale 3 and Hopedale 4 fractionators.
(7) Includes NGLs fractionated for the Marcellus Operations and Utica Operations.
(8) Purity ethane makes up approximately 182 mbpd and 198 mbpd of total MPLX Operated, fractionated products for the three months ended September 30, 2019 and 2018, respectively, and approximately 189 mbpd and 183 mbpd of total fractionated products for the nine months ended September 30, 2019 and 2018, respectively. Purity ethane makes up approximately 172 mbpd and 183 mbpd of total MPLX LP consolidated, fractionated products for the three months ended September 30, 2019 and 2018, respectively, and approximately 179 mbpd and 169 mbpd of total fractionated products for the nine months ended September 30, 2019 and 2018, respectively.
(9) C2 + NGL pricing based on Mont Belvieu prices assuming an NGL barrel of approximately 35 percent ethane, 35 percent propane, six percent Iso-Butane, 12 percent normal butane and 12 percent natural gasoline.
LIQUIDITY AND CAPITAL RESOURCES
Cash Flows
Our cash and cash equivalents and restricted cash was $41$57 million at September 30, 2019March 31, 2020 and $85$15 million at December 31, 2018.2019. The change in cash, cash equivalents and restricted cash was due to the factors discussed below. Net cash provided by (used in) operating activities, investing activities and financing activities were as follows:
| | | | Nine Months Ended September 30, | Three Months Ended March 31, |
| (In millions) | 2019 | | 2018 | 2020 | | 2019 |
| Net cash provided by (used in): | | | | | | |
| Operating activities | $ | 2,990 |
| | $ | 2,027 |
| $ | 1,009 |
| | $ | 853 |
|
| Investing activities | (2,189 | ) | | (2,027 | ) | (362 | ) | | (700 | ) |
| Financing activities | (845 | ) | | 30 |
| (605 | ) | | (116 | ) |
| Total | $ | (44 | ) | | $ | 30 |
| $ | 42 |
| | $ | 37 |
|
Net cash provided by operating activities increased $963$156 million in the first ninethree months of 20192020 compared to the first ninethree months of 2018,2019, primarily due to the increase inincreased net income period over period which was most impacted by the Merger which is included for all nine months in 2019 and not in 2018. Net incomeof $24 million, excluding impairments, as well as other changes related to the Merger was approximately $539 million. Other less significant impacts include adjustments for depreciation and amortization adjustments related to equity method investments and adjustments for changes in working capital items which were also impacted by the previously mentioned acquisitions.items.
Net cash used in investing activities increased $162decreased $338 million in the first ninethree months of 20192020 compared to the first ninethree months of 2018,2019, primarily due to decreased spending related to the capital budget, a return of capital from our investment in Wink to Webster, decreased contributions to equity method investments as well as increased investments in equity method investments, offset by a decrease in cash used for acquisitions (related toreceived from the Mt. Airy acquisition in 2018).sale of certain assets.
Financing activities were an $845a $605 million use of cash in the first ninethree months of 20192020 compared to a $30$116 million sourceuse of cash in the first ninethree months of 2018.2019. The use of cash for the first ninethree months of 20192020 was primarily due to distributions of $1,731$717 million to common unitholders, distributions of $61$20 million to Series A preferred unitholders, distributions of $21 million to Series B preferred unitholders, distributions of $20$9 million to noncontrolling interests, Predecessor distributions of $502 million, repayment of $1,245$575 million under credit facilitieson the MPLX Credit Agreement, payments of $6 million related to financing leases, and debt issuance costsrepayment of $20 million.$2,261 million on the MPC Loan Agreement. These uses of cash were offset by net borrowings of $125$1,325 million on the revolving credit facility, $1,667 million on the MPC Loan Agreement, net borrowings of $500 million on the term loan, $2,000and $14 million of borrowings related to the floating rate senior notes and $94 million and $52 million in contributions from noncontrolling interests and MPC, respectively.MPC.
Debt and Liquidity Overview
Our outstanding borrowings at September 30, 2019 and DecemberMarch 31, 20182020 consist of the following:
|
| | | | | | | |
| (In millions) | September 30, 2019 | | December 31, 2018 |
| MPLX LP: | | | |
| Bank revolving credit facility due 2024 | — |
| | — |
|
| Term loan facility due 2021 | 500 |
| | — |
|
| Floating rate senior notes due September 2021 | 1,000 |
| | — |
|
| Floating rate senior notes due September 2022 | 1,000 |
| | — |
|
| 6.250% senior notes due October 2022 | 266 |
| | — |
|
| 3.500% senior notes due December 2022 | 486 |
| | — |
|
| 3.375% senior notes due March 2023 | 500 |
| | 500 |
|
| 4.500% senior notes due July 2023 | 989 |
| | 989 |
|
| 6.375% senior notes due May 2024 | 381 |
| | — |
|
| 4.875% senior notes due December 2024 | 1,149 |
| | 1,149 |
|
| 5.250% senior notes due January 2025 | 708 |
| | — |
|
| 4.000% senior notes due February 2025 | 500 |
| | 500 |
|
| 4.875% senior notes due June 2025 | 1,189 |
| | 1,189 |
|
| 4.125% senior notes due March 2027 | 1,250 |
| | 1,250 |
|
| 4.250% senior notes due December 2027 | 732 |
| | — |
|
| 4.000% senior notes due March 2028 | 1,250 |
| | 1,250 |
|
| 4.800% senior notes due February 2029 | 750 |
| | 750 |
|
| 4.500% senior notes due April 2038 | 1,750 |
| | 1,750 |
|
| 5.200% senior notes due March 2047 | 1,000 |
| | 1,000 |
|
| 5.200% senior notes due December 2047 | 487 |
| | — |
|
| 4.700% senior notes due April 2048 | 1,500 |
| | 1,500 |
|
| 5.500% senior notes due February 2049 | 1,500 |
| | 1,500 |
|
| 4.900% senior notes due April 2058 | 500 |
| | 500 |
|
| Consolidated subsidiaries: | | | |
| MarkWest - 4.500% - 4.875% senior notes, due 2023-2025 | 23 |
| | 23 |
|
| ANDX - 3.500% - 6.375% senior notes, due 2019-2047 | 690 |
| | 3,750 |
|
| ANDX credit facilities | — |
| | 1,245 |
|
| Financing lease obligations | 20 |
| | 21 |
|
| Total | 20,120 |
| | 18,866 |
|
| Unamortized debt issuance costs | (109 | ) | | (97 | ) |
| Unamortized discount/premium | (311 | ) | | (334 | ) |
| Amounts due within one year | (510 | ) | | (513 | ) |
| Total long-term debt due after one year | $ | 19,190 |
| | $ | 17,922 |
|
Term Loan Agreement
On September 26, 2019, MPLX entered into a Term Loan Agreement which provides for a committed term loan facility for up to an aggregate of $1 billion available to be drawn in up to four separate borrowings, subject to the satisfaction or waiver of certain customary conditions. If not fully utilized, the term loan commitments expire 90 days after September 26, 2019. Borrowings under the Term Loan Agreement bear interest, at MPLX’s election, at either (i) the Adjusted LIBO Rate (as defined in the Term Loan Agreement) plus a margin ranging from 75.0 basis points to 100.0 basis points per annum, depending on MPLX’s credit ratings, or (ii) the Alternate Base Rate (as defined in the Term Loan Agreement). The proceeds from borrowings under the Term Loan Agreement were used to fund the repayment of MPLX’s existing indebtedness and/or for general business purposes. Amounts borrowed under the Term Loan Agreement will be due and payable on September 26, 2021. |
| | | |
| (In millions) | March 31, 2020 |
| MPLX LP: | |
| Bank revolving credit facility | 750 |
|
| Term loan facility | 1,000 |
|
| Floating rate senior notes | 2,000 |
|
| Fixed rate senior notes | 16,887 |
|
| Consolidated subsidiaries: | |
| MarkWest | 23 |
|
| ANDX | 190 |
|
| Financing lease obligations | 14 |
|
| Total | 20,864 |
|
| Unamortized debt issuance costs | (103 | ) |
| Unamortized discount/premium | (290 | ) |
| Amounts due within one year | (4 | ) |
| Total long-term debt due after one year | $ | 20,467 |
|
The Term Loan Agreement contains representations and warranties, affirmative and negative covenants and events of default that we consider to be customary for an agreement of this type and are substantially similar to those contained in the MPLX Credit Agreement, including a covenant that requires MPLX’s ratio of Consolidated Total Debt to Consolidated EBITDA (as both terms are defined in the Term Loan Agreement) for the four prior fiscal quarters not to exceed 5.0 to 1.0 as of the last day of each fiscal quarter (or during the six-month period following certain acquisitions, 5.5 to 1.0). Consolidated EBITDA is subject to adjustments for certain acquisitions completed and capital projects undertaken during the relevant period.
Floating Rate Senior Notes
On September 9, 2019, MPLX issued $2.0 billion aggregate principal amount of floating rate senior notes in a public offering, consisting of $1.0 billion aggregate principal amount of notes due September 2021 and $1.0 billion aggregate principal amount of notes due September 2022 (collectively, the “Floating Rate Senior Notes”). The Floating Rate Senior Notes were offered at a price to the public of 100 percent of par. The proceeds were used to repay MPLX’s existing indebtedness and/or for general business purposes. Interest on the Floating Rate Senior Notes is payable quarterly in March, June, September and December, commencing on December 9, 2019. The interest rate applicable to the floating rate senior notes due September 2021 is LIBOR plus 0.9 percent per annum. The interest rate applicable to the floating rate senior notes due September 2022 is LIBOR plus 1.1 percent per annum.
Fixed Rate Senior Notes
In connection with the Merger, MPLX assumed ANDX’s outstanding senior notes which had an aggregate principal amount of $3.75 billion, interest rates ranging from 3.5 percent to 6.375 percent and maturity dates ranging from 2019 to 2047. On September 23, 2019, approximately $3.06 billion aggregate principal amount of ANDX’s outstanding senior notes were exchanged for an aggregate principal amount of approximately $3.06 billion new unsecured senior notes (the “Exchange Notes”) issued by MPLX in an exchange offer and consent solicitation undertaken by MPLX, leaving approximately $690 million aggregate principal of outstanding senior notes held by ANDX. Of this, $500 million is related to 5.5 percent unsecured senior notes due 2019. The principal amount of $500 million and accrued interest of $13.75 million was paid on October 15, 2019 using proceeds from the Floating Rate Senior Notes and borrowings under the Term Loan Agreement discussed above and includes interest through the payoff date.
The Exchange Notes consist of $266 million in aggregate principal amount of 6.25 percent unsecured senior notes due October 2022, $486 million in aggregate principal amount of 3.5 percent unsecured senior notes due December 2022, $381 million in aggregate principal amount of 6.375 percent unsecured senior notes due May 2024, $708 million in aggregate principal amount of 5.25 percent unsecured senior notes due January 2025, $732 million in aggregate principal amount of 4.25 percent unsecured senior notes due December 2027 and $487 million in aggregate principal amount of 5.2 percent unsecured senior notes due December 2047. Interest on each series of Exchange Notes is payable semi-annually in arrears according to the table below.
|
| |
Senior Notes | Interest payable semi-annually in arrears |
6.250% senior notes due October 2022 | April 15th and October 15th
|
3.500% senior notes due December 2022 | June 1st and December 1st
|
6.375% senior notes due May 2024 | May 1st and November 1st
|
5.250% senior notes due January 2025 | January 15th and July 15th
|
4.250% senior notes due December 2027 | June 1st and December 1st
|
5.200% senior notes due December 2047 | June 1st and December 1st
|
Credit Agreement
Effective July 30, 2019 in connection with the closing of the Merger, MPLX amended and restated the MPLX Credit Agreement to, among other things, increase its borrowing capacity to up to $3.5 billion and extend its term to July 30, 2024. The MPLX Credit Agreement includes certain representations and warranties, affirmative and negative covenants and events of default that we consider usual and customary for an agreement of its type. The financial covenant requires us to maintain a ratio of Consolidated Total Debt as of the end of each fiscal quarter to Consolidated EBITDA (both as defined in the MPLX Credit Agreement) for the prior four fiscal quarters of no greater than 5.0 to 1.0 (or 5.5 to 1.0 for up to two fiscal quarters following certain acquisitions). Consolidated EBITDA is subject to adjustments for certain acquisitions completed and capital projects undertaken during the relevant period. Other covenants restrict us and/or certain of our subsidiaries from incurring debt, creating liens on our assets and entering into transactions with affiliates. As of September 30, 2019, we were in compliance
with this financial covenant with a ratio of Consolidated Total Debt to Consolidated EBITDA of 3.80 to 1.0, as well as other covenants contained in the MPLX Credit Agreement. As disclosed in Note 2 of the Notes to Consolidated Financial Statements, the adoption of the lease accounting standards update resulted in the recognition of a significant lease obligation. The MPLX Credit Agreement contains provisions under which the effects of the new accounting standard are not recognized for purposes of financial covenant calculations.
MPC Loan Agreement
In connection with the Merger, on July 31, 2019, MPLX and MPC Investment amended and restated the MPC Loan Agreement to, among other things, increase the borrowing capacity under the MPC Loan Agreement to $1.5 billion in aggregate principal amount of all loans outstanding at any one time. The entire unpaid principal amount of the loan, together with all accrued and unpaid interest and other amounts (if any), shall become due and payable on July 31, 2024, provided that MPC Investment may demand payment of all or any portion of the outstanding principal amount of the loan, together with all accrued and unpaid interest and other amounts (if any), at any time prior to July 31, 2024.
Our intention is to maintain an investment grade credit profile. As of November 1, 2019,April 23, 2020, the credit ratings on our senior unsecured debt were at or above investment grade level as follows:
|
| | |
| Rating Agency | | Rating |
| Moody’s | | Baa2 (negative outlook) |
| Standard & Poor’s | | BBB (stable(negative outlook) |
| Fitch | | BBB (stable(negative outlook) |
The ratings reflect the respective views of the rating agencies. Although it is our intention to maintain a credit profile that supports an investment grade rating, there is no assurance that these ratings will continue for any given period of time. The ratings may be revised or withdrawn entirely by the rating agencies if, in their respective judgments, circumstances so warrant.
The MPLX Credit Agreement and senior notesTerm Loan Agreement contain certain representations and warranties, affirmative and restrictive covenants and events of default that we consider to be usual and customary for an agreement of this type. The financial covenant requires MPLX to maintain a ratio of Consolidated Total Debt as of the end of each fiscal quarter to Consolidated EBITDA (both as defined in the MPLX credit agreement) for the prior four fiscal quarters of no greater than 5.0 to 1.0 (or 5.5 to 1.0 during the six-month period following certain acquisitions). Consolidated EBITDA is subject to adjustments for certain acquisitions completed and capital projects undertaken during the relevant period. Other covenants restrict us and/or certain of our subsidiaries from incurring debt, creating liens on assets and entering into transactions with affiliates. As of March 31, 2020, we were in compliance with the covenants, including the financial covenant with a ratio of Consolidated Total Debt to Consolidated EBITDA of 3.8 to 1.0.
The agreements governing our debt obligations do not contain credit rating triggers that would result in the acceleration of interest, principal or other payments solely in the event that our credit ratings are downgraded. However, any downgrades in the credit ratings of our senior unsecured debt ratings to below investment grade ratings would,could, among other things, increase the applicable interest rates and other fees payable under the MPLX Credit Agreement and the Term Loan Agreement and may limit our flexibilityability to obtain future financing.financing, including refinancing existing indebtedness.
Our liquidity totaled $5.4$4.3 billion at September 30, 2019March 31, 2020 consisting of:
| | | | September 30, 2019 | March 31, 2020 |
| (In millions) | Total Capacity | | Outstanding Borrowings | | Available Capacity | Total Capacity | | Outstanding Borrowings | | Available Capacity |
Bank revolving credit facility due 2024(1) | $ | 3,500 |
| | $ | (3 | ) | | $ | 3,497 |
| $ | 3,500 |
| | $ | (750 | ) | | $ | 2,750 |
|
| Term Loan Agreement | 1,000 |
| | (500 | ) | | 500 |
| |
| MPC Loan Agreement | 1,500 |
| | (125 | ) | | 1,375 |
| 1,500 |
| | — |
| | 1,500 |
|
| Total liquidity | $ | 6,000 |
| | $ | (628 | ) | | 5,372 |
| $ | 5,000 |
| | $ | (750 | ) | | 4,250 |
|
| Cash and cash equivalents | | | | | 41 |
| | | | | 57 |
|
| Total liquidity | | | | | $ | 5,413 |
| | | | | $ | 4,307 |
|
(1) Outstanding borrowings include $3 million in letters of credit outstanding under this facility.
| |
| (1) | Outstanding borrowings include less than $1 million in letters of credit outstanding under this facility. |
We expect our ongoing sources of liquidity to include cash generated from operations and borrowings under the MPC Loan Agreement, and the MPLX Credit Agreement.Agreement and access to capital markets. We believe that cash generated from these sources will be sufficient to meet our short-term and long-term funding requirements, including working capital requirements, capital expenditure requirements, contractual obligations, and quarterly cash distributions. MPC manages our cash and cash equivalents on our behalf directly with third-party institutions as part of the treasury services that it provides to us under our omnibus agreement. From time to time, we may also consider utilizing other sources of liquidity, including the formation of joint ventures or sales of non-strategic assets.
Equity and Preferred Units Overview
Common units
The table below summarizes the changes in the number of units outstanding through September 30, 2019:March 31, 2020:
|
| | |
| (In units) | |
Balance at December 31, 20182019 | 794,089,5181,058,355,471 |
|
| Unit-based compensation awards | 287,019 |
|
Issuance of units in connection with the Merger | 262,829,592 |
|
Conversion of Series A Preferred Units | 1,148,330151,878 |
|
Balance at September 30, 2019March 31, 2020 | 1,058,354,4591,058,507,349 |
|
In connection with the Merger on July 30, 2019, each common unit held by ANDX’s public unitholders was converted into the right to receive 1.135 MPLX common units while ANDX common units held by certain affiliates of MPC were converted into the right to receive 1.0328 MPLX common units. This resulted in the issuance of MPLX common units of approximately 102 million units to public unitholders and approximately 161 million units to MPC.
Unrelated to the Merger, during the quarter certain holders of our Series A preferred units exercised their rights to convert their Series A preferred units into common units. These impacts are reflected in the table above.
Series B Preferred Units
In connection with the Merger, we converted ANDX’s outstanding 600,000 units of 6.875 percent Fixed-to-Floating Rate Cumulative Redeemable Perpetual Preferred Units representing limited partner interests of ANDX into preferred units of MPLX representing substantially equivalent limited partnership interests in MPLX (the “Series B preferred units”). The Series B preferred units are pari passu with the Series A preferred units with respect to distribution rights and rights upon liquidation. Distributions on the Series B preferred units are payable semi-annually in arrears on the 15th day, or the first business day thereafter, of February and August of each year through and including February 15, 2023. After February 15, 2023, the distribution will be made quarterly in arrears on the 15th day, or the first business day thereafter, of February, May, August and November of each year to holders of record as of the record date, which is generally the close of business on the first business day of the month of the applicable payment date.
ATM
MPLX expects the net proceeds, if any, from sales under our ATM Program will be used for general business purposes including repayment or refinancing of debt and funding for acquisitions, working capital requirements and capital expenditures. During the ninethree months ended September 30, 2019,March 31, 2020, we issued no common units under our ATM program. As of September 30, 2019,March 31, 2020, $1.7 billion of common units remain available for issuance through the ATM Program.
Distributions
We intend to pay at least thea minimum quarterly distribution to the holders of our common units of $0.2625 per unit, or $1.05 per quarter, which equatesunit on an annualized basis, to the extent we have sufficient cash from our operations after the establishment of cash reserves and the payment of costs and expenses, including reimbursements of expenses to our general partner. The amount of distributions paid under our policy and the decision to make any distributions is determined by our general partner, taking into consideration the terms of our partnership agreement. Such minimum distribution would equate to $278 million per quarter, or $1,111 million per year, based on the number of common units outstanding at September 30, 2019.March 31, 2020. On October 25, 2019,April 28, 2020, we announced the board of directors of our general partner had declared a distribution of $0.6775$0.6875 per unit that will be paid on November 14, 2019May 15, 2020 to unitholders of record on November 4, 2019.May 8, 2020. This represents an increase of $0.0100 per unit, or 1.5 percent, aboveis consistent with the secondfourth quarter 2019 distribution of $0.6675$0.6875 per unit and an increase of 6.34.6 percent over the thirdfirst quarter 20182019 distribution. This increase in the distribution is consistent with our intent to maintain an attractive distribution growth profile over an extended period of time.rate will also be received by Series A preferred unitholders. Although our partnership agreement requires that we distribute all of our available cash each quarter, we do not otherwise have a legal obligation to distribute any particular amount per common unit.
The allocation of total quarterly cash distributions to general and limited partners is as follows for the three and nine months ended September 30, 2019 and 2018. Our distributions are declared subsequent to quarter end; therefore, the following table represents total cash distributions applicable to the period in which the distributions were earned for the distributions being declared in October. Series B preferred unitholders are entitled to receive a fixed distribution of $68.75 per unit, per annum, payable semi-annually in arrears on February 15 and August 15, or the first business day thereafter. Included inthereafter, up to and including February 15, 2023. After February 15, 2023, the table below is $10 millionholders of distributions earned by the Series B preferred units forare entitled to receive cumulative, quarterly distributions payable in arrears on the three months ended September 30, 201915th day of February, May, August and November of each year, or the first business day thereafter, based on a floating annual rate equal to the three-month LIBOR plus 4.652 percent, in each case assuming a distribution is declared by the Board of Directors. MPLX made a cash distribution to holders of the Series B preferred unitholders in February 2020 for approximately $21 million.
The allocation of total quarterly cash distributions is as follows for the three months ended March 31, 2020 and 2019. MPLX’s distributions are declared subsequent to quarter end; therefore, the following table represents total cash distributions applicable to the period in which the distributions were earned. |
| | | | | | | |
| | Three Months Ended March 31, |
| (In millions) | 2020 | | 2019 |
| Distribution declared: | | | |
| Limited partner units - public | $ | 270 |
| | $ | 191 |
|
| Limited partner units - MPC | 458 |
| | 332 |
|
| Total LP distribution declared | 728 |
| | 523 |
|
| Series A preferred units | 20 |
| | 20 |
|
| Series B preferred units | 11 |
| | — |
|
| Total distribution declared | 759 |
| | 543 |
|
| | | | |
| Cash distributions declared per limited partner common unit | $ | 0.6875 |
| | $ | 0.6575 |
|
|
| | | | | | | | | | | | | | | |
| | Three Months Ended September 30, | | Nine Months Ended September 30, |
| (In millions) | 2019 | | 2018 | | 2019 | | 2018 |
| Distribution declared: | | | | | | | |
| Limited partner units - public | $ | 266 |
| | $ | 185 |
| | $ | 718 |
| | $ | 545 |
|
Limited partner units - MPC(1) | 438 |
| | 322 |
| | 1,201 |
| | 926 |
|
| Total GP & LP distribution declared | 704 |
| | 507 |
| | 1,919 |
| | 1,471 |
|
| Series A preferred units | 20 |
| | 19 |
| | 61 |
| | 55 |
|
| Series B preferred units | 10 |
| | — |
| | 31 |
| | — |
|
| Total distribution declared | 734 |
| | 526 |
| | 2,011 |
| | 1,526 |
|
| | | | | | | | |
| Cash distributions declared per limited partner common unit | $ | 0.6775 |
| | $ | 0.6375 |
| | $ | 2.0025 |
| | $ | 1.8825 |
|
(1) The three and nine months ended September 30, 2019 amounts are net of $12.5 million and $25 million of waived distributions, respectively, with respect to units held by MPC and its affiliates.
Capital Expenditures
Our operations are capital intensive, requiring investments to expand, upgrade, enhance or maintain existing operations and to meet environmental and operational regulations. Our capital requirements consist of maintenance capital expenditures and growth capital expenditures. Examples of maintenance capital expenditures are those made to replace partially or fully depreciated assets, to maintain the existing operating capacity of our assets and to extend their useful lives, or other capital expenditures that are incurred in maintaining existing system volumes and related cash flows. In contrast, growth capital expenditures are those incurred for capital improvements that we expect will increase our operating capacity to increase volumes gathered, processed, transported or fractionated, decrease operating expenses within our facilities or increase operating income over the long term. Examples of growth capital expenditures include the acquisition of equipment or the construction costs associated with new well connections, and the development of additional pipeline, processing or storage capacity. In general, growth capital includes costs that are expected to generate additional or new cash flow for MPLX.
Our capital expenditures are shown in the table below:
| | | | Nine Months Ended September 30, | Three Months Ended March 31, |
| (In millions) | 2019 | | 2018 | 2020 | | 2019 |
| Capital expenditures: | | | | | | |
| Maintenance | $ | 174 |
|
| $ | 98 |
| $ | 34 |
|
| $ | 37 |
|
| Maintenance reimbursements | (34 | ) | | — |
| (14 | ) | | (7 | ) |
| Growth | 1,479 |
| | 1,382 |
| 284 |
| | 467 |
|
| Growth reimbursements | (17 | ) | | — |
| — |
| | (5 | ) |
| Total capital expenditures | 1,602 |
| | 1,480 |
| 304 |
| | 492 |
|
| Less: Increase (decrease) in capital accruals | (67 | ) | | 90 |
| (61 | ) | | (71 | ) |
| Asset retirement expenditures | 1 |
| | 7 |
| |
Additions to property, plant and equipment, net of reimbursements(1) | 1,668 |
| | 1,383 |
| 365 |
| | 563 |
|
| Investments in unconsolidated affiliates | 494 |
| | 215 |
| 91 |
| | 135 |
|
| Acquisitions | (5 | ) |
| 451 |
| — |
|
| (1 | ) |
| Total capital expenditures and acquisitions | 2,157 |
| | 2,049 |
| 456 |
| | 697 |
|
| Less: Maintenance capital expenditures (including reimbursements) | 140 |
| | 98 |
| 20 |
| | 30 |
|
| Acquisitions | (5 | ) | | 451 |
| — |
| | (1 | ) |
Total growth capital expenditures(2) | $ | 2,022 |
| | $ | 1,500 |
| $ | 436 |
| | $ | 668 |
|
| |
| (1) | This amount is represented in the Consolidated Statements of Cash Flows as Additions to property, plant and equipment after excluding growth and maintenance reimbursements. Reimbursements are shown as Contributions from MPC within the Financing activities section of the Consolidated Statements of Cash Flows. |
| |
| (2) | Amount excludes contributions from noncontrolling interests of zero and $94 million for the three months ended March 31, 2020 and 2019, respectively, as reflected in the financing section of our statement of cash flows. Also excludes a $69 million return of capital from our Wink to Webster joint venture which is reflected in the investing section of our statement of cash flows for the three months ended March 31, 2020. |
(1) This amount is represented in the Consolidated Statements of Cash Flows as Additions to property, plant and equipment after excluding growth and maintenance reimbursements. Reimbursements are shown as Contributions from MPC within the Financing activities section of the Consolidated Statements of Cash Flows.
(2) Amount excludes contributions from noncontrolling interests of $94 million and $8 million for the nine months ended September 30, 2019 and 2018, respectively, as reflected in the financing section of our statement of cash flows.
Contractual Cash Obligations
As of September 30, 2019,March 31, 2020, our contractual cash obligations included long-term debt, finance and operating lease obligations, purchase obligations for services and to acquire property, plant and equipment, and other liabilities. During the ninethree months ended September 30, 2019,March 31, 2020, our third-party, long-term debt obligations increased by $1.26 billion. Also, in connection with the Merger, we assumed ANDX obligations related$750 million and was primarily used to future purchase obligations included in fuel costs associated with the wholesale product supply agreement, NGLs transportation costs, fractionation fees, and fixed charges with MPC. This increasedrepay our future obligations by approximately $11.9 billion as of September 30, 2019.MPC Loan Agreement. There were no other material changes to these obligations outside the ordinary course of business since December 31, 2018.2019.
Off-Balance Sheet Arrangements
Off-balance sheet arrangements comprise those arrangements that may potentially impact our liquidity, capital resources and results of operations, even though such arrangements are not recorded as liabilities under U.S. GAAP. Our off-balance sheet arrangements are limited to indemnities and guarantees that are described in Note 20.21. Although these arrangements serve a variety of our business purposes, we are not dependent on them to maintain our liquidity and capital resources, and we are not aware of any circumstances that are reasonably likely to cause the off-balance sheet arrangements to have a material adverse effect on our liquidity and capital resources.
TRANSACTIONS WITH RELATED PARTIES
At September 30, 2019,March 31, 2020, MPC owned our non-economic general partnership interest and held approximately 63 percent of theour outstanding MPLX LP common units and the non-economic general partner interest.units.
Excluding revenues attributable to volumes shipped by MPC under joint tariffs with third parties that are treated as third-party revenues for accounting purposes, and excluding losses for impairment of equity method investments, MPC accounted for 5455 percent and 4653 percent of our total revenues and other income for the thirdfirst quarter of 20192020 and 2018,2019, respectively. We provide crude oil and product pipeline transportation services based on regulated tariff rates and storage services and inland marine transportation based on contracted rates.
Of our total costs and expenses, excluding impairment expense, MPC accounted for 3029 percent and 2729 percent for the thirdfirst quarter of 20192020 and 2018,2019, respectively. MPC performed certain services for us related to information technology, engineering, legal, accounting, treasury, human resources and other administrative services.
For further discussion of agreements and activity with MPC and related parties see Item 1. Business in our Annual Report on Form 10-K for the year ended December 31, 20182019 and Note 5 of the Notes to Consolidated Financial Statements in this report.
ENVIRONMENTAL MATTERS AND COMPLIANCE COSTS
We have incurred and may continue to incur substantial capital, operating and maintenance, and remediation expenditures as a result of environmental laws and regulations. If these expenditures, as with all costs, are not ultimately reflected in the prices of our products and services, our operating results will be adversely affected. We believe that substantially all of our competitors must comply with similar environmental laws and regulations. However, the specific impact on each competitor may vary depending on a number of factors, including, but not limited to, the age and location of its operating facilities.
As of September 30, 2019,March 31, 2020, there have been no significant changes to our environmental matters and compliance costs since our Annual Report on Form 10-K for the year ended December 31, 2018.2019.
CRITICAL ACCOUNTING ESTIMATES
As of September 30, 2019,March 31, 2020, there have been no significant changes to our critical accounting estimates since our Annual Report on Form 10-K for the year ended December 31, 2018.2019, except as noted below.
Impairment Assessments of Long-Lived Assets, Intangible Assets, Goodwill and Equity Method Investments
Fair value calculated for the purpose of testing our long-lived assets, intangible assets, goodwill and equity method investments for impairment is estimated using the expected present value of future cash flows method and comparative market prices when appropriate. Significant judgment is involved in performing these fair value estimates since the results are based on forecasted assumptions. Significant assumptions include:
| |
| • | Future Operating Performance. Our estimates of future operating performance are based on our analysis of various supply and demand factors, which include, among other things, industry-wide capacity, our planned utilization rate, end-user demand, capital expenditures and economic conditions as well as commodity prices. Such estimates are consistent with those used in our planning and capital investment reviews. |
| |
| • | Future volumes. Our estimates of future throughput of crude oil, natural gas, NGL and refined product volumes are based on internal forecasts and depend, in part, on assumptions about our customers’ drilling activity which is inherently subjective and contingent upon a number of variable factors (including future or expected pricing considerations), many of which are difficult to forecast. Management considers these volume forecasts and other factors when developing our forecasted cash flows. |
| |
| • | Discount rate commensurate with the risks involved. We apply a discount rate to our cash flows based on a variety of factors, including market and economic conditions, operational risk, regulatory risk and political risk. This discount rate is also compared to recent observable market transactions, if possible. A higher discount rate decreases the net present value of cash flows. |
| |
| • | Future capital requirements. These are based on authorized spending and internal forecasts. |
Assumptions about the effects of COVID-19 and the macroeconomic environment are inherently subjective and contingent upon the duration of the pandemic and its impact on the macroeconomic environment, which is difficult to forecast. We base our fair value estimates on projected financial information which we believe to be reasonable. However, actual results may differ from these projections.
The need to test for impairment can be based on several indicators, including a significant reduction in prices of or demand for commodities, a poor outlook for profitability, a significant reduction in pipeline throughput volumes, a significant reduction in natural gas or NGL volumes processed, other changes to contracts or changes in the regulatory environment in which the asset or equity method investment is located.
Long-lived assets used in operations are assessed for impairment whenever changes in facts and circumstances indicate that the carrying value of the assets may not be recoverable based on the expected undiscounted future cash flow of an asset group. For purposes of impairment evaluation, long-lived assets must be grouped at the lowest level for which independent cash flows can be identified, which is at least at the segment level and in some cases for similar assets in the same geographic region where cash flows can be separately identified. If the sum of the undiscounted cash flows is less than the carrying value of an asset group, fair value is calculated, and the carrying value is written down if greater than the calculated fair value.
During the first quarter of 2020, we identified an impairment trigger relating to asset groups within our Western G&P reporting unit as a result of significant impacts to forecasted cash flows for these asset groups resulting from the first quarter events and circumstances as discussed in Note 1 of the Notes to Consolidated Financial Statements. The cash flows associated with these assets were significantly impacted by volume declines reflecting decreased forecasted producer customer production as a result of lower commodity prices. After assessing each asset group within the Western G&P reporting unit for impairment, only the East Texas G&P asset group resulted in the fair value of the underlying assets being less than the carrying value. As a result, an impairment of $174 million of property, plant and equipment and $177 million of intangibles was recorded to Impairment expense on the Consolidated Statements of Income. Fair value of our PP&E was determined using a combination of an income and cost approach. The income approach utilized significant assumptions including management’s best estimates of the expected future cash flows and the estimated useful life of the asset group. The cost approach utilized assumptions for the current replacement costs of similar assets adjusted for estimated depreciation and deterioration of the existing equipment and economic obsolescence. The fair value of the intangibles was determined based on applying the multi-period excess earnings method, which is an income approach. Key assumptions included management’s best estimates of the expected future cash flows from existing customers, customer attrition rates and the discount rate. Fair value determinations require considerable judgment and are sensitive to changes in underlying assumptions and factors. As a result, there can be no assurance that the estimates and assumptions made for purposes of our impairment analysis will prove to be an accurate prediction of the future. The fair value measurements for the asset group fair values represent Level 3 measurements.
Unlike long-lived assets, goodwill must be tested for impairment at least annually, and between annual tests if an event occurs or circumstances change that would more likely than not reduce the fair value of a reporting unit below its carrying amount. Goodwill is tested for impairment at the reporting unit level. A goodwill impairment loss is measured as the amount by which a reporting unit’s carrying value exceeds its fair value, without exceeding the recorded amount of goodwill.
The “Current Economic Environment” section describes the effects that the recent outbreak of COVID-19 and its development into a pandemic and the recent decline in commodity prices have had on our business. Due to these developments, we performed impairment assessments as discussed further below.
Prior to performing our goodwill impairment assessment as of March 31, 2020, MPLX had goodwill totaling approximately $9,536 million. As part of that assessment, MPLX recorded approximately $1,814 million of impairment expense in the first quarter of 2020 related to our Eastern G&P reporting unit within the G&P operating segment, which brought the amount of goodwill recorded within this reporting unit to zero. The impairment was primarily driven by updated guidance related to the slowing of drilling activity which has reduced production growth forecasts from our producer customers. For the remaining reporting units with goodwill, we determined that no significant adjustments to the carrying value of goodwill were necessary. The interim impairment assessment resulted in the fair value of the reporting units exceeding their carrying value by percentages ranging from approximately 8.5 percent to 270.0 percent. The reporting unit whose fair value exceeded its carrying amount by 8.5 percent, our Crude Gathering reporting unit, had goodwill totaling $1.1 billion at March 31, 2020. The operations which make up this reporting unit were acquired through the merger with ANDX. MPC accounted for its October 1, 2018 acquisition of Andeavor (including acquiring control of ANDX), using the acquisition method of accounting, which required Andeavor assets and liabilities to be recorded by MPC at the acquisition date fair value. The Merger was closed on July 30, 2019 and has been treated as a common control transaction, which required the recognition of assets acquired and liabilities assumed using MPC’s historical carrying value. As such, given the short amount of time from when fair value was established to the date of the impairment test, the amount by which the fair value exceeded the carrying value within this
reporting unit is not unexpected. An increase of one percentage point to the discount rate used to estimate the fair value of this reporting unit would not have resulted in goodwill impairment as of March 31, 2020. No other reporting units had had fair values exceeding carrying values of less than 20 percent.
Significant assumptions used to estimate the reporting units’ fair value included estimates of future cash flows and market information for comparable assets. Fair value determinations require considerable judgment and are sensitive to changes in underlying assumptions and factors. As a result, there can be no assurance that the estimates and assumptions made for purposes of the impairment tests will prove to be an accurate prediction of the future. See Note 12 of the Notes to Consolidated Financial Statements for additional information relating to goodwill.
Equity method investments are assessed for impairment whenever factors indicate an other than temporary loss in value. Factors providing evidence of such a loss include the fair value of an investment that is less than its carrying value, absence of an ability to recover the carrying value or the investee’s inability to generate income sufficient to justify our carrying value. During the first quarter of 2020, we assessed certain of our equity method investments for impairment as a result of a number of first quarter events and circumstances as discussed in Note 1 of the Notes to Consolidated Financial Statements. As a result, we recorded an other than temporary impairment for three joint ventures in which we have an interest. Impairment of these investments was $1,264 million, of which $1,251 million was related to MarkWest Utica EMG, L.L.C. and its investment in Ohio Gathering Company, L.L.C. The fair value of the investments was determined based upon applying the discounted cash flow method, which is an income approach. The discounted cash flow fair value estimate is based on known or knowable information at the interim measurement date. The significant assumptions that were used to develop the estimate of the fair value under the discounted cash flow method include management’s best estimates of the expected future cash flows, including prices and volumes, the weighted average cost of capital and the long-term growth rate. Fair value determinations require considerable judgment and are sensitive to changes in underlying assumptions and factors. As such, the fair value of these equity method investments represents a Level 3 measurement. As a result, there can be no assurance that the estimates and assumptions made for purposes of the impairment test will prove to be an accurate prediction of the future. The impairment was recorded through “Income from equity method investments.” The impairments were largely due to a reduction in forecasted volumes gathered and processed by the systems operated by the joint ventures. At March 31, 2020 we had $3,992 million of equity method investments recorded on the Consolidated Balance Sheets.
An estimate of the sensitivity to net income resulting from impairment calculations is not practicable, given the numerous assumptions (e.g., pricing, volumes and discount rates) that can materially affect our estimates. That is, unfavorable adjustments to some of the above listed assumptions may be offset by favorable adjustments in other assumptions. See Note 4 of the Notes to Consolidated Financial Statements for additional information relating to equity method investments.
ACCOUNTING STANDARDS NOT YET ADOPTED
As discussed in Note 2 of the Notes to Consolidated Financial Statements, certainWhile new financial accounting pronouncements will be effective for our financial statements in the future.future, there are no standards that have not yet been adopted that are expected to have a material impact on our financial statements. Accounting standards are discussed in Note 2 of the Notes to Consolidated Financial Statements.
Item 3. Quantitative and Qualitative Disclosures about Market Risk
We are exposed to market risks related to the volatility of commodity prices. We employ various strategies, including the potential use of commodity derivative instruments, to economically hedge the risks related to these price fluctuations. We are also exposed to market risks related to changes in interest rates. As of September 30, 2019,March 31, 2020, we did not have any open financial derivative instruments to economically hedge the risks related to interest rate fluctuations or commodity derivative instruments to economically hedge the risks related to the volatility of commodity prices; however, we continually monitor the market and our exposure and may enter into these arrangements in the future. While there is a risk related to changes in fair value of derivative instruments we may enter into; such risk is mitigated by price or rate changes related to the underlying commodity or financial transaction.
Commodity Price Risk
The information about commodity price risk for the three and nine months ended September 30, 2019March 31, 2020 does not differ materially from that discussed in Item 7A. Quantitative and Qualitative Disclosures about Market Risk of our Annual Report on Form 10-K for the year ended December 31, 2018.2019.
Outstanding Derivative Contracts
We have a natural gas purchase commitment embedded in a keep-whole processing agreement with a producer customer in the Southern Appalachian region expiring in December 2022. The customer has the unilateral option to extend the agreement for two consecutive five-year terms through December 2032. For accounting purposes, these agreementsthe natural gas purchase commitment and the term extending options have been aggregated into a single compound embedded derivative. The probability of the customer exercising its options is determined based on assumptions about the customer’s potential business strategy decision points that may exist at the time they would elect whether to renew the contract. The changes in fair value of this compound embedded derivative are based on the difference between the contractual and index pricing, the probability of the producer customer exercising its option to extend and the estimated favorability of these contracts compared to current market conditions. The changes in fair value are recorded in earnings through “Purchased product costs” on the Consolidated Statements of Income. As of September 30, 2019March 31, 2020 and December 31, 2018,2019, the estimated fair value of this contract was a liability of $54$45 million and $61$60 million, respectively.
Open Derivative Positions and Sensitivity Analysis
As of September 30, 2019,March 31, 2020, we have no open commodity derivative contracts. We evaluate our portfolio of commodity derivative instruments on an ongoing basis and add or revise strategies in anticipation of changes in market conditions and in risk profiles.
Interest Rate Risk
Sensitivity analysis of the effect of a hypothetical 100-basis-point change in interest rates on long-term debt, excluding finance leases, is provided in the following table. Fair value of cash and cash equivalents, receivables, accounts payable and accrued interest approximate carrying value and are relatively insensitive to changes in interest rates due to the short-term maturity of the instruments. Accordingly, these instruments are excluded from the table.
| | | (In millions) | Fair value as of September 30, 2019(1) | | Change in Fair Value(2) | | Change in Income Before Income Taxes for the Nine Months Ended September 30, 2019(3) | Fair value as of March 31, 2020(1) | | Change in Fair Value(2) | | Change in Income Before Income Taxes for the Three Months Ended March 31, 2020(3) |
| Long-term debt | | | | | | | | | | |
| Fixed-rate | $ | 18,783 |
| | $ | 1,820 |
| | N/A |
| $ | 14,638 |
| | $ | 1,249 |
| | N/A |
|
| Variable-rate | $ | 2,507 |
| | $ | 48 |
| | $ | 4 |
| $ | 3,714 |
| | $ | 37 |
| | $ | 8 |
|
(1) Fair value was based on market prices, where available, or current borrowing rates for financings with similar terms and maturities.
(2) Assumes a 100-basis-point decrease in the weighted average yield-to-maturity at September 30, 2019.March 31, 2020.
(3) Assumes a 100-basis-point change in interest rates. The change to net income was based on the weighted average balance of all outstanding variable-rate debt for the ninethree months ended September 30, 2019. This analysis does not include the ANDX credit facilities which were terminated upon closing of the Merger.March 31, 2020.
At September 30, 2019,March 31, 2020, our portfolio of long-term debt consisted of fixed-rate instruments and variable-rate instruments underincluding our term loan, floating rate senior notes and our revolving credit facility, term loan facility and floating rate senior notes.facility. The fair value of our fixed-rate debt is relatively
sensitive to interest rate fluctuations. Our sensitivity to interest rate declines and corresponding increases in the fair value of our debt portfolio unfavorably affects our results of operations and cash flows only when we elect to repurchase or otherwise retire fixed-rate debt at prices above carrying value. Interest rate fluctuations generally do not impact the fair value of borrowings under our bank revolving credit or term loan facilities, but may affect our results of operations and cash flows. As of September 30, 2019,March 31, 2020, we did not have any financial derivative instruments to hedge the risks related to interest rate fluctuations; however, we continually monitor the market and our exposure and may enter into these agreements in the future.
Item 4. Controls and Procedures
Disclosure Controls and Procedures
An evaluation of the effectiveness of the design and operation of our disclosure controls and procedures (as defined in Rules 13a-15(e) and 15d-15(e) under the Securities Exchange Act of 1934, as amended) was carried out under the supervision and with the participation of management, including the chief executive officer and chief financial officer of our general partner. Based upon that evaluation, the chief executive officer and chief financial officer of our general partner concluded that the design and operation of these disclosure controls and procedures were effective as of September 30, 2019March 31, 2020, the end of the period covered by this report.
Changes in Internal Control Over Financial Reporting
During the quarter ended September 30, 2019,March 31, 2020, there were no changes in our internal control over financial reporting that have materially affected, or are reasonably likely to materially affect, our internal control over financial reporting.
Part II – Other Information
Item 1. Legal Proceedings
We are the subject of, or a party to, a number of pending or threatened legal actions, contingencies and commitments involving a variety of matters, including laws and regulations relating to the environment. Except as described below, there have been no material changes to the legal proceedings previously disclosed in our Annual Report on Form 10-K,10-K.
Litigation
In connection with our 9.19 percent indirect interest in a joint venture that owns and operates the Dakota Access Pipeline and Energy Transfer Crude Oil Pipeline projects, collectively referred to as updatedthe Bakken Pipeline system, we have entered into a Contingent Equity Contribution Agreement whereby MPLX LP, along with the other joint venture owners in the Quarterly Reports on Form 10-QBakken Pipeline system, have agreed to make equity contributions to the joint venture upon certain events occurring to allow the entities that own and operate the Bakken Pipeline system to satisfy their senior note payment obligations. The senior notes were issued to repay amounts owed by the pipeline companies to fund the cost of construction of the Bakken Pipeline system.
In March 2020, the U.S. District Court for the quarters ended March 31, 2019District of Columbia ordered the U.S. Army Corps of Engineers, which granted permits for the Bakken Pipeline system, to conduct a full environmental impact statement (“EIS”), and June 30, 2019.further requested briefing on whether an easement permit necessary for the operation of the Bakken Pipeline system should be vacated while the EIS is being prepared. If the permit is vacated pending completion of the EIS and the vacatur is deemed temporary, MPLX would have to contribute its 9.19 percent pro rata share of funds required to pay interest accruing on the notes while the pipeline is shutdown and its 9.19 percent pro rata share of any costs to remediate any deficiencies to reinstate the permit and/or return the pipeline into operation. If the court vacates the permit and such action results in a permanent shutdown of the pipeline, MPLX would have to contribute its 9.19 percent pro rata share of the cost to redeem the bonds (including the 1% redemption premium required pursuant to the indenture governing the notes) and any accrued and unpaid interest, if any.
MPLX, MarkWest, MarkWest Liberty Midstream, MarkWest Liberty Bluestone, L.L.C., Ohio FractionationEnvironmental Proceedings
On April 10, 2020, we received a Notice of Probable Violation and MarkWest Utica EMG (collectively,Proposed Civil Penalty from the “MPLX Parties”) are parties to various lawsuits with Bilfinger Westcon, Inc. (“Westcon”) that were instituted in 2016Pipeline and 2017 in Pennsylvania, West Virginia and Ohio. The lawsuits relate to disputes regarding construction work performed by WestconHazardous Materials Safety Administration’s Office of Pipeline Safety (OPS) for alleged violations arising from the release at the Bluestone, MobleyHospah Station pump station in New Mexico on September 7, 2018. The NOPV alleged a failure to follow written procedures for responding to, investigating, and Cadiz processing complexescorrecting the cause of an increase in Pennsylvania, West Virginiapressure of flow rate outside its normal operating limits, and Ohio, respectively, and the Hopedale fractionation complex in Ohio. With respecta failure to work performed by Westcon at the Mobley and Bluestone processing complexes, one or morefollow appropriate procedures regarding related personnel performance. This matter was resolved for a cash penalty of the MPLX Parties have asserted breach of contract, fraud, and with respect to work performed at the Mobley processing complex, MarkWest Liberty Midstream has also asserted negligent misrepresentation claims against Westcon. Westcon has also asserted claims against one or more of the MPLX Parties regarding these construction projects for breach of contract, unjust enrichment, promissory estoppel, fraud and constructive fraud, tortious interference with contractual relations, and civil conspiracy. Collectively, in the several cases, the MPLX Parties sought in excess of $10 million, plus an unspecified amount of punitive damages. Collectively, in the several cases, Westcon sought in excess of $40 million, plus an unspecified amount of punitive damages. As previously disclosed in our Quarterly Report on Form 10-Q for the quarter ended June 30, 2019, in July 2019, Westcon and the MPLX Parties reached an agreement to resolve the disputes among those parties relating to the Bluestone processing complex in Pennsylvania. The settlement will not have a material adverse effect on MPLX’s consolidated financial position, results of operations or cash flows.approximately $236,000.
Item 1A. Risk Factors
Except as described below, there have been no material changes from the risk factors previously disclosed in our Annual Report on Form 10-K for the year ended December 31, 2018,2019.
The recent outbreak of COVID-19 and certain developments in the global oil markets have had, and may continue to have, material adverse consequences for general economic, financial and business conditions, and could materially and adversely affect our business, financial condition, results of operations and cash flows and those of our customers, suppliers and other counterparties.
The recent outbreak of COVID-19 and the responses of governmental authorities, companies and the self-imposed restrictions by many individuals across the world to stem the spread of the virus have significantly reduced global economic activity, as updatedthere has been a dramatic decrease in our Quarterly Reportthe number of businesses open for operation and substantially fewer people across the world have been traveling to work or leaving their home to purchase goods and services. This has also resulted, for example, in a dramatic reduction in airline flights and has reduced the number of cars on Form 10-Qthe road. As a result, there has been a decline in the demand for the quarter ended June 30, 2019.
MPC’s ongoing review of strategic alternativesfuels distribution services we provide and for its midstream business could materially impact our strategic direction, businessthe petroleum products that we transport and results of operations.
MPC’s board of directors has formed a special committee to enhance its evaluation of potential value-creating options for its midstream business, of which MPLX is the primary component. MPC’s exploration of strategic alternatives, including anystore.
uncertainty created by this process, involves a numberConcerns over the negative effects of risks: significant fluctuations in our unitCOVID-19 on economic and business prospects across the world have contributed to increased market and oil price occur in response to developments relating tovolatility and have diminished expectations for the strategic review process or market speculation regarding any such developments; we may encounter difficulties in hiring, retainingglobal economy. These factors, coupled with the emergence of decreasing business and motivating key personnel who provide services to us during this process or as a result of uncertainties generated by this process or any developments or actions relating to it; we may incur substantial increases in generalconsumer confidence and administrative expense associated with increased legal feesincreasing unemployment resulting from the COVID-19 outbreak and the need to retainrecent abrupt oil price decline, may precipitate a prolonged economic slowdown and compensate third party advisors;recession. Any such prolonged period of economic slowdown or recession, or a protracted period of depressed prices for crude oil or refined petroleum products could have significant adverse consequences for our financial condition and we may experience difficulties in preserving the commercially sensitive information that may need to be disclosed to third parties during this process or in connection with an assessmentfinancial condition of our strategic alternatives. On November 1, 2019, Moody’s announced it had changed its outlook for MPC’scustomers, suppliers and MPLX’s credit ratings from stable to negative following the recent announcements regarding MPC’s planned spin-off of its Speedway businessother counterparties, and its midstream review, and the midstream review could be a factor causingdiminish our liquidity or contributing to a future determination by one or moretrigger additional impairments.
The ultimate extent of the rating agencies to lower MPLX’s credit ratings. The strategic review process also requires significant time and attention from management, which could distract them from other tasks in operating our business. There can be no assurance that this process will result in the pursuit or consummationimpact of any strategic transaction. The occurrence of any one or more of the above risks could have a material adverse impactCOVID-19 on our business, financial condition, results of operations and cash flows.flows will depend largely on future developments, including the duration and spread of the outbreak, particularly within the geographic areas where we operate, the related impact on overall economic activity and the timing of the lifting of restrictions and return of customer confidence, all of which are uncertain and cannot be predicted with certainty at this time.
The Court of Chancery of the State of Delaware will be, to the extent permitted by law, the sole and exclusive forum for substantially all disputes between us and our limited partners.
Our limited partnership agreement provides that the Court of Chancery of the State of Delaware will be the sole and exclusive forum for any claims, actions or proceedings:
arising out of or relating in any way to our limited partnership agreement, or the rights or powers of, or restrictions on, our limited partners or the limited partnership;
brought in a derivative manner on behalf of the limited partnership;
asserting a claim of breach of a duty owed by any director, officer, or other employee of the limited partnership or the general partner, or owed by the general partner, to the partnership or the limited partners;
asserting a claim arising pursuant to any provision of the Delaware Revised Uniform Limited Partnership Act; or
asserting a claim governed by the internal affairs doctrine.
The forum selection provision may restrict a limited partner's ability to bring a claim against us or directors, officers or other employee of ours or our general partner in a forum that it finds favorable, which may discourage limited partners from bringing such claims at all. Alternatively, if a court were to find the forum selection provision contained in our limited partnership agreement to be inapplicable or unenforceable in an action, we may incur additional costs associated with resolving such action in another forum, which could materially adversely affect our business, financial condition and results of operations. However, the forum selection provision does not apply to any claims, actions or proceedings arising under the Securities Act or the Exchange Act.
Item 2. Unregistered Sales of Equity Securities
In connection with the closing of the Merger, each common unit held by ANDX’s public unitholders was converted into the right to receive 1.135 MPLX common units. ANDX common units held by certain affiliates of MPC were converted into the right to receive 1.0328 MPLX common units.
Additionally, as a result of the Merger, each ANDX TexNew Mex Unit issued and outstanding immediately prior to the effective time of the Merger was converted into a right for Western Refining Southwest, Inc. (“Southwest”), a wholly-owned subsidiary of MPC, as the holder of all such units, to receive a unit representing a substantially equivalent special limited partner interest in MPLX (the “MPLX TexNew Mex Units”). By virtue of the conversion, all ANDX TexNew Mex Units were cancelled and ceased to exist as of the effective time of the Merger. The MPLX TexNew Mex Units are a new class of units in MPLX substantially equivalent to the ANDX TexNew Mex Units, including substantially equivalent rights, powers, duties and obligations that the ANDX TexNew Mex Units had immediately prior to the closing of the Merger. As a result of the Merger, the ANDX Special Limited Partner Interest outstanding immediately prior to the effective time of the Merger was converted into a right for Southwest, as the holder of all such interest, to receive a substantially equivalent special limited partner interest in MPLX (the “MPLX Special Limited Partner Interest”). By virtue of the conversion, the ANDX Special Limited Partner Interest was cancelled and ceased to exist as of the effective time of the Merger.
The issuance of MPLX TexNew Mex Units and the MPLX Special Limited Partner Interest was effected in reliance on an exemption from registration under Section 4(a)(2) of the Securities Act of 1933, as amended.
Item 6. Exhibits
|
| | | | | | | | | | | | | | | |
| | | | | Incorporated by Reference | | | | |
Exhibit Number | | Exhibit Description | | Form | | Exhibit |
| | Filing Date | | SEC File No. | | Filed Herewith | | Furnished Herewith |
| 1.1 | | | | 8-K | | 1.1 |
| | 9/9/2019 | | 001-35714 | | | | |
| 2.1* | | | | 8-K | | 2.1 |
| | 5/8/2019 | | 001-35714 | | | | |
| 3.1 | | | | S-1 | | 3.1 |
| | 7/2/2012 | | 333-182500 | | | | |
| 3.2 | | | | S-1/A | | 3.2 |
| | 10/9/2012 | | 333-182500 | | | | |
| 3.3 | | | | 8-K/A | | 3.1 |
| | 8/14/2019 | | 001-35714 | | | | |
| 4.1 | | | | 10-Q | | 4.3 |
| | 10/31/2014 | | 001-03473 (Andeavor) | | | | |
| 4.2 | | | | 8-K | | 4.1 |
| | 9/9/2019 | | 001-35714 | | | | |
| 4.3 | | | | 10-K | | 4.33 |
| | 2/21/2017 | | 001-03473 (Andeavor) | | | | |
| 4.4 | | | | 8-K | | 4.2 |
| | 9/9/2019 | | 001-35714 | | | | |
|
| | | | | | | | | | | | | | | |
| | | | | Incorporated by Reference From | | | | |
Exhibit Number | | Exhibit Description | | Form | | Exhibit |
| | Filing Date | | SEC File No. | | Filed Herewith | | Furnished Herewith |
| 1.1 | | | | 8-K | | 1.1 |
| | 9/9/2019 | | 001-35714 | | | | |
| 2.1* | | | | 8-K | | 2.1 |
| | 5/8/2019 | | 001-35714 | | | | |
| 3.1 | | | | S-1 | | 3.1 |
| | 7/2/2012 | | 333-182500 | | | | |
|
| | | | | | | | | | | | | | | |
| | | | | Incorporated by Reference | | | | |
Exhibit Number | | Exhibit Description | | Form | | Exhibit |
| | Filing Date | | SEC File No. | | Filed Herewith | | Furnished Herewith |
| 4.5 | | | | 10-K | | 4.34 |
| | 2/21/2017 | | 001-03473 (Andeavor) | | | | |
| 4.6 | | | | 8-K | | 4.3 |
| | 9/9/2019 | | 001-35714 | | | | |
| 4.7 | | | | 8-K | | 4.1 |
| | 11/28/2017 | | 001-35143 (ANDX) | | | | |
| 4.8 | | | | 8-K | | 4.4 |
| | 9/9/2019 | | 001-35714 | | | | |
| 4.9 | | | | 8-K | | 4.5 |
| | 9/9/2019 | | 001-35714 | | | | |
| 4.10 | | | | 8-K | | 4.6 |
| | 9/9/2019 | | 001-35714 | | | | |
| 4.11 | | | | 8-K | | 4.1 |
| | 9/27/2019 | | 001-35714 | | | | |
| 4.12 | | | | 8-K | | 4.2 |
| | 9/27/2019 | | 001-35714 | | | | |
| 4.13 | | | | 8-K | | 4.3 |
| | 9/27/2019 | | 001-35714 | | | | |
|
| | | | | | | | | | | | | | | |
| | | | | Incorporated by Reference | | | | |
Exhibit Number | | Exhibit Description | | Form | | Exhibit |
| | Filing Date | | SEC File No. | | Filed Herewith | | Furnished Herewith |
| 4.14 | | | | 8-K | | 4.4 |
| | 9/27/2019 | | 001-35714 | | | | |
| 4.15 | | | | 8-K | | 4.5 |
| | 9/27/2019 | | 001-35714 | | | | |
| 4.16 | | | | 8-K | | 4.6 |
| | 9/27/2019 | | 001-35714 | | | | |
| 4.17 | | | | 8-K | | 4.7 |
| | 9/27/2019 | | 001-35714 | | | | |
| 10.10 | | | | 8-K | | 10.1 |
| | 5/8/2019 | | 001-35714 | | | | |
| 10.20 | | Amended and Restated Credit Agreement, dated as of July 26, 2019, by and among MPLX, as borrower, Wells Fargo Bank, National Association, as administrative agent, each of Wells Fargo Securities, LLC, JPMorgan Chase Bank, N.A., Barclays Bank PLC, BofA Securities, Inc., Citigroup Global Markets Inc., Mizuho Bank, Ltd., MUFG Bank, Ltd. and Royal Bank of Canada, as joint lead arrangers and joint bookrunners, JPMorgan Chase Bank, N.A., as syndication agent, each of Bank of America, N.A., Barclays Bank PLC, Citigroup Global Markets Inc., Mizuho Bank, Ltd., MUFG Bank, Ltd. and Royal Bank of Canada, as documentation agents, and the other lenders and issuing banks that are parties thereto | | 8-K | | 10.1 |
| | 8/1/2019 | | 001-35714 | | | | |
| 10.30 | | | | 8-K | | 10.2 |
| | 8/1/2019 | | 001-35714 | | | | |
|
| | | | | | | | | | | | | | | |
| | | | | Incorporated by Reference | | | | |
Exhibit Number | | Exhibit Description | | Form | | Exhibit |
| | Filing Date | | SEC File No. | | Filed Herewith | | Furnished Herewith |
| 10.40 | | Term Loan Agreement, dated as of September 26, 2019, by and among MPLX LP, as borrower, Wells Fargo Bank, National Association, as administrative agent, each of Wells Fargo Securities, LLC, BofA Securities, Inc. and Mizuho Bank, Ltd., as joint lead arrangers and joint bookrunners, and the syndication agents, documentation agents and lenders that are parties thereto | | 8-K | | 10.1 |
| | 9/27/2019 | | 001-35714 | | | | |
| 10.41 | | | | 8-K | | 10.2 |
| | 10/31/2017 | | 001-35143 (ANDX)
| | | | |
| 10.42 | | First Amendment to Fourth Amended and Restated Omnibus Agreement, dated as of January 30, 2019, among Andeavor LLC, Marathon Petroleum Company LP, Tesoro Refining & Marketing Company LLC, Tesoro Companies, Inc., Tesoro Alaska Company LLC, Andeavor Logistics LP and Tesoro Logistics GP, LLC | | 10-K | | 10.77 |
| | 2/28/2019 | | 001-35054 | | | | |
| 10.43 | | Waiver and Second Amendment to Fourth Amended and Restated Omnibus Agreement, dated as of July 29, 2019, by and among MPC, Andeavor Logistics LP, Tesoro Logistics GP, LLC, Tesoro Refining & Marketing Company LLC, Tesoro Companies, Inc., Tesoro Alaska Company LLC and Marathon Petroleum Company LP. | | 8-K | | 10.3 |
| | 8/1/2019 | | 001-35054 | | | | |
| 10.44 | | | | 10-Q | | 10.2 |
| | 11/17/2018 | | 001-35143 (ANDX)
| | | | |
| 10.45 | | | | 8-K | | 10.1 |
| | 2/5/2019 | | 001-35143 (ANDX)
| | | | |
|
| | | | | | | | | | | | | | | |
| | | | | Incorporated by Reference | | | | |
Exhibit Number | | Exhibit Description | | Form | | Exhibit |
| | Filing Date | | SEC File No. | | Filed Herewith | | Furnished Herewith |
| 10.46 | | | | 8-K | | 10.2 |
| | 2/5/2019 | | 001-35143 (ANDX) | | | | |
| 10.47 | | | | | | | | | | | | X | | |
| 10.48 | | | | | | | | | | | | X | | |
| 10.49 | | | | 8-K | | 10.9 |
| | 12/8/2014 | | 001-35143 (ANDX) | | | | |
| 10.50 | | | | 8-K | | 10.3 |
| | 2/3/2016 | | 001-35143 (ANDX) | | | | |
| 10.51 | | | | 8-K | | 10.2 |
| | 10/16/2014 | | 001-36114 (WNRL) | | | | |
| 10.52 | | | | 10-Q | | 10.20 |
| | 8/7/2018 | | 001-35143 (ANDX) | | | | |
| 10.53 | | | | 8-K | | 10.1 |
| | 10/16/2014 | | 001-36114 (WNRL) | | | | |
| 10.54 | | | | 10-Q | | 10.7 |
| | 8/7/2018 | | 001-35143 (ANDX) | | | | |
| 10.55 | | | | 10-Q | | 10.8 |
| | 8/7/2018 | | 001-35143 (ANDX) | | | | |
|
| | | | | | | | | | | | | | | |
| | | | | Incorporated by Reference | | | | |
Exhibit Number | | Exhibit Description | | Form | | Exhibit |
| | Filing Date | | SEC File No. | | Filed Herewith | | Furnished Herewith |
| 10.56 | | | | 10-Q | | 10.9 |
| | 8/7/2018 | | 001-35143 (ANDX) | | | | |
| 10.57 | | | | 10-Q | | 10.10 |
| | 8/7/2018 | | 001-35143 (ANDX) | | | | |
| 10.58 | | | | 10-Q | | 10.11 |
| | 8/7/2018 | | 001-35143 (ANDX) | | | | |
| 31.10 | | | | | | | | | | | | X | | |
| 31.20 | | | | | | | | | | | | X | | |
| 32.10 | | | | | | | | | | | | | | X |
| 32.20 | | | | | | | | | | | | | | X |
| 101.INS | | XBRL Instance Document: The instance document does not appear in the interactive data file because its XBRL tags are embedded within the Inline XBRL document. | | | | | | | | | | | | |
| 101.SCH | | Inline XBRL Taxonomy Extension Schema Document | | | | | | | | | | X | | |
| 101.CAL | | Inline XBRL Taxonomy Extension Calculation Linkbase Document | | | | | | | | | | X | | |
| 101.DEF | | Inline XBRL Taxonomy Extension Definition Linkbase Document | | | | | | | | | | X | | |
| 101.LAB | | Inline XBRL Taxonomy Extension Label Linkbase Document | | | | | | | | | | X | | |
| 101.PRE | | Inline XBRL Taxonomy Extension Presentation Linkbase Document | | | | | | | | | | X | | |
|
| | | | | | | | | | | | | | | |
| | | | | Incorporated by Reference From | | | | |
Exhibit Number | | Exhibit Description | | Form | | Exhibit |
| | Filing Date | | SEC File No. | | Filed Herewith | | Furnished Herewith |
| 3.2 | | | | S-1/A | | 3.2 |
| | 10/9/2012 | | 333-182500 | | | | |
| 3.3 | | | | 8-K/A | | 3.1 |
| | 8/14/2019 | | 001-35714 | | | | |
| 10.1 | | | | | | | | | | | | X | | |
| 10.2 | | | | | | | | | | | | X | | |
| 10.3 | | | | | | | | | | | | X | | |
| 10.4 | | | | | | | | | | | | X | | |
| 31.10 | | | | | | | | | | | | X | | |
| 31.20 | | | | | | | | | | | | X | | |
| 32.10 | | | | | | | | | | | | | | X |
| 32.20 | | | | | | | | | | | | | | X |
| 101.INS | | XBRL Instance Document: The instance document does not appear in the interactive data file because its XBRL tags are embedded within the Inline XBRL document. | | | | | | | | | | | | |
| 101.SCH | | Inline XBRL Taxonomy Extension Schema Document. | | | | | | | | | | X | | |
| 101.CAL | | Inline XBRL Taxonomy Extension Calculation Linkbase Document. | | | | | | | | | | X | | |
| 101.DEF | | Inline XBRL Taxonomy Extension Definition Linkbase Document. | | | | | | | | | | X | | |
| 101.LAB | | Inline XBRL Taxonomy Extension Label Linkbase Document. | | | | | | | | | | X | | |
| 101.PRE | | Inline XBRL Taxonomy Extension Presentation Linkbase Document. | | | | | | | | | | X | | |
| 104 | | Cover Page Interactive Data File (formatted as Inline XBRL and contained in Exhibit 101). | | | | | | | | | | | | |
| |
| * | Schedules have been omitted pursuant to Item 601(b)(2) of Regulation S-K. MPLX LP hereby undertakes to furnish supplementally a copy of any omitted schedule upon request by the SEC. |
SIGNATURES
Pursuant to the requirements of the Securities Exchange Act of 1934, the registrant has duly caused this report to be signed on its behalf by the undersigned thereunto duly authorized.
|
| | | |
| | MPLX LP | | |
| | | | |
| | By: | | MPLX GP LLC |
| | | | Its general partner |
| | | | |
Date: November 4, 2019May 7, 2020 | By: | | /s/ C. Kristopher Hagedorn |
| | | | C. Kristopher Hagedorn |
| | | | Vice President and Controller of MPLX GP LLC (the general partner of MPLX LP) |