UNITED STATES
SECURITIES AND EXCHANGE COMMISSION
Washington, D.C. 20549
Form
FORM 10-Q
(Mark One)
☒ | QUARTERLY REPORT PURSUANT TO SECTION 13 OR 15(d) OF THE SECURITIES EXCHANGE ACT OF 1934 |
☒QUARTERLY REPORT PURSUANT TO SECTION 13 OR 15(d) OF THE SECURITIES EXCHANGE ACT OF 1934For the quarterly period ended March 31, 2020
FOR THE QUARTERLY PERIOD ENDED MARCH 31, 2019or
OR
☐TRANSITION REPORT PURSUANT TO SECTION 13 OR 15(d) OF THE SECURITIES EXCHANGE ACT OF 1934 | TRANSITION REPORT PURSUANT TO SECTION 13 OR 15(d) OF THE SECURITIES EXCHANGE ACT OF 1934 |
For the transition period from ______ to
______
Commission file number:number 001-38388

Victory Capital Holdings, Inc.
(Exact name of registrant as specified in its charter)
Delaware | | 32-0402956 |
(State or other jurisdiction of | | (I.R.S. Employer |
incorporation or organization) | | Identification No.) |
| | |
4900 Tiedeman Road 4th Floor15935 La Cantera Parkway, San Antonio, Texas
| | |
Brooklyn, OH
| | 4414478256
|
(Address of principal executive offices) | | (Zip Code) |
(216) 898-2400
(Registrant’s telephone number, including area code)
Securities registered pursuant to Section 12(b) of the Act:
| | |
| | |
Title of each class | Trading Symbol(s) | Name of each exchange on which registered |
Class A Common Stock, $0.01 Par Value | VCTR | The NASDAQ Stock Market LLC |
Indicate by check mark whether the registrant (1) has filed all reports required to be filed by Section 13 or 15(d) of the Securities Exchange Act of 1934 during the preceding 12 months (or for such shorter period that the registrant was required to file such reports), and (2) has been subject to such filing requirements for the past 90 days.days. Yes ☒ No ☐
Indicate by check mark whether the registrant has submitted electronically every Interactive Data File required to be submitted pursuant to Rule 405 of Regulation S-T (§232.405 of this chapter) during the preceding 12 months (or for such shorter period that the registrant was required to submit such files). Yes ☒ No ☐
Indicate by check mark whether the registrant is a large accelerated filer, an accelerated filer, a non-accelerated filer, a smaller reporting company, or an emerging growth company. See the definitions of “large accelerated filer,” “accelerated filer,” “smaller reporting company,” and “emerging growth company” in Rule 12b-2 of the Exchange Act.
Large accelerated filer ☐ | | Accelerated filer ☐☒ |
| Non-accelerated filer ☒☐ | | Smaller reporting company ☐ |
| | | | | | Emerging growth company ☒ |
If an emerging growth company, indicate by check mark if the registrant has elected not to use the extended transition period for complying with any new or revised financial accounting standards provided pursuant to Section 13(a) of the Exchange Act. ☐
Indicate by check mark whether the registrant is a shell company (as defined in Rule 12b-2 of the Exchange Act). Yes ☐ No ☒
Securities registered pursuant to Section 12(b) of the Act:
| | |
Title of each class
| Trading Symbol(s)
| Name of each exchange on which registered
|
Class A Common Stock, $0.01 Par Value
| VCTR
| NASDAQ
|
The number of outstanding shares of the registrant’s Class A common stock, par value $0.01 per share and Class B common stock, par value $0.01 per share, as of April 30, 20192020 were 14,784,31316,588,474 and 52,800,011,51,307,072 respectively.
TABLE OF CONTENTS
In this report, when we refer to:
| ·
| | the “2014 Credit Agreement,” we are referring to the credit agreement dated as of October 31, 2014 (as amended);
|
| ·
| | “CEMP,” we are referring to Compass Efficient Model Portfolios, LLC;
|
| ·
| | the “CEMP Acquisition,” we are referring to our acquisition of the CEMP business in 2015;
|
| ·
| | “Cerebellum,” we are referring to Cerebellum Capital, LLC;
|
| ·
| | “Crestview,” we are referring to Crestview Advisors, L.L.C.;
|
| ·
| | “Crestview GP,” we are referring to Crestview Partners II GP, L.P.;
|
| ·
| | “ETFs,” we are referring to exchange‑traded funds;
|
| ·
| | the “Existing Credit Agreement,” we are referring to the credit agreement dated as of February 12, 2018 (as amended from time to time);
|
| ·
| | “Harvest,” we are referring to Harvest Volatility Management, LLC.;
|
| ·
| | the “Harvest Acquisition,” we are referring to the transaction contemplated in the Harvest Purchase Agreement;
|
| ·
| | the “Harvest Commitment Letter,” we are referring to the amended and rested commitment letter we entered into on September 21, 2018 (as amended from time to time) with Royal Bank of Canada and Barclays Bank PLC;
|
| ·
| | the “Harvest Purchase Agreement,” we are referring to the purchase agreement entered into on September 21, 2018 between the Company, Harvest, the members of Harvest listed on Annex A thereto (collectively the “Members”), Curtis Brockelman, Jr. and LPC Harvest, LP, each solely in their joint capacity as Members’ Representative, to purchase 100% of the outstanding equity interests of Harvest;
|
| ·
| | the “Harvest Termination Agreement,” we are referring to the termination agreement entered into on April 22, 2019 between the Company, Harvest, the Members, Curtis Brockelman, Jr. and LPC Harvest, LP, each solely in their joint capacity as Members’ Representative, to terminate the Harvest Purchase Agreement and abandon the Harvest Acquisition contemplated therein effective April 22, 2019;
|
| ·
| | “IPO,” we are referring to the initial public offering of Class A common stock of Victory Capital Holdings, Inc.;
|
| ·
| | “Members” has the meaning set forth in the definition of “Harvest Purchase Agreement”;
|
| ·
| | “Munder,” we are referring to our Munder Capital Management Franchise;
|
| ·
| | the “Munder Acquisition,” we are referring to our acquisition of Munder Capital in 2014;
|
| ·
| | “Munder Capital,” we are referring to Munder Capital Management;
|
| ·
| | the “RS Acquisition,” we are referring to our acquisition of RS Investments in 2016;
|
| ·
| | “RS Investments,” we are referring to RS Investment Management Co. LLC;
|
| ·
| | “Reverence Capital,” we are referring to Reverence Capital Partners, LP;
|
| ·
| | the “USAA AMCO Acquisition,” we are referring to the pending acquisition of USAA Asset Management Company and its mutual fund and ETF businesses and USAA 529 College Savings Plan and USAA Transfer Agency Company d/b/a USAA Shareholder Account Services pursuant to the USAA Stock Purchase Agreement;
|
| ·
| | the “USAA AMCO Credit Facilities Commitment Letter,” we are referring to the commitment letter we entered into on November 6, 2018 (as amended from time to time) with Barclays Bank PLC and Royal Bank of Canada;
|
| ·
| | the “USAA Stock Purchase Agreement,” we are referring to the stock purchase agreement entered into on November 6, 2018 between the Company, USAA Investment Corporation, and, for certain limited purposes, USAA Capital Corporation, and its mutual fund and ETF businesses and USAA 529 College Savings Plan to purchase 100% of the outstanding common stock of USAA Asset Management Company and USAA Transfer Agency Company d/b/a USAA Shareholder Account Services (each a “USAA Acquired Company” and collectively, the “USAA Acquired Companies”);
|
| ·
| | “VCA,” we are referring to Victory Capital Advisers, Inc., our broker‑dealer subsidiary registered with the Securities and Exchange Commission;
|
| ·
| | “VCM,” we are referring to Victory Capital Management Inc., our wholly owned registered investment adviser;
|
| ·
| | “Victory,” the “Company,” “we,” “our” or “us,” we are referring to Victory Capital Holdings, Inc. and its consolidated subsidiaries, except where otherwise stated or where it is clear that the term means only Victory Capital Holdings, Inc. exclusive of its subsidiaries;
|
| ·
| | the “Victory Funds,” we are referring to the Victory Portfolios, Victory Variable Insurance Funds, Victory Institutional Funds and the mutual fund series of Victory Portfolio II, a family of open-end mutual funds; and
|
| ·
| | “VictoryShares,” we are referring to Victory’s ETF brand.
|
Forward‑Looking Statements
This report includes forward-looking statements, including in the sections entitled “Risk Factors,” “Management’s Discussion and Analysis of Financial Condition and Results of Operations” and “Business”.“Business.” These forward‑looking statements include, without limitation, statements regarding our industry, business strategy, plans, goals and expectations concerning our market position, future operations, margins, profitability, future efficiencies, capital expenditures, liquidity and capital resources and other financial and operating information. When used in this discussion, the words “may,” “believes,” “intends,” “seeks,” “anticipates,” “plans,” “estimates,” “expects,” “should,” “assumes,” “continues,” “could,” “will,” “future” and the negative of these or similar terms and phrases are intended to identify forward‑looking statements in this report.
Forward‑looking statements reflect our current expectations regarding future events, results or outcomes. These expectations may or may not be realized. Although we believe the expectations reflected in the forward‑looking statements are reasonable, we can give no assurance that these expectations will prove to have been correct. Some of these expectations may be based upon assumptions, data or judgments that prove to be incorrect. Actual events, results and outcomes may differ materially from our expectations due to a variety of known and unknown risks, uncertainties and other factors. Although it is not possible to identify all of these risks and factors, they include, among others, the following:
| ·
| | reductions in AUM based on investment performance, client withdrawals, difficult market conditions and other factors;
|
| ·
| | following; reductions in assets under management (“AUM”) based on investment performance, client withdrawals, difficult market conditions and other factors such as a pandemic; the nature of our contracts and investment advisory agreements; |
| ·
| | our ability to maintain historical returns and sustain our historical growth;
|
| ·
| | our dependence on third parties to market our strategies and provide products or services for the operation of our business;
|
| ·
| | our ability to retain key investment professionals or members of our senior management team;
|
| ·
| | our reliance on the technology systems supporting our operations;
|
| ·
| | our ability to successfully acquire and integrate new companies;
|
| ·
| | the concentration of our investments in long only small‑ and mid‑cap equity and U.S. clients;
|
| ·
| | risks and uncertainties associated with non‑U.S. investments;
|
| ·
| | our efforts to establish and develop new teams and strategies;
|
| ·
| | the ability of our investment teams to identify appropriate investment opportunities;
|
Table of Contentsour contracts and investment advisory agreements; our ability to maintain historical returns and sustain our historical growth; our dependence on third parties to market our strategies and provide products or services for the operation of our business; our ability to retain key investment professionals or members of our senior management team; our reliance on the technology systems supporting our operations; our ability to successfully acquire and integrate new companies; the concentration of our investments in long only small‑ and mid‑cap equity and U.S. clients; risks and uncertainties associated with non‑U.S. investments; our efforts to establish and develop new teams and strategies; the ability of our investment teams to identify appropriate investment opportunities; our ability to limit employee misconduct; our ability to meet the guidelines set by our clients; our exposure to potential litigation (including administrative or tax proceedings) or regulatory actions; our ability to implement effective information and cyber security policies, procedures and capabilities; our substantial indebtedness; the potential impairment of our goodwill and intangible assets; disruption to the operations of third parties whose functions are integral to our exchange traded fund (“ETF”) platform; our determination that we are not required to register as an “investment company” under the 1940 Act; the fluctuation of our expenses; our ability to respond to recent trends in the investment management industry; the level of regulation on investment management firms and our ability to respond to regulatory developments; the competitiveness of the investment management industry; the dual class structure of our common stock; the level of control over us retained by Crestview Partners II GP, L.P. (“Crestview GP”); our status as an emerging growth company and a controlled company; our ability to integrate the USAA Asset Management Company (“USAA Adviser”) and the Victory Capital Transfer Agency, Inc. (“VCTA”), formally known as the USAA Transfer Agency Company d/b/a USAA Shareholder Account Services (together with USAA Adviser, the “USAA Acquired Companies”); and other risks and factors included, but not limited to, those listed under the caption “Risk Factors” in Item 1A of the Company’s Annual Report on Form 10-K for the fiscal year ended December 31, 2019, filed with the Securities and Exchange Commission (the “SEC”) on March 13, 2020, which is accessible on the SEC’s website at www.sec.gov.
| ·
| | our ability to limit employee misconduct;
|
| ·
| | our ability to meet the guidelines set by our clients;
|
| ·
| | our exposure to potential litigation (including administrative or tax proceedings) or regulatory actions;
|
| ·
| | our ability to implement effective information and cyber security policies, procedures and capabilities;
|
| ·
| | our substantial indebtedness;
|
| ·
| | the potential impairment of our goodwill and intangible assets;
|
| ·
| | disruption to the operations of third parties whose functions are integral to our ETF platform;
|
| ·
| | our determination that we are not required to register as an “investment company” under the 1940 Act;
|
| ·
| | the fluctuation of our expenses;
|
| ·
| | our ability to respond to recent trends in the investment management industry;
|
| ·
| | the level of regulation on investment management firms and our ability to respond to regulatory developments;
|
| ·
| | the competitiveness of the investment management industry;
|
| ·
| | the dual class structure of our common stock;
|
| ·
| | the level of control over us retained by Crestview GP;
|
| ·
| | our status as an emerging growth company and a controlled company;
|
| ·
| | our ability to close and integrate the USAA AMCO Acquisition; and
|
| ·
| | other risks and factors included, but not limited to, those described in Part II, “Item 1A. Risk Factors,” and those listed under the caption “Risk Factors” in Item 1A of the Company’s Annual Report on Form 10-K for the fiscal year ended December 31, 2018, filed with the Securities and Exchange Commission “(SEC”) on March 15, 2019, which is accessible on the SEC’s website at www.sec.gov.
|
In light of these risks, uncertainties and other factors, the forward‑looking statements contained in this report might not prove to be accurate. All forward‑looking statements speak only as of the date made and we undertake no obligation to update or revise publicly any forward‑looking statements, whether as a result of new information, future events or otherwise.
PART I—FINANCIAL INFORMATION
Item 1.Financial Statements
Victory Capital Holdings, Inc. and Subsidiaries
Unaudited Condensed Consolidated Balance Sheets
(in thousands, except for shares)
| | | | | | |
| | March 31, 2019 | | December 31, 2018 |
Assets | | | | | | |
Cash and cash equivalents | | $ | 66,261 | | $ | 51,491 |
Receivables | | | 42,783 | | | 44,120 |
Prepaid expenses | | | 3,832 | | | 2,664 |
Investments | | | 15,742 | | | 13,320 |
Property and equipment, net | | | 8,874 | | | 8,780 |
Goodwill | | | 284,108 | | | 284,108 |
Other intangible assets, net | | | 383,029 | | | 387,679 |
Other assets | | | 9,299 | | | 9,349 |
Total assets | | $ | 813,928 | | $ | 801,511 |
| | | | | | |
Liabilities and stockholders' equity | | | | | | |
Accounts payable and accrued expenses | | $ | 24,410 | | $ | 20,350 |
Accrued compensation and benefits | | | 19,901 | | | 30,228 |
Consideration payable for acquisition of business | | | 5,921 | | | 5,838 |
Deferred tax liability, net | | | 7,575 | | | 6,212 |
Other liabilities | | | 16,636 | | | 14,478 |
Long-term debt | | | 269,320 | | | 268,857 |
Total liabilities | | | 343,763 | | | 345,963 |
| | | | | | |
Stockholders' equity | | | | | | |
Class A common stock, $0.01 par value per share: 2019 - 400,000,000 shares authorized, 15,663,474 shares issued and 14,684,242 shares outstanding; 2018 - 400,000,000 shares authorized, 15,280,833 shares issued and 14,424,558 shares outstanding | | | 157 | | | 153 |
Class B common stock, $0.01 par value per share: 2019 - 200,000,000 shares authorized, 55,014,007 shares issued and 52,837,919 shares outstanding; 2018 - 200,000,000 shares authorized, 55,284,408 shares issued and 53,137,428 shares outstanding | | | 550 | | | 553 |
Additional paid-in capital | | | 606,181 | | | 604,401 |
Class A treasury stock, at cost: 2019 - 979,232 shares; 2018 - 856,275 shares | | | (9,389) | | | (8,045) |
Class B treasury stock, at cost: 2019 - 2,176,088 shares; 2018 - 2,146,980 shares | | | (22,037) | | | (21,719) |
Accumulated other comprehensive income (loss) | | | (12) | | | (86) |
Retained deficit | | | (105,285) | | | (119,709) |
Total stockholders' equity | | | 470,165 | | | 455,548 |
Total liabilities and stockholders' equity | | $ | 813,928 | | $ | 801,511 |
The accompanying notes are an integral part of the unaudited condensed consolidated financial statements.
Victory Capital Holdings, Inc. and Subsidiaries
Unaudited Condensed Consolidated Statements of OperationsBalance Sheets (Unaudited)
(inIn thousands, except for shares)shares data)
| | | | | | | |
| | Three Months Ended March 31, | |
| | 2019 | | 2018 | |
Revenue | | | | | | | |
Investment management fees | | $ | 74,411 | | $ | 89,130 | |
Fund administration and distribution fees | | | 13,068 | | | 15,834 | |
Total revenue | | | 87,479 | | | 104,964 | |
| | | | | | | |
Expenses | | | | | | | |
Personnel compensation and benefits | | | 34,501 | | | 36,803 | |
Distribution and other asset-based expenses | | | 15,767 | | | 25,161 | |
General and administrative | | | 7,087 | | | 9,056 | |
Depreciation and amortization | | | 5,222 | | | 6,412 | |
Acquisition-related costs | | | 2,777 | | | — | |
Restructuring and integration costs | | | — | | | 264 | |
Total operating expenses | | | 65,354 | | | 77,696 | |
| | | | | | | |
Income from operations | | | 22,125 | | | 27,268 | |
| | | | | | | |
Other income (expense) | | | | | | | |
Interest income and other income/(expense) | | | 1,833 | | | (37) | |
Interest expense and other financing costs | | | (4,624) | | | (7,092) | |
Loss on debt extinguishment | | | — | | | (6,058) | |
Total other income (expense), net | | | (2,791) | | | (13,187) | |
| | | | | | | |
Income before income taxes | | | 19,334 | | | 14,081 | |
| | | | | | | |
Income tax expense | | | (4,807) | | | (3,557) | |
| | | | | | | |
Net income | | $ | 14,527 | | $ | 10,524 | |
| | | | | | | |
Earnings per share of common stock | | | | | | | |
Basic | | $ | 0.22 | | $ | 0.17 | |
Diluted | | $ | 0.20 | | $ | 0.16 | |
| | | | | | | |
Weighted average number of shares outstanding | | | | | | | |
Basic | | | 67,520,883 | | | 61,599,057 | |
Diluted | | | 72,281,878 | | | 66,283,621 | |
| | | | | | | |
Dividends declared per share of common stock | | $ | — | | $ | — | |
| | March 31, 2020 | | | December 31, 2019 | |
Assets | | | | | | | | |
Cash and cash equivalents | | $ | 37,130 | | | $ | 37,121 | |
Receivables | | | 77,610 | | | | 95,093 | |
Prepaid expenses | | | 6,709 | | | | 4,852 | |
Investments | | | 15,631 | | | | 19,076 | |
Property and equipment, net | | | 14,028 | | | | 13,240 | |
Goodwill | | | 404,750 | | | | 404,750 | |
Other intangible assets, net | | | 1,172,305 | | | | 1,175,471 | |
Other assets | | | 3,600 | | | | 3,706 | |
Total assets | | $ | 1,731,763 | | | $ | 1,753,309 | |
| | | | | | | | |
Liabilities and stockholders' equity | | | | | | | | |
Accounts payable and accrued expenses | | $ | 79,111 | | | $ | 89,203 | |
Accrued compensation and benefits | | | 33,544 | | | | 54,842 | |
Consideration payable for acquisition of business | | | 113,200 | | | | 118,700 | |
Deferred tax liability, net | | | 11,134 | | | | 5,486 | |
Other liabilities | | | 25,047 | | | | 22,668 | |
Long-term debt, net | | | 888,647 | | | | 924,539 | |
Total liabilities | | | 1,150,683 | | | | 1,215,438 | |
| | | | | | | | |
Stockholders' equity | | | | | | | | |
Class A common stock, $0.01 par value per share: 2020 - 400,000,000 shares authorized, 18,508,087 shares issued and 16,582,902 shares outstanding; 2019 - 400,000,000 shares authorized, 18,099,772 shares issued and 16,414,617 shares outstanding | | | 185 | | | | 181 | |
Class B common stock, $0.01 par value per share: 2020 - 200,000,000 shares authorized, 54,537,895 shares issued and 51,436,953 shares outstanding; 2019 - 200,000,000 shares authorized, 53,937,394 shares issued and 51,281,512 shares outstanding | | | 545 | | | | 539 | |
Additional paid-in capital | | | 632,468 | | | | 624,766 | |
Class A treasury stock, at cost: 2020 - 1,925,185 shares; 2019 - 1,685,155 shares | | | (25,918 | ) | | | (21,524 | ) |
Class B treasury stock, at cost: 2020 - 3,100,942 shares; 2019 - 2,655,882 shares | | | (40,173 | ) | | | (31,386 | ) |
Accumulated other comprehensive loss | | | (4,887 | ) | | | — | |
Retained earnings (deficit) | | | 18,860 | | | | (34,705 | ) |
Total stockholders' equity | | | 581,080 | | | | 537,871 | |
Total liabilities and stockholders' equity | | $ | 1,731,763 | | | $ | 1,753,309 | |
TheSee the accompanying notes are an integral part ofto the unaudited condensed consolidated financial statements.
3
Victory Capital Holdings, Inc. and Subsidiaries
Unaudited Condensed Consolidated Statements of Comprehensive IncomeOperations (Unaudited)
(in thousands)In thousands, except per share data)
| | | | | | | |
| | Three Months Ended March 31, | |
| | 2019 | | 2018 | |
Net income | | $ | 14,527 | | $ | 10,524 | |
| | | | | | | |
Other comprehensive income (loss), net of tax | | | | | | | |
Net unrealized income on available-for-sale securities | | | — | | | 5 | |
Net unrealized gain (loss) on foreign currency translation | | | 12 | | | 29 | |
Total other comprehensive income (loss), net of tax | | | 12 | | | 34 | |
| | | | | | | |
Comprehensive income | | $ | 14,539 | | $ | 10,558 | |
| | Three Months Ended March 31, | |
| | 2020 | | | 2019 | |
Revenue | | | | | | | | |
Investment management fees | | $ | 146,881 | | | $ | 74,411 | |
Fund administration and distribution fees | | | 57,540 | | | | 13,068 | |
Total revenue | | | 204,421 | | | | 87,479 | |
| | | | | | | | |
Expenses | | | | | | | | |
Personnel compensation and benefits | | | 47,571 | | | | 34,501 | |
Distribution and other asset-based expenses | | | 54,860 | | | | 15,767 | |
General and administrative | | | 11,888 | | | | 7,087 | |
Depreciation and amortization | | | 4,050 | | | | 5,222 | |
Change in value of consideration payable for acquisition of business | | | (5,500 | ) | | | — | |
Acquisition-related costs | | | (69 | ) | | | 2,777 | |
Restructuring and integration costs | | | 998 | | | | — | |
Total operating expenses | | | 113,798 | | | | 65,354 | |
| | | | | | | | |
Income from operations | | | 90,623 | | | | 22,125 | |
| | | | | | | | |
Other (expense) income | | | | | | | | |
Interest income and other (expense) income | | | (4,172 | ) | | | 1,833 | |
Interest expense and other financing costs | | | (11,408 | ) | | | (4,624 | ) |
Loss on debt extinguishment | | | (1,054 | ) | | | — | |
Total other expense, net | | | (16,634 | ) | | | (2,791 | ) |
| | | | | | | | |
Income before income taxes | | | 73,989 | | | | 19,334 | |
| | | | | | | | |
Income tax expense | | | (16,823 | ) | | | (4,807 | ) |
| | | | | | | | |
Net income | | $ | 57,166 | | | $ | 14,527 | |
| | | | | | | | |
Earnings per share of common stock | | | | | | | | |
Basic | | $ | 0.84 | | | $ | 0.22 | |
Diluted | | $ | 0.77 | | | $ | 0.20 | |
| | | | | | | | |
Weighted average number of shares outstanding | | | | | | | | |
Basic | | | 67,790 | | | | 67,521 | |
Diluted | | | 74,350 | | | | 72,282 | |
| | | | | | | | |
Dividends declared per share of common stock | | $ | 0.05 | | | $ | — | |
TheSee the accompanying notes are an integral part ofto the unaudited condensed consolidated financial statements.
4
Victory Capital Holdings, Inc. and Subsidiaries
Unaudited
Condensed Consolidated Statements of Comprehensive Income (Unaudited)
(In thousands)
| | Three Months Ended March 31, | |
| | 2020 | | | 2019 | |
Net income | | $ | 57,166 | | | $ | 14,527 | |
| | | | | | | | |
Other comprehensive (loss) income, net of tax | | | | | | | | |
Net unrealized loss on cash flow hedges | | | (4,820 | ) | | | — | |
Net unrealized (loss) income on foreign currency translation | | | (67 | ) | | | 12 | |
Total other comprehensive (loss) income, net of tax | | | (4,887 | ) | | | 12 | |
| | | | | | | | |
Comprehensive income | | $ | 52,279 | | | $ | 14,539 | |
See the accompanying notes to the unaudited condensed consolidated financial statements.
5
Table of Contents
Victory Capital Holdings, Inc. and Subsidiaries
Condensed Consolidated Statements of Changes in Stockholders’ Equity
(in thousands, except for shares)In thousands)
| | | | | | | | | | | | | | | | | | | | | | | | | | | | | | | | | | | | | | | | | | | | | | | | Accumulated | | | | | | | | | |
| | | | | | | | | | | | | | | | | | | Accumulated | | | | | | | | | | | | | | | | | | | | | | | | Additional | | | Other | | | Retained | | | | | |
| | | | | | | | | | | | | | | | Additional | | Other | | | | | | | | Common Stock | | | Treasury Stock | | | Paid-In | | | Comprehensive | | | (Deficit) | | | | | |
| | Common Stock | | | | Treasury Stock | | | | Paid-In | | Comprehensive | | Retained | | | | | Class A | | | Class B | | | Class A | | | Class B | | | Capital | | | Loss | | | Earnings | | | Total | |
| | Class A | Class B | | | Class A | Class B | | | Capital | | Income (Loss) | | Deficit | | Total | |
Balance, December 31, 2018 | | $ | 153 | $ | 553 | | | | $ | (8,045) | $ | (21,719) | | | | $ | 604,401 | | $ | (86) | | $ | (119,709) | | $ | 455,548 | |
Balance, December 31, 2019 | | | $ | 181 | | | $ | 539 | | | $ | (21,524 | ) | | $ | (31,386 | ) | | $ | 624,766 | | | $ | — | | | $ | (34,705 | ) | | $ | 537,871 | |
Issuance of common stock | | | — | | — | | | | | — | | — | | | | | 13 | | | — | | | — | | | 13 | | | — | | | | — | | | | — | | | | — | | | | 26 | | | | — | | | | — | | | | 26 | |
Share conversion - Class B to A | | | 4 | | (4) | | | | | — | | — | | | | | — | | | — | | | — | | | — | | | 4 | | | | (4 | ) | | | — | | | | — | | | | — | | | | — | | | | — | | | | — | |
Repurchase of shares | | | — | | — | | | | | (1,344) | | — | | | | | — | | | — | | | — | | | (1,344) | | | — | | | | — | | | | (4,394 | ) | | | — | | | | — | | | | — | | | | — | | | | (4,394 | ) |
Shares withheld related to net settlement of equity awards | | | — | | — | | | | | — | | (318) | | �� | | | — | | | — | | | — | | | (318) | | | — | | | | — | | | | — | | | | (8,787 | ) | | | — | | | | — | | | | — | | | | (8,787 | ) |
Vesting of restricted share grants | | | — | | — | | | | | — | | — | | | | | — | | | — | | | — | | | — | | | — | | | | 7 | | | | — | | | | — | | | | (7 | ) | | | — | | | | — | | | | — | |
Exercise of options | | | — | | 1 | | | | | — | | — | | | | | 220 | | | — | | | — | | | 221 | | | — | | | | 3 | | | | — | | | | — | | | | 1,690 | | | | — | | | | — | | | | 1,693 | |
Cumulative effect of adoption of ASU 2016-01 and 2018-02 | | | — | | — | | | | | — | | — | | | | | — | | | 62 | | | (62) | | | — | |
Other comprehensive income/(loss) | | | — | | — | | | | | — | | — | | | | | — | | | 12 | | | — | | | 12 | |
Other comprehensive loss | | | | — | | | | — | | | | — | | | | — | | | | — | | | | (4,887 | ) | | | — | | | | (4,887 | ) |
Share-based compensation | | | — | | — | | | | | — | | — | | | | | 1,547 | | | — | | | — | | | 1,547 | | | — | | | | — | | | | — | | | | — | | | | 5,993 | | | | — | | | | — | | | | 5,993 | |
Dividends paid | | | — | | — | | | | | — | | — | | | | | — | | | — | | | (41) | | | (41) | | | — | | | | — | | | | — | | | | — | | | | — | | | | — | | | | (3,601 | ) | | | (3,601 | ) |
Net income | | | — | | — | | | | | — | | — | | | | | — | | | — | | | 14,527 | | | 14,527 | | | — | | | | — | | | | — | | | | — | | | | — | | | | — | | | | 57,166 | | | | 57,166 | |
Balance, March 31, 2019 | | $ | 157 | $ | 550 | | | | $ | (9,389) | $ | (22,037) | | | | $ | 606,181 | | $ | (12) | | $ | (105,285) | | $ | 470,165 | |
| | | | | | | | | | | | | | | | | | | | | | | | | | | |
| | | | | | | | | | | | | | | | | | | Accumulated | | | | | | | |
| | | | | | | | | | | | | | | | Additional | | Other | | | | | | | |
| | Common Stock | | Treasury Stock | | Paid-In | | Comprehensive | | Retained | | | | |
| | Class A | Class B | Pre-IPO | | Class A | Class B | Pre-IPO | | Capital | | Income (Loss) | | Deficit | | Total | |
Balance, December 31, 2017 | | $ | — | $ | — | $ | 572 | | $ | — | $ | — | $ | (20,899) | | $ | 435,334 | | $ | 64 | | $ | (183,888) | | $ | 231,183 | |
Issuance of Class A common stock, net of underwriter discount | | | 128 | | — | | — | | | — | | — | | — | | | 156,421 | | | — | | | — | | | 156,549 | |
Class A common stock offering costs | | | — | | — | | — | | | — | | — | | — | | | (4,561) | | | — | | | — | | | (4,561) | |
Redesignation of common stock | | | — | | 572 | | (572) | | | — | | — | | — | | | — | | | — | | | — | | | — | |
Share conversion - Class B to A | | | 1 | | (1) | | — | | | — | | — | | — | | | — | | | — | | | — | | | — | |
Vesting of restricted share grants | | | — | | — | | — | | | — | | — | | — | | | — | | | — | | | — | | | — | |
Exercise of options | | | — | | — | | — | | | — | | — | | — | | | 12 | | | — | | | — | | | 12 | |
Fractional shares retired | | | — | | — | | — | | | — | | — | | — | | | (2) | | | — | | | — | | | (2) | |
Cumulative effect of adoption of ASU 2016-09 | | | — | | — | | — | | | — | | — | | — | | | 512 | | | — | | | 1,306 | | | 1,818 | |
Other comprehensive income/(loss) | | | — | | — | | — | | | — | | — | | — | | | — | | | 34 | | | — | | | 34 | |
Share-based compensation | | | — | | — | | — | | | — | | — | | — | | | 3,322 | | | — | | | — | | | 3,322 | |
Dividends paid | | | — | | — | | — | | | — | | — | | — | | | — | | | — | | | (53) | | | (53) | |
Net income | | | — | | — | | — | | | — | | — | | — | | | — | | | — | | | 10,524 | | | 10,524 | |
Balance, March 31, 2018 | | $ | 129 | $ | 571 | $ | — | | $ | — | $ | — | $ | (20,899) | | $ | 591,038 | | $ | 98 | | $ | (172,111) | | $ | 398,826 | |
Balance, March 31, 2020 | | | $ | 185 | | | $ | 545 | | | $ | (25,918 | ) | | $ | (40,173 | ) | | $ | 632,468 | | | $ | (4,887 | ) | | $ | 18,860 | | | $ | 581,080 | |
The
| | | | | | | | | | | | | | | | | | | | | | Accumulated | | | | | | | | | |
| | | | | | | | | | | | | | | | | | Additional | | | Other | | | | | | | | | |
| | Common Stock | | | Treasury Stock | | | Paid-In | | | Comprehensive | | | Retained | | | | | |
| | Class A | | | Class B | | | Class A | | | Class B | | | Capital | | | (Loss) Income | | | Deficit | | | Total | |
Balance, December 31, 2018 | | $ | 153 | | | $ | 553 | | | $ | (8,045 | ) | | $ | (21,719 | ) | | $ | 604,401 | | | $ | (86 | ) | | $ | (119,709 | ) | | $ | 455,548 | |
Issuance of common stock | | | — | | | | — | | | | — | | | | — | | | | 13 | | | | — | | | | — | | | | 13 | |
Share conversion - Class B to A | | | 4 | | | | (4 | ) | | | — | | | | — | | | | — | | | | — | | | | — | | | | — | |
Repurchase of shares | | | — | | | | — | | | | (1,344 | ) | | | — | | | | — | | | | — | | | | — | | | | (1,344 | ) |
Shares withheld related to net settlement of equity awards | | | — | | | | — | | | | — | | | | (318 | ) | | | — | | | | — | | | | — | | | | (318 | ) |
Exercise of options | | | — | | | | 1 | | | | — | | | | — | | | | 220 | | | | — | | | | — | | | | 221 | |
Cumulative effect of adoption of ASU 2016-01 and 2018-02 | | | — | | | | — | | | | — | | | | — | | | | — | | | | 62 | | | | (62 | ) | | | — | |
Other comprehensive income/(loss) | | | — | | | | — | | | | — | | | | — | | | | — | | | | 12 | | | | — | | | | 12 | |
Share-based compensation | | | — | | | | — | | | | — | | | | — | | | | 1,547 | | | | — | | | | — | | | | 1,547 | |
Dividends paid | | | — | | | | — | | | | — | | | | — | | | | — | | | | — | | | | (41 | ) | | | (41 | ) |
Net income | | | — | | | | — | | | | — | | | | — | | | | — | | | | — | | | | 14,527 | | | | 14,527 | |
Balance, March 31, 2019 | | $ | 157 | | | $ | 550 | | | $ | (9,389 | ) | | $ | (22,037 | ) | | $ | 606,181 | | | $ | (12 | ) | | $ | (105,285 | ) | | $ | 470,165 | |
See the accompanying notes are an integral part ofto the unaudited condensed consolidated financial statements.
6
Victory Capital Holdings, Inc. and Subsidiaries
Unaudited
Condensed Consolidated Statements of Cash Flows
(inIn thousands)
| | | | | | | | |
| | Three Months Ended March 31, | | | Three Months Ended March 31, | |
| | 2019 | | 2018 | | | 2020 | | | 2019 | |
Cash flows from operating activities | | | | | | | | | | | | | | | |
Net income | | $ | 14,527 | | $ | 10,524 | | | $ | 57,166 | | | $ | 14,527 | |
Adjustments to reconcile net income to net cash provided by operating activities: | | | | | | | | | | | | | | | |
Provision for deferred income taxes | | | 1,360 | | | 3,361 | | | | 7,182 | | | | 1,360 | |
Depreciation and amortization | | | 5,222 | | | 6,412 | | | | 4,050 | | | | 5,222 | |
Deferred financing costs and derivative and accretion expense | | | 593 | | | 995 | | | | 1,174 | | | | 593 | |
Stock-based and deferred compensation | | | 3,924 | | | 4,253 | | | | 2,772 | | | | 3,924 | |
Change in fair value of contingent consideration obligations | | | | (5,500 | ) | | | — | |
Unrealized depreciation (appreciation) on investments | | | (1,458) | | | 124 | | | | 4,971 | | | | (1,458 | ) |
Loss on equity method investment | | | 4 | | | 137 | | | | — | | | | 4 | |
Loss on debt extinguishment | | | — | | | 6,058 | | | | 1,054 | | | | — | |
Changes in operating assets and liabilities: | | | | | | | | | | | | | | | |
Receivables | | | (327) | | | 1,104 | | | | 16,439 | | | | (327 | ) |
Prepaid expenses | | | (1,181) | | | (1,545) | | | | (1,857 | ) | | | (1,181 | ) |
Other assets | | | — | | | 425 | | | | (18 | ) | | | — | |
Accounts payable and accrued expenses | | | 5,685 | | | 2,166 | | | | (11,760 | ) | | | 5,685 | |
Accrued compensation and benefits | | | (10,331) | | | (8,280) | | | | (23,990 | ) | | | (10,331 | ) |
Other liabilities | | | (80) | | | 138 | | | | 239 | | | | (80 | ) |
Net cash provided by operating activities | | | 17,938 | | | 25,872 | | | | 51,922 | | | | 17,938 | |
| | | | | | | | | | | | | | | |
Cash flows from investing activities | | | | | | | | | | | | | | | |
Purchases of property and equipment | | | (484) | | | (703) | | | | (708 | ) | | | (484 | ) |
Purchases of trading securities | | | (1,533) | | | (1,464) | | | | (2,617 | ) | | | (1,533 | ) |
Sales of trading securities | | | 570 | | | 448 | | | | 1,091 | | | | 570 | |
Equity method investment | | | — | | | (1,000) | | |
Net cash used in investing activities | | | (1,447) | | | (2,719) | | | | (2,234 | ) | | | (1,447 | ) |
| | | | | | | | | | | | | | | |
Cash flows from financing activities | | | | | | | | | | | | | | | |
Issuance of Class A common stock, net of underwriter discount | | | 13 | | | 156,549 | | | | 26 | | | | 13 | |
Payment of Class A common stock deferred offering costs | | | — | | | (438) | | |
Issuance of Class B common stock from exercise of stock options | | | 221 | | | 10 | | | | 1,693 | | | | 221 | |
Repurchase of common stock | | | (1,643) | | | — | | | | (6,020 | ) | | | (1,643 | ) |
Payments of taxes related to net share settlement of equity awards | | | (196) | | | — | | | | (4,431 | ) | | | (196 | ) |
Proceeds from long-term senior debt | | | — | | | 359,100 | | |
Payment of debt financing fees | | | — | | | (2,091) | | |
Repayment of long-term senior debt | | | — | | | (536,750) | | | | (38,000 | ) | | | — | |
Repayment of promissory note | | | (96) | | | (144) | | | | — | | | | (96 | ) |
Payment of dividends | | | (41) | | | (53) | | | | (3,490 | ) | | | (41 | ) |
Receipt of consideration for acquisition | | | | 649 | | | | — | |
Net cash used in financing activities | | | (1,742) | | | (23,817) | | | | (49,573 | ) | | | (1,742 | ) |
| | | | | | | | | | | | | | | |
Effect of changes of foreign exchange rate on cash and cash equivalents | | | 21 | | | 39 | | | | (106 | ) | | | 21 | |
| | | | | | | | | | | | | | | |
Net increase (decrease) in cash and cash equivalents | | | 14,770 | | | (625) | | |
Net increase in cash and cash equivalents | | | | 9 | | | | 14,770 | |
Cash and cash equivalents, beginning of period | | | 51,491 | | | 12,921 | | | | 37,121 | | | | 51,491 | |
Cash and cash equivalents, end of period | | $ | 66,261 | | $ | 12,296 | | | $ | 37,130 | | | $ | 66,261 | |
| | | | | | | | | | | | | | | |
Supplemental cash flow information | | | | | | | | | | | | | | | |
Cash paid for interest | | $ | 3,801 | | $ | 6,163 | | | $ | 20,112 | | | $ | 3,801 | |
Cash paid for income taxes | | | 343 | | | — | | | | 1,345 | | | | 343 | |
Supplemental disclosure of non-cash item | | | | | | | | |
Class A common stock offering costs reclassed from prepaid expenses and accounts payable and accrued expenses to additional paid in capital | | | — | | | 4,123 | | |
TheSee the accompanying notes are an integral part ofto the unaudited condensed consolidated financial statements.
7
Victory Capital Holdings, Inc. and Subsidiaries
Notes to Unaudited Condensed Consolidated Financial Statements(Unaudited)
March 31, 2019
Note 1. Organization and Nature of BusinessORGANIZATION AND NATURE OF BUSINESS
Victory Capital Holdings, Inc., a Delaware corporation (along with its wholly-owned subsidiaries, collectively referred to as “the Company”the “Company,” “Victory,” or in the first-person notations of “we,” “us,” and “our”) was formed on February 13, 2013 for the purpose of acquiring Victory Capital Management Inc. (“VCM”) and Victory Capital Advisers, Inc. (“VCA”), which occurred on August 1, 2013. On February 12, 2018, the Company completed the initial public offering (the “IPO”) of its Class A common stock, which trades on the NASDAQ under the symbol “VCTR.”
On and effective July 1, 2019, the Company completed the acquisition (the “USAA AMCO Acquisition”) of USAA Adviser and VCTA, formerly known as the USAA Transfer Agency Company d/b/a USAA Shareholder Account Services. The USAA AMCO Acquisition includes USAA’s mutual fund and ETF businesses and its 529 College Savings Plan (collectively, the “USAA Mutual Fund Business”). Refer to Note 4, Acquisitions, for further details on the acquisition.
VCM is a registered investment adviser managing assets through open-end mutual funds, separately managed accounts, unified management accounts, ETFs, collective trust funds, wrap separate account programs and UCITs.Undertakings Collective Investment in Transferable Securities (“UCITs”). VCM also provides mutual fund administrative services for the Victory Portfolios, Victory Variable Insurance Funds, Victory Institutional Funds and the mutual fund series of the Victory Portfolios II (collectively, “the Victorythe “Victory Funds”), a family of open-end mutual funds, and the VictoryShares (the Company’s ETF brand), as well as the USAA Mutual Fund Business, which includes the USAA Mutual Fund Trust, a family of open-end mutual funds (the “USAA Funds”). Additionally, VCM additionally employs all of the Company’s U.S.United States investment professionals across its Franchises and Solutions, which are not separate legal entities. Effective on or about June 30, 2020, Victory Capital Advisers, Inc. is changing its name to Victory Capital Services, Inc. VCA is registered with the SEC as an introducing broker-dealer and serves as distributor and underwriter for the Victory Funds and USAA Funds. VCTA is registered with the SEC as a transfer agent for the USAA Funds.
On February 12, 2018, the Company completed the initial public offering (“IPO”) of its Class A common stock, which trades on the NASDAQ under the symbol “VCTR.”NOTE 2. BASIS OF PRESENTATION AND SIGNIFICANT ACCOUNTING POLICIES
2. Basis of Presentation and Significant Accounting Policies
The Company prepares its interim unaudited condensed consolidated financial statements on the accrual basis of accountinghave been prepared in accordance with accounting principles generally accepted in the United States of America (“GAAP”) and applicable rules and regulations of the SEC regarding interim financial reporting. Accordingly, they do not include all of the information and notes required by GAAP for complete annual financial statements. InAs such, the opinion of management, these financial statements contain all adjustments, consisting only of normal recurring adjustments, necessary for a fair statement of the Company’s financial condition and results of operations.
These unaudited condensed consolidated financial statementsinformation included in this quarterly report on Form 10-Q should be read in conjunction with the audited consolidated financial statements and notes thereto included in the Company’s Annual Report on Form 10-K for the year ended December 31, 2018 filed with2019.
In the SEC. A complete listingopinion of management, the Company’s significant accounting policies is included in the 2018 Annual Report on Form 10-K.
All dollar amounts, except per share data in the text and tables herein, are stated in thousands unless otherwise indicated.
Retroactive Adjustments for Common Stock Split
The Company’s Board of Directors and stockholders approved a 175.194 for 1 stock split of the Company’s common stock on February 1, 2018. All common share and common per share amounts in the unaudited condensed consolidated financial statements reflect all adjustments, consisting only of normal recurring adjustments, necessary for the fair presentation of the financial condition, results of operations, and notes thereto have been retroactively adjustedcash flows for allthe interim periods presented to give effect to this stock split. See Notes 10, 11 and 12.presented. Operating results for the three month period ended March 31, 2020 are not necessarily indicative of the results that may be expected for the year ending December 31, 2020.
Principles of Consolidation
The unaudited condensed consolidated financial statements include the accountsoperations of the Company and its wholly‑owned subsidiaries. Allwholly-owned subsidiaries, after elimination of all intercompany transactionsbalances and balances have been eliminated.
The Company evaluates entities in which it invests and investment funds that it sponsors to determine whether the Company has a controlling financial interest in these entities and is required to consolidate them. A controlling financial interest generally exists if 1) the Company holds greater than 50% voting interest in entities controlled through voting
interests or if 2) the Company has the ability to direct significant activities of a fund not controlled through voting interests (atransactions. Our involvement with non-consolidated variable interest entity or VIE) and the obligation to absorb losses of and/or the right to receive benefits from the VIE that could potentially be significant to the VIE.
The Company’s involvement with non‑consolidatedentities (“VIEs”) include sponsored investment funds that are considered VIEs include providing investment advisory services, fund administration and, distribution services and/or holding a minority interest. At March 31,in 2019, and December 31, 2018, the Company’s investments in and maximum risk of loss related to unconsolidated sponsored VIE investment funds totaled $15.3 million and $12.9 million respectively which are included in investments on the unaudited condensed consolidated balance sheets. The Company has not provided financial support to these entities outside the ordinary course of business, which includes assuming operating expenses of funds for competitive or contractual reasons through fee waivers and fund expense reimbursements. The Company does not consolidate the sponsored investment funds in which it had an equity investment as it holds a minority interest, does not direct significant activities of these funds and does not have the right to receive benefits nor the obligation to absorb losses that could potentially be significant to these funds.
During the period ended March 31, 2019, the Company’s involvement with other non‑consolidated VIEs included an equity method investment with Cerebellum Capital, LLC (“Cerebellum Capital”). The Company’s maximum risk of loss associated with Cerebellum Capital totaled $9.0 million at March 31, 2019 andinvestment.
For further discussion regarding VIEs, refer to Note 2, Significant Accounting Policies, in our Annual Report on Form 10-K for the year ended December 31, 2018. See Note 13.
The Company applies the equity method of accounting to investments where it does not hold a controlling equity interest but has the ability to exercise significant influence over operating and financial matters. In the event that management identifies an other than temporary decline in the estimated fair value of an equity method investment to an amount below its carrying value, the investment is written down to its estimated fair value.2019.
Use of Estimates and Assumptions
The preparation of the unaudited condensed consolidated financial statements in conformity with GAAP requires management to make estimates and assumptions that affect the reported amounts and disclosures in the financial statements.statements and the notes. Actual results may ultimately differ materially from those estimatesestimates.
On March 11, 2020, the World Health Organization declared the outbreak of COVID-19 a pandemic. The global spread of COVID-19 has created significant volatility, uncertainty, and economic disruption. COVID-19 did not have a material adverse effect on our reported results for our first quarter.
8
Table of Contents
New Accounting Pronouncements
Accounting Standards Adopted in 2020
| • | Derivatives and Hedging: Effective January 1, 2020, the Company early adopted Accounting Standards Update (“ASU”) 2017-12 (“ASU 2017-12”), Derivatives and Hedging (Topic 815) and ASU 2019-04, Codification Improvements to Topic 815, Derivatives and Hedging (“ASU 2019-04”). ASU 2017-12 improves and simplifies accounting rules for hedge accounting to better present the economic results of an entity’s risk management activities in its financial statements and improves the disclosures of hedging arrangements. Various provisions of ASU 2017-12 were subsequently clarified by the Financial Accounting Standards Board (“FASB”) in April 2019 through the issuance of ASU 2019-04. The Company did not have any existing hedging relationships at the time of adoption; therefore, the adoption of ASU 2017-12 and ASU 2019-04 had no impact on our consolidated financial statements. | |
On March 27, 2020, the Company entered into an interest rate swap transaction (the “Swap”) to manage interest rate risk associated with a portion of its floating-rate long term debt (notional amount of $450 million). The Swap was designated as a cash flow hedge and the differences may be material.initial prospective quantitative hedge effectiveness assessment was deemed highly effective. Under ASU 2017-12, the Company has the option to perform subsequent assessments of hedge effectiveness qualitatively. The Company has elected to assess the Swap’s hedge effectiveness qualitatively and will verify and document on a quarterly basis that facts and circumstances have not changed.
Recently Issued Accounting Standards
| • | Subsequent Measurement of Goodwill: In January 2017, the FASB issued ASU 2017-04, Intangibles – Goodwill and Other (Topic 350) (“ASU 2017-04”) which simplifies the test for goodwill impairment. ASU 2017-04 eliminates the requirement to calculate the implied fair value of goodwill (step two) to measure a goodwill impairment charge. Goodwill impairment will be based upon the results of step one of the impairment test, which is defined as the excess of the carrying amount of a reporting unit over its fair value, not to exceed the carrying amount of goodwill allocated to that reporting unit. The effective date for calendar-year public business entities was January 1, 2020. Due to the Company’s status as an emerging growth company (“EGC”), the new guidance will be effective for the Company’s fiscal year that begins on January 1, 2021 and requires a prospective approach to adoption. Early adoption is permitted for interim or annual goodwill impairment tests. The impact of this new guidance will depend upon the performance of our one reporting unit and the market conditions impacting the fair value. |
| • | Leases: In February 2016, the FASB issued ASU 2016‑02, Leases (Topic 842) (the “New Lease Standard”) which supersedes previous lease guidance, Accounting Standards Codification (“ASC”) Topic 840 (“ASC Topic 840”). The New Lease Standard requires lessees to recognize a right-of-use asset and a lease liability for all leases (with the exception of short-term leases) on their balance sheet at the commencement date and recognize expenses on their income statement similar to ASC Topic 840 guidance. In addition, the FASB issued ASU 2018-11, Leases Targeted Improvements, which provides a package of practical expedients for entities to apply upon adoption. The effective date for calendar-year public business entities was January 1, 2019. In November 2019, the FASB deferred the effective date of the New Lease Standard for private companies and other companies who had not yet been required to adopt the standard. Due to the Company’s EGC status, we will adopt the New Lease Standard on January 1, 2021. |
We have assessed and evaluated our portfolio of active real estate leases and are currently surveying our business for other leases. As outlined in our Annual Report on Form 10-K for the year ended December 31, 2019, we have approximately $23 million in undiscounted, future minimum cash commitments under net operating leases. The New Lease Standard is expected to result in a gross up on our Consolidated Balance Sheets and to have no material impact to our Consolidated Statements of Operations, our liquidity or our debt covenant compliance under our current credit agreement.
| • | Expected Credit Losses:In June 2016, the FASB issued ASU 2016-13, Financial Instruments - Credit Losses: Measurement of Credit Losses on Financial Instruments (“ASU 2016-13”). ASU 2016-13 creates a new model for determining current expected credit losses (“CECL”) on trade and other receivables, net investments in leases, contract assets and long-term receivables. The CECL impairment model requires companies to consider the risk of loss even if it is remote and to include forecasts of future economic conditions as well as information about past events and current conditions. The effective date for calendar-year public business entities is January 1, 2020. As an EGC, the Company currently expects to adopt ASU 2016-13 on January 1, 2023. We are currently reviewing the effect of this new standard on our consolidated financial statements. |
9
Table of Contents
NOTE 3. Revenue RecognitionRECOGNITION
In accordance with the new revenue recognition standard requirements, the following table disaggregates our revenue by type and product:
| | Three Months Ended March 31, | |
(in thousands) | | 2020 | | | 2019 | |
Investment management fees | | | | | | | | |
Mutual funds (Victory/USAA Funds) | | $ | 119,514 | | | $ | 50,576 | |
ETFs (VictoryShares) | | | 3,162 | | | | 2,016 | |
Separate accounts and other vehicles | | | 24,545 | | | | 22,050 | |
Performance-based fees | | | | | | | | |
Separate accounts and other vehicles | | | (340 | ) | | | (231 | ) |
Total investment management fees | | $ | 146,881 | | | $ | 74,411 | |
| | | | | | | | |
Fund administration and distribution fees | | | | | | | | |
Administration fees | | | | | | | | |
Mutual funds (Victory/USAA Funds) | | $ | 29,610 | | | $ | 5,245 | |
ETFs (VictoryShares) | | | 385 | | | | 270 | |
Distribution fees | | | | | | | | |
Mutual funds (Victory/USAA Funds) | | | 6,796 | | | | 7,553 | |
Transfer agent fees | | | | | | | | |
Mutual funds (USAA Funds) | | | 20,749 | | | | — | |
Total fund administration and distribution fees | | $ | 57,540 | | | $ | 13,068 | |
| | | | | | | | |
Total revenue | | $ | 204,421 | | | $ | 87,479 | |
The following table presents balances of receivables:
(in thousands) | | March 31, 2020 | | | December 31, 2019 | |
Customer receivables | | | | | | | | |
Mutual funds (Victory/USAA Funds) | | $ | 54,464 | | | $ | 64,407 | |
ETFs (VictoryShares) | | | 1,155 | | | | 1,391 | |
Separate accounts and other vehicles | | | 21,861 | | | | 27,836 | |
Receivables from contracts with customers | | | 77,480 | | | | 93,634 | |
Non-customer receivables | | | 130 | | | | 1,459 | |
Total receivables | | $ | 77,610 | | | $ | 95,093 | |
Revenue
The Company’s revenue includes fees earned from providing investment management, fund administration and fund distribution services. providing;
| • | investment management services, |
| • | fund administration services, |
| • | fund transfer agent services, and |
| • | fund distribution services. |
Revenue is recognized for each distinct performance obligation identified in customer contracts when the performance obligation has been satisfied by transferring services to a customer either over time or at the point in time when the customer obtains control of the service. Revenue is recognized in the amount of variable or fixed consideration allocated to the satisfied performance obligation that the CompanyVictory expects to be entitled to in exchange for transferring services to a customer. Variable consideration is included in the transaction price only when it is probable that a significant reversal of such revenue will not occur when the uncertainty associated with the variable consideration is subsequently resolved.
Investment management, fund administration and fund distribution fees are generally considered variable consideration as they are typically calculated as a percentage of assets under management and advisement (“AUM’). TheAUM. Fund transfer agent fees are also considered variable consideration as they are calculated as a percentage of AUM or based on the number of accounts in the fund. In such cases, the amount of fees earned is subject to factors outside of the Company’s control including customer or underlying investor contributions and redemptions and financial
10
Table of Contents
market volatility. These fees are considered constrained and are excluded from the transaction price until the asset values or number of accounts on which the customer is billed are calculated and the value of consideration is measurable.
The timing of when the Company bills its clients and related payment terms varies in accordance with the agreed upon contractual terms. Clients are generally billed after the service is performed which results in the recording of accounts receivable and accrued revenue. Deferred revenue is recorded in situations where a client is billed in advance.
The Company has contractual arrangements with third parties to provide certain advisory, administration, transfer agent and distribution services. Management considers whether the Company iswe are acting as the principal service provider or as an agent to determine whether its revenue should be recorded based on the gross amount payable by the customer or net of payments to third-party service providers, respectively. The CompanyVictory is considered a principal service provider if it controlswe control the service that is transferred to the customer. The Company isWe are considered an agent when it arrangeswe arrange for the service to be provided by another party and doesdo not control the service.
Investment Management Fees
Investment management fees are received in exchange for investment management services that represent a series of distinct incremental days of investment management service. Control of investment management services is transferred to the customers over time as these customers receive and consume the benefits provided by these services. Investment management fees are calculated as a contractual percentage of AUM and are generally paid in arrears on a monthly or quarterly basis.
Investment management fees are recognized as revenue using a time-based output measuremethod to measure progress. Revenue is recorded at month end or quarter end when the value of consideration is measured. The amount of investment management fee revenue varies from one reporting period to another as levels of AUM change (from inflows, outflows and market movements) and as the number of days in the reporting period change.
The Company may waive certain fees for investment management services provided to the Victory Funds, USAA Funds and VictoryShares and may subsidize certain share classes of the Victory Funds, USAA Funds and VictoryShares to ensure that specified operating expenses attributable to such share classes do not exceed a specified percentage. These waivers and reimbursements reduce the transaction price allocated to investment management services and are recognized as a reduction to investment management fees revenue. The amounts due to the Victory Funds, USAA Funds and VictoryShares for waivers and expense reimbursements represent consideration payable to customers, which is recorded in accounts payable and accrued expenses onin the unaudited condensed consolidated balance sheet,Condensed Consolidated Balance Sheets, and no distinct services are received in exchange for these payments.
Performance‑based investment management fees, which include fees under performance fee and fulcrum fee arrangements, are included in the transaction price for providing investment management services. Performance-based investment management fees are calculated as a percentage of investment performance on a client’s account versus a specified benchmark or hurdle based on the terms of the contract with the customer. Performance-based investment management fees are variable consideration and are recognized as revenue when it is probable that a significant reversal of the cumulative revenue for the contractual performance period will not occur. Performance-based investment management fees recognized as revenue in the current period may pertain to performance obligations satisfied in prior periods.
Fund Administration Fees
The Company recognizes fund administration fees as revenue using a time-based output measuremethod to measure progress.Fund administration fees are determined based on the contractual rate applied to average daily net assets of the Victory Funds, USAA Funds and VictoryShares for which administration services are provided. Revenue is recorded on a monthly basis when the value of consideration is measured using actual average daily net assets and constraints are removed.
The Company has contractual arrangements with a third party to provide certain sub-administration services. The Company isWe are the primary obligor under the contracts with the Victory Funds, USAA Funds and VictoryShares and hashave the ability to select the service provider and establish pricing. As a result, fund administration fees and sub-administration expenses are recorded on a gross basis.
Fund Transfer Agent Fees
The Company recognizes fund transfer agent fees using a time-based output method to measure progress. Fund transfer agent fees are determined based on the contractual rate applied to either the average daily net assets of the USAA Funds for which transfer agent services are provided or number of accounts in the USAA Funds. Revenue is recorded on a monthly basis when the value of consideration is measured using actual average daily net assets or actual number of accounts and constraints are removed.
The Company has contractual arrangements with a third party to provide certain sub-transfer agent services. We are the primary obligor under the transfer agency contracts with the USAA Funds and have the ability to select the service provider and establish pricing. As a result, fund transfer agent fees and sub-transfer agent expenses are recorded on a gross basis.
Fund Distribution Fees
VCAThe Company receives compensation for sales and sales-related services promised under distribution contracts with the Victory Funds and USAA Funds. Revenue is measured in an amount that reflects the consideration to which VCAthe Company expects to be entitled in
exchange for providing distribution services. Distribution fees are generally calculated as a percentage of average net assets in the
11
Table of Contents
Victory Funds and USAA Funds. VCA’sThe Company’s performance obligation is satisfied at the point in time when control of the services is transferred to customers, which is upon investor subscription or redemption.
Based on the nature of the calculation, the revenue for these services is accounted for as variable consideration, VCAthe Company may recognize distribution fee revenue in the current period that pertains to performance obligations satisfied in prior periods, as it represents variable consideration and is recognized as uncertainties are resolved. VCA’sThe Company’s distribution fee revenue is recorded in fund administration and distribution fees onin the unaudited condensed consolidated statementsCondensed Consolidated Statements of operations.Operations.
VCAThe Company has contractual arrangements with third parties to provide certain distribution services. VCAThe Company is the primary obligor under the contracts with the Victory Funds and USAA Funds and has the ability to select the service provider and establish pricing. Substantially all of VCA’sthe Company’s revenue is recorded gross of payments made to third parties.
Costs RelatedIncurred to Obtain or Fulfill Customer Contracts
The Company is required to capitalize certain costs directly related to the acquisition or fulfillment of a contactcontract with a customer. The CompanyVictory has not identified any sales-based compensation or similar costs that meet the definition of an incremental cost to acquire a contract and as such haswe have no intangible assets related to contract acquisitions.
Direct costs incurred to fulfill services under VCA’sthe Company’s distribution contracts include sales commissions paid to third party dealers for the sale of Class C Shares. VCAThe Company may pay upfront sales commissions to dealers and institutions that sell Class C shares of the participating Victory Funds at the time of such sale. Upfront sales commission payments with respect to Class C shares equal 1.00% of the purchase price of the Class C shares sold by the dealer or institution. When VCAthe Company makes an upfront payment to a dealer or institution for the sale of Class C shares, VCAthe Company capitalizes the cost of such payment, which is recorded in prepaidPrepaid expenses onin the unaudited condensed consolidated balance sheets,Condensed Consolidated Balance Sheets and amortizes the cost over a 12 month12-month period, the estimated period of benefit.
Valuation of Assets Under Management
The fair value of assets under management of the Victory Funds, USAA Funds and VictoryShares is primarily determined using quoted market prices or independent third partythird-party pricing services or broker price quotes. In limited circumstances, a quotation or price evaluation is not readily available from a pricing service. In these cases, pricing is determined by management based on a prescribed valuation process that has been approved by the directors/trustees of the sponsored products. The same prescribed valuation process is used to price securities in separate accounts and other vehicles for which a quotation or price evaluation is not readily available from a pricing service. For the periods presented, a de minimis amount of the AUM was priced in this manner.
DistributionNOTE 4. ACQUISITIONS
USAA AMCO Acquisition
On and Other Asset‑Based Expenses
Distribution and other asset‑based expenses include broker dealer distribution, platform distribution, sub‑administration, and sub‑advisory expenses. These expenses are accrued on a monthly basis and are generally calculated as a percentage of AUM and vary as levels of AUM change from inflows, outflows and market movement and with the number of days in the month.
Also included in distribution and other asset‑based expenses are middle office expenses. Middle office expenses are accrued on a monthly basis and vary with changes in mutual fund, institutional and wrap separate account AUM levels, the number of accounts and volume of account transaction activity.
Restructuring and Integration Costs
In connection with business combinations, asset purchases and changes in business strategy, the Company incurs costs integrating investment platforms, products and personnel into existing systems, processes and service provider
arrangements and restructuring the business to capture operating expense synergies. These costs include severance‑related expenses related to one‑time benefit arrangements and contract termination costs.
Contract termination liabilities are recorded for contract termination costs when the Company terminates a contract or stops using the product or service covered by the contract. Contract termination liabilities are recognized and measured at fair value. Contract termination costs are recorded in restructuring and integration costs on the unaudited condensed consolidated statements of operations. A rollforward of restructuring and integration liabilities, which are recorded in accounts payable and accrued expenses on the unaudited condensed consolidated balance sheets, for the three months ended March 31, 2019 and 2018 appears below.
| | | | | | | |
| | Three Months Ended March 31, | |
(in millions) | | 2019 | | 2018 | |
Liability balance, beginning of period | | $ | 0.1 | | $ | 0.1 | |
Severance expense | | | — | | | 0.3 | |
Restructuring and integration costs | | | — | | | 0.3 | |
Settlement of liabilities | | | — | | | (0.2) | |
Liability balance, end of period | | $ | 0.1 | | $ | 0.2 | |
Earnings Per Share
The calculation of basic earnings per share is based on the weighted average number of shares of the Company’s common stock, Class A common stock and Class B common stock outstanding during the period. Diluted earnings per share is similar to basic earnings per share, but adjusts for the dilutive effect of the potential issuance of incremental shares of all classes of the Company’s common stock. The Company had vested and unvested stock options and unvested restricted stock grants outstanding during the periods presented and applies the treasury stock method to these securities in its calculation of diluted earnings per share. The treasury stock method assumes that the proceeds of exercise are used to purchase common stock at the average market price for the period. The Company does not have any participating securities that would require the use of the two‑class method of computing earnings per share.
Debt Modification
Gains and losses on debt modifications that are considered extinguishments are recognized in current earnings. Debt modifications that are not considered extinguishments are accounted for prospectively through yield adjustments, based on the revised terms. Legal fees and other costs incurred with third parties that are directly related to debt modifications are expensed as incurred and included in general and administrative expense on the unaudited condensed consolidated statements of operations. The analysis as to whether a modification of debt is an extinguishment or modification is performed on a creditor‑by‑creditor basis.
Adoption of New Accounting Standards
In May 2014, the FASB issued ASU 2014‑09, Revenue from Contracts with Customers (ASC 606, as amended), which supersedes prior revenue recognition guidance. ASU 2014-09 and all subsequent amendments related to ASU 2014-09 (the “new revenue guidance") requires the following steps when recognizing revenue: 1) identify the contract with the customer 2) identify performance obligations in the contract 3) determine the transaction price 4) allocate the transaction price to the performance obligations in the contract and 5) recognize revenue when or as performance obligations are satisfied.
The Company’s introducing broker-dealer VCA adopted ASU 2014-09 on Januaryeffective July 1, 2018. The Company adopted ASU 2014-09 on January 1, 2019 using the modified retrospective approach. No cumulative effect adjustment was required to be recorded and the comparative information has not been restated. The Company determined that the new revenue guidance did not have a material impact on the timing of recognition of the Company’s revenue. The most significant impact from adopting the new revenue guidance was a change to a net presentation of certain fund expense reimbursements which were previously presented on a gross basis. See Note 3 for the effect of the changes in the presentation of fund expense reimbursements.
In early 2016, the FASB issued ASU 2016‑01. This update requires equity securities to be measured at fair value and changes in the fair value of equity securities to be recognized in net income. The Company adopted ASU 2016-01 on January 1, 2019, and the adoption had an immaterial impact on the Company’s unaudited condensed consolidated financial statements. In the three months ended March 31, 2019, the Company recognized $0.1 million of unrealized gains in interest income and other income/(expense) incompleted the unaudited condensed consolidated statements of operations.
In February 2018, the FASB issued ASU 2018-02, "Reclassification of Certain Tax Effects from Accumulated Other Comprehensive Income". ASU 2018-02 allows companies to reclassify tax effects stranded in accumulated other comprehensive income from remeasuring deferred tax assets and liabilities upon the enactment of the Tax Cuts and Job Act in December 2017. The Company adopted ASU 2018-02 on January 1, 2019 and elected to reclassify the income tax effects of the 2017 Tax Cuts and Jobs Act, which totaled $0.1 million, from accumulated other comprehensive income to retained deficit.
On October 2018, as part of Rule 3-04 of Regulation S-X, the SEC published amended rules requiring an analysis of changes in stockholders’ equity for the current and comparative quarter and year to date periods in financial statements included in quarterly reports on Form 10-Q. The Company began including an analysis of changes in stockholders’ equity for the current and comparative quarter in its unaudited condensed consolidated financial statements included on Form 10-Q for the quarter ending March 31, 2019.
In August 2016, the FASB issued ASU 2016‑15 which provides guidance on the cash flow statement classification of debt extinguishment costs, contingent consideration payments made after a business combination, and distributions received from equity method investees. The Company adopted ASU 2016-15 on January 1, 2019 and there was no impact on the unaudited condensed consolidated financial statements.
Recent Accounting Pronouncements
In February 2016, the FASB issued ASU 2016‑02 on leases. The new guidance requires lessees to record most leases on their balance sheets. Expense will be recognized in the income statement in a manner that is similar to today’s accounting. A modified retrospective transition approach is used when adopting the amended ASU 2016-02, which includes a number of optional practical expedients that entities may elect to apply. The update is effective for fiscal years beginning after December 15, 2018 for non‑emerging growth companies and for fiscal years beginning after December 15, 2019 for the Company. The Company continues to analyze the impact on its financial statements of adopting this standard but expects to record right of use assets and lease liabilities related to its operating leases upon adoption on January 1, 2020.
In January 2017, the FASB issued ASU 2017-04 simplifying the test for goodwill impairment. The standard eliminates Step 2 from the goodwill impairment test. Under the amended guidance, an entity will perform its goodwill impairment test by comparing the fair value of a reporting unit with its carrying amount. An entity will recognize an impairment charge for the amount by which the carrying amount exceeds the reporting unit’s fair value, but the loss cannot exceed the total amount of goodwill allocated to the reporting unit. The new guidance is effective for the Company’s fiscal year that begins after December 15, 2020 and requires a prospective approach to adoption. Early adoption is permitted for interim or annual goodwill impairment tests. Upon adoption, the new guidance will impact the Company’s consolidated financial statements and related disclosures only in the event there is goodwill impairment.
3. Revenue Recognition
The following table presents a disaggregation of revenue by type and product for the three months ended March 31, 2019 and 2018:
| | | | | | | | |
| | | | Three Months Ended March 31, |
(in thousands) | | | | 2019 | | 2018 |
Investment management fees | | | | | | | | |
Mutual funds (Victory Funds) | | | | $ | 50,576 | | $ | 63,071 |
ETFs (VictoryShares) | | | | | 2,016 | | | 1,929 |
Separate accounts and other vehicles | | | | | 22,050 | | | 23,404 |
Performance-based fees | | | | | | | | |
Separate accounts and other vehicles | | | | | (231) | | | 726 |
Total | | | | $ | 74,411 | | $ | 89,130 |
| | | | | | | | |
Fund administration and distribution fees | | | | | | | | |
Administration fees | | | | | | | | |
Mutual funds (Victory Funds) | | | | $ | 5,245 | | $ | 5,550 |
ETFs (VictoryShares) | | | | | 270 | | | 186 |
Distribution fees | | | | | | | | |
Mutual funds (Victory Funds) | | | | | 7,553 | | | 10,098 |
Total | | | | $ | 13,068 | | $ | 15,834 |
| | | | | | | | |
Total Revenue | | | | $ | 87,479 | | $ | 104,964 |
Beginning on January 1, 2019, and as a result of adopting ASU 2014-09, fund expense reimbursements are presented as a reduction of investment management fees. This change in presentation reduced revenue, and operating expenses, by $4.1 million for the three months ended March 31, 2019.
The following table presents balances of receivables from contracts with customers:
| | | | | | |
(in thousands) | | March 31, 2019 | | December 31, 2018 |
Customer Receivables | | | | | | |
Mutual funds (Victory Funds) | | $ | 22,316 | | $ | 21,025 |
ETFs (VictoryShares) | | | 926 | | | 909 |
Separate accounts and other vehicles | | | 19,271 | | | 19,199 |
Receivables from contracts with customers | | | 42,513 | | | 41,133 |
Non-customer receivables | | | 270 | | | 2,987 |
Receivables | | $ | 42,783 | | $ | 44,120 |
4. Acquisitions
Harvest Acquisition
On September 21, 2018, the Company entered into the Harvest Purchase Agreement, whereby the Company agreed to purchase 100% of the equity interests of Harvest. The Harvest Acquisition was subject to the receipt of a specified level of client consent, termination or expiration of the waiting period under the Hart-Scott-Rodino Antitrust Improvements Act of 1976, as amended (the “HSR Act”), which termination was received on November 6, 2018, and other closing conditions. The Harvest Purchase Agreement contained customary termination rights for the Company and Harvest, including in the event the Harvest Acquisition is not consummated on or before June 11, 2019.
On April 22, 2019, the Company, Harvest and the Members’ Representative entered into an agreement (the “Harvest Termination Agreement”) to mutually terminate the Harvest Purchase Agreement as of April 22, 2019. Neither the Company nor Harvest will be responsible for any termination fee to the other party as a result of the termination.
USAA AMCO Acquisition,
On November 6, 2018, the Company entered into the USAA Stock Purchase Agreement, whereby the Company agreed to purchase acquiring 100% of the outstanding common stock of the USAA Acquired Companies.Companies and the USAA Mutual Fund Business. The USAA AMCO Acquisition includes AMCO’s mutual fundexpands and ETF businesses and the USAA 529 College Savings Plan. The USAA AMCO Acquisition is expected to diversifydiversifies the Company’s AUM, expand its investment capabilities, increase itsplatform, particularly in the fixed income and solutions asset classes, and increases the Company’s size and scale and introduce a new USAA direct-member distribution channelscale. Additional products added to the Company’s existing distribution platform.
USAA Stock Purchase Agreement
Subjectinvestment platforms include target date and target risk strategies, managed volatility mutual funds, active fixed income ETFs, sub-advised and multi-manager equity funds. The acquisition also added to the adjustments described belowCompany’s lineup of asset allocation portfolios and insmart beta equity ETFs and provided the Company the rights to offer products and services using the USAA Stock brand and the opportunity to offer its products to USAA members through a direct member channel.
Purchase Agreement,Price
During the aggregatefirst quarter of 2020, the Company received a post-closing purchase price (the “USAA Stock Purchase Price”) to be paid by the Company for the sharesadjustment of the USAA Acquired Companies is (i) $850$0.7 million in cash (the “Base Purchase Price”)from the sellers related to net working capital adjustments. We continue to evaluate the acquisition and purchase price accounting.
Total consideration paid at the closing ofthrough March 31, 2020 for the USAA AMCO Acquisition (the “USAA Closing”) and (ii)was $949.4 million, comprised of $851.3 million of cash paid at closing plus the acquisition date value of contingent payments due to sellers of $98.8 million less $0.7 million in net working capital adjustments settled in the first quarter of 2020.
A maximum of $150.0 million ($37.5 million per year) in contingent payments is payable to sellers based on AMCO’sthe annual revenue as calculated under theof USAA Stock Purchase AgreementAdviser attributable to all “non-managed money”-related assets under managementAUM in each of the first four years following the USAA Closing. A maximum of $150 million ($37.5 million per year) in contingent payments in respect of “non-managed money”-related assets is achievable over the four-year period.closing. To receive any contingent payment in respect of “non-managed money”-related assets for a given year, annual revenue from “non-managed money”-related assets must be at least 80% of the revenue run-rate as(as calculated under the USAA Stock Purchase AgreementAgreement) of AMCO’sthe USAA Adviser’s “non-managed money”-related assets under management as of the Closing,closing date, and to achieve the maximum contingent payment for a given year, such annual revenue must total at least 100% of that Closingclosing date revenue run-rate. Annual contingent
12
Table of Contents
payments in respect of “non-managed money”-related assets are subject to certain “catch-up” provisions set forth in the USAA Stock Purchase Agreement.
The USAA Stock Purchase Agreement provides thatCompany accounted for the Base Purchase Price will be reduced if AMCO does not obtain client consents (the “Consents”) relatedacquisition in accordance with ASC 805, Business Combinations. Accordingly, the purchase price was allocated to the assignmentassets acquired and liabilities assumed based upon their estimated fair values at the date of AMCO’s investment advisory contracts representing revenues equalthe USAA AMCO Acquisition. We used an independent valuation specialist to at least 95%assist with the determination of a baseline revenue amount (the “Run Rate Threshold”). fair value for certain of the acquired assets and assumed liabilities disclosed below.
The Base Purchase Priceexcess purchase price over the estimated fair values of assets acquired and liabilities assumed of $120.6 million was recorded to goodwill in the unaudited Condensed Consolidated Balance Sheets, all of which is subjectexpected to working capitalbe deductible for tax purposes. The goodwill arising from the acquisition primarily results from expected future earnings and debt adjustmentscash flows, as well as reductions for certain unpaid transaction expenses, accrued bonuses and commissions and other specified liabilities of AMCO, in each case as of immediately prior to Closing. The Base Purchase Price is also subject to a customary post-Closing adjustment, as well as a true-up payment in respect of Consents obtained in the 180 days followingsynergies created by the USAA Closing.
The USAA AMCO Acquisition is expected to close on July 1, 2019 and is subject to, among other things, the receipt of a specified level of Consents, the expiration or termination of the applicable waiting period under the HSR Act, which termination was received on December 3, 2018, the absence of any material adverse effect as defined in the USAA Stock Purchase Agreement on the businessintegration of the USAA Acquired Companies and other customary closing conditions.within our organization.
The following table summarizes the estimated amounts of identified acquired assets and liabilities assumed as of the acquisition date:
(in thousands) | | | | |
Cash and cash equivalents | | $ | 17,473 | |
Investment management fees receivable | | | 25,353 | |
Fund administration and distribution fees receivable | | | 4,779 | |
Other receivables and prepaid expenses | | | 299 | |
Property and equipment | | | 1,165 | |
Other intangible assets(1) | | | 808,670 | |
Goodwill | | | 120,643 | |
Accounts payable and accrued expenses | | | (5,575 | ) |
Accrued compensation and benefits | | | (5,907 | ) |
Payable to members and custodians | | | (17,473 | ) |
Contingent consideration payable to sellers | | | (98,800 | ) |
Total purchase price consideration | | $ | 850,627 | |
| (1) | Includes $750.2 million for indefinite-lived investment advisory contracts, $19.1 million for indefinite-lived transfer agent contracts, $0.8 million for indefinite-lived distribution contracts, $38.2 million for definite-lived trade name assets and $0.4 million for definite-lived lease-related assets, all of which are recorded in other intangible assets, net on the unaudited Condensed Consolidated Balance Sheets. |
The following table summarizes the change in the goodwill balance from December 31, 2019 to March 31, 2020:
(in thousands) | | As of March 31, 2020 | |
Balance, beginning of period | | $ | 404,750 | |
Goodwill recorded in acquisition | | | — | |
Balance, end of period | | $ | 404,750 | |
Contingent Consideration
The fair value of contingent consideration payable to sellers at March 31, 2020 was estimated to be $113.2 million as compared to $118.7 million at December 31, 2019. The decrease in the liability of $5.5 million in the first quarter of 2020 was recorded in change in value of consideration payable for acquisition of business in the unaudited Condensed Consolidated Statements of Operations.
The fair value of the USAA Stock Purchase Agreement contains customary termination rightsAMCO Acquisition contingent consideration payable was estimated using the real options method. Revenue related to “non-managed money” assets was simulated in a risk-neutral framework to calculate expected probability-weighted earn out payments, which were then discounted from the expected payment dates at the relevant cost of debt. Significant assumptions and inputs include the “non-managed money” revenue projected annual growth rate, the market price of risk, which adjusts the projected revenue growth rate to a risk-neutral expected growth rate, revenue volatility and discount rate.
As of March 31, 2020, the projected annual growth rate for “non-managed money” revenue was approximately 5%. The market price of risk and revenue volatility of approximately 8% and 18%, respectively, were based on data for comparable companies. As the contingent consideration represents a subordinate, unsecured claim of the Company, we have assessed a discount rate of approximately 7.5%, which incorporates adjustments for credit risk and the subordination of the contingent consideration. Total estimated undiscounted earn out payments ranged from $130 million to $150 million, the maximum amount payable to sellers.
13
Table of Contents
Actual and Pro Forma Results for USAA Capital Corporation, parentAcquired Companies
Revenue of the USAA Acquired Companies includingfor the three months ended March 31, 2019, was as follows:
| | Unaudited | |
| | Three Months Ended | |
(in millions) | | March 31, 2019 | |
Revenue | | $ | 117.4 | |
Net income attributable to the USAA Acquired Companies for the three months ended March 31, 2019 is impractical to determine as the Company does not prepare discrete financial information at that level.
The following Unaudited Pro Forma Condensed Combined Statements of Operations are provided for illustrative purposes only and assume that the acquisition occurred on January 1, 2018. This unaudited information should not be relied upon as indicative of historical results that would have been obtained if the acquisition had occurred on that date, nor of the results that may be obtained in the eventfuture.
The historical consolidated financial information of Victory and the USAA AMCO Acquisition is not consummatedAcquired Companies have been adjusted to give effect to unaudited pro forma events that are directly attributable to the transaction, factually supportable and expected to have continuing impact on or before August 3, 2019.
Acquisition-relatedthe combined results. These amounts have been calculated after adjusting the results of the USAA Acquired Companies to reflect additional interest expense, distribution costs, share-based compensation expense, income taxes and intangible asset amortization that would have been expensed assuming the fair value adjustments had been applied on January 1, 2018. In addition, Victory’s and the USAA Acquired Companies’ results were adjusted to remove incentive compensation, legal fees and mutual fund proxy costs directly attributable to the acquisition.
| | Unaudited | |
| | Three Months Ended | |
(in thousands, except per share amount) | | March 31, 2019 | |
Revenue | | $ | 205.0 | |
Net income | | $ | 13.2 | |
| | | | |
Earnings per share of common stock | | | | |
Basic | | $ | 0.20 | |
Diluted | | $ | 0.18 | |
| | | | |
Weighted average number of shares outstanding | | | | |
Basic | | | 67,599 | |
Diluted | | | 72,376 | |
Acquisition-Related Costs
Costs related to acquisitions are summarized below and include legal and filing fees, advisory services, mutual fund proxy voting costs and other one-time expenses related to the transactions. These costs are included in acquisition-related costs in the unaudited condensed consolidated statementsCondensed Consolidated Statements of operations.Operations.
| | | | | | | | |
| | Acquisition-related costs | | | Acquisition-related costs | |
| | Three Months Ended March 31, | | | Three Months Ended March 31, | |
(in thousands) | | 2019 | | 2018 | | | 2020 | | | 2019 | |
USAA AMCO Acquisition | | $ | 2,586 | | $ | — | | | $ | (124 | ) | | $ | 2,586 | |
Harvest Acquisition | | | 191 | | | — | | |
| | $ | 2,777 | | $ | — | | |
Other | | | | 55 | | | | 191 | |
Total acquisition-related costs | | | $ | (69 | ) | | $ | 2,777 | |
Restructuring and Integration Costs
14
Table of Contents
In connection with business combinations, asset purchases and changes in business strategy, the Company incurs costs integrating investment platforms, products and personnel into existing systems, processes and service provider arrangements and restructuring the business to capture operating expense synergies.
The following table presents the rollforward of restructuring and integration liabilities, which are recorded in accounts payable and accrued expenses in the unaudited Condensed Consolidated Balance Sheets, for the three months ended March 31, 2020 and 2019:
| | Three Months Ended March 31, | |
(in millions) | | 2020 | | | 2019 | |
Liability balance, beginning of period | | $ | 3.0 | | | $ | 0.1 | |
Integration costs-USAA AMCO | | | 1.0 | | | | — | |
Total restructuring and integration costs | | | 1.0 | | | | — | |
Settlement of liabilities | | | (1.5 | ) | | | — | |
Liability balance, end of period | | $ | 2.5 | | | $ | 0.1 | |
5. NOTE 5. Fair Value Measurements
The Company determines the fair value of certain financial and nonfinancial assets and liabilities. Fair value is determined based on the price that would be received for an asset or paid to transfer a liability in an orderly transaction between market participants at the measurement date. Fair value determinations utilize a valuation hierarchy based upon the transparency of inputs used in the valuation of an asset or liability. Classification within the fair value hierarchy contains three levels:
| ·•
| | Level 1—Valuation inputs are unadjusted quoted market prices for identical assets or liabilities in active markets. |
| ·•
| | Level 2—Valuation inputs are quoted prices for identical assets or liabilities in markets that are not active, quoted market prices for similar assets and liabilities in active markets and other observable inputs directly or indirectly related to the asset or liability being measured. |
| ·•
| | Level 3—Valuation inputs are unobservable and significant to the fair value measurement. These inputs reflect management’s own assumptions about the assumptions a market participant would use in pricing the asset or liability. |
As of March 31, 2019, the Company had $0.7 million in contingent consideration arrangementThe table below shows liabilities that were measured at fair value on a recurring basis. These
| | As of March 31, 2020 | |
(in thousands) | | Total | | | Level 1 | | | Level 2 | | | Level 3 | |
Financial Liabilities | | | | | | | | | | | | | | | | |
Interest Rate Swap Liability | | $ | (6,300 | ) | | $ | - | | | $ | (6,300 | ) | | $ | - | |
Contingent Consideration Arrangements | | | (113,200 | ) | | | - | | | | - | | | | (113,200 | ) |
Total Financial Liabilities | | $ | (119,500 | ) | | $ | - | | | $ | (6,300 | ) | | $ | (113,200 | ) |
| | As of December 31, 2019 | |
(in thousands) | | Total | | | Level 1 | | | Level 2 | | | Level 3 | |
Financial Liabilities | | | | | | | | | | | | | | | | |
Contingent Consideration Arrangements | | $ | (118,700 | ) | | $ | - | | | $ | - | | | $ | (118,700 | ) |
Total Financial Liabilities | | $ | (118,700 | ) | | $ | - | | | $ | - | | | $ | (118,700 | ) |
The Swap liability represents amounts owed as of March 31, 2020 under afloating-to-fixed interest rate swap transaction entered into by the Company on March 27, 2020. The Swap effectively fixes the interest rate at 3.465% on $450 million of the outstanding Term Loan balance through the Term Loan’s maturity in July 2026. The fair value of the Swap was included in other liabilities on the unaudited Condensed Balance Sheets at March 31, 2020. Pricing was determined based on a third party, model-derived valuation in which all significant inputs are observable in active markets (Level 2). Refer to Note 14, Derivatives, for further detail on the Swap.
The contingent consideration arrangement liabilities represent the CEMPUSAA AMCO Acquisition estimated earn-out payment liability, which is included in consideration payable for acquisition of business onin the unaudited condensed consolidated balance sheets. Level 3Condensed Consolidated Balance Sheets. Refer to Note 4, Acquisitions, for further details related to the contingent consideration arrangement.
Significant unobservable inputs were utilizedfor the option pricing model used to determine fair value, or the presentestimated fair value of the expected future settlement,USAA AMCO Acquisition earn-out payment liability include the “non-managed money” revenue projected growth rate, revenue volatility, market price of risk and discount rate. An increase in market price of risk, discount rate and revenue volatility results in a lower fair value for the earn-out payment liability, while an increase in the projected growth rate for “non-managed money” revenue results in a higher
15
Table of Contents
fair value for the earn-out payment liability. Refer to Note 4, Acquisitions, for further details related to the valuation of contingent consideration arrangement. payable related to the USAA AMCO Acquisition.
Changes in the fair value of the liability, realized or unrealized, are recorded in earnings and are included in change in value of consideration payable for acquisition of business onin the unaudited condensed consolidated statementsCondensed Consolidated Statements of operations. DuringOperations.
The following table presents the three months ended Marchbalance of the contingent consideration arrangement liabilities at December 31, 2019 and 2018, there were no changes in the valuation of the CEMP earn-out liability.
Significant unobservable inputs used in the fair value calculation for this obligation include discount rates and growth assumptions. Four scenarios were used in formulating the growth rate assumptions with varying levels of revenue growth and were probability‑weighted. An increase to the discount rate would result in a lower fair value, while an increase to growth rate assumptions would result in a higher fair value.March 31, 2020, respectively.
| | |
| | |
| | |
(in thousands)
| | Contingent Consideration Arrangements
|
Balance, December 31, 2018
| $
| (716)
|
CEMP change in fair value measurement
| | -
|
Balance, March 31, 2019
| $
| (716)
|
(in thousands) | | Contingent Consideration Liabilities | |
Balance, December 31, 2019 | | $ | (118,700 | ) |
USAA AMCO change in fair value measurement | | | 5,500 | |
Balance, March 31, 2020 | | $ | (113,200 | ) |
There were no0 transfers between any of the Level 1, 2 and 3 categories in the fair value measurement hierarchy from December 31, 20182019 to March 31, 2019.2020. The Company recognizes transfers at the end of the reporting period.
The net carrying valuesvalue of cash and cash equivalents, receivablesaccounts receivable and accounts payable and accrued expenses approximateapproximates fair value due to the short-termshort‑term nature of these assets and liabilities. The carrying amountfair value of the Company’sour long-term debt at March 31, 20192020 is considered to be its carrying value as the interest rate on the bank debt is variable and approximates fair value.current market rates. As a result, Level 2 inputs are utilized to determine the fair value of the Company’s long-termour long‑term debt.
The fair value of the Company’s money market investment ($10.1 million within cash and cash equivalents), available-for-sale investments and trading securities are measured using Level 1 inputs, which are the net asset value practical expedient at March 31, 2019 and December 31, 2018 totaled $15.7 million and $13.3 million, respectively.market prices for shares in these open-end mutual funds.
6. NOTE 6. Related-Party Transactions
The Company considers certain funds that it manages, including the Victory Funds, the USAA Funds, the VictoryShares and collective trust funds that it sponsors (the “Victory Collective Funds”), to be related parties as a result of the Company’sour advisory relationship.
The Company receives investment management, administrative, distribution and compliance fees in accordance with contracts that VCM and VCA have with the Victory Funds. The CompanyFunds and the USAA Funds and has invested a portion of its balance sheet cash in the USAA Treasury Money Market Fund and earns interest on the amount invested in this fund. We also receivesreceive investment management fees from the VictoryShares and Victory Collective Funds under VCM’s advisory contracts with these funds and administrative fees under VCM’s administrationfrom the VictoryShares. In addition, we receive transfer agent fees in accordance with a contract that VCTA has with the VictoryShares.USAA Funds.
Under the terms of monitoring agreements with affiliates of two shareholders of the Company, the Company paid fees for monitoring services, which are included in general and administrative expense in the unaudited condensed consolidated statements of operations. These monitoring agreements terminated upon the completion of the IPO.
BalancesThe table below presents balances and transactions involving related parties included in the unaudited condensed consolidated balance sheetsCondensed Consolidated Balance Sheets and unaudited condensed consolidated statementsCondensed Consolidated Statements of operations are summarized below. Included in receivables (fund administration and distribution fees) are amounts due from the Victory Funds for compliance services. Included in fund administration and distribution fees are amounts earned for compliance services. Realized and unrealized gains and losses and dividend income on investments in the Victory Funds classified as either available-for-sale or trading securities are included in interest income and other income/(expense). Included in other liabilities is the remaining amount payable for a promissory note for amounts due upon repurchase of Company common stock from a shareholder.
| | | | | | | | |
| | | | | | |
(in thousands) | | | March 31, 2019 | | December 31, 2018 | |
Related party assets | | | | | | | | |
Receivables (investment management fees) | | | $ | 20,872 | | $ | 19,612 | |
Receivables (fund administration and distribution fees) | | | | 3,309 | | | 3,153 | |
Investments (available-for-sale securities, fair value) | | | | 694 | | | 601 | |
Investments (trading securities, fair value) | | | | 14,577 | | | 12,343 | |
Total | | | $ | 39,452 | | $ | 35,709 | |
| | | | | | | | |
Related party liabilities | | | | | | | | |
Accounts payable and accrued expenses (fund reimbursements) | | | $ | 3,868 | | $ | 2,300 | |
Other liabilities (promissory note) | | | | — | | | 96 | |
Total | | | $ | 3,868 | | $ | 2,396 | |
| | | | | | | | |
| | | Three Months Ended March 31, | |
(in thousands) | | | 2019 | | 2018 | |
Related party revenue | | | | | | | | |
Investment management fees | | | $ | 53,793 | | $ | 65,866 | |
Fund administration and distribution fees | | | | 13,067 | | | 15,834 | |
Total | | | $ | 66,860 | | $ | 81,700 | |
| | | | | | | | |
Related party expense | | | | | | | | |
Distribution and other asset-based expenses (fund reimbursements) (1) | | | $ | — | | $ | 2,933 | |
General and administrative | | | | — | | | 141 | |
Total | | | $ | — | | $ | 3,074 | |
| | | | | | | | |
Related party other income (expense) | | | | | | | | |
Interest income/(expense) and other income/(expense) | | | $ | 1,361 | | $ | (99) | |
Interest income/(expense) and other financing costs (promissory note) | | | | (1) | | | (6) | |
Total | | | $ | 1,360 | | $ | (105) | |
Operations.
| (1)•
| Included in cash and cash equivalents is cash held in the USAA Treasury Money Market Fund. |
| Effective January 1, 2019 upon•
| Included in receivables (fund administration and distribution fees) are amounts due from the adoptionVictory Funds and USAA Funds for compliance services and amounts due from the USAA Funds for transfer agent services. |
| • | Included in revenue (fund administration and distribution fees) are amounts earned for compliance services and transfer agent services. |
| • | Realized and unrealized gains and losses and dividend income on investments in the Victory Funds classified as available-for-sale securities and investments in the Victory Funds and USAA Funds classified as trading securities and dividend income on investments in the USAA Treasury Money Market Fund are recorded in interest income and other income (expense) in the unaudited Condensed Consolidated Statements of ASU 2014-09, expense reimbursements have been reclassedOperations. |
| • | Amounts due to the Victory Funds, USAA Funds and VictoryShares for waivers of investment management fees. fees and reimbursements of fund operating expenses are included in accounts payable and accrued expenses in the unaudited Condensed Consolidated Balance Sheets and represent consideration payable to customers. |
16
Table of Contents
(in thousands) | | March 31, 2020 | | | December 31, 2019 | |
Related party assets | | | | | | | | |
Cash and cash equivalents | | $ | 10,085 | | | $ | 10,060 | |
Receivables (investment management fees) | | | 39,722 | | | | 47,872 | |
Receivables (fund administration and distribution fees) | | | 17,315 | | | | 19,313 | |
Investments (available-for-sale securities, fair value) | | | 582 | | | | 771 | |
Investments (trading securities, fair value) | | | 14,679 | | | | 17,914 | |
Total | | $ | 82,383 | | | $ | 95,930 | |
| | | | | | | | |
Related party liabilities | | | | | | | | |
Accounts payable and accrued expenses (fund reimbursements) | | $ | 4,587 | | | $ | 4,316 | |
| | Three Months Ended March 31, | |
(in thousands) | | 2020 | | | 2019 | |
Related party revenue | | | | | | | | |
Investment management fees | | $ | 124,312 | | | $ | 53,793 | |
Fund administration and distribution fees | | | 57,540 | | | | 13,067 | |
Total | | $ | 181,852 | | | $ | 66,860 | |
| | | | | | | | |
Related party other (expense) income | | | | | | | | |
Interest income and other (expense) income | | $ | (4,798 | ) | | $ | 1,361 | |
NOTE 7. Investments
As of March 31, 20192020 and December 31, 2018,2019, the Company held both available-for-sale securities and trading securities. Available-for-sale investments consist entirely of seed capital investments in certain Victory Funds. Trading securities are held under a deferred compensation plan and include Victory Funds, USAA Funds and third party mutual funds.
Available‑For‑Sale Securities
A summary of the cost and fair value of investments classified as available-for-sale iswere as follows:
| | | | | | | | | | | | |
| | | | | Gross Unrealized | | Fair |
(in thousands) | | Cost | | Gains | | (Losses) | | Value |
As of March 31, 2019 | | $ | 666 | | $ | 44 | | $ | (16) | | $ | 694 |
As of December 31, 2018 | | | 666 | | | 6 | | | (71) | | | 601 |
| | | | | | Gross Unrealized | | | Fair | |
(in thousands) | | Cost | | | Gains | | | (Losses) | | | Value | |
As of March 31, 2020 | | $ | 696 | | | $ | 4 | | | $ | (118 | ) | | $ | 582 | |
As of December 31, 2019 | | | 696 | | | | 85 | | | | (10 | ) | | | 771 | |
Unrealized and realized gains and losses on available‑for‑sale investments are recognized onin the unaudited condensed consolidated statementsCondensed Consolidated Statements of operationsOperations as interest income and other income/income (expense). There were no sales of available-for-sale securitiesinvestments in the three months ended March 31, 20192020 and 2018.2019.
Trading Securities
A summary of the cost and fair value of investments classified as trading securities iswere as follows:
| | | | | | | | | | | | |
| | | | | Gross Unrealized | | Fair |
(in thousands) | | Cost | | Gains | | (Losses) | | Value |
As of March 31, 2019 | | $ | 15,821 | | $ | 66 | | $ | (839) | | $ | 15,048 |
As of December 31, 2018 | | | 14,874 | | | 5 | | | (2,160) | | | 12,719 |
| | | | | | Gross Unrealized | | | Fair | |
(in thousands) | | Cost | | | Gains | | | (Losses) | | | Value | |
As of March 31, 2020 | | $ | 20,170 | | | $ | 38 | | | $ | (5,159 | ) | | $ | 15,049 | |
As of December 31, 2019 | | | 18,670 | | | | 733 | | | | (1,098 | ) | | | 18,305 | |
17
Table of Contents
Unrealized and realized gains and losses on trading securities are recorded in interest income and other income/income (expense) in the unaudited condensed consolidated statementsCondensed Consolidated Statements of operations.Operations. Proceeds from sales and realized gains and losses from trading securities in the three monthsperiods ended March 31, 2020 and 2019 and 2018 arewere as follows:
| | | | | | | | | |
| | Sale | | Realized |
(in thousands) | | Proceeds | | Gains | | (Losses) |
For the Three Months Ended March 31, 2019 | | $ | 570 | | $ | 2 | | $ | (20) |
For the Three Months Ended March 31, 2018 | | | 448 | | | 28 | | | (2) |
| | | | | | | | | |
| | Sale | | | Realized | |
(in thousands) | | Proceeds | | | Gains | | | (Losses) | |
For the three months ended March 31, 2020 | | $ | 1,091 | | | $ | 20 | | | $ | (46 | ) |
For the three months ended March 31, 2019 | | | 570 | | | | 2 | | | | (20 | ) |
8. NOTE 8. Income Taxes
The effective tax rate for the three months ended March 31, 20192020 and 20182019 differs from the U.S.United States federal statutory rate primarily as a result of state and local income taxes, excess tax benefits on share-based compensation, and certain non-deductible expenses. expenses and for 2020, expense related to increasing the liability for unrecorded state tax benefits.
For the three months ended March 31, 20192020 and 2018,2019, the provision for income taxes was $16.8 million and $4.8 million, or 22.7% and $3.6 million, or 24.9% and 25.3%, of pre-tax income respectively.
The effective tax rate for the three months ended March 31, 20192020 was lower than the effective tax rate for the three months ended March 31, 2018same period in 2019 due mainly to higher excess tax benefits on share-based compensation.
NoNaN valuation allowance was recorded for deferred tax assets in the periodsperiod ended March 31, 2020 and 2019.
During the three months ended March 31, 2020, the Company recorded a liability for $0.3 million ($0.2 million net of federal benefit) for unrecognized tax benefits. The gross unrecognized tax benefits and interest and penalties of $2.2 million and $2.9 million at March 31, 2020 and December 31, 2019, respectively, are included in other liabilities in the unaudited Condensed Consolidated Balance Sheets. The Company expects that the amount of unrecognized tax benefits will change in the next 12 months; however, this change is not expected to have a material impact on the consolidated financial statements.
The following table presents the changes in gross unrecognized tax benefits, excluding interest and 2018.penalties, for the three months ending March 31, 2020 and 2019.
(in thousands) | | 2020 | | | 2019 | |
Beginning balance | | $ | 2,582 | | | $ | — | |
Additions based on tax positions related to current period | | | 280 | | | | — | |
Reductions related to settlement of tax matters | | | (908 | ) | | | — | |
Ending balance | | $ | 1,954 | | | $ | — | |
NOTE 9. Debt
2020 Debt Repricing
21Concurrent with the USAA AMCO Acquisition on July 1, 2019, the Company (i) entered into the 2019 Credit Agreement, (ii) repaid all indebtedness outstanding under the previous credit agreement (dated February 2018), and (iii) terminated the previous credit agreement.
On January 17, 2020, we entered into the First Amendment (the “First Amendment”) to the 2019 Credit Agreementwith the other loan parties thereto, Barclays Bank PLC, as administrative agent, and the Royal Bank of Canada as fronting bank. Pursuant to the First Amendment, the Company repriced the existing term loans (the “Existing Term Loans”) with replacement term loans in an aggregate principal amount of $952.0 million (the “Repriced Term Loans”). The Repriced Term Loans provide for substantially the same terms as the Existing Term Loans, including the same maturity date of July 2026, except that the Repriced Term Loans provide for a reduced applicable margin on LIBOR of 75 basis points. The applicable margin on LIBOR under the Repriced Term Loans is 2.50%, compared to 3.25% under the Existing Term Loans.
18
9. Debt
The following table summarizes the components of long-term debt under the Existing2019 Credit Agreement onin the unaudited condensed consolidated balance sheetsCondensed Consolidated Balance Sheets at March 31, 20192020 and December 31, 2018 appear below.2019:
| | | | | | | | | | | |
(in thousands) | | March 31, 2019 | | Effective Interest Rate | | December 31, 2018 | | Effective Interest Rate | | March 31, 2020 | | | December 31, 2019 | |
Due February 2025 | | $ | 280,000 | | 5.91% | | $ | 280,000 | | 6.22% | |
Term loan principal outstanding | | | 280,000 | | | | | 280,000 | | | | $ | 914,000 | | | $ | 952,000 | |
Unamortized debt issuance costs | | | (7,312) | | | | | (7,629) | | | | | (15,907 | ) | | | (17,230 | ) |
Unamortized debt discount | | | (3,368) | | | | | (3,514) | | | | | (9,446 | ) | | | (10,231 | ) |
Long-term debt | | $ | 269,320 | | | | $ | 268,857 | | | |
Long-term debt, net | | | $ | 888,647 | | | $ | 924,539 | |
The 2019 Credit Agreement contains customary affirmative and negative covenants, including covenants that affect, among other things, the ability of the first lien leverage ratio, measured as of the last day of each fiscal quarter on which outstanding borrowings under the revolving credit facility exceed 35.0% of the commitments thereunder (excluding certain letters of credit), of no greater than 3.80 to 1.00. As of March 31, 2020, there were 0 outstanding borrowings under the revolving credit facility and we were in compliance with our financial performance covenant.
A total of $80.0$38.0 million of the outstanding term loans under the Existing2019 Credit Agreement was repaid in 2018, satisfying the required annual amortizationfirst quarter of 1% per annum through 2024. No additional repayments were made in the three months ended2020. Refer to Note 15, Subsequent Events, for information related to term loan activity subsequent to March 31, 2019.2020.
The components2020 Swap Transaction
On March 27, 2020, the Company executed the Swap, a floating-to-fixed interest rate swap transaction, to effectively fix the interest rate at 3.465% on $450 million of interest expense and other financing costsits outstanding term loan through the term loan maturity date of July 2026. Refer to Note 14, Derivatives, for further information on the unaudited condensed consolidated statements of operations for the three months ended March 31, 2019 and 2018 appear below.
| | | | | | | |
| | For the Three Months Ended March 31, | |
(in thousands) | | 2019 | | 2018 | |
Interest expense | | $ | 3,880 | | $ | 6,015 | |
Amortization of debt issuance costs | | | 364 | | | 603 | |
Amortization of debt discount | | | 146 | | | 252 | |
CEMP base payment accretion expense | | | 83 | | | 140 | |
Other | | | 151 | | | 82 | |
Total | | $ | 4,624 | | $ | 7,092 | |
Swap.
Interest Expense
As of March 31, 2019,2020, the term loans under the Existing2019 Credit Agreement had an interest period of one month and thean interest rate of 4.02%. Including the impact of amortization of debt issuance costs and original issue discount described herein, the effective yield for term loans under the 2019 Credit Agreement as of March 31, 2020 was 5.25%4.45%. The following table summarizes the components of interest expense and other financing costs in the unaudited Condensed Consolidated Statements of Operations for the periods ended March 31, 2020 and 2019:
| | For the Three Months Ended March 31, | |
(in thousands) | | 2020 | | | 2019 | |
Interest expense | | $ | 10,056 | | | $ | 3,880 | |
Amortization of debt issuance costs | | | 781 | | | | 364 | |
Amortization of debt discount | | | 392 | | | | 146 | |
Other | | | 179 | | | | 234 | |
Total | | $ | 11,408 | | | $ | 4,624 | |
The Harvest Commitment Letter
In connection with entering into the Harvest Purchase Agreement, on September 21, 2018, the Company entered into the Harvest Commitment Letter with Royal Bank of Canada (“RBC”) and Barclays Bank PLC (“Barclays”), pursuant to which RBC and Barclays committed to provide, and agreed to arrange and syndicate, an incremental senior secured term loan facility under the Existing Credit Agreement in an initial aggregate principal amount of up to $265 million (the “Harvest Facility”). The proceeds of the Harvest Facility, together with cash on the Company’s balance sheet at Harvest Closing, were to be used by the Company to fund a portion of the Harvest Purchase Price and to pay fees and expenses incurred in connection with the Harvest Acquisition and the Harvest Facility, unless the Company financed the Harvest Acquisition with proceeds from the USAA AMCO Term Loan Facility described below.NOTE 10. Equity
Shares Rollforward
The Harvest Commitment Letter automatically terminated in accordance with its terms upon execution of the Harvest Termination Agreement.
USAA AMCO Credit Facilities Commitment Letter
In connection with entering into the USAA Stock Purchase Agreement, on November 6, 2018, the Company entered into the USAA AMCO Credit Facilities Commitment Letter with Barclays and RBC, pursuant to which Barclays and RBC committed to provide, and agreed to arrange and syndicate, a new seven-year senior secured first lien term loan facility (the “USAA AMCO Term Loan Facility”) in an aggregate principal amount of up to $1.395 billion and a new five-year senior secured first lien revolving credit facility (together with the USAA AMCO Term Loan Facility, the “USAA
AMCO Credit Facilities”) in an aggregate principal amount of up to $100 million. Proceeds from the USAA AMCO Term Loan Facility, together with cash on the Company’s balance sheet, were to be used to refinance in full all debt outstanding under the Company’s Existing Credit Agreement, finance the USAA AMCO Acquisition and finance the above mentioned Harvest Acquisition, thus effectively replacing the Harvest Commitment Letter.
As a result of entering into the Harvest Termination Agreement on April 22, 2019, the commitments under the USAA AMCO Credit Facilities Commitment Letter attributable to the financing for the Harvest Acquisition automatically terminated in accordance with their terms, thereby reducing the size of the USAA AMCO Term Loan Facility to $1.130 billion.
10. Equity
Share Rollforward
Thefollowing tables below present the changes in the number of shares of common stock issued and repurchased:repurchased (in thousands):
| | | | | | |
| | | | | | |
| | Shares of Common Stock Issued | | Shares of Treasury Stock |
| | Class A | Class B | | Class A | Class B |
Balance, December 31, 2018 | | 15,280,833 | 55,284,408 | | (856,275) | (2,146,980) |
Issuance of shares | | 952 | – | | – | – |
Share conversion - Class B to A | | 381,689 | (381,689) | | – | – |
Repurchase of shares | | – | – | | (122,957) | – |
Vesting of restricted share grants | | – | 39,636 | | – | – |
Exercise of options | | – | 71,652 | | – | – |
Shares withheld related to net settlement of equity awards | | – | – | | – | (29,108) |
Balance, March 31, 2019 | | 15,663,474 | 55,014,007 | | (979,232) | (2,176,088) |
| | | | | | |
| | | | | | | | |
| | Shares of Common Stock Issued | | Shares of Treasury Stock |
| | Class A | Class B | Pre-IPO | | Class A | Class B | Pre-IPO |
Balance, December 31, 2017 | | – | – | 57,182,730 | | – | – | (2,064,057) |
Issuance of Class A common stock | | 12,810,860 | – | – | | – | – | – |
Redesignation of common stock | | – | 57,184,766 | (57,184,766) | | | (2,064,057) | 2,064,057 |
Share conversion - Class B to A | | 88,455 | (88,455) | – | | – | – | – |
Vesting of restricted share grants | | – | 14,794 | 2,036 | | – | – | – |
Exercise of options | | | 5,000 | | | | | |
Fractional shares retired | | – | (263) | – | | – | – | – |
Balance, March 31, 2018 | | 12,899,315 | 57,115,842 | – | | – | (2,064,057) | – |
| | Shares of Common Stock Issued | | | Shares of Treasury Stock | |
| | Class A | | | Class B | | | Class A | | | Class B | |
Balance, December 31, 2019 | | | 18,100 | | | | 53,937 | | | | (1,685 | ) | | | (2,656 | ) |
Issuance of shares | | | 2 | | | | — | | | | — | | | | — | |
Share conversion - Class B to A | | | 406 | | | | (406 | ) | | | — | | | | — | |
Repurchase of shares | | | — | | | | — | | | | (240 | ) | | | — | |
Vesting of restricted share grants | | | — | | | | 719 | | | | — | | | | — | |
Exercise of options | | | — | | | | 288 | | | | — | | | | — | |
Shares withheld related to net settlement of equity awards | | | — | | | | — | | | | — | | | | (445 | ) |
Balance, March 31, 2020 | | | 18,508 | | | | 54,538 | | | | (1,925 | ) | | | (3,101 | ) |
Equity19
Table of Contents
| | Shares of Common Stock Issued | | | Shares of Treasury Stock | |
| | Class A | | | Class B | | | Class A | | | Class B | |
Balance, December 31, 2018 | | | 15,281 | | | | 55,284 | | | | (856 | ) | | | (2,147 | ) |
Issuance of shares | | | — | | | | — | | | | — | | | | — | |
Share conversion - Class B to A | | | 382 | | | | (382 | ) | | | — | | | | — | |
Repurchase of shares | | | — | | | | — | | | | (123 | ) | | | — | |
Vesting of restricted share grants | | | — | | | | 40 | | | | — | | | | — | |
Exercise of options | | | — | | | | 72 | | | | — | | | | — | |
Shares withheld related to net settlement of equity awards | | | — | | | | — | | | | — | | | | (29 | ) |
Balance, March 31, 2019 | | | 15,663 | | | | 55,014 | | | | (979 | ) | | | (2,176 | ) |
Share Repurchase Program
The share repurchase program authorized in 2018 for $15.0 million of the Company’s Class A common stock was completed in September 2019. In August 2019, the Company’s Board of Directors authorized the Company to repurchase up to an additional $15.0 million of the Company’s Class A common stock in the open market or in privately negotiated transactions (“2019 Share Repurchase Program”). The amount and timing of the purchases under the 2019 Share Repurchase Program will depend on a number of factors including the price and availability of the Company’s shares, trading volume, capital availability, Company performance and general economic and market conditions. The 2019 Share Repurchase Program can be suspended or discontinued at any time.
As of March 31, 2019,2020, a total of 979,2321,925,185 shares of Class A common stock had been repurchased under the initial share repurchase program authorized in 2018and the 2019 Share Repurchase Program at a total cost of $9.4$25.9 million andfor an average costprice of $9.59$13.46 per share, and $5.6share. As of March 31, 2020, $4.1 million was available for future repurchases. The repurchase program2019 Share Repurchase Program expires on December 31, 2019.2020.
Quarterly Dividends
Dividends paid during the three months ended March 31, 2020 included $3.4 million for the March 2020 quarterly dividend and $0.1 million in cash bonuses and distributions related to dividends previously declared upon vesting of restricted stock and stock option awards.
NOTE 11. Share‑Based Compensation
Current Period Activity
During the three months ended March 31, 2019,2020, the Company issued 518,385 restricted share grants,stock awards for 276,981 shares of common stock, of which 6,248awards for 3,238 shares were fully vested on the grant date and 478,849 willawards for 273,743 shares vest based on service over a three year periodperiod.
Stock option award and 33,288 will vest over a five year period.
Activityrestricted stock award activity during the three months ended March 31, 2020 and 2019 and 2018 related to stock option awards and restricted stock awards is shown in the tables below.was as follows:
| | | | | | | | | | | | | | | | | | |
| | Shares Subject to Stock Option Awards | | | Shares Subject to Stock Option Awards | |
| | Three Months Ended March 31, | | | Three Months Ended March 31, | |
| | 2019 | | 2018 | | | 2020 | | | 2019 | |
| | Avg wtd | | Avg wtd | | | | Avg wtd | | Avg wtd | | | | | Avg wtd | | | Avg wtd | | | | | | | Avg wtd | | | Avg wtd | | | | | |
| | grant-date | | exercise | | | | grant-date | | exercise | | | | | grant-date | | | exercise | | | | | | | grant-date | | | exercise | | | | | |
| | fair value | | price | | Units | | fair value | | price | | Units | | | fair value | | | price | | | Units | | | fair value | | | price | | | Units | |
Outstanding at beginning of period | | $ | 3.79 | | $ | 6.12 | | 9,070,052 | | $ | 3.66 | | $ | 5.71 | | 9,078,728 | | | $ | 3.83 | | | $ | 6.27 | | | | 7,880,167 | | | $ | 3.79 | | | $ | 6.12 | | | | 9,070,052 | |
Granted | | | — | | | — | | — | | | 6.52 | | | 14.27 | | 357,256 | | |
Forfeited | | | 6.52 | | | 14.27 | | (25,160) | | | 6.26 | | | 13.73 | | (4,552) | | | | 6.32 | | | | 13.80 | | | | 1,708 | | | | 6.52 | | | | 14.27 | | | | (25,160 | ) |
Exercised | | | 2.80 | | | 3.08 | | (71,652) | | | 2.54 | | | 2.45 | | (5,000) | | | | 3.74 | | | | 5.89 | | | | (287,565 | ) | | | 2.80 | | | | 3.08 | | | | (71,652 | ) |
Outstanding at end of the period | | $ | 3.79 | | $ | 6.12 | | 8,973,240 | | $ | 3.76 | | $ | 6.04 | | 9,426,432 | | | $ | 3.84 | | | $ | 6.28 | | | | 7,594,310 | | | $ | 3.79 | | | $ | 6.12 | | | | 8,973,240 | |
Vested | | $ | 3.41 | | $ | 4.95 | | 6,752,579 | | $ | 3.21 | | $ | 4.32 | | 5,872,927 | | | $ | 3.67 | | | $ | 5.75 | | | | 6,659,406 | | | $ | 3.41 | | | $ | 4.95 | | | | 6,752,579 | |
Unvested | | | 4.94 | | | 9.69 | | 2,220,661 | | | 4.68 | | | 8.88 | | 3,553,505 | | | | 5.04 | | | | 10.05 | | | | 934,904 | | | | 4.94 | | | | 9.69 | | | | 2,220,661 | |
20
Table of Contents
| | | | | | | | | | | | |
| | Restricted Stock Awards | | | Restricted Stock Awards | |
| | Three Months Ended March 31, | | | Three Months Ended March 31, | |
| | 2019 | | 2018 | | | 2020 | | | 2019 | |
| | Avg wtd grant- | | | | Avg wtd grant- | | | | | Avg wtd grant- | | | | | | | Avg wtd grant- | | | | | |
| | date fair value | | Units | | date fair value | | Units | | | date fair value | | | Units | | | date fair value | | | Units | |
Unvested at beginning of period | | $ | 13.17 | | 2,997,856 | | $ | 11.82 | | 1,293,107 | | | $ | 14.29 | | | | 3,215,619 | | | $ | 13.17 | | | | 2,997,856 | |
Granted | | | 14.97 | | 518,385 | | | 14.27 | | 1,678,743 | | | | 16.62 | | | | 276,981 | | | | 14.97 | | | | 518,385 | |
Vested | | | 13.15 | | (39,636) | | | 12.84 | | (16,830) | | | | 14.14 | | | | (719,531 | ) | | | 13.15 | | | | (39,636 | ) |
Forfeited | | | 14.02 | | (367,998) | | | — | | — | | | | 16.07 | | | | (2,390 | ) | | | 14.02 | | | | (367,998 | ) |
Unvested at end of period | | $ | 13.37 | | 3,108,607 | | $ | 13.20 | | 2,955,020 | | | $ | 14.62 | | | | 2,770,679 | | | $ | 13.37 | | | | 3,108,607 | |
Dividend Payments
As ofAt March 31, 20192020 and December 31, 2018,2019, the amount of cash bonuses and distributions related to dividends previously declared on unvested and outstanding restricted share awards and stock options totaled $1.8$1.2 million and $1.3 million, respectively, which iswas not recorded as a liability as of the balance sheet date. A liability will be recorded for these cash bonuses and dividends when the restricted shares and options vest.
Share-basedShare-Based Compensation Expense
The Company recorded $1.5$6.0 million and $3.3$1.5 million of share-based compensation expense in the three months ended March 31, 20192020 and 2018,2019, respectively, in personnel compensation and benefits expense in the unaudited condensed consolidated statementsCondensed Consolidated Statements of operations.Operations.
NOTE 12. Earnings Per Share
The computationfollowing table sets forth the reconciliation of basic earnings per share and diluted earnings per share is as follows:from net income for the three months ended March 31, 2020 and 2019:
| | | | | | | | |
| | Three Months Ended March 31, | | | Three Months Ended March 31, | |
(in thousands except per share amounts) | | 2019 | | 2018 | | | 2020 | | | 2019 | |
Net income | | $ | 14,527 | | $ | 10,524 | | | $ | 57,166 | | | $ | 14,527 | |
Shares: | | | | | | | | | | | | | | | |
Basic: Weighted average number of shares outstanding | | | 67,520,883 | | | 61,599,057 | | |
Plus: Incremental shares from assumed conversion of dilutive instruments | | | 4,760,995 | | | 4,684,564 | | |
Diluted: Weighted average number of shares outstanding | | | 72,281,878 | | | 66,283,621 | | |
Basic: Weighted average number of shares outstanding | | | | 67,790 | | | | 67,521 | |
Plus: Incremental shares from assumed conversion of dilutive instruments | | | | 6,560 | | | | 4,761 | |
Diluted: Weighted average number of shares outstanding | | | | 74,350 | | | | 72,282 | |
Earnings per share | | | | | | | | | |
Basic: | | | $ | 0.84 | | | $ | 0.22 | |
Diluted: | | | $ | 0.77 | | | $ | 0.20 | |
Outstanding instruments excluded from the computation of weighted average shares for diluted EPSearnings per share because the effect would be anti-dilutive totaled 1,365,71431 thousand and 1,646,8441.4 million for the three months ended March 31, 2020 and 2019, and 2018,
respectively. Holders of non-vested share-based compensation awards do not have rights to receive nonforfeitable dividends on the shares covered by the awards.
21
Table of Contents
NOTE 13. Equity Method Investment
The Company’s equity investment in Cerebellum totaled $7.9 million as of March 31, 2019, which is net of $1.1 million of cumulative losses recorded under the equity method of accounting. For the three months ended March 31, 2019 and 2018, losses from equity method investments, which are recorded in interest income and other income/(expense) in the unaudited condensed consolidated statements of operations, were immaterial. Equity method investments are recorded in other assets on the unaudited condensed consolidated balance sheets. The Company’s equity investment in Cerebellum was $5.5 million as of March 31, 2018, which was net of cumulative losses of $0.5 million.
14. Accumulated Other Comprehensive Income (Loss)Loss
The following table presents changes in accumulated other comprehensive income/(loss)loss by component for the three months ended March 31, 20192020 and 2018.2019.
| | | | | | | | | | |
| | | | | Cumulative | | | | | Available-for- | | | | | | | Cumulative | | | | | |
| | Available-for-sale | | Translation | | | | | Sale | | | Cash Flow | | | Translation | | | | | |
(in thousands) | | Securities | | Adjustment | | Total | | Securities | | | Hedges | | | Adjustment | | | Total | |
Balance, December 31, 2019 | | | $ | — | | | $ | — | | | $ | — | | | $ | — | |
Other comprehensive loss before reclassification and tax | | | | — | | | | (6,318 | ) | | | (88 | ) | | | (6,406 | ) |
Tax impact | | | | — | | | | 1,498 | | | | 21 | | | | 1,519 | |
Net current period other comprehensive loss | | | | — | | | | (4,820 | ) | | | (67 | ) | | | (4,887 | ) |
Balance, March 31, 2020 | | | $ | — | | | $ | (4,820 | ) | | $ | (67 | ) | | $ | (4,887 | ) |
Balance, December 31, 2018 | | $ | (59) | | $ | (27) | | $ | (86) | | $ | (59 | ) | | $ | — | | | $ | (27 | ) | | $ | (86 | ) |
Other comprehensive income/(loss) before reclassification and tax | | | — | | | 16 | | | 16 | |
Other comprehensive income before reclassification and tax | | | | — | | | | — | | | | 16 | | | | 16 | |
Tax impact | | | — | | | (4) | | | (4) | | | — | | | | — | | | | (4 | ) | | | (4 | ) |
Net current period other comprehensive income/(loss) | | | — | | | 12 | | | 12 | |
Net current period other comprehensive income | | | | — | | | | — | | | | 12 | | | | 12 | |
Cumulative effect of adoption of ASU 2016-01 and 2018-02 | | | 59 | | | 3 | | | 62 | | | 59 | | | | — | | | | 3 | | | | 62 | |
Balance, March 31, 2019 | | $ | — | | $ | (12) | | $ | (12) | | $ | — | | | $ | — | | | $ | (12 | ) | | $ | (12 | ) |
Balance, December 31, 2017 | | $ | 51 | | $ | 13 | | $ | 64 | |
Other comprehensive income/(loss) before reclassification and tax | | | 14 | | | 39 | | | 53 | |
Tax impact | | | (9) | | | (10) | | | (19) | |
Net current period other comprehensive income/(loss) | | | 5 | | | 29 | | | 34 | |
Balance, March 31, 2018 | | $ | 56 | | $ | 42 | | $ | 98 | |
NOTE 14. DERIVATIVES
Interest Rate Swaps
On March 27, 2020, the Company entered into the Swap to manage interest rate risk associated with a portion of its floating-rate long-term debt. The Swap has a notional amount of $450 million. The Company will pay interest at a fixed rate of interest of 3.465% and receive interest that varies with the three-month LIBOR rate.
The designation of a derivative instrument as a hedge and its ability to meet the hedge accounting criteria determine how the Company reflects the change in fair value of the derivative instrument. A derivative qualifies for hedge accounting treatment if, at inception, it meets defined correlation and effectiveness criteria. These criteria require that the anticipated cash flows and/or changes in fair value of the hedging instrument substantially offset those of the position being hedged.
The Swap is designated as a cash flow hedge. Accordingly, the Swap is measured at fair value with mark-to-market gains or losses deferred and included in accumulated other comprehensive income (loss), net of tax, to the extent the hedge is determined to be effective. Gains or losses from the Swap will be reclassified to interest expense in the same period during which the hedged transaction affects earnings.
At March 31, 2020, the fair value of the interest rate swap was $6.3 million, which was included in other liabilities on the unaudited Condensed Consolidated Balance Sheets.
NOTE 15. SUBSEQUENT EVENTS
Subsequent to March 31, 2020, the Company established a trading account to purchase its outstanding term loans in the open market and has bought back $31 million of outstanding term loans for a total debt reduction of $217 million since July 1, 2019.
On May 11, 2020, our Board of Directors declared a quarterly cash dividend of $0.05 per share on Victory common stock. The dividend is payable on June 25, 2020, to stockholders of record on June 10, 2020.
Item 2. Management’s Discussion and Analysis of Financial Condition and Results of Operations
Unless the context otherwise requires, references in this Quarterly Report on Form 10-Q to the “Company,” “Victory,” or in the first-person notations of “we,” “us,” and “our” shall mean Victory Capital Holdings, Inc., a Delaware corporation, and its wholly-owned subsidiaries.
The following discussion is intended to assist in the understanding of our financial position at March 31, 2020 and analysisDecember 31, 2019, results of operations for the three months ended March 31, 2020 and 2019, and cash flows for the three months ended March 31, 2020 and 2019, and should be read in conjunction with ourthe unaudited condensed consolidated financial statements and related notes thereto included elsewhere in this report,Quarterly Report on Form 10-Q and with our audited financialAnnual Report on Form 10-K for the year ended
22
Table of Contents
December 31, 2019. This discussion and analysis contains forward-looking statements notes thereto and Management’s Discussionshould also be read in conjunction with the disclosures and Analysis of Financial Conditioninformation contained in “Forward-Looking Statements” included elsewhere in this Quarterly Report on Form 10-Q and Results of Operationsin “Item 1A. Risk Factors” included in the Annual Report on Form 10-K for the year ended December 31, 2019.
On March 11, 2020, the World Health Organization declared the outbreak of the novel coronavirus (“COVID-19”) a pandemic. The global spread of COVID-19 has created significant volatility, uncertainty and economic disruption. We are closely monitoring the impact of the outbreak of COVID-19 on all aspects of our 2018 Form 10-K. Ourbusiness. While COVID-19 did not have a material adverse effect on our reported results for our first quarter, the extent to which the COVID-19 pandemic impacts our business, operations and financial results going forward will depend on numerous evolving factors that we may not be able to accurately predict, including: the duration and scope of operations for interim periods are not necessarily indicative of resultsthe pandemic; governmental, business and individuals’ actions that have been and continue to be expected fortaken in response to the full year or for any other period.pandemic; the impact of the pandemic on economic activity and actions taken in response; and the effect on our ability to sell and provide our services.
Overview
We are an investmenta diversified global asset management firm operating a next generation business model combining boutique investment qualities with the benefits of a fully integrated, multi-boutique model with $58.1centralized operating and distribution platform. We have $123.8 billion in AUMassets under management (“AUM”) as of March 31, 2019.2020. Our differentiated model features a scalable operating platform that provides centralized distribution, marketing and operations infrastructure to our Franchises and Solutions. Our earnings are primarily driven by asset-based fees charged for services related to the investment strategies we deliver and consist of investment management, fund administration and distribution fees.
Franchises
Our Franchises are operationally integrated, but are separately branded and make investment decisions independently from one another within guidelines established by their respective investment mandates. Our integrated multi-boutique model creates a supportive environment in which our investment professionals, largely unencumbered by administrative and operational responsibilities, can focus on their pursuit of investment excellence. VCMVictory Capital Management Inc. (“VCM”) employs all of our U.S.the Company’s United States investment professionals across our Franchises, which are not separate legal entities.
Solutions
Our Solutions Platform consists of multi-Franchise and customized solutions strategies that are primarily rules-based. We offer our Solutions Platform through a variety of vehicles, including separate accounts, mutual funds and VictoryShares which is our ETF brand. Like our Franchises, our Solutions Platform is operationally integrated and supported by our centralized distribution, marketing and operational support functions. Our approach furthers our commitment to rules‑based investing and includes single and multi‑factor strategies designed to provide a variety of outcomes, including maximum diversification, dividend income, downside mitigation, minimum volatility, thematic and targeted factor exposure.
Operations
Our centralized operations functions provide our Franchises and Solutions Platform with the support they need so that they can focus on their investment processes. Our centralized operations functions include trading platforms, risk and compliance, middle‑ and back‑office support, technology, finance, human resources, accounting and legal. Although our operations are centralized, we do allow our Franchises a degree of customization with respect to their desired investment support functions, which we believe helps them maintain their individualized investment processes and minimize undue disruptions.
We outsource certain middle‑ and back‑office activities, such as sub-transfer agent, trade settlement, portfolio analytics, custodian reconciliation, portfolio accounting, corporate action processing, performance calculation and client reporting, to scaled, recognized service providers, who provide their services to us on a variable‑cost basis. Systems and processes are customized as necessary to support our investment processes and operations. We maintain relationships with multiple vendors for the majority of our outsourced functions, which we believe mitigates vendor‑specific risk. We also have information security, business continuity and data privacy programs in place to help mitigate risk.
Outsourcing these functions enables us to grow our AUM, both organically and through acquisitions, without the incremental capital expenditures and working capital that would typically be needed. Under our direction and oversight, our outsourced model enhances our ability to integrate our acquisitions, as we are experienced in working with our vendors to efficiently bring additional Franchises onto our platform in a cost‑efficient manner.
We believe both the scalability of our business and our cost structure, in which approximately two‑thirds of our operating expenses are variable, should drive industry-leading margins and facilitate free cash flow conversion. Additionally, we believe having a majority of our expenses tied to AUM and the number of client accounts provides downside margin protection should there be sustained net outflows or adverse market conditions.
23
Table of Contents
Professionals within our institutional, retail and direct member distribution channels and marketing organization sell our products through our centralized distribution model with 92 professionals across both our institutional and retail distribution channels and marketing organization.model. Our institutional sales team focuses on cultivating relationships with institutional consultants, who account for the majority of the institutional market, as well as asset allocators seeking sub-advisers. Our retail sales team offers intermediary and retirement platform clients, including broker-dealers, retirement platforms and RIA networks, mutual funds and ETFs as well as SMAs through wrap fee programs and access to our investment models through UMAs. Our direct member channel serves the investment needs of individual clients including USAA members and the military community.
We have grown our AUM from $17.9 billion following the management-led buyout with Crestview GP in August 2013 to $58.1$123.8 billion at March 31, 2019.2020. We attribute this growth to our success in sourcing acquisitions and evolving them into organic growers, generating strong investment returns, and developing institutional, retail, and institutionaldirect member distribution channels with deep penetration.
USAA AMCO Acquisition
On November 6, 2018, weEffective July 1, 2019, the Company completed the USAA AMCO Acquisition, a transformative acquisition that increased AUM by $81.1 billion and significantly impacted our financial results for the three month period ended March 31, 2020. The acquisition not only increased AUM and revenue, but also introduced additional personnel expenses and new and additional operating expenses such as third party distribution costs, expenses related to a transfer services agreement with USAA, 529 College Savings Plan, and direct member channel expenses that the Company did not incur prior to the acquisition. In conjunction with the USAA AMCO Acquisition, the Company entered into the 2019 Credit Agreement, dated July 1, 2019, and obtained a seven-year term loan in an aggregate principal amount of $1.1 billion. All indebtedness outstanding under the previous credit agreement was repaid and terminated as of July 1, 2019.
The USAA AMCO Acquisition expands and diversifies our investment platform, particularly in the fixed income and solutions asset classes, and increases our size and scale. Additional products added to acquireour investments platform include target date and target risk strategies, managed volatility mutual funds, active fixed income ETFs, sub-advised and multi-manager equity funds. We have also added to our lineup of asset allocation portfolios and smart beta equity ETFs. Through the acquisition, the Company has the rights to offer products and services using the USAA Acquired Companiesbrand for a period of time and their Mutual Fund and ETF businesses andthe opportunity to offer its products to USAA members through a direct member channel. In addition, we have entered into a referral agreement with USAA for members that are interested in investing in USAA Funds or the USAA 529 College Savings Plan. The USAA Acquired Companies have proven expertise in managing fixed income, global multi-asset and equity strategies through both internal investment teams and external subadvisors. We expect
Total consideration for the USAA AMCO Acquisition will diversify ourwas $949.4 million, comprising of $851.3 million of cash paid at closing plus $98.8 million as the estimated fair value of contingent consideration as of the acquisition date less $0.7 million in net working capital adjustments settled in the first quarter of 2020. A maximum of $150.0 million ($37.5 million per year) in contingent payments is payable to sellers based on the annual revenue of USAA Adviser attributable to all “non-managed money”-related AUM expand our investment capabilities, increase our size and scale and introduce a new and unique USAA direct-member distribution channel to our existing distribution platform.
in each of the first four years following the closing date.
The estimated fair value of contingent consideration arrangements as of March 31, 2020 was $113.2 million and consist of the USAA AMCO Acquisitionearn-out payment liability, which is expectedincluded in consideration payable for acquisition of business in the unaudited Condensed Consolidated Balance Sheets. Refer to close on July 1, 2019. See Note 4, ofAcquisitions, to the unaudited condensed consolidated financial statements for further details on the USAA AMCO Acquisition and Part II – Other Information - Item 1A “Risk Factors” for further discussion of the risks related to this acquisition.
Harvest Purchase Agreement
On April 22, 2019, we, Harvest and the Members’ Representative entered into the Harvest Termination Agreement to mutually terminate the Harvest Purchase Agreement as of that date. Neither we nor Harvest will be responsible for any termination fee to the other party as a result of the termination.
Acquisition.
Business Highlights
Assets under management:
| ·•
| | AUM was $58.1 billion at March 31, 2019 compared2020 decreased by $28.1 billion, or 18.5%, to $52.8$123.8 billion from $151.8 billion at December 31, 2018, up 10%2019, driven by negative market movement partially offset byaction and net outflows. Our Global / Non-U.S. Equity asset class saw net inflows during the quarter while U.S. Mid Cap Equityoutflows of $25.2 billion and U.S Large Cap Equity accounted for the majority of the net outflows.$2.9 billion, respectively. |
| • | AUM at March 31, 2020 and 2019 was $123.8 billion and $58.1 billion, respectively. We generated $3.0$14.9 billion in gross flows and ($1.1)$2.9 billion in negative net flows for the three months ended March 31, 20192020 compared to $3.7$3.0 billion in gross flows and ($0.6)$1.1 billion respectively,in negative net flows for the three months ended March 31, 2018.same period in 2019. |
Investment performance:
| ·•
| | Our Franchises and Solutions had strong investment performance. As39 of March 31, 2019, 24 of our Victory Capital mutual funds and ETFs havehad overall Morningstar ratings of four or five stars and 67%61% of our fund and ETF AUM were rated four or five stars overall by Morningstar. As of March 31, 2019, 60%44% of our strategies by AUM had investment returns in excess of their respective benchmarks over a one-year period, 75%55% over a three-year period, 74%69% over a five-year period and 90%79% over a ten-year period. On an equal-weighted basis, 55%31% of our strategies have outperformed their benchmarks over a one-year period, 55%41% over a three-year period, 63%48% over a five-year period and 81%67% over a ten-year period.
|
Industry achievements and recognition:
| ·•
| | The industry recognized us for our achievements. For the fourth consecutive year, eVestment ranked us in the top 5 in their 2018 Institutional Brand Awareness by AUM category. We ranked 97th in “Barron’s Best Fund Families of 2018”2019” for the one-yearfive-year period and 10th for the 10-year period ended December 31, 2018.2019. We also ranked 4th in the mixed asset category and 5th in the taxable bond category.17th overall on a one-year basis for 2019. This is the 2nd3rd consecutive year that we have
|
24
Table of Contents
| | been ranked among the top 10 best fund families and the 56th consecutive year that we have been ranked among the top 25 best fund families by Barron’s. |
Financial highlights:
| ·•
| | Total revenue for the three months ended March 31, 20192020 was $87.5$204.4 million compared to $105.0$87.5 million for the same period in 2019. |
| • | Net income was $57.2 million for the three months ended March 31, 2018.2020 compared to $14.5 million for the same period in 2019. |
| ·•
| | Net incomeAdjusted EBITDA was $14.5$91.5 million for the three months ended March 31, 20192020, or 44.8% of revenue, compared to $33.6 million, or 38.4% of revenue, for the same period in 2019. Refer to “Supplemental Non-GAAP Financial Information” for further information about the Adjusted EBITDA calculation and reconciliation of generally accepted accounting principles (“GAAP”) net income of $10.5to Adjusted EBITDA.
|
| • | Adjusted Net Income was $61.7 million for the three months ended March 31, 2018. |
| ·
| | Adjusted EBITDA was $33.6 million for the three months ended March 31, 20192020 compared to $39.8 million for the three months ended March 31, 2018. As a percentage of revenue, Adjusted EBITDA margin was 38.4% in the first quarter of 2019, compared with 37.9% in the first quarter of 2018. See “—Supplemental Non-GAAP Financial Information” for more information about how we calculate Adjusted EBITDA and a reconciliation of net income to Adjusted EBITDA.
|
| ·
| | Adjusted Net Income was $21.9 million for the three months ended March 31, 2019 compared2019. Refer to $23.1 million for the three months ended March 31, 2018. See “—Supplemental“Supplemental Non-GAAP Financial Information” for morefurther information about how we calculatethe Adjusted Net Income calculation and a reconciliation of GAAP net income to Adjusted Net Income.
|
Key Performance Indicators
When we review ourThe following table is a summary of key performance we focus on the indicators described below:utilized by management to assess results of operations:
| | | | | | | | |
| | Three Months Ended March 31, | | |
($ in millions) | | 2019 | | 2018 | | |
AUM at period end | | $ | 58,119 | | $ | 60,855 | | |
Average AUM | | | 57,043 | | | 62,020 | | |
Gross flows | | | 3,038 | | | 3,685 | | |
Net flows | | | (1,105) | | | (633) | | |
Total revenue (1) | | | 87.5 | | | 105.0 | | |
Revenue on average AUM(1) | | | 62 | bps | | 69 | bps | |
Net income | | | 14.5 | | | 10.5 | | |
Adjusted EBITDA(2) | | | 33.6 | | | 39.8 | | |
Adjusted EBITDA Margin(1)(3) | | | 38.4 | % | | 37.9 | % | |
Adjusted Net Income(2) | | | 21.9 | | | 23.1 | | |
Tax benefit of goodwill and acquired intangibles(4) | | | 3.4 | | | 3.3 | | |
| | Three Months Ended March 31, | |
($ in millions, except for basis points and percentages) | | 2020 | | | 2019 | |
AUM at period end | | $ | 123,779 | | | $ | 58,119 | |
Average AUM | | | 144,112 | | | | 57,043 | |
Gross flows | | | 14,925 | | | | 3,038 | |
Net flows | | | (2,900 | ) | | | (1,105 | ) |
Total revenue | | | 204.4 | | | | 87.5 | |
Revenue on average AUM | | 57 bps | | | 62 bps | |
Net income | | | 57.2 | | | | 14.5 | |
Adjusted EBITDA(1) | | | 91.5 | | | | 33.6 | |
Adjusted EBITDA Margin(2) | | | 44.8 | % | | | 38.4 | % |
Adjusted Net Income(1) | | | 61.7 | | | | 21.9 | |
Tax benefit of goodwill and acquired intangibles(3) | | | 6.7 | | | | 3.4 | |
(1) | (1)
| | On January 1, 2019, the Company adopted ASU 2014-09 and now records all Mutual Fund and ETF waivers and expense reimbursements as a reduction of reported revenue and not as an expense item. The impact in the three months ended March 31, 2019 was a $4.1 million decrease in revenue and operating expenses. Because the Company adopted the new guidance using the modified retrospective method, prior periods have not been restated.
|
| (2)
| | Our management usesManagement utilizes Adjusted EBITDA and Adjusted Net Income to measure the operating profitability of the business. These measures eliminate the impact of one‑time acquisition, restructuring and integration costs and demonstrate the ongoing operating earnings metrics of the business. These measures are explained in more detail and reconciled to net income calculated in accordance with GAAP in “—Supplemental“Supplemental Non‑GAAP Financial Information.”
|
| (3)
| (2) | Adjusted EBITDA margin represents Adjusted EBITDA as a percentage of total revenue. |
| (4)
| (3) | Represents the tax benefits associated with deductions allowed for intangibles and goodwill generated from prior acquisitions in which we received a step-up in basis for tax purposes. Acquired intangible assets and goodwill may be amortized for tax purposes, generally over a 15-year period. The tax benefit from amortization on these assets is included to show the full economic benefit of deductions for all acquired intangibles with a step-up in tax basis. Due to our acquisitive nature, tax deductions allowed on acquired intangible assets and goodwill provide us with a significant supplemental economic benefit. |
Assets Under Management
Due to rounding, AUM numbers presented in the tables below may not add up precisely to the totals provided.
Our profitability is largely affected by the level and composition of our AUM (including asset class and distribution channel) and the effective fee rates on our products. The amount and composition of our AUM are, and will continue to be, influenced by a number of factors, including:
| ·
| | including; (i) investment performance, including fluctuations in the financial markets and the quality of our investment decisions; |
| ·
| | client flows into and out of our various strategies and investment vehicles;
|
| ·
| | industry trends toward products or strategies that we either do or do not offer;
|
| ·
| | our ability to attract and retain high quality investment, distribution, marketing and management personnel;
|
| ·
| | our decision to close strategies or limit growth of assets in a strategy when we believe it is in the best interest of our clients or conversely to re‑open strategies in part or entirely; and
|
| ·
| | general investor sentiment and confidence.
|
our investment decisions; (ii) client flows into and out of our various strategies and investment vehicles; (iii) industry trends toward products or strategies that we either do or do not offer; (iv) our ability to attract and retain high quality investment, distribution, marketing and management personnel; (v) our decision to close strategies or limit growth of assets in a strategy when we believe it is in the best interest of our clients or conversely to re‑open strategies in part or entirely; and (vi) general investor sentiment and confidence. Our goal is to establish and maintain a client base that is diversified by Franchise and Solutions, asset class, distribution channel and vehicle. The chartDue to rounding, AUM numbers presented in the tables below sets forth our AUM by Franchise and Solutions as of March 31, 2019:
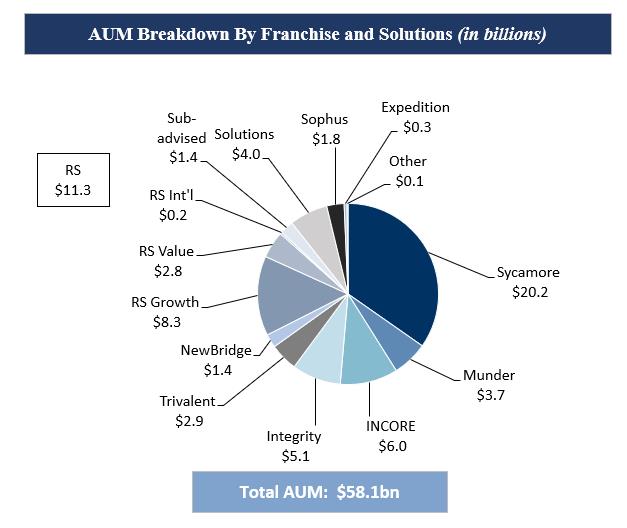
The following table presents our AUM by asset class as of the dates indicated:
| | | | | | | |
| | As of | |
| | March 31, | |
(in millions) | | 2019 | | 2018 | |
U.S. Mid Cap Equity | | $ | 22,169 | | $ | 24,205 | |
U.S. Small Cap Equity | | | 14,714 | | | 15,095 | |
Fixed Income | | | 6,973 | | | 7,311 | |
U.S. Large Cap Equity | | | 4,117 | | | 4,635 | |
Global / Non-U.S. Equity | | | 5,234 | | | 4,334 | |
Solutions | | | 3,996 | | | 3,563 | |
Commodity | | | 493 | | | 1,298 | |
Other | | | 425 | | | 414 | |
Total | | $ | 58,119 | | $ | 60,855 | |
25
Table of Contents
| | As of | |
| | March 31, | |
(in millions) | | 2020 | | | 2019 | |
Fixed Income | | $ | 35,402 | | | $ | 6,973 | |
Solutions | | | 25,526 | | | | 3,996 | |
U.S. Mid Cap Equity | | | 18,622 | | | | 22,169 | |
U.S. Small Cap Equity | | | 11,885 | | | | 14,714 | |
U.S. Large Cap Equity | | | 10,703 | | | | 4,117 | |
Global / Non-U.S. Equity | | | 9,372 | | | | 5,234 | |
Other | | | 140 | | | | 918 | |
Total Long-Term Assets | | $ | 111,650 | | | $ | 58,119 | |
Money Market & Short-Term Assets | | | 12,129 | | | | — | |
Total | | $ | 123,779 | | | $ | 58,119 | |
The following table summarizestables summarize our asset flows by asset class for the periods indicated:
| | | | | | | | | | | | | | | | | | | | | | | | | | | | |
| | | | | U.S. | | | | | U.S. | | | | | | | | | | | | | | | | | | | | | | | | | | | | | | | | | | | | | | | | | | | | | | | | | | | | | | | |
| | U.S. Mid | | Small | | | | | Large | | Global / | | | | | | | | | | | | | | U.S. Mid | | | U.S. Small | | | | | | | U.S. Large | | | Global / | | | | | | | | | | | | | | | Money | | | | | |
| | Cap | | Cap | | Fixed | | Cap | | Non-U.S. | | | | | | | | | | | | | | Cap | | | Cap | | | Fixed | | | Cap | | | Non-U.S. | | | | | | | | | | | Total | | | Market / | | | | | |
(in millions) | | Equity | | Equity | | Income | | Equity | | Equity | | Solutions | | Commodity | | Other | | Total | | Equity | | | Equity | | | Income | | | Equity | | | Equity | | | Solutions | | | Other | | | Long-term | | | Short-term | | | Total | |
For Three Months Ended March 31, 2019 | | | | | | | | | | | | | | | | | | | | | | | | | | | | |
For the Three Months Ended March 31, 2020 | | | | | | | | | | | | | | | | | | | | | | | | | | | | | | | | | | | | | | | | | |
Beginning AUM | | $ | 20,019 | | $ | 12,948 | | $ | 6,836 | | $ | 3,759 | | $ | 4,610 | | $ | 3,767 | | $ | 469 | | $ | 355 | | $ | 52,763 | | $ | 26,347 | | | $ | 17,346 | | | $ | 37,973 | | | $ | 14,091 | | | $ | 12,603 | | | $ | 31,649 | | | $ | 236 | | | $ | 140,245 | | | $ | 11,587 | | | $ | 151,832 | |
Gross client cash inflows | | | 993 | | | 992 | | | 303 | | | 26 | | | 365 | | | 279 | | | 56 | | | 25 | | | 3,038 | | | 1,474 | | | | 1,233 | | | | 1,951 | | | | 238 | | | | 671 | | | | 1,695 | | | | 11 | | | | 7,273 | | | | 7,652 | | | | 14,925 | |
Gross client cash outflows | | | (1,786) | | | (1,059) | | | (383) | | | (183) | | | (277) | | | (349) | | | (80) | | | (27) | | | (4,143) | | | (2,265 | ) | | | (1,310 | ) | | | (2,890 | ) | | | (807 | ) | | | (684 | ) | | | (2,394 | ) | | | (24 | ) | | | (10,374 | ) | | | (7,451 | ) | | | (17,825 | ) |
Net client cash flows | | | (793) | | | (67) | | | (79) | | | (158) | | | 88 | | | (70) | | | (24) | | | (2) | | | (1,105) | | | (791 | ) | | | (77 | ) | | | (939 | ) | | | (569 | ) | | | (13 | ) | | | (699 | ) | | | (12 | ) | | | (3,101 | ) | | | 201 | | | | (2,900 | ) |
Market appreciation / (depreciation) | | | | (6,907 | ) | | | (5,325 | ) | | | (1,361 | ) | | | (2,828 | ) | | | (3,245 | ) | | | (5,436 | ) | | | (86 | ) | | | (25,187 | ) | | | 34 | | | | (25,153 | ) |
Net transfers | | | 2 | | | (1) | | | — | | | (1) | | | — | | | 1 | | | — | | | (1) | | | — | | | (28 | ) | | | (59 | ) | | | (272 | ) | | | 9 | | | | 27 | | | | 12 | | | | 3 | | | | (307 | ) | | | 307 | | | | — | |
Market appreciation / (depreciation) | | | 2,942 | | | 1,834 | | | 216 | | | 516 | | | 535 | | | 297 | | | 47 | | | 73 | | | 6,460 | |
Ending AUM | | $ | 22,169 | | $ | 14,714 | | $ | 6,973 | | $ | 4,117 | | $ | 5,234 | | $ | 3,996 | | $ | 493 | | $ | 425 | | $ | 58,119 | | $ | 18,622 | | | $ | 11,885 | | | $ | 35,402 | | | $ | 10,703 | | | $ | 9,372 | | | $ | 25,526 | | | $ | 140 | | | $ | 111,650 | | | $ | 12,129 | | | $ | 123,779 | |
For Three Months Ended March 31, 2018 | | | | | | | | | | | | | | | | | | | | | | | | | | | | |
For the Three Months Ended March 31, 2019 | | | | | | | | | | | | | | | | | | | | | | | | | | | | | | | | | | | | | | | | | |
Beginning AUM | | $ | 25,185 | | $ | 15,308 | | $ | 7,551 | | $ | 4,789 | | $ | 4,105 | | $ | 3,028 | | $ | 1,419 | | $ | 386 | | $ | 61,771 | | $ | 20,019 | | | $ | 12,948 | | | $ | 6,836 | | | $ | 3,759 | | | $ | 4,610 | | | $ | 3,767 | | | $ | 824 | | | $ | 52,763 | | | $ | — | | | $ | 52,763 | |
Gross client cash inflows | | | 1,203 | | | 776 | | | 394 | | | 55 | | | 443 | | | 606 | | | 127 | | | 81 | | | 3,685 | | | 993 | | | | 992 | | | | 303 | | | | 26 | | | | 365 | | | | 279 | | | | 81 | | | | 3,038 | | | | — | | | | 3,038 | |
Gross client cash outflows | | | (2,080) | | | (922) | | | (640) | | | (211) | | | (220) | | | (77) | | | (146) | | | (22) | | | (4,318) | | | (1,786 | ) | | | (1,059 | ) | | | (383 | ) | | | (183 | ) | | | (277 | ) | | | (349 | ) | | | (107 | ) | | | (4,143 | ) | | | — | | | | (4,143 | ) |
Net client cash flows | | | (877) | | | (146) | | | (246) | | | (156) | | | 223 | | | 529 | | | (19) | | | 59 | | | (633) | | | (793 | ) | | | (67 | ) | | | (79 | ) | | | (158 | ) | | | 88 | | | | (70 | ) | | | (26 | ) | | | (1,105 | ) | | | — | | | | (1,105 | ) |
Market appreciation / (depreciation) | | | | 2,942 | | | | 1,834 | | | | 216 | | | | 516 | | | | 535 | | | | 297 | | | | 120 | | | | 6,460 | | | | — | | | | 6,460 | |
Net transfers | | | — | | | — | | | — | | | (1) | | | (8) | | | 40 | | | — | | | (39) | | | (8) | | | 2 | | | | (1 | ) | | | — | | | | (1 | ) | | | — | | | | 1 | | | | (1 | ) | | | — | | | | — | | | | — | |
Market appreciation / (depreciation) | | | (103) | | | (67) | | | 6 | | | 3 | | | 14 | | | (34) | | | (102) | | | 8 | | | (275) | |
Ending AUM | | $ | 24,205 | | $ | 15,095 | | $ | 7,311 | | $ | 4,635 | | $ | 4,334 | | $ | 3,563 | | $ | 1,298 | | $ | 414 | | $ | 60,855 | | $ | 22,169 | | | $ | 14,714 | | | $ | 6,973 | | | $ | 4,117 | | | $ | 5,234 | | | $ | 3,996 | | | $ | 918 | | | $ | 58,119 | | | $ | — | | | $ | 58,119 | |
The following table presents our AUM by distribution channel as of the dates indicated:
| | | | | | | | | | | | |
| | As of March 31, | | | As of March 31, | |
| | 2019 | | 2018 | | | 2020 | | | 2019 | |
(in millions) | | Amount | | % of total | | Amount | | % of total | | | Amount | | | % of total | | | Amount | | | % of total | |
Member | | | $ | 64,188 | | | | 52 | % | | $ | — | | | | 0 | % |
Institutional | | $ | 32,714 | | 56 | % | $ | 35,116 | | 58 | % | | | | 30,235 | | | | 24 | % | | | 32,714 | | | | 56 | % |
Retail | | | 25,405 | | 44 | % | | 25,739 | | 42 | % | | | | 29,356 | | | | 24 | % | | | 25,405 | | | | 44 | % |
Total AUM(1) | | $ | 58,119 | | 100 | % | $ | 60,855 | | 100 | % | | | $ | 123,779 | | | | 100 | % | | $ | 58,119 | | | | 100 | % |
| (1)
| | The allocation of AUM by distribution channel involves the use of estimates and the exercise of judgment.
|
(1)The allocation of AUM by distribution channel involves the use of estimates and the exercise of judgment.
26
Table of Contents
The following table summarizestables summarize our asset flows by vehicle for the periods indicated:
| | | | | | | | | | | | | |
| | | | | | | | Separate | | | | | | | | | | | | | Separate | | | | | |
| | | | | | | | Accounts and | | | | | | | | | | | | | Accounts and | | | | | |
| | | | | | | | Other | | | | | | | | | | | | | Other | | | | | |
(in millions) | | Mutual Funds(1) | | ETFs | | Vehicles(2) | | Total | | Mutual Funds(1) | | | ETFs(2) | | | Vehicles(3) | | | Total | |
Three Months Ended March 31, 2020 | | | | | | | | | | | | | | | | | |
Beginning AUM | | | $ | 118,605 | | | $ | 4,213 | | | $ | 29,014 | | | $ | 151,832 | |
Gross client cash inflows | | | | 13,745 | | | | 255 | | | | 925 | | | | 14,925 | |
Gross client cash outflows | | | | (15,631 | ) | | | (461 | ) | | | (1,733 | ) | | | (17,825 | ) |
Net client cash flows | | | | (1,886 | ) | | | (205 | ) | | | (809 | ) | | | (2,900 | ) |
Market appreciation (depreciation) | | | | (18,413 | ) | | | (830 | ) | | | (5,910 | ) | | | (25,153 | ) |
Net transfers | | | | — | | | | — | | | | — | | | | — | |
Ending AUM | | | $ | 98,305 | | | $ | 3,177 | | | $ | 22,296 | | | $ | 123,779 | |
Three Months Ended March 31, 2019 | | | | | | | | | | | | | | | | | | | | | | | | | | | | |
Beginning AUM | | $ | 30,492 | | $ | 2,956 | | $ | 19,315 | | $ | 52,763 | | $ | 30,492 | | | $ | 2,956 | | | $ | 19,315 | | | $ | 52,763 | |
Gross client cash inflows | | | 2,379 | | | 242 | | | 417 | | | 3,038 | | | 2,379 | | | | 242 | | | | 417 | | | | 3,038 | |
Gross client cash outflows | | | (2,887) | | | (299) | | | (957) | | | (4,143) | | | (2,887 | ) | | | (299 | ) | | | (957 | ) | | | (4,143 | ) |
Net client cash flows | | | (508) | | | (58) | | | (540) | | | (1,105) | | | (508 | ) | | | (58 | ) | | | (540 | ) | | | (1,105 | ) |
Market appreciation (depreciation) | | | | 3,801 | | | | 224 | | | | 2,435 | | | | 6,460 | |
Net transfers | | | — | | | — | | | — | | | — | | | — | | | | — | | | | — | | | | — | |
Market appreciation / (depreciation) | | | 3,801 | | | 224 | | | 2,435 | | | 6,460 | |
Ending AUM | | $ | 33,786 | | $ | 3,123 | | $ | 21,210 | | $ | 58,119 | | $ | 33,786 | | | $ | 3,123 | | | $ | 21,210 | | | $ | 58,119 | |
Three Months Ended March 31, 2018 | | | | | | | | | | | | | |
Beginning AUM | | $ | 37,967 | | $ | 2,250 | | $ | 21,555 | | $ | 61,771 | |
Gross client cash inflows | | | 2,626 | | | 481 | | | 578 | | | 3,685 | |
Gross client cash outflows | | | (3,266) | | | (29) | | | (1,023) | | | (4,318) | |
Net client cash flows | | | (640) | | | 452 | | | (445) | | | (633) | |
Net transfers | | | (31) | | | — | | | 22 | | | (8) | |
Market appreciation / (depreciation) | | | (307) | | | (28) | | | 60 | | | (275) | |
Ending AUM | | $ | 36,989 | | $ | 2,674 | | $ | 21,192 | | $ | 60,855 | |
| | | | | | | | | | | | | |
| (1) | | Includes institutional and retail share classes, money market and Variable Insurance Products or VIP funds. |
| (2) | Excludes assets managed for other proprietary product (i.e. funds of funds) in order to adjust for double counting. |
(3) | Includes collective trust funds, wrap program separate accounts and unified managed accounts or UMAs. |
March 31, 2020 AUM compared to December 31, 2019 AUM. At March 31, 2019,2020, our total AUM was $58.1$123.8 billion, an increasea decrease of $5.3$28.1 billion, or 10% compared to $52.818.5%, from $151.8 billion at December 31, 2018. The increase in AUM reflects net2019, primarily driven by negative market appreciation of $6.5 billionaction and net outflows of ($1.1) billion.$25.2 billion and $2.9 billion, respectively. The net outflows were primarilynegative market action was driven by pullback in the market as a result of ($0.8) billion inthe economic uncertainty due to the COVID-19 pandemic.
Net outflows were driven by our fixed income strategies, U.S. mid cap equity strategies ($0.2)and Solutions platform of $0.9 billion, in our U.S. large cap equity strategies$0.8 billion and ($0.1)$0.7 billion, in eachrespectively. Money market and short-term assets accounted for $12.1 billion, or 9.8%, of our U.S. small cap equity strategies, Solutions and fixed income strategies, partially offset by $0.1the total AUM of $123.8 billion in our global / non-U.S. equity strategies.at March 31, 2020.
27
GAAP Results of Operations
OurThe following table presents our GAAP results of operations were as follows for the three months ended March 31, 20192020 and 2018.
| | | | | | | | | | | | |
| | Three Months Ended March 31, | | Change | |
(in thousands, except for shares) | | 2019 | | 2018 | | Amount | | % | |
Revenue | | | | | | | | | | | | |
Investment management fees | | $ | 74,411 | | $ | 89,130 | | $ | (14,719) | | -17 | % |
Fund administration and distribution fees | | | 13,068 | | | 15,834 | | | (2,766) | | -17 | % |
Total revenue | | | 87,479 | | | 104,964 | | | (17,485) | | -17 | % |
| | | | | | | | | | | | |
Expenses | | | | | | | | | | | | |
Personnel compensation and benefits | | | 34,501 | | | 36,803 | | | (2,302) | | -6 | % |
Distribution and other asset-based expenses | | | 15,767 | | | 25,161 | | | (9,394) | | -37 | % |
General and administrative | | | 7,087 | | | 9,056 | | | (1,969) | | -22 | % |
Depreciation and amortization | | | 5,222 | | | 6,412 | | | (1,190) | | -19 | % |
Acquisition-related costs | | | 2,777 | | | — | | | 2,777 | | n/m | |
Restructuring and integration costs | | | — | | | 264 | | | (264) | | -100 | % |
Total operating expenses | | | 65,354 | | | 77,696 | | | (12,342) | | -16 | % |
| | | | | | | | | | | | |
Income from operations | | | 22,125 | | | 27,268 | | | (5,143) | | -19 | % |
| | | | | | | | | | | | |
Other income (expense) | | | | | | | | | | | | |
Interest income and other income/(expense) | | | 1,833 | | | (37) | | | 1,870 | | 5,054 | % |
Interest expense and other financing costs | | | (4,624) | | | (7,092) | | | 2,468 | | 35 | % |
Loss on debt extinguishment | | | — | | | (6,058) | | | 6,058 | | 100 | % |
Total other income (expense), net | | | (2,791) | | | (13,187) | | | 10,396 | | 79 | % |
| | | | | | | | | | | | |
Income before income taxes | | | 19,334 | | | 14,081 | | | 5,253 | | 37 | % |
| | | | | | | | | | | | |
Income tax expense | | | (4,807) | | | (3,557) | | | (1,250) | | -35 | % |
| | | | | | | | | | | | |
Net income | | $ | 14,527 | | $ | 10,524 | | $ | 4,003 | | 38 | % |
| | | | | | | | | | | | |
Earnings per share of common stock | | | | | | | | | | | | |
Basic | | $ | 0.22 | | $ | 0.17 | | $ | 0.05 | | 29 | % |
Diluted | | $ | 0.20 | | $ | 0.16 | | $ | 0.04 | | 25 | % |
| | | | | | | | | | | | |
Weighted average number of shares outstanding | | | | | | | | | | | | |
Basic | | | 67,520,883 | | | 61,599,057 | | | 5,921,826 | | 10 | % |
Diluted | | | 72,281,878 | | | 66,283,621 | | | 5,998,257 | | 9 | % |
| | | | | | | | | | | | |
Dividends declared per share of common stock | | $ | — | | $ | — | | $ | — | | n/m | |
Investment Management Fees
Investment management fees decreased by $14.7 million, or 17%, to $74.4 million2019. The financial results for the three months ended March 31, 2019 from $89.1 million2020 reflect the USAA AMCO Acquisition that closed on July 1, 2019. The acquisition significantly impacted our financial results for the three months ended March 31, 2018 due to a decrease in average AUM year over year and a change in presentation of mutual fund and ETF waivers and expense reimbursements as a reduction of investment management fees instead of as distribution and other asset-based expense upon adoption of ASU 2014-09 on January 1, 2019. This reduced first quarter 2019 reported revenue by $4.1 million; prior periods have not been restated. Average AUM decreased by $5.0 billion to $57.0 billion for the three months ended March 31, 2019 from $62.0 billion for the three months ended March 31, 2018.
Fund Administration and Distribution Fees
Fund administration and distribution fees totaled $13.1 million for the three months ended March 31, 2019, a decrease of $2.7 million, or 17%,2020 when compared to the three months ended March 31, 20182019.
| | Three Months Ended March 31, | |
(in thousands, except per share data) | | 2020 | | | 2019 | |
Revenue | | | | | | | | |
Investment management fees | | $ | 146,881 | | | $ | 74,411 | |
Fund administration and distribution fees | | | 57,540 | | | | 13,068 | |
Total revenue | | | 204,421 | | | | 87,479 | |
| | | | | | | | |
Expenses | | | | | | | | |
Personnel compensation and benefits | | | 47,571 | | | | 34,501 | |
Distribution and other asset-based expenses | | | 54,860 | | | | 15,767 | |
General and administrative | | | 11,888 | | | | 7,087 | |
Depreciation and amortization | | | 4,050 | | | | 5,222 | |
Change in value of consideration payable for acquisition of business | | | (5,500 | ) | | | — | |
Acquisition-related costs | | | (69 | ) | | | 2,777 | |
Restructuring and integration costs | | | 998 | | | | — | |
Total operating expenses | | | 113,798 | | | | 65,354 | |
| | | | | | | | |
Income from operations | | | 90,623 | | | | 22,125 | |
| | | | | | | | |
Other (expense) income | | | | | | | | |
Interest income and other (expense) income | | | (4,172 | ) | | | 1,833 | |
Interest expense and other financing costs | | | (11,408 | ) | | | (4,624 | ) |
Loss on debt extinguishment | | | (1,054 | ) | | | — | |
Total other expense, net | | | (16,634 | ) | | | (2,791 | ) |
| | | | | | | | |
Income before income taxes | | | 73,989 | | | | 19,334 | |
| | | | | | | | |
Income tax expense | | | (16,823 | ) | | | (4,807 | ) |
| | | | | | | | |
Net income | | $ | 57,166 | | | $ | 14,527 | |
| | | | | | | | |
Earnings per share of common stock | | | | | | | | |
Basic | | $ | 0.84 | | | $ | 0.22 | |
Diluted | | $ | 0.77 | | | $ | 0.20 | |
| | | | | | | | |
Weighted average number of shares outstanding | | | | | | | | |
Basic | | | 67,790 | | | | 67,521 | |
Diluted | | | 74,350 | | | | 72,282 | |
| | | | | | | | |
Dividends declared per share of common stock | | $ | 0.05 | | | $ | — | |
Investment Management Fees
Three months ended March 31, 2020 compared to March 31, 2019. Investment management fees increased by $72.5 million, or 97.4%, to $146.9 million for the three months ended March 31, 2020 from $74.4 million for the same period in 2019 due mainlyto an increase in average AUM year over year, partially offset by a decrease in the realized fee rate due to a shift in asset mix. Average AUM was $144.1 billion for the three months ended March 31, 2020 compared to $57.0 billion for the same period in 2019, largely attributable to acquired assets in the USAA AMCO Acquisition.
Fund Administration and Distribution Fees
28
Table of Contents
Three months ended March 31, 2020 compared to March 31, 2019. Fund administration and distribution fees increased by $44.5 million, or 340.3%, to $57.5 million for the three months ended March 31, 2020 from $13.1 million for the same period in 2019 due to an increase in average AUM year over year and the addition of $20.7 million in transfer agent fees with the USAA Funds related to the change in fund distribution fees, which were impactedUSAA AMCO Acquisition, partially offset by lower average mutual fund AUM and a shift in the mix of assets to lower 12b-1 paying share classes.
Personnel Compensation and Benefits
The following table presents the components of GAAP personnel compensation and benefits expense for the three months ended March 31, 20192020 and 2018:2019:
| | | | | | | |
| | Three Months Ended March 31, | | Three Months Ended March 31, | |
(in thousands) | | 2019 | | 2018 | | 2020 | | | 2019 | |
Salaries, payroll related taxes and employee benefits | | $ | 14,904 | | $ | 12,923 | | $ | 16,562 | | | $ | 14,904 | |
Incentive compensation | | | 14,662 | | | 17,165 | | | 20,504 | | | | 14,662 | |
Sales-based compensation(1) | | | 3,388 | | | 3,393 | | | 3,919 | | | | 3,388 | |
Equity awards granted to employees(2) | | | 1,547 | | | 3,322 | |
Equity awards granted to employees and directors(2) | | | | 5,993 | | | | 1,547 | |
Acquisition and transaction-related compensation | | | | 593 | | | | — | |
Total personnel compensation and benefits expense | | $ | 34,501 | | $ | 36,803 | | $ | 47,571 | | | $ | 34,501 | |
| (1) | | Represents sales-based commissions paid to our distribution teams. Sales-based compensation varies based on gross client cash flows and revenue earned on sales. |
| (2) | | Equity awards typically vest over several years based on service and the achievement of specific business and financial targets. The value of the equity awards is recognized as compensation expense over the vesting period. |
Three months ended March 31, 2020 compared to March 31, 2019. Personnel compensation and benefits was $34.5were $47.6 million for the three months ended March 31, 2019, a decrease2020, an increase of $2.3$13.1 million, or 6%37.9%, from $36.8$34.5 million for the same period in 2019 primarily attributable to an increase in the headcount due to the USAA AMCO Acquisition. Incentive compensation and equity awards granted to employees and directors were $20.5 million and $6.0 million, respectively, for the three months ended March 31, 2018.2020, compared to $14.7 million and $1.5 million, respectively, for the same period in 2019. Salaries, payroll related taxes and employee benefits waswere $16.6 million and $14.9 million, respectively, for the three months ended March 31, 2019, an increase of $2.0 million, or 16%, from $12.9 million for the three months ended March 31, 2018. This increase is primarily due to a $1.5 million increase in deferred compensation plan liabilities from favorable market action on the related investments during the quarter2020 and higher employer payroll taxes. Incentive compensation was $14.7 million for the three months ended March 31, 2019, a decrease of $2.5 million, or 15%, from $17.2 million for the three months ended March 31, 2018, due to lower earnings. Sales-based compensation was $3.4 million for the three months ended March 31, 2019, unchanged for the three months ended March 31, 2018. Equity award expense was $1.5 million for the three months ended March 31, 2019, a decrease of $1.8 million, or 55%, from $3.3 million for the three months ended March 31, 2018, due to the reversal of expense in 2019 related to equity awards forfeited during the quarter.2019.
Distribution and Other Asset‑basedBased Expenses
The following table presents the components of distribution and other asset-based expenses for the three months ended March 31, 20192020 and 2018:2019:
| | | | | | | |
| | Three Months Ended March 31, | | Three Months Ended March 31, | |
(in thousands) | | 2019 | | 2018 | | 2020 | | | 2019 | |
Broker-dealer distribution fees | | $ | 6,979 | | $ | 9,338 | | $ | 6,108 | | | $ | 6,979 | |
Platform distribution fees | | | 4,583 | | | 7,723 | | | 38,992 | | | | 4,583 | |
Fund expense reimbursements | | | — | | | 2,933 | |
Sub-administration | | | 1,682 | | | 1,534 | | | 4,082 | | | | 1,682 | |
Sub-advisory | | | 847 | | | 1,838 | | | 3,237 | | | | 847 | |
Middle-office | | | 1,676 | | | 1,795 | | | 2,441 | | | | 1,676 | |
Total distribution and other asset-based expenses | | $ | 15,767 | | $ | 25,161 | | $ | 54,860 | | | $ | 15,767 | |
Three months ended March 31, 2020 compared to March 31, 2019. Distribution and other asset-based expenses are primarily based on AUM. DistributionFor the three months ended March 31, 2020, distribution and other asset-based expenses were $54.9 million, an increase of $39.1 million, or 247.9%, from $15.8 million for the same period in 2019, primarily due to the USAA AMCO Acquisition. The acquisition introduced new operating expenses that the Company did not incur prior to the acquisition, such as platform distribution costs paid to third parties and USAA, sub-transfer agent service costs and 529 College Savings Plan expenses.
General and Administrative
Three months ended March 31, 2020 compared to March 31, 2019. General and administrative expenses were $11.9 million for the three months ended March 31, 2019, a decrease2020 compared to $7.1 million for the same period in 2019. The increase of $9.4$4.8 million, or 37%67.7%, from $25.2was primarily due to the addition of transition service agreement costs related to the USAA AMCO Acquisition partially offset by $3.5 million in Ohio Commercial Activity Tax refunds received for tax years 2015-2019.
29
Table of Contents
Depreciation and Amortization
Three months ended March 31, 2020 compared to March 31, 2019. Depreciation and amortization decreased by $1.2 million, or 22.4%, to $4.1 million for the three months ended March 31, 2018. Middle-office expenses decreased year over year2020 from $5.2 million for the same period in 2019, due to the decrease in AUM. Broker-dealer distribution fees and platform distribution fees decreased due to the mix of mutual fund assets and share classes and lower mutual fund average AUM. Fund expense reimbursements declined by $2.9 million due to the adoption of ASU 2014-09 on January 1, 2019 and the resulting change in presentation of these reimbursements as a reduction in amortization expense related to definite-lived intangible assets in connection with the Munder Capital Management acquisition that became fully amortized in the fourth quarter of revenue instead2019.
Change in Value of as operating expense. Sub-administration expenses increased dueConsideration Payable for Acquisition of Business
Three months ended March 31, 2020 compared to the impactMarch 31, 2019. The fair value of the tiered fee schedulecontingent consideration associated with the USAA AMCO acquisition decreased by $5.5 million, resulting in a higher basis point fee being charged on lower mutual fund average AUM. The decrease in sub-advisory expense is a result of a declinechange in the assets included under our two sub-advisory relationships.
General and Administrative Expenses
General and administrative expenses decreased by $2.0 million, or 22%, to $7.1estimated fair value of consideration payable of $5.5 million for the three months ended March 31, 2020. Refer to Note 4, Acquisitions, for further details on the fair value of contingent consideration payable.
Acquisition‑Related Costs
Three months ended March 31, 2020 compared to March 31, 2019 from $9.1. Acquisition-related costs for the three months ended March 31, 2020 were ($0.1) million and $2.8 million for the three months ended March 31, 2018.2019. The decrease was due mainly to one-time expenses recognized in 2018March 31, 2019 acquisition related costs were related to the IPOUSAA AMCO acquisition.
Restructuring and concurrent debt refinancing.Integration Costs
DepreciationThree months ended March 31, 2020 compared to March 31, 2019. Restructuring and Amortizationintegration costs for the three months ended March 31, 2020 was $1.0 million compared to no such costs for the same period in 2019. The increase is primarily due integration and conversion costs related to the USAA AMCO Acquisition.
DepreciationInterest Income and amortization decreased by $1.2 million, or 19%,Other Income/(Expense)
Three months ended March 31, 2020 compared to $5.2March 31, 2019. Interest income and other income/(expense) was expense of $4.2 million for the three months ended March 31, 2020 compared to income of $1.8 million for the same period in 2019. The expense for the three months ended March 31, 2020 was primarily due to a $4.8 million reduction in the net unrealized fair value of deferred compensation plan investments partially offset by interest income on cash and cash equivalents.
Interest Expense and Other Financing Costs
Three months ended March 31, 2020 compared to March 31, 2019 from $6.4. Interest expense and other financing costs increased $6.8 million to $11.4 million for the three months ended March 31, 2018,2020, compared to $4.6 million for the same period in 2019 due an increase in interest payments as definite-lived intangible assets acquireda result of a higher debt principal balance over the comparable period as a result of the Company entering into the 2019 Credit Agreement, dated July 1, 2019, in connectionconjunction with the management-led buyout with Crestview GPUSAA AMCO Acquisition.
Loss on Debt Extinguishment
Three months ended March 31, 2020 compared to March 31, 2019. Loss on debt extinguishment was $1.1 million and CEMP Acquisition became fully amortized in 2018.
Acquisition‑Related Costs
Acquisition costs$0.0 million, respectively, for the three months ended March 31, 2019 increased to $2.8 million primarily2020 and 2019. The Company wrote-off a pro-rata portion of the unamortized debt issuance costs and unamortized debt discount due to accelerating the pending USAA AMCO Acquisition. paydown of debt principal under the 2019 Credit Agreement. The Company paid down $38.0 million of debt during the first quarter of 2020. Refer to Note 9, Debt, for further details on the 2019 Credit Agreement.
Restructuring and Integration CostsIncome Tax Expense
Restructuring and integration costs decreased by $0.3 million for the threeThree months ended March 31, 2019 the three months ended2020 compared to March 31, 2018 due to severance costs recorded in 2018 related to changes in the operational platform.
Interest Income and Other Income/(Expense)
2019. The net interest income and other income/(expense) increased by $1.9 million for the three months ended March 31, 2019 due to unrealized gains on deferred compensation plan investments and interest income on higher cash and cash equivalents balances.
Interest Expense and Other Financing Costs
Interest expense and other financing costs decreased by $2.5 million, or 35%, to $4.6 million for the three months ended March 31, 2019, from $7.1 million for the three months ended March 31, 2018 due to the debt refinancing in February 2018 that resulted in a lower interest rate paid and subsequent term loan principal pre-payments in 2018.
Loss on Debt Extinguishment
During the three months ended March 31, 2019, the Company had no losses on debt extinguishment compared to the $6.1 million loss on debt extinguishment recorded during the three months ended March 31, 2018.
Income Tax Expense
The provision for income taxes for the three months ended March 31, 2019 and 2018 includes U.S. federal, state and local taxes and foreign income taxes payable by certain of our subsidiaries. The difference between our effective tax
rate and the statutory federal rate of 21% is due to state, local and foreign income taxes, excess tax benefits on share-based compensation and non-deductible expenses. Our effective tax rate for the three months ended March 31, 2020 and 2019 was 22.7% and 24.9%, down from 25.3% forrespectively. The decrease in the three months ended March 31, 2018 as a result ofeffective tax rate was primarily due to higher excess tax benefits on share-based compensation.
Supplemental Non‑GAAP Financial Information
We use non-GAAP performance measures to evaluate the underlying operations of our business. Due to our acquisitive nature, there are a number of acquisition and restructuring related expenses included in GAAP measures that we believe distort the economic value of our organization and we believe that many investors use this information when assessing the financial performance of companies in the investment management industry. We have included these non-GAAP measures to provide investors with the same financial metrics used by management to assess the operating performance of our Company. The non-GAAP measures we report are Adjusted EBITDA and Adjusted Net Income.
30
Table of Contents
The following table sets forth a reconciliation from GAAP financial measures to non-GAAP measures for the periods indicated:
| | | | | | | | |
| | Three Months Ended March 31, | | | Three Months Ended March 31, | |
(in thousands) | | 2019 | | 2018 | | | 2020 | | | 2019 | |
Reconciliation of non-GAAP financial measures: | | | | | | | | | | | | | | | |
Net income (GAAP) | | $ | 14,527 | | $ | 10,524 | | | $ | 57,166 | | | $ | 14,527 | |
Income tax expense | | | (4,807) | | | (3,557) | | | | (16,823 | ) | | | (4,807 | ) |
Income before taxes | | $ | 19,334 | | $ | 14,081 | | |
Income before income taxes | | | $ | 73,989 | | | $ | 19,334 | |
Interest expense(1) | | | 3,853 | | | 8,094 | | | | 10,528 | | | | 3,853 | |
Depreciation(2) | | | 571 | | | 736 | | | | 884 | | | | 571 | |
Other business taxes(3) | | | 555 | | | 375 | | | | (3,296 | ) | | | 555 | |
Amortization of acquisition-related intangibles(4) | | | 4,651 | | | 5,676 | | |
Amortization of acquisition-related intangible assets(4) | | | | 3,166 | | | | 4,651 | |
Stock-based compensation(5) | | | 1,478 | | | 3,322 | | | | 5,372 | | | | 1,478 | |
Acquisition, restructuring and exit costs(6) | | | 2,777 | | | 518 | | | | (1,542 | ) | | | 2,777 | |
Debt issuance costs(7) | | | 364 | | | 6,702 | | | | 2,389 | | | | 364 | |
Pre-IPO governance expenses(8) | | | — | | | 141 | | |
Losses on equity method investments(9) | | | 4 | | | 137 | | |
Earnings/losses from equity method investments(8) | | | | — | | | | 4 | |
Adjusted EBITDA | | $ | 33,587 | | $ | 39,782 | | | $ | 91,490 | | | $ | 33,587 | |
| | | | | | | |
| | Three Months Ended March 31, | |
(in thousands) | | 2019 | | 2018 | |
Reconciliation of non-GAAP financial measures: | | | | | | | |
Net income (GAAP) | | $ | 14,527 | | $ | 10,524 | |
Adjustments to reflect the operating performance of the Company: | | | | | | | |
i. Other business taxes(3) | | | 555 | | | 375 | |
ii. Amortization of acquisition-related intangibles(4) | | | 4,651 | | | 5,676 | |
iii. Stock-based compensation(5) | | | 1,478 | | | 3,322 | |
iv. Acquisition, restructuring and exit costs(6) | | | 2,777 | | | 518 | |
v. Debt issuance costs(7) | | | 364 | | | 6,702 | |
vi. Pre-IPO governance expenses(8) | | | — | | | 141 | |
Tax effect of above adjustments(10) | | | (2,456) | | | (4,183) | |
Adjusted Net Income | | $ | 21,896 | | $ | 23,075 | |
Tax benefit of goodwill and acquired intangibles(11) | | $ | 3,361 | | $ | 3,320 | |
| | Three Months Ended March 31, | |
(in thousands) | | 2020 | | | 2019 | |
Reconciliation of non-GAAP financial measures: | | | | | | | | |
Net income (GAAP) | | $ | 57,166 | | | $ | 14,527 | |
Adjustments to reflect the operating performance of the Company: | | | | | | | | |
i. Other business taxes(3) | | | (3,296 | ) | | | 555 | |
ii. Amortization of acquisition-related intangible assets(4) | | | 3,166 | | | | 4,651 | |
iii. Stock-based compensation(5) | | | 5,372 | | | | 1,478 | |
iv. Acquisition, restructuring and exit costs(6) | | | (1,542 | ) | | | 2,777 | |
v. Debt issuance costs(7) | | | 2,389 | | | | 364 | |
Tax effect of above adjustments(9) | | | (1,522 | ) | | | (2,456 | ) |
Adjusted Net Income | | $ | 61,733 | | | $ | 21,896 | |
Tax benefit of goodwill and acquired intangibles(10) | | $ | 6,728 | | | $ | 3,361 | |
Adjustments made to GAAP Net Income to calculate Adjusted EBITDA and Adjusted Net Income, as applicable, are:
(1) | (1)
| | We addAdding back interest paid on debt and other financing costs, net of interest income; interest expense is included in “Interest expense and other financing costs” and the write-off of debt discount is shown in “Loss on debt extinguishment” in our unaudited condensed consolidated financial statements, while interest income is shown in “Interest income and other income/(expense)” in our unaudited condensed consolidated financial statements.income.
|
(2) | (2)
| | We addAdding back depreciation on property and equipment; included in “Depreciation and amortization” in our unaudited condensed consolidated financial statements.equipment.
|
(3) | Adding back other business taxes. |
(4) | (3)
| | We addAdding back other business taxes; other business taxes are included in “General and administrative” in our unaudited condensed consolidated financial statements.amortization expense on acquisition‑related intangible assets.
|
(5) | (4)
| | We addAdding back amortization of acquisition‑related intangibles; included in “Depreciation and amortization” in our unaudited condensed consolidated financial statements.
|
| (5)
| | We add back the expense associated with stock‑based compensation associated with equity awards issued from pools that were created in connection with the management‑led buyout with Crestview GP from KeyCorp, the Munder Acquisition and the RS Acquisitionvarious acquisitions and as a result of IPO‑related equity grants; included in “Personnel compensation and benefits” in our unaudited condensed consolidated financial statements. Stock-based compensation expensegrants related to director compensation is excluded from this adjustment.the IPO.
|
| (6) | | We addAdding back direct incremental costs of acquisitions, and the IPO, including expenses associated with third‑party advisors, proxy solicitations of mutual fund shareholders for transaction consents, and severance. Severance is included in “Restructuring and integration costs” in ourunaudited condensed consolidated financial statements, costs associated with professional services incurred in connection with IPO readiness are included in “General and administrative”; all other incremental costs are included in “Restructuring and integration costs” or “Acquisition‑relatedrestructuring costs.”
|
| | | | | | | | |
| | Three Months Ended March 31, | | | Three Months Ended March 31, | |
(in thousands) | | 2019 | | 2018 | | | 2020 | | | 2019 | |
Acquisition-related costs | | | $ | (69 | ) | | $ | 2,777 | |
Restructuring and integration costs | | $ | — | | $ | 264 | | | | 998 | | | | — | |
Change in value of consideration payable for acquisition of business | | | | (5,500 | ) | | | | |
General and administrative | | | — | | | 254 | | | | 2,436 | | | | — | |
Acquisition-related costs | | | 2,777 | | | — | | |
Personnel compensation and benefits | | | | 593 | | | | — | |
Total acquisition, restructuring and exit costs | | $ | 2,777 | | $ | 518 | | | $ | (1,542 | ) | | $ | 2,777 | |
(7) | (7)
| | We addAdding back debt issuance costs; included in “Interest expense and other financing costs”, “General and administrative” and “Loss on debt extinguishment” in our unaudited condensed consolidated financial statements. See “—Liquidity and Capital Resources” for more information.costs.
|
| (8) | | We add back pre‑IPO governance expenses paid to Crestview and Reverence Capital, included in “General and administrative” in our unaudited condensed consolidated financial statements. These payments terminated as of the completion of the IPO.
|
| (9)
| | We adjust for earnings/losses on equity method investments, included in “Interestinvestments. |
31
Table of Contents
(9) | Subtracting an estimate of income and other income/(expense)” in our unaudited condensed consolidated financial statements.tax expense applied to the sum of the adjustments above. |
| (10) | | For the three months ended March 31, 2019 and March 31, 2018, reflects income taxes of 25% applied to the sum of line items i. to vi.; 25% represents statutory federal income tax rate of 21% plus an estimate for state, local and foreign income taxes.
|
| (11)
| | Represents the tax benefits associated with deductions allowed for intangiblesintangible assets and goodwill generated from prior acquisitions in which we received a step-up in basis for tax purposes. Acquired intangible assets and goodwill may be amortized for tax purposes, generally over a 15-year period. The tax benefit from amortization on these assets is included to show the full economic benefit of deductions for all acquired intangiblesintangible assets with a step-up in tax basis. Due to our acquisitive nature, tax deductions allowed on acquired intangible assets and goodwill provide us with a significant supplemental economic benefit. |
Non-GAAP measures should be considered in addition to, and not as a substitute for, financial measures prepared in accordance with GAAP. Our non-GAAP measures may differ from similar measures at other companies, even if similar terms are used to identify these measures.
Liquidity and Capital Resources
Our primary uses of cash relate to repayment of our debt obligations, funding of acquisitions and funding working capital needs, repurchasing of shares and payment of dividends, which are all expected to be met primarily through cash generated from our operations. operations and available capital resources.
We cannot predict the duration or scope of the COVID-19 pandemic, its impact on our business, and the potential negative financial impact to our results, but the Company has actively positioned itself so that our cash flows from operations and financing sources will be sufficient to meet our needs. During the period of uncertainty related to the COVID-19 pandemic, we will continue to monitor our liquidity.
The following table shows our liquidity position as of March 31, 20192020 and December 31, 2018.2019.
| | | | | | | |
| | March 31, | | December 31, | | March 31, | | | December 31, | |
(in thousands) | | 2019 | | 2018 | | 2020 | | | 2019 | |
Cash and cash equivalents | | $ | 66,261 | | $ | 51,491 | | $ | 37,130 | | | $ | 37,121 | |
Accounts and other receivables | | | 42,783 | | | 44,120 | | | 77,610 | | | | 95,093 | |
Undrawn commitment on revolving credit facility | | | 100,000 | | | 100,000 | | | 100,000 | | | | 100,000 | |
Accounts and other payables | | | (44,311) | | | (50,578) | | | (112,655 | ) | | | (144,045 | ) |
We manage our cash balances in order to fund our day-to-day operations. Our accounts receivable consistconsists primarily of investment management fees that have been earned but not yet received from clients. Included in other receivables areclients, income and other taxes receivable, and amounts receivable from the funds. We perform a review of our receivables on a monthly basis to accessassess collectability.
We continue to actively monitor the impact of the COVID-19 pandemic on the collectability of certain receivables. We maintained a $100.0 million revolving credit facility at March 31, 20192020 and December 31, 20182019 (under the 2019 Credit Agreement) which had $100.0 million undrawn as of March 31, 20192020 and December 31, 2018.2019.
2019 Credit Agreementand 2020 Debt RefinancingRepricing
On February 12, 2018, concurrentlyIn conjunction with the closing ofUSAA AMCO Acquisition, the IPO, weCompany entered into the Existing2019 Credit Agreement, under which we receiveddated July 1, 2019, and obtained a seven-year term loansloan in an original aggregate principal amount of $360.0 million$1.1 billion. All indebtedness outstanding under the previous credit agreement was repaid and established a five-year revolving credit facility (which was unfundedterminated as of closing) with aggregate commitmentsJuly 1, 2019. As of $50.0 million. On May 3, 2018,March 31, 2020, the Company signed an amendment to the Existing Credit Agreement increasing the revolving credit facility from $50.0 million to $100.0 million.
A total of $80.0has repaid $186.0 million of the outstanding term loans under the Existing2019 Credit Agreement was repaid in 2018. No debt repayments were made in the three months endedAgreement. As of March 31, 2020, we were in compliance with our financial performance covenant. Refer to Note 4, Acquisitions, to the unaudited condensed consolidated financial statements for further details on the USAA AMCO Acquisition, as well as Note 9, Debt, for further information on the 2019 as the Company accumulated cash on-hand to support financing acquisitions.Credit Agreement.
The Harvest Commitment Letter
In connection with entering into the Harvest Purchase Agreement, the CompanyOn January 17, 2020, we entered into the Harvest Commitment Letter pursuantFirst Amendment (the “First Amendment”) to whichthe 2019 Credit Agreementwith the other loan parties thereto, Barclays Bank PLC, as administrative agent, and the Royal Bank of Canada (“RBC”) and Barclays Bank PLC (“Barclays”) committedas fronting bank. Pursuant to provide, and agreed to arrange and syndicate, the Harvest Facility. The Harvest Commitment Letter automatically terminated in accordance with its terms upon execution of the Harvest Termination Agreement.
USAA AMCO Credit Facilities Commitment Letter
In connection with entering into the USAA Stock Purchase Agreement, on November 6, 2018First Amendment, the Company entered into arepriced the USAA AMCO Credit Facilities Commitment letterexisting term loans (the “USAA AMCO Credit Facilities Commitment Letter”“Existing Term Loans”) with Barclays and RBC, pursuant to which the Barclays and RBC committed to provide, and agreed to arrange and syndicate, a new seven-year senior secured first lienreplacement term loan facility (the “USAA AMCO Term Loan Facility”)loans in an aggregate principal amount of up$952.0 (the “Repriced Term Loans”). The Repriced Term Loans provide for substantially the same terms as the Existing Term Loans, including the same maturity date of July 2026, except that the Repriced Term Loans provide for a reduced applicable margin on LIBOR of 75 basis points. The applicable margin on LIBOR under the Repriced Term Loans is 2.50%, compared to $1.395 billion3.25% under the Existing Term Loans. Refer to Note 9, Debt, for further information on the repricing.
Subsequent to March 31, 2020, the Company established a trading account to opportunistically take advantage of potential short term trading arbitrage with respect to our term loan. An alternative to principal prepayments, this allows us to buy back our outstanding term loan in the open market and retire the debt. As we look to pay down our debt, this alternative is preferable at this time to principal prepayments when our debt trades at a new five-year senior secured first lien revolving credit facility (together withdiscount to par. Subsequent to March 31, 2020, we have bought back $31 million of our term loan, for a total debt reduction of $217 million since July 1, 2019.
2020 Swap Transaction
32
Table of Contents
On March 27, 2020, the USAA AMCOCompany executed a floating-to-fixed interest rate swap transaction (“Swap”) to effectively fix the interest rate at 3.465% on $450 million of its outstanding Term Loan Facility,through the “USAA AMCO Credit Facilities”) in an aggregate principal amount of up to $100 million.
Proceeds from the USAA AMCO Term Loan Facility, together with cashmaturity date of July 2026.Refer to Note 14, Derivatives, for further information on the Company’s balance sheet, will be used to refinance in full all debt outstanding under the Company’s Existing Credit Agreement, finance the USAA AMCO Acquisition and finance the Harvest Acquisition, thus effectively replacing the Harvest Commitment Letter.
As a result of entering into the Harvest Termination Agreement on April 22, 2019, the commitments under the USAA AMCO Credit Facilities Commitment Letter attributable to the financing for the Harvest Acquisition automatically terminated in accordance with their terms, thereby reducing the size of the USAA AMCO Term Loan Facility to $1.130 billion.Swap.
Capital Requirements
VCA is a registered broker-dealer subject to the Uniform Net Capital requirements under the Exchange Act, which requires maintenance of certain minimum net capital levels. In addition, we have certain non-U.S. subsidiaries that have minimum capital requirements. As a result, such subsidiaries of our Company may be restricted in their ability to transfer cash to their parents.
Cash Flows for
The following table is derived from our unaudited Condensed Consolidated Statements of Cash Flows:
| | Three Months Ended March 31, | |
(in thousands) | | 2020 | | | 2019 | |
Net cash provided by operating activities | | $ | 51,922 | | | $ | 17,938 | |
Net cash used in investing activities | | | (2,234 | ) | | | (1,447 | ) |
Net cash used in financing activities | | | (49,573 | ) | | | (1,742 | ) |
Operating Activities – Cash provided by operating activities during the three months ended March 31, 2019 and 2018
| | | | | | | |
| | Three Months Ended March 31, | |
(in thousands) | | 2019 | | 2018 | |
Net cash provided by operating activities | | $ | 17,938 | | $ | 25,872 | |
Net cash used in investing activities | | | (1,447) | | | (2,719) | |
Net cash used in financing activities | | | (1,742) | | | (23,817) | |
Operating activities provided net cash of2020 was $51.9 million, compared to $17.9 million and $25.9 millionof cash provided by operating activities for the three months ended March 31, 2019 and 2018, respectively.same period in 2019. The $7.9$34.0 million decreaseincrease in net cash provided by operating activities was primarily due to a $42.6 million and $6.1 million increase in net income and non-cash items, partially offset by a $14.7 million net decrease in revenues from lower average AUM.working capital source of cash.
Investing activities consistThe net decrease in working capital source of cash was primarily due to accounts payable and accrued expenses and compensation which was a $35.6 million use of purchases and sales of property and equipment, the purchases and sales of trading securities related to our deferred compensation plan and other investing activities related to our business operations. Investing activities used net cash of $1.4 million and $2.7 million for the three months ended March 31, 20192020 compared to a $4.6 million use of cash for the same period last year, due to new and 2018, respectively. The $1.3 million decrease inadditional operating expenses that the net cashCompany did not incur prior to the USAA AMCO acquisition, such as distribution costs paid to third parties and USAA, sub-transfer agent service costs, 529 College Savings Plan expenses, and direct member channel expenses.
Investing Activities – Cash used in investing activities was due to the $1.0 million additional equity investment in Cerebellum Capital during the three months ended March 31, 2020 was $2.2 million and consisted of net trading activity of $1.5 million and $0.7 million of property and equipment purchases. The nature of our trading activities is further described in Note 2, Significant Accounting Policies, to the consolidated financial statements included in our Annual Report on Form 10-K for the year ended December 31, 2019.
Financing activities consist primarily of proceeds received or paid from the issuance or repurchase of equity, debt-related activity and dividend payments to our stockholders. For the three months ended March 31, 2019, cash used in investing activities was $1.4 million and consisted of $1.0 million of net trading activity and $0.5 million of property and equipment purchases.
Financing Activities – Cash used in financing activities consisted mainly of repurchases of the Company’s Class A common stock. Forduring the three months ended March 31, 2018, financing activities included, but were not limited2020 was $49.6 million and was mostly attributable to the generation of net IPO proceeds of $156.5 million: $143.0 million received at the closing of the IPO and $13.5 million received at the subsequent closing of the underwriters’ exercise of their option, the incurrence of $360.0 million of term loans under the Existing Credit Agreement, the repayment of $499.7 million of term loans under the 2014 Credit Agreement and the repayment of long-term debt under the Existing2019 Credit Agreement, repurchases of $80.0common stock, and payment of dividends of $38.0 million, $6.0 million and $3.5 million, respectively.
Cash used in financing activities for the same period in 2019 was $1.7 million and consisted primarily of the repurchase of common stock of $1.6 million.
Contractual Obligations
There have been no material changes outsideOn January 17, 2020, we entered into the First Amendment to the 2019 Credit Agreementwith the other loan parties thereto, Barclays Bank PLC, as administrative agent, and the Royal Bank of Canada as fronting bank. Pursuant to the ordinary courseFirst Amendment, the Company repriced its Term Loan, lowering the interest rate spread by 75 basis points, from 3.25% over LIBOR, to 2.50% over LIBOR. On March 27, 2020, the Company executed a floating-to-fixed interest rate swap transaction to effectively fix the interest rate at 3.465% on $450 million of its outstanding Term Loan through the Term Loan maturity date of July 2026. As of March 31, 2020, the Company recorded a $6.3 million liability, which is included in other liabilities in the unaudited Condensed Consolidated Balance Sheets. Refer to Note 14, Derivatives, for further discussion regarding the swap transaction.
For the three month period ended March 31, 2020, the Company recorded a $5.5 million reduction in contingent consideration arrangement liabilities representing the USAA AMCO Acquisition earn-out payment liability, which is included in consideration payable for acquisition of business in the unaudited Condensed Consolidated Balance Sheets. A maximum of $150.0 million ($37.5 million per year) in contingent payments is payable to sellers based on the annual revenue of USAA Adviser attributable to all “non-managed money”-related AUM in each of the first four years following the closing.
33
Table of Contents
There were no other significant changes to our contractual obligations since December 31, 2018 as disclosedreported in Management’s Discussion and Analysis of Financial Condition and Results of Operations, set forth in Part II, Item 7 of our Annual Report on Form 10-K for the year ended December 31, 2018.2019.
Off‑Balance Sheet Arrangements
In connection with dividends declared in February 2017 and December 2017, holders of restricted stock awards that were unvested at the time such dividends were declared are entitled to be paid the dividends as and when the restricted stock vests. Holders of stock options that were unvested at the time the December 2017 dividend werewas declared are entitled to receive a cash bonus equivalent of the December 2017 dividend as and when their stock options vest. These amounts
The Company announced the initiation of quarterly cash dividends in August 2019. Holders of restricted stock awards that are not recordedunvested at the time the quarterly dividends are declared are entitled to be paid these dividends as a liability until and unlesswhen the awards vest in accordance with their respective agreements. restricted stock vests.
As of March 31, 2020 and December 31, 2019, the amount of cash bonuses and distributions related to the February 2017 and December 2017 dividends previously declared on unvested and outstanding restricted share awards and stock options totaled $1.2 million and $1.3 million, respectively, which was not recorded as a liability as of the balance sheet date. A liability will be recorded for these cash bonuses and dividends when the restricted shares and options totaled $1.8 million.
vest.
Critical Accounting Policies and Estimates
Our consolidated financial statements and the accompanying notes are prepared in accordance with accounting principles generally accepted in the United States of America, which require the use of estimates. Actual results will vary from these estimates. A discussion of our critical accounting policies and estimates is included in Management’s Discussion and Analysis of Financial Condition and Results of Operations in our 2018the Company’s Annual Report on Form 10-K. A complete description of our significant accounting policies is included in our 2018 audited consolidated financial statements and accompanying notes included in our 2018Annual Report on Form 10-K. No changes have been made to these policies excepted as noted below.
34
On January 1, 2019, the Company adopted ASU 2014-09 and updated its revenue recognition accounting policies. See Notes 2 and 3Table of the unaudited condensed consolidated financial statements.Contents
Item 3. Quantitative and Qualitative Disclosures About Market Risk
Market Risk
Substantially all of our revenues are derived from investment management, fund administration and distribution fees, which are primarily based on the market value of our AUM. Accordingly, our revenues and net income may decline as a result of our AUM decreasing due to depreciation of our investment portfolios. In addition, such depreciation could cause our clients to withdraw their assets in favor of other investment alternatives that they perceive to offer higher returns or lower risk, which could cause our revenues and net income to decline further.
The value of our AUM was $58.1$123.8 billion at March 31, 2019.2020. A 10% increase or decrease in the value of our AUM, if proportionately distributed over all of our strategies, products and client relationships, would cause an annualized increase or decrease in our revenues of approximately $36.0$70.6 million at our weighted-average fee rate of 6257 basis points for the quarter ended March 31, 2019.2020. Because of declining fee rates from larger relationships and differences in our fee rates across investment strategies, a change in the composition of our AUM, in particular, an increase in the proportion of our total AUM attributable to strategies, clients or relationships with lower effective fee rates, could have a material negative impact on our overall weighted-average fee rate. The same 10% increase or decrease in the value of our total AUM, if attributed entirely to a proportionate increase or decrease in the AUM of the Victory Funds and USAA Funds, to which we provide a range of services in addition to those provided to institutional separate accounts, would cause an annualized increase or decrease in our revenues of approximately $45.3$78.0 million at the Victory Funds’ and USAA Funds’ aggregate weighted-average fee rate of 7863 basis points for the quarter ended March 31, 2019.2020. If the same 10% increase or decrease in the value of our total AUM was attributable entirely to a proportionate increase or decrease in the assets of our institutional separate accounts, it would cause an annualized increase or decrease in our revenues of approximately $25.0$42.1 million at the weighted-average fee rate across all of our institutional separate accounts of 4334 basis points for the quarter ended March 31, 2019.2020.
As is customary in the investment management industry, clients invest in particular strategies to gain exposure to certain asset classes, which exposes their investment to the benefits and risks of those asset classes. We believe our clients invest in each of our strategies in order to gain exposure to the portfolio securities of the respective strategies and may implement their own risk management program or procedures. We have not adopted a corporate‑level risk management policy regarding client assets, nor have we attempted to hedge at the corporate level or within individual strategies the market risks that would affect the value of our overall AUM and related revenues. Some of these risks, such as sector and currency risks, are inherent in certain strategies, and clients may invest in particular strategies to gain exposure to particular risks. While negative returns in our strategies and net client cash outflows do not directly reduce the assets on our balance sheet (because the assets we manage are owned by our clients, not us), any reduction in the value of our AUM would result in a reduction in our revenues.
Exchange Rate Risk
A portion of the accounts that we advise hold investments that are denominated in currencies other than the U.S. dollar. To the extent our AUM are denominated in currencies other than the U.S. dollar, the value of that AUM will decrease with an increase in the value of the U.S. dollar, or increase with a decrease in the value of the U.S. dollar. Each investment team monitors its own exposure to exchange rate risk and makes decisions on how to manage that risk in the
portfolios they manage. We believe many of our clients invest in those strategies in order to gain exposure to non‑U.S. currencies, or may implement their own hedging programs. As a result, we generally do not hedge an investment portfolio’s exposure to non‑U.S. currency.
We have not adopted a corporate-level risk management policy to manage this exchange rate risk. Assuming 9%8% of our AUM are invested in securities denominated in currencies other than the U.S. dollar and excluding the impact of any hedging arrangement, a 10% increase or decrease in the value of the U.S. dollar would decrease or increase the fair value of our AUM by $523.1approximately $990.0 million, which would cause an annualized increase or decrease in revenues of approximately $3.2$5.6 million at our weighted-average fee rate for the business of 6257 basis points for the quarter ended March 31, 2019.2020.
We operate in several foreign countries and incur operating expenses associated with these operations. In addition, we have revenue and revenue-sharing arrangements that are denominated in non-U.S. currencies. We do not believe foreign currency fluctuations materially affect our results of operations.
Interest Rate Risk
Interest rate risk is the risk that the fair value of future cash flows of a financial instrument will fluctuate because of changes in market interest rates. On March 27, 2020, the Company executed the Swap, a floating-to-fixed interest rate swap transaction, to effectively fix the interest rate at 3.465% on $450 million of its outstanding Term Loan through the Term Loan maturity date of July 2026. Refer to Note 14, Derivatives, for further information on the Swap. At March 31, 2019,2020, we were exposed to interest rate risk as a result of the unhedged amounts outstanding under the Existing2019 Credit Agreement. SeeRefer to Note 9, to the unaudited condensed consolidated financial statementsDebt, for a description of the amounts outstanding as of such date and the applicable interest rate.
35
Table of Contents
Item 4. Controls and Procedures
Disclosure Controls and Procedures
We maintain disclosure controls and procedures, as defined in Rules 13a-15(e)13a-15(f) and 15d-15(e)15d-15(f) of the Exchange Act, that are designed to ensure that information required to be disclosed in our reports filed or submitted under the Securities Exchange Act of 1934 is recorded, processed, summarized and reported within the time periods specified in the SEC’s rules and forms, and that such information is accumulated and communicated to our management, including our principal executive and principal financial officers, as appropriate, to allow for timely decisions regarding required disclosure.
Our management, including our Chief Executive Officer and Chief Financial Officer, evaluated the effectiveness of our disclosure controls and procedures (as such term is defined in Rule 13a-15(e)13a-15(f) and 15d-15(e)15d-15(f) under the Exchange Act) at March 31, 2019.2020. Based on that evaluation, our Chief Executive Officer and Chief Financial Officer have concluded that our disclosure controls and procedures are effective.
Changes in Internal Control over Financial Reporting
There has been no change in the Company’s internal control over financial reporting (as such term is defined in Rules 13a-1513a-15(f) and 15d-1515d-15(f) under the Exchange Act) during the quarter ended March 31, 2019,2020, that has materially affected, or is reasonably likely to materially affect, the Company’s internal control over financial reporting.
36
PART II—OTHER INFORMATION
Item 1. Legal Proceedings
From time to time, the Company may be subject to legal proceedings and claims in the ordinary course of business. The Company is not currently a party to any material legal proceedings.
Item 1A. Risk Factors
For a discussion of our potential risks and uncertainties, see the risk factors previously disclosed in our Annual Report on Form 10-K for the year ended December 31, 20182019 as filed with the SEC and the information contained in this report. The declaration, payment and determination of the amount of our quarterly dividends may change at any time. In making decisions regarding our quarterly dividends, we consider general economic and business conditions, our strategic plans and prospects, our businesses and investment opportunities, our financial condition and operating results, working capital requirements and anticipated cash needs, contractual restrictions (including under the terms of our 2019 Credit Agreement as amended) and legal, tax, regulatory and such other factors as we may deem relevant. There have been no material changes, other than as described below, to the risk factors in our Annual Report on Form 10-K for the year ended December 31, 2018.2019.
Our results of operations could be materially adversely impacted by the COVID-19 pandemic.
On March 11, 2020, the World Health Organization declared COVID-19 a pandemic. The global spread of COVID-19 has created significant volatility, uncertainty, and economic disruption. In particular, global financial markets have seen increased volatility and significant changes in the value of investments. The extent to which the COVID-19 pandemic impacts our business, operations, and financial results will depend on numerous evolving factors that are outside of our control and that we may not be able to accurately predict, including: the duration and scope of the pandemic, actions taken in response to the pandemic, the impact of the pandemic on economic activity, the impact on our vendors, and the effect on our employees’ productivity. Any of these events could cause or contribute to the risks and uncertainties enumerated in the Annual Report and could materially adversely affect our business, financial condition, results of operations and/or stock price.
Item 2. Unregistered Sales of Equity Securities and Use of Proceeds
(c) Issuer purchases of equity securities.
The share repurchase program authorized in 2018 for $15.0 million of the Company’s Class A common stock was completed in September 2019. On May 22, 2018,August 28, 2019, our Board of Directors authorized the Company to repurchase up to an aggregate of $15.0 million of the Company’s Class A common stock.stock through December 31, 2020. These repurchases may be made in privately negotiated transactions, through block trades, pursuant to open market purchases, or pursuant to any trading plan adopted in compliance with Rule 10b5-1. The manner, timing, share number and price, of the repurchases will be determined by the Company, subject to market conditions, applicable securities laws, alternative investment opportunities and other factors. The Board’s authorization does not obligate the Company to acquire any particular amount of Class A common stock, and may be modified, suspended or terminated at any time. The following table sets out information regarding purchases of equity securities by the Company for the three months ended March 31, 2019.2020.
| | | | | | | | | | |
| | | | | | | Total Number of Shares | | Approximate Dollar Value |
| | Total Number of | | Average Price | | of Class A Common | | That May Yet Be Purchased |
| | Shares of Class A | | Paid Per Share | | Stock Purchased as Part of | | Under Outstanding |
| | Common Stock | | of Class A | | Publicly Announced | | Plans or Programs |
Period | | Purchased | | Common Stock | | Plans or Programs | | (in millions) (1) |
January 1-31, 2019 | | 81,886 | | $ | 10.76 | | 81,886 | | $ | 6.1 |
February 1-28, 2019 | | 41,071 | | | 11.27 | | 41,071 | | | 5.6 |
March 1-31, 2019 | | — | | | — | | — | | | 5.6 |
Total | | 122,957 | | $ | 10.93 | | 122,957 | | | |
| | | | | | | | | | Total Number of Shares | | | Approximate Dollar Value | |
| | Total Number of | | | Average Price | | | of Class A Common | | | That May Yet Be Purchased | |
| | Shares of Class A | | | Paid Per Share | | | Stock Purchased as Part of | | | Under Outstanding | |
| | Common Stock | | | of Class A | | | Publicly Announced | | | Plans or Programs | |
Period | | Purchased | | | Common Stock | | | Plans or Programs | | | (in millions) | |
Jan 1-31, 2020 | | | 63,980 | | | $ | 21.30 | | | | 63,980 | | | $ | 7.1 | |
Feb 1-29, 2020 | | | 51,675 | | | | 21.80 | | | | 51,675 | | | | 6.0 | |
March 1-31, 2020 | | | 124,375 | | | | 15.32 | | | | 124,375 | | | | 4.1 | |
Total | | | 240,030 | | | $ | 18.31 | | | | 240,030 | | | | | |
Item 3. Defaults Upon Senior Securities
None
Item 4. Mine Safety Disclosures
Not applicable
37
Table of Contents
Item 5. Other Information
None
Item 6. Exhibits
EXHIBIT INDEX
| | |
Exhibit No. | | Description |
10.131.1 | | Termination of Harvest Comittment Letter dated as of April 22, 2019 by and among Victory Capital Holdings, Inc. and Harvest Volatility Management, LLC.
|
31.1 | | Certification of the Principal Executive Officer pursuant to Section 302 of the Sarbanes‑Oxley Act of 2002 |
31.2 | | Certification of the Principal Financial Officer pursuant to Section 302 of the Sarbanes‑Oxley Act of 2002 |
32.1 | | Certification of Principal Executive Officer pursuant to 18 U.S.C. Section 1350, as adopted pursuant to Section 906 of the Sarbanes‑Oxley Act of 2002 |
32.2 | | Certification of Principal Financial Officer pursuant to 18 U.S.C. Section 1350, as adopted pursuant to Section 906 of the Sarbanes‑Oxley Act of 2002 |
101 | | The following information formatted in XBRL (eXtensibleiXBRL (Inline eXtensible Business Reporting Language): (i) Unaudited Condensed Consolidated Balance Sheets as of March 31, 20192020 and December 31, 2018,2019, (ii) Unaudited Condensed Consolidated Statements of Operations for the quartersthree months ended March 31, 20192020 and 2018,2019, (iii) Unaudited Condensed Consolidated Statements of Comprehensive Income for the quartersthree months ended March 31, 20192020 and 2018,2019, (iv) Unaudited Condensed Consolidated Statements of Cash Flows for the quartersthree months ended March 31, 20192020 and 2018,2019, (v) Unaudited Condensed Consolidated Statements of Changes in Stockholders’ Equity for the quartersthree months ended March 31, 20192020 and 2018 and2019; (vi) Notes to Unaudited Condensed Consolidated Financial Statements for the quartersthree months ended March 31, 20192020 and 2018.2019. |
104 | | Cover Page Interactive Data File (embedded within the Inline XBRL document) |
38
SIGNATURES
Pursuant to the requirements of Section 13 or 15(d) of the Securities Exchange Act of 1934, the registrant has duly caused this report to be signed on its behalf by the undersigned, thereunto duly authorized on this 15th11th day of May, 2019.2020.
| VICTORY CAPITAL HOLDINGS, INC. |
| | |
| | |
| By: | /s/ MICHAEL D. POLICARPO |
| | Name: | Michael D. Policarpo |
| | Title: | President, Chief Financial Officer and Chief Administrative OfficeOfficer |
39