UNITED STATES

SECURITIES AND EXCHANGE COMMISSION

WASHINGTON, D.C. 20549


FORM 10-Q


Quarterly report pursuant to Section 13 or 15(d) of the Securities Exchange Act of 1934 

Quarterly report pursuant to Section 13 or 15(d) of the Securities Exchange Act of 1934

For the quarterly period ended SeptemberJune 30, 2017,2022, or

Transition report pursuant to section 13 or 15(d) of the Securities Exchange Act of 1934

Transition report pursuant to section 13 or 15(d) of the Securities Exchange Act of 1934

Commission File Number 000-55774001-39529


BROADSTONE NET LEASE, INC.

(Exact name of registrant as specified in its charter)


Maryland

26-1516177

(State or other jurisdiction of
incorporation or organization)

(I.R.S. Employer
Identification No.)


800 Clinton Square

Rochester, New York

14604

(Address of principal executive offices)

(Zip Code)

(585) 287-6500

(Registrant’s585) 287-6500

(Registrant's telephone number, including area code)


Securities registered pursuant to Section 12(b) of the Act:

Title of each class

Trading

Symbol(s)

Name of each exchange on which registered

Common Stock, $0.00025 par value

BNL

The New York Stock Exchange

Indicate by check mark whether the registrant:registrant (1) has filed all reports required to be filed by Section 13 or 15 (d) of the Securities Exchange Act of 1934 during the preceding 12 months (or for such shorter period that the registrant was required to file such reports), and (2) has been subject to such filing requirements for the past 90 days. Yes No

Indicate by check mark whether the registrant has submitted electronically and posted on its corporate Web site, if any, every Interactive Data File required to be submitted and posted pursuant to Rule 405 of Regulation S-T (§232.405 of this chapter) during the preceding 12 months (or for such shorter period that the registrant was required to submit and post such files). Yes No

Indicate by check mark whether the registrant is a large accelerated filer, an accelerated filer, a non-accelerated filer, a smaller reporting company, or an emerging growth company. See the definitions of “large"large accelerated filer,” “accelerated" "accelerated filer,” “smaller" "smaller reporting company," and “emerging"emerging growth company”company" in Rule 12b-2 of the Exchange Act.


Large accelerated filer


Accelerated filer


Non-accelerated filer


  (Do not check if a smaller reporting company)


Smaller reporting company


Emerging growth company


If an emerging growth company, indicate by check mark if the registrant has elected not to use the extended transition period for complying with any new or revised financial accounting standards provided pursuant to Section 13(a) of the Exchange Act.

Indicate by check mark whether the registrant is a shell company (as defined in Rule 12b-2 of the Exchange Act). Yes No

There were 18,491,182.216173,115,020 shares of the Registrant’s common stock, $0.001Registrant's Common Stock, $0.00025 par value per share, outstanding as of November 13, 2017.August 2, 2022.


BROADSTONE NET LEASE, INC.

TABLE OF CONTENTS


Page

Part I - FINANCIAL INFORMATION

1

Item 1.

Financial Statements

1


Condensed Consolidated Balance Sheets (Unaudited)

1


Condensed Consolidated Statements of Income and Comprehensive Income (Loss) (Unaudited)

2


Condensed Consolidated Statements of Stockholders’Stockholders' Equity (Unaudited)

3


Condensed Consolidated Statements of Cash Flows (Unaudited)

45


Notes to the Condensed Consolidated Financial Statements (Unaudited)

56

Item 2.

Management’sManagement's Discussion and Analysis of Financial Condition and Results of Operations

2624


Cautionary Note Regarding Forward-Looking Statements

2624


OverviewRegulation FD Disclosures

2624


Explanatory Note and Certain Defined Terms

24

Overview

25

Real Estate Portfolio Information

26

Results of Operations

34

Liquidity and Capital Resources

3539


Impact of InflationDerivative Instruments and Hedging Activities

4042


Off-Balance Sheet ArrangementsCash Flows

4142


Contractual ObligationsNon-GAAP Measures

4143


Results of OperationsCritical Accounting Policies and Estimates

4146


Net Income and Non-GAAP Measures (FFO and AFFO)

47

Critical Accounting Policies

51

Impact of Recent Accounting Pronouncements

5146

Item 3.

Quantitative and Qualitative Disclosures About Market Risk

5146

Item 4.

Controls and Procedures

5247

Part II - OTHER INFORMATION

5348

Item 1.

Legal Proceedings

5348

Item 1A.

Risk Factors

5348

Item 2.

Unregistered Sales of Equity Securities and Use of Proceeds

5348

Item 3.

Defaults upon Senior Securities

5548

Item 4.

Mine Safety Disclosures

5548

Item 5.

Other Information

5548

Item 6.

Exhibits

5549


Part I. FINANCIAL INFORMATION

Item 1. Financial Statements

Broadstone Net Lease, Inc. and Subsidiaries

Condensed Consolidated Balance Sheets

(Unaudited)

(in thousands, except per share amounts)


September 30,


December 31,


2017


2016


June 30,
2022


December 31,
2021


Assets


Accounted for using the operating method, net of accumulated depreciation


$

1,891,708


$

1,637,700


Accounted for using the operating method:


Land


$

731,208


$

655,374


Land improvements


320,513


295,329


Buildings and improvements


3,503,478


3,242,618


Equipment


10,422


11,870


Total accounted for using the operating method


4,565,621


4,205,191


Less accumulated depreciation


(479,952

)


(430,141

)

Accounted for using the operating method, net


4,085,669


3,775,050


Accounted for using the direct financing method


41,612


47,271


28,584


28,782


Accounted for using the sales-type method


571


571


Investment in rental property, net


1,933,320


1,684,971


4,114,824


3,804,403


Cash and cash equivalents


13,698


21,635


16,813


21,669


Restricted cash


925


1,468


Accrued rental income


47,766


36,577


124,297


116,874


Tenant and other receivables, net


1,120


355


2,069


1,310


Tenant and capital reserves


897


767


Prepaid expenses and other assets


699


260


22,916


17,275


Notes receivable


6,527


6,527


Investment in related party


10,000


10,000


Interest rate swap, assets


7,493


9,598


26,562


Goodwill


339,769


339,769


Intangible lease assets, net


205,469


168,121


316,119


303,642


Debt issuance costs – unsecured revolver, net


3,139


446


Debt issuance costs – unsecured revolving credit facility, net


6,956


4,065


Leasing fees, net


13,046


11,329


9,117


9,641


Total assets


$

2,244,099


$

1,952,054


$

4,979,442


$

4,618,648


Liabilities and equity


Unsecured revolver


$

126,500


$

102,000


Mortgages and notes payable, net


57,883


106,686


Unsecured term notes, net


721,907


657,891


Unsecured revolving credit facility


$

320,657


$

102,000


Mortgages, net


95,453


96,846


Unsecured term loans, net


587,098


646,671


Senior unsecured notes, net


844,178


843,801


Interest rate swap, liabilities


7,119


10,217


27,171


Accounts payable and other liabilities


18,426


17,396


42,923


38,038


Due to related parties


1,688


364


Tenant improvement allowances


6,627


9,490


Dividends payable


49,541


45,914


Accrued interest payable


4,880


1,602


6,086


6,473


Intangible lease liabilities, net


66,303


47,871


66,864


70,596


Total liabilities


1,011,333


953,517


2,012,800


1,877,510


Commitments and contingencies (See Note 16)


Commitments and contingencies (See Note 18)


Equity


Broadstone Net Lease, Inc. stockholder’s equity:


Preferred stock, $0.001 par value; 20,000 shares authorized, no shares issued or outstanding


-


-


Common stock, $0.001 par value; 80,000 shares authorized, 18,260 and 15,158 shares issued and outstanding at

September 30, 2017 and December 31, 2016, respectively


18


15


Broadstone Net Lease, Inc. stockholders' equity:


Preferred stock, $0.001 par value; 20,000 shares authorized, 0 shares issued or outstanding


Common stock, $0.00025 par value; 500,000 shares authorized, 172,023 and 162,383 shares issued
and outstanding at June 30, 2022 and December 31, 2021, respectively


43


41


Additional paid-in capital


1,253,431


1,009,431


3,125,377


2,924,168


Subscriptions receivable


(470

)


(9,790

)

Cumulative distributions in excess of retained earnings


(112,725

)


(89,960

)


(350,127

)


(318,476

)

Accumulated other comprehensive income


(40

)


2,092


Total Broadstone Net Lease, Inc. stockholders’ equity


1,140,214


911,788


Accumulated other comprehensive income (loss)


23,397


(28,441

)

Total Broadstone Net Lease, Inc. stockholders' equity


2,798,690


2,577,292


Non-controlling interests


92,552


86,749


167,952


163,846


Total equity


1,232,766


998,537


2,966,642


2,741,138


Total liabilities and equity


$

2,244,099


$

1,952,054


$

4,979,442


$

4,618,648


The accompanying notes are an integral part of these condensed consolidated financial statements.

1


Broadstone Net Lease, Inc. and Subsidiaries

Condensed Consolidated Statements of Income and Comprehensive Income (Loss)

(Unaudited)

(in thousands, except per share amounts)


For the three months ended


For the nine months ended


September 30,


September 30,


For the Three Months Ended
June 30,


For the Six Months Ended
June 30,


2017


2016


2017


2016


2022


2021


2022


2021


Revenues


Rental income from operating leases


$

43,233


$

34,806


$

123,890


$

96,779


Earned income from direct financing leases


968


1,143


3,175


3,406


Operating expenses reimbursed from tenants


1,995


1,056


4,908


3,059


Other income from real estate transactions


39


5


117


176


Total revenues


46,235


37,010


132,090


103,420


Lease revenues, net


$

98,013


$

84,759


$

191,854


$

167,457


Operating expenses


Depreciation and amortization


15,643


12,114


44,969


33,273


35,511


31,225


69,801


61,938


Asset management fees


3,844


2,789


10,666


7,770


Property management fees


1,249


1,010


3,635


2,868


Acquisition expenses


-


2,367


-


8,256


Property and operating expense


2,009


1,184


4,710


3,005


4,696


4,572


9,740


9,177


General and administrative


1,173


598


3,297


1,951


9,288


8,655


18,116


19,288


State and franchise tax


301


71


511


181


Provision for impairment of investment in rental properties


2,608


-


2,608


-


1,380


1,380


2,012


Total operating expenses


26,827


20,133


70,396


57,304


50,875


44,452


99,037


92,415


Operating income


19,408


16,877


61,694


46,116


Other income (expenses)


Preferred distribution income


187


181


550


531


Interest income


127


4


354


9


6


11


Interest expense


(9,380

)


(4,576

)


(25,182

)


(24,166

)


(17,888

)


(15,430

)


(34,784

)


(31,538

)

Cost of debt extinguishment


(1,404

)


(52

)


(5,019

)


(105

)


(126

)

Gain on sale of real estate


4,052


2,983


10,332


4,089


4,071


3,838


5,267


8,571


Income taxes


(401

)


(301

)


(813

)


(714

)

Change in fair value of earnout liability


(5,604

)


(4,480

)

Other income


2,632


4


1,506


14


Net income


12,990


15,417


42,729


26,474


35,552


22,820


63,993


46,780


Net income attributable to non-controlling interests


(1,042

)


(1,459

)


(3,460

)


(2,600

)


(2,036

)


(1,606

)


(3,719

)


(3,343

)

Net income attributable to Broadstone Net Lease, Inc.


$

11,948


$

13,958


$

39,269


$

23,874


$

33,516


$

21,214


$

60,274


$

43,437


Weighted average number of common shares outstanding


Basic


17,617


13,647


16,607


12,738


169,555


146,119


166,698


145,728


Diluted


19,147


15,074


18,069


14,154


180,256


157,430


177,346


157,115


Net Earnings per common share


Net earnings per share attributable to common stockholders


Basic and diluted


$

0.68


$

1.02


$

2.36


$

1.87


$

0.20


$

0.14


$

0.36


$

0.30


Comprehensive income (loss)


Comprehensive income


Net income


$

12,990


$

15,417


$

42,729


$

26,474


$

35,552


$

22,820


$

63,993


$

46,780


Other comprehensive income (loss)


Other comprehensive income


Change in fair value of interest rate swaps


283


1,280


(1,448

)


(20,551

)


18,772


(2,911

)


53,733


25,769


Realized loss on interest rate swaps


-


-


(873

)


-


Realized loss (gain) on interest rate swaps


695


(42

)


1,354


(83

)

Comprehensive income


13,273


16,697


40,408


5,923


55,019


19,867


119,080


72,466


Comprehensive income attributable to non-controlling interests


(1,046

)


(1,581

)


(3,271

)


(443

)


(3,151

)


(1,399

)


(6,941

)


(5,212

)

Comprehensive income attributable to Broadstone Net Lease, Inc.


$

12,227


$

15,116


$

37,137


$

5,480


$

51,868


$

18,468


$

112,139


$

67,254


The accompanying notes are an integral part of these condensed consolidated financial statements.

2


Broadstone Net Lease, Inc. and Subsidiaries

Condensed Consolidated Statements of Stockholders’Stockholders' Equity

(Unaudited)

(in thousands, except per share amounts)


Common

Stock


Additional

Paid-in Capital


Subscriptions

Receivable


Cumulative

Distributions in Excess of Retained Earnings


Accumulated Other

Comprehensive

(Loss)/Income


Non-controlling

Interests


Total


Balance, January 1, 2016


$

11


$

738,909


$

(1,506

)


$

(56,911

)


$

(10,340

)


$

77,782


$

747,945


Net income


-


-


-


23,874


-


2,600


26,474


Issuance of 2,809 shares of common stock, net


3


209,049


(1,977

)


-


-


-


207,075


Other offering costs


-


(976

)


-


-


-


-


(976

)

Issuance of 97 membership units


-


-


-


-


-


7,190


7,190


Distributions declared ($0.405 per share January and

   February 2016, $0.410 per share March through September 2016)


-


-


-


(51,558

)


-


(5,860

)


(57,418

)

Change in fair value of interest rate swap agreements


-


-


-


-


(18,394

)


(2,157

)


(20,551

)

Redemption of 87 shares of common stock


-


(6,487

)


-


-


-

��


-


(6,487

)

Balance, September 30, 2016


$

14


$

940,495


$

(3,483

)


$

(84,595

)


$

(28,734

)


$

79,555


$

903,252


Common
Stock


Additional
Paid-in
Capital


Cumulative
Distributions
in Excess of
Retained
Earnings


Accumulated
Other
Comprehensive
Income (Loss)


Non-
controlling
Interests


Total
Stockholders'
Equity


Balance, January 1, 2022


$

41


$

2,924,168


$

(318,476

)


$

(28,441

)


$

163,846


$

2,741,138


Net income


26,758


1,683


28,441


Issuance of 6,427 shares of common stock


1


136,825


136,826


Offering costs, discounts, and commissions


(2,218

)


(2,218

)

Stock-based compensation, net of 1 share
   of restricted stock forfeited


929


929


Retirement of 59 shares of common stock


(1,301

)


(1,301

)

Distributions declared ($0.265 per share and OP Unit)


(45,270

)


(2,845

)


(48,115

)

Change in fair value of interest rate swap agreements


32,893


2,068


34,961


Realized loss on interest rate swap agreements


620


39


659


Adjustment to non-controlling interests


(1,843

)


(45

)


1,888


Balance, March 31, 2022


$

42


$

3,056,560


$

(336,988

)


$

5,027


$

166,679


$

2,891,320


Net income


33,516


2,036


35,552


Issuance of 3,281 shares of common stock


1


69,420


69,421


Offering costs, discounts, and commissions


(992

)


(992

)

Stock-based compensation, net of 8 shares
   of restricted stock forfeited


1,381


1,381


Distributions declared ($0.270 per share and OP Unit)


(46,655

)


(2,852

)


(49,507

)

Change in fair value of interest rate swap agreements


17,697


1,075


18,772


Realized loss on interest rate swap agreements


655


40


695


Adjustment to non-controlling interests


(992

)


18


974


Balance, June 30, 2022


$

43


$

3,125,377


$

(350,127

)


$

23,397


$

167,952


$

2,966,642


Common

Stock


Additional

Paid-in Capital


Subscriptions

Receivable


Cumulative

Distributions in Excess of Retained Earnings


Accumulated Other

Comprehensive

(Loss)/Income


Non-controlling

Interests


Total


Balance, January 1, 2017


$

15


$

1,009,431


$

(9,790

)


$

(89,960

)


$

2,092


$

86,749


$

998,537


Net income


-


-


-


39,269


-


3,460


42,729


Issuance of 3,163 shares of common stock, net


3


249,942


9,320


-


-


-


259,265


Other offering costs


-


(1,144

)


-


-


-


-


(1,144

)

Issuance of 103 membership units


-


-


-


-


-


8,278


8,278


Distributions declared ($0.410 per share January

   2017, $0.415 per share February through September 2017)


-


-


-


(62,034

)


-


(5,719

)


(67,753

)

Change in fair value of interest rate swap agreements


-


-


-


-


(1,328

)


(120

)


(1,448

)

Realized loss on interest rate swap agreements


-


-


-


-


(804

)


(69

)


(873

)

Conversion of 1 membership unit to 1 share of common stock


-


27


-


-


-


(27

)


-


Redemption of 62 shares of common stock


-


(4,825

)


-


-


-


-


(4,825

)

Balance, September 30, 2017


$

18


$

1,253,431


$

(470

)


$

(112,725

)


$

(40

)


$

92,552


$

1,232,766


The accompanying notes are an integral part of these condensed consolidated financial statements.


3


Broadstone Net Lease, Inc. and Subsidiaries

Condensed Consolidated Statements of Cash FlowsStockholders' Equity - Continued

(Unaudited)

(in thousands)thousands, except per share amounts)


For the nine months ended


September 30,


2017


2016


Operating activities


Net income


$

42,729


$

26,474


Adjustments to reconcile net income including non-controlling interest to net cash provided by operating

   activities:


Depreciation and amortization including intangibles associated with investment in rental property


45,456


32,900


Provision for impairment of investment in rental properties


2,608


-


Amortization of debt issuance costs charged to interest expense


1,478


1,136


Straight-line rent and financing lease adjustments


(12,505

)


(9,736

)

Cost of debt extinguishment


5,019


105


(Gain) on sale of real estate


(10,332

)


(4,089

)

Non-cash interest expense


(1,349

)


2,219


Repayment of interest rate swap, liability


(1,965

)


-


Leasing fees paid


(2,597

)


(2,827

)

Other non-cash items


325


306


Changes in assets and liabilities:


Tenant and other receivables


(237

)


286


Prepaid expenses and other assets


(440

)


(630

)

Accounts payable and other liabilities


897


5,870


Accrued interest payable


3,278


134


Net cash provided by operating activities


72,365


52,148


Investing activities


Acquisition of rental property accounted for using the operating method


(345,789

)


(367,654

)

Acquisition of rental property accounted for using the direct financing method


(3,546

)


(544

)

Capital expenditures and improvements


(3,871

)


(7,525

)

Proceeds from disposition of rental property, net


55,296


15,608


Increase in tenant and capital reserves


(130

)


(43

)

Decrease in restricted cash


543


65


Net cash used in investing activities


(297,497

)


(360,093

)


Financing activities


Proceeds from issuance of common stock, net


229,698


186,013


Redemptions of common stock


(4,825

)


(6,487

)

Borrowings on unsecured term notes


400,000


95,000


Principal payments on mortgages and notes payable and unsecured term notes


(384,087

)


(9,171

)

Borrowings on unsecured revolver


220,000


226,500


Repayments on unsecured revolver


(195,500

)


(146,000

)

Cash distributions paid to stockholders


(32,533

)


(26,060

)

Cash distributions paid to non-controlling interests


(5,669

)


(5,275

)

Debt issuance and extinguishment costs paid


(9,889

)


(622

)

Net cash provided by financing activities


217,195


313,898


Net (decrease) increase in cash and cash equivalents


(7,937

)


5,953


Cash and cash equivalents at beginning of period


21,635


27,050


Cash and cash equivalents at end of period


$

13,698


$

33,003


Common
Stock


Class A
Common
Stock


Additional
Paid-in
Capital


Cumulative
Distributions
in Excess of
Retained
Earnings


Accumulated
Other
Comprehensive
Loss


Non-
controlling
Interests


Total
Stockholders'
Equity


Balance, January 1, 2021


$

27


$

9


$

2,624,997


$

(259,673

)


$

(66,255

)


$

179,976


$

2,479,081


Net income


22,223


1,737


23,960


Issuance of 211 shares of common stock


233


233


Offering costs, discounts, and commissions


(500

)


(500

)

Stock-based compensation


1,769


1,769


Retirement of 45 shares of common stock


(832

)


(832

)

Conversion of 37,000 Class A common stock to
   
37,000 shares of common stock


9


(9

)


Conversion of 38 OP Units to 38 shares of
   common stock


606


(606

)


Distributions declared ($0.250 per share and OP Unit)


(36,690

)


(2,963

)


(39,653

)

Change in fair value of interest rate swap agreements


26,602


2,078


28,680


Realized gain on interest rate swap agreements


(39

)


(2

)


(41

)

Adjustment to non-controlling interests


(953

)


1,008


(55

)


Balance, March 31, 2021


$

36


$


$

2,625,320


$

(274,140

)


$

(38,684

)


$

180,165


$

2,492,697


Net income


21,214


1,606


22,820


Issuance of 11,659 shares of common stock


4


264,795


264,799


Issuance of 248 OP Units


Offering costs, discounts, and commissions


(11,013

)


(11,013

)

Stock-based compensation


951


951


Retirement of 16 shares of common stock


(309

)


(309

)

Conversion of 1,127 OP Units to 1,127 shares of
   common stock


17,859


(17,859

)


Distributions declared ($0.255 per share and OP Unit)


(40,696

)


(2,788

)


(43,484

)

Change in fair value of interest rate swap agreements


(2,708

)


(203

)


(2,911

)

Realized gain on interest rate swap agreements


(38

)


(4

)


(42

)

Adjustment to non-controlling interests


(7,472

)


(466

)


7,938


Balance, June 30, 2021


$

40


$


$

2,890,131


$

(293,622

)


$

(41,896

)


$

168,855


$

2,723,508


The accompanying notes are an integral part of these condensed consolidated financial statements.

4


Broadstone Net Lease, Inc. and Subsidiaries

Condensed Consolidated Statements of Cash Flows

(Unaudited)

(in thousands)


For the Six Months Ended
June 30,


2022


2021


Operating activities


Net income


$

63,993


$

46,780


Adjustments to reconcile net income including non-controlling interests to net cash provided by
   operating activities:


Depreciation and amortization including intangibles associated with investment in rental property


67,476


60,570


Provision for impairment of investment in rental properties


1,380


2,012


Amortization of debt issuance costs and original issuance discount charged to interest expense


1,704


1,799


Stock-based compensation expense


2,310


2,720


Straight-line rent, direct financing and sales-type lease adjustments


(8,513

)


(9,609

)

Cost of debt extinguishment


126


Gain on sale of real estate


(5,267

)


(8,571

)

Change in fair value of earnout liability


4,480


Other non-cash items


628


139


Changes in assets and liabilities, net of acquisition:


Tenant and other receivables


(326

)


986


Prepaid expenses and other assets


1,040


1,088


Accounts payable and other liabilities


(6,079

)


(3,367

)

Accrued interest payable


(387

)


(138

)

Net cash provided by operating activities


117,959


99,015


Investing activities


Acquisition of rental property accounted for using the operating method


(377,966

)


(284,300

)

Capital expenditures and improvements


(18,289

)


(1,336

)

Proceeds from disposition of rental property, net


16,402


43,144


Change in deposits on investments in rental property


(118

)


(220

)

Net cash used in investing activities


(379,971

)


(242,712

)


Financing activities


Proceeds from issuance of common stock, net of $3,229 and $10,842 offering
   costs, discounts, and commissions in 2022 and 2021, respectively


202,628


253,647


Principal payments on mortgages and unsecured term loans


(61,389

)


(51,593

)

Borrowings on unsecured revolving credit facility


380,783


175,600


Repayments on unsecured revolving credit facility


(161,000

)


(175,600

)

Cash distributions paid to stockholders


(88,361

)


(73,278

)

Cash distributions paid to non-controlling interests


(5,647

)


(5,927

)

Cash paid for earnout liability


(1,926

)

Debt issuance and extinguishment costs paid


(3,795

)


(946

)

Net cash provided by financing activities


263,219


119,977


Net increase (decrease) in cash and cash equivalents and restricted cash


1,207


(23,720

)

Cash and cash equivalents and restricted cash at beginning of period


27,769


110,728


Cash and cash equivalents and restricted cash at end of period


$

28,976


$

87,008


Reconciliation of cash and cash equivalents and restricted cash


Cash and cash equivalents at beginning of period


$

21,669


$

100,486


Restricted cash at beginning of period


6,100


10,242


Cash and cash equivalents and restricted cash at beginning of period


$

27,769


$

110,728


Cash and cash equivalents at end of period


$

16,813


$

78,987


Restricted cash at end of period


12,163


8,021


Cash and cash equivalents and restricted cash at end of period


$

28,976


$

87,008


The accompanying notes are an integral part of these condensed consolidated financial statements.

5


Broadstone Net Lease, Inc. and Subsidiaries

Notes to the Condensed Consolidated Financial Statements (Unaudited)

(Unaudited)

(in thousands)

1. Business Description

Broadstone Net Lease, Inc. (the “Corporation”"Corporation") is a Maryland corporation formed on October 18, 2007, that elected to be taxed as a real estate investment trust (“REIT”("REIT") commencing with the taxable year ended December 31, 2008. The Corporation focuses on investing in income-producing, net leased commercial properties.properties, primarily in the United States. The Corporation leases properties toindustrial, healthcare, restaurant, retail, healthcare, industrial, and otheroffice commercial businessesproperties under long-term lease agreements. Properties are generally leased on a triple-net basis such that tenants pay all operating expenses relating to the property, including, but not limited to, property taxes, insurance, maintenance, repairs, and capital costs, during the lease term. As of SeptemberAt June 30, 2017,2022, the Corporation owned a diversified portfolio of 477764 individual net leased commercial properties with 757 properties located in 3744 U.S. states throughout the continental United States.and 7 properties located in 4 Canadian provinces.

Broadstone Net Lease, LLC (the “Operating Company”Corporation's operating company, or the "OP"), is the entity through which the Corporation conducts its business and owns (either directly or through subsidiaries) all of the Corporation’sCorporation's properties. At September 30, 2017 and December 31, 2016, the Corporation owned economic interests of 92.3% and 91.4%, respectively, in the Operating Company. The Corporation is also the sole managing member of the Operating Company.OP. The remaining interests in the Operating Company are held by members who acquired their interest by contributing property to the Operating Company in exchange for membership units ofnot owned by the Operating Company.Corporation are referred to as OP Units or non-controlling interests. As the Corporation conducts substantially all of its operations through the Operating Company,OP, it is structured as what is referred to as an Umbrella Partnership Real Estate Investment Trust (“UPREIT”umbrella partnership real estate investment trust ("UPREIT").

The Corporation, operatesthe OP, and its consolidated subsidiaries are collectively referred to as the "Company."

Pursuant to the Corporation's initial public offering ("IPO"), a new class of common stock ("Class A Common Stock") was issued. On March 20, 2021, each share of Class A Common Stock automatically converted into one share of common stock, and effective March 22, 2021, all shares of common stock were listed and freely tradeable on the NYSE under the direction of its board of directors (the “Board of Directors”), which is responsible forsymbol "BNL."

The following table summarizes the managementoutstanding equity and controleconomic ownership interest of the Company’s affairs. The Corporation is externally managed and its board of directors has retained Broadstone Asset Management, LLC (the “Asset Manager”) to manage the day-to-day affairs and to implement the Corporation’s investment strategy, and the Corporation’s sponsor, Broadstone Real Estate, LLC (the “Manager”), to provide certain property management services for the Corporation’s properties, subject to the board of directors’ direction, oversight, and approval. The Asset Manager is a wholly-owned subsidiary of the Manager and all of the Corporation’s officers are employees of the Manager. Accordingly, both the Manager and the Asset Manager are related parties of the Corporation. OP:


June 30, 2022


December 31, 2021


(in thousands)


Shares of
Common Stock


OP Units


Total Diluted
Shares


Shares of
Common Stock


OP Units


Total Diluted
Shares


Ownership interest


172,023


10,323


182,346


162,383


10,323


172,706


Percent ownership of OP


94.3

%


5.7

%


100.0

%


94.0

%


6.0

%


100.0

%

Refer to Note 316 for further discussion over related parties and related party transactions.regarding the calculation of weighted average shares outstanding.

6


2. Summary of Significant Accounting Policies

Interim Information

The accompanying unaudited Condensed Consolidated Financial Statements have been prepared in accordance with accounting principles generally accepted in the United States of America (“GAAP”("GAAP") for interim financial information (Accounting Standards Codification (“ASC”("ASC") 270, Interim Reporting) and Article 10 of the SEC’sSecurities and Exchange Commission's ("SEC") Regulation S-X. Accordingly, the Corporation has omitted certain footnote disclosures which would substantially duplicate those contained within the audited consolidated financial statements for the year ended December 31, 2016,2021, included in the Company’s Amendment No. 2 to its Registration StatementCompany's 2021 Annual Report on Form 10,10-K, filed with the SEC on June 29, 2017 (the “Form 10”).February 23, 2022. Therefore, the readers of this quarterly report should refer to those audited consolidated financial statements, specifically Note 2, Summary of Significant Accounting Policies, for further discussion of significant accounting policies and estimates. The Corporation believes all adjustments necessary for a fair presentation have been included in these interim Condensed Consolidated Financial Statements (which include only normal recurring adjustments).

Principles of Consolidation

The Condensed Consolidated Financial Statements include the accounts and operations of the Corporation, the Operating Company and its consolidated subsidiaries, all of which are wholly-owned by the Operating Company (collectively, the “Company”).Company. All intercompany balances and transactions have been eliminated in consolidation.


To the extent the Corporation has a variable interest in entities that are not evaluated under the variable interest entity (“VIE”("VIE") model, the Corporation evaluates its interests using the voting interest entity model. The Corporation holds a 92.3% interest in the Operating Company at September 30, 2017 and is the sole managing member of the Operating Company, which gives the Corporation exclusive andhas complete responsibility for the day-to-day management of, authority to make decisions for, and control of the Operating Company.OP. Based on consolidation guidance, effective for the Corporation as of January 1, 2016, the Corporationhas concluded that the Operating CompanyOP is a VIE as the members in the Operating CompanyOP do not possess kick-out rights or substantive participating rights. Accordingly, the Corporation consolidates its interest in the Operating Company.OP. However, asbecause the Corporation holds the majority voting interest in the Operating Company,OP and certain other conditions are met, it qualifies for the exemption from providing certain disclosure requirements associated with investments in VIEs.

The portion of the Operating CompanyOP not owned by the Corporation is presented as non-controlling interests as of and during the periods presented.

Basis of Accounting

The Condensed Consolidated Financial Statements have been prepared in accordance with GAAP.

Use of Estimates

The preparation of consolidated financial statementsCondensed Consolidated Financial Statements in conformity with GAAP requires management to make certain estimates and assumptions that affect the reported amounts of assets and liabilities and disclosure of contingent assets and liabilities at the date of the Condensed Consolidated Financial Statements and the reported amounts of revenues and expenses during the reporting periods. Significant estimates include, but are not limited to, the allocation of purchase price between investment in rental propertytangible and intangible assets acquired and liabilities assumed, the value of long-lived assets and goodwill, the provision for impairment, the depreciable lives of rental property, the amortizable lives of intangible assets and liabilities, the allowance for doubtful accounts,probability of collecting outstanding and future lease payments, the fair value of the earnout liability, the fair value of assumed debt, and notes payables, the fair value of the Company’sCompany's interest rate swap agreements, and the determination of any uncertain tax positions. Accordingly, actual results may differ from those estimates.

Long-lived Asset Impairment

We reviewThe Company reviews long-lived assets to be held and used for possible impairment when events or changes in circumstances indicate that their carrying amounts may not be recoverable. If, and when, such events or changes in circumstances are present, an impairment exists to the extent the carrying value of the long-lived asset or asset group exceeds the sum of the undiscounted cash flows expected to result from the use of the long-lived asset or asset group and its eventual disposition. Such cash flows include factors such as expected future operating income, as adjusted for trends and prospects, as well as the effects of demand, competition, and other factors. An impairment loss is measured as the amount by which the carrying amount of the long-lived asset or asset group exceeds theits fair value of the asset or asset group. A significant judgementvalue. Significant judgment is made as to determine if and when impairment should be taken, if our strategy, or one or moretaken. The Company's assessment of impairment as of June 30, 2022 and 2021 was based on the most current information available to the Company. Certain of the assumptionsCompany's properties may have fair values less than their carrying amounts. However, based on the Company's plans with respect to each of those properties, the Company believes that their carrying amounts are recoverable and therefore, 0 impairment charges were recognized other than those described below. If the operating conditions mentioned above were to changedeteriorate or if the Company's expected holding period for assets changes, subsequent tests for impairments could result in additional impairment charges in the future, an impairment may need to be recognized.future.

7


Inputs used in establishing fair value for real estate assets generally fall within Level 3 of the fair value hierarchy, which are characterized as requiring significant judgment as little or no current market activity may be available for validation. The main indicator used to establish the classification of the inputs is current market condition,conditions, as derived through ourthe use of published commercial real estate market information. We determineThe Company determines the valuation of impaired assets using generally accepted valuation techniques including discounted cash flow analysis, income capitalization, analysis of recent comparable sales transactions, actual sales negotiations, and bona fide purchase offers received from third parties. Management may consider a single valuation technique or multiple valuation techniques, as appropriate, when estimating the fair value of its real estate.

The following table summarizes the Company's impairment charges, resulting primarily from changes in the Company's long-term hold strategy, with respect to the individual properties:


For the Three Months Ended
June 30,


For the Six Months Ended
June 30,


(in thousands, except number of properties)


2022


2021


2022


2021


Number of properties


1


0


1


1


Impairment charge


$

1,380


$

0


$

1,380


$

2,012


Restricted Cash

DuringRestricted cash includes escrow funds the three months ended September 30, 2017 we recorded impairmentCompany maintains pursuant to the terms of $2,608 based on our considerationcertain mortgages, lease agreements, and undistributed proceeds from the sale of properties under Section 1031 of the factors detailed above. In determining the fair valueInternal Revenue Code of the assets at the time of measurement, we utilized capitalization rates ranging from 7.25% to 12%1986, as amended (the "Code"), and a weighted average discount rate of 8%.

The Company has reduced the carrying value of the impaired real estateis reported within Prepaid expenses and other assets to the estimated fair value as detailed below:


September 30, 2017


(in thousands)


Carrying

Amount


Allocation of

Impairment


Net Carrying

Amount


Investments in rental property accounted for using the

   operating method, net of accumulated depreciation


$

16,159


$

(2,401

)


$

13,758


Intangible lease assets, net


1,263


(204

)


1,059


Leasing fees, net


123


(16

)


107


Intangible lease liabilities, net


(101

)


13


(88

)


$

17,444


$

(2,608

)


$

14,836


Revenue Recognition

At the inception of a new lease arrangement, including new leases that arise from amendments, the Company assesses the terms and conditions to determine the proper lease classification. A lease arrangement is classified as an operating lease if none of the following criteria are met: (i) ownership transfers to the lessee prior to or shortly after the end of the lease term, (ii) lessee has a bargain purchase option during or at the end of the lease term, (iii) the lease term is greater than or equal to 75% of the underlying property’s estimated useful life, or (iv) the present value of the future minimum lease payments (excluding executory costs) is greater than or equal to 90% of the fair value of the leased property. If one or more of these criteria are met, and the minimum lease payments are determined to be reasonably predictable and collectible, the lease arrangement is generally accounted for as a direct financing lease. Consistent with ASC 840, Leases, if the fair value of the land component is 25% or more of the total fair value of the leased property, the land is considered separately from the building for purposes of applying the lease term and minimum lease payments criterion in (iii) and (iv) above.

Revenue recognition methods for operating leases and direct financing leases are described below:

Rental property accounted for under operating leases – Revenue is recognized as rents are earned on a straight-line basis over the non-cancelable terms of the related leases. In most cases, revenue recognition under operating leases begins when the lessee takes possession of, or controls, the physical use of the leased asset. Generally, this occurs on the lease commencement date. For leases that have fixed and measurable rent escalations, the difference between such rental income earned and the cash rent due under the provisions of the lease is recorded as Accrued rental income on the Condensed Consolidated Balance Sheets.

Rental property accounted for under direct financing leases – The Company utilizes the direct finance method of accounting to record direct financing lease income. For a lease accounted for as a direct financing lease, the net investment in the direct financing lease represents receivables for the sum of future minimum lease payments and the estimated residual valueRestricted cash consisted of the leased property, less the unamortized unearned income. Unearned income is deferred and amortized into income over the lease terms so as to produce a constant periodic rate of return on the Company’s net investment in the leases.following:


June 30,


December 31,


(in thousands)


2022


2021


Escrow funds and other


$

6,634


$

6,100


Undistributed 1031 proceeds


5,529


0


$

12,163


$

6,100


Rent Received in Advance

Rent received in advance represents tenant payments received prior to itsthe contractual due date, and is included in Accounts payable and other liabilities on the Condensed Consolidated Balance Sheets. RentsRent received in advance was $6,845 and $7,566 at September 30, 2017 and December 31, 2016, respectively.

Property Loss and Insurance Recoveries

Property losses, whether full or partial, are accounted for using a combination of impairment, insurance, and revenue recognition guidance prescribed by GAAP. Upon incurring a loss event, the Company evaluates for asset impairment under ASC 350, Intangibles – Goodwill and Other, and ASC 360, Property, Plant, and Equipment. Under the termsconsisted of the Company’s lease agreements with tenants, a significant majority of which are triple-net whereby the tenants are responsible for insurance, taxes, and maintenance, amongst other property costs, the tenants are responsible for repairs and maintenance to the properties. The terms of the leases also require the tenants to continue making their monthly rental payments despite the property loss. To the extent that the assets are recoverable, determined utilizing undiscounted cash flows expected to result from the use of the asset or asset group and its eventual disposition, the Company accounts for a full or partial property loss as an acceleration of depreciation and evaluates whether all or a portion of the property loss can be offset by the recognition of insurance recoveries.

Under the terms of the lease agreements with tenants, in the case of full or partial loss to a property the tenant has an obligation to restore/rebuild the premises as nearly as possible to its value, condition and character immediately prior to such event. To mitigate the risk of loss, the Company requires tenants to maintain general liability insurance policies on the replacement value of the properties. Based on these considerations, the Company follows the guidance in ASC 605-40, Classification of Insurance Recoveries, for the conversion of nonmonetary assets (i.e., the properties) to monetary assets (i.e., insurance recoveries or tenant recoveries). Under ASC 605-40, once probable of receipt, the Company recognizes an insurance/tenant recovery receivable in Tenant and other receivables, net, in the Condensed Consolidated Balance Sheet, with a corresponding offset to the accelerated depreciation recognized in the Condensed Consolidated Statements of Income and Comprehensive Income (Loss). If the insurance/tenant recovery is less than the amount of accelerated depreciation recognized, the Company will recognize a net loss in the Condensed Consolidated Statements of Income and Comprehensive Income (Loss). If the insurance/tenant recovery is greater than the amount of accelerated depreciation recognized, the Company will only recognize a recovery up to the amount of the accelerated depreciation, and will account for the excess as a gain contingency in accordance with ASC 450-30, Gain Contingencies. Gain contingencies are recognized when earned and realized, which typically will occur at the time of final settlement or when non-refundable cash advances are received.following:


(in thousands)


June 30,
2022


December 31,
2021


Rent received in advance


$

13,533


$

15,162


Non-controlling Interests

Non-controlling interests represents the membership interests held in the Operating Company of 7.7% and 8.6% at September 30, 2017 and December 31, 2016, respectively, by third parties which are accounted for as a separate component of equity.

The Company periodically adjusts the carrying value of non-controlling interests to reflect its share of the book value of the Operating Company. Such adjustments are recorded to Additional paid-in capital as a reallocation of Non-controlling interests in the accompanying Condensed Consolidated Statements of Stockholders’ Equity.

Fair Value Measurements

ASC 820 defines fair value as the exchange price that would be received for an asset or paid to transfer a liability (an exit price) in the principal or most advantageous market for the asset or liability in an orderly transaction between market participants on the measurement date. ASC 820 also establishes a fair value hierarchy, which requires an entity to maximize the use of observable inputs and minimize the use of unobservable inputs when measuring fair value.Recurring Fair Value Measurements

The standard describes three levels of inputs that may be used to measure fair value:

Level 1 – Quoted prices that are available in active markets for identical assets or liabilities. The types of financial instruments included in Level 1 are marketable, available-for-sale equity securities that are traded in an active exchange market.

Level 2 – Pricing inputs other than quoted prices in active markets, such as quoted prices for similar assets or liabilities; quoted prices in markets that are not active; or other inputs that are observable or can be corroborated by observable market data for substantially the full term of the assets or liabilities. Instruments included in this category are derivative contracts whose value is determined using a pricing model with inputs (such as yield curves and credit spreads) that are observable in the market or can be derived principally from or corroborated by observable market data.

Level 3 – Unobservable inputs that are supported by little or no market activity and that are significant to the fair value of the assets or liabilities. Level 3 includes assets and liabilities whose values are determined using pricing models, discounted cash flow methodologies, or similar techniques, as well as instruments for which the determination of fair value requires significant management judgment or estimation.

The balances of financial instruments measured at fair value on a recurring basis at September 30, 2017 and December 31, 2016 are as follows (see Note 10)11):


September 30, 2017


(in thousands)


Total


Level 1


Level 2


Level 3


Interest rate swaps, assets


$

7,493


$

-


$

7,493


$

-


Interest rate swap, liabilities


(7,119

)


-


(7,119

)


-


$

374


$

-


$

374


$

-


June 30, 2022


(in thousands)


Total


Level 1


Level 2


Level 3


Interest rate swap, assets


$

26,562


$

0


$

26,562


$

0


December 31, 2021


(in thousands)


Total


Level 1


Level 2


Level 3


Interest rate swap, liabilities


$

(27,171

)


$

0


$

(27,171

)


$

0


8


December 31, 2016


Total


Level 1


Level 2


Level 3


Interest rate swaps, assets


$

9,598


$

-


$

9,598


$

-


Interest rate swap, liabilities


(10,217

)


-


(10,217

)


-


$

(619

)


$

-


$

(619

)


$

-


Interest rate swaps are derivative instruments that have no quoted readily available Level 1 inputs, and therefore are measured at fair value using inputs that are directly observable in active markets and are classified within Level 2 of the valuation hierarchy, using an income approach. Specifically, the fair value of the interest rate swaps are determined using a discounted cash flow analysis on the expected future cash flows of each instrument. This analysis utilizes observable market data including yield curves and implied volatilities to determine the market’s expectation of the future cash flows of the variable component. The fixed and variable components of the interest rate swaps are then discounted using calculated discount factors developed based on the London Interbank Offered Rate (“LIBOR”) swap rate and are aggregated to arrive at a single valuation for the period. The Company also incorporates credit valuation adjustments to appropriately reflect both its own nonperformance risk and the respective counterparty’s nonperformance risk in the fair value measurements. Although the Company has determined that the majority of the inputs used to value its interest rate swaps fall within Level 2 of the fair value hierarchy, the credit valuation adjustments associated with its interest rate swaps utilize Level 3 inputs, such as estimates of current credit spreads to evaluate the likelihood of default by itself and its counterparties. At September 30, 2017 and December 31, 2016, the Company has assessed the significance of the impact of the credit valuation adjustments on the overall valuation of its derivative positions and has determined that the credit valuation adjustments are not significant to the overall valuation. As a result, the Company has determined that its interest rate swap valuations in their entirety are appropriately classified within Level 2 of the fair value hierarchy.


The Company has estimated that the carrying amount reported on the Condensed Consolidated Balance Sheets for Cash and cash equivalents, Restricted cash, Tenant and other receivables, Notes receivable, and Accounts payable and other liabilities approximates their fair values due to their short term nature.

Long-term DebtThe fair value of the Company’sCompany's debt was estimated using Level 1, Level 2, and Level 3 inputs based on recent secondary market trades of the Company's 2031 Senior Unsecured Public Notes (see Note 9), recent financing transactions, estimates of the fair value of the property that serves as collateral for such debt, historical risk premiums for loans of comparable quality, current LIBOR, US treasuryLondon Interbank Offered Rate ("LIBOR"), U.S. Treasury obligation interest rates, and on the discounted estimated future cash payments to be made on such debt. The discount rates estimated reflect the Company’sCompany's judgment as to the approximate current lending rates for loans or groups of loans with similar maturities and assumes that the debt is outstanding through maturity. Market information, as available, or present value techniques were utilized to estimate the amounts required to be disclosed. Since such amounts are estimates that are based on limited available market information for similar transactions and do not acknowledge transfer or other repayment restrictions that may exist on specific loans, it is unlikely that the estimated fair value of any such debt could be realized by immediate settlement of the obligation.

The fair value of the Company’s Mortgage and notes payable, Unsecured term notes, net, and Unsecured revolver are estimated to be $914,270 and $873,026 at September 30, 2017 and December 31, 2016, respectively, as compared tofollowing table summarizes the carrying amount of such debt of $910,072 and $869,524reported on the Condensed Consolidated Balance Sheets at September 30, 2017 and December 31, 2016, respectively.the Company's estimate of the fair value of the unsecured revolving credit facility, mortgages, unsecured term loans, and senior unsecured notes which reflects the fair value of interest rate swaps:

As disclosed under the Long-lived Asset Impairment Charges section of Note 2, the Company’s

(in thousands)


June 30,
2022


December 31,
2021


Carrying amount


$

1,856,377


$

1,699,160


Fair value


1,758,160


1,785,701


Non-recurring Fair Value Measurements

The Company's non-recurring fair value measurements for the three months ended Septemberat June 30, 20172022 and December 31, 2021 consisted of the fair value of impaired real estate assets that were determined using Level 3 inputs.

Stock-Based Compensation

The Company did not havehas issued restricted stock awards ("RSAs") and performance-based restricted stock units ("PRSUs") under its 2020 Omnibus Equity and Incentive Plan (the "Equity Incentive Plan"). Subject to any assets measured at fair value on a nonrecurring basis at December 31, 2016.

Taxes Collected From Tenants and Remittedadjustment as provided in the Equity Incentive Plan, up to Governmental Authorities

Substantially all of9,000,000 shares may be issued to awards granted under the Company’s leases are triple-net, which provide that the lessees are responsible for the payment of all property operating expenses, including property taxes, maintenance and insurance.Equity Incentive Plan. The Company recordsaccounts for stock-based incentives in accordance with ASC 718, Compensation – Stock Compensation, which requires that such expensescompensation be recognized in the financial statements based on a net basis. For the three months ended September 30, 2017award's estimated grant date fair value. The value of such awards is recognized as compensation expense in General and 2016, the Company’s tenants, pursuant to their lease obligations, have made direct payment for property taxes to the taxing authorities of approximately $2,448 and $1,609, respectively. For the nine months ended September 30, 2017 and 2016, the Company’s tenants, pursuant to their lease obligations, have made direct payment for property taxes to the taxing authorities of approximately $13,405 and $11,176, respectively.

In some situations, the Company may collect property taxes from its tenants and remit those taxes to governmental authorities. Taxes collected from tenants and remitted to governmental authorities are presented on a gross basis, where revenue of $608 and $551 is included in Operating expenses reimbursed from tenants and expense of $885 and $718 is included in Property and operatingadministrative expenses in the accompanying Condensed Consolidated Statements of Income and Comprehensive Income (Loss) forover the three months ended September 30, 2017 and 2016, respectively. Taxes collected from tenants were $1,787 and $1,379, while taxes remitted to governmental authorities were $2,084 and $1,442 for the nine months ended September 30, 2017 and 2016, respectively.

Recently Adopted Accounting Standards

In January 2017, the Financial Accounting Standards Boards (“FASB”) issued ASU 2017-01, Business Combinations (Topic 805): Clarifying the Definition of a Business (“ASU 2017-01”), which changes the definition of a business to exclude acquisitions where substantially all of the fair value of the assets acquired are concentrated in a single identifiable asset or group of similar identifiable assets. Under ASU 2017-01, the Company expects that most of its investments in real estate will be considered asset acquisitions. While there are various differences between accounting for an asset acquisition and a business combination, the largest impact is the capitalization of acquisition expenses for asset acquisitions, which are expensed for business combinations. ASU 2017-01 is effective,appropriate vesting period on a prospectivestraight-line basis for interim and annual periods beginning after January 1, 2019, with early adoption permitted.or at the cumulative amount vested at each balance sheet date, if greater. The Company adopted the guidance, effective January 1, 2017. As a result of the adoption, the Company capitalized $6,583 of acquisition costs in connection with investments in real estate closed during the nine months ended September 30, 2017 that qualified as asset acquisitions under the adopted guidance.


Other Recently Issued Accounting Standards

In November 2016, the FASB issued ASU 2016-18, Statement of Cash Flows—Restricted Cash. ASU 2016-18 requires that the statement of cash flows explain the changerecords forfeitures during the period in the total of cash, cash equivalents, and amounts generally described as restricted cash or cash equivalents. Therefore, amounts generally described as restricted cash and equivalents should be included with cash and cash equivalents when reconciling the beginning and end of period total amounts on the statement of cash flows. Currently, there is no specific guidance to address how to classify or present these changes. ASU 2016-18 is effective, on a retrospective basis, for interim and annual periods beginning after December 15, 2017, with early adoption permitted. The Company currently reflects the change in restricted cash in its cash flows from investing activities. Upon adoption, these amounts will be included in the cash and cash equivalents balance when reconciling the beginning and end of period total amounts. For the nine months ended September 30, 2017 the decrease in restricted cash included in cash flows from investing activities was $543.

In August 2016, the FASB issued ASU 2016-15, Classification of Certain Cash Receipts and Cash Payments. ASU 2016-15 provides classification guidance for eight specific topics, including but not limited to, debt extinguishment costs, contingent consideration payments made after a business combination, and distributions received from equity method investees. ASU 2016-18 is effective, on a retrospective basis, for interim and annual periods beginning after December 15, 2017, with early adoption permitted. The Company has assessed the impact of adopting ASU 2016-15, noting the classification of debt extinguishment costs in the Condensed Consolidated Statement of Cash Flows is applicable to the Company, however, will have no impact as the Company currently classifies these as cash flows used in financing activities.  

In February 2016, the FASB issued ASU 2016-02, Leases (Topic 842), which supersedes the existing guidance for lease accounting, Leases (Topic 840). ASU 2016-02 requires lessees to recognize a right-of-use asset and a corresponding lease liability, initially measured at the present value of lease payments, for both operating and financing leases. For leases with a term of 12 months or less, lessees will be permitted to make an accounting policy electionthey occur by class of underlying asset to not recognize lease liabilities and lease assets. The Company does not have any material leases where the Company is the lessee. Under the new pronouncement, lessor accounting will be largely unchanged from existing GAAP.  However, there are certain changes, including 1) accounting for non-lease components of leases and 2) lease classification tests. In adopting the new guidance, companies are required to recognize and measure leases at the beginning of the earliest period presented using a modified retrospective approach. The amendments are effective January 1, 2019, with early adoption permitted. The Company is continuing to evaluate the impact that adoption of this guidance will have on its Condensed Consolidated Financial Statements and footnote disclosures until the guidance becomes effective.

In May 2014, the FASB issued ASU 2014-09, Revenue from Contracts with Customers (Topic 606). ASU 2014-09 is a comprehensive new revenue recognition model requiring a company to recognize revenue to depict the transfer of goods or services to a customer at an amount reflecting the consideration it expects to receive in exchange for those goods or services. In adopting ASU 2014-09, companies may use either a full retrospective or a modified retrospective approach. Additionally, this guidance requires improved disclosures regarding the nature, amount, timing and uncertainty of revenue and cash flows arising from contracts with customers. In August 2015, the FASB issued ASU 2015-14, Revenue from Contracts with Customers (Topic 606): Deferral of the Effective Date, which defers the effective date of ASU 2014-09, Revenue from Contracts with Customers, forreversing all entities by one year. With the deferral, ASU 2014-09 is effective January 1, 2018, with early adoption permitted beginning January 1, 2017. While the Company anticipates additional disclosure, it does not expect the adoption of this pronouncement to have a material effect on the amount or timing of revenue recognized in its Condensed Consolidated Financial Statements as it believes its revenue, excluding revenue streams recognized in Other income from real estate transactions and Gain on sale of real estate, falls outside the scope of this guidance. The Company expects to adopt the guidance using the modified retrospective approach on January 1, 2018. The Company will, however, continue to evaluate the impact of this guidance until it becomes effective.

In February 2017, the FASB issued ASU 2017-05, Other Income-Gains and Losses from the Derecognition of Nonfinancial Assets. This new guidance is required to be adopted concurrentlypreviously recorded stock compensation expense associated with the amendments in ASU 2014-09. The new pronouncement, which adds guidance for partial sales of nonfinancial assets, including real estate. In adopting ASU 2017-05, companies may use either a full retrospective or a modified retrospective approach. The Company currently recognizes revenueforfeited shares. Dividends declared on sales of real estate at the time the asset is transferred (i.e., at the time of closing). Upon adoption of ASU 2014-09, and therefore ASU 2017-05, the Company will need to evaluate any separate contracts or performance obligations to determine proper timing of revenue recognition, as well as transaction price allocation. The Company does not expect the adoption of this pronouncement to have a material effect on the amount or timing of revenue recognized in its Condensed Consolidated Financial Statements. The Company expects to adopt the guidance using the modified retrospective approach on January 1, 2018. The Company will, however, continue to evaluate the impact of this guidance until it becomes effective.


3. Related-Party Transactions

Property Management Agreement

The Corporation and the Operating Company have entered into a property management agreement (the “Property Management Agreement”) with the Manager, a related party in which certain officers and directors of the Corporation have either a direct or indirect ownership interest. Under the terms of the Property Management Agreement, the Manager manages and coordinates certain aspects of the leasing of the Company’s rental property.

In exchange for various services providedRSAs issued under the Property Management Agreement, the Manager is compensatedEquity Incentive Plan are recorded as outlinedCumulative distributions in the agreement.

In addition, the Manager may also provide, but is not obligated to provide, short-term financing to, or guarantees for, the Operating Company. In exchange for these services, the Manager is entitled to receive an interest rateexcess of up to the prime rate plus 1.00% in exchange for any advances to the Operating Company, and 0.05% for guaranteeing recourse carve-outs on financing arrangements. No such advances or guarantees were outstanding or made during the nine months ended September 30, 2017 and 2016, respectively.

The initial term of the Property Management Agreement is effective through December 31, 2017, after which it automatically renews for successive one year periods, unless either party provides written notice of termination in accordance with the Property Management Agreement. The Corporation’s Independent Directors Committee (“IDC”) has approved the renewal of the Property Management Agreement through December 31, 2018. If the Corporation terminates the Property Management Agreement prior to any renewal term or the IDC terminates the agreement within 30 days following a change in control of the Manager (as defined in Property Management Agreement), the Corporation will be required to pay to the Manager a termination fee equal to three times the Management Fees, as defined in the Property Management Agreement, to which the Manager was entitled during the 12 month period immediately preceding the date of such termination. Although not terminable as of September 30, 2017, if the Property Management Agreement had been terminated at September 30, 2017 subject to the conditions noted above, the termination fee would have been $14,121.

Asset Management Agreement

The Corporation and the Operating Company have entered into an asset management agreement (the “Asset Management Agreement”) with the Asset Manager, a wholly-owned subsidiary of the Manager, and therefore a related party in which certain officers and directors of the Company have an indirect ownership interest. Under the terms of the Asset Management Agreement, the Asset Manager is responsible for, among other things, the Corporation’s acquisition, initial leasing, and disposition strategies, financing activities, and providing support to the IDC for its valuation functions and other duties. The Asset Manager also designates two individuals to serve on the Board of Directors of the Corporation.

Under the terms of the Asset Management Agreement, the Asset Manager receives an annual asset management fee (“Asset Management Fee”) equal to 1% of the aggregate value of the Corporation’s common stock, based on the Determined Share Value (as defined in Note 13) as determined by the IDC each quarter, on a fully diluted basis as if all interests in the Operating Company had been converted into shares of the Corporation’s common stock. Through December 31, 2017, compensation to the Asset Manager for any quarter will be deferred in whole or in part at any time during a rolling 12 month period when cumulative distributions are below $3.50 per share. Any deferred compensation under the Asset Management Agreement will accrue interest at the rate of 7% per annum until paid and will be paid from available funds after cumulative 12 month distributions equal $3.50 per share. No compensation to the Asset Manager was deferred during the nine months ended September 30, 2017 and 2016. In addition, the Company pays the Asset Manager, or its designee, a marketing fee equal to 0.5% of all contributions of cash or property to the Corporation or the Operating Company, excluding reinvestments of distributions pursuant to the Distribution Reinvestment Plan (See Note 13), as compensation for its internal and third party offering and marketing costs and expenses. The Asset Manager has the responsibility to cover offering, marketing, and brokerage expenses associated with investor related matters of the Corporation and Operating Company.


The Asset Management Agreement includes various other fees paid to the Asset Manager in exchange for services provided under the agreement, as noted in the table below.

The initial term of the Asset Management Agreement is effective through December 31, 2017, after which it automatically renews for successive one year periods, unless either party provides written notice of termination in accordance with the Asset Management Agreement. The IDC has approved the renewal of the agreement through December 31, 2018. If the Corporation terminates the agreement prior to any renewal term or the IDC terminates the agreement within thirty days following a change in control of the Asset Manager (as defined in the Asset Management Agreement), the Corporation will be required to pay to the Asset Manager a termination fee equal to three times the Asset Management Fee to which the Asset Manager was entitled during the 12 month period immediately preceding the date of such termination. Although not terminable as of September 30, 2017, if the Asset Management Agreement had been terminated at September 30, 2017 subject to the conditions noted above, the termination fee would have been $41,552. Total fees incurred under the Property Management Agreement and Asset Management Agreement for the three and nine months ended September 30, 2017 and 2016 are as follows:


For the three months ended


For the nine months ended


(in thousands)


September 30,


September 30,


Type of Fee


Financial Statement Presentation


2017


2016


2017


2016


Asset management fee


Asset management fees


$

3,844


$

2,789


$

10,666


$

7,770


Property management fee


Property management fees


1,249


1,010


3,635


2,868


Total management fee expense


5,093


3,799


14,301


10,638


Marketing fee


Additional paid-in capital


342


318


1,144


976


Acquisition fee


Capitalized as a component of assets acquired in 2017 (See Note 4) and included as acquisition expenses in 2016


1,591


1,354


3,520


3,810


Leasing fee


Leasing fees, net


801


797


2,597


2,827


Disposition fee


Gain on sale of real estate


219


23


522


61


Total management fees


$

8,046


$

6,291


$

22,084


$

18,312


Included in management fees are $1,688 and $364 of unpaid fees recorded in Due to related partiesretained earnings on the Condensed Consolidated Balance Sheets at SeptemberSheets. Accumulated dividends related to forfeited RSAs are reversed through compensation expense in the period the forfeiture occurs. Dividends accrued on the PRSUs are recorded as Cumulative distributions in excess of retained earnings on the Condensed Consolidated Balance Sheets. Accumulated dividends accrued related to forfeited PRSUs are reversed in the period the forfeiture occurs.

Recently Adopted Accounting Standards

In August 2020, the Financial Accounting Standards Board ("FASB") issued Accounting Standards Update ("ASU") 2020-06, Debt – Debt with Conversion and Other Options (Subtopic 470-20) and Derivatives and Hedging – Contracts in Entity's Own Equity (Subtopic 815-40): Accounting for Convertible Instruments and Contracts in an Entity's Own Equity. The guidance in ASU 2020-06 simplifies the accounting for convertible debt and convertible preferred stock by removing the requirements to separately present certain conversion features in equity. In addition, the amendments in ASU 2020-06 also simplify the guidance in ASC Subtopic 815-40, Derivatives and Hedging: Contracts in Entity's Own Equity, by removing certain criteria that must be satisfied in order to classify a contract as equity, which is expected to decrease the number of freestanding instruments and embedded derivatives accounted for as assets or liabilities. Finally, the amendments revise the guidance on calculating earnings per share, requiring use of the if-converted method for all convertible instruments. The amendments in ASU 2020-06 were effective for the Company beginning January 1, 2022. The Company uses the two-class method of computing basic and diluted earnings per share. Based on the nature of the Company's potentially dilutive instruments, the treasury stock method is not used in computing dilutive earnings per share. Accordingly, the adoption of ASU 2020-06 did not have a material impact on the Company.

9


3. Related-Party Transactions

Prior to the Company's internalization on February 7, 2020, the Company was externally managed by Broadstone Real Estate, LLC ("BRE") and Broadstone Asset Management, LLC (the "Asset Manager") subject to the direction, oversight, and approval of the Company's board of directors (the "Board of Directors"). As part of the internalization the Asset Manager and BRE merged into the Company. Accordingly, both BRE and the Asset Manager were related parties of the Company.

Earnout Consideration

In connection with the Company's internalization, the Company incurred a contingent obligation that would be payable to certain members of the Board of Directors and employees who had previously been owners and/or employees of BRE, upon the occurrence of certain events (see Note 4). On June 16, 2021, the Company achieved the earnout milestone applicable to tranche 1 of the earnout. As a result, the Company issued 145,195 shares of common stock, 247,899 OP Units and paid $1.9 million of cash during the three and six months ended June 30, 20172021. The Company achieved the remaining volume-weighted average price ("VWAP") milestones and paid all earnout tranches (see Note 4) during the year ended December 31, 2016, respectively.  All fees2021. As such, there was no such activity during the three and six months ended June 30, 2022.

Conversion of OP Units to Common Stock

During the three and six months ended June 30, 2021, in a non-cash transaction (see Note 17), the Company converted 1,019,874 OP Units held by an affiliated third party to 1,019,874 shares of common stock at a total conversion value of $16.2 million. There were 0 OP Units converted to common stock during the three and six months ended June 30, 2022.

4. Internalization

On February 7, 2020, the Company completed an internalization where the Company's management team and corporate staff, who were previously employed by BRE, became employees of an indirect subsidiary of the OP. The effect of the internalization has been reflected in the Company's operating results beginning on February 7, 2020.

In accordance with the Company's internalization, the Company was required to pay additional earnout consideration of up to $75.0 million payable in 4 tranches of $10.0 million, $15.0 million, $25.0 million, and $25.0 million if certain milestones related to the Property Management Agreement40-day volume-weighted average price of a share of the Company's common stock ("VWAP per REIT Share") were achieved. The consideration consisted of a combination of cash, shares of the Company's common stock, and OP Units, based on the Asset Management Agreement aresame proportions paid in the base consideration.

As of December 31, 2021, the Company achieved all four VWAP milestones, thereby triggering the payout of all earnout tranches. Below is a summary of the shares of common stock and OP Units issued, and cash paid for in cash within the Company’s normal payment cycleeach earnout tranche:

(in thousands, except per share amounts)


Shares of


40-Day


Common Stock


OP Units


VWAP of a


Tranche


Issued


Issued


Cash Paid


REIT Share


Achievement Date

1


145


248


$

1,926


(a)

$

22.50


June 16, 2021

2


218


371


2,888


(a)


23.75


July 14, 2021

3


363


620


4,117


24.375


September 21, 2021

4


363


620


4,117


25.00


September 21, 2021

(a)
Cash payments include amounts earned for vendors.dividends.

Legal Services

The Company retains the legal services10


5. Acquisitions of Vaisey Nicholson & Nearpass, PLLC (“VNN”), formerly a related party. One former minority partner of VNN is an immediate family member to a member of the management of the Company and an indirect minority owner of the Manager. Beginning January 2017, the family member was no longer an owner or partner of VNN and therefore, prospectively, VNN will no longer be deemed a related party. Legal services obtained from VNN are mainly for acquisition and disposition of real estate related matters, as well as general counsel regarding property management and financing. The IDC has reviewed the billings and other aspects of the relationship between VNN and the Company. The Company utilizes the services of other outside legal counsel as well. These fees are paid for in cash within the Company’s normal payment cycle for vendor payments. Included in these expenses are $527 of unpaid fees recorded in Accounts payable and other liabilities at September 30, 2016. The following table details the type of legal fees incurred from VNN for the three and nine months ended September 30, 2016:

Rental Property

(in thousands)


Financial Statement


For the three months ended


For the nine months ended


Type of Fee


Presentation


September 30, 2016


September 30, 2016


Legal services – general


General and administrative


$

107


$

276


Organization costs


General and administrative


4


18


111


294


Finance related


Debt issuance costs(a)


47


94


Acquisition related fees


Acquisition expenses


89


1,756


Property disposition related


Gain on sale of real estate


34


34


Legal services - tenant related


Property and operating expenses


28


40


Total related party legal expenses


$

309


$

2,218


(a)

Amounts are recorded within Debt issuance costs – unsecured revolver, net, Mortgage and notes payable, net, and Unsecured term notes, net, on the accompanying Condensed Consolidated Balance Sheets.


4. Acquisitions

The Company closed on the following acquisitions during the ninesix months ended SeptemberJune 30, 2017:2022:


(in thousands, except number of properties)


Number of


Real Estate


Date


Property Type


Properties


Acquisition Price


January 7, 2022


Retail


2


$

2,573


February 10, 2022


Industrial


1


21,733


February 15, 2022


Retail


1


1,341


February 28, 2022


Industrial


1


5,678


March 4, 2022


Retail


6


79,061


March 31, 2022


Restaurant


16


99,587


April 12, 2022


Retail


1


1,680


April 12, 2022


Industrial


1


7,522


April 13, 2022


Industrial


1


16,250


April 19, 2022


Retail


1


1,780


May 16, 2022


Retail


1


2,264


June 7, 2022


Retail


1


11,510


June 13, 2022


Retail


1


1,638


June 15, 2022


Retail


1


1,884


June 21, 2022


Industrial


5


78,500


June 29, 2022


Healthcare


1


12,467


June 30, 2022


Industrial


1


29,500


42


$

374,968


(a)

(in thousands, except number of properties)


Date


Tenant Type


Number of

Properties


Real Estate

Acquisition

Price


January 18, 2017


Retail


1


$

2,520


March 1, 2017


Retail


9


87,196


April 28, 2017


Retail


25


48,898


June 2, 2017


Retail


2


13,300


June 15, 2017


Retail


2


2,700


June 30, 2017


Industrial


2


12,250


June 30, 2017


Office


7


25,989


July 7, 2017


Office


1


32,210


August 4, 2017


Healthcare


3


11,732


August 31, 2017


Healthcare


3


16,700


August 31, 2017


Industrial


2


6,148


September 13, 2017


Retail


5


4,994


September 29, 2017


Industrial/Retail


7


30,012


September 29, 2017


Industrial


1


57,372


70


$

352,021


(a)

(a)
Acquisition price excludes capitalized acquisition costs of $3.1 million and a $17.4 million building expansion agreed to as a forward commitment in connection with a prior acquisition (see Note 18).

(a)

Acquisition price does not include acquisition costs of $6,583 capitalized in accordance with the adoption of ASU 2017-01 (see Note 2).

The Company closed on the following acquisitions during the ninesix months ended SeptemberJune 30, 2016:2021:


(in thousands, except number of properties)


Number of


Real Estate


Date


Property Type


Properties


Acquisition Price


February 5, 2021


Healthcare


1


$

4,843


February 26, 2021


Restaurant


(b)


181


March 11, 2021


Retail


13


26,834


March 30, 2021


Retail


11


41,324


March 31, 2021


Healthcare


3


14,140


June 4, 2021


Retail


2


19,420


June 9, 2021


Industrial


1


8,500


June 9, 2021


Industrial


11


106,578


June 25, 2021


Retail


8


12,131


June 28, 2021


Healthcare


4


15,300


June 30, 2021


Retail


1


1,279


June 30, 2021


Healthcare


7


30,750


62


$

281,280


(c)

(in thousands, except number of properties)


Date


Tenant Type


Number of

Properties


Real Estate

Acquisition

Price


January 25, 2016


Retail


3


$

13,376


February 1, 2016


Retail


1


27,000


March 24, 2016


Industrial


1


15,650


April 7, 2016


Office


2


17,115


April 25, 2016


Office


2


54,600


May 9, 2016


Retail


5


42,390


May 12, 2016


Office


1


4,500


May 20, 2016


Retail


19


36,843


May 25, 2016


Healthcare


(b)


5,624


June 30, 2016


Retail


7


28,477


July 15, 2016


Healthcare


2


26,700


August 12, 2016


Other


3


12,399


September 14, 2016


Office


1


14,000


September 29, 2016


Retail


24


82,338


71


$

381,012


(b)
Acquisition of additional land adjacent to an existing property.

(b)

Acquisition of capital expansion of existing property.

(c)
Acquisition price excludes capitalized acquisition costs of $3.0 million.


11


The Company allocated the purchase price of these properties to the relative fair value of the real estate assets acquired and liabilities assumed. The following table summarizes the purchase price allocation for completed real estate acquisitions:


For the Six Months Ended
June 30,


(in thousands)


2022


2021


Land


$

77,088


$

48,477


Land improvements


26,002


15,844


Buildings and improvements


253,500


197,064


Acquired in-place leases(d)


29,585


22,729


Acquired above-market lease (e)


0


211


Acquired below-market lease (f)


(76

)


0


Non-real estate liabilities assumed


(8,051

)


0


$

378,048


(g)

$

284,325


(d)
The weighted average amortization period for acquired in-place leases is 20 years and 14 years for acquisitions completed during the ninesix months ended SeptemberJune 30, 20172022 and 2016, discussed above, excluding non-real estate liabilities assumed of $1,0002021, respectively.
(e)
The weighted average amortization period for the acquired above-market leases is 10 years for acquisitions completed during the three and ninesix months ended SeptemberJune 30, 2017:

2021. There were
no above-market leases acquired during the six months ended June 30, 2022.


September 30,


September 30,


(in thousands)


2017


2016


Land


$

18,499


$

63,918


Land improvements


28,463


28,250


Buildings and other improvements


279,110


251,861


Equipment


508


-


Acquired in-place leases(c)


37,110


38,456


Acquired above-market leases(d)


13,229


16,090


Acquired below-market leases(e)


(21,861

)


(18,107

)

Direct financing


3,546


544


$

358,604


$

381,012


(f)
The weighted average amortization period for acquired below-market leases is nine years for acquisitions completed during the six months ended June 30, 2022. There were no below-market leases acquired during the six months ended June 30, 2021.
(g)
Excludes $17.4 million building expansion agreed to as a forward commitment in connection with a prior acquisition (see Note 18).

(c)

The weighted average amortization period for acquired in-place leases is 17 and 18 years for acquisitions completed during the nine months ended September 30, 2017 and 2016, respectively.

(d)

The weighted average amortization period for acquired above-market leases is 17 and 18 years for acquisitions completed during the nine months ended September 30, 2017 and 2016, respectively.

(e)

The weighted average amortization period for acquired below-market leases is 17 and 18 years for acquisitions completed during the nine months ended September 30, 2017 and 2016, respectively.

The above acquisitions were funded using a combination of available cash on hand, and proceeds from the Company’s unsecuredequity issuances and revolving line of credit.credit facility borrowings. All of thereal estate acquisitions closed during the ninesix months ended SeptemberJune 30, 20172022 and 2021, qualified as asset acquisitions and, as such, acquisition costs were capitalized in accordance with ASU 2017-01. In conjunction with the acquisitions closed during the nine months ended September 30, 2016, expenses of $2,233 and $7,614 for the three and nine months ended September 30, 2016 were incurred and included in Acquisition expenses in the accompanying Condensed Consolidated Statements of Income and Comprehensive Income (Loss). From the date of acquisition through September 30, 2016, the Company recorded revenues of $5,173 and $8,515 for the three and nine months ended September 30, 2016, respectively, related to the properties acquired and accounted for as business combinations, and recognized net income of $2,655 and $5,204 for the three and nine months ended September 30, 2016, excluding the impact of one-time acquisition expenses from the date of acquisition through September 30, 2016.have been capitalized.

Subsequent to SeptemberJune 30, 2017,2022, the Company closed on the following acquisitions (see Note 17)19):


(in thousands, except number of properties)


(in thousands, except number of properties)


Number of


Real Estate


Date


Property Type


Number of

Properties


Acquisition Price


Property Type


Properties


Acquisition Price


October 13, 2017


Healthcare


1


$

10,000


November 1, 2017


Other


4


15,693


(f)

July 1, 2022


Retail


2


$

3,052


July 7, 2022


Retail


1


2,171


July 8, 2022


Industrial


11


75,000


5


$

25,693


14


$

80,223


(f)

The acquisition was conducted with a related party. The fees required under the Asset Management Agreement (see Note 3) were waived by the Asset Manager.

The Company has not completed the allocation of the acquisition date relative fair values for the properties acquired subsequent to September 30, 2017; however, it expects the acquisitions to qualify as asset acquisitions and that the purchase price of these properties will primarily be allocated to land, land improvements, building and acquired lease intangibles.


Condensed Pro Forma Financial Information

The results of operations, excluding the impact of one-time acquisition costs, of the acquisitions accounted for as business combinations, for which financial information was available, are included in the following condensed pro forma financial information as if these acquisitions had been completed as of the beginning of the comparable prior annual period prior to the acquisition date. The following condensed pro forma financial information is presented as if the 2016 acquisitions were completed as of January 1, 2015. Pro forma financial information is not presented for the 2017 acquisitions based on their qualification as asset acquisitions in accordance with ASU 2017-01. These pro forma results are for comparative purposes only and are not necessarily indicative of what the Company’s actual results of operations would have been had the acquisitions occurred at the beginning of the periods presented, nor are they necessarily indicative of future operating results.

The condensed pro forma financial information are as follows for the three and nine months ended September 30, 2016:


For the three months ended


For the nine months ended


(in thousands)


September 30, 2016


September 30, 2016


Revenues


$

39,290


$

117,175


Net income


18,394


38,088


5.6. Sale of Real Estate

The Company closed on the following sales of real estate, none of which qualified as discontinued operations, during the three and nine months ended September 30, 2017 and 2016:operations:


For the three months ended


For the nine months ended


September 30,


September 30,


For the Three Months Ended
June 30,


For the Six Months Ended
June 30,


(in thousands, except number of properties)


2017


2016


2017


2016


2022


2021


2022


2021


Number of properties disposed


4


2


10


4


3


11


4


19


Aggregate sale price


$

27,725


$

12,345


$

58,170


$

16,095


$

11,889


$

22,276


$

17,101


$

45,338


Aggregate carrying value


22,335


9,163


44,984


11,519


(7,311

)


(17,201

)


(11,135

)


(34,573

)

Additional sales expenses


1,338


199


2,854


487


(507

)


(1,237

)


(699

)


(2,194

)

Gain on sale of real estate


4,052


2,983


10,332


4,089


$

4,071


$

3,838


$

5,267


$

8,571


6.12


7. Investment in Rental Property and Lease Arrangements

The Company generally leases its investment rental property to established tenants.tenants in the industrial, healthcare, restaurant, retail, and office property types. At SeptemberJune 30, 2017,2022, the Company had 462764 real estate properties,751 of which were leased under leases that have been classified as operating leases and 15, 10 that have been classified as direct financing leases.leases, 1 that has been classified as a sales-type lease, and two that were vacant. Of the 1510 leases classified as direct financing leases five, 3 include land portions which are accounted for as operating leases (see Revenue Recognition within Note 2). Substantially allleases. The sales-type lease includes a land portion which is accounted for as an operating lease. Most leases have initial terms of 10 to 20 years and provide for minimum rentals as defined in ASC 840, Leases. In addition, theThe Company's leases generally provide for limited increases in rent as a result of fixed increases, increases in the consumer price index, and/Consumer Price Index ("CPI"), or increases in the tenant’stenant's sales volume. Generally, the tenant istenants are also required to pay all property taxes and assessments, substantially maintain the interior and exterior of the building, and maintain property and liability insurance coverage. The leases also typically provide for one or more multiple year renewal options, at the election of the tenant, and are subject to generally the same terms and conditions as the initial lease.

Investment in Rental Property – Accounted for Using the Operating Method

Rental property subject to non-cancelable operating leases with tenants are as follows at September 30, 2017 and December 31, 2016:


September 30,


December 31,


(in thousands)


2017


2016


Land


$

300,633


$

288,276


Land improvements


185,776


162,341


Buildings


1,530,429


1,283,322


Tenant improvements


9,656


8,665


Equipment


519


799


2,027,013


1,743,403


Less accumulated depreciation


(135,305

)


(105,703

)


$

1,891,708


$

1,637,700


Depreciation expense on investment in rental property was $12,600 and $9,796 for the three months ended September 30, 2017 and 2016, respectively, and $36,455 and $27,323 for the nine months ended September 30, 2017 and 2016, respectively.as follows:


For the Three Months Ended
June 30,


For the Six Months Ended
June 30,


(in thousands)


2022


2021


2022


2021


Depreciation


$

27,730


$

24,144


$

54,388


$

47,887


Estimated minimum future rental receipts requiredlease payments to be received under non-cancelable operating leases with tenants at SeptemberJune 30, 20172022 are as follows:


(in thousands)


Remainder of 2017


$

40,732


2018


165,923


2019


169,255


2020


171,908


2021


174,168


Thereafter


1,778,342


$

2,500,328


(in thousands)


Remainder of 2022


$

178,218


2023


359,960


2024


357,102


2025


350,807


2026


341,436


Thereafter


2,695,940


$

4,283,463


Since lease renewal periods are exercisable at the option of the tenant, the above amounts only include future minimum lease payments due during the initial lease terms. In addition, suchSuch amounts exclude any potential variable rent increases that are based on changes in the consumer price indexCPI or future contingentvariable rents which may be received under the leases based on a percentage of the tenant’stenant's gross sales. Additionally, certain of our leases provide tenants with the option to terminate their leases in exchange for termination penalties, or that are contingent upon the occurrence of a future event. Future lease payments within the table above have not been adjusted for these termination rights.

Investment in Rental Property – Accounted for Using the Direct Financing MethodLeases

The Company’sCompany's net investment in direct financing leases is as follows at September 30, 2017 and December 31, 2016:was comprised of the following:


(in thousands)


June 30,
2022


December 31,
2021


Undiscounted estimated lease payments to be received


$

40,983


$

42,602


Estimated unguaranteed residual values


15,203


15,203


Unearned revenue


(27,473

)


(28,893

)

Reserve for credit losses


(129

)


(130

)

Net investment in direct financing leases


$

28,584


$

28,782


September 30,


December 31,


(in thousands)


2017


2016


Minimum lease payments to be received


$

78,837


$

90,447


Estimated unguaranteed residual values


19,758


22,335


Less unearned revenue


(56,983

)


(65,511

)

Net investment in direct financing leases


$

41,612


$

47,271


Minimum future rental receipts requiredUndiscounted estimated lease payments to be received under non-cancelable direct financing leases with tenants at SeptemberJune 30, 20172022 are as follows:


(in thousands)


Remainder of 2017


$

947


2018


3,857


2019


3,931


2020


4,037


2021


4,126


Thereafter


61,939


$

78,837


(in thousands)


Remainder of 2022


$

1,622


2023


3,304


2024


3,361


2025


3,475


2026


3,547


Thereafter


25,674


$

40,983


13


The above rental receipts do not include future minimum lease payments for renewal periods, potential variable consumer price indexCPI rent increases, or contingent rentalvariable percentage rent payments that may become due in future periods.

The following table summarizes amounts reported as Lease revenues, net on the Condensed Consolidated Statements of Income and Comprehensive Income:


For the Three Months Ended
June 30,


For the Six Months Ended
June 30,


(in thousands)


2022


2021


2022


2021


Contractual rental amounts billed for operating leases


$

87,505


$

75,011


$

171,901


$

148,256


Adjustment to recognize contractual operating lease billings on a
   straight-line basis


5,090


4,724


10,111


9,533


Net write-offs of accrued rental income


0


0


(1,326

)


(442

)

Variable rental amounts earned


291


114


477


205


Earned income from direct financing leases


721


728


1,444


1,458


Interest income from sales-type leases


15


15


29


29


Operating expenses billed to tenants


4,263


4,196


8,998


8,584


Other income from real estate transactions


134


28


176


33


Adjustment to revenue recognized for uncollectible rental
   amounts billed, net


(6

)


(57

)


44


(199

)

Total lease revenues, net


$

98,013


$

84,759


$

191,854


$

167,457


7.

8. Intangible Assets and Liabilities

The following is a summary of intangible assets and liabilities and related accumulated amortization at September 30, 2017 and December 31, 2016:amortization:


September 30,


December 31,


(in thousands)


2017


2016


June 30,
2022


December 31,
2021


Lease intangibles:


Acquired above-market leases


$

57,922


$

45,490


$

46,772


$

47,147


Less accumulated amortization


(8,047

)


(4,940

)


(18,052

)


(16,807

)

Acquired above-market leases, net


49,875


40,550


28,720


30,340


Acquired in-place leases


177,044


141,676


407,993


380,766


Less accumulated amortization


(21,450

)


(14,105

)


(120,594

)


(107,464

)

Acquired in-place leases, net


155,594


127,571


287,399


273,302


Total intangible lease assets, net


$

205,469


$

168,121


$

316,119


$

303,642


Acquired below-market leases


$

75,038


$

54,062


$

105,293


$

105,310


Less accumulated amortization


(8,735

)


(6,191

)


(38,429

)


(34,714

)

Intangible lease liabilities, net


$

66,303


$

47,871


$

66,864


$

70,596


Leasing fees


$

15,543


$

13,279


$

14,650


$

14,786


Less accumulated amortization


(2,497

)


(1,950

)


(5,533

)


(5,145

)

Leasing fees, net


$

13,046


$

11,329


$

9,117


$

9,641


Amortization expense for acquired in-place leases and fees was $3,043 and $2,318 for the three months ended September 30, 2017 and 2016, respectively and $8,514 and $5,950 for the nine months ended September 30, 2017 and 2016, respectively. Amortization of acquired above-marketintangible lease assets and below-market leases, net,liabilities was a (decrease) increase in rental income of $(99) and $100 for the three months ended September 30, 2017 and 2016, respectively, and $(487) and $373 for the nine months ended September 30, 2017 and 2016, respectively.    as follows:

(in thousands)


For the Three Months Ended
June 30,


For the Six Months Ended
June 30,


Intangible


Financial Statement Presentation


2022


2021


2022


2021


Acquired in-place leases and leasing fees


Depreciation and amortization


$

7,749


$

7,058


$

15,350


$

14,005


Above-market and below-market leases


Lease revenues, net


1,170


665


2,331


1,418


Estimated future amortization of intangible assets and liabilities at SeptemberJune 30, 20172022 is as follows:


(in thousands)


Remainder of 2017


$

3,273


2018


12,224


2019


11,439


2020


11,330


2021


11,278


Thereafter


102,667


$

152,211


(in thousands)


Remainder of 2022


$

13,338


2023


26,512


2024


25,752


2025


24,455


2026


23,105


Thereafter


145,210


$

258,372


14


8.9. Unsecured Credit Agreements

The following table summarizes the Company's unsecured credit agreements:

2017


Outstanding Balance


(in thousands, except interest rates)


June 30,
2022


December 31,
2021


Interest
Rate


Maturity
Date

Unsecured revolving
   credit facility


$

320,657


$

102,000


Applicable reference
rate +
0.85% (a) (b) (c)


Mar. 2026

Unsecured term loans:


2022 Unsecured Term Loan


60,000


one-month LIBOR
+
1.00% (c)


Feb. 2022 (d)

2024 Unsecured Term Loan


190,000


190,000


one-month LIBOR
+
1.00% (c)


Jun. 2024

2026 Unsecured Term Loan


400,000


400,000


one-month LIBOR
+
1.00% (c)


Feb. 2026

Total unsecured term loans


590,000


650,000


Unamortized debt issuance costs, net


(2,902

)


(3,329

)


Total unsecured term loans, net


587,098


646,671


Senior unsecured notes:


2027 Senior Unsecured Notes -
   Series A


150,000


150,000


4.84%


Apr. 2027

2028 Senior Unsecured Notes -
   Series B


225,000


225,000


5.09%


Jul. 2028

2030 Senior Unsecured Notes -
   Series C


100,000


100,000


5.19%


Jul. 2030

2031 Senior Unsecured Public Notes


375,000


375,000


2.60%


Sep. 2031

Total senior unsecured notes


850,000


850,000


Unamortized debt issuance costs and
   original issuance discount, net


(5,822

)


(6,199

)


Total senior unsecured notes, net


844,178


843,801


Total unsecured debt, net


$

1,751,933


$

1,592,472


(a)
At June 30, 2022, a balance of $243.0 million was subject to the one-month Secured Overnight Financing Rate of 1.69%. The remaining balance includes $100 million CAD borrowings remeasured to $77.7 million USD, which was subject to the one-month Canadian Dollar Offered Rate of 2.23%.
(b)
At December 31, 2021, interest rate was one-month LIBOR plus 1.00%
(c)
At June 30, 2022 and December 31, 2021, one-month LIBOR was 1.79% and 0.10%, respectively.
(d)
The 2022 Unsecured Revolving Credit and Term Loan Agreementwas paid in full in February 2022, with borrowings from the unsecured revolving credit facility.

At June 30, 2022, the weighted average interest rate on all outstanding borrowings was 3.33%, exclusive of interest rate swap agreements.

The Company is subject to various financial and operational covenants and financial reporting requirements pursuant to its unsecured credit agreements. These covenants require the Company to maintain certain financial ratios, including leverage, fixed charge coverage, debt service coverage, aggregate debt ratio, consolidated income available for debt to annual debt service charge, total unencumbered assets to total unsecured debt, and secured debt ratio, among others. As of June 30, 2022, and for all periods presented the Company believes it was in compliance with all of its loan covenants. Failure to comply with the covenants would result in a default which, if the Company were unable to cure or obtain a waiver from the lenders, could accelerate the repayment of the obligations. Further, in the event of default, the Company may be restricted from paying dividends to its stockholders in excess of dividends required to maintain its REIT qualification. Accordingly, an event of default could have a material and adverse impact on the Company.

On June 23, 2017,January 28, 2022, the CorporationCompany amended and restated the Operating Company entered into an $800,000 unsecured Revolving Credit and Term Loan Agreement (“Credit Agreement”) with Manufacturers & Traders Trust Company (“M&T Bank”), as Administrative Agent, four participating banks as Joint Lead Arrangers and Joint Bookrunners, four participating banks as Co-Syndication Agents, and four participating banks, as Co-Documentation Agents. The Credit Agreement consists of a $400,000 senior unsecured revolving credit facility (“Revolver”), a $250,000 senior unsecured delayed draw term loan (“5.5-Year Term Loan”),to increase the available borrowings to $1.0 billion and a $150,000 senior unsecured delayed draw term loan (“7-Year Term Loan”)extend the maturity date to March 31, 2026. The Credit Agreement provides an accordion feature for upIn addition to a total of $1,000,000. The Revolver includes a $35,000 sublimit for swingline loans and $20,000 available for issuance of letters of credit. Proceeds from the Company’sUSD, borrowings under the Credit Agreement were used to repay the Company’s existing unsecured revolving credit facility and term notes with M&T and Regions Bank for $5,000 and $100,000, respectively,can be made in Pound Sterling, Euros or Canadian Dollars ("CAD") up to an aggregate amount of $500.0 million. Prior to the Company’s existing unsecured term note with Regions Bank for $185,000, and $50,000 ofamendment, borrowings under the Company’s unsecured term note with SunTrust Bank. The Revolver has an initial maturity date of January 2022 and provides for one five month extension, at the election of the Company,credit facility were subject to certain conditions set forth in the agreement and payment of a 0.0625% fee on the revolving commitments. Borrowings on the Revolver bear interest at variable rates based on LIBOR plus a margin based on the Operating Company’s investment gradeCompany's current credit rating ranging between 0.825% and 1.55%0.825% to 1.55% per annum. The initial applicable facility fee on the Revolver is 0.25% per annum. The 5.5-Year Term Loan provides for up to three delayed draws from inception through June 2018 at the request of the Company. Borrowings under the 5.5-Year Term Loan bearamended credit facility are subject to interest only payments at variable rates based on LIBORequal to the applicable reference rate plus a margin based on the Operating Company’sCompany's credit rating, ranging between 0.90%0.725% and 1.75% per annum through1.400%. In addition, the maturity date of January 2023. The 7-Year Term Loan provides for up to three delayed draws from inception through June 2018 at the request of the Company. Borrowings under the 7-Year Term Loan bear interest at variable rates based on LIBOR plus a margin based on the Operating Company’samended credit rating ranging between 1.50% and 2.45% through the maturity date of June 2024. Based on the Operating Company’s current credit rating of Baa3, the applicable margin under the Revolver, 5.5-Year Term Loan, and 7-Year Term Loan are 1.20%, 1.35% and 1.90%, respectively. The 5.5-Year Term Loan and 7-Year Term Loan are bothfacility is subject to a facility fee of 0.25% per annum on the amount of the revolving commitments, reduced by the amount of term loans outstanding under the applicable loan. The Company is subject to various financial and nonfinancial covenants under the Credit Agreement.

2015 Unsecured Term Loan Agreement

On June 23, 2017, the Company amended and restated the Term Loan Agreement by and among the Company, the Operating Company, as the borrower, SunTrust Bank, as Administrative Agent, and the lenders party thereto (as amended and restated, the “Restated Term Loan Agreement”). The Restated Term Loan Agreement amended certain terms, conditions, covenants, and other provisions to align them with those included in the Credit Agreement described above. The Restated Term Loan Agreement has an initial maturity date of February 2019 and provides for two one year extension options, at the election of the Company, subject to compliance with all covenants and the payment of a 0.01% fee. Borrowings under the Restated Term Loan Agreement bear interest at variable rates based on the one month LIBOR plus a margin based onCompany's credit rating. The applicable facility fee is 0.200% per annum.

For the Operating Company’s investment grade credit rating ranging between 0.90% and 1.75%. Based on the Operating Company’s current credit rating of Baa3, the applicable margin under the Restated Term Loan Agreement is 1.40%.

2017 Senior Notes

In January 2017,six months ended June 30, 2022, the Company commenced a private offering of unsecured, fixed rate, guaranteed senior promissory notes (“Senior Notes”). On March 16, 2017, the Company entered into a Note and Guaranty Agreement with each of the purchasers of the Senior Notes. On April 18, 2017, the Company closed the offering and issued the Senior Notes for an aggregate principal amount of $150,000. The Senior Notes were issued by the Operating Company and guaranteed by the Corporation. The Senior Notes were issued at par, bear interest at a rate of 4.84% per annum (priced at 240 basis points above the 10 year U.S. Treasury yield at the time of pricing), and have a 10 year maturity, maturing on April 18, 2027. J.P. Morgan Securities, LLC and Wells Fargo Securities, LLC served as the joint placement agents.


The following table summarizes the Company’s unsecured credit agreements:


Outstanding Balance


September 30,


December 31,


Interest


Maturity

(in thousands, except interest rates)


2017


2016


Rate(d)


Date

2015 Unsecured Term Loan Agreement(a)


$

325,000


$

375,000


1 month LIBOR + 1.40%


Feb. 2019


2017 Unsecured Revolving Credit and Term Loan Agreement(a)


Revolver (f)


126,500


-


1 month LIBOR + 1.20%


Jan. 2022

5.5-Year term loan


250,000


-


1 month LIBOR + 1.35%


Jan. 2023

7-Year term loan


-


-


1 month LIBOR + 1.90%


June 2024


376,500


-


2017 Senior Notes(a)


150,000


-


4.84%


Apr. 2027


2012 Unsecured Credit Agreement(a)


Term note


-


50,000


3 month LIBOR + 1.45%


June 2017

Term note


-


50,000


1 month LIBOR + 1.45%


June 2017

Revolver(b)


-


102,000


1 month LIBOR + 1.45%


June 2017


-


202,000


2013 Unsecured Credit Agreement(a)


-


185,000


1 month LIBOR + 1.75%

to 2.50%(e)


Oct. 2018


Total


851,500


762,000


Debt issuance costs, net(c)


(3,093

)


(2,109

)


$

848,407


$

759,891


(a)

The Company believes it was in compliance with all financial covenants for all periods presented.

(b)

At December 31, 2016, $273,200 of the revolving credit facility’s $300,000 capacity was available, due to a borrowing base limitation.

(c)

Amounts presented include debt issuance costs, net, related to the unsecured term notes only.

(d)

At September 30, 2017 and December 31, 2016, the one month LIBOR rate was 1.23% and 0.62%, respectively. At December 31, 2016, the three month LIBOR was 0.93%.

(e)

The margin is based on the Company’s overall leverage ratio and was 1.75% at December 31, 2016.

(f)

At September 30, 2017 the Company had an outstanding balance of $28,000 on the swingline loan feature of the Revolver, due within five business days.  On October 4, 2017 the balance became a part of the Revolver and therefore matures January 2022.

At September 30, 2017 and December 31, 2016, the weighted average interest rate on all outstanding borrowings was 2.96% and 2.14%, respectively.

Debt issuance costs were amortized and recorded as interest expense in the accompanying Condensed Consolidated Statements of Income and Comprehensive Income (Loss) of $486 and $403 for the three months ended September 30, 2017 and 2016, respectively, and $1,343 and $1,279 for the nine months ended September 30, 2017 and 2016, respectively.

For the nine months ended September 30, 2017, the Company paid $8,344incurred $3.8 million in debt issuance costs associated with the Senior Notes,unsecured revolving credit facility. For the Credit Agreementsix months ended June 30, 2021, the Company incurred $1.0 million in debt issuance costs associated with M&T as Administrative Agent,the amended 2026 Unsecured Term Loan. The Company did 0t incur debt issuance costs during the three months ended June 30, 2022 and the Amended and Restated Term Loan Agreement with SunTrust Bank. 2021.

15


For each separate debt instrument, on a lender by lender basis, in accordance with ASC 470-50, Debt Modifications and Extinguishment, the Company performed an assessment of whether the transaction iswas deemed to be new debt, a modification of existing debt, or an extinguishment of existing debt. Debt issuance costs are either deferred and amortized over the term of the associated debt or expensed as incurred.  Based on this assessment, $5,443 of

With respect to the unsecured revolving credit facility amendment, the transaction was deemed to be new debt and therefore, the debt issuance costs were related to new debt and thereforeincurred during the six months ended June 30, 2022, have been deferred and are being amortized over the term of the associated debt. The remaining $2,901With respect to the amended 2026 Unsecured Term Loan, the transaction was deemed to be a modification of existing debt and therefore the $0.9 million of debt issuance costs waspaid to lenders were deferred and are being amortized over the term of the associated with lenders whose commitments under the new agreements have been determined to be an extinguishment and suchdebt. The remaining debt issuance costs of $0.1 million were expensed as incurred during the six months ended June 30, 2021.

Debt issuance costs and original issuance discounts are amortized as a component of the cost of debt extinguishmentInterest expense in the accompanying Condensed Consolidated Statements of Income and Comprehensive Income (Loss) for the nine months ended September 30, 2017. Additionally, $654 of unamortizedIncome. The following table summarizes debt issuance costs were expensedcost and included in cost of debt extinguishment in the accompanying Condensed Consolidated Statements of Income and Comprehensive Income (Loss) for the nine months ended September 30, 2017.original issuance discount amortization:


For the Three Months Ended
June 30,


For the Six Months Ended
June 30,


(in thousands)


2022


2021


2022


2021


Debt issuance costs and original issuance discount amortization


$

900


$

956


$

1,756


$

1,870


9.10. Mortgages and Notes Payable

The Company’sCompany's mortgages and notes payable consist of the followingfollowing:


Origination


Maturity


(in thousands, except interest rates)


Date


Date


Interest


June 30,


December 31,


Lender


(Month/Year)


(Month/Year)


Rate


2022


2021


Wilmington Trust National Association


Apr-19


Feb-28


4.92%


$

46,142


$

46,760


(a) (b) (c) (d)

Wilmington Trust National Association


Jun-18


Aug-25


4.36%


19,355


19,557


(a) (b) (c) (e)

PNC Bank


Oct-16


Nov-26


3.62%


16,886


17,094


(b) (c)

T2 Durham I, LLC


Jul-21


Jul-24


Greater of Prime +
1.25% or 5.00%


7,500


7,500


(b) (f)

Aegon


Apr-12


Oct-23


6.38%


5,837


6,249


(b) (g)

Total mortgages


95,720


97,160


Debt issuance costs, net


(267

)


(314

)


Mortgages, net


$

95,453


$

96,846


(a)
Non-recourse debt includes the indemnification/guaranty of the Corporation and/or OP pertaining to fraud, environmental claims, insolvency, and other matters.
(b)
Debt secured by related rental property and lease rents.
(c)
Debt secured by guaranty of the OP.
(d)
Mortgage was assumed in April 2019 as part of the acquisition of the related property. The debt was recorded at Septemberfair value at the time of assumption.
(e)
Mortgage was assumed in June 2018 as part of the acquisition of the related property. The debt was recorded at fair value at the time of assumption.
(f)
Mortgage is subject to interest at a daily floating annual rate equal to the Prime Rate plus 1.25%, but no less than 5.00% per annum. At June 30, 20172022 and December 31, 2016:2021, the interest rate was 6.00% and 5.00%, respectively.
(g)
Mortgage was assumed in April 2012 as part of the acquisition of the related property. The debt was recorded at fair value at the time of the assumption.

(in thousands, except interest rates)


Origination

Date


Maturity Date


September 30,


December 31,


Lender


(Month/Year)


(Month/Year)


Interest Rate


2017


2016


(1)

M&T Bank


Dec-10


Apr-20


1 month

LIBOR+1.90%


$

-


$

21,335


(b) (f) (g)

(2)

Sun Life


Mar-12


Oct-21


5.13%


11,763


12,036


(b) (i)

(3)

Aegon


Apr-12


Oct-23


6.38%


9,330


9,804


(b) (j)

(4)

Legg Mason Mortgage Capital Corporation


Aug-10


Aug-22


7.06%


5,900


6,538


(b) (e)

(5)

Columbian Mutual Life Insurance Company


Aug-10


Sep-25


7.00%


1,510


1,538


(b) (c) (d)

(6)

Symetra Financial


Mar-11


Apr-31


6.34%


1,015


1,036


(a) (b)

(7)

Note holders


Dec-08


Dec-23


6.25%


750


750


(d)

(8)

Standard Insurance Co.


Jul-10


Aug-30


6.75%


585


597


(b) (c) (d) (h)

(9)

Siemens Financial Services, Inc.


Sep-10


Sep- 20


5.47%


5,869


6,010


(a) (b)

(10)

Standard Insurance Co.


Apr-09


May-34


6.88%


1,827


1,870


(b) (c) (h)

(11)

Wells Fargo Bank, N.A.


May-07


Jun-17


6.69%


-


1,694


(a) (b)

(12)

Standard Insurance Co.


May-09


Jun-34


6.88%


1,312


1,342


(b) (c) (h) (l)

(13)

Standard Insurance Co.


Mar-10


Apr-31


7.00%


-


1,058


(b) (c) (d) (h)

(14)

Standard Insurance Co.


Mar-10


Apr-31


7.00%


-


844


(b) (c) (d) (h)

(15)

Columbus Life Insurance


Feb-13


Jan-26


4.65%


-


9,400


(b) (k)

(16)

Athene Annuity & Life Co.


Feb-12


Feb-17


3.76%


-


12,701


(b)

(17)

PNC Bank


Oct-16


Nov-26


3.62%


18,711


18,971


(b) (c)


58,572


107,524


Debt issuance costs, net


(689

)


(838

)


$

57,883


$

106,686


(a)

Non-recourse debt includes the indemnification/guaranty of the Corporation and/or Operating Company pertaining to fraud, environmental claims, insolvency and other matters.

(b)

Debt secured by related rental property and lease rents.

(c)

Debt secured by guaranty of the Operating Company.

(d)

Debt secured by guaranty of the Corporation.

(e)

Debt is guaranteed by a third party.

(f)

The Company entered into an interest rate swap agreement in connection with this mortgage note or note payable, as further described in Note 10. At the time the mortgage was paid in full, the related interest rate swap agreement was terminated.

(g)

M&T’s participation in the New York State Energy Research and Development Authority program results in a blended interest rate of one month LIBOR plus 1.64% for the term of this mortgage note payable.

(h)

The interest rate represents the initial interest rate on the respective notes. The interest rate will be adjusted at Standard Insurance’s discretion at certain times throughout the term of the note, ranging from 59 to 239 months, and the monthly installments will be adjusted accordingly. At the time Standard Insurance may adjust the interest rate for notes payable, the Company has the right to prepay the note without penalty.

(i)

Mortgage was assumed in March 2012 as part of an UPREIT transaction. The debt was marked to market at the time of the assumption.

(j)

Mortgage was assumed in April 2012 as part of the acquisition of the related property. The debt was marked to market at the time of the assumption.

(k)

Mortgage was assumed in December 2013 as part of the acquisition of the related property. The debt was marked to market at the time of the assumption.

(l)

Subsequent to September 30, 2017, the note was paid in full.

At SeptemberJune 30, 2017,2022, investment in rental property of $91,326 is$159.5 million was pledged as collateral against the Company’s mortgages and notes payable.

The Company extinguished six and four mortgages totaling $46,804 and $8,199, during the nine months ended September 30, 2017 and the year ended December 31, 2016, respectively. For the three months ended September 30, 2017 and 2016, the cost of extinguishment for the mortgages was $1,404 and $52, respectively. For the nine months ended September 30, 2017 and 2016, the cost of extinguishment for the mortgages was $1,464 and $105, respectively.Company's mortgages.


Estimated future principal payments to be made under the above mortgage and note payable agreements,mortgages and the Company’sCompany's unsecured credit agreements (see Note 8)9) at SeptemberJune 30, 20172022 are as follows:

(in thousands)


Remainder of 2017


$

28,677


2018


2,829


2019


328,034


2020


8,449


2021


13,305


Thereafter


528,778


$

910,072


(in thousands)


Remainder of 2022


$

1,466


2023


7,582


2024


199,760


2025


20,195


2026


737,500


Thereafter


889,874


$

1,856,377


Certain of the Company’s mortgage and note payable agreementsCompany's mortgages provide for prepayment fees and can be terminated under certain events of default as defined under the related agreements whichagreements. These prepayment fees are not reflected as part of the table above.

10.16


11. Interest Rate Swaps

Interest rate swaps were entered into with certain financial institutions in order to mitigate the impact of interest rate variability over the term of the related debt agreements. The interest rate swaps are considered cash flow hedges. In order to reduce counterparty concentration risk, the Company has a diversification policy for institutions that serve as swap counterparties. Under these agreements, the Company receives monthly payments from the counterparties on these interest rate swaps equal to the related variable interest rates multiplied by the outstanding notional amounts. Certain interest rate swaps amortize on a monthly basis. In turn, the Company pays the counterparties each month an amount equal to a fixed rate multiplied by the related outstanding notional amounts. The intended net impact of these transactions is that the Company pays a fixed interest rate on its variable ratevariable-rate borrowings.

The following is a summary of the Company’sCompany's outstanding interest rate swap agreements at Septemberagreements:

(in thousands, except interest rates)


June 30, 2022


December 31, 2021


Counterparty


Maturity Date


Fixed
Rate


Notional
Amount


Fair
Value


Notional
Amount


Fair
Value


Wells Fargo Bank, N.A.


October 2024


2.72

%


$

15,000


$

110


$

15,000


$

(702

)


Capital One, National Association


December 2024


1.58

%


15,000


510


15,000


(241

)


Bank of Montreal


January 2025


1.91

%


25,000


672


25,000


(649

)


Truist Financial Corporation


April 2025


2.20

%


25,000


520


25,000


(905

)


Bank of Montreal


July 2025


2.32

%


25,000


459


25,000


(1,049

)


Truist Financial Corporation


July 2025


1.99

%


25,000


697


25,000


(767

)


Truist Financial Corporation


December 2025


2.30

%


25,000


517


25,000


(1,125

)


Bank of Montreal


January 2026


1.92

%


25,000


833


25,000


(760

)


Bank of Montreal


January 2026


2.05

%


40,000


1,162


40,000


(1,415

)


Capital One, National Association


January 2026


2.08

%


35,000


980


35,000


(1,274

)


Truist Financial Corporation


January 2026


1.93

%


25,000


826


25,000


(768

)


Capital One, National Association


April 2026


2.68

%


15,000


121


15,000


(941

)


Capital One, National Association


July 2026


1.32

%


35,000


2,076


35,000


(205

)


Bank of Montreal


December 2026


2.33

%


10,000


233


10,000


(538

)


Bank of Montreal


December 2026


1.99

%


25,000


941


25,000


(936

)


Toronto-Dominion Bank


March 2027


2.46

%


15,531


660


0


Wells Fargo Bank, N.A.


April 2027


2.72

%


25,000


170


25,000


(1,887

)


Bank of Montreal


December 2027


2.37

%


25,000


637


25,000


(1,570

)


Capital One, National Association


December 2027


2.37

%


25,000


616


25,000


(1,575

)


Wells Fargo Bank, N.A.


January 2028


2.37

%


75,000


1,864


75,000


(4,741

)


Bank of Montreal


May 2029


2.09

%


25,000


1,195


25,000


(1,316

)


Regions Bank


May 2029


2.11

%


25,000


1,143


25,000


(1,356

)


Regions Bank


June 2029


2.03

%


25,000


1,265


25,000


(1,222

)


U.S. Bank National Association


June 2029


2.03

%


25,000


1,284


25,000


(1,220

)


U.S. Bank National Association


August 2029


1.35

%


25,000


2,407


25,000


(9

)


Regions Bank


March 2032


2.69

%


15,531


1,103


0


U.S. Bank National Association


March 2032


2.70

%


15,531


1,126


0


Bank of Montreal


March 2034


2.81

%


31,064


2,435


0


$

717,657


$

26,562


$

640,000


$

(27,171

)


At June 30, 2017:

(in thousands, except interest rates)


Counterparty


Maturity Date


Fixed Rate


Variable Rate Index


Notional Amount


Fair Value


Bank of America, N.A.


November 2023


2.80%


LIBOR 1 month


$

25,000


$

(1,177

)

Bank of Montreal


July 2024


1.16%


LIBOR 1 month


40,000


2,147


Bank of Montreal


January 2025


1.91%


LIBOR 1 month


25,000


193


Bank of Montreal


July 2025


2.32%


LIBOR 1 month


25,000


(490

)

Bank of Montreal


January 2026


1.92%


LIBOR 1 month


25,000


297


Bank of Montreal


January 2026


2.05%


LIBOR 1 month


40,000


84


Bank of Montreal


December 2026


2.33%


LIBOR 1 month


10,000


(175

)

Capital One, N.A.


December 2021


1.05%


LIBOR 1 month


15,000


487


Capital One, N.A.


December 2024


1.58%


LIBOR 1 month


15,000


459


Capital One, N.A.


January 2026


2.08%


LIBOR 1 month


35,000


39


Capital One, N.A.


July 2026


1.32%


LIBOR 1 month


35,000


2,289


M&T Bank


September 2022


2.83%


LIBOR 1 month


25,000


(1,150

)

M&T Bank


November 2023


2.65%


LIBOR 1 month


25,000


(1,023

)

Regions Bank


March 2018


1.77%


LIBOR 1 month


25,000


(46

)

Regions Bank


March 2019


1.91%


LIBOR 3 month


25,000


(106

)

Regions Bank


May 2020


2.12%


LIBOR 1 month


50,000


(562

)

Regions Bank


March 2022


2.43%


LIBOR 3 month


25,000


(550

)

Regions Bank


December 2023


1.18%


LIBOR 1 month


25,000


1,178


SunTrust Bank


April 2024


1.99%


LIBOR 1 month


25,000


(63

)

SunTrust Bank


April 2025


2.20%


LIBOR 1 month


25,000


(332

)

SunTrust Bank


July 2025


1.99%


LIBOR 1 month


25,000


72


SunTrust Bank


January 2026


1.93%


LIBOR 1 month


25,000


248


Wells Fargo Bank, N.A.


February 2021


2.39%


LIBOR 1 month


35,000


(739

)

Wells Fargo Bank, N.A.


October 2024


2.72%


LIBOR 1 month


15,000


(706

)


$

640,000


$

374


The fair value of2022, the weighted average fixed rate on all outstanding interest rate swaps are reported on the Condensed Consolidated Balance Sheets at September 30, 2017 and December 31, 2016 as follows:was 2.11%.


September 30,


December 31,


(in thousands)


2017


2016


Interest rate swaps, asset


$

7,493


$

9,598


Interest rate swaps, liability


(7,119

)


(10,217

)

Interest rate swap


$

374


$

(619

)

17


The total lossamounts recognized, and the location of the loss in the accompanying Condensed Consolidated Statements of Income and Comprehensive Income, (Loss), from converting from variable rates to fixed rates under these agreements iswere as follows for the three months ended September 30, 2017 and 2016:follows:


Effective Portion


Ineffective Portion


(in thousands)


Location of Loss

Reclassified from

Accumulated Other

Comprehensive

Income into Income


Amount of Loss

Reclassified from

Accumulated Other

Comprehensive

Income into Income


Location of Loss

Recognized in Income on

Derivatives


Amount of Gain

Recognized in Income on

Derivatives


Interest rate swaps


2017


Interest expense


$

448


Interest expense


$

-


2016


Interest expense


2,426


Interest expense


(2,991

)


Amount of Gain (Loss)


Reclassification from


Total Interest Expense


Recognized in


Accumulated Other


Presented in the Condensed


(in thousands)


Accumulated Other


Comprehensive Income (Loss)


Consolidated Statements of


Comprehensive


Amount of


Income and Comprehensive


For the Three Months Ended June 30,


Income (Loss)


Location


Loss


Income


2022


$

18,772


Interest expense


$

3,122


$

17,888


2021


(2,911

)


Interest expense


4,039


15,430


Amount of Gain


Reclassification from


Total Interest Expense


Recognized in


Accumulated Other


Presented in the Condensed


Accumulated Other


Comprehensive Income (Loss)


Consolidated Statements of


(in thousands)


Comprehensive


Amount of


Income and Comprehensive


For the Six Months Ended June 30,


Income (Loss)


Location


Loss


Income


2022


$

53,733


Interest expense


$

6,987


$

34,784


2021


25,769


Interest expense


8,055


31,538


The total loss recognized, and the location of the loss in the accompanying Condensed Consolidated Statements of Income and Comprehensive Income (Loss), from converting from variable rates to fixed rates under these agreements is as follows for the nine months ended September 30, 2017 and 2016:


Effective Portion


Ineffective Portion


(in thousands)


Location of Loss

Reclassified from

Accumulated Other

Comprehensive

Income into Income


Amount of Loss

Reclassified from

Accumulated Other

Comprehensive

Income into Income


Location of Loss

Recognized in Income on

Derivatives


Amount of Loss

Recognized in Income on

Derivatives


Interest rate swaps


2017


Interest expense


$

3,152


Interest expense


$

332


2016


Interest expense


7,030


Interest expense


2,219


Ineffectiveness of $2,219 for the nine months ended September 30, 2017 was attributable to inconsistencies in certain terms between the interest rate swaps and the credit agreements. The interest rate swaps continued to qualify for hedge accounting, with the effective portion of mark-to-market adjustments included in Accumulated other comprehensive income. During the fourth quarter of 2016, the Company amended the terms of the credit agreements, thereby reversing the impact of the ineffectiveness and rendering a $0 full year 2016 impact to the Condensed Consolidated Statement of Income and Comprehensive Income (Loss).

Amounts related to the interest rate swaps expected to be reclassified out of Accumulated other comprehensive income (loss) to Interest expense during the next twelve months are estimated to be $3,460.a gain of $4.8 million. The Company is exposed to credit risk in the event of non-performance by the counterparties of the swaps. The Company minimizes thisthe risk exposure by limiting counterparties to only major banks who meet established credit and capital guidelines.guidelines.

11.12. Non-Controlling Interests

The following table summarizes OP Units exchanged for shares of common stock:

Under


For the Three Months Ended
June 30,


For the Six Months Ended
June 30,


(in thousands)


2022


2021


2022


2021


OP Units exchanged for shares of common stock


0


1,127


0


1,165


Value of units exchanged


$

0


$

17,859


$

0


$

18,465


On June 16, 2021, the Company’s UPREIT structure, entities and individuals can contribute their propertiesCompany achieved the VWAP milestone applicable to tranche 1 of the Operating Company in exchange for membership interests inearnout (see Note 4). As a result, the Operating Company. Properties contributed as part of UPREIT transactionsOP issued 247,899 non-controlling OP Units on June 22, 2021. There were no OP Units issued during the ninethree and six months ended SeptemberJune 30, 2017 and 2016 were valued at $8,278 and $7,190, respectively, which represents the estimated fair value of the properties contributed, less any assumed debt.2022.

The Company recognized rental income related to UPREIT transactions in the amount of $3,539 and $3,025 for the three months ended September 30, 2017 and 2016, respectively. The Company recognized rental income related to UPREIT transactions in the amount of $9,503 and $8,754 for the nine months ended September 30, 2017 and 2016, respectively.


12.13. Credit Risk Concentrations

The Company maintained bank balances that, at times, exceeded the federally insured limit during the ninesix months ended SeptemberJune 30, 2017.2022. The Company has not experienced losses relating to these deposits and management does not believe that the Company is exposed to any significant credit risk with respect to these amounts.

The Company’s rental property is managed by the Manager and the Asset Manager as described in Note 3. Management fees and expense reimbursements paid to the Manager and Asset Manager represent 21% and 26% of the Company’s total operating expenses for the three months ended September 30, 2017 and 2016, and 21% and 25% of the Company’s total operating expenses for the nine months ended September 30, 2017 and 2016, respectively.  The Company has mortgages and notes payable with five institutions that comprise 32%, 20%, 16%, 10%, and 10% of total mortgages and notes payable at September 30, 2017. The Company has mortgages and notes payable with four institutions that comprise 20%, 18%, 12%, and 11% of total mortgages and notes payable at December 31, 2016. For the three and ninesix months ended SeptemberJune 30, 20172022 and 2016,2021, the Company had no0 individual tenants or common franchises that accounted for more than 10% of total revenues.Lease revenues, net.

13.

18


14. Equity

General

Pursuant to the Corporation’s Articles of Incorporation (the “Charter”The Company established an at-the-market common equity offering program ("ATM Program"), the Corporation is authorized to issue an aggregate of 100,000 shares of capital stock, consisting of 80,000 shares designated as common stock with a par value of $0.001 per share, and 20,000 shares designated as preferred stock with a par value of $0.001 per share (unrounded). The Board of Directors, without any action by the Corporation’s stockholders,through which it may, amend the Charter from time to time, publicly offer and sell shares of common stock having an aggregate gross sales price of up to increase or decrease$400.0 million. The ATM Program provides for forward sale agreements, enabling the aggregate numberCompany to set the price of shares of capital stock orupon pricing the numberoffering, while delaying the issuance of shares and the receipt of capitalthe net proceeds. As of June 30, 2022, the Company has issued common stock with an aggregate gross sales price of any class or series that$234.0 million under the ATM Program and could issue additional common stock with an aggregate sales price of up to $166.0 million under the ATM Program.

The following table presents information about the Company's ATM Program activity:


For the Three Months Ended


For the Six Months Ended


(in thousands, except per share amounts)


June 30, 2022


June 30, 2022


Number of common shares issued


3,236


9,509


Weighted average sale price per share


$

21.42


$

21.69


Net proceeds


$

68,321


$

202,647


Gross proceeds


69,313


205,857


There was 0 ATM Program activity during the three and six months ended June 30, 2021.

On June 28, 2021, the Corporation has authority to issue.

Common Stock

Thecompleted its first public follow-on equity offering and issued 11,500,000 shares of Common Stock, including shares issued pursuant to the Corporation’sunderwriters' full exercise of their over-allotment option, at $23.00 per share. The net proceeds, after deducting underwriting discounts and commissions of $10.6 million and $0.4 million of other expenses, were $253.5 million. The Company used the net proceeds to repay the remaining $160.6 million principal due under the Company's revolving credit facility. The remaining net proceeds will be used for general business purposes, including acquisitions.

On June 16, 2021, the Company achieved the VWAP milestone applicable to tranche 1 of the earnout (see Note 4). As a result, the Company issued 145,195 shares of common stock entitleon June 22, 2021. There was 0 such activity during the holdersthree and six months ended June 30, 2022.

15. Stock-Based Compensation

Restricted Stock Awards

During the three and six months ended June 30, 2022, the Company awarded 32,868 and 174,913 shares of RSAs, respectively, to oneofficers, employees and non-employee directors, under the Equity Incentive Plan. During the three and six months ended June 30, 2021, the Company issued 1,665 and 201,095 shares of RSAs, respectively. The holder of RSAs is generally entitled at all times on and after the date of issuance of the restricted common shares to exercise the rights of a stockholder of the Company, including the right to vote per share on all matters upon which stockholders are entitled to vote,the shares and the right to receive dividends on the shares. The RSAs vest over a one, three, or four year period from the date of the grant and other distributions as authorized byare subject to the Board of Directorsholder's continued service through the applicable vesting dates and in accordance with the Maryland General Corporation Law and to all rights of a stockholder pursuant to the Maryland General Corporation Law. The common stock has no preferences or preemptive, conversion or exchange rights.

Pursuant to limited liability company agreementterms of the Operating Company, each outstanding membership unitindividual award agreements. The weighted average value of awards granted during the Operating Company is convertible into onethree and six months ended June 30, 2022, were $20.23 and $21.39, respectively, which were based on the market price per share of the Corporation’sCompany's common stock subject toon the terms and conditions set forth in the Operating Company’s operating agreement.

Preferred Stock

grant date. The Charter also provides the Boardweighted average value of Directors with the authority to issue one or more classes or series of preferred stock, and prior to the issuance of such shares of preferred stock, the Board of Directors shall have the power from time to time to classify or reclassify, in one or more series, any unissued shares and designate the preferences, rights and privileges of such shares of preferred stock. As of September 30, 2017 and December 31, 2016, no shares of the Corporation’s preferred stock were issued and outstanding.

Share Redemption Program

In 2009, the Board of Directors approved a share redemption program (“Share Redemption Program”) under which the Corporation may repurchase shares of its outstanding common stock after December 31, 2009.  The Board of Directors approved and adopted an amended and restated Share Redemption Program effective as of June 28, 2017.

Under the Share Redemption Program, stockholders may request that the Corporation redeem shares after one year from the original investment date, subject to certain exceptions as set forth in the Share Redemption Program. Under the Share Redemption Program, the Corporation is not obligated to repurchase shares and, notwithstanding any other term of the Share Redemption Program, the Board of Directors or IDC may reject any share redemption request made by any stockholder at any time. Shares held for more than 12 months, but less than five years, will be redeemed at a purchase price equal to 95% of the current share value established from time-to-time by the IDC (the “Determined Share Value”), and shares held for five years or more will be redeemed at a purchase price equal to 100% of the current Determined Share Value, subject to certain exemptions as set forth in the Share Redemption Program.


Total shares redeemed pursuant to the Share Redemption Program in any quarter may not exceed 1% of the total number of shares outstanding at the beginning of the calendar year plus 50% of the total number of any additional shares issuedawards granted during the prior calendar quarter under the Corporation’s Distribution Reinvestment Plan (“DRIP”)three and six months ended June 30, 2021, were $19.76 and $18.66, provided that the total number of shares redeemed during any calendar year may not exceed 5% of the number of shares outstanding as of the first day of such calendar year. The Board of Directors or the IDC may amend, suspend, or terminate the Share Redemption Program at any time upon 30 days’ notice to the Corporation’s stockholders.respectively.

The following table summarizes redemptions underpresents information about the Share Redemption ProgramCompany's RSAs:


For the Three Months Ended
June 30,


For the Six Months Ended
June 30,


(in thousands)


2022


2021


2022


2021


Compensation cost (a)


$

877


$

728


$

1,487


$

2,423


Dividends declared on unvested RSAs


106


97


203


201


Fair value of shares vested during the period


0


774


3,209


3,296


(a)
Includes $0.1 million compensation cost recognized from RSAs granted to non-employee directors for the three and ninesix months ended SeptemberJune 30, 20172022.

(in thousands, except recognition period)


June 30, 2022


December 31, 2021


Unamortized value of RSAs


$

6,794


$

4,715


Weighted average amortization period (in years)


2.5


2.4


19


The following table presents information about the Company's RSA activity:


For the Three Months Ended June 30,


2022


2021


(in thousands, except per share amounts)


Number of Shares


Weighted Average
Grant Date Fair
Value per Share


Number of Shares


Weighted Average
Grant Date Fair
Value per Share


Unvested at beginning of period


367


$

20.33


416


$

19.62


Granted


33


20.23


2


19.76


Vested


0


0


(40

)


19.81


Forfeited


(8

)


19.95


0


0


Unvested at end of period


392


20.33


378


19.60


For the Six Months Ended June 30,


2022


2021


(in thousands, except per share amounts)


Number of Shares


Weighted Average
Grant Date Fair
Value per Share


Number of Shares


Weighted Average
Grant Date Fair
Value per Share


Unvested at beginning of period


372


$

19.62


341


$

20.50


Granted


175


21.39


201


18.67


Vested


(146

)


19.80


(164

)


20.15


Forfeited


(9

)


20.06


0


0


Unvested at end of period


392


20.33


378


19.60


Performance-based Restricted Stock Units

The Company issued target grants of 121,883 and 2016:


For the three months ended


For the nine months ended


September 30,


September 30,


(in thousands, except stockholders and shares)


2017


2016


2017


2016


Number of stockholders


6


7


20


20


Number of shares


23


45


62


87


Aggregate redemption price


$

1,808


$

3,427


$

4,825


$

6,487


Distribution Reinvestment132,189 PRSUs, during the six months ended June 30, 2022 and 2021, respectively, under the Equity Incentive Plan

to the officers of the Company. There were no PRSUs granted during the three months ended June 30, 2022 and 2021, respectively. The Corporation has adoptedawards are non-vested restricted stock units where the DRIP, pursuantvesting percentages and the ultimate number of units vesting will be measured 50% based on the relative total shareholder return ("rTSR") of the Company's common stock as compared to which the Corporation’s stockholders and holdersrTSR of membership unitspeer companies, as identified in the Operating Company (other thangrant agreements, over a three-year period, and 50% based on the Corporation), may elect to have cash distributions reinvested in additional sharesrTSR of the Corporation’sCompany's common stock. Cash distributionsstock as compared to the rTSR of the MSCI US REIT Index over a three year measurement period. Vesting percentages range from 0% to 200% with a target of 100%. rTSR means the percentage appreciation in the fair market value of one share over the three year measurement period beginning on the date of grant, assuming the reinvestment of dividends on the ex-dividend date. The target number of units is based on achieving a rTSR equal to the 55th percentile of the peer companies and MSCI US REIT Index. Dividends accrue during the measurement period and will be reinvestedpaid on the PRSUs ultimately earned at the end of the measurement period in additional shares ofeither cash or common stock, pursuant toat the DRIP atdirection of the Board's Compensation Committee. The grant date fair value of the PRSUs was measured using a perMonte Carlo simulation model based on assumptions including share price equal to 98% ofvolatility.

The following tables present information about the Determined Share Value as ofCompany's PRSUs:


For the Three Months Ended
June 30,


For the Six Months Ended
June 30,


(in thousands, except recognition period)


2022


2021


2022


2021


Compensation cost


$

504


$

223


$

823


$

297


June 30, 2022


December 31, 2021


Unamortized value of PRSUs


$

4,490


$

1,931


Weighted average amortization period (in years)


2.3


2.2


20


The following table presents information about the applicable distribution date. The Corporation may amend the DRIP at any time upon written notice to each participant at least 10 days prior to the effective date of the amendment. The Corporation may terminate the DRIP upon written notice to each participant at least 30 days prior to the effective date of the termination. At September 30, 2017 and December 31, 2016, a total of 1,451 and 1,076, shares of common stock, respectively, have been issued under the DRIP.Company's PRSU activity:


For the Three Months Ended June 30,


2022


2021


(in thousands, except per share amounts)


Number of Shares


Weighted Average
Grant Date Fair
Value per Share


Number of Shares


Weighted Average
Grant Date Fair
Value per Share


Unvested at beginning of period


232


$

26.25


110


$

24.40


Granted


0


0


0


0


Vested


0


0


0


0


Forfeited


(1

)


27.93


0


0


Unvested at end of period


231


26.25


110


24.40


14.


For the Six Months Ended June 30,


2022


2021


(in thousands, except per share amounts)


Number of Shares


Weighted Average
Grant Date Fair
Value per Share


Number of Shares


Weighted Average
Grant Date Fair
Value per Share


Unvested at beginning of period


110


$

24.40


0


$

0


Granted


122


27.93


132


24.40


Vested


0


0


0


0


Forfeited


(1

)


27.93


(22

)


24.40


Unvested at end of period


231


26.25


110


24.40


16. Earnings per Share

The following table summarizes the components used in the calculation of basic and diluted earnings per share (“EPS”("EPS"):


For the Three Months Ended
June 30,


For the Six Months Ended
June 30,


(in thousands, except per share amounts)


2022


2021


2022


2021


Basic earnings:


Net earnings attributable to Broadstone Net Lease, Inc. common
   shareholders


$

33,516


$

21,214


$

60,274


$

43,437


Less: earnings allocated to unvested restricted shares


(105

)


(97

)


(202

)


(201

)

Net earnings used to compute basic earnings per common share


$

33,411


$

21,117


$

60,072


$

43,236


Diluted earnings:


Net earnings used to compute basic earnings per share


$

33,411


$

21,117


$

60,072


$

43,236


Net earnings attributable to non-controlling interests


2,036


1,606


3,719


3,343


Net earnings used to compute diluted earnings per common share


$

35,447


$

22,723


$

63,791


$

46,579


Weighted average number of common shares outstanding


169,933


146,506


167,072


146,089


Less: weighted average unvested restricted shares (a)


(378

)


(387

)


(374

)


(361

)

Weighted average number of common shares outstanding used in
   basic earnings per common share


169,555


146,119


166,698


145,728


Effects of restricted stock units (b)


378


219


325


147


Effects of convertible membership units (c)


10,323


11,092


10,323


11,240


Weighted average number of common shares outstanding used in
   diluted earnings per common share


180,256


157,430


177,346


157,115


Basic earnings per share


$

0.20


$

0.14


$

0.36


$

0.30


Diluted earnings per share


$

0.20


$

0.14


$

0.36


$

0.30


For the three months ended


For the nine months ended


September 30,


September 30,


(in thousands, except per share)


2017


2016


2017


2016


Basic earnings:


Net earnings attributable to Broadstone Net Lease, Inc.


$

11,948


$

13,958


$

39,269


$

23,874


Diluted earnings:


Net earnings attributable to Broadstone Net Lease, Inc.


$

11,948


$

13,958


$

39,269


$

23,874


Net earnings attributable to non-controlling interests


1,042


1,459


3,460


2,600


$

12,990


$

15,417


$

42,729


$

26,474


Basic and diluted weighted average shares outstanding:


Weighted average number of common shares outstanding used in

   basic earnings per share


17,617


13,647


16,607


12,738


Effects of convertible membership units


1,530


1,427


1,462


1,416


Weighted average number of common shares outstanding used in

   diluted earnings per share


19,147


15,074


18,069


14,154


Basic and diluted net earnings per common share


$

0.68


$

1.02


$

2.36


$

1.87


In(a)

Represents the table above, outstanding membership unitsweighted average effects of 391,187 and 378,516 unvested restricted shares of common stock as of June 30, 2022 and 2021, respectively, which will be excluded from the computation of earnings per share until they vest. The shares of restricted common stock were not included in the Operating Companycalculation of diluted earnings per share, as the effect of doing so would have been anti-dilutive.
(b)
Represents the weighted average effects of shares of common stock to be issued as though the end of the period were the end of the performance period (see Note 15).
(c)
Represents the weighted average effects of 10,323,206 and 10,481,872 OP Units outstanding at June 30, 2022 and 2021, respectively. OP Units are included in the diluted earnings per share calculation. However, because such membership unitsOP Units would also require that the share of the Operating Companynet income attributable to such membershipOP units also be added back to net income, there is no effect onto EPS.

21


15.

17. Supplemental Cash Flow Disclosures

Cash paid for interest was $20,364$32.1 million and $16,430$30.0 million for the ninesix months ended SeptemberJune 30, 20172022 and 2016,2021, respectively. Cash paid for state income and franchise taxes was $751$1.0 million and $323$0.7 million for the ninesix months ended SeptemberJune 30, 20172022 and 2016,2021, respectively.


The following are non-cash transactions and have been excluded from the accompanying Condensed Consolidated Statements of Cash Flows:

During the ninesix months ended SeptemberJune 30, 2017 and 2016,2021, the Corporation issued 375 and 284Company converted 1,164,461 OP Units valued at $18.5 million to 1,164,461 shares respectively, of the Corporation’scommon stock. There were no OP Units converted to common stock with a value of approximately $29,031 and $20,659, respectively, underduring the terms of the DRIP (see Note 13).

During the ninesix months ended SeptemberJune 30, 20172022.

At June 30, 2022 and 2016, the Operating Company issued 103 and 97, respectively, membership units in the Operating Company in exchange for property contributed in UPREIT transactions valued at $8,278 and $7,190, respectively (see Note 11).

At September 30, 2017 and 2016,2021, dividend amounts declared and accrued but not yet paid amounted to $8,099$49.5 million and $6,303,$43.2 million, respectively.

In connection with fire damage incurred at three properties during the nine months ended SeptemberAt June 30, 2017,2022 and 2021, the Company recognized $2,857 in insurance recovery receivables which were a reductionadjusted the carrying value of Non-controlling interests to depreciation expense forreflect their share of the associated real estate assets.

book value of the OP by $2.9 million and $7.9 million, respectively, with the reallocation recorded as an offset to Additional paid-in capital and Accumulated other comprehensive income (loss).

16.18. Commitments and Contingencies

Litigation

From time to time, the Company is a party to various litigation matters incidental to the conduct of the Company’sCompany's business. While the resolution of such matters cannot be predicted with certainty, based on currently available information, the Company does not believe that the final outcome of any of these matters will have a material effect on its consolidated financial position, results of operations, or liquidity.

Property and Acquisition Related

In connection with ownership and operation of real estate, the Company may potentially be liable for cost and damages related to environmental matters. The Company is not aware of any non-compliance, liability, claim, or other environmental condition that would have a material effect on its consolidated financial position, results of operations, or liquidity.

As part of acquisitions closed during 2016 and oneThe Company had a commitment to fund a building expansion project related to a previous acquisition closed in 2017, the Company assumed four separate lease agreements that provided for a total of $11,464$17.4 million, in tenant improvement allowances. Duringexchange for an increase in base rent. In June 2022, the nine months ended September 30,2017Company fulfilled this commitment and the year ended December 31, 2016, paymentsbase rent increased accordingly.

The Company is a party to three separate tax protection agreements with the contributing members of $3,863three distinct UPREIT transactions and $974, respectively, have been made for workto the Founding Owners' Tax Protection Agreement in connection with the internalization. The tax protection agreements require the Company to indemnify the beneficiaries in the event of a sale, exchange, transfer, or other disposal of the contributed property, and in the case of the Founding Owners' Tax Protection Agreement, the entire Company, in a taxable transaction that would cause such beneficiaries to recognize a gain that is protected under the agreements, subject to certain exceptions. The Company is required to allocate an amount of nonrecourse liabilities to each beneficiary that is at least equal to the minimum liability amount, as contained in the agreements. The minimum liability amount and the associated allocation of nonrecourse liabilities are calculated in accordance with applicable tax regulations, are completed at the OP level, and do not represent GAAP accounting. Therefore, there is no impact to the Condensed Consolidated Financial Statements. Based on values as of June 30, 2022, taxable sales of the applicable properties would trigger liability under these allowances,the agreements of approximately $22.3 million. Based on information available, the Company does not believe that the events resulting in a total tenant improvement allowance of $6,627 and $9,490 at September 30, 2017 and December 31, 2016, respectively.

During the nine months ended September 30, 2017, three properties helddamages as detailed above have occurred or are likely to occur in the Company’sforeseeable future.

In the normal course of business, the Company enters into various types of commitments to purchase real estate portfolio incurred lossesproperties. These commitments are generally subject to the Company's customary due to fire damage. Management anticipates that the proceeds received from insurance will exceed the book value of the property destroyed,diligence process and, accordingly, a gainnumber of specific conditions must be met before the Company is obligated to purchase the properties.

19. Subsequent Events

On July 15, 2022, the Company paid distributions totaling $49.2 million.

On July 28, 2022, the Board of Directors declared a quarterly distribution of $0.270 per share on insurance settlement maythe Company's common stock and OP Units for the third quarter of 2022, which will be recorded in a future period upon receiptpayable on or before October 14, 2022 to stockholders and OP unitholders of funds.record as of September 30, 2022.

17. Subsequent Events

Subsequent to SeptemberJune 30, 2017, the Company has raised $18,443 for a total of 231 shares of the Corporation’s common stock through monthly equity closings, including dividend reinvestments, and $4,635 for a total of 58 units of the Operating Company’s membership interest through an UPREIT transaction. Through November 13, 2017, the Company has paid $8,099 in distributions, including dividend reinvestments.

Subsequent to September 30, 2017,2022, the Company continued to expand its operations through the acquisition of additional rental property and associated intangible assets and liabilities. The Company acquired approximately $25,693$80.2 million of rental property and associated intangible assets and liabilities (see Note 4)5).

22


On August 1, 2022, the Company entered into 2 new unsecured bank term loans, including a $200.0 million, five year term loan that matures in 2027 (the "2027 Unsecured Term Loan"), and assumed $11,933a $300.0 million, seven year term loan that matures in 2029 (the "2029 Unsecured Term Loan"). Borrowings on the new term loans bear interest at variable rates based on the Secured Overnight Financing Rate plus a margin based on the Company's credit rating, ranging between 0.80% and 1.60% per annum for the 2027 Unsecured Term Loan, and 1.15% and 2.20% per annum for the 2029 Unsecured Term Loan. The applicable margin is 0.95% and 1.25% for the 2027 Unsecured Term Loan and 2029 Unsecured Term Loan, respectively. Proceeds from the loans were used to repay in full the $190.0 million unsecured term loan set to mature in 2024, including accrued interest, and a portion of liabilities.the outstanding balance on the unsecured revolving credit facility.

On November 7, 2017,Subsequent to June 30, 2022, the BoardCompany paid down $318.0 million, and borrowed $94.0 million on the unsecured revolving credit facility, the proceeds of Directors declaredwhich were used to fund acquisitions and for other general corporate purposes.

Through August 3, 2022, the Company issued 962,200 shares of common stock at a distributionweighted average sale price of $0.415$21.44 per share onunder the Corporation’s common stockATM Program. The net proceeds, after deducting $0.3 million of commissions and approved a distributionother offering costs, were $20.3 million.

23


Item 2. Management's Discussion and Analysis of $0.415 per membership unitFinancial Condition and Results of the Operating Company for monthly distributions through January 2018. The distributions are payable on or prior to the 15th of the following month to the Corporation’s common stockholders and the Operating Company’s unit holders of record on the last day of the month. In addition, the IDC determined the Determined Share Value for the Corporation’s common stock to be $81.00 per share for subscription agreements received from November 1, 2017 through January 31, 2018.Operations


Item 2.

Management’s Discussion and Analysis of Financial Condition and Results of Operations

Except where the context suggests otherwise, as used in this Quarterly Report on Form 10-Q, the terms “we,” “us,” “our,”"BNL," "we," "us," "our," and “our company”"our company" refer to Broadstone Net Lease, Inc., a Maryland corporation incorporated on October 18, 2007, and, as required by context, Broadstone Net Lease, LLC, a New York limited liability company, which we refer to as the or our “Operating Company,”"OP," and to their respective subsidiaries.

The following Management’sManagement's Discussion and Analysis of Financial Condition and Results of Operations (“("MD&A”&A") is intended to help the reader understand our results of operations and financial condition. This MD&A is provided as a supplement to, and should be read in conjunction with, our consolidated financial statementsCondensed Consolidated Financial Statements and the accompanying notesNotes to the consolidated financial statementsCondensed Consolidated Financial Statements appearing elsewhere in this Quarterly Report on Form 10-Q.

Cautionary Note Regarding Forward-Looking Statements

This Quarterly Report on Form 10-Q may containcontains forward-looking statements, withinwhich reflect our current views regarding our business, financial performance, growth prospects and strategies, market opportunities, and market trends, that are intended to be made pursuant to the meaningsafe harbor provisions of Section 27A of the Securities Act of 1933, as amended (the "Securities Act") and Section 21E of the Securities Exchange Act of 1934, as amended (the “Exchange Act”"Exchange Act"), regarding, among other things, our plans, strategies, and prospects, both business and financial.. Forward-looking statements include butall statements that are not limited to,historical facts. In some cases, you can identify these forward-looking statements that represent our beliefs concerning future operations, strategies, financial results or other developments. Forward-looking statements can be identified by the use of forward-looking terminologywords such as but not limited to, “may,” “should,” “expect,” “anticipate,” “estimate,” “would be,” “believe,” or “continue”"outlook," "believes," "expects," "potential," "continues," "may," "will," "should," "could," "seeks," "approximately," "projects," "predicts," "intends," "plans," "estimates," "anticipates," or the negative version of these words or other variationscomparable words. All of comparable terminology. Because thesethe forward-looking statements are basedincluded in this Quarterly Report on estimates and assumptions thatForm 10-Q are subject to significantvarious risks and uncertainties. Assumptions relating to the foregoing involve judgments with respect to, among other things, future economic, competitive and market conditions, and future business economic,decisions, all of which are difficult or impossible to predict accurately and competitive uncertainties, many of which are beyond our control or are subject to change, actual results could be materially different.control. Although we believe that our plans, intentions, andthe expectations reflected in or suggested by thesesuch forward-looking statements are based on reasonable we cannot assure you that we will achieveassumptions, our actual results, performance, and achievements could differ materially from those expressed in or realize these plans, intentions or expectations. Forward-looking statements are inherently subject to risks, uncertainties, and assumptions. Readers are cautioned not to place undue reliance on theseby the forward-looking statements which speak only asand may be affected by a variety of the date this Form 10-Q is filed with the Securitiesrisks and Exchange Commission (the “SEC”). Except as required by law, we do not undertake any obligationother factors. Accordingly, there are or will be important factors that could cause actual outcomes or results to update or revise anydiffer materially from such forward-looking statements contained in this Form 10-Q. statements.

Important factors that could cause actual results to differ materially from the forward-looking statements are discloseddescribed in Item 1. "Business," Item 1A. “Risk Factors”"Risk Factors," and Item 7. "Management's Discussion and Analysis of Financial Condition and Results of Operations" in Amendment No. 2 to our Registration Statement2021 Annual Report on Form 10,10-K, as filed with the SEC on June 29, 2017 (the “Form 10”).February 23, 2022. The "Risk Factors" of our 2021 Annual Report should not be construed as exhaustive and should be read in conjunction with other cautionary statements included elsewhere in this Quarterly Report on Form 10-Q.

OverviewYou are cautioned not to place undue reliance on any forward-looking statements included in this Quarterly Report on Form 10-Q. All forward-looking statements are made as of the date of this Quarterly Report on Form 10-Q and the risk that actual results, performance, and achievements will differ materially from the expectations expressed in or referenced by this Quarterly Report on Form 10-Q will increase with the passage of time. We undertake no obligation to publicly update or review any forward-looking statement, whether as a result of new information, future developments, or otherwise, except as required by law.

Regulation FD Disclosures

We use any of the following to comply with our disclosure obligations under Regulation FD: SEC filings, press releases, public conference calls, or our website. We routinely post important information on our website at www.Broadstone.com, including information that may be deemed material. We encourage our shareholders and others interested in our company to monitor these distribution channels for material disclosures. Our website address is included in this Quarterly Report as a textual reference only and the information on the website is not incorporated by reference in this Quarterly Report.

Explanatory Note and Certain Defined Terms

Unless the context otherwise requires, the following terms and phrases are used throughout this MD&A as described below:

"annualized base rent" or "ABR" means the annualized contractual cash rent due for the last month of the reporting period, excluding the impacts of short-term rent deferrals, abatements, free rent, or discounted rent periods, and adjusted to remove rent from properties sold during the month and to include a full month of contractual cash rent for properties acquired during the month;
"cash capitalization rate" represents the estimated first year cash yield to be generated on a real estate investment property, which was estimated at the time of investment based on the contractually specified cash base rent for the first full year after the date of the investment, divided by the purchase price for the property excluding capitalized acquisitions costs;

24


"CPI" means the Consumer Price Index for All Urban Consumers (CPI-U): U.S. City Average, All Items, as published by the U.S. Bureau of Labor Statistics, or other similar index which is a measure of the average change over time in the prices paid by urban consumers for a market basket of consumer goods and services;
"occupancy" or a specified percentage of our portfolio that is "occupied" or "leased" means as of a specified date the quotient of (1) the total rentable square footage of our properties minus the square footage of our properties that are vacant and from which we are not receiving any rental payment, and (2) the total square footage of our properties; and
"Revolving Credit Facility" means our $1.0 billion unsecured revolving credit facility, dated January 28, 2022, with J.P. Morgan Chase Bank, N.A. and the other lenders party thereto.

Overview

We are an externally managedinternally-managed real estate investment trust (“REIT”("REIT"), formed as a Maryland corporation in 2007 to acquire that acquires, owns, and holdmanages primarily single-tenant commercial real estate properties throughout the United States that are net leased to the properties’ operators under long-term leases. We focus on real estate that is operated by a single tenant which is an integral part of the tenant’s business. Our diversified portfolio of real estate includes retail properties, such as quick service and casual dining restaurants, healthcare facilities, industrial manufacturing facilities, warehouse and distribution centers, and corporate offices, amongst others. We target properties with credit-worthy tenants that look to engage in a long-term lease relationship. Through long-term leases, our tenants are ablebasis to retain control of their critical locations, while conserving their debt and equity capital to fund their fundamental business operations.

As of September 30, 2017, we owned a diversified portfoliogroup of 477 individualtenants. Since our inception in 2007, we have selectively invested in net leased commercial properties located in 37 states comprising approximately 14.1 million rentable square feet of operational space. As of September 30, 2017, our properties were 100% leased to 119 different commercial tenants, with no single tenant accounting for more than 5% of our annual rental stream.

We elected to qualify as a REIT under the Internal Revenue Code of 1986, as amended (the “Internal Revenue Code”), beginning with our taxable year ending December 31, 2008. As a REIT, we are not subject to federal income tax to the extent that we meet certain requirements, including that we distribute at least 90% of our annual taxable income to our stockholders and satisfy other requirements based on the composition of our asset portfolio and sources of income.

We operate under the direction of our board of directors, which is responsible for the management and control of our affairs. Our board of directors has retained Broadstone Real Estate, LLC (the “Manager”), to provide certain property management services for our properties, and Broadstone Asset Management, LLC, the wholly-owned subsidiary of the Manager (the “Asset Manager”), to manage our day-to-day affairs and implement our investment strategy, subject to our board of director’s direction, oversight, and approval.

We conduct substantially all of our activities through, and all of our properties are held directly or indirectly by, Broadstone Net Lease, LLC (the “Operating Company”). We are the sole managing member of the Operating Company and as of September 30, 2017, we owned approximately 92.3% of its issued and outstanding membership units, with the remaining 7.7% of its membership units held by persons who were issued membership units in exchange for their interests in properties acquired by the Operating Company.


As we conduct substantially all of our operations through the Operating Company, we are structured as what is referred to as an Umbrella Partnership Real Estate Investment Trust (“UPREIT”). The UPREIT structure allows a property owner to contribute their property to the Operating Company in exchange for membership unitsassets in the Operating Companyindustrial, healthcare, restaurant, retail, and generally defer taxation of a resulting gain untiloffice property types. During the contributor later disposes of the membership units. The membership units of the Operating Company held by members of the Operating Company other than us are referred to herein and in our consolidated financial statements as “non-controlling interests,” “non-controlling membership units,” or “membership units,” and are convertible into shares of our common stock on a one-for-one basis, subject to certain restrictions. We allocate consolidated earnings to holders of our common stock and non-controlling membership unit holders of the Operating Company based on the weighted average number of shares of our common stock and non-controlling membership units outstanding during the year. Approximately 1.5 million non-controlling membership units were outstanding as of September 30, 2017, with a year-to-date weighted average of 1.5 million.

We commenced our ongoing private offering of shares of our common stock (our “private offering”) in 2007. The first closing of our private offering occurred on December 31, 2007, and we have conducted additional closings at least once every calendar quarter since then. Currently, we close sales of additional shares of our common stock monthly. Shares of our common stock are currently being offered in our private offering at $81.00 per share, provided that the per share offering price may be adjusted quarterly by the committee of our board of directors comprised of our independent directors (“IDC”) based on the Determined Share Value (as defined below), which is based on input from management, and such other factors as our IDC may consider. For the ninesix months ended SeptemberJune 30, 2017,2022, we sold 3.2 million shares of our common stock in our private offering, including 0.4 million shares of common stock issued pursuant to our Distribution Reinvestment Plan (“DRIP”), for gross offering proceeds of approximately $249.6 million. We intend to use substantially all of the net proceeds from our private offering, supplemented with additional borrowings, to continue to invest in additional net leased properties. We conduct our private offering in reliance upon the exemption from registration under the Securities Act of 1933, as amended (the “Securities Act”), provided by Rule 506(c) of Regulation D promulgated under the Securities Act.

As of September 30, 2017, there were 18.3 million shares of our common stock issued and outstanding, and 1.5 million membership units in the Operating Company issued and outstanding. Each outstanding membership unit in the Operating Company is convertible on a one-for-one basis into shares of our common stock, subject to certain limitations.

Our principal executive offices are located at 800 Clinton Square, Rochester, New York, 14604, and our telephone number is (585) 287-6500.

Q3 2017 Highlights

For the three and nine months ended September 30, 2017, we:

Generated earnings per share on a GAAP basis (as defined below), including amounts attributable to non-controlling interests, of $0.68 and $2.36 for the three and nine months ended September 30, 2017, respectively.

Generated funds from operations (“FFO”), a non-GAAP financial measure, of $1.42 and $4.43 per diluted share for the three and nine months ended September 30, 2017, respectively.

Generated adjusted funds from operations (“AFFO”), a non-GAAP financial measure, of $1.30 and $4.04 per diluted share for the three and nine months ended September 30, 2017, respectively.

Subsequent to quarter end, the IDC approved increasing the Determined Share Value to $81.00 per share, from $80.00 per share, which will remain in effect through January 31, 2018.

Closed seven real estate acquisitions during the three months ended September 30, 2017, totaling $159.2invested $392.4 million, excluding capitalized acquisition expenses, adding 22 newcosts, in 42 properties at a weighted average initial cash capitalization rate of 7.7%6.1%. The acquisitions included properties in industrial (47.2% of the total volume acquired hadduring the six months ended June 30, 2022, based on ABR), restaurant (25.4%), retail (23.8%), and healthcare (3.6%) asset classes located across 21 U.S. states and four Canadian provinces with a weighted average initial lease term of 13.0 years at the time of acquisition and weighted averageminimum annual rent increases of 1.8%.

Received $79.2 million in investments from new19.6 years and existing stockholders during the three months ended September 30, 2017.1.8%, respectively. As of the end of the quarter we had 2,546 common stockholders and 51 holders of non-controlling membership units.

Collected over 99% of rents due during the three and nine months ended SeptemberJune 30, 2017, and maintained a 100% leased portfolio.


FFO and AFFO are performance measures that are not calculated in accordance2022, our portfolio has grown to 764 properties, with accounting principles generally accepted in the United States of America (“GAAP”). We present these non-GAAP measures as we believe certain investors and other users of our financial information use them as part of their evaluation of our historical operating performance. Please see our discussion below under the heading “Net Income and Non-GAAP Measures (FFO and AFFO),” which includes discussion of the definition, purpose, and use of these non-GAAP measures as well as a reconciliation of each to the most comparable GAAP measure.

Our Properties and Investment Objectives

We target acquisitions of fee simple interests in individual properties priced between $5 million and $75 million. Portfolios may be significantly larger, depending on balance sheet capacity and whether the portfolio is diversified or concentrated by tenant, geography, or brand. Our investment policy (“Investment Policy”) has three primary objectives that drive the investments we make: (1) preserve, protect, and return capital to investors; (2) realize increased cash available for distributions and long-term capital appreciation from growth in the rental income and value of our properties; and (3) maximize the level of sustainable cash distributions to our investors. We primarily acquire freestanding, single-tenant commercial757 properties located in the United States either directly from our credit-worthy44 U.S. states and seven properties located in four Canadian provinces.

We focus on investing in real estate that is operated by creditworthy single tenants in sale-leaseback transactions, where they sell usindustries characterized by positive business drivers and trends. We target properties that are an integral part of the tenants' businesses and are therefore opportunities to secure long-term net leases. Through long-term net leases, our tenants are able to retain operational control of their propertiesstrategically important locations, while allocating their debt and simultaneously lease them back through long-term, triple-net leases, or through the purchaseequity capital to fund core business operations rather than real estate ownership.

-
Diversified Portfolio. As of properties already underJune 30, 2022, our portfolio comprised approximately 34.4 million rentable square feet of operational space, and was highly diversified based on property type, geography, tenant, and industry, and is cross-diversified within each (e.g., property-type diversification within a triple-net lease (i.e., a lease assumption). Under either scenario,geographic concentration):
Property Type: We are focused primarily on industrial, healthcare, restaurant, retail, and office property types based on our extensive experience in and conviction around these sectors. Within these sectors, we have meaningful concentrations in manufacturing, distribution and warehouse, casual dining, clinical, quick service restaurants, food processing, general merchandise, and flex/research and development.
Geographic Diversification: Our properties are generally under leaselocated in 44 U.S. states and fully occupied at the time of acquisition. Our real estate portfolio as of September 30, 2017, is reflectivefour Canadian provinces, with no single geographic concentration exceeding 10.4% of our Investment Policy,ABR.
Tenant and Industry Diversification: Our properties are occupied by approximately 213 different commercial tenants who operate 203 different brands that are diversified across 57 differing industries, with a focus on properties in growth marketsno single tenant accounting for more than 2.0% of our ABR.
-
Strong In-Place Leases with at least ten yearsSignificant Remaining Lease Term. As of lease term remaining that will achieve financial returns on equity of greater than 10%, net of fees, provided that all acquisitions must have a minimumJune 30, 2022, our portfolio was approximately 99.8% leased with an ABR weighted average remaining lease term of sevenapproximately 10.6 years, and aexcluding renewal options.
-
Standard Contractual Base Rent Escalation. Approximately 97.3% of our leases have contractual rent escalations, with an ABR weighted average minimum return on equityincrease of 9.5%, unless approved by2.0%.
-
Extensive Tenant Financial Reporting. Approximately 94.0% of our IDC. Subsequent to quarter end, we updated our Investment Policy to require a 9.5% minimum return on equity, net of fees, calculatedtenants, based on the average return recognized across all acquisitions duringABR, provide financial reporting, of which 85.0% are required to provide us with specified financial information on a calendar year, with a minimum required return of 8.5%, net of fees, for any particular transaction. The IDC approved this update following the regular annual reviewperiodic basis, and an additional 9.0% of our Investment Policy at the November 2017 meeting of our board of directors. We believe the changes will allow us greater flexibility in deploying capital in investment opportunities that maximize the risk-adjusted return to our shareholders. Our criteria for selecting properties (“Property Selection Criteria”) is based on three pillars of underwriting evaluation:

fundamental value and characteristics of the underlying real estate,

creditworthiness of the tenant, and

transaction structure and pricing.

tenants report financial statements publicly, either through SEC filings or otherwise.

We believe we can achieve an appropriate risk-adjusted return through these pillars and conservatively project a property’s potential to generate targeted returns from current and future cash flows. We believe targeted returns are achieved through a combination of in-place income at the time of acquisition, rent growth, and a property’s potential for appreciation.

To achieve an appropriate risk-adjusted return, we maintain a diversified portfolio of real estate spread across multiple tenants, industries, and geographic locations. 25


Real Estate Portfolio Information

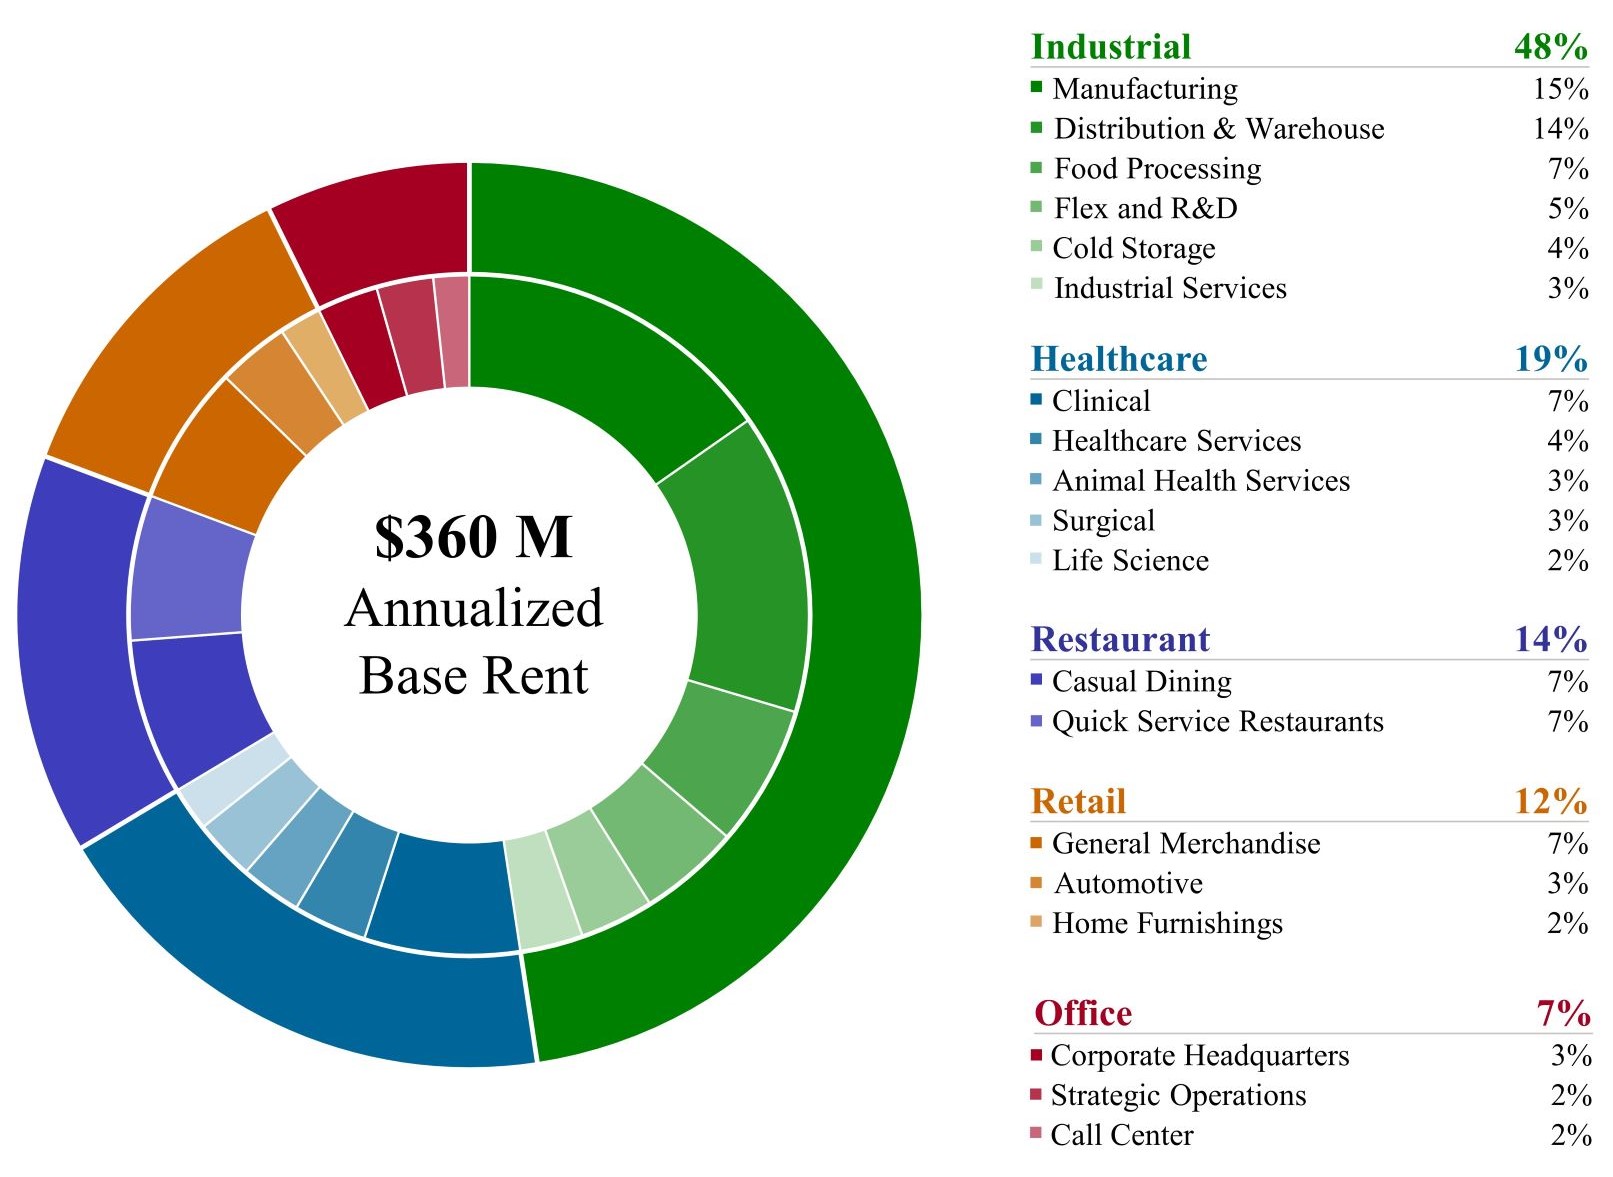
The following charts summarize our portfolio diversification by property type, tenant, brand, industry, and geographic location as of SeptemberJune 30, 2017.2022. The percentages below are calculated based on our contractual rental revenue over the next twelve months (“NTM Rent”), on a per property type basis divided by total NTM Rent. Late payments, non-payments or other unscheduled payments are not considered in the calculation. NTM Rent includes the impactABR of contractual rent escalations, excluding any potential variable rent increases that are based on consumer price index (“CPI”) and/or the tenants’ sales volume.$360.0 million as of June 30, 2022.


Industry

Diversification by % of NTM RentProperty Type

img144228974_0.jpg 


Property Type

% NTM Rent

Retail – casual dining

13.4

%

Retail – quick service restaurants (QSR)

11.9

%

Retail – other

10.7

%

Total Retail

36.0

%

Industrial – manufacturing

11.1

%

Industrial – warehouse/distribution

10.0

%

Industrial – flex

5.3

%

Industrial – other

3.8

%

Total Industrial

30.2

%

Healthcare – clinical

11.4

%

Healthcare – surgical

5.7

%

Healthcare – other

4.3

%

Total Healthcare

21.4

%

Other – corporate office

8.3

%

Other – other

4.1

%

Total Other

12.4

%


Top Tenant Industries

Industry

% NTM Rent

Restaurants

25.3

%

Healthcare Facilities

20.8

%

Home Furnishing Retail

5.6

%

Packaged Foods & Meats

5.3

%

Auto Parts & Equipment

5.0

%

Specialized Consumer Services

3.7

%

Industrial Conglomerates

2.6

%

Multi-line Insurance

2.3

%

Life Sciences Tools & Services

2.3

%

Distributors

2.3

%

Industrial Machinery

2.0

%

Food Retail

1.9

%

Metal & Glass Containers

1.8

%

Managed Healthcare

1.8

%

Soft Drinks

1.7

%

Top 15 Tenant Industries

84.4

%

Other (22 industries)

15.6

%

Total

100.0

%


Geographic

26


Property Type


# Properties


ABR
($'000s)


ABR as a % of
Total Portfolio


Square Feet
('000s)


SF as a % of
Total Portfolio


Industrial


Manufacturing


69


$

55,116


15.3

%


10,046


29.2

%

Distribution & Warehouse


47


51,375


14.3

%


9,526


27.7

%

Food Processing


17


24,200


6.7

%


2,730


7.9

%

Flex and R&D


7


17,296


4.8

%


1,457


4.3

%

Cold Storage


4


12,724


3.5

%


933


2.7

%

Industrial Services


22


10,765


3.0

%


587


1.7

%

Industrial Total


166


171,476


47.6

%


25,279


73.5

%

Healthcare


Clinical


52


26,770


7.4

%


1,091


3.2

%

Healthcare Services


28


12,528


3.5

%


463


1.3

%

Animal Health Services


27


10,437


2.9

%


405


1.2

%

Surgical


12


10,274


2.9

%


329


0.9

%

Life Science


9


7,722


2.1

%


549


1.6

%

Untenanted


1


18


0.1

%

Healthcare Total


129


67,731


18.8

%


2,855


8.3

%

Restaurant


Casual Dining


101


26,738


7.4

%


675


2.0

%

Quick Service Restaurants


146


24,787


6.9

%


499


1.4

%

Restaurant Total


247


51,525


14.3

%


1,174


3.4

%

Retail


General Merchandise


126


23,924


6.6

%


1,802


5.2

%

Automotive


66


12,196


3.4

%


771


2.3

%

Home Furnishings


13


7,030


2.0

%


797


2.3

%

Untenanted


1


34


0.1

%

Retail Total


206


43,150


12.0

%


3,404


9.9

%

Office


Corporate Headquarters


7


10,429


2.9

%


679


2.0

%

Strategic Operations


5


9,806


2.7

%


615


1.8

%

Call Center


4


5,902


1.7

%


391


1.1

%

Office Total


16


26,137


7.3

%


1,685


4.9

%

Total


764


$

360,019


100.0

%


34,397


100.0

%

27


Diversification by %Tenant

Tenant


Property Type


# Properties


ABR
($'000s)


ABR as a %
of Total
Portfolio


Square Feet
('000s)


SF as a %
of Total
Portfolio


Jack's Family Restaurants LP*


Quick Service Restaurants


43


$

7,166


2.0

%


147


0.4

%

Joseph T. Ryerson & Son, Inc


Distribution & Warehouse


11


6,395


1.8

%


1,537


4.5

%

Red Lobster Hospitality & Red Lobster
   Restaurants LLC
*


Casual Dining


20


6,361


1.8

%


166


0.5

%

J. Alexander's, LLC*


Casual Dining


16


6,025


1.7

%


131


0.4

%

Axcelis Technologies, Inc.


Flex and R&D


1


5,991


1.6

%


417


1.2

%

Hensley & Company*


Distribution & Warehouse


3


5,871


1.6

%


577


1.7

%

Dollar General Corporation


General Merchandise


57


5,636


1.5

%


531


1.5

%

BluePearl Holdings, LLC**


Animal Health Services


13


5,451


1.5

%


165


0.5

%

Tractor Supply Company


General Merchandise


21


5,279


1.5

%


417


1.2

%

Outback Steakhouse of Florida LLC*1


Casual Dining


22


5,278


1.5

%


140


0.4

%

Total Top 10 Tenants


207


59,453


16.5

%


4,228


12.3

%


AHF, LLC*


Distribution & Warehouse/
Manufacturing


5


5,142


1.4

%


982


2.8

%

Krispy Kreme Doughnut Corporation


Quick Service Restaurants/
Food Processing


27


5,034


1.4

%


156


0.4

%

Big Tex Trailer Manufacturing, Inc.*


Automotive/Distribution &
Warehouse/Manufacturing/ Corporate Headquarters


17


4,957


1.4

%


1,302


3.8

%

Siemens Medical Solutions USA, Inc. &
   Siemens Corporation


Manufacturing/Flex
and R&D


2


4,936


1.4

%


545


1.6

%

Carvana, LLC*


Industrial Services


2


4,510


1.3

%


230


0.7

%

Santa Cruz Valley Hospital


Healthcare Facilities


1


4,500


1.2

%


148


0.4

%

Nestle' Dreyer's Ice Cream Company


Cold Storage


1


4,476


1.2

%


310


0.9

%

Arkansas Surgical Hospital


Surgical


1


4,366


1.2

%


129


0.4

%

American Signature, Inc.


Home Furnishings


6


4,224


1.2

%


474


1.4

%

Fresh Express Incorporated


Food Processing


1


4,144


1.2

%


335


1.0

%

Total Top 20 Tenants


270


$

105,742


29.4

%


8,839


25.7

%

1Tenant's properties include 20 Outback Steakhouse restaurants and two Carrabba's Italian Grill restaurants.

*Subject to a master lease.

**Includes properties leased by multiple tenants, some, not all, of NTM Rentwhich are subject to master leases.

Diversification by Brand

Brand


Property Type


# Properties


ABR
($'000s)


ABR as a %
of Total
Portfolio


Square Feet
('000s)


SF as a %
of Total
Portfolio


Jack's Family Restaurants*


Quick Service Restaurants


43


$

7,166


2.0

%


147


0.4

%

Ryerson


Distribution & Warehouse


11


6,395


1.8

%


1,537


4.5

%

Red Lobster*


Casual Dining


20


6,361


1.8

%


166


0.5

%

Axcelis


Flex and R&D


1


5,991


1.6

%


417


1.2

%

Hensley*


Distribution & Warehouse


3


5,871


1.6

%


577


1.7

%

Dollar General


General Merchandise


57


5,636


1.5

%


531


1.5

%

BluePearl Veterinary Partners**


Animal Health Services


13


5,451


1.5

%


165


0.5

%

Bob Evans Farms*1


Casual Dining/Food Processing


21


5,352


1.5

%


281


0.9

%

Tractor Supply Co.


General Merchandise


21


5,279


1.5

%


417


1.2

%

AHF Products*


Distribution & Warehouse/
Manufacturing


5


5,142


1.4

%


982


2.8

%

Total Top 10 Brands


195


58,644


16.2

%


5,220


15.2

%


Krispy Kreme


Quick Service Restaurants/
Food Processing


27


5,034


1.4

%


156


0.4

%

Big Tex Trailers*


Automotive/Distribution &
Warehouse/Manufacturing/
Corporate Headquarters


17


4,957


1.4

%


1,302


3.8

%

Siemens


Manufacturing/Flex
and R&D


2


4,936


1.4

%


545


1.6

%

Outback Steakhouse*


Casual Dining


20


4,566


1.3

%


126


0.4

%

Carvana*


Industrial Services


2


4,510


1.3

%


230


0.7

%

Santa Cruz Valley Hospital


Healthcare Facilities


1


4,500


1.2

%


148


0.4

%

Nestle'


Cold Storage


1


4,476


1.2

%


310


0.9

%

Arkansas Surgical Hospital


Surgical


1


4,366


1.2

%


129


0.4

%

Wendy's**


Quick Service Restaurants


29


4,320


1.2

%


83


0.2

%

Value City Furniture


Home Furnishings


6


4,224


1.2

%


474


1.4

%

Total Top 20 Brands


301


$

104,533


29.0

%


8,723


25.4

%

1Brand includes one BEF Foods, Inc. property and 20 Bob Evans Restaurants, LLC properties.

*Subject to a master lease.

**Includes properties leased by multiple tenants, some, not all, of which are subject to master leases.

28


Diversification by Industry

Industry


# Properties


ABR
($'000s)


ABR as a %
of Total
Portfolio


Square Feet ('000s)


SF as a %
of Total
Portfolio


Healthcare Facilities


102


$

53,633


14.9

%


2,029


5.9

%

Restaurant


250


52,296


14.5

%


1,217


3.5

%

Packaged Foods & Meats


11


17,698


4.9

%


1,914


5.6

%

Distributors


27


15,699


4.4

%


2,695


7.8

%

Food Distributors


8


14,678


4.1

%


1,786


5.2

%

Specialty Stores


31


13,930


3.9

%


1,338


3.9

%

Auto Parts & Equipment


39


12,672


3.5

%


2,387


6.9

%

Home Furnishings Retail


18


12,459


3.5

%


1,858


5.4

%

Specialized Consumer Services


47


12,218


3.4

%


722


2.1

%

Metal & Glass Containers


8


9,898


2.7

%


2,206


6.4

%

Healthcare Services


18


9,213


2.6

%


515


1.5

%

General Merchandise Stores


90


9,011


2.5

%


817


2.4

%

Aerospace & Defense


7


8,694


2.4

%


952


2.8

%

Internet & Direct Marketing Retail


3


6,881


1.9

%


447


1.3

%

Electronic Components


2


6,806


1.9

%


466


1.4

%

Other (42 industries)


101


104,233


28.9

%


12,996


37.7

%

Untenanted properties


2


52


0.2

%

Total


764


$

360,019


100.0

%


34,397


100.0

%

29


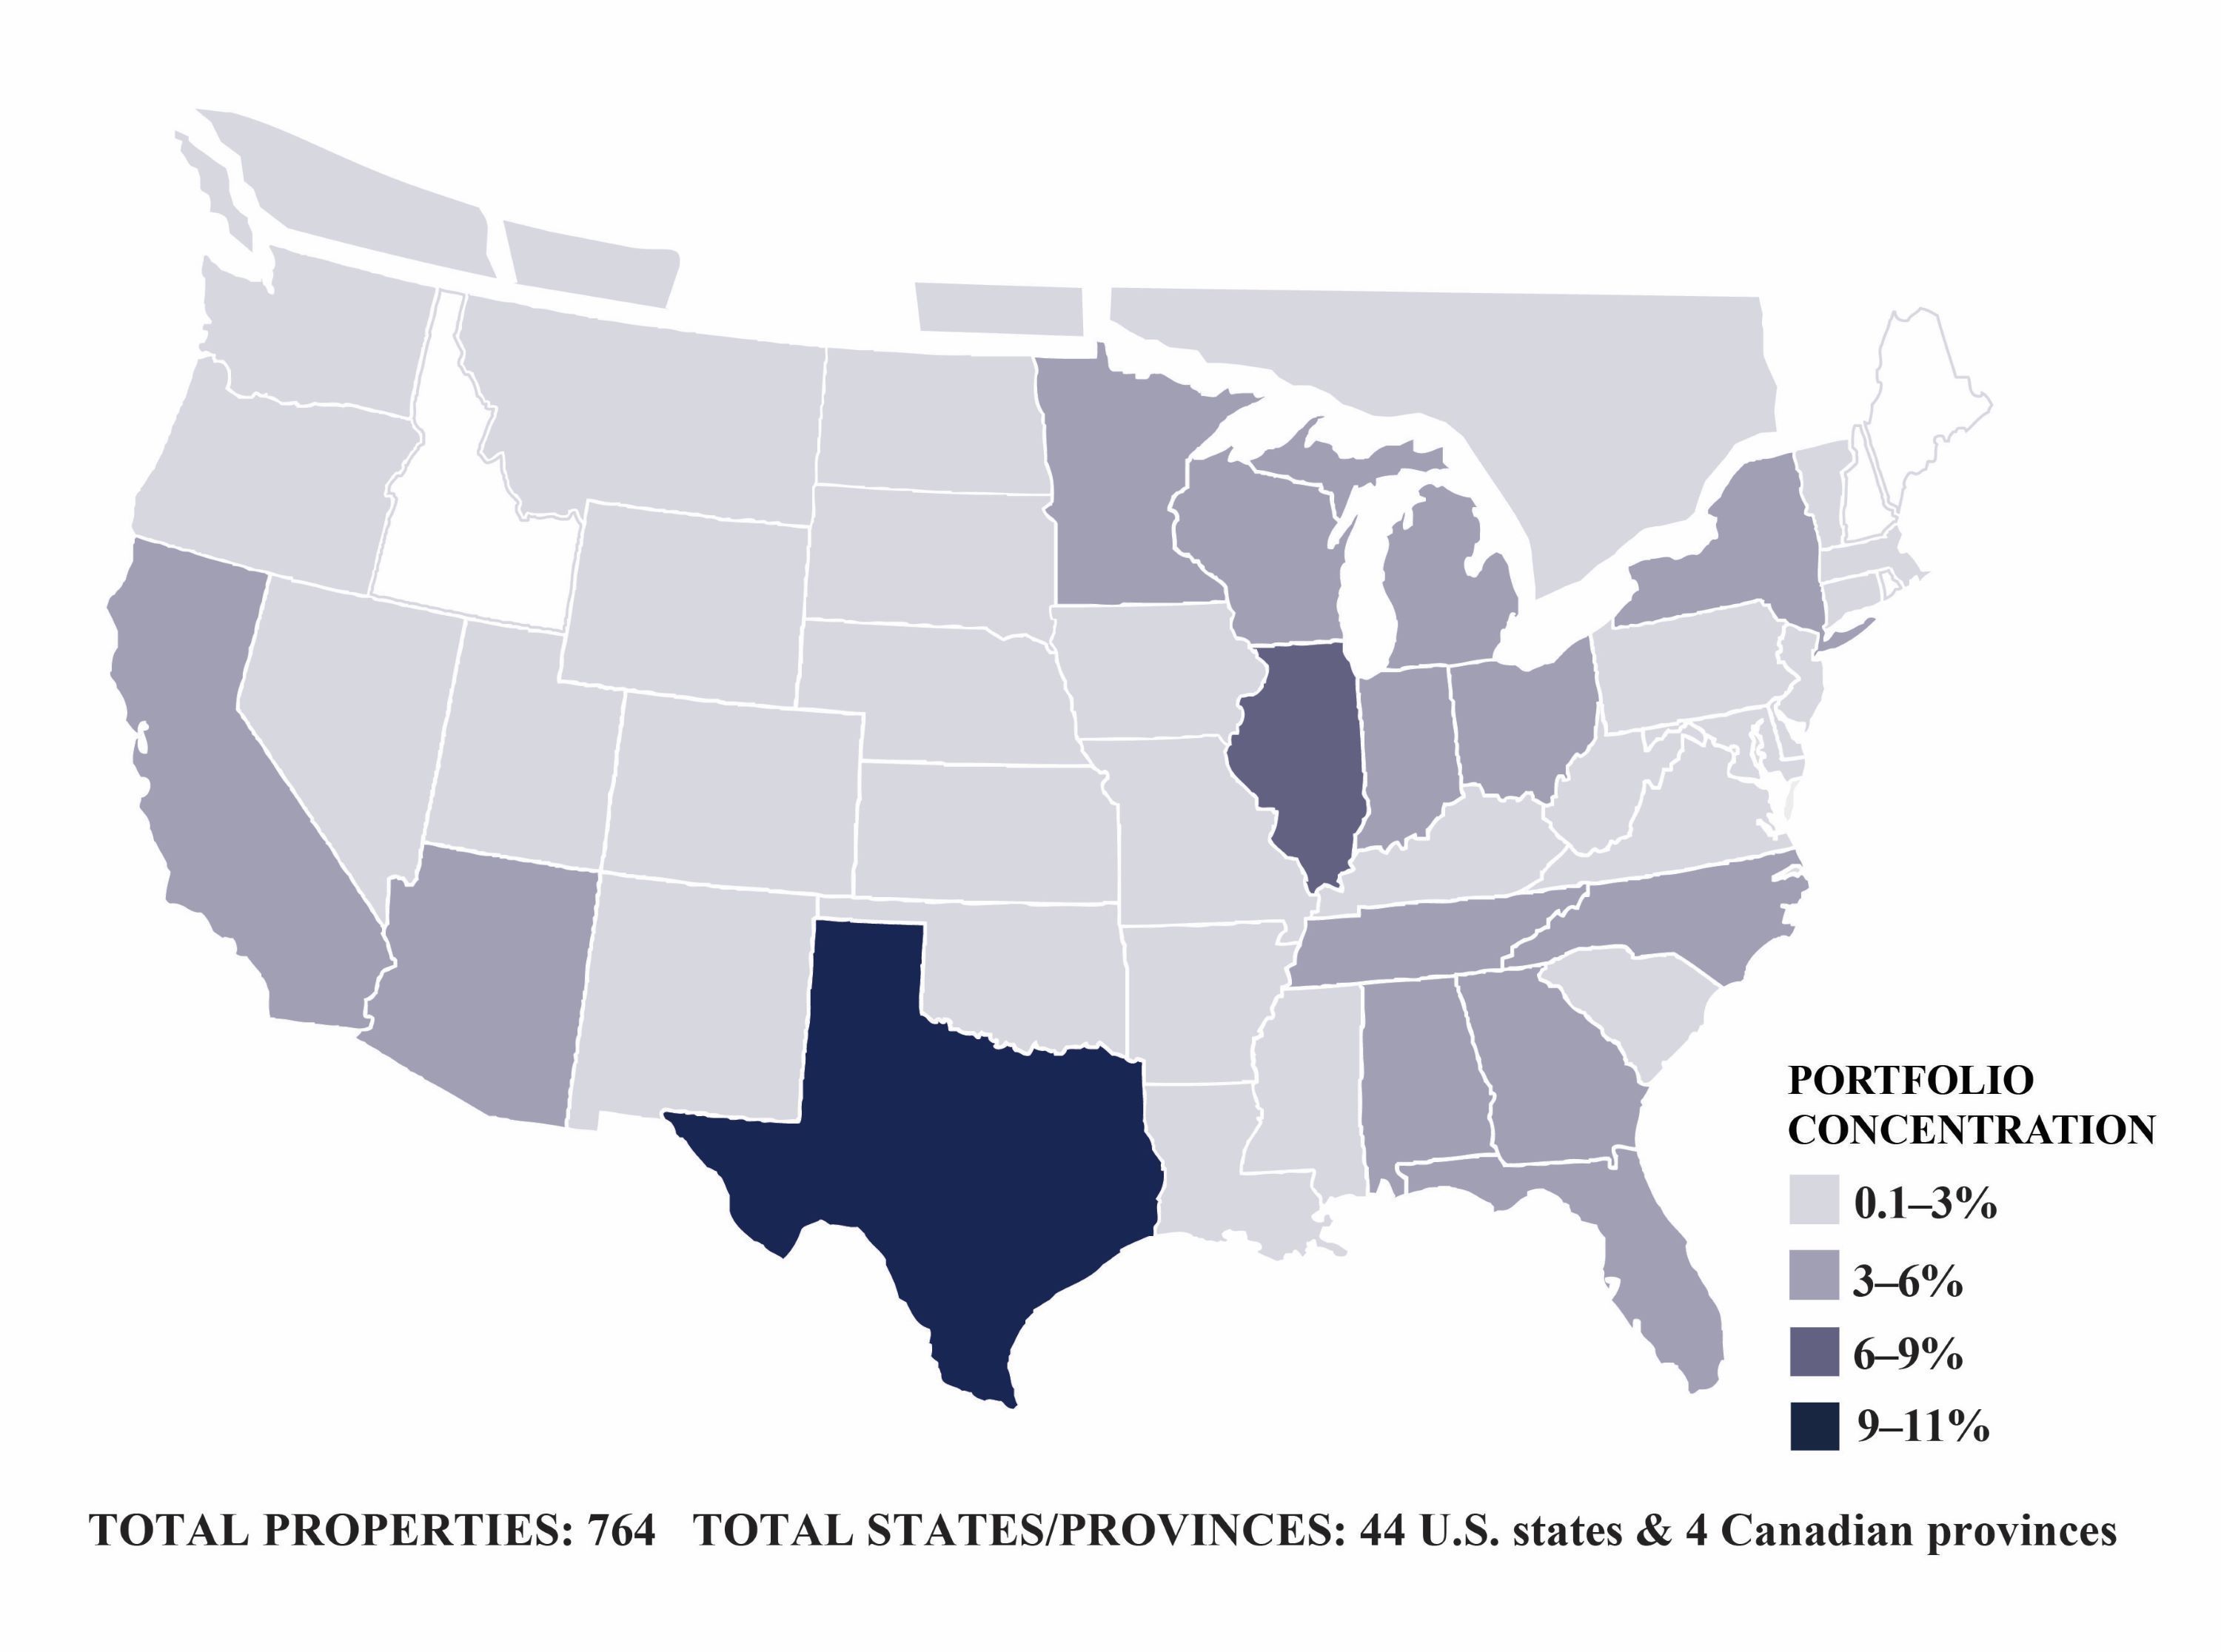
Diversification by Geographic Location

img144228974_1.jpg 

State /
Province


#
Properties


ABR
($'000s)


ABR as a
% of Total
Portfolio


Square Feet ('000s)


SF as a %
of Total
Portfolio


State /
Province


#
Properties


ABR
($'000s)


ABR as a
% of Total
Portfolio


Square Feet ('000s)


SF as a %
of Total
Portfolio


TX


70


$

37,549


10.4

%


3,636


10.6

%


LA


4


3,401


0.9

%


194


0.6

%

IL


27


21,566


6.0

%


2,002


5.8

%


NE


6


3,037


0.8

%


509


1.5

%

WI


35


20,744


5.8

%


2,163


6.3

%


MD


4


2,987


0.8

%


293


0.9

%

MI


49


17,130


4.8

%


1,633


4.7

%


NM


8


2,815


0.8

%


96


0.3

%

FL


42


16,122


4.5

%


844


2.5

%


MS


8


2,774


0.8

%


334


1.0

%

OH


38


15,786


4.4

%


1,416


4.1

%


IA


4


2,754


0.8

%


622


1.8

%

CA


10


15,622


4.3

%


1,493


4.3

%


SC


13


2,494


0.7

%


308


0.9

%

IN


30


15,035


4.2

%


1,858


5.4

%


WV


16


2,486


0.7

%


109


0.3

%

MN


21


14,600


4.0

%


2,285


6.6

%


CO


4


2,459


0.7

%


126


0.4

%

TN


49


13,995


3.9

%


866


2.5

%


UT


3


2,379


0.7

%


280


0.8

%

NC


36


13,742


3.8

%


1,425


4.1

%


CT


2


1,758


0.5

%


55


0.2

%

AZ


9


13,213


3.7

%


909


2.6

%


MT


7


1,563


0.4

%


43


0.1

%

AL


53


11,950


3.3

%


873


2.5

%


NV


2


1,336


0.4

%


81


0.2

%

GA


33


11,356


3.1

%


1,576


4.6

%


DE


4


1,154


0.3

%


133


0.4

%

NY


26


10,718


3.0

%


680


2.0

%


ND


2


943


0.3

%


28


0.1

%

MA


5


10,456


2.9

%


1,026


3.0

%


VT


2


420


0.1

%


24


0.1

%

AR


12


8,767


2.4

%


544


1.6

%


WY


1


307


0.1

%


21


0.1

%

OK


21


7,597


2.1

%


977


2.8

%


OR


1


136


0.0

%


9


0.1

%

KY


24


7,486


2.1

%


946


2.7

%


SD


1


81


0.0

%


9


0.0

%

PA


17


7,080


2.0

%


1,037


3.0

%


Total US


757


$

351,970


97.8

%


33,967


98.8

%

MO


12


6,064


1.7

%


1,136


3.3

%


BC


2


$

4,633


1.3

%


253


0.7

%

KS


11


5,489


1.5

%


648


1.9

%


ON


3


2,085


0.6

%


101


0.3

%

VA


17


5,451


1.5

%


204


0.6

%


AB


1


981


0.2

%


51


0.1

%

NJ


3


4,904


1.4

%


366


1.1

%


MB


1


350


0.1

%


25


0.1

%

WA


15


4,264


1.2

%


150


0.4

%


Total Canada


7


$

8,049


2.2

%


430


1.2

%


Grand Total


764


$

360,019


100.0

%


34,397


100.0

%

30


Our Leases

We typically lease our properties pursuant to long-term net leases that often have renewal options. Substantially all of our leases are triple-net,net, meaning that our tenants are responsible for the maintenance, insurance, and property taxesgenerally obligated to pay all expenses associated with the leased property (such as real estate taxes, insurance, maintenance, repairs, and capital costs).

As of June 30, 2022, approximately 99.8% of our portfolio, representing all but two of our properties, they lease from us. Since inception and at September 30, 2017,was subject to a lease. Because substantially all of our properties are subject to leases. We do not currently engage in the development of real estate, which could cause a delay in timing between the funds used to invest in properties and the corresponding cash inflows from rental receipts. Our cash flows from operations are primarily generated through our real estate investment portfolio and the monthly lease payments under our long-term leases with our tenants.

Due to the fact that all of our properties are leased to single tenants under long-term leases, we are not currently required to perform significant ongoing leasing activities on our properties. The leases for only two of our properties, representing less than 1% of our annual rental streams (calculated based on NTM Rent), will expire before 2020.

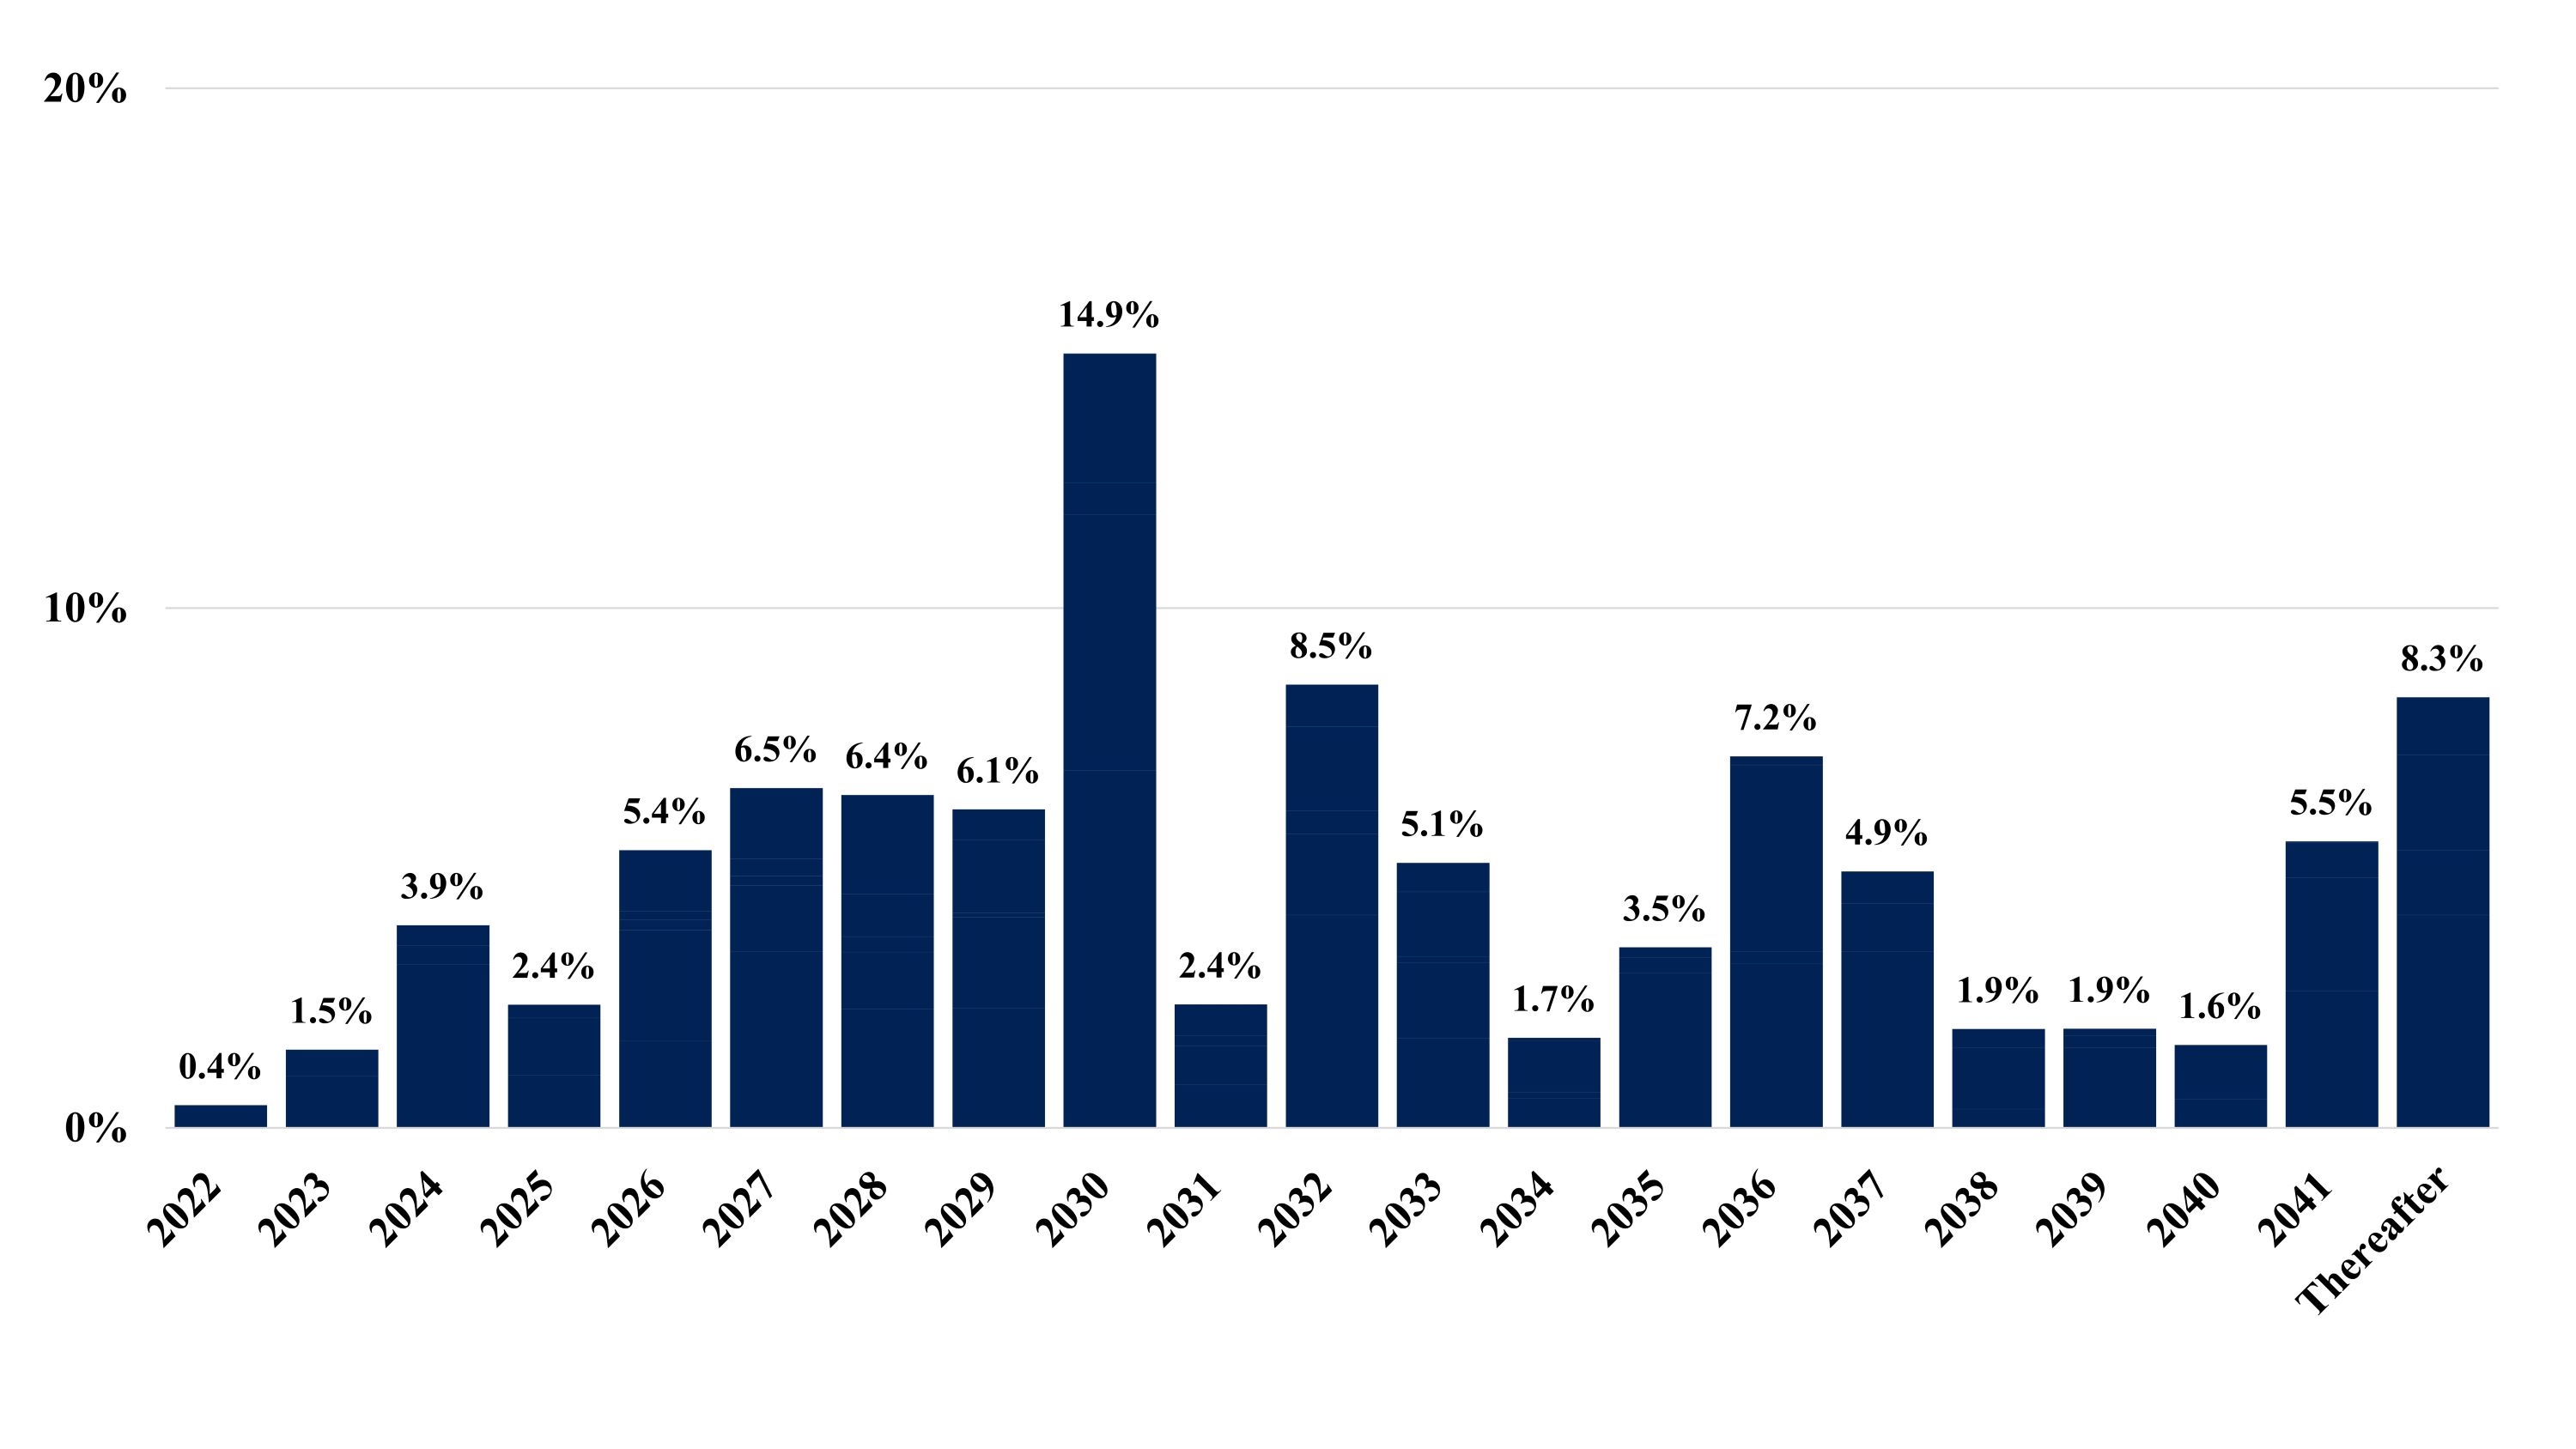
As of SeptemberJune 30, 2017,2022, the ABR weighted average remaining term of our leases (calculated based on NTM Rent) was approximately 13.2 years, excluding renewal options, which are exercisable at the option of our tenants upon expiration of their base lease term.10.6 years. Less than 5% of the properties in our portfolio are subject to leases without at least one renewal option. Furthermore, the weighted average lease term on the $159.2 million in properties acquired during the three months ended September 30, 2017, was 13.0 years.  Over 50%Approximately 67.4% of our rental revenue isABR was derived from leases that will expire duringin 2030 and thereafter. As of September 30, 2017, notafter, and no more than 10%6.5% of our rental revenue isABR was derived from leases that expire in any single year in the decade between 2020 andprior to 2030. The following chart sets forth our lease expirations based upon the terms of ourthe leases in place as of SeptemberJune 30, 2017.2022.

img144228974_2.jpg 

31


The following table presents certain information based on lease expirations by year. Amounts are in thousands, except for number of properties.

Expiration Year


# Properties


# Leases


ABR
($'000s)


ABR as a % of
Total Portfolio


Square Feet
('000s)


SF as a % of
Total Portfolio


2022


1


2


$

1,566


0.4

%


46


0.1

%

2023


7


8


5,412


1.5

%


538


1.6

%

2024


11


11


14,036


3.9

%


1,689


4.9

%

2025


20


23


8,527


2.4

%


698


2.0

%

2026


35


32


19,235


5.4

%


1,413


4.1

%

2027


29


28


23,531


6.5

%


2,019


5.9

%

2028


33


31


23,061


6.4

%


2,291


6.7

%

2029


71


39


22,061


6.1

%


2,711


7.9

%

2030


101


57


53,636


14.9

%


5,110


14.8

%

2031


33


28


8,547


2.4

%


805


2.3

%

2032


59


44


30,701


8.5

%


3,437


10.0

%

2033


49


23


18,360


5.1

%


1,575


4.6

%

2034


33


22


6,240


1.7

%


409


1.2

%

2035


17


13


12,494


3.5

%


1,927


5.6

%

2036


86


21


25,732


7.2

%


2,854


8.3

%

2037


24


9


17,762


4.9

%


1,369


4.0

%

2038


33


29


6,842


1.9

%


306


0.9

%

2039


11


6


6,860


1.9

%


803


2.3

%

2040


31


5


5,744


1.6

%


312


0.9

%

2041


40


8


19,850


5.5

%


1,731


5.0

%

Thereafter


38


9


29,822


8.3

%


2,302


6.7

%

Untenanted properties


2


52


0.2

%

Total


764


448


$

360,019


100.0

%


34,397


100.0

%

32


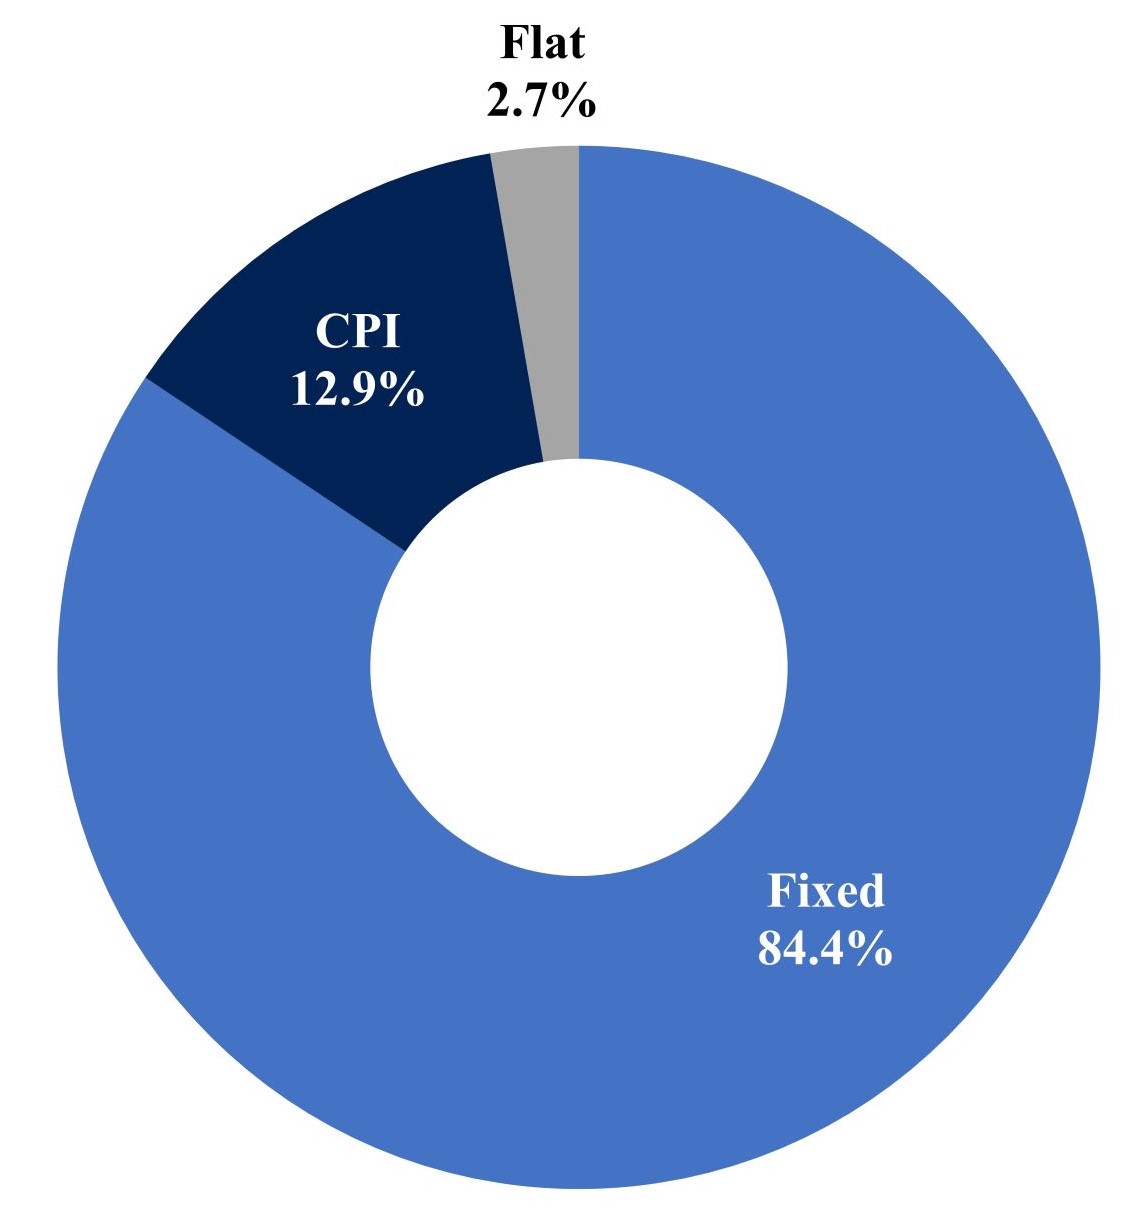
Substantially all of our leases provide for periodic contractual rent escalations. As of June 30, 2022, leases contributing 97.3% of our ABR provided for increases in future ABR, generally ranging from 1.5% to 2.5% annually, with an ABR weighted average annual minimum increase equal to 2.0% of base rent. Generally, our rent escalators increase rent on specified dates by a fixed percentage. Our escalations provide us with a source of organic revenue growth and a measure of inflation protection. Additional information on lease escalation frequency and weighted average annual escalation rates as of June 30, 2022 is displayed below:

Lease Escalation Frequency


% of ABR


Weighted Average Annual Minimum Increase (a)


Annually


78.2

%


2.3

%

Every 2 years


0.1

%


1.8

%

Every 3 years


2.9

%


3.0

%

Every 4 years


1.1

%


2.4

%

Every 5 years


8.0

%


1.8

%

Other escalation frequencies


7.0

%


1.6

%

Flat


2.7

%


Total/Weighted Average (b)


100.0

%


2.0

%


(a)
Represents the ABR weighted average annual minimum increase of the entire portfolio as if all escalations occurred annually. For leases where rent escalates by the greater of a stated fixed percentage or the change in CPI, we have assumed an escalation equal to the stated fixed percentage in the lease. As of June 30, 2022, leases contributing 8.0% of our ABR provide for rent increases equal to the lesser of a stated fixed percentage or the change in CPI. As any future increase in CPI is unknowable at this time, we have not included an increase in the rent pursuant to these leases in the weighted average annual minimum increase presented.
(b)
Weighted by ABR.

The escalation provisions of our leases (by percentage of ABR) as of June 30, 2022, are displayed in the following chart:

img144228974_3.jpg 

33


Results of Operations

The following discussion includes the results of our operations for the periods presented.

Three Months Ended June 30, 2022 Compared to Three Months Ended March 31, 2022

Lease Maturity Schedule, by %Revenues, net


For the Three Months Ended


June 30,


March 31,


Increase/(Decrease)

(in thousands)


2022


2022


$


%

Contractual rental amounts billed for operating leases


$

87,505


$

84,396


$

3,109


3.7

%

Adjustment to recognize contractual operating lease
   billings on a straight-line basis


5,090


5,021


69


1.4

%

Net write-offs of accrued rental income


  —


(1,326

)


1,326


(100.0

)%

Variable rental amounts earned


291


186


105


56.5

%

Earned income from direct financing leases


721


723


(2

)


(0.3

)%

Interest income from sales-type leases


15


14


1


7.1

%

Operating expenses billed to tenants


4,263


4,735


(472

)


(10.0

)%

Other income from real estate transactions


134


42


92


>100.0

%

Adjustment to revenue recognized for uncollectible
   rental amounts billed, net


(6

)


50


(56

)


<(100.0

)%

Total Lease revenues, net


$

98,013


$

93,841


$

4,172


4.4

%

The increase in Lease revenues, net was primarily attributable to growth in our real estate portfolio through property acquisitions. As we acquire properties throughout the period, the full benefit of NTM Rentlease revenues from newly acquired properties will not be realized in the quarter of acquisition. During the first quarter of 2022, we invested $210.0 million, excluding capitalized acquisition costs, in 27 properties at a weighted average initial cash capitalization rate of 5.7%. Most of these acquisitions closed during the month of March 2022, and therefore did not materially contribute to Lease revenues, net for the three months ended March 31, 2022. The increase was also partially attributable to our $182.4 million of acquisitions during the second quarter of 2022 at a 6.4% weighted average initial cash capitalization rate, the full benefit of which we anticipate will be realized during the third quarter of 2022. Additionally, we did not record any write-offs of accrued rental income during the three months ended June 30, 2022.


34


Operating Expenses


For the Three Months Ended


June 30,


March 31,


Increase/(Decrease)


(in thousands)


2022


2022


$


%


Operating expenses


Depreciation and amortization


$

35,511


$

34,290


$

1,221


3.6

%

Property and operating expense


4,696


5,044


(348

)


(6.9

)%

General and administrative


9,288


8,828


460


5.2

%

Provision for impairment of investment in rental properties


1,380


1,380


100.0

%

Total operating expenses


$

50,875


$

48,162


$

2,713


5.6

%

Depreciation and amortization

The increase in depreciation and amortization for the three months ended June 30, 2022 was primarily due to growth in our real estate portfolio.

Provision for impairment of investment in rental properties

During the three months ended June 30, 2022 we recognized $1.4 million of impairment on our investments in rental properties due to change in our long-term hold strategy for a single property, compared to no impairment recognized during the three months ended March 31, 2022. The following table presents the lease expirations by year, including the number of tenants and properties with leases expiring, the square footage covered by the leases expiring, the NTM Rent, and the percentage of NTM Rentimpairment charges for the leases expiring. Late payments, non-paymentsrespective periods:


For the Three Months Ended


June 30,


March 31,


(in thousands, except number of properties)


2022


2022


Number of properties


1


Carrying value prior to impairment charge


$

3,674


$


Fair value


2,294


Impairment charge


$

1,380


$


The timing and amount of impairment fluctuates from period to period depending on the specific facts and circumstances.

35


Other income (expenses)


For the Three Months Ended


��

June 30,


March 31,


Increase/(Decrease)

(in thousands)


2022


2022


$


%

Other income (expenses)


Interest expense


$

(17,888


)


$

(16,896


)


$

992


5.9

%

Gain on sale of real estate


4,071


1,196


2,875


>100.0

%

Income taxes


(401


)


(412


)


(11


)


(2.7

)%

Other income (expenses)


2,632


(1,126


)


(3,758


)


>100.0

%

Interest expense

The increase in interest expense reflects an increase in our weighted average cost of borrowings combined with increased average outstanding borrowings during the three months ended June 30, 2022 compared to during the three months ended March 31, 2022. During the second quarter we increased total outstanding borrowings by $53.8 million to partially fund our acquisitions. Of our $1.9 billion of total outstanding indebtedness, approximately $200.5 million, or other unscheduled payments are not considered in the NTM Rent amounts. NTM Rent includes10.8% is variable, and therefore subject to the impact of contractual rent escalations, excluding any potential variable rent increases that arefluctuations in interest rates.

Gain on sale of real estate

Our recognition of a gain or loss on the sale of real estate varies from transaction to transaction based on CPI and/or the tenants’ sales volume. Amounts arefluctuations in thousands, except the number of tenantsasset prices and properties.

Year


Number of

Tenants


Number of

Properties


Square

Footage


NTM Rent


Percentage of

NTM Rent


2017


$


%

2018


1


1


2


131


<0.1

%

2019


1


1


2


117


<0.1

%

2020


3


4


116


1,376


0.8

%

2021


2


4


9


576


0.3

%

2022


3


3


87


2,393


1.4

%

2023


9


13


724


6,786


4.0

%

2024


12


15


1,741


13,933


8.2

%

2025


2


8


28


1,034


0.6

%

2026


17


27


620


9,964


5.9

%

2027


16


30


1,210


14,785


8.8

%

2028


12


22


1,025


11,184


6.6

%

2029


12


54


2,483


15,623


9.2

%

2030 and thereafter


61


295


6,015


91,023


53.9

%

Our top tenants and brands at September 30, 2017, are listeddemand in the tables below. real estate market. During the three months ended June 30, 2022, we recognized a gain of $4.1 million on the sale of three properties, compared to a gain of $1.2 million on the sale of one property during the three months ended March 31, 2022. Our proactive asset management strategy includes determining to sell any of our properties where we believe the risk profile has changed and become misaligned with our then current risk-adjusted return objectives.

Other income (expenses)

The percentages are calculated basedchange in other income (expenses) during the three months ended June 30, 2022 was primarily due to $2.6 million of an unrealized foreign exchange gain recognized on the quarterly remeasurement of our $100 million CAD revolver borrowings, compared to a $1.1 million unrealized foreign exchange loss recognized during the three months ended March 31, 2022.

Net income and Net earnings per diluted share


For the Three Months Ended


June 30,


March 31,


Increase/(Decrease)


(in thousands, except per share data)


2022


2022


$


%


Net income


$

35,552


$

28,441


$

7,111


25.0

%

Net earnings per diluted share


0.20


0.16


0.04


25.0

%

The increase in net income is primarily attributable to a $4.2 million increase in lease revenue associated with growth in our real estate portfolio, a $3.8 million increase in unrealized foreign exchange gains, and a $2.9 million increase in gain on sale of real estate, partially offset by a $1.4 million increase in impairment of investment in rental properties, a $1.2 million increase in depreciation and amortization, and a $1.0 million increase in interest expense.

GAAP net income includes items such as gain or loss on sale of real estate and provisions for impairment, among others, which can vary from quarter to quarter and impact period-over-period comparisons.

36


Six Months Ended June 30, 2022 Compared to Six Months Ended June 30, 2021

Lease Revenues, net


For the Six Months Ended


June 30,


Increase/(Decrease)

(in thousands)


2022


2021


$


%

Contractual rental amounts billed for operating leases


$

171,901


$

148,256


$

23,645


15.9

%

Adjustment to recognize contractual operating lease
   billings on a straight-line basis


10,111


9,533


578


6.1

%

Net write-offs of accrued rental income


(1,326

)


(442

)


(884

)


>100.0

%

Variable rental amounts earned


477


205


272


>100.0

%

Earned income from direct financing leases


1,444


1,458


(14

)


(1.0

)%

Interest income from sales-type leases


29


29


  —


  —

%

Operating expenses billed to tenants


8,998


8,584


414


4.8

%

Other income from real estate transactions


176


33


143


>100.0

%

Adjustment to revenue recognized for uncollectible
   rental amounts billed, net


44


(199

)


243


>100.0

%

Total Lease revenues, net


$

191,854


$

167,457


$

24,397


14.6

%

The increase in Lease revenues, net was primarily attributable to growth in our real estate portfolio through property acquisitions closed since June 30, 2021. During the twelve months ended June 30, 2022, we invested $765.8 million, excluding capitalized acquisition costs, in 96 properties at a weighted average initial cash capitalization rate of 6.2%.

Operating Expenses


For the Six Months Ended


June 30,


Increase/(Decrease)


(in thousands)


2022


2021

��


$


%


Operating expenses


Depreciation and amortization


$

69,801


$

61,938


$

7,863


12.7

%

Property and operating expense


9,740


9,177


563


6.1

%

General and administrative


18,116


19,288


(1,172

)


(6.1

)%

Provision for impairment of investment in rental properties


1,380


2,012


(632

)


(31.4

)%

Total operating expenses


$

99,037


$

92,415


$

6,622


7.2

%

Depreciation and amortization

The increase in depreciation and amortization for the six months ended June 30, 2022 was primarily due to growth in our real estate portfolio.

General and administrative

The decrease in general and administrative expenses mainly reflects decreased severance expense. During the six months ended June 30, 2021, we recognized severance associated with the departure of a named executive officer.

Provision for impairment of investment in rental properties

During the six months ended June 30, 2022, we recognized $1.4 million of impairment on our NTM Rent on a per property type basis divided by total NTM Rent. Late payments, non-payments or other unscheduled payments are not considered in the calculation. NTM Rent includes the impact of contractual rent escalations, excluding any potential variable rent increases that are based on CPI and/or the tenants’ sales volume.


Top Ten Tenants, by % of NTM Rent

Tenant


Property Type


% NTM Rent


Properties


Red Lobster Hospitality LLC & Red Lobster Restaurants LLC


Retail


4.3

%


25


Art Van Furniture, LLC


Retail


3.9

%


9


Jack’s Family Restaurants LP


Retail


3.4

%


36


Outback Steakhouse of Florida, LLC(1)


Retail


3.1

%


24


Big Tex Trailer Manufacturing Inc.


Industrial/Retail


2.7

%


17


Siemens Medical Solutions USA, Inc. & Siemens Corporation


Industrial


2.6

%


2


Nestle' Dreyer's Ice Cream Company


Industrial


2.5

%


1


Nationwide Mutual Insurance Company


Other


2.3

%


2


Arkansas Surgical Hospital LLC


Healthcare


2.3

%


1


Bob Evans Restaurants, LLC


Retail


2.2

%


25


Total


29.3

%


142


All Other


70.7

%


335


(1)

Tenant’s properties include 22 Outback Steakhouse restaurants and two Carrabba’s Italian Grill restaurants.

Top Ten Brands, by % of NTM Rent

Brand


Property Type


% NTM Rent


Properties


Bob Evans Farms(1)


Industrial/Retail


4.3

%


27


Red Lobster


Retail


4.3

%


25


Art Van Furniture


Retail


3.9

%


9


Jack's Family Restaurants


Retail


3.4

%


36


Taco Bell


Retail


3.1

%


41


Wendy's


Retail


2.9

%


35


Outback Steakhouse


Retail


2.8

%


22


Big Tex Trailers


Industrial/Retail


2.7

%


17


Siemens


Industrial


2.6

%


2


Nestle'


Retail


2.5

%


1


Total


32.5

%


215


All Other


67.5

%


262


(1)

Brand includes two BEF Foods, Inc. properties and 25 Bob Evans Restaurants, LLC restaurants.

As previously mentioned, the IDC approved certain updates to our Investment Policy following the regular annual review of the policy at the November 2017 meeting of our board of directors. As updated, our Investment Policy generally requires us to seek diversification of our investments. Based on the aggregate NTM rent of the properties in the portfolio, determined as of the date of the prior quarter end, new investments may not cause us to exceed:

5% in any single property,

8% leased to any single tenant or brand,

10% located in any single metropolitan statistical area, or

20% located in any single state.

We may exceed these diversification targets from time to time with the approval of the IDC. To avoid undue risk concentrations in any single asset class or category, long-term asset allocation will be set with the following target percentages and within the following ranges, although these ranges may be temporarily waived by the IDC:

Asset Category

Target

Range

Retail

30

%

15-45%

Healthcare

20

%

15-40%

Industrial

25

%

15-40%

Office

15

%

10-20%

Other

10

%

5-15%

Our Investment Policy provides the Asset Manager with the authority to make any acquisition or sale of any property or group of related properties involving up to $50 million for any single or portfolio transaction, $75 million per cumulative tenant concentration, or $100 million per cumulative brand concentration on our behalf, without approval of the IDC, provided that any properties so acquired otherwise meet our Investment Policy and Property Selection Criteria, and any financing related to any such acquisitions does not violate our Leverage Policy (as defined below), as such are established by the IDC from time to time. Our Investment Policy permits investments in rental properties, that do not otherwise meet our Investment Policy or Property Selection Criteria withcompared to $2.0 million during the approval of the IDC.


Leverage Policy

In March of 2016, Moody’s Investors Service (“Moody’s”) assigned the Operating Company an investment grade credit rating of Baa3 with a stable outlook. Moody’s re-affirmed the investment grade credit rating in March 2017. The investment grade credit rating allowed us to take advantage of preferential borrowing margins on our outstanding debt, including the $800 million credit facility we entered into on June 23, 2017. The investment grade credit ratings will also allow us more attractive access to the debt private placement markets. The rating is based on a number of factors, including an assessment of our financial strength, portfolio size and diversification, credit and operating metrics, corporate governance policies, and sustainability of cash flow and earnings. We are strongly committed to maintaining modest leverage, commensurate with our investment grade rating. While Moody’s utilizes other factors outside of our leverage ratio, our leverage policy (“Leverage Policy”) is to maintain a leverage ratio in the 35% to 45% range based on the market value of assets, recognizing that the actual leverage ratio will vary over time and there may be opportunistic reasons to exceed a 45% leverage ratio; provided, however, that we cannot exceed a 50% leverage ratio without the approval of the IDC.

To reduce its exposure to variable rate debt, the Operating Company enters into interest rate swap agreements to fix the rate of interest as a hedge against interest rate fluctuations. These interest rate hedges have staggered maturities to reduce the exposure to interest rate fluctuations in any one year, and generally extend up to 10 years. The interest rate swaps are applied against a pool of debt, which offers flexibility in maintaining our hedge designation concurrent with our ongoing capital market activity. We limit our total exposure to floating rate debt to no more than 5% of the market value of total assets, measured at quarter end.

During the ninesix months ended SeptemberJune 30, 2017, we added $150 million of unsecured Senior Notes (as defined below) to our capital structure. The Senior Notes bear interest at a fixed of 4.84% per annum, with a 10 year maturity. We strategically used this channel of long-term, fixed rate debt capital to help mitigate interest rate risk, lengthen our maturity profile, and diversify our sources of debt capital.  

The IDC reviews our Leverage Policy at least annually, however, depending on market conditions and other factors, they may change our Leverage Policy from time to time.

As of September 30, 2017, our total outstanding indebtedness was $910.1 million, and the ratio of our total indebtedness to the market value of our assets was approximately 36.5%.

Determined Share Value

Our shares of common stock are sold by us in our ongoing private offering at a price equal to a determined share value (the “Determined Share Value”), which is established quarterly by the IDC based on the net asset value (“NAV”) of our portfolio, input from management, and such other factors as the IDC may determine. Shares of our common stock are also sold pursuant to our DRIP, and repurchased by us pursuant to our share redemption program, at a price based upon the Determined Share Value. For additional information regarding our valuation policy and procedures, please see the section titled “Determined Share Value” in Item 1 of our Form 10.2021. The following table presents our Determined Share Value for each period indicated below, together with the corresponding NAV as of the preceding quarter-end:

Period


NAV as of


Determined

Share Value


NAV per

share


November 1, 2017 - January 31, 2018


September 30, 2017


$

81.00


$

80.55


August 1, 2017 - October 31, 2017


June 30, 2017


$

80.00


$

79.90


The adjustments to NAV per share in arriving at the Determined Share Valueimpairment charges for the periods presented above account forrespective periods:


For the Six Months Ended


June 30,


(in thousands, except number of properties)


2022


2021


Number of properties


1


1


Carrying value prior to impairment charge


$

3,674


$

2,818


Fair value


2,294


806


Impairment charge


$

1,380


$

2,012


The timing and amount of impairment fluctuates from period to period depending on the inherent imprecisionspecific facts and circumstances.

37


Other income (expenses)


For the Six Months Ended


June 30,


Increase/(Decrease)

(in thousands)


2022


2021


$


%

Other income (expenses)


Interest income


$


$

11


$

(11


)


<(100.0

)%

Interest expense


(34,784


)


(31,538


)


3,246


10.3

%

Cost of debt extinguishment


(126


)


(126


)


<(100.0

)%

Gain on sale of real estate


5,267


8,571


(3,304


)


(38.5

)%

Income taxes


(813


)


(714


)


99


13.9

%

Change in fair value of earnout liability


(4,480


)


4,480


<(100.0

)%

Other income


1,506


14


1,492


>100.0

%

Interest expense

The increase in the valuation estimates. In February 2018, the IDC will review the NAV calculations as of December 31, 2017, and will assess whether adjustments to the current Determined Share Value of $81.00 are appropriate.   

The following table provides a breakdown of the major components of our estimated NAV and NAV per share amounts as of September 30, 2017 and June 30, 2017 (in thousands, except per share amounts):

NAV as of:


September 30,

2017


June 30,

2017


Investment in rental property


$

2,502,140


$

2,351,989


Debt


(909,416

)


(883,112

)

Other assets and liabilities, net


1,348


34,790


NAV


$

1,594,072


$

1,503,667


Number of outstanding shares, including noncontrolling interests


$

19,790


$

18,820


NAV per share


$

80.55


$

79.90


The following table details the implied market capitalization rates (shown on a weighted average basis) used to value the investment in rental property, by property type, as of September 30, 2017 and June 30, 2017, supporting the Determined Share Value in effect for the periods of November 1, 2017 through January 31, 2018, and August 1, 2017 through October 31, 2017, respectively:

Market capitalization rates, as of:


Retail


Industrial


Healthcare


Other


Portfolio

Total


September 30, 2017


6.38

%


6.96

%


6.95

%


7.11

%


6.75

%

June 30, 2017


6.40

%


6.96

%


6.87

%


7.05

%


6.73

%

While we believe our assumptions are reasonable, a change in these assumptions would impact the calculation of the value of our real estate investments. For example, assuming all other factors remain unchanged,interest expense reflects an increase in theour weighted average implied market capitalization rate usedcost of borrowings combined with increased average outstanding borrowings during the six months ended June 30, 2022 compared to during the six months ended June 30, 2021. Since June 30, 2021 we increased total outstanding borrowings by $360.4 million to partially fund our acquisitions. Of our $1.9 billion of total outstanding indebtedness, approximately $200.5 million, or 10.8% is variable, and therefore subject to the impact of fluctuations in interest rates.

Gain on sale of real estate

Our recognition of a gain or loss on the sale of real estate varies from transaction to transaction based on fluctuations in asset prices and demand in the real estate market. During the six months ended June 30, 2022, we recognized a gain of $5.3 million on the sale of four properties, compared to a gain of $8.6 million on the sale of 19 properties during the six months ended June 30, 2021. Our proactive asset management strategy includes determining to sell any of our properties where we believe the risk profile has changed and become misaligned with our then current risk-adjusted return objectives.

Change in fair value of earnout liability

The fair value of the earnout liability was remeasured each reporting period, with changes recorded as Change in fair value of September 30, 2017,earnout liability in the Condensed Consolidated Statements of 0.25%, would result in a decreaseIncome and Comprehensive Income. All earnout milestones were achieved during the year ended December 31, 2021, therefore there is no change in the fair value of the earnout liability during the six months ended June 30, 2022. The change in the fair value of the earnout liability during the six months ended June 30, 2021 reflected an increase in our investmentshare price as compared to December 31, 2020.

Other income

The increase in rental property of 3.6%, and our NAV per share would have been $76.03.

Distributions and Distribution Reinvestment

At its November 7, 2017, meeting, our board of directors declared monthly distributions of $0.415 per shareother income during the six months ended June 30, 2022 was primarily due to a $1.5 million unrealized foreign exchange gain recognized on the quarterly remeasurement of our common stock and unit$100 million CAD revolver borrowings. The specific CAD revolver borrowings were drawn during the first quarter of membership interest in2022, with no similar activity during the Operating Company to be paid by us to our stockholders and members of the Operating Company (other than us) of record prior to the end of November 2017, December 2017, and January 2018:

Dividend Per Share/Unit


Record Date


Payment Date

(on or before)

$

0.415


November 29, 2017


December 15, 2017

$

0.415


December 28, 2017


January 15, 2018

$

0.415


January 30, 2018


February 15, 2018

Investors may purchase additional shares of our common stock by electing to reinvest their distributions through our DRIP. The purchase price for shares of our common stock acquired through our DRIP will be 98% of the then-current Determined Share Value. Please refer to Item 11. “Description of Registrant’s Securities to Be Registered” of our Form 10 for additional discussion of our DRIP.

The following table summarizes distributions paid in cash and pursuant to our DRIP for the ninesix months ended SeptemberJune 30, 2017 (in thousands).2021.

Net income and Net earnings per diluted share

Month


Year


Cash

Distribution -

Common

Stockholders


Cash

Distribution -

Membership

Units


Distribution

Paid

Pursuant to

DRIP on

Common Stock (1)


Distribution

Paid

Pursuant to

DRIP on

Membership

Units (1)


Total

Amount of

Distribution


January


2017


$

3,319


$

488


$

2,738


$

98


$

6,643


February


2017


3,394


488


2,836


98


6,816


March


2017


3,522


493


2,972


99


7,086


April


2017


3,555


493


3,068


99


7,215


May


2017


3,618


493


3,167


99


7,377


June


2017


3,680


493


3,220


99


7,492


July


2017


3,742


493


3,296


99


7,630


August


2017


3,815


512


3,378


122


7,827


September


2017


3,883


512


3,420


123


7,938


TOTAL


$

32,528


$

4,465


$

28,095


$

936


$

66,024


For the Six Months Ended


June 30,


Increase/(Decrease)


(in thousands, except per share data)


2022


2021


$


%


Net income


$

63,993


$

46,780


$

17,213


36.8

%

Net earnings per diluted share


0.36


0.30


0.06


20.0

%


(1)

Distributions are paid in shares of common stock.


The following table summarizes our distributions paid during the nine months ended September 30, 2017 and 2016, including the sourceincrease in net income is primarily due to revenue growth of distributions$24.4 million, a $4.5 million increase in change in fair value of earnout liability, a $1.5 million increase in unrealized foreign exchange gain, and a comparison against FFO (in thousands).


For the nine months ended


September 30,


2017


2016


Distributions:


Paid in cash


$

37,929


$

31,229


Reinvested in shares


28,095


19,781


Total Distributions


$

66,024


$

51,010


Source of Distributions:


Cash flow from operating activities


$

66,024


$

51,010


Cash flow from investing activities


Cash flow from financing activities


Total Sources of Distributions


$

66,024


$

51,010


FFO


$

79,974


$

55,658


For the nine months ended September 30, 2017$1.2 million decrease in general and 2016, we paid distributions from our cash flow from operating activities. Refer to “Net Incomeadministrative expenses. These factors were partially offset by a $7.9 million increase in depreciation and Non-GAAP Measures (FFO and AFFO)” below for further discussion of our FFO.

We intend to fund future distributions from cash generated by operations; however, we may fund distributions from theamortization, a $3.3 million decrease on gain on sale of assets, borrowings,real estate, and a $3.2 million increase in interest expense.

GAAP net income includes items such as gain or proceeds from theloss on sale of our securities.real estate and provisions for impairment, among others, which can vary from quarter to quarter and impact period-over-period comparisons.

Share Redemptions38


The following table sets forth the redemption requests honored pursuant to our share redemption program during the three and nine months ended September 30, 2017. We did not defer or reject any redemption requests during this period. Please refer to Item 11. “Description of Registrant’s Securities to Be Registered” of our Form 10 for additional discussion of our share redemption program.

Period


Shares

Redeemed


Average

Determined

Share

Value(1)


Average

Redemption

Price


Redemption

Amount


Discount on

Redemption(2)


Q1 2017


17,861


$

79.00


$

77.24


$

1,379,570


2.2

%

Q2 2017


20,641


$

80.00


$

79.29


$

1,636,650


0.9

%

Q3 2017


23,374


$

80.00


$

77.36


$

1,808,288


3.3

%

YTD 2017


61,876


$

79.67


$

77.97


$

4,824,508


2.1

%

(1)

Average Determined Share Value represents the weighted average Determined Share Value in effect during the applicable period.

(2)

Discount on redemption represents the weighted average discount applied to the Determined Share Value as a result of redemption limitations.

Liquidity and Capital Resources

General

We acquire real estate withusing a combination of debt and equity capital and with cash from operations that is not otherwise distributed to our stockholders. Our focus is on maximizing the risk-adjusted return to our shareholdersstockholders through an appropriate balance of debt and equity in our capital structure. Therefore, we attemptWe are committed to maintain a conservative debt level on ourmaintaining an investment grade balance sheet with appropriate interest and fixed charge coverage ratios. We target a leverage ratio with total debt equal to 35% to 45% of the approximate market valuethrough active management of our assets.leverage profile and overall liquidity position. We believe our current leverage modelstrategy has allowed us to take advantage of the lower cost of debt while simultaneously strengthening our balance sheet, as evidenced by theour current investment grade credit rating the Operating Company received in Marchratings of 2016'BBB' from S&P Global Ratings ("S&P") and re-affirmed in March'Baa2' from Moody's Investors Service ("Moody's"). We manage our leverage profile using a ratio of 2017. The actual leverage ratio will vary over time but may not exceed 50% without the approval of the IDC. As of September 30, 2017, the leverage ratio was approximately 36.5% of the market valueNet Debt to Annualized Adjusted EBITDAre, a non-GAAP financial measure, which we believe is a useful measure of our assets. Fromability to repay debt and a management perspectiverelative measure of leverage, and is used in communications with the creditlenders and with rating agencies regarding our credit rating. We seek to maintain on a sustained basis a Net Debt to Annualized Adjusted EBITDAre ratio that is generally less than 6.0x. As of June 30, 2022, we also consider our leverage position ashad total debt outstanding of $1.9 billion, Net Debt of $1.8 billion, and a multipleNet Debt to Annualized Adjusted EBITDAre ratio of Earnings Before Interest Taxes Depreciation5.3x.

Net Debt and Amortization (“EBITDA”),Annualized Adjusted EBITDAre are non-GAAP financial measures, and Annualized Adjusted EBITDAre is calculated based upon EBITDA, EBITDAre, and Adjusted EBITDAre, each of which is also a non-GAAP financial measure. EBITDARefer to Non-GAAP Measures below for further details concerning our calculation of non-GAAP measures and reconciliations to the comparable GAAP measure.

Liquidity/REIT Requirements

Liquidity is a toolmeasure of our ability to meet potential cash requirements, including our ongoing commitments to repay debt, fund our operations, acquire properties, make distributions to our stockholders, and other general business needs. As a REIT, we useare required to measure leveragedistribute to our stockholders at least 90% of our REIT taxable income determined without regard to the dividends paid deduction and excluding net capital gains, on an annual basis. As a result, it is unlikely that we will be able to retain substantial cash balances to meet our long-term liquidity needs, including repayment of debt and the acquisition of additional properties, from our annual taxable income. Instead, we expect to meet our long-term liquidity needs primarily by relying upon external sources of capital.

Short-term Liquidity Requirements

Our short-term liquidity requirements consist primarily of funds necessary to pay for our operating expenses, including our general and administrative expenses as well as interest payments on our outstanding debt, to pay distributions, and to fund our acquisitions that are under control or expected to close within a short time period. We do not currently anticipate making significant capital expenditures or incurring other significant property costs, including as a result of inflationary pressures in the contextcurrent economic environment, because of the strong occupancy levels across our portfolio and the net lease nature of our leases. We expect to meet our short-term liquidity requirements primarily from cash flow expectations and projections. Furthermore, given the significance ofcash equivalents balances and net cash provided by operating activities, supplemented by borrowings under our growth over the past two years, adding $352.0 million in investments during the nine months ended September 30, 2017, $518.8 million in investments during 2016, and $550.1 million in investments during 2015, coupled withRevolving Credit Facility. We intend to match fund our continued strategic growth initiatives, historical EBITDA may not provide investorsacquisitions with an adequate picture of the contractual cash in-flows associated with these investments. Our investments are typically made throughout the year, and therefore the full year, or “normalized” cash flows, will not be realized until subsequent years. Accordingly, we look at contractual, “normalized,” cash flows and EBITDA as an appropriate tool to manage our leverage profile. We utilize this analysis inclusive of our focus on debt-to-market value metrics.


Our equity capital for our real estate acquisition activity is provided from the proceeds of our ongoing private offering, including distributions reinvested through our DRIP. During the three and nine months ended September 30, 2017, we raised $79.2 million and $249.6 million, respectively, in equity capital to be used in our acquisition activities, including distributions reinvested through our DRIP and properties exchanged for membership units in the Operating Company through UPREIT transactions. We seek to maintain an appropriate balancemix of debt and equity capital. We use cash on hand and borrowings under our Revolving Credit Facility to initially fund acquisitions, which are subsequently repaid or replaced with proceeds from our equity and debt capital markets activities.

As detailed in the contractual obligations table below, we have approximately $36.0 million of expected obligations due throughout the remainder of 2022, primarily consisting of $34.1 million of interest expense due, including the impact of our interest rate swaps, and $1.5 million of mortgage maturities. We expect our cash provided by operating activities, as discussed below, will be sufficient to pay for our current obligations including interest expense on our borrowings. We expect to either repay the maturing mortgages with available cash on hand generated from our results of operations or borrowings under our Revolving Credit Facility, or refinance with property-level borrowings.

Long-term Liquidity Requirements

Our long-term liquidity requirements consist primarily of funds necessary to repay debt and invest in additional revenue generating properties. We expect to source debt capital from unsecured term loans from commercial banks, revolving credit facilities, private placement senior unsecured notes, and public bond offerings.

The source and mix of our debt capital in the future will be impacted by market conditions as well as our overall leverage policy, while maintaining acontinued focus on increasing core value for existing stockholders (achieved via share appreciationlengthening our debt maturity profile to better align with our portfolio's long-term leases, staggering debt maturities to reduce the risk that a significant amount of debt will mature in any single year in the future, and earnings growth).managing our exposure to interest rate risk. As of June 30, 2022, we have $679.3 million of available capacity under our Revolving Credit Facility.

We expect to meet our long-term liquidity requirements primarily from borrowings under our Revolving Credit Facility, future debt and equity financings, and proceeds from limited sales of our properties. Our ability to access these capital sources may be impacted by unfavorable market conditions, particularly in the debt and equity capital markets, that are outside of our control. In addition, our success

39


will depend on our operating performance, our borrowing restrictions, our degree of leverage, and other factors. Our acquisition growth strategy significantly depends on our ability to obtain acquisition financing on favorable terms. We seek to reduce the risk that long-term debt capital is provided through unsecured term notes, revolvingmay be unavailable to us by strengthening our balance sheet by investing in real estate with creditworthy tenants and lease guarantors, and by maintaining an appropriate mix of debt facilities, and senior unsecured notes.equity capitalization. We also, from time to time, obtain or assume non-recourse mortgage financing from banks and insurance companies secured by mortgages on the corresponding specific property. Mortgages, however, are not currently a strategic focus of the active management of our leverage profile. Rather, we enter into mortgages and notes payable as ancillary business transactions on an as-needed basis.

To reduce our exposure to variable rate debt, the Operating Company enters into interest rate swap agreements to fix the rate of interest as a hedge against interest rate fluctuations. These interest rate hedges have staggered maturities up to ten years in duration in order to reduce the exposure to interest rate fluctuations in any one year. The interest rate swaps are applied against a pool of debt, which offers flexibility in maintaining our hedge designation concurrent with our ongoing capital market activity. We attempt to limit our total floating rate debt exposure to no more than 5% of total assets, measured at quarter end. To reduce counterparty concentration risk with respect to the interest rate hedges, we diversify the institutions that serve as swap counterparties. No more than 30% of the nominal value of our total hedged debt may be with any one institution, to be measured at the time we enter into an interest rate swap transaction and at quarter end. We may deviate from these policies from time-to-time subject to the approval of the IDC. The interest rate swaps are considered cash flow hedges. Under these agreements, we receive monthly payments from the counterparties equal to the variable interest rates multiplied by the outstanding notional amounts. In turn, we pay the counterparties each month an amount equal to a fixed rate multiplied by the outstanding notional amounts. The intended net impact of these transactions is that we pay a fixed interest rate on our variable rate borrowings.

We also mitigate interest rate risk by strategically adding long-term, fixed rate debt to our capital structure. During the nine months ended September 30, 2017, we added $150 million of unsecured Senior Notes (as defined below) to our

Equity Capital Resources

Our equity capital structure. The Senior Notes bear interest at a fixed rate of 4.84% per annum, with a 10 year maturity.

The availability of debt to finance commercial real estate can be impacted by economic and other factors that are beyond our control. We seek to reduce the risk that long-term debt capital may be unavailable to us by strengthening our balance sheetis primarily provided through our investments in real estate with credit-worthy tenants and lease guarantors, and maintaining an appropriate mix of debt andat-the-market common equity capitalization. Specifically, we recognized a 100% collection rate on rentals during 2016, and over a 99% collection rate on rentals during the nine months ended September 30, 2017. Additionally, Moody’s issued an investment grade credit rating of Baa3 to the Operating Company in March 2016, further evidencing our active management of a conservative capital structure. Moody’s re-affirmed the investment grade credit rating in March 2017. We have arranged our debt facilities to have multiple year terms in order to reduce the risk that short-term real estate financing would not be available to us in any given year. As we grow our real estate portfolio, we also intend to manage our debt maturities to reduce the risk that a significant amount of our debt will mature in any single year in the future. Refer to “Contractual Obligations” below for further details of the maturities on our contractual obligations, including long-term debt.

As of September 30, 2017, the historical cost basis of our real estate investment portfolio totaled $1.9 billion, consisting of investments in 477 properties with rent and interest due from our tenants aggregating $14.7 million per month on a straight-line basis. During the nine months ended September 30, 2017, we closed 14 real estate acquisitions totaling $352.0 million, adding 70 new properties to our portfolio. The 70 new properties will provide approximately $2.6 million in monthly rent on a straight-line basis. Substantially all of our cash from operations is generated by our real estate portfolio.

Our primary cash expenditures are the monthly interest payments we make on the debt we use to finance our real estate investment portfolio, asset management and property management fees of servicing the portfolio, acquisition expenses related to the growth of our portfolio, and the general and administrative expenses of operating our business. Since substantially all of our leases are triple-net, our tenants are generally responsible for the maintenance, insurance, and property taxes associated with the properties they lease from us. In certain circumstances,offering program ("ATM Program"), as well as follow-on equity offerings. Under the terms of the lease requireour ATM Program we may, from time to time, publicly offer and sell shares of our common stock having an aggregate gross sales price of up to $400 million. The ATM Program provides for forward sale agreements, enabling us to pay these expenses, however, in most cases we are reimbursed byset the tenants. Accordingly, we do not currently anticipate making significant capital expenditures or incurring other significant property costs duringprice of shares upon pricing the term of a property lease, unless we incur substantial vacancies. To the extent that we have vacant properties, we will incur certain costs to operate and maintain the properties, however, we do not currently expect these costs to be material. For the nine months ended September 30, 2017, we maintained a 100% leased portfolio, with the leases for only two of our properties, representing less than 1% of our annual rental streams (calculated based on NTM Rent), expiring before 2020.

We intend to continue to grow through additional real estate investments. To accomplish this objective, we must continue to identify real estate acquisitions that are consistent with our underwriting guidelines and raise additional future debt and equity capital. We have financed our acquisition of properties using both equity investments as well as a combination of unsecured term, revolving debt, senior unsecured notes, and mortgage loans. The mix of financing sources may change over time based on market conditions and our liquidity needs. We have three outstanding unsecured term loans with an outstanding principal balance of approximately $725.0 million as of September 30, 2017, and a $400.0 million line of credit with $126.5 million of outstanding borrowings as of September 30, 2017.


On April 18, 2017, the Operating Company closedoffering while delaying the issuance of unsecured, fixed rate, guaranteed senior promissory notes (“Senior Notes”)shares and the receipt of the net proceeds. As of June 30, 2022, we have issued common stock with an aggregate principal amountgross sales price of $150 million. The Senior Notes were issued by the Operating Company and upon issuance, were guaranteed by us and each of the Operating Company’s subsidiaries that guarantee our other unsecured credit facilities. The Senior Notes were issued at par, bear interest at a rate of 4.84% per annum (priced at 240 basis points above the 10 year U.S. Treasury yield at the time of pricing), and mature on April 18, 2027. We used the proceeds from the sale of the Senior Notes to pay down $115 million of the outstanding balance on our existing line of credit (the “Revolver”) at the time of closing and to fund other general corporate purposes, including acquisitions. The financial covenants associated with the Senior Notes are materially consistent with the covenant tables set forth below.

On June 23, 2017, together with the Operating Company, we closed on an $800 million unsecured credit facility (the “Credit Facility”). The Credit Facility contains an accordion feature that can increase the facility size up to a total of $1.0 billion, and includes (i) a $400 million senior unsecured revolving credit facility (the “New Revolver”), (ii) a five and a half year, $250 million senior unsecured delayed draw term loan (the “5.5-Year Term Loan”), and (iii) a seven year, $150 million senior unsecured delayed draw term loan (the “7-Year Term Loan”). The following table summarizes the amounts drawn and available to be drawn on the Credit Facility upon closing (in thousands).

Loan Tranche


Amount Drawn


Amount Available


Total Capacity


Maturity Date

New Revolver


90,000


310,000


400,000


January 21, 2022

5.5-Year Term Loan


250,000


250,000


January 23, 2023

7-Year Term Loan


150,000


150,000


June 21, 2024

At closing, we borrowed $250$234.0 million under the 5.5-Year Term LoanATM Program and drew down $90 million on the New Revolver. We used the proceeds from these borrowingscould issue additional common stock with an aggregate sales price of up to pay off our $100 million term note (“Term Note 1”), our $185 million term note (“Term Note 2”), the outstanding balance of $5 million on our Revolver, and to pay down $50 million of the outstanding borrowings on our $375 term note (“Term Note 3”). The $50 million payment on Term Note 3 was made via a one-time, non-pro rata payment provision included in our amended and restated Term Note 3 agreement, which was amended and restated simultaneously with the closing of the Credit Facility to align its terms with the Credit Facility. We did not draw down funds from the 7-Year Term Loan at closing. The remaining capacity on the Credit Facility will also be used to partially fund future acquisition activity in our real estate portfolio, and for general corporate purposes. Prior to extension options, Term Note 1 and the Revolver were set to mature on June 27, 2017, and Term Note 2 was set to mature on October 11, 2018.$166.0 million.

Included in the terms of the Credit Facility and through our amendment and restatement of Term Note 3, we removed the subsidiary guarantees supporting our term notes and Senior Notes.      

Our $400 million New Revolver matures on January 21, 2022, with one extension option for an additional five month period through June 21, 2022, subject to certain conditions set forth in the Credit Facility, including payment of an extension fee equal to 0.0625% of the revolving commitments. The rate of interest payable on the New Revolver, at our option, is equal to LIBOR plus a margin. The margin for New Revolver borrowings is adjustable based upon the Operating Company’s credit rating and is between 0.825% and 1.55% per annum. Based on the Operating Company’s current investment grade credit rating of Baa3, the applicable margin for the New Revolver equals 1.2% per annum. Borrowings under the New Revolver are payable interest only during the term, with the principal amount due in full at maturity. As of September 30, 2017, and at closing on June 23, 2017, there were $126.5 million and $90 million, respectively, in outstanding LIBOR borrowings under the New Revolver. As of September 30, 2017, $28 million of the total $126.5 million outstanding New Revolver borrowings were in the form of swingline borrowings, which allow us to draw down funds on the New Revolver immediately upon request. The swingline borrowings are short-term in nature, with a maturity date equal to five business days after draw. As of September 30, 2017, we expect to replace the $28 million in swingline borrowings with New Revolver borrowings. Should the Operating Company lose its investment grade credit rating, the margin would be 1.55% until such time as the Operating Company regains its investment grade credit rating. The current margin on the New Revolver of 1.2% represents a 25 basis point reduction from the margin of 1.45% on the previous Revolver, prior to consideration of the applicable facility fee discussed below. The following table presents information about the marginsCompany's ATM Program activity:


For the Three Months Ended


For the Six Months Ended


(in thousands, except per share amounts)


June 30, 2022


June 30, 2022


Number of common shares issued


3,236


9,509


Weighted average sale price per share


$

21.42


$

21.69


Net proceeds


$

68,321


$

202,647


Gross proceeds


69,313


205,857


Our public offerings have been used to repay debt, fund acquisitions, and for other general corporate purposes.

As we continue to invest in accretive real estate properties, we expect to balance our debt and equity capitalization, while maintaining a Net Debt to Annualized Adjusted EBITDAre ratio below 6.0x on a sustained basis, through the New Revolver based on credit ratings from S&P or Moody’s.anticipated use of follow-on equity offerings and the ATM Program.

Unsecured Indebtedness and Capital Markets Activities as of and for the Six Months Ended June 30, 2022

Level

Credit Rating

(S&P/Moody’s)

Applicable Margin

for LIBOR Loans

I

A-/A3 or better

0.83%

II

BBB+/Baa1

0.88%

III

BBB/Baa2

1.00%

IV

BBB-/Baa3

1.20%

V

Lower than BBB-/Baa3

1.55%


An applicable facility fee is payable on the amount of the revolving commitments, as defined in the Credit Facility, based on the Operating Company’s credit rating. The initial applicable facility fee equals 0.25% per annum. The previous Revolver contained an unused commitment fee. The following table presentssets forth our outstanding Revolving Credit Facility, Unsecured Term Loans and Senior Unsecured Notes at June 30, 2022.

(in thousands, except interest rates)


Outstanding
Balance


Interest
Rate


Maturity
Date

Unsecured revolving credit facility


$

320,657


Applicable reference rate + 0.85% (a)


Mar. 2026

Unsecured term loans:


2024 Unsecured Term Loan


190,000


one-month LIBOR + 1.00%


Jun. 2024

2026 Unsecured Term Loan


400,000


one-month LIBOR + 1.00%


Feb. 2026

Total unsecured term loans


590,000


Senior unsecured notes:


2027 Senior Unsecured Notes - Series A


150,000


4.84%


Apr. 2027

2028 Senior Unsecured Notes - Series B


225,000


5.09%


Jul. 2028

2030 Senior Unsecured Notes - Series C


100,000


5.19%


Jul. 2030

2031 Senior Unsecured Public Notes


375,000


2.60%


Sep. 2031

Total senior unsecured notes


850,000


Total unsecured debt


$

1,760,657


(a)
At June 30, 2022, a balance of $243.0 million was subject to the one-month Secured Overnight Financing Rate of 1.69%. The remaining balance includes $100 million CAD borrowings remeasured to $77.7 million USD, which was subject to the one-month Canadian Dollar Offered Rate of 2.23%.

On January 28, 2022, we amended and restated the Revolving Credit Facility, upsizing the capacity to $1.0 billion, extending the maturity date to March 2026 and reducing the applicable facility fee onmargin to 0.85% per annum.

On February 25, 2022, we repaid the New Revolver based on credit ratings from S&P or Moody’s.

Level

Credit Rating

(S&P/Moody’s)

Applicable

Facility Fee

I

A-/A3 or better

0.13%

II

BBB+/Baa1

0.15%

III

BBB/Baa2

0.20%

IV

BBB-/Baa3

0.25%

V

Lower than BBB-/Baa3

0.30%

Our $250$60.0 million 5.5-Year2022 Unsecured Term Loan matureswith borrowings under our Revolving Credit Facility.

As of June 30, 2022, we had $320.7 million outstanding on January 23, 2023, and was fully drawnour Revolving Credit Facility. We have $679.3 million of remaining capacity on our Revolving Credit Facility as of June 30, 2017.2022.

Subsequent to quarter end, on August 1, 2022, we entered into two new unsecured bank term loans, including a $200 million, five year term loan that matures in 2027 (the "2027 Unsecured Term Loan"), and a $300 million, seven year term loan that matures in 2029 (the

40


"2029 Unsecured Term Loan"). Borrowings underon the 5.5-Year Term Loannew term loans bear interest at variable rates based on LIBORthe Secured Overnight Financing Rate ("SOFR") plus a margin ranging from 0.90% to 1.75% based on the Operating Company’s credit rating. Based on the Operating Company’s current investment gradeour credit rating of Baa3,ranging between 0.80% and 1.60% per annum for the applicable margin under the 5.5-Year2027 Unsecured Term Loan, equals 1.35%and 1.15% and 2.20% per annum. As compared toannum for the applicable margin for Term Note 1 and Term Note 2 of 1.45% and 1.75%, respectively, the applicable margin of 1.35% on the 5.5-Year Term Loan represents a 10 basis point and 40 basis point reduction, respectively. Borrowings under the 5.5-Year Term Loan are payable interest only during the term, with the principal amount due in full at maturity. The following table presents the margins on the 5.5-Year Term Loan.

Level

Credit Rating

(S&P/Moody’s)

Applicable Margin for

LIBOR Loans

I

A-/A3 or better

0.90%

II

BBB+/Baa1

0.95%

III

BBB/Baa2

1.10%

IV

BBB-/Baa3

1.35%

V

Lower than BBB-/Baa3

1.75%

Our $150 million 7-Year Term Loan matures on June 21, 2024. We are permitted to request up to three borrowings under the delayed draw feature of the 7-Year Term Loan, which may be drawn from June 23, 2017, to but excluding June 22, 2018. As of September 30, 2017, we have not drawn upon the 7-Year2029 Unsecured Term Loan. The rate of interest payable oninitial applicable margin was 0.95% and 1.25% for the 7-Year2027 Unsecured Term Loan is equal to LIBOR plus a margin. The margin for 7-Yearand 2029 Unsecured Term Loan, borrowings is adjustable based uponrespectively. Proceeds from the Operating Company’s credit ratingloans were used to repay in full our $190 million unsecured term loan set to mature in 2024, including accrued interest, and is between 1.5% and 2.45% per annum. Based on the Operating Company’s current investment grade credit rating of Baa3, the initial margin under the 7-Year Term Loan equals 1.9% per annum. A ticking fee is payable on the amounta portion of the commitments for the 7-Year Term Loan, as reduced by the amount of any term loans outstanding under the 7-Year Term Loan, equal to 0.25% per annum. Borrowings under the 7-Year Term Loan are payable interest only during the term, with the principal amount due in full at maturity. The following table presents the margins on the 7-Year Term Loan based on credit ratings from S&P or Moody’s.

Level

Credit Rating

(S&P/Moody’s)

Applicable Margin

for LIBOR Loans

I

A-/A3 or better

1.50%

II

BBB+/Baa1

1.55%

III

BBB/Baa2

1.65%

IV

BBB-/Baa3

1.90%

V

Lower than BBB-/Baa3

2.45%

Our $325 million Term Note 3 matures on February 6, 2019, was fully drawn as of September 30, 2017, and provides for two one year extension options, at our option, subject to compliance with all covenants and the payment of a 0.10% fee. The Term Note 3 agreement contains an accordion feature that can increase the note size up to a total of $600 million. Borrowings under Term Note 3 originally bore interest at variable rates based on the one month LIBOR plus a margin. Moody’s assignment of an investment grade credit rating to the Operating Company led to a margin of 1.40% on Term Note 3, effective April 1, 2016. Should the Operating Company lose its investment grade credit rating, the margin would be 1.75% until such time as the Operating Company regains its investment grade credit rating. The following tables present the margins on Term Note 3 based on credit ratings from S&P or Moody’s.

Level

Credit Rating

(S&P/Moody’s)

Applicable Margin

for LIBOR Loans

I

A-/A3 or better

0.90%

II

BBB+/Baa1

0.95%

III

BBB/Baa2

1.10%

IV

BBB-/Baa3

1.40%

V

Lower than BBB-/Baa3

1.75%


The Operating Company achieved its investment grade credit rating basedbalance on our conservative leverage profile, diversified portfolio, and earnings stability based on the credit-worthiness of our tenants, which we intend to maintain concurrent with our growth objectives. Factors that could negatively impact our credit rating include, but are not limited to: a significant increase in our leverage on a sustained basis; a significant increase in secured debt levels; a significant decline in our unencumbered asset base; weakening of our corporate governance structure; and a significant decline in our portfolio diversification. We have aligned our strategic growth priorities with these factors, as we believe the favorable debt pricing and access to additional sources of debt capital resulting from the investment grade credit rating provides us with an advantageous cost of capital and risk-adjusted return on investment for our stockholders.Revolver.

We intend to draw down on the $150 million 7-Year Term Loan as we acquire additional real estate as part of our strategic growth initiatives. Additionally, we intend to exercise the extension provisions of the New Revolver and Term Note 3, refinance, or replace the existing borrowings as they become due. The extensions would delay the New Revolver’s maturities until June 2022, and Term Note 3’s maturity until February 2021. We do not intend to make principal payments on these obligations in the foreseeable future, and plan to replace our existing credit facilities with new debt prior to maturity. Additionally, we may be required to increase our borrowing capacity to partially fund future acquisitions. We assess market conditions and the availability and pricing of debt on an ongoing basis, which are critical inputs in our strategic planning and decision making process. While we believe the current market conditions provide our stockholders with an advantageous capitalization structure and risk-adjusted return, we believe our conservative capital structure is appropriate to absorb temporary market fluctuations. Significant adverse market conditions could impact the availability of debt to fund future acquisitions, our ability to recognize growth in earnings and return on investment for stockholders, and our ability to recast the debt facilities at cost-advantageous pricing points. In the event of such conditions, we would plan to revise our capitalization structure and strategic initiatives to maximize return on investment for stockholders. To the extent that we are unable to recast our debt facilities, our cash flows from operations will not be adequate to pay the principal amount of debt, and we may be forced to liquidate properties to satisfy our obligations.Debt Covenants

We are subject to various covenants and financial reporting requirements pursuant to the loan agreements we have entered into. The table below summarizes the applicable financial covenants,our debt facilities, which are substantially the same across each of our loan agreements.summarized below. As of SeptemberJune 30, 2017,2022, we believe we were in compliance with all of our covenants.covenants on all outstanding borrowings. In the event of default, either through default on payments or breach of covenants, we may be prohibitedrestricted from paying dividends onto our common stock above the annual 90%stockholders in excess of dividends required to maintain our REIT taxable income distribution requirement.qualification. For each of the previous three years, we paid dividends out of our cash flows from operations in excess of the distribution amounts required distribution amounts.to maintain our REIT qualification.


Covenants


Required

Actual

(as of

September 30, 2017)

Requirements

Leverage Ratio(1)


 0.60 to 1.00

0.37

Secured Indebtedness Ratio(2)


 0.40 to 1.00

0.02

Unencumbered Coverage Ratio(3)


 1.75 to 1.00

5.49

Fixed Charge Coverage Ratio(4)


≥ 1.50 to 1.00

3.11

Total Unsecured Indebtedness to Total

Unencumbered Eligible Property Value(5)


≤ 0.60 to 1.00

0.43

Dividends and Other Restricted Payments


Only applicable in case of default

Aggregate Debt Ratio


Not Applicable≤ 0.60 to 1.00

Consolidated Income Available for Debt to Annual Debt Service Charge

≥ 1.50 to 1.00

Total Unencumbered Assets to Total Unsecured Debt

≥ 1.50 to 1.00

Secured Debt Ratio

≤ 0.40 to 1.00

(1)

The leverage ratio is calculated as the ratio of total indebtedness to total market value. Total market value is computed as the net operating income for the most recently completed fiscal quarter on properties owned for four consecutive quarters at a capitalization rate of 7.50%, multiplied by four, plus the acquisition price of properties in the last four quarters, plus tangible assets comprised of current assets on a GAAP basis and notes receivable.

(2)

The secured indebtedness ratio is the ratio of secured indebtedness to total market value. The secured indebtedness represents outstanding mortgage borrowings.

(3)

Unencumbered Coverage Ratio is the ratio of adjusted EBITDA to interest expense for the most recent fiscal quarter. Adjusted EBITDA is calculated as net income adjusted for depreciation and amortization, interest, taxes, gain/loss on sale of properties, dividend income, gain/loss on debt extinguishment, straight-line rent adjustments, transaction costs expensed, amortization of intangibles, and interest rate swap ineffectiveness, if applicable.

(4)

Fixed Charge Coverage Ratio is the ratio of adjusted EBITDA to fixed charges for the most recent fiscal quarter. Fixed charges are calculated as interest expense plus any principal payments on debt, excluding balloon payments, if applicable.  

In connection with our closing of the Credit Facility and amending and restating Term Note 3, we removed the maximum recourse secured indebtedness ratio, minimum tangible net worth requirement, minimum eligible properties, and maximum permitted investments covenants from our term loan and revolving credit agreements. The new debt covenants are characteristic of investment grade credit facilities within the REIT industry.

We believe our leverage policy and capital structure provides us with several advantages, including the ability to:

create a growing and diversified real estate portfolio;

capitalize on competitive debt pricing;


add value to our stockholders through earnings growth on a growing pool of assets; and

issue unsecured debt having relatively limited negative financial covenants and maintain the distributions necessary to retain our tax-sheltered REIT status in the event of contractual default, which we believe increases our corporate flexibility.

We do not anticipate utilizing mortgage loans as a strategic priority in our capital structure to fund growth. When utilized, mortgage loans typically correspond to a single property or a group of related properties acquired from a single seller. The loans may be further secured by guarantees from us or the Operating Company, provided that we attempt to limit the use of guarantees to the extent possible. The Operating Company may assume debt when conducting a transaction or it may mortgage existing properties. The maturities on our mortgages are staggered from 2017 to 2031. As of September 30, 2017, the aggregate GAAP principal balance of outstanding mortgage loans approximated $57.9 million, net of unamortized debt issuance costs.

As part of acquisitions closed during 2016, we entered into tenant improvement allowances with a balance of $9.5 million at December 31, 2016, included in Accounts payable and other liabilities in the Condensed Consolidated Balance Sheets within this Form 10-Q. During the nine months ended September 30, 2017, we entered into $1.0 million of additional tenant improvement allowances and paid $3.9 million towards the allowances. We expect to pay the $6.6 million balance of tenant improvement allowances within the next twelve months out of cash flows from operations.

As shown in the table below, net cash provided by operating activities increased by $20.2 million during the nine months ended September 30, 2017, from $52.1 million for the nine months ended September 30, 2016. The increase in cash provided by operating activities is primarily due to the increase in the size of our real estate investment portfolio. Our real estate investing activities have grown in volume as we continue to identify and acquire income-producing, net leased commercial real estate, primarily through sale-leaseback transactions, as a result of increased access to debt and equity capital and favorable investment opportunities. We funded real estate investment activity with a combination of cash from operations, proceeds from the issuance of unsecured debt obligations, and proceeds from the issuance of common stock. We paid cash dividends to our stockholders and non-controlling members of the Operating Company, net of reinvestments through our DRIP, totaling $38.2 million and $31.3 million for the nine months ended September 30, 2017 and 2016, respectively. Cash used to fund the increase in dividends between periods related primarily to the increase in cash provided by our operations. Cash and cash equivalents totaled $13.7 million and $33.0 million at September 30, 2017  and September 30, 2016, respectively.


For the nine months ended


September 30,


(In thousands)


2017


2016


Net cash provided by operating activities


$

72,365


$

52,148


Net cash used in investing activities


(297,497

)


(360,093

)

Net cash provided by financing activities


217,195


313,898


Increase (decrease) in cash and cash equivalents


$

(7,937

)


$

5,953


Management believes that the cash generated by our operations and our ongoing private offering, our cash and cash equivalents at September 30, 2017, our current borrowing capacity on our New Revolver and three unsecured credit facilities, and our access to long-term debt capital, including through the debt private placement market, will be sufficient to fund our operations for the foreseeable future and allow us to acquire the real estate to meet our strategic objectives.

Impact of Inflation

Our leases with tenants of our properties are long-term in nature, with a current weighted average remaining lease term of 13.2 years as of September 30, 2017. To mitigate the impact of inflation on our fixed revenue streams, we have implemented limited escalation clauses in our leases. As of September 30, 2017, all of our leases had contractual lease escalations, with a weighted average of 2.1%. A substantial majority of our leases have fixed annual rent increases, and the remaining portion has annual lease escalations based on increases in the CPI, or periodic escalations over the term of the lease (e.g., a 10% increase every five years). These lease escalations mitigate the risk of fixed revenue streams in the case of an inflationary economic environment, and provide increased return in otherwise stable market conditions. As a majority of our portfolio has fixed lease escalations, there is a risk that inflation could be greater than the contractual rent increases.

Our focus on single-tenant, triple-net leases also shelters us from fluctuations in the cost of services and maintenance as a result of inflation. For an insignificant portion of our portfolio, we have leases that are not triple-net, and therefore we bear certain responsibilities for the maintenance and structural component replacement that may be required in the future. Inflation and increased costs may have an adverse impact to our tenants and their credit-worthiness if the increase in costs are greater than their increase in revenue. In the limited circumstances where we cannot implement a triple-net lease, we attempt to limit our exposure to inflation through the use of warranties and other remedies that reduce the likelihood of a significant capital outlay.


Off-Balance Sheet Arrangements

We have no off-balance sheet arrangements as of September 30, 2017.

Contractual Obligations

The following table provides information with respect to our contractual commitments and obligations as of SeptemberJune 30, 20172022 (in thousands). Refer to the discussion in the Liquidity and Capital Resources section above for further discussion over our short and long-term obligations.

Year of
Maturity


Term Loans


Revolving Credit
Facility
(a)


Senior
Notes


Mortgages


Interest
Expense
(b)


Tenant
Improvement
Allowances


Operating
Leases


Total


Remainder
   of 2022


$


$


$


$

1,466


$

34,078


$

57


$

424


$

36,025


2023


7,582


67,463


705


75,750


2024


190,000


9,760


64,088


320


264,168


2025


20,195


60,660


326


81,181


2026


400,000


320,657


16,843


42,122


332


779,954


Thereafter


850,000


39,874


88,769


3,739


982,382


Total


$

590,000


$

320,657


$

850,000


$

95,720


$

357,180


$

57


$

5,846


$

2,219,460


Year of

Maturity


Term Note 3(1)


5.5-Year Term Loan


New Revolver(2)


Senior Notes


Mortgages


Interest

Expense(3)


Tenant

Improvement

Allowances(4)


Total


2017


$


$


$

28,000


$


$

677


$

8,842


$

6,627


$

44,146


2018


2,829


34,915


37,744


2019


325,000


3,036


26,907


354,943


2020


8,450


25,459


33,909


2021


13,306


24,537


37,843


Thereafter


250,000


98,500


150,000


30,274


70,467


599,241


Total


$

325,000


$

250,000


$

126,500


$

150,000


$

58,572


$

191,127


$

6,627


$

1,107,826


(a)
The Revolving Credit Facility contains two six-month extension options subject to certain conditions, including the payment of an extension fee equal to 0.0625% of the revolving commitments.
(b)
Interest expense is projected based on the outstanding borrowings and interest rates in effect as of June 30, 2022. This amount includes the impact of interest rate swap agreements.

(1)

We may extend Term Note 3 twice, for a one year period each time, subject to compliance with all covenants and the payment of 0.10% fee.

(2)

We may extend the New Revolver once, for a five month period, subject to compliance with all covenants and the payment of an extension fee equal to 0.0625% of the revolving commitments.

(3)

Interest expense is projected based on the outstanding borrowings and interest rates in effect as of September 30, 2017. This amount includes the impact of interest rate swap agreements. The interest expense projections on the New Revolver include management’s expectation that the $28 million in outstanding borrowings due during 2017 will be replaced with borrowings due January 21, 2022.  

(4)

The tenant improvement allowance is included within the Accounts payable and other liabilities financial statement caption included within the Condensed Consolidated Balance Sheets within this Form 10-Q.

At SeptemberJune 30, 2017,2022 investment in rental property of $91.3$159.5 million iswas pledged as collateral against our mortgages and notes payable.mortgages.

41


Additionally, as of September 30, 2017, we have twoare a party to three separate Tax Protection Agreements (the “Agreements”)tax protection agreements with the contributing members (the “Protected Members”) of twothree distinct UPREIT transactions conducted in November 2015 and February 2016. Subsequent to September 30, 2017, we entered into a thirdthe Founding Owners' Tax Protection Agreement in connection with additional Protected Members through one UPREIT transaction conducted in October 2017.the Internalization. The Agreementstax protection agreements require us to pay monetary damagesindemnify the beneficiaries in the event of a sale, exchange, transfer, or other disposal of the contributed property, and in the case of the Founding Owners' Tax Protection Agreement, the entire Company, in a taxable transaction that would cause a Protected Membersuch beneficiaries to recognize a Protected Gain, as defined ingain that is protected under the Agreements andagreements, subject to certain exceptions. In such an event, we will pay monetary damages to the Protected Members in the amountBased on values as of June 30, 2022, taxable sales of the aggregate federal, state, and local income taxes incurred as a result of the income or gain allocated or recognized by the Protected Member as an outcome of the transaction, subject to certain caps and limitations contained in the Agreements. We are required to allocate to the Protected Members, an amount of nonrecourse liabilities that is at least equal to the Minimum Liability Amount for each Protected Member, as defined in the Agreements. The Minimum Liability Amount and the associated allocation of nonrecourse liabilities are calculated in accordance with applicable tax regulations, are completed at the Operating Company level, and do not represent GAAP accounting. Therefore, there is no impact to the consolidated financial statements included in this Form 10-Q. If the nonrecourse liabilities allocated do not meet the requirement, we will pay monetary damages to the Protected Members in the amount of the aggregate federal, state, and local income taxes incurred as a result of the income or gain allocated or recognized by the Protected Member as an outcome to the default. The maximum aggregate amount we may be liable forproperties would trigger liability under the Agreements isfour agreements of approximately $12.3$22.3 million. Based on information available, we do not believe that the events resulting in damages as detailed above have occurred or are likely to occur in the foreseeable future. Accordingly, we have excluded this commitmentthese commitments from the contractual commitments table above.

ResultsIn the normal course of Operations

For the three months ended September 30, 2017 and 2016

Overview

As of September 30, 2017, our real estate investment portfolio had a net book value of $1.9 billion, consisting of investments in 477 property locations in 37 states and various industries. All of our real estate investment portfolio represents commercial real estate properties subject to long-term leases, and all of our owned properties were subject to a lease as of September 30, 2017. During the three months ended September 30, 2017 and 2016, none of our leases with tenants expired, and all of our leasing activity related to our real estate acquisitions.


Revenues


For the three months ended


September 30,


Increase/


(in thousands)


2017


2016


(Decrease)


Revenues:


Rental income from operating leases


$

43,233


$

34,806


$

8,427


Earned income from direct financing leases


968


1,143


(175

)

Operating expenses reimbursed from tenants


1,995


1,056


939


Other income from real estate transactions


39


5


34


Total revenues


$

46,235


$

37,010


$

9,225


Total revenues increased by $9.2 million, or 24.9%, to $46.2 million for the three months ended September 30, 2017, compared to $37.0 million for the three months ended September 30, 2016. The growth in revenue period-over-period is primarily attributable to the growth in our real estate portfolio. During the three months ended September 30, 2017,business, we closed seven real estate acquisitions and acquired $159.2 million in real estate, excluding capitalized acquisition costs, comprised of 22 new properties. We capitalized approximately $2.4 million in acquisition expenses and $0.8 million in leasing fees as part of the acquisitions. Additionally, subsequent to September 30, 2016 and for the twelve month period ended September 30, 2017, we closed 22 real estate acquisitions and acquired approximately $489.8 million in real estate comprised of 88 new properties, contributing to the growth in current quarter revenue. The rental rates we receive on sale-leaseback transactions and lease assumptions on theenter into various types of properties we target across the United States vary from transactioncommitments to transaction based on many factors, such as the terms of the lease, each property’s real estate fundamentals, and the market rents in the area. The initial contractual cash lease payments on acquisitions during the three months ended September 30, 2017, excluding capitalized acquisition expenses, represented a weighted average capitalization rate of 7.5%.

Operating Expenses


For the three months ended


September 30,


Increase/


(in thousands)


2017


2016


(Decrease)


Operating expenses


Depreciation and amortization


$

15,643


$

12,114


$

3,529


Asset management fees


3,844


2,789


1,055


Property management fees


1,249


1,010


239


Acquisition expenses


2,367


(2,367

)

Property and operating expense


2,009


1,184


825


General and administrative


1,173


598


575


State and franchise tax


301


71


230


Provision for impairment of investment in rental properties


2,608


2,608


Total operating expenses


$

26,827


$

20,133


$

6,694


Depreciation and amortization

Depreciation and amortization increased by $3.5 million, or 29.1%, to $15.6 million for the three months ended September 30, 2017, primarily as a result of the growth in our real estate portfolio. During the three months ended September 30, 2017, we closed seven real estate acquisitions and acquired $159.2 million in real estate, excluding capitalized acquisition costs, comprised of 22 new properties. Additionally, subsequent to September 30, 2016 and for the twelve month period ended September 30, 2017, we closed 22 real estate acquisitions and acquired approximately $489.8 million in real estate comprised of 88 new properties. In addition to the $159.2 million purchase price for acquisitions during the three months ended September 30, 2017, we capitalized $2.4 million in acquisition expenses as the result of adopting ASU 2017-01, Business Combinations (Topic 805): Clarifying the Definition of a Business (“ASU 2017-01”). The capitalized acquisition expenses are capitalized as part of the cost basis of the underlying tangible and intangible assets acquired, and are depreciated over the respective useful lives. For acquisitions made during 2016, we expensed acquisition costs as incurred. We adopted ASU 2017-01 and the respective accounting for acquisition expenses as of January 1, 2017, on a prospective basis, and therefore, this new accounting standard does not impact acquisition costs previously expensed in 2016.

Asset management fees

Asset management fees increased by $1.1 million, or 37.8%, to $3.8 million for the three months ended September 30, 2017. The Asset Manager receives an annual asset management fee equal to 1% of the aggregate value of our equity on a fully diluted basis, based on the Determined Share Value. The increase in asset management fees during the three months ended September 30, 2017 compared to the comparable period in 2016 is a result of an increase in our outstanding equity on a fully diluted basis and the increase in the Determined Share Value.


The $80.00 per share Determined Share Value in effect as of September 30, 2017, reflected an increase of 3.9% from the $77.00 per share Determined Share Value in effect as of September 30, 2016. Additionally, the weighted average number of shares of our common stock and non-controlling membership units of the Operating Company outstanding increased as the result of continued equity capital investments. For the three months ended September 30, 2017, the weighted average number of shares of our common stock and non-controlling membership units of the Operating Company outstanding was 19.1 million, compared to 15.1 million for the three months ended September 30, 2016. The increase in equity capital was used to partially fund the continued growth in our real estate portfolio.

Acquisition expenses

Acquisition expenses decreased by $2.4 million for the three months ended September 30, 2017. Under the terms of the Asset Management Agreement, we pay the Asset Manager an acquisition fee equal to 1% of the gross purchase price paid for each property we acquire (including properties contributed in exchange for membership units in the Operating Company).

We adopted ASU 2017-01 effective January 1, 2017, and under this new accounting standard, we capitalize acquisition expenses as part of the cost basis of the underlying tangible and intangible assets acquired, as opposed to expensing them as incurred. We adopted ASU 2017-01 on a prospective basis. For the three months ended September 30, 2017, we capitalized $2.4 million in acquisition expenses relating to $159.2 million in acquisitions, which approximated the acquisition expenses recognized during the three months ended September 30, 2016.

Provision for impairment of investment in rental properties

During the three months ended September 30, 2017, we recognized $2.6 million of impairment on our investments in rental properties. We review long-lived assets to be held and used for possible impairment when events or changes in circumstances indicate that their carrying amounts may not be recoverable. If and when such events or changes in circumstances are present, an impairment exists to the extent the carrying value of the asset or asset group exceeds the sum of the undiscounted cash flows expected to result from the use of the asset or asset group and its eventual disposition. We recognized impairment on four properties whose carrying amounts we determined were not recoverable. In determining the fair value of the assets at the time of measurement, we utilized capitalization rates ranging from 7.25% to 12%, and a weighted average discount rate of 8%.

Other income (loss)


For the three months ended


September 30,


Increase/


(in thousands)


2017


2016


(Decrease)


Other income (expenses)


Preferred distribution income


$

187


$

181


$

6


Interest income


127


4


123


Interest expense


(9,380

)


(4,576

)


(4,804

)

Cost of debt extinguishment


(1,404

)


(52

)


(1,352

)

Gain on sale of real estate


4,052


2,983


1,069


Interest expense

Interest expense increased $4.8 million, or 105%, to $9.4 million for the three months ended September 30, 2017, from $4.6 million for the three months ended September 30, 2016, due primarily to an increase in long-term borrowings used to partially fund the acquisition of properties for our growing real estate investment portfolio. Our total outstanding debt, excluding capitalized debt issuance costs, increased from $831.3 million at September 30, 2016, to $910.1 million at September 30, 2017. Additionally, during the three months ended September 30, 2016, we recognized approximately $3.0 million of interest rate swap ineffectiveness, which resulted in a reduction of interest expense. Ineffectiveness during the three months ended September 30, 2016 was attributable to inconsistencies in certain terms between the interest rate swaps and the loan agreements for the Term Notes and Revolver. The interest rate swaps continued to qualify for hedge accounting, with the effective portion of mark-to-market adjustments included in accumulated other comprehensive income. During the fourth quarter of 2016, we amended the terms of the credit agreements, thereby reversing the impact of the ineffectiveness and rendering a $0 full year 2016 impact to the consolidated income statement. We did not recognize any ineffectiveness on our interest rate swaps during the three months ended September 30, 2017.


Cost of debt extinguishment

The cost of debt extinguishment represents the difference between the price paid to extinguish the debt compared to the carrying value of the debt, plus any unamortized debt issuance costs at the time of extinguishment. To the extent that the price paid to extinguish the debt is greater than the carrying value of debt, we would recognize a loss (cost) on extinguishment. The loss would be increased by the amount of previously capitalized debt issuance costs that remain unamortized at the time of extinguishment. These amounts fluctuate period-over-period based on the variability in the interest rate environment, changes in financial institutions’ credit standards, and our activity in capital markets to manage our leverage position. Cost of debt extinguishment increased by $1.4 million, to $1.4 million for the three months ended September 30, 2017, from $0.1 million for the three months ended September 30, 2016. The fluctuation is a direct result of a $1.4 million prepayment penalty recognized on the extinguishment of a mortgage, with no similar activity during the three months ended September 30, 2016.

Gain on sale of real estate

During the three months ended September 30, 2017, we recognized a $4.1 million gain on the sale of real estate, compared to a gain of $3.0 million for the three months ended September 30, 2016. During the three months ended September 30, 2017 and 2016, we sold four properties and two properties, respectively. Our recognition of a gain or loss on the sale of real estate varies from transaction to transaction based on fluctuations in asset prices and demand in the real estate market.

For the nine months ended September 30, 2017 and 2016

Overview

As of September 30, 2017, our real estate investment portfolio had grown to a net book value of $1.9 billion, consisting of investments in 477 property locations in 37 states and various industries. All of our real estate investment portfolio represents commercial real estate properties subject to long-term leases, and all of our owned properties were subject to a lease as of September 30, 2017. During the nine months ended September 30, 2017 and 2016, none of our leases expired, and all of our leasing activity related to our real estate acquisitions.

Revenues


For the nine months ended


September 30,


Increase/


(In thousands)


2017


2016


(Decrease)


Revenues:


Rental income from operating leases


$

123,890


$

96,779


$

27,111


Earned income from direct financing leases


3,175


3,406


(231

)

Operating expenses reimbursed from tenants


4,908


3,059


1,849


Other income from real estate transactions


117


176


(59

)

Total revenues


$

132,090


$

103,420


$

28,670


Total revenues increased by $28.7 million, or 27.7%, to $132.1 million for the nine months ended September 30, 2017, compared to $103.4 million for the nine months ended September 30, 2016. The growth in revenue year over year is primarily attributable to the growth in our real estate portfolio. During the nine months ended September 30, 2017, we closed 14 real estate acquisitions and acquired $352.0 million in real estate comprised of 70 new properties. We capitalized approximately $6.6 million in acquisition expenses and $2.6 million in leasing fees as part of the acquisitions. Additionally, subsequent to September 30, 2016 and for the three month period ended December 31, 2016, we closed eight real estate acquisitions and acquired approximately $137.8 million in real estate comprised of 17 new properties. The rental rates we receive on sale-leaseback transactions and lease assumptions on the various types of properties we target across the United States vary from transaction to transaction based on many factors, such as the terms of the lease, each property’s real estate fundamentals, and the market rents in the area. The initial contractual cash lease payments on acquisitions during the nine months ended September 30, 2017, excluding capitalized acquisition expenses, represented a weighted average capitalization rate of 7.4%.


Operating Expenses


For the nine months ended


September 30,


Increase/


(in thousands)


2017


2016


(Decrease)


Operating expenses:


Depreciation and amortization


$

44,969


$

33,273


$

11,696


Asset management fees


10,666


7,770


2,896


Property management fees


3,635


2,868


767


Acquisition expenses


8,256


(8,256

)

Property and operating expense


4,710


3,005


1,705


General and administrative


3,297


1,951


1,346


State and franchise tax


511


181


330


Provision for impairment of investment in rental properties


2,608


2,608


Total operating expenses


$

70,396


$

57,304


$

13,092


Depreciation and amortization

Depreciation and amortization increased by $11.7 million, or 35.2%, to $45.0 million for the nine months ended September 30, 2017, primarily as a result of the growth in our real estate portfolio. During the nine months ended September 30, 2017, we acquired $352.0 million in real estate comprised of 70 new properties. In addition to the $352.0 million purchase price for acquisitions during the nine months ended September 31, 2017, we capitalized $6.6 million in acquisition expenses as the result of adopting ASU 2017-01. The capitalized acquisition expenses are capitalized as part of the cost basis of the underlying tangible and intangible assets acquired, and are depreciated over their respective useful lives. For acquisitions made during 2016, we expensed acquisition costs as incurred. We adopted ASU 2017-01 and the respective accounting for acquisition expenses as of January 1, 2017, on a prospective basis, and therefore, this new accounting standard does not impact acquisition costs previously expensed in 2016.

Asset management fees

Asset management fees increased by $2.9 million, or 37.3%, to $10.7 million for the nine months ended September 30, 2017. The Asset Manager receives an annual asset management fee equal to 1% of the aggregate value of our equity on a fully diluted basis based on the Determined Share Value. The increase in asset management fees during 2016 is a result of an increase in the equity on a fully diluted basis and the increase in the Determined Share Value.

The $80.00 per share Determined Share Value in effect as of September 30, 2017, reflected an increase of 3.9% from the $77.00 per share Determined Share Value in effect as of September 30, 2016. Additionally, the weighted average number of shares of our common stock and non-controlling membership units of the Operating Company outstanding increased as the result of continued equity capital investments. For the nine months ended September 30, 2017, the weighted average number of shares of our common stock and non-controlling membership units of the Operating Company outstanding was 18.1 million compared to 14.2 million for the nine months ended September 30, 2016. The increase in equity capital was used to partially fund the continued growth in our real estate portfolio.

Acquisition expenses

Acquisition expenses decreased by $8.3 million for the nine months ended September 30, 2017. Under the terms of the Asset Management Agreement, we pay the Asset Manager an acquisition fee equal to 1% of the gross purchase price paid for each property we acquire (including properties contributed in exchange for membership units in the Operating Company).

We adopted ASU 2017-01 effective January 1, 2017, and under this new accounting standard, we capitalize acquisition expenses as part of the cost basis of the underlying tangible and intangible assets acquired, as opposed to expensing them as incurred. We adopted ASU 2017-01 on a prospective basis. For the nine months ended September 30, 2017, we capitalized $6.6 million in acquisition expenses relating to $352.0 million in acquisitions. The $1.7 million decrease in acquisition expenses incurred during the comparable periods relates to a decrease in acquisition activity. During the nine months ended September 30, 2016, we acquired $381.0 million in real estate.

Property and operating expense

Property and operating expense increased by $1.7 million, or 56.7%, to $4.7 million for the nine months ended September 30, 2017. The increase is attributable to an increase in the number of properties we own, whereby we are responsible for engaging a third party property manager to manage the respective ongoing property maintenance. These expenses are paid by us and reimbursed by the tenant under the terms of the respective leases. There was a corresponding increase in the operating expenses reimbursed by tenants revenue balance.


General and administrative

General and administrative expenses increased by $1.3 million, or 69.0% to $3.3 million for the nine months ended September 30, 2017. The increase is primarily attributable to increased fees for costs and services associated with becoming a public reporting entity in accordance with Section 12(g) of the Exchange Act.

Provision for impairment of investment in rental properties

During the nine months ended September 30, 2017, we recognized $2.6 million of impairment on our investments in rental properties. We review long-lived assets to be held and used for possible impairment when events or changes in circumstances indicate that their carrying amounts may not be recoverable. If and when such events or changes in circumstances are present, an impairment exists to the extent the carrying value of the asset or asset group exceeds the sum of the undiscounted cash flows expected to result from the use of the asset or asset group and its eventual disposition. We recognized impairment on four properties whose carrying amounts we determined were not recoverable. In determining the fair value of the assets at the time of measurement, we utilized capitalization rates ranging from 7.25% to 12%, and a weighted average discount rate of 8%.

Other income (loss)


For the nine months ended


September 30,


Increase/


(in thousands)


2017


2016


(Decrease)


Other revenue (expenses)


Preferred distribution income


$

550


$

531


$

19


Interest income


354


9


345


Interest expense


(25,182

)


(24,166

)


(1,016

)

Cost of debt extinguishment


(5,019

)


(105

)


(4,914

)

Gain on sale of real estate


10,332


4,089


6,243


Interest expense

Interest expense increased $1.0 million, or 4.2%, to $25.2 million for the nine months ended September 30, 2017, from $24.2 million for the nine months ended September 30, 2016, due primarily to an increase in long-term borrowings used to partially fund the acquisition of properties for our growing real estate investment portfolio. Our total outstanding debt, excluding capitalized debt issuance costs, increased from $831.3 million at September 30, 2016, to $910.1 million at September 30, 2017.

The increase in outstanding debt was slightly offset by $2.2 million in ineffectiveness recognized on interest rate swaps during the nine months ended September 30, 2016 that was not recognized during the nine months ended September 30, 2017. Ineffectiveness during the nine months ended September 30, 2016 was attributable to inconsistencies in certain terms between the interest rate swaps and the loan agreements for the Term Notes and Revolver. The interest rate swaps continued to qualify for hedge accounting, with the effective portion of mark-to-market adjustments included in accumulated other comprehensive income. During the fourth quarter of 2016, we amended the terms of the credit agreements, thereby reversing the impact of the ineffectiveness and rendering a $0 full year 2016 impact to the consolidated income statement. The increase in interest expense was also offset by a $1.2 million decrease in interest expense during the nine months ended September 30, 2017 related to the termination of an interest rate swap that occurred concurrent with the paydown of a mortgage.

Cost of debt extinguishment

The cost of debt extinguishment represents the difference between the price paid to extinguish the debt compared to the carrying value of the debt, plus any unamortized debt acquisition costs at the time of extinguishment. To the extent that the price paid to extinguish the debt is greater than the carrying value of debt, we would recognize a loss (cost) on extinguishment. The loss would be increased by the amount of previously capitalized debt acquisition costs that remain unamortized at the time of extinguishment. These amounts fluctuate period-over-period based on the variability in the interest rate environment, changes in financial institutions’ credit standards, and our activity in capital markets to manage our leverage position. Cost of debt extinguishment increased by $4.9 million, to $5.0 million for the nine months ended September 30, 2017, from $0.1 million for the nine months ended September 30, 2016. The fluctuation is a direct result of the $800 million Credit Facility we closed on June 23, 2017, prior to quarter end, together with the corresponding extinguishment of the Revolver, Term Note 1, and Term Note 2, with no similar activity during the nine months ended September 30, 2016.


Gain on sale of real estate

During the nine months ended September 30, 2017, we recognized a $10.3 million gain on the sale of real estate, compared to a gain of $4.1 million for the nine months ended September 30, 2016. During the nine months ended September 30, 2017 and 2016 we sold ten properties and four properties, respectively. Our recognition of a gain or loss on the sale of real estate varies from transaction to transaction based on fluctuations in asset prices and demand in the real estate market.

Net Income and Non-GAAP Measures (FFO and AFFO)

Our reported results and net earnings per dilutive share are presented in accordance with GAAP. We also disclose FFO and AFFO, each of which are non-GAAP measures. We believe the use of FFO and AFFO are useful to investors because they are widely accepted industry measures used by analysts and investors to compare the operating performance of REITs. FFO and AFFO should not be considered alternatives to net income as a performance measure or to cash flows from operations, as reported on our statement of cash flows, or as a liquidity measure and should be considered in addition to, and not in lieu of, GAAP financial measures.

We compute FFO in accordance with the standards established by the 2002 White Paper on FFO approved by the Board of Governors of the National Association of Real Estate Investment Trusts (“NAREIT”). NAREIT defines FFO as GAAP net income or loss adjusted to exclude net gains (losses) from sales of depreciated real estate assets, depreciation and amortization expense from real estate assets, and impairment charges related to previously depreciated real estate assets. To derive AFFO, we modify the NAREIT computation of FFO to include other adjustments to GAAP net income related to certain non-cash revenues and expenses, including straight-line rents, cost of debt extinguishments, acquisition expenses, amortization of lease intangibles, amortization of debt issuance costs, amortization of net mortgage premiums, (gain) loss on interest rate swaps, extraordinary items and other specified non-cash items. We believe that such items are not a result of normal operations and thus we believe excluding such items assists management and investors in distinguishing whether changes in our operations are due to growth or decline of operations at our properties or from other factors.

Our leases include rents that increase over the term of the lease to compensate us for anticipated increases in market rentals over time. Our leases do not include significant front-loading or back-loading of payments or significant rent-free periods. Therefore, we find it useful to evaluate rent on a contractual basis as it allows for comparison of existing rental rates to market rental rates. Additionally, we exclude transaction costs associated with acquiring real estate subject to existing leases, including the amortization of lease intangibles, as well as acquisition expenses paid to our Asset Manager that are based on a percentage of the gross acquisition purchase price. We exclude these costs from AFFO because they are upfront expenses that are recognized in conjunction with an acquisition, and therefore, are not indicative of ongoing operational results of the portfolio. We believe excluding acquisition expenses provides investors a view of the performance of our portfolio over time. In connection with our adoption of ASU 2017-01, effective January 1, 2017 and on a prospective basis, we capitalize all acquisition expenses as part of the cost-basis of the tangible and intangible assets acquired. Therefore, effective January 1, 2017, we will no longer adjust for acquisition expenses in our AFFO computation. We also exclude the amortization of debt issuance costs and net mortgage premiums as they are not indicative of ongoing operational results of the portfolio. We use AFFO as a measure of our performance when we formulate corporate goals.

FFO is used by management, investors and analysts to facilitate meaningful comparisons of operating performance between periods and among our peers, primarily because it excludes the effect of real estate depreciation and amortization and net gains on sales, which are based on historical costs and implicitly assume that the value of real estate diminishes predictably over time, rather than fluctuating based on existing market conditions. We believe that AFFO is a useful supplemental measure for investors to consider because it will help them to better assess our operating performance without the distortions created by non-cash revenues or expenses. FFO and AFFO may not be comparable to similarly titled measures employed by other REITs, and comparisons of our FFO and AFFO with the same or similar measures disclosed by other REITs may not be meaningful.

Neither the SEC or any other regulatory body has passed judgment on the acceptability of the adjustments that we use to calculate FFO and AFFO. In the future, the SEC, NAREIT or another regulatory body may decide to standardize the allowable adjustments across the REIT industry and in response to such standardization we may have to adjust our calculation and characterization of FFO and AFFO accordingly.


Net Income, FFO, and AFFO for the three months ended September 30, 2017 and 2016

The following table presents our net income and our non-GAAP FFO and AFFO for the three months ended September 30, 2017 and 2016. Our measures of FFO and AFFO are computed on the basis of amounts attributable to both us and non-controlling interests. As the non-controlling interests share in our net income on a one-for-one basis, the basic and diluted per share amounts are the same.


For the three months ended


September 30,


Increase/


(in thousands, except per share data)


2017


2016


Decrease


Net income


$

12,990


$

15,417


$

(2,427

)

Net earnings per diluted share


0.68


1.02


(0.34

)

FFO


27,189


24,548


2,641


FFO per diluted share


1.42


1.63


(0.21

)

AFFO


24,813


20,476


4,337


AFFO per diluted share


1.30


1.36


(0.06

)

Diluted WASO(1)


19,147


15,074


(1)

Weighted average number of shares of our common stock and membership units in the Operating Company outstanding (“WASO”), computed in accordance with GAAP

Net income

Net income decreased by $2.4 million, or 15.7%, to $13.0 million for the three months ended September 30, 2017, compared to $15.4 million for the three months ended September 30, 2016. Net earnings per diluted share decreased by $0.34 during the same period, down to $0.68 per share. The decrease in net income is primarily attributable to $2.6 million of asset impairment charges recognized during the three months ended September 30, 2017, with no impairment recognized during the three months ended September 30, 2016. The decrease in net income was partially offset by our investments in real estate properties. During the three months ended September 30, 2017, we closed seven real estate acquisitionsThese commitments are generally subject to our customary due diligence process and, acquired $159.2 million in real estate, excluding capitalized acquisition costs, comprised of 22 new properties. Additionally, subsequent to September 30, 2016 and for the twelve month period ended September 30, 2017, we closed 22 real estate acquisitions and acquired approximately $489.8 million in real estate comprised of 88 new properties.

The fluctuation in net income was also impacted by acquisition expenses. During the three months ended September 30, 2016 we recognized $2.4 million in acquisition expenses. We adopted ASU 2017-01 effective January 1, 2017, and under this new accounting standard, we capitalize acquisition expenses as part of the cost basis of the underlying assets acquired, as opposed to expensing them as incurred. We adopted ASU 2017-01 onaccordingly, a prospective basis. For the three months ended September 30, 2017, we capitalized $2.4 million in acquisition expenses relating to $159.2 million in acquisitions. As such, net income for the three months ended September 30, 2016 was impacted by acquisition expenses, however, net income for the three months ended September 30, 2017 was not. The impact of capitalizing acquisition expenses during the three months ended September 30, 2017 was partially offset by increased depreciation expense relating to the capitalized costs.

The fluctuation in net income for the three months ended September 30, 2017 was also impacted by a $4.1 million gain on the sale of real estate, representing a $1.1 million increase as compared to the three months ended September 30, 2016.  

Earnings per share were further impacted by a 4.1 million increase in the diluted weighted average number of shares of our common stock outstanding as a result of ongoing equity raises.specific conditions must be met before we are obligated to purchase the properties.

FFODerivative Instruments and Hedging Activities

FFO increased by $2.6 million, or 10.8%, to $27.2 million for the three months ended September 30, 2017, compared to $24.5 million for the three months ended September 30, 2016. FFO per diluted share decreased by $0.21 during the same period to $1.42 per share. The increase in FFO is primarily driven by increased revenue year over year as a result of growth in our real estate investment portfolio, as discussed for net income above. Additionally, we added back $2.6 million of asset impairment charges recognized during the three months ended September 30, 2017, which were not recognized during the three months ended September 30, 2016.

Consistent with the decrease in net earnings per diluted share, the increase in FFO was more than offset by a 4.1 million increase in the diluted weighted average number of shares of our common stock outstanding as a result of ongoing equity raises.


AFFO

AFFO increased by $4.3 million, or 21.2%, to $24.8 million for the three months ended September 30, 2017, compared to $20.5 million for the three months ended September 30, 2016. AFFO per diluted share decreased by $0.06 during the same period to $1.30 per diluted share.

The period-over-period growth in AFFO was $1.7 million greater than the comparable growth in FFO, primarily as a result of a $3.0 million gain on interest rate swaps and other non-cash interest expense recognized during the three months ended September 30, 2016, which is subtracted from FFO in the AFFO calculation. We did not recognize a gain or loss on interest rate swaps and other non-cash interest expense during the three months ended September 30, 2017. Additionally, AFFO during the three months ended September 30, 2017 was reduced by $1.4 million of debt extinguishment costs, compared to $0.1 million of debt extinguishment costs recognized during the three months ended September 30, 2016. These increases were partially offset by a reduction in the addback for acquisition expenses. During the three months ended September 30, 2016, we added back $2.4 million in acquisition expenses in our AFFO calculation. For the three months ended September 30, 2017, we capitalized all acquisition expenses to the cost basis of the real estate acquired. The capitalized acquisition expenses, beginning in 2017, result in increased depreciation expenses, which is an add-back in the FFO computation. Accordingly, our capitalization of acquisition expenses has no net impact to AFFO.    

Consistent with the decrease in net earnings per diluted share, the increase in AFFO was more than offset by a 4.1 million increase in the diluted weighted average number of shares of our common stock outstanding as a result of ongoing equity raises.

Net Income, FFO, and AFFO for the nine months ended September 30, 2017 and 2016

The following table presents our net income and our non-GAAP FFO and AFFO for the nine months ended September 30, 2017 and 2016. Our measures of FFO and AFFO are computed on the basis of amounts attributable to both us and non-controlling interests. As the non-controlling interests share in our net income on a one-for-one basis, the basic and diluted per share amounts are the same.


For the nine months ended


September 30,


Increase/


(in thousands, except per share data)


2017


2016


Decrease


Net income


$

42,729


$

26,474


$

16,255


Net earnings per diluted share


2.36


1.87


0.49


FFO


79,974


55,658


24,316


FFO per diluted share


4.43


3.93


0.50


AFFO


72,946


57,093


15,853


AFFO per diluted share


4.04


4.03


0.01


Diluted WASO


18,069


14,154


Net income

Net income increased by $16.3 million, or 61.4%, to $42.7 million for the nine months ended September 30, 2017, compared to $26.5 million for the nine months ended September 30, 2016. Net earnings per diluted share increased by $0.49 during the same period, up to $2.36 per share. The increase in net income and earnings per share is attributable to accretive investments in real estate properties made during 2017, coupled with the annualized revenue streams from the real estate investments made during the nine months ended September 30, 2016. We added $352.0 million and $381.0 million in real estate investments during the nine months ended September 30, 2017 and 2016, respectively.

In increase in net income was also impacted by acquisition expenses. During the nine months ended September 30, 2016 we recognized $8.3 million in acquisition expenses. We adopted ASU 2017-01 effective January 1, 2017, and under this new accounting standard, we capitalize acquisition expenses as part of the cost basis of the underlying assets acquired, as opposed to expensing them as incurred. We adopted ASU 2017-01 on a prospective basis. For the nine months ended September 30, 2017, we capitalized $6.6 million in acquisition expenses relating to $352.0 million in acquisitions. As such, net income for the nine months ended September 30, 2016 was impacted by acquisition expenses, however, net income for the nine months ended September 30, 2017 was not. The impact of capitalizing acquisition expenses during the nine months ended September 30, 2017 was partially offset by increased depreciation expense relating to the capitalized costs.

The increase in net income for the nine months ended September 30, 2016 was also impacted by a $10.3 million gain on the sale of real estate, representing a $6.2 million increase as compared to the nine months ended September 30, 2016.  

The increase in net income in the earnings per share computation was partially offset by a 3.9 million increase in the diluted weighted average number of shares of our common stock outstanding as a result of ongoing equity raises.


FFO

FFO increased by $24.3 million, or 43.7%, to $80.0 million for the nine months ended September 30, 2017, compared to $55.7 million for the nine months ended September 30, 2016. FFO per diluted share increased by $0.50 during the same period to $4.43 per share. The increase in FFO is primarily driven by increased revenue period-over-period as the result of growth in our real estate investment portfolio. We added $352.0 million in real estate investments during the nine months ended September 30, 2017. Growth in FFO per diluted share was less than growth in net earnings per diluted share primarily as a result of a $10.3 million gain on sale of real estate recognized in net income during the nine months ended September 30, 2017, which was adjusted and excluded in the FFO computation.

AFFO

AFFO increased by $15.9 million, or 27.8%, to $72.9 million for the nine months ended September 30, 2017, compared to $57.1 million for the nine months ended September 30, 2016. AFFO per diluted share increased by $0.01 during the same period to $4.04 per diluted share.

AFFO per diluted share growth of $0.01 as compared to FFO per diluted share growth of $0.50 was primarily impacted by acquisition expenses. During the nine months ended September 30, 2016, we recognized $8.3 million in acquisition expenses that were added back to FFO in computing AFFO. For the nine months ended September 30, 2017, we capitalized all acquisition expenses to the cost basis of the real estate acquired. The capitalized acquisition expenses, beginning in 2017, result in increased depreciation expenses, which is an add-back in the FFO computation. AFFO per diluted share growth as compared to FFO per diluted share growth was also impacted by the (gain) loss on interest rate swaps and other non-cash interest expense. During the nine months ended September 30, 2016, we recognized an add-back of $2.2 million, compared to a deduction of $1.3 million for the nine months ended September 30, 2017. These impacts were offset by a $4.9 million increase in the add-back for the cost of debt extinguishment. During the nine months ended September 30, 2017 we recognized $5.0 million in debt extinguishment costs, compared to $0.1 million for the nine months ended September 30, 2016.  

Reconciliation of Non-GAAP Measures

The following is a reconciliation of net income to FFO and AFFO for the three and nine months ended September 30, 2017 and 2016. Also presented is information regarding distributions paid to common stockholders and non-controlling interests and the weighted average number of shares of our common stock and non-controlling membership units of the Operating Company used for the basic and diluted computation per share:


For the three months ended


For the nine months ended


(in thousands, except per share data)


September 30,


September 30,


2017


2016


2017


2016


Net income


$

12,990


$

15,417


$

42,729


$

26,474


Real property depreciation and amortization


15,643


12,114


44,969


33,273


Gain on sale of real estate


(4,052

)


(2,983

)


(10,332

)


(4,089

)

Asset impairment


2,608


2,608


FFO


$

27,189


$

24,548


$

79,974


$

55,658


Capital improvements / reserves


(49

)


(49

)


(147

)


(147

)

Straight line rent adjustment


(4,520

)


(3,759

)


(12,585

)


(9,761

)

Cost of debt extinguishment


1,404


52


5,019


105


Amortization of debt issuance costs


486


456


1,343


1,279


Amortization of net mortgage premiums


205


(48

)


135


(143

)

(Gain) Loss on interest rate swaps and other non-cash interest expense


(2,991

)


(1,280

)


2,219


Amortization of lease intangibles


99


(100

)


487


(373

)

Acquisition expenses


2,367


8,256


AFFO


$

24,813


$

20,476


$

72,946


$

57,093


Diluted WASO


19,147


15,074


18,069


14,154


Net earnings per share, basic and diluted


$

0.68


$

1.02


$

2.36


$

1.87


FFO per diluted share


1.42


1.63


4.43


3.93


AFFO per diluted share


$

1.30


$

1.36


$

4.04


$

4.03


Critical Accounting Policies

This Management’s Discussion and Analysis of Financial Condition and Results of Operations is based upon our consolidated financial statements, which have been prepared in accordance with GAAP. The preparation of these consolidated financial statements requires management to make estimates and judgments that affect the reported amounts of assets, liabilities, revenues and expenses. Management bases its estimates on historical experience and assumptions that are believed to be reasonable under the circumstances, the results of which form the basis for making judgments about carrying value of assets and liabilities that are not readily apparent from other sources. Actual results may differ from these estimates under different assumptions or conditions. We believe there have been no significant changes during the nine months ended September 30, 2017 to the items that we disclosed as our critical accounting policies and estimates under Item 2. “Financial Information - Management’s Discussion and Analysis of Financial Condition and Results of Operations,” in our Form 10.

Impact of Recent Accounting Pronouncements

For information on the impact of recent accounting pronouncements on our business, see Note 2 of the notes to the condensed consolidated financial statements included in this Form 10-Q.

Item 3.

Quantitative and Qualitative Disclosures About Market Risk

We are exposed to interest rate risk arising from changes in interest rates on the floating rate indebtednessfloating-rate borrowings under our unsecured credit facilities and a certain mortgages.mortgage. Borrowings pursuant to our unsecured credit facilities and floating-rate mortgages bear interest at floating rates based on LIBOR plus thean applicable margin. Accordingly, fluctuations in market interest rates may increase or decrease our interest expense, which will in turn, increase or decrease our net income and cash flow.

We attempt to manage a portion of ourthe interest rate risk on variable rate borrowings by entering into interest rate swap agreements. Ourswaps. As of June 30, 2022, we had 28 interest rate risk management strategy is intended to stabilize cash flow requirements by maintaining interest rate swap agreements to convert certain variable rate debt to a fixed rate. As of September 30, 2017, we had 24 interest rate swap agreementsswaps outstanding within an aggregate notional amount of $640$717.7 million. Under these agreements, we receive monthly payments from the counterparties equal to the related variable interest rates multiplied by the outstanding notional amounts. In turn, we pay the counterparties each month an amount equal to a fixed interest rate multiplied by the related outstanding notional amounts. The intended net impact of these transactions is that we pay a fixed interest rate on our variable ratevariable-rate borrowings. The interest rate swaps have been designated by us as effective cash flow hedges for accounting purposes and are reported at fair value. We assess, both at inception and on an ongoing basis, the effectiveness of our qualifying cash flow hedges. We have not entered, and do not intend to enter, into derivative or interest rate transactions for speculative purposes.

In addition, we own investments in Canada, and as a result are subject to risk from the effects of exchange rate movements in the Canadian dollar, which may affect future costs and cash flows. We funded a significant portion of our Canadian investments through Canadian dollar borrowings under our Revolving Credit Facility, which is intended to act as a natural hedge against our Canadian dollar investments. The Canadian dollar revolving borrowings are remeasured each reporting period, with the unrealized foreign currency gains and losses flowing through earnings. These unrealized foreign currency gains and losses do not impact our cash flows from operations until settled, and are expected to directly offset the changes in the value of our net investments as a result of changes in the Canadian dollar. Our Canadian investments are recorded at their historical exchange rates, and therefore are not impacted by changes in the value of the Canadian dollar.

Cash Flows

Cash and cash equivalents and restricted cash totaled $29.0 million and $87.0 million at June 30, 2022 and June 30, 2021, respectively. The table below summarizesshows information concerning cash flows for the termssix months ended June 30, 2022 and 2021:


For the Six Months Ended


June 30,


June 30,


(In thousands)


2022


2021


Net cash provided by operating activities


$

117,959


$

99,015


Net cash used in investing activities


(379,971

)


(242,712

)

Net cash provided by financing activities


263,219


119,977


Increase (decrease) in cash and cash equivalents and restricted cash


$

1,207


$

(23,720

)

The increase in net cash provided by operating activities during the six months ended June 30, 2022 as compared to the six months ended June 30, 2021, was mainly due to growth in our real estate portfolio and associated incremental net lease revenues.

The increase in cash used in investing activities during the six months ended June 30, 2022 as compared to the six months ended June 30, 2021, was mainly due to increased acquisition volume and decreased disposition volume during the six months ended June 30, 2022.

The increase in net cash provided by financing activities during the six months ended June 30, 2022 as compared to the six months ended June 30, 2021, mainly reflects an increased borrowings on the unsecured revolving credit facility to fund the increased acquisition volume.

42


Non-GAAP Measures

FFO, Core FFO, and AFFO

We compute Funds From Operations ("FFO") in accordance with the standards established by the Board of Governors of Nareit, the current swap agreements relatingworldwide representative voice for REITs and publicly traded real estate companies with an interest in the U.S. real estate and capital markets. Nareit defines FFO as GAAP net income or loss adjusted to exclude net gains (losses) from sales of certain depreciated real estate assets, depreciation and amortization expense from real estate assets, gains and losses from change in control, and impairment charges related to certain previously depreciated real estate assets. FFO is used by management, investors, and analysts to facilitate meaningful comparisons of operating performance between periods and among our unsecured credit facilities. Severalpeers, primarily because it excludes the effect of real estate depreciation and amortization and net gains (losses) on sales, which are based on historical costs and implicitly assume that the value of real estate diminishes predictably over time, rather than fluctuating based on existing market conditions.

We compute Core Funds From Operations ("Core FFO") by adjusting FFO, as defined by Nareit, to exclude certain GAAP income and expense amounts that we believe are infrequently recurring, unusual in nature, or not related to its core real estate operations, including write-offs or recoveries of accrued rental income, lease termination fees, the change in fair value of our earnout liability, cost of debt extinguishments, unrealized and realized gains or losses on foreign currency transactions, severance, and other extraordinary items. Exclusion of these items from similar FFO-type metrics is common within the equity REIT industry, and management believes that presentation of Core FFO provides investors with a metric to assist in their evaluation of our operating performance across multiple periods and in comparison to the operating performance of our peers, because it removes the effect of unusual items that are not expected to impact our operating performance on an ongoing basis.

We compute Adjusted Funds From Operations ("AFFO"), by adjusting Core FFO for certain non-cash revenues and expenses, including straight-line rents, amortization of lease intangibles, amortization of debt issuance costs, amortization of net mortgage premiums, (gain) loss on interest rate swaps agreements set forthand other non-cash interest expense, stock-based compensation, and other specified non-cash items. We believe that excluding such items assists management and investors in distinguishing whether changes in our operations are due to growth or decline of operations at our properties or from other factors. We use AFFO as a measure of our performance when we formulate corporate goals, and is a factor in determining management compensation. We believe that AFFO is a useful supplemental measure for investors to consider because it will help them to better assess our operating performance without the distortions created by non-cash revenues or expenses.

Specific to our adjustment for straight-line rents, our leases include cash rents that increase over the term of the lease to compensate us for anticipated increases in market rental rates over time. Our leases do not include significant front-loading or back-loading of payments, or significant rent-free periods. Therefore, we find it useful to evaluate rent on a contractual basis as it allows for comparison of existing rental rates to market rental rates. In situations where we granted short-term rent deferrals as a result of the COVID-19 pandemic, and such deferrals were probable of collection and expected to be repaid within a short term, we continued to recognize the same amount of GAAP lease revenues each period. Consistent with GAAP lease revenues, the short-term deferrals associated with COVID-19, and the corresponding payments, did not impact our AFFO.

FFO, Core FFO, and AFFO may not be comparable to similarly titled measures employed by other REITs, and comparisons of our FFO, Core FFO and AFFO with the same or similar measures disclosed by other REITs may not be meaningful.

Neither the SEC nor any other regulatory body has passed judgment on the acceptability of the adjustments to FFO that we use to calculate Core FFO and AFFO. In the future, the SEC, Nareit or another regulatory body may decide to standardize the allowable adjustments across the REIT industry and in response to such standardization we may have to adjust our calculation and characterization of Core FFO and AFFO accordingly.

43


The following table reconciles net income (which is the most comparable GAAP measure) to FFO, Core FFO, and AFFO:


For the Three Months Ended


For the Six Months Ended


(in thousands, except per share data)


June 30,
2022


March 31,
2022


June 30,
2022


June 30,
2021


Net income


$

35,552


$

28,441


$

63,993


$

46,780


Real property depreciation and amortization


35,479


34,259


69,738


61,892


Gain on sale of real estate


(4,071

)


(1,196

)


(5,267

)


(8,571

)

Provision for impairment on investment in rental properties


1,380


1,380


2,012


FFO


$

68,340


$

61,504


$

129,844


$

102,113


Net write-offs of accrued rental income


1,326


1,326


442


Cost of debt extinguishment


126


Severance


278


120


398


1,275


Change in fair value of earnout liability


4,480


Other (income) expenses (a)


(2,632

)


1,126


(1,506

)


(14

)

Core FFO


$

65,986


$

64,076


$

130,062


$

108,422


Straight-line rent adjustment


(4,965

)


(4,934

)


(9,899

)


(10,053

)

Adjustment to provision for credit losses


(1

)


(1

)


(1

)

Amortization of debt issuance costs


900


856


1,756


1,870


Amortization of net mortgage premiums


(25

)


(27

)


(52

)


(72

)

Loss (gain) on interest rate swaps and other non-cash interest expense


695


659


1,354


(83

)

Amortization of lease intangibles


(1,167

)


(1,158

)


(2,325

)


(1,369

)

Stock-based compensation


1,381


929


2,310


2,720


AFFO


$

62,804


$

60,401


$

123,205


$

101,434


(a)
Amount includes ($2.6) million and $1.1 million of unrealized and realized foreign exchange (gain) loss during the three months ended June 30, 2022 and March 31, 2022, respectively, and ($1.5) million of unrealized foreign exchange (gain) for the six months ended June 30, 2022, primarily associated with our CAD denominated revolving borrowings.

44


EBITDA, EBITDAre, Adjusted EBITDAre and Annualized Adjusted EBITDAre

We compute EBITDA as earnings before interest, income taxes and depreciation and amortization. EBITDA is a measure commonly used in our industry. We believe that this ratio provides investors and analysts with a measure of our performance that includes our operating results unaffected by the differences in capital structures, capital investment cycles and useful life of related assets compared to other companies in our industry. We compute EBITDAre in accordance with the definition adopted by Nareit, as EBITDA excluding gains (losses) from the sales of depreciable property and provisions for impairment on investment in real estate. We believe EBITDA and EBITDAre are useful to investors and analysts because they provide important supplemental information about our operating performance exclusive of certain non-cash and other costs. EBITDA and EBITDAre are not measures of financial performance under GAAP, and our EBITDA and EBITDAre may not be comparable to similarly titled measures of other companies. You should not consider our EBITDA and EBITDAre as alternatives to net income or cash flows from operating activities determined in accordance with GAAP.

We are focused on a disciplined and targeted acquisition strategy, together with active asset management that includes selective sales of properties. We manage our leverage profile using a ratio of Net Debt to Annualized Adjusted EBITDAre, each discussed further below, which we believe is a useful measure of our ability to repay debt and a relative measure of leverage, and is used in communications with our lenders and rating agencies regarding our credit rating. As we fund new acquisitions using our unsecured Revolving Credit Facility, our leverage profile and Net Debt will be immediately impacted by current quarter acquisitions. However, the full benefit of EBITDAre from newly acquired properties will not be received in the same quarter in which the properties are acquired. Additionally, EBITDAre for the quarter includes amounts generated by properties that have been sold during the quarter. Accordingly, the variability in EBITDAre caused by the timing of our acquisitions and dispositions can temporarily distort our leverage ratios. We adjust EBITDAre ("Adjusted EBITDAre") for the most recently completed quarter (i) to recalculate as if all acquisitions and dispositions had occurred at the beginning of the quarter, (ii) to exclude certain GAAP income and expense amounts that are either non-cash, such as cost of debt extinguishments, realized or unrealized gains and losses on foreign currency transactions, or the change in fair value of our earnout liability, or that we believe are one time, or unusual in nature because they relate to unique circumstances or transactions that had not previously occurred and which we do not anticipate occurring in the future, and (iii) to eliminate the impact of lease termination fees and other items that are not a result of normal operations. We then annualize quarterly Adjusted EBITDAre by multiplying it by four ("Annualized Adjusted EBITDAre"). You should not unduly rely on this measure as it is based on assumptions and estimates that may prove to be inaccurate. Our actual reported EBITDAre for future periods may be significantly different from our Annualized Adjusted EBITDAre. Adjusted EBITDAre and Annualized Adjusted EBITDAre are not measurements of performance under GAAP, and our Adjusted EBITDAre and Annualized Adjusted EBITDAre may not be comparable to similarly titled measures of other companies. You should not consider our Adjusted EBITDAre and Annualized Adjusted EBITDAre as alternatives to net income or cash flows from operating activities determined in accordance with GAAP.

The following table below were entered intoreconciles net income (which is the most comparable GAAP measure) to EBITDA, EBITDAre, and Adjusted EBITDAre. Information is also presented with respect to Annualized EBITDAre and Annualized Adjusted EBITDAre:


For the Three Months Ended


(in thousands)


June 30,
2022


March 31,
2022


June 30,
2021


Net income


$

35,552


$

28,441


$

22,820


Depreciation and amortization


35,511


34,290


31,225


Interest expense


17,888


16,896


15,430


Income taxes


401


412


301


EBITDA


$

89,352


$

80,039


$

69,776


Provision for impairment of investment in rental properties


1,380


Gain on sale of real estate


(4,071

)


(1,196

)


(3,838

)

EBITDAre


$

86,661


$

78,843


$

65,938


Adjustment for current quarter acquisition activity (a)


2,780


3,225


2,761


Adjustment for current quarter disposition activity (b)


(141

)


(79

)


(353

)

Adjustment to exclude change in fair value of earnout liability


5,604


Adjustment exclude net write-offs of accrued rental income


1,326


Adjustment to exclude realized / unrealized foreign exchange (gain) loss


(2,632

)


1,125


Adjusted EBITDAre


$

86,668


$

84,440


$

73,950


Annualized EBITDAre


$

346,642


$

315,375


$

263,761


Annualized Adjusted EBITDAre


$

346,672


$

337,759


$

295,808


(a)
Reflects an adjustment to give effect to all acquisitions during the quarter as if they had been acquired as of the beginning of the quarter.
(b)
Reflects an adjustment to give effect to all dispositions during the quarter as if they had been sold as of the beginning of the quarter.

45


Net Debt, Net Debt to Annualized EBITDAre and Net Debt to Annualized Adjusted EBITDAre

We define Net Debt as gross debt (total reported debt plus debt issuance costs) less cash and cash equivalents and restricted cash. We believe that the presentation of Net Debt to Annualized EBITDAre and Net Debt to Annualized Adjusted EBITDAre is useful to investors and analysts because these ratios provide information about gross debt less cash and cash equivalents, which could be used to repay debt, compared to our performance as measured using EBITDAre, and is used in conjunctioncommunications with previous securedlenders and unsecured borrowingsrating agencies regarding our credit rating. The following table reconciles total debt (which is the most comparable GAAP measure) to Net Debt, and presents the ratio of Net Debt to Annualized EBITDAre and Net Debt to Annualized Adjusted EBITDAre, respectively:

(in thousands)


June 30,
2022


March 31,
2022


June 30,
2021


Debt


Unsecured revolving credit facility


$

320,657


$

266,118


$


Unsecured term loans, net


587,098


586,884


910,994


Senior unsecured notes, net


844,178


843,990


472,637


Mortgages, net


95,453


96,141


105,748


Debt issuance costs


8,991


9,419


6,625


Gross Debt


1,856,377


1,802,552


1,496,004


Cash and cash equivalents


(16,813

)


(54,103

)


(78,987

)

Restricted cash


(12,163

)


(11,444

)


(8,021

)

Net Debt


$

1,827,401


$

1,737,005


$

1,408,996


Net Debt to Annualized EBITDAre


5.3x


5.5x


5.3x


Net Debt to Annualized Adjusted EBITDAre


5.3x


5.1x


4.8x


Critical Accounting Policies and Estimates

This Management's Discussion and Analysis of Financial Condition and Results of Operations is based upon our Condensed Consolidated Financial Statements, which have been prepared in accordance with GAAP. The preparation of these Condensed Consolidated Financial Statements requires management to make estimates and assumptions that were retiredaffect the reported amounts of assets, liabilities, revenues, and expenses as well as other disclosures in the financial statements. We base our estimates on historical experience and on various other assumptions believed to be reasonable under the circumstances. These judgments affect the reported amounts of assets and liabilities, disclosure of contingent assets and liabilities at the dates of the financial statements, and the reported amounts of revenue and expenses during the reporting periods. On an ongoing basis, management evaluates its estimates and assumptions; however, actual results may differ from these estimates and assumptions, which in turn could have a material impact on our financial statements. A summary of our significant accounting policies and procedures are included in Note 2, "Summary of Significant Accounting Policies," in the Notes to the Condensed Consolidated Financial Statements included in this Quarterly Report on Form 10-Q. We believe there have been no significant changes during the six months ended June 30, 2022, to the items that we disclosed as our critical accounting policies and estimates in our 2021 Annual Report on Form 10-K.

Impact of Recent Accounting Pronouncements

For information on the impact of recent accounting pronouncements on our business, see Note 2 of the Notes to the Condensed Consolidated Financial Statements included in this Quarterly Report on Form 10-Q.

Item 3. Quantitative and Qualitative Disclosures About Market Risk

Interest Rate Risk

We are exposed to certain market risks, one of the most predominant of which is a change in interest rates. Increases in interest rates can result in increased interest expense under our Revolving Credit Facility and other variable-rate debt. Increases in interest rates can also result in increased interest expense when our fixed rate debt matures and needs to be refinanced. We attempt to manage interest rate risk by entering into long-term fixed rate debt or by entering into interest rate swaps to convert certain variable-rate debt to a fixed rate. The interest rate swaps have since been reapplieddesignated by us as cash flow hedges for accounting purposes and are reported at fair value. We have not entered, and do not intend to enter, into derivative or interest rate transactions for speculative purposes. Further information concerning our interest rate swaps can be found in supportNote 11 in our Condensed Consolidated Financial Statements contained elsewhere in this Quarterly Report on Form 10-Q.

Our fixed-rate debt includes our Senior Unsecured Notes, mortgages, and variable-rate debt converted to a fixed rate with the use of interest rate swaps. Our fixed-rate debt had a carrying value and fair value of approximately $1.7 billion and $1.6 billion, respectively, as of June 30, 2022. Changes in market interest rates impact the current unsecured credit facilities.fair value of our fixed-rate debt, but they have no impact on interest incurred or on cash flows. For instance, if interest rates were to increase 1%, and the fixed-rate debt balance were to remain constant,

46

Counterparty


Maturity Date


Fixed

Rate


Variable Rate

Index


Notional

Amount


Fair Value


Bank of America, N.A.


November-23


2.80%


1 month LIBOR


$

25,000,000


(1,177,353

)

Bank of Montreal


July-24


1.16%


1 month LIBOR


40,000,000


2,146,861


Bank of Montreal


January-25


1.91%


1 month LIBOR


25,000,000


192,803


Bank of Montreal


July-25


2.32%


1 month LIBOR


25,000,000


(489,600

)

Bank of Montreal


January-26


1.92%


1 month LIBOR


25,000,000


297,340


Bank of Montreal


January-26


2.05%


1 month LIBOR


40,000,000


84,117


Bank of Montreal


December-26


2.33%


1 month LIBOR


10,000,000


(175,375

)

Capital One, N.A.


December-21


1.05%


1 month LIBOR


15,000,000


486,922


Capital One, N.A.


December-24


1.58%


1 month LIBOR


15,000,000


459,406


Capital One, N.A.


January-26


2.08%


1 month LIBOR


35,000,000


38,960


Capital One, N.A.


July-26


1.32%


1 month LIBOR


35,000,000


2,289,026


Manufacturers & Traders Trust Co.


September-22


2.83%


1 month LIBOR


25,000,000


(1,149,860

)

Manufacturers & Traders Trust Co.


November-23


2.65%


1 month LIBOR


25,000,000


(1,023,132

)

Regions Bank


March-18


1.77%


1 month LIBOR


25,000,000


(46,329

)

Regions Bank


March-19


1.91%


3 month LIBOR


25,000,000


(105,943

)

Regions Bank


May-20


2.12%


1 month LIBOR


50,000,000


(561,657

)

Regions Bank


March-22


2.43%


3 month LIBOR


25,000,000


(550,191

)

Regions Bank


December-23


1.18%


1 month LIBOR


25,000,000


1,177,710


SunTrust Bank


April-24


1.99%


1 month LIBOR


25,000,000


(63,116

)

SunTrust Bank


April-25


2.20%


1 month LIBOR


25,000,000


(331,624

)

SunTrust Bank


July-25


1.99%


1 month LIBOR


25,000,000


71,593


SunTrust Bank


January-26


1.93%


1 month LIBOR


25,000,000


248,334


Wells Fargo Bank, N.A.


February-21


2.39%


1 month LIBOR


35,000,000


(738,635

)

Wells Fargo Bank, N.A.


October-24


2.72%


1 month LIBOR


15,000,000


(706,367

)


we would expect the fair value of our debt to decrease, similar to how the price of a bond decreases as interest rates rise. A 1% increase in market interest rates would have resulted in a decrease in the fair value of our fixed-rate debt of approximately $82.4 million as of June 30, 2022.

Borrowings pursuant to our Revolving Credit Facility and other variable-rate debt bear interest at rates based on the applicable reference rate plus an applicable margin, and totaled $918.2 million as of June 30, 2022, of which $717.7 million was swapped to a fixed rate by our use of interest rate swaps. Taking into account the effect of our interest rate swaps, a 1% increase or decrease in interest rates would have a corresponding $2.0 million increase or decrease in interest expense annually.

With the exception of our interest rate swap transactions, we have not engaged in transactions in derivative financial instruments or derivative commodity instruments.

AsForeign Currency Exchange Rate Risk

We own investments in Canada, and as a result are subject to risk from the effects of September 30, 2017,exchange rate movements in the Canadian dollar, which may affect future costs and cash flows. We funded a significant portion of our financial instruments were not exposedCanadian investments through Canadian dollar borrowings under our Revolving Credit Facility, which is intended to significant marketact as a natural hedge against our Canadian dollar investments. To the extent that currency fluctuations increase or decrease rental revenues, as translated to U.S. dollars, the change in debt service (comprised of interest payments), as translated to U.S. dollars, will partially offset the effect of fluctuations in revenue and, to some extent, mitigate the risk due tofrom changes in foreign currency exchange risk.rates. We believe the foreign currency exchange rate risk on the remaining cash flows is immaterial.

Item 4.

Controls and Procedures

Additionally, our Canadian dollar revolving borrowings are remeasured each reporting period, with the unrealized foreign currency gains and losses flowing through earnings. These unrealized foreign currency gains and losses do not impact our cash flows from operations until settled, and are expected to directly offset the changes in the value of our net investments as a result of changes in the Canadian dollar. Our Canadian investments are recorded at their historical exchange rates, and therefore are not impacted by changes in the value of the Canadian dollar.

Item 4. Controls and Procedures

Evaluation of Disclosure Controls and Procedures

We maintain disclosure controls and procedures (as defined in Rules 13a-15(e) and 15d-15(e) of the Securities Exchange Act of 1934, as amended (the “Exchange Act”))Act), that are designed to ensure that information required to be disclosed in our Exchange Act reports is recorded, processed, summarized, and reported within the time periods specified in the Securities and Exchange Commission’sSEC's rules and forms, and that such information is accumulated and communicated to our management, including our Chief Executive Officer and Chief Financial Officer, as appropriate, to allow timely decisions regarding required disclosure. As of and for the quarter ended SeptemberJune 30, 2017,2022, we carried out an evaluation of the effectiveness of the design and operation of our disclosure controls and procedures, under the supervision and with the participation of management, including our Chief Executive Officer and Chief Financial Officer. Based on the foregoing, our Chief Executive Officer and Chief Financial Officer concluded that our disclosure controls and procedures were effective and were operating at a reasonable assurance level.

Changes in Internal Control overOver Financial Reporting

There werehave been no changes toin our internal control over financial reporting that occurred during the quarter ended SeptemberJune 30, 2017,2022 that have materially affected, or are reasonably likely to materially affect, our internal control over financial reporting.


47


Part II – OTHEROTHER INFORMATION

Item 1.

Legal Proceedings.

Item 1. Legal Proceedings.

From time to time, we are subject to various lawsuits, claims, and other legal proceedings and claims that arise in the ordinary course of our business. These mattersWe are generally covered by insurance or are subjectnot currently a party to our right to be indemnified by our tenantslegal proceedings that we include inbelieve would reasonably be expected to have material adverse effect on our leases. Management isbusiness, financial condition, or results of operations. We are not aware of any material pending legal proceedings to which we or any of our subsidiaries are a party or to which any of our property is subject, nor are we aware of any such legal proceedings contemplated by government agencies.

Item 1A.

Risk Factors.

Item 1A. Risk Factors.

There have been no material changes from the risk factors set forth in our 2021 Annual Report on Form 10-K for the Form 10.year ended December 31, 2021.

Item 2.

Item 2. Unregistered Sales of Equity Securities and Use of Proceeds.

Sales of Common Stock

In December 2007, we commenced our ongoing private offering of shares of our common stock. The following table provides information regarding the sale of shares of our common stock pursuant to our ongoing private offering during the nine months ended September 30, 2017 (in thousands, except year and Determined Share Value amounts).

Month


Year


Common

Shares

Sold


Determined

Share Value –

Common

Shares (1)


Total

Proceeds –

Common

Shares Sold


Common Shares

DRIP


Determined

Share Value

– DRIP(2)


Total

Proceeds –

Common

Share DRIP(3)


Total

Proceeds


January


2017


413


$

77


$

31,827


38


$

75


$

2,836


$

34,663


February


2017


270


79


21,314


39


75


2,934


24,248


March


2017


368


79


28,946


39


77


3,071


32,017


April


2017


234


79


18,462


41


77


3,166


21,628


May


2017


291


80


23,242


42


78


3,266


26,508


June


2017


352


80


28,064


42


79


3,319


31,383


July


2017


220


80


17,601


44


78


3,394


20,995


August


2017


343


80


27,455


45


78


3,501


30,956


September


2017


297


80


23,676


45


78


3,544


27,220


TOTAL


2,788


$

220,587


375


$

29,031


$

249,618


(1)

Shares of our common stock are sold in our ongoing private offering at a price per share equal to the then-applicable Determined Share Value.

(2)

DRIP shares are purchased at a discounted rate of 98% of the Determined Share Value.

(3)

For common shares reinvested under our DRIP there is no corresponding cash flow from the transaction. Refer to Note 13 to the consolidated financial statements included in this Form 10-Q for further discussion.

None of the shares of our common stock set forth in the table above were registered under the Securities Act in reliance upon the exemption from registration under the Securities Act provided by Rule 506(c) under Regulation D promulgated under the Securities Act. All of the shares of our common stock set forth in the table above were sold to persons who represented to us in writing that they qualified as an “Accredited Investor” as such term is defined by Regulation D promulgated under the Securities Act, and provided us with additional documentation to assist us in verifying such person’s status as accredited investors.

Issuances of Membership Units

In connection with property acquisitions that are structured as UPREIT transactions, the owner of a property will transfer its interest in the property to the Operating Company in exchange for membership units in the Operating Company. During June 2017 we issued 103,478 membership units in the Operating Company in exchange for property in the amount of $8.3 million. There were no other membership unit issuances during the nine months ended September 30, 2017.

None of the membership units in the Operating Company discussed above were registered under the Securities Act in reliance upon the exemption from registration under the Securities Act provided by Rule 506(c) under Regulation D promulgated under the Securities Act. All of the membership units in the Operating Company discussed above were sold to persons who represented to us in writing that they qualified as an Accredited Investor, as such term is defined by Regulation D promulgated under the Securities Act, and provided us with additional documentation to assist us in verifying such person’s status as accredited investors.


Repurchases of Equity Securities and Use of Proceeds from Registered Securities.

During the three months ended September 30, 2017, we fulfilled repurchase requests and repurchased shares of our common stock pursuant to our share redemption program as follows.  None.

Item 3. Defaults Upon Senior Securities.

Period


Total Number

of Shares

Requested to be

Redeemed (1)


Total Number

of Shares

Redeemed


Average

Price Paid

Per Share (2)


Approximate Dollar

Value of Shares

Available That May

Yet Be Redeemed

Under the Program

July 2017


$


(3)

August 2017


$


(3)

September 2017


23,374


23,374


$

77.36


(3)

None.

Item 4. Mine Safety Disclosures.

Not applicable.

Item 5. Other Information.

None.

48


Item 6. Exhibits

(1)No.

Repurchases of shares of our common stock pursuant to the share redemption program will be made quarterly, at the end of the quarter, upon written request to us delivered at least 10 calendar days prior to the last business day of the applicable calendar quarter, and the redemption price paid for redeemed shares will be paid in cash within three business days of the last business day of the applicable calendar quarter.

(2)

Shares held for more than 12 months, but less than five years, will be redeemed at a purchase price equal to 95% of the Determined Share Value in effect as of the last business day of the quarter in which the shares are timely tendered for redemption and shares held for five years or more will be redeemed at a purchase price equal to 100% of the Determined Share Value in effect as of the last business day of the quarter in which the shares are timely tendered for redemption, subject to certain exceptions as set forth in the share redemption program.

(3)

The total number of shares redeemed pursuant to the share redemption program in any quarter may not exceed (i) 1% of the total number of shares outstanding at the beginning of the applicable calendar year, plus (ii) 50% of the total number of any additional shares of our common stock issued during the prior calendar quarter pursuant to our DRIP; provided, however, that the total number of shares redeemed during any calendar year may not exceed 5% of the number of shares outstanding as of the first day of such calendar year.


Item 3.

Defaults Upon Senior Securities.

None.

Item 4.

Mine Safety Disclosures.

Not applicable.

Item 5.

Other Information.

Not applicable.

Item 6.

Exhibits

Description

No.


Description

3.1

    3.1(a)


Articles of Incorporation of Broadstone Net Lease, Inc. (filed as Exhibit 3.1 to the Corporation's Registration Statement on Form 10 filed April 24, 2017 and incorporated herein by reference)

3.2

Articles of Amendment of Broadstone Net Lease, Inc. (filed as Exhibit 3.1 to the Corporation's Current Report on Form 8-K filed September 18, 2020 and incorporated herein by reference)


    3.2(a)3.3


Articles Supplementary of Broadstone Net Lease, Inc. (filed as Exhibit 3.2 to the Corporation's Current Report on Form 8-K filed September 18, 2020 and incorporated herein by reference)

3.4

Articles of Amendment of Broadstone Net Lease, Inc. (filed as Exhibit 3.3 to the Corporation's Current Report on Form 8-K filed September 18, 2020 and incorporated herein by reference)

3.5

Second Amended and Restated Bylaws of Broadstone Net Lease, Inc., adopted March 23, 2020 (filed as Exhibit 3.1 to the Corporation's Current Report on Form 8-K filed March 25, 2020 and incorporated herein by reference)


4.1(a)


Indenture, dated as of September 15, 2021, among the Issuer, the Company and the Trustee, including the form of the Guarantee (filed as Exhibit 4.1 to the Corporation's Current Report on Form 8-K filed September 10, 2021 and incorporated herein by reference)

4.2

First Supplemental Indenture, dated as of September 15, 2021, among the Issuer, the Company and the Trustee, including the form of the Notes (filed as Exhibit 4.2 to the Corporation's Current Report on Form 8-K filed September 10, 2021 and incorporated herein by reference)

10.1*

Broadstone Net Lease, Inc. Distribution Reinvestment PlanChange in Control Severance Protection Policy


    4.2(b)31.1*


Broadstone Net Lease, Inc. Share Redemption Program

  31.1

Certification of Chief Executive Officer pursuant to Rule 13a-14(a) or Rule 15d-14(a) of the Securities Exchange Act of 1934, as amended, as adopted pursuant to Section 302 of the Sarbanes-Oxley Act of 2002 (filed herewith)


  31.231.2*


Certification of Chief Financial Officer pursuant to Rule 13a-14(a) or Rule 15d-14(a) of the Securities Exchange Act of 1934, as amended, as adopted pursuant to Section 302 of the Sarbanes-Oxley Act of 2002 (filed herewith)


  32.132.1*†


Certification of Chief Executive Officer pursuant to 18 U.S.C. Section 1350, as adopted pursuant to Section 906 of the Sarbanes-Oxley Act of 2002 (furnished herewith)


  32.232.2*†


Certification of Chief Financial Officer pursuant to 18 U.S.C. Section 1350, as adopted pursuant to Section 906 of the Sarbanes-Oxley Act of 2002 (furnished herewith)


101.1101.INS


The following materials fromInline XBRL Instance Document – the Company’s Quarterly Report on Form 10-Q forinstance document does not appear in Interactive Data File because its XBRL tags are embedded within the quarterly period ended September 30, 2017, formatted inInline XBRL (eXtensible Business Reporting Language): (i) Condensed Consolidated Balance Sheets, (ii) Condensed Consolidated Statements of Income and Comprehensive Income (Loss), (iii) Condensed Consolidated Statements of Stockholders’ Equity, (iv) Condensed Consolidated Statements of Cash Flows, and (v) Notes to Condensed Consolidated Financial StatementsDocument

101.SCH

Inline XBRL Taxonomy Extension Schema Document

101.CAL

Inline XBRL Taxonomy Extension Calculation Linkbase Document

101.DEF

Inline XBRL Taxonomy Extension Definition Linkbase Document

101.LAB

Inline XBRL Taxonomy Extension Label Linkbase Document

101.PRE

Inline XBRL Taxonomy Extension Presentation Linkbase Document

104

Cover Page Interactive Data File (embedded within the Inline XBRL document)

(a)

Incorporated herein by reference to the General Form for Registration of Securities on Form 10, filed on April 24, 2017.

(b)

Incorporated herein by reference to the Company’s Amendment No. 2 to the General Form for Registration of Securities on Form 10, filed on June 29, 2017.


* Filed herewith.

SIGNATURES In accordance with Item 601(b)(32) of Regulation S-K, this Exhibit is not deemed "filed" for purposes of Section 18 of the Exchange Act or otherwise subject to the liabilities of that section. Such certifications will not be deemed incorporated by reference into any filing under the Securities Act or the Exchange Act, except to the extent that the Registrant specifically incorporates it by reference.

49


SIGNATURES

Pursuant to the requirements of the Securities Exchange Act of 1934, the registrant has duly caused this report to be signed on its behalf by the undersigned thereunto duly authorized.


BROADSTONE NET LEASE, INC.


Date: November 13, 2017August 4, 2022


/s/ Christopher J. Czarnecki


Christopher J. Czarnecki


Chief Executive Officer and President


Date: November 13, 2017August 4, 2022


/s/ Ryan M. Albano


Ryan M. Albano


Executive Vice President and Chief Financial Officer


50

56