TABLE OF CONTENTS
| Page | ||||||||||||
| Part I | Financial Information | |||||||||||
| Item 1. | Unaudited Consolidated Financial Statements | |||||||||||
| Item 2. | Management's Discussion and Analysis of the Account's Financial Condition and Results of Operations | |||||||||||
| Item 3. | Quantitative and Qualitative Disclosures about Market Risk | |||||||||||
| Item 4. | Controls and Procedures | |||||||||||
| Part II | Other Information | |||||||||||
| Item 1. | Legal Proceedings | |||||||||||
| Item 1A. | Risk Factors | |||||||||||
| Item 2. | Unregistered Sales of Equity Securities and Use of Proceeds | |||||||||||
| Item 3. | Defaults Upon Senior Securities | |||||||||||
| Item 4. | Mine Safety Disclosures | |||||||||||
| Item 5. | Other Information | |||||||||||
| Item 6. | Exhibits | |||||||||||
| Signatures | ||||||||||||
PART I. FINANCIAL INFORMATION
ITEM 1. UNAUDITED CONSOLIDATED FINANCIAL STATEMENTS
TIAA REAL ESTATE ACCOUNT
CONSOLIDATED STATEMENTS OF ASSETS AND LIABILITIES
(Unaudited)
(In millions, except per accumulation unit amounts)
| March 31, | December 31, | ||||||||||||||||
| 2023 | 2022 | ||||||||||||||||
| ASSETS | |||||||||||||||||
| Investments, at fair value: | |||||||||||||||||
Real estate properties (cost: $14,424.5 and $14,323.2) | $ | 20,057.9 | $ | 20,444.0 | |||||||||||||
Real estate joint ventures (cost: $5,789.4 and $5,738.1) | 6,762.1 | 7,103.6 | |||||||||||||||
Real estate funds (cost: $815.2 and $787.7) | 931.9 | 893.4 | |||||||||||||||
Real estate operating business (cost: $355.0 and $355.0) | 636.0 | 641.9 | |||||||||||||||
Marketable securities (cost: $1,273.4 and $2,077.1) | 1,255.3 | 2,030.2 | |||||||||||||||
Loans receivable (principal: $1,549.2 and $1,546.0) | 1,378.9 | 1,418.7 | |||||||||||||||
Loans receivable with related parties (principal: $71.3 and $69.9) | 71.3 | 69.9 | |||||||||||||||
Total investments (cost: $24,278.0 and $24,897.0) | $ | 31,093.4 | $ | 32,601.7 | |||||||||||||
| Cash and cash equivalents | 177.9 | 72.4 | |||||||||||||||
| Due from investment manager | 2.3 | — | |||||||||||||||
| Other | 337.2 | 359.5 | |||||||||||||||
| TOTAL ASSETS | $ | 31,610.8 | $ | 33,033.6 | |||||||||||||
| LIABILITIES | |||||||||||||||||
Loans payable, at fair value (principal outstanding: $2,222.1 and $2,168.7) | 2,129.9 | 2,069.7 | |||||||||||||||
Other unsecured debt, at fair value (principal outstanding: $1,000.0 and $1,000.0) | 960.0 | 953.1 | |||||||||||||||
| Due to investment manager | — | 7.1 | |||||||||||||||
| Accrued real estate property expenses | 282.8 | 291.8 | |||||||||||||||
| Payable for securities purchased | 138.3 | — | |||||||||||||||
| Other | 49.5 | 53.8 | |||||||||||||||
| TOTAL LIABILITIES | $ | 3,560.5 | $ | 3,375.5 | |||||||||||||
| COMMITMENTS AND CONTINGENCIES | |||||||||||||||||
| NET ASSETS | |||||||||||||||||
| Accumulation Fund | 27,441.1 | 29,025.7 | |||||||||||||||
| Annuity Fund | 609.2 | 632.4 | |||||||||||||||
| TOTAL NET ASSETS | $ | 28,050.3 | $ | 29,658.1 | |||||||||||||
| NUMBER OF ACCUMULATION UNITS OUTSTANDING | 50.5 | 52.1 | |||||||||||||||
| NET ASSET VALUE, PER ACCUMULATION UNIT | $ | 543.524 | $ | 556.923 | |||||||||||||
| September 30, | December 31, | ||||||||
| 2017 | 2016 | ||||||||
| (Unaudited) | |||||||||
| ASSETS | |||||||||
| Investments, at fair value: | |||||||||
| Real estate properties (cost: $12,944.7 and $12,818.1) | $ | 15,654.2 | $ | 15,452.8 | |||||
Real estate joint ventures and limited partnerships (cost: $4,540.2 and $4,530.4) | 5,816.1 | 5,759.9 | |||||||
| Marketable securities: | |||||||||
| Real estate-related (cost: $889.5 and $883.9) | 1,121.0 | (1) | 1,081.5 | (1) | |||||
| Other (cost: $4,293.3 and $4,054.0) | 4,293.4 | 4,053.8 | |||||||
| Loans receivable (cost: $296.5 and $294.8) | 298.8 | 295.7 | |||||||
| Total investments (cost: $22,964.2 and $22,581.2) | 27,183.5 | 26,643.7 | |||||||
| Cash and cash equivalents | 6.8 | 3.0 | |||||||
| Due from investment manager | 4.8 | 5.9 | |||||||
| Other | 227.6 | (2) | 332.6 | (2) | |||||
| TOTAL ASSETS | 27,422.7 | 26,985.2 | |||||||
| LIABILITIES | |||||||||
Mortgage loans payable, at fair value (principal outstanding: $2,284.8 and $2,316.5) | 2,311.0 | 2,332.1 | |||||||
| Accrued real estate property expenses | 211.7 | 202.2 | |||||||
| Payable for collateral for securities loaned | 5.6 | 93.0 | |||||||
| Other | 54.6 | 53.2 | |||||||
| TOTAL LIABILITIES | 2,582.9 | 2,680.5 | |||||||
| COMMITMENTS AND CONTINGENCIES | |||||||||
| NET ASSETS | |||||||||
| Accumulation Fund | 24,333.5 | 23,813.5 | |||||||
| Annuity Fund | 506.3 | 491.2 | |||||||
| TOTAL NET ASSETS | $ | 24,839.8 | $ | 24,304.7 | |||||
| NUMBER OF ACCUMULATION UNITS OUTSTANDING | 61.9 | 62.4 | |||||||
| NET ASSET VALUE, PER ACCUMULATION UNIT | $ | 393.257 | $ | 381.636 | |||||
See notes to the consolidated financial statements
3
TIAA REAL ESTATE ACCOUNT
CONSOLIDATED STATEMENTS OF OPERATIONS
(In millions)millions, Unaudited)
| For the Three Months Ended March 31, | |||||||||||||||||||||||
| 2023 | 2022 | ||||||||||||||||||||||
| INVESTMENT INCOME | |||||||||||||||||||||||
| Real estate income, net: | |||||||||||||||||||||||
| Rental income | $ | 334.5 | $ | 303.7 | |||||||||||||||||||
| Real estate property level expenses and taxes: | |||||||||||||||||||||||
| Operating expenses | 79.4 | 73.6 | |||||||||||||||||||||
| Real estate taxes | 53.4 | 51.7 | |||||||||||||||||||||
| Interest expense | 23.2 | 19.6 | |||||||||||||||||||||
| Total real estate property level expenses and taxes | 156.0 | 144.9 | |||||||||||||||||||||
| Real estate income, net | 178.5 | 158.8 | |||||||||||||||||||||
| Income from real estate joint ventures | 53.3 | 60.5 | |||||||||||||||||||||
| Income from real estate funds | 6.6 | 6.0 | |||||||||||||||||||||
| Interest | 40.3 | 20.7 | |||||||||||||||||||||
| Other | — | 0.8 | |||||||||||||||||||||
| TOTAL INVESTMENT INCOME | 278.7 | 246.8 | |||||||||||||||||||||
| Expenses: | |||||||||||||||||||||||
| Investment management charges | 21.8 | 22.5 | |||||||||||||||||||||
| Administrative charges | 11.9 | 13.5 | |||||||||||||||||||||
| Distribution charges | 4.8 | 7.3 | |||||||||||||||||||||
| Mortality and expense risk charges | — | 0.4 | |||||||||||||||||||||
| Liquidity guarantee charges | 19.9 | 22.7 | |||||||||||||||||||||
| Interest expense | 11.4 | 1.3 | |||||||||||||||||||||
| TOTAL EXPENSES | 69.8 | 67.7 | |||||||||||||||||||||
| INVESTMENT INCOME, NET | 208.9 | 179.1 | |||||||||||||||||||||
| NET REALIZED AND UNREALIZED GAIN (LOSS) ON INVESTMENTS AND DEBT | |||||||||||||||||||||||
| Net realized gain (loss) on investments: | |||||||||||||||||||||||
| Real estate properties | — | (8.4) | |||||||||||||||||||||
| Real estate joint ventures | — | 50.9 | |||||||||||||||||||||
| Marketable securities | (19.1) | (1.0) | |||||||||||||||||||||
| Net realized (loss) gain on investments | (19.1) | 41.5 | |||||||||||||||||||||
| Net change in unrealized gain (loss) on: | |||||||||||||||||||||||
| Real estate properties | (487.4) | 1,212.4 | |||||||||||||||||||||
| Real estate joint ventures | (377.3) | 71.9 | |||||||||||||||||||||
| Real estate funds | 11.0 | (9.4) | |||||||||||||||||||||
| Real estate operating business | (5.9) | 60.4 | |||||||||||||||||||||
| Foreign currency exchange on forward contracts | (0.5) | — | |||||||||||||||||||||
| Marketable securities | 28.7 | (28.6) | |||||||||||||||||||||
| Loans receivable | (43.0) | 1.0 | |||||||||||||||||||||
| Loans payable | (6.8) | 3.7 | |||||||||||||||||||||
| Other unsecured debt | (6.9) | — | |||||||||||||||||||||
| Net change in unrealized (loss) gain on investments and debt | (888.1) | 1,311.4 | |||||||||||||||||||||
| NET REALIZED AND UNREALIZED (LOSS) GAIN ON INVESTMENTS AND DEBT | (907.2) | 1,352.9 | |||||||||||||||||||||
| NET (DECREASE) INCREASE IN NET ASSETS RESULTING FROM OPERATIONS | $ | (698.3) | $ | 1,532.0 | |||||||||||||||||||
| For the Three Months Ended September 30, | For the Nine Months Ended September 30, | ||||||||||||||
| 2017 | 2016 | 2017 | 2016 | ||||||||||||
| INVESTMENT INCOME | |||||||||||||||
| Real estate income, net: | |||||||||||||||
| Rental income | $ | 267.9 | $ | 257.4 | $ | 791.6 | $ | 755.9 | |||||||
| Real estate property level expenses and taxes: | |||||||||||||||
| Operating expenses | 56.9 | 54.8 | 164.9 | 163.5 | |||||||||||
| Real estate taxes | 43.2 | 40.4 | 127.3 | 116.9 | |||||||||||
| Interest expense | 22.5 | 22.4 | 67.3 | 63.3 | |||||||||||
| Total real estate property level expenses and taxes | 122.6 | 117.6 | 359.5 | 343.7 | |||||||||||
| Real estate income, net | 145.3 | 139.8 | 432.1 | 412.2 | |||||||||||
| Income from real estate joint ventures and limited partnerships | 60.9 | 33.5 | 154.3 | 111.8 | |||||||||||
| Interest | 15.9 | 6.3 | 37.6 | 17.8 | |||||||||||
| Dividends | 7.9 | 9.2 | 15.7 | 19.9 | |||||||||||
| TOTAL INVESTMENT INCOME | 230.0 | 188.8 | 639.7 | 561.7 | |||||||||||
| Expenses: | |||||||||||||||
| Investment management charges | 15.5 | 17.6 | 52.9 | 51.8 | |||||||||||
| Administrative charges | 14.7 | 17.0 | 46.0 | 48.4 | |||||||||||
| Distribution charges | 6.4 | 7.2 | 19.6 | 21.3 | |||||||||||
| Mortality and expense risk charges | 0.3 | 0.3 | 0.9 | 0.9 | |||||||||||
| Liquidity guarantee charges | 12.5 | 10.2 | 34.5 | 28.1 | |||||||||||
| TOTAL EXPENSES | 49.4 | 52.3 | 153.9 | 150.5 | |||||||||||
| INVESTMENT INCOME, NET | 180.6 | 136.5 | 485.8 | 411.2 | |||||||||||
| NET REALIZED AND UNREALIZED GAIN (LOSS) ON INVESTMENTS AND MORTGAGE LOANS PAYABLE | |||||||||||||||
| Net realized gain (loss) on investments: | |||||||||||||||
| Real estate properties | 75.2 | 16.4 | 58.4 | 26.5 | |||||||||||
| Real estate joint ventures and limited partnerships | (8.6 | ) | 0.2 | (8.6 | ) | 0.4 | |||||||||
| Marketable securities | 2.6 | 3.1 | 15.3 | 21.6 | |||||||||||
| Net realized gain on investments | 69.2 | 19.7 | 65.1 | 48.5 | |||||||||||
| Net change in unrealized appreciation (depreciation) on: | |||||||||||||||
| Real estate properties | (9.4 | ) | 36.9 | 74.8 | 242.2 | ||||||||||
| Real estate joint ventures and limited partnerships | 26.9 | 24.3 | 88.7 | 152.3 | |||||||||||
| Marketable securities | 2.2 | (26.0 | ) | 34.2 | 84.2 | ||||||||||
| Loans receivable | 1.4 | 0.1 | 1.4 | 0.1 | |||||||||||
| Mortgage loans payable | (4.1 | ) | (29.1 | ) | (10.6 | ) | (54.8 | ) | |||||||
Net change in unrealized appreciation on investments and mortgage loans payable | 17.0 | 6.2 | 188.5 | 424.0 | |||||||||||
| NET REALIZED AND UNREALIZED GAIN ON INVESTMENTS AND MORTGAGE LOANS PAYABLE | 86.2 | 25.9 | 253.6 | 472.5 | |||||||||||
| NET INCREASE IN NET ASSETS RESULTING FROM OPERATIONS | $ | 266.8 | $ | 162.4 | $ | 739.4 | $ | 883.7 | |||||||
See notes to the consolidated financial statements
4
TIAA REAL ESTATE ACCOUNT
CONSOLIDATED STATEMENTS OF CHANGES IN NET ASSETS
(In millions)millions, Unaudited)
| For the Three Months Ended March 31, | ||||||||||||||||||||
| 2023 | 2022 | |||||||||||||||||||
| FROM OPERATIONS | ||||||||||||||||||||
| Investment income, net | $ | 208.9 | $ | 179.1 | ||||||||||||||||
| Net realized (loss) gain on investments | (19.1) | 41.5 | ||||||||||||||||||
| Net change in unrealized (loss) gain on investments and debt | (888.1) | 1,311.4 | ||||||||||||||||||
| NET (DECREASE) INCREASE IN NET ASSETS RESULTING FROM OPERATIONS | (698.3) | 1,532.0 | ||||||||||||||||||
| FROM PARTICIPANT TRANSACTIONS | ||||||||||||||||||||
| Premiums | 510.6 | 808.4 | ||||||||||||||||||
| Annuity payments | (14.4) | (12.5) | ||||||||||||||||||
| Death benefits | (37.3) | (30.6) | ||||||||||||||||||
| Withdrawals | (1,368.4) | (598.3) | ||||||||||||||||||
| NET (DECREASE) INCREASE IN NET ASSETS RESULTING FROM PARTICIPANT TRANSACTIONS | (909.5) | 167.0 | ||||||||||||||||||
| NET (DECREASE) INCREASE IN NET ASSETS | (1,607.8) | 1,699.0 | ||||||||||||||||||
| NET ASSETS | ||||||||||||||||||||
| Beginning of period | 29,658.1 | 28,072.0 | ||||||||||||||||||
| End of period | $ | 28,050.3 | $ | 29,771.0 | ||||||||||||||||
| For the Three Months Ended September 30, | For the Nine Months Ended September 30, | ||||||||||||||
| 2017 | 2016 | 2017 | 2016 | ||||||||||||
| FROM OPERATIONS | |||||||||||||||
| Investment income, net | $ | 180.6 | $ | 136.5 | $ | 485.8 | $ | 411.2 | |||||||
| Net realized gain on investments | 69.2 | 19.7 | 65.1 | 48.5 | |||||||||||
| Net change in unrealized appreciation on investments and mortgage loans payable | 17.0 | 6.2 | 188.5 | 424.0 | |||||||||||
NET INCREASE IN NET ASSETS RESULTING FROM OPERATIONS | 266.8 | 162.4 | 739.4 | 883.7 | |||||||||||
| FROM PARTICIPANT TRANSACTIONS | |||||||||||||||
| Premiums | 552.4 | 757.8 | 1,980.6 | 2,349.2 | |||||||||||
| Annuity payments | (10.8 | ) | (10.3 | ) | (32.3 | ) | (30.3 | ) | |||||||
| Withdrawals and death benefits | (777.5 | ) | (576.6 | ) | (2,152.6 | ) | (1,551.1 | ) | |||||||
NET INCREASE (DECREASE) IN NET ASSETS RESULTING FROM PARTICIPANT TRANSACTIONS | (235.9 | ) | 170.9 | (204.3 | ) | 767.8 | |||||||||
| NET INCREASE IN NET ASSETS | 30.9 | 333.3 | 535.1 | 1,651.5 | |||||||||||
| NET ASSETS | |||||||||||||||
| Beginning of period | 24,808.9 | 23,678.2 | 24,304.7 | 22,360.0 | |||||||||||
| End of period | $ | 24,839.8 | $ | 24,011.5 | $ | 24,839.8 | $ | 24,011.5 | |||||||
See notes to the consolidated financial statements
5
TIAA REAL ESTATE ACCOUNT
CONSOLIDATED STATEMENTS OF CASH FLOWS
(In millions)millions, Unaudited)
| For the Three Months Ended March 31, | |||||||||||
| 2023 | 2022 | ||||||||||
| CASH FLOWS FROM OPERATING ACTIVITIES | |||||||||||
| Net (decrease) increase in net assets resulting from operations | $ | (698.3) | $ | 1,532.0 | |||||||
| Adjustments to reconcile net changes in net assets resulting from operations to net cash used in operating activities: | |||||||||||
| Net realized loss (gain) on investments | 19.1 | (41.5) | |||||||||
| Net change in unrealized loss (gain) on investments and debt | 888.1 | (1,311.4) | |||||||||
| Purchase of real estate properties | (0.3) | (137.2) | |||||||||
| Capital improvements on real estate properties | (96.1) | (84.8) | |||||||||
| Proceeds from sales of real estate properties | — | 157.7 | |||||||||
| Purchases of other real estate investments | (66.1) | (369.8) | |||||||||
| Proceeds from sales of other real estate investments | 2.5 | 310.8 | |||||||||
| Purchases and originations of loans receivable | (11.0) | (5.2) | |||||||||
| Purchases and originations of loans receivable with related parties | (1.5) | — | |||||||||
| Proceeds from sales of loans receivable | — | 161.4 | |||||||||
| Proceeds from payoffs of loans receivable | 7.9 | 8.2 | |||||||||
| Decrease (Increase) in other investments | 784.6 | (363.2) | |||||||||
| Net change in due to/from investment manager | (9.3) | 0.7 | |||||||||
| (Increase) in receivable for securities sold | — | (4.8) | |||||||||
| Increase in payable for securities purchased | 138.3 | 45.0 | |||||||||
| Decrease in other assets | 13.8 | 20.3 | |||||||||
| (Increase) in other liabilities | (18.6) | (35.0) | |||||||||
| NET CASH PROVIDED BY (USED IN) OPERATING ACTIVITIES | 953.1 | (116.8) | |||||||||
| CASH FLOWS FROM FINANCING ACTIVITIES | |||||||||||
| Mortgage loan proceeds received | 98.9 | 3.0 | |||||||||
| Payments of mortgage loans | (45.5) | (41.8) | |||||||||
| Premiums | 510.6 | 808.4 | |||||||||
| Annuity payments | (14.4) | (12.5) | |||||||||
| Death benefits | (37.3) | (30.6) | |||||||||
| Withdrawals | (1,368.4) | (598.3) | |||||||||
| NET CASH (USED IN) PROVIDED BY FINANCING ACTIVITIES | (856.1) | 128.2 | |||||||||
| NET INCREASE IN CASH, CASH EQUIVALENTS AND RESTRICTED CASH | 97.0 | 11.4 | |||||||||
| CASH, CASH EQUIVALENTS AND RESTRICTED CASH | |||||||||||
| Beginning of period cash, cash equivalents and restricted cash | 117.0 | 46.0 | |||||||||
| Net increase in cash, cash equivalents and restricted cash | 97.0 | 11.4 | |||||||||
| End of period cash, cash equivalents and restricted cash | $ | 214.0 | $ | 57.4 | |||||||
| SUPPLEMENTAL DISCLOSURES: | |||||||||||
| Cash paid for interest | $ | 30.1 | $ | 21.9 | |||||||
The following table provides a reconciliation of cash, cash equivalents and restricted cash reported within the Consolidated Statements of Assets and Liabilities that sum to the total of the same such amounts shown in the Consolidated Statements of Cash Flows (in millions):
| For the Nine Months Ended September 30, | |||||||
| 2017 | 2016 | ||||||
| CASH FLOWS FROM OPERATING ACTIVITIES | |||||||
| Net increase in net assets resulting from operations | $ | 739.4 | $ | 883.7 | |||
| Adjustments to reconcile net changes in net assets resulting from operations to net cash provided by (used in) operating activities: | |||||||
| Net realized gain on investments | (65.1 | ) | (48.5 | ) | |||
Net change in unrealized appreciation on investments and mortgage loans payable | (188.5 | ) | (424.0 | ) | |||
| Purchase of real estate properties | (298.4 | ) | (378.0 | ) | |||
| Capital improvements on real estate properties | (95.0 | ) | (125.2 | ) | |||
| Proceeds from sale of real estate properties | 340.7 | 152.9 | |||||
| Purchases of long term investments | (342.5 | ) | (1,134.0 | ) | |||
| Proceeds from long term investments | 376.3 | 51.6 | |||||
| Increase in loans receivable | (1.7 | ) | (69.0 | ) | |||
| Increase in other investments | (239.3 | ) | (203.8 | ) | |||
| Change in due to (from) investment manager | 1.1 | (4.9 | ) | ||||
| (Increase) decrease in other assets | 105.0 | (121.4 | ) | ||||
| Increase (decrease) in other liabilities | (74.5 | ) | 141.3 | ||||
| NET CASH PROVIDED BY (USED IN) OPERATING ACTIVITIES | 257.5 | (1,279.3 | ) | ||||
| CASH FLOWS FROM FINANCING ACTIVITIES | |||||||
| Mortgage loan proceeds received | — | 563.5 | |||||
| Payments of mortgage loans | (49.4 | ) | (34.7 | ) | |||
| Premiums | 1,980.6 | 2,349.2 | |||||
| Annuity payments | (32.3 | ) | (30.3 | ) | |||
| Withdrawals and death benefits | (2,152.6 | ) | (1,551.1 | ) | |||
| NET CASH (USED IN) PROVIDED BY FINANCING ACTIVITIES | (253.7 | ) | 1,296.6 | ||||
| NET INCREASE IN CASH AND CASH EQUIVALENTS | 3.8 | 17.3 | |||||
| CASH AND CASH EQUIVALENTS | |||||||
| Beginning of period | 3.0 | 11.9 | |||||
| End of period | $ | 6.8 | $ | 29.2 | |||
| SUPPLEMENTAL DISCLOSURES: | |||||||
| Cash paid for interest | $ | 67.3 | $ | 61.6 | |||
| Debt assumed as part of real estate acquisition | $ | 17.7 | $ | — | |||
| As of March 31, | |||||||||||||||||||||||
| 2023 | 2022 | ||||||||||||||||||||||
| Cash and cash equivalents | $ | 177.9 | $ | 34.9 | |||||||||||||||||||
Restricted cash(1) | 36.1 | 22.5 | |||||||||||||||||||||
| TOTAL CASH, CASH EQUIVALENTS AND RESTRICTED CASH | $ | 214.0 | $ | 57.4 | |||||||||||||||||||
(1) Restricted cash is included within other assets in the Consolidated Statements of Assets and Liabilities.
See notes to the consolidated financial statements
6
TIAA REAL ESTATE ACCOUNT
NOTES TO THE CONSOLIDATED FINANCIAL STATEMENTS
(Unaudited)
Note 1—Organization and Significant Accounting Policies
Business: The TIAA Real Estate Account (“Account”) is an insurance separate account of Teachers Insurance and Annuity Association of America (“TIAA”) and was established by resolution of TIAA’s Board of Trustees (the “Board”) on February 22, 1995, under the insurance laws of the State of New York, for the purpose of funding variable annuity contracts issued by TIAA. The Account offers individual and group accumulating annuity contracts (with contributions made on a pre-tax or after-tax basis), as well as individual lifetime and term-certain variable payout annuity contracts (including the payment of death benefits to beneficiaries). Investors are entitled to transfer funds to or from the Account, and make withdrawals from the Account on a daily basis, under certain circumstances. Funds invested in the Account for each category of contract are expressed in terms of units, and unit values will fluctuate depending on the Account’s performance.
The investment objective of the Account is to seek favorable long-termtotal returns primarily through the rental income and appreciation of a diversified portfolio of directly held, private real estate investments and real estate-related investments owned by the Account.while offering investors guaranteed, daily liquidity. The Account holds real estate properties directly and through subsidiaries wholly-owned by TIAA for the sole benefit of the Account. The Account also holds limited interests in real estate joint ventures and limited partnerships,funds, as well as investments in loans receivable with commercial real estate properties as underlying collateral. Additionally, the Account invests in real estate-related and non-real estate-related publicly traded securities, cash and other instruments to maintain adequate liquidity levels for operating expenses, capital expenditures and to fund benefit payments (withdrawals, transfers and related transactions).
Interim Financial Information: The Consolidated Financial Statements wereof the Account as of March 31, 2023 and for the three months ended March 31, 2023 and 2022 are unaudited and include all adjustments necessary to present a fair statement of results for the interim periods presented. Results of operations for the interim periods are not necessarily indicative of results for the entire year. These Consolidated Financial Statements have been prepared in accordance with the applicable rules and regulations of the Securities and Exchange Commission (“SEC”). Accordingly, certain footnote disclosures normally included in financial statements prepared in accordance with accounting principles generally accepted in the United States of America (“GAAP”) have been condensed or omitted from this report pursuant to the rules of the SEC. As a result, these Consolidated Financial Statements should be read in conjunction with the audited Consolidated Financial Statements and notes thereto included in the Account’s Annual Report on Form 10-K for the year ended December 31, 2022 (“2022 Form 10-K”).
Use of Estimates: The Consolidated Financial Statements were prepared in accordance with GAAP, which requires the use of estimates made by management. Actual results may vary from those estimates and such differences may be material. The following is a summary of the significant accounting policies of the Account.
Basis of Presentation: The accompanying Consolidated Financial Statements include the Account and those subsidiaries wholly-owned by TIAA for the benefit of the Account. Certain prior period amounts have been reclassified for comparative purposes to conform to the current period financial statement presentation. These reclassifications had no effect on previously reported results of operations or cash flows. All significant intercompany accounts and transactions between the Account and such subsidiaries have been eliminated.
The Accumulation Unit Value (“AUV”) used for financial reporting purposes may differ from the AUV used for processing transactions. The AUV used for financial reporting purposes includes security and participant (or "contract owner") transactions effective through the period end date to which this report relates. Total return is computed based on the AUV used for processing transactions.
Recent Accounting Pronouncements: In March 2023, the FASB issued ASU 2023-01—Leases (Topic 842): Common Control Arrangements. The amendments in this Update provide a practical expedient for private
7
companies and not-for-profit entities that are the consummation of a sale as of a specified date and the passing of title from seller to buyer under conditions whereby:
In March 2020, the FASB issued ASU 2020-04, Facilitation of adoption.the Effects of Reference Rate Reform on Financial Reporting (“ASU 2020-04”). The guidance provides optional expedients and exceptions for applying generally accepted accounting principles to contract modifications and hedging relationships, subject to meeting certain criteria, that reference the London Interbank Offered Rate ("LIBOR") or another reference rate expected to be discontinued. In December 2022, the FASB issued ASU 2022-06, Reference Rate Reform (Topic 848): Deferral of the Sunset Date of Topic 848 (“ASU 2022-06”). The amendments in ASU 2022-06 extend the period of time preparers can utilize the reference rate reform relief guidance. ASU 2022-06 is effective for all entities upon issuance. To ensure the relief in Topic 848 covers the period of time during which a significant number of modifications may take place, the ASU defers the sunset date of Topic 848 from December 31, 2022, to December 31, 2024, after which entities will no longer be permitted to apply the relief in Topic 848. Management is currently assessingdoes not expect the guidance to have a material impact of ASU 2017-05 onto the Account’s Consolidated Financial Statements.Account.
Note 2—Management Agreements, Arrangements and Related Party Transactions
Investment advisorymanagement, administrative and distribution services are provided to the Account at cost by TIAA. Services provided at cost are paid by the Account on a daily basis based upon projected expenses to be provided to the Account. Payments are adjusted periodically to ensure daily payments are as close as possible to the Account’s actual expenses incurred. Differences between actual expenses and the amounts paid by the Account are reconciled and adjusted quarterly.
Investment management services for the Account are provided by TIAA officers, under the direction and control of the Board, pursuant to investment management procedures adopted by TIAA for the Account. TIAA’s investment management decisions for the Account are subject to review by the Account’s independent fiduciary. TIAA also provides various portfolio accounting and related services for the Account.
Part of TIAA’s compensation for provision of at cost investment management services to the Account includes reimbursement of costs incurred by TIAA to manage certain of the Account’s joint ventures. Such joint ventures also reimburse the Account directly in its capacity as general partner or managing member (collectively, the “GP”) of the joint venture in the form of an asset management fee for GP-related services provided by the Account, and such fee is based on a percentage of the fair market value of the underlying properties held in the joint venture.
The Account is a party to the Distribution Agreement for the Contracts Funded by the TIAA Real Estate Account (the “Distribution Agreement”), dated January 1, 2008, by and among TIAA, for itself and on behalf of the Account, and TIAA-CREF Individual and Institutional Services, LLC (“Services”),. Services is a direct wholly-owned subsidiary of TIAA, and is registered with the SEC as a broker-dealer and a registered broker-dealerinvestment adviser and is a member of the Financial Industry Regulatory Authority. Pursuant to the Distribution Agreement, Services performs distribution services for the Account which include, among other things, (i) distributingdistribution of annuity contracts issued by TIAA and funded by the Account, (ii) advising existing annuity contract owners in connection with their accumulations and (iii) helping employers implement and manage retirement plans. In addition, TIAA
8
performs administrative functions for the Account, which include, among other things, (i) maintaining accounting records and performing accounting services, (ii) receiving and allocating premiums, (iii) calculating and making annuity payments, (iv) processing withdrawal requests, (v) providing regulatory compliance and reporting services, (vi) maintaining the Account’s records of contract ownership and (vii) otherwise assisting generally in all aspects of the Account’s operations. Both distribution services (pursuant to the Distribution Agreement) and administrative services are provided to the Account by Services and TIAA, as applicable, on an at cost basis.
The Distribution Agreement is terminable by either party upon 60 days written notice and terminates automatically upon any assignment thereof.
In addition to providing the services described above, TIAA charges the Account fees to bear certain mortality and expense risks and risks with providing the liquidity guarantee. These fees are charged as a percentage of the net assets of the Account. Rates for these fees are established annually.
Once an Account participant begins receiving lifetime annuity income benefits, payment levels cannot be reduced as a result of the Account’s actual mortality experience. As such, mortality and expense risk are contractual charges for TIAA’s assumption of this risk.
TIAA and Services provide investment management, administrative and distribution services at cost. TIAA and Services receive payments fromprovides the Account on a daily basis according to formulas established each year and adjusted periodically with the objective of keeping the payments as close as possible to the Account’s expenses actually incurred. Any differences between actual expenses and the amounts paid by the Account are adjusted quarterly.
The Account has loans receivable outstanding with related parties as of March 31, 2023. Two of the loans are with a joint venture partner and the other loans are with joint ventures in which the Account also has an equity interest. The loans are held at fair value in accordance with the valuation policies described in Note 1—Organization and Significant Accounting Policies of the Account's 2022 Form 10-K. The following table presents the key terms of the loans as of the reporting date (in millions):
| Related Party | Equity Ownership Interest | Interest Rate | Maturity Date | Fair Value at | ||||||||||||||||||||||||||||||||||||||||
| Principal | March 31, 2023 | December 31, 2022 | ||||||||||||||||||||||||||||||||||||||||||
| 2023 | 2022 | |||||||||||||||||||||||||||||||||||||||||||
| 36.5 | 36.5 | MRA Hub 34 Holding, LLC | 95.00% | 2.50% + LIBOR | 9/1/2023 | $ | 36.5 | $ | 36.5 | |||||||||||||||||||||||||||||||||||
| 0.5 | 0.5 | MRA 34 LLC | —% | 3.75% + LIBOR | 8/26/2023 | 0.5 | 0.5 | |||||||||||||||||||||||||||||||||||||
| 32.8 | 32.8 | THP Student Housing, LLC | 97.00% | 3.20% | 9/1/2024 | 32.9 | 32.9 | |||||||||||||||||||||||||||||||||||||
| 1.5 | — | MR MCC 3 Sponsor, LLC | 80.00% | 6.00% | 12/1/2025 | 1.4 | — | |||||||||||||||||||||||||||||||||||||
| TOTAL LOANS RECEIVABLE WITH RELATED PARTIES | 71.3 | 69.9 | ||||||||||||||||||||||||||||||||||||||||||
9
Note 3—CreditConcentrations of Risk Concentrations
Concentrations of credit risk may arise when a number of properties or tenants are located in a similar geographic region such that the economic conditions of that region could impact tenants’ obligations to meet their contractual obligations or cause the values of individual properties to decline. TheAdditionally, concentrations of risk may arise if any one tenant comprises a significant amount of the Account's rent, or if tenants are concentrated in a particular industry.
As of March 31, 2023, the Account hashad no significant concentrations of tenants as no single tenant hashad annual contract rent that makesmade up more than 3%4% of the rental income of the Account. Moreover, the Account's tenants have no notable concentration present in any one industry.
The Account’s wholly-owned real estate investments and investments in joint ventureventures are primarily located in the United States. The following table represents the diversification of the Account’s portfolio by region and property type as of September 30, 2017:March 31, 2023:
Diversification by Fair Value(1) | |||||||||||||||||||||||||||||||||||
West(2) | South(3) | East(4) | Midwest(5) | Foreign(6) | Total | ||||||||||||||||||||||||||||||
| Industrial | 17.2 | % | 7.7 | % | 2.6 | % | 1.5 | % | — | % | 29.0 | % | |||||||||||||||||||||||
| Apartments | 8.0 | % | 10.6 | % | 6.8 | % | 1.0 | % | — | % | 26.4 | % | |||||||||||||||||||||||
| Office | 7.6 | % | 5.5 | % | 13.0 | % | 0.2 | % | — | % | 26.3 | % | |||||||||||||||||||||||
| Retail | 3.7 | % | 5.4 | % | 2.7 | % | 0.7 | % | — | % | 12.5 | % | |||||||||||||||||||||||
Other(7) | 1.8 | % | 2.1 | % | 1.5 | % | 0.3 | % | 0.1 | % | 5.8 | % | |||||||||||||||||||||||
| Total | 38.3 | % | 31.3 | % | 26.6 | % | 3.7 | % | 0.1 | % | 100.0 | % | |||||||||||||||||||||||
Diversification by Fair Value(1) | ||||||||||||||
| West | East | South | Midwest | Total | ||||||||||
| Office | 16.1 | % | 20.7 | % | 5.6 | % | — | % | 42.4 | % | ||||
| Apartment | 8.8 | % | 8.1 | % | 4.0 | % | 0.8 | % | 21.7 | % | ||||
| Retail | 7.7 | % | 3.0 | % | 7.7 | % | 0.5 | % | 18.9 | % | ||||
| Industrial | 7.1 | % | 2.0 | % | 4.1 | % | 0.8 | % | 14.0 | % | ||||
Other(2) | 0.3 | % | 2.5 | % | 0.1 | % | 0.1 | % | 3.0 | % | ||||
| Total | 40.0 | % | 36.3 | % | 21.5 | % | 2.2 | % | 100.0 | % | ||||
(1)Wholly-owned properties are represented at fair value and gross of any debt, while joint venture properties are represented at the net equity value.
(2)Properties in the “West” region are located in: AK, AZ, CA, CO, HI, ID, MT, NM, NV, OR, UT, WA, WYWY.
(3)Properties in the “South” region are located in: AL, AR, FL, GA, LA, MS, OK, TN, TX.
(4)Properties in the “East” region are located in: CT, DC, DE, KY, MA, MD, ME, NC, NH, NJ, NY, PA, RI, SC, VA, VT, WVWV.
(5)Properties in the “Midwest” region are located in: IA, IL, IN, KS, MI, MN, MO, ND, NE, OH, SD, WIWI.
(6)Represents a developable land investment in Ireland.
(7)Represents interests in Storage Portfolio investments, a hotel investment and land.
Note 4—Leases
The Account’s wholly-owned real estate properties are leased to tenants under operating lease agreements which expire on various dates through 2051. Rental income is recognized in accordance with the billing terms of the lease agreements. The leases do not have material variable payments, material residual value guarantees or material restrictive covenants. Certain leases have the option to extend or terminate at the tenant's discretion, with termination options resulting in additional fees due to the Account. Aggregate minimum annual rentals for wholly-owned real estate investments owned by the Account through the non-cancelable lease term, excluding short-term residential leases, as of March 31, 2023 and December 31, 2022 are as follows (in millions):
| As of | ||||||||||||||
| Years Ended | March 31, 2023 | December 31, 2022 | ||||||||||||
| 2023 | $ | 541.8 | (1) | $ | 689.0 | |||||||||
| 2024 | 682.8 | 634.5 | ||||||||||||
| 2025 | 607.1 | 556.9 | ||||||||||||
| 2026 | 495.5 | 460.0 | ||||||||||||
| 2027 | 381.7 | 362.0 | ||||||||||||
| Thereafter | 1,238.4 | 1,276.1 | ||||||||||||
| Total | $ | 3,947.3 | $ | 3,978.5 | ||||||||||
(1) Representative of minimum rents owed for the remaining months of the calendar year ending December 31, 2023.
10
Certain leases provide for additional rental amounts based upon the recovery of actual operating expenses in excess of specified base amounts, sales volume or contractual increases as defined in the lease agreement. These contractual contingent rentals are not included in the table above.
The Account has ground leases for which the Account is the lessee. The leases do not contain material residual value guarantees or material restrictive covenants. The fair value of right-of-use assets and leases liabilities related to ground leases are reflected on the balance sheet within other assets and other liabilities, respectively.
The fair values and key terms of the right-of-use assets and lease liabilities related to the Account's ground leases are as follows (in millions):
| As of | ||||||||||||||
| March 31, 2023 | December 31, 2022 | |||||||||||||
| Assets: | ||||||||||||||
| Right-of-use assets, at fair value | $ | 37.3 | $ | 43.3 | ||||||||||
| Liabilities: | ||||||||||||||
| Ground lease liabilities, at fair value | $ | 37.3 | $ | 43.3 | ||||||||||
| Key Terms: | ||||||||||||||
| Weighted-average remaining lease term (years) | 66.6 | 69.9 | ||||||||||||
Weighted-average discount rate(1) | 7.93 | % | 7.51 | % | ||||||||||
(1) Discount rates are reflective of the rates utilized during the most recent appraisal of the associated real estate investments.
For both the three months ended March 31, 2023 and 2022, operating lease costs related to ground leases were $0.6 million and $0.5 million, respectively. These costs include variable lease costs, which are immaterial. Aggregate future minimum annual payments for ground leases held by the Account are as follows (in millions):
| As of | ||||||||||||||
| March 31, 2023 | December 31, 2022 | |||||||||||||
| Years Ended | ||||||||||||||
| 2023 | $ | 1.8 | (1) | $ | 2.4 | |||||||||
| 2024 | 2.5 | 2.4 | ||||||||||||
| 2025 | 2.6 | 2.5 | ||||||||||||
| 2026 | 2.6 | 2.5 | ||||||||||||
| 2027 | 2.6 | 2.5 | ||||||||||||
| Thereafter | 448.7 | 424.3 | ||||||||||||
| Total | $ | 460.8 | $ | 436.6 | ||||||||||
(1) Representative of minimum rents owed for the remaining months of the calendar year ending December 31, 2023.
11
Note 5—Assets and Liabilities Measured at Fair Value on a Recurring Basis
Valuation Hierarchy: The Account’s fair value measurements are grouped categorically into three levels, as defined by the FASB. The levels are defined as follows:
•Level 1—Valuations using unadjusted1 fair value inputs are quoted prices for assets tradedidentical items in active, liquid and visible markets such as stocks listed on the New York Stock Exchange. Active markets are defined as having the following characteristics for the measured asset or liability: (i) many transactions, (ii) current prices, (iii) price quotes not varying substantially among market makers, (iv) narrow bid/ask spreads and (v) most information regarding the issuer is publicly available. Level 1 assets held by the Account are generally marketable equity securities.stock exchanges.
•Level 3 fair value inputs reflect our best estimate of inputs and assumptions market participants would use in pricing an asset or liability either directly or indirectly. Level 2at the measurement date. The inputs include:
An asset or liabilities. Examples of Level 3 assets and liabilities which may be held by the Account from time to time include investments in real estate, investments in joint ventures, and loans receivable and payable.
The following tables show the major categories of assets and liabilities measured at fair value on a recurring basis as of September 30, 2017 (unaudited)March 31, 2023 and December 31, 2016,2022, using unadjusted quoted prices in active markets for identical assets (Level 1); significant other observable inputs (Level 2); and significant unobservable inputs (Level 3); and fair value using the practical expedient (in millions)(millions):
| Description | Level 1: Quoted Prices in Active Markets for Identical Assets | Level 2: Significant Other Observable Inputs | Level 3: Significant Unobservable Inputs | Fair Value Using Practical Expedient | Total at March 31, 2023 | |||||||||||||||||||||||||||
| Real estate properties | $ | — | $ | — | $ | 20,057.9 | $ | — | $ | 20,057.9 | ||||||||||||||||||||||
| Real estate joint ventures | — | — | 6,762.1 | — | 6,762.1 | |||||||||||||||||||||||||||
| Real estate funds | — | — | — | 931.9 | 931.9 | |||||||||||||||||||||||||||
| Real estate operating business | — | — | 636.0 | — | 636.0 | |||||||||||||||||||||||||||
| Marketable securities: | ||||||||||||||||||||||||||||||||
| U.S. government agency notes | — | 709.2 | — | — | 709.2 | |||||||||||||||||||||||||||
| Foreign government agency notes | — | 17.1 | — | — | 17.1 | |||||||||||||||||||||||||||
| U.S. treasury securities | — | 255.8 | — | — | 255.8 | |||||||||||||||||||||||||||
| Corporate bonds | — | 273.2 | — | — | 273.2 | |||||||||||||||||||||||||||
Loans receivable(1) | — | — | 1,450.2 | — | 1,450.2 | |||||||||||||||||||||||||||
| Total Investments at March 31, 2023 | $ | — | $ | 1,255.3 | $ | 28,906.2 | $ | 931.9 | $ | 31,093.4 | ||||||||||||||||||||||
| Loans payable | $ | — | $ | — | $ | (2,129.9) | $ | — | $ | (2,129.9) | ||||||||||||||||||||||
| Other unsecured debt | $ | — | $ | (460.0) | $ | (500.0) | $ | — | $ | (960.0) | ||||||||||||||||||||||
12
| Description | Level 1: Quoted Prices in Active Markets for Identical Assets | Level 2: Significant Other Observable Inputs | Level 3: Significant Unobservable Inputs | Fair Value Using Practical Expedient | Total at September 30, 2017 | |||||||||||||||
| Real estate properties | $ | — | $ | — | $ | 15,654.2 | $ | — | $ | 15,654.2 | ||||||||||
| Real estate joint ventures | — | — | 5,675.4 | — | 5,675.4 | |||||||||||||||
| Limited partnerships | — | — | — | 140.7 | 140.7 | |||||||||||||||
| Marketable securities: | ||||||||||||||||||||
| Real estate-related | 1,121.0 | — | — | — | 1,121.0 | |||||||||||||||
| Government agency notes | — | 3,276.1 | — | — | 3,276.1 | |||||||||||||||
| United States Treasury securities | — | 1,017.3 | — | — | 1,017.3 | |||||||||||||||
| Loans receivable | — | — | 298.8 | — | 298.8 | |||||||||||||||
| Total Investments at September 30, 2017 | $ | 1,121.0 | $ | 4,293.4 | $ | 21,628.4 | $ | 140.7 | $ | 27,183.5 | ||||||||||
| Mortgage loans payable | $ | — | $ | — | $ | (2,311.0 | ) | $ | — | $ | (2,311.0 | ) | ||||||||
| Description | Level 1: Quoted Prices in Active Markets for Identical Assets | Level 2: Significant Other Observable Inputs | Level 3: Significant Unobservable Inputs | Fair Value Using Practical Expedient | Total at December 31, 2022 | |||||||||||||||||||||||||||
| Real estate properties | $ | — | $ | — | $ | 20,444.0 | $ | — | $ | 20,444.0 | ||||||||||||||||||||||
| Real estate joint ventures | — | — | 7,103.6 | — | 7,103.6 | |||||||||||||||||||||||||||
| Real estate funds | — | — | — | 893.4 | 893.4 | |||||||||||||||||||||||||||
| Real estate operating business | — | — | 641.9 | — | 641.9 | |||||||||||||||||||||||||||
| Marketable securities: | ||||||||||||||||||||||||||||||||
| U.S. government agency notes | — | 902.9 | — | — | 902.9 | |||||||||||||||||||||||||||
| Foreign government agency notes | — | 16.9 | — | — | 16.9 | |||||||||||||||||||||||||||
| U.S. treasury securities | — | 574.0 | — | — | 574.0 | |||||||||||||||||||||||||||
| Corporate bonds | — | 536.4 | — | 536.4 | ||||||||||||||||||||||||||||
Loans receivable(1) | — | — | 1,488.6 | — | 1,488.6 | |||||||||||||||||||||||||||
| Total Investments at December 31, 2022 | $ | — | $ | 2,030.2 | $ | 29,678.1 | $ | 893.4 | $ | 32,601.7 | ||||||||||||||||||||||
| Loans payable | $ | — | $ | — | $ | (2,069.7) | $ | — | $ | (2,069.7) | ||||||||||||||||||||||
| Other unsecured debt | $ | — | $ | (453.1) | $ | (500.0) | $ | — | $ | (953.1) | ||||||||||||||||||||||
| Description | Level 1: Quoted Prices in Active Markets for Identical Assets | Level 2: Significant Other Observable Inputs | Level 3: Significant Unobservable Inputs | Fair Value Using Practical Expedient | Total at December 31, 2016 | |||||||||||||||
| Real estate properties | $ | — | $ | — | $ | 15,452.8 | $ | — | $ | 15,452.8 | ||||||||||
| Real estate joint ventures | — | — | 5,622.4 | — | 5,622.4 | |||||||||||||||
| Limited partnerships | — | — | — | 137.5 | 137.5 | |||||||||||||||
| Marketable securities: | ||||||||||||||||||||
| Real estate-related | 1,081.5 | — | — | — | 1,081.5 | |||||||||||||||
| Government agency notes | — | 2,308.9 | — | — | 2,308.9 | |||||||||||||||
| United States Treasury securities | — | 1,744.9 | — | — | 1,744.9 | |||||||||||||||
| Loans receivable | — | — | 295.7 | — | 295.7 | |||||||||||||||
| Total Investments at December 31, 2016 | $ | 1,081.5 | $ | 4,053.8 | $ | 21,370.9 | $ | 137.5 | $ | 26,643.7 | ||||||||||
| Mortgage loans payable | $ | — | $ | — | $ | (2,332.1 | ) | $ | — | $ | (2,332.1 | ) | ||||||||
(1) Includes loans receivable with related parties.
The following tables show the reconciliation of the beginning and ending balances for assets and liabilities measured at fair value on a recurring basis using significant unobservable inputs (Level 3) during the three and nine months ended September 30, 2017March 31, 2023 and 20162022 (in millions, unaudited)millions):
| Real Estate Properties | Real Estate Joint Ventures | Real Estate Operating Business | Loans Receivable(3) | Total Level 3 Investments | Loans Payable | Other Unsecured Debt | ||||||||||||||||||||||||||||||||||||||||||||
| For the three months ended March 31, 2023 | ||||||||||||||||||||||||||||||||||||||||||||||||||
| Beginning balance January 1, 2023 | $ | 20,444.0 | $ | 7,103.6 | $ | 641.9 | $ | 1,488.6 | $ | 29,678.1 | $ | (2,069.7) | $ | (500.0) | ||||||||||||||||||||||||||||||||||||
| Total realized and unrealized (losses) included in changes in net assets | (487.4) | (377.3) | (5.9) | (43.0) | (913.6) | (6.8) | — | |||||||||||||||||||||||||||||||||||||||||||
Purchases(1) | 101.3 | 36.2 | — | 12.5 | 150.0 | (98.9) | — | |||||||||||||||||||||||||||||||||||||||||||
| Sales | — | — | — | — | — | — | — | |||||||||||||||||||||||||||||||||||||||||||
Settlements(2) | — | (0.4) | — | (7.9) | (8.3) | 45.5 | — | |||||||||||||||||||||||||||||||||||||||||||
| Ending balance March 31, 2023 | $ | 20,057.9 | $ | 6,762.1 | $ | 636.0 | $ | 1,450.2 | $ | 28,906.2 | $ | (2,129.9) | $ | (500.0) | ||||||||||||||||||||||||||||||||||||
13
| Real Estate Properties | Real Estate Joint Ventures | Loans Receivable | Total Level 3 Investments | Mortgage Loans Payable | ||||||||||||||||
| For the three months ended September 30, 2017 | ||||||||||||||||||||
| Beginning balance July 1, 2017 | $ | 15,496.6 | $ | 5,946.8 | $ | 297.3 | $ | 21,740.7 | $ | (2,290.1 | ) | |||||||||
| Total realized and unrealized gains (losses) included in changes in net assets | 65.8 | 17.6 | 1.4 | 84.8 | (4.1 | ) | ||||||||||||||
Purchases(1) | 317.1 | 13.1 | 0.1 | 330.3 | (17.7 | ) | ||||||||||||||
| Sales | (225.3 | ) | — | — | (225.3 | ) | — | |||||||||||||
Settlements(2) | — | (302.1 | ) | — | (302.1 | ) | 0.9 | |||||||||||||
| Ending balance September 30, 2017 | $ | 15,654.2 | $ | 5,675.4 | $ | 298.8 | $ | 21,628.4 | $ | (2,311.0 | ) | |||||||||
| Real Estate Properties | Real Estate Joint Ventures | Real Estate Operating Business | Loans Receivable(3) | Total Level 3 Investments | Loans Payable | Line of Credit | ||||||||||||||||||||||||||||||||||||||
| For the three months ended March 31, 2022 | ||||||||||||||||||||||||||||||||||||||||||||
| Beginning balance January 1, 2022 | $ | 18,903.9 | $ | 7,175.9 | $ | 326.3 | $ | 1,492.6 | $ | 27,898.7 | $ | (2,380.5) | $ | (500.0) | ||||||||||||||||||||||||||||||
| Total realized and unrealized gains included in changes in net assets | 1,204.0 | 122.8 | 60.4 | 1.0 | 1,388.2 | 3.7 | — | |||||||||||||||||||||||||||||||||||||
Purchases(1) | 228.9 | 251.3 | 100.9 | 5.2 | 586.3 | (3.0) | — | |||||||||||||||||||||||||||||||||||||
Sales(4) | (157.7) | — | — | (161.4) | (319.1) | — | — | |||||||||||||||||||||||||||||||||||||
Settlements(2) | — | (296.7) | — | (8.2) | (304.9) | 41.8 | — | |||||||||||||||||||||||||||||||||||||
| Ending balance March 31, 2022 | $ | 20,179.1 | $ | 7,253.3 | $ | 487.6 | $ | 1,329.2 | $ | 29,249.2 | $ | (2,338.0) | $ | (500.0) | ||||||||||||||||||||||||||||||
(1)Includes purchases, contributions for joint ventures, capital expenditures, lending for loans receivable, assumption of loans payable and term loan borrowings.
| Real Estate Properties | Real Estate Joint Ventures | Loans Receivable | Total Level 3 Investments | Mortgage Loans Payable | ||||||||||||||||
| For the nine months ended September 30, 2017 | ||||||||||||||||||||
| Beginning balance January 1, 2017 | $ | 15,452.8 | $ | 5,622.4 | $ | 295.7 | $ | 21,370.9 | $ | (2,332.1 | ) | |||||||||
| Total realized and unrealized gains (losses) included in changes in net assets | 133.2 | 80.4 | 1.4 | 215.0 | (10.6 | ) | ||||||||||||||
Purchases(1) | 408.9 | 275.6 | 1.7 | 686.2 | (17.7 | ) | ||||||||||||||
| Sales | (340.7 | ) | — | — | (340.7 | ) | — | |||||||||||||
Settlements(2) | — | (303.0 | ) | — | (303.0 | ) | 49.4 | |||||||||||||
| Ending balance September 30, 2017 | $ | 15,654.2 | $ | 5,675.4 | $ | 298.8 | $ | 21,628.4 | $ | (2,311.0 | ) | |||||||||
(3)Includes loans receivable with related parties.
| Real Estate Properties | Real Estate Joint Ventures | Loans Receivable | Total Level 3 Investments | Mortgage Loans Payable | ||||||||||||||||
| For the three months ended September 30, 2016 | ||||||||||||||||||||
| Beginning balance July 1, 2016 | $ | 15,131.3 | $ | 4,238.9 | $ | 100.6 | $ | 19,470.8 | $ | (2,383.2 | ) | |||||||||
| Total realized and unrealized gains (losses) included in changes in net assets | 53.3 | 23.9 | 0.1 | 77.3 | (29.1 | ) | ||||||||||||||
Purchases(1) | 82.1 | 1,043.4 | 69.0 | 1,194.5 | — | |||||||||||||||
| Sales | (58.0 | ) | — | — | (58.0 | ) | — | |||||||||||||
Settlements(2) | — | (0.2 | ) | — | (0.2 | ) | 34.2 | |||||||||||||
| Ending balance September 30, 2016 | $ | 15,208.7 | $ | 5,306.0 | $ | 169.7 | $ | 20,684.4 | $ | (2,378.1 | ) | |||||||||
| Real Estate Properties | Real Estate Joint Ventures | Loans Receivable | Total Level 3 Investments | Mortgage Loans Payable | ||||||||||||||||
| For the nine months ended September 30, 2016 | ||||||||||||||||||||
| Beginning balance January 1, 2016 | $ | 14,606.2 | $ | 4,068.4 | $ | 100.6 | $ | 18,775.2 | $ | (1,794.4 | ) | |||||||||
| Total realized and unrealized gains (losses) included in changes in net assets | 268.7 | 157.4 | 0.1 | 426.2 | (54.8 | ) | ||||||||||||||
Purchases(1) | 486.7 | 1,082.1 | 69.0 | 1,637.8 | (563.5 | ) | ||||||||||||||
| Sales | (152.9 | ) | — | — | (152.9 | ) | — | |||||||||||||
Settlements(2) | — | (1.9 | ) | — | (1.9 | ) | 34.6 | |||||||||||||
| Ending balance September 30, 2016 | $ | 15,208.7 | $ | 5,306.0 | $ | 169.7 | $ | 20,684.4 | $ | (2,378.1 | ) | |||||||||
(4)Real estate properties amount shown is inclusive of post closing realized losses.
The following table shows quantitative information about unobservable inputs related to the Level 3 fair value measurements as of September 30, 2017 (unaudited).
March 31, 2023.
| Type | Asset Class | Valuation Technique(s) | Unobservable Inputs(1) | Range (Weighted Average) | ||||||||||
| Real Estate Properties and Joint Ventures | Office | Income Approach—Discounted Cash Flow | Discount Rate Terminal Capitalization Rate | 6.0% - 9.3% (7.2%) 5.0% - 8.5% (6.0%) | ||||||||||
| Income Approach—Direct Capitalization | Overall Capitalization Rate | 4.0% - 8.0% | ||||||||||||
| Industrial | ||||||||||||||
| Income Approach—Discounted Cash Flow | Discount Rate Terminal Capitalization Rate | 6.0% - 4.5% - 7.0% (5.1%) | ||||||||||||
| Income Approach—Direct Capitalization | Overall Capitalization Rate | 1.8% - 6.0% (4.5%) | ||||||||||||
| Apartment | Income Approach—Discounted Cash Flow | Discount Rate Terminal Capitalization Rate | 5.8% - 7.3% (6.3%) 4.5% - 5.8% (5.0%) | |||||||||||
| Income Approach—Direct Capitalization | Overall Capitalization Rate | 4.0% - 5.3% (4.4%) | ||||||||||||
| Retail | Income Approach—Discounted Cash Flow | Discount Rate Terminal Capitalization Rate | 6.0% - 11.5% (7.4%) 5.0% - 8.8% (6.0%) | |||||||||||
| Income Approach—Direct Capitalization | Overall Capitalization Rate | 4.5% - 8.3% (5.5%) | ||||||||||||
| Hotel | ||||||||||||||
| Income Approach—Discounted Cash Flow | Discount Rate Terminal Capitalization Rate | 10.0% 8.0% | ||||||||||||
| Income Approach—Direct Capitalization | Overall Capitalization Rate | |||||||||||||
| Real Estate Operating Business | Income Approach—Discounted Cash Flow | Discount Rate Terminal | 10.8% 7.3% | |||||||||||
| Office | Discounted Cash Flow | Loan to Value Ratio Equivalency Rate | 36.0% - 5.9% - | |||||||||||
| Net Present Value | Loan to Value Ratio Weighted Average Cost of Capital Risk Premium Multiple | 36.0% - 1.1 - | ||||||||||||
| Discounted Cash Flow | Loan to Value Ratio Equivalency Rate | 28.3% - 5.4% - | ||||||||||||
| Net Present Value | Loan to Value Ratio Weighted Average Cost of Capital Risk Premium Multiple | 28.3% - 1.1 - | ||||||||||||
| Discounted Cash Flow | Loan to Value Ratio Equivalency Rate | 26.3% - 5.8% - | ||||||||||||
| Net Present Value | Loan to Value Ratio Weighted Average Cost of Capital Risk Premium Multiple | 26.3% - 1.1 - | ||||||||||||
| Discounted Cash Flow | Loan to Value Ratio Equivalency Rate | 47.3% - 5.4% - | ||||||||||||
14
| Type | Asset Class | Valuation Technique(s) | Unobservable Inputs(1) | Range (Weighted Average) | ||||||||||
| Net Present Value | Loan to Value Ratio Weighted Average Cost of Capital Risk Premium Multiple | 47.3% - 77.7% (56.5%) 1.1- 1.5 (1.3) | ||||||||||||
| Loans Receivable, including those with related parties | Office | Discounted Cash Flow | Loan to Value Ratio Equivalency Rate | 40.1% - 105.0% (69.4%) 6.4% - 19.7% (10.0%) | ||||||||||
| Industrial | Discounted Cash Flow | Loan to Value Ratio Equivalency Rate | 8.8% - 66.2% (41.5%) 6.0% - 10.0% (7.0%) | |||||||||||
| Apartment | Discounted Cash Flow | Loan to Value Ratio Equivalency Rate | 60.8% - 70.4% (65.0%) 7.0% - 8.7% (7.7%) | |||||||||||
| Retail & Hospitality | Discounted Cash Flow | Loan to Value Ratio Equivalency Rate | 54.9% - 130.5% (86.6%) 7.9% - 18.8% (10.8%) | |||||||||||
The significantfollowing table shows quantitative information about unobservable inputs used inrelated to the Level 3 fair value measurementmeasurements as of March 31, 2022.
| Type | Asset Class | Valuation Technique(s) | Unobservable Inputs(1) | Range (Weighted Average) | ||||||||||
| Real Estate Properties and Joint Ventures | Office | Income Approach—Discounted Cash Flow | Discount Rate Terminal Capitalization Rate | 5.8% - 9.8% (6.6%) 4.5% - 8.5% (5.5%) | ||||||||||
| Income Approach—Direct Capitalization | Overall Capitalization Rate | 4.0% - 8.0% (5.0%) | ||||||||||||
| Industrial | Income Approach—Discounted Cash Flow | Discount Rate Terminal Capitalization Rate | 4.8% - 8.0% (5.8%) 3.5% - 6.8% (4.4%) | |||||||||||
| Income Approach—Direct Capitalization | Overall Capitalization Rate | 2.0% - 6.0% (3.8%) | ||||||||||||
| Apartment | Income Approach—Discounted Cash Flow | Discount Rate Terminal Capitalization Rate | 5.3% - 7.0% (5.8%) 4.0% - 5.5% (4.5%) | |||||||||||
| Income Approach—Direct Capitalization | Overall Capitalization Rate | 3.5% - 5.0% (4.0%) | ||||||||||||
| Retail | Income Approach—Discounted Cash Flow | Discount Rate Terminal Capitalization Rate | 6.0% - 11.5% (7.0%) 5.0% - 8.7% (5.7%) | |||||||||||
| Income Approach—Direct Capitalization | Overall Capitalization Rate | 4.5% - 8.6% (5.2%) | ||||||||||||
| Hotel | Income Approach—Discounted Cash Flow | Discount Rate Terminal Capitalization Rate | 9.8% 7.8% | |||||||||||
| Income Approach—Direct Capitalization | Overall Capitalization Rate | 7.5% | ||||||||||||
| Real Estate Operating Business | Income Approach—Discounted Cash Flow | Discount Rate | 8.2 | % | ||||||||||
| Terminal Growth Rate | 5.3 | % | ||||||||||||
| Market Approach | EBITDA Multiple | 25.0x | ||||||||||||
| Loans Receivable, including those with related parties | Office | Discounted Cash Flow | Loan to Value Ratio Equivalency Rate | 40.4% - 94.7% (69.8%) 2.3% - 9.5% (5.6%) | ||||||||||
| Industrial | Discounted Cash Flow | Loan to Value Ratio Equivalency Rate | 29.9% - 71.3% (65.3%) 4.3% - 5.2% (4.7%) | |||||||||||
| Residential | Discounted Cash Flow | Loan to Value Ratio Equivalency Rate | 38.4% - 76.5% (49.0%) 2.5% - 8.6% (5.0%) | |||||||||||
| Retail & Hospitality | Discounted Cash Flow | Loan to Value Ratio Equivalency Rate | 59.8% - 79.8% (67.6%) 3.0% - 7.3% (4.3%) | |||||||||||
| Loans Payable | Office | Discounted Cash Flow | Loan to Value Ratio Equivalency Rate | 35.8% - 57.5% (45.4%) 1.8% - 3.7% (3.2%) | ||||||||||
| Net Present Value | Loan to Value Ratio Weighted Average Cost of Capital Risk Premium Multiple | 35.8% - 57.5% (45.4%) 1.2 - 1.4 (1.3) | ||||||||||||
| Industrial | Discounted Cash Flow | Loan to Value Ratio Equivalency Rate | 31.2% - 38.4% (34.1%) 3.3% - 3.9% (3.6%) | |||||||||||
| Net Present Value | Loan to Value Ratio Weighted Average Cost of Capital Risk Premium Multiple | 31.2% - 38.4% (34.1%) 1.2 - 1.3 (1.2) | ||||||||||||
| Residential | Discounted Cash Flow | Loan to Value Ratio Equivalency Rate | 27.2% - 67.8% (41.2%) 1.9% - 3.2% (2.6%) | |||||||||||
| Net Present Value | Loan to Value Ratio Weighted Average Cost of Capital Risk Premium Multiple | 27.2% - 67.8% (41.2%) 1.2 - 1.5 (1.3) | ||||||||||||
| Retail | Discounted Cash Flow | Loan to Value Ratio Equivalency Rate | 34.8% - 74.2% (45.4%) 3.2% - 4.2% (3.6%) | |||||||||||
| Net Present Value | Loan to Value Ratio Weighted Average Cost of Capital Risk Premium Multiple | 34.8% - 74.2% (45.4%) 1.2 - 1.8 (1.4) | ||||||||||||
(1) Equivalency Rate is defined as the Account’s real estate property and joint venture investments areprevailing market interest rate used to discount the selection of certain investment rates (Discount Rate, Terminal Capitalization Rate, and Overall Capitalization Rate). contractual loan payments.
15
Significant increases (decreases) in any of those inputs in isolation would result in significantly lower (higher) fair value measurements, respectively.
During the ninethree months ended September 30, 2017March 31, 2023 and 2016,2022, there were no transfers between Levels 1, 2 or 3.
The amount of total net unrealized gains (losses) included in changes in net assets attributable to the change in net unrealized gains (losses) relating to Level 3 investments and mortgage loans payable using significant unobservable inputs still held as of the reporting date is as follows (in millions, unaudited)(millions):
| Real Estate Properties | Real Estate Joint Ventures | Real Estate Operating Business | Loans Receivable(1) | Total Level 3 Investments | Loans Payable | ||||||||||||||||||||||||||||||
| For the three months ended March 31, 2023 | $ | (487.3) | $ | (391.1) | $ | (6.0) | $ | (43.0) | $ | (927.4) | $ | (6.8) | |||||||||||||||||||||||
| For the three months ended March 31, 2022 | $ | 1,202.3 | $ | 125.6 | $ | 60.4 | $ | 0.9 | $ | 1,389.2 | $ | 3.7 | |||||||||||||||||||||||
Real Estate Properties | Real Estate Joint Ventures | Loans Receivable | Total Level 3 Investments | Mortgage Loans Payable | |||||||||||||||
| For the three months ended September 30, 2017 | $ | 68.0 | $ | 17.9 | $ | 1.4 | $ | 87.3 | $ | (4.1 | ) | ||||||||
| For the nine months ended September 30, 2017 | $ | 139.0 | $ | 80.7 | $ | 1.4 | $ | 221.1 | $ | (10.6 | ) | ||||||||
| For the three months ended September 30, 2016 | $ | 53.9 | $ | 23.7 | $ | 0.1 | $ | 77.7 | $ | (29.1 | ) | ||||||||
| For the nine months ended September 30, 2016 | $ | 270.1 | $ | 157.2 | $ | 0.1 | $ | 427.4 | $ | (54.8 | ) | ||||||||
Note 5—6—Investments in Joint Ventures
The Account owns interests in several real estate properties through joint ventures and receives distributions and allocations of profits and losses from the joint ventures based on the Account’s ownership interest in those investments. Several of these joint ventures have mortgage loans payable collateralized by the properties owned by the aforementioned joint ventures. At September 30, 2017,March 31, 2023, the Account held investments in joint ventures with ownership interest percentages that ranged from 33.3%2.0% to 97.5%98.5%. Certain joint ventures are subject to adjusted distribution percentages when earnings in the investment reach a pre-determinedpredetermined threshold. The fair value of the Account’s equity interest in these joint ventures was $5.7 billion and $5.6 billion at September 30, 2017 and December 31, 2016, respectively.
A condensed summary of the results of operations of the joint ventures are shown below (millions):
| For the Three Months Ended March 31, | |||||||||||||||||||||||
| 2023 | 2022 | ||||||||||||||||||||||
| Operating Revenue and Expenses | |||||||||||||||||||||||
| Revenues | $ | 305.6 | $ | 269.2 | |||||||||||||||||||
| Expenses | 184.3 | 167.3 | |||||||||||||||||||||
| Excess of revenues over expenses | $ | 121.3 | $ | 101.9 | |||||||||||||||||||
Note 7—Investments in Real Estate Funds
The Account has ownership interests in real estate funds (each a “Fund”, and collectively the “Funds”). The Funds are set up as limited partnerships or entities similar to a limited partnership, and as such, meet the definition of a VIE as the limited partners collectively lack the power, through voting or similar rights, to direct the activities of the Fund that most significantly impact the Fund's economic performance. Management has determined that the Account is not the primary beneficiary for any of the Funds, as the Account lacks the power to direct the activities of each Fund that most significantly impact the respective Fund's economic performance, and the Account further lacks substantive kick-out rights to remove the entity with these powers. Refer to Note 1—Organization and Significant Accounting Policies of the Account's 2022 Form 10-K for a description of the methodology used to determine the primary beneficiary of a VIE.
No financial support (such as loans or financial guarantees) was provided to the Funds during the three months ended March 31, 2023. The Account is contractually obligated to make additional capital contributions in certain Funds in future years. These commitments are included in the maximum exposure to loss presented below.
The carrying amount and maximum exposure to loss relating to unconsolidated VIEs in which the Account holds a variable interest but is not the primary beneficiary were as follows at March 31, 2023 (in millions, unaudited)millions):
16
| For the Three Months Ended September 30, | For the Nine Months Ended September 30, | ||||||||||||||
| 2017 | 2016 | 2017 | 2016 | ||||||||||||
| Operating Revenue and Expenses | |||||||||||||||
| Revenues | $ | 218.0 | $ | 190.5 | $ | 645.0 | $ | 509.4 | |||||||
| Expenses | 108.3 | 94.6 | 315.0 | 259.5 | |||||||||||
| Excess of revenues over expenses | $ | 109.7 | $ | 95.9 | $ | 330.0 | $ | 249.9 | |||||||
| Fund Name | Carrying Amount | Maximum Exposure to Loss | Liquidity Provisions | Investment Strategy | |||||||||||||||||||
| LCS SHIP Venture I, LLC (90.0% Account Interest) | $ | 243.0 | $ | 243.0 | Redemptions prohibited prior to liquidation. | To invest in senior housing properties. | |||||||||||||||||
| Liquidation estimated to begin no earlier than 2025. | |||||||||||||||||||||||
| The Account is permitted to sell or transfer its interest in the fund, subject to consent and approval of the manager. | |||||||||||||||||||||||
| Veritas - Trophy VI, LLC (90.4% Account Interest) | $ | 75.6 | $ | 88.6 | Redemptions prohibited prior to liquidation. | To invest in multi-family properties primarily in the San Francisco Bay and Los Angeles metropolitan statistical area ("MSA"). | |||||||||||||||||
| The Account is not permitted to sell or transfer its interest in the fund until August 2023. After this date, the Account can sell or transfer its interest in the fund with the consent and approval of the manager. | |||||||||||||||||||||||
| SP V - II, LLC (61.8% Account Interest) | $ | 102.3 | $ | 112.3 | Redemptions prohibited prior to liquidation. | To invest in medical office properties in the U.S. | |||||||||||||||||
| Liquidation estimated to begin no earlier than 2023. | |||||||||||||||||||||||
| The Account is permitted to sell or transfer its interest in the fund, subject to consent and approval of the manager. | |||||||||||||||||||||||
| Taconic New York City GP Fund, LP (60.0% Account Interest) | $ | 28.9 | $ | 28.9 | Redemptions prohibited prior to liquidation. | To invest in real estate and real estate-related assets in the New York City MSA. | |||||||||||||||||
| Liquidation estimated to begin no earlier than 2024. | |||||||||||||||||||||||
| The Account is permitted to sell its interest in the fund, subject to consent and approval of the general partner. | |||||||||||||||||||||||
| Silverpeak NRE FundCo LLC (90.0% Account Interest) | $ | 40.1 | $ | 66.3 | Redemptions prohibited prior to liquidation. | To invest in alternative real estate investments primarily in major U.S. metropolitan markets. | |||||||||||||||||
| Liquidation estimated to begin no earlier than 2028. | |||||||||||||||||||||||
| The Account is permitted to sell its interest in the fund to qualified institutional investors, subject to consent and approval of the manager. | |||||||||||||||||||||||
| IDR - Core Property Index Fund, LLC (1.1% Account Interest) | $ | 43.8 | $ | 43.8 | Redemptions are permitted for a full calendar quarter and upon at least 90 days prior written notice, subject to fund availability. | To invest primarily in open-ended funds that fall within the NFI-ODCE Index and are actively managed. | |||||||||||||||||
| The Account is permitted to sell its interest in the fund, subject to consent and approval of the manager. | |||||||||||||||||||||||
| Townsend Group Value-Add Fund (99.0% Account Interest) | $ | 178.6 | $ | 255.8 | Redemptions prohibited prior to liquidation. | To invest in value-add real estate investment opportunities in the U.S. market. | |||||||||||||||||
| Liquidation estimated to begin no earlier than 2027. | |||||||||||||||||||||||
| The Account is prohibited from transferring its interest in the fund without consent by the general partner, which can be withheld in their sole discretion | |||||||||||||||||||||||
| Flagler REA Healthcare Properties Partnership (90.0% Account Interest) | $ | 20.7 | $ | 20.7 | Redemptions prohibited prior to liquidation. | To acquire healthcare properties within the top 50 MSA's in the U.S. | |||||||||||||||||
| Liquidation estimated to begin no earlier than 2025. | |||||||||||||||||||||||
| The Account is permitted to transfer its interest in the fund to a qualified institutional investor, subject to the right first offer by the partner, following the one year anniversary of the fund launch. | |||||||||||||||||||||||
17
| Fund Name | Carrying Amount | Maximum Exposure to Loss | Liquidity Provisions | Investment Strategy | |||||||||||||||||||
| Grubb Southeast Real Estate Fund VI, LLC (66.7% Account Interest) | $ | 18.7 | $ | 18.7 | Redemptions prohibited prior to liquidation. | To acquire office investments across the Southeast. | |||||||||||||||||
| Liquidation estimated to begin no earlier than 2026. | |||||||||||||||||||||||
| The Account is permitted to sell or transfer its interest in the fund with the consent and approval of the manager. | |||||||||||||||||||||||
| Silverpeak NRE FundCo 2 LLC (90.0% Account Interest) | $ | 86.8 | $ | 112.2 | Redemptions prohibited prior to liquidation. | To invest in value-add real estate investment opportunities in the top 25 major U.S. metropolitan markets. | |||||||||||||||||
| The Account is permitted to sell its interest in the fund to qualified institutional investors, subject to consent and approval of the manager. | |||||||||||||||||||||||
| JCR Capital - REA Preferred Equity Parallel Fund (31.1% Account Interest) | $ | 61.1 | $ | 102.9 | Redemptions prohibited prior to liquidation. | To invest primarily in multi-family properties. | |||||||||||||||||
| Liquidation estimated to begin no earlier than 2026. | |||||||||||||||||||||||
| The Account is prohibited from transferring its interest in the fund without consent by the general partner, which can be withheld in their sole discretion | |||||||||||||||||||||||
| Silverpeak NRE FundCo 3 LLC (90.0% Account Interest) | $ | 32.3 | $ | 99.7 | Redemptions prohibited prior to liquidation. | To invest in value-add real estate investment opportunities in the top 25 major U.S. metropolitan markets. | |||||||||||||||||
| The Account is permitted to sell its interest in the fund to qualified institutional investors, subject to consent and approval of the manager. | |||||||||||||||||||||||
| Total | $ | 931.9 | $ | 1,192.9 | |||||||||||||||||||
Note 6—Mortgage 8—Loans Receivable
The Account’s loan receivable portfolio is primarily comprised of mezzanine loans secured by the borrower’s direct and indirect interests in commercial real estate. Mezzanine loans are subordinate to first mortgages on the underlying real estate collateral. The following property types represent the underlying real estate collateral for the Account's loans (in millions):
| March 31, 2023 | December 31, 2022 | |||||||||||||||||||||||||||||||||||||
| Principal Outstanding | Fair Value | % of Fair Value | Principal Outstanding | Fair Value | % of Fair Value | |||||||||||||||||||||||||||||||||
Office(1) | $ | 1,082.5 | $ | 923.5 | 63.7 | % | $ | 904.6 | $ | 788.4 | 52.9 | % | ||||||||||||||||||||||||||
Apartments(1) | 214.5 | 209.4 | 14.4 | % | 214.2 | 209.6 | 14.1 | % | ||||||||||||||||||||||||||||||
| Industrial | 133.6 | 130.8 | 9.0 | % | 131.6 | 130.6 | 8.8 | % | ||||||||||||||||||||||||||||||
| Hotel | 139.3 | 136.0 | 9.4 | % | 139.3 | 134.9 | 9.1 | % | ||||||||||||||||||||||||||||||
| Retail | 49.1 | 49.0 | 3.4 | % | 226.1 | 225.1 | 15.1 | % | ||||||||||||||||||||||||||||||
| Land | 1.5 | 1.5 | 0.1 | % | — | — | — | % | ||||||||||||||||||||||||||||||
| $ | 1,620.5 | $ | 1,450.2 | 100.0 | % | $ | 1,615.8 | $ | 1,488.6 | 100.0 | % | |||||||||||||||||||||||||||
(1) Includes loans receivable with related parties.
The Account monitors the risk profile of the loan receivable portfolio with the assistance of a third-party rating service that models the loans and assigns risk ratings based on inputs such as loan-to-value ratios, yields, credit quality of the borrowers, property types of the collateral, geographic and local market dynamics, physical condition of the collateral, and the underlying structure of the loans. Ratings for loans are updated monthly. Assigned ratings can range from AAA to C, with an AAA designation representing debt with the lowest level of credit risk and C representing a greater risk of default or principal loss. Loans that are more than 90 days past due are classified as delinquent and assigned a D rating. Mezzanine debt in good health is typically reflective of a risk rating in the B range (e.g., BBB, BB, or B), as these ratings reflect borrowers' having adequate financial resources to service their
18
financial commitments, but also acknowledging that adverse economic conditions, should they occur, would likely impede on a borrowers' ability to pay.
All borrowers of loans rated C or higher are current as of March 31, 2023.
The following table presents the fair values of the Account's loan portfolio based on the risk ratings as of March 31, 2023 (in millions), listed in order of the strength of the risk rating (from strongest to weakest):
| March 31, 2023 | December 31, 2022 | |||||||||||||||||||||||||||||||||||||
| Number of Loans | Fair Value | % of Fair Value | Number of Loans | Fair Value | % of Fair Value | |||||||||||||||||||||||||||||||||
| A+ | 1 | 100.2 | 6.9 | % | 1 | — | — | % | ||||||||||||||||||||||||||||||
| A | 1 | 47.6 | 3.3 | % | 2 | 130.6 | 8.8 | % | ||||||||||||||||||||||||||||||
| A- | — | — | — | % | 1 | — | — | % | ||||||||||||||||||||||||||||||
| BBB+ | 2 | 114.2 | 7.9 | % | 3 | 191.0 | 12.8 | % | ||||||||||||||||||||||||||||||
| BBB | 2 | 134.4 | 9.3 | % | 2 | 137.4 | 9.2 | % | ||||||||||||||||||||||||||||||
| BBB- | 2 | 228.5 | 15.8 | % | 1 | 47.5 | 3.2 | % | ||||||||||||||||||||||||||||||
| BB+ | 1 | 40.7 | 2.8 | % | 2 | 64.9 | 4.4 | % | ||||||||||||||||||||||||||||||
| BB | 1 | 57.8 | 4.0 | % | 2 | 72.3 | 4.8 | % | ||||||||||||||||||||||||||||||
| BB- | 2 | 79.3 | 5.5 | % | 1 | 18.9 | 1.3 | % | ||||||||||||||||||||||||||||||
| B+ | 3 | 120.8 | 8.3 | % | 3 | 87.2 | 5.9 | % | ||||||||||||||||||||||||||||||
| B | — | — | — | % | 2 | 72.5 | 4.9 | % | ||||||||||||||||||||||||||||||
| B- | 4 | 117.8 | 8.1 | % | 5 | 171.0 | 11.5 | % | ||||||||||||||||||||||||||||||
| CCC+ | 1 | 38.2 | 2.6 | % | 3 | 223.4 | 15.0 | % | ||||||||||||||||||||||||||||||
| CCC | 3 | 63.8 | 4.4 | % | — | — | — | % | ||||||||||||||||||||||||||||||
| CCC- | 2 | 122.0 | 8.4 | % | 2 | 60.9 | 4.1 | % | ||||||||||||||||||||||||||||||
| CC | 1 | 21.8 | 1.5 | % | 1 | 66.0 | 4.4 | % | ||||||||||||||||||||||||||||||
| C | 2 | 91.8 | 6.3 | % | 1 | 75.1 | 5.0 | % | ||||||||||||||||||||||||||||||
| D | 1 | — | — | % | — | — | — | % | ||||||||||||||||||||||||||||||
NR(1) | 4 | 71.3 | 4.9 | % | 3 | 69.9 | 4.7 | % | ||||||||||||||||||||||||||||||
| 33 | $ | 1,450.2 | 100.0 | % | 35 | $ | 1,488.6 | 100.0 | % | |||||||||||||||||||||||||||||
(1) "NR" designates loans not assigned an internal credit rating. As of March 31, 2023 and December 31, 2022, all loans with NR designations were with related parties. The loans are collateralized by equity interests in real estate investments.
The following table represents loans receivable in nonaccrual status as of March 31, 2023 (in millions). Loans are placed in nonaccrual status when a loan is more than 90 days in arrears or at any point when management believes the full collection of principal is doubtful.
| Aging | Number of Loans | Principal Outstanding | Fair Value | |||||||||||||||||
| Past Due - 90 Days + | 1 | $ | 92.9 | $ | — | |||||||||||||||
19
Note 9—Loans Payable
At September 30, 2017,March 31, 2023, the Account had outstanding mortgage loans payable secured by the following propertiesassets (in millions):
| Property | Annual Interest Rate and Payment Frequency | Principal Amounts Outstanding as of | Maturity | |||||||||||||||||||||||
| March 31, 2023 | December 31, 2022 | |||||||||||||||||||||||||
1001 Pennsylvania Avenue(1) | 3.70% paid monthly | $ | 299.4 | $ | 301.2 | June 1, 2023 | ||||||||||||||||||||
| Biltmore at Midtown | 3.94% paid monthly | 36.4 | 36.4 | July 5, 2023 | ||||||||||||||||||||||
| Cherry Knoll | 3.78% paid monthly | 35.3 | 35.3 | July 5, 2023 | ||||||||||||||||||||||
| Lofts at SoDo | 3.94% paid monthly | 35.1 | 35.1 | July 5, 2023 | ||||||||||||||||||||||
San Diego Office Portfolio(2) | 1.61% + SOFR paid monthly | 58.2 | 58.2 | August 9, 2023 | ||||||||||||||||||||||
| Pacific City | 2.10% + SOFR paid monthly | 105.0 | 105.0 | October 1, 2023 | ||||||||||||||||||||||
The Stratum(2) | 2.25% + LIBOR paid monthly | 40.4 | 40.4 | May 9, 2024 | ||||||||||||||||||||||
Spring House Innovation Park(2) | 1.25% + LIBOR paid monthly | 55.5 | 52.3 | July 9, 2024 | ||||||||||||||||||||||
| 1401 H Street NW | 3.65% paid monthly | 115.0 | 115.0 | November 5, 2024 | ||||||||||||||||||||||
The District on La Frontera(1) | 3.84% paid monthly | 36.8 | 37.0 | December 1, 2024 | ||||||||||||||||||||||
The District on La Frontera(1) | 4.96% paid monthly | 4.2 | 4.2 | December 1, 2024 | ||||||||||||||||||||||
| Circa Green Lake | 3.71% paid monthly | 52.0 | 52.0 | March 5, 2025 | ||||||||||||||||||||||
| Union - South Lake Union | 3.66% paid monthly | 57.0 | 57.0 | March 5, 2025 | ||||||||||||||||||||||
| Holly Street Village | 3.65% paid monthly | 81.0 | 81.0 | May 1, 2025 | ||||||||||||||||||||||
Henley at Kingstowne(1) | 3.60% paid monthly | 67.3 | 67.7 | May 1, 2025 | ||||||||||||||||||||||
| 32 South State Street | 4.48% paid monthly | 24.0 | 24.0 | June 6, 2025 | ||||||||||||||||||||||
Project Sonic(2) | 2.00% + SOFR paid monthly | 93.5 | — | June 9, 2025 | ||||||||||||||||||||||
Vista Station Office Portfolio(1) | 4.00% paid monthly | 18.5 | 18.6 | July 1, 2025 | ||||||||||||||||||||||
| 780 Third Avenue | 3.55% paid monthly | 150.0 | 150.0 | August 1, 2025 | ||||||||||||||||||||||
| 780 Third Avenue | 3.55% paid monthly | 20.0 | 20.0 | August 1, 2025 | ||||||||||||||||||||||
Reserve at Chino Hills(2) | 1.50% + LIBOR paid monthly | 74.4 | 72.5 | August 9, 2025 | ||||||||||||||||||||||
Vista Station Office Portfolio(1) | 4.20% paid monthly | 41.7 | 41.9 | November 1, 2025 | ||||||||||||||||||||||
Sixth & Main(2)(3) | 1.87% + LIBOR paid monthly | — | 41.1 | November 9, 2025 | ||||||||||||||||||||||
701 Brickell Avenue(1) | 3.66% paid monthly | 177.6 | 178.5 | April 1, 2026 | ||||||||||||||||||||||
| Marketplace at Mill Creek | 3.82% paid monthly | 39.6 | 39.6 | September 11, 2027 | ||||||||||||||||||||||
| Overlook At King Of Prussia | 3.82% paid monthly | 40.8 | 40.8 | September 11, 2027 | ||||||||||||||||||||||
| Winslow Bay | 3.82% paid monthly | 25.8 | 25.8 | September 11, 2027 | ||||||||||||||||||||||
1900 K Street, NW(1) | 3.93% paid monthly | 160.6 | 161.1 | April 1, 2028 | ||||||||||||||||||||||
| 99 High Street | 3.90% paid monthly | 277.0 | 277.0 | March 1, 2030 | ||||||||||||||||||||||
| Total Principal Outstanding | $ | 2,222.1 | $ | 2,168.7 | ||||||||||||||||||||||
Fair Value Adjustment(4) | (92.2) | (99.0) | ||||||||||||||||||||||||
| Total Loans Payable | $ | 2,129.9 | $ | 2,069.7 | ||||||||||||||||||||||
(1)The mortgage is adjusted monthly for principal payments.
(2)The loan is collateralized by a mezzanine loan receivable. The mezzanine loan receivable is collateralized by the property reflected within the table above.
(3)The principal amount of the outstanding debt was paid off during the quarter.
(4)The fair value adjustment consists of the difference (positive or negative) between the principal amount of the outstanding debt and the fair value of the outstanding debt. See Note 1—Organization and Significant Accounting Policies.
20
| Property | Annual Interest Rate and Payment Frequency(2) | Principal Amounts Outstanding as of | Maturity | |||||||||
| September 30, 2017 | December 31, 2016 | |||||||||||
| (Unaudited) | ||||||||||||
The Legend at Kierland(4) (5) | 4.97% paid monthly | $ | — | $ | 21.8 | August 1, 2017 | ||||||
The Tradition at Kierland(4) (5) | 4.97% paid monthly | — | 25.8 | August 1, 2017 | ||||||||
Mass Court(4) | 2.88% paid monthly | 92.6 | 92.6 | September 1, 2019 | ||||||||
Red Canyon at Palomino Park(4) (6) | 5.34% paid monthly | 27.1 | 27.1 | August 1, 2020 | ||||||||
Green River at Palomino Park(4) (6) | 5.34% paid monthly | 33.2 | 33.2 | August 1, 2020 | ||||||||
Blue Ridge at Palomino Park(4) (6) | 5.34% paid monthly | 33.4 | 33.4 | August 1, 2020 | ||||||||
Ashford Meadows(4) | 5.17% paid monthly | 44.6 | 44.6 | August 1, 2020 | ||||||||
The Knoll(1) (4) | 3.98% paid monthly | 17.6 | — | December 5, 2020 | ||||||||
The Corner(4) | 4.66% paid monthly | 105.0 | 105.0 | June 1, 2021 | ||||||||
The Palatine(1) (4) | 4.25% paid monthly | 79.1 | 80.0 | January 10, 2022 | ||||||||
The Forum at Carlsbad(1) (4) | 4.25% paid monthly | 89.2 | 90.0 | March 1, 2022 | ||||||||
The Colorado(4) | 3.69% paid monthly | 91.7 | 91.7 | November 1, 2022 | ||||||||
The Legacy at Westwood(4) | 3.69% paid monthly | 46.7 | 46.7 | November 1, 2022 | ||||||||
Regents Court(4) | 3.69% paid monthly | 39.6 | 39.6 | November 1, 2022 | ||||||||
The Caruth(4) | 3.69% paid monthly | 45.0 | 45.0 | November 1, 2022 | ||||||||
Fourth & Madison(4) | 3.75% paid monthly | 200.0 | 200.0 | June 1, 2023 | ||||||||
| 1001 Pennsylvania Avenue | 3.70% paid monthly | 330.0 | 330.0 | June 1, 2023 | ||||||||
1401 H Street NW(4) | 3.65% paid monthly | 115.0 | 115.0 | November 5, 2024 | ||||||||
32 South State Street(4) | 4.48% paid monthly | 24.0 | 24.0 | June 6, 2025 | ||||||||
780 Third Avenue(4) | 3.55% paid monthly | 150.0 | 150.0 | August 1, 2025 | ||||||||
780 Third Avenue(4) | 3.55% paid monthly | 20.0 | 20.0 | August 1, 2025 | ||||||||
701 Brickell Avenue(4) | 3.66% paid monthly | 184.0 | 184.0 | April 1, 2026 | ||||||||
55 Second Street(4) (7) | 3.74% paid monthly | 137.5 | 137.5 | October 1, 2026 | ||||||||
| 1900 K Street, NW | 3.93% paid monthly | 163.0 | 163.0 | April 1, 2028 | ||||||||
501 Boylston Street(4) | 3.70% paid monthly | 216.5 | 216.5 | April 1, 2028 | ||||||||
| Total Principal Outstanding | $ | 2,284.8 | $ | 2,316.5 | ||||||||
Fair Value Adjustment(3) | 26.2 | 15.6 | ||||||||||
| Total Mortgage Loans Payable | $ | 2,311.0 | $ | 2,332.1 | ||||||||
Note 10—Credit Facility
The Account has a credit agreement (the “Credit Agreement”) with a syndicate of third-party bank lenders, including JPMorgan Chase Bank, N.A., comprised of revolving credit loans ("Line of Credit") up to $945.0 million and up to $500.0 million in term loans ("Term Loans"). The Account may use the proceeds of borrowings under the Credit Agreement for general organizational purposes in the ordinary course of business, including to finance certain real estate portfolio investments. The Account may prepay borrowings under the Credit Facility at any time during the life of the loan without penalty.
The Account may elect for each borrowing under the Credit Agreement to bear annual interest at an adjusted base rate ("ABR") or adjusted SOFR plus an applicable margin which is dependent on the leverage ratio of the Account.The applicable margin for adjusted SOFR Term Loans ranges from 1.00% to 1.50% and for ABR Term Loans ranges from 0.00% to 0.50%.The applicable margin for adjusted SOFR Revolving Credit Loans ranges from 0.875% to 1.30% and for ABR Revolving Credit Loans ranges from 0.00% to 0.30%.In addition, the Account pays facility fees ranging from 0.125% to 0.20%, depending on the leverage ratio of the Account, on the total revolving commitments (used and unused) under the Credit Agreement.
As of March 31, 2023, the Account was in compliance with all covenants required by the Credit Agreement.
The following table provides a summary of the key characteristics of the Credit Agreement, as of March 31, 2023:
| Current Balance - Line of Credit (in millions) | $ | — | ||||||||||||
| Current Balance - Term Loans (in millions) | $ | 500.0 | ||||||||||||
| Maximum Capacity (in millions) | $ | 1,445.0 | ||||||||||||
| Inception Date | September 16, 2022 | |||||||||||||
| Revolving Commitment Termination and Term Loan Maturity Date | September 16, 2024 | |||||||||||||
Extension Option(1) | Yes | |||||||||||||
| ABR Revolving Credit Loans Interest Rate | ABR + Applicable Margin | |||||||||||||
| ABR Term Loans Interest Rate | ABR + Applicable Margin | |||||||||||||
| SOFR Revolving Credit Loans Interest Rate | Adjusted SOFR + Applicable Margin | |||||||||||||
SOFR Term Loans Interest Rate(3) | Adjusted SOFR + Applicable Margin | |||||||||||||
Facility Fee (2) | 0.125% - 0.20% quarterly | |||||||||||||
(1) | The | |||||||||||||
| subject to approval at the sole discretion of the lenders and is not guaranteed. | |||||||||||||||
(2) | |||||||||||||||
| Line of Credit, whether used or unused, which is determined based on the Account's loan-to-value ratio. | |||||||||||||||
(3) | The | ||||||||||||||
Note 7—11—Senior Notes Payable
In June 2022, the Account entered into a note purchase agreement with certain qualified institutional investors. Under the note purchase agreement, the Account issued $500.0 million of debt securities, in the form of Series A senior notes and Series B senior notes (the "Series A and B Notes"). The Account is obligated to repay the Series A and B Notes at par, plus accrued and unpaid interest to, but not including, the date of repayment. The Account may also prepay the Series A and B Notes in whole or in part at any time, or from time to time, at the Account's option at par plus accrued interest to the prepayment date and, if prepaid on or before 90 days prior to the applicable maturity date, a make-whole premium.
On March 21, 2023, the Account entered into another note purchase agreement with certain qualified institutional investors. Under this note purchase agreement, the Account agreed to issue on May 30, 2023, $400.0 million of debt securities, in the form of Series C senior notes (the "Series C Notes") that will mature on May 30, 2027. The Series C Notes will bear interest at an annual rate of 5.50%, payable semi-annually and will be subject to the same prepayment terms as the Series A and B Notes.
21
As of March 31, 2023, the Account was in compliance with all covenants required by the note purchase agreements.
The following table provides a summary of the key characteristics of the outstanding senior notes payable, as of March 31, 2023:
| Principal (in millions) | Interest Rate | Maturity Date | |||||||||||||||
| Series A | $ | 300.0 | 3.24% | June 10, 2029 | |||||||||||||
| Series B | $ | 200.0 | 3.35% | June 10, 2032 | |||||||||||||
Note 12—Financial Highlights
Selected condensed financial information for an Accumulation Unit of the Account is presented below. Per Accumulation Unit data is calculated on average units outstanding.
| For the Three Months Ended March 31, 2023 | Years Ended December 31, | ||||||||||||||||||||||
| 2022 | 2021 | 2020 | |||||||||||||||||||||
| Per Accumulation Unit Data: | |||||||||||||||||||||||
| Rental income | $ | 6.520 | $ | 23.751 | $ | 22.672 | $ | 21.145 | |||||||||||||||
| Real estate property level expenses and taxes | 3.041 | 11.042 | 10.683 | 10.027 | |||||||||||||||||||
| Real estate income, net | 3.479 | 12.709 | 11.989 | 11.118 | |||||||||||||||||||
| Other income | 1.954 | 6.559 | 5.474 | 4.980 | |||||||||||||||||||
| Total income | 5.433 | 19.268 | 17.463 | 16.098 | |||||||||||||||||||
Expense charges(1) | 1.361 | 5.121 | 4.035 | 3.603 | |||||||||||||||||||
| Investment income, net | 4.072 | 14.147 | 13.428 | 12.495 | |||||||||||||||||||
| Net realized and unrealized gain (loss) on investments and debt | (17.471) | 28.011 | 64.615 | (16.195) | |||||||||||||||||||
| Net increase (decrease) in Accumulation Unit Value | (13.399) | 42.158 | 78.043 | (3.700) | |||||||||||||||||||
| Accumulation Unit Value: | |||||||||||||||||||||||
| Beginning of period | 556.923 | 514.765 | 436.722 | 440.422 | |||||||||||||||||||
| End of period | $ | 543.524 | $ | 556.923 | $ | 514.765 | $ | 436.722 | |||||||||||||||
Total return(3) | (2.41) | % | 8.19 | % | 17.87 | % | (0.84) | % | |||||||||||||||
Ratios to Average net assets(2): | |||||||||||||||||||||||
Expenses(1) | 0.98 | % | 0.89 | % | 0.84 | % | 0.81 | % | |||||||||||||||
| Investment income, net | 2.94 | % | 2.45 | % | 2.82 | % | 2.85 | % | |||||||||||||||
Portfolio turnover rate(3): | |||||||||||||||||||||||
Real estate properties(4) | 0.2 | % | 5.6 | % | 7.6 | % | 7.1 | % | |||||||||||||||
Marketable securities(5) | 7.0 | % | 4.7 | % | — | % | 113.4 | % | |||||||||||||||
| Accumulation Units outstanding at end of period (millions) | 50.5 | 52.1 | 53.4 | 52.0 | |||||||||||||||||||
| Net assets end of period (millions) | $ | 28,050.3 | $ | 29,658.1 | $ | 28,072.0 | $ | 23,243.9 | |||||||||||||||
(1)Expense charges per Accumulation Unit and the Ratio of Expenses to average net assets reflect the year-to-date Account level expenses and exclude real estate property level expenses which are included in real estate income, net.
(2)Percentages for the three months ended March 31, 2023 are annualized.
(3)Percentages for the three months ended March 31, 2023 are not annualized.
(4)Real estate investment portfolio turnover rate is calculated by dividing the lesser of purchases or sales of real estate property investments (including contributions to, or return of capital distributions received from, existing real estate joint ventures and fund investments) by the average value of the portfolio of real estate investments held during the period.
(5)Marketable securities portfolio turnover rate is calculated by dividing the lesser of purchases or sales of securities, excluding securities having maturity dates at acquisition of one year or less, by the average value of the portfolio securities held during the period.
22
| For the Nine Months Ended September 30, 2017 | Years Ended December 31, | ||||||||||||||
| 2016 | 2015 | 2014 | |||||||||||||
| (Unaudited) | |||||||||||||||
| Per Accumulation Unit Data: | |||||||||||||||
| Rental income | $ | 12.737 | $ | 16.433 | $ | 15.538 | $ | 15.862 | |||||||
| Real estate property level expenses and taxes | 5.784 | 7.534 | 7.319 | 7.788 | |||||||||||
| Real estate income, net | 6.953 | 8.899 | 8.219 | 8.074 | |||||||||||
| Other income | 3.340 | 3.594 | 3.342 | 3.459 | |||||||||||
| Total income | 10.293 | 12.493 | 11.561 | 11.533 | |||||||||||
Expense charges(1) | 2.476 | 3.290 | 3.092 | 2.880 | |||||||||||
| Investment income, net | 7.817 | 9.203 | 8.469 | 8.653 | |||||||||||
| Net realized and unrealized gain on investments and mortgage loans payable | 3.804 | 9.660 | 18.911 | 27.868 | |||||||||||
| Net increase in Accumulation Unit Value | 11.621 | 18.863 | 27.380 | 36.521 | |||||||||||
| Accumulation Unit Value: | |||||||||||||||
| Beginning of period | 381.636 | 362.773 | 335.393 | 298.872 | |||||||||||
| End of period | $ | 393.257 | $ | 381.636 | $ | 362.773 | $ | 335.393 | |||||||
Total return(3) | 3.04 | % | 5.20 | % | 8.16 | % | 12.22 | % | |||||||
Ratios to Average net assets(2): | |||||||||||||||
Expenses(1) | 0.83 | % | 0.86 | % | 0.86 | % | 0.89 | % | |||||||
| Investment income, net | 2.63 | % | 2.41 | % | 2.37 | % | 2.68 | % | |||||||
Portfolio turnover rate(3): | |||||||||||||||
Real estate properties(4) | 1.6 | % | 1.3 | % | 5.7 | % | 6.5 | % | |||||||
Marketable securities(5) | 5.2 | % | 3.5 | % | 10.0 | % | 15.9 | % | |||||||
| Accumulation Units outstanding at end of period (in millions) | 61.9 | 62.4 | 60.4 | 57.9 | |||||||||||
| Net assets end of period (in millions) | $ | 24,839.8 | $ | 24,304.7 | $ | 22,360.0 | $ | 19,829.0 | |||||||
Note 8—13—Accumulation Units
Changes in the number of Accumulation Units outstanding were as follows (in millions):
| For the Three Months Ended March 31, 2023 | For the Year Ended December 31, 2022 | ||||||||||
| Outstanding: | |||||||||||
| Beginning of period | 52.1 | 53.4 | |||||||||
| Credited for premiums | 0.9 | 5.4 | |||||||||
| Annuity, other periodic payments, withdrawals and death benefits | (2.5) | (6.7) | |||||||||
| End of period | 50.5 | 52.1 | |||||||||
| For the Nine Months Ended September 30, 2017 | For the Year Ended December 31, 2016 | ||||
| (Unaudited) | |||||
| Outstanding: | |||||
| Beginning of period | 62.4 | 60.4 | |||
| Credited for premiums | 5.1 | 8.2 | |||
| Annuity, other periodic payments, withdrawals and death benefits | (5.6 | ) | (6.2 | ) | |
| End of period | 61.9 | 62.4 | |||
Note 9—14—Commitments and Contingencies
Commitments—TheAs of March 31, 2023 and December 31, 2022, the Account had $32.0 million and $39.0 million of outstandingthe following immediately callable commitments to purchase additional interests in its limited partnershipreal estate funds or provide additional funding through its loans receivable investments as of September 30, 2017 and December 31, 2016, respectively.(in millions):
| Commitment Expiration | March 31, 2023 | December 31, 2022 | ||||||||||||||||||
Real Estate Funds(1) | ||||||||||||||||||||
| Silverpeak NRE FundCo 3 LLC | 06/2023 | $ | 67.4 | $ | 70.0 | |||||||||||||||
| SP V - II, LLC | 08/2023 | 10.0 | 10.0 | |||||||||||||||||
| Veritas Trophy VI, LLC | 08/2023 | 13.0 | 15.4 | |||||||||||||||||
| Taconic New York City GP Fund, LP | 11/2023 | — | 4.2 | |||||||||||||||||
| JCR Capital - REA Preferred Equity Parallel Fund | 02/2024 | 41.8 | 48.6 | |||||||||||||||||
| Flagler - REA Healthcare Properties Partnership | 02/2025 | — | 1.2 | |||||||||||||||||
| Townsend Group Value-Add Fund | 12/2026 | 77.2 | 84.7 | |||||||||||||||||
| Silverpeak NRE FundCo LLC | 12/2028 | 26.2 | 26.2 | |||||||||||||||||
| Silverpeak NRE FundCo 2 LLC | 12/2029 | 25.4 | 29.6 | |||||||||||||||||
| $ | 261.0 | $ | 289.9 | |||||||||||||||||
Loans Receivable(2) | ||||||||||||||||||||
| 311 South Wacker Mezzanine | 03/2023 | — | 2.2 | |||||||||||||||||
| SCG Oakland Portfolio Mezzanine | 04/2023 | 0.5 | 5.4 | |||||||||||||||||
| Five Oak Mezzanine | 05/2023 | 1.5 | 1.5 | |||||||||||||||||
| MRA Hub 34 Holding, LLC | 08/2023 | 1.4 | 1.5 | |||||||||||||||||
| Liberty Park Mezzanine | 11/2023 | 2.6 | 2.6 | |||||||||||||||||
| Colony New England Hotel Portfolio Senior Loan | 11/2023 | 3.6 | 3.6 | |||||||||||||||||
| Colony New England Hotel Portfolio Mezzanine | 11/2023 | 1.2 | 1.2 | |||||||||||||||||
| Exo Apartments Mezzanine | 01/2024 | 3.9 | 2.4 | |||||||||||||||||
| The Stratum Senior Loan | 05/2024 | 1.3 | 1.3 | |||||||||||||||||
| The Stratum Mezzanine | 05/2024 | 0.4 | 0.4 | |||||||||||||||||
| Spring House Innovation Park Senior Loan | 07/2024 | 19.5 | 23.4 | |||||||||||||||||
| Spring House Innovation Park Mezzanine | 07/2024 | 6.5 | 7.8 | |||||||||||||||||
| Project Sonic Senior Loan | 06/2025 | 2.4 | 3.9 | |||||||||||||||||
| Project Sonic Mezzanine | 06/2025 | 0.8 | 1.3 | |||||||||||||||||
| One Biscayne Tower Senior Loan | 07/2025 | 31.8 | 31.8 | |||||||||||||||||
| One Biscayne Tower Mezzanine | 07/2025 | 10.6 | 10.6 | |||||||||||||||||
| The Reserve at Chino Hills | 08/2025 | 10.7 | 12.7 | |||||||||||||||||
| 735 Watkins Mill | 08/2025 | 7.7 | 9.2 | |||||||||||||||||
23
| Commitment Expiration | March 31, 2023 | December 31, 2022 | ||||||||||||||||||
| Sixth and Main Senior Loan | 11/2025 | 5.3 | 6.2 | |||||||||||||||||
| Sixth and Main Mezzanine | 11/2025 | 2.8 | 3.4 | |||||||||||||||||
| $ | 114.5 | $ | 132.4 | |||||||||||||||||
| TOTAL COMMITMENTS | $ | 375.5 | $ | 422.3 | ||||||||||||||||
(1)Additional capital can be called during the commitment period at any time. The commitment at September 30, 2017 and December 31, 2016period can only be extended by the manager with the consent of the Account. The commitment expiration date is related toreflective of the Taconic New York City GP Fund, LP, in whichmost recent signed agreement between the Account and the fund manager, including any side letter agreements.
(2)Advances from the Account can be requested during the commitment period at any time. The commitment expiration date is reflective of the most recent signed agreement between the Account and the borrower, including any side letter agreements. Certain loans contain extension clauses on the term of the loan that do not require the Account's prior consent. If elected, the Account's commitment may be extended through the extension term.
Contingencies—In the normal course of business, the Account may be named, from time to time, as a defendantor may be involved in various legal actions, including arbitration, class actions and other litigation.
The Account establishes an accrual for all litigation and regulatory matters when it believes it is probable that a loss has entered into an agreementbeen incurred and the amount of the loss can be reasonably estimated. Once established, accruals are adjusted, as appropriate, in light of additional information. The amount of loss ultimately incurred in relation to provide funding. those matters may be higher or lower than the amounts accrued for those matters.
As of September 30, 2017, $13.0 millionthe date of the commitment has been funded. Once the remaining commitment is funded, the Account anticipates holding a 60%-90% interest in the fund.
Note 10—Securities Lending15—Subsequent Events
24
TIAA REAL ESTATE ACCOUNT
CONDENSED CONSOLIDATED SCHEDULES OF INVESTMENTS
(Dollar values shown in millions)
| REAL ESTATE PROPERTIES | ||||||||||||||||||||||||||
| Location/Sector | March 31, 2023 | December 31, 2022 | ||||||||||||||||||||||||
| Fair Value | % of Net Assets | Fair Value | % of Net Assets | |||||||||||||||||||||||
| Alabama | ||||||||||||||||||||||||||
| Retail | 53.5 | 0.2 | % | 55.3 | 0.2 | % | ||||||||||||||||||||
| $ | 53.5 | 0.2 | % | $ | 55.3 | 0.2 | % | |||||||||||||||||||
| Arizona | ||||||||||||||||||||||||||
| Industrial | 50.4 | 0.2 | % | 48.3 | 0.2 | % | ||||||||||||||||||||
| Land | 4.5 | — | % | 4.3 | — | % | ||||||||||||||||||||
| $ | 54.9 | 0.2 | % | $ | 52.6 | 0.2 | % | |||||||||||||||||||
| California | ||||||||||||||||||||||||||
| Industrial | 3,926.3 | 14.0 | % | 3,924.6 | 13.2 | % | ||||||||||||||||||||
| Apartment | 1,525.6 | 5.4 | % | 1,567.0 | 5.3 | % | ||||||||||||||||||||
| Office | 568.4 | 2.0 | % | 574.2 | 1.9 | % | ||||||||||||||||||||
| Retail | 437.2 | 1.6 | % | 441.0 | 1.5 | % | ||||||||||||||||||||
| $ | 6,457.5 | 23.0 | % | $ | 6,506.8 | 21.9 | % | |||||||||||||||||||
| Colorado | ||||||||||||||||||||||||||
| Office | 83.1 | 0.3 | % | 102.0 | 0.3 | % | ||||||||||||||||||||
| Industrial | 46.7 | 0.2 | % | 49.0 | 0.2 | % | ||||||||||||||||||||
| $ | 129.8 | 0.5 | % | $ | 151.0 | 0.5 | % | |||||||||||||||||||
| Connecticut | ||||||||||||||||||||||||||
| Office | 33.3 | 0.1 | % | 35.4 | 0.1 | % | ||||||||||||||||||||
| $ | 33.3 | 0.1 | % | $ | 35.4 | 0.1 | % | |||||||||||||||||||
| Florida | ||||||||||||||||||||||||||
| Apartment | 1,240.8 | 4.4 | % | 1,304.4 | 4.4 | % | ||||||||||||||||||||
| Industrial | 736.4 | 2.6 | % | 714.0 | 2.4 | % | ||||||||||||||||||||
| Office | 495.8 | 1.8 | % | 503.0 | 1.7 | % | ||||||||||||||||||||
| Retail | 157.1 | 0.6 | % | 157.6 | 0.5 | % | ||||||||||||||||||||
| $ | 2,630.1 | 9.4 | % | $ | 2,679.0 | 9.0 | % | |||||||||||||||||||
| Georgia | ||||||||||||||||||||||||||
| Apartment | 425.0 | 1.5 | % | 456.7 | 1.5 | % | ||||||||||||||||||||
| Retail | 256.2 | 0.9 | % | 253.7 | 0.9 | % | ||||||||||||||||||||
| Industrial | 242.9 | 0.9 | % | 258.3 | 0.9 | % | ||||||||||||||||||||
| $ | 924.1 | 3.3 | % | $ | 968.7 | 3.3 | % | |||||||||||||||||||
| Illinois | ||||||||||||||||||||||||||
| Retail | 180.7 | 0.7 | % | 189.3 | 0.6 | % | ||||||||||||||||||||
| Industrial | 157.8 | 0.6 | % | 182.1 | 0.6 | % | ||||||||||||||||||||
| Apartment | 124.0 | 0.4 | % | 129.4 | 0.4 | % | ||||||||||||||||||||
| Land | 38.0 | 0.1 | % | 5.7 | — | % | ||||||||||||||||||||
| $ | 500.5 | 1.8 | % | $ | 506.5 | 1.7 | % | |||||||||||||||||||
| Indiana | ||||||||||||||||||||||||||
| Industrial | 102.0 | 0.4 | % | 108.0 | 0.4 | % | ||||||||||||||||||||
| $ | 102.0 | 0.4 | % | $ | 108.0 | 0.4 | % | |||||||||||||||||||
| Maryland | ||||||||||||||||||||||||||
| Apartment | 87.2 | 0.3 | % | 86.5 | 0.3 | % | ||||||||||||||||||||
25
TIAA REAL ESTATE ACCOUNT
CONDENSED CONSOLIDATED SCHEDULES OF INVESTMENTS
(Dollar values shown in millions)
| REAL ESTATE PROPERTIES | ||||||||||||||||||||||||||
| Location/Sector | March 31, 2023 | December 31, 2022 | ||||||||||||||||||||||||
| Fair Value | % of Net Assets | Fair Value | % of Net Assets | |||||||||||||||||||||||
| Industrial | 77.9 | 0.3 | % | 68.4 | 0.2 | % | ||||||||||||||||||||
| Retail | 72.3 | 0.3 | % | 74.4 | 0.3 | % | ||||||||||||||||||||
| $ | 237.4 | 0.9 | % | $ | 229.3 | 0.8 | % | |||||||||||||||||||
| Massachusetts | ||||||||||||||||||||||||||
| Office | 668.6 | 2.4 | % | 687.3 | 2.3 | % | ||||||||||||||||||||
| Industrial | 161.7 | 0.6 | % | 169.5 | 0.6 | % | ||||||||||||||||||||
| Retail | 123.0 | 0.4 | % | 123.0 | 0.4 | % | ||||||||||||||||||||
| Apartment | 56.3 | 0.2 | % | 57.7 | 0.2 | % | ||||||||||||||||||||
| $ | 1,009.6 | 3.6 | % | $ | 1,037.5 | 3.5 | % | |||||||||||||||||||
| Minnesota | ||||||||||||||||||||||||||
| Industrial | 148.3 | 0.5 | % | 149.1 | 0.5 | % | ||||||||||||||||||||
| Apartment | 95.3 | 0.3 | % | 100.8 | 0.3 | % | ||||||||||||||||||||
| $ | 243.6 | 0.8 | % | $ | 249.9 | 0.8 | % | |||||||||||||||||||
| New Jersey | ||||||||||||||||||||||||||
| Industrial | 373.4 | 1.3 | % | 388.7 | 1.3 | % | ||||||||||||||||||||
| Retail | 89.2 | 0.3 | % | 90.5 | 0.3 | % | ||||||||||||||||||||
| $ | 462.6 | 1.6 | % | $ | 479.2 | 1.6 | % | |||||||||||||||||||
| New York | ||||||||||||||||||||||||||
| Office | 740.9 | 2.6 | % | 787.0 | 2.7 | % | ||||||||||||||||||||
| Apartment | 272.9 | 1.0 | % | 266.8 | 0.9 | % | ||||||||||||||||||||
| $ | 1,013.8 | 3.6 | % | $ | 1,053.8 | 3.6 | % | |||||||||||||||||||
| North Carolina | ||||||||||||||||||||||||||
| Retail | 90.1 | 0.3 | % | 90.3 | 0.3 | % | ||||||||||||||||||||
| Apartment | 81.5 | 0.3 | % | 86.4 | 0.3 | % | ||||||||||||||||||||
| $ | 171.6 | 0.6 | % | $ | 176.7 | 0.6 | % | |||||||||||||||||||
| Oregon | ||||||||||||||||||||||||||
| Apartment | 39.5 | 0.1 | % | 41.3 | 0.1 | % | ||||||||||||||||||||
| $ | 39.5 | 0.1 | % | $ | 41.3 | 0.1 | % | |||||||||||||||||||
| Pennsylvania | ||||||||||||||||||||||||||
| Retail | 67.1 | 0.2 | % | 68.1 | 0.2 | % | ||||||||||||||||||||
| $ | 67.1 | 0.2 | % | $ | 68.1 | 0.2 | % | |||||||||||||||||||
| South Carolina | ||||||||||||||||||||||||||
| Apartment | 82.7 | 0.3 | % | 89.5 | 0.3 | % | ||||||||||||||||||||
| Retail | 47.2 | 0.2 | % | 46.9 | 0.2 | % | ||||||||||||||||||||
| $ | 129.9 | 0.5 | % | $ | 136.4 | 0.5 | % | |||||||||||||||||||
| Tennessee | ||||||||||||||||||||||||||
| Retail | 150.1 | 0.5 | % | 149.5 | 0.5 | % | ||||||||||||||||||||
| Industrial | 71.2 | 0.3 | % | 73.9 | 0.3 | % | ||||||||||||||||||||
| Apartment | 38.5 | 0.1 | % | 38.6 | 0.1 | % | ||||||||||||||||||||
| $ | 259.8 | 0.9 | % | $ | 262.0 | 0.9 | % | |||||||||||||||||||
| Texas | ||||||||||||||||||||||||||
| Industrial | 965.3 | 3.4 | % | 936.5 | 3.2 | % | ||||||||||||||||||||
| Apartment | 685.4 | 2.4 | % | 706.9 | 2.4 | % | ||||||||||||||||||||
| Office | 556.7 | 2.0 | % | 591.8 | 2.0 | % | ||||||||||||||||||||
26
TIAA REAL ESTATE ACCOUNT
CONDENSED CONSOLIDATED SCHEDULES OF INVESTMENTS
(Dollar values shown in millions)
| REAL ESTATE PROPERTIES | ||||||||||||||||||||||||||
| Location/Sector | March 31, 2023 | December 31, 2022 | ||||||||||||||||||||||||
| Fair Value | % of Net Assets | Fair Value | % of Net Assets | |||||||||||||||||||||||
| Hotel | 90.0 | 0.3 | % | 87.6 | 0.3 | % | ||||||||||||||||||||
| $ | 2,297.4 | 8.1 | % | $ | 2,322.8 | 7.8 | % | |||||||||||||||||||
| Utah | ||||||||||||||||||||||||||
| Office | 111.7 | 0.4 | % | 119.5 | 0.4 | % | ||||||||||||||||||||
| $ | 111.7 | 0.4 | % | $ | 119.5 | 0.4 | % | |||||||||||||||||||
| Virginia | ||||||||||||||||||||||||||
| Apartment | 411.5 | 1.5 | % | 414.0 | 1.4 | % | ||||||||||||||||||||
| Retail | 153.1 | 0.6 | % | 152.7 | 0.5 | % | ||||||||||||||||||||
| Office | 106.3 | 0.4 | % | 114.1 | 0.4 | % | ||||||||||||||||||||
| $ | 670.9 | 2.5 | % | $ | 680.8 | 2.3 | % | |||||||||||||||||||
| Washington | ||||||||||||||||||||||||||
| Industrial | 587.8 | 2.1 | % | 595.2 | 2.0 | % | ||||||||||||||||||||
| Apartment | 311.1 | 1.1 | % | 327.1 | 1.1 | % | ||||||||||||||||||||
| $ | 898.9 | 3.2 | % | $ | 922.3 | 3.1 | % | |||||||||||||||||||
| Washington D.C. | ||||||||||||||||||||||||||
| Office | 1,224.6 | 4.4 | % | 1,248.0 | 4.2 | % | ||||||||||||||||||||
| Apartment | 333.8 | 1.2 | % | 353.1 | 1.2 | % | ||||||||||||||||||||
| $ | 1,558.4 | 5.6 | % | $ | 1,601.1 | 5.4 | % | |||||||||||||||||||
| TOTAL REAL ESTATE PROPERTIES | ||||||||||||||||||||||||||
| (Cost: $14,424.5 and $14,323.2) | $ | 20,057.9 | 71.5 | % | $ | 20,444.0 | 68.9 | % | ||||||||||||||||||
| REAL ESTATE JOINT VENTURES | ||||||||||||||||||||||||||
| Location/Sector | March 31, 2023 | December 31, 2022 | ||||||||||||||||||||||||
| Fair Value | % of Net Assets | Fair Value | % of Net Assets | |||||||||||||||||||||||
| Arizona | ||||||||||||||||||||||||||
| Land | 23.7 | 0.1 | % | 17.3 | 0.1 | % | ||||||||||||||||||||
| $ | 23.7 | 0.1 | % | $ | 17.3 | 0.1 | % | |||||||||||||||||||
| California | ||||||||||||||||||||||||||
| Office | 958.4 | 3.4 | % | 1,082.2 | 3.6 | % | ||||||||||||||||||||
| Retail | 50.9 | 0.2 | % | 50.6 | 0.2 | % | ||||||||||||||||||||
| $ | 1,009.3 | 3.6 | % | $ | 1,132.8 | 3.8 | % | |||||||||||||||||||
| Florida | ||||||||||||||||||||||||||
| Retail | 605.9 | 2.2 | % | 624.8 | 2.1 | % | ||||||||||||||||||||
| $ | 605.9 | 2.2 | % | $ | 624.8 | 2.1 | % | |||||||||||||||||||
| Georgia | ||||||||||||||||||||||||||
| Land | 7.1 | — | % | — | — | % | ||||||||||||||||||||
| $ | 7.1 | — | % | $ | — | — | % | |||||||||||||||||||
| Maryland | ||||||||||||||||||||||||||
| Land | 28.5 | 0.1 | % | 16.0 | 0.1 | % | ||||||||||||||||||||
| Retail | 16.9 | 0.1 | % | 17.1 | 0.1 | % | ||||||||||||||||||||
| $ | 45.4 | 0.2 | % | $ | 33.1 | 0.1 | % | |||||||||||||||||||
| Massachusetts | ||||||||||||||||||||||||||
| Office | 423.0 | 1.5 | % | 447.6 | 1.5 | % | ||||||||||||||||||||
| $ | 423.0 | 1.5 | % | $ | 447.6 | 1.5 | % | |||||||||||||||||||
| Nevada | ||||||||||||||||||||||||||
| Retail | 505.4 | 1.8 | % | 503.9 | 1.7 | % | ||||||||||||||||||||
| $ | 505.4 | 1.8 | % | $ | 503.9 | 1.7 | % | |||||||||||||||||||
27
TIAA REAL ESTATE ACCOUNT
CONDENSED CONSOLIDATED SCHEDULES OF INVESTMENTS
(Dollar values shown in millions)
| REAL ESTATE JOINT VENTURES | ||||||||||||||||||||||||||
| Location/Sector | March 31, 2023 | December 31, 2022 | ||||||||||||||||||||||||
| Fair Value | % of Net Assets | Fair Value | % of Net Assets | |||||||||||||||||||||||
| New York | ||||||||||||||||||||||||||
| Office | 124.7 | 0.4 | % | 139.7 | 0.5 | % | ||||||||||||||||||||
| Industrial | 73.5 | 0.3 | % | 78.5 | 0.3 | % | ||||||||||||||||||||
| Apartment | 48.0 | 0.2 | % | 51.7 | 0.2 | % | ||||||||||||||||||||
| Retail | 34.5 | 0.1 | % | 32.9 | 0.1 | % | ||||||||||||||||||||
| $ | 280.7 | 1.0 | % | $ | 302.8 | 1.0 | % | |||||||||||||||||||
| North Carolina | ||||||||||||||||||||||||||
| Apartments | 92.7 | 0.3 | % | — | — | % | ||||||||||||||||||||
| Office | 43.8 | 0.2 | % | 49.3 | 0.2 | % | ||||||||||||||||||||
| Retail | 41.6 | 0.1 | % | 143.0 | 0.5 | % | ||||||||||||||||||||
| Land | 29.7 | 0.1 | % | 30.8 | 0.1 | % | ||||||||||||||||||||
| $ | 207.8 | 0.7 | % | $ | 223.1 | 0.8 | % | |||||||||||||||||||
| South Carolina | ||||||||||||||||||||||||||
| Apartment | 60.8 | 0.2 | % | 60.0 | 0.2 | % | ||||||||||||||||||||
| Land | 7.8 | — | % | 8.7 | — | % | ||||||||||||||||||||
| $ | 68.6 | 0.2 | % | $ | 68.7 | 0.2 | % | |||||||||||||||||||
| Tennessee | ||||||||||||||||||||||||||
| Retail | 213.2 | 0.8 | % | 225.0 | 0.8 | % | ||||||||||||||||||||
| $ | 213.2 | 0.8 | % | $ | 225.0 | 0.8 | % | |||||||||||||||||||
| Texas | ||||||||||||||||||||||||||
| Office | 329.7 | 1.2 | % | 348.8 | 1.2 | % | ||||||||||||||||||||
| Industrial | 55.0 | 0.2 | % | 53.3 | 0.2 | % | ||||||||||||||||||||
| Land | 23.8 | 0.1 | % | 28.8 | 0.1 | % | ||||||||||||||||||||
| $ | 408.5 | 1.5 | % | $ | 430.9 | 1.5 | % | |||||||||||||||||||
| Washington | ||||||||||||||||||||||||||
| Office | 112.1 | 0.4 | % | 135.9 | 0.5 | % | ||||||||||||||||||||
| $ | 112.1 | 0.4 | % | $ | 135.9 | 0.5 | % | |||||||||||||||||||
Various(1) | ||||||||||||||||||||||||||
| Storage | 1,292.4 | 4.6 | % | 1,310.2 | 4.4 | % | ||||||||||||||||||||
| Apartment | 1,064.3 | 3.8 | % | 1,146.4 | 3.9 | % | ||||||||||||||||||||
| Office | 460.6 | 1.6 | % | 471.7 | 1.6 | % | ||||||||||||||||||||
| $ | 2,817.3 | 10.0 | % | $ | 2,928.3 | 9.9 | % | |||||||||||||||||||
Foreign(2) | ||||||||||||||||||||||||||
| Land | 24.8 | 0.1 | % | 20.4 | 0.1 | % | ||||||||||||||||||||
Other(3) | 9.3 | — | % | 9.0 | — | % | ||||||||||||||||||||
| $ | 34.1 | 0.1 | % | $ | 29.4 | 0.1 | % | |||||||||||||||||||
| TOTAL REAL ESTATE JOINT VENTURES | ||||||||||||||||||||||||||
| (Cost: $5,789.4 and $5,738.1) | $ | 6,762.1 | 24.1 | % | $ | 7,103.6 | 24.0 | % | ||||||||||||||||||
(1)Properties within these investments are located throughout the loaned securities and maintains cash collateral in an amount not less than 100%United States.
(2)Property is located outside of the market value of loaned securities during the period of the loan; any additional collateral required due to changes in security values is delivered to the Account the next business day. Cash collateral received by the Account is invested exclusively in an interest-bearing deposit account. United States.
(3)The value ofrepresents the loaned securities and the liability to return the cash collateral received are reflectedequity interest in the consolidated statements of assets and liabilities. joint venture, which does not currently hold any properties.
28
TIAA REAL ESTATE PROPERTIES—57.6% and 58.0%ACCOUNT
CONDENSED CONSOLIDATED SCHEDULES OF INVESTMENTS
(Dollar values shown in millions)
| MARKETABLE SECURITIES | ||||||||||||||||||||||||||
| March 31, 2023 | December 31, 2022 | |||||||||||||||||||||||||
| Fair Value | % of Net Assets | Fair Value | % of Net Assets | |||||||||||||||||||||||
| Corporate bonds | 273.2 | 1.0 | % | 536.4 | 1.8 | % | ||||||||||||||||||||
| U.S. government agency notes | 709.2 | 2.5 | % | 902.9 | 3.0 | % | ||||||||||||||||||||
| Foreign government agency notes | 17.1 | 0.1 | % | 16.9 | 0.1 | % | ||||||||||||||||||||
| U.S. treasury securities | 255.8 | 0.9 | % | 574.0 | 1.9 | % | ||||||||||||||||||||
| TOTAL MARKETABLE SECURITIES | ||||||||||||||||||||||||||
| (Cost: $1,273.4 and $2,077.1) | $ | 1,255.3 | 4.5 | % | $ | 2,030.2 | 6.8 | % | ||||||||||||||||||
| TOTAL REAL ESTATE FUNDS | ||||||||||||||||||||||||||
| (Cost: $815.2 and $787.7) | $ | 931.9 | 3.3 | % | $ | 893.4 | 3.0 | % | ||||||||||||||||||
| TOTAL REAL ESTATE OPERATING BUSINESS | ||||||||||||||||||||||||||
| (Cost: $355.0 and $355.0) | $ | 636.0 | 2.3 | % | $ | 641.9 | 2.2 | % | ||||||||||||||||||
| TOTAL LOANS RECEIVABLE | ||||||||||||||||||||||||||
| (Cost: ($1,549.2 and $1,546.0) | $ | 1,378.9 | 4.9 | % | $ | 1,418.7 | 4.8 | % | ||||||||||||||||||
| TOTAL LOANS RECEIVABLE WITH RELATED PARTIES | ||||||||||||||||||||||||||
| (Cost: $71.3 and $69.9) | $ | 71.3 | 0.3 | % | $ | 69.9 | 0.2 | % | ||||||||||||||||||
| TOTAL INVESTMENTS | ||||||||||||||||||||||||||
| (Cost: $24,278.0 and $24,897.0) | $ | 31,093.4 | 110.9 | % | $ | 32,601.7 | 109.9 | % | ||||||||||||||||||
29
| Location/Description | Type | Fair Value at | ||||||||||
| September 30, 2017 | December 31, 2016 | |||||||||||
| (Unaudited) | ||||||||||||
| Arizona: | ||||||||||||
| Camelback Center | Office | $ | 58.4 | $ | 56.4 | |||||||
| Kierland Apartment Portfolio | Apartments | 147.7 | 127.9 | (1) | ||||||||
| California: | ||||||||||||
| 55 Second Street | Office | 353.1 | (1) | 335.0 | (1) | |||||||
| 88 Kearny Street | Office | 177.6 | 172.3 | |||||||||
| 200 Middlefield Road | Office | 61.2 | 60.5 | |||||||||
| BLVD63 | Apartments | 162.0 | 157.0 | |||||||||
| Castro Station | Office | 163.0 | 158.2 | |||||||||
| Centre Pointe and Valley View | Industrial | 43.9 | 42.8 | |||||||||
| Cerritos Industrial Park | Industrial | 140.0 | 126.3 | |||||||||
| Charleston Plaza | Retail | 93.0 | 92.0 | |||||||||
| Great West Industrial Portfolio | Industrial | 160.9 | 166.1 | |||||||||
| Holly Street Village | Apartments | 148.0 | 146.0 | |||||||||
| Larkspur Courts | Apartments | 141.4 | 140.5 | |||||||||
| Northern CA RA Industrial Portfolio | Industrial | 87.0 | 76.7 | |||||||||
| Oakmont IE West Portfolio | Industrial | 87.2 | 82.7 | |||||||||
| Oceano at Warner Center | Apartments | 89.0 | 88.3 | |||||||||
| Ontario Industrial Portfolio | Industrial | 397.4 | (11) | 438.0 | ||||||||
| Ontario Mills Industrial Portfolio | Industrial | 55.9 | 52.0 | |||||||||
| Pacific Plaza | Office | 115.2 | 115.0 | |||||||||
| Rancho Cucamonga Industrial Portfolio | Industrial | 70.9 | (11) | 174.2 | ||||||||
| Regents Court | Apartments | 95.4 | (1) | 89.9 | (1) | |||||||
| Southern CA RA Industrial Portfolio | Industrial | 136.2 | 135.0 | |||||||||
| Stella | Apartments | 178.9 | 173.1 | |||||||||
| Stevenson Point | Industrial | 49.9 | 49.3 | |||||||||
| The Forum at Carlsbad | Retail | 220.0 | (1) | 221.5 | (1) | |||||||
| The Legacy at Westwood | Apartments | 143.0 | (1) | 142.1 | (1) | |||||||
| Township Apartments | Apartments | 89.8 | 89.6 | |||||||||
| West Lake North Business Park | Office | 60.4 | 60.0 | |||||||||
| Westcreek | Apartments | 51.1 | 48.2 | |||||||||
| Westwood Marketplace | Retail | 131.8 | 125.0 | |||||||||
| Wilshire Rodeo Plaza | Office | 326.7 | 320.7 | |||||||||
| Colorado: | ||||||||||||
| Palomino Park | Apartments | 327.9 | (1) | 314.1 | (1) | |||||||
| South Denver Marketplace | Retail | 72.7 | 73.0 | |||||||||
| Connecticut: | ||||||||||||
| Wilton Woods Corporate Campus | Office | 134.0 | 141.9 | |||||||||
| Florida: | ||||||||||||
| 701 Brickell Avenue | Office | 362.6 | (1) | 380.7 | (1) | |||||||
| Broward Industrial Portfolio | Industrial | 54.1 | — | |||||||||
| Casa Palma | Apartments | 95.0 | 97.0 | |||||||||
| Orion on Orpington | Apartments | 42.1 | — | |||||||||
| Publix at Weston Commons | Retail | 74.1 | 73.0 | |||||||||
| Seneca Industrial Park | Industrial | 106.4 | 102.7 | |||||||||
| South Florida Apartment Portfolio | Apartments | 105.0 | 104.1 | |||||||||
| Location/Description | Type | Fair Value at | ||||||||||
| September 30, 2017 | December 31, 2016 | |||||||||||
| (Unaudited) | ||||||||||||
| The Manor Apartments | Apartments | 52.8 | 53.6 | |||||||||
| The Manor at Flagler Village | Apartments | 148.0 | 150.8 | |||||||||
| The Residences at the Village of Merrick Park | Apartments | 75.0 | 74.1 | |||||||||
| Urban Centre | Office | 138.8 | 121.4 | |||||||||
| Weston Business Center | Industrial | 92.8 | 92.7 | |||||||||
| Georgia: | ||||||||||||
| Atlanta Industrial Portfolio | Industrial | 31.6 | (6) | 62.8 | ||||||||
| Shawnee Ridge Industrial Portfolio | Industrial | 89.6 | 86.7 | |||||||||
| Illinois: | ||||||||||||
| 32 South State Street | Retail | 47.7 | (1) | 46.5 | (1) | |||||||
| 803 Corday | Apartments | 92.5 | — | |||||||||
| Chicago Caleast Industrial Portfolio | Industrial | 80.3 | 81.8 | |||||||||
| Chicago Industrial Portfolio | Industrial | 96.6 | 85.5 | |||||||||
| Maryland: | ||||||||||||
| Landover Logistics Center | Industrial | 43.1 | 39.8 | |||||||||
| The Shops at Wisconsin Place | Retail | 91.0 | 92.8 | |||||||||
| Massachusetts: | ||||||||||||
| 99 High Street | Office | 504.0 | 514.1 | |||||||||
| 501 Boylston Street | Office | 506.3 | (1) | 490.3 | (1) | |||||||
| Fort Point Creative Exchange Portfolio | Office | 217.9 | 223.0 | |||||||||
| Northeast RA Industrial Portfolio | Industrial | 40.2 | 41.3 | |||||||||
| One Beeman Road | Industrial | 33.7 | — | |||||||||
| Minnesota: | ||||||||||||
| The Bridges | Apartments | 62.1 | — | |||||||||
| The Knoll | Apartments | 33.3 | (1) | — | ||||||||
| New Jersey: | ||||||||||||
| 200 Milik Street | Industrial | 52.1 | 51.2 | |||||||||
| Marketfair | Retail | 105.0 | 104.2 | |||||||||
| Amazon Distribution Center | Industrial | 110.0 | 101.0 | |||||||||
| South River Road Industrial | Industrial | 87.2 | 71.9 | |||||||||
| New York: | ||||||||||||
| 21 Penn Plaza | Office | 266.3 | 275.2 | |||||||||
| 250 North 10th Street | Apartments | 166.0 | 162.0 | |||||||||
| 425 Park Avenue | Ground Lease | 454.0 | 450.0 | |||||||||
| 430 West 15th Street | Office | 140.5 | 116.1 | |||||||||
| 780 Third Avenue | Office | 429.0 | (1) | 425.0 | (1) | |||||||
| 837 Washington Street | Office | 209.0 | 215.0 | |||||||||
| The Colorado | Apartments | 256.0 | (1) | 258.1 | (1) | |||||||
| The Corner | Apartments | 253.1 | (1) | 250.0 | (1) | |||||||
| Oregon: | ||||||||||||
| The Cordelia | Apartments | 49.0 | 50.0 | |||||||||
| Pennsylvania: | ||||||||||||
| 1619 Walnut Street | Retail | 23.4 | 23.4 | |||||||||
| The Pepper Building | Apartments | — | 52.9 | |||||||||
| South Carolina: | ||||||||||||
| Greene Crossing | Apartments | 65.8 | 65.8 | |||||||||
| Tennessee: | ||||||||||||
| Southside at McEwen | Retail | 48.2 | 48.8 | |||||||||
| Location/Description | Type | Fair Value at | ||||||||||
| September 30, 2017 | December 31, 2016 | |||||||||||
| (Unaudited) | ||||||||||||
| Texas: | ||||||||||||
| Beltway North Commerce Center | Industrial | 19.2 | 19.5 | |||||||||
| Cliffs at Barton Creek | Apartments | 45.7 | 45.8 | |||||||||
| Dallas Industrial Portfolio | Industrial | 210.5 | 201.3 | |||||||||
| Houston Apartment Portfolio | Apartments | 159.3 | 159.3 | |||||||||
| Lincoln Centre | Office | 353.0 | 347.0 | |||||||||
| Northwest Houston Industrial Portfolio | Industrial | 70.0 | 68.2 | |||||||||
| Park 10 Distribution | Industrial | 10.3 | 11.3 | |||||||||
| Pinnacle Industrial Portfolio | Industrial | 53.4 | 52.8 | |||||||||
| Pinto Business Park | Industrial | 130.8 | 134.2 | |||||||||
| The Caruth | Apartments | 82.7 | (1) | 84.3 | (1) | |||||||
| The Maroneal | Apartments | 54.5 | 52.1 | |||||||||
| Virginia: | ||||||||||||
| 8270 Greensboro Drive | Office | 47.3 | 47.6 | |||||||||
| Ashford Meadows Apartments | Apartments | 106.6 | (1) | 107.2 | (1) | |||||||
| Plaza America | Retail | 115.0 | 109.0 | |||||||||
| The Ellipse at Ballston | Office | 84.4 | 79.8 | |||||||||
| The Palatine | Apartments | 121.1 | (1) | 130.9 | (1) | |||||||
| Washington: | ||||||||||||
| Circa Green Lake | Apartments | 94.4 | 92.5 | |||||||||
| Fourth and Madison | Office | 527.0 | (1) | 521.0 | (1) | |||||||
| Millennium Corporate Park | Office | 182.1 | 190.1 | |||||||||
| Northwest RA Industrial Portfolio | Industrial | 38.2 | 31.7 | |||||||||
| Pacific Corporate Park | Industrial | 44.5 | 42.0 | |||||||||
| Prescott Wallingford Apartments | Apartments | 62.0 | 58.8 | |||||||||
| Rainier Corporate Park | Industrial | 114.7 | 104.0 | |||||||||
| Regal Logistics Campus | Industrial | 97.8 | 83.1 | |||||||||
| Union - South Lake Union | Apartments | 109.1 | 105.3 | |||||||||
| Washington DC: | ||||||||||||
| 1001 Pennsylvania Avenue | Office | 810.0 | (1) | 810.0 | (1) | |||||||
| 1401 H Street, NW | Office | 203.1 | (1) | 230.0 | (1) | |||||||
| 1900 K Street, NW | Office | 330.2 | (1) | 335.0 | (1) | |||||||
| Mass Court | Apartments | 171.0 | (1) | 169.0 | (1) | |||||||
| Mazza Gallerie | Retail | — | 78.0 | |||||||||
| The Ashton | Apartments | 38.5 | 39.2 | |||||||||
| The Louis at 14th | Apartments | 175.0 | 183.2 | |||||||||
| The Woodley | Apartments | 191.0 | 203.0 | |||||||||
| TOTAL REAL ESTATE PROPERTIES | ||||||||||||
| (Cost $12,944.7 and $12,818.1) | $ | 15,654.2 | $ | 15,452.8 | ||||||||
| Location/Description | Type | Fair Value at | ||||||||||
| September 30, 2017 | December 31, 2016 | |||||||||||
| (Unaudited) | ||||||||||||
| California: | ||||||||||||
CA—Colorado Center LP Colorado Center (50% Account Interest) | Office | $ | 355.1 | (2) | $ | 567.8 | ||||||
PC Borrower, LLC Pacific City (70% Account Interest) | Retail | 133.8 | 128.5 | |||||||||
| TREA Campus Pointe 1, LLC Campus Pointe 1 (45% Account Interest) | Office | 139.4 | 137.5 | |||||||||
| TREA Campus Pointe 2, LLC Campus Pointe 2 (43.16% Account Interest) | Office | 104.2 | 85.7 | |||||||||
T-C 1500 Owens, LLC 1500 Owens Street (49.9% Account Interest) | Office | 77.0 | 74.8 | |||||||||
T-C Foundry Square II Venture LLC Foundry Square II (50.1% Account Interest) | Office | 257.4 | 200.1 | (2) | ||||||||
T-C Illinois Street, LLC 409-499 Illinois Street (40% Account Interest) | Office | 206.3 | 196.8 | |||||||||
Valencia Town Center Associates LP Valencia Town Center (50% Account Interest) | Retail | 137.5 | (2) | 128.0 | (2) | |||||||
| Florida: | ||||||||||||
Florida Mall Associates, Ltd The Florida Mall (50% Account Interest) | Retail | 754.8 | (2) | 755.8 | (2) | |||||||
TREA Florida Retail, LLC Florida Retail Portfolio (80% Account Interest) | Retail | 150.0 | 147.6 | |||||||||
West Dade County Associates Miami International Mall (50% Account Interest) | Retail | 164.2 | (2) | 161.1 | (2) | |||||||
| Maryland: | ||||||||||||
WP Project Developer The Shops at Wisconsin Place (33.33% Account Interest) | Retail | 21.0 | 19.4 | |||||||||
| Massachusetts: | ||||||||||||
One Boston Place REIT One Boston Place (50.25% Account Interest) | Office | 238.8 | 224.2 | |||||||||
T-C 225 Binney, LLC 225 Binney Street (70% Account Interest) | Office | 195.7 | 194.9 | |||||||||
| Nevada: | ||||||||||||
Fashion Show Holding I, LLC Fashion Show (50% Account Interest) | Retail | 837.9 | (2) | 839.1 | (2) | |||||||
| New York: | ||||||||||||
401 West 14th Street, LLC 401 West 14th Street (42.19% Account Interest) | Retail | 45.5 | (2) | 41.1 | (2) | |||||||
817 Broadway Owner, LLC 817 Broadway (61.46% Account Interest) | Office | 23.3 | (2) | 20.8 | (2) | |||||||
MRA Hub 34 Holding, LLC The Hub (95% Account Interest) | Office | 57.1 | (2) | 54.9 | (2) | |||||||
RGM 42, LLC MiMA (70% Account Interest) | Apartments | 188.0 | (2) | 194.7 | (2) | |||||||
TREA 35th Street LIC Investor Member, LLC Commerce LIC (97.5% Account Interest) | Industrial | 57.9 | — | |||||||||
| Tennessee: | ||||||||||||
West Town Mall, LLC West Town Mall (50% Account Interest) | Retail | 137.1 | (2) | 154.4 | (2) | |||||||
| Location/Description | Type | Fair Value at | ||||||||||
| September 30, 2017 | December 31, 2016 | |||||||||||
| (Unaudited) | ||||||||||||
| Texas: | ||||||||||||
Four Oaks Venture LP Four Oaks Place LP (51% Account Interest) | Office | 341.6 | (2) | 342.3 | (2) | |||||||
| Washington: | ||||||||||||
T-C REA 400 Fairview Investor, LLC 400 Fairview (90% Account Interest) | Office | 262.4 | 243.6 | |||||||||
| Various: | ||||||||||||
DDRTC Core Retail Fund, LLC DDR Joint Venture (85% Account Interest) | Retail | 615.8 | (2,3) | 552.8 | (2,3) | |||||||
Storage Portfolio I, LLC Storage Portfolio (75% Account Interest) | Storage | 173.6 | (2,3) | 156.5 | (2,3) | |||||||
TOTAL REAL ESTATE JOINT VENTURES (Cost $4,399.3 and $4,393.2) | $ | 5,675.4 | $ | 5,622.4 | ||||||||
| LIMITED PARTNERSHIPS—0.5% and 0.5% | ||||||||||||
| Clarion Gables Multi-Family Trust LP (8.407% Account Interest) | $ | 124.9 | $ | 121.6 | ||||||||
| Colony Realty Partners LP (5.27% Account Interest) | — | 3.1 | (10) | |||||||||
| Lion Gables Apartment Fund (18.46% Account Interest) | — | 0.2 | (5) | |||||||||
| Taconic New York City GP Fund, LP (60% Account Interest) | 11.0 | 4.8 | ||||||||||
| Transwestern Mezz Realty Partners III, LLC (11.708% Account Interest) | 4.8 | 7.8 | ||||||||||
TOTAL LIMITED PARTNERSHIPS (Cost $140.9 and $137.2) | $ | 140.7 | $ | 137.5 | ||||||||
TOTAL REAL ESTATE JOINT VENTURES AND LIMITED PARTNERSHIPS (Cost $4,540.2 and $4,530.4) | $ | 5,816.1 | $ | 5,759.9 | ||||||||
| Shares | Issuer | Fair Value at | ||||||||||||||
| September 30, 2017 | December 31, 2016 | |||||||||||||||
| 2017 | 2016 | |||||||||||||||
| (Unaudited) | ||||||||||||||||
| 82,202 | 84,437 | Acadia Realty Trust | $ | 2.3 | $ | 2.8 | ||||||||||
| 28,294 | 26,717 | Agree Realty Corporation | 1.4 | 1.2 | ||||||||||||
| 2,132 | 2,132 | Alexander's, Inc. | 0.9 | 0.9 | ||||||||||||
| 92,255 | 83,175 | Alexandria Real Estate Equities, Inc. | 11.0 | 9.2 | ||||||||||||
| 48,980 | — | Altisource Residential Corp. | 0.5 | — | ||||||||||||
| 40,188 | 41,010 | American Assets Trust, Inc. | 1.6 | 1.8 | ||||||||||||
| 133,888 | 138,467 | American Campus Communities, Inc. | 5.9 | 6.9 | ||||||||||||
| — | 6,347 | American Farmland Company | — | 0.1 | ||||||||||||
| 239,344 | 233,916 | American Homes 4 Rent | 5.2 | 4.9 | ||||||||||||
| 421,695 | 443,315 | American Tower Corp. | 57.6 | 46.8 | ||||||||||||
| 155,985 | 163,592 | Apartment Investment and Management Company | 6.8 | 7.4 | ||||||||||||
| 210,602 | 223,733 | Apple Hospitality Inc. | 4.0 | 4.5 | ||||||||||||
| 47,395 | 38,282 | Armada Hoffler Properties Inc. | 0.7 | 0.6 | ||||||||||||
| 27,462 | 27,631 | Ashford Hospitality Prime Inc. | 0.3 | 0.4 | ||||||||||||
| 75,865 | 96,553 | Ashford Hospitality Trust, Inc. | 0.5 | 0.7 | ||||||||||||
| 137,335 | 143,728 | Avalonbay Communities, Inc. | 24.5 | 25.5 | ||||||||||||
| 24,509 | 21,354 | Bluerock Residential Growth, Inc. | 0.3 | 0.3 | ||||||||||||
| 153,602 | 160,997 | Boston Properties, Inc. | 18.9 | 20.3 | ||||||||||||
| 172,155 | 183,336 | Brandywine Realty Trust | 3.0 | 3.0 | ||||||||||||
| 305,457 | 319,555 | Brixmore Property Group Inc | 5.7 | 7.8 | ||||||||||||
| 90,816 | 91,727 | Camden Property Trust | 8.3 | 7.7 | ||||||||||||
| — | 89,419 | Care Capital Properties, Inc. | — | 2.2 | ||||||||||||
| 76,188 | 64,966 | CareTrust REIT Inc. | 1.5 | 1.0 | ||||||||||||
| 39,488 | 43,788 | Catchmark Timber Trust, Inc. | 0.5 | 0.5 | ||||||||||||
| 167,957 | 178,895 | CBL & Associates Properties, Inc. | 1.4 | (9) | 2.1 | |||||||||||
| 92,124 | 92,124 | Cedar Shopping Centers, Inc. | 0.5 | 0.6 | ||||||||||||
| 39,759 | 39,759 | Chatham Lodging Trust | 0.8 | 0.8 | ||||||||||||
| 58,946 | 63,363 | Chesapeake Lodging Trust | 1.6 | 1.6 | ||||||||||||
| 15,330 | — | Clipper Realty, Inc. | 0.2 | (9) | — | |||||||||||
| 541,689 | — | Colony Northstar, Inc. | 6.8 | — | ||||||||||||
| — | 50,961 | Colony Starwood Homes | — | 1.5 | ||||||||||||
| 122,581 | 130,704 | Columbia Property Trust Inc. | 2.7 | 2.8 | ||||||||||||
| — | 161,499 | Communication Sales & Leasing, Inc. | — | 4.1 | ||||||||||||
| 17,855 | 13,231 | Community Healthcare Trust, Inc. | 0.5 | 0.3 | ||||||||||||
| 117,713 | 117,878 | CoreCivic, Inc. | 3.2 | 2.9 | ||||||||||||
| 12,695 | 12,695 | Corenergy Infrastructure Trust, Inc. | 0.4 | (9) | 0.4 | |||||||||||
| 33,863 | 35,452 | CoreSite Realty Corporation | 3.8 | 2.8 | ||||||||||||
| 99,369 | 98,668 | Corporate Office Properties Trust | 3.3 | 3.1 | ||||||||||||
| 414,681 | 358,876 | Cousins Properties Incorporated | 3.9 | 3.1 | ||||||||||||
| 401,185 | 378,286 | Crown Castle International Corporation | 40.1 | 32.8 | ||||||||||||
| 180,122 | 189,128 | Cubesmart | 4.7 | 5.1 | ||||||||||||
| 86,428 | 80,245 | CyrusOne Inc. | 5.1 | 3.6 | ||||||||||||
| 92,007 | 95,203 | DCT Industrial Trust, Inc. | 5.3 | 4.6 | ||||||||||||
| 308,806 | 326,844 | DDR Corp | 2.8 | 5.0 | ||||||||||||
| 198,919 | 211,566 | DiamondRock Hospitality Company | 2.2 | 2.4 | ||||||||||||
| 203,672 | 166,911 | Digital Realty Trust, Inc. | 24.1 | 16.4 | ||||||||||||
| Shares | Issuer | Fair Value at | ||||||||||||||
| September 30, 2017 | December 31, 2016 | |||||||||||||||
| 2017 | 2016 | |||||||||||||||
| (Unaudited) | ||||||||||||||||
| 144,167 | 146,715 | Douglas Emmett, Inc. | $ | 5.7 | $ | 5.4 | ||||||||||
| 355,455 | 371,513 | Duke Realty Corporation | 10.2 | 9.9 | ||||||||||||
| — | 79,039 | DuPont Fabros Technology, Inc. | — | 3.5 | ||||||||||||
| 38,107 | 38,107 | Easterly Government Properties, Inc. | 0.8 | 0.8 | ||||||||||||
| 32,984 | 34,448 | EastGroup Properties, Inc. | 2.9 | 2.5 | ||||||||||||
| 73,142 | 76,609 | Education Realty Trust, Inc. | 2.6 | 3.2 | ||||||||||||
| 125,679 | 128,313 | Empire State Realty Trust | 2.6 | 2.6 | ||||||||||||
| 62,943 | 66,086 | EPR Properties | 4.4 | 4.7 | ||||||||||||
| 77,532 | 74,499 | Equinix Inc. | 34.6 | 26.6 | ||||||||||||
| 120,619 | 132,412 | Equity Commonwealth | 3.7 | 4.0 | ||||||||||||
| 81,386 | 81,207 | Equity Lifestyle Properties, Inc. | 6.9 | 5.9 | ||||||||||||
| — | 97,735 | Equity One, Inc. | — | 3.0 | ||||||||||||
| 355,638 | 378,516 | Equity Residential | 23.4 | 24.4 | ||||||||||||
| 39,142 | 39,142 | Escrow Winthrop Realty Trust | 0.3 | 0.3 | ||||||||||||
| 65,165 | 68,928 | Essex Property Trust, Inc. | 16.6 | 16.0 | ||||||||||||
| 121,584 | 123,598 | Extra Space Storage, Inc. | 9.7 | 9.5 | ||||||||||||
| 33,146 | 20,247 | Farmland Partners, Inc. | 0.3 | (9) | 0.2 | (9) | ||||||||||
| 72,018 | 75,390 | Federal Realty Investment Trust | 8.9 | 10.7 | ||||||||||||
| — | 146,636 | FelCor Lodging Trust Incorporated | — | 1.2 | ||||||||||||
| 117,988 | 122,078 | First Industrial Realty Trust, Inc. | 3.6 | 3.4 | ||||||||||||
| 62,454 | 62,454 | First Potomac Realty Trust | 0.7 | 0.7 | ||||||||||||
| 242,943 | 247,510 | Forest City Realty Trust A | 6.2 | 5.2 | ||||||||||||
| 62,347 | 62,347 | Four Corners Property Trust | 1.6 | 1.3 | ||||||||||||
| 105,457 | 105,457 | Franklin Street Properties Corp. | 1.1 | 1.4 | ||||||||||||
| 200,306 | 215,403 | Gaming and Leisure Properties, Inc. | 7.4 | 6.6 | ||||||||||||
| 616,628 | 528,439 | General Growth Properties, Inc. | 12.8 | 13.2 | ||||||||||||
| 121,553 | 75,332 | GEO Group, Inc./The | 3.3 | 2.7 | ||||||||||||
| 32,335 | 27,304 | Getty Realty Corp. | 0.9 | 0.7 | ||||||||||||
| 27,842 | 24,752 | Gladstone Commercial Corporation | 0.6 | 0.5 | ||||||||||||
| 7,822 | — | Gladstone Land Corporation | 0.1 | — | ||||||||||||
| 14,323 | 14,323 | Global Medical REIT, Inc. | 0.1 | (9) | 0.1 | (9) | ||||||||||
| 66,375 | 169,785 | Global Net Lease, Inc. | 1.5 | 1.3 | ||||||||||||
| 93,766 | 74,542 | Government Properties Income Trust | 1.8 | 1.4 | ||||||||||||
| 150,155 | 439,336 | Gramercy Property Trust Inc. | 4.5 | 4.0 | ||||||||||||
| 468,228 | 488,199 | HCP, Inc. | 13.0 | 14.5 | ||||||||||||
| 121,482 | 121,172 | Healthcare Realty Trust Inc. | 3.9 | 3.7 | ||||||||||||
| 197,648 | 148,194 | Healthcare Trust of America | 5.9 | 4.3 | ||||||||||||
| 38,921 | 38,921 | Hersha Hospitality Trust | 0.7 | 0.8 | ||||||||||||
| 100,544 | 105,127 | Highwoods Properties, Inc. | 5.2 | 5.4 | ||||||||||||
| 162,463 | 172,557 | Hospitality Properties Trust | 4.6 | 5.5 | ||||||||||||
| 730,412 | 784,264 | Host Hotels & Resorts, Inc. | 13.5 | 14.8 | ||||||||||||
| 156,033 | 130,545 | Hudson Pacific Properties, Inc. | 5.2 | 4.5 | ||||||||||||
| 70,772 | 64,154 | Independence Realty Trust, Inc. | 0.7 | 0.6 | ||||||||||||
| 130,841 | 130,841 | Investors Real Estate Trust | 0.8 | 0.9 | ||||||||||||
| 87,831 | — | Invitation Homes | 2.0 | — | ||||||||||||
| 262,389 | 251,283 | Iron Mountain Inc. | 10.2 | 8.2 | ||||||||||||
| 1,500,000 | 1,500,000 | iShares Dow Jones US Real Estate Index Fund | 119.8 | 115.4 | (9) | |||||||||||
| 86,089 | — | JBG Smith Properties | 2.9 | — | ||||||||||||
| 96,468 | 96,739 | Kilroy Realty Corporation | 6.9 | 7.1 | ||||||||||||
| Shares | Issuer | Fair Value at | ||||||||||||||
| September 30, 2017 | December 31, 2016 | |||||||||||||||
| 2017 | 2016 | |||||||||||||||
| (Unaudited) | ||||||||||||||||
| 413,143 | 446,152 | Kimco Realty Corporation | $ | 8.1 | $ | 11.2 | ||||||||||
| 82,157 | 86,474 | Kite Realty Group Trust | 1.7 | 2.0 | ||||||||||||
| 82,861 | 86,839 | Lamar Advertising Corporation | 5.7 | 5.8 | ||||||||||||
| 113,248 | 118,625 | LaSalle Hotel Properties | 3.3 | 3.6 | ||||||||||||
| 233,615 | 246,697 | Lexington Realty Trust | 2.4 | 2.7 | ||||||||||||
| 147,200 | 154,875 | Liberty Property Trust | 6.0 | 6.1 | ||||||||||||
| 45,893 | 48,870 | Life Storage, Inc. | 3.8 | 4.2 | ||||||||||||
| 39,429 | 41,261 | LTC Properties, Inc. | 1.9 | 1.9 | ||||||||||||
| 91,244 | 93,046 | Mack-Cali Realty Corporation | 2.2 | 2.7 | ||||||||||||
| 29,800 | 23,475 | Medequities Realty Trust, Inc. | 0.4 | 0.3 | ||||||||||||
| 362,242 | 337,220 | Medical Properties Trust, Inc. | 4.8 | 4.1 | ||||||||||||
| 113,412 | 118,873 | Mid-America Apartment Communities, Inc. | 12.1 | 11.6 | ||||||||||||
| 71,720 | 69,038 | Monmouth Real Estate Investment Corporation | 1.2 | 1.1 | ||||||||||||
| — | 175,519 | Monogram Residential Trust Inc. | — | 1.9 | ||||||||||||
| 39,678 | 38,542 | National Health Investors, Inc. | 3.1 | 2.9 | ||||||||||||
| 148,742 | 154,142 | National Retail Properties, Inc. | 6.2 | 6.8 | ||||||||||||
| 44,249 | 44,249 | National Storage Affiliates Trust | 1.1 | 1.0 | ||||||||||||
| 83,324 | 83,324 | New Senior Investment Group | 0.8 | 0.8 | ||||||||||||
| — | 175,401 | New York REIT | — | 1.8 | ||||||||||||
| 17,140 | 17,140 | Nexpoint Residential Trust, Inc. | 0.4 | 0.4 | ||||||||||||
| 54,554 | 59,329 | NorthStar Realty Europe Corp. | 0.7 | 0.7 | ||||||||||||
| — | 189,799 | NorthStar Realty Finance Corp. | — | 2.9 | ||||||||||||
| 194,823 | 181,435 | Omega Healthcare Investors, Inc. | 6.2 | (9) | 5.7 | |||||||||||
| 16,324 | 16,324 | One Liberty Properties, Inc. | 0.4 | 0.4 | ||||||||||||
| 138,381 | 144,614 | Outfront Media Inc. | 3.5 | 3.6 | ||||||||||||
| 198,430 | 157,741 | Paramount Group Inc. | 3.2 | 2.5 | ||||||||||||
| 144,718 | — | Park Hotels & Resorts, Inc. | 4.0 | — | ||||||||||||
| 42,820 | 45,533 | Parkway Properties, Inc. | 1.0 | 1.0 | ||||||||||||
| 68,431 | 75,815 | Pebblebrook Hotel Trust | 2.5 | (9) | 2.3 | |||||||||||
| 69,866 | 69,866 | Pennsylvania Real Estate Investment Trust | 0.7 | (9) | 1.3 | |||||||||||
| 178,281 | 141,267 | Physicians Realty Trust | 3.2 | 2.7 | ||||||||||||
| 144,783 | 153,053 | Piedmont Office Realty Trust, Inc. | 2.9 | 3.2 | ||||||||||||
| 40,092 | 39,487 | Potlatch Corporation | 2.0 | 1.6 | ||||||||||||
| 30,894 | 25,352 | Preferred Apartment Communities, Inc. | 0.6 | 0.4 | ||||||||||||
| 526,083 | 549,455 | ProLogis | 33.4 | 29.0 | ||||||||||||
| 19,639 | 20,916 | PS Business Parks, Inc. | 2.6 | 2.4 | ||||||||||||
| 147,591 | 152,197 | Public Storage, Inc. | 31.6 | 34.0 | ||||||||||||
| 47,384 | 47,125 | QTS Realty Trust, Inc. | 2.5 | 2.3 | ||||||||||||
| 96,479 | 98,883 | Quality Care Properties | 1.5 | 1.5 | ||||||||||||
| 78,232 | 82,342 | Ramco-Gershenson Properties Trust | 1.0 | 1.4 | ||||||||||||
| 127,625 | 129,796 | Rayonier, Inc. | 3.7 | 3.4 | ||||||||||||
| 272,317 | 270,184 | Realty Income Corporation | 15.6 | 15.5 | ||||||||||||
| 149,168 | 109,616 | Regency Centers Corporation | 9.3 | 7.6 | ||||||||||||
| 107,617 | 113,887 | Retail Opportunity Investment | 2.0 | 2.4 | ||||||||||||
| 230,343 | 247,302 | Retail Properties of America | 3.0 | 3.8 | ||||||||||||
| 70,011 | 67,197 | Rexford Industrial Realty Inc. | 2.0 | 1.6 | ||||||||||||
| 169,181 | 131,026 | RLJ Lodging Trust | 3.7 | 3.2 | ||||||||||||
| 44,005 | 50,994 | Ryman Hospitality Properties | 2.7 | 3.2 | ||||||||||||
| 173,736 | 68,440 | Sabra Health Care REIT Inc. | 3.8 | 1.7 | ||||||||||||
| Shares | Issuer | Fair Value at | ||||||||||||||
| September 30, 2017 | December 31, 2016 | |||||||||||||||
| 2017 | 2016 | |||||||||||||||
| (Unaudited) | ||||||||||||||||
| 11,006 | — | Safety Income and Growth, Inc. | $ | 0.2 | $ | — | ||||||||||
| 11,082 | 14,267 | Saul Centers, Inc. | 0.7 | 0.9 | ||||||||||||
| 119,786 | — | SBA Communications Corporation | 17.3 | — | ||||||||||||
| 63,334 | 71,466 | Select Income Real Estate Investment Trust | 1.5 | 1.8 | ||||||||||||
| 235,142 | 248,749 | Senior Housing Properties Trust | 4.6 | 4.7 | ||||||||||||
| — | 36,820 | Silver Bay Realty Trust Corp. | — | 0.6 | ||||||||||||
| 310,266 | 329,687 | Simon Property Group, Inc. | 50.0 | 58.6 | ||||||||||||
| 96,162 | 106,453 | SL Green Realty Corp. | 9.7 | 11.4 | ||||||||||||
| 483,394 | 483,032 | Spirit Realty Capital Inc. | 4.1 | 5.2 | ||||||||||||
| 91,969 | 78,649 | Stag Industrial, Inc. | 2.5 | 1.9 | ||||||||||||
| 126,762 | — | Starwood Waypoint Homes | 4.6 | — | ||||||||||||
| 170,571 | 162,012 | STORE Capital Corporation | 4.2 | 4.0 | ||||||||||||
| 101,582 | 88,627 | Summit Hotel Properties, Inc. | 1.6 | 1.4 | ||||||||||||
| 75,320 | 68,173 | Sun Communities, Inc. | 6.5 | 5.2 | ||||||||||||
| 223,998 | 227,526 | Sunstone Hotel Investors, Inc. | 3.6 | 3.5 | ||||||||||||
| 93,587 | 100,862 | Tanger Factory Outlet Centers, Inc. | 2.3 | 3.6 | ||||||||||||
| 59,024 | 63,335 | Taubman Centers, Inc. | 2.9 | 4.7 | ||||||||||||
| 50,869 | 48,484 | Terreno Realty Corporation | 1.8 | 1.4 | ||||||||||||
| 136,929 | 150,999 | The Macerich Company | 7.5 | 10.7 | ||||||||||||
| 50,411 | 50,411 | Tier Inc. | 1.0 | 0.9 | ||||||||||||
| 265,245 | 280,233 | UDR, Inc. | 10.1 | 10.2 | ||||||||||||
| 30,879 | 27,329 | UMH Properties, Inc. | 0.5 | 0.4 | ||||||||||||
| 165,032 | — | UNITI Group, Inc. | 2.4 | — | ||||||||||||
| 13,049 | 14,676 | Universal Health Realty Income Trust | 1.0 | 1.0 | ||||||||||||
| 97,222 | 93,500 | Urban Edge Properties | 2.3 | 2.6 | ||||||||||||
| 31,959 | 31,959 | Urstadt Biddle Properties, Inc. | 0.7 | 0.8 | ||||||||||||
| 353,728 | 371,296 | Ventas, Inc. | 23.0 | 23.2 | ||||||||||||
| 975,362 | 1,012,629 | VEREIT, Inc. | 8.1 | 8.6 | ||||||||||||
| 172,179 | 177,780 | Vornado Realty Trust | 13.2 | 18.6 | ||||||||||||
| 185,508 | 193,859 | Washington Prime Group, Inc. | 1.5 | 2.0 | ||||||||||||
| 76,866 | 78,200 | Washington Real Estate Investment Trust | 2.5 | 2.6 | ||||||||||||
| 119,216 | 120,820 | Weingarten Realty Investors | 3.8 | 4.3 | ||||||||||||
| 365,663 | 380,425 | Welltower Inc. | 25.7 | 25.5 | ||||||||||||
| 744,863 | 783,938 | Weyerhaeuser Company | 25.3 | 23.6 | ||||||||||||
| 38,883 | 32,110 | Whitestone Real Estate Investment Trust B | 0.5 | 0.5 | ||||||||||||
| 105,577 | 95,234 | WP Carey Inc. | 7.1 | 5.6 | ||||||||||||
| 107,316 | 113,720 | Xenia Hotels & Resorts Inc. | 2.3 | 2.2 | ||||||||||||
| TOTAL REAL ESTATE-RELATED MARKETABLE SECURITIES (Cost $889.5 and $883.9) | $ | 1,121.0 | $ | 1,081.5 | ||||||||||||
| Principal | Issuer | Yield(4) | Maturity Date | Fair Value at | ||||||||||||||||
| September 30, 2017 | December 31, 2016 | |||||||||||||||||||
| 2017 | 2016 | |||||||||||||||||||
| (Unaudited) | ||||||||||||||||||||
| $ | — | $ | 22.0 | Fannie Mae Discount Notes | 0.416% | 2/1/2017 | $ | — | $ | 22.0 | ||||||||||
| — | 42.0 | Fannie Mae Discount Notes | 0.366% - 0.482% | 3/1/2017 | — | 42.0 | ||||||||||||||
| — | 10.0 | Fannie Mae Discount Notes | 0.427% | 3/3/2017 | — | 10.0 | ||||||||||||||
| — | 20.0 | Fannie Mae Discount Notes | 0.427% | 3/6/2017 | — | 20.0 | ||||||||||||||
| — | 20.0 | Fannie Mae Discount Notes | 0.406% | 3/13/2017 | — | 20.0 | ||||||||||||||
| — | 30.3 | Fannie Mae Discount Notes | 0.406% | 3/27/2017 | — | 30.3 | ||||||||||||||
| — | 25.0 | Fannie Mae Discount Notes | 0.406% | 3/28/2017 | — | 25.0 | ||||||||||||||
| — | 30.0 | Fannie Mae Discount Notes | 0.518% | 4/18/2017 | — | 29.9 | ||||||||||||||
| — | 24.0 | Fannie Mae Discount Notes | 0.483% - 0.579% | 4/19/2017 | — | 24.0 | ||||||||||||||
| — | 31.5 | Fannie Mae Discount Notes | 0.447% - 0.539% | 5/1/2017 | — | 31.5 | ||||||||||||||
| — | 49.9 | Fannie Mae Discount Notes | 0.518% | 5/2/2017 | — | 49.9 | ||||||||||||||
| — | 39.9 | Fannie Mae Discount Notes | 0.539% | 5/5/2017 | — | 39.9 | ||||||||||||||
| 34.9 | — | Fannie Mae Discount Notes | 0.987% | 10/2/2017 | 34.9 | — | ||||||||||||||
| 47.1 | — | Fannie Mae Discount Notes | 1.017% - 1.038% | 10/11/2017 | 47.1 | — | ||||||||||||||
| 35.1 | — | Fannie Mae Discount Notes | 1.027% | 10/12/2017 | 35.1 | — | ||||||||||||||
| 33.6 | — | Fannie Mae Discount Notes | 1.017% | 10/13/2017 | 33.6 | — | ||||||||||||||
| 37.1 | — | Fannie Mae Discount Notes | 1.017% - 1.037% | 10/19/2017 | 37.1 | — | ||||||||||||||
| 15.1 | — | Fannie Mae Discount Notes | 1.038% | 10/23/2017 | 15.1 | — | ||||||||||||||
| 20.0 | — | Fannie Mae Discount Notes | 1.038% | 10/25/2017 | 20.0 | — | ||||||||||||||
| 40.0 | — | Fannie Mae Discount Notes | 1.038% | 10/27/2017 | 40.0 | — | ||||||||||||||
| 35.0 | — | Fannie Mae Discount Notes | 0.996% | 10/30/2017 | 35.0 | — | ||||||||||||||
| 75.1 | — | Fannie Mae Discount Notes | 0.996% - 1.006% | 11/1/2017 | 75.0 | — | ||||||||||||||
| 10.0 | — | Fannie Mae Discount Notes | 0.985% | 11/3/2017 | 10.0 | — | ||||||||||||||
| 24.6 | — | Fannie Mae Discount Notes | 1.048% | 11/6/2017 | 24.5 | — | ||||||||||||||
| 5.0 | — | Fannie Mae Discount Notes | 1.048% | 11/9/2017 | 5.0 | — | ||||||||||||||
| 75.0 | — | Fannie Mae Discount Notes | 1.058% | 11/20/2017 | 74.9 | — | ||||||||||||||
| 75.0 | — | Fannie Mae Discount Notes | 1.058% | 11/21/2017 | 74.9 | — | ||||||||||||||
| 30.0 | — | Fannie Mae Discount Notes | 1.058% | 11/22/2017 | 30.0 | — | ||||||||||||||
| 20.0 | — | Fannie Mae Discount Notes | 1.007% | 11/24/2017 | 20.0 | — | ||||||||||||||
| 25.0 | — | Fannie Mae Discount Notes | 1.042% | 12/20/2017 | 24.9 | — | ||||||||||||||
| 40.0 | — | Fannie Mae Discount Notes | 1.063% | 1/11/2018 | 40.0 | — | ||||||||||||||
| 30.0 | — | Fannie Mae Discount Notes | 1.038% | 1/22/2018 | 29.9 | — | ||||||||||||||
| 46.2 | — | Fannie Mae Discount Notes | 1.038% | 1/23/2018 | 46.0 | — | ||||||||||||||
| 35.1 | — | Fannie Mae Discount Notes | 1.038% | 1/24/2018 | 35.0 | — | ||||||||||||||
| — | 19.9 | Farmer Mac Discount Notes | 0.682% | 6/1/2017 | — | 19.9 | ||||||||||||||
| — | 15.5 | Federal Farm Credit Bank Discount Notes | 0.376% - 0.381% | 2/22/2017 | — | 15.5 | ||||||||||||||
| — | 34.7 | Federal Home Loan Bank Discount Notes | 0.304% - 0.355% | 1/3/2017 | — | 34.7 | ||||||||||||||
| — | 40.0 | Federal Home Loan Bank Discount Notes | 0.345% | 1/4/2017 | — | 40.0 | ||||||||||||||
| — | 29.2 | Federal Home Loan Bank Discount Notes | 0.355% - 0.447% | 1/6/2017 | — | 29.2 | ||||||||||||||
| — | 7.1 | Federal Home Loan Bank Discount Notes | 0.299% - 0.345% | 1/9/2017 | — | 7.1 | ||||||||||||||
| — | 25.0 | Federal Home Loan Bank Discount Notes | 0.325% | 1/10/2017 | — | 25.0 | ||||||||||||||
| — | 50.0 | Federal Home Loan Bank Discount Notes | 0.304% - 0.396% | 1/11/2017 | — | 50.0 | ||||||||||||||
| — | 33.0 | Federal Home Loan Bank Discount Notes | 0.365% - 0.396% | 1/12/2017 | — | 33.0 | ||||||||||||||
| — | 50.0 | Federal Home Loan Bank Discount Notes | 0.386% | 1/13/2017 | — | 50.0 | ||||||||||||||
| — | 36.0 | Federal Home Loan Bank Discount Notes | 0.345% | 1/17/2017 | — | 36.0 | ||||||||||||||
| — | 42.1 | Federal Home Loan Bank Discount Notes | 0.294% - 0.365% | 1/18/2017 | — | 42.1 | ||||||||||||||
| Principal | Issuer | Yield(4) | Maturity Date | Fair Value at | ||||||||||||||||
| September 30, 2017 | December 31, 2016 | |||||||||||||||||||
| 2017 | 2016 | |||||||||||||||||||
| (Unaudited) | ||||||||||||||||||||
| $ | — | $ | 20.0 | Federal Home Loan Bank Discount Notes | 0.284% | 1/20/2017 | $ | — | $ | 20.0 | ||||||||||
| — | 50.0 | Federal Home Loan Bank Discount Notes | 0.335% | 1/23/2017 | — | 50.0 | ||||||||||||||
| — | 47.0 | Federal Home Loan Bank Discount Notes | 0.345% | 1/24/2017 | — | 47.0 | ||||||||||||||
| — | 34.8 | Federal Home Loan Bank Discount Notes | 0.304% - 0.360% | 1/25/2017 | — | 34.8 | ||||||||||||||
| — | 45.0 | Federal Home Loan Bank Discount Notes | 0.294% - 0.406% | 1/27/2017 | — | 45.0 | ||||||||||||||
| — | 25.0 | Federal Home Loan Bank Discount Notes | 0.416% | 1/30/2017 | — | 25.0 | ||||||||||||||
| — | 34.7 | Federal Home Loan Bank Discount Notes | 0.467% - 0.497% | 2/1/2017 | — | 34.7 | ||||||||||||||
| — | 42.0 | Federal Home Loan Bank Discount Notes | 0.406% | 2/3/2017 | — | 42.0 | ||||||||||||||
| — | 15.0 | Federal Home Loan Bank Discount Notes | 0.416% | 2/7/2017 | — | 15.0 | ||||||||||||||
| — | 10.2 | Federal Home Loan Bank Discount Notes | 0.376% | 2/10/2017 | — | 10.2 | ||||||||||||||
| — | 50.0 | Federal Home Loan Bank Discount Notes | 0.386% - 0.487% | 2/17/2017 | — | 50.0 | ||||||||||||||
| — | 30.0 | Federal Home Loan Bank Discount Notes | 0.365% | 2/21/2017 | — | 30.0 | ||||||||||||||
| — | 30.0 | Federal Home Loan Bank Discount Notes | 0.437% | 2/22/2017 | — | 30.0 | ||||||||||||||
| — | 50.0 | Federal Home Loan Bank Discount Notes | 0.396% | 2/24/2017 | — | 50.0 | ||||||||||||||
| — | 20.0 | Federal Home Loan Bank Discount Notes | 0.533% | 2/27/2017 | — | 20.0 | ||||||||||||||
| — | 10.1 | Federal Home Loan Bank Discount Notes | 0.518% | 3/3/2017 | — | 10.1 | ||||||||||||||
| — | 15.0 | Federal Home Loan Bank Discount Notes | 0.523% | 3/6/2017 | — | 15.0 | ||||||||||||||
| — | 30.0 | Federal Home Loan Bank Discount Notes | 0.538% | 3/8/2017 | — | 30.0 | ||||||||||||||
| — | 45.8 | Federal Home Loan Bank Discount Notes | 0.447% - 0.574% | 3/10/2017 | — | 45.8 | ||||||||||||||
| — | 20.0 | Federal Home Loan Bank Discount Notes | 0.543% | 3/14/2017 | — | 20.0 | ||||||||||||||
| — | 40.5 | Federal Home Loan Bank Discount Notes | 0.528% - 0.579% | 3/17/2017 | — | 40.5 | ||||||||||||||
| — | 49.9 | Federal Home Loan Bank Discount Notes | 0.538% | 3/20/2017 | — | 49.9 | ||||||||||||||
| — | 36.1 | Federal Home Loan Bank Discount Notes | 0.533% | 3/22/2017 | — | 36.1 | ||||||||||||||
| — | 28.0 | Federal Home Loan Bank Discount Notes | 0.427% - 0.518% | 3/23/2017 | — | 28.0 | ||||||||||||||
| — | 40.0 | Federal Home Loan Bank Discount Notes | 0.528% | 3/24/2017 | — | 40.0 | ||||||||||||||
| — | 25.0 | Federal Home Loan Bank Discount Notes | 0.548% | 3/28/2017 | — | 25.0 | ||||||||||||||
| — | 31.0 | Federal Home Loan Bank Discount Notes | 0.558% | 3/29/2017 | — | 31.0 | ||||||||||||||
| — | 6.4 | Federal Home Loan Bank Discount Notes | 0.477% | 3/31/2017 | — | 6.4 | ||||||||||||||
| — | 49.9 | Federal Home Loan Bank Discount Notes | 0.559% | 4/17/2017 | — | 49.9 | ||||||||||||||
| — | 26.0 | Federal Home Loan Bank Discount Notes | 0.548% - 0.605% | 4/19/2017 | — | 26.0 | ||||||||||||||
| — | 20.1 | Federal Home Loan Bank Discount Notes | 0.488% | 4/28/2017 | — | 20.1 | ||||||||||||||
| — | 25.0 | Federal Home Loan Bank Discount Notes | 0.538% - 0.600% | 5/5/2017 | — | 25.0 | ||||||||||||||
| — | 37.2 | Federal Home Loan Bank Discount Notes | 0.558% - 0.641% | 5/12/2017 | — | 37.2 | ||||||||||||||
| 27.1 | — | Federal Home Loan Bank Discount Notes | 1.015% | 10/5/2017 | 27.1 | — | ||||||||||||||
| 30.8 | — | Federal Home Loan Bank Discount Notes | 0.968% | 10/6/2017 | 30.8 | — | ||||||||||||||
| 40.1 | — | Federal Home Loan Bank Discount Notes | 1.020% - 1.053% | 10/10/2017 | 40.1 | — | ||||||||||||||
| 4.0 | — | Federal Home Loan Bank Discount Notes | 1.049% | 10/13/2017 | 4.0 | — | ||||||||||||||
| 88.3 | — | Federal Home Loan Bank Discount Notes | 1.020% - 1.025% | 10/16/2017 | 88.3 | — | ||||||||||||||
| 44.2 | — | Federal Home Loan Bank Discount Notes | 1.063% | 10/18/2017 | 44.1 | — | ||||||||||||||
| 39.6 | — | Federal Home Loan Bank Discount Notes | 1.008% - 1.039% | 10/20/2017 | 39.6 | — | ||||||||||||||
| 30.1 | — | Federal Home Loan Bank Discount Notes | 1.031% - 1.049% | 10/23/2017 | 30.0 | — | ||||||||||||||
| 42.2 | — | Federal Home Loan Bank Discount Notes | 1.013% | 10/24/2017 | 42.1 | — | ||||||||||||||
| 23.2 | — | Federal Home Loan Bank Discount Notes | 1.036% - 1.048% | 10/25/2017 | 23.2 | — | ||||||||||||||
| 10.2 | — | Federal Home Loan Bank Discount Notes | 1.041% | 10/27/2017 | 10.1 | — | ||||||||||||||
| 37.1 | — | Federal Home Loan Bank Discount Notes | 1.048% | 10/30/2017 | 37.1 | — | ||||||||||||||
| 34.5 | — | Federal Home Loan Bank Discount Notes | 1.019% - 1.041% | 11/1/2017 | 34.4 | — | ||||||||||||||
| 43.2 | — | Federal Home Loan Bank Discount Notes | 1.048% | 11/2/2017 | 43.1 | — | ||||||||||||||
| 50.0 | — | Federal Home Loan Bank Discount Notes | 1.024% - 1.031% | 11/3/2017 | 50.0 | — | ||||||||||||||
| Principal | Issuer | Yield(4) | Maturity Date | Fair Value at | ||||||||||||||||
| September 30, 2017 | December 31, 2016 | |||||||||||||||||||
| 2017 | 2016 | |||||||||||||||||||
| (Unaudited) | ||||||||||||||||||||
| $ | 58.2 | $ | — | Federal Home Loan Bank Discount Notes | 1.031% - 1.048% | 11/7/2017 | $ | 58.1 | $ | — | ||||||||||
| 50.0 | — | Federal Home Loan Bank Discount Notes | 1.031% - 1.069% | 11/8/2017 | 49.9 | — | ||||||||||||||
| 61.0 | — | Federal Home Loan Bank Discount Notes | 1.030% - 1.068% | 11/9/2017 | 60.9 | — | ||||||||||||||
| 33.6 | — | Federal Home Loan Bank Discount Notes | 1.079% | 11/10/2017 | 33.6 | — | ||||||||||||||
| 42.3 | — | Federal Home Loan Bank Discount Notes | 1.032% - 1.079% | 11/13/2017 | 42.3 | — | ||||||||||||||
| 51.9 | — | Federal Home Loan Bank Discount Notes | 1.068% - 1.079% | 11/14/2017 | 51.9 | — | ||||||||||||||
| 43.4 | — | Federal Home Loan Bank Discount Notes | 1.068% - 1.109% | 11/15/2017 | 43.4 | — | ||||||||||||||
| 40.0 | — | Federal Home Loan Bank Discount Notes | 1.068% | 11/16/2017 | 40.0 | — | ||||||||||||||
| 66.4 | — | Federal Home Loan Bank Discount Notes | 1.068% - 1.069% | 11/17/2017 | 66.3 | — | ||||||||||||||
| 15.2 | — | Federal Home Loan Bank Discount Notes | 1.069% | 11/27/2017 | 15.2 | — | ||||||||||||||
| 40.0 | — | Federal Home Loan Bank Discount Notes | 1.110% | 11/28/2017 | 39.9 | — | ||||||||||||||
| 30.0 | — | Federal Home Loan Bank Discount Notes | 1.068% | 11/29/2017 | 30.0 | — | ||||||||||||||
| 36.9 | — | Federal Home Loan Bank Discount Notes | 1.047% - 1.069% | 12/1/2017 | 36.9 | — | ||||||||||||||
| 40.0 | — | Federal Home Loan Bank Discount Notes | 1.110% | 12/5/2017 | 39.9 | — | ||||||||||||||
| 20.3 | — | Federal Home Loan Bank Discount Notes | 1.110% | 12/6/2017 | 20.2 | — | ||||||||||||||
| 40.0 | — | Federal Home Loan Bank Discount Notes | 1.100% | 12/8/2017 | 39.9 | — | ||||||||||||||
| 20.0 | — | Federal Home Loan Bank Discount Notes | 1.068% | 12/11/2017 | 20.0 | — | ||||||||||||||
| 40.0 | — | Federal Home Loan Bank Discount Notes | 1.079% | 12/12/2017 | 39.9 | — | ||||||||||||||
| 44.3 | — | Federal Home Loan Bank Discount Notes | 1.067% - 1.074% | 12/15/2017 | 44.2 | — | ||||||||||||||
| 15.2 | — | Federal Home Loan Bank Discount Notes | 1.079% | 12/18/2017 | 15.1 | — | ||||||||||||||
| 25.1 | — | Federal Home Loan Bank Discount Notes | 1.079% | 12/19/2017 | 25.0 | — | ||||||||||||||
| 28.5 | — | Federal Home Loan Bank Discount Notes | 1.058% - 1.074% | 12/20/2017 | 28.4 | — | ||||||||||||||
| 30.0 | — | Federal Home Loan Bank Discount Notes | 1.074% | 12/22/2017 | 29.9 | — | ||||||||||||||
| 30.0 | — | Federal Home Loan Bank Discount Notes | 1.069% | 12/26/2017 | 29.9 | — | ||||||||||||||
| 30.0 | — | Federal Home Loan Bank Discount Notes | 1.069% | 12/27/2017 | 29.9 | — | ||||||||||||||
| 25.0 | — | Federal Home Loan Bank Discount Notes | 1.069% | 12/29/2017 | 24.9 | — | ||||||||||||||
| 20.2 | — | Federal Home Loan Bank Discount Notes | 1.069% | 1/2/2018 | 20.1 | — | ||||||||||||||
| 40.0 | — | Federal Home Loan Bank Discount Notes | 1.079% | 1/3/2018 | 39.9 | — | ||||||||||||||
| 40.0 | — | Federal Home Loan Bank Discount Notes | 1.068% | 1/5/2018 | 39.9 | — | ||||||||||||||
| 40.0 | — | Federal Home Loan Bank Discount Notes | 1.068% | 1/8/2018 | 39.9 | — | ||||||||||||||
| 33.0 | — | Federal Home Loan Bank Discount Notes | 1.058% | 1/9/2018 | 32.9 | — | ||||||||||||||
| 20.0 | — | Federal Home Loan Bank Discount Notes | 1.068% | 1/10/2018 | 19.9 | — | ||||||||||||||
| 10.0 | — | Federal Home Loan Bank Discount Notes | 1.089% | 1/12/2018 | 10.0 | — | ||||||||||||||
| 38.1 | — | Federal Home Loan Bank Discount Notes | 1.068% | 1/16/2018 | 38.0 | — | ||||||||||||||
| 30.0 | — | Federal Home Loan Bank Discount Notes | 1.094% | 1/17/2018 | 29.9 | — | ||||||||||||||
| 30.2 | — | Federal Home Loan Bank Discount Notes | 1.063% | 1/19/2018 | 30.1 | — | ||||||||||||||
| 38.0 | — | Federal Home Loan Bank Discount Notes | 1.063% | 1/25/2018 | 37.8 | — | ||||||||||||||
| 36.1 | — | Federal Home Loan Bank Discount Notes | 1.063% | 1/26/2018 | 36.0 | — | ||||||||||||||
| 19.2 | — | Federal Home Loan Bank Discount Notes | 1.069% | 1/29/2018 | 19.1 | — | ||||||||||||||
| 37.1 | — | Federal Home Loan Bank Discount Notes | 1.069% | 2/9/2018 | 37.0 | — | ||||||||||||||
| 2.2 | — | Federal Home Loan Bank Discount Notes | 1.161% | 3/2/2018 | 2.1 | — | ||||||||||||||
| — | 16.1 | Freddie Mac Discount Notes | 0.345% | 1/9/2017 | — | 16.1 | ||||||||||||||
| — | 25.0 | Freddie Mac Discount Notes | 0.335% | 1/10/2017 | — | 25.0 | ||||||||||||||
| — | 30.0 | Freddie Mac Discount Notes | 0.391% | 1/20/2017 | — | 30.0 | ||||||||||||||
| — | 13.1 | Freddie Mac Discount Notes | 0.426% | 1/30/2017 | — | 13.1 | ||||||||||||||
| — | 40.0 | Freddie Mac Discount Notes | 0.447% | 2/6/2017 | — | 40.0 | ||||||||||||||
| — | 36.9 | Freddie Mac Discount Notes | 0.436% - 0.457% | 2/7/2017 | — | 36.9 | ||||||||||||||
| — | 44.2 | Freddie Mac Discount Notes | 0.360% | 2/8/2017 | — | 44.2 | ||||||||||||||
| Principal | Issuer | Yield(4) | Maturity Date | Fair Value at | ||||||||||||||||
| September 30, 2017 | December 31, 2016 | |||||||||||||||||||
| 2017 | 2016 | |||||||||||||||||||
| (Unaudited) | ||||||||||||||||||||
| $ | — | $ | 25.0 | Freddie Mac Discount Notes | 0.360% | 2/10/2017 | $ | — | $ | 25.0 | ||||||||||
| — | 40.0 | Freddie Mac Discount Notes | 0.365% | 2/13/2017 | — | 40.0 | ||||||||||||||
| — | 30.0 | Freddie Mac Discount Notes | 0.376% | 2/14/2017 | — | 30.0 | ||||||||||||||
| — | 20.0 | Freddie Mac Discount Notes | 0.467% | 2/21/2017 | — | 20.0 | ||||||||||||||
| — | 27.0 | Freddie Mac Discount Notes | 0.386% | 2/27/2017 | — | 27.0 | ||||||||||||||
| — | 15.0 | Freddie Mac Discount Notes | 0.401% | 3/3/2017 | — | 15.0 | ||||||||||||||
| — | 35.2 | Freddie Mac Discount Notes | 0.406% | 3/7/2017 | — | 35.2 | ||||||||||||||
| — | 14.0 | Freddie Mac Discount Notes | 0.411% | 3/14/2017 | — | 14.0 | ||||||||||||||
| — | 50.0 | Freddie Mac Discount Notes | 0.427% | 3/21/2017 | — | 49.9 | ||||||||||||||
| — | 18.0 | Freddie Mac Discount Notes | 0.600% | 4/21/2017 | — | 18.0 | ||||||||||||||
| — | 39.9 | Freddie Mac Discount Notes | 0.457% | 5/3/2017 | — | 39.9 | ||||||||||||||
| — | 22.9 | Freddie Mac Discount Notes | 0.483% | 5/4/2017 | — | 22.9 | ||||||||||||||
| 45.2 | — | Freddie Mac Discount Notes | 0.997% | 10/3/2017 | 45.2 | — | ||||||||||||||
| 42.2 | — | Freddie Mac Discount Notes | 0.997% | 10/4/2017 | 42.2 | — | ||||||||||||||
| 40.0 | — | Freddie Mac Discount Notes | 1.013% | 10/16/2017 | 40.0 | — | ||||||||||||||
| 37.1 | — | Freddie Mac Discount Notes | 1.013% | 10/17/2017 | 37.1 | — | ||||||||||||||
| 10.5 | — | Freddie Mac Discount Notes | 1.005% | 10/20/2017 | 10.5 | — | ||||||||||||||
| 42.5 | — | Freddie Mac Discount Notes | 1.001% - 1.028% | 10/26/2017 | 42.5 | — | ||||||||||||||
| 15.0 | — | Freddie Mac Discount Notes | 1.079% | 11/6/2017 | 15.0 | — | ||||||||||||||
| 15.0 | — | Freddie Mac Discount Notes | 1.006% | 11/10/2017 | 15.0 | — | ||||||||||||||
| 30.0 | — | Freddie Mac Discount Notes | 1.027% | 11/27/2017 | 30.0 | — | ||||||||||||||
| 12.5 | — | Freddie Mac Discount Notes | 1.036% | 12/1/2017 | 12.5 | — | ||||||||||||||
| 51.1 | — | Freddie Mac Discount Notes | 1.027% - 1.074% | 12/4/2017 | 51.0 | — | ||||||||||||||
| 15.0 | — | Freddie Mac Discount Notes | 1.043% | 12/6/2017 | 15.0 | — | ||||||||||||||
| 20.4 | — | Freddie Mac Discount Notes | 1.064% | 12/11/2017 | 20.4 | — | ||||||||||||||
| 40.0 | — | Freddie Mac Discount Notes | 1.064% | 12/13/2017 | 39.9 | — | ||||||||||||||
| 40.0 | — | Freddie Mac Discount Notes | 1.063% | 12/14/2017 | 39.9 | — | ||||||||||||||
| 25.0 | — | Freddie Mac Discount Notes | 1.101% | 2/2/2018 | 24.9 | — | ||||||||||||||
| 30.0 | — | Freddie Mac Discount Notes | 1.101% | 2/5/2018 | 29.9 | — | ||||||||||||||
| 25.0 | — | Freddie Mac Discount Notes | 1.090% | 2/6/2018 | 24.9 | — | ||||||||||||||
| 20.1 | — | Freddie Mac Discount Notes | 1.100% | 2/7/2018 | 20.0 | — | ||||||||||||||
TOTAL GOVERNMENT AGENCY NOTES (Cost $3,276.0 and $2,309.0) | $ | 3,276.1 | $ | 2,308.9 | ||||||||||||||||
| Principal | Issuer | Yield(4) | Maturity Date | Fair Value at | |||||||||||||||||
| September 30, 2017 | December 31, 2016 | ||||||||||||||||||||
| 2017 | 2016 | ||||||||||||||||||||
| (Unaudited) | |||||||||||||||||||||
| $ | — | $ | 35.9 | United States Treasury Bills | 0.345% - 0.369% | 1/5/2017 | $ | — | $ | 35.9 | |||||||||||
| — | 47.9 | United States Treasury Bills | 0.423% - 0.428% | 1/19/2017 | — | 48.0 | |||||||||||||||
| — | 36.1 | United States Treasury Bills | 0.371% - 0.401% | 1/26/2017 | — | 36.1 | |||||||||||||||
| — | 60.1 | United States Treasury Bills | 0.363% - 0.423% | 2/2/2017 | ��� | 60.1 | |||||||||||||||
| — | 75.0 | United States Treasury Bills | 0.315% - 0.426% | 2/9/2017 | — | 75.0 | |||||||||||||||
| — | 48.0 | United States Treasury Bills | 0.325% - 0.437% | 2/16/2017 | — | 48.0 | |||||||||||||||
| — | 48.0 | United States Treasury Bills | 0.448% - 0.473% | 2/23/2017 | — | 48.0 | |||||||||||||||
| — | 36.0 | United States Treasury Bills | 0.368% - 0.477% | 3/2/2017 | — | 36.0 | |||||||||||||||
| — | 48.7 | United States Treasury Bills | 0.386% - 0.518% | 3/9/2017 | — | 48.7 | |||||||||||||||
| — | 59.9 | United States Treasury Bills | 0.406% - 0.481% | 3/16/2017 | — | 60.0 | |||||||||||||||
| — | 129.0 | United States Treasury Bills | 0.380% - 0.533% | 3/23/2017 | — | 129.0 | |||||||||||||||
| — | 25.9 | United States Treasury Bills | 0.396% - 0.518% | 3/30/2017 | — | 25.9 | |||||||||||||||
| — | 58.9 | United States Treasury Bills | 0.411% - 0.509% | 4/6/2017 | — | 58.9 | |||||||||||||||
| — | 130.8 | United States Treasury Bills | 0.518% - 0.529% | 4/13/2017 | — | 130.8 | |||||||||||||||
| — | 49.9 | United States Treasury Bills | 0.514% - 0.559% | 4/20/2017 | — | 49.9 | |||||||||||||||
| — | 48.2 | United States Treasury Bills | 0.554% - 0.781% | 4/27/2017 | — | 48.2 | |||||||||||||||
| — | 49.9 | United States Treasury Bills | 0.514% | 5/4/2017 | — | 49.9 | |||||||||||||||
| — | 42.0 | United States Treasury Bills | 0.601% - 0.623% | 5/11/2017 | — | 42.0 | |||||||||||||||
| — | 30.1 | United States Treasury Bills | 0.584% - 0.620% | 5/18/2017 | — | 30.1 | |||||||||||||||
| — | 32.0 | United States Treasury Bills | 0.587% | 6/8/2017 | — | 32.0 | |||||||||||||||
| — | 74.8 | United States Treasury Bills | 0.541% - 0.654% | 7/20/2017 | — | 74.7 | |||||||||||||||
| — | 86.7 | United States Treasury Bills | 0.574% - 0.591% | 8/17/2017 | — | 86.6 | |||||||||||||||
| — | 34.8 | United States Treasury Bills | 0.696% - 0.934% | 9/14/2017 | — | 34.8 | |||||||||||||||
| 30.0 | — | United States Treasury Bills | 0.943% | 10/5/2017 | 30.0 | — | |||||||||||||||
| 0.8 | — | United States Treasury Bills | 0.956% | 10/12/2017 | 0.8 | — | |||||||||||||||
| 20.0 | — | United States Treasury Bills | 1.017% | 11/24/2017 | 20.0 | — | |||||||||||||||
| 50.0 | — | United States Treasury Bills | 0.998% | 11/30/2017 | 49.9 | — | |||||||||||||||
| 49.0 | — | United States Treasury Bills | 0.768% | 12/7/2017 | 48.9 | — | |||||||||||||||
| 50.0 | — | United States Treasury Bills | 1.090% | 12/21/2017 | 49.9 | — | |||||||||||||||
| 97.0 | — | United States Treasury Bills | 1.099% - 1.100% | 12/28/2017 | 96.7 | — | |||||||||||||||
| 50.0 | — | United States Treasury Bills | 1.084% | 1/4/2018 | 49.9 | — | |||||||||||||||
| 40.0 | — | United States Treasury Bills | 1.114% | 1/18/2018 | 39.9 | — | |||||||||||||||
| 71.0 | — | United States Treasury Bills | 1.132% | 1/25/2018 | 70.8 | — | |||||||||||||||
| 36.0 | — | United States Treasury Bills | 1.106% | 2/1/2018 | 35.9 | — | |||||||||||||||
| 93.0 | — | United States Treasury Bills | 1.075% - 1.077% | 2/8/2018 | 92.6 | — | |||||||||||||||
| 98.0 | — | United States Treasury Bills | 1.106% - 1.122% | 2/22/2018 | 97.6 | — | |||||||||||||||
| 81.0 | — | United States Treasury Bills | 1.060% - 1.117% | 3/1/2018 | 80.6 | — | |||||||||||||||
| — | 69.9 | United States Treasury Notes | 0.431% - 0.451% | 1/31/2017 | — | 69.9 | |||||||||||||||
| — | 46.9 | United States Treasury Notes | 0.441% - 0.471% | 2/15/2017 | — | 47.0 | |||||||||||||||
| — | 49.7 | United States Treasury Notes | 0.502% | 2/28/2017 | — | 49.7 | |||||||||||||||
| — | 50.0 | United States Treasury Notes | 0.542% | 3/15/2017 | — | 50.0 | |||||||||||||||
| — | 50.0 | United States Treasury Notes | 0.515% | 3/31/2017 | — | 50.0 | |||||||||||||||
| — | 69.6 | United States Treasury Notes | 0.550% - 0.621% | 5/31/2017 | — | 69.6 | |||||||||||||||
| — | 40.1 | United States Treasury Notes | 0.580% | 6/15/2017 | — | 40.1 | |||||||||||||||
| — | 50.0 | United States Treasury Notes | 0.586% | 6/30/2017 | — | 50.0 | |||||||||||||||
| — | 30.0 | United States Treasury Notes | 0.668% - 0.710% | 7/31/2017 | — | 30.0 | |||||||||||||||
| 50.0 | — | United States Treasury Notes | 0.768% | 10/31/2017 | 50.0 | — | |||||||||||||||
| Principal | Issuer | Yield(4) | Maturity Date | Fair Value at | |||||||||||||||||
| September 30, 2017 | December 31, 2016 | ||||||||||||||||||||
| 2017 | 2016 | ||||||||||||||||||||
| (Unaudited) | |||||||||||||||||||||
| $ | 21.1 | $ | — | United States Treasury Notes | 0.812% - 0.935% | 11/30/2017 | $ | 21.0 | $ | — | |||||||||||
| 5.0 | — | United States Treasury Notes | 0.997% | 12/15/2017 | 5.0 | — | |||||||||||||||
| 50.0 | — | United States Treasury Notes | 1.148% - 1.180% | 1/31/2018 | 49.9 | — | |||||||||||||||
| 40.0 | — | United States Treasury Notes | 1.175% - 1.184% | 2/15/2018 | 40.0 | — | |||||||||||||||
| 48.0 | — | United States Treasury Notes | 1.200% | 2/28/2018 | 47.9 | — | |||||||||||||||
| 40.0 | — | United States Treasury Notes | 1.179% | 3/15/2018 | 40.0 | — | |||||||||||||||
TOTAL UNITED STATES TREASURY SECURITIES (Cost $1,017.3 and $1,745.0) | $ | 1,017.3 | $ | 1,744.9 | |||||||||||||||||
TOTAL OTHER MARKETABLE SECURITIES (Cost $4,293.3 and $4,054.0) | $ | 4,293.4 | $ | 4,053.8 | |||||||||||||||||
TOTAL MARKETABLE SECURITIES (Cost $5,182.8 and $4,937.9) | $ | 5,414.4 | $ | 5,135.3 | |||||||||||||||||
| LOANS RECEIVABLE—1.1% and 1.1% | Fair Value at | ||||||||||||||||||||
| Borrower | Interest Rate(7) | Maturity Date | September 30, 2017 | December 31, 2016 | |||||||||||||||||
| (Unaudited) | |||||||||||||||||||||
DJM Capital Partners(8) | 4.200% | 7/1/2018 | $ | 34.0 | $ | 32.3 | |||||||||||||||
| Simply Self Storage Portfolio | 8.250% | 9/6/2021 | 37.6 | 37.6 | |||||||||||||||||
| State Street Financial Center Junior Mezz | 6.500% | 11/10/2021 | 125.2 | 125.2 | |||||||||||||||||
| Charles River Plaza North | 6.080% | 4/6/2029 | 102.0 | 100.6 | |||||||||||||||||
TOTAL LOANS RECEIVABLE (Cost $296.5 and $294.8) | $ | 298.8 | $ | 295.7 | |||||||||||||||||
TOTAL INVESTMENTS (Cost $22,964.2 and $22,581.2) | $ | 27,183.5 | $ | 26,643.7 | |||||||||||||||||
ITEM 2. MANAGEMENT’S DISCUSSION AND ANALYSIS OF FINANCIAL CONDITION AND RESULTS OF OPERATIONS
The following discussion and analysis of the Account’s financial condition and results of operations should be read together with the consolidated financial statementsConsolidated Financial Statements and notes contained in this report and with consideration to the sub-section entitled “Forward-Looking Statements,” which begins below, and the section entitled “Item 1A. Risk Factors,” of the Account’sAccount's Annual Report on Form 10-K for the year ended December 31, 20162022, filed with the Securities and Exchange Commission on March 9, 2023 (the “Form 10-K”"Form 10-K") entitled “Item 1A. Risk Factors.”, as such risk factors may be updated in Item 1A of this Form 10-Q or in subsequent reports. The past performance of the Account is not indicative of future results.
Forward-looking Statements
Some statements in this Form 10-Q which are not historical facts may be “forward-looking statements” within the meaning of Section 27A of the Securities Act of 1933, Section 21E of the Securities Exchange Act of 1934 and the Private Securities Litigation Reform Act of 1995. Forward-looking statements include statements about management’s expectations, beliefs, intentions or strategies for the future, include the assumptions and beliefs underlying these forward-looking statements, and are based on current expectations, estimates and projections about the real estate industry, domestic and global economic conditions, including conditions in the credit and capital markets, employment rates, the sectors and markets in which the Account invests and operates, and the transactions described in this Form 10-Q. While management believes the assumptions underlying any of its forward-looking statements and information to be reasonable, such information may be subject to uncertainties and may involve certain risks which may be difficult to predict and are beyond management’s control. These risks and uncertainties could cause actual results to differ materially from those contained in any forward-looking statement. These risks and uncertainties include, but are not limited to, the risks associated with the following:
•Acquiring, owning and Owning Real Estate: The risks associated with acquiring and owningselling real property and real estate investments, including risks related to general economic and real estate market conditions, the availability of, and economic cost associated with, financing the Account’s properties, the risk that the Account’s properties become too concentrated (whether by geography, sector or by tenant mix), competition for acquiring real estate properties, leasing risk (including tenant defaults) and the risk of uninsured losses at properties (including due to terrorism, natural disasters, and acts of violence);
and (iii) high levels of cash and liquid non-real estate-related investments in the Account during times of appreciating real estate values can impair the Account’s overall return;
•Joint Venture Investments: The risks associated with joint ventures organized as limited partnerships or limited liability companies, as applicable,and real estate funds, including the risk that a co-venturer may have interests or goals inconsistent with those of the Account, that a co-venturer may have financial difficulties, and the risk that the Account may have limited rights with respect to operation of the property and transfer of the Account’s interest;
joint venture or that a co-venturer or fund manager may have financial difficulties;•Certain catastrophic losses that may be uninsurable, as well as risks related to climate-related changes and hazards, which could adversely impact the Account’s investment returns;
•ESG criteria used to assess economic risk or financial opportunity projections in the evaluation of commercial real estate properties), includinginvestments may not materialize in the way we have anticipated, resulting in the Account subsequently underperforming relative to other investment vehicles that did not utilize such ESG criteria in selecting and managing portfolio properties;
30
•Countries with emerging market, foreign commercial real properties, foreign real estate loans, foreign debt investments and foreign securities investments that may experience unique risks such as changes in currency exchange rates, imposition of market controls or currency exchange controls, seizure, expropriation or nationalization of assets, political, risk, the risk associated with currency fluctuations (whether hedgedsocial or not),diplomatic events or unrest, regulatory and taxation risks and risks of enforcing judgments;
•Investments in REITs, including changes in the value of the Account and providerunderlying properties or by the quality of any credit extended, as well as exposure to market risk due to changing conditions in the liquidity guarantee atfinancial markets;
•Investments in mortgage-backed securities, which are subject to the same time as TIAA and its affiliates are serving as an investment manager to otherrisks inherent in real estate accounts or funds, including conflictsinvesting, making mortgage loans and investing in debt securities. For example, the underlying mortgage loans may experience defaults, are subject to prepayment risks and are sensitive to economic conditions impacting the credit markets generally;
•Risks associated with satisfyingthe Account’s investments in mortgage loans, including (i) borrower default that results in the Account being unable to recover its fiduciary duties to all such accountsoriginal investment, (ii) liens that may have priority over the Account’s security interest, (iii) a deterioration in the financial condition of tenants, and funds(iv) changes in interest rates for the Account’s variable-rate mortgage loans and other debt instruments;
•Risks associated with purchasing, sellingthe Account’s investments in, and leasing of, properties;
•Lending securities, which has the Account bear the market risk with respect to the investment of collateral or a portion of the income generated by interest paid by the securities lending agent on the cash collateral balance;
•The Account’s requirement to sell property in the event that the issuer will not be able to pay principal and interest when due or that the issuer’s earnings will fall;
More detailed discussions of certain of these risk factors are contained in the section of the Form 10-K entitled “Item 1A. Risk Factors” and "Part II, Item 1A, Risk Factors" in this section belowReport and also in the section below entitled “Quantitative and Qualitative Disclosures About Market Risk.” These risks could cause actual results to differ materially from historical experience or management’s present expectations.
Caution should be taken not to place undue reliance on management’s forward-looking statements, which represent management’s views only as of the date that this report is filed. Neither management nor the Account undertake any obligation to update publicly or revise any forward-looking statement, whether as a result of new information, changed assumptions, future events or otherwise.
Commercial real estate market statistics discussed in this section are obtained by the Account from sources that management considers reliable, but some of the data are preliminary for the period ended September 30, 2017March 31, 2023 and may be subsequently revised. Prior period data may have been adjusted to reflect updated calculations. Investors should
31
not rely exclusively on the data presented below in forming a judgment regarding the current or prospective performance of the commercial real estate market generally.
ABOUT THE TIAA REAL ESTATE ACCOUNT
The Account was established, under the laws of New York, in February 1995 as an insurancea separate account of TIAA and interests in the Account were first offered to eligible participantscontract owners on October 2, 1995. The Account offers individual and group accumulating annuity contracts (with contributions made on a pre-tax or after-tax basis), as well as individual lifetime and term-certain variable payout annuity contracts (including the payment of death benefits to beneficiaries). Investors are entitled to transfer funds to or from the Account under certain circumstances. Funds invested in the Account for each category of contract are expressed in terms of units, and unit values will fluctuate depending on the Account’s performance.
Investment Objective and Strategy
The Real Estate Account seeks to generate favorable long-termtotal returns primarily through the rental income and appreciation of real estate anda diversified portfolio of directly held, private real estate investments owned by the Account. The Account will also invest in non-realand real estate-related publicly traded securities and short-term higher quality liquid investments, that are easily converted to cash to enable the Account to meet participant redemption requests, purchase or improve properties, or cover other expense needs.while offering investors guaranteed, daily liquidity.
Real Estate-Related Investments. The Account intends to have between 75% and 85% of its net assets invested directly in real estate or real estate-related investments with the goal of producing favorable long-term returns primarily through rental income and appreciation. These investments may consist of:
•Direct ownership interests in domestic and foreign real estate;
•Direct ownership of real estate through interests in joint ventures; or
•Indirect interests in real estate through real estate-related securities, such as:
◦private real estate limited partnerships and limited liability companies (collectively, “real estate funds”);
◦real estate operating businesses;
◦investments in equity or debt securities of domestic and foreign companies whose operations involve real estate (i.e., that primarily own, develop or manage real estate) which may not be real estate investment trusts (“REITs”);
◦domestic or foreign loans, including conventional commercial mortgage loans, participating mortgage loans, secured domestic and foreign (including U.K.) mezzanine loans, subordinated loans and collateralized mortgage obligations, including commercial mortgage-backed securities (“CMBS”), collateralized mortgage obligations (“CMOs”) and other similar investments; and
◦public and/or privately placed, domestic and foreign, registered and unregistered equity investments in REITs, which investments may consist of registered or unregistered common or preferred stock interests;
The Account’s principal investment strategy is to purchase direct ownership interests in income-producing real estate, primarilyincluding the four primary sectors of office, industrial, retail, and multi-family, residential properties.and alternative real estate sectors (defined as real estate outside of the four primary sectors noted above). The Account is targeted to holdtargets holding between 65% and 80%85% of the Account’s net assets in such direct ownership interests at any time. Historically, approximately 70% of the Account’s net assets have been comprised of such direct ownership interests in real estate.interests.
In addition, while the Account is authorized to hold up to 25% of its net assets in liquid real estate-related securities, such asincluding publicly traded REITs and CMBS, managementCMBS. Management intends that the Account will not hold more than 10% of its net assets in such securities on a long-term basis. Traditionally, less than 10%As of March 31, 2023, the Account did not hold any publicly traded REIT securities or CMBS.
In making commercial real estate investments within the Account, TIAA seeks to make investments that are suitable from a financial perspective, taking into account the potential financial impacts associated with industry recognized environmental, social and governance (“ESG”) criteria. The Account intends to promote awareness of these criteria to its joint venture partners, vendors and other stakeholders in connection with portfolio related activity involving commercial real estate transactions. TIAA believes awareness, and, as appropriate, implementation of ESG criteria in commercial real estate holdings is beneficial to total long-term returns for the Account. In its evaluation of commercial real estate opportunities, the Account will take ESG considerations into account as part of the Account’s net assets have been comprisedfinancial
32
assessment of interests in these securities; although,a commercial real estate portfolio asset, and not to achieve a desired outcome or as an investment qualification or screen. Ultimately, the Account has recently held approximately 10% of its net assets in equity REIT securities at times. In addition, underwill make an investment decision that incorporates ESG criteria only to the Account’s current investment guidelines,extent that the Accountcriteria is authorizedreasonably expected to hold up to 10% of its net assets in CMBS. As of September 30, 2017, REIT securities comprised approximately 4.5%enhance our understanding of the Account’s net assets, andinvestment's ability to achieve desired returns for the Account held no CMBS as of such date.Account.
•Money market instruments and other cash equivalents. These will usually be high-quality, short-term debt instruments, including U.S. Government or government agency securities, commercial paper, certificates of deposit, bankers’ acceptances, repurchase agreements, interest-bearing time deposits, and corporate debt securities; and
Liquid Securities.Securities Generally. Primarily due to management’s need to manage fluctuations in cash flows, in particular during and immediately following periods of significant participantcontract owner net transfer activity into or out of the Account, the Account may, on a temporary basis (i) exceed the upper end of its targeted holdings (currently 35% of the Account’s net assets) in liquid securities of all types, including both publicly traded non-real estate-related liquid investments and liquid real estate-related securities, such as REITs, and structured securities including ABS, RMBS, CMBS and MBS, or (ii) be below the low end of its targeted holdings in such liquid securities (currently 15% of the Account’s net assets).
The portion of the Account’s net assets invested in liquid investments of all types may exceed the upper end of its target, for example, if (i) the Account receives a large inflow of money in a short period of time, in particular due to significant participantcontract owner transfer activity into the Account, (ii) the Account receives significant proceeds from sales or financings of direct real estate assets, (iii) there is a lack of attractive direct real estate investments available on the market, and/or (iv) the Account anticipates more near-term cash needs, including to apply to acquire or improve direct real estate investments, pay expenses or repay indebtedness. Conversely, the portion of the Account’s net assets invested in liquid investments of all types may exceed the lower end of its target, for example, during and immediately following periods of significant net contract owner outflows.
Foreign Investments.Investments. The Account from time to time willmay also make foreign real estate, foreign real estate-related investments and foreign liquid, fixed-income investments. Under the Account’s investment guidelines, investments in direct foreign real estate and real estate loans, together with foreign real estate-related securities and foreign non-real estate-related liquid, fixed-income investments may not comprise more than 25% of the Account’s net assets. However, management does not intend such foreign investments, in the aggregate, to exceed 10% of the Account's net assets. As of September 30, 2017,March 31, 2023, the Account did not hold anyfair value of the Account's foreign real estate investments.
investments was $34.1 million.
33
put and call options and other hedging transactions) in order to hedge against the risks of exchange rate uncertainties, interest rate uncertainties and foreign currency or market fluctuations impacting the Account’s domestic or foreign investments. The Account does not intend to speculate in such transactions.
FIRST QUARTER 20172023 U.S. ECONOMIC AND COMMERCIAL REAL ESTATE OVERVIEW
The Account invests primarily in high-quality, core real estate in order to meet its investment objective of obtaining favorable long-term returns through rental income and the appreciation of its real estate holdings.
Economic Overview and Outlook
| Key Macro Economic Indicators* | Actuals | Forecast | ||||||||||||||||||||||||
| 2022 | 1Q 2023 | 2023 | 2024 | |||||||||||||||||||||||
Economy(1) | ||||||||||||||||||||||||||
| Gross Domestic Product ("GDP") | 0.9% | 2.1% | 1.2% | 2.2% | ||||||||||||||||||||||
Employment Growth (2) | 401 | 345 | 115 | 59 | ||||||||||||||||||||||
| Unemployment Rate | 3.6% | 3.5% | 3.9% | 4.2% | ||||||||||||||||||||||
Interest Rates(3) | ||||||||||||||||||||||||||
| 10 Year Treasury | 3.9% | 3.5% | 4.0% | 3.8% | ||||||||||||||||||||||
| 2016 | 1Q 2017 | 2Q 2017 | 3Q 2017 | Forecast | ||||||
| 2017 | 2018 | |||||||||
Economy(1) | ||||||||||
| Gross Domestic Product ("GDP") | 1.5% | 1.2% | 3.1% | 3.0% | 2.2% | 2.4% | ||||
| Employment Growth (Thousands) | 2,240 | 498 | 562 | 274 | 2,100 | 1,800 | ||||
| Unemployment Rate | 4.9% | 4.5% | 4.4% | 4.2% | 4.4% | 4.1% | ||||
Interest Rates(2) | ||||||||||
| 10 Year Treasury | 1.8% | 2.4% | 2.3% | 2.2% | 2.3% | 2.8% | ||||
Sources: Blue Chip Economic Indicators, Blue Chip Financial Forecasts,Bloomberg, BEA, Bureau of Labor Statistics (“BLS”), Federal Reserve and Moody’s Analytics
*Data subject to revision
(1)GDP growth rates are annual rates. Quarterly unemployment rates are the reported value for the final month of the quarter while annual values represent a twelve-month average.
(2)Values presented in thousands. Forecast values represent average monthly employment growth in the respective periods.
(3)Treasury rates are an average over the stated period.
Global growth conditions remained subdued at the start of the year, as major economies continue to deal with persistently high inflation, tight monetary policy and the continued fallout from the Russia/Ukraine conflict. The U.S. economy grew at an estimated 2.1% annualized pace quarter-over-quarter in the first quarter of 2023, as year-over-year growth improved to 1.2%. The labor market continued to surprise on the upside in recent months, with employers hiring over a million new workers in the first quarter and unemployment remaining near historic lows at 3.5%. In addition, inflation remains above the Federal Open Market Committee (“FOMC”) votedReserve’s target rate but continued to ease in Septemberthe first quarter. As a result, real income growth improved during the quarter, leaving consumers in a solid position to maintainincrease spending.
Other areas of the target range forU.S. economy have sputtered at the start of the year. High interest rates and tighter lending standards have stunted activity in the housing sector and curbed business investment growth. Manufacturing production has also struggled in 2023 and is now 1.1% lower than at this point last year.
Recent turmoil in the banking sector has introduced some additional risk into the economic outlook. The U.S. government quickly moved to backstop deposits at Silicon Valley Bank and Signature Bank and has signaled that it is willing to provide support to other banking institutions to prevent contagion in financial markets. To the extent that this is successful, the impact of recent troubles on the broader macroeconomy is likely to be minimal. However, some financial institutions are likely to tighten lending conditions further to shore up balance sheets, and a broader fallout in the financial sector with wide-ranging economic implications is possible if the government’s planned backstop proves to be insufficient.
Despite challenges in the banking sector, the Federal Reserve continued to tighten monetary policy in the first quarter, raising the federal funds rate at 1.0% to 1.25% “in view of realized25 basis points in February and expected labor market conditions and inflation”, as indicatedmatching that increase in March. Cumulatively, the September meeting minutes. The committee expects that economic conditions will continue to evolve in a manner that will warrant gradual rate increases. The FOMC is widely expected to raisecentral bank has now raised the effective federal funds rate 475 basis points since the start of 2022, bringing the target range byto 4.75%-5%. Federal Reserve officials have consistently stated that they are committed to bringing inflation back to normal, even if the economy falls into recession in upcoming quarters. However, recent statements suggest that the central bank is nearing the end of the current rate hiking cycle, with markets expecting only one more 25 basis points at the December meeting.point increase this year.
34
Real Estate Market Conditions and Outlook
The Account returned -2.41% in the first quarter 2017,of 2023 and 0.14% since March 31, 2022. Over the last year, borrowing costs have increased in response to high inflation, which caused a 5.1% decline from thirddecrease in transaction activity. As a result of both factors, property values have been adjusted downward. The first quarter 2016. Property pricing as calculatednet return was negative for the second consecutive quarter since September 2020 and reflects the impact of these broader economic conditions. Despite market headwinds, the Account remains focused on improving portfolio diversification by the Green Street Advisor Commercial Property Price Index (“CPPI”) increased 1.0% during the third quarter on a year-over-year basis. During 2017, property pricingreducing exposure to lower-growth assets and acquiring assets with higher growth prospects and economic resiliency. The Account has been essentially flat as modest increasesless active from a transaction standpoint in cap rates have largely offset income growth.
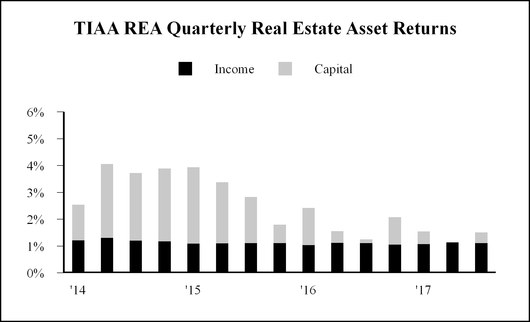
Top 5 Metro Areas by Fair Market Value(1) | Account % Leased Fair Value Weighted(2) | Number of Property Investments | Metro Area Fair Value as a % of Total RE Portfolio(3) | Metro Area Fair Value as a % of Total Investments | ||||||||||
| Riverside-San Bernardino-Ontario, CA | 100.0% | 7 | 9.9% | 8.6% | ||||||||||
| Washington-Arlington-Alexandria, DC-VA-MD-WV | 84.9% | 18 | 9.5% | 8.2% | ||||||||||
| Los Angeles-Long Beach-Anaheim, CA | 84.9% | 22 | 9.1% | 7.8% | ||||||||||
| Miami-Fort Lauderdale-West Palm Beach, FL | 95.6% | 14 | 7.1% | 6.1% | ||||||||||
| New York-Newark-Jersey City, NY-NJ-PA | 86.4% | 14 | 6.3% | 5.4% | ||||||||||
| Top 5 Metro Areas by Fair Market Value | Account % Leased Fair Value Weighted* | Number of Property Investments | Metro Area Fair Value as a % of Total RE Portfolio** | Metro Area Fair Value as a % of Total Investments |
| New York-Jersey City-White Plains, NY-NJ | 93.3% | 16 | 13.1% | 10.3% |
| Washington-Arlington-Alexandria, DC-VA-MD-WV | 86.4% | 13 | 11.4% | 9.0% |
| Los Angeles-Long Beach-Glendale, CA | 86.5% | 12 | 8.9% | 7.0% |
| Boston, MA | 91.6% | 5 | 7.1% | 5.5% |
| Seattle-Bellevue-Everett, WA | 91.8% | 6 | 5.8% | 4.6% |
(2)Weighted by fair value, which differs from the calculations provided for market comparisons to CoStar and RealPage data and are used here to reflect the fair value of the Account’s monetary investments in those markets.
(3)Wholly-owned properties are represented at fair value and gross of any debt, while joint venture properties are represented at the net equity value.
Office
Vacancy nationwide remained at 12.5% for the first quarter of 2023, as reported by CB Richard Ellis Econometric Advisors (“CBRE-EA”). Several high-techCoStar. Vacancy rates have remained high in large downtown markets, including San Francisco, Seattle, Austin, Nashville, Raleigh,such as Dallas, Washington D.C. and New York, maintained single-digit vacancy rates.
| Account Square Foot Weighted Average Vacancy | Market Vacancy* | ||||||||||||||||||
| Top 5 Office Metropolitan Areas | Total Sector by Metro Area ($M) | % of Total Investments | 2017 Q3 | 2017 Q2 | 2017 Q3 | 2017 Q2 | |||||||||||||
| Account / Nation | 15.1 | % | 14.8 | % | 12.9 | % | 13.0 | % | |||||||||||
| Washington-Arlington-Alexandria, DC-VA-MD-WV | $ | 1,475.0 | 5.4 | % | 16.5 | % | 13.7 | % | 15.4 | % | 15.6 | % | |||||||
| Boston, MA | 1,467.0 | 5.4 | % | 10.9 | % | 11.3 | % | 9.8 | % | 9.8 | % | ||||||||
| San Francisco-Redwood City-South San Francisco, CA | 1,132.6 | 4.2 | % | 8.3 | % | 6.6 | % | 7.1 | % | 7.4 | % | ||||||||
| New York-Jersey City-White Plains, NY-NJ | 1,125.2 | 4.1 | % | 22.5 | % | 20.0 | % | 9.4 | % | 9.5 | % | ||||||||
| Los Angeles-Long Beach-Glendale, CA | 742.2 | 2.7 | % | 27.0 | % | 27.6 | % | 13.6 | % | 13.7 | % | ||||||||
other top markets is due to expiring leases. The average availability ratedepth of large tenants is thin which is causing difficulty in re-leasing the Account’s industrial properties increased to 9.7% in the third quarter of 2017 from 8.2% during the second quarter. Availability rates in three of the Account’s top five industrial markets were near or well below their respective market averages. Several tenants vacated space in one of the Account’s Los Angeles properties, causing the average vacancy to rise in that area. One tenant downsized a significant amount of space in one of the Account’s Tacoma properties, contributing to the vacancy rise there, but a new tenant has since signed a lease to backfill the vacant space.
once leases expire.
35
| Account Square Foot Weighted Average Vacancy | Market Vacancy* | ||||||||||||||||||
| Top 5 Industrial Metropolitan Areas | Total Sector by Metro Area ($M) | % of Total Investments | 2017 Q3 | 2017 Q2 | 2017 Q3 | 2017 Q2 | |||||||||||||
| Account / Nation | 9.7 | % | 8.2 | % | 7.7 | % | 7.8 | % | |||||||||||
| Riverside-San Bernardino-Ontario, CA | $ | 772.2 | 2.8 | % | 0.0 | % | 0.0 | % | 6.2 | % | 6.4 | % | |||||||
| Los Angeles-Long Beach-Glendale, CA | 320.1 | 1.2 | % | 9.0 | % | 5.1 | % | 4.2 | % | 3.9 | % | ||||||||
| New York-Jersey City-White Plains, NY-NJ | 307.2 | 1.1 | % | 2.4 | % | 3.2 | % | 7.2 | % | 7.0 | % | ||||||||
| Tacoma-Lakewood, WA | 295.2 | 1.1 | % | 7.3 | % | 4.1 | % | 4.7 | % | 4.7 | % | ||||||||
| Dallas-Plano-Irving, TX | 263.9 | 1.0 | % | 4.7 | % | 6.1 | % | 8.0 | % | 8.1 | % | ||||||||
| Account Square Foot Weighted Average Vacancy | Market Vacancy(2) | |||||||||||||||||||||||||||||||||||||
Top 5 Office Metropolitan Areas(1) | Total Sector by Metro Area ($M) | % of Total Investments | Q1 2023 | Q4 2022 | Q1 2023 | Q4 2022 | ||||||||||||||||||||||||||||||||
| 17.4 | % | 19.6 | % | 12.5 | % | 12.5 | % | |||||||||||||||||||||||||||||||
| Washington-Arlington-Alexandria, DC-VA-MD-WV | $ | 1,330.9 | 4.3 | % | 16.8 | % | 18.0 | % | 15.7 | % | 15.5 | % | ||||||||||||||||||||||||||
| Boston-Cambridge-Newton, MA-NH | 1,091.6 | 3.5 | % | 20.5 | % | 18.7 | % | 10.4 | % | 9.8 | % | |||||||||||||||||||||||||||
| New York-Newark-Jersey City, NY-NJ-PA | 884.1 | 2.8 | % | 23.9 | % | 33.3 | % | 13.0 | % | 12.5 | % | |||||||||||||||||||||||||||
| San Diego-Carlsbad, CA | 666.6 | 2.1 | % | 5.6 | % | 2.7 | % | 10.9 | % | 10.8 | % | |||||||||||||||||||||||||||
| Dallas-Fort Worth-Arlington, TX | 556.7 | 1.8 | % | 25.9 | % | 23.4 | % | 17.9 | % | 17.7 | % | |||||||||||||||||||||||||||
(1)The table above has been standardized to depict MSA definitions.
(2)Source: CoStar. Market availabilityvacancy is the percentage of space available for rent. Account vacancy is the square foot-weighted percentage of unleased space.
Industrial
The industrial sector saw record-breaking activity in 2022. Consumers' long-term shift to e-commerce caused demand for industrial space to rise to unprecedented levels. Leasing activity in the Seattle-Tacoma total.first quarter of 2023 remained steady; however, demand is softening as inflation and rising interest rates have caused a reduction in consumption and construction. The need for improved supply chain and automation is expected to keep demand steady in 2023.
The national industrial availability remained at 3.9% in the first quarter of 2023, as reported by CoStar. The average vacancy rate of the industrial properties held by the Account decreased from 2.6% in the fourth quarter of 2022 to 1.7% in the first quarter of 2023, due to new leases at existing properties.
| Account Square Foot Weighted Average Vacancy | Market Vacancy(2) | |||||||||||||||||||||||||||||||||||||
Top 5 Industrial Metropolitan Areas(1) | Total Sector by Metro Area ($M) | % of Total Investments | Q1 2023 | Q4 2022 | Q1 2023 | Q4 2022 | ||||||||||||||||||||||||||||||||
| Account / Nation | 1.7 | % | 2.6 | % | 3.9 | % | 3.9 | % | ||||||||||||||||||||||||||||||
| Riverside-San Bernardino-Ontario, CA | $ | 2,551.1 | 8.2 | % | — | % | — | % | 2.9 | % | 1.9 | % | ||||||||||||||||||||||||||
| Los Angeles-Long Beach-Anaheim, CA | 782.3 | 2.5 | % | 5.1 | % | 3.3 | % | 3.2 | % | 2.4 | % | |||||||||||||||||||||||||||
| Dallas-Fort Worth-Arlington, TX | 630.4 | 2.0 | % | 3.6 | % | 8.0 | % | 6.3 | % | 5.4 | % | |||||||||||||||||||||||||||
| Seattle-Tacoma-Bellevue, WA | 587.8 | 1.9 | % | — | % | — | % | 4.6 | % | 3.8 | % | |||||||||||||||||||||||||||
| Miami-Fort Lauderdale-West Palm Beach, FL | 515.3 | 1.7 | % | 1.2 | % | 1.2 | % | 2.6 | % | 2.7 | % | |||||||||||||||||||||||||||
(1)The table above has been standardized to depict MSA definitions.
(2)Source: CoStar. Market vacancy is the percentage of space available for rent. Account vacancy is the square foot-weighted percentage of unleased space. Market vacancy rates are subject to change.
Multi-Family
remain steady throughout 2023. The vacancy rate of the Account’s multi-familyapartment properties fellincreased to 6.4% during6.9% in the thirdfirst quarter of 2023 as compared to 7.0%6.6% in the second quarter. As shownprior quarter, driven by small declines in occupancy across the following table, average vacancy rates in the Account’s top five apartment markets are at or above their comparable market averages. Strong leasing activity at one of the Account’s properties in New York improved vacancy to market average. The delivery and lease-up of several new projects in the local sub-market impacted vacancy in the Account’s properties in Denver. The Account’s properties in Fort Lauderdale benefited from increased leasing activity during the end of the summer while the overall market experienced significant deliveries.Account's properties.
36
| Account Units Foot Weighted Average Vacancy | Market Vacancy* | ||||||||||||||||||
| Top 5 Apartment Metropolitan Areas | Total Sector by Metro Area ($M) | % of Total Investments | 2017 Q3 | 2017 Q2 | 2017 Q3 | 2017 Q2 | |||||||||||||
| Account / Nation | 6.4 | % | 7.0 | % | 4.6 | % | 4.6 | % | |||||||||||
| New York-Jersey City-White Plains, NY-NJ | $ | 863.1 | 3.2 | % | 3.1 | % | 4.8 | % | 3.1 | % | 3.2 | % | |||||||
| Washington-Arlington-Alexandria, DC-VA-MD-WV | 803.2 | 3.0 | % | 8.2 | % | 8.6 | % | 4.7 | % | 4.5 | % | ||||||||
| Los Angeles-Long Beach-Glendale, CA | 558.9 | 2.1 | % | 6.2 | % | 5.9 | % | 4.0 | % | 3.9 | % | ||||||||
| Denver-Aurora-Lakewood, CO | 327.9 | 1.2 | % | 7.7 | % | 5.3 | % | 4.9 | % | 5.2 | % | ||||||||
| Fort Lauderdale-Pompano Beach-Deerfield Beach, FL | 295.9 | 1.1 | % | 8.3 | % | 12.3 | % | 6.0 | % | 5.6 | % | ||||||||
| Account Units Weighted Average Vacancy | Market Vacancy(2) | |||||||||||||||||||||||||||||||||||||
Top 5 Apartment Metropolitan Areas(1) | Total Sector by Metro Area ($M) | % of Total Investments | Q1 2023 | Q4 2022 | Q1 2023 | Q4 2022 | ||||||||||||||||||||||||||||||||
| Account / Nation | 6.9 | % | 6.6 | % | 5.2 | % | 5.2 | % | ||||||||||||||||||||||||||||||
| Washington-Arlington-Alexandria, DC-VA-MD-WV | $ | 832.5 | 2.7 | % | 6.9 | % | 7.4 | % | 5.2 | % | 5.1 | % | ||||||||||||||||||||||||||
| Los Angeles-Long Beach-Anaheim, CA | 826.7 | 2.7 | % | 9.2 | % | 8.5 | % | 4.3 | % | 4.1 | % | |||||||||||||||||||||||||||
| Miami-Fort Lauderdale-West Palm Beach, FL | 750.8 | 2.4 | % | 8.1 | % | 7.5 | % | 4.2 | % | 3.8 | % | |||||||||||||||||||||||||||
| Atlanta-Sandy Springs-Roswell, GA | 425.0 | 1.4 | % | 10.3 | % | 10.6 | % | 6.9 | % | 6.4 | % | |||||||||||||||||||||||||||
| Tampa-St. Petersburg-Clearwater, FL | 330.1 | 1.1 | % | 6.6 | % | 9.2 | % | 5.7 | % | 5.5 | % | |||||||||||||||||||||||||||
(1)The table above has been standardized to depict MSA definitions.
(2)Source: RealPage. Market vacancy is the percentage of units vacant. The Account’s vacancy is the percentage of unleased units. Market vacancy rates are subject to change.
Retail
The Account's retail portfolio is composed primarily of high-end lifestyle shopping centers and regional malls in large metropolitan or tourist centers, which tend to have been challenged by rising online retail sales, bankruptcies and store closings, but national availabilityhigher vacancy rates have generally held steady or modestly declined since 2011. However, CBRE-EA data indicates thatthan the overall national retail availability ratemarket. The Account has over 1,100 retailers across its portfolio, with its largest retail exposure comprising less than 5.0% of total retail rentable area. The retail portfolio is managed to minimize significant exposure to any single retailer. The Account’s retail vacancy increased to 10.2%11.0% in the thirdfirst quarter of 2023, up from 10.1%9.0% in the second quarter. CBRE-EA noted that anfourth quarter of 2022, due to two large tenants' leases expiring at two of the Account's properties.
| Account Units Weighted Average Vacancy | Market Vacancy* | |||||||||||||||||||||||||||||||||||||
| Total Exposure ($M) | % of Total Investments | Q1 2023 | Q4 2022 | Q1 2023 | Q4 2022 | |||||||||||||||||||||||||||||||||
| All Retail | 11.0 | % | 9.0 | % | 4.3 | % | 4.3 | % | ||||||||||||||||||||||||||||||
| Lifestyle & Mall | $ | 1,551.8 | 5.0 | % | 15.4 | % | 12.7 | % | 8.8 | % | 8.8 | % | ||||||||||||||||||||||||||
| Neighborhood, Community & Strip | 1,321.6 | 4.3 | % | 6.4 | % | 4.9 | % | 5.9 | % | 5.9 | % | |||||||||||||||||||||||||||
| Power Center** | 454.9 | 1.5 | % | 13.7 | % | 11.9 | % | 4.5 | % | 4.4 | % | |||||||||||||||||||||||||||
**The Power Center designation is reserved for properties with three or more anchor units. Anchor units are leased to large retailers such as department stores, home improvement stores, and warehouse clubs. Properties with the Neighborhood, Community and Strip designation consist of two or less anchor units.
Hotel
Despite inflation and the rising costs of travel, the hotel industry had strong occupancy in the coming quarters. Allfirst quarter of 2023 due primarily to the Account’s retail investments have vacancy rates below 10.0%, which is reflective of the overall high quality of the retail portfolio.
37
The biggest riskAccount's exposure to the US economyhospitality sector is exogenous.limited to one hotel in the Dallas metro area. The geopolitical landscape hashotel is located in a business park in the Dallas metro area and caters largely to business travelers. Key metrics to track hotel performance include occupancy, the average daily rate (“ADR”) and revenue per available room (“RevPAR”). For the quarter ended March 31, 2023, occupancy of the property increased uncertainty. Expected cutsto 61.5%, as compared to 45.0% in U.S. personalthe previous quarter. ADR and corporate tax rates appear increasingly unlikelyRevPAR were $148.82 and $161.31, respectively, for the first quarter of 2023, as compared to occur$129.07 and $103.20, respectively, in 2017. Nonetheless, if domestic economic conditions approximate economist expectations, real estate market conditions should remain healthy into 2018.the prior quarter.
INVESTMENTS
As of September 30, 2017,March 31, 2023, the Account hadheld 86.3% of its total net assets of $24.8 billion, a 2.2% increase from December 31, 2016. The increaseinvestments in the Account’s net assets was primarily driven by net investment income and appreciation in value of the Account’s investments.
The outstanding principal on mortgage loans payable on the Account’s wholly-owned real estate portfolio as of September 30, 2017March 31, 2023 was $2.3$1.9 billion. The Account’s proportionate share of outstanding principal on mortgage loans payable within its joint venture investments was $2.2$3.0 billion, which is netted against the underlying properties when determining the joint venture investment’s fair value presented on the consolidated schedulesConsolidated Schedules of investments. When the mortgage loans payable within the joint venture investments are considered, totalInvestments. Total outstanding principal on the Account’s portfolio as of September 30, 2017March 31, 2023, inclusive of loans payable within the joint venture investments, $322.0 million in loans collateralized by a loan receivable, $500.0 million of term loans outstanding and $500.0 million in senior notes payable, was $4.5$6.2 billion, which represented a loan to valueloan-to-value ratio of 15.2%18.1%. The Account has no Account-level debt.
Management believes that the Account’s real estate portfolio is diversified by location and property type. The Account’s largest investment, Fashion Show located in Las Vegas, NV, represented 3.9% of total real estate investments and 3.1% of total investments. As discussed in the Account’s prospectus, the Account does not intend to buy and sell its real estate investments simply to make short-term profits. Rather, the Account’s general strategy in selling real estate investments is to dispose of those assets that management believes (i) have maximized in value, (ii) have underperformed or face deteriorating property-specific or market conditions, (iii) need significant capital infusions in the future, (iv) are appropriate to dispose of in order to remain consistent with the Account’s intent to diversify the Account by property type and geographic location (including reallocating the Account’s exposure to or away from certain property types in certain geographic locations), or (v) otherwise do not satisfy the investment objectives of the Account. Management, from time to time, will evaluate the need to manage liquidity in the Account as part of its analysis as to whether to undertake a particular asset sale. The Account couldmay reinvest any sale proceeds that it does not need to pay operating expenses or to meet debt service or redemption requests (e.g.(e.g., participantcontract owner withdrawals or benefit payments).
The following table lists the Account's ten largest investments as of September 30, 2017.March 31, 2023. For information regarding the Account's diversification of real estate assets by region and property type, see Note 3—Credit Risk Concentrations.
Concentrations of Risk.
38
| Ten Largest Real Estate Investments | Ten Largest Real Estate Investments | Ten Largest Real Estate Investments | ||||||||||||||||||||||||||||||||||||||||||||||||||||||||||||||||||||||||
| Property Investment Name | City | State | Type | Fair Value (in millions)(1) | Property as a % of Total Real Estate Portfolio | Property as a % of Total Investments | Property Investment Name | Ownership Percentage | City | State | Type | Gross Real Estate Fair Value(1) | Debt Fair Value(2) | Net Real Estate Fair Value(3) | Property as a % of Total Real Estate Portfolio(4) | Property as a % of Total Investments(5) | ||||||||||||||||||||||||||||||||||||||||||||||||||||||||||
| Ontario Industrial Portfolio | Ontario Industrial Portfolio | 100% | Ontario | CA | Industrial | $ | 1,300.0 | $ | — | $ | 1,300.0 | 4.3% | 3.8% | |||||||||||||||||||||||||||||||||||||||||||||||||||||||||||||
| Simpson Housing Portfolio | Simpson Housing Portfolio | 80% | Various | U.S.A | Apartment | 1,153.6 | 376.5 | 777.1 | 3.9% | 3.4% | ||||||||||||||||||||||||||||||||||||||||||||||||||||||||||||||||
| Fashion Show | Las Vegas | NV | Retail | $ | 837.9 | (2) | 3.9 | % | 3.1 | % | Fashion Show | 50% | Las Vegas | NV | Retail | 914.8 | 417.5 | 497.3 | 3.0% | 2.7% | ||||||||||||||||||||||||||||||||||||||||||||||||||||||
| 1001 Pennsylvania Avenue | Washington | DC | Office | 810.0 | (3) | 3.8 | % | 3.0 | % | 1001 Pennsylvania Avenue | 100% | Washington | DC | Office | 701.0 | 299.4 | 401.6 | 2.3% | 2.0% | |||||||||||||||||||||||||||||||||||||||||||||||||||||||
| The Florida Mall | Orlando | FL | Retail | 754.8 | (4) | 3.5 | % | 2.8 | % | The Florida Mall | 50% | Orlando | FL | Retail | 688.6 | 297.6 | 391.0 | 2.3% | 2.0% | |||||||||||||||||||||||||||||||||||||||||||||||||||||||
| DDR | Various | USA | Retail | 615.8 | (5) | 2.9 | % | 2.3 | % | |||||||||||||||||||||||||||||||||||||||||||||||||||||||||||||||||
| Fourth and Madison | Seattle | WA | Office | 527.0 | (6) | 2.5 | % | 1.9 | % | |||||||||||||||||||||||||||||||||||||||||||||||||||||||||||||||||
| 501 Boylston Street | Boston | MA | Office | 506.3 | (7) | 2.4 | % | 1.9 | % | |||||||||||||||||||||||||||||||||||||||||||||||||||||||||||||||||
| Storage Portfolio II | Storage Portfolio II | 90% | Various | U.S.A | Storage | 619.6 | 166.1 | 453.5 | 2.1% | 1.8% | ||||||||||||||||||||||||||||||||||||||||||||||||||||||||||||||||
| Lincoln Centre | Lincoln Centre | 100% | Dallas | TX | Office | 509.6 | — | 509.6 | 1.7% | 1.5% | ||||||||||||||||||||||||||||||||||||||||||||||||||||||||||||||||
| Great West Industrial Portfolio | Great West Industrial Portfolio | 100% | Rancho Cucamonga | CA | Industrial | 499.0 | — | 499.0 | 1.7% | 1.5% | ||||||||||||||||||||||||||||||||||||||||||||||||||||||||||||||||
| 701 Brickell Avenue | 701 Brickell Avenue | 100% | Miami | FL | Office | 495.8 | 161.8 | 334.0 | 1.7% | 1.4% | ||||||||||||||||||||||||||||||||||||||||||||||||||||||||||||||||
| 99 High Street | Boston | MA | Office | 504.0 | 2.4 | % | 1.9 | % | 99 High Street | 100% | Boston | MA | Office | 470.9 | 252.2 | 218.7 | 1.6% | 1.4% | ||||||||||||||||||||||||||||||||||||||||||||||||||||||||
| 425 Park Avenue | New York | NY | Ground Lease | 454.0 | 2.1 | % | 1.7 | % | ||||||||||||||||||||||||||||||||||||||||||||||||||||||||||||||||||
| 780 Third Avenue | New York | NY | Office | 429.0 | (8) | 2.0 | % | 1.6 | % | |||||||||||||||||||||||||||||||||||||||||||||||||||||||||||||||||
| Ontario Industrial Portfolio | Ontario | CA | Industrial | 397.4 | 1.9 | % | 1.5 | % | ||||||||||||||||||||||||||||||||||||||||||||||||||||||||||||||||||
(1)The Account's share of the fair value of the property investment, gross of debt.
(2)Debt fair values are presented at the Account's ownership interest.
(3)The Account's share of the fair value of the property investment, net of debt.
(4)Total real estate portfolio is the aggregate fair value of the Account's wholly-owned properties and the properties held within a joint venture, gross of debt.
(5)Total investments are the aggregate fair value of all investments held by the Account, gross of debt. Total investments, as calculated within this table, will vary from total investments, as calculated in the Account's Schedule of Investments, as joint venture investments are presented in the Schedule of Investments at their net equity position in accordance with U.S. Generally Accepted Accounting Principals ("GAAP").
39
Results of Operations
Net Investment Income
The following table shows the results of operations for the ninethree months ended September 30, 2017March 31, 2023 and 20162022 and the dollar and percentage changes for those periods (dollars in millions, unaudited)millions).
| For the Three Months Ended March 31, | Change | |||||||||||||||||||||||||
| 2023 | 2022 | $ | % | |||||||||||||||||||||||
| INVESTMENT INCOME | ||||||||||||||||||||||||||
| Real estate income, net: | ||||||||||||||||||||||||||
| Rental income | $ | 334.5 | $ | 303.7 | $ | 30.8 | 10.1 | % | ||||||||||||||||||
| Real estate property level expenses: | ||||||||||||||||||||||||||
| Operating expenses | 79.4 | 73.6 | 5.8 | 7.9 | % | |||||||||||||||||||||
| Real estate taxes | 53.4 | 51.7 | 1.7 | 3.3 | % | |||||||||||||||||||||
| Interest expense | 23.2 | 19.6 | 3.6 | 18.4 | % | |||||||||||||||||||||
| Total real estate property level expenses | 156.0 | 144.9 | 11.1 | 7.7 | % | |||||||||||||||||||||
| Real estate income, net | 178.5 | 158.8 | 19.7 | 12.4 | % | |||||||||||||||||||||
| Income from real estate joint ventures | 53.3 | 60.5 | (7.2) | (11.9) | % | |||||||||||||||||||||
| Income from real estate funds | 6.6 | 6.0 | 0.6 | 10.0 | % | |||||||||||||||||||||
| Interest | 40.3 | 20.7 | 19.6 | 94.7 | % | |||||||||||||||||||||
| Other income | — | 0.8 | (0.8) | N/M | ||||||||||||||||||||||
| TOTAL INVESTMENT INCOME | 278.7 | 246.8 | 31.9 | 12.9 | % | |||||||||||||||||||||
| Expenses: | ||||||||||||||||||||||||||
| Investment management charges | 21.8 | 22.5 | (0.7) | (3.1) | % | |||||||||||||||||||||
| Administrative charges | 11.9 | 13.5 | (1.6) | (11.9) | % | |||||||||||||||||||||
| Distribution charges | 4.8 | 7.3 | (2.5) | (34.2) | % | |||||||||||||||||||||
| Mortality and expense risk charges | — | 0.4 | (0.4) | N/M | ||||||||||||||||||||||
| Liquidity guarantee charges | 19.9 | 22.7 | (2.8) | (12.3) | % | |||||||||||||||||||||
| Interest expense | 11.4 | 1.3 | 10.1 | N/M | ||||||||||||||||||||||
| TOTAL EXPENSES | 69.8 | 67.7 | 2.1 | 3.1 | % | |||||||||||||||||||||
| INVESTMENT INCOME, NET | $ | 208.9 | $ | 179.1 | $ | 29.8 | 16.6 | % | ||||||||||||||||||
The following table illustrates and compares rental income, operating expenses and real estate taxes for properties held by the Account for the three months ended March 31, 2023 and 2022. The comparative increases or decreases associated with the acquisition and disposition of properties made in either period is compared to "same property" (dollars in millions).
| Rental Income | Operating Expenses | Real Estate Taxes | |||||||||||||||||||||||||||||||||||||||||||||
| Change | Change | Change | |||||||||||||||||||||||||||||||||||||||||||||
| 2023 | 2022 | $ | % | 2023 | 2022 | $ | % | 2023 | 2022 | $ | % | ||||||||||||||||||||||||||||||||||||
| Same Property | $ | 318.4 | $ | 282.4 | $ | 36.0 | 12.7 | % | $ | 75.7 | $ | 67.4 | $ | 8.3 | 12.3 | % | $ | 50.8 | $ | 48.4 | $ | 2.4 | 5.0 | % | |||||||||||||||||||||||
| Properties Acquired | 7.4 | 1.1 | 6.3 | N/M | 1.3 | 0.1 | 1.2 | N/M | 1.6 | 0.1 | 1.5 | N/M | |||||||||||||||||||||||||||||||||||
| Properties Sold | 8.7 | 20.2 | (11.5) | (56.9) | % | 2.4 | 6.1 | (3.7) | (60.7) | % | 1.0 | 3.2 | (2.2) | (68.8) | % | ||||||||||||||||||||||||||||||||
| Impact of Properties Acquired/Sold | 16.1 | 21.3 | (5.2) | (24.4) | % | 3.7 | 6.2 | (2.5) | (40.3) | % | 2.6 | 3.3 | (0.7) | (21.2) | % | ||||||||||||||||||||||||||||||||
| Total Property Portfolio | $ | 334.5 | $ | 303.7 | $ | 30.8 | 10.1 | % | $ | 79.4 | $ | 73.6 | $ | 5.8 | 7.9 | % | $ | 53.4 | $ | 51.7 | $ | 1.7 | 3.3 | % | |||||||||||||||||||||||
N/M—Not meaningful
40
| For the Nine Months Ended September 30, | Change | ||||||||||||||
| 2017 | 2016 | $ | % | ||||||||||||
| INVESTMENT INCOME | |||||||||||||||
| Real estate income, net: | |||||||||||||||
| Rental income | $ | 791.6 | $ | 755.9 | $ | 35.7 | 4.7 | % | |||||||
| Real estate property level expenses: | |||||||||||||||
| Operating expenses | 164.9 | 163.5 | 1.4 | 0.9 | % | ||||||||||
| Real estate taxes | 127.3 | 116.9 | 10.4 | 8.9 | % | ||||||||||
| Interest expense | 67.3 | 63.3 | 4.0 | 6.3 | % | ||||||||||
| Total real estate property level expenses | 359.5 | 343.7 | 15.8 | 4.6 | % | ||||||||||
| Real estate income, net | 432.1 | 412.2 | 19.9 | 4.8 | % | ||||||||||
| Income from real estate joint ventures and limited partnerships | 154.3 | 111.8 | 42.5 | 38.0 | % | ||||||||||
| Interest | 37.6 | 17.8 | 19.8 | N/M | |||||||||||
| Dividends | 15.7 | 19.9 | (4.2 | ) | (21.1 | )% | |||||||||
| TOTAL INVESTMENT INCOME | 639.7 | 561.7 | 78.0 | 13.9 | % | ||||||||||
| Expenses: | |||||||||||||||
| Investment management charges | 52.9 | 51.8 | 1.1 | 2.1 | % | ||||||||||
| Administrative charges | 46.0 | 48.4 | (2.4 | ) | (5.0 | )% | |||||||||
| Distribution charges | 19.6 | 21.3 | (1.7 | ) | (8.0 | )% | |||||||||
| Mortality and expense risk charges | 0.9 | 0.9 | — | — | % | ||||||||||
| Liquidity guarantee charges | 34.5 | 28.1 | 6.4 | 22.8 | % | ||||||||||
| TOTAL EXPENSES | 153.9 | 150.5 | 3.4 | 2.3 | % | ||||||||||
| INVESTMENT INCOME, NET | $ | 485.8 | $ | 411.2 | $ | 74.6 | 18.1 | % | |||||||
Rental Income:
Rental income increased $35.7by $30.8 million, or 4.7%10.1%, primarily duewhen compared to net acquisitions coupled with increased occupancy in the retailfirst quarter of 2022, driven by increases across the industrial, office and apartment sectors due to increased markets rents, as well as reductions in bad debt expenses and reduced leasing incentivesrent concessions. The Account's hotel property also experienced an increase in income which can be attributed to an increase in group catering, room rentals and short term corporate bookings when compared to the industrial and retail sectors.first quarter of 2022.
Operating Expenses:
Operating expenses increased $1.4$5.8 million, or 0.9%7.9%, primarilywhen compared to the first quarter of 2022 due to net acquisitions.
Real estate taxes increased $10.4$1.7 million, or 8.9%3.3%, primarilywhen compared to the same period in 2022, due to net real estate acquisitions coupled with higher property tax assessments resulting from increases in the assessed property values acrossof two of the officeAccount's industrial properties located in Dallas, Texas and apartment sectors.Minneapolis, Minnesota.
Interest Expense:
Interest expense increased $4.0$3.6 million, or 6.3%18.4%, due to higher average outstanding principal balances through the nine months ended September 30, 2017, aswhen compared to the same period in 2016.2022, as a result of a higher average outstanding principal balance on loans payable.
Income from Real Estate Joint Ventures and Limited Partnerships:Ventures:
Income from real estate joint ventures and limited partnerships increased $42.5 million, or 38.0%, as a result of net acquisitions and higher distributions, primarily from a joint venture that holds a large retail property in Las Vegas, Nevada.
Income from Real Estate Funds:
Income from real estate funds increased $0.6 million when compared to the same period in 2022, primarily as a result of higher distributed income from two of the Account's real estate fund investments.
Interest Income:
Interest income increased $19.6 million in comparison to the same period of 2022, due to lower dividend yieldsan increase in the Account's loans receivable portfolio.
Expenses:
Investment management, administrative and distribution costs charged to the Account are associated with managing the Account. Investment management charges are comprised primarily of fixed components, but fluctuate based on the Account's real-estate relatedsecurities.
Mortality and expense risk and liquidity guarantee chargesexpenses are contractual charges to the Account from TIAA for TIAA’s assumption of these risks and provision of the liquidity guarantee. The ratesrate for these charges wereis established effective May 1, 2017, for the twelve month period ending April 30, 2018,annually and are charged at a fixed rate based on the Account’s net assets. Mortality and expense risk expenses decreased between the comparative periods due to a decrease in the mortality and expense risk charge. Liquidity guarantee expenses were $2.8 million lower than the comparable period of 2022 as a result of lower average net assets.
Interest expense on the Account's line of credit and other unsecured debt increased $10.1 million when compared to the same quarter of 2022, due to the June 2022 issuance of $500.0 million of senior notes and a higher average outstanding balance on the Account's credit facility.
41
Net Realized and Unrealized Gains and Losses on Investments and Mortgage Loans PayableDebt
The following table shows the net realized and unrealized gains and losses on investments and mortgage loans payabledebt for the ninethree months ended September 30, 2017March 31, 2023 and 20162022 and the dollar and percentage changes for those periods (dollars in millions, unaudited)millions).
| For the Nine Months Ended September 30, | Change | ||||||||||||||
| 2017 | 2016 | $ | % | ||||||||||||
| NET REALIZED AND UNREALIZED GAIN (LOSS) ON INVESTMENTS AND MORTGAGE LOANS PAYABLE | |||||||||||||||
| Net realized gain (loss) on investments: | |||||||||||||||
| Real estate properties | $ | 58.4 | $ | 26.5 | $ | 31.9 | N/M | ||||||||
| Real estate joint ventures and limited partnerships | (8.6 | ) | 0.4 | (9.0 | ) | N/M | |||||||||
| Marketable securities | 15.3 | 21.6 | (6.3 | ) | (29.2 | )% | |||||||||
| Total realized gain on investments: | 65.1 | 48.5 | 16.6 | 34.2 | % | ||||||||||
| Net change in unrealized appreciation (depreciation) on: | |||||||||||||||
| Real estate properties | 74.8 | 242.2 | (167.4 | ) | (69.1 | )% | |||||||||
| Real estate joint ventures and limited partnerships | 88.7 | 152.3 | (63.6 | ) | (41.8 | )% | |||||||||
| Marketable securities | 34.2 | 84.2 | (50.0 | ) | (59.4 | )% | |||||||||
| Loans receivable | 1.4 | 0.1 | 1.3 | N/M | |||||||||||
| Mortgage loans payable | (10.6 | ) | (54.8 | ) | 44.2 | (80.7 | )% | ||||||||
| Net change in unrealized appreciation on investments and mortgage loans payable | 188.5 | 424.0 | (235.5 | ) | (55.5 | )% | |||||||||
| NET REALIZED AND UNREALIZED GAIN ON INVESTMENTS AND MORTGAGE LOANS PAYABLE | $ | 253.6 | $ | 472.5 | $ | (218.9 | ) | (46.3 | )% | ||||||
| For the Three Months Ended March 31, | Change | |||||||||||||||||||||||||
| 2023 | 2022 | $ | % | |||||||||||||||||||||||
| NET REALIZED AND UNREALIZED GAIN (LOSS) ON INVESTMENTS AND DEBT | ||||||||||||||||||||||||||
| Net realized gain (loss) on investments: | ||||||||||||||||||||||||||
| Real estate properties | $ | — | $ | (8.4) | $ | 8.4 | N/M | |||||||||||||||||||
| Real estate joint ventures | — | 50.9 | (50.9) | N/M | ||||||||||||||||||||||
| Marketable securities | (19.1) | (1.0) | (18.1) | N/M | ||||||||||||||||||||||
| Total realized (loss) gain on investments: | (19.1) | 41.5 | (60.6) | N/M | ||||||||||||||||||||||
| Net change in unrealized gain (loss) on: | ||||||||||||||||||||||||||
| Real estate properties | (487.4) | 1,212.4 | (1,699.8) | N/M | ||||||||||||||||||||||
| Real estate joint ventures | (377.3) | 71.9 | (449.2) | N/M | ||||||||||||||||||||||
| Real estate funds | 11.0 | (9.4) | 20.4 | N/M | ||||||||||||||||||||||
| Real estate operating business | (5.9) | 60.4 | (66.3) | N/M | ||||||||||||||||||||||
| Foreign currency exchange on forward contracts | (0.5) | — | (0.5) | N/M | ||||||||||||||||||||||
| Marketable securities | 28.7 | (28.6) | 57.3 | N/M | ||||||||||||||||||||||
| Loans receivable | (43.0) | 1.0 | (44.0) | N/M | ||||||||||||||||||||||
| Loans payable | (6.8) | 3.7 | (10.5) | N/M | ||||||||||||||||||||||
| Other unsecured debt | (6.9) | — | (6.9) | N/M | ||||||||||||||||||||||
| Net change in unrealized (loss) gain on investments and debt | (888.1) | 1,311.4 | (2,199.5) | N/M | ||||||||||||||||||||||
| NET REALIZED AND UNREALIZED (LOSS) GAIN ON INVESTMENTS AND DEBT | $ | (907.2) | $ | 1,352.9 | $ | (2,260.1) | N/M | |||||||||||||||||||
N/M—Not meaningful
Real Estate Properties:
Wholly-owned real estate investments experienced unrealized losses of $487.4 million during the first quarter of 2023, compared to $1,020.4 million of net realized and unrealized gains of $133.2 million during the first nine months of 2017 compared to $268.7 million during the comparable period of 2016. While the rate of appreciation has slowed in 2017, the Account continues to see appreciation across most of its sectors. Appreciation for the nine months ended September 30, 2017 was largely concentrated among the Account's industrial sector, especially2022. Unrealized losses in the first quarter of 2023 were driven by office properties in the Eastern, Western region. Strong tenantand Southern regions, due to decreased market demand, for industrial space in California has been the primary driver of this appreciation.higher concessions and current economic conditions.
Real Estate Joint Ventures and Limited Partnerships:Ventures:
Real estate joint ventures and limited partnerships experienced unrealized losses of $377.3 million during the first quarter of 2023, compared to $122.8 million of net realized and unrealized gains during the first quarter of $80.12022. Current quarter unrealized losses were seen across the Account's joint venture investments portfolio, with the largest losses seen in the office sectors due to a decrease in demand.
Real Estate Funds:
Real estate funds experienced unrealized gains of $11.0 million during the first nine monthsquarter of 2017,2023, compared to $152.7$9.4 million of unrealized losses during the comparable periodfirst quarter of 2016. While2022. Unrealized gains in the ratefirst quarter of appreciation has slowed in 2017, the Account continues2023 were due to see modest appreciation across most sectorsa favorable valuation of one of the Account's joint venture portfolio. The strongest appreciation for the nine months ended September 30, 2017 was among the Account's office investments in the Western region. Appreciation from joint venture regional malls in the Southern region was especially strong in 2016; the absence of this same appreciation in 2017 due to moderating market conditions was a significant driver of the overall decline from the prior year.real estate funds, driven by lower capitalization rates.
42
Real Estate Operating Business:
The Account’s marketable securitiesAccount's real estate operating business experienced net realized and unrealized gainslosses of $49.5$5.9 million during the first nine monthsquarter of 20172023, compared to $105.8$60.4 million during the comparable period of 2016. The markets for REITs in the U.S. increased 6.0% as measured by the FTSE NAREIT All Equity REITs Index during the nine month period ended September 30, 2017, compared to a increase of 12.3% in the same period of 2016. Appreciation on the Account's real estate related equity securities moved in line with the market movements. Additionally, as of September 30, 2017, the Account held $4.3 billion of investments in government agency notes and U.S. Treasury securities, which had nominal changes due to the short-term nature of these investments.
The following table shows the results of operations for the three months ended September 30, 2017 and 2016 and the dollar and percentage changes for those periods (dollars in millions, unaudited).
| For the Three Months Ended September 30, | Change | ||||||||||||||
| 2017 | 2016 | $ | % | ||||||||||||
| INVESTMENT INCOME | |||||||||||||||
| Real estate income, net: | |||||||||||||||
| Rental income | $ | 267.9 | $ | 257.4 | $ | 10.5 | 4.1 | % | |||||||
| Real estate property level expenses: | |||||||||||||||
| Operating expenses | 56.9 | 54.8 | 2.1 | 3.8 | % | ||||||||||
| Real estate taxes | 43.2 | 40.4 | 2.8 | 6.9 | % | ||||||||||
| Interest expense | 22.5 | 22.4 | 0.1 | 0.4 | % | ||||||||||
| Total real estate property level expenses | 122.6 | 117.6 | 5.0 | 4.3 | % | ||||||||||
| Real estate income, net | 145.3 | 139.8 | 5.5 | 3.9 | % | ||||||||||
| Income from real estate joint ventures and limited partnerships | 60.9 | 33.5 | 27.4 | 81.8 | % | ||||||||||
| Interest | 15.9 | 6.3 | 9.6 | N/M | |||||||||||
| Dividends | 7.9 | 9.2 | (1.3 | ) | (14.1 | )% | |||||||||
| TOTAL INVESTMENT INCOME | 230.0 | 188.8 | 41.2 | 21.8 | % | ||||||||||
| Expenses: | |||||||||||||||
| Investment management charges | 15.5 | 17.6 | (2.1 | ) | (11.9 | )% | |||||||||
| Administrative charges | 14.7 | 17.0 | (2.3 | ) | (13.5 | )% | |||||||||
| Distribution charges | 6.4 | 7.2 | (0.8 | ) | (11.1 | )% | |||||||||
| Mortality and expense risk charges | 0.3 | 0.3 | — | — | % | ||||||||||
| Liquidity guarantee charges | 12.5 | 10.2 | 2.3 | 22.5 | % | ||||||||||
| TOTAL EXPENSES | 49.4 | 52.3 | (2.9 | ) | (5.5 | )% | |||||||||
| INVESTMENT INCOME, NET | $ | 180.6 | $ | 136.5 | $ | 44.1 | 32.3 | % | |||||||
| For the Three Months Ended September 30, | Change | ||||||||||||||
| 2017 | 2016 | $ | % | ||||||||||||
| NET REALIZED AND UNREALIZED GAIN (LOSS) ON INVESTMENTS AND MORTGAGE LOANS PAYABLE | |||||||||||||||
| Net realized gain (loss) on investments: | |||||||||||||||
| Real estate properties | $ | 75.2 | $ | 16.4 | $ | 58.8 | N/M | ||||||||
| Real estate joint ventures and limited partnerships | (8.6 | ) | 0.2 | (8.8 | ) | N/M | |||||||||
| Marketable securities | 2.6 | 3.1 | (0.5 | ) | (16.1 | )% | |||||||||
| Total realized gain on investments: | 69.2 | 19.7 | 49.5 | N/M | |||||||||||
| Net change in unrealized appreciation (depreciation) on: | |||||||||||||||
| Real estate properties | (9.4 | ) | 36.9 | (46.3 | ) | N/M | |||||||||
| Real estate joint ventures and limited partnerships | 26.9 | 24.3 | 2.6 | 10.7 | % | ||||||||||
| Marketable securities | 2.2 | (26.0 | ) | 28.2 | N/M | ||||||||||
| Loans receivable | 1.4 | 0.1 | 1.3 | N/M | |||||||||||
| Mortgage loans payable | (4.1 | ) | (29.1 | ) | 25.0 | (85.9 | )% | ||||||||
| Net change in unrealized appreciation on investments and mortgage loans payable | 17.0 | 6.2 | 10.8 | N/M | |||||||||||
| NET REALIZED AND UNREALIZED GAIN ON INVESTMENTS AND MORTGAGE LOANS PAYABLE | $ | 86.2 | $ | 25.9 | $ | 60.3 | N/M | ||||||||
Loans Receivable, including those with related parties:
Loans receivable, including those with related parties, experienced unrealized losses of $43.0 million during the first quarter of 2023 compared to $53.3$1.0 million of unrealized gains during the comparable period of 2016, mostly2022. The current period losses are attributed to gains realized from the saleunfavorable valuation of wholly-owned properties and appreciation among the Account's industrial propertiesan underperforming loan collateralized by an office property located in Chicago, Illinois.
Loans Payable:
Loans payable experienced unrealized losses of $6.8 million in the Western region. Strong tenant demand for industrial space in California has been the primary driver of this appreciation.
Other Unsecured Debt:
The Account's other unsecured debt experienced an unrealized loss of Treasury rates during$6.9 million in the comparable period.first quarter of 2023, attributable to changes in the risk-free yield curve and are partially offset by changes in credit spreads.
Liquidity and Capital Resources
As of September 30, 2017March 31, 2023 and December 31, 2016,2022, the Account’s cash and cash equivalents and non-real estate-related marketable securities had a value of $4.3$1.4 billionand $4.12.1 billion representing 17.3%5.1% and 16.7%7.1% of the Account’s net assets at such dates, respectively.
Net Income and Leverage
The Account has a $945.0 million unsecured line of credit, accessible as needed to fund the Account's near-term investment objectives, as further described in Note 10—Credit Facility. As of March 31, 2023, the Account had not drawn on the line of credit.
The Account may from time to time borrow money and assume or obtain a mortgage on a property to make leveraged real estate investments. Also, to meet any short-term cash needs, the Account may obtain a line of credit that may be unsecured and/or contain terms that may require the Account to secure the loan with one or more of its properties.
The Account is authorized to borrow money in accordance with its investment
43
guidelines. Under the Account’s current investment guidelines, the Account’s loan to value ratio (as described below) is to be maintained at or below 30% (measured at the time of incurrence and after giving effect thereto). Such incurrencesincurrence of debt from time to time may include:
•placing new debt on properties;
•refinancing outstanding debt;
•assuming debt on acquired properties or interests in the Account’s properties; and/or
•the purposeissuance of calculating the loan to value ratio, management deems the maximum amount which may be drawn under that line of credit as fully incurred, regardless of whether the maximum amount available has been drawn from time to time.debt securities.
As of September 30, 2017,March 31, 2023, the Account’s loan-to-value ratio ofwas 18.1%. The Account's loan-to-value ratio at any time is based on the outstanding principal amount of debt (inclusive ofto the Account’s proportionate share of debt held within its joint venture investments) toAccount's total gross asset value, (i.e., a “loan to value ratio”) was 15.2%.and excludes leverage, if any, employed by REITs and real estate funds in which the Account invests. The Account intends to maintain its loan to value ratio at or below 30% (this ratio is measured at the time of any debt incurrence and after giving effect thereto).thereto. The Account’s total gross asset value, for these purposes, is equal to the total fair value of the Account’s assets (including the fair value of the Account’s interest in joint ventures), with no reduction associated with any indebtedness on such assets. In calculating outstanding indebtedness, we include only the Account’s actual percentage interest in any borrowings on a joint venture investment and not that of any joint venture partner. Also, at the time the Account (or a joint venture in which the Account is a partner) enters into a revolving or other line of credit, management includes only amounts outstanding when calculating outstanding indebtedness.
The Account may borrow up to 70% of the then-current value of a property, although construction loans may be for 100% of costs incurred in developing the property. Except for construction loans, any mortgage loans on a property will be non-recourse to the Account. For this purpose, non-recourse means that if there is a default on a loan in respect to a specific property, the lender will have recourse to (i.e., be able to foreclose on) only the property encumbered (or the joint venture owning the property), or to other specific Account properties that may have been pledged as security for the defaulted loan, but not to any other assets of the Account. Currently, TIAA, on behalf of the Account, maintains a credit agreement with a syndicate of third-party bank lenders, including JPMorgan Chase Bank, N.A. (the “Credit Agreement”), comprised of an unsecured revolving line of credit and term loans. The Account may use the proceeds of borrowings under the Credit Agreement for funding general organizational purposes of the Account in the ordinary course of business, including financing certain real estate portfolio investments. The Account may enter into additional unsecured lines of credit, credit facilities and term bank loans underwritten by one or more third-party lenders. In addition, from time to time, the Account may borrow capital for operating or other needs by offering debt securities.
As of September 30, 2017,March 31, 2023, there are nosix mortgage obligations, totaling $569.4 million, secured by real estate investments wholly-owned by the Account maturingthat mature within the next twelve months. The Account has sufficient liquidity in the form of cash and cash equivalents and securities to meet its current mortgage obligations.
Recent Transactions
The following describes property transactions by the Accountoccurring during the thirdfirst quarter of 2017.2023 related to real estate properties, real estate joint ventures, real estate funds, loans receivable, and loans payable. Except as noted, the expenses for operating the properties purchased are either borne or reimbursed, in whole or in part, by the property tenants, although the terms vary under each lease. Dollar amounts are shown in millions.
Financings
| Description | Transaction Date | Interest Rate | Maturity Date | Amount | ||||||||||||||||||||||
| Project Sonic Senior Note | 03/30/2023 | 2.00% + SOFR paid monthly | 06/09/2025 | $ | 70.2 | |||||||||||||||||||||
| Project Sonic Mezzanine | 03/30/2023 | 2.00% + SOFR paid monthly | 06/09/2025 | $ | 23.4 | |||||||||||||||||||||
44
| Description | Transaction Date | Interest Rate | Sector | Maturity Date | Amount | |||||||||||||||||||||||||||
| Sixth and Main Senior Note | 03/30/2023 | 1.87% + LIBOR paid monthly | Note-on-note | 11/09/2025 | $ | (26.9) | ||||||||||||||||||||||||||
| Sixth and Main Mezzanine | 03/30/2023 | 1.87% + LIBOR paid monthly | Note-on-note | 11/09/2025 | $ | (14.5) | ||||||||||||||||||||||||||
| Description | Transaction Date | Interest Rate | Maturity Date | Amount | ||||||||||||||||||||||
| 735 Watkins Mill Debt Asset | 01/10/2023 | 6.00% | 08/09/2025 | $ | 1.0 | |||||||||||||||||||||
Critical Accounting PoliciesEstimates
Management’s discussion and analysis of the Account’s financial condition and results of operations is based on the
Account’s consolidated interim financial statements,Consolidated Financial Statements, which have been prepared by management in accordance with GAAP. The preparation of the Account’s financial statements in conformity with GAAP requires management to make estimates and assumptions that affect the financial statementsreported amounts of assets, liabilities, income and disclosures. Someexpenses. Management considers the valuation of these estimatesreal estate properties and assumptions require applicationvaluation of difficult, subjective, and/or complex judgments about the effect of matters that are inherently uncertain and that may change in subsequent periods. Management evaluates its estimates and assumptions on an ongoing basis. Management bases its estimates on historical experience and on various other assumptions that it believesreal estate joint ventures to be reasonable undercritical accounting estimates because they involve a significant level of estimation uncertainty and have a material impact on the circumstances, theAccount’s financial condition and results of which formoperations.
There have been no material changes to the basis for making judgments aboutAccount's critical accounting policies described in the carrying values of assets and liabilities of the Account that are not readily apparent from other sources. Actual results may differ from these estimates under different assumptions or conditions.
ITEM 3. QUANTITATIVE AND QUALITATIVE DISCLOSURES ABOUT MARKET RISK
The Account’s real estate holdings, including real estate joint venture, limited partnershipsventures, funds, an operating business and loans receivable, including those with related parties, which, as of September 30, 2017,March 31, 2023, represented 80.1% 95.9%of the Account’s total investments, expose the Account to a variety of risks. These risks include, but are not limited to:
•General Real Estate Risk—The risk that the Account’s property values or rental and occupancy rates could go down due to general economic conditions, a weak market for real estate generally, disruptions in the credit and/or capital markets, or changing supply and demand for certain types of properties;
•Appraisal Risk—The risk that the sale price of an Account property (i.e., the value that would be determined by negotiations between independent parties) might differ substantially from its estimated or appraised value, leading to losses or reduced profits to the Account upon sale;
•Risk Relating to Property Sales—The risk that the Account might not be able to sell a property at a particular time for its full value, particularly in a poor market. This might make it difficult to raise cash quickly and also could lead to Account losses;
•Risks of Borrowing—The risk that interest rate changes may impact Account returns if the Account borrows against a credit facility, takes out a mortgage on a property, buys a property subject to a mortgage or holds a property subject to a mortgage, and hedging against such interest rate changes, if undertaken by the Account, may entail additional costs and be unsuccessful; and
•Foreign Currency Risk—The risk that the value of the Account’s foreign investments, related debt, or rental income could increase or decrease due to changes in foreign currency exchange rates or foreign currency exchange control regulations, and hedging against such currency changes, if undertaken by the Account, may entail additional costs and be unsuccessful.
The Account believes the diversification of its real estate portfolio, both geographically and by sector, along with its quarterly valuation procedure, helps manage the real estate and appraisal risks described above.
As of September 30, 2017, 19.9%March 31, 2023, 4.1% of the Account’s total investments were comprised of marketable securities. Marketable securities include high-quality debt instruments (i.e.(i.e., U.S. government agency notes)notes and corporate bond
45
securities) and, when applicable, REIT securities. The consolidated scheduleAccount's Consolidated Statements of investments for the AccountInvestments sets forth the general financial terms of these instruments, along with their fair values, as determined in accordance with procedures described earlier in the Critical Accounting Policies section above and in Note 1—1–Organization and Significant Accounting Policies to the Account’s Consolidated Financial Statements included herewith.of the Account's 2022 Form 10-K. As of the date of this report,March 31, 2023, the Account does not invest in derivative financial investments, norinstruments, although it does the Account engage in any hedging activity although it may do so in selected circumstances in the future.related to foreign currency denominated investments.
Risks associated with investments in real estate-related liquid assets (which could include, from time to time, REIT securities and CMBS), and non-real estate-related liquid assets, including financial/credit risk, market volatility risk, interest rate volatility risk and deposit/money market risk.include the following:
•Financial/Credit Risk—The risk, for debt securities, that the issuer will not be able to pay principal and interest when due (and/or declare bankruptcy or be subject to receivership) and, for equity securities such as common or preferred stock, that the issuer’s current earnings will fall or that its overall financial soundness will decline, reducing the security’s value.
•Market Volatility Risk—The risk that the Account’s investments will experience price volatility due to changing conditions in the financial markets regardless of the credit quality or financial condition of the underlying issuer. This risk is particularly acute to the extent the Account holds equity securities, which have experienced significant short-term price volatility over the past year. Also, to the extent the Account holds debt securities, changes in overall interest rates can cause price fluctuations.
•Interest Rate Volatility—The risk that interest rate volatility may affect the Account’s current income from an investment.
•Deposit/Money Market Risk—The risk that, to the extent the Account’s cash held in bank deposit accounts exceeds federally insured limits as to that bank, the Account could experience losses if banks fail. The Account does not believe it has exposure to significant concentration of deposit risk. In addition, there is some risk that investments held in money market accounts can suffer losses.
In addition, to the extent the Account were to hold mortgage-backed securitiesMBS (including commercial mortgage-backed securities)CMBS) these securities are subject to prepayment risk or extension risk (i.e.(i.e., the risk that borrowers will repay the loans earlier or later than anticipated). If the underlying mortgage assets experience faster than anticipated repayments of principal, the Account could fail to recoup some or all of its initial investment in these securities, since the original price paid by the Account was based in part on assumptions regarding the receipt of interest payments. If the underlying mortgage assets are repaid later than anticipated, the Account could lose the opportunity to reinvest the anticipated cash flows at a time when interest rates might be rising. The rate of prepayment depends on a variety of geographic, social and other functions, including prevailing market interest rates and general economic factors. The fair value of these securities is also highly sensitive to changes in interest rates. Note that the potential for appreciation, which could otherwise be expected to result from a decline in interest rates, may be limited by any increased prepayments. These securities may be harder to sell than other securities.
In addition to these risks, real estate equity securities (such as REIT stockssecurities and mortgage-backed securities)MBS) would be subject to many of the same general risks inherent in real estate investing, making mortgage loans and investing in debt securities. For more information on the risks associated with all of the Account’s investments, see Item 1A. Risk Factors, of the Account’s most recent prospectus.Account's Annual Report on Form 10-K for the year ended December 31, 2022, filed with the Securities and Exchange Commission on March 9, 2023, as such risk factors may be updated in Item 1A of this Form 10-Q or in subsequent reports.
ITEM 4. CONTROLS AND PROCEDURES
(a) The registrant maintains a system of disclosure controls and procedures that are designed to provide reasonable assurance that information required to be disclosed in the registrant’s reports under the Securities Exchange Act of 1934, as amended (the “Exchange Act”), is recorded, processed, summarized and reported within the time periods specified in the SEC’s rules and forms, and that such information is accumulated and communicated to management, including TIAA’s Executive Vice President, Institutional Investment & Endowment Services (Principalthe registrant’s Principal Executive Officer (“PEO”)) and TIAA’s Senior Executive Vice President and Chief Financial Officer (Principalthe Principal Financial Officer (“PFO”)), as appropriate, to allow timely decisions regarding required disclosure.
Under the supervision and participation of the registrant’s management, including the registrant’s PEO and PFO, the registrant conducted an evaluation of the effectiveness of the registrant’s disclosure controls and procedures as defined in Rule 13a-15(e) under the Exchange Act as of September 30, 2017.March 31, 2023. Based upon management’s review, the PEO and PFO concluded that the registrant’s disclosure controls and procedures, as of the end of the period covered by this report, were effective to provide reasonable assurance that material information required to be included in the Account's periodic reports is recorded, processed, summarizedobjectives of disclosure controls and reported within the time periods specified in the relevant SEC rules and forms.procedures are met.
(b) Changes in internal control over financial reporting. There have been no changes in the registrant’s internal control over financial reporting that occurred during the registrant’s last fiscal quarter that materially affected, or are reasonably likely to materially affect, the registrant’s internal control over financial reporting.
PART II. OTHER INFORMATION
ITEM 1. LEGAL PROCEEDINGS.
In the normal course of business, the Account may be named, from time to time, as a defendantor may be involved in various legal actions, including arbitration, class actions and other litigation.
The Account establishes an accrual for all litigation and regulatory matters when it believes it is partyprobable that a loss has been incurred and the amount of the loss can be reasonably estimated. Once established, accruals are adjusted, as appropriate, in light of additional information. The amount of loss ultimately incurred in relation to various claims and routine litigation arising inthose matters may be higher or lower than the ordinary courseamounts accrued for those matters.
As of business. Managementthe date of this report, management of the Account does not believe that the results of any such claims or litigation, individually or in the aggregate, will have a material effect on the Account’s business, financial position or results of operations.
ITEM 1A. RISK FACTORS.
The Account requires sufficient liquidity to fund ongoing Account-level loan and debt commitments to make payments on its debt obligations as previously reportedthey become due, satisfy contract owner redemption requests, fund purchases and maintenance of portfolio properties, and meet other cash and contractual commitments. Although the Account’s liquid assets continue to be available to purchase suitable real estate properties, meet the Account’s debt obligations, expense needs, and contract owner redemption requests (i.e., contract owner withdrawals or benefit payments), as noted above the Account has experienced a sustained decrease in liquid assets during the first quarter of 2023. The decrease in liquid assets during the first quarter of 2023 was largely attributable to continued market volatility and higher contract owner withdrawals driven by unfavorable market trends in the U.S. commercial real estate market, with elevated interest rates negatively impacting property values. If net outflows continue in line with recent trends, that could impair the Account’s Annual Reportability to fund its operations and meet its obligations as they become due. In such event, it is likely TIAA will be required to purchase liquidity units pursuant to the Liquidity Guarantee in the second or third quarters of 2023, depending on Form 10-K for the year ended December 31, 2016.pace of net outflows, and this could have a material adverse effect on the Account’s business, financial condition and results of operations.
ITEM 2. UNREGISTERED SALES OF EQUITY SECURITIES AND USE OF PROCEEDS.
Not applicable.
ITEM 3. DEFAULTS UPON SENIOR SECURITIES.
Not applicable.
ITEM 4. MINE SAFETY DISCLOSURES.
Not applicable.
ITEM 5. OTHER INFORMATION.
48
ITEM 6. EXHIBITS
| (1) | (A) | ||||||||||
| (3) | (A) | ||||||||||
| (B) | |||||||||||
| (4) | (A) | ||||||||||
| (B) | |||||||||||
| (C) | |||||||||||
| (D) | |||||||||||
| (E) | |||||||||||
| (F) | |||||||||||
| (G) | |||||||||||
| (H) | |||||||||||
| (I) | |||||||||||
| (J) | |||||||||||
| (K) | |||||||||||
| (L) | |||||||||||
| (M) | |||||||||||
| (N) | |||||||||||
| (O) | |||||||||||
| (P) | |||||||||||
| (Q) | |||||||||||
| (10) | (A) | ||||||||||
| (B) | |||||||||||
| (C) | |||||||||||
49
| (101) | The following financial information from the Quarterly Report on Form 10-Q for the period ended | ||||||||||
*Filed herewith. **Furnished electronically herewith. (1)Previously filed and incorporated herein by reference to Exhibit 1(A) to the Account’s Registration Statement on Form S-1, filed with the Commission on March 15, 2013 (File No. 333-187309). (2)Previously filed and incorporated herein by reference to Exhibit 3(A) to the Account’s Registration Statement on Form S-1, filed with the Commission on April 22, 2015 (File No. 333-202583). (3)Previously filed and incorporated herein by reference to Exhibit 3(B) to the Account’s Registration Statement on Form S-1, filed with the Commission on April 22, 2015 (File No. 333-202583). (4)Previously filed and incorporated herein by reference to the Account’s Post-Effective Amendment No. 2 to the Registration Statement on Form S-1, filed with the Commission on April 30, 1996 (File No. 33-92990). (5)Previously filed and incorporated herein by reference to Exhibit 4(A) to the Account’s Post-Effective Amendment No. 1 to the Registration Statement on Form S-1, filed with the Commission on May 2, 2005 (File No. 333-121493). (6)Previously filed and incorporated herein by reference to the Account’s Pre-Effective Amendment No. 1 to the Registration Statement on Form S-1, filed with the Commission on April 29, 2004 (File No. 333-113602). (7)Previously filed and incorporated by reference to Exhibit 4(C) to the Account’s Quarterly Report on Form 10-Q for the quarter ended September 30, 2010 and filed with the Commission on November 12, 2010 (File No. 33-92990). (8)Previously filed and incorporated herein by reference to Exhibit 10(B) to the Account's Annual Report on Form 10-K for the fiscal year ended December 31, 2012 and filed with the Commission on March 14, 2013 (File No. 33-92990). (9)Previously filed and incorporated herein by reference to Exhibit 4(D)(1) and 4(D)(2) to the Account’s Registration Statement on Form S-1, filed with the Commission on March 21, 2017 (File No. 333-216849). (10)Previously filed and incorporated herein by reference to Exhibit 4(E)(1) and 4(E)(2) to the Account’s Registration Statement on Form S-1, filed with the Commission on March 21, 2017 (File No. 333-216849). (11)Previously filed and incorporated herein by reference to Exhibit 4(F)(1) and 4(F)(2) to the Account’s Registration Statement on Form S-1, filed with the Commission on March 21, 2017 (File No. 333-216849). (12)Previously filed and incorporated herein by reference to Exhibit 4(G) to the Account’s Annual Report on Form 10-K, filed with the Commission on March 15, 2018 (File No. 333-216849). (13)Previously filed and incorporated herein by reference to Exhibit 4(H) to the Account’s Annual Report on Form 10-K, filed with the Commission on March 15, 2018 (File No. 333-216849). (14)Previously filed and incorporated herein by reference to Exhibit 4(I) to the Account’s Annual Report on Form 10-K, filed with the Commission on March 15, 2018 (File No. 333-216849). (15)Previously filed and incorporated by reference to Exhibit 10.1 to the Account's Current Report on Form 8-K, filed with the Commission on February 16, 2022 (File No. 33-92990). (16)Previously filed and incorporated herein by reference to Exhibit 4(J)(1) and 4(J)(2) to the Account’s Current Report on Form 10-K, filed with the Commission on March 14, 2019 (File No. 33-92990). (17)Previously filed and incorporated herein by reference to Exhibit 4(K) to the Account’s Current Report on Form 10-K, filed with the Commission on March 14, 2019 (File No. 33-92990). (18)Previously filed and incorporated herein by reference to Exhibit 4(L)(1) and 4(L)(2) to the Account's Current Report on Form 10-K, filed with the Commission on March 12, 2020 (File No. 33-92990). (19)Previously filed and incorporated herein by reference to Exhibit 4(M) to the Account’s Current Report on Form 10-K, filed with the Commission on March 11, 2021 (File No. 33-92990). (20)Previously filed and incorporated herein by reference to Exhibit 4(N) to the Account’s Current Report on Form 10-K, filed with the Commission on March 11, 2021 (File No. 33-92990). (21)Previously filed and incorporated herein by reference to Exhibit 4(O) to the Account’s Current Report on Form 10-K, filed with the Commission on March 11, 2021 (File No. 33-92990). (22)Previously filed and incorporated herein by reference to Exhibit 4(P) to the Account’s Current Report on Form 10-K, filed with the Commission on March 11, 2021 (File No. 33-92990). (23)Previously filed and incorporated herein by reference to Exhibit 4(Q) to the Account’s Current Report on Form 10-K, filed with the Commission on March 11, 2021 (File No. 33-92990). 50 (24)Previously filed and incorporated herein by reference to Exhibit 4(C)(2) to the Account’s Current Report on Form 10-K, filed with the Commission on March 9, 2023 (File No. 33-92990). (25)Previously filed and incorporated herein by reference to Exhibit 4(E)(3) to the Account’s Current Report on Form 10-K, filed with the Commission on March 9, 2023 (File No. 33-92990). (26)Previously filed and incorporated herein by reference to Exhibit 4(E)(4) to the Account’s Current Report on Form 10-K, filed with the Commission on March 9, 2023 (File No. 33-92990). (27)Previously filed and incorporated herein by reference to Exhibit 4(F)(3) to the Account’s Current Report on Form 10-K, filed with the Commission on March 9, 2023 (File No. 33-92990). (28)Previously filed and incorporated herein by reference to Exhibit 4(F)(4) to the Account’s Current Report on Form 10-K, filed with the Commission on March 9, 2023 (File No. 33-92990). (29)Previously filed and incorporated herein by reference to the Account’s Current Report on Form 8-K, filed with the Commission on March 24, 2023 (File No. 33-92990) 51 |
SIGNATURES
Pursuant to the requirements of the Securities Exchange Act of 1934, as amended, the registrant, TIAA Real Estate Account, has duly caused this Report to be signed on its behalf by the undersigned, thereunto duly authorized, in New York, New York, on the 7th5thday of November, 2017.
May 2023.
| TIAA REAL ESTATE ACCOUNT | |||||||||||
| By: | |||||||||||
| TEACHERS INSURANCE AND ANNUITY ASSOCIATION OF AMERICA | |||||||||||
| By: | /s/ | ||||||||||
| May 5, 2023 | Christine E. Dugan Executive Vice President and Product General Manager –Institutional Lifetime Income, Teachers Insurance and Annuity Association of America | ||||||||||
| By: | /s/ | ||||||||||
Senior Corporate Controller of Teachers Insurance and Annuity Association of America | |||||||||||
52