UNITED STATES SECURITIES AND EXCHANGE COMMISSION
Washington, D.C. 20549
Annual Report
FORM 20-F
| ☐ | REGISTRATION STATEMENT PURSUANT TO SECTION 12(b) OR (g) OF THE SECURITIES EXCHANGE ACT OF 1934 |
☐ REGISTRATION STATEMENT PURSUANT TO SECTION 12(b)
OR (g) OF THE SECURITIES EXCHANGE ACT OF 1934
| X | ANNUAL REPORT PURSUANT TO SECTION 13 OR 15(d) OF THE SECURITIES EXCHANGE ACT OF 1934 |
| For the fiscal year ended December 31, 2017 |
OR
| ☐ | TRANSITION REPORT PURSUANT TO SECTION 13 OR 15(d) OF THE SECURITIES EXCHANGE ACT OF 1934 |
OR
X ANNUAL REPORT PURSUANT TO SECTION 13 OR 15(d) OF THE SECURITIES EXCHANGE ACT OF 1934
For the fiscal year ended December 31, 2015
OR
☐TRANSITION REPORT PURSUANT TO SECTION 13 OR 15(d) OF THE SECURITIES EXCHANGE ACT OF 1934
OR
☐ SHELL COMPANY REPORT PURSUANT TO SECTION 13 OR 15(d) OF THE SECURITIES EXCHANGE ACT OF 1934
| ☐ | SHELL COMPANY REPORT PURSUANT TO SECTION 13 OR 15(d) OF THE SECURITIES EXCHANGE ACT OF 1934 |
Date of event requiring this shell company report . . . . . . . . . . . . . . . . . . .
For the transition period from __________ to ________
Commission file number 333-98397
LINGO MEDIA CORPORATION
(FORMERLY LINGO MEDIA INC.)
(Exact name of Registrant as specified in its charter)
Ontario, Canada
(Jurisdiction of incorporation or organization)
151 Bloor Street West, Suite 703, Toronto, Ontario,CanadaM5S 1S4
(Address of principal executive offices)
Michael Kraft, President & CEO
Tel: (416) 927-7000 x23 Fax: (416) 927-1222 Email: investor@lingomedia.com
Lingo Media Corporation 151 Bloor Street West, Suite 703, Toronto, Ontario,CanadaM5S 1S4
(Name, Telephone, E-mail and/or Facsimile number and Address of Company Contact Person)
Securities to be registered pursuant to Section 12(b) of the Act:
None
Securities to be registered pursuant to Section 12(g) of the Act:
Common Shares, without par value
(Title of Class)
Securities for which there is a reporting obligation pursuant to Section 15(d) of the Act: None
Indicate the number of outstanding shares of each of the issuer's classes of capital or common stock as of the close of the period covered by the annual report.
29,518,343 35,529,192
Indicate by check mark if the registrant is a well-known seasoned issuer, as defined by Rule 405 of the Securities Act
Yes ___ NoX
If this report is an annual transition report, indicate by check mark if the registrant is not required to file reports pursuant to Section 13 or 15(d) of the Securities Exchange Act of 1934.
Yes ___ NoX
Indicate by check mark whether the registrant (1) has filed all reports required to be filed by Section 13 or 15(d) of the Securities Exchange Act of 1934 during the preceding 12 months (or for such shorter period that the registrant was required to file such reports), and (2) has been subject to such filing requirements for the past 90 days.
YesX No ___
Indicate by check mark whether the registrant has submitted electronically and posted on its corporate Web site, if any, every Interactive Data File required to be submitted and posted pursuant to Rule 405 of Regulation S-T (§232.405 of this chapter) during the preceding 12 months (or for such shorter period that the registrant was required to submit and post such files).
Yes ___ NoX
Indicate by check mark whether the registrant is a large accelerated filer, an accelerated filer, or a non-accelerated filer. See definition of “accelerated filer and large accelerated filer” in Rule 12b-2 of the Exchange Act (Check one):
| Large accelerated filer ___ | Accelerated Filer ___ | Non-accelerated filer X |
| Emerging growth company ___ |
Large accelerated filer ___Accelerated Filer ___Non-accelerated filerXIf an emerging growth company that prepares its financial statements in accordance with U.S. GAAP, indicate by check mark if the registrant has elected not to use the extended transition period for complying with any new or revised financial accounting standards† provided pursuant to Section 13(a) of the Exchange Act. ___
† The term “new or revised financial accounting standard” refers to any update issued by the Financial Accounting Standards Board to its Accounting Standards Codification after April 5, 2012.
Indicate by check mark which basis of accounting the registrant has used to prepare the financial statements included in this filing:
U.S. GAAP _______ International Financial Reporting Standards as issued by Other ___thethe International Accounting Standards Board X Other ____
If “Other” has been checked in response to the previous question mark, indicate by check mark which financial statement item the registrant has elected to follow:
Item 17 ___ Item 18 ___
If this is an annual report, indicate by check mark whether the registrant is a shell company (as defined in Rule 12b-2 of the Exchange Act).
Yes ___ NoX
LINGO MEDIA CORPORATION
FORM 20-F ANNUAL REPORT
TABLE OF CONTENTS
| PART I | ||
Item 1. | Identity of Directors, Senior Management and Advisors | 4 |
Item 2. | Offer Statistics and Expected Timetable | 4 |
Item 3. | Key Information | 4 |
Item 4. | Information on the Company | 12 |
| Item 4A. | Unresolved Staff Comments | 20 |
Item 5. | Operating and Financial Review and Prospects |
|
Item 6. | Directors, Senior Management and Employees |
|
Item 7. | Major Shareholders and Related Party Transactions | 44 |
Item 8. | Financial Information | 45 |
Item 9. | The Offer and Listing | 46 |
Item 10. | Additional Information | 49 |
Item 11. | Quantitative and Qualitative Disclosures about Market Risk |
|
Item 12. | Description of Securities Other Than Equity Securities | 61 |
PART II | ||
| ||
Item 13. | Default, Dividend Arrearages and Delinquencies | 61 |
Item 14. | Material Modifications to the Rights of Security Holders and Use of Proceeds | 61 |
Item 15. | Controls and Procedures | 61 |
Item 16. | Reserved |
|
Item | Audit Committee Financial Expert | 63 |
Item | Code of Ethics | 63 |
Item | Principal Accountant Fees and Services | 63 |
| Item 16D. | Exemptions from the Listing Standards for Audit Committees | 64 |
| Item 16E. | Purchase of Equity Security by the Issuer and Affiliated Purchasers | 64 |
| Item 16F. | Change in Registrant’s Certifying Accountant | 64 |
| Item 16G. | Corporate Governance | 64 |
| Item 16H. | Mine Safety Disclosure4 | 64 |
PART III | ||
Item 17. | Financial Statements | 64 |
Item 18. | Financial Statements | 64 |
Item 19. | Exhibits |
|
Forward-Looking Statements
This Annual Report on Form 20-F contains certain forward-looking statements, which reflect management’s expectations regarding the Company’s results of operations, performance, growth, and business prospects and opportunities.
Statements about the Company’s future plans and intentions, results, levels of activity, performance, goals or achievements or other future events constitute forward-looking statements. Wherever possible, words such as "may," "will," "should," "could," "expect," "plan," "intend," "anticipate," "believe," "estimate," "predict," or "potential" or the negative or other variations of these words, or similar words or phrases, have been used to identify these forward-looking statements. These statements reflect management’s current beliefs and are based on information currently available to management as at the date hereof.
Forward-looking statements involve significant risk, uncertainties and assumptions. Many factors could cause actual results, performance or achievements to differ materially from the results discussed or implied in the forward-looking statements. These factors should be considered carefully and readers should not place undue reliance on the forward-looking statements. Although the forward-looking statements contained in this Annual Report are based upon what management believes to be reasonable assumptions, the Company cannot assure readers that actual results will be consistent with these forward-looking statements. These forward-looking statements are made as of the date of this Annual Report, and the Company assumes no obligation to update or revise them to reflect new events or circumstances, except as required by law. Many factors could cause the actual results, performance or achievements of the Company to be materially different from any future results, performance or achievements that may be expressed or implied by such forward-looking statements, including: general economic and market segment conditions, competitor activity, product capability and acceptance, international risk and currency exchange rates and technology changes. More detailed assessment of the risks that could cause actual results to materially differ than current expectations is contained in the sections entitled "Risk Factors", “Information on the Company” and “Operating and Financial Review and Prospects”.
PART I
ITEM 1. IDENTITY OF DIRECTORS, SENIOR MANAGEMENT AND ADVISORSIdentity of Directors, Senior Management and Advisors
Not applicable
ITEM 2. OFFER STATISTICS AND EXPECTED TIMETABLE
Not applicable.
ITEM 3. KEY INFORMATION
Lingo Media Corporation (“Lingo Media” or the “Company”) is a publicly listed company incorporated in Canada with limited liability under the legislation of the Province of Ontario and itsOntario. Its shares are listed on the TSX Venture Exchange and inter-listedare traded on OTC Markets, previously on the OTCQB Marketplace. The consolidated financial statements of the Company as at and for the year ended December 31, 20152017 comprise the Company and its wholly owned subsidiaries (the “Group”) consisted ofsubsidiaries: Lingo Learning Inc., ELL Technologies Ltd., Vizualize Technologies Corporation, ELL Technologies Limited, Speak2Me Inc., Parlo Corporation and Lingo Group Limited and Parlo Corporation.(the “Group”).
Lingo Media is an EdTech company that is ‘Changing ‘Changingthewaytheworldlearns English’English’. The Company provides online and print-based solutions through its two distinct business units: ELL Technologies Ltd. (“ELL Technologies”) and Lingo Learning Inc. (“Lingo Learning”). ELL Technologies is a global English language learning multi-media and online training company. Lingo Learning is a print-based publisher of English language learning school programs in China.
The head office, principal address and registered and records office of the Company is located at 151 Bloor Street West, Suite 703, Toronto, Ontario, Canada, M5S 1S4.
3.A Selected Financial Data
Conversion to International Financial Reporting Standards
The consolidated financial statements of the Company have been prepared in accordance with International Financial Reporting Standards (“IFRS”) as issued by the International Accounting Standards Board (“IASB”) and interpretations of the International Financial Reporting Interpretations Committee (“IFRIC”).
The selected financial data should be read in conjunction with the consolidated financial statements and other financial information included elsewhere in the Annual Report.
The Company has not declared any dividends since incorporation and does not anticipate that it will do so in the foreseeable future. The present policy of the Company is to retain any future earnings for use in its operations and the expansion of its business.
The following data for the fiscal years ended December 31, 2017, 2016, 2015, 2014, 2013, 2012 and 20112013 is derived from our consolidated financial statements prepared in accordance with IFRS (andas issued by the data for the fiscal year ended December 31, 2010 is derived from our consolidated financial statements prepared in accordance with Canadian GAAP)IASB and all are expressed in Canadian Dollars.
Fiscal Year Ended December 31 | Fiscal Year Ended December 31 | |||||||||||||||||||||||||||||||||||||||
2015 | 2014 | 2013 | 2012 | 2011 | 2017 | 2016 | 2015 | 2014 | 2013 | |||||||||||||||||||||||||||||||
Revenue | $ | 4,925,735 | $ | 2,512,464 | $ | 2,008,066 | $ | 2,016,261 | $ | 2,066,969 | $ | 2,776,768 | $ | 3,195,221 | $ | 4,925,735 | $ | 2,512,464 | $ | 2,008,066 | ||||||||||||||||||||
Profit/(Loss) from Operations | 2,532,057 | 523,736 | 370,681 | (996,816 | ) | (4,203,274 | ) | (5,839,868 | ) | 434,319 | 2,601,824 | 523,736 | (370,681 | ) | ||||||||||||||||||||||||||
Total Comprehensive Profit/(Loss) | 2,374,699 | 107,406 | (56,331 | ) | (1,364,737 | ) | (4,799,626 | ) | (6,262,792 | ) | 124,420 | 2,374,699 | 107,406 | (56,331 | ) | |||||||||||||||||||||||||
Total Assets | 5,232,951 | 2,423,438 | 2,214,590 | 2,660,648 | 3,049,175 | 1,534,072 | 7,176,192 | 5,232,951 | 2,423,438 | 2,214,590 | ||||||||||||||||||||||||||||||
Current Assets | 2,858,710 | 1,411,416 | 1,166,151 | 1,606,441 | 1,761,715 | 1,503,383 | 3,709,077 | 2,858,710 | 1,411,416 | 1,166,151 | ||||||||||||||||||||||||||||||
Issued Share Capital | 29,518,343 | 22,379,177 | 21,779,177 | 20,899,177 | 20,543,177 | 35,529,192 | 35,529,192 | 29,518,343 | 22,379,177 | 21,779,177 | ||||||||||||||||||||||||||||||
Weighted Average Number of Common Shares Outstanding | 26,288,889 | 21,986,300 | 21,174,026 | 20,652,415 | 18,797,185 | 35,529,192 | 33,987,383 | 26,288,889 | 21,986,300 | 21,174,026 | ||||||||||||||||||||||||||||||
Total Equity | 4,046,784 | 743,956 | 510,887 | 417,292 | 1,449,834 | 553,754 | 6,445,033 | 4,046,784 | 743,956 | 510,887 | ||||||||||||||||||||||||||||||
Dividends per Common Share | NIL | NIL | NIL | NIL | NIL | NIL | NIL | NIL | NIL | NIL | ||||||||||||||||||||||||||||||
Earnings/(Loss) per Share | ||||||||||||||||||||||||||||||||||||||||
Basic | $ | 0.10 | $ | 0.01 | $ | (0.00 | ) | $ | (0.07 | ) | $ | (0.25 | ) | $ | (0.18 | ) | $ | 0.00 | $ | 0.10 | $ | 0.01 | $ | (0.00 | ) | |||||||||||||||
Diluted | $ | 0.09 | $ | 0.01 | $ | (0.00 | ) | $ | (0.07 | ) | $ | (0.25 | ) | $ | (0.18 | ) | $ | 0.00 | $ | 0.09 | $ | 0.01 | $ | (0.00 | ) | |||||||||||||||
3.A.3. Exchange Rates
In this Annual Report, unless otherwise specified, all dollar amounts are expressed in Canadian Dollars ($). The Government of Canada permits a floating exchange rate to determine the value of the Canadian Dollar against the U.S. Dollar (USD).
The table sets forth the rate of exchange for the Canadian Dollar at the end of the five most recent fiscal periods ended December 31st, the average rates for the period and the range of high and low rates for the period. The data for each month during the previous twelve months is also provided.
Table No. 4
U.S. Dollar/Canadian Dollar
Average | High | Low | Close | |||||||||||||
Mar-16 | 1.3222 | 1.3468 | 1.2962 | 1.2971 | ||||||||||||
Feb-16 | 1.3787 | 1.4040 | 1.3523 | 1.3523 | ||||||||||||
Jan-16 | 1.4181 | 1.4589 | 1.3969 | 1.4080 | ||||||||||||
Dec-15 | 1.3718 | 1.3990 | 1.3360 | 1.3840 | ||||||||||||
Nov-15 | 1.3289 | 1.3360 | 1.3095 | 1.3333 | ||||||||||||
Oct-15 | 1.3063 | 1.3242 | 1.2904 | 1.3083 | ||||||||||||
Sept-15 | 1.3270 | 1.3413 | 1.3147 | 1.3394 | ||||||||||||
Aug-15 | 1.3145 | 1.3303 | 1.2973 | 1.3223 | ||||||||||||
Jul-15 | 1.2842 | 1.3060 | 1.2566 | 1.3047 | ||||||||||||
Jun-15 | 1.2359 | 1.2550 | 1.2209 | 1.2474 | ||||||||||||
May-15 | 1.2188 | 1.2485 | 1.1951 | 1.2465 | ||||||||||||
Apr-15 | 1.2348 | 1.2612 | 1.1954 | 1.2119 | ||||||||||||
Fiscal Yr Ended Dec., 31, 2015 | 1.3718 | 1.3990 | 1.3360 | 1.3840 | ||||||||||||
Fiscal Yr Ended Dec., 31, 2014 | 1.1048 | 1.1643 | 1.0614 | 1.1601 | ||||||||||||
Fiscal Yr Ended Dec., 31, 2013 | 1.0302 | 1.0697 | 0.9839 | 1.0636 | ||||||||||||
Fiscal Yr Ended Dec. 31, 2012 | 0.9996 | 1.0279 | 0.9790 | 0.9902 | ||||||||||||
Fiscal Yr Ended Dec. 31, 2011 | 0.9959 | 1.0130 | 0.98 | 0.9944 | ||||||||||||
Fiscal Yr Ended Dec. 31, 2010 | 1.0295 | 1.0778 | 0.9946 | 0.9946 | ||||||||||||
Average | High | Low | Close | |||||||||||||
Mar-18 | 1.2924 | 1.3088 | 1.283 | 1.2894 | ||||||||||||
Feb-18 | 1.2557 | 1.2809 | 1.2288 | 1.2809 | ||||||||||||
Jan-18 | 1.2439 | 1.2535 | 1.2293 | 1.2293 | ||||||||||||
Dec-17 | 1.2767 | 1.2886 | 1.2545 | 1.2545 | ||||||||||||
Nov-17 | 1.2757 | 1.2888 | 1.2683 | 1.2888 | ||||||||||||
Oct-17 | 1.2583 | 1.2893 | 1.2472 | 1.2893 | ||||||||||||
Sept-17 | 1.2294 | 1.2480 | 1.2128 | 1.2480 | ||||||||||||
Aug-17 | 1.2605 | 1.2755 | 1.2482 | 1.2536 | ||||||||||||
Jul-17 | 1.2713 | 1.2982 | 1.2447 | 1.2485 | ||||||||||||
Jun-17 | 1.3328 | 1.3504 | 1.2977 | 1.2977 | ||||||||||||
May-17 | 1.3601 | 1.3191 | 1.2458 | 1.3500 | ||||||||||||
Apr-17 | 1.3427 | 1.3743 | 1.3453 | 1.3662 | ||||||||||||
Fiscal Yr Ended Dec., 31, 2017 | 1.2986 | 1.3743 | 1.2128 | 1.2545 | ||||||||||||
Fiscal Yr Ended Dec., 31, 2016 | 1.3219 | 1.4691 | 1.2458 | 1.3433 | ||||||||||||
Fiscal Yr Ended Dec., 31, 2015 | 1.1048 | 1.1643 | 1.0614 | 1.1601 | ||||||||||||
Fiscal Yr Ended Dec., 31, 2014 | 1.0302 | 1.0697 | 0.9839 | 1.0636 | ||||||||||||
Fiscal Yr Ended Dec. 31, 2013 | 0.9996 | 1.0279 | 0.9790 | 0.9902 | ||||||||||||
3.B. Capitalization and Indebtedness
Not applicable
3.C. Reasons for the Offer and Use of Proceeds
Not applicable
3.D. Risk Factors
Financial risk management objectives and policies
The financial risk arising from the Company’s operations are currency risk, liquidity risk and credit risk. These risks arise from the normal course of operations and all transactions undertaken are to support the Group’s ability to continue as a going concern. The risks associated with these financial instruments and the policies on how to mitigate these risks are as follows:
Management manages and monitors these exposures to ensure appropriate measures are implemented on a timely and effective manner. The Company’s Management oversees these risks. The Board of Directors reviews and agrees on policies for managing each of these risks are as follows:
Foreign Currency Risk
Foreign currency risk is the risk that the fair value or future cash flows of a financial instrument will fluctuate because of changes in underlying foreign exchange rates. The Company’s exposure to the risk of changes in foreign exchange rates relates primarily to the Company’s operating activities (when revenue or expense is denominated in a different currency from the Company’s functional currency) and the Company’s net investments in foreign subsidiaries. The Company operates internationally and is exposed to foreign exchange risk as certain expenditures are denominated in non-Canadian Dollar currencies.
A 10% strengthening of the US Dollar against the Canadian Dollar as at December 31, 2017 would have increased the net equity by approximately $228,000 (2014$67,000 (2016 - $90,000)$294,858) due to reduction in the value of net liability balance. A 10% of weakening of the US Dollar against the Canadian Dollar at December 31, 20152017 would have had the equal but opposite effect. The significant financial instruments of the Company, their carrying values and the exposure to other denominated monetary assets and liabilities, as of December 31, 20152017 are as follows:
US Denominated | Euro Denominated | Great Britain Denominated | |
USD | Euro | GBP | |
Cash | 367,138 | 4,574 | - |
Accounts receivable | 1,346,490 | - | - |
Accounts payable | 64,298 | - | 3,960 |
US Denominated | ||||
USD | ||||
Cash | 122,319 | |||
Accounts receivable | 518,999 | |||
Accounts payable | 104,225 | |||
The carrying values and the exposure to other denominated monetary assets and liabilities as of December 31, 20142016 are as follows:
US Denominated | China Denominated | Euro Denominated | US Denominated | China Denominated | |||||||
USD | RMB | Euro | USD | RMB | |||||||
Cash | - | 18,412 | 11,091 | 17,652 | 1,786 | ||||||
Accounts receivable | 681,916 | - | 16,692 | 2,267,036 | - | ||||||
Accounts payable | 45,926 | - | - | 88,352 | - | ||||||
Liquidity Risk
The Company manages its liquidity risk by preparing and monitoring forecasts of cash expenditures to ensure that it will have sufficient liquidity to meet liabilities when due. The Company’s accounts payable and accrued liabilities generally have maturities of less than 90 days. At December 31, 2015,2017, the Company had cash of $409,022 (2014$327,434 (2016 - $477,001)$84,303), accounts and grants receivable of $1,961,534 (2014$970,467 (2016 - $849,344) and prepaid and other receivables of $488,154 (2014- $85,071)$3,044,928) to settle current liabilities of $1,186,167 (2014$980,318 (2016 - $1,679,482)$731,158).
Credit Risk
Credit risk refers to the risk that one party to a financial instrument will cause a financial loss for the counterparty by failing to discharge an obligation. The Company is primarily exposed to credit risk through accounts receivable. The maximum credit risk exposure is limited to the reported amounts of these financial assets. Credit risk is managed by ongoing review of the amount and aging of accounts receivable balances. As at December 31, 2015,2017, the Company has outstanding receivables of $1,961,534 (2014- $849,344)$970,467 (2016- $3,044,928). An allowance for doubtful accounts is taken on accounts receivable if the account has not been collected after a predetermined period of time as determined by the contract and collectability is offset against other operating expenses. The Company deposits its cash with high credit quality financial institutions, with the majority deposited within Canadian Tier 1 Banks.
Dependence onMajor Customer
The Company hashad sales to a major customer in 20152017 and 2014,2016, a government agency of the People’s Republic of China. The total percentage of sales to this customer during the year was 39% (2014 – 65%59% (2016 –54%, 2013 – 75%2015 –39%) and the total percentage of the Company’s accounts receivable at December 31, 2017 was 84% (2016 – 52%, 2015 was– 45% (2014 – 84%, 2013 – 68%).
In 2015 and 2014, the Company has sales to an online education services distribution company. The total percentage of sales to this customer during the year was 50% (2014 – 9%) and the total percentage of accounts receivable at December 31, 2015 was 50% (2014 – nil).
Market Trends and Business Uncertainties
Lingo Media believes that the global market trends in English language learning are strong and will continue to grow at a rapid pace. Developing countries around the world, specifically in Latin America and Asia are expanding their mandates for the teaching of English amongst students, young professionals and adults.
The British Council suggests that there are 1.6 Billion people learning English globally. English language learning products and services are a US$56.3 Billion global market notes Ambient Insight, who also forecasts digital English learning expenditures to account for US$3.1 Billion by 2018.
Markets and Markets forecasts the global EdTech market to grow from US$43.27 Billion in 2015 to US$93.76 Billion to 2020, or at a CAGR or 16.72%.
GSV Advisors forecasts digital English learning product expenditures to be US$2.5 Billion (or 7.3%) of the global market by 2016, with Latin America representing approximately US$260.9 Million of that figure. Students attending English language training (“ELT”) classes in Latin America accounted for approximately 14 per cent of worldwide revenues, or US$321-million in 2013. Growth has been very rapid in the region, and represents a particularly strong opportunity moving forward relative to other geographic regions. The remaining market for ELT is largely concentrated in Europe, the Middle East and Africa (45 per cent of revenues or US$1.04-billion) and the Asia Pacific region (35 per cent of revenues or US$825-million).
Lingo Media is uniquely positioned to take advantage of the market opportunity for teaching English in Latin America and Asia, with its scalable web-based learning technology and solutions. Although the market outlook remains positive, there can be no assurance that this trend will continue or that the Company will benefit from this trend.
Competitive Markets
We operate in competitive and evolving markets locally, nationally and globally. These markets are subject to rapid technological change and changes in customer preferences and demand. There can be no assurance that we will be able to obtain market acceptance or compete for market share. We must be able to keep current with the rapidly changing technologies, to adapt our services to evolving industry standards and to improve the performance and reliability of our services. New technologies could enable competitive product offerings and adversely affect us and our failure to adapt to such changes could seriously harm our business.
Failure of Delivery Infrastructure to Perform Consistently
Our success as a business depends, in part, on our ability to provide consistently high quality online services to users via the delivery infrastructure. There is no guarantee that the Company’s delivery infrastructure and/or its software will not experience problems or other performance issues. If the delivery infrastructure or software fails or suffers performance problems, then it would likely affect the quality and interrupt the continuation of our services and significantly harm the business.
The Company’s delivery infrastructure is susceptible to natural or man-made disasters such as earthquakes, floods, fires, power loss and sabotage, as well as interruptions from technology malfunctions, computer viruses and hacker attacks. Other potential service interruptions may result from unanticipated demands on network infrastructure, increased traffic or problems in customer service. Significant disruptions in the delivery infrastructure could harm the Company’s goodwill and its brands and ultimately could significantly and negatively impact the amount of revenue it may earn from its service. Like all Internet transmissions, our services may be subject to interception and malicious attack. Pirates may be able to obtain or copy our products without paying fees. The delivery infrastructure is exposed to spam, viruses, worms, trojan horses, malware, spyware, denial of service or other attacks by hackers and other acts of malice. The Company uses security measures intended to make theft of its software more difficult. However, if the Company is required to upgrade or replace existing security technology, the cost of such security upgrades or replacements could have a material adverse effect on our financial condition, profitability and cash flows.
Limited Intellectual Property Protection
The Company relies on a combination of copyright and trademark laws, trade secrets, confidentiality procedures and contractual provisions to protect its proprietary rights. In addition, our success may depend, in part, on its ability to obtain patent protection and operate without infringing the rights of third parties. There can be no assurance that, once filed, the Company’s patent applications will be successful, that we will develop future proprietary products that are patentable, that any issued patents will provide us with any competitive advantages or will not be successfully challenged by any third parties or that the patents of others will not have an adverse effect on the ability of the Company to do business. In addition, there can be no assurance that others will not independently develop similar products, duplicate some or all of our products or, if patents are issued, design their products so as to circumvent the patent protection held by the Company. We protect our product documentation and other written materials under trade secret and copyright laws which afford only limited protection. Despite precautions taken by the Company, it may be possible for unauthorized third parties to copy aspects of our business and marketing plans or future strategic documents or to obtain and use information that we regard as proprietary. There can be no assurance that the Company’s means of protecting its proprietary rights will be adequate or that our competitors will not independently develop similar or superior technology. Litigation may be necessary in the future to enforce our intellectual property rights, to protect trade secrets or to determine the validity and scope of the propriety rights of others. Such litigation could result in substantial costs and diversion of resources, and there can be no guarantee of the ultimate success thereof.
Government Regulation and Licensing
The Company’s operations may be subject to Canadian and foreign provincial and/or state and federal regulations and licensing. There can be no assurance that we will be able to comply with the regulations or secure and maintain the required licensing for its operations. Government regulation and licensing could seriously impact our ability to achieve its financial and operational objectives. The Company is subject to local, provincial and/or state, federal, and international laws affecting companies conducting business on the Internet, including user privacy laws, laws giving special protection to children, regulations prohibiting unfair and deceptive trade practices and laws addressing issues such as freedom of expression, pricing and access charges, quality of products and services, taxation, advertising, intellectual property rights and information security. The restrictions imposed by and the costs of complying with, current and possible future laws and regulations related to its business could limit our growth and reduce client base and revenue.
Operating in Foreign Jurisdictions
The Company’s current and future development opportunities relate to geographical areas outside of Canada. There are a number of risks inherent in international business activities, including government policies concerning the import and export of goods and services, costs of localizing products and subcontractors in foreign countries, costs associated with the use of foreign agents, potentially adverse tax consequences, limits on repatriation of earnings, the burdens of complying with a wide variety of foreign laws, nationalization and possible social, labour, political and economic instability. There can be no assurance that such risks will not adversely affect the business, financial condition and results of operations. Furthermore, a portion of expenditures and revenues will be in currencies other than the Canadian Dollar. Foreign exchange exposure may change over time with changes in the geographic mix of its business activities. Foreign currencies may be unfavourably impacted by global developments, country-specific events and many other factors. As a result, future results may be adversely affected by significant foreign exchange fluctuations.
Economic Conditions
Unfavorable economic and market conditions could increase our financing costs, reduce demand for our products and services, limit access to capital markets and negatively impact any access to future credit facilities. Expenditures by educational institution, government and corporation tend to be cyclical, reflecting overall economic conditions as well as budgeting and purchasing patterns.
Working Capital
We may need to raise additional funds in order to finance our operations and growth strategy. The Company expects that corporate growth will be funded from cash flow equity and/or debt financing(s) to help generate any required capital. Insuring that capital is available to increase production; sales and marketing capacity; and to provide support materials and training in the market place and to expand is essential to success. There can be no assurance that financing will be available on terms favorable to us, or at all. If adequate funds are not available on acceptable terms, we may be forced to curtail or cease our operations. Even if we are able to continue our operations, the failure to obtain financing could have a substantial adverse effect on our business and financial results.
Uncertainty of Assumptions Underlying Business Plan
The Company’s business plan is based upon numerous assumptions that may later prove to be incorrect. The Company’s ability to adhere to its business plan will depend upon a variety of factors, many of which are beyond the Company’s control. Likewise, the Company’s management is not bound to follow its business plan, and may elect to adopt other strategies and courses of action based upon changes in circumstances and/or market conditions. The Company cannot assure that the actual results of the Company’s operations will materially conform to its business plan.
Success Dependent on Key Management Personnel
The success of the Company is highly dependent on the skills, experience and successful performance of the Company’s management team. The loss of such services could adversely affect development of the Company’s business, revenues, cash flows and profitability.
Managing Growth
The Company must expand its business to achieve greater profitability. Any further expansion of the Company’s business may strain its current managerial, financial, operational, and other resources. Success in managing this expansion and growth will depend, in part, upon the ability of senior management to manage growth effectively. Any failure to do so may lead to inefficiencies and redundancies, and result in reduced growth prospects. As a result, the Company’s profitability, if any, may be curtailed or eliminated.
Supply Failures
The Company relies on third parties for the timely supply of maintenance services. Although the Company actively manages these third party relationships to ensure continuity of services on time and to its required specifications, some events beyond its control could result in the complete or partial failure of services or services not being delivered on time. Any such failure could negatively affect the Company’s operating results.
Our Public Trading Market is Highly Volatile
The Company's common shares trade on the TSX Venture Exchange under the symbol "LM", and on the OTCQBOTC Markets under the symbol “LMDCF”.
The market price of our common shares could fluctuate substantially due to:
■ | Quarterly fluctuations in operating results; |
■ | Announcements of new products or services by us or our competitors; |
■ | Technological innovations by us or our competitors; |
■ | General market conditions or market conditions specific to our or our customer’s industries; or |
■ | Changes in earning estimates or recommendations by analysts. |
Penny Stock Rules
Our common shares are quoted on the OTCQBOTC Marketplace; a FINRA sponsored and operated quotation system for equity securities. It is a more limited trading market than the NASDAQ, and timely, accurate quotations of the price of our common shares may not always be available. You may expect trading volume to be low in such a market. Consequently, the activity of only a few shares may affect the market and may result in wide swings in price and in volume.
Our common shares are listed on the OTCQBOTC Marketplace, and are subject to the requirements of Rule 15(g)- 9, promulgated under the Securities Exchange Act as long as the price of our common shares is below $5.00 per share. Under such rule, broker-dealers who recommend low-priced securities to persons other than established customers and accredited investors must satisfy special sales practice requirements, including a requirement that they make an individualized written suitability determination for the purchaser and receive the purchaser’s consent prior to the transaction. The Securities Enforcement Remedies and Penny Stock Reform Act of 1990 also requires additional disclosure in connection with any trade involving a stock defined as a penny stock. Generally, the Commission defines a penny stock as any equity security not traded on an exchange or quoted on NASDAQ that has a market price of less than $5.00 per share. The required penny stock disclosures include the delivery, prior to any transaction, of a disclosure schedule explaining the penny stock market and the risks associated with it. Such requirements could severely limit the market liquidity of the securities and the ability of purchasers to sell their securities in the secondary market.
The stock market has experienced significant price and volume fluctuations, and the market prices of companies, have been highly volatile. Investors may not be able to sell their shares at or above the then current, OTCQBOTC price. In addition, our results of operations during future fiscal periods might fail to meet the expectations of stock market analysts and investors. This failure could lead the market price of our common shares to decline.
There is Uncertainty as to the Company’s Shareholders’ Ability to Enforce Civil Liabilities Both Within and Outside of the United States
The preponderance of our assets are located outside the United States and are held through companies incorporated under the laws of Canada, Hong Kong, China, and the United Kingdom and representative office in China. In addition, all of our directors and officers are nationals and/or residents of countries other than the United States. All or a substantial portion of the assets of these persons are located outside the United States. As a result, it may be difficult for shareholders to effect service of process within the United States upon these persons. In addition, investors may have difficulty enforcing, both in and outside the United States, judgments based upon the civil liability provisions of the securities laws of the United States or any State thereof.
ITEM 4. INFORMATION ON THE COMPANY
4.A. History and Development of the Company
Incorporation and Name Changes
The Company was incorporated under the name Alpha Publishing Inc. pursuant to the Business Corporations Act (Alberta) on April 22, 1996. The name was changed to Alpha Ventures Inc. on May 24, 1996. Pursuant to Articles of Continuance effective April 22, 1998, the Company was continued as an Ontario company under the provisions of the Business Corporations Act (Ontario) under the name, Alpha Communications Corp. The name was changed to Lingo Media Inc. on July 4, 2000, and changed to Lingo Media Corporation on October 16, 2007.
The Company currently has two active segments: Lingo Learning Inc. ("LLI") and ELL Technologies Ltd. (“ELL Technologies”)
Lingo Learning Inc. was incorporated pursuant to the Business Corporations Act (Ontario) on November 21, 1994 under the name Alpha Corporation. Alpha Corporation changed its name to Lingo Media Ltd. on August 25, 2000 and again on March 6, 2008 to Lingo Learning Inc.
ELL Technologies Limited was incorporated pursuant to the Companies Act of United Kingdom under the name The Q Group Limited. On April 29, 2010, the Company changed its name to ELL Technologies Limited.
ELL Technologies Ltd. was incorporated pursuant to the Business Corporations Act (Ontario) on February 23, 2012 under the name 2318041 Ontario Inc. 2318041 Ontario Inc. changed its name to ELL Technologies Ltd. on January 15, 2014.
Speak2Me Inc. was incorporated pursuant to the Business Corporations Act (Ontario) on February 22, 2007.
Parlo Corporation was incorporated pursuant to the Business Corporations Act (Ontario) on September 24, 2009.
The Company’s Executive Office is located at:
151 Bloor Street West
Suite 703
Toronto, Ontario, Canada M5S 1S4
Telephone: (416) 927-7000
Facsimile: (416) 927-1222
E-mail: investor@lingomedia.com
Website:www.lingomedia.com
The Company’s Beijing Representative Office is located at:
#55 Middle Road East Third Ring,
Tower B, Fuli Twins Tower, Suite 1805
Chaoyang District,
Beijing China 100022
The Company's fiscal year ends on December 31st.
The Company's common shares trade on the TSX Venture Exchange under the symbol "LM", on the OTCQBOTC under the symbol “LMDCF” and are quoted on the Berlin-Bremen Stock Exchange under the symbol “LIM.BE” and the German securities code is (WKN) 121226.
4.B. BUSINESS OVERVIEW
Background
Lingo Media (“Lingo Media,” the “Company,” “we” or ”us”) is an EdTech company that is ‘Changing the way the world learns English’ through the combination of education with technology. The Company is focused on online and print-based technologies and solutions through its two subsidiaries: Lingo Learning Inc. (Lingo Learning”) and ELL Technologies Ltd. (“ELL Technologies”). Through its two distinct business units, Lingo Media develops, markets and supports a suite of English language learning solutions consisting of web-based software licensing subscriptions, online and professional services, audio practice tools and multi-platform applications. The Company continues to operate its legacy textbook publishing business from which it collects recurring royalty revenues.
Lingo Media’s two distinct business units include ELL Technologies and Lingo Learning. ELL Technologies is a global web-based educational technology (“EdTech”) English language learning training and assessment company that creates innovative Software-as-a-Service eLearning solutions. Lingo Learning is a print-based publisher of English language learning textbook programs in China. Lingo Media has formed successful relationships with key government and industry organizations, establishing a strong presence in China’s education market of more than 300 million students. The Company is extending its global reach, with an initial market expansion into Latin America and continues to expand its product offerings and technology applications.
As of December 31, 2015,2017, the Company operated two distinct business segments as follows:
Print-Based English Language Learning
The Company continues to maintain its legacy textbook publishing business through Lingo Learning, a print-based publisher of English language learning programs in China since 2001. Lingo Learning has an established presence in China’s education market of over 300 million students. To date, it has co-published more than 550600 million units from its library of program titles.
China Publishing
Lingo Media has spent 1517 years developing English Language Learning (ELL), products, programs, and relationships in the Chinese market. Learning to communicate in English is seen as a top priority for Chinese school students and young adult learners. Along with learning how to use a PC, English skills are perceived as a key determinant of their future levels of prosperity. The Company’s ELL books, audio and CD-based programs are unique in that they have a special focus on the spoken language. In addition to developing learning materials, considerable resources have been expended on the development of relationships with leading Chinese publishers, both in the education and trade sectors, as well as in extensive marketing of Lingo Media’s programs.
The Company is capitalizing on its co-development approach in the Chinese market. Lingo Media sees its relationships with leading Chinese publishers; its Canadian and Chinese author teams; and its original custom-developed content as key factors in opening up the Chinese educational market. The Company has secured long-term publishing contracts for the Kindergarten to Grade 12 (K-12) and higher educational markets, which it anticipates will generate ongoing revenue streams from the sale of its programs.
Co-Publishing Partner in China
People's Education Press
People's Education Press (“PEP”) a division of China's State Ministry of Education, publishes more than 60% of educational materials for the Kindergarten to Grade 12 (“K-12”) market throughout China, for all subjects, including English Language Learning. PEP has a readership of more than 120 million students. Lingo Learning has two programs with PEP. These series target the elementary market of 100 million students:PEP Primary English (for Grades 3-6; Chinese students now begin learning English in Grade 3); andStarting Line (Grades 1-6); All series include the core textbooks in addition to supplemental activity books, audiocassettes, teacher resource books, and other materials.
Seasonality
The Company may experience some seasonal trends in the sale of its publications. For example, sales of educational published materials experience seasonal fluctuations with higher sales in the Spring (second calendar quarter) and Fall (fourth calendar quarter).
Online English Language Learning(See MDA p4 – 5)
ELL Technologies, acquired in 2010, now offers over 2,000 hours of interactive learning through a number of product offerings that includeWinnie’s World, English Academy, Scholar,Campus,English for Success, Master andBusinessEnglish for Success (targeting Corporations), in addition to offering custom solutions. ELL Technologies is primarily marketed in Latin America through a network of distributors and earns its revenues from licensing and subscription fees from its suite of web-based EdTech language learning products and applications.
To further leverage its Speak2Me lesson and technology platform, the Company acquired Parlo in 2009 to expand its online offerings to include fee-based spoken English training solutions for corporations, governments, and educational institutions. This fee-based training service incorporates a reporting platform in the form of a Learning Management System for human resources administrators. Parlo’s spoken language learning platform has now been integrated into ELL Technologies.
| | | | | | |
 |  |  |  |  |  |
At the time of the acquisition, ELL Technologies had an extensive existing product line which required substantial revisions in the technology platform and user interface. Over the past fewthree years, our development team has engineered an eLearning platform and has been introducing new products to the market since the beginning of 2015, integrating cutting-edge technologies, solutions, content and pedagogy.
ELL Technologies’ high-tech, easy to implement eLearning software-as-a-Service solutions have positioned the Company to teach the world English. As a result of ongoing investment into product development, we are able to provide learners of all ages and levels of English proficiency with a platform to further their language learning development. See our “Correlation Table” below:
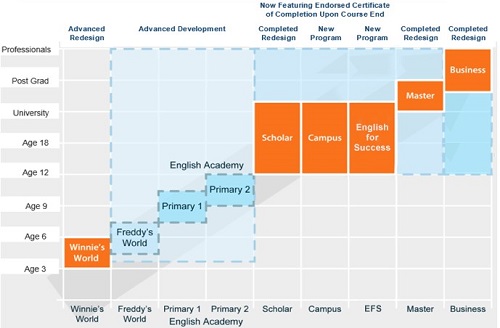
The horizontal axis contains our product line and correlates to the vertical axis which contains the ages and levels of proficiency that the product has been designed for.
Segmented Information (Before Other Financial Items Below)
2017 | Online English Language Learning | Print-Based English Language Learning | Total | |||||||||
Segmented assets | $ | 223,542 | $ | 1,310,530 | $ | 1,534,072 | ||||||
Segmented liabilities | 458,698 | 521,620 | 980,318 | |||||||||
Segmented revenue | 1,088,197 | 1,688,571 | 2,776,768 | |||||||||
Segmented direct costs | 134,695 | 90,923 | 225,618 | |||||||||
Segmented selling, general & administrative | 1,420,502 | 679,908 | 2,100,407 | |||||||||
Segmented intangible amortization | 1,051,928 | - | 1,051,928 | |||||||||
Segmented other expense | 1,502 | 280,908 | 282,410 | |||||||||
Segmented profit (loss) | (6,380,956 | ) | 734,579 | (5,646,377 | ) | |||||||
2016 | Online English Language Learning | Print-Based English Language Learning | Total | |||||||||
Segmented assets | $ | 5,043,729 | $ | 2,132,463 | $ | 7,176,192 | ||||||
Segmented liabilities | 326,463 | 404,696 | 731,159 | |||||||||
Segmented revenue | 1,456,421 | 1,738,800 | 3,195,221 | |||||||||
Segmented direct costs | 167,597 | 217,787 | 385,384 | |||||||||
Segmented selling, general & administrative | 625,512 | 739,224 | 1,364,736 | |||||||||
Segmented intangible amortization | 1,003,485 | - | 1,003,485 | |||||||||
Segmented other expense | 1,513 | 193,489 | 195,002. | |||||||||
Segmented profit (loss) | (341,660 | ) | 588,274 | 246,614 | ||||||||
Segmented intangible addition | 1,798,687 | - | 1,798,687 | |||||||||
2015 | Online English Language Learning | Print-Based English Language Learning | Total | |||||||||
Segmented assets | 3,756,913 | 1,476,038 | 5,232,951 | |||||||||
Segmented liabilities | 717,139 | 469,028 | 1,186,167 | |||||||||
Segmented revenue | 2,954,614 | 1,971,121 | 4,925,735 | |||||||||
Segmented direct costs | 276,049 | 106,822 | 382,871 | |||||||||
Segmented selling, general & administrative | 337,756 | 721,947 | 1,059,703 | |||||||||
Segmented intangible amortization | 721,720 | - | 721,720 | |||||||||
Segmented other expense | 3,097 | 315,771 | 318,868 | |||||||||
Segmented profit | 1,615,992 | 826,581 | 2,442,573 | |||||||||
Segmented intangible addition | 2,071,440 | - | 2,071,440 | |||||||||
2014 | Online English Language Learning | Print-Based English Language Learning | Total | |||||||||
Segmented assets | $ | 1,407,525 | $ | 1,015,913 | $ | 2,423,438 | ||||||
Segmented liabilities | 623,349 | 1,056,134 | 1,679,483 | |||||||||
Segmented revenue | 831,650 | 1,680,814 | 2,512,464 | |||||||||
Segmented direct costs | 286,945 | 95,649 | 382,594 | |||||||||
Segmented selling, general & administrative | 307,361 | 642,868 | 950,229 | |||||||||
Segmented intangible amortization | 582,857 | - | 582,857 | |||||||||
Segmented other expense | 3,652 | 272,853 | 276,505 | |||||||||
Segmented profit (loss) | (349,165 | ) | 669,444 | 320,279 | ||||||||
Segmented intangible addition | 544,635 | - | 544,635 | |||||||||
2013 | Online English Language Learning | Print-Based English Language Learning | Total | |||||||||
Segmented assets | $ | 1,215,023 | $ | 999,567 | $ | 2,214,590 | ||||||
Segmented liabilities | 496,975 | 1,206,728 | 1,703,703 | |||||||||
Segmented revenue | 466,869 | 1,541,197 | 2,008,066 | |||||||||
Segmented direct costs | 153,200 | 42,124 | 195,324 | |||||||||
Segmented selling, general & administrative | 295,893 | 645,569 | 941,462 | |||||||||
Segmented intangible amortization | 431,049 | - | 431,049 | |||||||||
Segmented other expense | 6,171 | 243,119 | 249,290 | |||||||||
Segmented income (loss) | (419,444 | ) | 610,385 | 190,941 | ||||||||
Segmented intangible addition | 431,711 | - | 431,711 | |||||||||
2013 | Online English Language Learning | Print-Based English Language Learning | Total | |||||||||
Segmented assets | $ | 1,215,023 | $ | 999,567 | $ | 2,214,590 | ||||||
Segmented liabilities | 496,975 | 1,206,728 | 1,703,703 | |||||||||
Segmented revenue | 466,869 | 1,541,197 | 2,008,066 | |||||||||
Segmented direct costs | 153,200 | 42,124 | 195,324 | |||||||||
Segmented selling, general & administrative | 295,893 | 645,569 | 941,462 | |||||||||
Segmented intangible amortization | 431,049 | - | 431,049 | |||||||||
Segmented other expense | 6,171 | 243,119 | 249,290 | |||||||||
Segmented profit (loss) | (419,444 | ) | 610,385 | 190,941 | ||||||||
Segmented intangible addition | 431,711 | - | 431,711 | |||||||||
2012 | Online English Language Learning | Print-Based English Language Learning | Total | |||||||||
Segmented assets | $ | 1,269,953 | $ | 1,390,695 | $ | 2,660,648 | ||||||
Segmented liabilities | 814,887 | 1,428,469 | 2,243,356 | |||||||||
Segmented revenue | 680,321 | 1,335,940 | 2,016,261 | |||||||||
Segmented direct costs | 261,341 | 11,714 | 273,055 | |||||||||
Segmented selling, general & administrative | 1,014,346 | 1,106,890 | 2,121,236 | |||||||||
Segmented intangible amortization | 365,752 | - | 365,752 | |||||||||
Segmented other expense | 8,415 | 223,411 | 231,826 | |||||||||
Segmented income (loss) | (969,533 | ) | (6,075 | ) | (975,608 | ) | ||||||
Segmented intangible addition | 143,215 | - | 143,215 | |||||||||
2011 | Online English Language Learning | Print-Based English Language Learning | Total | |||||||||
Segmented assets | $ | 1,610,229 | $ | 1,438,946 | $ | 3,049,175 | ||||||
Segmented liabilities | 656,422 | 942,919 | 1,599,341 | |||||||||
Segmented revenue | 829,589 | 1,237,380 | 2,066,969 | |||||||||
Segmented direct costs | 168,013 | (26,264 | ) | 141,749 | ||||||||
Segmented selling, general & administrative | 1,474,810 | 865,745 | 2,340,555 | |||||||||
Segmented intangible amortization | 2,544,818 | - | 2,544,818 | |||||||||
Segmented other expense | 891,386 | 213,991 | 1,105,377 | |||||||||
Segmented income (loss) | (4,074,438 | ) | (743,938 | ) | (4,818,376 | ) | ||||||
Segmented intangible addition | 138,681 | - | 138,681 | |||||||||
Other Financial Items | 2015 | 2014 | 2013 | 2012 | 2011 | 2017 | 2016 | 2015 | 2014 | 2013 | ||||||||||||||||||||||||||||||
Print-Based English Language Learning segmented income (loss) | $ | 826,581 | $ | 669,444 | $ | 610,385 | $ | (6,075 | ) | $ | 183,908 | |||||||||||||||||||||||||||||
Print-Based English Language Learning segmented income | $ | 734,579 | $ | 588,274 | $ | 826,581 | $ | 669,444 | $ | 610,385 | ||||||||||||||||||||||||||||||
Online English Language Learning segmented income (loss) | 1,615,992 | (349,165 | ) | (419,444 | ) | (969,533 | ) | (4,074,438 | ) | (6,380,958 | ) | (341,660 | ) | 1,615,992 | (349,165 | ) | (419,444 | ) | ||||||||||||||||||||||
Foreign exchange gain | 399,314 | 106,437 | 134,444 | 25,046 | 19,709 | |||||||||||||||||||||||||||||||||||
Foreign exchange gain (loss) | (189,783 | ) | (146,599 | ) | 399,314 | 106,437 | 134,444 | |||||||||||||||||||||||||||||||||
Interest and other financial | (158,792 | ) | (217,040 | ) | (240,516 | ) | (168,769 | ) | (328,112 | ) | (53,709 | ) | (35,768 | ) | (158,792 | ) | (217,040 | ) | (240,516 | ) | ||||||||||||||||||||
Share-based payments | (151,038 | ) | (65,663 | ) | (61,926 | ) | (243,195 | ) | (518,114 | ) | (371,513 | ) | - | (151,038 | ) | (65,663 | ) | (61,926 | ) | |||||||||||||||||||||
Other comprehensive loss | (157,358 | ) | (36,607 | ) | (79,274 | ) | (2,211 | ) | (82,579 | ) | (1,410 | ) | 60,173 | (157,358 | ) | (36,607 | ) | (79,274 | ) | |||||||||||||||||||||
Total ComprehensiveIncome /(Loss) | $ | 2,374,699 | $ | 107,406 | $ | (56,331 | ) | $ | (1,364,737 | ) | $ | (4,799,626 | ) | $ | (6,262,792 | ) | $ | 124,420 | $ | 2,374,699 | $ | 107,406 | $ | (56,331 | ) | |||||||||||||||
Revenue by Geographic Region
2015 | 2014 | 2013 | 2012 | 2011 | 2017 | 2016 | 2015 | 2014 | 2013 | |||||||||||||||||||||||||||||||
Latin America | $ | 2,660,535 | $ | 424,892 | $ | 60,966 | $ | 126,957 | $ | 2,328 | $ | 997,661 | $ | 821,762 | $ | 2,660,535 | $ | 424,892 | $ | 60,966 | ||||||||||||||||||||
China | 2,069,253 | 1,822,660 | 1,543,753 | 1,366,415 | 1,320,945 | 1,712,079 | 2,252,170 | 2,069,253 | 1,822,660 | 1,543,753 | ||||||||||||||||||||||||||||||
Other | 195,947 | 264,912 | 403,347 | 522,889 | 743,696 | 67,028 | 121,289 | 195,947 | 264,912 | 403,347 | ||||||||||||||||||||||||||||||
| $ | 4,925,735 | $ | 2,512,464 | $ | 2,008,066 | $ | 2,016,261 | $ | 2,066,969 | $ | 2,776,768 | $ | 3,195,221 | $ | 4,925,735 | $ | 2,512,464 | $ | 2,008,066 | |||||||||||||||||||||
IdentifiableNon-CurrentAssets by Geographic Region
2015 | 2014 | 2013 | 2012 | 2011 | ||||||||||||||||
Canada | $ | 2,374,241 | $ | 1,004,424 | $ | 1,024,169 | $ | 2,626,632 | $ | 2,923,211 | ||||||||||
China | - | 7,598 | 24,270 | 34,016 | 121,964 | |||||||||||||||
| $ | 2,374,241 | $ | 1,012,022 | $ | 1,048,439 | $ | 2,660,648 | $ | 3,049,175 | |||||||||||
Intangibles | Software and Web Development | Content Platform | Customer Relationships | Content Development | Total | |||||||||||||||
Cost, January 1, 2011 | $ | 6,523,227 | $ | 1,477,112 | $ | 130,000 | $ | - | $ | 8,130,339 | ||||||||||
Additions | 126,472 | - | - | - | 126,472 | |||||||||||||||
Cost, December 31, 2011 | 6,649,699 | 1,477,112 | 130,000 | - | 8,256,811 | |||||||||||||||
Additions | 142,464 | - | - | - | 142,464 | |||||||||||||||
Cost, December 31, 2012 | 6,792,163 | 1,477,112 | 130,000 | - | 8,399,275 | |||||||||||||||
Additions | 431,711 | - | - | - | 431,711 | |||||||||||||||
Effect of foreign exchange | 1,191 | - | - | - | 1,191 | |||||||||||||||
Cost, December 31, 2013 | 7,225,065 | 1,477,112 | 130,000 | - | 8,832,117 | |||||||||||||||
Additions | 544,635 | - | - | - | 544,635 | |||||||||||||||
Effect of foreign exchange | 11,911 | - | - | - | 11,911 | |||||||||||||||
Cost, December 31, 2014 | 7,781,611 | 1,477,112 | 130,000 | - | 9,388,723 | |||||||||||||||
Additions | 782,945 | - | - | 1,288,495 | 2,071,440 | |||||||||||||||
Effect of foreign exchange | 66,450 | - | - | - | 66,450 | |||||||||||||||
Cost, December 31, 2015 | $ | 8,631,006 | $ | 1,477,112 | $ | 130,000 | $ | 1,288,495 | $ | 11,526,613 | ||||||||||
2017 | 2016 | 2015 | 2014 | 2013 | ||||||||||||||||
Canada | $ | 29,804 | $ | 3,467,115 | $ | 2,374,241 | $ | 1,004,424 | $ | 1,024,169 | ||||||||||
China | 885 | - | - | 7,598 | 24,270 | |||||||||||||||
| $ | 30,689 | $ | 3,467,115 | $ | 2,374,241 | $ | 1,012,022 | $ | 1,048,439 | |||||||||||
Intangibles | Software and Web Development | Content Platform | Customer Relationships | Content Development | Total | |||||||||||||||
Accumulated depreciation, January 31, 2011 | $ | 3,695,622 | $ | 174,792 | $ | 130,000 | $ | - | $ | 4,000,414 | ||||||||||
Charge for the year | 2,184,396 | 295,422 | 2,479,818 | |||||||||||||||||
Impairment Loss | 703,600 | 703,600 | ||||||||||||||||||
Accumulated depreciation, December 31, 2011 | 6,583,618 | 470,214 | 130,000 | - | $ | 7,183,832 | ||||||||||||||
Charge for the year | 42,978 | 296,232 | - | - | 339,210 | |||||||||||||||
Accumulated depreciation, December 31, 2012 | 6,626,596 | 766,446 | 130,000 | - | 7,523,042 | |||||||||||||||
Charge for the year | 135,627 | 295,422 | - | - | 431,049 | |||||||||||||||
Effect of foreign exchange | 1,191 | - | - | - | 1,191 | |||||||||||||||
Accumulated depreciation, December 31, 2013 | 6,763,414 | 1,061,868 | 130,000 | - | 7,955,282 | |||||||||||||||
Charge for the year | 287,435 | 295,422 | - | - | 582,857 | |||||||||||||||
Effect of foreign exchange | 2,986 | - | - | - | 2,986 | |||||||||||||||
Accumulated depreciation, December 31, 2014 | 7,053,835 | 1,357,290 | 130,000 | - | 8,541,125 | |||||||||||||||
Charge for the year | 510,366 | 119,822 | - | 91,532 | 721,720 | |||||||||||||||
Effect of foreign exchange | 58,024 | - | - | - | 58,024 | |||||||||||||||
Accumulated depreciation, December 31, 2015 | $ | 7,622,225 | $ | 1,477,112 | $ | - | $ | 91,532 | $ | 9,320,869 | ||||||||||
Net book value, December 31, 2011 | $ | 66,081 | $ | 1,006,898 | $ | 26,542 | $ | - | 1,099,521 | |||||||||||
Net book value, December 31, 2012 | $ | 165,567 | $ | 710,666 | $ | - | $ | - | 876,233 | |||||||||||
Net book value, December 31, 2013 | $ | 461,651 | $ | 415,244 | $ | - | $ | - | 876,895 | |||||||||||
Net book value, December 31, 2014 | $ | 727,776 | $ | 119,822 | $ | - | $ | - | 847,598 | |||||||||||
Net book value, December 31, 2015 | $ | 1,008,781 | $ | - | $ | - | $ | 1,196,963 | $ | 2,205,744 | ||||||||||
Intangibles | Software and Web Development | Content Platform | Content Development | Total | ||||||||||||
Cost, January 1, 2013 | $ | 6,792,163 | $ | 1,477,112 | $ | - | $ | 8,269,275 | ||||||||
Additions | 431,711 | - | - | 431,711 | ||||||||||||
Effect of foreign exchange | 1,191 | - | 1,191 | |||||||||||||
Cost, December 31, 2013 | 7,225,065 | 1,477,112 | - | 8,702,177 | ||||||||||||
Additions | 544,635 | - | - | 544,635 | ||||||||||||
Effect of foreign exchange | 11,911 | - | - | 11,911 | ||||||||||||
Cost, December 31, 2014 | 7,781,611 | 1,477,112 | - | 9,258,723 | ||||||||||||
Additions | 782,945 | - | 1,288,495 | 2,071,440 | ||||||||||||
Effect of foreign exchange | 66,450 | - | - | 66,450 | ||||||||||||
Cost, December 31, 2015 | 8,631,006 | 1,477,112 | 1,288,495 | 11,396,613 | ||||||||||||
Additions | 613,163 | - | 1,185,525 | 1,798,687 | ||||||||||||
Effect of foreign exchange | (5,081 | ) | - | - | (5,081 | ) | ||||||||||
Cost, December 31, 2016 | 9,239,088 | 1,477,112 | 2,474,020 | 13,190,219 | ||||||||||||
| Cost, December 31, 2017 | $ | 9,239,088 | $ | 1,477,112 | $ | 2,474,020 | $ | 13,190,219 | ||||||||
Intangibles | Software and Web Development | Content Platform | Content Development | Total | ||||||||||||
Accumulated depreciation, January 1, 2013 | $ | 6,626,596 | $ | 766,446 | $ | - | $ | 7,523,042 | ||||||||
Charge for the year | 135,627 | 295,422 | - | 431,049 | ||||||||||||
Effect of foreign exchange | 1,191 | - | - | 1,191 | ||||||||||||
Accumulated depreciation, December 31, 2013 | 6,763,414 | 1,061,868 | - | 7,955,282 | ||||||||||||
Charge for the year | 287,435 | 295,422 | - | 582,857 | ||||||||||||
Effect of foreign exchange | 2,986 | - | - | 2,986 | ||||||||||||
Accumulated depreciation, December 31, 2014 | 7,053,835 | 1,357,290 | - | 8,411,125 | ||||||||||||
Charge for the year | 510,366 | 119,822 | 91,532 | 721,720 | ||||||||||||
Effect of foreign exchange | 58,024 | - | - | 58,024 | ||||||||||||
Accumulated depreciation, December 31, 2015 | 7,622,225 | 1,477,112 | 91,532 | 9,190,869 | ||||||||||||
Charge for the year | 611,865 | - | 391,620 | 1,003,485 | ||||||||||||
Effect of foreign exchange | (4,144 | ) | - | - | (4,144 | ) | ||||||||||
Accumulated depreciation, December 31, 2016 | 8,229,946 | 1,477,112 | 483,152 | 10,190,210 | ||||||||||||
Charge for the year | 557,124 | - | 494,804 | 1,051,928 | ||||||||||||
Impairment | 452,018 | - | 1,496,064 | 1,948,082 | ||||||||||||
Accumulated depreciation, December 31, 2017 | $ | 9,239,088 | $ | 1,477,112 | $ | 2,474,020 | $ | 13,190,219 | ||||||||
Net book value, December 31, 2013 | $ | 461,651 | $ | 415,244 | $ | - | $ | 876,895 | ||||||||
Net book value, December 31, 2014 | $ | 727,776 | $ | 119,822 | $ | - | $ | 847,598 | ||||||||
Net book value, December 31, 2015 | $ | 1,008,781 | $ | - | $ | 1,196,963 | $ | 2,205,744 | ||||||||
Net book value, December 31, 2016 | $ | 1,009,142 | $ | - | $ | 1,990,867 | $ | 3,000,009 | ||||||||
Net book value, December 31, 2017 | $ | - | $ | - | $ | - | $ | - | ||||||||
The Company began commercial production and sale of its services and products during 2009. In 2015,2017, the Company focusedcontinued to focus on the redesign and upgrade of its ELL Technologies’ suite of products and invested $2,071,440 (2014$Nil (2016 - $544,635)$1,798,687). The ELL Technologies’ suite of products includes sixfive different products, each designed to suit the needs of different demographic groups.Althoughgroups.Although the full suite of product is not yet complete, the Company has started the commercial production and sale of fivethree of these products. No impairment was recognized in 2014 or 2015.
4.C. Organization Structure
See 4.A. “History and Development of the Company” for more information.
Name of subsidiary | Principal activity | Place of incorporation and operation | Proportion of ownership interest and voting rights held | Principal activity | Place of incorporation | Proportion of ownership interest and voting rights held | ||||||||||||||||||
December 31, 2015 | December 31, 2014 | December 31, 2013 | and operation | December 31, 2017 | December 31, 2016 | December 31, 2015 | ||||||||||||||||||
Lingo Learning Inc. | Developer and publisher of English language learning print and audio-based products | Canada | 100% | 100% | 100% | Developer and publisher of English language learning print and audio-based products | Canada | 100% | 100% | 100% | ||||||||||||||
ELL Technologies Ltd. | English language learning multi-media & online training service | Canada | 100% | 100% | 100% | English language learning multi-media & online training service | Canada | 100% | 100% | 100% | ||||||||||||||
ELL Technologies Limited | English language learning multi-media & online training service | U.K. | 100% | 100% | 100% | English language learning multi-media & online training service | U.K. | 100% | 100% | 100% | ||||||||||||||
Speak2Me Inc. | Free English language learning online service | Canada | 100% | 100% | 100% | Free English language learning online service | Canada | 100% | 100% | 100% | ||||||||||||||
Parlo Corporation | Fee-based online English language learning training and assessment service | Canada | 100% | 100% | 100% | Fee-based online English language learning training and assessment service | Canada | 100% | 100% | 100% | ||||||||||||||
4.D. Property and Equipment
The Company’s executive offices are located in rented premises of approximately 4,270 sq. ft. at 151 Bloor Street West, Suite 703, Toronto, Ontario, M5S 1S4 Canada. The Company began occupying these facilities, through its subsidiary Lingo Learning Inc. in March 2006.
The Company’s Beijing representative offices are located in rented premises of approximately 2,174 sq. ft. at #55 Middle Road East Third Ring, Tower B, Fuli Twins Tower, Suite 1805, Chaoyang District Beijing, China, 100022
The Company has office equipment, furniture and computer equipment located in these offices and for the fiscal years ended December 31, 2017, 2016, 2015, 2014, 2013, 2012, and 2011,2013, they have a net carrying value of $30,689, $27,488, $28,879, $24,806, $31,926, $38,356, and $48,321,$31,926, respectively.
ITEM 4A. UNRESOLVED STAFF COMMENTS
None.
ITEM 5. OPERATING AND FINANCIAL REVIEW AND PROSPECTS
The following discussion for the fiscal years ended December 31, 2015,2017, December 31, 2014,2016, and December 31, 20132015 should be read in conjunction with the consolidated financial statements of the Company and the notes thereon.
The following discussion contains forward-looking statements that are subject to significant risks and uncertainties. Readers should carefully review the risk factors described herein and in other documents the Company files from time to time with the Securities and Exchange Commission.
5.A Overview
Critical Accounting Policies and Estimates
BASIS OF PREPARATION
Statement ofCompliance
These consolidated financial statements of the Company have been prepared in accordance with International Financial Reporting Standards (“IFRS”) as issued by the International Accounting Standards Board (“IASB”) and interpretations of the IFRS Interpretations Committee (“IFRIC”).
Basis ofMeasurement
These consolidated financial statements have been prepared on the historical cost basis except as provided in note 4. The comparative figures presented in these consolidated financial statements are in accordance with the same accounting policies.
Basis ofConsolidation
The consolidated financial statements comprise the financial statements of the Company and its wholly owned subsidiaries controlled by the Company (the “Group”) as at December 31, 2015.2017. Control exists when the Company is exposed to, or has the rights to variable returns from its involvement with the entity and has the ability to affect these returns through its power over the entity.
Subsidiaries are fully consolidated from the date of acquisition, being the date on which the Group obtains control, and continue to be consolidated until the date when such control ceases. The financial statements of the subsidiaries are prepared for the same reporting period as the parent company, using consistent accounting policies. All inter-group balances, transactions, unrealized gains and losses resulting from inter-group transactions and dividends are eliminated in full.
Functional and Presentation Currency
The functional currency is the currency of the primary economic environment in which the entity operates and has been determined for each entity within the Group. These consolidated financial statements are presented in Canadian Dollars, which is the Company’s functional currency. The functional currency of ELL Technologies Limited and Lingo Group Limited are United States Dollar (“USD”). All other subsidiaries’ functional currency is Canadian Dollar (“CAD”).
The functional currency determinations were conducted through an analysis of the consideration factors identified in IAS 21, “The Effects of Changes in Foreign Exchange Rates”.
SIGNIFICANT ACCOUNTING JUDGEMENTS, ESTIMATES AND ASSUMPTIONS
The preparation of the Company’s consolidated financial statements in conformity with IFRS requires management to make judgments, estimates and assumptions that affect the application of accounting policies, reported amounts of assets, liabilities and contingent liabilities, revenues and expenses at the date of the consolidated financial statements and during the reporting period.
Estimates and assumptions are continuously evaluated and are based on management’s historical experience and other factors, including expectations of future events that are believed to be reasonable under the circumstances. However, actual outcomes can differ from these estimates. Revisions to accounting estimates are recognized in the period in which the estimate is revised if the revision affects only that period or in the period of the revision and further periods if the review affects both current and future periods.
Information about critical judgements in applying accounting policies that have the most significant effect on the amounts recognized in the consolidated financial statements is included in the following notes:
● Determination of functional currency
| ● | Determination of functional currency | |
| ● | Determination of allowance for doubtful accounts | |
| ● | Determination of the recoverability of the carrying value of intangibles and goodwill | |
| ● | Recognition of internally developed intangibles | |
| ● | Determination and recognition of long-term revenue contracts | |
| ● | Recognition of government grant and grant receivable | |
| ● | Recognition of deferred tax assets | |
| ● | Valuation of share-based payments | |
| ● | Recognition of provisions and contingent liabilities |
● Determination of the recoverability of the carrying value of intangibles and goodwill
● Recognition of internally developed intangibles
● Determination and recognition of long-term revenue contracts
● Recognition of government grant and grant receivable
● Recognition of deferred tax assets
● Valuation of share-based payments
● Recognition of provisions and contingent liabilities
SUMMARY OF SIGNIFICANT ACCOUNTING POLICIES
Revenue Recognition
Revenue from fee-based English language training and assessment services and licenses are recognized upon delivery based on the terms of the agreement and when the risk of ownership is transferred and collectability is reasonably assured.
When the outcome of long-term service contracts cannot be reliably estimated, all contract related costs are expensed and revenues are recognized only to the extent that those costs are recoverable. When the uncertainties that prevented reliable estimation of the outcome of a contract no longer exist, contract revenue and expenses are recognized using the stage of completion method based on milestones achieved.
Revenue from royalty and licensing sales is recognized based on confirmation of finished products produced by the Company’s co-publishing partners and when collectability is reasonably assured. Royalty revenue from audiovisual products is recognized based on the confirmation of sales by its co-publishing partners, and when collectability is reasonably assured. Royalty revenues are not subject to right of return or product warranties. Revenue from the sale of published and supplemental products is recognized upon delivery and when the risk of ownership is transferred and collectability is reasonably assured.
The Company does not recognize non-monetary revenues until the service received is exchangeexchanged and the amount can be reliably estimated. Non-monetary revenues are measured at the fair value of services received.
Comprehensive Income (loss)
Comprehensive income (loss) measures net earnings for the period plus other comprehensive income. Other comprehensive income (loss) consists of changes in equity from non-owner sources, such as changes to foreign currency translation adjustments of foreign operations during the period. Amounts reported as other comprehensive income are accumulated in a separate component of shareholders’ equity as accumulated other comprehensive income.
Property and Equipment
Property and equipment are initially recorded at cost. AmortizationDepreciation is provided using methods outlined below at rates intended to amortize the cost of assets over their estimated useful lives.
Method | Rate |
| Computer and office equipment | Declining balance 20 % |
Software and Web Development Costs
The Company capitalizes all costs related to the development of its fee-based English Language Learning products and services when the feasibility and profitability of the project can be reasonably considered certain. Expenditure on development activities, whereby research findings are applied to a plan or design for the production of new or substantially improved products and processes, is capitalized if the product or process is technically and commercially feasible and the Group has sufficient resources to complete development. The expenditure capitalized includes the cost of material, and direct labour. Other development expenditure is recognized in the statement of comprehensive income as an expense as incurred. Capitalized development expenditure is stated at cost less accumulated amortization and impairment losses. The software and web development cost are being amortized on a straight-line basis over the useful life of the asset, which is estimated to be 3 years.
Content Development Costs
The Company capitalizes all costs related to content development of its fee-based English Language Learning products and services when the feasibility and profitability of the project can be reasonably considered certain. Expenditure on content development activities, whereby research findings are applied to a plan or design for the production of new or substantially improved products and processes, is capitalized if the product or process is technically and commercially feasible and the Group has sufficient resources to complete development. The expenditure capitalized includes the cost of material, and direct labour. Other development expenditure is recognized in the statement of comprehensive income as an expense as incurred. Capitalized content development expenditure is stated at cost less accumulated amortization and impairment losses. The content development costs are being amortized on a straight-line basis over the useful life of the asset, which is estimated to be 5 years.
Goodwill
Goodwill represents the excess of the purchase price over the fair value of the net identifiable assets of an acquired business.
The Company measures goodwill as the fair value of the consideration transferred including the recognized amount of any non-controlling interest in the venture, less the net recognized amount (fair value) of the identifiable assets acquired and liabilities assumed, all measured as of the acquisition date. When the excess is negative, a bargain purchase gain is recognized immediately in net profit.
The Company elects on a transaction-by-transaction basis whether to measure non-controlling interest at its fair value, or at its proportionate share of the recognized amount of the identifiable net assets, at the acquisition date. Transaction costs, other than those associated with the issue of debt or equity securities, that the Company incurs in connection with a business combination are expensed as incurred.
Government Grants
The Company receives government grants based on certain eligibility criteria for book publishing industry development in Canada. These government grants are recognized quarterly and are recorded as a reduction of general and administrative expenses to offset direct costs funded by the grant.grant during the period in which the criteria to receive the grant is met. The Company records a liability for the repayment of the grants and a charge to operations in the period in which conditions arise that will cause the government grants to be repayable.
Current and Deferred Income Taxes
Income tax on the profit or loss for the periods presented comprises current and deferred tax. Income tax is recognized in profit or loss except to the extent that it relates to items recognized directly in equity, in which case it is recognized in equity. Current tax expense is the expected tax payable on the taxable income for the year, using tax rates enacted or substantively enacted at period end, adjusted for amendments to tax payable with regards to previous years.
Deferred taxation is recognized using the liability method on temporary differences between the carrying amounts of assets and liabilities for financial reporting purposes and the amounts used for taxation purposes.
However, the deferred taxation is not recognized if it arises from initial recognition of an asset or liability in a transaction other than a business combination that at the time of the transaction affects neither accounting nor taxable profit or loss. Deferred taxation is determined using tax rates (and laws) that have been enacted or substantially enacted by the reporting date and are expected to apply when the related deferred tax asset is realized or the deferred tax liability is settled.
A deferred tax asset is recognized to the extent that it is probable that future taxable profits will be available against which the temporary difference can be utilized. Deferred tax assets are reviewed at each reporting date and are reduced to the extent that it is no longer probable that the related tax benefit will be realized.
Deferred income tax is provided on temporary differences arising on investments in subsidiaries, associates and joint ventures, except where the timing of the reversal of the temporary difference is controlled by the Company and it is probable that the temporary difference will not reverse in the foreseeable future.
Deferred tax assets and deferred tax liabilities are offset, if a legally enforceable right exists to offset current income tax assets against current income tax liabilities and the deferred taxes relate to the same taxable entity and the same taxation authority.
Foreign Currency Translation
Foreign currency transactions are initially recorded in the functional currency at the transaction date exchange rate. At the balance sheet date, monetary assets and liabilities denominated in a foreign currency are translated into the functional currency at the reporting date exchange rate. Foreign exchange gains and losses resulting from the settlement of such transactions and from the remeasurement of monetary items at year-end exchange rates are recognized in the income statement.
Non-monetary items measured at historical cost are translated using the historical exchange rate. Non-monetary items measured at fair value are translated using the exchange rates at the date when fair value was determined.
Financial statements of subsidiaries, affiliates and joint ventures for which the functional currency is not the Canadian Dollar are translated into the Canadian Dollar as follows: all asset and liability accounts are translated at the balance sheet exchange rate and all earnings and expense accounts and cash flow statement items are translated at average exchange rates for the period. The resulting translation gains and losses are recorded as foreign currency translation adjustments in other comprehensive income and recorded in accumulated other comprehensive income in equity. On disposal of a foreign operation the cumulative translation differences recognized in equity are reclassified to the statement of comprehensive income and recognized as part of the gain or loss on disposal. Goodwill and fair value adjustments arising on the acquisition of a foreign entity have been treated as assets and liabilities of the foreign entity and translated into Canadian Dollars at the balance sheet rate.
Foreign exchange gains or losses arising from a monetary item receivable from or payable to a foreign operation, the settlement of which is neither planned nor likely to occur in the foreseeable future and which in substance is considered to form part of the net investment in the foreign operation, are recognized in other comprehensive income in accumulated other comprehensive income.
Earnings (Loss) per Share
Earnings (loss) per share is computed by dividing the earnings (loss) for the year by the weighted average number of common shares outstanding during the year, including contingently issuable shares which are included when the conditions necessary for issuance have been met. Diluted earnings per share is calculated in a similar manner, except that the weighted average number of common shares outstanding is increased to include potentially issuable common shares from the assumed exercise of common share purchase options and warrants, if dilutive.
Share-based Compensation Plan
The share-based compensation plan allows the Company employees and consultants to acquire shares of the Company. The fair value of share-based payment awards granted is recognized as an employee or consultant expense with a corresponding increase in equity. An individual is classified as an employee when the individual is an employee for legal or tax purposes (direct employee) or provides services similar to those performed by a direct employee.
Each tranche in an award is considered a separate award with its own vesting period and grant date fair value. The fair value is measured at grant date and each tranche is recognized on a graded vesting basis over the period during which the share purchase options vest. The fair value of the share-based payment awards granted is measured using the Black-Scholes option pricing model taking into account the terms and conditions upon which the awards were granted. At each financial position reporting date, the amount recognized as an expense is adjusted to reflect the actual number of awards, for which the related service and non-market vesting conditions are expected to be met.
For equity-settled share-based payment transactions, the Company measures the goods or services received, and the corresponding increase in equity, directly, at the fair value of the goods or services received, unless that fair value cannot be estimated reliably, in which cases, the Company measures their value, and the corresponding increase in equity, indirectly, by reference to the fair value of the equity instruments granted.
Financial Instruments
All financial instruments are recorded initially at fair value. In subsequent periods, all financial instruments are measured based on the classification adopted for the financial instrument: fair value through profit and loss (“FVTPL”); held to maturity; loans and receivables; and available for sale or other liability.
Financial assets: FVTPL assets are subsequently measured at fair value with the change in the fair value recognized in net income during the period.
Loans and receivables are subsequently measured at amortized cost using the effective interest rate method.
Financial liabilities: Other liabilities are subsequently measured at amortized cost using the effective interest rate method. Costs that are directly attributable to a financial instrument’s origination, acquisition, issuance or assumption, are included in the fair value adjustment of the financial instrument. These costs are amortized over the life of the financial instrument.
The Company has classified its financial instruments as follows:
| Financial Instrument | Classification | |
| Cash | FVTPL |
| Accounts and grants receivable | Loans and receivables | |
| Accounts payable | Other financial liabilities | |
| Accrued liabilities | Other financial liabilities | |
| Loans payable | Other financial liabilities |
The Company’s financial instruments measured at fair value on the balance sheet consist of cash, which is measured at level 1 of the fair value hierarchy. There are three levels of the fair value hierarchy as follows:
Level 1: Values based on unadjusted quoted prices in active markets that are accessible at the measurement date for identical assets or liabilities.
Level 2: Values based on quoted prices in markets that are not active or model inputs that are observable either directly or indirectly for substantially the full term of the asset or liability.
Level 3: Values based on prices or valuation techniques that require inputs that are both unobservable and significant to the overall fair value measurement.
Impairment of Long-lived Assets
The Company’s property and equipment and intangibles with finite lives are reviewed for an indication of impairment at each balance sheet date. The Company’s intangible assets that have an indefinite life or not ready for use are not subject to amortization and are tested annually for impairment. Goodwill is reviewed for impairment annually or at any time if an indicator of impairment exists ifexists. If indication of impairment exists, the asset’s recoverable amount is estimated. The recoverable amount is the greater of the asset’s fair value less costs to sellof disposal and value in use. In assessing value in use, the estimated future cash flows are discounted to their present value using a pre-tax discount rate that reflects current market assessments of the time value of money and the risks specific to the asset.
An impairment loss is recognized when the carrying amount of an asset, or its cash-generating unit, exceeds its recoverable amount. A cash-generating unit is the smallest identifiable group of assets that generates cash inflows that are largely independent of the cash inflows from other assets or groups of assets. Impairment losses are recognized in profit and loss for the period.
An impairment loss, other than goodwill impairment, is reversed if there is an indication that there has been a change in the estimates used to determine the recoverable amount. An impairment loss is reversed only to the extent that the asset’s carrying amount does not exceed the carrying amount that would have been determined, net of depreciation or amortization, if no impairment loss had been recognized.
Goodwill represents the excess of the cost of an acquisition over the fair value of the Company’s share of identifiable net assets of the acquired subsidiary at the date of acquisition. Goodwill is carried at cost less accumulated impairment losses. Goodwill is allocated to each cash generating unit (“CGU”) or group of CGUs that are expected to benefit from the related business combination. A group of CGUs represents the lowest level within the entity at which the goodwill is monitored for internal management purposes, which is not higher than an operating segment.
For the purposes of impairment testing, goodwill is allocated to each of the Group’s cash-generating units (or groups of cash-generating units) that is expected to benefit from the synergies of the combination.
A cash-generating unit to which goodwill has been allocated is tested for impairment annually, or more frequently when there is indication that the unit may be impaired. If the recoverable amount of the cash-generating unit is less than its carrying amount, the impairment loss is allocated first to reduce the carrying amount of any goodwill allocated to the unit and then to the other assets of the unit pro rata based on the carrying amount of each asset in the unit. Any impairment loss for goodwill is recognized directly in profit or loss in the consolidated statement of comprehensive loss.
An impairment loss recognized for goodwill is not reversed in subsequent periods. On disposal of the relevant cash-generating unit, the attributable amount of goodwill is included in the determination oftheof the profit or loss on disposal. Determining whether goodwill is impaired requires an estimation of the higher of fair value less costs of disposal and value in use of the cash-generating units to which goodwill has been allocated. The value in use calculation requires the management to estimate the future cash flows expected to arise from the cash-generating unit and a suitable discount rate in order to calculate present value.
Leases
Leases are classified as either finance or operating. Leases that transfer substantially all of the risks and benefits of ownership of the leased asset to the Company are classified as finance leases. Finance leases are capitalized at the lease’s commencement at the lower of fair value of the leased asset and the present value of the minimum lease payments. Leases in which a significant portion of the risks and rewards of ownership are retained by the lessor are classified as operating leases. Rental payments, net of any incentives received from the lessor, are charged to earnings on a straight-line basis over the period of the lease.
Warrants
From time to time, the Company may issue warrants as a means of raising capital. The Company values warrants using the Black-Scholes pricing model. Any transaction costs arising on the issue of warrants are recognized in equity as a reduction of the proceeds from warrants. In the event that warrants are exercised, the fair value of the warrants issued is reclassified from warrants to share capital. In the event that warrants expire unexercised, their value is transferred from warrants to share- based payment reserve.
Operating Results
Financial information for the year ended December 31, 2017, 2016, 2015, 2014, 2013 and 20122014 was prepared in accordance with IFRS as issued by the IASB.
Fiscal Year Ended December 31, 20157 vs. Fiscal Year Ended December 31, 20146
Revenues from print-based English language learning for the year ended December 31, 20152017 were $1,971,121$1,688,571 compared to $1,680,814$1,738,800 for fiscal 2014. 2016, a decrease of 3%. This decrease is due to foreign exchange fluctuation, a decrease in both the Chinese RMB and the Canadian Dollar vs. the US Dollar.
Direct costs associated with publishing revenue are kept to a minimumrelatively modest and hashave been consistent throughout the years. The Company continues to maintain its relationship with PEPPeoples’ Education Press and is investing in the development of its existing and new programs and marketing activities to maintain and increase its royalty revenues.
Publishing revenue for the year ended December 31, 2015 increased 17% compared to fiscal 2014. This increase consists of additional royalties generated through licensing sales from provincial distributors as a result of Lingo Media and PEP’s local marketing and teacher training initiatives as well as the distribution of theScholarseries.
In 2015,2017, Lingo Media generated $2,954,614$1,088,197 in online English language learning revenue as compared to $831,650$1,456,421 in 2014, an increase2016, a decrease of 255%. This increase in sales is due to the Company maximizing its sales efforts related to its ELL Technologies’ redesigned suite of products. Since 2012, the Company has completely redesigned the user interface, learning management system and the multi-browser delivery system for desktops and tablets for its ELL Technologies suite of products includingWinnie’s World, English Academy, Scholar,Campus, Master andBusiness25%. The redesign has now been completed and full sales efforts have resumed and recorded a 255% increasedecrease in revenue is a result of extended sales cycles in securing contracts and time shifting of the 2015 as compared to 2014.sales pipeline.
Selling, General and Administrative Costs
Selling, general and administrative expenses were $1,059,703$1,368,153 in fiscal 20152017 compared to $950,229$1,364,736 for fiscal 2014.2016. Selling, general and administrative expenses for the two segments are segregated below.
(i)(i) Print-Based English Language Learning
Selling, general and administrative cost for print-based publishing increaseddecreased from $642,868$739,224 in 20142016 to $721,947$679,905 in 20152017 due to the decreases in sales, marketing and administration, travel, rent and corporate development offset against an increase in consulting fees and corporate development fees.salaries, professional fees and an increase in government grants. The following is a breakdown of selling, general and administrative costs directly related to print-based English language learning:
For theYear Ended December 31 | 2015 | 2014 | 2017 | 2016 | ||||||||||||
Sales, marketing & administration | $ | 140,305 | $ | 142,544 | $ | 98,152 | $ | 185,511 | ||||||||
Consulting fees & salaries | 430,884 | 382,564 | 435,039 | 351,581 | ||||||||||||
Travel | 69,820 | 60,007 | 45,164 | 81,485 | ||||||||||||
Premises | 104,139 | 111,598 | 83,550 | 126,632 | ||||||||||||
Corporate development | 140,112 | 49,399 | 83,625 | 158,922 | ||||||||||||
Professional fees | 48,416 | 79,887 | 166,788 | 64,787 | ||||||||||||
Less: Grants | (211,729 | ) | (183,131 | ) | (262,413 | ) | (229,694 | ) | ||||||||
| $ | 721,947 | $ | 642,868 | $ | 679,905 | $ | 739,224 | |||||||||
(ii) Online English Language Learning
Selling, general and administrative costs related to online English language learning was $337,756$688,248 for the year compared to $307,361$625,512 in 2014.2016. Selling, general and administrative costs for this business unit increased in 20152017 as compared to 2014,2016, which included anthe increase of corporate development services.sales, marketing and administrative expenses, and professional fees.
For theYear Ended December 31 | 2015 | 2014 | ||||||||||||||
For the Year Ended December 31 | 2017 | 2016 | ||||||||||||||
Sales, marketing & administration | $ | (52,719 | ) | $ | 166,207 | $ | 177,126 | $ | 29,001 | |||||||
Consulting fees and salaries | 46,840 | 79,588 | 252,720 | 312,329 | ||||||||||||
Travel | 13,328 | 13,136 | 41,407 | 57,917 | ||||||||||||
Premises | 48,000 | 45,888 | 48,000 | 48,000 | ||||||||||||
Corporate development | 208,923 | - | 53,892 | 133,613 | ||||||||||||
Professional fees | 73,384 | 60,876 | 115,103 | 44,652 | ||||||||||||
Less: Grants | - | (58,334 | ) | |||||||||||||
| $ | 337,756 | $ | 307,361 | $ | 688,248 | $ | 625,512 | |||||||||
Total Selling and Administrative Expenses | 1,059,703 | 950,229 | $ | 1,368,153 | $ | 1,364,736 | ||||||||||
Government Grants
Lingo Media makes applications to the Canadian government for various types of grants to support its publishing and international marketing activities. Each year, the amount of any grant may vary depending on certain eligibility criteria (including prior year revenues) and the monies available to and the number of eligible candidates. These government grants are recorded as a reduction of general and administrative expenses to offset direct costs funded by the grant. During the year, the Company recorded $211,729$232,413 of such grants.
One government grant for the print-based English language learning segment is repayable in the event that the segment’s annual net income before tax for each ofthe current year and the previous two years exceeds 15% of revenuerevenue. During 2017 and at such time a liability would be recorded. During the year ended December 31, 2015,2016, the conditions for the repayment of the government grant weregrants did not metarise and no liability was recorded.
One grant, relating to the Company’s “Development of Comprehensive, Interactive Phonetic English Learning Solution” project, is repayable semi-annually at a royalty rate of 2.5% per year’s gross sales derived from this project until 100% of the grant is repaid. No royalty was paid in 2015, 20142017, 2016 or 20132015 as no sales were generated from this project.
Segmented Information
Total comprehensive loss for the Company was $6,262,792 for the year ended December 31, 2017 as compared to a total comprehensive income of $124,420 in 2016. Total comprehensive loss can be attributed to the two operating segments as shown below:
Online English Language Learning | 2017 | 2016 | ||||||
Revenue | $ | 1,088,197 | $ | 1,456,421 | ||||
Expenses: | ||||||||
Direct costs | 134,695 | 167,597 | ||||||
General & administrative | 688,248 | 625,512 | ||||||
Bad debt expense | 732,254 | - | ||||||
Amortization of property & equipment | 1,322 | 682 | ||||||
Amortization of development costs | 1,051,928 | 1,003,485 | ||||||
Development costs | 2,692,009 | - | ||||||
Loss on acquisition | 80,818 | - | ||||||
Impairment loss – goodwill | 139,618 | - | ||||||
Impairment – intangible assets | 1,948,081 | - | ||||||
Income taxes and other taxes | 180 | 805 | ||||||
| 7,469,153 | 1,798,081 | |||||||
Segmented Loss - Online English Language Learning | $ | (6,380,956 | ) | $ | (341,660 | ) | ||
Print-Based English Language Learning | 2017 | 2016 | ||||||
Revenue | $ | 1,688,571 | $ | 1,738,800 | ||||
Expenses: | ||||||||
Direct costs | 90,923 | 217,787 | ||||||
Selling, general & administrative | 679,905 | 739,224 | ||||||
Amortization of property & equipment | 5,322 | 6,615 | ||||||
Income taxes and other taxes | 177,842 | 186,900 | ||||||
| $ | 953,992 | $ | 1,150,526 | |||||
Segmented Income – Print-Based English Language Learning | $ | 734,579 | $ | 588,274 | ||||
Total Segmented Profit (Loss) | $ | (5,646,377 | ) | $ | 246,614 | |||
Other | ||||||||
Foreign exchange | $ | (189,783 | ) | $ | (146,500 | ) | ||
Interest and other financial expenses | (53,709 | ) | (35,768 | ) | ||||
Share-based compensation | (371,513 | ) | - | |||||
Other comprehensive loss | (1,410 | ) | 60,173 | |||||
| (616,415 | ) | (122,194 | ) | |||||
Total Comprehensive Income (Loss) | $ | (6,262,792 | ) | $ | 124,420 | |||
Share-Based Payments
The Company amortizes share-based payments with a corresponding increase to the contributed surplus account. During 2017, the Company recorded an expense of $371,513 compared to $Nil in 2016.
Foreign Exchange
The Company recorded foreign exchange loss of $189,783 as compared to $146,599 in 2016, relating to the Company's currency risk through its activities denominated in foreign currencies as the Company is exposed to foreign exchange risk as a significant portion of its revenue and expenses are denominated in Chinese Renminbi and US Dollars.
Income Tax Expense
The Company recorded a tax expense of $178,022 for the year ended December 31, 2017 compared to a tax expense of $187,705 in 2016. This tax is a withholding tax paid on revenues earned in China and repatriated outside of China.
Net Profit (Loss) for the Year
The Company reported a net loss of $6,261,382 for the year as compared to $64,247 in 2016. The loss per share is $0.18 per share and is primarily due to an impairment of intangible assets and goodwill of $2,087,700 and development costs of $2,692,009 in addition to recording an allowance for bad debts of $732,254. The impairment arose primarily as a result of the weakened market conditions on the forecast of the online English Language Learning segment.
Fiscal Year Ended December 31, 2016 vs. Fiscal Year Ended December 31, 2015
Revenues from print-based English language learning for the year ended December 31, 2016 were $1,738,800 compared to $1,971,121 for fiscal 2015, a decrease of 12%. This decrease is due to foreign exchange fluctuations, a decrease in both the Chinese RMB and the Canadian Dollar vs. the US Dollar. Direct costs associated with publishing revenue are relatively modest and has been consistent throughout the years. The Company continues to maintain its relationship with Peoples’ Education Press and is investing in the development of its existing and new programs and marketing activities to maintain and increase its royalty revenues.
In 2016, Lingo Media generated $1,456,421 in online English language learning revenue as compared to $2,954,614 in 2015. This revenue decrease from online English Language Learning is a result of a delay in a large project becoming a reference site for new customers in Latin America. The Company believe that once the SENA project goes “live” it will regain its sales momentum.
Selling, General and Administrative Costs
Selling, general and administrative expenses were $1,364,736 in fiscal 2016 compared to $1,059,703 for fiscal 2015. Selling, general and administrative expenses for the two segments are segregated below.
(i) Print-Based English Language Learning
Selling, general and administrative cost for print-based publishing increased from $721,947 in 2015 to $739,224 in 2016 due to the increase in sales, marketing and admin, travel, rent and professional fees offset against a reduction in consulting fees & salaries and an increase in government grants. The following is a breakdown of selling, general and administrative costs directly related to print-based English language learning:
For the Year Ended December 31 | 2016 | 2015 | ||||||
Sales, marketing & administration | $ | 185,511 | $ | 140,305 | ||||
Consulting fees & salaries | 351,581 | 430,884 | ||||||
Travel | 81,485 | 69,820 | ||||||
Premises | 126,632 | 104,139 | ||||||
Corporate development | 158,922 | 140,112 | ||||||
Professional fees | 64,787 | 48,416 | ||||||
Less: Grants | (229,694 | ) | (211,729 | ) | ||||
| $ | 739,224 | $ | 721,947 | |||||
ii) Online English Language Learning
Selling, general and administrative costs related to online English language learning was $625,512 for the year compared to $337,756 in 2015. Selling, general and administrative costs for this business unit increased in 2016 as compared to 2015, which included an increase of sales, marketing and admin expenses, consulting fees & salaries and travel expenses.
For the Year Ended December 31 | 2016 | 2015 | ||||||
Sales, marketing & administration | $ | 29,001 | $ | (52,719 | ) | |||
Consulting fees and salaries | 312,329 | 46,840 | ||||||
Travel | 57,917 | 13,328 | ||||||
Premises | 48,000 | 48,000 | ||||||
Corporate development | 133,613 | 208,923 | ||||||
Professional fees | 44,652 | 73,384 | ||||||
| $ | 625,512 | $ | 337,756 | |||||
Total Selling and Administrative Expenses | $ | 1,364,736 | $ | 1,059,703 | ||||
Government Grants
Lingo Media makes applications to the Canadian government for various types of grants to support its publishing and international marketing activities. Each year, the amount of any grant may vary depending on certain eligibility criteria (including prior year revenues) and the monies available to and the number of eligible candidates. These government grants are recorded as a reduction of general and administrative expenses to offset direct costs funded by the grant. During the year, the Company recorded $229,694 of such grants.
One government grant for the print-based English language learning segment is repayable in the event that the segment’s annual net income before tax for the current year and the previous two years exceeds 15% of revenue. During 2016 and 2015, the conditions for the repayment of grants did not arise and no liability was recorded.
One grant, relating to the Company’s “Development of Comprehensive, Interactive Phonetic English Learning Solution” project, is repayable semi-annually at a royalty rate of 2.5% per year’s gross sales derived from this project until 100% of the grant is repaid. No royalty was paid in 2016, 2015 or 2014 as no sales were generated from this project.
While the Company will continue to apply for various government grants to fund its ongoing development and market expansion, there can be no assurance the Company will be successful in obtaining these grants in the future or that the Company will meet the eligibility requirements for the grants or that the grant programs will continue to be offered.
Segmented Information
Total comprehensive income for the Company was $2,374,699$124,420 for the year ended December 31, 20152016 as compared to a total comprehensive lossincome of $107,406$2,374,699 in 2014.2015. These gains can be attributed to the two operating segments and other financial costs as shown below:
Online English Language Learning | 2015 | 2014 | 2016 | 2015 | ||||||||||||
Revenue | $ | 2,954,614 | $ | 831,650 | $ | 1,456,421 | $ | 2,954,614 | ||||||||
Expenses: | ||||||||||||||||
Direct costs | 276,049 | 286,945 | 167,597 | 276,049 | ||||||||||||
Selling, general & administrative | 337,756 | 307,361 | 625,512 | 337,756 | ||||||||||||
Amortization of property & equipment | 3,012 | 3,253 | 682 | 3,012 | ||||||||||||
Amortization of development costs | 721,720 | 582,857 | 1,003,485 | 721,720 | ||||||||||||
Income taxes and other taxes | 85 | 399 | 805 | 85 | ||||||||||||
| 1,338,622 | 1,180,815 | $ | 1,798,081 | $ | 1,338,622 | |||||||||||
SegmentedIncome(Loss) - OnlineEnglish Language Learning | $ | 1,615,992 | $ | (349,165 | ) | $ | (341,660 | ) | $ | 1,615,992 | ||||||
Print-Based English Language Learning | ||||||||||||||||
Revenue | $ | 1,738,800 | $ | 1,971,121 | ||||||||||||
Expenses: | ||||||||||||||||
Direct costs | 217,787 | 106,822 | ||||||||||||||
Selling, general & administrative | 739,224 | 721,947 | ||||||||||||||
Amortization of property & equipment | 6,615 | 5,567 | ||||||||||||||
Income taxes and other taxes | 186,900 | 310,204 | ||||||||||||||
| $ | 1,150,526 | $ | 1,144,540 | |||||||||||||
Segmented Income – Print-Based English Language Learning | $ | 588,274 | $ | 826,581 | ||||||||||||
Total Segmented Profit | $ | 246,614 | $ | 2,442,573 | ||||||||||||
Other Financial Items | ||||||||||||||||
Foreign exchange | $ | (146,599 | ) | $ | 399,314 | |||||||||||
Interest and other financial expenses | (35,768 | ) | (158,792 | ) | ||||||||||||
Share-based compensation | - | (151,038 | ) | |||||||||||||
Other comprehensive income | 60,173 | (157,358 | ) | |||||||||||||
| (122,194 | ) | (67,874 | ) | |||||||||||||
Total Comprehensive Income | $ | 124,420 | $ | 2,374,699 | ||||||||||||
Print-Based English Language Learning | 2015 | 2014 | ||||||
Revenue | $ | 1,971,121 | $ | 1,680,814 | ||||
Expenses: | ||||||||
Direct costs | 106,822 | 95,649 | ||||||
Selling, general & administrative | 721,947 | 642,868 | ||||||
Amortization of property & equipment | 5,567 | 4,133 | ||||||
Income taxes and other taxes | 310,204 | 268,720 | ||||||
| 1,144,540 | 1,011,370 | |||||||
Segmented Income – Print-BasedEnglish Language Learning | $ | 826,581 | $ | 669,444 | ||||
Total Segmented Profit | $ | 2,442,573 | $ | 320,279 | ||||
Other | 2015 | 2014 | ||||||
Foreign exchange | $ | 399,314 | $ | 106,437 | ||||
Interest and other financial expenses | (158,792 | ) | (217,040 | ) | ||||
Share-based compensation | (151,038 | ) | (65,663 | ) | ||||
Other comprehensive loss | (157,358 | ) | (36,607 | ) | ||||
| (67,874 | ) | (212,873 | ) | |||||
Total Comprehensive Income | $ | 2,374,699 | $ | 107,406 | ||||
During the year ended December 31, 2015,2016, the Company continued to invest in product development and redesigned its fee-based online training and assessment service. The majority of its expenses consist of selling, general and administrative expenses detailed in the selling, general and administrative section above. The loss decreased as a result of decreased expenditures related to cost rationalization, and reduced financial expenses and share-based compensation.
Share-Based Payments
The Company amortizes share-based payments with a corresponding increase to the contributed surplus account. During 2015,2016, the Company recorded an expense of $151,038nil compared to $65,663$151,038 during 2014. The increase in this expense is due to stock options granted and vested, and no financing activities.2015.
Foreign Exchange
The Company recorded foreign exchange gainloss in 20152016 of $399,314$ 146,599 as compared to a gain of $106,437$399,314 in fiscal 2014,2015, relating to the Company's currency risk through its activities denominated in foreign currencies as the Company is exposed to foreign exchange risk as a significant portion of its revenue and expenses are denominated in Chinese Renminbi and US Dollars, European Euros, and Chinese Renminbi.Dollars.
Income Tax Expense
The Company recorded a tax expense of $310,289$187,705 for the year ended December 31, 20152016 compared to a tax expense of $269,119$310,289 in 2014.2015. This tax is a withholding tax paid on revenues earned in China and repatriated outside of China.
Net Profit for the Year
The Company reported a net profit of $2,532,057$64,247 for the year as compared to $144,013$2,532,057 in 2014, an operational improvement of $2,388,044. This improvement2015. The
reduction in net profit is primarily attributed to increasea decrease in revenue of $2,413,271.sales in Online ELL Division. The earnings per shares are $0.10$0.00 per share (basic) and $0.09$0.00 per share (fully diluted).
Fiscal Year Ended December 31, 2014 vs. Fiscal Year Ended December 31, 2013
Revenues from print-based English language learning for the year ended December 31, 2014 were $1,680,814 compared to $1,541,197 for fiscal 2013. Direct costs associated with publishing revenue are kept to a minimum and has been consistent throughout the years. The Company continues to maintain its relationship with PEP and is investing in the development of its existing and new programs and marketing activities to maintain and increase its royalty revenues.
Publishing revenue for the year ended December 31, 2014 increased 9% compared to fiscal 2013. This increase consists of additional royalties generated through licensing sales from provincial distributors as a result of Lingo Media and PEP’s local marketing and teacher training initiatives as well as the distribution of theScholarseries. With more than 520 million copies of co-published units to date, Lingo Media continues to maintain its dominant market position in the primary level English language learning school publishing market in China.
In 2014, Lingo Media generated $831,650 in online English language learning revenue as compared to $466,869 in 2013, an increase of 78%. This increase in sales is due to the Company maximizing its sales efforts related to its ELL Technologies’ redesigned suite of products in 2014. Since 2012, the Company has completely redesigned the user interface, learning management system and the multi-browser delivery system for desktops and tablets for its ELL Technologies suite of products including Scholar, Masterand Kids. The redesign has now been completed and full sales efforts have resumed, and recorded a 78% increase in revenue.
Selling, General and Administrative Costs
Selling, general and administrative expenses were maintained at $950,229 in fiscal 2014 compared to $941,462 for fiscal 2013, an increase of 1%. Selling, general and administrative expenses for the two segments are segregated below.
(i) Print-Based English Language Learning
Selling, general and administrative costs for print-based publishing decreased significantly from 2013 to 2014. The decrease in sales, marketing & administration, travel and premises was primarily due to cost rationalization efforts in 2014. The following is a breakdown of selling, general and administrative costs directly related to Print-Based English Language Learning:
2014 | 2013 | |||||||
Sales, marketing & administration | $ | 142,544 | $ | 189,676 | ||||
Consulting fees | 382,564 | 396,809 | ||||||
Travel | 60,007 | 84,705 | ||||||
Premises | 111,598 | 131,257 | ||||||
Shareholder service | 49,399 | 54,073 | ||||||
Professional fees | 79,887 | 60,696 | ||||||
Less: Grants | (183,131 | ) | (271,647 | ) | ||||
| $ | 642,868 | $ | 645,569 | |||||
(ii) Online English Language Learning
Selling, general and administrative costs related to online English language learning were $307,361 for fiscal 2014 compared to $295,893 in 2013. Selling, general and administrative costs for this business unit increased in 2014 as a result of the increase in operations and revenue growth. The following is a breakdown of selling, general and administrative costs directly related to Online English Language Learning:
2014 | 2013 | |||||||
Sales, marketing & administration | $ | 166,207 | $ | 133,138 | ||||
Consulting fees and salaries | 79,588 | 69,213 | ||||||
Travel | 13,136 | 7,990 | ||||||
Premises | 45,888 | 32,814 | ||||||
Shareholder service | - | - | ||||||
Professional fees | 60,876 | 52,738 | ||||||
Less: Grants | (58,334 | ) | - | |||||
| $ | 307,361 | $ | 295,893 | |||||
Total Selling and Administrative Expenses | 950,229 | 941,462 | ||||||
Government Grants
Lingo Media makes applications to the Canadian Government for various types of grants to support its publishing and international marketing activities. Each year, the amount of any grant may vary depending on certain eligibility criteria (including prior year revenues) and the monies available to and the number of eligible candidates.
These government grants are recorded as a reduction of general and administrative expenses to offset direct costs funded by the grant. During the year, the Company recorded $241,465 of such grants.
One government grant for the print-based English language learning segment is repayable in the event that the segment’s annual net income for each of the previous two years exceeds 15% of revenue and at such time a liability would be recorded. During the year, the conditions for the repayment of the government grant were not met and no liability was recorded.
One grant, relating to the Company’s “Development of Comprehensive, Interactive Phonetic English Learning Solution” project, is repayable semi-annually at a royalty rate of 2.5% per year’s gross sales derived from this project until 100% of the grant is repaid. No royalty was paid in 2014, 2013 or 2012 as no sales were generated from this project.
During 2008, Lingo Media was audited by a government grant agency and was assessed with a repayment of $115,075 relating to a publishing grant. In 2010, the Company was reassessed with a reduction to the repayment to $100,000 which is recorded in accrued liabilities and this audit finding was appealed by the Company. In 2013, the appeal was approved and the liability was reduced to $16,263, which was paid, and the difference of $87,737 was recorded as grant during the year.
While the Company will continue to apply for various government grants to fund its ongoing development and market expansion, there can be no assurance the Company will be successful in obtaining these grants in the future or that the Company will meet the eligibility requirements for the grants or that the grant programs will continue to be offered.
Segmented Information
Total comprehensive income for the Company was $107,408 for the year ended December 31, 2014 as compared to total comprehensive loss of ($56,331) in 2013. The profit can be attributed to the two operating segments and other financial costs as shown below:
Online English Language Learning | 2014 | 2013 | ||||||
Revenue | $ | 831,650 | $ | 466,869 | ||||
Expenses: | ||||||||
Direct costs | 286,945 | 153,200 | ||||||
Selling, general & administrative | 307,361 | 295,893 | ||||||
Amortization of property & equipment | 3,253 | 3,533 | ||||||
Amortization of development costs | 582,857 | 431,049 | ||||||
Income taxes and other taxes | 399 | 2,638 | ||||||
| 1,180,815 | 886,313 | |||||||
Segmented Loss - OnlineEnglish Language Learning | $ | (349,165 | ) | $ | (419,444 | ) | ||
Print-Based English Language Learning | 2014 | 2013 | ||||||
Revenue | $ | 1,680,814 | $ | 1,541,197 | ||||
Expenses: | ||||||||
Direct costs | 95,649 | 42,124 | ||||||
Selling, general & administrative | 642,868 | 645,569 | ||||||
Amortization of property & equipment | 4,133 | 4,091 | ||||||
Income taxes and other taxes | 268,720 | 239,028 | ||||||
| 1,011,370 | 930,812 | |||||||
Segmented Income / (Loss) – Print-Based English Language Learning | $ | 669,444 | $ | 610,385 | ||||
Other Financial Items | 2014 | 2013 | ||||||
Foreign exchange | 106,437 | 134,444 | ||||||
Interest and other financial expenses | (217,040 | ) | (240,516 | ) | ||||
Share-based compensation | (65,663 | ) | (61,926 | ) | ||||
Other comprehensive income | (36,607 | ) | (79,274 | ) | ||||
| (212,873 | ) | (247,272 | ) | |||||
Total ComprehensiveIncome (Loss) | $ | 107,406 | $ | (56,331 | ) | |||
During the year, the Company continued to invest in product development and redesigned its fee-based online training products. The majority of its expenses consist of selling, general and administrative expenses, detailed above. The profit was achieved as a result of an increase in revenue and a decrease of expenditures related to cost rationalization, and reduced financial expenses and share-based payments.
Share-Based Payments
The Company amortizes share-based payments with a corresponding increase to the contributed surplus account. During 2014, the Company recorded an expense of $65,663 compared to $61,926 during 2013. The increase in this expense is due to stock options granted and vested in 2014.
Foreign Exchange
The Company recorded foreign exchange gain of $106,437 as compared to a gain of $134,444 in fiscal 2013, relating to the Company's currency risk through its activities denominated in foreign currencies. The Company is exposed to foreign exchange risk as a significant portion of its revenue and expenses are denominated in US Dollars, European Euros, and Chinese Renminbi.
Income Tax Expense
The Company recorded a tax expense of $269,119 for the year ended December 31, 2014 compared to a tax expense of $241,666 in 2013. This tax is a withholding tax paid on revenues earned in China and repatriated outside of China and increased as a result of the increase in revenue.
Net Profit for the Year
The Company reported an increase in net profit of $144,013 for the year ended December 31, 2014, as compared to $22,943 in 2013, an operational improvement of $121,070. This improvement in profitability is primarily attributed to increase in revenue accompanied by a proportionate increase in direct costs.
5.B Liquidity and Capital Resources
Financial information for the years ended December 31, 2015, 20142017, 2016 and 20132015 was prepared in accordance with IFRS as issued by the IASB.
As at December 31, 2015,2017, the Company had cash of $409,022$327,434 as compared to $477,001$84,303 in 20142016 and $78,091$409,022 in 2013.2015. Accounts and grants receivable of $1,961,534$970,467 were outstanding at the end of 20152017 as compared to $849,344$3,044,928 in 20142016 and $1,003,440$1,961,534 in 2013.2015. With 39%84% of its receivables from PEP and having a 90 day collection cycle, the balance due from ELL Technologies’ customers,the Company does not anticipate an effect on its liquidity. Total current assets amounted to $2,858,710 (2014$1,503,383 (2016 - $1,411,416, 2013$3,709,077, 2015 - $$1,166,151)$2,858,710) with current liabilities of $1,186,167 (2014$980,318 (2016 - $1,679,482, 2013$731,159, 2015 - 1,703,703)$1,186,167) resulting in a working capital of $1,672,543 (2014$523,065 (2016 – $268,066, 2013$2,977,918, 2015 – $537,552)$1,672,543).
5.C Research and Development
During the years ended December 31, 2015, 20142017, 2016 and 2013,2015, respectively, the Company expended $2,071,440, $544,635,$Nil, $1,798,687, and $431,711$2,071,440 on intangibles, under the categories of “software and web development costs” and “content platform”. These expenditures in 2015, 2014,2017, 2016, and 20132015 were primarily directed at developing the ELL Technologies products for the international market.
5.D Trend Information
Lingo Media believes that the global market trends in English language learning are strong and will continue to grow at a rapid pace. Developing countries around the world, specifically in Latin America and Asia are expanding their mandates for the teaching of English amongst students, young professionals and adults.
5.E Off-Balance Sheet Arrangements
The Company has not entered into any off-balance sheet finance arrangements.
5.F Tabular disclosure of contractual obligations
The Company has future minimum lease payments under operating leases for premises and equipment as follows:
2016 | $ | 86,354 | ||||||
2017 | 123,515 | |||||||
2018 | 121,750 | 217,393 | ||||||
2019 | 123,258 | 212,734 | ||||||
2020 | 123,258 | 212,734 | ||||||
Thereafter | 22,430 | |||||||
2021 | 37,256 | |||||||
The rent expense associated with operating lease for premise and equipment is recognized on a straight-line basis.
5.G. Safe Harbor
Portions of this Annual Report on Form 20-F may include "forward-looking statements" within the meaning of securities laws.Theselaws.These statements are made in reliance upon Sections 21E and 27A of the Securities Exchange Act of 1934, which involve known and unknown risks, uncertainties or other factors that could cause actual results to differ materially from the results, performance, or expectations implied by these forward-looking statements. These statements are based on management's current expectations and involve certain risks and uncertainties. Actual results may vary materially from management's expectations and projections and thus readers should not place undue reliance on forward-looking statements.The Company has tried to identify these forward-looking statements by using words such as "may," "should," "expect," "hope," "anticipate," "believe," "intend," "plan," "estimate" and similar expressions. The Company’s expectations, among other things, are dependent upon general economic conditions, the continued and growth in demand for its products, retention of its key management and operating personnel, its need for and availability of additional capital as well as other uncontrollable or unknown factors. No assurance can be given that the actualresultsactualresults will be consistent with the forward-looking statements. Except as otherwise required by US Federal securities laws, the Company undertakes no obligation to publicly update or revise any forward-looking statements, whether as a result of new information, future events, changed circumstances or any other reason.See also under “ Forward Looking Statements” above.
ITEM 6. DIRECTORS, SENIOR MANAGEMENT AND EMPLOYEES
6.A. Directors and Senior Management
Table No. 6
Directors and Senior Management
April 30, 20152018
Name | Position | Age | Date of Election/ Appointment | ||||
Michael P. Kraft | President/CEO/Director |
| 55 | November 1996 | |||
Khurram Qureshi | CFO/Secretary/Treasurer |
| 55 | April 1997/December 2011 | |||
Gali Bar-Ziv | COO |
| 46 | June 2009 | |||
| Director |
|
| ||||
|
|
| September 2010 | ||||
Tommy Weibing Gong | Director |
| 50 | September 2010 | |||
Martin Bernholtz | Director |
| 55 | August 2013 | |||
Robert Martellacci | Director | December 8, 2017 | |||||
Michael P. Kraft is the Founder, President & CEO and Director of Lingo Media and has been since its inception in 1996. He is also the President of MPK Inc. a management services and consulting business providing strategic planning, business development and corporate development since 1989. Mr. Kraft is the Chairman of Buckingham Group Limited, a privatesmall privately-owned merchant banking corporationbank that has played a significant role in the capital formation strategy and financing as a principal of various emerging and growth enterprises since 1994.and participated in financing these companies to become viable entities within their field. He is also a directorCo-Founder and Chairman of TSX Venture Exchange listed Pioneering Technology Corp. and JM Capital II Corp. and private companies including WeedMD Rx Inc., WMD Venturesthe Founder of Internet of Things Inc., MakMera Upstream Inc. and REIN Capital Corp. Mr. Kraft received a BachelorCo-Founder & Chairman of Arts in Economics from York University in 1985.Lingo Media Corporation.
Khurram R. Qureshi was the Chief Financial Officer of the Company from 1997 to July 2009, and was reappointed as such in December 2011. Mr. Qureshi received a Bachelor of Administrative Studies from York University in 1987 and received the Chartered Accountant designation in 1990.Mr. Qureshi is also a partner at CQK Chartered Accountants LLP.
Gali Bar-Ziv brings more than 1015 years of management and entrepreneurial experience, including financing, mergers and acquisitions, strategic planning, channel development and corporate development. Most recently, Galidevelopment with extensive international experience in Israel, China and Latin America. Mr. Bar-Ziv profitably grew a sales,sale, marketing and distribution start-up to sales growth of more than 700% year over year. Prior to that, GaliHe also successfully turned around the largest service division of a $300MM$300 million financial services company. Galicompany while at Fairfax Financial. Mr. Bar-Ziv holds a Bachelor of Law (LL.B) degree from the University of London and an MBA in Strategic and Entrepreneurial studies from the Schulich School of Business in Toronto.
Scott Remborg,MBA is an independent consultant in the Information Technology and eCommerce sector. From 1994 to 1999, he initiated and led the development of Sympatico, Canada’s largest Internet service and portal, for Bell Canada and twelve other telecommunications companies across Canada. From 2001 to 2003, Mr. Remborg was General Manager, eBusiness, at Air Canada. He also held senior management positions at Reuters and I.P. Sharp Associates. Mr. Remborg has an MBA from BI Norwegian School of Management and the University of Alberta.
The Hon. Jerry S. Grafstein, Q.C., holds degrees from the University of Western Ontario and the University of Toronto and has taught the Bar Admission Course at Osgoode Hall. HeMr. Grafstein serves as counsel emeritus at Minden Gross LLP in Toronto and practices corporate finance and communication law. Mr. Grafstein devotes most of his business time to technology start-ups in Canada, the U.S. and Latin America. Mr. Grafstein has wide-ranging legal and business experience in all aspects of media. Mr. GrafsteinHe was a co-founder of a range of media companies, focusing on broadcasting, cable, communications, film production and publicationpublic enterprises in Canada, the USA,U.S., the UK,U.K., and South America. HeMr. Grafstein recently co-founded on-lineonline news sites from Canada, USA,the U.S., the U.K., Brazil, China, Russia, Africa, UK, Europe and the Mideast. In addition to his media experience, Mr. Grafstein advised several key government ministries, including Transportation, External Affairs, Consumer and Corporate Affairs and Justice. He was appointed to the Senate of Canada in 1984 by then Prime Minister Pierre Elliott Trudeau. Mr. Grafstein hasTrudeau and served on all Senate Committees, including theincluding: Foreign Affairs and theAffairs; Legal and Constitutional Affairs Committees. He served as Chairman of theAffairs; and (as Chairman) Senate Banking, Trade and Commerce Committee.Commerce. While in the Senate, Mr. Grafstein was a long serving Co-Chair of the Canada-United States Inter-Parliamentary Group, and a long serving senior officer of the Organization for Security and Co-Operation in Europe Parliamentary Assembly (OSCE PA). He retired from the Senate on January 1, 2010. Mr. Grafstein continues his law practice in corporate finance and communication law and as counsel emeritus to Minden Gross LLP in Toronto and remains active in the local affairs in Toronto. He is the director of TeraGo Inc., a company listed at TSX and Multivision Communications Corp., a TSX Venture listed company.
Tommy Weibing Gongholds an Engineering degree from Huazhong University of Science and Technology in China, and IT certifications through his North American education and started his IT career in 1996 in Silicon Valley. He is Founder of Polar Bear Energy Inc., a business in the Cleantech and Greentech sector. Mr. Gong is now a leading commercial property developer in Shanghai. He serves as Chairman of Shanghai Green Town Plaza Real Estate Development Co., Ltd, Shanghai Zhetie Green Town Real Estate Development Co., Ltd, Zysteq North America Corporation, Shanghai Tommy Real Estate Development Co., Ltd, Shanghai Tommy & Jane Property Investment and Management Co., Ltd., and Canada & China Real Estate Management Co., Ltd. Mr. Gong was appointed as Economy Advisor by Shanghai Yangpu District Government in 2010. He is the recipient of “2009: China’s Top 10 Intelligent and Financial Person”; “2010: Person of the Year in Overseas Business”, “2013: China’s Top 10 Outstanding Business Leaders”.
Martin Bernholtz, BBA, CA is the Chief Financial Officer of Kerbel Group Inc. since 1988, an integrated construction and land development company. In this capacity, he is responsible for strategy, finance, accounting, taxation and personnel. Mr. Bernholtz has considerable sophisticated business experience in real estate, finance and public markets. He graduated with a Bachelor degree in Business Administration from York University in 1981 and became a Chartered Accountant in 1984. While in practice at Laventhol & Horwath and at BDO Dunwoody, Mr. Berholtz gained considerable experience in the business valuation and litigation support areas. He is a director of several TSX Venture Exchange listed companies including Covalon Technologies Limited, Selectcore Limited, Titan Medical Devices Inc., Loyalist Group Limited, Continental Precious Metals Inc., KGIC Inc. , Imex Systems Inc.,and NanoStruck Technologies Inc. listed on Canadian Securities Exchange.
Robert Martellacci is founder and President, MindShare Learning Technology since 2002 and President and Co-Founder, C21 Canada—Canadians for 21st Century Learning & Innovation. He has over 25 years of expertise in the learning and technology field as an administrator at York University & Country Manager, TLC Canada School Division and MLS. Mr. Martellacci served on the President’s Task Force on the College System at York University. His board appointments include: Past Chair, Canadian eLearning Enterprise Alliance and board member York University Institute on Learning Technology. Mr. Martellacci was also appointed to the ICTC Task Force on Driving Change Education and Skills DigitalTalent2020. Mr. Martellacci was awarded the 2016 Chair’s Global Best Partnership Award for outstanding work nationally and internationally for taking a leadership role in forging strategic partnerships between industry and education. He is also founder and CEO of MindShare WorkSpace, a coworking/innovation space on a mission to redefine the future of work and learning. Mr. Martellacci is a graduate of Pepperdine University with a Masters degree in Educational Technology.
The Directors have served in their respective capacities since their election and/or appointment and will serve until the next Annual General Meeting or until a successor is duly elected, unless the office is vacated in accordance with the Articles/By-Laws of the Company.
The Senior Management serves at the pleasure of the Board of Directors with management service contracts but without term of office, except as disclosed herein.
No Director and/or Executive Officer has been the subject of any order, judgment, or decree of any governmental agency or administrator or of any court or competent jurisdiction, revoking or suspending for cause any license, permit or other authority of such person or of any corporation of which he is a Director and/or Executive Officer, to engage in the securities business or in the sale of a particular security or temporarily or permanently restraining or enjoining any such person or any corporation of which he is an officer or director from engaging in or continuing any conduct, practice, or employment in connection with the purchase or sale of securities, or convicting such person of any felony or misdemeanor involving a security or any aspect of the securities business or of theft or of any felony.
There are no arrangements or understandings between any two or more Directors or Executive Officers, pursuant to which he was selected as a Director or Executive Officer. There are no family relationships between any two or more Directors or Executive Officers.
6.B. Compensation
The table below sets forth information concerning the compensation paid, during each of the last three fiscal years (as applicable), to the Company’s Chief Executive Officer, Chief Financial Officer, and other Executive Officers of the Company and its subsidiaries who received total remuneration, determined on the basis of base salary and bonuses in excess of $100,000 during the last three fiscal years ended December 31 (the “Named Executive Officers”).
Summary Compensation Table
|
|
| |||||||
|
|
|
|
|
|
|
|
| |
|
|
|
|
|
|
|
|
|
|
|
|
|
|
|
|
|
|
|
|
|
|
|
|
|
|
|
|
|
|
Share- | Option- | Non-equity incentive plan compensation | |||||||||||
Name and principal position | Year | Salary ($) | based awards ($) | based awards ($)(2) | Annual incentive plans | Long-term incentive plans(3) | Pension Value ($) | All other compensation ($)(1) | Total compensation ($) | ||||
Michael P. Kraft | 2017 | 120,000 | Nil | 100,000 | Nil | Nil | Nil | 25,854 | 245,854 | ||||
| President, Chief | 2016 | 120,000 | Nil | Nil | Nil | Nil | Nil | 134,198 | 254,198 | ||||
Executive Officer and Director | 2015 | 132,500 | Nil | Nil | Nil | Nil | Nil | 24,191 | 156,691 | ||||
Gali Bar-Ziv | 2017 | 150,000 | Nil | 100,000 | Nil | Nil | Nil | 37,844 | 287,844 | ||||
| Chief Operating | 2016 | 150,000 | Nil | Nil | Nil | Nil | Nil | 42,898 | 192,898 | ||||
| Officer | 2015 | 139,500 | Nil | Nil | Nil | Nil | Nil | 94,167 | 233,667 | ||||
| Khurram | 2017 | 60,000 | Nil | 50,000 | Nil | Nil | Nil | Nil | 110,000 | ||||
| Qureshi | 2016 | 60,000 | Nil | Nil | Nil | Nil | Nil | 7,500 | 67,500 | ||||
Chief Financial Officer | 2015 | 60,000 | Nil | Nil | Nil | Nil | Nil | Nil | 60,000 | ||||
Notes:
(1) | Perquisites and other personal benefits, securities or property that do not in the aggregate exceed the lesser of |
(2) | The weighted average grant date fair value was calculated in accordance with the Black-Scholes model using the common share price on the date of grant, with the key valuation assumptions being stock-price volatility of 79%, risk free interest rate of 1.35%, no dividend yields, and expected life of 5 years. |
(3) | "LTIP" or "long term incentive plan" means any plan which provides compensation intended to serve as incentive for performance to occur over a period longer than one financial year, but does not include option or stock appreciation right plans or plans for compensation through restricted shares or restricted share units. |
Management Agreements
Michael P. Kraft
The Company entered into a consulting agreement (the "Kraft Consulting Agreement") dated as of October 18, 2007 with MPK Inc. pursuant to which the Company engaged MPK Inc. to provide the services of Michael P. Kraft (the "Consultant") to be the President & Chief Executive Officer of the Company. MPK Inc. is a corporation wholly-owned and controlled by Michael P. Kraft.
The Kraft Consulting Agreement provides for an initial term of twenty-four (24) months to begin on January 1, 2008 and was renewed in September 2009, 2011, 2013, 2015 and 2015.2017. (The Kraft Consulting Agreement and Amendment provide that the Company pay MPK Inc. an aggregate of $38,000 plus applicable HST for the Applicable Period. In consideration of the Consultant agreeing to a reduction of consulting fees from $180,000 to $150,000. A further reduction was taken in 2013, from $150,000 to $38,000. The Company agrees to pay the Consultant a cash bonus in the amount of $100,000 upon completion of a merger or acquisition as approved by the board of directors or if the Company’s market capitalization increases from approximately $3,000,000 to $6,000,000.) Further, beginning on January 1, 2014, the Kraft Consulting Agreement resumed to $150,000 per year. A further amendment was entered into whereby the monthly consulting fees were reduced from $12,500 to $10,000 as of June 1, 2015. In addition to providing an allowance for a health plan, the Kraft Consulting Agreement also provides for an automobile allowance of up to $1,500 per month.
Gali Bar-Ziv
The Company entered into a consulting agreement (the "Bar-Ziv Consulting Agreement") dated as of June 1, 2009 with Busy Babies Inc. pursuant to which the Company engaged Busy Babies Inc. to provide the services of Gali Bar-Ziv (the "Consultant") to be the Chief Operating Officer of the Company. Busy Babies Inc. is a corporation wholly-owned and controlled by Gali Bar-Ziv.
The Bar-Ziv Consulting Agreement provided for an initial term of twelve (12) months to begin on June 1, 2009 and automatic renewals for a further one (1) year unless terminated pursuant to the terms thereof. The Bar-Ziv Consulting Agreement provides that the Company pay Busy Babies Inc. an aggregate of $120,000 plus applicable HST for the Applicable Period. In consideration of the Consultant agreeing to a reduction of consulting fees from $144,000 from 2009 to 2012 to $120,000 in 2013 plus reimbursement for certain expenses properly incurred in connection with the Company. An amendment was entered into whereby the monthly consulting fees were increased from $10,000 to $12,500 as of June 1, 2015. The Company agreed to enable the Consultant to participate in the Company’s sales commission program, 7% of net revenue for business initiative, 2% of net revenue for direct influence, other discretionary bonus by the board if applicable. The Bar-Ziv Consulting Agreement also provides for an automobile allowance of $500 per month, mobile phone, and parking allowance.
Khurram Qureshi
Mr. Qureshi is engaged by the Company throughThe Corporation has entered into a consulting agreement (the “Qureshi Consulting Agreement”) dated as of August 1, 2011 with CQK Chartered Accountants LLP (“CQK”), to provide the services of Khurram Qureshi as Chief Financial Officer of the Corporation. CQK Chartered Accountants LLP is a partnership where Mr. Qureshi is a senior partner.
The Qureshi Consulting Agreement provided for an initial term of 12 months to begin on August 1, 2011, and automatically renews for subsequent one-year terms unless terminated in accordance with its terms. The Corporation pays to CQK a month-to-month basis and receivesbase consulting fee of $5,000 per month, plus applicable HST. Mr. Qureshi is eligible for reimbursement for certain expenses properly incurred in connection with the Company’sCorporation’s business. Mr. Qureshi is eligible to receive annual incentive bonuses and grants stock of options pursuant to the Option Plan from time to time, in each case at the discretion of the Board. The Qureshi Consulting Agreement also provides that the Corporation will provide to Mr. Qureshi extended health benefits.
Stock Options
The Company grants stock options to Directors, Senior Management, employees and consultants; refer to ITEM #6.E., "Share Ownership, Stock Options”.
Director Compensation
The non-management directors of the Company are entitled to reimbursement for reasonable travel and other out-of-pocket expenses incurred in connection with attendance at meetings of the Board of Directors. The Board of Directors may award special remuneration to any Director undertaking any special services on behalf of the Company other than services ordinarily required of a Director. Other than indicated below no Director received any compensation for his services as a Director, including committee participation and/or special assignments.
Change of Control Remuneration
Michael P. Kraft
1. | The Consultant may terminate the Kraft Consulting Agreement upon ninety (90) days written notice to the Company and the Company shall pay to the Consultant, all amounts due and owing up to the effective date of termination. The Consultant may also terminate the Kraft Consulting Agreement for the following reasons: (i) a material change in the position, duties and responsibilities of the Consultant; (ii) the Consultant ceases to be the most senior officer of the Company; (iii) any material reduction in the compensation payable to the Consultant in accordance with the terms of the Kraft Consulting Agreement; and (iv) the Company's head office being located more than 50 kilometres from its current location and the Consultant's current residence ("Good Cause"). If the Consultant terminates the Kraft Consulting Agreement for Good Cause the Company shall pay to the Consultant, all amounts due and owing up to the effective date of termination and a settlement amount equal to eighteen (18) months of compensation at the rate of compensation payable to the Consultant immediately prior to the effective date of termination. |
| |
| 2. | The Kraft Consulting Agreement may be terminated by the Company by giving written notice to the Consultant and the Company shall pay to the Consultant, all amounts due and owing up to the effective date of termination and a settlement amount equal to eighteen (18) months of compensation at the rate of compensation payable to the Consultant immediately prior to the effective date of termination. |
| |
| 3. | In the event of a change of control, the Consultant may, for a period of six (6) months after the effective date of any such change of control, elect to terminate the Kraft Consulting Agreement with the Company upon eight weeks’ notice and the Company shall pay to the Consultant, all amounts due and owing up to the effective date of termination and a settlement amount equal to eighteen (18) months of compensation at the rate of compensation payable to the Consultant immediately prior to the effective date of termination by voluntary resignation. In the event of a change of control and if the Company terminates the Consultant without cause, the settlement amount shall be equal to twenty-four (24) months of compensation at the rate of compensation payable to the Consultant immediately prior to the effective date of termination. |
The Consultant is subject to an 18 month non-compete period following the termination of the Kraft Consulting Agreement.
Gali Bar-Ziv
1. | The Consultant may terminate the Bar-Ziv Consulting Agreement upon ninety (90) days written notice to the Company and the Company shall pay to the Consultant, all amounts due and owing up to the effective date of termination. The Consultant may also terminate the Bar-Ziv Consulting Agreement for the following reasons: (i) a material change in the position, duties and responsibilities of the Consultant; (ii) the Consultant ceases to be |
2. | The Bar-Ziv Consulting Agreement may be terminated by the Company by giving written notice to the Consultant and the Company shall pay to the Consultant, all amounts due and owing up to the effective date of termination and a settlement amount equal to |
The Consultant is subject to a nine month non-compete period following the termination of the Bar-Ziv Consulting Agreement.
Khurram Qureshi
| 1. | Mr. Qureshi may terminate the Qureshi Consulting Agreement upon 90 days’ written notice to the Corporation and the Corporation shall pay to CQK Chartered Accountants LLP all amounts due and owing up to the effective date of termination. The Corporation shall pay to CQK Chartered Accountants LLP all amounts due and owing up to the effective date of termination, and a settlement amount equal to three months’ compensation at the rate of compensation payable within 30 days of the termination date. |
2. | The Corporation may terminate the Qureshi Consulting Agreement for convenience by giving written notice to CQK Chartered Accountants LLP and payment by the Corporation of all amounts due and owing up to the effective date of termination plus a settlement amount equal to three months’ compensation at the rate of compensation payable to CQK Chartered Accountants LLP within 30 days of the termination date. |
Other Compensation
NoExcept as set forth above under “Summary Compensation Table”, no Executive Officer/Director received “other compensation” in excess of the lesser of US$25,00010,000 or 10% of such officer's cash compensation, and all Executive Officers/Directors as a group did not receive other compensation which exceeded US$25,00010,000 times the number of persons in the group or 10% of the compensation.
Bonus/Profit Sharing/Non-Cash Compensation
Except for the stock option program discussed in ITEM #6.E., the Company has agreed to pay Michael P. Kraft a cash bonus in the amount of $100,000 upon completion of a merger or acquisition as approved by the board of directors or if the Company’s market capitalization increases from approximately $3,000,000 to $6,000,000. Similarly,#6.E, the Company also agreed to enable Gali Bar-Ziv to participate in the Company’s sales commission program, pursuant to which Mr. Bar-Ziv is to receive 7% of net revenue for business initiative, 2% of net revenue for direct influence, other discretionary bonus by the board if applicable.
Pension/Retirement Benefits
No funds were set aside or accrued by the Company during fiscal 20142017 to provide pension, retirement or similar benefits for Directors or Executive Officers.
6.C. Board Practices
6.C.1. Terms of Office.
The Directors have served in their respective capacities since their election and/or appointment and will serve until the next Annual General Meeting or until a successor is duly elected, unless the office is vacated in accordance with the Articles/By-Laws of the Company.
The Senior Management serves at the pleasure of the Board of Directors with management service contracts but without term of office, except as disclosed herein.
6.C.2. Termination benefits
Not applicable
6.C.3. Board of Director Committees.
The Company has established an Audit Committee, Compensation Committee and Corporate Governance and Nominating Committee in compliance with the Guidelines.
The Audit Committee assists the Board in its oversight of: (i) the integrity of the financial reporting of the Company; (ii) the independence and performance of the Company's external auditors; and (iii) the Company's compliance with legal and regulatory requirements. The members of the Audit Committee during the past fiscal year were Martin Bernholtz (Chairman), Scott Remborg,Tommy Weibing Gong, and Michael Kraft, Messrs. Bernholtz and RemborgGong being independent as defined in the Guidelines. Following the 20152017 shareholder meeting, the Committee was comprised of Martin Bernholtz (Chairman), Scott Remborg,Robert Martellacci, and Michael Kraft, with Messrs. Bernholtz and RemborgMartellacci being independent as defined in the Guidelines.
The Compensation Committee assists the Board in fulfilling its obligations relating to human resource and compensation matters of the Company and its subsidiaries and to establish a plan for the continuity and development of senior management. The members of the Compensation Committee during the past fiscal year were Martin Bernholtz (Chairman), Scott Remborg, and Tommy Gong, all being independent as defined in the Guidelines. Following the 2015 shareholder meeting, the Committee was comprised of Martin Bernholtz (Chairman), Jerry Grafstein, and Tommy Weibing Gong, all being independent as defined in the Guidelines. Following the 2017 shareholder meeting, the Committee was comprised of Jerry Grafstein (Chairman), Martin Bernholtz, and Robert Martellacci, all being independent as defined in the Guidelines.
The Corporate Governance and Nominating Committee assists the Board by: (i) developing, reviewing and planning the Company's approach to corporate governance issues, including developing a set of corporate governance principles and guidelines specifically applicable to the Company; (ii) identifying and recommending to the Board potential new nominees to the Board; (iii) monitoring management's succession plan for the Chief Executive Officer (the "CEO") and other senior management; and (iv) overseeing enforcement of and compliance with the Company's proposed Code of Business Conduct. The members of the Corporate Governance Committee during the past fiscal year were Messrs. Grafstein (Chairman), Bernholtz and Kraft, Messrs. Grafstein and Bernholtz being independent directors as defined in the Guidelines. Following the 20152017 shareholder meeting, the Committee was comprised of Grafstein (Chairman), Scott Remborg,Bernholtz, and Michael Kraft, with Messrs. Grafstein and RemborgTommy Gong all being independent as defined in the Guidelines.
6.E. Share Ownership
Table No. 7 lists, as of April 30, 2016,2018, Directors and Executive Officers who beneficially own the Company's voting securities and the amount of the Company's voting securities owned by the Directors and Executive Officers as a group. Table No. 7 includes all persons/companies where the Company is aware that they have 5% or greater beneficial interest in the Company’s securities.
Table No. 7
Shareholdings of Directors and Executive Officers
Shareholdings of 5% Shareholders
Title of Class | Name of Beneficial Owner | Amount and Nature of Beneficial Ownership(1) | Percent of Class | Name of Beneficial Owner | Amount and Nature of Beneficial Ownership (1) | Percent of Class | ||||||
Common | Michael P. Kraft(2)(4) | 2,069,450(5) | 7% | Michael P. Kraft(2)(3) | 2,804,950 | (5) | 7.89 | % | ||||
Common | Khurram Qureshi | [nil] (6) | * | Khurram Qureshi | 38,606 | (6) | * | |||||
Common | Gali Bar-Ziv | 183,364(7) | * | Gali Bar-Ziv | 242,864 | (7) | * | |||||
Common | Martin Bernholtz(2)(3) | 70,000(8) | * | Martin Bernholtz (2)(3)(4) | 230,000 | (8) | * | |||||
Common | Scott Remborg(2)(3) | 135,372(9) | * | Tommy Gong(4) | [nil] | (9) | * | |||||
Common | Tommy Gong(3) | [nil](10) | * | Jerry Grafstein(3)(4) | 900,000 | (10) | 2.53 | % | ||||
Common | Jerry Grafstein(3)(4) | 668,182(11) | 2.3% | Robert Martellacci(2)(3) | [nil] | (11) | ||||||
Common | Global Telecom Holding SAE | 2,857,143(12) | 9.68% | Global Telecom Holding SAE | 2,857,143 | 8.04 | % | |||||
As a group (8 parties) | As a group (8 parties) | 5,983,511 | 18.98% | As a group (8 parties) | 7,145,125 | 19.91 | % | |||||
* Less than 1%.
(1) | The information as to voting securities beneficially owned, controlled or directed, not being within the knowledge of the Company, has been furnished by the respective individuals. | |
(2) | Member of the Audit Committee. | |
(3) | Member of the Compensation Committee. | |
(4) | Member of the Corporate Governance and Nominating Committee. |
(5) | Of such shares, 95,636 are held in Mr. Kraft's RRSP and | |
(6) |
| |
(7) | Of such shares, 2,000 are held in Mr. Bar-Ziv's RRSP, and | |
(8) | Of such shares, 100,000 are held by Accretive Capital Corp, a company controlled by Mr. Bernholtz. Mr. Bernholtz also holds options to purchase up to an additional | |
(9) |
| |
| Tommy Gong holds options to purchase up to | |
| Of such shares, | |
|
| |
| (11) | Robert Martellacci holds options to purchase up to 80,000 common shares of the Company. |
Stock Options
TSX Venture Exchange Rules and Policies
Incentive options granted by the Company are made in accordance with the rules and policies of the TSX Venture Exchange ("TSX VEN"), including the number of common shares under option, the exercise price and expiration date of such options, and any amendments thereto.
Such terms and conditions, including the pricing of the options, expiration and the eligibility of personnel for such stock options; are described below. The TSX VEN policy in respect of incentive stock options provides that shareholder approval is not required if the aggregate number of common shares that may be reserved for issuance pursuant to incentive stock options does not exceed 10% of the issued common shares of the Company, 5% to any one individual and 2% to any consultant at the time of granting.
Shareholder approval of the grant of incentive stock options is required pursuant to the rules of the TSX VEN where the grant will result in the Company having options outstanding which, in aggregate, are exercisable to acquire over 10% (to a maximum of 20%) of the outstanding common shares of the Company. In addition, disinterested shareholders (all shareholders excluding insiders and associates of insiders) approval is required pursuant to the rules of the TSX VEN where:
(a) grant of incentive stock options could result at any time in:
(i) | the Company having options outstanding to insiders which, in aggregate, are exercisable to acquire over 20% of the outstanding common shares of the Company; or | |
(ii) | the issuance to insiders, within a one year period, of common shares which, in aggregate, exceed 10% of the outstanding common shares of the Company; or | |
(iii) | the issuance to any one insider and such insider's associates, within a one year period, of common shares which, in aggregate, exceed 5% of the outstanding common shares of the Company; or | |
(iv) | the issuance to any consultant of common shares which, in aggregate, exceed 2% of the outstanding common shares of the Company; or |
(b) the Company is proposing to decrease the exercise price of stock options held by any insiders.
Company Stock Option Plan
The Board has approved aan amended stock option plan (the "Stock Option Plan") on November 3, 2017 whereby options may be granted to directors, officers, employees, consultants of the Company and its subsidiaries. The number of shares which may be reserved for issuance under the Stock Option Plan is limited to 4,108,6357,105,838 common shares, representing approximately 20% of the issued and outstanding common shares of the Company as at November 3, 2011.2017.
The maximum number of common shares which may be reserved for issuance in a 12 month period to any one individual under the Stock Option Plan, shall not, in the aggregate, exceed 5% of the issued and outstanding common shares of the Company at the time of grant. The maximum number of common shares which may be reserved for issuance in a 12 month period to any consultants and persons engaged in investor relations activities for the Company, shall not, in the aggregate, exceed 2% of the issued and outstanding common shares at the time of grant. Any common shares subject to a prior option granted under the Stock Option Plan which for any reason are cancelled or terminated prior to exercise will be available for a subsequent grant under the Stock Option Plan.
The option price of any common shares cannot be less than the closing price of the shares on the day immediately preceding the day upon which the option is granted less any permitted discount. Options may be granted under the Stock Option Plan to be exercisable for a maximum period of ten years, subject to earlier termination, upon the termination of the optionee’s employment, upon the optionee ceasing to be an employee, officer, director or consultant of the Company or any of its subsidiaries, as applicable, or upon the optionee retiring, becoming permanently disabled or dying. The options under the Stock Option Plan are non-transferable. The Stock Option Plan contains provisions for adjustment in the number of shares issuable thereunder in the event of a subdivision, consolidation, reclassification or change of the common shares, a merger or other relevant changes in the Company’s capitalization.
As of the date hereof, options to purchase an aggregate of 3,767,5003,999,000 common shares are outstanding under the Stock Option Plan.
The names and titles of the Directors/Executive Officers of the Company to whom outstanding stock options have been granted and the number of common shares subject to such options are set forth in the Table below as of April 30, 2016,2018, as well as the number of options granted to Directors and officers as a group.
Stock Options Outstanding
Expressed in Canadian Dollars
|
|
| ||||
|
|
|
| |||
|
|
|
| |||
|
|
|
| |||
|
|
|
| |||
|
|
|
| |||
|
|
|
| |||
|
|
|
|
Number of securities underlying unexercised options (#) | Option exercise price (C$) | Option expiration date | |||
Michael P. Kraft President, Chief Executive Officer and Director | 1,000,000 | 0.20 | December 12, 2020 | ||
Gali Bar-Ziv Chief Operating Officer | 1,000,000 | 0.20 | December 12, 2020 | ||
Khurram Qureshi Chief Financial Officer | 500,000 | 0.20 | December 12, 2020 | ||
Jerry Grafstein Director | 450,000 | 0.20 | December 12, 2020 | ||
Tommy Weibing Gong Director | 290,000 | 0.20 | December 12, 2020 | ||
Robert Martellacci Director | 80,000 | 0.20 | December 12, 2020 | ||
Martin Bernholtz Director | 470,000 | 0.20 | December 12, 2020 | ||
ITEM 7. MAJOR SHAREHOLDERS AND RELATED PARTY TRANSACTIONS
7.A. Major Shareholders
7.A.1.a. Holdings By Major Shareholders
Refer to ITEM #6.E.
7.A.1.b. Significant Changes in Major Shareholders’ Holdings
None.
7.A.1.c. Different Voting Rights
None.
7.A.2. Canadian Share Ownership
As of April 30, 2016,2018, the Company’s registered shareholders’ list showed34,829,943showed 35,529,192 common shares outstanding with 4631 registered shareholders,with 31,424,73332,082,315 shares owned by 3620 shareholders residing in Canada, 383,909425,576 shares owned by 45 registered shareholders in US and 3,021,301 shares owned by 6 foreign registered shareholders.
7.A.3. Control of Company.
The Company is a publicly owned Canadian corporation, the shares of which are owned by U.S. residents, Canadian residents and other foreign residents. The Company is not controlled by any foreign government or other person(s).
7.A.4. Change in Control
None.
7.B. Related Party Transactions
During the year, the Company had the following transactions with related parties, made in the normal course of operations, and accounted for at an amount of consideration established and agreed to by the Company and related parties.
(a) | The Company charged |
(b) | Key management compensation was |
(c) | At the year end, the Company had loans payable bearing interest at |
Other than as disclosed above, there have been no transactions since December 31, 20152017 or proposed transactions, which have materially affected or will materially affect the Company in which any director, executive officer, or beneficial holder of more than 10% of the outstanding common stock, or any of their respective relatives, spouses, associates or affiliates has had or will have any direct or material indirect interest. Management believes the transactions referenced above were on terms at least as favorable to the Company as the Company could have obtained from unaffiliated parties.
ITEM 8. FINANCIAL INFORMATION
8.A. 1-6 Consolidated Statements and Other Financial Information
The Company's financial statements are prepared in accordance with International Financial Reporting Standards (“IFRS”) as issued by the International Accounting Standards Board (“IASB”) and interpretations of the International Financial Reporting Interpretations Committee (“IFRIC”).
The financial statements as required under ITEM #18 are attached hereto and found immediately following the text of this Annual Report. The audit reports of Collins Barrow Toronto LLP are included herein immediately preceding the financial statements and schedules.
Audited Financial Statements for Fiscal 20152017 and Fiscal 20142016
8.A.7. Legal/Arbitration Proceedings
The Directors and the management of the Company do not know of any material, active or pending, legal proceedings against them; nor is the Company involved as a plaintiff in any material proceeding or pending litigation. The Directors and the management of the Company know of no active or pending proceedings against anyone that might materially adversely affect an interest of the Company.
8.A.8 Company Policy on Dividend Distribution
The Company does not intend to pay dividends in cash or in kind in the foreseeable future. The Company expects to retain any earnings to finance the further growth of the Company. The directors of the Company will determine if and when dividends should be declared and paid in the future based upon the earnings and financial conditions of the Company at the relevant time and such other factors as the directors may deem relevant. All of the Common Shares of the Company are entitled to an equal share in any dividends declared and paid.
8.B. Significant Changes
None.
ITEM 9. THE OFFER AND LISTING
9.A.1-3. Not applicable
9.A.4. Common Share Trading Information
The Company's common shares began trading on the Alberta Stock Exchange in Calgary, Alberta, Canada under its former name Alpha Ventures Inc. in November 1996. The Alberta Stock Exchange was absorbed by the Canadian Venture Exchange, which in turn was absorbed by the TSX Venture Exchange (“Exchange”). The Company’s listing was automatically transferred from the Alberta Stock Exchange to the Exchange as a Tier 2 company.Thecompany. The current stock symbol on the Exchange is “LM”. The CUSIP number is 5357441065.
The Exchange currently classifies Issuers into different tiers based on standards, including historical financial performance, stage of development and financial resources of the Issuer at the time of listing. Specific Minimum Listing Requirements for each industry segment in each of Tier 1, Tier 2 and Tier 3 have also been established by the Exchange.
Policy 2.1 of the Exchange outlines the Minimum Listing Requirements for each industry segment in Tier 1 and Tier 2. Under this policy, Lingo Media Corporation is a Tier 2 Issuer in the industry segment category of Junior Industrial. Each industry segment is further divided into categories. Quantitative minimum requirements for listing for the industry segment Junior Industrial and Tier 2 are provided in Section 4.3 of Exchange Policy 2.1.
Similarly, Policy 2.5 of the Exchange sets out the minimum standards to be met by Issuers to continue to qualify for listing in each Tier, referred to as Tier Maintenance Requirements (“TMR”). A Tier 2 Issuer which fails to meet one of the Tier 2 TMR will not automatically be suspended or designated as “Inactive”. Rather, the Exchange will provide notice of failure to meet one of the Tier 2 TMR and will allow the Issuer 6 months from the date of notice to meet the requirement, failing which the Exchange may designate the Issuer as Inactive. If a Tier 2 Issuer fails to meet more than one Tier 2 TMR, notice will be given to the Issuer by the Exchange and if the requirements are not met within 90 days of the notice, the Exchange will designate the Issuer as Inactive and apply the restrictions on Inactive Issuers retroactively. An Inactive Issuer may continue to trade on Tier 2 of the Exchange for 18 months from the date it is designated as Inactive. If the Issuer does not meet all of the applicable Tier 2 TMR within that 18 month period, its listed shares may be suspended from trading by the Exchange.
To maintain a listing as an active Tier 2 Issuer, an Issuer must meet all Tier 2 TMR for its industry segment as set out in Section 4 of the Exchange Policy 2.5.
Table No. 9 lists the volume of trading and high, low and closing sales prices on the TSX Venture Exchange for the Company's common shares for: the last 12 months, the last twelve fiscal quarters; and the last five fiscal years.
Table No. 9
TSX Venture Exchange
Common Shares Trading Activity
| Period | Sales -- Canadian Dollars | |||||||||||||
| Ended | Volume | High | Low | Close | ||||||||||
| Monthly | ||||||||||||||
March 2018 | 183,100 | 0.14 | 0.12 | 0.13 | ||||||||||
February 2018 | 178,900 | 0.16 | 0.12 | 0.13 | ||||||||||
January 2018 | 746,500 | 0.18 | 0.15 | 0.16 | ||||||||||
December 2017 | 824,300 | 0.20 | 0.16 | 0.17 | ||||||||||
November 2017 | 1,387,300 | 0.21 | 0.17 | 0.18 | ||||||||||
October 2017 | 1,228,200 | 0.33 | 0.19 | 0.19 | ||||||||||
September 2017 | - | 0.33 | 0.33 | 0.33 | ||||||||||
August 2017 | 318,600 | 0.33 | 0.28 | 0.33 | ||||||||||
July 2017 | 746,000 | 0.31 | 0.27 | 0.31 | ||||||||||
June 2017 | 3,466,000 | 0.36 | 0.23 | 0.27 | ||||||||||
May 2017 | 3,089,600 | 0.28 | 0.22 | 0.24 | ||||||||||
April 2017 | 2,074,200 | 0.38 | 0.28 | 0.28 | ||||||||||
| Yearly | ||||||||||||||
12/31/2017 | 20,076,100 | 0.39 | 0.16 | 0.17 | ||||||||||
12/31/2016 | 35,450,000 | 1.19 | 0.185 | 0.225 | ||||||||||
12/31/2015 | 26,356,600 | 0.94 | 0.1 | 0.93 | ||||||||||
12/31/2014 | 1,887,900 | 0.25 | 0.07 | 0.11 | ||||||||||
12/31/2013 | 2,395,000 | 0.27 | 0.08 | 0.11 | ||||||||||
| Quarterly | ||||||||||||||
3/31/2018 | 1,108,500 | 0.18 | 0.12 | 0.13 | ||||||||||
12/31/2017 | 3,439,800 | 0.33 | 0.16 | 0.17 | ||||||||||
9/30/2017 | 1,064,600 | 0.33 | 0.27 | 0.33 | ||||||||||
6/30/2017 | 8,629,800 | 0.38 | 0.22 | 0.27 | ||||||||||
3/31/2017 | 6,940,000 | 0.395 | 0.19 | 0.375 | ||||||||||
12/31/2016 | 10,530,000 | 0.54 | 0.185 | 0.225 | ||||||||||
9/30/2016 | 6,080,000 | 0.66 | 0.38 | 0.54 | ||||||||||
6/30/2016 | 13,850,000 | 1.19 | 0.45 | 0.57 | ||||||||||
3/31/2016 | 4,990,700 | 0.97 | 0.61 | 0.86 | ||||||||||
12/31/2015 | 12,823,300 | 0.94 | 0.37 | 0.93 | ||||||||||
9/30/2015 | 11,956,000 | 0.60 | 0.22 | 0.38 | ||||||||||
6/30/2015 | 1,086,300 | 0.26 | 0.10 | 0.26 | ||||||||||
| Period | Sales -- Canadian Dollars | |||
| Ended | Volume | High | Low | Close |
| Monthly | ||||
March 2016 | 1,402,900 | 0.97 | 0.75 | 0.86 |
February 2016 | 1,144,000 | 0.87 | 0.69 | 0.78 |
January 2016 | 2,287,100 | 0.95 | 0.61 | 0.86 |
December 2015 | 4,060,000 | 0.94 | 0.72 | 0.93 |
November 2015 | 3,642,500 | 0.78 | 0.56 | 0.74 |
October 2015 | 5,120,800 | 0.60 | 0.37 | 0.58 |
September 2015 | 3,818,200 | 0.44 | 0.34 | 0.38 |
August 2015 | 6,499,900 | 0.60 | 0.24 | 0.41 |
July 2015 | 1,637,900 | 0.29 | 0.22 | 0.26 |
June 2015 | 504,100 | 0.26 | 0.21 | 0.26 |
May 2015 | 308,700 | 0.25 | 0.19 | 0.24 |
April 2015 | 273,500 | 0.24 | 0.1 | 0.24 |
| Yearly | ||||
12/31/2015 | 26,356,600 | 0.94 | 0.1 | 0.93 |
12/31/2014 | 1,887,900 | 0.25 | 0.07 | 0.11 |
| 12/31/2013 | 2,395,000 | 0.27 | 0.08 | 0.11 |
12/31/2012 | 2,435,000 | 0.45 | 0.16 | 0.27 |
12/31/2011 | 3,030,500 | 0.95 | 0.24 | 0.35 |
| Quarterly | ||||
3/31/2016 | 4,990,700 | 0.97 | 0.61 | 0.86 |
12/31/2015 | 12,823,300 | 0.94 | 0.37 | 0.93 |
9/30/2015 | 11,956,000 | 0.60 | 0.22 | 0.38 |
6/30/2015 | 1,086,300 | 0.26 | 0.10 | 0.26 |
3/31/2015 | 491,000 | 0.16 | 0.10 | 0.10 |
12/31/2014 | 340,400 | 0.15 | 0.10 | 0.11 |
9/30/2014 | 342,200 | 0.17 | 0.11 | 0.13 |
6/30/2014 | 559,000 | 0.25 | 0.12 | 0.17 |
3/31/2014 | 646,300 | 0.22 | 0.08 | 0.21 |
12/31/2013 | 1,031,200 | 0.15 | 0.10 | 0.11 |
09/30/2013 | 411,100 | 0.15 | 0.08 | 0.10 |
06/30/2013 | 403,900 | 0.23 | 0.10 | 0.12 |
The Company's shares became quoted for trading on the OTCQB MarketplaceOTC Market on January 22, 2014. OTC Markets halted trading in the Company’s shares on August 29, 2017 because of a regulatory trading halt placed by the TSX Venture Exchange. While the TSX Venture Exchange has released its regulatory halt of trading, OTC Markets has not yet done so.
Table No.10 lists the volume of trading and high, low and closing sales prices on the OTCQB MarketplaceOTC Market for the Company's common shares for the last 12 months, the last twelve fiscal quarters; and the last five fiscal years.
Table No. 10
OTCQB MarketplaceOTC Markets
Common Shares Trading Activity
| Period | Sales -- US Dollars | |||
| Ended | Volume | High | Low | Close |
| Monthly | ||||
March 2016 | 86,800 | 0.7 | 0.56 | 0.68 |
February 2016 | 8,600 | 0.0.58 | 0.49 | 0.56 |
January 2016 | 112,100 | 0.67 | 0.43 | 0.56 |
December 2015 | 109,600 | 0.67 | 0.53 | 0.67 |
November 2015 | 253,900 | 0.58 | 0.43 | 0.55 |
October 2015 | 502,600 | 0.46 | 0.29 | 0.44 |
September 2015 | 218,100 | 0.33 | 0.26 | 0.28 |
August 2015 | 254,100 | 0.34 | 0.2 | 0.3 |
July 2015 | 130,300 | 0.23 | 0.17 | 0.22 |
June 2015 | 0 | 0.19 | 0.19 | 0.19 |
May 2015 | 28,800 | 0.19 | 0.14 | 0.19 |
April 2015 | 54,400 | 0.2 | 0.09 | 0.2 |
| Yearly | ||||
12/31/2015 | 1,551,800 | 0.67 | 0.09 | 0.67 |
12/31/2014 | 18,400 | 0.12 | 0.08 | 0.12 |
12/31/2013 | 29,600 | 0.26 | 0.07 | 0.10 |
12/31/2012 | 97,200 | 0.37 | 0.23 | 0.26 |
12/31/2011 | 137,246 | 0.99 | 0.26 | 0.26 |
| Quarterly | ||||
03/31/2016 | 207,500 | 0.7 | 0.43 | 0.56 |
12/31/2015 | 866,100 | 0.67 | 0.29 | 0.67 |
09/30/2015 | 602,500 | 0.34 | 0.17 | 0.28 |
06/30/2015 | 83,200 | 0.2 | 0.19 | 0.19 |
03/31/2015 | 0 | 0.12 | 0.12 | 0.12 |
12/31/2014 | 900 | 0.12 | 0.11 | 0.12 |
09/30/2014 | 300 | 0.12 | 0.11 | 0.11 |
06/30/2014 | 3,500 | 0.12 | 0.08 | 0.12 |
03/31/2014 | 13,900 | 0.10 | 0.08 | 0.08 |
12/31/2013 | 3,500 | 0.14 | 0.09 | 0.10 |
09/30/2013 | 22,500 | 0.13 | 0.07 | 0.09 |
06/30/2013 | 3,600 | 0.26 | 0.13 | 0.13 |
3/31/2013 | 0 | 0.26 | 0.26 | 0.26 |
12/31/2012 | 1,700 | 0.26 | 0.23 | 0.26 |
9/30/2012 | 1,400 | 0.26 | 0.23 | 0.23 |
6/30/2012 | 93,900 | 0.37 | 0.25 | 0.26 |
| Period | Period Sales -- US Dollars | |||||||||||||
| Ended | Volume | High | Low | Close | ||||||||||
| Monthly | ||||||||||||||
March 2018 | 714 | 0.13 | 0.09 | 0.09 | ||||||||||
February 2018 | - | 0.13 | 0.13 | 0.13 | ||||||||||
January 2018 | - | 0.13 | 0.13 | 0.13 | ||||||||||
December 2017 | 101,000 | 0.13 | 0.13 | 0.13 | ||||||||||
November 2017 | 9,100 | 0.18 | 0.13 | 0.13 | ||||||||||
October 2017 | 20,000 | 0.24 | 0.18 | 0.18 | ||||||||||
September 2017 | 1,500 | 0.24 | 0.23 | 0.24 | ||||||||||
August 2017 | 68,000 | 0.24 | 0.21 | 0.23 | ||||||||||
July 2017 | 76,000 | 0.26 | 0.21 | 0.24 | ||||||||||
June 2017 | 138,320 | 0.26 | 0.16 | 0.26 | ||||||||||
May 2017 | 77,900 | 0.20 | 0.16 | 0.16 | ||||||||||
April 2017 | 90,534 | 0.28 | 0.22 | 0.22 | ||||||||||
| Yearly | ||||||||||||||
12/31/2017 | 854,134 | 0.29 | 0.13 | 0.13 | ||||||||||
12/31/2016 | 52,730 | 0.759 | 0.126 | 0.253 | ||||||||||
12/31/2015 | 1,551,800 | 0.67 | 0.09 | 0.67 | ||||||||||
12/31/2014 | 18,400 | 0.12 | 0.08 | 0.12 | ||||||||||
12/31/2013 | 29,600 | 0.26 | 0.07 | 0.10 | ||||||||||
| Quarterly | ||||||||||||||
3/31/2018 | 714 | 0.13 | 0.09 | 0.09 | ||||||||||
12/31/2017 | 130,100 | 0.24 | 0.13 | 0.13 | ||||||||||
9/30/2017 | 145,500 | 0.26 | 0.21 | 0.24 | ||||||||||
6/30/2017 | 306,754 | 0.28 | 0.16 | 0.26 | ||||||||||
3/31/2017 | - | 0.258 | 0.129 | 0.253 | ||||||||||
12/31/2016 | 47,730 | 0.34 | 0.126 | 0.141 | ||||||||||
9/30/2016 | - | 0.409 | 0.239 | 0.314 | ||||||||||
6/30/2016 | 5,000 | 0.759 | 0.367 | 0.367 | ||||||||||
03/31/2016 | 207,500 | 0.70 | 0.43 | 0.56 | ||||||||||
12/31/2015 | 866,100 | 0.67 | 0.29 | 0.67 | ||||||||||
09/30/2015 | 602,500 | 0.34 | 0.17 | 0.28 | ||||||||||
06/30/2015 | 83,200 | 0.20 | 0.19 | 0.19 | ||||||||||
The Company's common shares became quoted for trading on the Berlin-Bremen Stock Exchange on August 20, 2003. No trades of the Company's common shares have taken place on the Berlin-Bremen Stock Exchange to this date.
9.A.5. Common Share Description
Not Applicable
9.C. Stock Exchanges Identified
The common shares trade on the TSX Venture Exchange, OTCQBandOTC Market and are quoted for trading on the Berlin-Bremen Stock Exchange.
9.B, D-F. Not applicable
ITEM 10. ADDITIONAL INFORMATION
10.A. Share Capital
Not Applicable
10.B. Memorandum and Articles of Association
Objects and Purposes
The Company’s corporation number as assigned by the Ontario Ministry of Consumer and Commercial Relations is 4020-1165. The Company’s Articles of Incorporation do not contain the Company’s purpose or its objectives, as neither is required under the laws of Ontario.
Disclosure of Interest of Directors
No director of the Company is permitted to vote on any resolution to approve a material contract or transaction in which such director has a material interest.
Subject to the Articles of Incorporation and any unanimous shareholder agreement, the board may fix their remuneration.
Borrowing Powers of Directors, ByLawsBy-Laws - Section 3.10
The board of directors may from time to time:
(i) | borrow money upon the credit of the Corporation; |
(ii) | issue, reissue, sell or pledge debt obligations of the Corporation; |
(iii) | subject to the Business Corporations Act (Ontario), give a guarantee on behalf of the Corporation to secure performance of an obligation of any person; and |
(iv) | mortgage, hypothecate, pledge or otherwise create a security interest in all or any property of theCorporation, owned or subsequently acquired, to secure any debt obligations of the Corporation. |
Delegation of Power to Borrow, Bylaws – Section 3.11
The board may by resolution delegate all or any of the powers conferred on them by paragraphs (i) and (iii) of section 3.10 of the bylaws, to any one or more of the directors, the Managing Director, the executive committee, the Chairman of the Board (if any), the President, any Vice-President, the Secretary, the Treasurer, any Assistant Secretary, any Assistant Treasurer or the General Manager.
Director Qualification and Retirement
Neither the Articles of Incorporation nor the Bylaws of the Company discuss the retirement or non-retirement of directors under an age limit requirement, and there is no number of shares required for director qualification.
Description of Rights, Preferences and Restrictions
Attaching to Each Class of Shares
a) | Class/Number of Shares. The Company’s Articles of Incorporation provide that: the Corporation is authorized to issue two classes of shares, namely an unlimited number of Preferred Shares without nominal or par value (“Preferred Shares”) and an unlimited number of Common Shares (“Common Shares”). |
b) | Common Shares. The holders of Common Shares shall be entitled: |
1) | to vote at all meetings of shareholders, except meetings at which only holders of a specified class of shares are entitled to vote, and on every poll taken at every such meeting, or adjourned meeting, every holder of Common Shares shall be entitled to one vote in respect of each Common Share held; and |
2) | subject to the rights of the holders of Preferred Shares, to receive the remaining property of the Corporation upon a dissolution; and |
3) | subject to the rights of the holders of Preferred Shares, to receive all other dividends declared by the Corporation. |
c) | Preferred Shares. The Preferred Shares as a class shall carry and be subject to the following rights, privileges, restrictions and conditions: |
1) | Directors’ Rights to Issue in One or More Series. | |
| The Preferred Shares may at any time or from time to time be issued in one or more series, each series to consist of such number of shares as may before the issue thereof be determined by the Directors by resolution; the Directors of the Company may (subject as hereinafter provided) by resolution fix, from time to time before the issued thereof, the designation, rights, privileges, restrictions and conditions attaching to the shares of such series including, without limiting the generality of the foregoing (1) the issue price, (2) the rate, amount or method of calculation of dividends and whether the same are subject to change of dividends and whether the same are subject to change or adjustment, (3) whether such dividends shall be cumulative, non-cumulative or partly cumulative, (4) the dates, manner and currencies of payments of dividends and the dates from which dividends shall accrue, (5) the redemption and/or purchase prices and terms and conditions of redemption and/or purchase, with or without provision for sinking or similar funds, (6) conversion and/or exchange and/or classification rights, (7) the voting rights if any, and/or (8) other provisions, the whole subject to the following provisions, and to the issue of Certificate(s) of Amendment setting forth such designations, rights, privileges, restrictions and conditions attaching to the shares of each series. |
2) | Ranking of Preferred Shares. | |
| The Preferred Shares shall be entitled to preference over the Common Shares of the Corporation and over any other shares ranking junior to the Preferred Shares with respect to payment of dividends and distribution of assets in the event of liquidation, dissolution or winding-up of the Corporation, whether voluntary or involuntary, or any other distribution of the assets of the Corporation among its shareholders for the purpose of winding up its affairs and may also be given such other preferences not inconsistent with paragraphs (1) and (2) hereof over the Common Shares of the Corporation and over any other shares ranking junior to the Preferred Shares as may be determined in the case of each series of Preferred Shares authorized to be issued. |
3) | Amendment with Approval of Holders of Preferred Shares. | |
| The rights, privileges, restrictions and conditions attaching to the Preferred Shares as a class may be repealed, altered, modified, amended or amplified by Certificate(s) of Amendment, but in each case with the approval of the holders of Preferred Shares (only as a class but not as individual series) given as hereinafter specified. |
4) | Approval of Holders of Preferred Shares. | |
| Subject to the Provisions of the Business Corporations Act, any consent or approval given by the holders of Preferred Shares as a class shall be deemed to have been sufficiently given if it shall have been given in writing by the holders of at least sixty-six and two-thirds percent (66²/³%) of the outstanding Preferred Shares or by a resolution passed at a meeting of holders of Preferred Shares duly called and held upon not less than fifteen days’ notice at which the holders of at least a majority of the outstanding Preferred Shares are present or are represented by proxy and carried by the affirmative vote of not less than sixty-six and two-thirds percent of the votes cast at such meetings, in addition to any other consent or approval required by the Business Corporation Act. If at any such meeting the holders of a majority of the outstanding Preferred Shares are not present or represented by proxy within one-half hour after the time appointed for such meeting, then the meeting shall be adjourned to such date not less than fifteen days thereafter and to such time and place as may be designated by the Chairman, and not less than ten days’ written notice shall be given of such adjourned meeting. At such adjourned meeting, the holders of the Preferred Shares present or represented by proxy may transact the business for which the meeting was originally convened and a resolution passed by the affirmative vote of not less than sixty-six and two-thirds percent of the votes cast at such meeting shall constitute the consent or approval of the holders of Preferred Shares. On every poll taken at every meeting, every holder of Preferred Shares shall be entitled to one vote in respect of each share held. Subject to the foregoing, the formalities to be observed in respect of the giving or waiving of notice of any such meeting and the conduct thereof shall be those from time to time prescribed in the Bylaws of the Corporation with respect to meetings of shareholders. Any consent or approval given by the holders of Preferred Shares or a series as a class shall be deemed to have been sufficiently given if in the same manner as provided herein regarding holders of Preferred Shares as a class. |
d) | Dividend Rights. The Company’s Bylaws provide that holders of common shares shall be entitled to receive dividends and the Company shall pay dividends thereon, as and when declared by the board of directors of the Company out of moneys properly applicable to the payment of dividends, in such amount and in such form as the board of directors may from time to time determine and all dividends which the directors may declare on the common shares shall be declared and paid in equal amounts per share on all common shares at the time outstanding, subject to the prior rights of any shares ranking senior to the common shares with respect to priority in the payment of dividends. |
e) | Voting Rights. Neither the Company’s Bylaws nor its Articles of Incorporation provide for the election or re-election of directors at staggered intervals. |
f) | Redemption Provisions. The Company may purchase any of its issued common shares subject to the provisions of the Ontario Business Corporations Act. |
g) | Sinking Fund Provisions. Neither the Company’s Articles of Incorporation nor its Bylaws contain sinking fund provisions. |
h) | Liability to Further Capital Calls by the Company. Neither the Company’s Articles of Incorporation nor its Bylaws contain provisions allowing the Company to make further capital calls with respect to any shareholder of the Company. |
i) | Discriminatory Provisions Based on Substantial Ownership. Neither the Company’s Articles of Incorporation nor its Bylaws contain provisions that discriminate against any existing or prospective holders of securities as a result of such shareholder owning a substantial number of shares. |
j) | Miscellaneous Provisions. Neither the Articles of Incorporation nor the Bylaws of the Company address the process by which the rights of holders of stock may be changed. The general provisions of the Ontario Business Corporations Act apply to this process, and require shareholder meetings and independent voting for such changes. |
A meeting of shareholders may be called at any time by resolution or by the Chairman of the Board or by the President and the Secretary shall cause notice of a meeting of shareholders to be given when directed so to do by resolution of the board or by the Chairman or the Board or the President.
The board shall call an annual meeting of the shareholders not later than eighteen (18) months after the Corporation comes into existence and subsequently not later than fifteen (15) months after holding the last preceding annual meeting.
A special meeting of shareholders may be called at any time and may be held in conjunction with an annual meeting of shareholders.
Meeting of shareholders shall be held at the place within Canada determined by the board from time to time. Notwithstanding the above subsection, a meeting of shareholders may be held outside Canada if all the shareholders entitled to vote at that meeting so agree, and a shareholder who attends a meeting of shareholders held outside Canada is deemed to have so agreed except when he attends the meeting for the express purpose of objecting to the transaction of any business on the grounds that the meeting is not lawfully held.
Neither the Articles of Incorporation nor the Bylaws of the Company discuss limitations on the rights to own securities or exercise voting rights thereon.
Although not expressly enumerated in the Articles, pursuant to Canadian regulations, shareholder ownership must be disclosed by any shareholder who owns more than 10% of the Company’s common stock.
There is no provision of the Company’s Articles of Incorporation or Bylaws that would delay, defer or prevent a change in control of the Company, and that would operate only with respect to a merger, acquisition, or corporate restructuring involving the Company (or any of its subsidiaries). The Company’s Bylaws do not contain a provision indicating the ownership threshold above which shareholder ownership must be disclosed. With respect to the matters discussed in this Item 10B, the law applicable to the Company is not significantly different from United States law. Neither the Articles of Incorporation nor Bylaws contain provisions governing changes in capital that are more stringent than the conditions required by law.
The Ontario Business Corporations Act contains provisions that require a "special resolution" for effecting certain corporate actions. Such a "special resolution" requires a three-quarters vote of shareholders rather than a simple majority for passage. The principle corporate actions for which the Company would require a "special resolution" include:
a. | Changing its name; |
b. | Changing the place where its registered office is situated; |
c. | Adding, changing or removing any restriction on the business or businesses that the corporation may carry on; |
d. | Certain reorganizations of the corporation and alterations of share capital; |
e. | Increasing or decreasing the number of directors or the minimum or maximum number of directors; |
f. | Any amendment to its articles regarding constraining the issue or transfer of shares to persons who are not resident Canadians; and |
g. | Dissolution of the corporation. |
10.C. Material Contracts
Not Applicable
10.D. Exchange Controls
Except as discussed in ITEM #10.E., the Company is unaware of any Canadian federal or provincial laws, decrees, or regulations that restrict the export or import of capital, including foreign exchange controls, or that affect the remittance of dividends, interest or other payments to non-Canadian holders of the common shares. The Company is unaware of any limitations on the right of non-Canadian owners to hold or vote the common shares imposed by Canadian federal or provincial law or by the charter or other constituent documents of the Company.
10.E. Taxation
A brief description of provisions of the tax treaty between Canada and the United States is included below, together with a brief outline of certain taxes, including withholding provisions, to which United States security holders are subject under existing laws and regulations of Canada. The consequences, if any, of provincial, state and local taxes are not considered.
Security holders should seek the advice of their own tax advisors, tax counsel or accountants with respect to the applicability or effect on their own individual circumstances of the matters referred to herein and of any provincial, state or local taxes.
IRS Circular 230 Disclosure: To ensure compliance with requirements imposed by the US Internal Revenue Service, please be advised that any information on U.S. federal taxation contained in this report (including any exhibit hereto) is not intended or written to be used or relied upon, and cannot be used or relied upon, for the purpose of (i) avoiding penalties under the Internal Revenue Code, or (ii) promoting, marketing or recommending to another party any transaction or matter addressed herein.
Material Canadian Federal Income Tax Consequences
The discussion under this heading relates to the principal Canadian federal income tax consequences of acquiring, holding and disposing of shares of common stock of the Company for a shareholder of the Company who is not a resident of Canada but is a resident of the United States and who will acquire and hold shares of common stock of the Company as capital property for the purposes of theIncome Tax Act(Canada) (the “Canadian Tax Act”). This summary does not apply to a shareholder who carries on business in Canada through a “permanent establishment” situated in Canada or performs independent personal services in Canada through a fixed base in Canada if the shareholder’s holding in the Company is effectively connected with such permanent establishment or fixed base. This information is based on the provisions of the Canadian Tax Act and the regulations thereunder and on an understanding of the administrative practices of Canada Revenue Agency, and takes into account all specific proposals to amend the Canadian Tax Act or regulations made by the Minister of Finance of Canada as of the date hereof. This discussion is not a substitute for independent advice from a shareholder’s own Canadian and U.S. tax advisors.
The provisions of the Canadian Tax Act are subject to income tax treaties to which Canada is a party, including the Canada-United States Income Tax Convention (1980), as amended (the “Convention”).
Dividends on Common Shares and Other Income.Under the Canadian Tax Act, a non-resident of Canada is subject to Canadian withholding tax at the rate of 25 percent on dividends paid or deemed to have been paid to him or her by a corporation resident in Canada. The Convention limits the rate to 15 percent if the shareholder is a resident of the United States and the dividends are beneficially owned by and paid to such shareholder, and to 5 percent if the shareholder is also a corporation that beneficially owns at least 10 percent of the voting stock of the payor-corporation.
The amount of a stock dividend (for tax purposes) would be equal to the amount by which the paid up or stated capital of the Company had increased because of the payment of such dividend. The Company will furnish additional tax information to shareholders in the event of such a dividend. Interest paid or deemed to be paid on the Company’s debt securities held by non-Canadian residents may also be subject to Canadian withholding tax, depending upon the terms and provisions of such securities and any applicable tax treaty.
The Convention exempts from Canadian income tax dividends paid to a religious, scientific, literary, educational or charitable organization or to an organization constituted and operated exclusively to administer a pension, retirement or employee benefit fund or plan, if the organization is a resident of the United States and is exempt from income tax under the laws of the United States.
Dispositions of Common Shares.Under the Canadian Tax Act, a taxpayer’s capital gain or capital loss from a disposition of a share of common stock of the Company is the amount, if any, by which his or her proceeds of disposition exceed (or are exceeded by, respectively) the aggregate of his or her adjusted cost base of the share and reasonable expenses of disposition. One-half of a capital gain (the “taxable capital gain”) is included in income, and one-half of a capital loss in a year (the “allowable capital loss”) is deductible from taxable capital gains realized in the same year. The amount by which a shareholder’s allowable capital loss exceeds the taxable capital gain in a year may be deducted from a taxable capital gain realized by the shareholder in the three previous or any subsequent year, subject to adjustment when the capital gains inclusion rate in the year of disposition differs from the inclusion rate in the year the deduction is claimed.
If a share of common stock of the Company is disposed of to the Company other than in the open market in the manner in which shares would normally be purchased by the public, the proceeds of disposition will, in general terms, be considered as limited to the paid-up capital of the share and the balance of the price paid will be deemed to be a dividend. In the case of a shareholder that is a corporation, the amount of any capital loss otherwise determined may be reduced by the amount of dividends previously received in respect of the shares disposed of, unless the corporation owned the shares for at least 365 days prior to sustaining the loss and (together with corporations, persons and other entities, with whom the corporation was not dealing at arm’s length) did not own more than five percent of the shares of any class of the corporation from which the dividend was received. These loss limitation rules may also apply where a corporation is a member of a partnership or a beneficiary of a trust that owned the shares disposed of.
Under the Canadian Tax Act, a non-resident of Canada is subject to Canadian tax on taxable capital gains, and may deduct allowable capital losses, realized on a disposition of “taxable Canadian property.” Shares of common stock of the Company will constitute taxable Canadian property of a shareholder at a particular time if the shareholder used the shares in carrying on business in Canada, or if at any time in the five years immediately preceding the disposition 25 percent or more of the issued shares of any class or series in the capital stock of the Company belonged to one or more persons in a group comprising the shareholder and persons with whom the shareholder did not deal at arm’s length.
The Convention relieves United States residents from liability for Canadian tax on capital gains derived on a disposition of shares unless (a) the value of the shares is derived principally from “real property” in Canada, including the right to explore for or exploit natural resources and rights to amounts computed by reference to production, (b) the shareholder was resident in Canada for 120 months during any period of 20 consecutive years preceding, and at any time during the 10 years immediately preceding, the disposition and the shares were owned by him when he or she ceased to be resident in Canada, or (c) the shares formed part of the business property of a “permanent establishment” that the holder has or had in Canada within the 12 months preceding the disposition.
Material United States Federal Income Tax Considerations
The following discussion is based upon the sections of the Internal Revenue Code of 1986, as amended (the "Code"), Treasury Regulations, published Internal Revenue Service ("IRS") rulings, published administrative positions of the IRS and court decisions that are currently applicable. This discussion does not consider the potential effects, both adverse and beneficial, of any recently proposed legislation that, if enacted, could be applied, possibly on a retroactive basis, at any time. Holders and prospective holders of shares of the Company should consult their own tax advisors about the Federal; state, local and foreign tax consequences of purchasing, owning and disposing of shares of the Company.
U.S. Holders. As used herein, a "U.S. Holder" includes a holder of shares of the Company who is a citizen or resident of the United States, a corporation created or organized in or under the laws of the United States or of any political subdivision thereof, any entity that is taxable as a corporation for U.S. tax purposes and any other person or entity whose ownership of shares of the Company is effectively connected with the conduct of a trade or business in the United States. A U.S. Holder does not include persons subject to special provisions of Federal income tax law, such as tax exempt organizations, qualified retirement plans, financial institutions, insurance companies, real estate investment trusts, regulated investment companies, broker-dealers, nonresident alien individuals or foreign corporations whose ownership of shares of the Company is not effectively connected with conduct of trade or business in the United States, shareholders who acquired their stock through the exercise of employee stock options or otherwise as compensation and shareholders who hold their stock as ordinary assets and not as capital assets.
Distributions on Shares of the Company. U.S. Holders receiving dividend distributions (including constructive dividends) with respect to shares of the Company are required to include in gross income for United States Federal income tax purposes the gross amount of such distributions to the extent that the Company has current or accumulated earnings and profits as defined under U.S. Federal tax law, without reduction for any Canadian income tax withheld from such distributions. Such Canadian tax withheld may be credited against the U.S. Holder's United States Federal income tax liability or, alternatively, may be deducted in computing the U.S. Holder's United States Federal taxable income by those who itemize deductions. (See discussion that is more detailed at "Foreign Tax Credit" below). To the extent that distributions exceed current or accumulated earnings and profits of the Company, they will be treated first as a return of capital up to the U.S. Holder's adjusted basis in the shares and thereafter as gain from the sale or exchange of the shares. Preferential tax rates for net capital gains are applicable to a U.S. Holder that is an individual, estate or trust. There are currently no preferential tax rates for long-term capital gains for a U.S. Holder that is a corporation.
Dividends paid on the shares of the Company are not expected to be eligible for the dividends received deduction provided to corporations receiving dividends from certain United States corporations. A U.S. Holder that is a corporation may be entitled to a 70% deduction of the United States source portion of dividends received from the Company (unless the Company qualifies as a "foreign personal holding company" or a "passive foreign investment company", as defined below) if such U.S. Holder owns shares representing at least 10% of the voting power and value of the Company.
In the case of foreign currency received as a dividend that is not converted by the recipient into U.S. Dollars on the date of receipt, a U.S. Holder will have a tax basis in the foreign currency equal to its U.S. Dollar value on the date of receipt. Any gain or loss recognized upon a subsequent sale or other disposition of the foreign currency, including the exchange for U.S. Dollars, will be ordinary income or loss. However, for tax years after 1997, an individual whose realized foreign exchange gain does not exceed U.S. $200 will not recognize that gain, to the extent that there are not expenses associated with the transaction that meet the requirement for deductibility as a trade or business expense (other than travel expenses in connection with a business trip or as an expense for the production of income).
Foreign Tax Credit.A U.S. Holder who pays (or has withheld from distributions) Canadian income tax with respect to the ownership of shares of the Company may be entitled, at the option of the U.S. Holder, to either a deduction or a tax credit for such foreign tax paid or withheld. It will be more advantageous to claim a credit because a credit reduces United States Federal income taxes on a dollar-for-dollar basis, while a deduction merely reduces the taxpayer's income subject to tax. This election is made on a year-by-year basis and applies to all foreign taxes paid by (or withheld from) the U.S. Holder during that year. There are significant and complex limitations that apply to the credit, among which is the general limitation that the credit cannot exceed the proportionate share of the U.S. Holder's United States Federal income tax liability that the U.S. Holder's foreign source income bears to his or its worldwide taxable income. In the determination of the application of this limitation, the various items of income and deduction must be classified into foreign and domestic sources. Complex rules govern this classification process. There are further limitations on the foreign tax credit for certain types of income such as "passive income", "high withholding tax interest", "financial services income", and "shipping income". The availability of the foreign tax credit and the application of the limitations on the credit are fact specific and holders and prospective holders of shares of the Company should consult their own tax advisors regarding their individual circumstances.
In the case of certain U.S. Holders that are corporations (other than corporations subject to Subchapter S of the Code), owning 10% or more of the Company's Common Shares, a portion of the qualifying Canadian income tax paid by the Company will also be available as a foreign tax credit for U.S. federal income tax purposes, at the election of the U.S. Holder.
Disposition of Shares of the Company.A U.S. Holder will recognize a gain or loss upon the sale of shares of the Company equal to the difference, if any, between (i) the amount of cash plus the fair market value of any property received, and (ii) the shareholder's tax basis in the shares of the Company. This gain or loss will be a capital gain or loss if the shares are a capital asset in the hands of the U.S. Holder, and will be a short-term or long-term capital gain or loss depending upon the holding period of the U.S. Holder. Gains and losses are netted and combined according to special rules in arriving at the overall capital gain or loss for a particular tax year. Deductions for net capital losses are subject to significant limitations. Corporate capital losses (other than losses of corporations electing under Subchapter S or the Code) are deductible to the extent of capital gains. Non-corporate taxpayers may deduct net capital losses, whether short-term or long-term, up to U.S. $3,000 a year (U.S. $1,500 in the case of a married individual filing separately). For U.S. Holders that are individuals, any unused portion of such net capital loss may be carried over to be used in later tax years until such net capital loss is thereby exhausted. For U.S. Holders that are corporations (other than corporations subject to Subchapter S of the Code), an unused net capital loss may be carried back three years from the loss year and carried forward five years from the loss year to be offset against capital gains until such net capital loss is thereby exhausted.
Other Considerations
In the following circumstances, the above sections of this discussion may not describe the United States Federal income tax consequences resulting from the holding and disposition of shares of the Company:
Foreign Personal Holding Company.If at any time during a taxable year more than 50% of the total combined voting power or the total value of the Company's outstanding shares is owned, directly or indirectly, by five or fewer individuals who are citizens or residents of the United States and 60% (50% in subsequent years) or more of the Company's gross income for such year was derived from certain passive sources (e.g., from dividends received from its subsidiaries), the Company would be treated as a "foreign personal holding company". In that event, U.S. Holders that hold shares of the Company (on the earlier of the last day of the Company's tax year or the last date on which the Company was a foreign personal holding company) would be required to include in gross income for such year their allowable portions of such passive income to the extent the Company does not actually distribute such income.
Foreign Investment Company.If 50% or more of the combined voting power or total value of the Company's outstanding shares are held, directly or indirectly, by citizens or residents of the United States, United States domestic partnerships or corporations, or estates or trusts other than foreign estates or trusts (as defined by the Code Section 7701 (a)(31)), and the Company is found to be engaged primarily in the business of investing, reinvesting, or trading in securities, commodities, or any interest, it is possible that the Company might be treated as a "foreign investment company" as defined in Section 1246 of the Code, causing all or part of any gain realized by a U.S. Holder selling or exchanging shares of the Company to be treated as ordinary income rather than capital gain.
Passive Foreign Investment Company.As a foreign corporation with U.S. Holders, the Company will be treated as a passive foreign investment company ("PFIC"), as defined in Section 1297 of the Code, if 75% or more of its gross income in a taxable year is passive income, or the average percentage of the Company’s assets (by value) during the taxable year which produce passive income or which are held for production of same is at least 50%. Passive income is defined to include gross income in the nature of dividends, interest, royalties, rents and annuities; excess of gains over losses from certain transactions in any commodities not arising inter alia from a PFIC whose business is actively involved in such commodities; certain foreign currency gains; and other similar types of income. Foreign mining companies that are in the exploration stage may have little or no income from operations and/or may hold substantial cash and short-term securities that pay interest and dividends while awaiting expenditure in connection with the business. Given the complexities of determining what expenditures may be deductible and of how assets held for production of active income should be valued, the Company, based on advice from its professional advisers, cannot conclude whether it is a PFIC.
It is not the intention of the Company to be considered a PFIC and the Company does not consider this to be a material risk. In the event that it were to become classified as a PFIC, the following should be taken into consideration. U.S. Holders owning shares of a PFIC are subject to a special tax and to an interest charge based on the value of deferral of U.S. tax attributable to undistributed earnings of a PFIC for the period during which the shares of the PFIC are owned. This special tax would apply to any gain realized on the disposition of shares of a PFIC. In addition, the gain is subject to U.S. federal income tax as ordinary income, taxed at top marginal rates, rather than as capital gain income. The special tax would also be payable on receipt of excess distributions (any distributions received in the current year that are in excess of 125% of the average distributions received during the 3 preceding years or, if shorter, the shareholder's holding period). If, however, the U.S. Holder makes a timely election to treat a PFIC as a qualified electing fund ("QEF") with respect to such shareholder's interest and the Company provides an annual information statement, the above-described rules will not apply. The Company will provide such an information statement upon request from a U.S. Holder for current and prior taxable years. Instead, the electing U.S. Holder would include annually in his gross income his pro rata share of the PFIC's ordinary earnings and any net capital gain regardless of whether such income or gain was actually distributed. A U.S. Holder of a PFIC treated as a QEF can, however, further elect to defer the payment of United States Federal income tax on such income and gain inclusions, with tax payments ultimately requiring payment of an interest factor. In addition, with a timely QEF election, the electing U.S. Holder will obtain capital gain treatment on the gain realized on disposition of such U.S. Holder’s interest in the PFIC. Special rules apply to U.S. Holders who own their interests in a PFIC through intermediate entities or persons.
Effective for tax years of U.S. Holders beginning after December 31, 1997, U.S. Holders who hold, actually or constructively, marketable stock of a foreign corporation that qualifies as a PFIC may elect to mark such stock to the market (a “mark-to-market election”). If such an election is made, such U.S. Holder will not be subject to the special taxation rules of PFIC described above for the taxable years for which the mark-to-market election is made. A U.S. Holder who makes such an election will include in income for the taxable year an amount equal to the excess, if any, of the fair market value of the shares of the Company as of the close of such tax year over such U.S. Holder's adjusted basis in such shares. In addition, the U.S. Holder is allowed a deduction for the lesser of (i) the excess, if any, of such U.S. Holder's adjusted tax basis in the shares over the fair market value of such shares as of the close of the tax year, or (ii) the excess, if any of (A) the mark-to-market gains for the shares in the Company included by such U.S. Holder for prior tax years, including any amount which would have been included for any prior year but for Section 1291 interest on tax deferral rules discussed above with respect to a U.S. Holder, who has not made a timely QEF election during the year in which he holds (or is deemed to have held) shares in the Company and the Company is a PFIC (“Non-Electing U.S. Holder”), over (B) the mark-to-market losses for shares that were allowed as deductions for prior tax years. A U.S. Holder's adjusted tax basis in the shares of the Company will be increased or decreased to reflect the amount included or deducted as a result of mark-to-market election. A mark-to-market election will apply to the tax year for which the election is made and to all later tax years, unless the PFIC stock ceases to be marketable or the IRS consents to the revocation of the election.
The IRS has issued proposed regulations that would treat as taxable certain transfers of PFIC stock by a Non-Electing U.S. Holder that are not otherwise taxed, such as gifts, exchanges pursuant to corporate reorganizations, and transfers at death. In such cases, the basis of the Company's shares in the hands of the transferee and the basis of any property received in the exchange for those shares would be increased by the amount of gain recognized. A U.S. Holder who has made a timely QEF election (as discussed herein) will not be taxed on certain transfers of PFIC stock, such as gifts, exchanges pursuant to corporate reorganizations, and transfers at death. The transferee's basis in this case will depend on the manner of the transfer. The specific tax effect to the U.S. Holder and the transferee may vary based on the manner in which the shares of the Company are transferred. Each U.S. Holder should consult a tax advisor with respect to how the PFIC rules affect their tax situation.
The PFIC and QEF election rules are complex. U.S. Holders should consult a tax advisor regarding the availability and procedure for making the QEF election as well as the applicable method for recognizing gains or earnings and profits under the foregoing rules.
Controlled Foreign Corporation.If more than 50% of the voting power of all classes of stock or the total value of the stock of the Company is owned, directly or indirectly, by citizens or residents of the United States, United States domestic partnerships and corporations or estates or trusts other than foreign estates or trusts, each of whom own 10% or more of the total combined voting power of all classes of stock of the Company ("United States shareholder"), the Company could be treated as a "controlled foreign corporation" under Subpart F of the Code. This classification would effect many complex results including the required inclusion by such United States shareholders in income of their pro rata share of "Subpart F income" (as specially defined by the Code) of the Company. Subpart F requires current inclusions in the income of United States shareholders to the extent of a controlled foreign corporation's accumulated earnings invested in "excess passive" assets (as defined by the Code). In addition, under Section 1248 of the Code, a gain from the sale or exchange of shares by a U.S. Holder who is or was a United States shareholder at any time during the five year period ending with the sale or exchange is treated as ordinary dividend income to the extent of earnings and profits of the Company attributable to the stock sold or exchanged. Because of the complexity of Subpart F, and because it is not clear that Subpart F would apply to the U.S. Holders of shares of the Company, a more detailed review of these rules is outside of the scope of this discussion.
If the Company is both a PFIC and controlled foreign corporation, the company will not be treated as a PFIC with respect to United States shareholders of the controlled foreign corporation. This rule will be effective for taxable years of the Company ending with or within such taxable years of United States shareholders.
Summary
Management believes this discussion covers all material tax consequences. Nevertheless, this is not intended to be, nor should it be construed to be, legal or tax advice to any holder of common shares of the Company Holders and prospective holders are encouraged to consult their own tax advisers with respect to their particular circumstances.
10.H. Documents on Display
Documents responsive to this item may be obtained by request from the Company at its principal executive offices and from SEDAR,www.sedar.com
10.H.10.I. Subsidiary Information
Not applicable
Item 11. Quantitative and Qualitative Disclosures About Market Risk
Foreign Currency Risk
Foreign currency risk is the risk that the fair value or future cash flows of a financial instrument will fluctuate because of changes in foreign exchange rates. The Company’s exposure to the risk of changes in foreign exchange rates relates primarily to the Company’s operating activities (when revenue or expense is denominated in a different currency from the Company’s functional currency) and the Company’s net investments in foreign subsidiaries. The Company operates internationally and is exposed to foreign exchange risk as certain expenditures are denominated in non-Canadian Dollar currencies.
A 10% strengthening of the US dollars against Canadian dollars would have increased the net equity by approximately $228,000 (2014$67,000 (2016 - $90,000)$294,858) due to reduction in the value of net liability balance. A 10% of weakening of the US dollar against Canadian dollar at December 31, 20152017 would have had the equal but opposite effect. The significant financial instruments of the Company, their carrying values and the exposure to other denominated monetary assets and liabilities, as of December 31, 20152017 are as follows:
US Denominated | Euro Denominated | Great Britain Denominated | ||||||||||
USD | Euro | GBP | ||||||||||
Cash | 367,138 | 4,574 | - | |||||||||
Accounts receivable | 1,346,490 | - | - | |||||||||
Accounts payable | 64,298 | - | 3,960 | |||||||||
US Denominated | ||||
USD | ||||
Cash | 122,319 | |||
Accounts receivable | 518,999 | |||
Accounts payable | 104,225 | |||
The carrying values and the exposure to other denominated monetary assets and liabilities as of December 31, 20142016 are as follows:
US Denominated | China Denominated | Euro Denominated | US Denominated | China Denominated | Euro Denominated | |||||||||||||||||||
USD | RMB | Euro | USD | RMB | Euro | |||||||||||||||||||
Cash | - | 18,412 | 11,091 | 17,702 | 1,786 | - | ||||||||||||||||||
Accounts receivable | 681,916 | - | 16,692 | 2,247,036 | - | - | ||||||||||||||||||
Accounts payable | 45,926 | - | - | 88,235 | - | - | ||||||||||||||||||
The Company operates one segment of its business in China, and a substantial portion of our operating expenses are in Canadian dollars, whereas our revenue from co-publishing agreements are primarily in Renminbi which is first converted to US dollars then to Canadian dollars.
A significant adverse change in foreign currency exchange rates between the Canadian dollars relative to US dollars or Renminbi to US dollars could have a material effect on our consolidated results of operations, financial position or cash flows. We have not hedged exposures denominated in foreign currencies, as they are not material at this time.
RMB | USD | USD | USD | USD | RMB | USD | USD | USD | USD | |||||||||||||||||||||||||||||||
At 12/31/2015 | +0.05 | +0.10 | +0.15 | At 12/31/2017 | +0.05 | +0.10 | +0.15 | |||||||||||||||||||||||||||||||||
Year-end Exchange Rate For 1 RMB to USD | 0.1540 | 0.1617 | 0.1694 | 0.1771 | 0.1537 | 0.1614 | 0.1691 | 0.1768 | ||||||||||||||||||||||||||||||||
Annual Revenue From China | 10,478,570 | 1,613,700 | 1,694,385 | 1,775,070 | 1,855,755 | |||||||||||||||||||||||||||||||||||
Annual Revenue from China | 8,465,961 | 1,301,218 | 1,366,279 | 1,431,340 | 1,496,401 | |||||||||||||||||||||||||||||||||||
Accounts Receivable | 4,064,213 | 625,889 | 657,183 | 688,478 | 719,772 | 7,558,410 | 1,161,728 | 1,219,814 | 1,277,900 | 1,335,987 | ||||||||||||||||||||||||||||||
USD | CAD | CAD | CAD | CAD | USD | CAD | CAD | CAD | CAD | |||||||||||||||||||||||||||||||
Year 2015 | +0.05 | +0.10 | +0.15 | Year 2017 | +0.05 | +0.10 | +0.15 | |||||||||||||||||||||||||||||||||
Average Annual Exchange Rate for 1 USD to CAD | 1.2788 | 1.3427 | 1.4067 | 1.4706 | 1.2986 | 1.3635 | 1.4285 | 1.4934 | ||||||||||||||||||||||||||||||||
Annual Revenue From China | 1,669,409 | 2,134,840 | 2,241,582 | 2,348,324 | 2,455,066 | |||||||||||||||||||||||||||||||||||
Annual Revenue from China | 1,272,501 | 1,652,470 | 1,735,093 | 1,817,716 | 1,900,340 | |||||||||||||||||||||||||||||||||||
USD | CAD | CAD | CAD | CAD | USD | CAD | CAD | CAD | CAD | |||||||||||||||||||||||||||||||
At 12/31/2015 | +0.05 | +0.10 | +0.15 | At 12/31/2017 | +0.05 | +0.10 | +0.15 | |||||||||||||||||||||||||||||||||
Year-end Exchange Rate for 1 USD to CAD | 1.3718 | 1.4404 | 1.509 | 1.5776 | 1.2545 | 1.3172 | 1.3800 | 1.4427 | ||||||||||||||||||||||||||||||||
Cash | 36,7138 | 503,640 | 528,822 | 554,004 | 579,186 | 122,319 | 153,449 | 161,121 | 168,794 | 176,467 | ||||||||||||||||||||||||||||||
Accounts Receivable | 1,346,490 | 1,847,115 | 1,939,471 | 2,031,826 | 2,124,182 | 518,999 | 651,084 | 683,638 | 716,193 | 748,747 | ||||||||||||||||||||||||||||||
Accounts Payable | 64,298 | 88,204 | 92,614 | 97,024 | 101,435 | 104,225 | 130,750 | 137,288 | 143,825 | 150,363 | ||||||||||||||||||||||||||||||
Item 12. Description of Securities Other than Equity Securities
None
PART II
Item 13. Defaults, Dividend Arrearages and Delinquencies
None
Item 14. Material Modifications to the Rights of Security Holders and Use of Proceeds
None
ITEM 15.CONTROLS AND PROCEDURES
15.A. As of the end of the period covered by this report ("Date of Evaluation"), an evaluation was carried out under the supervision and with the participation of the Company's management, including the Chief Executive Officer ("CEO") and Chief Financial Officer ("CFO"), of the effectiveness of our disclosure controls and procedures. Based on that evaluation, the CEO and CFO have concluded that the Company's disclosure controls and procedures are effective to ensure that information required to be disclosed by the Company in reports that it files or submits under the Securities Exchange Act of 1934 is recorded, processed, summarized and reported within the time periods specified in Securities and Exchange Commission rules and forms.
Recent Accounting Pronouncements
The following pronouncements issued by the IASB and interpretations published by IFRIC will become effective for annual periods beginning on or after January 1, 20162018
Effective forPeriodsBeginning on or after January 1, 2016
IAS 1 Presentation of Financial Statements was amended by the IASB in December 2014. The amendments are designed to further encourage companies to apply professional judgement in determining what information to disclose in their financial statements. For example, the amendments make clear that materiality applies to the whole of financial statements and that the inclusion of immaterial information can inhibit the usefulness of financial disclosures. Furthermore, the amendments clarify that companies should use professional judgement in determining where and in what order information is presented in the financial disclosures. Earlier application is permitted.
Effective forPeriodsBeginning on or after January 1, 2018
IFRS 15 Revenue from Contracts with Customers was issued by the IASB in May 2014. The core principle of the new standard is for companies to recognize revenue to depict the transfer of goods or services to customers in amounts that reflect the consideration (that is, payment) to which the company expects to be entitled in exchange for those goods or services. The new standard will also result in enhanced disclosures about revenue, provide guidance for transactions that were not previously addressed comprehensively (for example, service revenue and contract modifications) and improve guidance for multiple-element arrangements. Earlier application is permitted. IFRS 15 supersedes the following standards: IAS 11 Construction Contracts, IAS 18 Revenue, IFRIC 13 Customer Loyalty Programs,Programmes, IFRIC 15 Agreements for the Construction of Real Estate, IFRIC 18 Transfers of Assets from Customers, and SIC-31 Revenue—Barter Transactions Involving Advertising Services.
IFRS 9 Financial Instruments was issued by the IASB in July 2014 and will replace IAS 39 Financial Instruments: Recognition and Measurement. IFRS 9 uses a single approach to determine whether a financial asset is measured at amortized cost or fair value, replacing the multiple rules in IAS 39. The approach in IFRS 9 is based on how an entity manages its financial instruments in the context of its business model and the contractual cash flow characteristics of the financial assets. Most of the requirements in IAS 39 for classification and measurement of financial liabilities were carried forward unchanged to IFRS 9. The new standard also requires a single impairment method to be used, replacing the multiple impairment methods in IAS 39. A new hedge accounting model is introduced and represents a substantial overhaul of hedge accounting which will allow entities to better reflect their risk management activities in the financial statements. The most significant improvements apply to those that hedge non-financial risk, and so these improvements are expected to be of particular interest to non-financial institutions. Earlier application is permitted.
The Company has not yet completed its evaluations of the effect of adopting the above standards and the impact it may haveEffective for Periods Beginning on its consolidated financial statements.or after January 1, 2019
IFRS 16, Leases replaces IAS 17, Leases and related interpretations. The core principle is that a lessee recognizes assets and liabilities for all leases with a lease term of more than 12 months. A lessee is required to recognize a right-of-use asset representing its right to use the underlying leased asset and a lease liability representing its obligation to make lease payments. Assets and liabilities arising from a lease are initially measured on a present value basis. The measurement includes non-cancellable lease payments (including inflation-linked payments), and also includes payments to be made in optional periods if the lessee is reasonably certain to exercise an option to extend the lease, or not to exercise an option to terminate the lease. The new standard is intended to provide a faithful representation of leasing transactions, in particular those that do not currently require the lessees to recognize an asset and liability arising from an operating lease. IFRS 16 is effective for annual periods beginning on January 1, 2019, with early adoption permitted for entities that would also apply IFRS 15, Revenue from Contracts with Customers.
15.B. There have been no changes that have materially affected,IFRS 15 — Revenue from Contracts with Customers is required to be applied retrospectively for annual periods beginning on or that is reasonably likely to affect, the Company's internal control over financial reporting during the period covered by this Annual Report.after January 1, 2018.
On January 1, 2018, the Company will adopt on a fully retrospective basis the new rules under IFRS 15 which specifies how and when an entity should recognize revenue as well as requiring such entities to provide users of financial statements with more informative disclosures. The standard provides a single, principles-based, five-step model to be applied to all contracts with customers.
In addition, under IFRS 15, certain costs, mainly sales commissions, to obtain a contract will be capitalized and amortized as operating expenses over the contract term or over the period of time the customer is expected to remain a customer of the Company. Currently, such costs are expensed as incurred. The Company will capitalize these costs and subsequently amortize the capitalized costs over a period of time that is consistent with the transfer of the related good or service to the customer. Capitalized costs, net of accumulated amortization, will be included in “Prepaid expenses and other current assets” on our consolidated balance sheets. If the incremental cost incurred exceeds payments made, the accrued cost will be included in “Accrued expenses and other liabilities”.
The retroactive adoption of IFRS 15 will have no material impact to the consolidated financial statements.
IFRS 9 — Financial Instruments is required to be applied retrospectively for annual periods beginning on or after January 1, 2018.
On January 1, 2018, the Company will adopt the new rules under IFRS 9 which simplifies the measurement and classification of financial assets by reducing the number of measurement categories in IAS 39, Financial Instruments: Recognition and Measurement. The new standard also provides for a fair value option in the designation of a non-derivative financial liability and its related classification and measurement, as well as for a new hedge accounting model more closely aligned with risk-management activities undertaken by entities.
The adoption of IFRS 9 will have no material impact on the consolidated financial statements.
ITEM 16. RESERVED
ITEM 16A. AUDIT COMMITTEE FINANCIAL EXPERT
During the past fiscal year, the members of the audit committee (the "Audit Committee") were Martin Bernholtz ("Chairman"), Scott RemborgTommy Weibing Gong and Michael Kraft, of whom Martin Bernholtz and Scott RemborgTommy Gong are independent. Martin Bernholtz is an audit committee financial expert.Tommy Gongexpert and was succeeded as Chairman by Martin Bernholtz in August 2013.Each2013. Each member of the Audit Committee is financially literate as defined by MI 52-110.
A member of the Audit Committee isindependentif the member has no direct or indirect material relationship with the Company. A material relationship means a relationship which could, in the view of the Board, reasonably interfere with the exercise of a member's independent judgment.
A member of the Audit Committee is consideredfinancially literateif he or she has the ability to read and understand a set of financial statements that present a breadth and level of complexity of accounting issues that are generally comparable to the breadth and complexity of the issues that can reasonably be expected to be raised by the Company. Each has acquired these attributes through relevant experience serving as directors and/or audit committee members of various other private and public companies.
ITEM 16B. CODE OF ETHICS
The Company has adopted a “Code of Conduct”, the text of such code is available through its internet website,www.lingomedia.com.
ITEM 16C. PRINCIPAL ACCOUNTANT FEES AND SERVICES
Nature of Services | Fees Paid to Auditor Year-ended December 31, 2015 | Fees Paid to Auditor Year-ended December 31, 2014 | Fees Paid to Auditor Year-ended December 31, 2013 | |||||||||
Audit Fees(1) | $ | 66,543 | $ | 77,864 | $ | 81,077 | ||||||
Audit-Related Fees(2) | 7,800 | 9,029 | 6,934 | |||||||||
Tax Fees(3) | 2,000 | Nil | Nil | |||||||||
All Other Fees(4) | Nil | Nil | Nil | |||||||||
Total | $ | 76,343 | $ | 93,644 | $ | 94,385 | ||||||
Notes:
(1) "Audit Fees" include fees necessary to perform the annual audit and any quarterly reviews of the Company's financial statements
(2) "Audit-Related Fees" include services that are traditionally performed by the auditor. These audit-related services include employee benefit audits, due diligence assistance, accounting consultations on proposed transactions, internal control reviews and audit or attest services not required by legislation or regulation.
(3) "Tax Fees" include fees for all tax services other than those included in "Audit Fees" and "Audit-Related Fees". This category includes fees for tax compliance, tax planning and tax advice. Tax planning and tax advice includes assistance with tax audits and appeals, tax advice related to mergers and acquisitions, and requests for rulings or technical advice from tax authorities
(4) "All Other Fees" include all other non-audit services
ITEM 16D. NOT APPLICABLE
ITEM 16E. NOT APPLICABLE
ITEM 16F. NOT APPLICABLE
Nature of Services | Fees Paid to Auditor Year-ended December 31, 2017 | Fees Paid to Auditor Year-ended December 31, 2016 | Fees Paid to Auditor Year-ended December 31, 2015 | |||||||||
Audit Fees (1) | 85,818 | $ | 84,370 | $ | 66,543 | |||||||
Audit-Related Fees (2) | 17,336 | 7,800 | 7,800 | |||||||||
Tax Fees (3) | 4,500 | 9,414 | 2,000 | |||||||||
All Other Fees (4) | Ni | Nil | Nil | |||||||||
Total | 107,653 | $ | 101,584 | $ | 76,343 | |||||||
Notes:
| (1) | "Audit Fees" include fees necessary to perform the annual audit and any quarterly reviews of the Company's financial statements |
| (2) | "Audit-Related Fees" include services that are traditionally performed by the auditor. These audit-related services include employee benefit audits, due diligence assistance, accounting consultations on proposed transactions, internal control reviews and audit or attest services not required by legislation or regulation. |
| (3) | "Tax Fees" include fees for all tax services other than those included in "Audit Fees" and "Audit-Related Fees". This category includes fees for tax compliance, tax planning and tax advice. Tax planning and tax advice includes assistance with tax audits and appeals, tax advice related to mergers and acquisitions, and requests for rulings or technical advice from tax authorities |
| (4) | "All Other Fees" include all other non-audit services |
ITEM 16G. 16D. NOT APPLICABLE
ITEM 16H. 16E. NOT APPLICABLE
ITEM 16F. NOT APPLICABLE
PART IIIITEM 16G. NOT APPLICABLE
ITEM 16H. NOT APPLICABLE
PART III
ITEM 17. FINANCIAL STATEMENTS
The Company has elected to provide financial statements pursuant to ITEM #18.
ITEM 18. FINANCIAL STATEMENTS
The Company's financial statements are stated in Canadian Dollars (CAD) and are prepared in accordance with with International Financial Reporting Standards (“IFRS”) as issued by the International Accounting Standards Board (“IASB”) and interpretations of the International Financial Reporting Interpretations Committee (“IFRIC”).
The financial statements as required under ITEM #18 are attached hereto as exhibits. The audit reports of Collins Barrow Toronto LLP are included herein immediately preceding the financial statements and schedules.
Audited Financial Statements
Auditor's Report, dated April 29, 201630, 2018
Consolidated Balance Sheets at December 31, 20152017 and December 31, 20142016
Consolidated Statements of Comprehensive IncomeforIncome
for the years ended December 31, 2015, 2014,2017, 2016, and 20132015
Consolidated Statements of Changes in EquityforEquity
for the years ended December 31, 2015, 2014,2017, 2016, and 20132015
Consolidated Statements of Cash FlowsforFlows
for the years ended December 31, 2015, 2014,2017, 2016, and 20132015
Notes to Financial Statements
ITEM 19. EXHIBITS
| 1.1 | |
1.2 | |
| 1.3 | By-Laws/Articles |
| a. | Amended By-Laws of the Company incorporated by reference from the Lingo Media Corporation Form 20-F/A filed February 17, 2012. |
| 101.INS | XBRL Instance |
| 101.SCH | XBRL Extension Schema |
| 101.CAL | XBRL Extension Calculation |
| 101.DEF | XBRL Extension Definition |
| 101.LAB | XBRL Extension Label |
| 101.PRE | XBRL Extension Presentation |
SIGNATURES
The registrant hereby certifies that it meets all the requirements for filing on Form 20-F and that it has duly caused this annual report to be signed on its behalf.
| LINGO MEDIA CORPORATION |
| |
|
|
| |
| By: | /s/ Michael |
|
|
|
| |
| Michael P. Kraft | ||
| President and Chief Executive Officer | |||
By: | /s/Khurram Qureshi | ||
Khurram R. Qureshi | |||
| Chief Financial Officer | |||
| May 15, 2018 | |||
May 16, 2016
LINGO MEDIACORPORATION
Consolidated FinancialStatements
For the years ended December 31, 20152017 and 20142016
Management’s Responsibility |
To the Shareholdersof
Lingo MediaMediaCorporation
Management is responsible for the preparation and presentation of the accompanying consolidated financial statements, including responsibility for significant accounting judgments and estimates in accordance with International Financial Reporting Standards and ensuring that all information in the Management Discussion & Analysis is consistent with the statements. This responsibility includes selecting appropriate accounting principles and methods, and making decisions affecting the measurement of transactions in which objective judgment is required.
In discharging its responsibilities for the integrity and fairness of the consolidated financial statements, management designs and maintains the necessary accounting systems and related internal controls to provide reasonable assurance that transactions are authorized, assets are safeguarded and financial records are properly maintained to provide reliable information for the preparation of financial statements.
The Board of Directors and the Audit Committee include some Directors who are neither management nor employees of the Company. The Board is responsible for overseeing management in the performance of its financial reporting responsibilities, and for approving the financial information included in the annual report. The Audit Committee has the responsibility of meeting with management and external auditors to discuss the internal controls over the financial reporting process, auditing matters and financial reporting issues. The Audit Committee is also responsible for recommending the appointment of the Company’s external auditors.
Collins Barrow TorontoRSM Canada LLP, an independent firm of Chartered Professional Accountants, is appointed by the Audit Committee of the Board to audit the consolidated financial statements and report directly to them; their report follows. The external auditors have full and free access to, and meet periodically and separately with, both the Audit Committee and management to discuss their audit findings.
April 29, 201630, 2018
/s/ Michael Kraft | /s/ Khurram Qureshi | ||
President & CEO | Chief Financial Officer |
|
|
INDEPENDENT AUDITORS' REPORT OF REGISTERED PUBLIC ACCOUNTING FIRM
To the Shareholders and the board of directors of Lingo Media Corporation
Opinion on the Consolidated Financial Statements
We have audited the accompanying consolidated financial statements of Lingo Media Corporation and its subsidiaries (collectively the "Company"), which comprise the consolidated balance sheets as at December 31, 20152017 and December 31, 2014 and2016, the consolidated statements of comprehensive income (loss), changes in equity, and cash flows for each of the three years in the period ended December 31, 2015, December 31, 20142017 and December 31, 2013 andthe related notes, comprising a summary of significantsignifcant accounting policies and other explanatory information.information (collectively referred to as the "consolidated financial statements").
Management’sResponsibilityIn our opinion, the consolidated financial statements present fairly, in all material respects, the financial position of the Company as of December 31, 2017 and December 31, 2016, and its financial performance and its cash flows for each of theConsolidated three years in the period ended December 31, 2017, in accordance with International FinancialStatements Reporting Standards as issued by the International Accounting Standards Board.
Basis for Opinion
Management's Responsibility for the Consolidated Financial Statements
Management is responsible for the preparation and fair presentation of these consolidated financial statements in accordance with International Financial Reporting Standards as issued by the International Accounting Standards Board, and for such internal control as management determines is necessary to enable the preparation of consolidated financial statements that are free from material misstatement, whether due to fraud or error.
Auditors'Responsibility
Our responsibility is to express an opinion on these consolidated financial statements based on our audits. We conductedconduced our audits in accordance with Canadian generally accepted auditing standards and the standards of the Public Company Accounting Oversight Board (United States) ("PCAOB"). Those standards require that we comply with ethical requirements and plan and perform the audit to obtain reasonable assurance about whether the consolidated financial statements are free fromof material misstatement.misstatement, whether due to error or fraud. Those standards also require that we comply with ethical requirements, including independence. We are required to be independent with respect to the Company in accordance with the ethical requirement that are relevant to our audit of the consolidated financial statements in Canada, the U.S. federal securities laws and the applicable rules and regulations of the Securities and Exchange Commission and the PCAOB. We are a public accounting firm registered with the PCAOB.
An audit involvesincludes performing procedures to obtain auditassess the risks of material misstatement of the consolidated financial statements, whether due to error or fraud, and performing procedures that respond to those risks. Such procedures include obtaining and examining, on a test basis, evidence aboutregarding the amounts and disclosures in the consolidated financial statements. The procedures selected depend on the auditor’s judgement,our judgment, including the assessment of the risks of material misstatement of the consolidated financial statements, whether due to frauderror or error.fraud. In making those risk assessments, the auditor considerswe consider internal control relevant to the entity’sCompany's preparation and fair presentation of the consolidated financial statements in order to design audit procedures that are appropriate in the circumstances, but not for the purpose of expressing an opinion on the effectiveness of the entity’s internal control. circumstances.
An audit also includes evaluating the appropriateness of accounting policies and principles used and the reasonableness of accounting estimates made by management, as well as evaluating the overall presentation of the consolidated financial statements.
THE POWER OF BEING UNDERSTOOD
AUDIT | TAX | CONSULTING
RSM Canada LLP is a limited liability partnership that provides public accounting services and is the Canadian member firm of RSM International, a global network of independent audit, tax, and consulting firms. Visit rsmcanada.com/aboutus for more information regarding RSM Canada LLP and RSM International.
We believe that the audit evidence we have obtained in our audits is sufficient and appropriate to provide a reasonable basis for our audit opinion.
/S/RSM Canada LLP
Opinion
In our opinion, the consolidated financial statements present fairly, in all material respects, the financial position of Lingo Media Corporation and its subsidiaries as at December 31, 2015 and December 31, 2014, and its financial performance and its cash flows for the years ended December 31, 2015, December 31, 2014, and December 31, 2013 in accordance with International Financial Reporting Standards as issued by the International Accounting Standards Board.
 |
Chartered Professional Accountants
Licensed Public Accountants
April 29, 201630, 2018
Toronto, Ontario
We have served as the Company's auditor since 2008.
LINGO MEDIA CORPORATION
Consolidated Financial Statements
As at December 31, 20152017 and December 31, 20142016
Contents | |
Consolidated Financial Statements | Page |
Consolidated Balance Sheets | 5 |
Consolidated Statements of Comprehensive Income (Loss) | 6 |
Consolidated Statements of Changes in Equity | 7 |
Consolidated Statements of Cash Flows | 8 |
Notes to Consolidated Financial Statements | 9 – |
LINGO MEDIA CORPORATION
Consolidated Balance Sheets
(Expressed in Canadian Dollars, unless otherwise stated)
As at December 31, 20152017 and December 31, 20142016
Notes | December 31,2015 | December 31,2014 | Notes | December 31, 2017 | December 31, 2016 | |||||||||||||||||||
ASSETS | ASSETS | ASSETS | ||||||||||||||||||||||
CurrentAssets | CurrentAssets | Current Assets | ||||||||||||||||||||||
Cash | $ | 409,022 | $ | 477,001 | $ | 327,434 | $ | 84,303 | ||||||||||||||||
Accounts and grants receivable | 6 | 1,961,534 | 849,344 | 6 | 970,467 | 3,044,928 | ||||||||||||||||||
Prepaid and other receivables | 488,154 | 85,071 | 205,482 | 579,846 | ||||||||||||||||||||
| 1,503,383 | 3,709,077 | |||||||||||||||||||||||
| 2,858,710 | 1,411,416 | |||||||||||||||||||||||
Non-CurrentAssets | Non-CurrentAssets | Non-Current Assets | ||||||||||||||||||||||
Long-term deposit | - | 300,000 | ||||||||||||||||||||||
Property and equipment | 7 | 28,879 | 24,806 | 7 | 30,689 | 27,488 | ||||||||||||||||||
Intangibles | 8 | 2,205,744 | 847,598 | 8 | - | 3,000,009 | ||||||||||||||||||
Goodwill | 139,618 | 139,618 | 9 | - | 139,618 | |||||||||||||||||||
TOTALASSETS | $ | 5,232,951 | $ | 2,423,438 | $ | 1,534,072 | $ | 7,176,192 | ||||||||||||||||
LIABILITIES ANDEQUITY | LIABILITIES ANDEQUITY | LIABILITIES AND EQUITY | ||||||||||||||||||||||
CurrentLiabilities | CurrentLiabilities | Current Liabilities | ||||||||||||||||||||||
Accounts payable | 250,973 | 150,634 | 488,636 | 273,750 | ||||||||||||||||||||
Accrued liabilities | 355,194 | 690,015 | 155,156 | 249,736 | ||||||||||||||||||||
Lease inducement | 36,526 | 57,673 | ||||||||||||||||||||||
Loans payable | 9 | 580,000 | 838,833 | 11 | 300,000 | 150,000 | ||||||||||||||||||
| 1,186,167 | 1,679,482 | 980,318 | 731,159 | |||||||||||||||||||||
Equity | Equity | Equity | ||||||||||||||||||||||
Share capital | 10 | 18,927,388 | 18,162,347 | 12 | 21,914,722 | 21,914,722 | ||||||||||||||||||
Share-based payment reserve | 11 | 2,695,038 | 2,578,380 | 13 | 3,792,678 | 3,421,165 | ||||||||||||||||||
Warrants | 12 | 1,439,632 | 1,393,202 | |||||||||||||||||||||
Accumulated other comprehensive income | (362,210 | ) | (204,852 | ) | (303,447 | ) | (302,037 | ) | ||||||||||||||||
Deficit | (18,653,064 | ) | (21,185,121 | ) | (24,850,199 | ) | (18,588,817 | ) | ||||||||||||||||
TOTALEQUITY | 4,046,784 | 743,956 | 553,754 | 6,445,033 | ||||||||||||||||||||
TOTAL LIABILITIES ANDEQUITY | $ | 5,232,951 | $ | 2,423,438 | $ | 1,534,072 | $ | 7,176,192 | ||||||||||||||||
| Commitments and contingency | 20 | 22 | ||||||||||||||||||||||
The accompanying notes are an integral part of these consolidated financial statements.
These consolidated financial statements are authorized for issue by the Board of Directors on April 28, 2016.30, 2018.
| /s/ Michael Kraft | /s/ Martin Bernholtz | |
Director | Director |
LINGO MEDIA CORPORATION
Consolidated Statements of Comprehensive Income (Loss)
For the years ended December 31, 2017, 2016 and 2015 2014 and 2013
(Expressed(Expressed in Canadian Dollars, unless otherwise stated)
Notes | 2015 | 2014 | 2013 | |||||||||||||||||||||||||||||
Notes | 2017 | 2016 | 2015 | |||||||||||||||||||||||||||||
Revenue | $ | 4,925,735 | $ | 2,512,464 | $ | 2,008,066 | $ | 2,776,768 | $ | 3,195,221 | $ | 4,925,735 | ||||||||||||||||||||
Expenses | Expenses | Expenses | ||||||||||||||||||||||||||||||
Selling, general and administrative | 1,059,703 | 950,229 | 941,462 | 1,368,153 | 1,364,736 | 1,059,703 | ||||||||||||||||||||||||||
Amortization – intangibles | 8 | 721,720 | 582,857 | 431,049 | 8 | 1,051,928 | 1,003,485 | 721,720 | ||||||||||||||||||||||||
Bad debt | 732,254 | - | - | |||||||||||||||||||||||||||||
Direct costs | 382,871 | 382,593 | 195,324 | 225,618 | 385,384 | 382,871 | ||||||||||||||||||||||||||
Development costs | 2,692,009 | - | - | |||||||||||||||||||||||||||||
Share-based payments | 11 | 151,038 | 65,663 | 61,926 | 13 | 371,513 | - | 151,038 | ||||||||||||||||||||||||
Loss on acquisition | 10 | 80,818 | - | - | ||||||||||||||||||||||||||||
Impairment loss – goodwill | 9 | 139,618 | - | - | ||||||||||||||||||||||||||||
Impairment loss – intangible assets | 8 | 1,948,082 | - | - | ||||||||||||||||||||||||||||
Depreciation – property and equipment | 7 | 8,579 | 7,386 | 7,624 | 7 | 6,644 | 7,297 | 8,579 | ||||||||||||||||||||||||
TotalExpenses | 2,323,911 | 1,988,728 | 1,637,385 | 8,616,636 | 2,760,902 | 2,323,911 | ||||||||||||||||||||||||||
Profit fromOperations | 2,601,824 | 523,736 | 370,681 | |||||||||||||||||||||||||||||
Income /(Loss) from Operations | (5,839,868 | ) | 434,319 | 2,601,824 | ||||||||||||||||||||||||||||
Net FinanceCharges | Net FinanceCharges | Net Finance Charges | ||||||||||||||||||||||||||||||
Interest expense | 158,792 | 217,040 | 240,516 | 53,709 | 35,768 | 158,792 | ||||||||||||||||||||||||||
Foreign exchange gain | (399,314 | ) | (106,437 | ) | (134,444 | ) | ||||||||||||||||||||||||||
Profit Before IncomeTax | 2,842,346 | 413,132 | 264,609 | |||||||||||||||||||||||||||||
Foreign exchange loss (gain) | 189,783 | 146,599 | (399,314 | ) | ||||||||||||||||||||||||||||
Profit / (Loss) Before Income Tax | (6,083,360 | ) | 251,952 | 2,842,346 | ||||||||||||||||||||||||||||
Income tax expense | 14 | 310,289 | 269,119 | 241,666 | 16 | 178,022 | 187,705 | 310,289 | ||||||||||||||||||||||||
Net Profit for theYear | $ | 2,532,057 | $ | 144,013 | $ | 22,943 | ||||||||||||||||||||||||||
Net Profit / (Loss) for the Year | (6,261,382 | ) | 64,247 | $ | 2,532,057 | |||||||||||||||||||||||||||
Other ComprehensiveIncome | Other ComprehensiveIncome | Other Comprehensive Income | ||||||||||||||||||||||||||||||
Items subsequently transferred to net profit (loss) Exchange differences on translating foreign operations loss | (157,358 | ) | (36,607 | ) | (79,274 | ) | ||||||||||||||||||||||||||
Total Comprehensive Income /(Loss) | $ | 2,374,699 | $ | 107,406 | $ | (56,331 | ) | |||||||||||||||||||||||||
Earnings / (Loss) perShare | ||||||||||||||||||||||||||||||||
Items that may be subsequently transferred to net profit (loss) exchange differences on translating foreign operations gain (loss) | (1,410 | ) | 60,173 | (157,358 | ) | |||||||||||||||||||||||||||
Total Comprehensive Income (Loss) | $ | (6,262,792 | ) | $ | 124,420 | $ | 2,374,699 | |||||||||||||||||||||||||
Earnings (Loss) per Share | Earnings (Loss) per Share | |||||||||||||||||||||||||||||||
Basic | 13 | $ | 0.10 | $ | 0.01 | $ | (0.00 | ) | 15 | $ | (0.18 | ) | $ | 0.00 | $ | 0.10 | ||||||||||||||||
Diluted | 13 | $ | 0.09 | $ | 0.01 | $ | (0.00 | ) | 15 | $ | (0.18 | ) | $ | 0.00 | $ | 0.09 | ||||||||||||||||
Weighted Average Number of CommonSharesOutstanding | Weighted Average Number of CommonSharesOutstanding | Weighted Average Number of Common Shares Outstanding | ||||||||||||||||||||||||||||||
Basic | 13 | 26,288,889 | 21,986,300 | 21,174,026 | 15 | 35,529,192 | 33,987,383 | 26,288,889 | ||||||||||||||||||||||||
Diluted | 13 | 29,083,740 | 21,986,300 | 21,174,026 | 15 | 35,529,192 | 34,951,693 | 29,083,740 | ||||||||||||||||||||||||
The accompanying notes are an integral part of these consolidated financial statements.
LINGO MEDIA CORPORATION
Consolidated Statements of Changes in Equity
For the years ended December 31, 2015, 20142017, 2016 and 20132015
(Expressed in Canadian Dollars, unless otherwise stated)
Issued ShareCapital (Note 10) | Share-Based Payment Reserve | Warrants | Accumulated OtherComprehensiveIncome | Deficit | Total Equity | Issued Share Capital (Note 12) | Share-Based Payment Reserve |
Warrants | Accumulated Other Comprehensive Income |
Deficit |
Total Equity | |||||||||||||||||||||||||||||||||||||||||||||
Number of common shares | Amount | Number of common shares |
Amount | |||||||||||||||||||||||||||||||||||||||||||||||||||||
Balance asat January 1,2013 | 20,899,177 | $ | 18,014,347 | $ | 2,450,791 | $ | 1,132,685 | $ | (88,971 | ) | $ | (21,091,560 | ) | $ | 417,292 | |||||||||||||||||||||||||||||||||||||||||
Profit for the year | - | - | - | - | - | 22,943 | 22,943 | |||||||||||||||||||||||||||||||||||||||||||||||||
Other comprehensive loss | - | - | - | - | (79,274 | ) | - | (79,274 | ) | |||||||||||||||||||||||||||||||||||||||||||||||
Issued share – as financing cost against loan payable | 880,000 | 88,000 | - | - | - | - | 88,000 | |||||||||||||||||||||||||||||||||||||||||||||||||
Share-based payments charged to operations | - | - | 61,926 | - | - | - | 61,926 | |||||||||||||||||||||||||||||||||||||||||||||||||
Balance asat December31,2013 | 21,779,177 | $ | 18,102,347 | $ | 2,512,717 | $ | 1,132,685 | $ | (168,245 | ) | $ | (21,068,617 | ) | $ | 510,887 | |||||||||||||||||||||||||||||||||||||||||
Profit for the year | - | - | - | - | - | 144,013 | 144,013 | |||||||||||||||||||||||||||||||||||||||||||||||||
Other comprehensive loss | - | - | - | - | (36,607 | ) | - | (36,607 | ) | |||||||||||||||||||||||||||||||||||||||||||||||
Warrants extension | - | - | - | 260,517 | - | (260,517 | ) | - | ||||||||||||||||||||||||||||||||||||||||||||||||
Issued shares – as financing cost against loans payable | 600,000 | 60,000 | - | - | - | - | - | |||||||||||||||||||||||||||||||||||||||||||||||||
Balance asat December31,2014 | 22,379,177 | $ | 18,162,347 | $ | 2,578,380 | $ | 1,393,202 | $ | (204,852 | ) | $ | (21,185,121 | ) | $ | 743,956 | |||||||||||||||||||||||||||||||||||||||||
Balance as at January 1, 2015 | 22,379,177 | $ | 18,162,347 | $ | 2,578,380 | $ | 1,393,202 | $ | (204,852 | ) | $ | (21,185,121 | ) | $ | 743,956 | |||||||||||||||||||||||||||||||||||||||||
Profit for the year | - | - | - | - | - | 2,532,057 | 2,532,057 | - | - | - | - | - | 2,532,057 | 2,532,057 | ||||||||||||||||||||||||||||||||||||||||||
Other comprehensive loss | (157,358 | ) | - | (157,358 | ) | - | - | - | - | (157,358 | ) | - | (157,358 | ) | ||||||||||||||||||||||||||||||||||||||||||
Private Placement | 5,000,000 | 500,000 | - | - | - | - | 500,000 | 5,000,000 | 500,000 | - | - | - | - | 500,000 | ||||||||||||||||||||||||||||||||||||||||||
Warrants issuance(Note 10(b)) | (70,230 | ) | - | 70,230 | - | - | - | |||||||||||||||||||||||||||||||||||||||||||||||||
Warrant exercise | 1,700,000 | 236,300 | - | (23,800 | ) | - | - | 212,500 | ||||||||||||||||||||||||||||||||||||||||||||||||
Warrants issuance (Note 12(b)) | - | (70,230 | ) | - | 70,230 | - | - | - | ||||||||||||||||||||||||||||||||||||||||||||||||
Warrants exercise | 1,700,000 | 236,300 | - | (23,800 | ) | - | - | 212,500 | ||||||||||||||||||||||||||||||||||||||||||||||||
Stock option exercise | 439,166 | 98,971 | (34,380 | ) | - | - | - | 64,591 | 439,166 | 98,971 | (34,380 | ) | - | - | - | 64,591 | ||||||||||||||||||||||||||||||||||||||||
Share-based payment charged to operations | - | 151,038 | - | - | - | 151,038 | - | - | 151,038 | - | - | - | 151,038 | |||||||||||||||||||||||||||||||||||||||||||
Balance asat December31,2015 | 29,518,343 | $ | 18,927,388 | $ | 2,695,038 | $ | 1,439,632 | $ | (362,210 | ) | $ | 18,653,064 | $ | 4,046,784 | ||||||||||||||||||||||||||||||||||||||||||
Balance as at December 31, 2015 | 29,518,343 | $ | 18,927,388 | $ | 2,695,038 | $ | 1,439,632 | $ | (362,210 | ) | $ | (18,653,064 | ) | $ | 4,046,784 | |||||||||||||||||||||||||||||||||||||||||
Profit for the year | - | - | - | - | - | 64,247 | 64,247 | |||||||||||||||||||||||||||||||||||||||||||||||||
Other comprehensive gain | - | - | - | - | 60,173 | - | 60,173 | |||||||||||||||||||||||||||||||||||||||||||||||||
Warrant exercise (note 12 (d)) | 5,711,683 | 2,904,840 | - | (683,578 | ) | - | - | 2,221,262 | ||||||||||||||||||||||||||||||||||||||||||||||||
Expired Warrant | - | - | 756,054 | (756,054 | ) | - | - | - | ||||||||||||||||||||||||||||||||||||||||||||||||
Stock option exercise (note 12 (c)) | 299,166 | 82,494 | (29,927 | ) | - | - | - | 52,567 | ||||||||||||||||||||||||||||||||||||||||||||||||
Balance as at December 31, 2016 | 35,529,192 | $ | 21,914,722 | $ | 3,421,165 | $ | - | $ | (302,037 | ) | $ | (18,588,817 | ) | $ | 6,445,033 | |||||||||||||||||||||||||||||||||||||||||
Loss for the year | - | - | - | - | - | (6,261,382 | ) | (6,261,382 | ) | |||||||||||||||||||||||||||||||||||||||||||||||
Other comprehensive loss | - | - | - | - | (1,410 | ) | - | (1,410 | ) | |||||||||||||||||||||||||||||||||||||||||||||||
Share-based payments charged to operations | - | - | 371,513 | - | - | - | 371,513 | |||||||||||||||||||||||||||||||||||||||||||||||||
Balance as at December 31, 2017 | 35,529,192 | $ | 21,914,722 | $ | 3,792,678 | $ | - | $ | (303,447 | ) | $ | (24,850,199 | ) | $ | 553,754 | |||||||||||||||||||||||||||||||||||||||||
No preference shares were issued at December 31, 2015, 20142017, 2016 and 2013.2015.
The accompanying notes are an integral part of these consolidated financial statements.
LINGO MEDIA CORPORATION
Consolidated Statements of Cash Flows
For the years ended December 31, 2015, 20142017, 2016 and 20132015
(Expressed in Canadian Dollars, unless otherwise stated)
2015 | 2014 | 2013 | ||||||||||
CASH FLOWS FROM OPERATINGACTIVITIES | ||||||||||||
Net Profit for theYear | $ | 2,532,057 | $ | 144,013 | $ | 22,943 | ||||||
Adjustments to Net Profit for Non-CashItems: | ||||||||||||
Amortization – intangibles | 721,720 | 582,857 | 431,049 | |||||||||
Share-based payments | 151,038 | 65,663 | 61,926 | |||||||||
Unrealized foreign exchange gain | (166,109 | ) | (44,035 | ) | (80,468 | ) | ||||||
Interest accretion | 41,167 | 79,288 | 88,931 | |||||||||
Depreciation - property and equipment | 8,579 | 7,386 | 7,624 | |||||||||
Loss on disposition of property and equipment | 954 | 7,773 | - | |||||||||
Operating Profit before WorkingCapitalChanges | 3,289,406 | 842,945 | 532,005 | |||||||||
Working CapitalAdjustments: | ||||||||||||
Decrease / (Increase) in accounts and grants receivable | (1,112,190 | ) | 154,096 | 443,522 | ||||||||
(Increase) / Decrease in prepaid and other receivables | (403,083 | ) | (451 | ) | 35,611 | |||||||
Increase / (Decrease) in accounts payable | 100,339 | (131,681 | ) | (295,340 | ) | |||||||
Increase / (Decrease) in accrued liabilities | (334,821 | ) | 88,172 | 129,756 | ||||||||
Cash Generated from OperatingActivities | 1,539,651 | 953,081 | 845,554 | |||||||||
CASH FLOWS FROM INVESTINGACTIVITIES | ||||||||||||
Expenditures on software, web development and content development costs | (2,071,440 | ) | (544,635 | ) | (431,711 | ) | ||||||
Purchase of property and equipment | (13,281 | ) | (9,536 | ) | - | |||||||
Cash Used in InvestingActivities | (2,084,721 | ) | (554,171 | ) | (431,711 | ) | ||||||
CASH FLOWS FROM FINANCINGACTIVITIES | ||||||||||||
Share capital issued | 500,000 | - | - | |||||||||
Proceeds from stock option exercise | 64,591 | - | - | |||||||||
Proceeds from warrant exercise | 212,500 | - | - | |||||||||
Proceeds from loans | 90,000 | - | 240,000 | |||||||||
Repayment of loan payable | (390,000 | ) | - | (615,000 | ) | |||||||
Cash (Used in) / Generated fromFinancingActivities | 477,091 | - | (375,000 | ) | ||||||||
NET INCREASE (DECREASE) INCASH | (67,979 | ) | 398,910 | 38,843 | ||||||||
Cash at the Beginning of theYear | 477,001 | 78,091 | 39,248 | |||||||||
Cash at the End of theYear | $ | 409,022 | $ | 477,001 | $ | 78,091 | ||||||
2017 | 2016 | 2015 | ||||||||||
CASH FLOWS FROM OPERATING ACTIVITIES | ||||||||||||
Net Profit (Loss) for the Year | $ | (6,261,382 | ) | $ | 64,247 | $ | 2,532,057 | |||||
Adjustments to Net Profit (Loss) for Non-Cash Items: | ||||||||||||
Amortization – intangibles | 1,051,928 | 1,003,485 | 721,720 | |||||||||
Share-based payments | 371,513 | - | 151,038 | |||||||||
Unrealized foreign exchange loss (gain) | (1,410 | ) | 61,166 | (166,109 | ) | |||||||
Interest accretion | - | - | 41,167 | |||||||||
Lease inducement | (21,147 | ) | 57,673 | - | ||||||||
Bad debts | 732,254 | - | - | |||||||||
Long term deposit | 300,000 | - | - | |||||||||
Depreciation - property and equipment | 6,644 | 7,297 | 8,579 | |||||||||
Loss on asset acquisition | 80,819 | - | - | |||||||||
Impairment loss – intangible assets | 1,948,082 | - | - | |||||||||
Impairment loss – goodwill | 139,618 | - | - | |||||||||
Loss on disposition of property and equipment | - | 2,670 | 954 | |||||||||
Operating Profit (Loss) before Working Capital Changes | (1,653,081 | ) | 1,196,538 | 3,289,406 | ||||||||
Working Capital Adjustments: | ||||||||||||
Accounts and grants receivable | 1,429,133 | (1,083,394 | ) | (1,112,190 | ) | |||||||
Prepaid and other receivables | 374,364 | (91,692 | ) | (403,083 | ) | |||||||
Accounts payable | 28,867 | 22,777 | 100,339 | |||||||||
Accrued liabilities | (94,580 | ) | (105,458 | ) | (334,821 | ) | ||||||
Cash Generated from (Used in) Operating Activities | 84,702 | (61,229 | ) | 1,539,651 | ||||||||
CASH FLOWS FROM INVESTING ACTIVITIES | ||||||||||||
Long-term deposit | - | (300,000 | ) | - | ||||||||
Cash (net) paid for acquisition | 9,355 | - | - | |||||||||
Expenditures on software, web development and content development costs | - | (1,798,687 | ) | (2,071,440 | ) | |||||||
Purchase of property and equipment | (926 | ) | (8,632 | ) | (13,281 | ) | ||||||
Cash Used in Investing Activities | 8,429 | (2,107,319 | ) | (2,084,721 | ) | |||||||
CASH FLOWS FROM FINANCING ACTIVITIES | ||||||||||||
Share capital issued | - | - | 500,000 | |||||||||
Proceeds from stock option exercise | - | 52,567 | 64,591 | |||||||||
Proceeds from warrant exercise | - | 2,221,262 | 212,500 | |||||||||
Proceeds from loans | 1,460,000 | 150,000 | 90,000 | |||||||||
Repayment of loans | (1,310,000 | ) | (580,000 | ) | (390,000 | ) | ||||||
Cash Generated from Financing Activities | 150,000 | 1,843,829 | 477,091 | |||||||||
NET INCREASE (DECREASE) IN CASH | 243,131 | (324,719 | ) | (67,979 | ) | |||||||
Cash at the Beginning of the Year | 84,303 | 409,022 | 477,001 | |||||||||
Cash at the End of the Year | $ | 327,434 | $ | 84,303 | $ | 409,022 | ||||||
Interest paid disclosedSupplemental cash flow information in Note 21.Note23
The accompanying notes are an integral part of these consolidated financial statements.
LINGO MEDIA CORPORATION
Notes to Consolidated Financial Statements
December 31, 2017, 2016 and 2015
(Expressed in Canadian Dollars, unless otherwise stated)
|
1. | CORPORATE INFORMATION |
Lingo Media Corporation (“Lingo Media” or the “Company”) is a publicly listed company incorporated in Canada with limited liability under the legislation of the Province of Ontario and its shares are listed on the TSX Venture Exchange and inter-listed on the OTCQB Marketplace. The consolidated financial statements of the Company as at and for the year ended December 31, 20152017 comprise the Company and its wholly owned subsidiaries consisted ofsubsidiaries: Lingo Learning Inc., ELL Technologies Ltd., Vizualize Technologies Corporation, ELL Technologies Limited, Speak2Me Inc., Parlo Corporation and Lingo Group Limited.Limited (the “Group”).
Lingo Media is an EdTech company that is ‘ChangingthewaytheworldlearnsEnglish’. The Company provides online and print-based solutions through its two distinct business units: ELL Technologies Ltd. (“ELL Technologies”) and Lingo Learning Inc. (“Lingo Learning”). ELL Technologies is a global English language learning multi-media and online training company. Lingo Learning is a print-based publisher of English language learning school programs in China.
The head office, principal address and registered and records office of the Company is located at 151 Bloor Street West, Suite 703, Toronto, Ontario, Canada, M5S 1S4.
2. | BASIS OF PREPARATION |
2.1 | Statement ofcompliance |
These consolidated financial statements of the Company have been prepared in accordance with International Financial Reporting Standards (“IFRS”) as issued by the International Accounting Standards Board (“IASB”) and interpretations of the IFRS Interpretations Committee (“IFRIC”). These consolidated financial statements were authorized by the Board of Directors on April 28, 2016.30, 2018.
2.2 | Basis of measurement |
These consolidated financial statements have been prepared on the historical cost basis except as provided in note 4. The comparative figures presented in these consolidated financial statements are in accordance with the same accounting policies.
2.3 | Basis of consolidation |
The consolidated financial statements comprise the financial statements of the Company and its wholly owned subsidiaries controlled by the Company (the “Group”) as at December 31, 2015.. Control exists when the Company is exposed to, or has the rights to variable returns from its involvement with the entity and has the ability to affect these returns through its power over the entity.
Subsidiaries are fully consolidated from the date of acquisition, being the date on which the Group obtains control, and continue to be consolidated until the date when such control ceases. The financial statements of the subsidiaries are prepared for the same reporting period as the parent company, using consistent accounting policies. All inter-group balances, transactions, unrealized gains and losses resulting from inter-group transactions and dividends are eliminated in full.
2.4 | Functional and presentation currency |
The functional currency is the currency of the primary economic environment in which the entity operates and has been determined for each entity within the Group. These consolidated financial statements are presented in Canadian Dollars, which is the Company’s functional currency. The functional currency of ELL Technologies Limited and Lingo Group Limited are United States Dollar (“USD”). All other subsidiaries’ functional currency is Canadian Dollar (“CAD”).
The functional currency determinations were conducted through an analysis of the consideration factors identified in IAS 21, “The Effects of Changes in Foreign Exchange Rates”.
LINGO MEDIA CORPORATION
Notes to Consolidated Financial Statements
December 31, 2017, 2016 and 2015
(Expressed in Canadian Dollars, unless otherwise stated)
|
3. | SIGNIFICANT ACCOUNTING JUDGEMENTS, ESTIMATES AND ASSUMPTIONS |
The preparation of the Company’s consolidated financial statements in conformity with IFRS requires management to make judgments,judgements, estimates and assumptions that affect the application of accounting policies, reported amounts of assets, liabilities and contingent liabilities, revenues and expenses at the date of the consolidated financial statements and during the reporting period.
Estimates and assumptions are continuously evaluated and are based on management’s historical experience and other factors, including expectations of future events that are believed to be reasonable under the circumstances. However, actual outcomes can differ from these estimates. Revisions to accounting estimates are recognized in the period in which the estimate is revised if the revision affects only that period or in the period of the revision and further periods if the review affects both current and future periods.
Information about critical judgements and estimates in applying accounting policies that have the most significant effect on the amounts recognized in the consolidated financial statements is included in the following notes:
● | Determination of functional currency |
● | Determination of allowance for doubtful accounts |
● | Determination of the recoverability of the carrying value of intangibles and goodwill |
● | Recognition of internally developed intangibles |
● | Determination and recognition of long-term revenue contracts |
● | Recognition of government grant and grant receivable |
● | Recognition of deferred tax assets |
● | Valuation of share-based payments |
● | Recognition of provisions and contingent liabilities |
4. | SUMMARY OF SIGNIFICANT ACCOUNTING POLICIES |
4.1 | Revenuerecognition |
Revenue from fee-based English language training and assessment services and licenses are recognized upon delivery based on the terms of the agreement and when the risk of ownership is transferred and collectability is reasonably assured.
When the outcome of long-term service contracts cannot be reliably estimated, all contract related costs are expensed and revenues are recognized only to the extent that those costs are recoverable. When the uncertainties that prevented reliable estimation of the outcome of a contract no longer exist, contract revenue and expenses are recognized using the stage of completion method based on milestones achieved.
Revenue from royalty and licensing sales is recognized based on confirmation of finished products produced by the Company’s co-publishing partners and when collectability is reasonably assured. Royalty revenue from audiovisual products is recognized based on the confirmation of sales by its co-publishing partners, and when collectability is reasonably assured. Royalty revenues are not subject to right of return or product warranties. Revenue from the sale of published and supplemental products is recognized upon delivery and when the risk of ownership is transferred and collectability is reasonably assured.
The Company does not recognize non-monetary revenues until the service received is exchangeexchanged and the amount can be reliably estimated. Non-monetary revenues are measured at the fair value of services received.
LINGO MEDIA CORPORATION
Notes to Consolidated Financial Statements
December 31, 2017, 2016 and 2015
(Expressed in Canadian Dollars, unless otherwise stated)
|
4. | SUMMARY OF SIGNIFICANT ACCOUNTING POLICIES (Cont’d) |
4.2 | Comprehensiveincome (loss) |
Comprehensive income (loss) measures net earningsprofit for the period plus other comprehensive income. Other comprehensive income (loss) consists of changes in equity, from non-owner sources, such as changes to foreign currency translation adjustments of foreign operations during the period. Amounts reported as other comprehensive income are accumulated in a separate component of shareholders’ equity as accumulated other comprehensive income.
4.3 | Property and equipment |
Property and equipment are initially recorded at cost. Depreciation is provided using methods outlined below at rates intended to depreciate the cost of assets over their estimated useful lives.
Method | Rate |
Computer and office equipment | Declining balance 20 % |
4.4 | Software and web development costs |
The Company capitalizes all costs related to the development of its fee-based English Language Learning products and services when the feasibility and profitability of the project can be reasonably considered certain. Expenditure on development activities, whereby research findings are applied to a plan or design for the production of new or substantially improved products and processes, is capitalized if the product or process is technically and commercially feasible and the Group has sufficient resources to complete development. The expenditure capitalized includes the cost of material, and direct labour. Other development expenditure is recognized in the statement of comprehensive income (loss) as an expense as incurred. Capitalized development expenditure is stated at cost less accumulated amortization and impairment losses. The software and web development cost are being amortized on a straight-line basis over the useful life of the asset, which is estimated to be 3 years.
4.5 | Content development costs |
The Company capitalizes all costs related to content development of its fee-based English Language Learning products and services when the feasibility and profitability of the project can be reasonably considered certain. Expenditure on content development activities, whereby research findings are applied to a plan or design for the production of new or substantially improved products and processes, is capitalized if the product or process is technically and commercially feasible and the Group has sufficient resources to complete development. The expenditure capitalized includes the cost of material, and direct labour. Other development expenditure is recognized in the statement of comprehensive income (loss) as an expense as incurred. Capitalized content development expenditure is stated at cost less accumulated amortization and impairment losses. The content development costs are being amortized on a straight-line basis over the useful life of the asset, which is estimated to be 5 years.
4.6 | Goodwill |
Goodwill represents the excess of the purchase price over the fair value of the net identifiable assets of an acquired business.
The Company measures goodwill as the fair value of the consideration transferred including the recognized amount of any non-controlling interest in the venture, less the net recognized amount (fair value) of the identifiable assets acquired and liabilities assumed, all measured as of the acquisition date. When the excess is negative, a bargain purchase gain is recognized immediately in net profit.
LINGO MEDIA CORPORATION
Notes to Consolidated Financial Statements
December 31, 2017, 2016 and 2015
(Expressed in Canadian Dollars, unless otherwise stated)
|
4. | SUMMARY OF SIGNIFICANT ACCOUNTING POLICIES (Cont’d) |
4.6 | Goodwill(Cont’d) |
The Company elects on a transaction-by-transaction basis whether to measure non-controlling interest at its fair value, or at its proportionate share of the recognized amount of the identifiable net assets, at the acquisition date. Transaction costs, other than those associated with the issue of debt or equity securities, that the Company incurs in connection with a business combination are expensed as incurred.
4.7 | Government grants |
The Company receives government grants based on certain eligibility criteria for book publishing industry development in Canada. These government grants are recognized quarterly and are recorded as a reduction of general and administrative expenses to offset direct costs funded by the grant during the period in which the criteria to receive the grant is met. The Company records a liability for the repayment of the grants and a charge to operations in the period in which conditions arise that will cause the government grants to be repayable.
4.8 | Current and deferred income taxes |
Income tax on the profit or loss for the periods presented comprises current and deferred tax. Income tax is recognized in profit or loss except to the extent that it relates to items recognized directly in equity, in which case it is recognized in equity. Current tax expense is the expected tax payable on the taxable income for the year, using tax rates enacted or substantively enacted at period end, adjusted for amendments to tax payable with regards to previous years.
Deferred taxation is recognized using the liability method on temporary differences between the carrying amounts of assets and liabilities for financial reporting purposes and the amounts used for taxation purposes.
However, the deferred taxation is not recognized if it arises from initial recognition of an asset or liability in a transaction other than a business combination that at the time of the transaction affects neither accounting nor taxable profit or loss. Deferred taxation is determined using tax rates (and laws) that have been enacted or substantially enacted by the reporting date and are expected to apply when the related deferred tax asset is realized or the deferred tax liability is settled.
A deferred tax asset is recognized to the extent that it is probable that future taxable profits will be available against which the temporary difference can be utilized. Deferred tax assets are reviewed at each reporting date and are reduced to the extent that it is no longer probable that the related tax benefit will be realized.
Deferred income tax is provided on temporary differences arising on investments in subsidiaries, associates and joint ventures, except where the timing of the reversal of the temporary difference is controlled by the Company and it is probable that the temporary difference will not reverse in the foreseeable future.
Deferred tax assets and deferred tax liabilities are offset, if a legally enforceable right exists to offset current income tax assets against current income tax liabilities and the deferred taxes relate to the same taxable entity and the same taxation authority.
LINGO MEDIA CORPORATION
Notes to Consolidated Financial Statements
December 31, 2017, 2016 and 2015
(Expressed in Canadian Dollars, unless otherwise stated)
|
4. | SUMMARY OF SIGNIFICANT ACCOUNTING POLICIES (Cont’d) |
4.9 | Foreign currencytranslation |
Foreign currency transactions are initially recorded in the functional currency at the transaction date exchange rate. At the balance sheet date, monetary assets and liabilities denominated in a foreign currency are translated into the functional currency at the reporting date exchange rate. Foreign exchange gains and losses resulting from the settlement of such transactions and from the remeasurement of monetary items at year-end exchange rates are recognized in the income statement. Non-monetary items measured at historical cost are translated using the historical exchange rate. Non-monetary items measured at fair value are translated using the exchange rates at the date when fair value was determined.
Financial statements of subsidiaries, affiliates and joint ventures for which the functional currency is not the Canadian Dollar are translated into the Canadian Dollar as follows: all asset and liability accounts are translated at the balance sheet exchange rate and all earnings and expense accounts and cash flow statement items are translated at average exchange rates for the period. The resulting translation gains and losses are recorded as foreign currency translation adjustments in other comprehensive income (loss) and recorded in accumulated other comprehensive income in equity. On disposal of a foreign operation the cumulative translation differences recognized in equity are reclassified to the statement of comprehensive income (loss) and recognized as part of the gain or loss on disposal. Goodwill and fair value adjustments arising on the acquisition of a foreign entity have been treated as assets and liabilities of the foreign entity and translated into Canadian Dollars at the balance sheet rate.
Foreign exchange gains or losses arising from a monetary item receivable from or payable to a foreign operation, the settlement of which is neither planned nor likely to occur in the foreseeable future and which in substance is considered to form part of the net investment in the foreign operation, are recognized in other comprehensive income in accumulated other comprehensive income.(loss).
4.10 | Earnings (loss) per share |
Earnings (loss) per share is computed by dividing the earnings (loss) for the year by the weighted average number of common shares outstanding during the year, including contingently issuable shares which are included when the conditions necessary for issuance have been met. Diluted earnings per share is calculated in a similar manner, except that the weighted average number of common shares outstanding is increased to include potentially issuable common shares from the assumed exercise of common share purchase options and warrants, if dilutive.
4.11 | Share-based compensation plan |
The share-based compensation plan allows the Company employees and consultants to acquire shares of the Company. The fair value of share-based payment awards granted is recognized as an employee or consultant expense with a corresponding increase in equity. An individual is classified as an employee when the individual is an employee for legal or tax purposes (direct employee) or provides services similar to those performed by a direct employee.
Each tranche in an award is considered a separate award with its own vesting period and grant date fair value. The fair value is measured at grant date and each tranche is recognized on a graded vesting basis over the period during which the share purchase options vest. The fair value of the share-based payment awards granted is measured using the Black-Scholes option pricing model taking into account the terms and conditions upon which the awards were granted. At each financial position reporting date, the amount recognized as an expense is adjusted to reflect the actual number of awards, for which the related service and non-market vesting conditions are expected to be met.
LINGO MEDIA CORPORATION
Notes to Consolidated Financial Statements
December 31, 2017, 2016 and 2015
(Expressed in Canadian Dollars, unless otherwise stated)
|
4. | SUMMARY OF SIGNIFICANT ACCOUNTING POLICIES (Cont’d) |
4.11 | Share-based compensation plan(Cont’d) |
For equity-settled share-based payment transactions with non-employees, the Company measures the goods or services received, and the corresponding increase in equity, directly, at the fair value of the goods or services received, unless that fair value cannot be estimated reliably, in which cases, the Company measures their value, and the corresponding increase in equity, indirectly, by reference to the fair value of the equity instruments granted.
4.12 | Financial instruments |
All financial instruments are recorded initially at fair value. In subsequent periods, all financial instruments are measured based on the classification adopted for the financial instrument: fair value through profit and loss (“FVTPL”); held to maturity; loans and receivables; and available for sale or other financial liability.
Financial assets: FVTPL assets are subsequently measured at fair value with the change in the fair value recognized in net incomeprofit during the period.
Loans and receivables are subsequently measured at amortized cost using the effective interest rate method.
Financial liabilities: Other financial liabilities are subsequently measured at amortized cost using the effective interest rate method. Transaction costs are costs that are directly attributable to a financial instrument’s origination, acquisition, issuance or assumption, are included in the fair value adjustment of the financial instrument. These costs are amortized over the life of the financial instrument.
The Company has classified its financial instruments as follows:
FinancialInstrument | Classification |
Cash | FVTPL |
| Accounts and grants receivable | Loans and receivables |
| Accounts payable | Other financial liabilities |
| Accrued liabilities | Other financial liabilities |
| Loans payable | Other financial liabilities |
The Company’s financial instruments measured at fair value on the balance sheet consist of cash, which is measured at level 1 of the fair value hierarchy. There are three levels of the fair value hierarchy as follows:
Level 1: Values based on unadjusted quoted prices in active markets that are accessible at the measurement date for identical assets or liabilities.
Level 2: Values based on quoted prices in markets that are not active or model inputs that are observable either directly or indirectly for substantially the full term of the asset or liability.
Level 3: Values based on prices or valuation techniques that require inputs that are both unobservable and significant to the overall fair value measurement.
LINGO MEDIA CORPORATION
Notes to Consolidated Financial Statements
December 31, 2017, 2016 and 2015
(Expressed in Canadian Dollars, unless otherwise stated)
|
4. | SUMMARY OF SIGNIFICANT ACCOUNTING POLICIES (Cont’d) |
4.13 | Impairment of long-livedassets |
The Company’s property and equipment and intangibles with finite lives are reviewed for an indication of impairment at each balance sheet date. The Company’s intangible assets that have an indefinite life or are not ready for use are not subject to amortization and are tested annually for impairment. Goodwill is reviewed for impairment annually or at any time if an indicator of impairment exists. If indication of impairment exists, the asset’s recoverable amount is estimated. The recoverable amount is the greater of the asset’s fair value less costs of disposal and value in use. In assessing value in use, the estimated future cash flows are discounted to their present value using a pre-tax discount rate that reflects current market assessments of the time value of money and the risks specific to the asset. An impairment loss is recognized when the carrying amount of an asset, or its cash-generating unit, exceeds its recoverable amount. A cash-generating unit is the smallest identifiable group of assets that generates cash inflows that are largely independent of the cash inflows from other assets or groups of assets. Impairment losses are recognized in profit and loss for the period.
An impairment loss, other than goodwill impairment, is reversed if there is an indication that there has been a change in the estimates used to determine the recoverable amount. An impairment loss is reversed only to the extent that the asset’s carrying amount does not exceed the carrying amount that would have been determined, net of depreciation or amortization, if no impairment loss had been recognized.
Goodwill represents the excess of the cost of an acquisition over the fair value of the Company’s share of identifiable net assets of the acquired subsidiary at the date of acquisition. Goodwill is carried at cost less accumulated impairment losses. Goodwill is allocated to each cash generating unit (“CGU”) or group of CGUs that are expected to benefit from the related business combination. A group of CGUs represents the lowest level within the entity at which the goodwill is monitored for internal management purposes, which is not higher than an operating segment.
For the purposes of impairment testing, goodwill is allocated to each of the Group’s cash-generating units (or groups of cash-generating units) that is expected to benefit from the synergies of the combination.Acombination.
A cash-generating unit to which goodwill has been allocated is tested for impairment annually, or more frequently when there is indication that the unit may be impaired. If the recoverable amount of the cash-generating unit is less than its carrying amount, the impairment loss is allocated first to reduce the carrying amount of any goodwill allocated to the unit and then to the other assets of the unit pro rata based on the carrying amount of each asset in the unit. Any impairment loss for goodwill is recognized directly in profit or loss in the consolidated statement of comprehensive loss.
An impairment loss recognized for goodwill is not reversed in subsequent periods. On disposal of the relevant cash-generating unit, the attributable amount of goodwill is included in the determination oftheof the profit or loss on disposal. Determining whether goodwill is impaired requires an estimation of the higher of fair value less costs of disposal and value in use of the cash-generating units to which goodwill has been allocated. The value in use calculation requires the management to estimate the future cash flows expected to arise from the cash-generating unit and a suitable discount rate in order to calculate present value.
4.14 | Leases |
Leases are classified as either finance or operating. Leases that transfer substantially all of the risks and benefits of ownership of the leased asset to the Company are classified as finance leases. Finance leases are capitalized at the lease’s commencement at the lower of fair value of the leased asset and the present value of the minimum lease payments. Leases in which a significant portion of the risks and rewards of ownership are retained by the lessor are classified as operating leases. Rental payments, net of any incentives received from the lessor, are charged to earnings on a straight-line basis over the period of the lease.
LINGO MEDIA CORPORATION
Notes to Consolidated Financial Statements December 31, 2017, 2016 and 2015 (Expressed in Canadian Dollars, unless otherwise stated)
From time to time, the Company may issue warrants as a means of raising capital. The Company values warrants using the Black-Scholes pricing model. Any transaction costs arising on the issue of warrants are recognized in equity as a reduction of the proceeds from warrants. In the event that warrants are exercised, the fair value of the warrants issued is reclassified from warrants to share capital. In the event that warrants expire unexercised, their value is transferred from warrants to share-based payment reserve.
The following pronouncements issued by the IASB and interpretations published by IFRIC will become effective for annual periods beginning on or after January 1,
Effective for periods beginning on or after January 1, 2018
IFRS 15 Revenue from Contracts with Customers was issued by the IASB in May 2014. The core principle of the new standard is for companies to recognize revenue to depict the transfer of goods or services to customers in amounts that reflect the consideration (that is, payment) to which the company expects to be entitled in exchange for those goods or services. The new standard will also result in enhanced disclosures about revenue, provide guidance for transactions that were not previously addressed comprehensively (for example, service revenue and contract modifications) and improve guidance for multiple-element arrangements. Earlier application is permitted. IFRS 15 supersedes the following standards: IAS 11 Construction Contracts, IAS 18 Revenue, IFRIC 13 Customer Loyalty Programmes, IFRIC 15 Agreements for the Construction of Real Estate, IFRIC 18 Transfers of Assets from Customers, and SIC-31 Revenue—Barter Transactions Involving Advertising Services.
IFRS 9 Financial Instruments was issued by the IASB in July 2014 and will replace IAS 39 Financial Instruments: Recognition and Measurement. IFRS 9 uses a single approach to determine whether a financial asset is measured at amortized cost or fair value, replacing the multiple rules in IAS 39. The approach in IFRS 9 is based on how an entity manages its financial instruments in the context of its business model and the contractual cash flow characteristics of the financial assets. Most of the requirements in IAS 39 for classification and measurement of financial liabilities were carried forward unchanged to IFRS 9. The new standard also requires a single impairment method to be used, replacing the multiple impairment methods in IAS 39. A new hedge accounting model is introduced and represents a substantial overhaul of hedge accounting which will allow entities to better reflect their risk management activities in the financial statements. The most significant improvements apply to those that hedge non-financial risk, and so these improvements are expected to be of particular interest to non-financial institutions.
IFRS 16, Leases replaces IAS 17, Leases and related interpretations. The core principle is that a lessee recognizes assets and liabilities for all leases with a lease term of more than 12 months. A lessee is required to recognize a right-of-use asset representing its right to use the underlying leased asset and a lease liability representing its obligation to make lease payments. Assets and liabilities arising from a lease are initially measured on a present value basis. The measurement includes non-cancellable lease payments (including inflation-linked payments), and also includes payments to be made in optional periods if the lessee is reasonably certain to exercise an option to extend the lease, or not to exercise an option to terminate the lease. The new standard is intended to provide a faithful representation of leasing transactions, in particular those that do not currently require the lessees to recognize an asset and liability arising from an operating lease. IFRS 16 is effective for annual periods beginning on January 1, 2019, with early adoption permitted for entities that would also apply IFRS 15, Revenue from Contracts with Customers.
LINGO MEDIA CORPORATION Notes to Consolidated Financial Statements December 31, 2017, 2016 and 2015 (Expressed in Canadian Dollars, unless otherwise stated)
The Company has not yet completed its evaluations of the effect of adopting the above standards and the impact it may have on its consolidated financial statements.
As at December 31,
| |||||||||||||||||||||||||||||||||||||||||||||||||||||||||||||||||||||||||||||||||||||||||||||||||||||||||||||||||||||||||||||||||||||||||||||||||||||||||||||||||||||||||||||||||||||||||||||||||||||||||||||||||||||||||||||||||||||||||||||||||||||||||||||||||||||||||||||||||||||||||||||||||||||||||||||||||||||||||||||||||||||||||||||||||||||||||||||||||||||||||||||||||||||||||||||||||||||||||||||||||||||||||||||||||||||||||||||||||||||||||||||||||||||||||||||||||||||||||||||||||||||||||||||||||||||||||||||||||||||||||||||||||||||||||||||||||||||||||||||||||||||||||||||||||||||||||||||||||||||||||||||||||||||||||||||||||||||||||||||||||||||||||||||||||||||||||||||||||||||||||||||||||||||||||||||||||||||||||||||||||||||||||||||||||||||||||||||||||||||||||||||||||||||||||||||||||||||||||||||||||||||||||||||||||||||||||||||||||||||||||||||||||||||||||||||||||||||||||||||||||||||||||||||||||||||||||||||||||||||||||||||||||||||||||||||||||||||||||||||||||||||||||||||||||||||||||||||||||||||||