UNITED STATES
SECURITIES AND EXCHANGE COMMISSION
Washington, D. C. 20549
Form 10-Q
(Mark One)
☒ | QUARTERLY REPORT PURSUANT TO SECTION 13 OR 15(d) OF THE SECURITIES EXCHANGE ACT OF 1934 |
For the quarterly period ended March 31, 2020
OR
☐ | TRANSITION REPORT PURSUANT TO SECTION 13 OR 15(d) OF THE SECURITIES EXCHANGE ACT OF 1934 |
For the transition period from to
Commission file number 000-32017
CENTERSTATE BANK CORPORATION
(Exact Name of Registrant as Specified in Its Charter)
Florida |
| 59-3606741 |
(State or Other Jurisdiction |
| (I.R.S. Employer |
1101 First Street South, Suite 202
Winter Haven, Florida 33880
(Address of Principal Executive Offices)
(863) 293-4710
(Issuer’s Telephone Number, Including Area Code)
Indicate by check mark whether the registrant (1) has filed all reports required to be filed by Section 13 or 15(d) of the Securities Exchange Act of 1934 during the preceding 12 months (or for such shorter period that the registrant was required to file such reports), and (2) has been subject to such filing requirements for the past 90 days. Yes ☒ No ☐
Indicate by check mark whether the registrant has submitted electronically every Interactive Data File required to be submitted pursuant to Rule 405 of Regulation S-T (§ 232.405 of this chapter) during the preceding 12 months (or for such shorter period that the registrant was required to submit such files). Yes ☒ No ☐
Indicate by check mark whether the registrant is a large accelerated filer, an accelerated filer, a non-accelerated filer, smaller reporting company, or an emerging growth company. See the definitions of “large accelerated filer,” “accelerated filer,” “smaller reporting company,” and “emerging growth company” in Rule 12b-2 of the Exchange Act.
Large accelerated filer |
| ☒ |
| Accelerated filer |
| ☐ |
|
|
|
| |||
Non-accelerated filer |
| ☐ |
| Small reporting company |
| ☐ |
|
|
|
|
|
|
|
Emerging growth company |
| ☐ |
|
|
|
|
If an emerging growth company, indicate by check mark if the registrant has elected not to use the extended transition period for complying with any new or revised financial accounting standards provided pursuant to Section 13(a) of the Exchange Act. ☐
Indicate by check mark whether the registrant is a shell company (as defined in Rule 12b-2 of the Exchange Act). Yes ☐ No ☒
Securities registered pursuant to Section 12 (b) of the Act:
Title of each class | Trading Symbol(s) | Name of each exchange on which registered |
Common stock | CSFL | NASDAQ |
APPLICABLE ONLY TO CORPORATE ISSUERS:
Indicate the number of shares outstanding of each of the issuer’s classes of common stock, as of the latest practicable date:
| Common stock, par value $.01 per share |
|
|
| 124,132,401 shares |
|
(class) |
| Outstanding at April 29, 2020
| ||||
CENTERSTATE BANK CORPORATION AND SUBSIDIARIES
INDEX
|
| Page |
PART I. FINANCIAL INFORMATION |
|
|
Item 1. Financial Statements |
|
|
Condensed consolidated balance sheets (unaudited) at March 31, 2020 and December 31, 2019 |
| 3 |
|
| 4 |
|
| 6 |
|
| 7 |
Notes to condensed consolidated financial statements (unaudited) |
| 9 |
Item 2. Management’s Discussion and Analysis of Financial Condition and Results of Operations |
| 48 |
Item 3. Quantitative and Qualitative Disclosures About Market Risk |
| 67 |
|
| 67 |
PART II. OTHER INFORMATION |
|
|
|
| 68 |
|
| 68 |
Item 2. Unregistered Sales of Equity Securities and Use of Proceeds |
| 69 |
|
| 69 |
|
| 69 |
|
| 69 |
|
| 70 |
|
| 71 |
CERTIFICATIONS |
|
|
2
CenterState Bank Corporation and Subsidiaries
CONDENSED CONSOLIDATED BALANCE SHEETS (unaudited)
(in thousands of dollars, except per share data)
|
| March 31, 2020 |
| December 31, 2019 |
ASSETS |
|
|
|
|
Cash and due from banks |
| $135,338 |
| $185,255 |
Deposits in other financial institutions (restricted cash) |
| 550,101 |
| 140,913 |
Federal funds sold and FRB deposits |
| 461,252 |
| 163,890 |
Cash and cash equivalents |
| 1,146,691 |
| 490,058 |
Trading securities, at fair value |
| 8,432 |
| 4,987 |
Available for sale debt securities, at fair value |
| 2,138,442 |
| 1,886,724 |
Held to maturity debt securities, net of allowance for credit losses of $10 at |
|
|
|
|
March 31, 2020 (fair value of $205,458 and $208,852 at March 31, 2020 |
|
|
|
|
and December 31, 2019, respectively) |
| 195,948 |
| 202,903 |
Loans held for sale (see Note 6) |
| 188,316 |
| 142,801 |
Loans, excluding Purchased Credit Deteriorated ("PCD") loans |
| 11,876,909 |
| 11,848,475 |
PCD loans |
| 150,322 |
| 135,468 |
Allowance for credit losses |
| (158,733) |
| (40,655) |
Net Loans |
| 11,868,498 |
| 11,943,288 |
Bank premises and equipment, net |
| 296,471 |
| 296,706 |
Right-of-use operating lease assets |
| 33,062 |
| 32,163 |
Accrued interest receivable |
| 43,382 |
| 40,945 |
FHLB, FRB and other stock, at cost |
| 100,463 |
| 100,305 |
Goodwill |
| 1,204,417 |
| 1,204,417 |
Core deposit intangible, net |
| 87,295 |
| 91,157 |
Other intangible assets, net |
| 4,131 |
| 4,507 |
Bank owned life insurance |
| 331,713 |
| 330,155 |
Other repossessed real estate owned |
| 9,942 |
| 5,092 |
Deferred income tax asset, net |
| 37,687 |
| 28,786 |
Bank property held for sale |
| 21,347 |
| 23,781 |
Interest rate swap derivatives, at fair value |
| 831,891 |
| 273,068 |
Prepaid expense and other assets |
| 48,164 |
| 40,182 |
TOTAL ASSETS |
| $18,596,292 |
| $17,142,025 |
|
|
|
|
|
LIABILITIES AND EQUITY |
|
|
|
|
Deposits: |
|
|
|
|
Demand - non-interest bearing |
| $4,164,091 |
| $3,929,183 |
Demand - interest bearing |
| 2,650,252 |
| 2,613,933 |
Savings and money market accounts |
| 4,413,773 |
| 4,336,721 |
Time deposits |
| 2,893,383 |
| 2,256,555 |
Total deposits |
| 14,121,499 |
| 13,136,392 |
|
|
|
|
|
Securities sold under agreement to repurchase |
| 81,736 |
| 93,141 |
Federal funds purchased |
| 255,433 |
| 379,193 |
Other borrowed funds |
| 211,000 |
| 161,000 |
Corporate and subordinated debentures |
| 71,356 |
| 71,343 |
Accrued interest payable |
| 4,334 |
| 3,998 |
Interest rate swap derivatives, at fair value |
| 842,451 |
| 275,033 |
Operating lease liabilities |
| 35,168 |
| 34,485 |
Reserve for unfunded commitments |
| 7,110 |
| — |
Payables and accrued expenses |
| 95,953 |
| 90,722 |
Total liabilities |
| 15,726,040 |
| 14,245,307 |
|
|
|
|
|
Equity: |
|
|
|
|
Common stock, $.01 par value: 200,000,000 shares authorized; 124,131,401 |
|
|
|
|
and 125,173,597 shares issued and outstanding at March 31, 2020 and |
|
|
|
|
December 31, 2019, respectively |
| 1,241 |
| 1,252 |
Additional paid-in capital |
| 2,376,637 |
| 2,407,385 |
Retained earnings |
| 435,984 |
| 465,680 |
Accumulated other comprehensive income |
| 56,390 |
| 22,401 |
Total equity |
| 2,870,252 |
| 2,896,718 |
TOTAL LIABILITIES AND EQUITY |
| $18,596,292 |
| $17,142,025 |
See notes to the accompanying condensed financial statements
3
CenterState Bank Corporation and Subsidiaries
CONDENSED CONSOLIDATED STATEMENTS OF INCOME AND COMPREHENSIVE INCOME (unaudited)
(in thousands of dollars, except per share data)
|
| Three months ended March 31, | ||
|
| 2020 |
| 2019 |
Interest income: |
|
|
|
|
Loans |
| $160,675 |
| $116,285 |
Investment securities: |
|
|
|
|
Taxable |
| 12,534 |
| 12,286 |
Tax-exempt |
| 1,737 |
| 1,716 |
Federal funds sold and other |
| 1,813 |
| 1,995 |
|
| 176,759 |
| 132,282 |
Interest expense: |
|
|
|
|
Deposits |
| 19,836 |
| 13,323 |
Securities sold under agreement to repurchase |
| 252 |
| 236 |
Federal funds purchased and other borrowings |
| 2,321 |
| 3,978 |
Corporate and subordinated debentures |
| 997 |
| 570 |
|
| 23,406 |
| 18,107 |
|
|
|
|
|
Net interest income |
| 153,353 |
| 114,175 |
Provision for credit losses |
| 44,914 |
| 1,053 |
Net interest income after credit loss provision |
| 108,439 |
| 113,122 |
|
|
|
|
|
Non-interest income: |
|
|
|
|
Correspondent banking capital markets revenue |
| 26,424 |
| 7,972 |
Other correspondent banking related revenue |
| 1,384 |
| 1,028 |
Mortgage banking revenue |
| 10,973 |
| 4,193 |
Small business administration loans revenue |
| 1,403 |
| 688 |
Service charges on deposit accounts |
| 7,522 |
| 6,678 |
Debit, prepaid, ATM and merchant card related fees |
| 3,667 |
| 5,018 |
Wealth management related revenue |
| 831 |
| 607 |
Bank owned life insurance income |
| 1,927 |
| 1,626 |
Net gain on sale of available for sale debt securities |
| — |
| 17 |
Other non-interest income |
| 1,659 |
| 1,473 |
Total other income |
| 55,790 |
| 29,300 |
See notes to the accompanying condensed consolidated financial statements
4
CenterState Bank Corporation and Subsidiaries
CONDENSED CONSOLIDATED STATEMENTS OF INCOME AND COMPREHENSIVE INCOME (unaudited)
(in thousands of dollars, except per share data)
|
| Three months ended March 31, | ||
|
| 2020 |
| 2019 |
Non-interest expense: |
|
|
|
|
Salaries, wages and employee benefits |
| $77,077 |
| $48,393 |
Occupancy expense |
| 7,346 |
| 5,602 |
Depreciation of premises and equipment |
| 4,045 |
| 2,850 |
Supplies, stationary and printing |
| 861 |
| 748 |
Marketing expenses |
| 2,158 |
| 2,020 |
Data processing expense |
| 5,617 |
| 3,656 |
Legal, audit and other professional fees |
| 2,682 |
| 1,442 |
Amortization of intangibles |
| 4,535 |
| 2,814 |
Credit loss expense for unfunded commitments |
| 1,027 |
| — |
Postage and delivery |
| 1,160 |
| 925 |
ATM and debit card and merchant card related expenses |
| 1,598 |
| 1,453 |
Bank regulatory expenses |
| 1,807 |
| 1,616 |
Loss on sale of repossessed real estate (“OREO”) |
| 1 |
| 47 |
Valuation write down of OREO |
| 95 |
| 108 |
(Gain) loss on repossessed assets other than real estate |
| (8) |
| 13 |
Foreclosure related expenses |
| 856 |
| 561 |
Merger related expenses |
| 3,051 |
| 6,365 |
Impairment on bank property held for sale |
| 31 |
| 107 |
Other expenses |
| 8,833 |
| 5,753 |
Total other expenses |
| 122,772 |
| 84,473 |
|
|
|
|
|
Income before provision for income taxes |
| 41,457 |
| 57,949 |
Provision for income taxes |
| 6,025 |
| 13,306 |
Net income |
| $35,432 |
| $44,643 |
|
|
|
|
|
Net income |
| $35,432 |
| $44,643 |
Other comprehensive income, net of tax |
|
|
|
|
Unrealized available for sale debt securities holding gain, |
|
|
|
|
net of taxes of $13,268 and $7,322, respectively |
| 39,729 |
| 21,571 |
Unrealized interest rate swap holding loss, net of |
|
|
|
|
taxes of ($1,917) and $0, respectively |
| (5,740) |
| — |
Less: reclassified adjustments for gain included in net income, |
|
|
|
|
net income tax expense of $0 and $4, respectively |
| — |
| (13) |
|
|
|
|
|
Net change in accumulated other comprehensive income |
| $33,989 |
| $21,558 |
|
|
|
|
|
Total comprehensive income |
| $69,421 |
| $66,201 |
|
|
|
|
|
Earnings per share: |
|
|
|
|
Basic |
| $0.28 |
| $0.47 |
Diluted |
| $0.28 |
| $0.46 |
Common shares used in the calculation of earnings per share: |
|
|
|
|
Basic (1) |
| 124,798,732 |
| 95,740,856 |
Diluted (1) |
| 125,341,227 |
| 96,500,740 |
(1)Excludes participating shares
See notes to the accompanying condensed consolidated financial statements
5
CenterState Bank Corporation and Subsidiaries
CONDENSED CONSOLIDATED STATEMENTS OF CHANGES IN EQUITY
For the three months ended March 31, 2020 and 2019 (unaudited)
(in thousands of dollars, except per share data)
|
|
|
|
|
|
|
|
|
| Accumulated |
|
|
|
| Number of |
|
|
| Additional |
|
|
| other |
|
|
|
| common |
| Common |
| paid in |
| Retained |
| comprehensive |
| Total |
|
| shares |
| stock |
| capital |
| earnings |
| income (loss) |
| equity |
Balances at January 1, 2019 |
| 95,679,596 |
| $957 |
| $1,699,031 |
| $293,777 |
| $(22,421) |
| $1,971,344 |
|
|
|
|
|
|
|
|
|
|
|
|
|
Net income |
|
|
|
|
|
|
| 44,643 |
|
|
| 44,643 |
Unrealized holding gain on |
|
|
|
|
|
|
|
|
|
|
|
|
available for sale securities, net of |
|
|
|
|
|
|
|
|
|
|
|
|
deferred income tax of $7,318 |
|
|
|
|
|
|
|
|
| 21,558 |
| 21,558 |
Cumulative adjustment pursuant to adoption |
|
|
|
|
|
|
|
|
|
|
|
|
of ASU 842 (Note 11) |
|
|
|
|
|
|
| (1,464) |
|
|
| (1,464) |
Dividends paid - common ($0.11 per share) |
|
|
|
|
|
|
| (10,547) |
|
|
| (10,547) |
Stock grants issued |
| 132,918 |
| 1 |
| (1) |
|
|
|
|
| — |
Stock based compensation expense |
|
|
|
|
| 1,218 |
|
|
|
|
| 1,218 |
Stock options exercised |
| 116,764 |
| 1 |
| 1,198 |
|
|
|
|
| 1,199 |
Stock repurchase |
| (15,971) |
| — |
| (399) |
|
|
|
|
| (399) |
Balances at March 31, 2019 |
| 95,913,307 |
| 959 |
| 1,701,047 |
| 326,409 |
| (863) |
| 2,027,552 |
|
|
|
|
|
|
|
|
|
|
|
|
|
|
|
|
|
|
|
|
|
|
|
|
|
|
Balances at January 1, 2020 |
| 125,173,597 |
| $1,252 |
| $2,407,385 |
| $465,680 |
| $22,401 |
| $2,896,718 |
|
|
|
|
|
|
|
|
|
|
|
|
|
Net income |
|
|
|
|
|
|
| 35,432 |
|
|
| 35,432 |
Unrealized holding gain on |
|
|
|
|
|
|
|
|
|
|
|
|
available for sale securities, net of |
|
|
|
|
|
|
|
|
|
|
|
|
deferred income tax of $13,268 |
|
|
|
|
|
|
|
|
| 39,729 |
| 39,729 |
Unrealized holding loss on |
|
|
|
|
|
|
|
|
|
|
|
|
interest rate swaps, net of |
|
|
|
|
|
|
|
|
|
|
|
|
deferred income tax of $1,917 |
|
|
|
|
|
|
|
|
| (5,740) |
| (5,740) |
Cumulative adjustment pursuant to adoption |
|
|
|
|
|
|
|
|
|
|
|
|
of ASU 326 (Note 12) |
|
|
|
|
|
|
| (47,751) |
|
|
| (47,751) |
Dividends paid - common ($0.14 per share) |
|
|
|
|
|
|
| (17,377) |
|
|
| (17,377) |
Stock grants issued |
| 258,616 |
| 3 |
| (3) |
|
|
|
|
| — |
Stock based compensation expense |
|
|
|
|
| 1,796 |
|
|
|
|
| 1,796 |
Stock options exercised |
| 179,174 |
| 1 |
| 1,358 |
|
|
|
|
| 1,359 |
Stock repurchase |
| (1,479,986) |
| (15) |
| (33,899) |
|
|
|
|
| (33,914) |
Balances at March 31, 2020 |
| 124,131,401 |
| $1,241 |
| $2,376,637 |
| $435,984 |
| $56,390 |
| $2,870,252 |
See notes to the accompanying condensed consolidated financial statements
6
CenterState Bank Corporation and Subsidiaries
CONDENSED CONSOLIDATED STATEMENTS OF CASH FLOWS (unaudited)
(in thousands of dollars, except per share data)
|
| Three months ended March 31, | ||
|
| 2020 |
| 2019 |
Cash flows from operating activities: |
|
|
|
|
Net income |
| $35,432 |
| $44,643 |
Adjustments to reconcile net income to net cash provided by operating activities: |
|
|
|
|
Provision for credit losses |
| 44,914 |
| 1,053 |
Credit loss on unfunded commitments |
| 1,027 |
| — |
Depreciation of premises and equipment |
| 4,045 |
| 2,850 |
Accretion of purchase accounting adjustments |
| (12,575) |
| (12,982) |
Net amortization of investment securities |
| 2,273 |
| 2,421 |
Net deferred loan origination fees |
| 435 |
| 344 |
Gain on sale of securities available for sale debt securities |
| — |
| (17) |
Trading securities revenue |
| (153) |
| (25) |
Purchases of trading securities |
| (54,723) |
| (51,691) |
Proceeds from sale of trading securities |
| 51,431 |
| 53,453 |
Repossessed real estate owned valuation write down |
| 95 |
| 108 |
Loss on sale of repossessed real estate owned |
| 1 |
| 47 |
(Gain) loss on repossessed assets other than real estate |
| (8) |
| 13 |
Gain on sale of residential loans held for sale |
| (10,781) |
| (3,976) |
Residential loans originated and held for sale |
| (423,622) |
| (134,752) |
Proceeds from sale of residential loans held for sale |
| 391,242 |
| 129,657 |
Net change in fair value of residential loans held for sale |
| (2,354) |
| (4) |
Gain on disposal of and or sale of fixed assets |
| (6) |
| (1) |
Gain on disposal of bank property held for sale |
| (236) |
| (618) |
Impairment on bank property held for sale |
| 31 |
| 107 |
Gain on sale of small business administration loans |
| (1,403) |
| (688) |
Small business administration loans originated for sale |
| (12,255) |
| (7,482) |
Proceeds from sale of small business administration loans |
| 13,658 |
| 8,170 |
Deferred income taxes |
| (4,306) |
| 6,114 |
Tax deduction in excess of book deduction for stock awards |
| (1,391) |
| (376) |
Stock based compensation expense |
| 1,796 |
| 1,218 |
Bank owned life insurance income |
| (1,927) |
| (1,626) |
Net cash from changes in: |
|
|
|
|
Net changes in accrued interest receivable, prepaid expenses, and other assets |
| 10,211 |
| 11,461 |
Net change in accrued interest payable, accrued expense, and other liabilities |
| (12,867) |
| (5,019) |
Net cash provided by operating activities |
| $17,984 |
| $42,402 |
See notes to the accompanying condensed consolidated financial statements
7
CenterState Bank Corporation and Subsidiaries
CONDENSED CONSOLIDATED STATEMENTS OF CASH FLOWS (unaudited)
(in thousands of dollars, except per share data)
(continued)
|
| Three months ended March 31, | ||
|
| 2020 |
| 2019 |
Cash flows from investing activities: |
|
|
|
|
Available for sale debt securities: |
|
|
|
|
Purchases of investment securities |
| $(229,404) |
| $(1,037) |
Purchases of mortgage-backed securities |
| (50,138) |
| (66,624) |
Proceeds from pay-downs of mortgage-backed securities |
| 78,830 |
| 53,579 |
Proceeds from sales of investment securities |
| — |
| 2,309 |
Proceeds from sales of mortgage-backed securities |
| — |
| 64,177 |
Proceeds from maturities of investment securities |
| — |
| 295 |
Held to maturity debt securities: |
|
|
|
|
Proceeds from called investment securities |
| 3,110 |
| — |
Proceeds from pay-downs of mortgage-backed securities |
| 3,551 |
| 2,317 |
Purchases of FHLB, FRB and other stock |
| (20,344) |
| (4,717) |
Proceeds from sales of FHLB, FRB and other stock |
| 20,188 |
| 10,826 |
Net (increase) decrease in loans |
| (16,919) |
| 1,956 |
Purchases of premises and equipment, net |
| (3,813) |
| (3,931) |
Proceeds from sale of repossessed real estate |
| 438 |
| 430 |
Proceeds from sale of fixed assets |
| 9 |
| 1 |
Proceeds from sale of bank property held for sale |
| 2,639 |
| 6,365 |
Net cash (used in) provided by investing activities |
| $(211,853) |
| $65,946 |
Cash flows from financing activities: |
|
|
|
|
Net increase in deposits |
| 985,602 |
| 269,954 |
Net (decrease) increase in securities sold under agreement to repurchase |
| (11,405) |
| 1,259 |
Net (decrease) increase in federal funds purchased |
| (123,760) |
| 8,657 |
Net increase (decrease) in other borrowings |
| 50,000 |
| (150,000) |
Net decrease in payable to shareholders for acquisitions |
| (3) |
| (1) |
Stock options exercised |
| 1,359 |
| 1,199 |
Stock repurchased |
| (33,914) |
| (399) |
Dividends paid |
| (17,377) |
| (10,547) |
Net cash provided by financing activities |
| $850,502 |
| $120,122 |
|
|
|
|
|
Net increase in cash and cash equivalents |
| 656,633 |
| 228,470 |
Cash and cash equivalents, beginning of period |
| 490,058 |
| 367,333 |
Cash and cash equivalents, end of period |
| $1,146,691 |
| $595,803 |
|
|
|
|
|
Supplemental Information |
|
|
|
|
Transfer of loans to other real estate owned |
| $5,384 |
| $3,657 |
New right-of-use operating lease assets |
| 4,749 |
| — |
|
|
|
|
|
Cash paid during the period for: |
|
|
|
|
Interest |
| $23,889 |
| $17,689 |
Income taxes |
| — |
| — |
See notes to the accompanying condensed consolidated financial statements
8
CenterState Bank Corporation and Subsidiaries
NOTES TO CONDENSED CONSOLIDATED FINANCIAL STATEMENTS (unaudited)
(in thousands of dollars, except per share data)
NOTE 1: Nature of operations and basis of presentation
The consolidated financial statements include the accounts of CenterState Bank Corporation (the “Parent Company,” “Company” or “CSFL”), and its wholly owned subsidiary bank, CenterState Bank, N.A. (“CenterState” or the “Bank”), and non-bank subsidiaries, R4ALL, Inc., and CSFL Insurance Corp. The Company operates as one of the largest community bank franchises headquartered in the state of Florida. The Bank provides traditional retail, commercial, mortgage, wealth management and SBA services throughout its Florida, Georgia and Alabama branch network and customer relationships in neighboring states.
The Bank, headquartered in Winter Haven, Florida, also operates a correspondent banking and capital markets division, of which the majority of its bond salesmen, traders and operational personnel are primarily housed in facilities located in Birmingham, Alabama and Atlanta, Georgia. This division’s primary revenue generating activities are related to its capital markets division, which includes commissions earned on fixed income security sales, fees from hedging services, loan brokerage fees and consulting fees for services related to these activities; and its correspondent banking division, which includes spread income earned on correspondent bank deposits (i.e. federal funds purchased) and correspondent bank checking account deposits and fees from safe-keeping activities, bond accounting services for correspondents, asset/liability consulting related activities, international wires, and other clearing and corporate checking account services. The customer base includes small to medium size financial institutions primarily located in the Southeastern United States, although clients are located across the United States. The Bank also owns CBI Holding Company, LLC (“CBI”), which in turn owns Corporate Billing, LLC (“Corporate Billing”), a transaction-based finance company headquartered in Decatur, Alabama that provides factoring, invoicing, collection and accounts receivable management services to transportation companies and automotive parts and service providers nationwide.
R4ALL, Inc. manages troubled loans purchased from the Bank to their eventual disposition. CSFL Insurance Corp. is a captive insurance subsidiary pursuant to Section 831(b) of the U.S. Tax Code.
The accompanying unaudited condensed consolidated financial statements have been prepared in accordance with accounting principles generally accepted in the United States of America for interim financial statements and with the instructions to Form 10-Q. Accordingly, they do not include all of the information and footnotes required by accounting principles generally accepted in the United States of America for complete financial statements. These statements should be read in conjunction with the consolidated financial statements included in the Annual Report on Form 10-K for the year ended December 31, 2019. In the Company’s opinion, all adjustments, consisting primarily of normal recurring adjustments, necessary for a fair presentation of the results for the interim periods have been made. The results of operations of the three-month ended March 31, 2020 are not necessarily indicative of the results expected for the full year.
Some items in the prior period financial statements were reclassified to conform to the current presentation. Reclassifications had no effect on prior period net income or common stockholders’ equity.
9
CenterState Bank Corporation and Subsidiaries
NOTES TO CONDENSED CONSOLIDATED FINANCIAL STATEMENTS (unaudited)
(in thousands of dollars, except per share data)
NOTE 2: Common stock outstanding and earnings per share data
The two-class method is used in the calculation of basic and diluted earnings per share. Under the two-class method, earnings available to common shareholders for the period are allocated between common shareholders and participating securities according to dividends declared (or accumulated) and participation rights in undistributed earnings. There were 0 anti-dilutive stock options for the three-month periods ending March 31, 2020 and 2019. The following table presents the factors used in the earnings per share computations for the periods indicated.
|
| Three months ended March 31, | ||
|
| 2020 |
| 2019 |
Basic |
|
|
|
|
Net income available to common shareholders |
| $35,432 |
| $44,643 |
Less: Earnings allocated to participating securities |
| (8) |
| (23) |
Net income allocated to common shareholders |
| $35,424 |
| $44,620 |
|
|
|
|
|
Weighted average common shares outstanding |
|
|
|
|
including participating securities |
| 124,831,232 |
| 95,790,456 |
Less: Participating securities (1) |
| (32,500) |
| (49,600) |
Average shares |
| 124,798,732 |
| 95,740,856 |
Basic earnings per common share |
| $0.28 |
| $0.47 |
|
|
|
|
|
Diluted |
|
|
|
|
Net income available to common shareholders |
| $35,424 |
| $44,620 |
Weighted average common shares outstanding for |
|
|
|
|
basic earnings per common share |
| 124,798,732 |
| 95,740,856 |
Add: Dilutive effects of stock based compensation awards |
| 542,495 |
| 759,884 |
Average shares and dilutive potential common shares |
| 125,341,227 |
| 96,500,740 |
Diluted earnings per common share |
| $0.28 |
| $0.46 |
| (1) | Participating securities are restricted stock awards whereby the stock certificates have been issued, are included in outstanding shares, receive dividends and can be voted, but have not vested. |
|
NOTE 3: Fair value
Generally accepted accounting principles establish a fair value hierarchy which requires an entity to maximize the use of observable inputs and minimize the use of unobservable inputs when measuring fair value. The standard describes three levels of inputs that may be used to measure fair value:
Level 1: Quoted prices (unadjusted) for identical assets or liabilities in active markets that the entity has the ability to access as of the measurement date.
Level 2: Significant other observable inputs other than Level 1 prices such as quoted prices for similar assets or liabilities; quoted prices in markets that are not active; or other inputs that are observable or can be corroborated by observable market data.
Level 3: Significant unobservable inputs that reflect a reporting entity’s own assumptions about the assumptions that market participants would use in pricing an asset or liability.
The fair values of available for sale debt securities are determined by obtaining quoted prices on nationally recognized securities exchanges (Level 1 inputs) or matrix pricing, which is a mathematical technique widely used in the industry to value debt securities without relying exclusively on quoted prices for the specific securities but rather by relying on the securities’ relationship to other benchmark quoted securities (Level 2 inputs). U.S. Treasury securities are valued using quoted market prices. Valuation adjustments are not applied (Level 1). The fair values of corporate debt securities are calculated using market indicators such as broker quotes (Level 2).
The fair values of trading securities are determined as follows: (1) for those securities that have traded prior to the date of the consolidated balance sheet but have not settled (date of sale) until after such date, the sales price is used as the fair value; and, (2) for those securities which have not traded as of the date of the consolidated balance sheet, the fair value was determined by broker price indications of similar or same securities.
10
CenterState Bank Corporation and Subsidiaries
NOTES TO CONDENSED CONSOLIDATED FINANCIAL STATEMENTS (unaudited)
(in thousands of dollars, except per share data)
The Company accounts for mortgage loans held for sale under the fair value option with changes in fair value recognized in current period earnings. These loans are intended for sale and the Company believes that the fair value is the best indicator of the resolution of these loans (Level 2). In conjunction with the fair value election on loans held for sale, Mortgage banking uses derivative forward sales contracts and Interest Rate Lock Commitments (“IRLCs”) on residential mortgage loans. Fair values of these mortgage derivatives are estimated based on changes in market prices for mortgage forward trades and mortgage interest rates (Level 2) and estimated pull through percentages from the date the interest on the loan is locked (Level 3). The fair values of IRLCs are derived by a valuation model using various unobservable inputs, such as an estimate of the fair value of the servicing rights expected to be recorded upon sale of the loans, estimated costs to originate the loans, and the pull through rate. At March 31, 2020, the estimated gain on sale before the pull through rate ranged from (1.45%) to 9.34% with an average of 3.19%. The costs to originate ranged from 0.70% to 0.89% with an average of 0.82%. The pull through rates ranged from 47.00% to 100.00% with an average of 85.19%. At December 31, 2019, the estimated gain on sale before the pull through rate ranged from (2.41%) to 8.21% with an average of 2.54%. The costs to originate ranged from 0.70% to 0.89% with an average of 0.82%. The pull through rates ranged from 58.00% to 100.00% with an average of 89.00%.
The Company has the rights to service a portfolio of Fannie Mae and other government guaranteed loans sold on a servicing retained basis. Mortgage servicing assets are measured at fair value when the loan is sold and subsequently measured at fair value on a recurring basis utilizing Level 2 inputs. Management uses a model operated and maintained by a third party to calculate the present value of future cash flows using the third party's market-based assumptions. The future cash flows for each asset are based on the asset's unique characteristics and the third party's market-based assumptions for prepayment speeds, default and voluntary prepayments. Adjustments to fair value are recorded as a component of Mortgage Banking Revenue in the Condensed Consolidated Statements of Income and Comprehensive Income.
The fair value of interest rate swap derivatives is based on valuation models using observable market data as of the measurement date (Level 2). The derivatives are traded in an over-the-counter market where quoted market prices are not always available. Therefore, fair values of derivatives are determined using quantitative models that utilize multiple market inputs. The inputs will vary based on the type of derivative, but could include interest rates, prices and indices to generate continuous yield or pricing curves, prepayment rates, and volatility factors to value the position. The majority of market inputs are actively quoted and can be validated through external sources, including brokers, market transactions and third-party pricing services.
The fair value of impaired loans with specific valuation allowance for credit losses and other real estate owned is based on recent real estate appraisals. For residential real estate impaired loans and other real estate owned, appraised values are based on the comparative sales approach. For commercial and commercial real estate impaired loans, and other real estate owned, appraisers may use either a single valuation approach or a combination of approaches such as comparative sales, cost or the income approach. A significant unobservable input in the income approach is the estimated income capitalization rate for a given piece of collateral. At March 31, 2020, the range of capitalization rates utilized to determine the fair value of the underlying collateral ranged from 5% to 13%. Adjustments to appraisals may be made by the appraiser to reflect local market conditions or other economic factors and may result in changes in the fair value of a given asset over time. As such, the fair value of impaired loans, other real estate owned and bank property held for sale are considered a Level 3 in the fair value hierarchy.
11
CenterState Bank Corporation and Subsidiaries
NOTES TO CONDENSED CONSOLIDATED FINANCIAL STATEMENTS (unaudited)
(in thousands of dollars, except per share data)
Assets and liabilities measured at fair value on a recurring basis are summarized below.
|
|
|
| Fair value measurements using | ||||
|
|
|
| Quoted prices |
| Significant |
|
|
|
|
|
| in active |
| other |
| Significant |
|
|
|
| markets for |
| observable |
| unobservable |
|
| Carrying |
| identical assets |
| inputs |
| inputs |
|
| value |
| (Level 1) |
| (Level 2) |
| (Level 3) |
at March 31,2020 |
|
|
|
|
|
|
|
|
Assets: |
|
|
|
|
|
|
|
|
Trading securities |
| $8,432 |
| $ — |
| $8,432 |
| $ — |
Available for sale debt securities |
|
|
|
|
|
|
|
|
Corporate debt securities |
| 5,757 |
| — |
| 5,757 |
| — |
Obligations of U.S. government sponsored entities and agencies |
| 147,959 |
| — |
| 147,959 |
| — |
Mortgage-backed securities |
| 1,787,846 |
| — |
| 1,787,846 |
| — |
U.S. treasuries |
| 99,997 |
| — |
| 99,997 |
| — |
Municipal securities |
| 96,883 |
| — |
| 96,883 |
| — |
Loans held for sale |
| 188,316 |
| — |
| 188,316 |
| — |
Mortgage servicing assets |
| 1,038 |
| — |
| 1,038 |
| — |
Mortgage banking derivatives |
| 6,436 |
| — |
| 57 |
| 6,379 |
Interest rate swap derivatives |
| 831,891 |
| — |
| 831,891 |
| — |
|
|
|
|
|
|
|
|
|
Liabilities: |
|
|
|
|
|
|
|
|
Mortgage banking derivatives |
| 6,126 |
| — |
| 6,032 |
| 94 |
Interest rate swap derivatives |
| 842,451 |
| — |
| 842,451 |
| — |
|
|
|
|
|
|
|
|
|
at December 31,2019 |
|
|
|
|
|
|
|
|
Assets: |
|
|
|
|
|
|
|
|
Trading securities |
| $4,987 |
| $ — |
| $4,987 |
| $ — |
Available for sale debt securities |
|
|
|
|
|
|
|
|
Corporate debt securities |
| 5,657 |
| — |
| 5,657 |
| — |
Obligations of U.S. government sponsored entities and agencies |
| 19,930 |
| — |
| 19,930 |
| — |
Mortgage-backed securities |
| 1,767,242 |
| — |
| 1,767,242 |
| — |
Municipal securities |
| 93,895 |
| — |
| 93,895 |
| — |
Loans held for sale |
| 142,801 |
| — |
| 142,801 |
| — |
Mortgage servicing assets |
| 1,332 |
| — |
| 1,332 |
| — |
Mortgage banking derivatives |
| 1,761 |
| — |
| 14 |
| 1,747 |
Interest rate swap derivatives |
| 273,068 |
| — |
| 273,068 |
| — |
|
|
|
|
|
|
|
|
|
Liabilities: |
|
|
|
|
|
|
|
|
Mortgage banking derivatives |
| 305 |
| — |
| 288 |
| 17 |
Interest rate swap derivatives |
| 275,033 |
| — |
| 275,033 |
| — |
12
CenterState Bank Corporation and Subsidiaries
NOTES TO CONDENSED CONSOLIDATED FINANCIAL STATEMENTS (unaudited)
(in thousands of dollars, except per share data)
Assets and liabilities measured at fair value on a non-recurring basis are summarized below.
|
|
|
| Fair value measurements using | ||||
|
|
|
| Quoted prices |
| Significant |
|
|
|
|
|
| in active |
| other |
| Significant |
|
|
|
| markets for |
| observable |
| unobservable |
|
| Carrying |
| identical assets |
| inputs |
| inputs |
|
| value |
| (Level 1) |
| (Level 2) |
| (Level 3) |
at March 31,2020 |
|
|
|
|
|
|
|
|
Assets: |
|
|
|
|
|
|
|
|
Impaired loans, non-PCD |
|
|
|
|
|
|
|
|
Residential real estate |
| $1,916 |
| $ — |
| $ — |
| $1,916 |
Commercial real estate |
| 12,748 |
| — |
| — |
| 12,748 |
Land, land development and construction |
| 725 |
| — |
| — |
| 725 |
Commercial |
| 4,944 |
| — |
| — |
| 4,944 |
Consumer |
| 47 |
| — |
| — |
| 47 |
Impaired loans, PCD |
|
|
|
|
|
|
|
|
Commercial real estate |
| 9,694 |
| — |
| — |
| 9,694 |
Commercial |
| 766 |
| — |
| — |
| 766 |
Other real estate owned |
|
|
|
|
|
|
|
|
Residential real estate |
| 363 |
| — |
| — |
| 363 |
Commercial real estate |
| 2,129 |
| — |
| — |
| 2,129 |
Land, land development and construction |
| 289 |
| — |
| — |
| 289 |
Bank property held for sale |
| 2,834 |
| — |
| — |
| 2,834 |
|
|
|
|
|
|
|
|
|
at December 31,2019 |
|
|
|
|
|
|
|
|
Assets: |
|
|
|
|
|
|
|
|
Impaired loans |
|
|
|
|
|
|
|
|
Residential real estate |
| $2,213 |
| $ — |
| $ — |
| $2,213 |
Commercial real estate |
| 8,177 |
| — |
| — |
| 8,177 |
Land, land development and construction |
| 847 |
| — |
| — |
| 847 |
Commercial |
| 5,564 |
| — |
| — |
| 5,564 |
Consumer |
| 47 |
| — |
| — |
| 47 |
Other real estate owned |
|
|
|
|
|
|
|
|
Residential real estate |
| — |
| — |
| — |
| — |
Commercial real estate |
| 2,129 |
| — |
| — |
| 2,129 |
Land, land development and construction |
| 340 |
| — |
| — |
| 340 |
Bank property held for sale |
| 4,160 |
| — |
| — |
| 4,160 |
Non-PCD impaired loans measured at fair value had a recorded investment of $22,169, with a valuation allowance of $1,789 at March 31, 2020, and a recorded investment of $18,556, with a valuation allowance of $1,708 at December 31, 2019. The Company recorded a provision for credit loss expense of $911 and $1,124 on non-PCD impaired loans carried at fair value during the three-month periods ending March 31, 2020 and 2019, respectively. Beginning in 2020, the Company began accounting for PCD loans under ASC Topic 326 and as a result several loans previously evaluated on a pool level basis were individually evaluated for impairment during the current period. PCD impaired loans measured at fair value had a recorded investment of $22,776, with a valuation allowance of $12,316 at March 31, 2020. The Company recorded a provision for credit loss expense of $2,870 on PCD impaired loans carried at fair value during the three-month periods ending March 31, 2020.
Other real estate owned had a decline in fair value of $95 and $108 during the three-month periods ending March 31, 2020 and 2019, respectively. Changes in fair value were recorded directly to current earnings through non-interest expense.
Bank property held for sale represents certain branch office buildings which the Company has closed and consolidated with other existing branches. The real estate was transferred out of the Bank Premises and Equipment category into Bank Property Held for Sale at the lower of amortized cost or fair value less estimated costs to sell. The fair values were based upon appraisals. The Company recognized an impairment charge of $31 and $107 during the three-month periods ending March 31, 2020 and 2019, respectively, related to bank properties held for sale.
13
CenterState Bank Corporation and Subsidiaries
NOTES TO CONDENSED CONSOLIDATED FINANCIAL STATEMENTS (unaudited)
(in thousands of dollars, except per share data)
Fair Value of Financial Instruments:
The methods and assumptions, not previously presented, used to estimate fair value are described as follows:
Cash and Cash Equivalents: The carrying amounts of cash and cash equivalents approximate fair values and are classified as Level 1.
FHLB, FRB and Other Stock: It is not practical to determine the fair value of FHLB, FRB and other stock due to restrictions placed on their transferability.
Investment securities held to maturity: The fair values of securities held to maturity are determined by obtaining quoted prices on nationally recognized securities exchanges (Level 1 inputs) or matrix pricing, which is a mathematical technique widely used in the industry to value debt securities without relying exclusively on quoted prices for the specific securities but rather by relying on the securities’ relationship to other benchmark quoted securities (Level 2 inputs).
Loans, net: For performing loans, the fair value is determined based on a discounted cash flow analysis (income approach). The discounted cash flow was based on contractual maturity of the loan and market indications of rates, prepayment speeds, defaults and credit risk resulting in Level 3 classification. For non-performing loans, the fair value is determined based on the estimated values of the underlying collateral or individual analysis of receipts (asset approach) resulting in Level 3 classification. Tables below present additional information on assumptions ranges and methods used for the Level 3 fair value measurements for loans.
|
| Quantitative information about Level 3 fair value measurements | ||||||
|
| Fair value |
| Valuation |
| Unobservable |
| Range |
|
| at March 31, 2020 |
| technique |
| inputs |
| (weighted average rate) |
Loan, net |
| $12,008,094 |
| Discounted cash flow |
| Probability of default (PD) |
| 0.51% - 100.00% (1.43%) |
|
|
|
|
|
| Loss given default (LGD) |
| 0% - 100.00% (17.95%) |
|
|
|
|
|
| Prepayment rate |
| 0.00% - 34.47% (20.76%) |
|
|
|
|
|
| Discount rate |
| 3.03% - 8.28% (4.5%) |
|
|
|
|
|
|
|
|
|
|
| Quantitative information about Level 3 fair value measurements | ||||||
|
| Fair value |
| Valuation |
| Unobservable |
| Range |
|
| at December 31, 2019 |
| technique |
| inputs |
| (average) (1) |
Loan, net |
| $11,925,693 |
| Discounted cash flow |
| Probability of default (PD) |
| 1.04% - 2.79% (1.83%) |
|
|
|
|
|
| Loss given default (LGD) |
| 6.44% - 46.26% (22.02%) |
|
|
|
|
|
| Prepayment rate |
| 10.00% - 34.47% (19.19%) |
|
|
|
|
|
| Discount rate |
| 1.48% - 2.39% (1.62%) |
| (1) | Average rates are median rates. |
Accrued Interest Receivable: The carrying amount of accrued interest receivable approximates fair value and is classified as Level 2 for accrued interest receivable related to investment securities and Level 3 for accrued interest receivable related to loans.
Deposits: The fair values disclosed for demand deposits (e.g., interest and non-interest checking, savings, and money market accounts) are, by definition, equal to the amount payable on demand at the reporting date (i.e., their carrying amount) resulting in Level 1 classification. Fair values for fixed rate certificates of deposit are estimated using a discounted cash flows calculation that applies interest rates currently being offered on certificates to a schedule of aggregated expected monthly maturities on time deposits resulting in a Level 2 classification.
Short-term Borrowings: The carrying amounts of federal funds purchased, borrowings under repurchase agreements, and other short-term borrowings, generally maturing within ninety days, approximate their fair values resulting in a Level 2 classification.
Corporate and Subordinated Debentures: The fair values of the Company’s corporate and subordinated debentures are estimated using discounted cash flow analyses based on the current borrowing rates for similar types of borrowing arrangements resulting in a Level 3 classification.
Accrued Interest Payable: The carrying amount of accrued interest payable approximates fair value resulting in a Level 2 classification.
Off-balance Sheet Instruments: The fair value of off-balance-sheet items is not considered material.
14
CenterState Bank Corporation and Subsidiaries
NOTES TO CONDENSED CONSOLIDATED FINANCIAL STATEMENTS (unaudited)
(in thousands of dollars, except per share data)
The following table presents the carry amounts and estimated fair values of the Company’s financial instruments:
|
|
|
| Fair value measurements |
|
| ||||
|
| Carrying amount |
| Level 1 |
| Level 2 |
| Level 3 |
| Total |
at March 31,2020 |
|
|
|
|
|
|
|
|
|
|
Financial assets: |
|
|
|
|
|
|
|
|
|
|
Cash and cash equivalents |
| $1,146,691 |
| $1,146,691 |
| $ — |
| $ — |
| $1,146,691 |
Trading securities |
| 8,432 |
| — |
| 8,432 |
| — |
| 8,432 |
Available for sale debt securities |
| 2,138,442 |
| — |
| 2,138,442 |
| — |
| 2,138,442 |
Held to maturity debt securities |
| 195,948 |
| — |
| 205,458 |
| — |
| 205,458 |
Loans held for sale, at fair value |
| 188,316 |
| — |
| 188,316 |
| — |
| 188,316 |
Loans, net |
| 11,868,498 |
| — |
| — |
| 12,008,094 |
| 12,008,094 |
Mortgage servicing assets |
| 1,038 |
| — |
| 1,038 |
| — |
| 1,038 |
Mortgage banking derivatives |
| 6,436 |
| — |
| 57 |
| 6,379 |
| 6,436 |
Interest rate swap derivatives |
| 831,891 |
| — |
| 831,891 |
| — |
| 831,891 |
Accrued interest receivable |
| 43,382 |
| — |
| 7,594 |
| 35,788 |
| 43,382 |
|
|
|
|
|
|
|
|
|
|
|
Financial liabilities: |
|
|
|
|
|
|
|
|
|
|
Deposits - without stated maturities |
| $11,228,116 |
| $11,228,116 |
| $ — |
| $ — |
| $11,228,116 |
Deposits - with stated maturities |
| 2,893,383 |
| — |
| 2,918,615 |
| — |
| 2,918,615 |
Securities sold under agreement to repurchase |
| 81,736 |
| — |
| 81,736 |
| — |
| 81,736 |
Federal funds purchased and other borrowings |
| 466,433 |
| — |
| 466,433 |
| — |
| 466,433 |
Corporate and subordinated debentures |
| 71,356 |
| — |
| — |
| 66,669 |
| 66,669 |
Mortgage banking derivatives |
| 6,126 |
| — |
| 6,032 |
| 94 |
| 6,126 |
Interest rate swap derivatives |
| 842,451 |
| — |
| 842,451 |
| — |
| 842,451 |
Accrued interest payable |
| 4,334 |
| — |
| 4,334 |
| — |
| 4,334 |
|
|
|
| Fair value measurements |
|
| ||||
|
| Carrying amount |
| Level 1 |
| Level 2 |
| Level 3 |
| Total |
at December 31,2019 |
|
|
|
|
|
|
|
|
|
|
Financial assets: |
|
|
|
|
|
|
|
|
|
|
Cash and cash equivalents |
| $490,058 |
| $490,058 |
| $ — |
| $ — |
| $490,058 |
Trading securities |
| 4,987 |
| — |
| 4,987 |
| — |
| 4,987 |
Available for sale debt securities |
| 1,886,724 |
| — |
| 1,886,724 |
| — |
| 1,886,724 |
Held to maturity debt securities |
| 202,903 |
| — |
| 208,852 |
| — |
| 208,852 |
Loans held for sale, at fair value |
| 142,801 |
| — |
| 142,801 |
| — |
| 142,801 |
Loans, net |
| 11,943,288 |
| — |
| — |
| 11,925,693 |
| 11,925,693 |
Mortgage servicing assets |
| 1,332 |
| — |
| 1,332 |
| — |
| 1,332 |
Mortgage banking derivatives |
| 1,761 |
| — |
| 14 |
| 1,747 |
| 1,761 |
Interest rate swap derivatives |
| 273,068 |
| — |
| 273,068 |
| — |
| 273,068 |
Accrued interest receivable |
| 40,945 |
| — |
| 7,547 |
| 33,398 |
| 40,945 |
|
|
|
|
|
|
|
|
|
|
|
Financial liabilities: |
|
|
|
|
|
|
|
|
|
|
Deposits - without stated maturities |
| $10,879,837 |
| $10,879,837 |
| $ — |
| $ — |
| $10,879,837 |
Deposits - with stated maturities |
| 2,256,555 |
| — |
| 2,271,497 |
| — |
| 2,271,497 |
Securities sold under agreement to repurchase |
| 93,141 |
| — |
| 93,141 |
| — |
| 93,141 |
Federal funds purchased and other borrowings |
| 540,193 |
| — |
| 540,193 |
| — |
| 540,193 |
Corporate and subordinated debentures |
| 71,343 |
| — |
| — |
| 66,964 |
| 66,964 |
Mortgage banking derivatives |
| 305 |
| — |
| 288 |
| 17 |
| 305 |
Interest rate swap derivatives |
| 275,033 |
| — |
| 275,033 |
| — |
| 275,033 |
Accrued interest payable |
| 3,998 |
| — |
| 3,998 |
| — |
| 3,998 |
15
CenterState Bank Corporation and Subsidiaries
NOTES TO CONDENSED CONSOLIDATED FINANCIAL STATEMENTS (unaudited)
(in thousands of dollars, except per share data)
NOTE 4: Reportable segments
The Company’s reportable segments represent the distinct product lines the Company offers and are viewed separately for strategic planning purposes by management. The table below is a reconciliation of the reportable segment revenues, expenses, and profit to the Company’s consolidated total for the three-month periods ending March 31, 2020 and 2019.
|
| Three-month period ending March 31, 2020 | ||||||||
|
|
|
| Correspondent |
| Corporate |
|
|
|
|
|
| Commercial |
| banking and |
| overhead |
|
|
|
|
|
| and retail |
| capital markets |
| and |
| Elimination |
|
|
|
| banking |
| division |
| administration |
| entries |
| Total |
Interest income |
| $173,702 |
| $3,057 |
| $ — |
| $ — |
| $176,759 |
Interest expense |
| (20,434) |
| (1,664) |
| (1,308) |
| — |
| (23,406) |
Net interest income (expense) |
| 153,268 |
| 1,393 |
| (1,308) |
| — |
| 153,353 |
Provision for credit losses |
| (45,156) |
| 242 |
| — |
| — |
| (44,914) |
Non-interest income |
| 27,981 |
| 27,809 |
| — |
| — |
| 55,790 |
Non-interest expense |
| (108,373) |
| (12,503) |
| (1,896) |
| — |
| (122,772) |
Net income (loss) before taxes |
| 27,720 |
| 16,941 |
| (3,204) |
| — |
| 41,457 |
Income tax (provision) benefit |
| (3,487) |
| (4,241) |
| 1,703 |
| — |
| (6,025) |
Net income (loss) |
| 24,233 |
| 12,700 |
| (1,501) |
| — |
| 35,432 |
Total assets |
| $17,954,442 |
| $641,599 |
| $3,005,931 |
| $(3,005,680) |
| $18,596,292 |
| Three-month period ending March 31, 2019 | ||||||||||
|
|
|
| Correspondent |
| Corporate |
|
|
|
| |
|
| Commercial |
| banking and |
| overhead |
|
|
|
| |
|
| and retail |
| capital markets |
| and |
| Elimination |
|
| |
|
| banking |
| division |
| administration |
| entries |
| Total | |
Interest income |
| $127,832 |
| $4,450 |
| $ — |
| $ — |
| $132,282 | |
Interest expense |
| (14,851) |
| (2,549) |
| (707) |
| — |
| (18,107) | |
Net interest income (expense) |
| 112,981 |
| 1,901 |
| (707) |
| — |
| 114,175 | |
Provision for credit losses |
| (1,015) |
| (38) |
| — |
| — |
| (1,053) | |
Non-interest income |
| 20,300 |
| 9,000 |
| — |
| — |
| 29,300 | |
Non-interest expense |
| (77,581) |
| (5,713) |
| (1,179) |
| — |
| (84,473) | |
Net income (loss) before taxes |
| 54,685 |
| 5,150 |
| (1,886) |
| — |
| 57,949 | |
Income tax (provision) benefit |
| (12,690) |
| (1,305) |
| 689 |
| — |
| (13,306) | |
Net income (loss) |
| $41,995 |
| $3,845 |
| $(1,197) |
| $ — |
| $44,643 | |
Total assets |
| $11,939,930 |
| $647,046 |
| $2,073,703 |
| $(2,073,042) |
| $12,587,637 | |
Commercial and retail banking: The Company’s primary business is commercial and retail banking. Currently, the Company operates primarily through the Bank providing traditional retail, commercial, mortgage, wealth management and SBA services throughout its Florida, Georgia and Alabama branch network and customer relationships in neighboring states. This segment also includes the results of CBI, our transaction-based finance company that provides factoring, invoicing, collection and accounts receivable management services to transportation companies and automotive parts and service providers throughout the United States and Canada.
Correspondent banking and capital markets division: Operating as a division of our subsidiary bank, its primary revenue generating activities are related to the capital markets division which includes commissions earned on fixed income security sales, fees from hedging services, loan brokerage fees and consulting fees for services related to these activities. Income generated related to the correspondent banking services includes spread income earned on correspondent bank deposits (i.e. federal funds purchased) and fees generated from safe-keeping activities, bond accounting services, asset/liability consulting services, international wires, clearing and corporate checking account services and other correspondent banking related services. The fees derived from the correspondent banking services are less volatile than those generated through the capital markets group. The customer base includes small to medium size financial institutions primarily located in Southeastern United States.
Corporate overhead and administration: Corporate overhead and administration is comprised primarily of compensation and benefits for certain members of management, interest on parent company debt, office occupancy and depreciation of parent company facilities, merger related costs and other expenses.
16
CenterState Bank Corporation and Subsidiaries
NOTES TO CONDENSED CONSOLIDATED FINANCIAL STATEMENTS (unaudited)
(in thousands of dollars, except per share data)
NOTE 5: Investment securities
Available for Sale Debt Securities
All of the mortgage-backed securities (“MBS”) listed below are residential Fannie Mae, Freddie Mac and Ginnie Mae MBSs. The amortized cost, fair value and allowance for credit losses of available for sale debt securities and the related gross unrealized gains and losses recognized in accumulated other comprehensive income (loss) were as follows:
|
| March 31, 2020 | ||||||||
|
|
|
| Gross |
| Gross |
| Allowance |
|
|
|
| Amortized |
| unrealized |
| unrealized |
| for credit |
| Fair |
|
| cost |
| gains |
| losses |
| losses |
| value |
Corporate debt securities |
| $5,504 |
| $253 |
| $ — |
| $ — |
| $5,757 |
Obligations of U.S. government sponsored entities and agencies |
| 147,339 |
| 620 |
| — |
| — |
| 147,959 |
Mortgage-backed securities |
| 1,711,738 |
| 76,108 |
| — |
| — |
| 1,787,846 |
U.S. treasuries |
| 100,001 |
| — |
| 4 |
| — |
| 99,997 |
Municipal securities |
| 90,162 |
| 6,721 |
| — |
| — |
| 96,883 |
Total available for sale debt securities |
| $2,054,744 |
| $83,702 |
| $4 |
| $ — |
| $2,138,442 |
|
| December 31, 2019 | ||||||
|
|
|
| Gross |
| Gross |
|
|
|
| Amortized |
| Unrealized |
| Unrealized |
| Fair |
|
| Cost |
| Gains |
| Losses |
| Value |
Corporate debt securities |
| $5,504 |
| $153 |
| $ — |
| $5,657 |
Obligations of U.S. government sponsored entities and agencies |
| 20,000 |
| — |
| 70 |
| 19,930 |
Mortgage-backed securities |
| 1,742,221 |
| 26,403 |
| 1,382 |
| 1,767,242 |
Municipal securities |
| 88,301 |
| 5,594 |
| — |
| 93,895 |
Total available for sale debt securities |
| $1,856,026 |
| $32,150 |
| $1,452 |
| $1,886,724 |
The cost of securities sold is determined using the specific identification method. NaN available for sale debt securities were sold during the three-month ended March 31, 2020. Sales of available for sale debt securities for the three-month ended March 31, 2019 were as follows:
For the three months ended: |
| March 31, 2020 |
| March 31, 2019 |
Proceeds |
| $ — |
| $66,486 |
Gross gains |
| — |
| 646 |
Gross losses |
| — |
| 629 |
The tax provision related to these net realized gain at March 31, 2019 was $4.
The fair value of available for sale debt securities at March 31, 2020 by contractual maturity were as follows. Securities not due at a single maturity date, primarily mortgage-backed securities, are shown separately.
|
| Fair |
| Amortized |
Investment securities available for sale: |
| Value |
| Cost |
Due one year or less |
| $102,204 |
| $102,191 |
Due after one year through five years |
| 131,668 |
| 131,295 |
Due after five years through ten years |
| 45,763 |
| 44,017 |
Due after ten years through thirty years |
| 70,961 |
| 65,503 |
Mortgage-backed securities |
| 1,787,846 |
| 1,711,738 |
Total available for sale debt securities |
| $2,138,442 |
| $2,054,744 |
Available for sale debt securities pledged at March 31, 2020 and December 31, 2019 had a carrying amount (estimated fair value) of $1,403,169 and $1,195,664, respectively. These securities were pledged primarily to increase borrowing capacity at the FHLB, secure public deposits and repurchase agreements. In addition, the amounts at March 31, 2020 and December 31, 2019 include $605,100 and $361,127 of securities pledged to the third party dealers and clearinghouse exchanges for the Company’s cash flow hedge interest rate swaps, respectively.
At March 31, 2020 and December 31, 2019, there were 0 holdings of securities of any one issuer, other than mortgage-backed securities issued by U.S. Government sponsored entities, in an amount greater than 10% of stockholders’ equity.
17
CenterState Bank Corporation and Subsidiaries
NOTES TO CONDENSED CONSOLIDATED FINANCIAL STATEMENTS (unaudited)
(in thousands of dollars, except per share data)
The following tables show the Company’s available for sale debt investments’ gross unrealized losses and fair value, aggregated by investment category and length of time that individual securities have been in a continuous unrealized loss position, at March 31, 2020 and December 31, 2019.
|
| March 31, 2020 | ||||||||||
|
| Less than 12 months |
| 12 months or more |
| Total | ||||||
|
| Fair |
| Unrealized |
| Fair |
| Unrealized |
| Fair |
| Unrealized |
|
| value |
| losses |
| value |
| losses |
| value |
| losses |
Mortgage-backed securities |
| $100 |
| $ — |
| $ — |
| $ — |
| $100 |
| $ — |
U.S. treasuries |
| 99,997 |
| 4 |
| — |
| — |
| 99,997 |
| 4 |
Total temporarily impaired available for sale debt securities |
| $100,097 |
| $4 |
| $ — |
| $ — |
| $100,097 |
| $4 |
|
| December 31, 2019 | ||||||||||
|
| Less than 12 months |
| 12 months or more |
| Total | ||||||
|
| Fair |
| Unrealized |
| Fair |
| Unrealized |
| Fair |
| Unrealized |
|
| Value |
| Losses |
| Value |
| Losses |
| Value |
| Losses |
Obligations of U.S. government sponsored entities and agencies |
| $19,930 |
| $70 |
| $ — |
| $ — |
| $19,930 |
| $70 |
Mortgage-backed securities |
| 125,249 |
| 388 |
| 117,903 |
| 994 |
| 243,152 |
| 1,382 |
Total temporarily impaired available for sale debt securities |
| $145,179 |
| $458 |
| $117,903 |
| $994 |
| $263,082 |
| $1,452 |
Mortgage-backed securities: At March 31, 2020, 100% of the mortgage-backed securities held by the Company were issued by U.S. government-sponsored entities and agencies, primarily Fannie Mae, Freddie Mac, and Ginnie Mae, institutions which the government has affirmed its commitment to support. As of March 31, 2020, none of our mortgage-backed securities were in a loss position.
U.S. treasuries: U.S. treasuries have almost no credit risk since they are backed by the full faith and credit of the U.S. government. Because the decline in fair value is attributable to changes in interest rates and inflation, and not credit quality, and because the Company does not have the intent to sell these securities and it is likely that it will not be required to sell the securities before their anticipated recovery, the Company does not consider these securities to be other-than-temporarily impaired at March 31, 2020.
Held to Maturity Debt Securities
Mortgage-Backed Securities: Most of the held to maturity securities investment portfolio is invested in U.S. Government Agency MBS. Given that the principal and interest payments on these securities are guaranteed by a U.S. Government Agency, there is minimal risk. Default from mortgage-backed securities would be present in macroeconomic events such as a recession which would result in insufficient cash flow to the servicer to continue regular payments.
Municipal Securities: Defaults on municipal bonds are not common, but they are not without risk. Risks stem from the potential for financial mismanagement of the municipal entity or a significant deterioration in the tax or revenue base of the municipal entity.
The following reflects the amortized cost, fair value and allowance for credit losses and the related gross unrecognized gains and losses of held to maturity securities as of March 31, 2020 and December 31, 2019.
|
| March 31, 2020 | |||||||||
|
|
|
| Gross |
| Gross |
|
|
| Allowance | |
|
| Amortized |
| unrecognized |
| unrecognized |
| Fair |
| for credit | |
|
| cost |
| gains |
| losses |
| value |
| losses | |
Mortgage-backed securities |
| $67,841 |
| $2,317 |
| $ — |
| $70,158 |
| $ — | |
Municipal securities |
| 128,117 |
| 7,183 |
| — |
| 135,300 |
| (10) | |
Total held to maturity debt securities |
| $195,958 |
| $9,500 |
| $ — |
| $205,458 |
| $(10) | |
|
| December 31, 2019 | |||||||
|
|
|
| Gross |
| Gross |
|
| |
|
| Amortized |
| unrecognized |
| unrecognized |
| Fair | |
|
| cost |
| gains |
| losses |
| value | |
Mortgage-backed securities |
| $71,560 |
| $456 |
| $29 |
| $71,987 | |
Municipal securities |
| 131,343 |
| 5,522 |
| — |
| 136,865 | |
Total held to maturity debt securities |
| $202,903 |
| $5,978 |
| $29 |
| $208,852 | |
18
CenterState Bank Corporation and Subsidiaries
NOTES TO CONDENSED CONSOLIDATED FINANCIAL STATEMENTS (unaudited)
(in thousands of dollars, except per share data)
Held to maturity securities pledged at March 31, 2020 and December 31, 2019 had a carrying amount of $130,281 and $100,582 respectively. These securities were pledged primarily to secure public deposits and repurchase agreements.
At March 31, 2020, there were 0 holdings of held to maturity securities of any one issuer, other than the U.S. Government and its agencies, in an amount greater than 10% of stockholders’ equity.
The fair value and amortized cost of held to maturity securities at March 31, 2020 by contractual maturity were as follows. Mortgage-backed securities are not due at a single maturity date and are shown separately.
|
| Fair |
| Amortized |
Held to maturity debt securities |
| value |
| cost |
Due after five years through ten years |
| $2,193 |
| $2,138 |
Due after ten years through thirty years |
| 133,107 |
| 125,979 |
Mortgage-backed securities |
| 70,158 |
| 67,841 |
Total held to maturity debt securities |
| $205,458 |
| $195,958 |
As of March 31, 2020, there were no held to maturity debt securities in an unrecognized loss position. The following table shows the Company’s held to maturity debt investments’ gross unrecognized losses and fair value, aggregated by investment category and length of time the individual securities have been in a continuous unrecognized loss position, at December 31, 2019.
|
| December 31, 2019 | ||||||||||
|
| Less than 12 months |
| 12 months or more |
| Total | ||||||
|
| Fair |
| Unrecognized |
| Fair |
| Unrecognized |
| Fair |
| Unrecognized |
|
| Value |
| Losses |
| Value |
| Losses |
| Value |
| Losses |
Mortgage-backed securities |
| $ — |
| $ — |
| $8,445 |
| $29 |
| $8,445 |
| $29 |
Total temporarily impaired held to maturity debt securities |
| $ — |
| $ — |
| $8,445 |
| $29 |
| $8,445 |
| $29 |
The following table shows a roll-forward for the three-month ended March 31, 2020 for the of the allowance for credit losses on held to maturity debt investments:
|
|
| Municipal |
Held to maturity debt securities |
|
| securities |
Allowance for credit losses: |
|
|
|
Beginning balance, January 1, 2020 |
|
| $ — |
Impact of adopting ASC 326 |
|
| 10 |
Provision for credit loss expense |
|
| — |
Allowance on purchased financial assets with credit deterioration |
|
| — |
Securities charged off |
|
| — |
Recoveries |
|
| — |
Total ending allowance balance |
|
| $10 |
The Company adopted CECL effective January 1, 2020 and recorded allowance for credit losses of $10 for held to maturity debt securities. The Company did not record any provision for credit loss on held to maturity debt securities for the three-month ended March 31, 2020.
Credit Quality Indicators:
Pursuant to ASC 326, the Company must also determine if the decline in fair value of investment securities, relative to its amortized cost, is due to credit-related factors. With respect to U.S. Government agency securities, the Bank has determined that a decline in fair value is not due to credit-related factors. In addition, no held to maturity debt securities were past due or on non-accrual as of March 31, 2020. The Company monitors the credit quality of debt securities held to maturity through the use of credit rating and other factors specific to an individual security in assessing whether or not the decline in fair value of municipal and corporate securities, relative to their amortized cost, is due to credit-related factors. The Company uses the following triggers to prompt further investigation of securities when the fair value is less than amortized costs: the security has been downgraded and fallen below an A credit rating, and the security’s unrealized loss exceeds 20% of its book value. The Company monitors credit ratings quarterly and annually performs an internal credit review of its municipal securities.
19
CenterState Bank Corporation and Subsidiaries
NOTES TO CONDENSED CONSOLIDATED FINANCIAL STATEMENTS (unaudited)
(in thousands of dollars, except per share data)
The following table summarizes the amortized costs of held to maturity debt securities at March 31, 2020, aggregated by credit quality indicator:
|
| Mortgage-backed |
| Municipal |
|
|
| securities |
| securities |
|
At March 31, 2020 |
|
|
|
|
|
AAA/AA/A |
| $ — |
| $126,737 |
|
Not rated (1) |
| 67,841 |
| 1,380 |
|
Total |
| $67,841 |
| $128,117 |
|
| (1) | All unrated mortgage-backed securities are FNMA and GNMA. The federal backing of these securities result in negligible credit risk. |
|
NOTE 6: Loans Held for Sale
The Company accounts for loans held for sale under the fair value option with changes in fair value recognized in current period earnings. At the date of funding of the loan, the funded amount of the loan, the relative derivative asset or liability of the associated interest rate lock commitment, less direct costs, becomes the initial recorded investment in the loan held for sale. Such amount approximates the fair value of the loan. Net gains from changes in estimated fair value of mortgage loans held for sale were $2,354 and $4 for the three-month periods ending March 31, 2020 and 2019, respectively. The total unpaid principal balance of loans held for sale was $185,962 and $141,627 at March 31, 2020 and December 31, 2019, respectively. NaN loans held for sale at March 31, 2020 or at December 31, 2019 were past due or on nonaccrual.
The table below summarizes the activity in mortgage loans held for sale during the three-month period ending March 31, 2020 and 2019.
|
| Three-month periods ended | ||
|
| March 31, 2020 |
| March 31, 2019 |
Beginning balance |
| $142,801 |
| $40,399 |
Loans originated |
| 423,622 |
| 134,752 |
Proceeds from sales |
| (391,242) |
| (129,657) |
Net change in fair value |
| 2,354 |
| 4 |
Net realized gain on sales |
| 10,781 |
| 3,976 |
Ending balance |
| $188,316 |
| $49,474 |
As loans are closed, they are typically sold at prices specified in the forward contracts. Gains or losses may arise if the yields of the loans delivered vary from those specified in the forward contracts. Derivative mortgage loan commitments, or interest rate locks, are also utilized and relate to the origination of a mortgage that will be held for sale upon funding. The Company uses these derivative financial instruments on its loans held for sale to manage interest rate risk and not for speculative purposes. The table below summarizes the main components of Mortgage Banking Revenue during the three-month period ending March 31, 2020 and 2019. The Mortgage Banking Revenue amounts are reported in the Company’s Condensed Consolidated Statements of Income and Comprehensive Income.
|
| Three-month periods ended | ||
|
| March 31, 2020 |
| March 31, 2019 |
Servicing fees and commissions |
| $83 |
| $93 |
Gain on sale of loans held for sale |
| 10,781 |
| 3,976 |
Unrealized gain on loans held for sale |
| 2,354 |
| 4 |
(Loss) gain on mortgage derivatives |
| (1,147) |
| 557 |
Loss on mortgage hedge |
| (1,098) |
| (404) |
Loss on mortgage servicing assets |
| — |
| (33) |
Mortgage banking revenue |
| $10,973 |
| $4,193 |
20
CenterState Bank Corporation and Subsidiaries
NOTES TO CONDENSED CONSOLIDATED FINANCIAL STATEMENTS (unaudited)
(in thousands of dollars, except per share data)
The table below summarizes the notional amounts for interest rate lock commitments, best efforts forward trades and MBS forward trades pertaining to loans held for sale at March 31, 2020 and 2019.
| Notional at | ||
| March 31, 2020 |
| March 31, 2019 |
Interest rate lock commitments | $389,387 |
| $85,802 |
Best efforts forward trades | 152,788 |
| 92,115 |
MBS forward trades | 345,500 |
| 57,000 |
Total derivative instruments | $887,675 |
| $234,917 |
Mortgage banking derivatives used in the ordinary course of business consist of forward sales contracts and interest rate lock commitments on residential mortgage loans. Forward sales contracts represent future commitments to deliver loans at a specified price and by a specified date and are used to manage interest rate risk on loan commitments and mortgage loans held for sale. Rate lock commitments represent commitments to fund loans at a specific rate and by a specified expiration date. These derivatives involve underlying items, such as interest rates, and are designed to mitigate risk. Notional amounts are amounts on which calculations and payments are based, but which do not represent credit exposure, as credit exposure is limited to the amounts required to be received or paid.
NOTE 7: Loans
The following table sets forth information concerning the loan portfolio by collateral types as of the dates indicated.
|
| March 31, 2020 |
| December 31, 2019 | |||||
Loans excluding PCD loans |
|
|
|
| |||||
Real estate loans |
|
|
|
| |||||
Residential |
| $2,537,240 |
| $2,512,544 | |||||
Commercial |
| 6,391,975 |
| 6,325,108 | |||||
Land, development and construction |
| 929,014 |
| 999,923 | |||||
Total real estate |
| 9,858,229 |
| 9,837,575 | |||||
Commercial, industrial & factored receivables |
| 1,778,526 |
| 1,759,074 | |||||
Consumer and other loans |
| 235,200 |
| 247,307 | |||||
Loans before unearned fees and deferred cost |
| 11,871,955 |
| 11,843,956 | |||||
Net unearned fees and costs |
| 4,954 |
| 4,519 | |||||
Total loans excluding PCD loans |
| 11,876,909 |
| 11,848,475 | |||||
PCD loans (note 1) |
|
|
|
| |||||
Real estate loans |
|
|
|
| |||||
Residential |
| 42,779 |
| 45,795 | |||||
Commercial |
| 92,281 |
| 81,576 | |||||
Land, development and construction |
| 5,447 |
| 4,655 | |||||
Total real estate |
| 140,507 |
| 132,026 | |||||
Commercial and industrial |
| 9,756 |
| 3,342 | |||||
Consumer and other loans |
| 59 |
| 100 | |||||
Total PCD loans |
| 150,322 |
| 135,468 | |||||
Total loans |
| 12,027,231 |
| 11,983,943 | |||||
Allowance for credit losses for loans that are not PCD loans |
| (140,803) |
| (40,429) | |||||
Allowance for credit losses for PCD loans |
| (17,930) |
| (226) | |||||
Total loans, net of allowance for credit losses |
| $11,868,498 |
| $11,943,288 | |||||
| note 1: | Purchased credit deteriorated (“PCD”) loans are being accounted for pursuant to ASC Topic 326 effective January 1, 2020. |
|
21
CenterState Bank Corporation and Subsidiaries
NOTES TO CONDENSED CONSOLIDATED FINANCIAL STATEMENTS (unaudited)
(in thousands of dollars, except per share data)
The table below set forth the activity in the allowance for credit losses for the periods presented.
|
| Allowance for credit losses for loans that are not PCD loans |
| Allowance for credit losses on PCD loans |
| Total |
Three-month ended March 31, 2020 |
|
|
|
|
|
|
Balance at beginning of period, prior to adoption of ASC 326 |
| $40,429 |
| $226 |
| $40,655 |
Impact of adopting ASC 326 |
| 57,604 |
| 17,004 |
| 74,608 |
Loans charged-off |
| (2,350) |
| (1,257) |
| (3,607) |
Recoveries of loans previously charged-off |
| 1,201 |
| 962 |
| 2,163 |
Net charge-offs |
| (1,149) |
| (295) |
| (1,444) |
Provision for credit losses |
| 43,919 |
| 995 |
| 44,914 |
Balance at end of period |
| $140,803 |
| $17,930 |
| $158,733 |
|
|
|
|
|
|
|
Three-month ended March 31, 2019 |
|
|
|
|
|
|
Balance at beginning of period |
| $39,579 |
| $191 |
| $39,770 |
Loans charged-off |
| (1,447) |
| — |
| (1,447) |
Recoveries of loans previously charged-off |
| 676 |
| — |
| 676 |
Net charge-offs |
| (771) |
| — |
| (771) |
Provision for credit losses |
| 1,053 |
| — |
| 1,053 |
Balance at end of period |
| $39,861 |
| $191 |
| $40,052 |
|
|
|
|
|
|
|
|
|
|
|
|
|
|
22
CenterState Bank Corporation and Subsidiaries
NOTES TO CONDENSED CONSOLIDATED FINANCIAL STATEMENTS (unaudited)
(in thousands of dollars, except per share data)
The following tables present the activity in the allowance for credit losses by portfolio segment for the periods presented.
|
| Real Estate Loans |
|
|
|
|
|
| ||||
|
| Residential |
| Commercial |
| Land, develop., constr. |
| Comm., industrial & factored receivables |
| Consumer & other |
| Total |
Allowance for credit losses for loans that are not PCD loans: |
|
|
|
|
|
|
|
|
|
| ||
Three-month ended March 31, 2020 |
|
|
|
|
|
|
|
|
|
|
|
|
Beginning balance, prior to adoption of ASC 326 |
| $4,257 |
| $18,552 |
| $2,319 |
| $11,282 |
| $4,019 |
| $40,429 |
Impact of adopting ASC 326 |
| 11,412 |
| 35,596 |
| 6,932 |
| 2,995 |
| 669 |
| 57,604 |
Charge-offs |
| (294) |
| — |
| (24) |
| (1,117) |
| (915) |
| (2,350) |
Recoveries |
| 181 |
| 305 |
| 25 |
| 556 |
| 134 |
| 1,201 |
Provision for credit losses |
| 4,675 |
| 37,073 |
| 4,929 |
| (2,727) |
| (31) |
| 43,919 |
Balance at end of period |
| $20,231 |
| $91,526 |
| $14,181 |
| $10,989 |
| $3,876 |
| $140,803 |
|
|
|
|
|
|
|
|
|
|
|
|
|
Three-month ended March 31, 2019 |
|
|
|
|
|
|
|
|
|
|
|
|
Beginning of the period |
| $5,518 |
| $22,978 |
| $1,781 |
| $6,414 |
| $2,888 |
| $39,579 |
Charge-offs |
| (201) |
| — |
| (31) |
| (664) |
| (551) |
| (1,447) |
Recoveries |
| 142 |
| 152 |
| 83 |
| 155 |
| 144 |
| 676 |
Provision for loan losses |
| (11) |
| (883) |
| 387 |
| 1,025 |
| 535 |
| 1,053 |
Balance at end of period |
| $5,448 |
| $22,247 |
| $2,220 |
| $6,930 |
| $3,016 |
| $39,861 |
|
|
|
|
|
|
|
|
|
|
|
|
|
|
| Real Estate Loans |
|
|
|
|
|
| ||||
|
| Residential |
| Commercial |
| Land, develop., constr. |
| Comm., industrial & factored receivables |
| Consumer & other |
| Total |
Allowance for credit losses for loans that are PCD loans: |
|
|
|
|
|
|
|
|
|
| ||
Three-month ended March 31, 2020 |
|
|
|
|
|
|
|
|
|
|
|
|
Beginning balance, prior to adoption of ASC 326 |
| $ — |
| $ — |
| $177 |
| $ — |
| $49 |
| $226 |
Impact of adopting ASC 326 |
| 3,021 |
| 11,966 |
| 79 |
| 1,924 |
| 14 |
| 17,004 |
Charge-offs |
| (156) |
| (1,021) |
| — |
| (80) |
| — |
| (1,257) |
Recoveries |
| 141 |
| 244 |
| 293 |
| 283 |
| 1 |
| 962 |
Provision for credit losses |
| (154) |
| 914 |
| (291) |
| 533 |
| (7) |
| 995 |
Balance at end of period |
| $2,852 |
| $12,103 |
| $258 |
| $2,660 |
| $57 |
| $17,930 |
|
|
|
|
|
|
|
|
|
|
|
|
|
Three-month ended March 31, 2019 |
|
|
|
|
|
|
|
|
|
|
|
|
Beginning of the period |
| $ — |
| $ — |
| $177 |
| $ — |
| $14 |
| $191 |
Charge-offs |
| — |
| — |
| — |
| — |
| — |
| — |
Recoveries |
| — |
| — |
| — |
| — |
| — |
| — |
Provision for loan losses |
| — |
| — |
| — |
| — |
| — |
| — |
Balance at end of period |
| $ — |
| $ — |
| $177 |
| $ — |
| $14 |
| $191 |
23
CenterState Bank Corporation and Subsidiaries
NOTES TO CONDENSED CONSOLIDATED FINANCIAL STATEMENTS (unaudited)
(in thousands of dollars, except per share data)
The following tables present the balance in the allowance for credit losses and the recorded investment in loans by portfolio segment and based on impairment method as of March 31, 2020 and December 31, 2019. Upon adoption of ASC Topic 326 effective January 1, 2020, the Company began to evaluate PCD loans that met the criteria for individual impairment analysis on a loan level basis. Previously, the Company accounted for PCD (formerly PCI) loans on a pool level basis pursuant to ASC 310-30 and were therefore collectively evaluated for period end December 31, 2019. Accrued interest receivable and unearned loan fees and costs are not included in the recorded investment because they are not material.
|
| Real Estate Loans |
|
|
|
|
|
| ||||
|
| Residential |
| Commercial |
| Land, develop., constr. |
| Comm., industrial & factored receivables |
| Consumer & other |
| Total |
As of March 31, 2020 |
|
|
|
|
|
|
|
|
|
|
|
|
Allowance for credit losses: |
|
|
|
|
|
|
|
|
|
|
|
|
Ending allowance balance attributable to: |
|
|
|
|
|
|
|
|
|
| ||
Non-PCD loans |
|
|
|
|
|
|
|
|
|
|
|
|
Individually evaluated for impairment |
| $322 |
| $280 |
| $4 |
| $1,314 |
| $ — |
| $1,920 |
Collectively evaluated for impairment |
| 19,909 |
| 91,246 |
| 14,177 |
| 9,675 |
| 3,876 |
| 138,883 |
Total ending allowance balance, non-PCD |
| $20,231 |
| $91,526 |
| $14,181 |
| $10,989 |
| $3,876 |
| $140,803 |
PCD loans |
|
|
|
|
|
|
|
|
|
|
|
|
Individually evaluated for impairment |
| $ — |
| $9,917 |
| $ — |
| $2,398 |
| $ — |
| $12,315 |
Collectively evaluated for impairment |
| 2,852 |
| 2,186 |
| 258 |
| 262 |
| 57 |
| 5,615 |
Total ending allowance balance, PCD |
| $2,852 |
| $12,103 |
| $258 |
| $2,660 |
| $57 |
| $17,930 |
Total ending allowance balance |
| $23,083 |
| $103,629 |
| $14,439 |
| $13,649 |
| $3,933 |
| $158,733 |
|
|
|
|
|
|
|
|
|
|
|
|
|
Loans: |
|
|
|
|
|
|
|
|
|
|
|
|
Non-PCD loans |
|
|
|
|
|
|
|
|
|
|
|
|
Individually evaluated for impairment |
| $4,659 |
| $18,145 |
| $781 |
| $7,276 |
| $134 |
| $30,995 |
Collectively evaluated for impairment |
| 2,532,581 |
| 6,373,830 |
| 928,233 |
| 1,771,250 |
| 235,066 |
| 11,840,960 |
Total non-PCD loans |
| $2,537,240 |
| $6,391,975 |
| $929,014 |
| $1,778,526 |
| $235,200 |
| $11,871,955 |
PCD loans |
|
|
|
|
|
|
|
|
|
|
|
|
Individually evaluated for impairment |
| $ — |
| $19,611 |
| $ — |
| $3,165 |
| $ — |
| $22,776 |
Collectively evaluated for impairment |
| 42,779 |
| 72,670 |
| 5,447 |
| 6,591 |
| 59 |
| 127,546 |
Total PCD loans |
| $42,779 |
| $92,281 |
| $5,447 |
| $9,756 |
| $59 |
| $150,322 |
Total ending loan balances |
| $2,580,019 |
| $6,484,256 |
| $934,461 |
| $1,788,282 |
| $235,259 |
| $12,022,277 |
|
|
|
|
|
|
|
|
|
|
|
|
|
|
| Real Estate Loans |
|
|
|
|
|
| ||||
|
| Residential |
| Commercial |
| Land, develop., constr. |
| Comm., industrial & factored receivables |
| Consumer & other |
| Total |
As of December 31, 2019 |
|
|
|
|
|
|
|
|
|
|
|
|
Allowance for loan losses: |
|
|
|
|
|
|
|
|
|
|
|
|
Ending allowance balance attributable to loans: |
|
|
|
|
|
|
|
|
|
|
|
|
Individually evaluated for impairment |
| $588 |
| $375 |
| $ — |
| $914 |
| $1 |
| $1,878 |
Collectively evaluated for impairment |
| 3,669 |
| 18,177 |
| 2,319 |
| 10,368 |
| 4,018 |
| 38,551 |
Purchased credit impaired |
| — |
| — |
| 177 |
| — |
| 49 |
| 226 |
Total ending allowance balance |
| $4,257 |
| $18,552 |
| $2,496 |
| $11,282 |
| $4,068 |
| $40,655 |
|
|
|
|
|
|
|
|
|
|
|
|
|
Loans: |
|
|
|
|
|
|
|
|
|
|
|
|
Individually evaluated for impairment |
| $6,475 |
| $11,445 |
| $865 |
| $7,232 |
| $123 |
| $26,140 |
Collectively evaluated for impairment |
| 2,506,069 |
| 6,313,663 |
| 999,058 |
| 1,751,842 |
| 247,184 |
| 11,817,816 |
Purchased credit impaired |
| 45,795 |
| 81,576 |
| 4,655 |
| 3,342 |
| 100 |
| 135,468 |
Total ending loan balances |
| $2,558,339 |
| $6,406,684 |
| $1,004,578 |
| $1,762,416 |
| $247,407 |
| $11,979,424 |
24
CenterState Bank Corporation and Subsidiaries
NOTES TO CONDENSED CONSOLIDATED FINANCIAL STATEMENTS (unaudited)
(in thousands of dollars, except per share data)
The table below summarizes impaired loan data for the periods presented.
|
| March 31, 2020 |
| December 31, 2019 |
Performing TDRs (these are not included in nonperforming loans ("NPLs")) |
| $7,215 |
| $8,012 |
Nonperforming TDRs (these are included in NPLs) |
| 4,648 |
| 4,512 |
Total TDRs (these are included in impaired loans) |
| 11,863 |
| 12,524 |
Impaired loans that are not TDRs |
| 19,132 |
| 13,616 |
Total impaired loans, excluding PCD loans |
| $30,995 |
| $26,140 |
Impaired PCD loans |
| 22,776 |
| — |
Total impaired loans |
| $53,771 |
| $26,140 |
Troubled Debt Restructurings:
In certain situations, it is common to restructure or modify the terms of troubled loans (i.e. troubled debt restructure or “TDRs”). In those circumstances, it may be beneficial to restructure the terms of a loan and work with the borrower for the benefit of both parties, versus forcing the property into foreclosure and having to dispose of it in a distressed sale. When the terms of a loan have been modified, usually the monthly payment and/or interest rate is reduced for generally twelve to twenty-four months. The Company has not forgiven any material principal amounts on any loan modifications to date.
TDRs as of March 31, 2020 and December 31, 2019 quantified by loan type classified separately as accrual (performing loans) and non-accrual (non-performing loans) are presented in the tables below.
|
| Accruing |
| Non-accrual |
| Total |
As of March 31, 2020 |
|
|
|
|
|
|
Real estate loans: |
|
|
|
|
|
|
Residential |
| $4,660 |
| $813 |
| $5,473 |
Commercial |
| 1,290 |
| — |
| 1,290 |
Land, development, construction |
| 46 |
| 470 |
| 516 |
Total real estate loans |
| 5,996 |
| 1,283 |
| 7,279 |
Commercial and industrial |
| 1,085 |
| 3,365 |
| 4,450 |
Consumer and other |
| 134 |
| — |
| 134 |
Total TDRs |
| $7,215 |
| $4,648 |
| $11,863 |
|
|
|
|
|
|
|
|
|
|
|
|
|
|
|
| Accruing |
| Non-Accrual |
| Total |
As of December 31, 2019 |
|
|
|
|
|
|
Real estate loans: |
|
|
|
|
|
|
Residential |
| $4,862 |
| $1,147 |
| $6,009 |
Commercial |
| 1,706 |
| — |
| 1,706 |
Land, development, construction |
| 175 |
| — |
| 175 |
Total real estate loans |
| 6,743 |
| 1,147 |
| 7,890 |
Commercial and industrial |
| 1,146 |
| 3,365 |
| 4,511 |
Consumer and other |
| 123 |
| — |
| 123 |
Total TDRs |
| $8,012 |
| $4,512 |
| $12,524 |
The Company’s policy is to return non-accrual TDR loans to accrual status when all the principal and interest amounts contractually due, pursuant to its modified terms, are brought current and future payments are reasonably assured. Our policy also considers the payment history of the borrower, but is not dependent upon a specific number of payments. The Company recorded a provision for credit loss expense of $22 and partial charge offs of $21 on the TDR loans described above during the three-month period ending March 31, 2020. The Company recorded a provision for credit loss expense of $31 and partial charge-offs of $8 on TDR loans during the three-month period ending March 31, 2019.
Loans are modified to minimize credit losses when we believe the modification will improve the borrower’s financial condition and ability to repay the loan. We typically do not forgive principal. We generally either reduce interest rates or decrease monthly payments for a temporary period of time and those reductions of cash flows are capitalized into the loan balance. We may also extend maturities, convert balloon loans to longer-term amortizing loans, or vice versa, or change interest rates between variable and fixed rate. Each borrower and situation is unique and we try to accommodate the borrower and minimize the Company’s potential losses. Approximately 61% of our TDRs are current pursuant to their modified terms, and $4,648, or approximately 39% of our total TDRs are not performing pursuant to their modified terms. There does not appear to be any significant difference in success rates with one type of concession versus another.
25
CenterState Bank Corporation and Subsidiaries
NOTES TO CONDENSED CONSOLIDATED FINANCIAL STATEMENTS (unaudited)
(in thousands of dollars, except per share data)
Loans modified as TDRs during the three-month period ending March 31, 2020 were $482. Loans modified as TDRs during the three-month period ending March 31, 2019 were $713. The Company recorded $14 of credit loss provision for loans modified during the three-month period ending March 31, 2020. NaN credit loss provision was recorded during the three-month period ending March 31, 2019.
The following table presents loans by class modified and for which there was a payment default within twelve months following the modification during the periods ending March 31, 2020 and 2019.
| Period ending |
| Period ending | |||||||||||
| March 31, 2020 |
| March 31, 2019 | |||||||||||
|
| Number |
| Recorded |
| Number |
| Recorded | ||||||
|
| of loans |
| investment |
| of loans |
| investment | ||||||
Residential |
| 1 |
| $169 |
| — |
| $ — | ||||||
Commercial real estate |
| 1 |
| 267 |
| — |
| — | ||||||
Land, development, construction |
| — |
| — |
| — |
| — | ||||||
Commercial and industrial |
| 1 |
| 61 |
| 1 |
| 122 | ||||||
Consumer and other |
| — |
| — |
| — |
| — | ||||||
Total |
| 3 |
| $497 |
| 1 |
| $122 | ||||||
The Company recorded $1 provision for credit loss expense related to TDRs and $1 partial charge offs on TDR loans subsequently defaulted during the for three-month period ending March 31, 2020. The Company recorded 0 provision for loan loss expense of and 0 partial charge offs on TDR loans that subsequently defaulted as described above during the three-month period ending March 31, 2019.
The following tables present non-PCD loans individually evaluated for impairment by class of loans as March 31, 2020 and December 31, 2019. The recorded investment is less than the unpaid principal balance due to partial charge-offs.
|
| Unpaid principal balance |
| Recorded investment |
| Allowance for credit losses allocated |
As of March 31, 2020 |
|
|
|
|
|
|
With no related allowance recorded: |
|
|
|
|
|
|
Residential real estate |
| $2,822 |
| $2,669 |
| $ — |
Commercial real estate |
| 16,470 |
| 15,003 |
| — |
Land, development, construction |
| 755 |
| 725 |
| — |
Commercial and industrial |
| 3,737 |
| 3,424 |
| — |
Consumer, other |
| 110 |
| 109 |
| — |
|
|
|
|
|
|
|
With an allowance recorded: |
|
|
|
|
|
|
Residential real estate |
| 2,126 |
| 1,990 |
| 322 |
Commercial real estate |
| 3,175 |
| 3,142 |
| 280 |
Land, development, construction |
| 56 |
| 56 |
| 4 |
Commercial and industrial |
| 3,922 |
| 3,852 |
| 1,314 |
Consumer, other |
| 30 |
| 25 |
| — |
Total |
| $33,203 |
| $30,995 |
| $1,920 |
|
|
|
|
|
|
|
|
|
|
|
|
|
|
|
| Unpaid principal balance |
| Recorded investment |
| Allowance for loan losses allocated |
As of December 31, 2019 |
|
|
|
|
|
|
With no related allowance recorded: |
|
|
|
|
|
|
Residential real estate |
| $2,894 |
| $2,744 |
| $ — |
Commercial real estate |
| 11,031 |
| 10,015 |
| — |
Land, development, construction |
| 886 |
| 865 |
| — |
Commercial and industrial |
| 5,522 |
| 4,820 |
| — |
Consumer, other |
| 99 |
| 98 |
| — |
|
|
|
|
|
|
|
With an allowance recorded: |
|
|
|
|
|
|
Residential real estate |
| 3,920 |
| 3,731 |
| 588 |
Commercial real estate |
| 1,438 |
| 1,430 |
| 375 |
26
CenterState Bank Corporation and Subsidiaries
NOTES TO CONDENSED CONSOLIDATED FINANCIAL STATEMENTS (unaudited)
(in thousands of dollars, except per share data)
Land, development, construction |
| — |
| — |
| — |
Commercial and industrial |
| 2,486 |
| 2,412 |
| 914 |
Consumer, other |
| 31 |
| 25 |
| 1 |
Total |
| $28,307 |
| $26,140 |
| $1,878 |
|
| Average of impaired loans |
| Interest income recognized during impairment |
| Cash basis interest income recognized | ||||
Three-month ended March 31, 2020 |
|
|
|
|
|
| ||||
Real estate loans: |
|
|
|
|
|
| ||||
Residential |
| $5,567 |
| $37 |
| $ — | ||||
Commercial |
| 14,795 |
| 31 |
| — | ||||
Land, development, construction |
| 823 |
| 2 |
| — | ||||
Total real estate loans |
| 21,185 |
| 70 |
| — | ||||
|
|
|
|
|
|
| ||||
Commercial and industrial |
| 7,254 |
| 18 |
| — | ||||
Consumer and other loans |
| 129 |
| 2 |
| — | ||||
Total |
| $28,568 |
| $90 |
| $ — | ||||
|
|
|
|
|
|
| ||||
|
| Average of impaired loans |
| Interest income recognized during impairment |
| Cash basis interest income recognized | ||||
Three-month ended March 31, 2019 |
|
|
|
|
|
| ||||
Real estate loans: |
|
|
|
|
|
| ||||
Residential |
| $5,945 |
| $62 |
| $ — | ||||
Commercial |
| 7,787 |
| 25 |
| — | ||||
Land, development, construction |
| 117 |
| 1 |
| — | ||||
Total real estate loans |
| 13,849 |
| 88 |
| — | ||||
|
|
|
|
|
|
| ||||
Commercial and industrial |
| 2,600 |
| 12 |
| — | ||||
Consumer and other loans |
| 140 |
| 2 |
| — | ||||
Total |
| $16,589 |
| $102 |
| $ — | ||||
|
|
|
|
|
|
| ||||
The following tables present PCD loans, accounted for pursuant to ASC Topic 326, individually evaluated for impairment by class of loans as of March 31, 2020. The recorded investment is less than the unpaid principal balance due to partial charge-offs and non-credit discounts. In addition, the interest income recognized during impairment excludes interest accretion recognized during the current reporting period.
|
| Unpaid principal balance |
| Recorded investment |
| Allowance for credit losses allocated |
As of March 31, 2020, PCD loans |
|
|
|
|
|
|
With no related allowance recorded: |
|
|
|
|
|
|
Residential real estate |
| $ — |
| $ — |
| $ — |
Commercial real estate |
| — |
| — |
| — |
Land, development, construction |
| — |
| — |
| — |
Commercial and industrial |
| — |
| — |
| — |
Consumer, other |
| — |
| — |
| — |
|
|
|
|
|
|
|
With an allowance recorded: |
|
|
|
|
|
|
Residential real estate |
| — |
| — |
| — |
Commercial real estate |
| 35,999 |
| 19,611 |
| 9,917 |
Land, development, construction |
| — |
| — |
| — |
Commercial and industrial |
| 4,745 |
| 3,165 |
| 2,398 |
Consumer, other |
| — |
| — |
| — |
Total |
| $40,744 |
| $22,776 |
| $12,315 |
27
CenterState Bank Corporation and Subsidiaries
NOTES TO CONDENSED CONSOLIDATED FINANCIAL STATEMENTS (unaudited)
(in thousands of dollars, except per share data)
|
| Average of impaired loans |
| Interest income recognized during impairment |
| Cash basis interest income recognized |
Three-month ended March 31, 2020, PCD loans |
|
|
|
|
|
|
Real estate loans: |
|
|
|
|
|
|
Residential |
| $ — |
| $ — |
| $ — |
Commercial |
| 20,128 |
| 125 |
| — |
Land, development, construction |
| — |
| — |
| — |
Total real estate loans |
| 20,128 |
| 125 |
| — |
|
|
|
|
|
|
|
Commercial and industrial |
| 3,593 |
| 23 |
| — |
Consumer and other loans |
| — |
| — |
| — |
Total |
| $23,721 |
| $148 |
| $ — |
Nonperforming loans include both smaller balance homogeneous loans that are collectively evaluated for impairment and individually classified impaired loans. All loans greater than 90 days past due are placed on non-accrual status, excluding factored receivables. For CBI’s factored receivables, which are commercial trade credits rather than promissory notes, the Company’s practice, in most cases, is to charge-off unpaid recourse receivables when they become 90 days past due from the invoice due date and the non-recourse receivables when they become 120 days past due from the statement billing date. Effective January 1, 2020 with the adoption of ASC Topic 326, the Company began including non-accrual PCD loans in its nonperforming loans. As such the nonperforming loans as of March 31, 2020 include PCD loans accounted for pursuant to ASC 326 as these loans are individually evaluated. The nonperforming loans do not include PCD (formerly PCI) loans as of December 31, 2019, as the PCD loans prior to adopting ASC Topic 326 were evaluated on a pool level basis.
Nonperforming loans were as follows: |
| March 31, 2020 |
| December 31, 2019 |
Non-accrual loans, non-PCD |
| $45,305 |
| $36,916 |
Non-accrual loans, PCD |
| 33,893 |
| — |
Loans past due over 90 days and still accruing interest |
| 535 |
| 1,692 |
Total nonperforming loans |
| $79,733 |
| $38,608 |
The following table presents the recorded investment in nonaccrual loans and loans past due over 90 days still on accrual by class of loans as of March 31, 2020 and December 31, 2019. Effective January 1, 2020 with the adoption of ASC Topic 326, the Company began including non-accrual PCD loans in its nonperforming loans. As such the nonperforming loans as of March 31, 2020 below include PCD loans accounted for pursuant to ASC 326 but does not include PCD (formerly PCI) loans in non-performing loans as of December 31, 2019.
|
| Non-accrual with no allocated allowance for credit losses |
| Non-accrual with allocated allowance for credit losses |
| Loans past due over 90 days still accruing |
As of March 31, 2020 |
|
|
|
|
|
|
Non-PCD loans: |
|
|
|
|
|
|
Residential real estate |
| $11,537 |
| $926 |
| $ — |
Commercial real estate |
| 18,386 |
| 2,264 |
| — |
Land, development, construction |
| 2,107 |
| 470 |
| — |
Comm., industrial & factored receivables |
| 5,713 |
| 2,869 |
| 535 |
Consumer, other |
| 1,033 |
| — |
| — |
Total |
| $38,776 |
| $6,529 |
| $535 |
|
| Non-accrual with no allocated allowance for credit losses |
| Non-accrual with allocated allowance for credit losses |
| Loans past due over 90 days still accruing |
As of March 31, 2020 |
|
|
|
|
|
|
PCD loans: |
|
|
|
|
|
|
Residential real estate |
| $ 8,847 |
| $— |
| $ — |
Commercial real estate |
| 10,722 |
| 9,609 |
| — |
Land, development, construction |
| 1,334 |
| — |
| — |
Comm., industrial & factored receivables |
| 1,396 |
| 1,969 |
| — |
Consumer, other |
| 16 |
| — |
| — |
Total |
| $ 22,315 |
| $11,578 |
| $ — |
28
CenterState Bank Corporation and Subsidiaries
NOTES TO CONDENSED CONSOLIDATED FINANCIAL STATEMENTS (unaudited)
(in thousands of dollars, except per share data)
|
| Non-accrual |
| Loans past due over 90 days still accruing |
As of December 31, 2019 |
|
|
|
|
Non-PCD loans: |
|
|
|
|
Residential real estate |
| $13,455 |
| $ — |
Commercial real estate |
| 12,141 |
| — |
Land, development, construction |
| 2,516 |
| — |
Commercial and industrial |
| 7,884 |
| 1,692 |
Consumer, other |
| 920 |
| — |
Total |
| $36,916 |
| $1,692 |
Collateral dependent loans:
Collateral dependent loans are impaired loans where repayment is expected to be provided solely by the underlying collateral and there are no other available and reliable sources of repayment. They are written down to the lower of cost or collateral value less estimated selling costs. As of March 31, 2020, there were $19,611 of collateral-dependent loans which are secured by real-estate.
The following table presents the aging of the recorded investment in past due non-PCD loans as of March 31, 2020 and December 31, 2019:
|
| Accruing Loans |
|
| ||||||||||
As of March 31, 2020 |
| Total |
| 30 - 59 days past due |
| 60 - 89 days past due |
| Greater than 90 days past due |
| Total past due |
| Loans not past due |
| Nonaccrual loans |
Residential real estate |
| $2,537,240 |
| $17,555 |
| $910 |
| $ — |
| $18,465 |
| $2,506,312 |
| $12,463 |
Commercial real estate |
| 6,391,975 |
| 10,802 |
| 7,147 |
| — |
| 17,949 |
| 6,353,376 |
| 20,650 |
Land, development, construction |
| 929,014 |
| 4,757 |
| 74 |
| — |
| 4,831 |
| 921,606 |
| 2,577 |
Comm., industrial & factored receivables |
| 1,778,526 |
| 15,859 |
| 2,043 |
| 535 |
| 18,437 |
| 1,751,507 |
| 8,582 |
Consumer |
| 235,200 |
| 1,870 |
| 377 |
| — |
| 2,247 |
| 231,920 |
| 1,033 |
|
| $11,871,955 |
| $50,843 |
| $10,551 |
| $535 |
| $61,929 |
| $11,764,721 |
| $45,305 |
|
|
|
|
|
|
|
|
|
|
|
|
|
|
|
|
|
|
|
|
|
|
|
|
|
|
|
|
|
|
|
| Accruing Loans |
|
| ||||||||||
As of December 31, 2019 |
| Total |
| 30 - 59 days past due |
| 60 - 89 days past due |
| Greater than 90 days past due |
| Total past due |
| Loans not past due |
| Nonaccrual loans |
Residential real estate |
| $2,512,544 |
| $7,601 |
| $5,928 |
| $ — |
| $13,529 |
| $2,485,560 |
| $13,455 |
Commercial real estate |
| 6,325,108 |
| 7,554 |
| 2,577 |
| — |
| 10,131 |
| 6,302,836 |
| 12,141 |
Land, development, construction |
| 999,923 |
| 1,343 |
| 2,349 |
| — |
| 3,692 |
| 993,715 |
| 2,516 |
Comm., industrial & factored receivables |
| 1,759,074 |
| 14,924 |
| 12,465 |
| 1,692 |
| 29,081 |
| 1,722,109 |
| 7,884 |
Consumer |
| 247,307 |
| 1,663 |
| 907 |
| — |
| 2,570 |
| 243,817 |
| 920 |
|
| $11,843,956 |
| $33,085 |
| $24,226 |
| $1,692 |
| $59,003 |
| $11,748,037 |
| $36,916 |
The following table presents the aging of the recorded investment in past due PCD loans as of March 31, 2020:
|
| Accruing Loans |
|
| ||||||||||
As of March 31, 2020 |
| Total |
| 30 - 59 days past due |
| 60 - 89 days past due |
| Greater than 90 days past due |
| Total past due |
| Loans not past due |
| Nonaccrual loans |
Residential real estate |
| $42,779 |
| $782 |
| $ — |
| $ — |
| $782 |
| $33,150 |
| $8,847 |
Commercial real estate |
| 92,281 |
| 870 |
| — |
| — |
| 870 |
| 71,080 |
| 20,331 |
Land, development, construction |
| 5,447 |
| 12 |
| 35 |
| — |
| 47 |
| 4,066 |
| 1,334 |
Comm., industrial & factored receivables |
| 9,756 |
| 1,049 |
| 168 |
| — |
| 1,217 |
| 5,174 |
| 3,365 |
Consumer |
| 59 |
| 3 |
| — |
| — |
| 3 |
| 40 |
| 16 |
|
| $150,322 |
| $2,716 |
| $203 |
| $ — |
| $2,919 |
| $113,510 |
| $33,893 |
Credit Quality Indicators:
The Company categorizes loans into risk categories based on relevant information about the ability of borrowers to service their debt such as; current financial information, historical payment experience, credit documentation, public information, and current economic trends, among other factors. The Company analyzes loans individually by classifying the loans as to credit risk. This analysis is performed on at least an annual basis. The Company uses the following definitions for risk ratings:
29
CenterState Bank Corporation and Subsidiaries
NOTES TO CONDENSED CONSOLIDATED FINANCIAL STATEMENTS (unaudited)
(in thousands of dollars, except per share data)
Special Mention: Loans classified as special mention have a potential weakness that deserves management’s close attention. If left uncorrected, these potential weaknesses may result in deterioration of the repayment prospects for the loan or of the institution’s credit position at some future date.
Substandard: Loans classified as substandard are inadequately protected by the current net worth and paying capacity of the obligor or of the collateral pledged, if any. Loans so classified have a well-defined weakness or weaknesses that jeopardize the liquidation of the debt. They are characterized by the distinct possibility that the institution will sustain some loss if the deficiencies are not corrected.
Doubtful: Loans classified as doubtful have all the weaknesses inherent in those classified as substandard, with the added characteristic that the weaknesses make collection or liquidation in full, on the basis of currently existing facts, conditions, and values, highly questionable and improbable.
Loans not meeting the criteria above that are analyzed individually as part of the above described process are considered to be pass rated loans. Effective January 1, 2020, the Company began accounting for PCD loans pursuant to ASC Topic 326. Previously, PCD (formerly PCI) loans were accounted for pursuant to ASC Topic 310-30. Based on the most recent analysis performed, the risk category of loans by class of loans is as follows:
|
| Term Loans Amortized Cost Basis by Origination Year |
|
|
|
| |||||||||||
Loan Category |
| 2020 |
| 2019 |
| 2018 |
| 2017 |
| 2016 |
| Prior |
| Revolving loans amortized cost |
| Total | |
As of March 31, 2020 |
|
|
|
|
|
|
|
|
|
|
|
|
|
|
|
| |
Residential Non-PCD: |
|
|
|
|
|
|
|
|
|
|
|
|
|
|
|
| |
Risk rating |
|
|
|
|
|
|
|
|
|
|
|
|
|
|
|
| |
Pass |
| $96,916 |
| $331,772 |
| $340,612 |
| $235,228 |
| $191,581 |
| $626,533 |
| $659,493 |
| $2,482,135 | |
Special mention |
| — |
| — |
| 272 |
| 1,258 |
| 3,182 |
| 21,568 |
| 3,414 |
| 29,694 | |
Substandard |
| — |
| 19 |
| 1,893 |
| 1,642 |
| 1,200 |
| 16,183 |
| 4,474 |
| 25,411 | |
Total residential loans |
| $96,916 |
| $331,791 |
| $342,777 |
| $238,128 |
| $195,963 |
| $664,284 |
| $667,381 |
| $2,537,240 | |
Commercial Non-PCD: |
|
|
|
|
|
|
|
|
|
|
|
|
|
|
|
| |
Risk rating |
|
|
|
|
|
|
|
|
|
|
|
|
|
|
|
| |
Pass |
| $231,694 |
| $1,068,021 |
| $1,013,588 |
| $908,262 |
| $827,344 |
| $2,162,917 |
| $ — |
| $6,211,826 | |
Special mention |
| 555 |
| 6,378 |
| 3,801 |
| 16,580 |
| 13,985 |
| 79,175 |
| — |
| 120,474 | |
Substandard |
| — |
| 439 |
| 1,111 |
| 9,406 |
| 10,942 |
| 37,777 |
| — |
| 59,675 | |
Total commercial loans |
| $232,249 |
| $1,074,838 |
| $1,018,500 |
| $934,248 |
| $852,271 |
| $2,279,869 |
| $ — |
| $6,391,975 | |
Land, Dev., Construction Non-PCD: |
|
|
|
|
|
|
|
|
|
|
|
|
|
|
|
| |
Risk rating |
|
|
|
|
|
|
|
|
|
|
|
|
|
|
|
| |
Pass |
| $55,460 |
| $414,429 |
| $218,397 |
| $84,358 |
| $51,453 |
| $93,530 |
| $ — |
| $917,627 | |
Special mention |
| — |
| 184 |
| 626 |
| 584 |
| — |
| 6,042 |
| — |
| 7,436 | |
Substandard |
| — |
| 348 |
| 274 |
| 154 |
| 919 |
| 2,256 |
| — |
| 3,951 | |
Total land, dev., construction loans |
| $55,460 |
| $414,961 |
| $219,297 |
| $85,096 |
| $52,372 |
| $101,828 |
| $ — |
| $929,014 | |
Commercial & Industrial Non-PCD: |
|
|
|
|
|
|
|
|
|
|
|
|
|
|
|
| |
Risk rating |
|
|
|
|
|
|
|
|
|
|
|
|
|
|
|
| |
Pass |
| $113,652 |
| $334,843 |
| $382,869 |
| $287,342 |
| $161,970 |
| $449,985 |
| $ — |
| $1,730,661 | |
Special mention |
| — |
| — |
| 75 |
| 3,026 |
| 2,264 |
| 25,662 |
| — |
| 31,027 | |
Substandard |
| 98 |
| 995 |
| 5,212 |
| 5,480 |
| 3,020 |
| 2,033 |
| — |
| 16,838 | |
Total commercial & industrial loans |
| $113,750 |
| $335,838 |
| $388,156 |
| $295,848 |
| $167,254 |
| $477,680 |
| $ — |
| $1,778,526 | |
Consumer & Other Non-PCD: |
|
|
|
|
|
|
|
|
|
|
|
|
|
|
|
| |
Risk rating |
|
|
|
|
|
|
|
|
|
|
|
|
|
|
|
| |
Pass |
| $20,977 |
| $65,488 |
| $42,744 |
| $25,046 |
| $29,300 |
| $23,642 |
| $26,498 |
| $233,695 | |
Special mention |
| — |
| — |
| — |
| 5 |
| 33 |
| 108 |
| — |
| 146 | |
Substandard |
| — |
| 141 |
| 106 |
| 137 |
| 670 |
| 267 |
| 38 |
| 1,359 | |
Total consumer & other loans |
| $20,977 |
| $65,629 |
| $42,850 |
| $25,188 |
| $30,003 |
| $24,017 |
| $26,536 |
| $235,200 | |
|
|
|
|
|
|
|
|
|
|
|
|
|
|
|
|
| |
Total, non-PCD loans |
| $ 519,352 |
| $ 2,223,057 |
| $ 2,011,580 |
| $ 1,578,508 |
| $ 1,297,863 |
| $ 3,547,678 |
| $ 693,917 |
| $ 11,871,955 | |
30
CenterState Bank Corporation and Subsidiaries
NOTES TO CONDENSED CONSOLIDATED FINANCIAL STATEMENTS (unaudited)
(in thousands of dollars, except per share data)
|
| Term Loans Amortized Cost Basis by Origination Year |
|
|
|
| ||||||||||
Loan Category |
| 2020 |
| 2019 |
| 2018 |
| 2017 |
| 2016 |
| Prior |
| Revolving loans amortized cost |
| Total |
As of March 31, 2020 |
|
|
|
|
|
|
|
|
|
|
|
|
|
|
|
|
Residential PCD: |
|
|
|
|
|
|
|
|
|
|
|
|
|
|
|
|
Risk rating |
|
|
|
|
|
|
|
|
|
|
|
|
|
|
|
|
Pass |
| $ — |
| $ — |
| $ — |
| $ — |
| $268 |
| $14,814 |
| $3,695 |
| $18,777 |
Special mention |
| — |
| — |
| — |
| — |
| — |
| 3,849 |
| 224 |
| 4,073 |
Substandard |
| — |
| 98 |
| — |
| 3 |
| 500 |
| 16,945 |
| 2,383 |
| 19,929 |
Total residential loans |
| $ — |
| $98 |
| $ — |
| $3 |
| $768 |
| $35,608 |
| $6,302 |
| $42,779 |
Commercial PCD: |
|
|
|
|
|
|
|
|
|
|
|
|
|
|
|
|
Risk rating |
|
|
|
|
|
|
|
|
|
|
|
|
|
|
|
|
Pass |
| $ — |
| $ — |
| $ — |
| $ — |
| $ — |
| $25,820 |
| $ — |
| $25,820 |
Special mention |
| — |
| — |
| — |
| — |
| — |
| 10,792 |
| — |
| 10,792 |
Substandard |
| — |
| 1,807 |
| — |
| 2,801 |
| 678 |
| 50,383 |
| — |
| 55,669 |
Total commercial loans |
| $ — |
| $1,807 |
| $ — |
| $2,801 |
| $678 |
| $86,995 |
| $ — |
| $92,281 |
Land, Dev., Construction PCD: |
|
| �� |
|
|
|
|
|
|
|
|
|
|
|
|
|
Risk rating |
|
|
|
|
|
|
|
|
|
|
|
|
|
|
|
|
Pass |
| $ — |
| $ — |
| $ — |
| $ — |
| $ — |
| $1,810 |
| $ — |
| $1,810 |
Special mention |
| — |
| — |
| — |
| — |
| — |
| 630 |
| — |
| 630 |
Substandard |
| — |
| — |
| 188 |
| — |
| 121 |
| 2,698 |
| — |
| 3,007 |
Total land, dev., construction loans |
| $ — |
| $ — |
| $188 |
| $ — |
| $121 |
| $5,138 |
| $ — |
| $5,447 |
Commercial & Industrial PCD: |
|
|
|
|
|
|
|
|
|
|
|
|
|
|
|
|
Risk rating |
|
|
|
|
|
|
|
|
|
|
|
|
|
|
|
|
Pass |
| $ — |
| $ — |
| $15 |
| $ — |
| $ — |
| $1,398 |
| $ — |
| $1,413 |
Special mention |
| — |
| — |
| — |
| — |
| — |
| 405 |
| — |
| 405 |
Substandard |
| — |
| — |
| 48 |
| 1,123 |
| 1,286 |
| 5,481 |
| — |
| 7,938 |
Total commercial & industrial loans |
| $ — |
| $ — |
| $63 |
| $1,123 |
| $1,286 |
| $7,284 |
| $ — |
| $9,756 |
Consumer & Other PCD: |
|
|
|
|
|
|
|
|
|
|
|
|
|
|
|
|
Risk rating |
|
|
|
|
|
|
|
|
|
|
|
|
|
|
|
|
Pass |
| $ — |
| $ — |
| $ — |
| $ — |
| $ — |
| $30 |
| $3 |
| $33 |
Special mention |
| — |
| — |
| — |
| — |
| — |
| — |
| — |
| — |
Substandard |
| — |
| — |
| — |
| 1 |
| — |
| 25 |
| — |
| 26 |
Total consumer & other loans |
| $ — |
| $ — |
| $ — |
| $1 |
| $ — |
| $55 |
| $3 |
| $59 |
|
|
|
|
|
|
|
|
|
|
|
|
|
|
|
|
|
Total, PCD loans |
| $ — |
| $1,905 |
| $251 |
| $3,928 |
| $2,853 |
| $135,080 |
| $6,305 |
| $150,322 |
As of December 31, 2019, the risk category of loans by class of loans, excluding purchased credit deteriorated loans, is presented below.
|
| As of December 31, 2019 | ||||||
Loan Category |
| Pass |
| Special Mention |
| Substandard |
| Doubtful |
Residential real estate |
| $2,455,752 |
| $31,189 |
| $25,603 |
| $ — |
Commercial real estate | 6,151,309 |
| 118,412 |
| 55,387 |
| — | |
Land, development, construction | 989,860 |
| 6,418 |
| 3,645 |
| — | |
Comm., industrial & factored receivables | 1,705,862 |
| 35,070 |
| 18,142 |
| — | |
Consumer |
| 245,905 |
| 160 |
| 1,242 |
| — |
Total |
| $11,548,688 |
| $191,249 |
| $104,019 |
| $ — |
31
CenterState Bank Corporation and Subsidiaries
NOTES TO CONDENSED CONSOLIDATED FINANCIAL STATEMENTS (unaudited)
(in thousands of dollars, except per share data)
The Company considers the performance of the loan portfolio and its impact on the allowance for credit losses. For residential and consumer loan classes, the Company also evaluates credit quality based on the aging status of the loan, which was previously presented, and by payment activity.
|
| Term Loans Amortized Cost Basis by Origination Year |
|
|
|
| ||||||||||
Loan Category |
| 2020 |
| 2019 |
| 2018 |
| 2017 |
| 2016 |
| Prior |
| Revolving loans amortized cost |
| Total |
As of March 31, 2020 |
|
|
|
|
|
|
|
|
|
|
|
|
|
|
|
|
Residential Non-PCD: |
|
|
|
|
|
|
|
|
|
|
|
|
|
|
|
|
Performing |
| $96,916 |
| $331,639 |
| $342,340 |
| $236,663 |
| $195,436 |
| $657,475 |
| $664,308 |
| $2,524,777 |
Nonperforming |
| — |
| 152 |
| 437 |
| 1,465 |
| 527 |
| 6,809 |
| 3,073 |
| 12,463 |
Total residential loans |
| $96,916 |
| $331,791 |
| $342,777 |
| $238,128 |
| $195,963 |
| $664,284 |
| $667,381 |
| $2,537,240 |
|
|
|
|
|
|
|
|
|
|
|
|
|
|
|
|
|
Consumer & Other Non-PCD: |
|
|
|
|
|
|
|
|
|
|
|
|
|
|
|
|
Performing |
| $20,977 |
| $65,599 |
| $42,794 |
| $25,055 |
| $29,469 |
| $23,750 |
| $26,523 |
| $234,167 |
Nonperforming |
| — |
| 30 |
| 56 |
| 133 |
| 534 |
| 267 |
| 13 |
| 1,033 |
Total consumer & other loans |
| $20,977 |
| $65,629 |
| $42,850 |
| $25,188 |
| $30,003 |
| $24,017 |
| $26,536 |
| $235,200 |
|
|
|
|
|
|
|
|
|
|
|
|
|
|
|
|
|
As of March 31, 2020 |
|
|
|
|
|
|
|
|
|
|
|
|
|
|
|
|
Residential PCD: |
|
|
|
|
|
|
|
|
|
|
|
|
|
|
|
|
Performing |
| $ — |
| $98 |
| $ — |
| $ — |
| $471 |
| $27,984 |
| $5,379 |
| $33,932 |
Nonperforming |
| — |
| — |
| — |
| 3 |
| 297 |
| 7,624 |
| 923 |
| 8,847 |
Total residential loans |
| $ — |
| $98 |
| $ — |
| $3 |
| $768 |
| $35,608 |
| $6,302 |
| $42,779 |
|
|
|
|
|
|
|
|
|
|
|
|
|
|
|
|
|
Consumer & Other PCD: |
|
|
|
|
|
|
|
|
|
|
|
|
|
|
|
|
Performing |
| $ — |
| $ — |
| $ — |
| $1 |
| $ — |
| $39 |
| $3 |
| $43 |
Nonperforming |
| — |
| — |
| — |
| — |
| — |
| 16 |
| — |
| 16 |
Total consumer & other loans |
| $ — |
| $ — |
| $ — |
| $1 |
| $ — |
| $55 |
| $3 |
| $59 |
As of December 31, 2019 |
| Residential |
| Consumer |
Performing |
| $2,499,089 |
| $246,387 |
Nonperforming |
| 13,455 |
| 920 |
Total |
| $2,512,544 |
| $247,307 |
Purchased Credit Deteriorated (“PCD”) loans:
Effective January 1, 2020, the Company began accounting for PCD loans pursuant to ASC Topic 326. As such, the following disclosures are no longer applicable for the current period and are only presented for periods prior to the adoption of ASC Topic 326. Prior to the adoption of ASC 326, income was recognized on PCD (formerly PCI) loans pursuant to ASC Topic 310. A portion of the fair value discount was ascribed as an accretable yield that was accreted into interest income over the estimated remaining life of the loans. The remaining non-accretable difference represented cash flows not expected to be collected.
The table below summarizes the total contractually required principal and interest cash payments, management’s estimate of expected total cash payments and carrying value of the loans as of December 31, 2019. Contractually required principal and interest payments were adjusted for estimated prepayments.
|
|
| December 31, 2019 |
Contractually required principal and interest |
|
| $244,189 |
Non-accretable difference |
|
| (46,271) |
Cash flows expected to be collected |
|
| 197,918 |
Accretable yield |
|
| (62,450) |
Carrying value of acquired loans |
|
| 135,468 |
Allowance for credit losses |
|
| (226) |
Carrying value less allowance for credit losses |
|
| $135,242 |
The Company adjusted its estimates of future expected losses, cash flows and renewal assumptions for the three months ended March 31, 2019. These adjustments resulted in an increase in expected cash flows and accretable yield, and a decrease in the non-accretable difference. The Company reclassified $7,199 from non-accretable difference to accretable yield during the three-month period ending March 31, 2019 to reflect its adjusted estimates of future expected cash flows at that time.
32
CenterState Bank Corporation and Subsidiaries
NOTES TO CONDENSED CONSOLIDATED FINANCIAL STATEMENTS (unaudited)
(in thousands of dollars, except per share data)
The table below summarizes the changes in total contractually required principal and interest cash payments, management’s estimate of expected total cash payments and carrying value of the loans during the three-month period ending March 31, 2019.
Activity during the |
|
|
| Effect of |
| income |
| all other |
|
|
three-month period ending March 31, 2019 |
| December 31, 2018 |
| acquisitions |
| accretion |
| adjustments |
| March 31, 2019 |
Contractually required principal and interest |
| $267,815 |
| $ — |
| $ — |
| $(19,572) |
| $248,243 |
Non-accretable difference |
| (38,602) |
| — |
| — |
| 9,737 |
| (28,865) |
Cash flows expected to be collected |
| 229,213 |
| — |
| — |
| (9,835) |
| 219,378 |
Accretable yield |
| (70,242) |
| — |
| 10,140 |
| (9,820) |
| (69,922) |
Carry value of acquired loans |
| $158,971 |
| $ — |
| $10,140 |
| $(19,655) |
| $149,456 |
NOTE 8: Securities sold under agreement to repurchase
The Company enters into borrowing arrangements with our retail business customers by agreements to repurchase (“securities sold under agreements to repurchase”) under which the bank pledges investment securities owned and under its control as collateral against these one-day borrowing arrangements. These short-term borrowings totaled $81,736 at March 31, 2020 compared to $93,141 at December 31, 2019. Repurchase agreements are secured by obligations of U.S. government agencies and municipal securities with fair values of $113,426 and $131,394 at March 31, 2020 and December 31, 2019, respectively. The following table provides additional details for the periods presented.
|
| MBS |
| Municipal |
|
|
As of March 31, 2020 |
| securities |
| securities |
| Total |
Market value of securities pledged |
| $112,973 |
| $453 |
| $113,426 |
Borrowings related to pledged amounts |
| 81,520 |
| 216 |
| 81,736 |
Market value pledged as a % of borrowings |
| 139% |
| 209% |
| 139% |
|
|
|
|
|
|
|
As of December 31, 2019 |
|
|
|
|
|
|
Market value of securities pledged |
| $130,942 |
| $451 |
| $131,394 |
Borrowings related to pledged amounts |
| 92,953 |
| 188 |
| 93,141 |
Market value pledged as a % of borrowings |
| 141% |
| 240% |
| 141% |
Any risk related to these arrangements, primarily market value changes, are minimized due to the overnight (one day) maturity and the additional collateral pledged over the borrowed amounts.
NOTE 9: Business Combinations
Acquisition of National Commerce Corporation
On April 1, 2019, the Company completed its acquisition of NCOM whereby NCOM merged with and into the Company. Pursuant to and simultaneously with the merger of NCOM with and into the Company, NCOM’s wholly owned subsidiary bank, National Bank of Commerce, merged with and into the Company’s subsidiary bank, CenterState Bank, N.A. As a result of that merger, the Bank acquired a controlling 70% interest in CBI, and its factoring subsidiary, Corporate Billing. Effective September 30, 2019, the Company purchased the 30% noncontrolling interest of CBI for $11,400.
The Company’s primary reasons for the transaction were to further expand its franchise into Georgia and Alabama, further solidify its market share in the Florida market and expand its customer base to enhance deposit fee income and leverage operating cost through economies of scale. The acquisition increased the Company’s total assets and total deposits by approximately 36% and 37% as compared with the balances at December 31, 2018 and is expected to positively affect the Company’s operating results to the extent the Company earns more from interest earning assets than it pays in interest on its interest bearing liabilities. During the three-month periods ending March 31, 2020 and 2019, the Company incurred approximately ($25) and $1,264, respectively, of acquisition costs related to this transaction. These acquisition costs are reported in merger and acquisition related expenses on the Company’s Condensed Consolidated Statements of Income and Comprehensive Income.
The acquisition was accounted for under the acquisition method of accounting in accordance with ASC Topic 805, Business Combinations. The Company recognized goodwill on this acquisition of $401,537 which is nondeductible for tax purposes as this acquisition is a nontaxable transaction. The goodwill is calculated based on the fair values of the assets acquired and liabilities assumed as of the acquisition date. Fair value estimates are based on the information available, and are subject to change for up to one year after the closing date of the acquisition as additional information relative to closing date fair values becomes available.
33
CenterState Bank Corporation and Subsidiaries
NOTES TO CONDENSED CONSOLIDATED FINANCIAL STATEMENTS (unaudited)
(in thousands of dollars, except per share data)
The Company acquired 100% of the outstanding common stock of NCOM. The purchase price consisted of stock plus cash in lieu of fractional shares. Each share of NCOM common stock was exchanged for 1.65 shares of the Company’s common stock. Based on the closing price of the Company’s common stock on March 29, 2019, the resulting purchase price was $831,696.
The table below summarizes the purchase price calculation.
Number of shares of NCOM common stock outstanding at March 29, 2019 |
| 21,011,352 |
Per share exchange ratio |
| 1.650 |
Number of shares of CenterState common stock less 763 of fractional shares |
| 34,667,968 |
CenterState common stock price per share on March 29, 2019 |
| $23.81 |
Fair value of CenterState common stock issued |
| $825,444 |
|
|
|
Cash Consideration for 763 of fractional shares |
| $20 |
|
|
|
Total Stock Consideration |
| $825,444 |
Total Cash Consideration |
| 20 |
Total consideration to be paid to NCOM common shareholders |
| $825,464 |
Fair value of NCOM stock options converted to CenterState stock options |
| 5,848 |
Fair value of NCOM warrants converted to CenterState warrants |
| 384 |
Total Purchase Price for NCOM |
| $831,696 |
The list below summarizes the fair value of the assets purchased, including goodwill, and liabilities assumed as of the April 1, 2019 purchase date.
|
| April 1, 2019 |
Assets: |
|
|
Cash and cash equivalents |
| $268,524 |
Loans, held for investment |
| 3,309,234 |
Purchased credit impaired loans |
| 18,616 |
Loans held for sale |
| 14,588 |
Investments |
| 178,488 |
Accrued interest receivable |
| 11,006 |
Branch real estate |
| 61,295 |
Furniture and fixtures |
| 7,204 |
Bank property held for sale |
| 12,436 |
FHLB, FRB and other stock |
| 17,076 |
Bank owned life insurance |
| 55,474 |
Other real estate owned |
| 875 |
Servicing asset |
| 1,581 |
Core deposit intangible |
| 39,900 |
Goodwill |
| 401,537 |
Deferred tax asset |
| 16,285 |
Other assets |
| 23,663 |
Total assets acquired |
| $4,437,782 |
Liabilities: |
|
|
Deposits |
| $3,486,732 |
Securities sold under agreement to repurchase |
| 18,833 |
Subordinated debt |
| 38,802 |
Accrued interest payable |
| 2,095 |
Other liabilities |
| 47,622 |
Noncontrolling interest |
| 12,002 |
Total liabilities assumed and noncontrolling interest |
| $3,606,086 |
34
CenterState Bank Corporation and Subsidiaries
NOTES TO CONDENSED CONSOLIDATED FINANCIAL STATEMENTS (unaudited)
(in thousands of dollars, except per share data)
In the acquisition, the Company acquired $3,327,850 of loans at fair value, net of $61,384, or 1.8%, estimated discount to the outstanding principal balance, representing 39.9% of the Company’s total loans at December 31, 2018. Of the total loans acquired, management identified $18,616 with credit deficiencies. All loans that were on non-accrual status including accruing loans that are 90 days or more past due that should be recognized as non-accrual, all substandard loans or all loans with impaired collateral value including TDRs and all loans under litigation were considered by management to be credit impaired and are accounted for pursuant to ASC Topic 310-30. NaN TDRs were acquired from the NCOM transaction.
The table below summarizes the total contractually required principal and interest cash payments, management’s estimate of expected total cash payments and fair value of the loans as of April 1, 2019 for purchased credit impaired loans. Contractually required principal and interest payments have been adjusted for estimated prepayments.
Contractually required principal and interest |
| $51,527 |
Non-accretable difference |
| (29,187) |
Cash flows expected to be collected |
| 22,340 |
Accretable yield |
| (3,724) |
Total purchased credit-impaired loans acquired |
| $18,616 |
The table below presents information with respect to the fair value of acquired loans, as well as their Book Balance at acquisition date.
|
| Book |
| Fair |
|
| Balance |
| Value |
Loans: |
|
|
|
|
Single family residential real estate |
| $615,296 |
| $608,705 |
Commercial real estate |
| 1,762,480 |
| 1,736,653 |
Construction/development/land |
| 363,005 |
| 358,643 |
Commercial loans |
| 539,698 |
| 536,262 |
Consumer and other loans |
| 70,058 |
| 68,971 |
Purchased credit-impaired |
| 38,697 |
| 18,616 |
Total earning assets |
| $3,389,234 |
| $3,327,850 |
In its assumption of the deposit liabilities, the Company believed the deposits assumed from the acquisition have an intangible value. The Company applied ASC Topic 805, which prescribes the accounting for goodwill and other intangible assets such as core deposit intangibles, in a business combination. The Company determined the estimated fair value of the core deposit intangible asset totaled $39,900, which will be amortized utilizing an accelerated amortization method over an estimated economic life not to exceed ten years. In determining the valuation amount, deposits were analyzed based on factors such as type of deposit, deposit retention, interest rates and age of deposit relationships.
Pro-forma information
Pro-forma data for the three-month period ending March 31, 2019 listed in the table below presents pro-forma information as if the NCOM acquisitions occurred at the beginning of 2019.
|
| Three-month ended March 31, |
|
| 2019 |
Net interest income |
| $163,968 |
Net income available to common shareholders |
| $65,178 |
EPS - basic |
| $0.50 |
EPS - diluted |
| $0.50 |
The disclosures regarding the results of operations for NCOM subsequent to its respective acquisition date are omitted as this information is not practical to obtain. Although the Company did not convert NCOM’s core system until the third quarter of 2019, the majority of the fixed costs and purchase accounting entries were booked on the Company’s core system making it impractical to determine NCOM’s results of operation on a stand-alone basis.
Announcement of Merger of Equals between CenterState and South State Corporation
On January 27, 2020, the Company and South State Corporation (“South State”) announced the execution of an Agreement and Plan of Merger, dated as of January 25, 2020 (the “Merger Agreement”), providing for the merger of the Company and South State, subject to the terms and conditions set forth therein. Under the terms of the Merger Agreement, which was unanimously approved by the Boards of Directors of both companies, the Company’s shareholders will receive 0.3001 shares of South State
35
CenterState Bank Corporation and Subsidiaries
NOTES TO CONDENSED CONSOLIDATED FINANCIAL STATEMENTS (unaudited)
(in thousands of dollars, except per share data)
common stock for each share of CenterState common stock they own. The transaction is expected to close in the third quarter of 2020 subject to customary closing conditions, including receipt of all applicable regulatory approvals and shareholder approval of each company. The Company’s primary reason for the transaction is to create a leading Southeastern-based regional bank, which diversifies each company’s geographies into a contiguous six-state footprint, spanning from Florida to Virginia. The transaction will also expand both companies’ customer base which will enhance deposit fee income and leverage operating cost through economies of scale. The combined company will operate under the South State Bank name and will trade under the South State ticker symbol SSB on the Nasdaq stock market. The company will be headquartered in Winter Haven, Florida and will maintain a significant presence in Columbia and Charleston, South Carolina; Charlotte, North Carolina; and Atlanta, Georgia. South State is a bank holding company headquartered in Columbia, South Carolina. South State’s bank subsidiary South State Bank operates 157 banking locations. South State reported total assets of $16,642,911, total loans of $11,506,890 and total deposits of $12,344,547 as of March 31, 2020.
NOTE 10: Interest Rate Swap Derivatives
Fair Value Hedge
The Company enters into interest rate swaps in order to provide commercial loan clients the ability to swap from variable to fixed interest rates. Under these agreements, the Company enters into a variable rate loan with a client in addition to a swap agreement. This swap agreement effectively converts the client’s variable rate loan into a fixed rate. The Company then enters into a matching swap agreement with a third party dealer in order to offset its exposure on the customer swap. At March 31, 2020 and December 31, 2019, the notional amount of such arrangements were $12,408,888 and $10,596,427, respectively. The Company pledged $550,101 and $140,913 of cash as collateral to the third party dealers at March 31, 2020 and December 31, 2019, respectively. The Company also pledged $605,100 and $361,127 of securities to the third party dealers and clearinghouse exchanges at March 31, 2020 and December 31, 2019, respectively. As the interest rate swaps with the clients and third parties are not designated as hedges under ASC 815, changes in market values are reported in earnings.
Summary information about the interest rate swap derivative instruments is as follows:
|
| March 31, 2020 |
| December 31, 2019 |
Notional amount |
| $12,408,888 |
| $10,596,427 |
Weighted average pay rate on interest-rate swaps |
| 2.70% |
| 3.20% |
Weighted average receive rate on interest rate swaps |
| 2.70% |
| 3.20% |
Weighted average maturity (years) |
| 11 |
| 11 |
Fair value of interest rate swap derivatives (asset) |
| $831,891 |
| $273,068 |
Fair value of interest rate swap derivatives (liability) |
| $833,977 |
| $274,216 |
Cash Flow Hedge
The Company is exposed to certain risks relating to its ongoing business operations. The primary risk managed by using derivative instruments is interest rate risk. Interest rate swaps are utilized to manage interest rate risk associated with the Company's variable rate borrowings entered during the second quarter of 2019. The Company recognizes interest rate swaps as either assets or liabilities at fair value in the Condensed Consolidated Balance Sheets.
The interest rate swap contract entered during the second quarter of 2019 on a variable rate borrowing was designated as a cash flow hedge and was negotiated over the counter. The contract was entered into by the Company with a counterparty and the specific agreement of terms were negotiated, including the amount, interest rate and maturity.
The following table reflects the cash flow hedge included in the Condensed Consolidated Balance Sheets as of March 31, 2020:
|
| March 31, 2020 |
Notional amount |
| $150,000 |
Fair value of interest rate swap derivatives (asset) |
| — |
Fair value of interest rate swap derivatives (liability) |
| 8,474 |
36
CenterState Bank Corporation and Subsidiaries
NOTES TO CONDENSED CONSOLIDATED FINANCIAL STATEMENTS (unaudited)
(in thousands of dollars, except per share data)
The following table presents the net unrealized holding losses recorded in Accumulated Other Comprehensive Income on the Company’s Condensed Consolidated Balance Sheet and Condensed Consolidated Statements of Income and Comprehensive Income relating to the cash flow derivative instrument for the three-month period ended March 31, 2020:
|
| March 31, 2020 | ||||
|
| Amount of |
| Amount of gain / (loss) |
| Location of gain / (loss) |
|
| loss |
| reclassified from OCI |
| reclassified from AOCI |
|
| recognized in OCI |
| to interest income |
| to income |
Interest rate contracts - pay fixed, receive floating |
| $(5,740) |
| $ — |
| Interest expense: Federal funds purchased and other borrowings |
During the three-month ended March 31, 2020, the derivative position designed as a cash flow hedge was not discontinued and 0ne of the losses reported in Accumulated Other Comprehensive Income were reclassified into earnings as a result of the discontinuance of a cash flow hedge or because of the early extinguishment of the borrowing.
NOTE 11: Leases
In February 2016, the FASB established Topic 842, Leases, by issuing Accounting Standards Update (ASU) No. 2016-02, which requires lessees to recognize leases on-balance sheet and disclose key information about leasing arrangements. Subsequently, amendments ASU No. 2018-01, Land Easement Practical Expedient for Transition to Topic 842; ASU No. 2018-10, Codification Improvements to Topic 842, Leases; and ASU No. 2018-11, Targeted Improvements were issued. ASC 842 established a right-of-use (“ROU”) model that requires a lessee to recognize a ROU asset and lease liability on the balance sheet for all leases with a term longer than 12 months. Leases are classified as finance or operating, with classification affecting the pattern and classification of expense recognition in the income statement.
ASC 842 was effective on January 1, 2019. The Company leases certain properties and equipment under operating leases that resulted in the recognition of ROU Lease Assets of $20,311 and Lease Liabilities of $22,795 on the Company’s Condensed Consolidated Balance Sheets. The one-time transition impact to retained earnings from measurement differences was approximately $1,093 as disclosed on the Company’s Condensed Consolidated Statements of Changes in Stockholders’ Equity.
ASC 842 provides a number of optional practical expedients in transition. The Company elected the ‘package of practical expedients,’ which permits the Company not to reassess under the new standard the prior conclusions about lease identification, lease classification and initial direct costs. The Company also elected the use of the hindsight, a practical expedient which permits the use of information available after lease inception to determine the lease term via the knowledge of renewal options exercised not available as of the leases inception. The practical expedient pertaining to land easements was not applicable to the Company.
ASC 842 also requires certain accounting elections for ongoing application of ASC 842. The Company elected the short-term lease recognition exemption for all leases that qualify, meaning those with terms under twelve months. ROU assets or lease liabilities are not to be recognized for short-term leases. However, since all real estate and equipment leases have terms greater than 12 months, no leases currently meet this exemption. The Company also elected the practical expedient to not separate lease and non-lease components for all leases, the majority of which consist of real estate common area maintenance expenses. However, since these non-lease items are subject to change, they are treated and disclosed as variable payments in the quantitative disclosures below.
Lessee Leases
The majority of the Company’s lessee leases are operating leases, and consist of leased real estate for branches and operations centers. Options to extend and renew leases are generally exercised under normal circumstances. Advance notification is required prior to termination, and any noticing period is often limited to the months prior to renewal. Variable payments generally consist of common area maintenance and taxes. Rent escalations are generally specified by a payment schedule, or are subject to a defined formula. The Company also elected the practical expedient to not separate lease and non-lease components for all leases, the majority of which consist of real estate common area maintenance expenses. Generally, leases do not include guaranteed residual values, but instead typically specify that the leased premises are to be returned in satisfactory condition with the Company liable for damages. The Company also has other operating leases for various equipment, including copiers, printers, and other small equipment. Equipment lease terms and conditions generally specify a fixed amount and term with options to renew. The Company’s equipment leases are typically not renewed, and existing leases are typically assumed from prior bank acquisitions.
37
CenterState Bank Corporation and Subsidiaries
NOTES TO CONDENSED CONSOLIDATED FINANCIAL STATEMENTS (unaudited)
(in thousands of dollars, except per share data)
For operating leases, the lease liability and ROU asset (before adjustments) are recorded at the present value of future lease payments. ASC 842 requires the use of the lease interest rate; however, this rate is typically not known. As an alternative, ASC 842 permits the use of an entity’s fully secured incremental borrowing rate. The Company is electing to utilize the FHLB Atlanta Fixed Rate Advance index, as it is the most actively used institution-specific collateralized borrowing source available to the Company.
The Company also holds a small number of finance leases assumed in connection to prior acquisitions. These leases are all real estate leases. Terms and conditions are similar to those real estate operating leases described above, but the lease terms are generally longer. Lease classifications from the acquired institution were retained, and were again retained as a result of the election of the package of practical expedients described above.
|
| Three-month periods ended | ||
|
| March 31, 2020 |
| March 31, 2019 |
Amortization of ROU Assets - Finance Leases |
| $55 |
| $38 |
Interest on Lease Liabilities - Finance Leases |
| 72 |
| 50 |
Operating Lease Cost (Cost resulting from lease payments) |
| 2,141 |
| 1,287 |
Short-term Lease Cost |
| 1 |
| — |
Variable Lease Cost (Cost excluded from lease payments) |
| 296 |
| 235 |
Total Lease Cost |
| $2,565 |
| $1,610 |
Finance Lease - Operating Cash Flows |
| 65 |
| 57 |
Finance Lease - Financing Cash Flows |
| 78 |
| 91 |
Operating Lease - Operating Cash Flows (Fixed Payments) |
| 2,191 |
| 1,241 |
Operating Lease - Operating Cash Flows (Liability Reduction) |
| 3,974 |
| 1,181 |
New ROU Assets - Operating Leases |
| 4,749 |
| 21,351 |
Weighted Average Lease Term (Years) - Finance Leases |
| 10.64 |
| 19.22 |
Weighted Average Lease Term (Years) - Operating Leases |
| 6.59 |
| 7.65 |
Weighted Average Discount Rate - Finance Leases |
| 5.83% |
| 5.95% |
Weighted Average Discount Rate - Operating Leases |
| 3.25% |
| 3.65% |
A maturity analysis of operating lease liabilities and reconciliation of the undiscounted cash flows to the total operating lease liabilities as of March 31, 2020 is as follows:
|
| March 31, 2020 |
Operating lease payments due: |
|
|
Within one year |
| $8,380 |
After one but within two years |
| 7,165 |
After two but within three years |
| 5,667 |
After three but within four years |
| 4,823 |
After four years but within five years |
| 3,932 |
After five years |
| 9,401 |
Total undiscounted cash flows |
| 39,368 |
Discount on cash flows |
| (4,200) |
Total operating lease liabilities |
| $35,168 |
The following is a schedule of future minimum annual rentals under operating leases as of December 31, 2019:
|
| December 31, 2019 |
Operating lease payments due: |
|
|
Within one year |
| $7,577 |
After one but within two years |
| 6,693 |
After two but within three years |
| 5,358 |
After three but within four years |
| 4,419 |
After four years but within five years |
| 3,723 |
After five years |
| 11,410 |
Total undiscounted cash flows |
| 39,180 |
Discount on cash flows |
| (4,695) |
Total operating lease liabilities |
| $34,485 |
38
CenterState Bank Corporation and Subsidiaries
NOTES TO CONDENSED CONSOLIDATED FINANCIAL STATEMENTS (unaudited)
(in thousands of dollars, except per share data)
Lessor Leases
ASC 842 also impacted lessor accounting. ASC 842 changed the criteria in which a lessor lease is classified. A lease is a sales-type lease if any one of five criteria are met, each of which indicate that the lease, in effect, transfers control of the underlying asset to the lessee. If none of those five criteria are met, but two additional criteria are both met, indicating that the lessor has transferred substantially all the risks and benefits of the underlying asset to the lessee and a third party, the lease is a direct financing lease. All leases that are not sales-type or direct financing leases are operating leases.
Similar to the above lessee leases, the Company elected the ‘package of practical expedients,’ which allows the Company not to reassess the Company’s prior conclusions under ASC 842 about lease identification, lease classification and initial direct costs. The Company also elected the use of the hindsight, a practical expedient which permits the use of information available after lease inception to determine the lease term via the knowledge of renewal options exercised not available as of the leases inception. Lastly, the practical expedient pertaining to land easements is not applicable to the Company.
While ASC 842 identifies common area building maintenance as a non-lease component of our real estate lease contracts, the Company elected to account for the Company’s real estate leases and associated common area maintenance service components as a single, combined operating lease component. Consequently, ASC 842’s changed guidance on contract components did not significantly affect financial reporting.
Substantially, all of the Company’s lessor leases are related to unused real estate office space owned by the Company. Most have defined terms, though some leases have gone month-to-month once the initial term has passed. The impact of subleases was not material. Income from operating leases are reported within Occupancy Expense as an offset to Non-interest Expense in the Company’s Condensed Consolidated Statements of Income and Comprehensive Income.
The Company is also the lessor on a few equipment direct finance leases (formerly known as capital leases) with three municipal entities. Interest income from these leases are tax exempt, and is reported within loan interest income. The lessee retains the title to all equipment in each of these finance leases. Each of these leases originated in 2018, and therefore the prior ASC 840 classification was not reassessed due to the election of the package of practical expedients.
|
| Three-month periods ended | ||
|
| March 31, 2020 |
| March 31, 2019 |
Operating Lease Income from Lease Payments |
| $476 |
| $212 |
Direct Financing Lease Income |
| 25 |
| 173 |
Total Lease Income |
| $501 |
| $385 |
|
|
|
|
|
Net Investment in Direct Financing Leases |
| $1,167 |
| $15,785 |
Unguaranteed Residual Assets |
| — |
| — |
Deferred Selling Profit on Direct Financing Leases |
| — |
| — |
|
|
|
|
|
Maturity Analysis of Operating Lease Receivables |
|
|
|
|
0 - 12 Months |
| $2,089 |
| $962 |
13 - 24 Months |
| 1,609 |
| 551 |
25 - 36 Months |
| 710 |
| 341 |
37 - 48 Months |
| 124 |
| 166 |
48 - 60 Months |
| — |
| 6 |
Over 60 Months |
| — |
| — |
|
|
|
|
|
Maturity Analysis of Finance Lease Receivables |
|
|
|
|
0 - 12 Months |
| $912 |
| $1,392 |
13 - 24 Months |
| 251 |
| 1,841 |
25 - 36 Months |
| — |
| 1,618 |
37 - 48 Months |
| — |
| 1,356 |
48 - 60 Months |
| — |
| 1,355 |
Over 60 Months |
| — |
| 12,543 |
39
CenterState Bank Corporation and Subsidiaries
NOTES TO CONDENSED CONSOLIDATED FINANCIAL STATEMENTS (unaudited)
(in thousands of dollars, except per share data)
NOTE 12: Recently Issued Accounting Standards
Adoption of ASU 2016-13:
On January 1, 2020, The Company adopted ASU 2016-13 Financial Instruments - Credit Losses (Topic 326): Measurement of Credit Losses on Financial Instruments, which replaces the incurred loss methodology with an expected loss methodology that is referred to as the current expected credit loss (“CECL”) methodology. The measurement of expected credit losses under the CECL methodology is applicable to financial assets measured at amortized cost, including loan receivables and held to maturity debt securities. It also applies to Off-Balance Sheet (“OBS”) credit exposures not accounted for as insurance (loan commitments, standby letters of credit, financial guarantees, and other similar instruments) and net investments and leases recognized by a lessor in accordance with Topic 842 on leases. In addition, ASC 326 made changes to the accounting for available for sale debt securities. One such change is to require credit losses to be presented as an allowance rather than as a write down on available for sale debt securities management does not intend to sell or believes that it is more likely than not they will be required to sell.
The Company adopted ASC 326 using the modified retrospective method for all financial assets measured at amortized cost and OBS credit exposures. Results for periods reporting beginning after and January 1, 2020 are presented under ASC 326 while prior period amounts continue to be reported in accordance with previously applicable GAAP. The January 1, 2020 transition to ASC 326 required an increase of $74,608 to the ACL, including a reclassification of $17,004 from loan discount to allowance for credit losses due to the transition of its PCI loans to PCD loans. This reclassification from loan discount to ACL for PCD loans did not impact retained earnings. The post-transition CECL Method ACL is $115,270 compared to the December 31, 2019 Incurred Loss Method ALLL of $40,652. CECL requires a Company to consider a credit reserve on HTM securities; however, the strong credit quality of the portfolio resulted in a minimal ACL of $10. CECL requires a Company to consider a reserve for unfunded commitments and to record this exposure as a liability separate from the ACL. Upon adoption of ASC 326, the Company recorded a $6,084 reserve for unfunded commitments. The increase to the ACL for loans, excluding the reclassification of loan discount for PCD loans, plus the reserve for unfunded commitments and allowance for credit losses for HTM debt securities resulted in a reduction to retained earnings of $47,751, net of $15,947 for deferred taxes.
The Company adopted ASC 326 using the prospective transition approach for PCD financial assets that were previously classified as PCI and accounted for under ASC 310-30. In accordance with the standard, management did not reassess whether PCI assets met the criteria of PCD assets as of the date of adoption. On January 1, 2020, the amortized cost basis of the PCD assets were adjusted to reflect the addition of $17,230 of the ACL. The remaining non-credit discount for PCD loans was allocated to each individual PCD loans and will be accreted into interest income at the effective interest rate as of January 1, 2020.
As allowed by ASC 326, the Company elected to maintain pools of loans accounted for under ASC 310-30 for ACL purposes. CECL does not provide for the PCD pool accounting due to individual allocation of the non-credit-related discount, but does allow for the maintenance of existing pools upon the transition from PCI to PCD for ACL purposes. The Company elected to retain these pools, and consolidated them into ten pools of similar risk characteristics consistent with those segments and sub-segments of non-PCD loans. PCD loans may also be individually analyzed in a manner comparable to non-PCD loans with significant deterioration. In accordance with the standard, management did not reassess whether modifications to individual acquired financial assets accounted for in pools were troubled debt restructurings as of the date of adoption. The principal balance of pooled PCD loans for ACL purposes totaled $170,921, and the principal balance for individually analyzed PCD loans totaled $31,380 as of January 1, 2020.
40
CenterState Bank Corporation and Subsidiaries
NOTES TO CONDENSED CONSOLIDATED FINANCIAL STATEMENTS (unaudited)
(in thousands of dollars, except per share data)
The following table illustrates the impact of ASC 326.
|
| January 1, 2020 | ||||
|
| As reported under ASC 326 |
| Pre-ASC 326 adoption |
| Impact of ASC 326 adoption |
Assets: |
|
|
|
|
|
|
Allowance for credit losses on |
|
|
|
|
|
|
debt securities held to maturity |
|
|
|
|
|
|
Mortgage-backed |
| $ — |
| $ — |
| $ — |
Municipal |
| 10 |
| — |
| 10 |
Loans non-PCD |
|
|
|
|
|
|
Residential |
| $15,669 |
| $4,257 |
| $11,412 |
Commercial |
| 54,148 |
| 18,552 |
| 35,596 |
Construction & land development |
| 9,251 |
| 2,319 |
| 6,932 |
Comm., industrial & factored receivables |
| 14,277 |
| 11,282 |
| 2,995 |
Consumer & other |
| 4,688 |
| 4,019 |
| 669 |
Loans PCD |
|
|
|
|
|
|
Residential |
| $3,021 |
| $ — |
| $3,021 |
Commercial |
| 11,966 |
| — |
| 11,966 |
Construction & land development |
| 256 |
| 177 |
| 79 |
Commercial & industrial |
| 1,924 |
| — |
| 1,924 |
Factored commercial receivables |
| — |
| — |
| — |
Consumer & other |
| 63 |
| 49 |
| 14 |
|
|
|
|
|
|
|
Liabilities: |
|
|
|
|
|
|
Allowance for credit losses |
|
|
|
|
|
|
on OBS exposures |
| $6,084 |
| $ — |
| $6,084 |
Debt Securities
Allowance for Credit Losses - Available for Sale Debt Securities: For available-for-sale debt securities in an unrealized loss position, the Company first assesses whether or not it intends to sell, or it is more likely than not that it will be required to sell the security before recovery of its amortized cost basis. If either of the criteria regarding intent or requirement to sell is met, the securities amortized cost basis is written down to fair value through income. For available-for-sale debt securities that do not meet the aforementioned criteria, the Company evaluates whether the decline in fair value has resulted from credit losses or other factors. In making this assessment, management considers the extent to which fair value is less than amortized cost, any changes to the rating of the security by a rating agency, and adverse conditions specifically related to the security, among other factors. If this assessment indicates that a credit loss exists, the present value of the cash flows expected to be collected from the security are compared to the amortized cost basis of the security. If the present value of cash flows expected to be collected are less than the amortized cost basis, a credit loss exists and an allowance for credit losses is recorded for the credit loss, limited by the amount that the fair value is less than the amortized cost basis. Any impairment that has not been recorded through an allowance for credit losses is recognized in other comprehensive income.
Changes in the allowance for credit losses are recorded as provisions for or reversal of credit loss expense. Losses are charged against the allowance when management believes an available-for-sale security is uncollectible or when either of the criteria regarding intent to sell or required to sell is met.
Accrued interest receivable on available-for-sale debt securities totaled $6,058 as of March 31, 2020 and is excluded from the estimate of credit losses.
Allowance for Credit Losses – Held to Maturity Debt Securities: Management measures expected credit losses on held-to-maturity debt securities on a collective basis by major security type. Accrued interest receivable on held-to-maturity debt securities totaled $1,536 and is excluded from the estimate of credit losses.
The estimate of expected credit losses considers historical credit loss information that is adjusted for current conditions and reasonable and supportable forecasts. Management classifies the held-to-maturity portfolio into the following major security types: Mortgage-backed and municipal.
41
CenterState Bank Corporation and Subsidiaries
NOTES TO CONDENSED CONSOLIDATED FINANCIAL STATEMENTS (unaudited)
(in thousands of dollars, except per share data)
All of the mortgage-backed securities held by the Company are issued by US government entities and agencies. The securities are either explicitly or implicitly guaranteed by the US government, and are highly rated by major rating agencies and have a long history of no credit losses. After reviewing the portfolio and the potential for loss, management determined no allowance for credit losses is required.
Other securities are comprised primarily of investments in municipal bonds. Management utilizes historical research conducted by Moody’s Investor Services to determine expected credit losses, particularly default and recovery from 2009 to 2018. Using the more recent data captures the aforementioned emerging risks in public finance. After reviewing the portfolio and the potential for loss, management determined a $10 in allowance for credit losses on adoption date.
Loans
Loans that management has the intent and ability to hold for the foreseeable future or until maturity or payoff are reported at their outstanding unpaid principal balance net of purchase premiums and discounts, deferred loan fees and costs, and an allowance for credit losses. Interest income is accrued on the unpaid principal balance. The recorded investment in a loan excludes accrued interest receivable, deferred fees, and deferred costs because they are not considered material.
Loan segment risks:
Residential, Commercial, and Other Real Estate: A significant portion of our loan portfolio is secured by real estate, a substantial majority of which is located in Florida, and events that negatively impact the real estate market could hurt our resultant business. A substantial majority of our loans are concentrated in Florida and subject to the volatility of the state’s economy and real estate market. With our loans concentrated in Florida, declines in local economic conditions will adversely affect the values of our real estate collateral. Consequently, a decline in local economic conditions may have a greater effect on our earnings and capital than on the earnings and capital of other financial institutions whose real estate loan portfolios are more geographically diverse.
In addition to relying on the financial strength and cash flow characteristics of the borrower in each case, we often secure loans with real estate collateral. The real estate collateral in each case provides an alternate source of repayment in the event of default by the borrower but may deteriorate in value during the time credit is extended. If we are required to liquidate the collateral securing a loan to satisfy the debt during a period of reduced real estate values, our earnings and capital could be adversely affected.
Commercial and Commercial Real Estate: Commercial and commercial real estate loans generally carry larger loan balances and can involve a greater degree of financial and credit risk than other loans. The increased financial and credit risk associated with these types of loans are a result of several factors, including the concentration of principal in a limited number of loans and borrowers, the size of loan balances, the effects of general economic conditions on income-producing properties and the increased difficulty of evaluating and monitoring these types of loans.
Furthermore, the repayment of loans secured by commercial real estate is typically dependent upon the successful operation of the related real estate or commercial project. If the cash flows from the project are reduced, a borrower’s ability to repay the loan may be impaired. This cash flow shortage may result in the failure to make loan payments. In such cases, we may be compelled to modify the terms of the loan. In addition, the nature of these loans is such that they are generally less predictable and more difficult to evaluate and monitor. As a result, repayment of these loans may, to a greater extent than residential loans, be subject to adverse conditions in the real estate market or economy.
Commercial Receivables Factoring: The Company provides receivables factoring through its subsidiary for a variety of industries, the largest portfolio segments remain in the Oil and Gas, Truck and Freight, and Parts and Services sectors. These are dependent on the cash flow from these receivables from these industries which are exposed to volatility in demand and freight costs. Economic disruptions in demand, labor, or costs in these industries may adversely impact collectability of these loans.
Consumer and all other loans: While disclosed as a separate portfolio segment, many of the same events that negatively impact the real estate and commercial market could have a similar direct risk to consumer loans. While the borrower or collateral are for consumer loans, the employment and cash flow from these borrowers are similarly exposed to risk of declines in local economic conditions. Consequently, a decline in local economic conditions may have a greater effect on these loans.
A loan is considered a troubled debt restructured loan based on individual facts and circumstances. A modification may include either an increase or reduction in interest rate or deferral of principal payments or both. Loans for which the terms have been modified resulting in a concession, and for which the borrower is experiencing financial difficulties, are considered troubled debt restructurings. The Company classifies troubled debt restructured loans as impaired and evaluates the need for an allowance for credit losses on a loan-by-loan basis. An allowance for credit losses is based on either the present value of estimated future cash flows or the estimated fair value of the underlying collateral. Loans retain their accruing or non-accruing status at the time of modification.
42
CenterState Bank Corporation and Subsidiaries
NOTES TO CONDENSED CONSOLIDATED FINANCIAL STATEMENTS (unaudited)
(in thousands of dollars, except per share data)
Loan origination fees and the incremental direct cost of loan origination, are deferred and recognized in interest income without anticipating prepayments over the contractual life of the loans. If the loan is prepaid, the remaining unamortized fees and costs are charged or credited to interest income. Amortization ceases for non-accrual loans.
Determining the contractual term: Expected credit losses are estimated over the contractual term of the loans, adjusted for expected prepayments when appropriate. The contractual term excludes expected extensions, renewals, and modifications unless either of the following applies: management has a reasonable expectation at the reporting date that a troubled debt restructuring will be executed with an individual borrower or the extension or renewal options are included in the original or modified contract at the reporting date and are not unconditionally cancellable by the Company.
Nonaccrual loans: A loan is moved to non-accrual status in accordance with the Company’s policy typically after 90 days of non-payment, or less than 90 days of non-payment if management determines that the full timely collection of principal and interest becomes doubtful. For CBI’s factored receivables, which are commercial trade credits rather than promissory notes, the Company’s practice, in most cases, is to charge-off unpaid recourse receivables when they become 90 days past due from the invoice due date and the non-recourse receivables when they become 120 days past due from the statement billing date. Past due status is based on the contractual terms of the loan. Past due status is based on the contractual terms of the loan. In all cases, loans are placed on non-accrual or charged-off at an earlier date if collection of principal or interest is considered doubtful. Non-accrual loans and loans past due 90 days still on accrual include both smaller balance homogeneous loans that are collectively evaluated for impairment and individually classified impaired loans. Single family home loans, consumer loans and smaller commercial, land, development and construction loans (less than $500) are monitored by payment history, and as such, past due payments is generally the triggering mechanism to determine non-accrual status. Larger (greater than $500) commercial, land, development and construction loans are monitored on a loan level basis, and therefore in these cases it is more likely that a loan may be placed on non-accrual status before it becomes 90 days past due.
All interest accrued but not received for loans placed on non-accrual is reversed against interest income. Interest received on such loans is accounted for on the cash-basis or cost-recovery method, until qualifying for return to accrual. Loans are returned to accrual status when all the principal and interest amounts contractually due are brought current and future payments are reasonably assured. Non real estate consumer loans are typically charged off no later than 120 days past due.
The Company, considering current information and events regarding the borrower’s ability to repay their obligations, considers a loan to be impaired when it is probable that the Company will be unable to collect all amounts due according to the contractual terms of the loan agreement. When a loan is considered to be impaired, the amount of the impairment is measured based on the present value of expected future cash flows discounted at the loan’s effective interest rate, the secondary market value of the loan, or the fair value of the collateral for collateral dependent loans. Interest income on impaired loans is recognized in accordance with the Company’s non-accrual policy. Impaired loans are written down to the extent that principal is judged to be uncollectible and, in the case of impaired collateral dependent loans where repayment is expected to be provided solely by the underlying collateral and there is no other available and reliable sources of repayment, are written down to the lower of cost or collateral value less estimated selling costs. Impairment losses are included in the allowance for credit losses. Large groups of smaller balance homogeneous loans, such as consumer and residential real estate loans, are collectively evaluated for impairment, and accordingly, they are not separately identified for impairment disclosures.
Troubled Debt Restructurings: A loan for which the terms have been modified resulting in a concession, and for which the borrower is experiencing financial difficulties, is considered to be a TDR. In certain circumstances, it may be beneficial to modify or restructure the terms of a loan and work with the borrower for the benefit of both parties, versus forcing the property into foreclosure and having to dispose of it in an unfavorable real estate market. When the Company modifies the terms of a loan, it usually either reduces the monthly payment and/or interest rate for generally twelve to twenty-four months. The Company has not forgiven any material principal amounts on any loan modifications to date. The Company has $11,863 of TDRs. Of this amount $7,215 are performing pursuant to their modified terms, and $4,648 are not performing and have been placed on non-accrual status and included in our non-performing loans (“NPLs”).
Purchased Credit Deteriorated (“PCD”) Loans: The Company has purchased loans, some of which have experienced more than insignificant credit deterioration since origination. Examples of PCD loans generally include loans on non-accrual status, loans with insufficient cash flow, loans that are delinquent, loans with high loan-to-value ratios, loans in process of foreclosure or any TDR with loss potential in accordance with guidance outlined in ASC 310-30. PCD loans are recorded at the amount paid. An allowance for credit losses is determined using the same methodology as other loans held for investment.
43
CenterState Bank Corporation and Subsidiaries
NOTES TO CONDENSED CONSOLIDATED FINANCIAL STATEMENTS (unaudited)
(in thousands of dollars, except per share data)
Upon adoption of ASC Topic 326, the ACL for PCD loans, except for PCD loans individually evaluated for impairment, is measured on a collective pool basis when similar risk characteristics exist. On adoption date, the credit discount on PCD loans was reclassified from loan discount to ACL, thereby establishing a new amortized cost basis. The difference between the unpaid principal balance of the pool and the new amortized cost basis on adoption date was non-credit discount and was subsequently allocated to each individual loan. This non-credit discount will be amortized into interest income using the effective yield method over the remaining life of the individual loans. Changes to the allowance for credit losses after adoption are recorded through provision for credit losses.
Allowance for Credit Losses – Loans: The allowance for credit losses is a valuation account that is deducted from or added to the loans amortized cost basis to present the net amount expected to be collected on the loans. Loans are charged off against the allowance when management believes a loan is uncollectible. Expected recoveries do not exceed the aggregate of amounts previously charged off and expected to be charged off.
Management estimates the allowance balance using relevant available information, from internal and external sources, relating to past events, current conditions, and reasonable and supportable forecasts. Peer credit loss experience provides the basis for the estimation of expected credit losses. Given the Company’s size, complexity, and acquisitive history, loan-level loss data is not readily available to develop reasonable and supportable loss estimates. Rather, the Company is relying on peer data from Call Reports to develop models that forecast a periodic default rate for each of the portfolio segments.
Adjustments to historical loss information and reversion periods are made for differences in current loan specific risk characteristics such as differences in underwriting standards, portfolio mix, delinquency level, or term as well as for changes in environmental conditions, such as changes in unemployment rates, property values, the national home price index, and other factors. The Company generally utilizes a four-quarter forecast with a four-quarter reversion period.
The allowance for credit losses is measured on a collective pool basis when similar risk characteristics exist. The company has identified the following portfolio segments: residential loans, commercial real estate loans, construction and land development loans, commercial and industrial and consumer and other.
Loans that do not share risk characteristics are evaluated on an individual basis. Loans evaluated individually are not also included in the collective evaluation. When management determines that foreclosure is probable expected credit losses are based on the fair value of the collateral at the reporting date, adjusted for selling costs as appropriate.
Reserve for unfunded commitments: The company estimates expected credit losses over the contractual period in which the company is exposed to credit risk via a contractual obligation to extend credit, unless that obligation is unconditionally cancelable by the Company. The allowance for credit losses on off balance sheet credit exposures is adjusted as a provision for credit loss expense. The estimate includes consideration of the likelihood that funding will occur and an estimate of expected credit losses on commitments expected to be funded over its estimated life. Expected credit losses are determined using historical funding rates by loan segment.
Other new accounting pronouncements
In January 2017, the FASB issued ASU No. 2017-04, “Simplifying the Test for Goodwill Impairment,” to simplify how an entity is required to test goodwill for impairment by eliminating Step 2 from the goodwill impairment test. Step 2 measures a goodwill impairment loss by comparing the implied fair value of a reporting unit’s goodwill with the carrying amount of that goodwill. In computing the implied fair value of goodwill under Step 2, an entity had to perform procedures to determine the fair value at the impairment testing date of its assets and liabilities (including unrecognized assets and liabilities) following the procedure that would be required in determining the fair value of assets acquired and liabilities assumed in a business combination. Instead, under the amendments in this update, an entity should perform its annual, or interim, goodwill impairment test by comparing the fair value of a reporting unit with its carrying amount. An entity should recognize an impairment charge for the amount by which the carrying amount exceeds the reporting unit’s fair value; however, the loss recognized should not exceed the total amount of goodwill allocated to that reporting unit. Additionally, an entity should consider income tax effects from any tax deductible goodwill on the carrying amount of the reporting unit when measuring the goodwill impairment loss, if applicable. FASB also eliminated the requirements for any reporting unit with a zero or negative carrying amount to perform a qualitative assessment and, if it fails that qualitative test, to perform Step 2 of the goodwill impairment test. Therefore, the same impairment assessment applies to all reporting units. An entity is required to disclose the amount of goodwill allocated to each reporting unit with a zero or negative carrying amount of net assets. An entity still has the option to perform the qualitative assessment for a reporting unit to determine if the quantitative impairment test is necessary. The amendments in this update become effective for annual periods and interim periods within those annual periods beginning after December 15, 2019. The Company adopted the new accounting guidance effective January 1, 2020, but it did not have a material impact on the consolidated financial statements.
44
CenterState Bank Corporation and Subsidiaries
NOTES TO CONDENSED CONSOLIDATED FINANCIAL STATEMENTS (unaudited)
(in thousands of dollars, except per share data)
In August 2018, the FASB issued ASU No. 2018-13, “Fair Value Measurement (Topic 820) - Changes to the Disclosure Requirements for Fair Value Measurement,” to modify the disclosure requirements on fair value measurements in Topic 820 based on the concepts in the Concepts Statement, including the consideration of costs and benefits. The following disclosure requirements were removed from Topic 820: (1) the amount of and reasons for transfers between Level 1 and Level 2 of the fair value hierarchy; (2) the policy for timing of transfers between levels; (3) the valuation processes for Level 3 fair value measurements; and (4) for nonpublic entities, the changes in unrealized gains and losses for the period included in earnings for recurring Level 3 fair value measurements held at the end of the reporting period. The following disclosure requirements were modified in Topic 820: (1) in lieu of a rollforward for Level 3 fair value measurements, a nonpublic entity is required to disclose transfers into and out of Level 3 of the fair value hierarchy and purchases and issues of Level 3 assets and liabilities; (2) for investments in certain entities that calculate net asset value, an entity is required to disclose the timing of liquidation of an investee’s assets and the date when restrictions from redemption might lapse only if the investee has communicated the timing to the entity or announced the timing publicly; and (3) the amendments clarify that the measurement uncertainty disclosure is to communicate information about the uncertainty in measurement as of the reporting date. The following disclosure requirements were added to Topic 820: (1) the changes in unrealized gains and losses for the period included in other comprehensive income for recurring Level 3 fair value measurements held at the end of the reporting period; (2) the range and weighted average of significant unobservable inputs used to develop Level 3 fair value measurements. For certain unobservable inputs, an entity may disclose other quantitative information (such as the median or arithmetic average) in lieu of the weighted average if the entity determines that other quantitative information would be a more reasonable and rational method to reflect the distribution of unobservable inputs used to develop Level 3 fair value measurements. The amendments in this update are effective for annual periods and interim periods within those annual periods beginning after December 15, 2019. The amendments on changes in unrealized gains and losses, the range and weighted average of significant unobservable inputs used to develop Level 3 fair value measurements, and the narrative description of measurement uncertainty should be applied prospectively for only the most recent interim or annual period presented in the initial fiscal year of adoption. All other amendments should be applied retrospectively to all periods presented upon their effective date. Early adoption is permitted upon issuance of this update. An entity is permitted to early adopt any removed or modified disclosures upon issuance of this update and delay adoption of the additional disclosures until their effective date. The Company adopted the new accounting guidance effective January 1, 2020, but it did not have a material impact on the consolidated financial statements.
In March 2020, the FASB has issued Accounting Standards Update (ASU) No. 2020-04, Reference Rate Reform (Topic 848): Facilitation of the Effects of Reference Rate Reform on Financial Reporting, to provide optional guidance, for a limited time, to ease the potential burden in accounting for or recognizing the effects of reference rate reform on financial reporting. By way of background, as a response to concerns about structural risks of interbank offered rates (IBORs) and, particularly, the risk that the London Interbank Offer Rate (LIBOR) will no longer be used, regulators around the world have begun reference rate reform initiatives to identify alternative reference rates that are more observable or transaction-based and less susceptible to manipulation. Stakeholders raised certain operational challenges likely to arise in accounting for contract modifications and hedge accounting due to reference rate reform. Some of those challenges relate to the significant volume of contracts and other arrangements that will need to be modified to replace references to discontinued rates with references to the replacement rates. For accounting purposes, such contract modifications are required to be evaluated in determining whether the modifications result in the establishment of new contracts or the continuation of existing contracts, which could prove quite costly and burdensome and undermine the intended continuation of such contracts and arrangements. Stakeholders also noted that the inability to apply hedge accounting because of reference rate reform would result in financial reporting outcomes that do not reflect entities' intended hedging strategies. The amendments, which are elective and apply to all entities, provide expedients and exceptions for applying U.S. GAAP to contract modifications and hedging relationships affected by reference rate reform if certain criteria are met. The amendments apply only to contracts and hedging relationships that reference LIBOR or another reference rate that is expected to be discontinued due to reference rate reform. The optional expedients for contract modifications apply consistently for all contracts or transactions within the relevant Codification Topic, Subtopic, or Industry Subtopic that contains the guidance that otherwise would be required to be applied, while those for hedging relationships can be elected on an individual hedging relationship basis. Because the guidance is intended to assist stakeholders during the global market-wide reference rate transition period, it is in effect for a limited time, from March 12, 2020, through December 31, 2022. The Company established a LIBOR Committee and is currently evaluating the impact of adopting ASU 2020-04 on the consolidated financial statements.
45
CenterState Bank Corporation and Subsidiaries
NOTES TO CONDENSED CONSOLIDATED FINANCIAL STATEMENTS (unaudited)
(in thousands of dollars, except per share data)
NOTE 13: Subsequent Events
On March 11, 2020, the World Health Organization declared the outbreak of COVID-19 as a global pandemic, which continues to spread throughout the United States and around the world. The COVID-19 pandemic has adversely affected, and may continue to adversely affect economic activity globally, nationally and locally. Actions taken around the world to help mitigate the spread of COVID-19 include restrictions on travel, quarantines in certain areas, and forced closures for certain types of public places and businesses. COVID-19 and actions taken to mitigate the spread of it have had and are expected to continue to have an adverse impact on the economies and financial markets of many countries, including the geographical area in which the Company operates. Due to the COVID-19 pandemic, market interest rates have declined significantly, with the 10-year Treasury bond falling below 1.00 percent on March 3, 2020 for the first time. Such events also may adversely affect business and consumer confidence, generally, and the Company and its customers, and their respective suppliers, vendors and processors, may be adversely affected. On March 3, 2020, the Federal Open Market Committee reduced the targeted federal funds interest rate range by 50 basis points to 1.00 percent to 1.25 percent. This range was further reduced to 0 percent to 0.25 percent on March 16, 2020. These reductions in interest rates and other effects of the COVID-19 pandemic may adversely affect the Company's financial condition and results of operations in future periods. It is unknown how long the adverse conditions associated with the COVID-19 pandemic will last and what the complete financial effect will be to the Company. It is reasonably possible that estimates made in the financial statements could be materially and adversely impacted in the near term as a result of these conditions, including expected credit losses on loans and the fair value of financial instruments that are carried at fair value. On March 27, 2020, the Coronavirus Aid, Relief, and Economic Security Act (CARES Act) was enacted to, among other provisions, provide emergency assistance for individuals, families and businesses affected by the COVID-19 pandemic.
On March 27, 2020, the Coronavirus Aid, Relief and Economic Security (CARES) Act was enacted. The CARES Act, among other things, temporarily adds a new product, titled the “Paycheck Protection Program, (“PPP”)” to the U.S. Small Business Administration’s (SBA’s) 7(a) Loan Program. The CARES Act provides for forgiveness of up to the full principal amount of qualifying loans guaranteed under the PPP. The PPP and loan forgiveness are intended to provide economic relief to small businesses nationwide adversely impacted under the Coronavirus Disease 2019 (COVID-19) Emergency Declaration issued on March 13, 2020. As a result, the Company generated over 8,900 PPP loans for a total loan amount of approximately $1.3 billion in the SBA system through April 28, 2020. In addition, in the efforts of providing relief to the Bank customers affected by the COVID-19, the Company began offering various mitigation efforts, including a loan payment deferral program. The standard program offers a 90-day payment deferral. As of April 28, 2020, the Company has approved or processed loan deferrals for a total loan book balance, before loan discounts or premiums, of approximately $2.1 billion.
46
Cautionary Note Regarding Any Forward-Looking Statements
Some of the statements made in this report are “forward-looking statements” within the meaning of the Securities Act of 1933 (the “Securities Act”) and the Securities Exchange Act of 1934 (the “Exchange Act”). Forward-looking statements include statements with respect to our beliefs, plans, objectives, goals, expectations, anticipations, assumptions, estimates, intentions and future performance and involve known and unknown risks, uncertainties and other factors, many of which may be beyond our control and which may cause the actual results, performance or achievements of the Company to be materially different from future results, performance or achievements expressed or implied by such forward-looking statements.
All forward-looking statements are subject to risks, uncertainties and other factors that may cause the actual results, performance or achievements of South State or CenterState to differ materially from any results expressed or implied by such forward-looking statements. Such factors include, among others, (1) the risk that the cost savings and any revenue synergies from the merger may not be fully realized or may take longer than anticipated to be realized, (2) disruption to the parties’ businesses as a result of the announcement and pendency of the merger, (3) the occurrence of any event, change or other circumstances that could give rise to the termination of the merger agreement, (4) the risk that the integration of each party’s operations will be materially delayed or will be more costly or difficult than expected or that the parties are otherwise unable to successfully integrate each party’s businesses into the other’s businesses, (5) the failure to obtain the necessary approvals by the shareholders of South State or CenterState, (6) the amount of the costs, fees, expenses and charges related to the merger, (7) the ability by each of South State and CenterState to obtain required governmental approvals of the merger (and the risk that such approvals may result in the imposition of conditions that could adversely affect the combined company or the expected benefits of the transaction), (8) reputational risk and the reaction of each company’s customers, suppliers, employees or other business partners to the merger, (9) the failure of the closing conditions in the merger agreement to be satisfied, or any unexpected delay in closing the merger, (10) the possibility that the merger may be more expensive to complete than anticipated, including as a result of unexpected factors or events, (11) the dilution caused by South State’s issuance of additional shares of its common stock in the merger, (12) a material adverse change in the financial condition of South State or CenterState, (13) general competitive, economic, political and market conditions, (14) major catastrophes such as earthquakes, floods or other natural or human disasters, including infectious disease outbreaks, including the recent outbreak of a novel strain of coronavirus, a respiratory illness, the related disruption to local, regional and global economic activity and financial markets, and the impact that any of the foregoing may have on South State or CenterState and its customers and other constituencies, and (15) other factors that may affect future results of CenterState and South State including changes in asset quality and credit risk; the inability to sustain revenue and earnings growth; changes in interest rates and capital markets; inflation; customer borrowing, repayment, investment and deposit practices; the impact, extent and timing of technological changes; capital management activities; and other actions of the Federal Reserve Board and legislative and regulatory actions and reforms; and other factors discussed in our filings with the Securities and Exchange Commission under the Exchange Act.
All written or oral forward-looking statements that are made by or are attributable to us are expressly qualified in their entirety by this cautionary notice. Our forward-looking statements apply only as of the date of this report or the respective date of the document from which they are incorporated herein by reference. We have no obligation and do not undertake to update, revise or correct any of the forward-looking statements after the date of this report, or after the respective dates on which such statements otherwise are made, whether as a result of new information, future events or otherwise.
47
ITEM 2:MANAGEMENT’S DISCUSSION AND ANALYSIS OF FINANCIAL CONDITION AND RESULTS OF OPERATIONS
(All dollar amounts presented herein are in thousands, except per share data, or unless otherwise noted.)
COMPARISON OF BALANCE SHEETS AT MARCH 31, 2020 AND DECEMBER 31, 2019
Overview
Our total assets increased approximately 8% from December 31, 2019 to March 31, 2020, to approximately $18.6 billion. Loan growth during the period was $43,288, or 1% annualized, and deposit growth was $985,107, including brokered deposits, or 30% annualized. Our loan to deposit ratio was 85.2% and 91.2% at March 31, 2020 and December 31, 2019, respectively.
Due to consolidated assets in excess of $10 billion, the Company is subject to additional regulations and oversight that has affected our revenues and expenses. Such regulations and oversight include increased expectations with respect to risk management internal audit, and information security, enhanced stress testing as a component of liquidity and capital planning, transfer of examination over compliance with consumer and small business laws from the Office of the Comptroller of the Currency to the Consumer Financial Protection Bureau (“CFPB”), increased deposit insurance premium assessments based on a new scorecard issued by the FDIC, and no longer being exempt from the requirements of the Federal Reserve’s rules limiting certain interchange transaction fees for debit cards on institutions over $10 billion in assets. We have expended and expect to continue to expend additional resources to comply with these and other additional applicable regulatory requirements. Increased deposit insurance assessments can result in increased expense related to our use of deposits as a funding source. Likewise, a reduction in the amount of interchange fees we receive for electronic debit interchange has reduced our revenues. Finally, a failure to meet prudential risk management and capital planning standards or compliance with consumer lending laws could, among other things, limit our ability to engage in expansionary activities or make dividend payments to our shareholders.
On January 27, 2020, the Company and South State Corporation (“South State”) announced the execution of an Agreement and Plan of Merger, dated as of January 25, 2020 (the “Merger Agreement”), providing for the merger of the Company and South State, subject to the terms and conditions set forth therein. Under the terms of the Merger Agreement, which was unanimously approved by the Boards of Directors of both companies, the Company’s shareholders will receive 0.3001 shares of South State common stock for each share of CenterState common stock they own. The transaction is expected to close in the third quarter of 2020 subject to customary closing conditions, including receipt of all applicable regulatory approvals and shareholder approval of each company. The Company’s primary reason for the transaction is to create a leading Southeastern-based regional bank, which diversifies each company’s geographies into a contiguous six-state footprint, spanning from Florida to Virginia. The transaction will also expand both companies’ customer base which will enhance deposit fee income and leverage operating cost through economies of scale. The combined company will operate under the South State Bank name and will trade under the South State ticker symbol SSB on the Nasdaq stock market. The company will be headquartered in Winter Haven, Florida and will maintain a significant presence in Columbia and Charleston, South Carolina; Charlotte, North Carolina; and Atlanta, Georgia.
Global health concerns relating to the coronavirus, COVID-19, have, and will likely continue to, severely impact the macroeconomic environment, leading to lower interest rates, depressed equity market valuations, heightened financial market volatility and significant disruption in banking and other financial activity in the areas in which South State and CenterState operate and in a broad range of industries in which the customers of South State and CenterState operate. The financial performance of each of South State and CenterState generally, and in particular the ability of borrowers to pay interest on and repay principal of outstanding loans and the value of collateral securing those loans, as well as demand for loans and other products and services that each company offers and whose success it relies on to drive growth, is highly dependent upon the business environment in the primary markets in which it operates and in the United States as a whole. Unfavorable market conditions and uncertainty due to the coronavirus pandemic have and may continue to result in a deterioration in the credit quality of borrowers, an increase in the number of loan delinquencies, defaults and charge-offs, additional provisions for credit losses, adverse asset values of the collateral securing loans and an overall material adverse effect on the quality of the loan portfolio of each of South State, CenterState and the combined company following the completion of the merger. In addition, following the coronavirus outbreak in December 2019 and January 2020, market interest rates have declined significantly. On March 3, 2020, the Federal Open Market Committee (‘‘FOMC’’) reduced the target federal funds rate by 50 basis points to 1.00% to 1.25%. Subsequently on March 16, 2020, the FOMC further reduced the target federal funds rate by an additional 100 basis points to 0.00% to 0.25%. These reductions in interest rates, and continued fluctuations in the interest rate environment as a result of changes in monetary policies of the Federal Reserve Board, including in connection with efforts to address the economic fallout from the coronavirus outbreak, could have significant adverse effects on the earnings, financial condition and results of operations of South State and CenterState during the time the merger is pending and the combined company following the completion of the merger.
The extent to which the coronavirus pandemic impacts the businesses of South State and CenterState will depend on future developments in the United States and around the world, which are highly uncertain and cannot be predicted, including new information which may emerge concerning the severity of the coronavirus and the actions required to contain and treat it, among others. There can be no assurance that efforts by each of South State and CenterState during the time the merger is pending and the
48
combined company following the completion of the merger to address the adverse impacts of the coronavirus will be effective. If South State or CenterState is unable to recover from a business disruption on a timely basis, the combined company’s business, financial condition and results of operations may be adversely affected. The coronavirus outbreak could also delay, increase the costs of, or otherwise adversely affect, the integration of the businesses of the two companies following the completion of the merger and make it more difficult for the combined company to realize anticipated synergies and cost savings in the amounts estimated or in the time frame contemplated or at all.
Federal funds sold and Federal Reserve Bank deposits
Federal funds sold and Federal Reserve Bank deposits were $461,252 at March 31, 2020 (approximately 2% of total assets) compared to $163,890 at December 31, 2019 (approximately 1% of total assets). We use our available for sale securities portfolio, as well as federal funds sold and Federal Reserve Bank deposits for liquidity management and for investment yields. These accounts, as a group, will fluctuate as a function of loans outstanding, and to some degree the amount of correspondent bank deposits (i.e. federal funds purchased) outstanding.
Available for sale debt investments
Available for sale debt securities, consisting primarily of mortgage-backed, U.S. government sponsored enterprises and U.S. treasury securities, were $2,138,442 at March 31, 2020 (approximately 12% of total assets) compared to $1,886,724 at December 31, 2019 (approximately 11% of total assets), an increase of $251,718, which was mainly attributable to a combination of purchases of $279,542 and an increase in unrealized holding gains of $52,998 net of paydowns received on MBSs of $78,830 during current year. We use our available for sale debt securities portfolio, as well as federal funds sold and Federal Reserve Bank deposits for liquidity management and for investment yields. These accounts, as a group, will fluctuate as a function of loans outstanding as discussed above, under the caption “Federal funds sold and FRB deposits.” We classify the majority of our securities as “available for sale debt securities” to provide for greater flexibility to respond to changes in interest rates as well as future liquidity needs. Our available for sale debt securities are carried at fair value.
Trading securities
We also have a trading securities portfolio. Realized and unrealized gains and losses are included in trading securities revenue, a component of our non-interest income, in our Condensed Consolidated Statement of Income and Comprehensive Income. Securities purchased for this portfolio have primarily been various municipal securities. A list of the activity in this portfolio is summarized below.
|
| Three-month periods ended | ||
|
| March 31, 2020 |
| March 31, 2019 |
Beginning balance |
| $4,987 |
| $1,737 |
Purchases |
| 54,723 |
| 51,691 |
Proceeds from sales |
| (51,431) |
| (53,453) |
Net realized gain on sales |
| 70 |
| 25 |
Net unrealized gain |
| 83 |
| — |
Ending balance |
| $8,432 |
| $ — |
Held to maturity debt investments
At March 31, 2020, we had $195,958 (unamortized cost basis), net of an allowance for credit losses of $10, of securities with an estimated fair value of $205,458, resulting in a net unrecognized gain of $9,500, compared to $202,903 (unamortized cost basis) of securities with an estimated fair value of $208,852 and a net unrecognized gain of $5,949 at December 31, 2019. This portfolio generally holds longer-term securities for the primary purpose of yield. This classification was chosen to minimize temporary effects on our tangible equity and tangible equity ratio due to increases and decreases in general market interest rates.
Loans held for sale
We also have a mortgage loans held for sale portfolio, whereby we originate single family home loans and sell those mortgages into the secondary market, servicing released. The Company accounts for these loans under the fair value option with changes in fair value recognized in current period earnings. At the date of funding of the loan, the funded amount of the loan, the relative derivative asset or liability of the associated interest rate lock commitment, less direct costs, becomes the initial recorded investment in the loan held for sale. Such amount approximates the fair value of the loan. Net gains from changes in estimated fair value of mortgage loans held for sale were $2,354 and $4 at March 31, 2020 and 2019, respectively. Gains and losses on the sale of mortgage loans held for sale and changes in fair value are included as a components of mortgage banking revenue which are reported in non-interest income in our Condensed Consolidated Statement of Income and Comprehensive Income.
49
The table below presents the activity in this portfolio for the periods indicated.
|
| Three-month periods ended | ||
|
| March 31, 2020 |
| March 31, 2019 |
Beginning balance |
| $142,801 |
| $40,399 |
Loans originated |
| 423,622 |
| 134,752 |
Proceeds from sales |
| (391,242) |
| (129,657) |
Net change in fair value |
| 2,354 |
| 4 |
Net realized gain on sales |
| 10,781 |
| 3,976 |
Ending balance |
| $188,316 |
| $49,474 |
|
|
|
|
|
Loans
Lending-related income is the most important component of our net interest income and is a major contributor to profitability. The loan portfolio is the largest component of earning assets, and it therefore generates the largest portion of revenues. The absolute volume of loans and the volume of loans as a percentage of earning assets is an important determinant of our net interest margin as loans are expected to produce higher yields than securities and other earning assets. Average loans during the three-month ended March 31, 2020, were $12,083,364 or 81.2% of average earning assets, as compared to $8,363,073 or 79.0% of average earning assets, for the three-month ended March 31, 2019. Total loans at March 31, 2020 and December 31, 2019 were $12,027,231 and $11,983,943, respectively. This represents a loan to total asset ratio of 64.7% and 69.9% and a loan to deposit ratio of 85.2% and 91.2%, at March 31, 2020 and December 31, 2019, respectively.
Non-PCD loans
At March 31, 2020, we have total non-PCD loans of $11,876,909. Total new loans originated during the three-month ended March 31, 2020 were approximately $832.0 million, of which $547.0 million were funded at the time of origination. About 24% of funded loan origination was non-owner occupied commercial real estate (“CRE”); 21% owner occupied CRE, 20% single family residential, 19% commercial and industrial (“C&I”), 12% land, development & construction and 4% were all other. Approximately 28% of the funded loan production was floating rate, 24% was other variable rate and 48% was fixed rate. The weighted average tax equivalent interest rate on funded loans was approximately 4.20% during the three-month ended. The loan origination pipeline is approximately $914.0 million at March 31, 2020 compared to $1 billion at December 31, 2019.
The graph below summarizes new loan originations and funded loan production, excluding acquired loans purchased pursuant to acquisitions, over the past nine quarters.
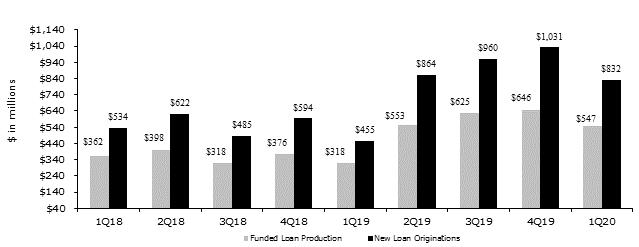
50
PCD loans
Total Purchased Credit Deteriorated (“PCD”) loans, formerly PCI loans, at March 31, 2020 were $150,322 compared to $135,468 at December 31, 2019. When we adopted CECL on January 1, 2020, we made a reclassification of $17,004 of credit discount on PCD loans to our ACL. On adoption date, the credit discount on PCD loans was reclassified from loan discount to ACL, thereby establishing a new amortized cost basis. The difference between the unpaid principal balance of the pool and the new amortized cost basis on adoption date was non-credit discount and was subsequently allocated to each individual loan. This non-credit discount will be amortized into interest income using the effective yield method over the remaining life of the individual loans.
Loan concentrations are considered to exist where there are amounts loaned to multiple borrowers engaged in similar activities, which collectively could be similarly impacted by economic or other conditions and when the total of such amounts would exceed 25% of total capital. Due to the lack of diversified industry and the relative proximity of markets served, the Company has concentrations in geographic as well as in types of loans funded.
Total loans at March 31, 2020 were $12,027,231. Of this amount, approximately 83.1% are collateralized by real estate, 14.9% are commercial non real estate loans and the remaining 2.0% are consumer and other non-real estate loans. We have $2,580,019 of single family residential loans which represents about 21.5% of our total loan portfolio. Our largest category of loans is commercial real estate which represents approximately 53.9% of our total loan portfolio.
The following table sets forth information concerning the loan portfolio by collateral types as of the dates indicated.
|
| March 31, 2020 |
| December 31, 2019 |
Loans excluding PCD loans |
|
|
|
|
Real estate loans |
|
|
|
|
Residential |
| $2,537,240 |
| $2,512,544 |
Commercial |
| 6,391,975 |
| 6,325,108 |
Land, development and construction |
| 929,014 |
| 999,923 |
Total real estate |
| 9,858,229 |
| 9,837,575 |
Commercial, industrial & factored receivables |
| 1,778,526 |
| 1,759,074 |
Consumer and other loans |
| 235,200 |
| 247,307 |
Loans before unearned fees and deferred cost |
| 11,871,955 |
| 11,843,956 |
Net unearned fees and costs |
| 4,954 |
| 4,519 |
Total loans excluding PCD loans |
| 11,876,909 |
| 11,848,475 |
PCD loans (note 1) |
|
|
|
|
Real estate loans |
|
|
|
|
Residential |
| 42,779 |
| 45,795 |
Commercial |
| 92,281 |
| 81,576 |
Land, development and construction |
| 5,447 |
| 4,655 |
Total real estate |
| 140,507 |
| 132,026 |
Commercial and industrial |
| 9,756 |
| 3,342 |
Consumer and other loans |
| 59 |
| 100 |
Total PCD loans |
| 150,322 |
| 135,468 |
Total loans |
| 12,027,231 |
| 11,983,943 |
Allowance for credit losses for loans that are not PCD loans |
| (140,803) |
| (40,429) |
Allowance for credit losses for PCD loans |
| (17,930) |
| (226) |
Total loans, net of allowance for credit losses |
| $11,868,498 |
| $11,943,288 |
| note 1: | PCD loans are accounted for pursuant to ASC Topic 326 effective January 1, 2020. |
51
The table below summarizes the Company’s loan mix for the periods presented.
|
| March 31, 2020 |
| December 31, 2019 |
Originated Loans |
|
|
|
|
Real estate loans |
|
|
|
|
Residential |
| $1,224,467 |
| $1,131,387 |
Commercial |
| 3,130,140 |
| 2,922,274 |
Land, development and construction loans |
| 581,997 |
| 541,741 |
Total real estate loans |
| 4,936,604 |
| 4,595,402 |
Commercial, industrial & factored receivables |
| 1,208,942 |
| 1,133,849 |
Consumer and other loans |
| 181,414 |
| 189,109 |
Total loans before unearned fees and costs |
| 6,326,960 |
| 5,918,360 |
Unearned fees and costs |
| 4,954 |
| 4,519 |
Total originated loans |
| 6,331,914 |
| 5,922,879 |
|
|
|
|
|
Acquired Loans (1) |
|
|
|
|
Real estate loans |
|
|
|
|
Residential |
| 1,312,773 |
| 1,381,157 |
Commercial |
| 3,261,835 |
| 3,402,834 |
Land, development and construction loans |
| 347,017 |
| 458,182 |
Total real estate loans |
| 4,921,625 |
| 5,242,173 |
Commercial, industrial & factored receivables |
| 569,584 |
| 625,225 |
Consumer and other loans |
| 53,786 |
| 58,198 |
Total acquired loans |
| 5,544,995 |
| 5,925,596 |
|
|
|
|
|
PCD loans |
|
|
|
|
Real estate loans |
|
|
|
|
Residential |
| 42,779 |
| 45,795 |
Commercial |
| 92,281 |
| 81,576 |
Land, development and construction loans |
| 5,447 |
| 4,655 |
Total real estate loans |
| 140,507 |
| 132,026 |
Commercial and industrial |
| 9,756 |
| 3,342 |
Consumer and other loans |
| 59 |
| 100 |
Total PCD loans |
| 150,322 |
| 135,468 |
|
|
|
|
|
Total Loans |
| $12,027,231 |
| $11,983,943 |
| note 1: | Acquired loans include the non-PCD loans purchased pursuant to the following acquisitions: |
| • | Branch and loan transaction from TD Bank (year 2011); |
| • | Federal Trust Bank acquisition (year 2011); |
| • | Gulfstream Business Bank acquisition (year 2014); |
| • | First Southern Bank acquisition (year 2014); |
| • | Community Bank of South Florida acquisition (year 2016); |
| • | Hometown of Homestead Banking Company acquisition (year 2016); |
| • | Platinum Bank Holding Company (year 2017); |
| • | Gateway Financial Holdings of Florida, Inc. (year 2017); |
| • | Sunshine Bancorp, Inc. (year 2018); |
| • | HCBF Holding Company, Inc. (year 2018); |
| • | Charter Financial Corporation (year 2018); and |
| • | National Commerce Corporation (year 2019) |
52
Credit quality and allowance for credit losses
Effective January 1, 2020, the Company adopted ASC Topic 326 which requires management to account for credit losses under expected credit model and no longer under the incurred loss model previously utilized. The allowance for credit losses is a valuation account that is deducted from or added to the loans amortized cost basis to present the net amount expected to be collected on the loans. Loans are charged off against the allowance when management believes the uncollectability of a loan balance is confirmed. Expected recoveries do not exceed the aggregate of amounts previously charged off and expected to be charged off. We maintain an allowance for credit losses that we believe is adequate to absorb expected credit losses in our loan portfolio.
The allowance consists of three components. The first component consists of amounts reserved for impaired loans, as defined by ASC 326. Impaired loans are those loans that management has estimated will not repay as agreed pursuant to the loan contract. Each of these loans is required to have an analysis supporting the amount of specific reserve allocated to the particular loan, if any. That is to say, a loan may be impaired (i.e. not expected to repay as agreed), but may be sufficiently collateralized such that we expect to recover all principal and interest eventually, and therefore no specific reserve is warranted.
Commercial, commercial real estate, land, land development and construction loans in excess of $500 are monitored and evaluated for impairment on an individual loan basis. Commercial, commercial real estate, land, land development and construction loans less than $500 are evaluated for impairment on a pool basis. All consumer and single family residential loans are evaluated for impairment on a pool basis.
On at least a quarterly basis, management reviews each impaired loan to determine whether it should have a specific reserve or partial charge-off. Management relies on appraisals to help make this determination. Updated appraisals are obtained for collateral dependent loans when a loan is scheduled for renewal or refinance. In addition, if the classification of the loan is downgraded to substandard, identified as impaired, or placed on nonaccrual status (collectively “Problem Loans”), an updated appraisal is obtained if the loan amount is greater than $500 and individually evaluated for impairment.
After an updated appraisal is obtained for a Problem Loan, as described above, an additional updated appraisal will be obtained on at least an annual basis. Thus, current appraisals for Problem Loans in excess of $500 will not be older than one year.
After the initial updated appraisal is obtained for a Problem Loan and before its next annual appraisal update is due, management considers the need for a downward adjustment to the current appraisal amount to reflect current market conditions, based on management’s analysis, judgment and experience. In an extremely volatile market, we may update the appraisal prior to the one-year anniversary date. When management determines that foreclosure is probable expected credit losses are based on the fair value of the collateral at the reporting date and adjusted for selling costs as appropriate.
The second component is a general reserve on all of our loans other than those identified as impaired and is based on relevant available information, from internal and external sources, relating to past events, current conditions, and reasonable and supportable forecasts. Peer credit loss experience provides the basis for the estimation of expected credit losses. Given the Company’s size, complexity, and acquisitive history, loan-level loss data is not readily available to develop reasonable and supportable loss estimates. Rather, the Company is relying on peer data from call reports to develop models that forecast a periodic default rate for each of the portfolio segments. Adjustments to historical loss information and reversion periods are made for differences in current loan specific risk characteristics such as differences in underwriting standards, portfolio mix, delinquency level, or term as well as for changes in environmental conditions, such as changes in unemployment rates, property values, the national home price index, and other factors. Adjustments to the models may be made based on changes in lending policy, underwriting standards, portfolio mix, delinquency levels, credit concentrations, external factors and other economic and regulatory factors that may not be captured in the models. The Company generally utilizes a four-quarter forecast with a four-quarter reversion period.
The allowance for credit losses is measured on a collective pool basis when similar risk characteristics exist. The company has identified the following portfolio segments: residential loans, commercial real estate loans, construction and land development loans, commercial and industrial and consumer and other.
Loans that do not share risk characteristics are evaluated on an individual basis as described above. Loans evaluated individually are not also included in the collective evaluation.
The third component consists of amounts reserved for purchased credit deteriorated loans. The third component consists of amounts reserved for purchased credit deteriorated loans. Upon adoption of ASC Topic 326, the ACL for PCD loans, except for PCD loans individually evaluated for impairment, is measured on a collective pool basis when similar risk characteristics exist. On adoption date, the credit discount on PCD loans was reclassified from loan discount to ACL, thereby establishing a new amortized cost basis. The difference between the unpaid principal balance of the pool and the new amortized cost basis on adoption date was non-credit discount and was subsequently allocated to each individual loan. This non-credit discount will be amortized into interest income using the effective yield method over the remaining life of the individual loans. Changes to the allowance for credit losses after adoption are recorded through provision for credit losses. Like with our other impaired loans, PCD loans in excess of $500 are individually evaluated for impairment and are processed in a similar manner as described above. The aggregate of these three components results in our total allowance for credit losses.
53
In the table below, we have shown the components, as discussed above, of our allowance for credit losses for the three-month ended March 31, 2020 and December 31, 2019.
| March 31, 2020 |
| December 31, 2019 |
| increase (decrease) |
Non-PCD loans: |
|
|
|
|
|
Allowance at beginning of period | $40,429 |
| $41,758 |
| $(1,329) |
Impact of adopting CECL | 57,604 |
| — |
| 57,604 |
Net charge-offs | (1,149) |
| (4,384) |
| 3,235 |
Provision for credit losses | 43,919 |
| 3,055 |
| 40,864 |
Allowance at end of period for non-PCD loans | $140,803 |
| $40,429 |
| $100,374 |
|
|
|
|
|
|
Ending allowance attributable to non-impaired non-PCD loans | $138,883 |
| $38,551 |
| $100,332 |
Ending allowance attributable to impaired non-PCD loans | 1,920 |
| 1,878 |
| 42 |
Allowance at end of period for non-PCD loans | $140,803 |
| $40,429 |
| $100,374 |
|
|
|
|
|
|
Performing non-PCD loans | $11,845,914 |
| $11,822,335 |
| $23,579 |
Impaired non-PCD loans | 30,995 |
| 26,140 |
| 4,855 |
Total non-PCD loans | $11,876,909 |
| $11,848,475 |
| $28,434 |
|
|
|
|
|
|
Allowance attributable to non-impaired loans over non-impaired loan balance, non-PCD | 1.17% |
| 0.33% |
| 0.85% |
Allowance attributable to impaired loans over impaired loan balance, non-PCD | 6.19% |
| 7.18% |
| (0.99)% |
Total Allowance over total loans, non-PCD | 1.19% |
| 0.34% |
| 0.85% |
|
|
|
|
|
|
PCD loans: |
|
|
|
|
|
Allowance at beginning of period | $226 |
| $233 |
| $(7) |
Reclassified PCD discount to ACL under CECL | 17,004 |
| — |
| 17,004 |
Net charge-offs | (295) |
| — |
| (295) |
Provision (recovery) for credit losses | 995 |
| (7) |
| 1,002 |
Allowance at end of period for PCD loans | $17,930 |
| $226 |
| $17,704 |
|
|
|
|
|
|
Ending allowance attributable to non-impaired PCD loans | $5,615 |
| $226 |
| $5,389 |
Ending allowance attributable to PCD loans | 12,315 |
| — |
| 12,315 |
Allowance at end of period for PCD loans | $17,930 |
| $226 |
| $17,704 |
|
|
|
|
|
|
Performing PCD loans | $127,546 |
| $135,468 |
| $(7,922) |
Impaired PCD loans | 22,776 |
| — |
| 22,776 |
Total PCD loans | $150,322 |
| $135,468 |
| $14,854 |
|
|
|
|
|
|
Allowance attributable to non-impaired loans over non-impaired loan balance, PCD | 4.40% |
| 0.17% |
| 4.24% |
Allowance attributable to impaired loans over impaired loan balance, PCD | 54.07% |
| 0.00% |
| 54.07% |
Total Allowance over total loans, PCD | 11.93% |
| 0.17% |
| 11.76% |
The general allowance for credit losses relating to non-PCD loans increased by $42,728, excluding the impact from the adoption of CECL which was $57,604. Net changes resulting from a mixture of decreases and increases in the Company’s expected loss model, including the impact from the COVID-19 pandemic, affected the net change in the general credit loss allowance.
The specific credit loss allowance (impaired loans) for non-PCD loans is the aggregate of the results of individual analyses prepared for each one of the impaired loans, excluding PCD loans. Total impaired loans at March 31, 2020 totaled $30,995.
The Company recorded partial charge offs in lieu of specific allowance for a number of the impaired loans. The Company’s non-PCD impaired loans have been written down by $2,208 to $30,995 ($29,075 when the $1,920 specific allowance is considered) from their legal unpaid principal balance outstanding of $33,203 for non-PCD loans. In the aggregate, total impaired non-PCD loans have been written down to approximately 88% of their legal unpaid principal balance, and non-performing impaired non-PCD loans have been written down to approximately 86% of their legal unpaid principal balance. Approximately $7,215 of the Company’s impaired non-PCD loans, or 23% of total impaired non-PCD loans, are accruing performing loans. This group of impaired loans is not included in the Company’s non-performing loans or non-performing assets categories.
54
PCD loans are now accounted for pursuant to ASC Topic 326. PCD loans in excess of $500 will be individually evaluated for impairment each quarter. All other PCD loans with similar risk characteristics are pooled and collectively evaluated. PCD loans had a remaining unpaid principal balance of $187,020 and unamortized fair value adjustment of $36,698, which represents 19.6% of unpaid principal balance, at March 31, 2020. The allowance for credit losses relating to PCD loans increased by $700, excluding the impact from the adoption of CECL of $17,004. The $17,004 was a reclassification of the credit discount on PCD loans from loan discount to ACL. The Company’s impaired PCD loans have been written down to $22,776 ($10,461 when the $12,315 specific allowance is considered) from their legal unpaid principal balance outstanding of $40,744.
The allowance is increased by the provision for credit losses, which is a charge to current period earnings and decreased by loan charge-offs net of recoveries of prior period loan charge-offs. Loans are charged against the allowance when management believes collection of the principal is unlikely. We believe our allowance for credit losses was adequate at March 31, 2020. However, we recognize that many factors can adversely impact various segments of the Company’s markets and customers, and therefore there is no assurance as to the amount of losses or credit losses which may develop in the future.
The tables below summarize the changes in allowance for credit losses during the periods presented.
|
| Allowance for credit losses for loans that are not PCD loans |
| Allowance for credit losses on PCD loans |
| Total |
Three-month ended March 31, 2020 |
|
|
|
|
|
|
Beginning balance, prior to adoption of ASC 326 |
| $40,429 |
| $226 |
| $40,655 |
Effect of adopting ASC 326 (CECL) |
| 57,604 |
| 17,004 |
| 74,608 |
Loans charged-off |
| (2,350) |
| (1,257) |
| (3,607) |
Recoveries of loans previously charged-off |
| 1,201 |
| 962 |
| 2,163 |
Net charge-offs |
| (1,149) |
| (295) |
| (1,444) |
Provision for credit losses |
| 43,919 |
| 995 |
| 44,914 |
Balance at end of period |
| $140,803 |
| $17,930 |
| $158,733 |
|
|
|
|
|
|
|
Three-month ended March 31, 2019 |
|
|
|
|
|
|
Balance at beginning of period |
| $39,579 |
| $191 |
| $39,770 |
Loans charged-off |
| (1,447) |
| — |
| (1,447) |
Recoveries of loans previously charged-off |
| 676 |
| — |
| 676 |
Net charge-offs |
| (771) |
| — |
| (771) |
Provision for credit losses |
| 1,053 |
| — |
| 1,053 |
Balance at end of period |
| $39,861 |
| $191 |
| $40,052 |
The increase in allowance for credit losses during the current quarter compared to the comparable period prior year is due to the adoption of CECL effective January 1, 2020 and the higher provision for credit losses recorded during the current period is mainly attributable to the COVID-19 pandemic.
Nonperforming loans and nonperforming assets
Non-performing loans are defined as non-accrual loans plus loans past due 90 days or more and still accruing interest. Generally, we place loans on non-accrual status when they are past due 90 days and management believes the borrower’s financial condition, after giving consideration to economic conditions and collection efforts, is such that collection of interest is doubtful. For CBI’s factored receivables, which are commercial trade credits rather than promissory notes, the Company’s practice, in most cases, is to charge-off unpaid recourse receivables when they become 90 days past due from the invoice due date and the non-recourse receivables when they become 120 days past due from the statement billing date. When we place a loan on non-accrual status, interest accruals cease and uncollected interest is reversed and charged against current income. Interest received on such loans is accounted for on the cash-basis or cost-recovery method, until qualifying for return to accrual. Loans are returned to accrual status when all the principal and interest amounts contractually due are brought current and future payments are reasonably assured. With the adoption of ASC 326 and the new accounting treatment for PCD loans, the Company began to include non-accrual PCD loans in its non-performing loans and assets and related credit metrics starting with the current quarter. Previous periods do not include PCD loans as these loans were not considered non-performing under ASC 310-30. Non-performing loans, as defined above, as a percentage of total loans including PCD loans, was 0.66% at March 31, 2020. Non-performing loans as a percentage of total non-PCD loans was 0.33% at December 31, 2019.
Non-performing assets (which we define as non-performing loans, as defined above, plus (a) OREO (i.e., real estate acquired through foreclosure, in substance foreclosure, or deed in lieu of foreclosure); and (b) other repossessed assets that are not real estate), were $89,762, including $33,893 of non-accrual PCD loans, at March 31, 2020, compared to $43,870 at December 31, 2019. Non-performing assets as a percentage of total assets were 0.48% at March 31, 2020, compared to 0.26% at December 31, 2019.
55
The table below summarizes selected credit quality data at the dates indicated.
|
| March 31, 2020 |
| December 31, 2019 |
Non-accrual loans (note 1) |
| $79,198 |
| $36,916 |
Accruing loans 90 days or more past due (note 1) |
| 535 |
| 1,692 |
Total non-performing loans ("NPLs") (note 1) |
| 79,733 |
| 38,608 |
Other real estate owned ("OREO") |
| 9,942 |
| 5,092 |
Repossessed assets other than real estate ("ORAs") (note 1) |
| 87 |
| 170 |
Total NPAs |
| $89,762 |
| $43,870 |
|
|
|
|
|
NPLs as percentage of total loans (note 1) |
| 0.66% |
| 0.33% |
NPAs as percentage of total assets |
| 0.48% |
| 0.26% |
NPAs as percentage of loans and OREO and ORAs (note 1) |
| 0.75% |
| 0.37% |
30-89 days past due accruing loans as percentage of total loans (note 1) |
| 0.53% |
| 0.48% |
Allowance for credit losses as percentage of NPLs (note 1) |
| 199% |
| 105% |
| note 1: | Includes PCD loans at March 31, 2020 and excludes PCI loans at December 31, 2019. |
As shown in the table above, the largest component of non-performing loans is non-accrual loans. As of March 31, 2020, the Company had non-accrual loans with an aggregate book value of $79,198 compared to December 31, 2019 when an aggregate book value of $36,916 was reported. The increase in non-accrual loans is mainly attributable to the non-accrual PCD loans of $33,893 which are now included as non-accrual loans as of March 31, 2020.
The second largest component of non-performing assets after non-accrual loans is OREO. At March 31, 2020, total OREO was $9,942 compared to $5,092 at December 31, 2019. OREO is carried at the lower of cost or market less the estimated cost to sell. Further declines in real estate values can affect the market value of these assets. Any further decline in market value beyond its cost basis is recorded as a current expense in the Company’s Condensed Consolidated Statement of Income and Comprehensive Income.
Impaired loans are defined as loans that management has determined will not repay as agreed pursuant to the terms of the related loan agreement. Small balance homogeneous loans are not considered for impairment purposes. Once management has determined a loan is impaired, we perform a specific reserve analysis to determine if it is probable that we will eventually collect all contractual cash flows. If management determines that a shortfall is probable, then a specific valuation allowance is placed against the loan. This loan is then placed on non-accrual, even if the borrower is current with his/her contractual payments, and will remain on non-accrual until payments collected reduce the loan balance such that it eliminates the specific valuation allowance or equivalent partial charge-down or other economic conditions change. At March 31, 2020, we identified a total of $30,995 in impaired loans, excluding PCD loans. A specific valuation allowance of $1,920 has been attached to $9,065 of impaired non-PCD loans included in the total $30,995 of identified impaired loans. It should also be noted that the total carrying balance of the impaired loans, or $30,995, has been partially charged down by $2,208 from their aggregate legal unpaid balance of $33,203. At March 31, 2020, we identified a total of $22,776 in impaired PCD loans. A specific valuation allowance of $12,315 has been attached to the total $22,776 of identified impaired PCD loans. It should also be noted that the total carrying balance of the impaired PCD loans, or $22,776, has been partially charged down by $17,968 from their aggregate legal unpaid balance of $40,744.
The table below summarizes impaired loan data for the periods presented.
|
| March 31, 2020 |
| December 31, 2019 |
Non-PCD loans |
|
|
|
|
Impaired loans with a specific valuation allowance |
| $9,065 |
| $7,598 |
Impaired loans without a specific valuation allowance |
| 21,930 |
| 18,542 |
Total impaired non-PCD loans |
| $30,995 |
| $26,140 |
PCD loans |
|
|
|
|
Impaired loans with a specific valuation allowance |
| $22,776 |
| $ — |
Impaired loans without a specific valuation allowance |
| — |
| — |
Total impaired PCD loans |
| $22,776 |
| $ — |
|
|
|
|
|
Performing TDRs (these are not included in NPLs) |
| $7,215 |
| $8,012 |
Non performing TDRs (these are included in NPLs) |
| 4,648 |
| 4,512 |
Total TDRs |
| 11,863 |
| 12,524 |
Impaired loans that are not TDRs |
| 19,132 |
| 13,616 |
Total impaired loans, excluding PCD loans |
| $30,995 |
| $26,140 |
Impaired PCD loans |
| $22,776 |
| $ — |
Total Impaired loans |
| $53,771 |
| $26,140 |
56
Bank premises and equipment
Bank premises and equipment was $296,471 at March 31, 2020 compared to $296,706 at December 31, 2019, a decrease of $235 or 0.1%.
A summary of our bank premises and equipment for the period end indicated is presented in the table below.
|
| March 31, 2020 |
| December 31, 2019 |
Land |
| $89,973 |
| $89,973 |
Land improvements |
| 1,659 |
| 1,560 |
Buildings |
| 175,288 |
| 174,344 |
Leasehold improvements |
| 19,630 |
| 19,076 |
Furniture, fixtures and equipment |
| 69,637 |
| 68,148 |
Construction in progress |
| 11,429 |
| 10,821 |
Subtotal |
| 367,616 |
| 363,922 |
Less: accumulated depreciation |
| 71,145 |
| 67,216 |
Total |
| $296,471 |
| $296,706 |
We transfer branch real estate that is no longer in use to held for sale at estimated fair value less estimated cost to sell. We did not transfer any branch real estate to held for sale during the three-month period ending March 31, 2020. Our branch real estate held for sale at March 31, 2020 and December 31, 2019 were $21,347 and $23,781, respectively, a net decrease of $2,434. The net decrease is primarily due to net proceeds of $2,639 received on four properties held for sale sold during the three-month period ending March 31, 2020.
Interest Rate Swap Derivatives
The Company enters into interest rate swaps in order to provide commercial loan clients the ability to swap from variable to fixed interest rates. Under these agreements, the Company enters into a variable rate loan with a client in addition to a swap agreement. This swap agreement effectively converts the client’s variable rate loan into a fixed rate. The Company then enters into a matching swap agreement with a third party dealer in order to offset its exposure on the customer swap. The fair value of interest rate swap derivatives (asset component) was $831,891 at March 31, 2020 compared to $273,068 at December 31, 2019. Out of the total fair value of interest rate swap derivatives (liability component) of $842,451, the fair value of interest swap derivatives on commercial loans was $833,977 at March 31, 2020 compared to $274,216 at December 31, 2019. The Company pledged $550,101 and $140,913 of cash as collateral to the third party dealers and clearinghouse exchanges at March 31, 2020 and December 31, 2019, respectively. The Company also pledged $605,100 and $361,127 of securities to the third party dealers and clearinghouse exchanges at March 31, 2020 and December 31, 2019, respectively.
During the second quarter of 2019, the Company entered into an interest rate swap contract on a variable rate borrowing to manage interest rate risk associated with the borrowing. Under the agreement, the Company borrowed a variable rate note from the Federal Home Loan Bank and entered into a matching swap agreement with a counterparty in order to offset its exposure on the variable rate borrowing. The Company negotiated specific agreement of terms with the counterparty, including the amount, the interest rate, and the maturity. The Company is exposed to credit-related losses in the event of nonperformance by the counterparty to the agreement. The Company controls the credit risk through monitoring procedures and does not expect the counterparty to fail its obligations. The Company only deals with primary dealers and believes that the credit risk inherent in this contract was not significant during the current quarter. Out of the total fair value of interest rate swap derivatives (liability component) of $842,451, the fair value of the fair value of interest rate swap derivatives on a variable rate borrowing (liability component) was $8,474 at March 31, 2020.
Deposits
Total deposits were $14,121,499 at March 31, 2020 compared to $13,136,392 at December 31, 2019. The total deposits increased $985,107, or approximately 30% on an annualized basis. Excluding the increase in brokered time deposits of $732,525, deposits increased 7.73% on an annual basis. The cost of interest bearing deposits in the current quarter was 0.86%, compared to 1.01% in the previous quarter. The overall cost of total deposits (i.e. includes non-interest bearing checking accounts) in the current quarter was 0.60% compared to 0.68% in the previous quarter.
57
The table below summarizes the Company’s deposit mix for the periods presented.
|
|
|
| % of |
|
|
| % of |
|
| March 31, 2020 |
| total |
| December 31, 2019 |
| total |
Demand - non-interest bearing |
| $4,164,091 |
| 29% |
| $3,929,183 |
| 30% |
Demand - interest bearing |
| 2,650,252 |
| 19% |
| 2,613,933 |
| 20% |
Money market accounts |
| 3,519,441 |
| 25% |
| 3,525,571 |
| 27% |
Savings deposits |
| 894,332 |
| 6% |
| 811,150 |
| 6% |
Time deposits |
| 2,893,383 |
| 21% |
| 2,256,555 |
| 17% |
Total deposits |
| $14,121,499 |
| 100% |
| $13,136,392 |
| 100% |
Securities sold under agreement to repurchase
Our Bank enters into borrowing arrangements with our retail business customers by agreements to repurchase (“securities sold under agreements to repurchase”) under which the Bank pledges investment securities owned and under their control as collateral against these one-day borrowing arrangement. These short-term borrowings totaled $81,736 at March 31, 2020 compared to $93,141 at December 31, 2019.
Federal funds purchased
Federal funds purchased are overnight deposits including deposits from correspondent banks. At March 31, 2020 we had $255,433 of overnight correspondent bank deposits, compared to $254,193 in overnight correspondent bank deposits and $125,000 in other overnight federal funds purchased at December 31, 2019.
Federal Home Loan Bank advances and other borrowed funds
From time to time, we borrow either through Federal Home Loan Bank (“FHLB”) advances or other borrowings. We had $150,000 in FHLB advances, $11,000 in subordinated notes (assumed from the Sunshine transaction closed on January 1, 2018 and from the NCOM transaction on April 1, 2019) and $50,000 in line of credit at March 31, 2020. In addition, the Company had a $160,400 letter of credit issued through the FHLB to support public funds under the Alabama SAFE program. At December 31, 2019, the Company had $150,000 in FHLB advances and $11,000 in subordinated notes.
Corporate and subordinated debentures
Below is a schedule of statutory trust entities and the related corporate debentures formed and assumed through various acquisitions.
|
| Amount |
| Interest Rate |
| Maturity |
CenterState Banks of Florida Statutory Trust I |
| $10,000 |
| LIBOR + 3.05% |
| Sep. 2033 |
Valrico Capital Statutory Trust |
| $2,500 |
| LIBOR + 2.70% |
| Sep. 2034 |
Federal Trust Statutory Trust I |
| $5,000 |
| LIBOR + 2.95% |
| Sep. 2033 |
Gulfstream Bancshares Capital Trust II |
| $3,000 |
| LIBOR + 1.70% |
| Mar. 2037 |
Homestead Statutory Trust I |
| $10,000 |
| LIBOR + 1.65% |
| Jul. 2036 |
BSA Financial Statutory Trust I |
| $5,000 |
| LIBOR + 1.55% |
| Dec. 2035 |
MRCB Statutory Trust II |
| $3,000 |
| LIBOR + 1.60% |
| Sep. 2036 |
On April 1, 2019, the Company acquired all the assets and assumed all the liabilities of NCOM pursuant to the merger agreement, including NCOM’s subordinated debt obligations as listed in the table below. Each subordinated debenture bears interest at a fixed rate.
|
| Amount |
| Interest Rate |
| Maturity |
National Commerce Corporation |
| $25,000 |
| 6.00% |
| Jun. 2026 |
Landmark Bancshares |
| $13,000 |
| 6.50% |
| Jun. 2027 |
58
Total equity
The total equity at March 31, 2020, was $2,870,252, or 15.4% of total assets, compared to $2,896,718, or 16.9% of total assets at December 31, 2019. The decrease in total equity was due to the following items:
Total stockholders' equity at December 31, 2019 |
| $2,896,718 |
Net income |
| 35,432 |
Cumulative adjustment pursuant to adoption of ASU 326 |
| (47,751) |
Dividends paid on common shares ($0.14 per share) |
| (17,377) |
Net increase in market value of securities available for sale, net of deferred taxes |
| 39,729 |
Net decrease in market value of interest rate swap, net of deferred taxes |
| (5,740) |
Stock options exercised |
| 1,359 |
Equity based compensation |
| 1,796 |
Stock repurchase (1,479,986 shares, average price of $22.92 per share) |
| (33,914) |
Total equity at March 31, 2020 |
| $2,870,252 |
The Company and the Bank are subject to various regulatory capital requirements administered by the federal banking agencies. Under capital adequacy guidelines and the regulatory framework for prompt corrective action, the Company and the Bank must meet specific capital guidelines that involve quantitative measures of assets, liabilities and certain off-balance-sheet items as calculated under regulatory accounting practices. The capital amounts and classification are also subject to qualitative judgments by the regulators about components, risk weightings and other factors. Failure to meet minimum capital requirements can initiate certain mandatory and possibly additional discretionary actions by regulators that, if undertaken, could have a direct material effect on the Company’s consolidated financial statements. A banking organization needs to maintain a Common Equity Tier 1 (“CET1”) capital ratio of at least 7%, a total Tier 1 capital ratio of at least 8.5% and a total risk-based capital ratio of at least 10.5%. The net unrealized gain or loss on available for sale debt securities is not included in computing regulatory capital.
Quantitative measures established by regulation to ensure capital adequacy require the Company and the Bank to maintain minimum amounts and ratios (set forth in the table below) of total capital, Tier I capital and CET1 (as defined in the regulations) to risk-weighted assets. Management believes, as of March 31, 2020, that the Company and the Bank meet all capital adequacy requirements to which they are subject.
In March 2020, the Office of the Comptroller of the Currency, the Board of Governors of the Federal Reserve System, and the Federal Deposit Insurance Corporation (collectively, the “agencies”) issued an interim final rule that delays the estimated impact on regulatory capital stemming from the implementation of ASC Topic 326, Measurement of Credit Losses on Financial Instruments (CECL). The interim final rule provides banking organizations that implement CECL in 2020 the option to delay for two years an estimate of CECL’s effect on regulatory capital, relative to the incurred loss methodology’s effect on regulatory capital, followed by a three-year transition period. The agencies are providing this relief to allow such banking organizations to better focus on supporting lending to creditworthy households and businesses in light of recent strains on the U.S. economy as a result of COVID-19, while also maintaining the quality of regulatory capital. As a result, the Company and Bank elected the five-year transition relief allowable under the interim final rule effective March 31, 2020.
59
Selected consolidated capital ratios at March 31, 2020 and December 31, 2019 for the Company and the Bank are presented in the tables below. The ratios for capital adequacy purposes do not include capital conservation buffer requirements.
CenterState Bank Corporation (the Company) |
| Actual |
| Capital adequacy |
| Excess | ||||
|
| Amount |
| Ratio |
| Amount |
| Ratio |
| amount |
March 31, 2020 |
|
|
|
|
|
|
|
|
|
|
Total capital (to risk weighted assets) |
| $1,706,892 |
| 11.6% |
| $1,172,354 |
| >8.0% |
| $534,538 |
Tier 1 capital (to risk weighted assets) |
| 1,557,403 |
| 10.6% |
| 879,266 |
| >6.0% |
| 678,137 |
Common equity Tier 1 capital (to risk weighted assets) |
| 1,557,403 |
| 10.6% |
| 659,449 |
| >4.5% |
| 897,954 |
Tier 1 capital (to average assets) |
| 1,557,403 |
| 9.7% |
| 645,507 |
| >4.0% |
| 911,896 |
|
|
|
|
|
|
|
|
|
|
|
December 31, 2019 |
|
|
|
|
|
|
|
|
|
|
Total capital (to risk weighted assets) |
| $1,672,911 |
| 12.2% |
| $1,097,448 |
| >8.0% |
| $575,463 |
Tier 1 capital (to risk weighted assets) |
| 1,555,756 |
| 11.3% |
| 823,086 |
| >6.0% |
| 732,670 |
Common equity Tier 1 capital (to risk weighted assets) |
| 1,555,756 |
| 11.3% |
| 617,315 |
| >4.5% |
| 938,441 |
Tier 1 capital (to average assets) |
| 1,555,756 |
| 9.7% |
| 638,866 |
| >4.0% |
| 916,890 |
|
|
|
|
|
|
|
|
|
|
|
CenterState Bank, N.A. |
| Actual |
| Capital adequacy |
| Excess | ||||
|
| Amount |
| Ratio |
| Amount |
| Ratio |
| amount |
March 31, 2020 |
|
|
|
|
|
|
|
|
|
|
Total capital (to risk weighted assets) |
| $1,724,919 |
| 11.8% |
| $1,467,074 |
| >10.0% |
| $257,845 |
Tier 1 capital (to risk weighted assets) |
| 1,651,933 |
| 11.3% |
| 1,173,659 |
| >8.0% |
| 478,274 |
Common equity Tier 1 capital (to risk weighted assets) |
| 1,651,933 |
| 11.3% |
| 953,598 |
| >6.5% |
| 698,335 |
Tier 1 capital (to average assets) |
| 1,651,933 |
| 10.2% |
| 806,772 |
| >5.0% |
| 845,161 |
|
|
|
|
|
|
|
|
|
|
|
December 31, 2019 |
|
|
|
|
|
|
|
|
|
|
Total capital (to risk weighted assets) |
| $1,670,678 |
| 12.2% |
| $1,097,258 |
| >8.0% |
| $299,106 |
Tier 1 capital (to risk weighted assets) |
| 1,630,026 |
| 11.9% |
| 822,943 |
| >6.0% |
| 532,768 |
Common equity Tier 1 capital (to risk weighted assets) |
| 1,630,026 |
| 11.9% |
| 617,207 |
| >4.5% |
| 738,504 |
Tier 1 capital (to average assets) |
| 1,630,026 |
| 10.2% |
| 638,628 |
| >4.0% |
| 831,741 |
60
COMPARISON OF RESULTS OF OPERATIONS FOR THE THREE-MONTH PERIODS ENDED MARCH 31, 2020 AND 2019
Overview
We recognized net income of $35,432 or $0.28 per share basic and diluted for the three-month period ended March 31, 2020, compared to net income and net income of $44,643 or $0.47 and $0.46 per share basic and diluted, respectively, for the same period in 2019. A summary of the differences is listed in the table below.
|
| Mar. 31, |
| Mar. 31, |
| increase |
Three-month periods ending: |
| 2020 |
| 2019 |
| (decrease) |
Net interest income |
| $153,353 |
| $114,175 |
| $39,178 |
Provision for credit losses |
| 44,914 |
| 1,053 |
| 43,861 |
Net interest income after loan loss provision |
| 108,439 |
| 113,122 |
| (4,683) |
|
|
|
|
|
|
|
Total non-interest income |
| 55,790 |
| 29,300 |
| 26,490 |
|
|
|
|
|
|
|
Merger related expenses |
| 3,051 |
| 6,365 |
| (3,314) |
All other non-interest expense |
| 119,721 |
| 78,108 |
| 41,613 |
Total non-interest expense |
| 122,772 |
| 84,473 |
| 38,299 |
|
|
|
|
|
|
|
Net income before provision for income taxes |
| 41,457 |
| 57,949 |
| (16,492) |
Provision for income taxes |
| 6,025 |
| 13,306 |
| (7,281) |
Net income |
| $35,432 |
| $44,643 |
| $(9,211) |
The increase in our net interest income relates primarily to the increase in our average interest earning assets as a result of the acquisition of NCOM in April 2019. The $44,914 provision for credit losses on loans recorded during the first quarter of 2020, an increase of $43,861 compared to the same period in 2019 is mainly due to provision expense related to COVID-19. The increase in our “Total non-interest income” is mainly attributable to higher interest rate swap and fixed income revenue in the correspondent banking division and mortgage banking revenue. The increase in our “all other non-interest expense,” which represents the operating expenses of our commercial/retail banking segment, is primarily due to growth from the acquisition of NCOM. These items along with others are discussed and analyzed below.
Our strategy is to grow organically and by acquisition in the southeastern region. In pursuing this strategy, we seek lending teams and companies that are culturally similar to us, that are experienced and are located in our markets or in markets close to us so we can achieve economies of scale.
Net interest income/margin
Net interest income increased $39,178 or 34.3% to $153,353 during the three-month period ended March 31, 2020 compared to $114,175 for the same period in 2019. The $39,178 increase was the result of a $44,477 increase in interest income offset by $5,299 increase in interest expense.
Interest earning assets averaged $14,873,007 during the three-month period ended March 31, 2020 as compared to $10,579,666 for the same period in 2019, an increase of 40.6%, or $4,293,341. The yield on average interest earning assets decreased 29 bps to 4.78% (29 bps to 4.80% tax equivalent basis) during the three-month period ended March 31, 2020, compared to 5.07% (5.09% tax equivalent basis) for the same period in 2019. The combined effects of the $4,293,341 increase in average interest earning assets and the 29 bps (29 bps tax equivalent basis) decrease in yield on average interest earning assets resulted in the $44,477 ($44,615 tax equivalent basis) increase in interest income between the two periods.
Interest bearing liabilities averaged $9,906,875 during the three-month period ended March 31, 2020 as compared to $7,124,758 for the same period in 2019, an increase of $2,782,117 or 39.0%. The cost of average interest bearing liabilities was 0.95% during the three-month period ended March 31, 2020, compared to 1.03% for the same period in 2019. The effect of the $2,782,117 increase in average interest bearing liabilities and the 8 bps decrease in cost of funds resulted in the $5,299 increase in interest expense between the two periods.
61
The table below summarizes the analysis of changes in interest income and interest expense for the three-month periods ended March 31, 2020 and 2019 on a tax equivalent basis.
| Three months ended March 31, | ||||||||||
| 2020 |
| 2019 | ||||||||
| Average |
| Interest |
| Average |
| Average |
| Interest |
| Average |
| Balance |
| inc / exp |
| rate |
| balance |
| inc / exp |
| rate |
Originated loans, excluding PCD (notes 1, 2 and 8) | $6,196,409 |
| $72,890 |
| 4.73% |
| $4,243,258 |
| $50,907 |
| 4.87% |
Acquired loans, excluding PCD (notes 8 and 9) | 5,733,217 |
| 76,683 |
| 5.38% |
| 3,964,231 |
| 55,561 |
| 5.68% |
PCD loans (note 10) | 153,738 |
| 11,544 |
| 30.20% |
| 155,584 |
| 10,140 |
| 26.43% |
Securities - taxable | 1,895,781 |
| 12,534 |
| 2.66% |
| 1,707,002 |
| 12,286 |
| 2.92% |
Securities - tax exempt (note 8) | 220,310 |
| 1,980 |
| 3.61% |
| 220,244 |
| 1,940 |
| 3.57% |
Fed funds sold and other (note 3) | 673,552 |
| 1,813 |
| 1.08% |
| 289,347 |
| 1,995 |
| 2.80% |
Total interest earning assets | 14,873,007 |
| 177,444 |
| 4.80% |
| 10,579,666 |
| 132,829 |
| 5.09% |
|
|
|
|
|
|
|
|
|
|
|
|
Allowance for credit losses | (115,230) |
|
|
|
|
| (39,376) |
|
|
|
|
All other assets | 2,669,789 |
|
|
|
|
| 1,787,262 |
|
|
|
|
Total assets | $17,427,566 |
|
|
|
|
| $12,327,552 |
|
|
|
|
|
|
|
|
|
|
|
|
|
|
|
|
Interest bearing deposits (note 4) | $9,224,690 |
| $19,836 |
| 0.86% |
| $6,430,085 |
| $13,323 |
| 0.84% |
Fed funds purchased | 300,539 |
| 1,133 |
| 1.52% |
| 259,590 |
| 1,618 |
| 2.53% |
Other borrowings (notes 5) | 310,298 |
| 1,440 |
| 1.87% |
| 402,624 |
| 2,596 |
| 2.61% |
Corporate and subordinated debenture (note 11 and 12) | 71,348 |
| 997 |
| 5.62% |
| 32,459 |
| 570 |
| 7.12% |
Total interest bearing liabilities | 9,906,875 |
| 23,406 |
| 0.95% |
| 7,124,758 |
| 18,107 |
| 1.03% |
Demand deposits | 4,035,991 |
|
|
|
|
| 3,032,471 |
|
|
|
|
Other liabilities | 602,056 |
|
|
|
|
| 169,912 |
|
|
|
|
Total equity | 2,882,644 |
|
|
|
|
| 2,000,411 |
|
|
|
|
Total liabilities and stockholders’ equity | $17,427,566 |
|
|
|
|
| $12,327,552 |
|
|
|
|
Net interest spread (tax equivalent basis) (note 6) |
|
|
|
| 3.85% |
|
|
|
|
| 4.06% |
Net interest income (tax equivalent basis) |
|
| $154,038 |
|
|
|
|
| $114,722 |
|
|
Net interest margin (tax equivalent basis) (note 7) |
|
|
|
| 4.17% |
|
|
|
|
| 4.40% |
| note 1: | Loan balances are net of deferred origination fees and costs. |
|
| note 2: | Interest income on average loans includes amortization of loan fee recognition of $517 and $603 for the three-month periods ended March 31, 2020 and 2019, respectively. |
|
| note 3: | Includes federal funds sold, interest earned on deposits at the Federal Reserve Bank and earnings on Federal Reserve Bank stock, Federal Home Loan Bank stock and other equity stocks. |
|
| note 4: | Includes interest-bearing deposits only. Non-interest bearing checking accounts are included in the demand deposits listed below. Also, includes net amortization of fair market value adjustments related to various acquisitions of time deposits of ($495) and ($266) for the three-month periods ended March 31, 2020 and 2019. |
|
| note 5: | Includes securities sold under agreements to repurchase, Federal Home Loan Bank advances and subordinated notes. |
|
| note 6: | Represents the average rate earned on interest earning assets minus the average rate paid on interest bearing liabilities (Non-GAAP). |
|
| note 7: | Represents net interest income divided by total interest earning assets (Non-GAAP). |
|
| note 8: | Interest income and rates include the effects of a tax equivalent adjustment using applicable statutory tax rates to adjust tax-exempt interest income on tax-exempt investment securities and loans to a fully taxable basis (Non-GAAP). |
|
note 9: Interest income on acquired loans, excluding PCD, includes amortization of loan discounts of $6,677 and $4,951.
| note 10: | PCD loans are accounted for pursuant to ASC 326. Interest income on PCD loans includes amortization of loan discounts of $9,157 and $7,904. |
|
| note 11: | Includes amortization of fair value adjustments related to various assumptions of corporate debentures of $88 and $88 for the three-month periods ended March 31, 2020 and 2019. |
|
note 12: Includes accretion of fair value adjustments related to an assumption of subordinated debt of $75 for the three-month period ended March 31, 2020.
The primary reason for the decrease in our Net Interest Margin (“NIM”) during the current period was due to an overall primarily as a result of a decline in loan yields due to a reduction in the federal funds rate and in LIBOR rates.
Provision for credit losses
62
The provision for credit losses increased $43,861 to $44,914 during the three-month period ending March 31, 2020 compared to a provision expense of $1,053 for the comparable period in 2019. The increase between the comparable periods is mainly attributable to the COVID-19 forecast utilized for our expected loss model now in effect due to the adoption of ASC Topic 326 effective January 1, 2020. Our policy is to maintain the allowance for credit losses at a level sufficient to absorb expected credit losses in the loan portfolio. The allowance is increased by the provision for credit losses, which is a charge to current period earnings, and is decreased by charge-offs, net of recoveries on prior loan charge-offs. Therefore, the provision for credit losses (Income Statement effect) is a residual of management’s determination of allowance for credit losses (Balance Sheet approach). In determining the adequacy of the allowance for credit losses, we consider relevant available information, from internal and external sources, relating to past events, current conditions, and reasonable and supportable forecasts. As these factors change, the level of credit loss provision changes. See “Credit Quality and Allowance for Credit Losses” for additional information regarding the allowance for credit losses.
Non-interest income
Non-interest income for the three-month ended March 31, 2020 was $55,790 compared to $29,300 for the comparable period in 2019. A summary of the differences is listed in the table below.
|
| Mar. 31, |
| Mar. 31, |
| $ increase |
| % increase |
|
Three-month periods ending: |
| 2020 |
| 2019 |
| (decrease) |
| (decrease) |
|
Income from correspondent banking capital markets division (note 1) |
| $26,424 |
| $7,972 |
| $18,452 |
| 231.5 | % |
Other correspondent banking related revenue (note 2) |
| 1,384 |
| 1,028 |
| 356 |
| 34.6 | % |
Mortgage banking revenue |
| 10,973 |
| 4,193 |
| 6,780 |
| 161.7 | % |
SBA revenue |
| 1,403 |
| 688 |
| 715 |
| 103.9 | % |
Service charges on deposit accounts |
| 7,522 |
| 6,678 |
| 844 |
| 12.6 | % |
Debit, prepaid, ATM and merchant card related fees |
| 3,667 |
| 5,018 |
| (1,351) |
| (26.9) | % |
Bank owned life insurance income |
| 1,927 |
| 1,626 |
| 301 |
| 18.5 | % |
Wealth management related revenue |
| 831 |
| 607 |
| 224 |
| 36.9 | % |
Gain on sale of bank properties held for sale |
| 236 |
| 618 |
| (382) |
| (61.8) | % |
Other non-interest income |
| 1,423 |
| 855 |
| 568 |
| 66.4 | % |
Gain on sale of securities |
| — |
| 17 |
| (17) |
| (100.0) | % |
Total non-interest income |
| $55,790 |
| $29,300 |
| $26,490 |
| 90.4 | % |
| note 1: | Includes gross commissions earned on bond sales, fees from hedging services, loan brokering fees and related consulting fees. The fee income in this category is based on sales volume in any particular period and is therefore volatile between comparable periods. |
|
| note 2: | Includes fees from safekeeping activities, bond accounting services, asset/liability consulting services, international wires, clearing and corporate checking account services and other correspondent banking related revenue and fees. The fees included in this category are less volatile than those described above in note 1. |
|
Income from correspondent banking capital markets division increased $18,452 due to higher interest rate swap and fixed income revenue during the current quarter compared to the same period in 2019. The decline in interest rates and the flattening of the yield curve led to strong demand from our correspondent bank customers for interest rate swaps in order to allow them to meet demand from our correspondent bank customers’ clients for longer-term fixed rate loans. Mortgage banking revenue increased $6,780 during the current quarter compared to the same period in 2019. This increase is a result of including the NCOM mortgage team, which was acquired on April 1, 2019, and a higher demand for mortgage loans due to the decline in interest rates leading to increased revenue from realized gains on the sale of loans held for sale. The $1,351 decrease in merchant card related fees is primarily due to the impact of the Durbin Amendment, which went into effect in the third quarter 2019.
Non-interest expense
Non-interest expense for the three-month ended March 31, 2020 increased $38,299, or 45.3%, to $122,772, compared to $84,473 for the same period in 2019.
63
Components of our non-interest expenses are listed in the table below.
|
| Mar. 31, |
| Mar. 31, |
| $ increase |
| % increase |
|
Three-month periods ending: |
| 2020 |
| 2019 |
| (decrease) |
| (decrease) |
|
Salaries and wages |
| $61,509 |
| $37,935 |
| $23,574 |
| 62.1 | % |
Incentive/bonus compensation |
| 6,439 |
| 3,523 |
| 2,916 |
| 82.8 | % |
Stock based compensation |
| 1,796 |
| 1,218 |
| 578 |
| 47.5 | % |
Employer 401K matching contributions |
| 1,696 |
| 1,104 |
| 592 |
| 53.6 | % |
Deferred compensation expense |
| 444 |
| 181 |
| 263 |
| 145.3 | % |
Health insurance and other employee benefits |
| 4,713 |
| 3,408 |
| 1,305 |
| 38.3 | % |
Payroll taxes |
| 4,432 |
| 3,104 |
| 1,328 |
| 42.8 | % |
Other employee related expenses |
| 1,011 |
| 753 |
| 258 |
| 34.3 | % |
Incremental direct cost of loan origination |
| (4,963) |
| (2,833) |
| (2,130) |
| 75.2 | % |
Total salaries, wages and employee benefits |
| 77,077 |
| 48,393 |
| 28,684 |
| 59.3 | % |
|
|
|
|
|
|
|
|
|
|
Loss on sale of OREO |
| 1 |
| 47 |
| (46) |
| (97.9) | % |
Valuation write down of OREO |
| 95 |
| 108 |
| (13) |
| (12.0) | % |
(Gain) loss on repossessed assets other than real estate |
| (8) |
| 13 |
| (21) |
| (161.5) | % |
Foreclosure and repossession related expenses |
| 856 |
| 561 |
| 295 |
| 52.6 | % |
Total credit related expenses |
| 944 |
| 729 |
| 215 |
| 29.5 | % |
|
|
|
|
|
|
|
|
|
|
Occupancy expense |
| 7,346 |
| 5,602 |
| 1,744 |
| 31.1 | % |
Depreciation of premises and equipment |
| 4,045 |
| 2,850 |
| 1,195 |
| 41.9 | % |
Supplies, stationary and printing |
| 861 |
| 748 |
| 113 |
| 15.1 | % |
Marketing expenses |
| 2,158 |
| 2,020 |
| 138 |
| 6.8 | % |
Data processing expense |
| 5,617 |
| 3,656 |
| 1,961 |
| 53.6 | % |
Legal, auditing and other professional fees |
| 2,682 |
| 1,442 |
| 1,240 |
| 86.0 | % |
Bank regulatory related expenses |
| 1,807 |
| 1,616 |
| 191 |
| 11.8 | % |
Postage and delivery |
| 1,160 |
| 925 |
| 235 |
| 25.4 | % |
Debit, prepaid, ATM and merchant card related expenses |
| 1,598 |
| 1,453 |
| 145 |
| 10.0 | % |
Amortization of intangibles |
| 4,535 |
| 2,814 |
| 1,721 |
| 61.2 | % |
Internet and telephone banking |
| 1,426 |
| 949 |
| 477 |
| 50.3 | % |
Operational write-offs and losses |
| 1,757 |
| 827 |
| 930 |
| 112.5 | % |
Correspondent accounts and Federal Reserve charges |
| 416 |
| 285 |
| 131 |
| 46.0 | % |
Conferences/Seminars/Education/Training |
| 750 |
| 495 |
| 255 |
| 51.5 | % |
Director fees |
| 541 |
| 342 |
| 199 |
| 58.2 | % |
Impairment of bank property held for sale |
| 31 |
| 107 |
| (76) |
| (71.0) | % |
Travel expenses |
| 628 |
| 279 |
| 349 |
| 125.1 | % |
Credit loss expense for unfunded commitments |
| 1,027 |
| — |
| 1,027 |
| NM | % |
Other expenses |
| 3,315 |
| 2,576 |
| 739 |
| 28.7 | % |
Subtotal |
| 119,721 |
| 78,108 |
| 41,613 |
| 53.3 | % |
Merger related expenses |
| 3,051 |
| 6,365 |
| (3,314) |
| (52.1) | % |
Total non-interest expense |
| $122,772 |
| $84,473 |
| $38,299 |
| 45.3 | % |
The overall primary reason for the increase between the periods presented above largely relate to the acquisition of NCOM in April 2019, which resulted in increases in salaries and wages, occupancy and fixed asset depreciation related expenses, data processing, professional fees and amortization of intangibles. We also recorded $1,027 in credit loss expense for unfunded commitments during the current quarter as a result of higher expected credit losses mainly attributable to the COVID-19 pandemic.
Provision for income taxes
We recognized income tax expense for the three-month period ended March 31, 2020 of $6,025 on pre-tax income of $41,457 (an effective tax rate of 14.5%) compared to an income tax expense of $13,306 on pre-tax income of $57,949 (an effective tax rate of 23.0%) for the comparable quarter in 2019. The decrease in the effective tax rate is primarily due to a $2,273 tax benefit on net operating loss carrybacks available under the CARES Act and $1,391 of excess tax benefits on stock awards recorded during the three-month ended March 31, 2020 compared to $376 of excess tax benefits on stock awards for the same period in 2019.
64
Liquidity
Liquidity is defined as the ability to meet anticipated customer demands for funds under credit commitments and deposit withdrawals at a reasonable cost and on a timely basis. We measure liquidity position by giving consideration to both on- and off-balance sheet sources of and demands for funds on a daily and weekly basis.
Our Bank regularly assesses the amount and likelihood of projected funding requirements through a review of factors such as historical deposit volatility and funding patterns, present and forecasted market and economic conditions, individual client funding needs, and existing and planned business activities. The Bank’s asset/liability committee (ALCO) provides oversight to the liquidity management process and recommends guidelines, subject to the approval of its board of directors, and courses of action to address actual and projected liquidity needs.
Short term sources of funding and liquidity include cash and cash equivalents, net of federal requirements to maintain reserves against deposit liabilities; investment securities eligible for pledging to secure borrowings from customers pursuant to securities sold under repurchase agreements; loan repayments; deposits and certain interest rate-sensitive deposits; and borrowings under overnight federal fund lines available from correspondent banks, including the Federal Reserve Discount Window, and borrowing from the Federal Home Loan Bank of Atlanta. In addition to interest rate-sensitive deposits and collateral requirements related to interest rate swaps related to the correspondent banking division, the primary demand for liquidity is anticipated fundings under credit commitments to customers.
Off-Balance Sheet Arrangements
We do not have any material off-balance sheet arrangements except for approved and unfunded loans and letters of credit to our customers in the ordinary course of business.
65
Use of Non-GAAP Financial Measures and Ratios
The accounting and reporting policies of the Company conform to generally accepted accounting principles (“GAAP”) in the United States and prevailing practices in the banking industry. However, certain non-GAAP performance measures and ratios are used by management to evaluate and measure the Company’s performance. These include tax-equivalent net interest income (including its individual components) and net interest margin (including its individual components). Management believes that these measures and ratios provide users of the Company’s financial information with a more meaningful view of the performance of the interest-earning assets and interest-bearing liabilities. Other financial holding companies may define or calculate these measures differently.
Management reviews yields on certain asset categories and the net interest margin of the Company and its banking subsidiaries on a fully taxable equivalent basis. In this non-GAAP presentation, net interest income is adjusted to reflect tax-exempt interest income on an equivalent before-tax basis. This measure ensures the comparability of net interest income arising from both taxable and tax-exempt sources.
These disclosures should not be considered in isolation or a substitute for results determined in accordance with GAAP, and are not necessarily comparable to non-GAAP performance measures which may be presented by other financial holding companies. Management compensates for these limitations by providing detailed reconciliations between GAAP information and the non-GAAP financial measures.
66
|
| Three months ended March 31, | ||
(Dollars in thousands) |
| 2020 |
| 2019 |
Income Statement Non-GAAP measures and ratios |
|
|
|
|
Interest income (GAAP) |
|
|
|
|
Originated loans, excluding PCD loans |
| $72,489 |
| $50,621 |
Acquired loans, excluding PCD loans |
| 76,642 |
| 55,524 |
PCD loans |
| 11,544 |
| 10,140 |
Securities - taxable |
| 12,534 |
| 12,286 |
Securities - tax-exempt |
| 1,737 |
| 1,716 |
Federal funds sold and other |
| 1,813 |
| 1,995 |
Total Interest income (GAAP) |
| 176,759 |
| 132,282 |
|
|
|
|
|
Tax equivalent adjustment |
|
|
|
|
Non-PCD originated loans |
| 401 |
| 286 |
Non-PCD acquired loans |
| 41 |
| 37 |
Securities - tax-exempt |
| 243 |
| 224 |
Total tax equivalent adjustment |
| 685 |
| 547 |
|
|
|
|
|
Interest income - tax equivalent |
|
|
|
|
Originated loans excluding PCD loans |
| 72,890 |
| 50,907 |
Acquired loans, excluding PCD loans |
| 76,683 |
| 55,561 |
PCD loans |
| 11,544 |
| 10,140 |
Securities - taxable |
| 12,534 |
| 12,286 |
Securities - tax-exempt |
| 1,980 |
| 1,940 |
Federal funds sold and other |
| 1,813 |
| 1,995 |
Total interest income - tax equivalent |
| 177,444 |
| 132,829 |
|
|
|
|
|
Total Interest expense (GAAP) |
| (23,406) |
| (18,107) |
|
|
|
|
|
Net interest income - tax equivalent |
| $154,038 |
| $114,722 |
|
|
|
|
|
Net interest income (GAAP) |
| $153,353 |
| $114,175 |
|
|
|
|
|
Yields and costs |
|
|
|
|
Yield on originated loans excluding PCD - tax equivalent |
| 4.73% |
| 4.87% |
Yield on acquired loans excluding PCD - tax equivalent |
| 5.38% |
| 5.68% |
Yield on securities tax-exempt - tax equivalent |
| 3.61% |
| 3.57% |
Yield on interest earning assets (GAAP) |
| 4.78% |
| 5.07% |
Yield on interest earning assets - tax equivalent |
| 4.80% |
| 5.09% |
Cost of interest bearing liabilities (GAAP) |
| 0.95% |
| 1.03% |
Net interest spread (GAAP) |
| 3.83% |
| 4.04% |
Net interest spread - tax equivalent |
| 3.85% |
| 4.06% |
Net interest margin (GAAP) |
| 4.15% |
| 4.38% |
Net interest margin - tax equivalent |
| 4.17% |
| 4.40% |
ITEM 3. | QUANTITATIVE AND QUALITATIVE DISCLOSURES: MARKET RISK |
We believe interest rate risk is the most significant market risk impacting us. We monitor and manage interest rate risk using interest rate sensitivity “gap” analysis to measure the impact of market interest rate changes on net interest income. See our Annual Report on Form 10-K for the fiscal year ended December 31, 2019 for disclosure of the quantitative and qualitative information regarding the interest rate risk inherent in interest rate risk sensitive instruments as of December 31, 2019. There have been no changes in the assumptions used in monitoring interest rate risk as of March 31, 2020. The impact of other types of market risk, such as foreign currency exchange risk and equity price risk, is deemed immaterial.
ITEM 4. | CONTROLS AND PROCEDURES |
Disclosure Controls and Procedures
As of the end of the period covered by this report, an evaluation was carried out under the supervision and with the participation of our management, including the Chief Executive Officer (CEO) and Chief Financial Officer (CFO), of the effectiveness of the
67
design and operation of our disclosure controls and procedures (as defined in Rules 13a-15(e) or 15d-15(e)). Based on that evaluation, the CEO and CFO have concluded that our disclosure controls and procedures are effective to ensure that information required to be disclosed by us in reports that we file or submit under the Securities Exchange Act of 1934 are recorded, processed, summarized and reported within the time periods specified in Securities and Exchange Commission rules and forms.
Changes in Internal Control Over Financial Reporting
On January 1, 2020, the Company adopted ASU 2016-13, “Financial Instruments – Credit Losses (Topic 326): Measurement of Credit Losses on Financial Instruments”. The Company implemented changes to the policies, processes, and controls over the estimation of the allowance for credit losses to support the adoption of ASU 2016-13. Many controls under this new standard mirror controls under prior GAAP. New controls were established over the review of economic forecasting projections obtained from an independent third party. Except as related to the adoption of ASU 2016 13, there were no changes in the Company’s internal control over financial reporting (as defined in Rules 13a-15(f) and 15d-15(f) under the Exchange Act) that occurred during the quarter ended March 31, 2020, that have materially affected, or are reasonably likely to materially affect, the Company’s internal control over financial reporting.
PART II. OTHER INFORMATION
Item 1. | Legal Proceedings |
In March and April 2020, seven complaints were filed against the Company pursuant to its proposed merger with South State Corporation. Additional litigation may be filed against the Company and the Company’s Board of Directors in the future, which could prevent or delay the completion of the merger or result in the payment of damages. Please refer to the definitive proxy statement filed on Schedule 14A by the Company on April 20, 2020 for more information regarding the complaints.
Item 1a. | Risk Factors |
As companies operating in the financial services industry, the businesses and operations of the Company may be adversely affected in numerous and complex ways, including as a result of adverse economic conditions, natural and human disasters or other international or domestic calamities, including the global coronavirus pandemic.
The Company’s businesses and operations, which primarily consist of lending money to customers in the form of loans, borrowing money from customers in the form of deposits and investing in securities, are sensitive to general business and economic conditions in the United States. Uncertainty about federal fiscal monetary and related policies, the medium and long-term fiscal outlook of the federal government, and future tax rates is a concern for businesses, consumers and investors in the United States. Changes in any of these policies are influenced by macroeconomic conditions and other factors that are beyond the control of the Company.
In addition, adverse economic, social and political conditions in the United States and in foreign countries, including adverse conditions resulting from natural disasters, acts of terrorism, outbreaks of hostilities or other domestic or international calamities, epidemics and pandemics, and other matters beyond the control of the Company, and the government policy responses to such conditions, could have an adverse effect on the businesses, financial condition, results of operations, prospects and trading prices of the Company during the time the proposed merger with South State is pending and the combined company following the completion of the proposed merger.
For example, the recent global coronavirus outbreak could harm the business, financial condition and results of operations of the Company during the time the merger is pending and the combined company following the completion of the merger. In December 2019, a novel strain of coronavirus, COVID-19, was reported in Wuhan, China. The coronavirus has since spread rapidly to other countries, including the United States, and the World Health Organization formally declared the coronavirus outbreak a pandemic in March 2020. Global health concerns relating to the coronavirus pandemic have been weighing on the macroeconomic environment, leading to lower interest rates, depressed equity market valuations, heightened financial market volatility and significant disruption in banking and other financial activity in the areas in which the Company operates and in a broad range of industries in which the customers of the Company operate. The financial performance of the Company generally, and in particular the ability of borrowers to pay interest on and repay principal of outstanding loans and the value of collateral securing those loans, as well as demand for loans and other products and services that each company offers and whose success it relies on to drive growth, is highly dependent upon the business environment in the primary markets in which it operates and in the United States as a whole. Unfavorable market conditions and uncertainty due to the coronavirus pandemic may result in a deterioration in the credit quality of borrowers, an increase in the number of loan delinquencies, defaults and charge-offs, additional provisions for credit losses, adverse asset values of the collateral securing loans and an overall material adverse effect on the quality of the loan portfolio of the Company and the combined company following the completion of the proposed merger with South State. In addition, following the coronavirus outbreak in December 2019 and January 2020, market interest rates have declined significantly. On March 3, 2020, the Federal Open Market Committee
68
(‘‘FOMC’’) reduced the target federal funds rate by 50 basis points to 1.00% to 1.25%. Subsequently on March 16, 2020, the FOMC further reduced the target federal funds rate by an additional 100 basis points to 0.00% to 0.25%. These reductions in interest rates, and continued fluctuations in the interest rate environment as a result of changes in monetary policies of the Federal Reserve Board, including in connection with efforts to address the economic fallout from the coronavirus outbreak, could have significant adverse effects on the earnings, financial condition and results of operations of the Company during the time the proposed merger with South State is pending and the combined company following the completion of the proposed merger. The extent to which the coronavirus impacts the businesses of the Company will depend on future developments in the United States and around the world, which are highly uncertain and cannot be predicted, including new information which may emerge concerning the severity of the coronavirus and the actions required to contain and treat it, among others. There can be no assurance that efforts by the Company during the time the proposed merger with South State is pending and the combined company following the completion of the proposed merger to address the adverse impacts of the coronavirus will be effective. If the Company is unable to recover from a business disruption on a timely basis, the Company’s business, financial condition and results of operations may be adversely affected. The coronavirus outbreak could also delay, increase the costs of, or otherwise adversely affect, the integration of the businesses of the two companies following the completion of the proposed merger and make it more difficult for the combined company to realize anticipated synergies and cost savings in the amounts estimated or in the time frame contemplated or at all. All of these factors could be detrimental to the Company and the combined company’s businesses, and the interplay between these factors can be complex and unpredictable.
From time to time, the Company is, or may become, the subject of self-regulatory agency information-gathering requests, reviews, investigations and proceedings, and other forms of regulatory inquiry, including by bank regulatory agencies, the SEC and law enforcement authorities. For example, the Company is subject to an ongoing SEC investigation that CenterState believes primarily relates to its EPS calculations. The Company has been fully cooperating with the SEC in this investigation. The SEC investigation could lead to the institution of civil or administrative proceedings against the Company as well as against individuals associated with the Company. Any such proceedings might result in the imposition of monetary fines or other sanctions against the named parties. Resulting sanctions could include remedial measures that might prove costly or disruptive to the Company's business. In addition to the risk of fines, sanctions, or monetary judgments, the SEC investigation may cause the Company to incur significant attorneys' fees. The Company believes that its financial statements filed with the SEC in Forms 10-K and 10-Q present fairly, in all material respects, its financial condition, results of operations and cash flows as of or for the periods ending on their respective dates.
In addition to the other information set forth in this Quarterly Report, you should carefully consider the factors discussed in Part I, Item 1A. “Risk Factors” in our Annual Report on Form 10-K for our fiscal year ended December 31, 2019. The risks discussed in our Annual Report on Form 10-K could materially affect our business, financial condition and future results. The risks described in our Annual Report on Form 10-K are not the only risks facing us. For factors associated with the proposed merger with South State, please refer to the definitive proxy statement filed on Schedule 14A by the Company on April 20, 2020 for more information regarding these risk factors. Additional risks and uncertainties not currently known to us or that we currently deem to be insignificant also may materially and adversely affect our business, financial condition or operating results in the future.
Item 2.Unregistered Sales of Equity Securities and Use of Proceeds
|
|
|
| Total Number | Maximum Number |
|
|
|
| of Shares | of Shares that |
|
| Total |
| Purchased as | may yet be |
|
| Number of | Average | part of Publicly | Purchased Under |
|
| Shares | Price paid | Announced Plans | the Plans or |
Beginning Period | Ending Period | Purchased | per Share | or Programs | Programs |
January 1, 2020 | January 31, 2020 | 105,265 | $22.88 | 100,000 | 6,400,000 |
February 1, 2020 | February 28, 2020 | 1,302,655 | $23.03 | 1,277,934 | 5,122,066 |
March 1, 2020 | March 31, 2020 | 72,066 | $20.83 | 72,066 | 5,050,000 |
Total for quarter ending March 31, 2020 | 1,479,986 | $22.92 | 1,450,000 | 5,050,000 | |
During the first quarter of 2020, we repurchased 1,450,000 shares of our common stock, at an average price of approximately $22.89 per share, pursuant to our stock repurchase plan currently in place. We repurchased 29,986 shares of our common stock from our employees during the first quarter of 2020 for settlement of certain tax withholding obligations related to certain equity based compensation awards.
Item 3. | Defaults Upon Senior Securities |
None.
Item 4. | [Removed and Reserved] |
Item 5. | Other Information |
None
69
Item 6. | Exhibits |
|
|
|
| ||
|
|
|
|
|
|
|
|
|
|
|
|
Exhibit 101.1 |
|
Interactive Data File |
101.INS |
|
Inline XBRL Instance Document - the instance document does not appear in the Interactive Data File because its XBRL tags are embedded within the Inline XBRL document. |
101.SCH |
|
Inline XBRL Taxonomy Extension Schema Document |
101.CAL |
|
Inline XBRL Taxonomy Extension Calculation Linkbase Document |
101.DEF |
|
Inline XBRL Taxonomy Extension Definition Linkbase Document |
101.LAB |
|
Inline XBRL Taxonomy Extension Label Linkbase Document |
101.PRE |
|
Inline XBRL Taxonomy Extension Presentation Linkbase Document |
104 |
|
The cover page from the Company’s Quarterly Report on Form 10-Q for the quarter ended March 31, 2020, has been formatted in Inline XBRL. |
|
|
|
70
CENTERSTATE BANK CORPORATION
SIGNATURES
In accordance with the requirements of the Securities Exchange Act of 1934, the Registrant has duly caused this report to be signed on its behalf by the undersigned thereunto duly authorized.
CENTERSTATE BANK CORPORATION
(Registrant)
Date: April 30, 2020 |
|
|
| By: |
| /s/ John C. Corbett |
|
|
|
|
|
| John C. Corbett |
|
|
|
|
|
| President and Chief Executive Officer |
Date: April 30, 2020 |
|
|
| By: |
| /s/ William E. Matthews, V |
|
|
|
|
|
| William E. Matthews, V |
|
|
|
|
|
| Executive Vice President |
|
|
|
|
|
| and Chief Financial Officer |
71