Exhibit 99.1

Blackstone Reports Fourth Quarter and Full Year 2019 Results
New York, January 30, 2020: Blackstone (NYSE:BX) today reported its fourth quarter and full year 2019 results.
Stephen A. Schwarzman, Chairman and Chief Executive Officer, said, “2019 was a momentous year for Blackstone and our shareholders. In addition to delivering another year of outstanding results, we converted to a corporation, allowing a vastly wider universe of investors to own our stock. We continued to expand our leading investment platforms into new areas, driving $134 billion of capital inflows during the year, and enabling us to deploy $63 billion – both records for the firm. We ended the year with $571 billion of Assets Under Management, also a record and up 21% year-over-year, including $104 billion of perpetual capital. As we enter the new decade, the outlook has never been stronger, with Blackstone positioned as the clear reference institution in the fast-growing alternatives sector.”
Blackstone issued a full detailed presentation of its fourth quarter and full year 2019 results, which can be viewed atwww.blackstone.com.
Dividend
Blackstone has declared a quarterly dividend of $0.61 per common share to record holders of common shares at the close of business on February 10, 2020. This dividend will be paid on February 18, 2020.
Quarterly Investor Call Details
Blackstone will host a conference call on January 30, 2020 at 9:00 a.m. ET to discuss fourth quarter and full year 2019 results. The conference call can be accessed via the Shareholders section of Blackstone’s website atwww.blackstone.com or by dialing +1 (866) 318-8619 (U.S. domestic) or +1 (617) 399-5138 (international), passcode 149 943 55#. For those unable to listen to the live broadcast, a replay will be available onwww.blackstone.com or by dialing +1 (888) 286-8010 (U.S. domestic) or +1 (617) 801-6888 (international), passcode 461 589 63#.
About Blackstone
Blackstone is one of the world’s leading investment firms. We seek to create positive economic impact and long-term value for our investors, the companies we invest in, and the communities in which we work. We do this by using extraordinary people and flexible capital to help companies solve problems. Our asset management businesses, with $571 billion in assets under management, include investment vehicles focused on
The Blackstone Group Inc. 345 Park Avenue New York, New York 10154 T 212 583 5000 |
private equity, real estate, public debt and equity, growth equity, opportunistic, non-investment grade credit, real assets and secondary funds, all on a global basis. Further information is available atwww.blackstone.com. Follow Blackstone on Twitter@Blackstone.
Forward-Looking Statements
This presentation may contain forward-looking statements within the meaning of Section 27A of the Securities Act of 1933 and Section 21E of the Securities Exchange Act of 1934 which reflect our current views with respect to, among other things, our operations, taxes, earnings and financial performance, share repurchases and dividends. You can identify these forward-looking statements by the use of words such as “outlook,” “indicator,” “believes,” “expects,” “potential,” “continues,” “may,” “will,” “should,” “seeks,” “approximately,” “predicts,” “intends,” “plans,” “estimates,” “anticipates” or the negative version of these words or other comparable words. Such forward-looking statements are subject to various risks and uncertainties. Accordingly, there are or will be important factors that could cause actual outcomes or results to differ materially from those indicated in these statements. We believe these factors include but are not limited to those described under the section entitled “Risk Factors” in our Annual Report on Form 10-K for the year ended December 31, 2018 and in our Quarterly Report on Form 10-Q for the quarter ended March 31, 2019, as such factors may be updated from time to time in our periodic filings with the United States Securities and Exchange Commission (“SEC”), which are accessible on the SEC’s website at www.sec.gov. These factors should not be construed as exhaustive and should be read in conjunction with the other cautionary statements that are included in this report and in our other periodic filings. The forward-looking statements speak only as of the date of this report, and we undertake no obligation to publicly update or review any forward-looking statement, whether as a result of new information, future developments or otherwise.
This presentation does not constitute an offer of any Blackstone Fund.
Investor and Media Relations Contacts
Weston Tucker Blackstone Tel: +1 (212) 583-5231 tucker@blackstone.com | Christine Anderson Blackstone Tel: +1 (212) 583-5182 christine.anderson@blackstone.com |
2
 January 30, 2020 Blackstone’s Fourth Quarter and Full Year 2019 Earnings |
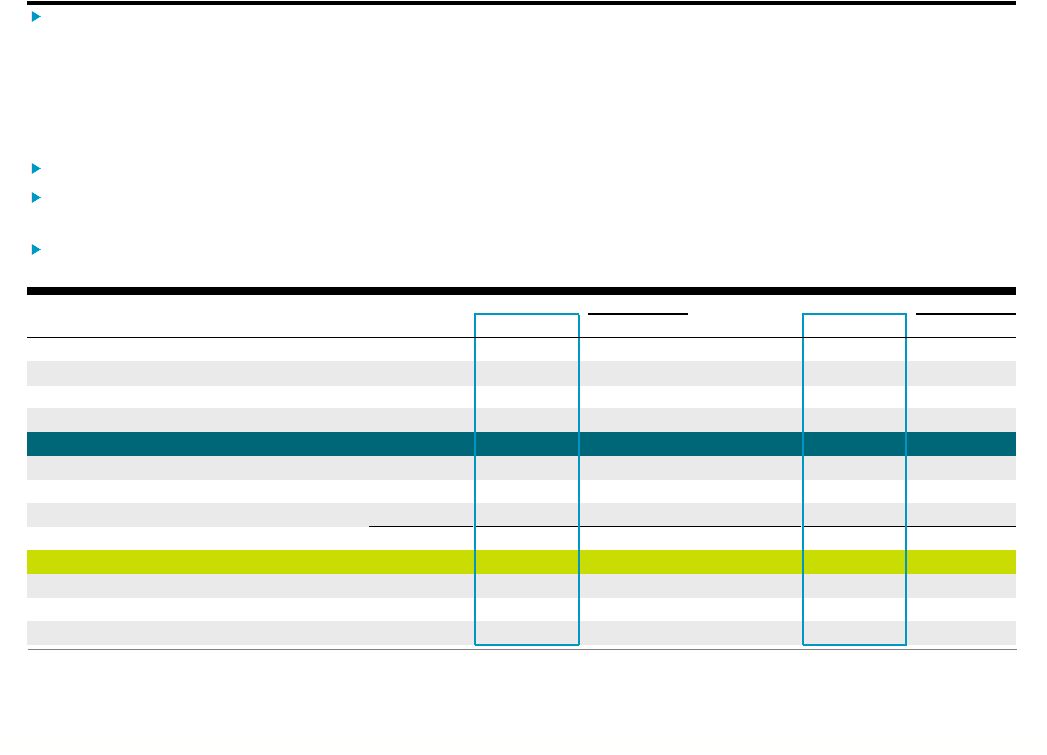
 Blackstone 1 Income (Loss) Before Provision (Benefit) for Taxes Margin is calculated by dividing Income (Loss) Before Provision (Benefit) for Taxes by Total Revenues. Effective July 1, 2019, The Blackstone Group L.P. converted from a Delaware limited partnership to a Delaware corporation, The Blackstone Group Inc. (the “Conversion”). This presentation includes results for The Blackstone Group L.P. prior to the Conversion. As of any time prior to the Conversion, references to “Blackstone,” “the Company,” “our” and similar terms mean The Blackstone Group L.P. and its consolidated subsidiaries and, as of any time after the Conversion, The Blackstone Group Inc. and its consolidated subsidiaries. All references to shares or per share amounts prior to the Conversion refer to units or per unit amounts. Blackstone’s Fourth Quarter and Full Year 2019 GAAP Results GAAP Net Income was $978 million for the quarter and $3.9 billion for the year. GAAP Net Income Attributable to The Blackstone Group Inc. was $483 million for the quarter and $2.0 billion for the year. (Dollars in Thousands, Except per Share Data) (Unaudited) 4Q'18 4Q'19 FY'18 FY'19 Revenues Management and Advisory Fees, Net 797,554 $ 943,900 $ 3,027,796 $ 3,472,155 $ Incentive Fees 15,797 87,610 57,540 129,911 Investment Income (Loss) Performance Allocations Realized 511,388 717,555 1,876,507 1,739,000 Unrealized (806,305) 128,231 561,373 1,126,332 Principal Investments Realized 109,901 100,535 415,862 393,478 Unrealized (218,165) 67,913 49,917 215,003 Total Investment Income (Loss) (403,181) 1,014,234 2,903,659 3,473,813 Interest and Dividend Revenue 47,885 52,146 171,947 182,398 Other 46,923 (6,410) 672,317 79,993 Total Revenues 504,978 2,091,480 6,833,259 7,338,270 Expenses Compensation and Benefits Compensation 373,790 447,646 1,609,957 1,820,330 Incentive Fee Compensation 10,260 24,589 33,916 44,300 Performance Allocations Compensation Realized 212,174 295,059 711,076 662,942 Unrealized (302,868) 93,845 319,742 540,285 Total Compensation and Benefits 293,356 861,139 2,674,691 3,067,857 General, Administrative and Other 153,519 186,971 594,873 679,408 Interest Expense 44,644 60,688 163,990 199,648 Fund Expenses 3,577 5,229 78,486 17,738 Total Expenses 495,096 1,114,027 3,512,040 3,964,651 Other Income (Loss) Change in Tax Receivable Agreement Liability - (13,039) - 161,567 Net Gains (Losses) from Fund Investment Activities (59,234) 42,923 191,722 282,829 Income (Loss) Before Provision (Benefit) or Taxes (49,352) $ 1,007,337 $ 3,512,941 $ 3,818,015 $ Provision (Benefit) or Taxes 29,366 28,943 249,390 (47,952) Net Income (Loss) (78,718) $ 978,394 $ 3,263,551 $ 3,865,967 $ Net Loss Attributable to Redeemable Non-Controlling Interests in Consolidated Entities (4,303) (3,688) (2,104) (121) Net Income (Loss) Attributable to Non-Controlling Interests in Consolidated Entities (68,800) 120,796 358,878 476,779 Net Income Attributable to Non-Controlling Interests in Blackstone Holdings 5,253 378,137 1,364,989 1,339,627 Net Income (Loss) Attributable to The Blackstone Group Inc. (“BX”) (10,868) $ 483,149 $ 1,541,788 $ 2,049,682 $ Net Income (Loss) Per Share of Class A Common Stock, Basic (0.02) $ 0.71 $ 2.27 $ 3.03 $ Net Income (Loss) Per Share of Class A Common Stock, Diluted (0.02) $ 0.71 $ 2.26 $ 3.03 $ Income (Loss) Before Provision (Benefit) for Taxes Margin (9.8)% 48.2% 51.4% 52.0% |
 Blackstone 2 Blackstone’s Fourth Quarter and Full Year 2019 Highlights The changes in carrying value, fund returns and composite returns presented throughout this presentation represent those of the applicable Blackstone Funds and not those of Blackstone. See pages 32-33, Definitions and Dividend Policy, for definitions of terms used throughout this presentation. Unless otherwise noted, references to “common stock” and “common shares” refer to Class A common stock. Capital Metrics Total Assets Under Management (“AUM”) of $571.1 billion, up 21% year-over-year Inflows of $26.0 billion in the quarter and $134.4 billion for the year Realizations of $11.6 billion in the quarter and $40.2 billion for the year Deployment of $17.3 billion in the quarter and $62.9 billion for the year Capital Returned to Shareholders Dividend of $0.61 per common share payable on February 18, 2020 • Dividends of $1.95 per common share for the year Repurchased 1.5 million common shares in the quarter and 12.8 million common shares for the year Over $850 million distributed with respect to the fourth quarter to shareholders through dividends and share repurchases, and $3.0 billion for the year Financial Measures Fee Related Earnings (“FRE”) of $552 million ($0.46/share) in the quarter, up 27% year- over-year • FRE was $1.8 billion for the year ($1.49/share), up 23% year-over-year Distributable Earnings (“DE”) of $914 million ($0.72/share) in the quarter, up 27% year- over-year • DE was $2.9 billion for the year ($2.31/share), up 7% year-over-year Net Accrued Performance Revenues receivable of $4.3 billion ($3.61/share) |
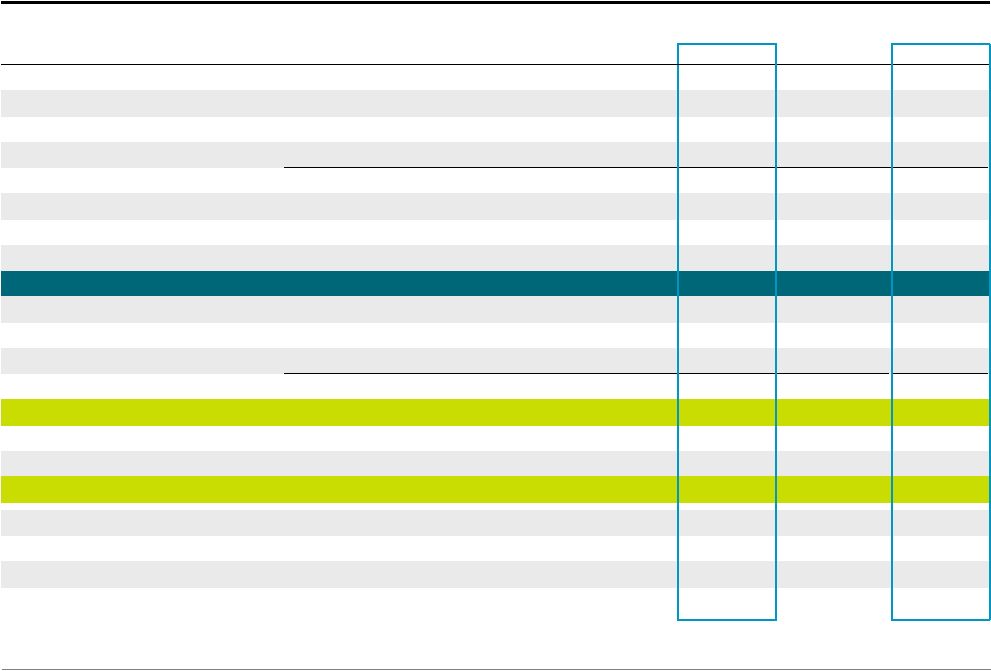
 Blackstone 3 Blackstone’s Fourth Quarter and Full Year 2019 Segment Earnings Fee Related Earnings per Share is based on end of period DE Shares Outstanding (see page 23, Share Summary). DE per Common Share is on DE Attributable to Common Shareholders (see page 22, Shareholder Dividends) and end of period Participating Common Shares outstanding. Full year per Share amounts represent the sum of the last four quarters. See pages 30-31 for the Reconciliation of GAAP to Total Segment Measures. % Change % Change (Dollars in Thousands, Except per Share Data) 4Q'18 4Q'19 vs. 4Q'18 FY'18 FY'19 vs. FY'18 Management and Advisory Fees, Net 798,195 $ 945,673 $ 18% 3,036,452 $ 3,484,236 $ 15% Fee Related Performance Revenues 44,185 156,373 254% 123,836 212,001 71% Fee Related Compensation (279,284) (388,879) 39% (1,216,146) (1,336,578) 10% Other Operating Expenses (130,025) (161,359) 24% (488,328) (571,142) 17% Fee Related Earnings 433,071 $ 551,808 $ 27% 1,455,814 $ 1,788,517 $ 23% FRE per Share 0.36 $ 0.46 $ 28% 1.21 $ 1.49 $ 23% Realized Performance Revenues 483,697 651,647 35% 1,811,771 1,660,642 (8)% Realized Performance Compensation (199,645) (249,359) 25% (678,141) (603,935) (11)% Realized Principal Investment Income 47,098 38,542 (18)% 236,058 224,155 (5)% Net Realizations 331,150 440,830 33% 1,369,688 1,280,862 (6)% Total Segment Distributable Earnings 764,221 $ 992,638 $ 30% 2,825,502 $ 3,069,379 $ 9% Net Interest Income (Loss) 11,923 (2,496) n/m 21,925 (2,441) n/m Taxes and Related Payables (54,063) (76,104) 41% (153,865) (196,159) 27% Distributable Earnings 722,081 $ 914,038 $ 27% 2,693,562 $ 2,870,779 $ 7% DE per Common Share 0.57 $ 0.72 $ 26% 2.17 $ 2.31 $ 6% Total Segment Revenues 1,373,175 $ 1,792,235 $ 31% 5,208,117 $ 5,581,034 $ 7% Total Assets Under Management 472,242,317 $ 571,122,463 $ 21% 472,242,317 $ 571,122,463 $ 21% Fee-Earning Assets Under Management 342,527,507 $ 408,074,852 $ 19% 342,527,507 $ 408,074,852 $ 19% |
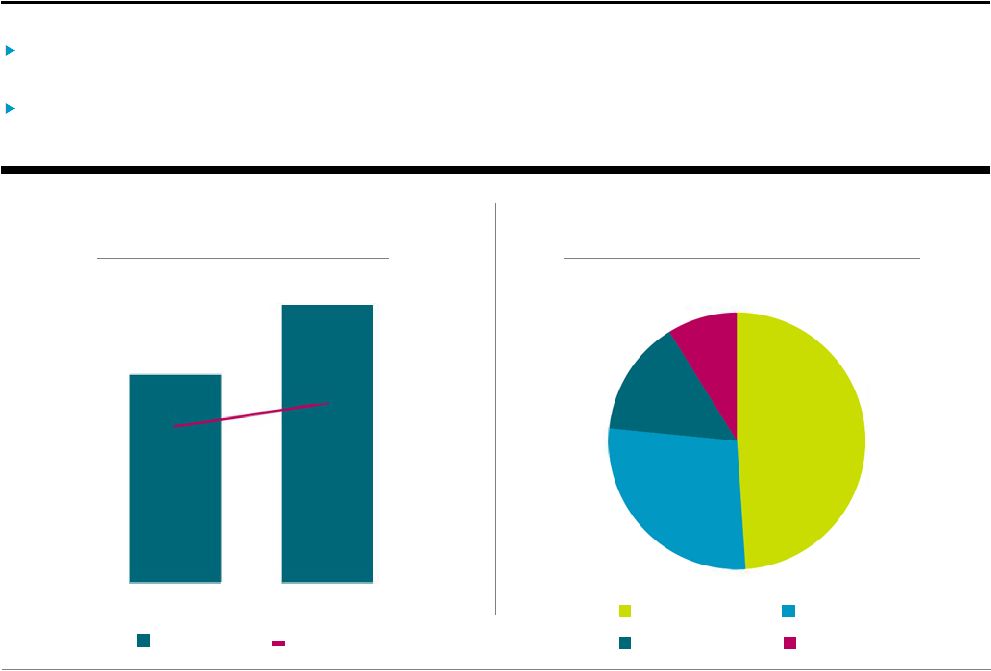 Blackstone 4 Summary of Financials Full year Fee Related Earnings of $1.49 per share, an increase of 23% year-over-year. Full year Total Segment Distributable Earnings were $3.1 billion, an increase of 9% year-over-year. Fee Related Earnings per Share (Per Share) FRE/Share FRE Margin Real Estate Private Equity Hedge Fund Solutions Credit Segment Distributable Earnings (Dollars in Millions) FY’19 Total: $3,069 FRE Margin is calculated by dividing Fee Related Earnings by Fee Related Revenues (defined as the sum of Total Segment Management and Advisory Fees, Net and Fee Related Performance Revenues). Totals may not add due to rounding. $1.21 $1.49 46.1% 48.4% FY'18 FY'19 $1,502 $847 $450 $270 |
  Blackstone 5 $3,523 $4,171 $4,314 $572 $429 4Q'18 3Q'19 Net Performance Revenues Net Realized Distributions 4Q'19 Investment Performance and Net Accrued Performance Revenues Positive overall appreciation drove Net Accrued Performance Revenues to $4.3 billion ($3.61/share), up 22% year- over-year. • Appreciation generated $572 million of additional Net Accrued Performance Revenues, relative to $429 million of Net Realized Distributions in the quarter. Net Accrued Performance Revenues (Dollars in Millions) Investment Performance (Appreciation / Gross Returns) Investment Performance represents fund appreciation for Real Estate and Private Equity and gross returns for Hedge Fund Solutions and Credit. Appreciation for core+ funds excludes BREIT. BPS Composite net returns were 2.0% and 7.3% for 4Q’19 and FY’19, respectively. Performing Credit net returns were 2.9% and 9.7% for 4Q’19 and FY’19, respectively. Distressed net returns were (1.1)% and (6.0)% for 4Q’19 and FY’19, respectively. Effective with the 4Q’19 Earnings Release, Credit returns exclude funds in liquidation. Net Realized Distributions excludes Net Performance Revenues realized, but not yet distributed as of the reporting date which are included in the Net Accrued Performance Revenues balance. 4Q'19 FY'19 Real Estate Opportunistic Funds 4.7% 17.6% Core+ 2.9% 9.2% Private Equity Corporate Private Equity 1.5% 9.3% Tactical Opportunities 7.7% 13.1% Strategic Partners 5.4% 17.0% Hedge Fund Solutions BPS Composite 2.2% 8.2% Credit Performing Credit 3.8% 13.4% Distressed (0.8)% (4.4)% |
 Blackstone 6 Capital Metrics Activity Inflows were $26.0 billion in the quarter, bringing full year inflows to $134.4 billion. Realizations were $11.6 billion in the quarter and $40.2 billion for the year. Deployed $17.3 billion in the quarter and $62.9 billion for the year. • Committed an additional $5.3 billion during the quarter that is not yet deployed. (Dollars in Millions) Private Equity includes Corporate Private Equity, Core Private Equity, Life Sciences, and BTAS. Inflows Realizations Capital Deployed 4Q'19 FY'19 4Q'19 FY'19 4Q'19 FY'19 8,046 $ 34,191 $ 6,474 $ 18,098 $ 7,269 $ 22,458 $ Opportunistic 948 16,212 4,994 13,104 4,501 11,006 Core+ 3,986 11,952 906 2,709 2,536 9,844 BREDS 3,111 6,026 575 2,285 232 1,608 8,304 56,837 2,307 13,541 5,772 26,601 Private Equity 5,710 31,936 1,013 7,669 3,736 10,215 Tactical Opportunities 1,106 5,378 375 3,164 536 4,686 Strategic Partners 1,488 11,234 920 2,708 1,500 9,198 Infrastructure - 8,289 - - - 2,503 Hedge Fund Solutions BAAM 2,697 12,243 483 1,272 712 3,704 Credit GSO/BIS/Harvest 6,921 31,107 2,334 7,291 3,587 10,185 Total Blackstone 25,968 $ 134,377 $ 11,599 $ 40,202 $ 17,339 $ 62,948 $ Real Estate Private Equity Total Real Estate Total Private Equity |
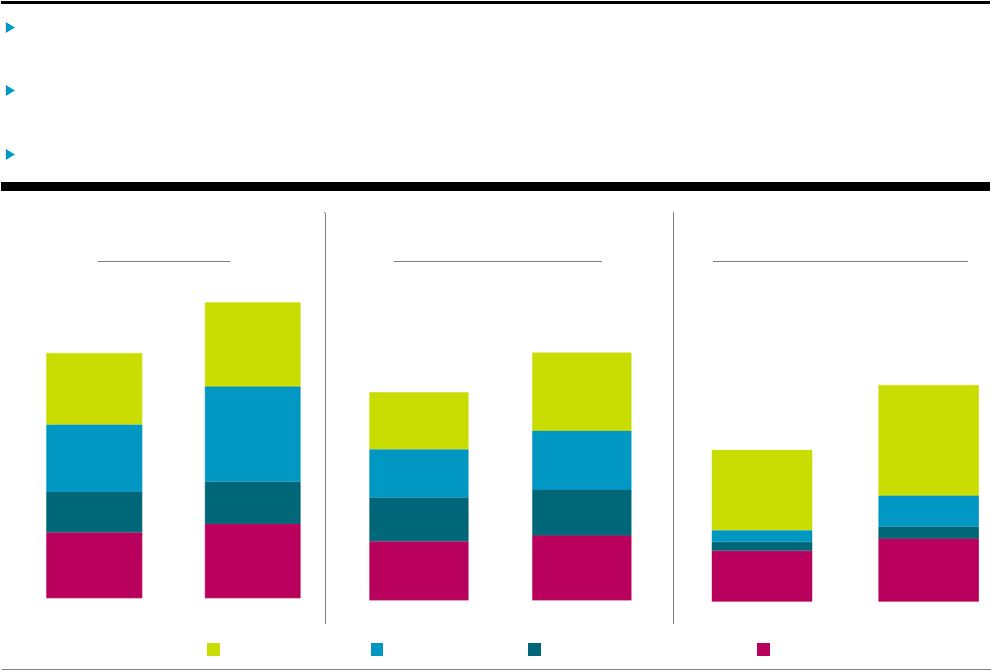 Blackstone 7 Assets Under Management Total AUM increased to $571.1 billion, up 21% year-over-year, with $26.0 billion of inflows in the quarter and $134.4 billion for the year. Fee-Earning AUM of $408.1 billion was up 19% year-over-year, with $27.4 billion of inflows in the quarter and $112.2 billion for the year. Perpetual Capital AUM reached $103.7 billion, up 43% year-over-year. Fee-Earning AUM (Dollars in Billions) Total AUM (Dollars in Billions) Real Estate Hedge Fund Solutions Credit Private Equity Perpetual Capital AUM (Dollars in Billions) $127.5 $144.3 $77.8 $80.7 $130.7 $182.9 $136.2 $163.2 $472.2 $571.1 4Q'18 4Q'19 $97.0 $106.5 $72.3 $75.6 $80.0 $97.8 $93.3 $128.2 $342.5 $408.1 4Q'18 4Q'19 $24.4 $30.2 $4.3 $6.1 $5.8 $14.5 $38.1 $52.9 $72.6 $103.7 4Q'18 4Q'19 |
 Blackstone 8 Additional Capital Detail Invested Performance Revenue Eligible AUM reached $248.7 billion at quarter end, up 18% year-over-year. Undrawn capital (“Total Dry Powder”) available for investment of $151.1 billion, driven by fundraising activity for the latest flagship funds. Total Dry Powder (Dollars in Billions) 4Q’19 Total: $151.1 Invested Performance Revenue Eligible AUM (Dollars in Billions) Real Estate Private Equity Hedge Fund Solutions Credit Invested Performance Revenue Eligible AUM represents the fair value of invested assets that are eligible to earn performance revenues. $45.7 $74.0 $2.7 $28.7 $22.9 $26.0 $42.4 $43.8 $59.5 $73.5 $85.5 $105.4 $210.3 $248.7 4Q'18 4Q'19 |
 Segment Highlights |
 Blackstone 10 Real Estate Appreciation for core+ funds excludes BREIT. Total AUM: Increased 20% to a record $163.2 billion with inflows of $8.0 billion in the quarter and $34.2 billion for the year. • Inflows during the quarter included $2.8 billion in BREIT, $1.8 billion in the fourth real estate debt fund, and an additional $442 million in BREP Europe VI, which commenced its investment period on October 9. • Core+ Total AUM increased 31% to $46.2 billion with BREIT surpassing $13.1 billion after three years. • Perpetual Capital AUM of $52.9 billion, up 39% year-over-year, now represents one-third of Total AUM. Realizations: $6.5 billion in the quarter and $18.1 billion for the year; realizations in the quarter included the sale of Hembla, a Swedish multifamily portfolio, and the final secondary sale of Invitation Homes shares. • $150 million of Fee Related Performance Revenues in the quarter driven by BREIT’s annual crystallization. Capital Deployed: $7.3 billion in the quarter and a record $22.5 billion for the year; deployment in the quarter included the acquisition of a last-mile U.S. logistics portfolio in BREP and the Bellagio Las Vegas in BREIT. Appreciation: Opportunistic funds and core+ funds appreciated 4.7% and 2.9% in the quarter, and 17.6% and 9.2% for the year, respectively. % Change % Change (Dollars in Thousands) 4Q'18 4Q'19 vs. 4Q'18 FY'18 FY'19 vs. FY'18 Management Fees, Net 317,269 $ 370,833 $ 17% 1,126,470 $ 1,265,178 $ 12% Fee Related Performance Revenues 44,185 149,889 239% 124,502 198,237 59% Fee Related Compensation (109,695) (186,465) 70% (459,430) (531,259) 16% Other Operating Expenses (41,030) (45,335) 10% (146,260) (168,332) 15% Fee Related Earnings 210,729 $ 288,922 $ 37% 645,282 $ 763,824 $ 18% Realized Performance Revenues 172,985 474,203 174% 914,984 1,032,337 13% Realized Performance Compensation (54,179) (190,910) 252% (284,319) (374,096) 32% Realized Principal Investment Income 11,439 16,476 44% 92,525 79,733 (14)% Net Realizations 130,245 299,769 130% 723,190 737,974 2% Segment Distributable Earnings 340,974 $ 588,691 $ 73% 1,368,472 $ 1,501,798 $ 10% Segment Revenues 545,878 $ 1,011,401 $ 85% 2,258,481 $ 2,575,485 $ 14% Total AUM 136,247,229 $ 163,156,064 $ 20% 136,247,229 $ 163,156,064 $ 20% Fee-Earning AUM 93,252,724 $ 128,214,137 $ 37% 93,252,724 $ 128,214,137 $ 37% |
 Blackstone 11 Private Equity Total AUM: Increased 40% to a record $182.9 billion with inflows of $8.3 billion in the quarter and $56.8 billion for the year. • Inflows in the quarter primarily driven by $3.2 billion for the latest life sciences fund, $862 million for the third secondaries infrastructure fund, and $463 million for the final close of BCP VIII. Realizations: $2.3 billion in the quarter and $13.5 billion for the year. Capital Deployed: $5.8 billion in the quarter and $26.6 billion for the year across regions; committed an additional $2.4 billion that was not yet deployed in the quarter, including MagicLab. Appreciation: Corporate Private Equity appreciated 1.5% in the quarter and 9.3% for the year. % Change % Change (Dollars in Thousands) 4Q'18 4Q'19 vs. 4Q'18 FY'18 FY'19 vs. FY'18 Management and Advisory Fees, Net 212,443 $ 278,352 $ 31% 829,884 $ 1,064,329 $ 28% Fee Related Compensation (86,089) (105,285) 22% (375,446) (423,752) 13% Other Operating Expenses (29,244) (47,145) 61% (133,096) (160,010) 20% Fee Related Earnings 97,110 $ 125,922 $ 30% 321,342 $ 480,567 $ 50% Realized Performance Revenues 252,100 65,255 (74)% 757,406 468,992 (38)% Realized Performance Compensation (110,209) (37,895) (66)% (318,167) (192,566) (39)% Realized Principal Investment Income 26,385 10,227 (61)% 109,731 90,249 (18)% Net Realizations 168,276 37,587 (78)% 548,970 366,675 (33)% Segment Distributable Earnings 265,386 $ 163,509 $ (38)% 870,312 $ 847,242 $ (3)% Segment Revenues 490,928 $ 353,834 $ (28)% 1,697,021 $ 1,623,570 $ (4)% Total AUM 130,665,286 $ 182,886,109 $ 40% 130,665,286 $ 182,886,109 $ 40% Fee-Earning AUM 80,008,166 $ 97,773,964 $ 22% 80,008,166 $ 97,773,964 $ 22% |
 Blackstone 12 Hedge Fund Solutions The BPS Composite gross and net returns are based on the BAAM Principal Solutions (“BPS”) Composite, which does not include BAAM’s individual investor solutions (liquid alternatives), strategic capital (seeding and minority interests), strategic opportunities (co-invests), and advisory (non-discretionary) platforms, except for investments by BPS funds directly into those platforms. BAAM-managed funds in liquidation and non fee-paying assets (net returns only) are also excluded. The funds/accounts that comprise the BPS Composite are not managed within a single fund or account and are managed with different mandates. There is no guarantee that BAAM would have made the same mix of investments in a stand-alone fund/account. The BPS Composite is not an investible product and, as such, the performance of the BPS Composite does not represent the performance of an actual fund or account. Total AUM: Increased 4% to $80.7 billion with inflows of $2.7 billion in the quarter and $12.2 billion for the year. • Held the second close for the second GP stakes fund in the quarter, bringing its Total AUM to $2.4 billion. • Individual Investor Solutions had $381 million of net inflows in the quarter and $1.3 billion for the year. • Record year for market appreciation for the segment of $5.4 billion. • January 1 subscriptions of $631 million are not yet included in Total AUM. Returns: BPS Composite gross returns of 2.2% in the quarter (2.0% net). • Gross returns of 8.2% for the year (7.3% net), with less than one fifth of the volatility of broader markets. % Change % Change (Dollars in Thousands) 4Q'18 4Q'19 vs. 4Q'18 FY'18 FY'19 vs. FY'18 Management Fees, Net 132,611 $ 143,399 $ 8% 522,869 $ 560,125 $ 7% Fee Related Compensation (38,557) (33,486) (13)% (162,172) (151,960) (6)% Other Operating Expenses (19,740) (22,507) 14% (77,772) (81,999) 5% Fee Related Earnings 74,314 $ 87,406 $ 18% 282,925 $ 326,166 $ 15% Realized Performance Revenues 20,987 108,677 418% 42,419 126,576 198% Realized Performance Compensation (14,401) (19,713) 37% (21,792) (24,301) 12% Realized Principal Investment Income 6,609 8,204 24% 17,039 21,707 27% Net Realizations 13,195 97,168 636% 37,666 123,982 229% Segment Distributable Earnings 87,509 $ 184,574 $ 111% 320,591 $ 450,148 $ 40% Segment Revenues 160,207 $ 260,280 $ 62% 582,327 $ 708,408 $ 22% Total AUM 77,814,516 $ 80,738,112 $ 4% 77,814,516 $ 80,738,112 $ 4% Fee-Earning AUM 72,280,606 $ 75,636,004 $ 5% 72,280,606 $ 75,636,004 $ 5% |
 Blackstone 13 Credit Performing Credit includes mezzanine lending funds, middle market direct lending funds, including our BDCs, and other performing credit strategy funds. Distressed includes credit alpha strategies, stressed/distressed funds and energy strategies. The gross returns represent a weighted-average composite of the fee-earning funds exceeding $100 million of fair value at each respective quarter end for each strategy. Performing Credit net returns were 2.9% for 4Q’19 and Distressed net returns were (1.1)% for 4Q’19. Credit returns exclude Blackstone Funds that were contributed to GSO as part of Blackstone’s acquisition of GSO in March 2008. In addition, effective with the 4Q’19 Earnings Release, Credit returns exclude funds in liquidation. Total AUM: Increased 13% to a record $144.3 billion with inflows of $6.9 billion in the quarter and $31.1 billion for the year. • U.S. Direct Lending strategy had inflows of $2.0 billion in the quarter and $6.2 billion for the year, bringing Total AUM to $12.4 billion. • European Direct Lending strategy raised $1.4 billion in the quarter and $4.0 billion for the year. • Insurance Solutions had $844 million of gross inflows in the quarter and $8.1 billion for the year. Realizations: $2.3 billion in the quarter and $7.3 billion for the year. Capital Deployed: $3.6 billion in the quarter, driven by the U.S. Direct Lending strategy, and $10.2 billion for the year; committed an additional $1.7 billion in the quarter that is not yet deployed. Returns: Gross returns of 3.8% in the quarter for Performing Credit; gross returns of (0.8)% in the quarter for Distressed driven by certain energy and select other positions. % Change % Change (Dollars in Thousands) 4Q'18 4Q'19 vs. 4Q'18 FY'18 FY'19 vs. FY'18 Management Fees, Net 135,872 $ 153,089 $ 13% 557,229 $ 594,604 $ 7% Fee Related Performance Revenues - 6,484 n/m (666) 13,764 n/m Fee Related Compensation (44,943) (63,643) 42% (219,098) (229,607) 5% Other Operating Expenses (40,011) (46,372) 16% (131,200) (160,801) 23% Fee Related Earnings 50,918 $ 49,558 $ (3)% 206,265 $ 217,960 $ 6% Realized Performance Revenues 37,625 3,512 (91)% 96,962 32,737 (66)% Realized Performance Compensation (20,856) (841) (96)% (53,863) (12,972) (76)% Realized Principal Investment Income 2,665 3,635 36% 16,763 32,466 94% Net Realizations 19,434 6,306 (68)% 59,862 52,231 (13)% Segment Distributable Earnings 70,352 $ 55,864 $ (21)% 266,127 $ 270,191 $ 2% Segment Revenues 176,162 $ 166,720 $ (5)% 670,288 $ 673,571 $ 0% Total AUM 127,515,286 $ 144,342,178 $ 13% 127,515,286 $ 144,342,178 $ 13% Fee-Earning AUM 96,986,011 $ 106,450,747 $ 10% 96,986,011 $ 106,450,747 $ 10% |
 Supplemental Details |
 Blackstone 15 Total Segments Total Capital Invested has been updated for 2Q’19. (Dollars in Thousands) 4Q'18 1Q'19 2Q'19 3Q'19 4Q'19 FY'18 FY'19 Management and Advisory Fees, Net Base Management Fees 722,648 $ 757,518 $ 805,315 $ 809,729 $ 873,368 $ 2,844,325 $ 3,245,930 $ Transaction, Advisory and Other Fees, Net 77,576 65,150 61,495 92,702 95,073 229,498 314,420 Management Fee Offsets (2,029) (8,606) (22,654) (22,086) (22,768) (37,371) (76,114) Total Management and Advisory Fees, Net 798,195 814,062 844,156 880,345 945,673 3,036,452 3,484,236 Fee Related Performance Revenues 44,185 7,779 13,624 34,225 156,373 123,836 212,001 Fee Related Compensation (279,284) (324,031) (293,834) (329,834) (388,879) (1,216,146) (1,336,578) Other Operating Expenses (130,025) (123,311) (142,121) (144,351) (161,359) (488,328) (571,142) Fee Related Earnings 433,071 $ 374,499 $ 421,825 $ 440,385 $ 551,808 $ 1,455,814 $ 1,788,517 $ Realized Performance Revenues 483,697 246,769 341,386 420,840 651,647 1,811,771 1,660,642 Realized Performance Compensation (199,645) (85,240) (125,466) (143,870) (249,359) (678,141) (603,935) Realized Principal Investment Income 47,098 25,908 123,557 36,148 38,542 236,058 224,155 Total Net Realizations 331,150 187,437 339,477 313,118 440,830 1,369,688 1,280,862 Total Segment Distributable Earnings 764,221 $ 561,936 $ 761,302 $ 753,503 $ 992,638 $ 2,825,502 $ 3,069,379 $ Net Interest Income (Loss) 11,923 5,061 2,761 (7,767) (2,496) 21,925 (2,441) Taxes and Related Payables (54,063) (29,039) (55,201) (35,815) (76,104) (153,865) (196,159) Distributable Earnings 722,081 $ 537,958 $ 708,862 $ 709,921 $ 914,038 $ 2,693,562 $ 2,870,779 $ Total Segment Revenues 1,373,175 $ 1,094,518 $ 1,322,723 $ 1,371,558 $ 1,792,235 $ 5,208,117 $ 5,581,034 $ Total Assets Under Management 472,242,317 $ 511,777,762 $ 545,482,337 $ 554,022,343 $ 571,122,463 $ 472,242,317 $ 571,122,463 $ Fee-Earning Assets Under Management 342,527,507 $ 352,993,394 $ 387,864,642 $ 394,138,443 $ 408,074,852 $ 342,527,507 $ 408,074,852 $ Total Capital Invested 16,349,738 $ 11,783,583 $ 17,669,109 $ 16,156,664 $ 17,339,074 $ 44,715,499 $ 62,948,430 $ |
 Blackstone 16 4Q’19 Total AUM Rollforward (Dollars in Millions) FY’19 Total AUM Rollforward (Dollars in Millions) Inflows include contributions, capital raised, other increases in available capital, purchases, inter-segment allocations and acquisitions. Outflows represent redemptions, client withdrawals and other decreases in available capital. Realizations represent realizations from the disposition of assets. Market Activity represents gains (losses) on portfolio investments and the impact of foreign exchange rate fluctuations. AUM is reported in the segment where the assets are managed. Assets Under Management 4Q’19 Fee-Earning AUM Rollforward (Dollars in Millions) FY’19 Fee-Earning AUM Rollforward (Dollars in Millions) Real Private Hedge Fund Estate Equity Solutions 3Q'19 157,076 $ 173,858 $ 81,154 $ 141,933 $ 554,022 $ Inflows 8,046 8,304 2,697 6,921 25,968 Outflows (349) (294) (4,142) (2,710) (7,494) Net Inflows (Outflows) 7,697 8,010 (1,444) 4,211 18,474 Realizations (6,474) (2,307) (483) (2,334) (11,599) Market Activity 4,857 3,325 1,511 532 10,225 4Q'19 163,156 $ 182,886 $ 80,738 $ 144,342 $ 571,122 $ QoQ Increase (Decrease) 4% 5% (1)% 2% 3% Credit Total Real Private Hedge Fund Estate Equity Solutions 3Q'19 116,749 $ 97,937 $ 74,878 $ 104,574 $ 394,138 $ Inflows 17,108 1,682 3,342 5,261 27,392 Outflows (3,302) (1,072) (3,506) (1,748) (9,628) Net Inflows (Outflows) 13,806 610 (165) 3,513 17,764 Realizations (3,867) (813) (449) (1,812) (6,941) Market Activity 1,525 41 1,371 176 3,114 4Q'19 128,214 $ 97,774 $ 75,636 $ 106,451 $ 408,075 $ QoQ Increase (Decrease) 10% (0)% 1% 2% 4% Credit Total Real Private Hedge Fund Estate Equity Solutions 4Q'18 136,247 $ 130,665 $ 77,815 $ 127,515 $ 472,242 $ Inflows 34,191 56,837 12,243 31,107 134,377 Outflows (2,665) (1,065) (13,434) (11,629) (28,793) Net Inflows (Outflows) 31,526 55,771 (1,191) 19,478 105,584 Realizations (18,098) (13,541) (1,272) (7,291) (40,202) Market Activity 13,481 9,991 5,386 4,640 33,498 4Q'19 163,156 $ 182,886 $ 80,738 $ 144,342 $ 571,122 $ YoY Increase 20% 40% 4% 13% 21% Credit Total Real Private Hedge Fund Estate Equity Solutions 4Q'18 93,253 $ 80,008 $ 72,281 $ 96,986 $ 342,528 $ Inflows 52,425 27,260 11,488 21,069 112,243 Outflows (9,690) (2,353) (11,929) (9,068) (33,039) Net Inflows (Outflows) 42,735 24,908 (441) 12,002 79,203 Realizations (11,354) (7,213) (1,154) (5,629) (25,350) Market Activity 3,581 71 4,950 3,092 11,694 4Q'19 128,214 $ 97,774 $ 75,636 $ 106,451 $ 408,075 $ YoY Increase 37% 22% 5% 10% 19% Credit Total |
 Blackstone 17 $8.45 $9.60 4Q'18 4Q'19 At December 31, 2019, Blackstone had $5.3 billion in total cash, cash equivalents, and corporate treasury investments and $11.5 billion of cash and net investments, or $9.60 per share. Blackstone has no net debt, a $1.6 billion undrawn credit revolver and maintains A+/A+ ratings. Deconsolidated Balance Sheet Highlights Balance Sheet Highlights are preliminary, and exclude the consolidated Blackstone Funds. GP/Fund Investments include Blackstone investments in Real Estate, Private Equity, Hedge Fund Solutions, and Credit, which were $804 million, $717 million, $103 million, and $269 million, respectively, as of December 31, 2019. Cash and Net Investments per share amounts are calculated using period end DE Shares Outstanding (see page 23, Share Summary). A+/A+ Rated by S&P and Fitch $1.6 billion Undrawn Credit Revolver with September 2023 Maturity $5.3 billion Total Cash and Corporate Treasury Cash and Net Investments (Per Share) (Dollars in Millions) 4Q’19 Cash and Cash Equivalents $ 2,172 Corporate Treasury Investments 3,112 GP/Fund Investments 1,892 Net Accrued Performance Revenues 4,314 Cash and Net Investments $ 11,490 Outstanding Bonds (at par) $ 4,682 |
 Blackstone 18 Net Accrued Performance Revenues Net Accrued Performance Revenues are presented net of performance compensation and do not include clawback amounts, if any, which are disclosed in the 10-K/Q. Net Realized Performance Revenues are included in DE. Net Realized Performance Revenues above represent Performance Revenues realized, but not yet distributed as of the reporting date and included in the Net Accrued Performance Revenues balance. When these fees are received, the receivable is reduced without further impacting DE. Per Share calculations are based on end of period DE Shares Outstanding (see page 23, Share Summary). 4Q’19 QoQ Rollforward (Dollars in Millions) FY’19 Rollforward (Dollars in Millions) Net Accrued Performance Revenues (Dollars in Millions, Except per Share Data) 4Q'18 3Q'19 4Q'19 4Q'19 Per Share QoQ Change YoY Change Real Estate BREP IV 3 $ 11 $ 11 $ 0.01 $ 1 $ 8 $ BREP V 55 47 19 0.02 (29) (36) BREP VI 89 92 81 0.07 (11) (8) BREP VII 484 501 447 0.37 (55) (37) BREP VIII 429 597 674 0.56 77 245 BREP IX - - 6 0.01 6 6 BREP International II - 44 - - (44) - BREP Europe III - - - - - - BREP Europe IV 200 222 167 0.14 (55) (33) BREP Europe V 110 174 193 0.16 19 83 BREP Asia I 114 162 152 0.13 (10) 38 BREP Asia II - - 22 0.02 22 22 BPP 215 273 282 0.24 8 67 BREIT 23 59 79 0.07 20 56 BREDS 17 29 47 0.04 17 30 BTAS 36 45 42 0.04 (3) 6 Total Real Estate 1,775 $ 2,256 $ 2,220 $ 1.86 $ (36) $ 445 $ Private Equity BCP IV 72 24 23 0.02 (1) (49) BCP V - - - - - - BCP VI 746 724 705 0.59 (19) (41) BCP VII 225 382 471 0.39 89 246 BCP Asia - 7 17 0.01 10 17 BEP I 103 133 102 0.09 (31) (1) BEP II 73 8 - - (8) (73) Tactical Opportunities 155 114 160 0.13 46 5 Strategic Partners 94 133 144 0.12 11 50 BCEP 19 36 46 0.04 10 27 Life Sciences - 4 7 0.01 3 7 BTAS 41 53 61 0.05 9 20 Other 1 0 0 - 0 (1) Total Private Equity 1,529 $ 1,616 $ 1,737 $ 1.45 $ 121 $ 208 $ Total Hedge Fund Solutions 24 $ 61 $ 105 $ 0.09 $ 44 $ 81 $ Total Credit 195 $ 238 $ 252 $ 0.21 $ 14 $ 57 $ Net Accrued Performance Revenues 3,523 $ 4,171 $ 4,314 $ 3.61 $ 143 $ 791 $ Memo: Net Realized Performance Revenues 68 $ 129 $ 215 $ 0.18 $ 86 $ 146 $ 4Q'18 Net Performance Revenues Net Realized Distributions 4Q'19 Real Estate 1,775 $ 1,144 $ (700) $ 2,220 $ Private Equity 1,529 530 (321) 1,737 HFS 24 95 (14) 105 Credit 195 86 (29) 252 Total 3,523 $ 1,855 $ (1,064) $ 4,314 $ YoY Increase 22% 3Q'19 Net Performance Revenues Net Realized Distributions 4Q'19 Real Estate 2,256 $ 341 $ (377) $ 2,220 $ Private Equity 1,616 158 (37) 1,737 HFS 61 44 - 105 Credit 238 29 (15) 252 Total 4,171 $ 572 $ (429) $ 4,314 $ QoQ Increase 3% |
 Blackstone 19 Investment Records as of December 31, 2019 (a) Notes on page 21. BREP – Blackstone Real Estate Partners, BREIT – Blackstone Real Estate Income Trust, BPP – Blackstone Property Partners, BREDS – Blackstone Real Estate Debt Strategies, BCP – Blackstone Capital Partners, BCOM – Blackstone Communications. * Represents funds that are currently in their investment period and open ended funds. (Dollars in Thousands, Except Where Noted) Committed Available Unrealized Investments Realized Investments Total Investments Net IRRs (d) Fund (Investment Period Beginning Date / Ending Date) Capital Capital (b) Value MOIC (c) Value MOIC (c) Value MOIC (c) Realized Total Real Estate Pre-BREP 140,714 $ - $ - $ n/a 345,190 $ 2.5x 345,190 $ 2.5x 33% 33% BREP I (Sep 1994 / Oct 1996) 380,708 - - n/a 1,327,708 2.8x 1,327,708 2.8x 40% 40% BREP II (Oct 1996 / Mar 1999) 1,198,339 - - n/a 2,531,614 2.1x 2,531,614 2.1x 19% 19% BREP III (Apr 1999 / Apr 2003) 1,522,708 - - n/a 3,330,406 2.4x 3,330,406 2.4x 21% 21% BREP IV (Apr 2003 / Dec 2005) 2,198,694 - 74,855 0.1x 4,521,164 2.2x 4,596,019 1.7x 28% 12% BREP V (Dec 2005 / Feb 2007) 5,539,418 - 272,765 1.0x 13,030,719 2.4x 13,303,484 2.3x 12% 11% BREP VI (Feb 2007 / Aug 2011) 11,060,444 - 917,009 2.8x 26,936,728 2.5x 27,853,737 2.5x 13% 13% BREP VII (Aug 2011 / Apr 2015) 13,496,564 1,906,699 7,262,924 1.6x 22,551,604 2.1x 29,814,528 2.0x 22% 16% BREP VIII (Apr 2015 / Jun 2019) 16,629,914 3,254,163 18,095,903 1.4x 6,838,570 1.7x 24,934,473 1.5x 26% 16% *BREP IX (Jun 2019 / Dec 2024) 20,634,398 16,859,273 3,907,608 1.0x 87,590 n/m 3,995,198 1.0x n/m n/m Total Global BREP 72,801,901 $ 22,020,135 $ 30,531,064 $ 1.4x 81,501,293 $ 2.2x 112,032,357 $ 1.9x 18% 16% BREP Int'l (Jan 2001 / Sep 2005) 824,172 € - € - € n/a 1,373,170 € 2.1x 1,373,170 € 2.1x 23% 23% BREP Int'l II (Sep 2005 / Jun 2008) (e) 1,629,748 - 3,566 n/a 2,572,364 1.8x 2,575,930 1.8x 8% 8% BREP Europe III (Jun 2008 / Sep 2013) 3,205,167 467,438 581,528 0.8x 5,579,325 2.5x 6,160,853 2.1x 21% 14% BREP Europe IV (Sep 2013 / Dec 2016) 6,709,145 1,339,258 3,091,281 1.6x 8,910,480 2.0x 12,001,761 1.9x 23% 17% BREP Europe V (Dec 2016 / Oct 2019) 7,935,140 1,780,767 7,935,118 1.3x 667,050 2.6x 8,602,168 1.4x 51% 16% *BREP Europe VI (Oct 2019 / Apr 2025) 8,880,497 8,371,719 507,476 1.0x - n/a 507,476 1.0x n/a n/m Total BREP Europe 29,183,869 € 11,959,182 € 12,118,969 € 1.3x 19,102,389 € 2.1x 31,221,358 € 1.7x 16% 14% BREP Asia I (Jun 2013 / Dec 2017) 5,096,361 $ 1,728,289 $ 3,774,257 $ 1.6x 4,049,838 $ 1.9x 7,824,095 $ 1.7x 21% 15% *BREP Asia II (Dec 2017 / Jun 2023) 7,208,070 4,785,471 2,787,120 1.2x 62,050 1.6x 2,849,170 1.2x n/m 10% BREP Co-Investment (f) 7,055,974 170,135 1,587,692 2.1x 13,263,050 2.1x 14,850,742 2.1x 15% 16% Total BREP 127,001,719 $ 42,113,862 $ 52,689,535 $ 1.4x 122,989,021 $ 2.2x 175,678,556 $ 1.9x 17% 15% *Core+ BPP (Various) (g) 29,378,175 689,947 32,420,228 n/a 5,877,291 n/a 38,297,519 n/a n/m 10% *Core+ BREIT (Various) (h) 12,532,379 n/m 13,104,041 n/a 258,935 n/a 13,362,976 n/a n/m 10% *BREDS High-Yield (Various) (i) 13,856,187 4,489,213 3,310,277 1.1x 11,889,018 1.3x 15,199,295 1.3x 11% 11% Corporate Private Equity BCP I (Oct 1987 / Oct 1993) 859,081 $ - $ - $ n/a 1,741,738 $ 2.6x 1,741,738 $ 2.6x 19% 19% BCP II (Oct 1993 / Aug 1997) 1,361,100 - - n/a 3,256,819 2.5x 3,256,819 2.5x 32% 32% BCP III (Aug 1997 / Nov 2002) 3,967,422 - - n/a 9,184,688 2.3x 9,184,688 2.3x 14% 14% BCOM (Jun 2000 / Jun 2006) 2,137,330 24,575 13,493 n/a 2,953,649 1.4x 2,967,142 1.4x 6% 6% BCP IV (Nov 2002 / Dec 2005) 6,773,182 198,964 178,378 2.5x 21,417,821 2.9x 21,596,199 2.9x 36% 36% BCP V (Dec 2005 / Jan 2011) 21,013,658 1,039,805 736,918 0.7x 37,166,622 1.9x 37,903,540 1.9x 9% 8% BCP VI (Jan 2011 / May 2016) 15,192,447 1,652,514 12,566,484 1.7x 14,834,583 2.1x 27,401,067 1.9x 18% 12% *BCP VII (May 2016 / May 2022) 18,819,853 5,048,792 17,566,425 1.4x 1,663,648 1.7x 19,230,073 1.4x 45% 19% BCP VIII (TBD) 24,500,000 24,500,000 - n/a - n/a - n/a n/a n/a Energy I (Aug 2011 / Feb 2015) 2,435,285 224,784 1,611,101 1.6x 2,699,524 2.0x 4,310,625 1.8x 18% 12% *Energy II (Feb 2015 / Feb 2021) 4,913,607 749,717 4,347,043 1.3x 278,192 1.8x 4,625,235 1.3x 43% 7% Energy III (TBD) 4,193,015 4,193,015 - n/a - n/a - n/a n/a n/a *BCP Asia (Dec 2017 / Dec 2023) 2,397,744 1,310,366 1,028,271 1.3x 54,308 1.7x 1,082,579 1.3x n/m 25% Total Corporate Private Equity 108,563,724 $ 38,942,532 $ 38,048,113 $ 1.5x 95,251,592 $ 2.1x 133,299,705 $ 1.9x 16% 15% *Core Private Equity (Jan 2017 / Jan 2021) (j) 4,755,077 1,385,354 4,325,980 1.3x 418,053 1.6x 4,744,033 1.3x 37% 15% |
 Blackstone 20 Investment Records as of December 31, 2019 (a) – Continued Notes on page 21. BXLS – Blackstone Life Sciences * Represents funds that are currently in their investment period and open ended funds. (Dollars in Thousands, Except Where Noted) Committed Available Unrealized Investments Realized Investments Total Investments Net IRRs (d) Fund (Investment Period Beginning Date / Ending Date) Capital Capital (b) Value MOIC (c) Value MOIC (c) Value MOIC (c) Realized Total Tactical Opportunities *Tactical Opportunities (Various) 23,654,242 $ 10,157,252 $ 10,351,985 $ 1.2x 8,955,179 $ 1.7x 19,307,164 $ 1.4x 19% 10% *Tactical Opportunities Co-Investment and Other (Various) 6,885,259 2,352,464 5,409,682 1.3x 1,894,792 1.6x 7,304,474 1.4x 23% 14% Total Tactical Opportunities 30,539,501 $ 12,509,716 $ 15,761,667 $ 1.3x 10,849,971 $ 1.7x 26,611,638 $ 1.4x 20% 11% Strategic Partners (Secondaries) Strategic Partners I-V (Various) (k) 11,862,623 1,732,094 1,092,247 n/m 16,645,510 n/m 17,737,757 1.5x n/a 13% Strategic Partners VI (Apr 2014 / Apr 2016) (k) 4,362,750 1,140,935 1,488,888 n/m 3,111,382 n/m 4,600,270 1.5x n/a 16% Strategic Partners VII (May 2016 / Mar 2019) (k) 7,489,970 2,506,624 5,556,596 n/m 1,546,950 n/m 7,103,546 1.5x n/a 23% *Strategic Partners Real Assets II (May 2017 / Mar 2022) (k) 1,749,807 516,372 817,832 n/m 271,186 n/m 1,089,018 1.2x n/a 17% *Strategic Partners VIII (Mar 2019 / Jul 2023) (k) 10,763,600 5,421,224 3,166,592 n/m 53,818 n/m 3,220,410 1.3x n/a n/m *Strategic Partners Real Estate, SMA and Other (Various) (k) 6,606,978 2,096,602 2,498,143 n/m 1,189,081 n/m 3,687,224 1.3x n/a 18% Total Strategic Partners (Secondaries) 42,835,728 $ 13,413,851 $ 14,620,298 $ n/m 22,817,927 $ n/m 37,438,225 $ 1.5x n/a 14% *Infrastructure (Various) 13,659,163 11,309,149 2,407,643 1.0x - n/a 2,407,643 1.0x n/a n/m Life Sciences *Clarus IV (Jan 2018 / May 2023) 910,000 547,667 467,471 1.5x 3,323 n/m 470,794 1.5x n/m 29% BXLS V (Jan 2020 / Jan 2025) 3,194,630 3,194,630 - n/a - n/a - n/a n/a n/a Credit (l) Mezzanine I (Jul 2007 / Oct 2011) 2,000,000 $ 97,114 $ 23,053 $ 1.2x 4,772,316 $ 1.6x 4,795,369 $ 1.6x n/a 17% Mezzanine II (Nov 2011 / Nov 2016) 4,120,000 1,033,255 1,371,238 0.9x 5,273,460 1.6x 6,644,698 1.3x n/a 11% *Mezzanine III (Sep 2016 / Sep 2021) 6,639,133 2,845,176 4,324,259 1.1x 1,678,739 1.6x 6,002,998 1.2x n/a 12% Distressed I (Sep 2009 / May 2013) 3,253,143 85,000 121,458 0.2x 5,772,964 1.6x 5,894,422 1.4x n/a 10% Distressed II (Jun 2013 / Jun 2018) 5,125,000 573,315 1,160,820 0.6x 4,300,232 1.3x 5,461,052 1.1x n/a 2% *Distressed III (Dec 2017 / Dec 2022) 7,356,380 4,962,377 1,772,334 1.0x 866,528 1.4x 2,638,862 1.1x n/a 11% Energy I (Nov 2015 / Nov 2018) 2,856,867 1,078,049 1,834,281 1.1x 1,013,466 1.7x 2,847,747 1.3x n/a 10% *Energy II (Feb 2019 / Feb 2024) 3,616,081 2,973,803 671,512 1.0x 30,067 2.3x 701,579 1.1x n/a n/m Euro European Senior Debt (Feb 2015 / Feb 2019) 1,964,689 € 381,768 € 2,028,539 € 1.1x 1,159,583 € 1.5x 3,188,122 € 1.2x n/a 9% *European Senior Debt II (Jun 2019 / Jun 2024) 3,403,585 € 3,117,425 € 292,468 € 1.0x - € n/a 292,468 € 1.0x n/a n/m Total Credit 41,095,232 $ 17,575,933 $ 13,884,286 $ 1.0x 25,026,993 $ 1.5x 38,911,279 $ 1.3x n/a 11% |
 Blackstone 21 Investment Records as of December 31, 2019 – Notes The returns presented herein represent those of the applicable Blackstone Funds and not those of The Blackstone Group Inc. n/m Not meaningful generally due to the limited time since initial investment. n/a Not applicable. (a) Preliminary. Excludes investment vehicles where Blackstone does not earn fees. (b) Available Capital represents total investable capital commitments, including side-by-side, adjusted for certain expenses and expired or recallable capital and may include leverage, less invested capital. This amount is not reduced by outstanding commitments to investments. (c) Multiple of Invested Capital (“MOIC”) represents carrying value, before management fees, expenses and Performance Revenues, divided by invested capital. (d) Net Internal Rate of Return (“IRR”) represents the annualized inception to December 31, 2019 IRR on total invested capital based on realized proceeds and unrealized value, as applicable, after management fees, expenses and Performance Revenues. IRRs are calculated using actual timing of limited partner cash flows. Initial inception date cash flow may differ from the Investment Period Beginning Date. (e) The 8% Realized Net IRR and 8% Total Net IRR exclude investors that opted out of the Hilton investment opportunity. Overall BREP International II performance reflects a 7% Realized Net IRR and a 7% Total Net IRR. (f) BREP Co-Investment represents co-investment capital raised for various BREP investments. The Net IRR reflected is calculated by aggregating each co-investment’s realized proceeds and unrealized value, as applicable, after management fees, expenses and Performance Revenues. (g) BPP represents the core+ real estate funds which invest with a more modest risk profile and lower leverage. (h) Unrealized Investment Value reflects BREIT’s net asset value as of December 31, 2019. Realized Investment Value represents BREIT’s cash distributions, net of servicing fees. BREIT net return reflects a per share blended return, assuming BREIT had a single share class, reinvestment of all dividends received during the period, and no upfront selling commission, net of all fees and expenses incurred by BREIT. These returns are not representative of the returns experienced by any particular investor or share class. Inception to date net returns are presented on an annualized basis and are from January 1, 2017. (i) BREDS High-Yield represents the flagship real estate debt drawdown funds only and excludes BREDS High-Grade. (j) BCEP, or Blackstone Core Equity Partners, is a core private equity fund which invests with a more modest risk profile and longer hold period. (k) Realizations are treated as return of capital until fully recovered and therefore unrealized and realized MOICs are not meaningful. If information is not available on a timely basis, returns are calculated from results that are reported on a three month lag. (l) Funds presented represent the flagship credit drawdown funds only. The Total Credit Net IRR is the combined IRR of the credit drawdown funds presented. |
 Blackstone 22 Shareholder Dividends A detailed description of Blackstone’s dividend policy and the definition of Distributable Earnings can be found on pages 32-33, Definitions and Dividend Policy. DE before Certain Payables represents Distributable Earnings before the deduction for the Payable Under Tax Receivable Agreement and tax expense (benefit) of wholly-owned subsidiaries. Per Share calculations are based on end of period Participating Common Shares (page 23, Share Summary); actual dividends are paid to shareholders as of the applicable record date. Retained capital is withheld pro-rata from common and Blackstone Holdings Partnership unitholders. Common shareholders’ share was $75 million for 4Q’19 and $243 million for FY’19. Generated $0.72 of Distributable Earnings per common share during the quarter, bringing the year-to-date amount to $2.31 per common share. Blackstone declared a quarterly dividend of $0.61 per common share to record holders as of February 10, 2020; payable on February 18, 2020. % Change % Change (Dollars in Thousands, Except per Share Data) 4Q'18 1Q'19 2Q'19 3Q'19 4Q'19 vs. 4Q'18 FY'18 FY'19 vs. FY'18 Distributable Earnings 722,081 $ 537,958 $ 708,862 $ 709,921 $ 914,038 $ 27% 2,693,562 $ 2,870,779 $ 7% Add: Other Payables Attributable to Common Shareholders 43,345 14,598 39,673 24,578 63,796 47% 102,732 142,645 39% DE before Certain Payables 765,426 552,556 748,535 734,499 977,834 28% 2,796,294 3,013,424 8% Percent to Common Shareholders 56% 56% 56% 56% 57% 56% 56% DE before Certain Payables Attributable to Common Shareholders 429,433 310,832 419,502 413,900 556,133 30% 1,576,653 1,700,367 8% Less: Other Payables Attributable to Common Shareholders (43,345) (14,598) (39,673) (24,578) (63,796) 47% (102,732) (142,645) 39% DE Attributable to Common Shareholders 386,088 296,234 379,829 389,322 492,337 28% 1,473,921 1,557,722 6% DE per Common Share 0.57 $ 0.44 $ 0.57 $ 0.58 $ 0.72 $ 26% 2.17 $ 2.31 $ 6% Less: Retained Capital per Common Share (0.09) $ (0.07) $ (0.09) $ (0.09) $ (0.11) $ 22% (0.32) $ (0.36) $ 13% Special Cash Dividend per Common Share 0.10 $ - $ - $ - $ - $ n/m 0.30 $ - $ n/m Actual Dividend per Common Share 0.58 $ 0.37 $ 0.48 $ 0.49 $ 0.61 $ 5% 2.15 $ 1.95 $ (9)% Record Date Feb 10, 2020 Payable Date Feb 18, 2020 |
 Blackstone 23 Share Summary Common Shareholders receive tax benefits from deductions taken by Blackstone’s corporate tax paying subsidiaries and bear responsibility for the deduction from Distributable Earnings of the Payable Under Tax Receivable Agreement and certain other tax-related payables. Participating Common Shares and Participating Partnership Units include both issued and outstanding shares and unvested shares that participate in dividends. 4Q'18 1Q'19 2Q'19 3Q'19 4Q'19 Participating Common Shares 672,755,818 674,457,578 669,561,793 675,640,119 680,457,424 Participating Partnership Units 526,370,654 524,504,626 525,165,724 523,338,040 515,973,657 Distributable Earnings Shares Outstanding 1,199,126,472 1,198,962,204 1,194,727,517 1,198,978,159 1,196,431,081 Distributable Earnings Shares Outstanding as of quarter end of 1,196 million shares. • Repurchased 1.5 million common shares in the quarter and 12.8 million common shares for the year. • Available authorization remaining was $781 million at December 31, 2019. |
 Reconciliations and Disclosures |
 Blackstone 25 Notes on pages 26-27. Reconciliation of GAAP to Non-GAAP Measures QTD FY (Dollars in Thousands) 4Q'18 1Q'19 2Q'19 3Q'19 4Q'19 FY'18 FY'19 Net Income (Loss) Attributable to The Blackstone Group Inc. (10,868) $ 481,304 $ 305,792 $ 779,437 $ 483,149 $ 1,541,788 $ 2,049,682 $ Net Income Attributable to Non-Controlling Interests in Blackstone Holdings 5,253 402,260 259,330 299,900 378,137 1,364,989 1,339,627 Net Income (Loss) Attributable to Non-Controlling Interests in Consolidated Entities (68,800) 186,833 80,744 88,406 120,796 358,878 476,779 Net Income (Loss) Attributable to Redeemable Non-Controlling Interests in Consolidated Entities (4,303) 2,480 1,095 (8) (3,688) (2,104) (121) Net Income (Loss) (78,718) $ 1,072,877 $ 646,961 $ 1,167,735 $ 978,394 $ 3,263,551 $ 3,865,967 $ Provision (Benefit) for Taxes 29,366 41,155 38,736 (156,786) 28,943 249,390 (47,952) Income (Loss) Before Provision (Benefit) for Taxes (49,352) $ 1,114,032 $ 685,697 $ 1,010,949 $ 1,007,337 $ 3,512,941 $ 3,818,015 $ Transaction-Related Charges (a) 76,431 89,451 106,994 (82,547) 94,715 (261,916) 208,613 Amortization of Intangibles (b) 15,392 16,483 16,483 16,483 16,482 59,994 65,931 Impact of Consolidation (c) 73,103 (189,313) (81,839) (88,398) (117,108) (356,774) (476,658) Unrealized Performance Revenues (d) 806,531 (664,333) (157,398) (176,604) (128,333) (561,163) (1,126,668) Unrealized Performance Allocations Compensation (e) (302,868) 287,015 64,518 94,907 93,845 319,742 540,285 Unrealized Principal Investment (Income) Loss (f) 160,659 (139,925) 56,353 5,219 (34,974) 65,851 (113,327) Other Revenues (g) (46,854) (13,189) 20,150 (92,843) 6,435 (89,468) (79,447) Equity-Based Compensation (h) 43,102 66,776 53,105 58,570 51,743 158,220 230,194 Taxes and Related Payables (i) (54,063) (29,039) (55,201) (35,815) (76,104) (153,865) (196,159) Distributable Earnings 722,081 $ 537,958 $ 708,862 $ 709,921 $ 914,038 $ 2,693,562 $ 2,870,779 $ Taxes and Related Payables (i) 54,063 29,039 55,201 35,815 76,104 153,865 196,159 Net Interest (Income) Loss (j) (11,923) (5,061) (2,761) 7,767 2,496 (21,925) 2,441 Total Segment Distributable Earnings 764,221 $ 561,936 $ 761,302 $ 753,503 $ 992,638 $ 2,825,502 $ 3,069,379 $ Realized Performance Revenues (k) (483,697) (246,769) (341,386) (420,840) (651,647) (1,811,771) (1,660,642) Realized Performance Compensation (l) 199,645 85,240 125,466 143,870 249,359 678,141 603,935 Realized Principal Investment Income (m) (47,098) (25,908) (123,557) (36,148) (38,542) (236,058) (224,155) Fee Related Earnings 433,071 $ 374,499 $ 421,825 $ 440,385 $ 551,808 $ 1,455,814 $ 1,788,517 $ Adjusted EBITDA Reconciliation Distributable Earnings 722,081 $ 537,958 $ 708,862 $ 709,921 $ 914,038 $ 2,693,562 $ 2,870,779 $ Interest Expense (n) 41,792 41,638 43,230 52,815 57,351 159,838 195,034 Taxes and Related Payables (i) 54,063 29,039 55,201 35,815 76,104 153,865 196,159 Depreciation and Amortization 5,964 5,789 6,000 6,895 7,666 23,882 26,350 Adjusted EBITDA 823,900 $ 614,424 $ 813,293 $ 805,446 $ 1,055,159 $ 3,031,147 $ 3,288,322 $ |
 Blackstone 26 Reconciliation of GAAP to Non-GAAP Measures – Notes Note: See pages 32-33, Definitions and Dividend Policy. QTD FY 4Q'18 1Q'19 2Q'19 3Q'19 4Q'19 FY'18 FY'19 GAAP Unrealized Performance Allocations (806,305) $ 663,999 $ 157,732 $ 176,370 $ 128,231 $ 561,373 $ 1,126,332 $ Segment Adjustment (226) 334 (334) 234 102 (210) 336 Unrealized Performance Revenues (806,531) $ 664,333 $ 157,398 $ 176,604 $ 128,333 $ 561,163 $ 1,126,668 $ QTD FY 4Q'18 1Q'19 2Q'19 3Q'19 4Q'19 FY'18 FY'19 GAAP Unrealized Principal Investment Income (Loss) (218,165) $ 169,044 $ (37,345) $ 15,391 $ 67,913 $ 49,917 $ 215,003 $ Segment Adjustment 57,506 (29,119) (19,008) (20,610) (32,939) �� (115,768) (101,676) Unrealized Principal Investment Income (Loss) (160,659) $ 139,925 $ (56,353) $ (5,219) $ 34,974 $ (65,851) $ 113,327 $ QTD FY 4Q'18 1Q'19 2Q'19 3Q'19 4Q'19 FY'18 FY'19 GAAP Other Revenue 46,923 $ 10,250 $ (17,120) $ 93,273 $ (6,410) $ 672,317 $ 79,993 $ Segment Adjustment (69) 2,939 (3,030) (430) (25) (582,849) (546) Other Revenues 46,854 $ 13,189 $ (20,150) $ 92,843 $ (6,435) $ 89,468 $ 79,447 $ (h) This adjustment removes Equity-Based Compensation on a segment basis. (b) This adjustment removes the amortization of transaction-related intangibles, which are excluded from Blackstone’s segment presentation. This amount includes amortization of intangibles associated with Blackstone’s investment in Pátria, which is accounted for under the equity method. (c) This adjustment reverses the effect of consolidating Blackstone Funds, which are excluded from Blackstone’s segment presentation. This adjustment includes the elimination of Blackstone’s interest in these funds and the removal of amounts associated with the ownership of Blackstone consolidated operating partnerships held by non-controlling interests. (d) This adjustment removes Unrealized Performance Revenues on a segment basis. The Segment Adjustment represents the add back of performance revenues earned from consolidated Blackstone Funds which have been eliminated in consolidation. (e) This adjustment removes Unrealized Performance Allocations Compensation. (f) This adjustment removes Unrealized Principal Investment Income (Loss) on a segment basis. The Segment Adjustment represents (1) the add back of Principal Investment Income, including general partner income, earned from consolidated Blackstone Funds which have been eliminated in consolidation, and (2) the removal of amounts associated with the ownership of Blackstone consolidated operating partnerships held by non-controlling interests. (g) This adjustment removes Other Revenues on a segment basis. The Segment Adjustment represents (1) the add back of Other Revenues earned from consolidated Blackstone Funds which have been eliminated in consolidation, and (2) the removal of certain Transaction-Related Charges. For the year ended December 31, 2018, Transaction-Related Charges included $580.9 million of Other Revenues received upon the conclusion of Blackstone’s investment sub-advisory relationship with FS Investments’ funds. (a) This adjustment removes Transaction-Related Charges, which are excluded from Blackstone’s segment presentation. Transaction-Related Charges arise from corporate actions including acquisitions, divestitures, and Blackstone’s initial public offering. They consist primarily of equity-based compensation charges, gains and losses on contingent consideration arrangements, changes in the balance of the Tax Receivable Agreement resulting from a change in tax law or similar event, transaction costs and any gains or losses associated with these corporate actions. |
 Blackstone 27 Reconciliation of GAAP to Non-GAAP Measures – Notes Continued (i) Taxes represent the total GAAP tax provision adjusted to include only the current tax provision (benefit) calculated on Income (Loss) Before Provision (Benefit) for Taxes and adjusted to exclude the tax impact of any divestitures. Related Payables represent tax-related payables including the amount payable under the Tax Receivable Agreement. QTD FY 4Q'18 1Q'19 2Q'19 3Q'19 4Q'19 FY'18 FY'19 GAAP Interest and Dividend Revenue 47,885 $ 44,084 $ 43,686 $ 42,482 $ 52,146 $ 171,947 $ 182,398 $ Segment Adjustment 5,830 2,615 2,305 2,566 2,709 9,816 10,195 Interest and Dividend Revenue 53,715 $ 46,699 $ 45,991 $ 45,048 $ 54,855 $ 181,763 $ 192,593 $ GAAP Interest Expense 44,644 $ 42,002 $ 43,596 $ 53,362 $ 60,688 $ 163,990 $ 199,648 $ Segment Adjustment (2,852) (364) (366) (547) (3,337) (4,152) (4,614) Interest Expense 41,792 $ 41,638 $ 43,230 $ 52,815 $ 57,351 $ 159,838 $ 195,034 $ Net Interest Income (Loss) 11,923 $ 5,061 $ 2,761 $ (7,767) $ (2,496) $ 21,925 $ (2,441) $ (k) This adjustment removes the total segment amounts of Realized Performance Revenues. (l) This adjustment removes the total segment amounts of Realized Performance Compensation. (m) This adjustment removes the total segment amount of Realized Principal Investment Income. (n) This adjustment adds back Interest Expense on a segment basis. Reconciliation of GAAP Shares of Class A Common Stock Outstanding to Distributable Earnings Shares Outstanding QTD 4Q'18 1Q'19 2Q'19 3Q'19 4Q'19 GAAP Shares of Class A Common Stock Outstanding 663,212,830 665,331,887 660,588,369 666,257,305 671,157,692 Unvested Participating Common Shares 9,542,988 9,125,691 8,973,424 9,382,814 9,299,732 Total Participating Common Shares 672,755,818 674,457,578 669,561,793 675,640,119 680,457,424 Participating Partnership Units 526,370,654 524,504,626 525,165,724 523,338,040 515,973,657 Distributable Earnings Shares Outstanding 1,199,126,472 1,198,962,204 1,194,727,517 1,198,978,159 1,196,431,081 Disclosure of Weighted-Average Shares of Class A Common Stock Outstanding QTD FY 4Q'18 1Q'19 2Q'19 3Q'19 4Q'19 FY'18 FY'19 Total GAAP Weighted-Average Shares of Class A Common Stock Outstanding - Basic 676,629,572 674,507,698 673,655,305 675,963,129 679,420,988 678,850,245 675,900,466 Weighted-Average Shares of Unvested Deferred Restricted Class A Common Stock - 207,752 330,639 256,629 274,520 226,487 267,385 Weighted-Average Blackstone Holdings Partnership Units - 525,764,790 - - - 527,886,114 - Total GAAP Weighted-Average Shares of Class A Common Stock Outstanding - Diluted 676,629,572 1,200,480,240 673,985,944 676,219,758 679,695,508 1,206,962,846 676,167,851 (j) This adjustment removes Interest and Dividend Revenue less Interest Expense on a segment basis. The Segment Adjustment represents (1) the add back of Other Revenues earned from consolidated Blackstone Funds which have been eliminated in consolidation, and (2) the removal of interest expense associated with the Tax Receivable Agreement. QTD FY 4Q'18 1Q'19 2Q'19 3Q'19 4Q'19 FY'18 FY'19 Taxes 38,975 $ 15,344 $ 34,209 $ 26,933 $ 63,930 $ 90,022 $ 140,416 $ Related Payables 15,088 13,695 20,992 8,882 12,174 63,843 55,743 Taxes and Related Payables 54,063 $ 29,039 $ 55,201 $ 35,815 $ 76,104 $ 153,865 $ 196,159 $ |
 Blackstone 28 Blackstone’s Fourth Quarter 2019 GAAP Balance Sheet Results See page 29, Reconciliation of GAAP to Non-GAAP Balance Sheet Measures. (Dollars in Thousands) (Unaudited) 4Q'18 1Q'19 2Q'19 3Q'19 4Q'19 Assets Cash and Cash Equivalents 2,207,841 $ 1,570,741 $ 1,484,444 $ 2,468,563 $ 2,172,441 $ Cash Held by Blackstone Funds and Other 337,320 217,625 324,609 375,981 351,210 Investments 20,377,031 21,180,950 22,242,040 22,204,460 22,281,682 Accounts Receivable 636,238 711,889 802,066 755,777 975,075 Due from Affiliates 1,994,123 2,320,291 2,211,737 2,464,163 2,594,873 Intangible Assets, Net 468,507 450,757 433,007 415,257 397,508 Goodwill 1,869,860 1,869,860 1,869,860 1,869,860 1,869,860 Other Assets 294,248 302,033 354,253 402,670 382,493 Right-of-Use Assets - 521,932 507,065 490,882 471,059 Deferred Tax Assets 739,482 728,873 743,132 938,158 1,089,305 Total Assets 28,924,650 $ 29,874,951 $ 30,972,213 $ 32,385,771 $ 32,585,506 $ Liabilities and Equity Loans Payable 9,951,862 $ 10,011,155 $ 10,676,138 $ 11,270,245 $ 11,080,723 $ Due to Affiliates 1,035,776 1,045,452 1,081,899 984,969 1,026,871 Accrued Compensation and Benefits 2,942,128 3,001,597 3,308,595 3,623,258 3,796,044 Securities Sold, Not Yet Purchased 142,617 128,106 128,512 87,051 75,545 Repurchase Agreements 222,202 218,865 207,676 163,059 154,118 Operating Lease Liabilities - 587,408 574,619 558,253 542,994 Accounts Payable, Accrued Expenses and Other Liabilities 875,979 735,667 929,688 1,069,475 806,159 Total Liabilities 15,170,564 15,728,250 16,907,127 17,756,310 17,482,454 Redeemable Non-Controlling Interests in Consolidated Entities 141,779 136,941 101,310 93,667 87,651 Equity The Blackstone Group L.P. Partners’ Capital 6,415,700 6,501,072 6,335,897 - - Class A Common Stock, $0.00001 par value (671,157,692 shares issued and outstanding as of December 31, 2019) - - - 7 7 Class B Common Stock, $0.00001 par value (1 share issued and outstanding as of December 31, 2019) - - - - - Class C Common Stock, $0.00001 par value (1 share issued and outstanding as of December 31, 2019) - - - - - Additional Paid-in-Capital - - - 6,292,765 6,428,647 Retained Earnings - - - 456,814 609,625 Accumulated Other Comprehensive Loss (36,476) (32,430) (27,542) (35,173) (28,495) Non-Controlling Interests in Consolidated Entities 3,648,766 3,852,346 3,869,303 4,035,513 4,186,069 Non-Controlling Interests in Blackstone Holdings 3,584,317 3,688,772 3,786,118 3,785,868 3,819,548 Total Equity 13,612,307 14,009,760 13,963,776 14,535,794 15,015,401 Total Liabilities and Equity 28,924,650 $ 29,874,951 $ 30,972,213 $ 32,385,771 $ 32,585,506 $ |
 Blackstone 29 Reconciliation of GAAP to Non-GAAP Balance Sheet Measures (a) This adjustment adds back investments in consolidated Blackstone Funds which have been eliminated in consolidation. (b) Represents GAAP accrued performance revenue recorded within Due from Affiliates. (c) Represents GAAP accrued performance compensation associated with Accrued Performance Allocations and is recorded within Accrued Compensation and Benefits and Due to Affiliates. (d) This adjustment adds other assets related to Treasury Operations that are recorded within Accounts Receivable, reverse repurchase agreements and Due from Affiliates. (e) This adjustment adds other liabilities related to Treasury Operations that are recorded within Accounts Payable, Accrued Expenses and Other Liabilities, Repurchase Agreements and securities sold short, not yet purchased. (f) This adjustment removes amounts associated with the ownership of Blackstone consolidated operating partnerships held by non-controlling interests and adds back investments in consolidated Blackstone Funds which have been eliminated in consolidation. (g) This adjustment removes amounts related to consolidated Blackstone Funds. (Dollars in Thousands) 4Q'18 1Q'19 2Q'19 3Q'19 4Q'19 Investments of Consolidated Blackstone Funds 8,376,338 $ 8,603,847 $ 8,633,794 $ 8,481,233 $ 8,380,698 $�� Equity Method Investments Partnership Investments 3,649,423 3,815,993 3,802,565 3,864,453 4,035,675 Accrued Performance Allocations 5,883,924 6,486,450 6,743,542 7,003,889 7,180,449 Corporate Treasury Investments 2,206,493 2,005,174 2,797,908 2,588,529 2,419,587 Other Investments 260,853 269,486 264,231 266,356 265,273 Total GAAP Investments 20,377,031 $ 21,180,950 $ 22,242,040 $ 22,204,460 $ 22,281,682 $ Accrued Performance Allocations - GAAP 5,883,924 $ 6,486,450 $ 6,743,542 $ 7,003,889 $ 7,180,449 $ Impact of Consolidation (a) - 374 607 237 384 Due from Affiliates - GAAP (b) 33,419 9,483 25,022 18,955 154,980 Less: Accrued Performance Compensation - GAAP (c) (2,394,747) (2,638,374) (2,724,998) (2,851,817) (3,021,899) Net Accrued Performance Revenues 3,522,596 $ 3,857,933 $ 4,044,173 $ 4,171,264 $ 4,313,914 $ Corporate Treasury Investments - GAAP 2,206,493 $ 2,005,174 $ 2,797,908 $ 2,588,529 $ 2,419,587 $ Impact of Consolidation (a) 73,106 75,988 160,644 163,183 164,243 Other Assets (d) 438,454 519,884 425,823 440,982 602,707 Other Liabilities (e) (205,332) (101,605) (91,016) (80,086) (74,898) Corporate Treasury Investments - Deconsolidated 2,512,721 $ 2,499,441 $ 3,293,359 $ 3,112,608 $ 3,111,639 $ Partnership and Other Investments - GAAP 3,910,276 $ 4,085,479 $ 4,066,796 $ 4,130,809 $ 4,300,948 $ Impact of Consolidation (f) (2,015,417) (2,095,717) (2,209,825) (2,289,139) (2,409,218) GP/Fund Investments - Deconsolidated 1,894,859 $ 1,989,762 $ 1,856,971 $ 1,841,670 $ 1,891,730 $ Loans Payable - GAAP 9,951,862 $ 10,011,155 $ 10,676,138 $ 11,270,245 $ 11,080,723 $ Impact of Consolidation (g) (6,480,711) (6,561,111) (6,536,221) (6,492,686) (6,479,867) Outstanding Bonds (Carrying Value) 3,471,151 3,450,044 4,139,917 4,777,559 4,600,856 Unamortized Discount/Premium 60,879 59,576 66,033 82,336 81,094 Outstanding Bonds (at par) - Deconsolidated 3,532,030 $ 3,509,620 $ 4,205,950 $ 4,859,895 $ 4,681,950 $ |
 Blackstone 30 Reconciliation of GAAP to Total Segment Measures QTD FY (Dollars in Thousands) 4Q'18 1Q'19 2Q'19 3Q'19 4Q'19 FY'18 FY'19 Management and Advisory Fees, Net GAAP 797,554 $ 809,726 $ 840,378 $ 878,151 $ 943,900 $ 3,027,796 $ 3,472,155 $ Segment Adjustment (a) 641 4,336 3,778 2,194 1,773 8,656 12,081 Total Segment 798,195 $ 814,062 $ 844,156 $ 880,345 $ 945,673 $ 3,036,452 $ 3,484,236 $ GAAP Realized Performance Revenues to Total Segment Fee Related Performance Revenues GAAP Incentive Fees 15,797 12,132 21,915 8,254 87,610 57,540 129,911 Investment Income - Realized Performance Allocations 511,388 242,375 332,520 446,550 717,555 1,876,507 1,739,000 GAAP 527,185 $ 254,507 $ 354,435 $ 454,804 $ 805,165 $ 1,934,047 $ 1,868,911 $ Total Segment Less: Realized Performance Revenues (483,697) (246,769) (341,386) (420,840) (651,647) (1,811,771) (1,660,642) Segment Adjustment (b) 697 41 575 261 2,855 1,560 3,732 Total Segment 44,185 $ 7,779 $ 13,624 $ 34,225 $ 156,373 $ 123,836 $ 212,001 $ GAAP Compensation to Total Segment Fee Related Compensation GAAP Compensation 373,790 471,397 438,521 462,766 447,646 1,609,957 1,820,330 Incentive Fees Compensation 10,260 5,406 8,886 5,419 24,589 33,916 44,300 Realized Performance Allocations Compensation 212,174 86,395 125,825 155,663 295,059 711,076 662,942 GAAP 596,224 $ 563,198 $ 573,232 $ 623,848 $ 767,294 $ 2,354,949 $ 2,527,572 $ Total Segment Less: Realized Performance Compensation (199,645) (85,240) (125,466) (143,870) (249,359) (678,141) (603,935) Less: Equity-Based Compensation - Operating Compensation (39,968) (63,708) (50,225) (56,139) (51,612) (145,213) (221,684) Less: Equity-Based Compensation - Performance Compensation (3,134) (3,068) (2,880) (2,431) (131) (13,007) (8,510) Segment Adjustment (c) (74,193) (87,151) (100,827) (91,574) (77,313) (302,442) (356,865) Total Segment 279,284 $ 324,031 $ 293,834 $ 329,834 $ 388,879 $ 1,216,146 $ 1,336,578 $ GAAP General, Administrative and Other to Total Segment Other Operating Expenses GAAP 153,519 $ 146,062 $ 175,308 $ 171,067 $ 186,971 $ 594,873 $ 679,408 $ Segment Adjustment (d) (23,494) (22,751) (33,187) (26,716) (25,612) (106,545) (108,266) Total Segment 130,025 $ 123,311 $ 142,121 $ 144,351 $ 161,359 $ 488,328 $ 571,142 $ Realized Performance Revenues GAAP Incentive Fees 15,797 12,132 21,915 8,254 87,610 57,540 129,911 Investment Income - Realized Performance Allocations 511,388 242,375 332,520 446,550 717,555 1,876,507 1,739,000 GAAP 527,185 $ 254,507 $ 354,435 $ 454,804 $ 805,165 $ 1,934,047 $ 1,868,911 $ Total Segment Less: Fee Related Performance Revenues (44,185) (7,779) (13,624) (34,225) (156,373) (123,836) (212,001) Segment Adjustment (b) 697 41 575 261 2,855 1,560 3,732 Total Segment 483,697 $ 246,769 $ 341,386 $ 420,840 $ 651,647 $ 1,811,771 $ 1,660,642 $ |
 Blackstone 31 Reconciliation of GAAP to Total Segment Measures – Continued This analysis reconciles the components of Total Segment Distributable Earnings (page 3) to their equivalent GAAP measures, reported on the Consolidated Statement of Operations (page 1). Segment basis presents revenues and expenses on a basis that deconsolidates the investment funds Blackstone manages and excludes the amortization of intangibles, the expense of equity-based awards and Transaction-Related Charges. (a) Represents (1) the add back of net management fees earned from consolidated Blackstone Funds which have been eliminated in consolidation, and (2) the removal of revenue from the reimbursement of certain expenses by the Blackstone Funds, which are presented gross under GAAP but netted against Management and Advisory Fees, Net in the Total Segment measures. (b) Represents the add back of Performance Revenues earned from consolidated Blackstone Funds which have been eliminated in consolidation. (c) Represents the removal of Transaction-Related Charges that are not recorded in the Total Segment measures. (d) Represents the removal of (1) the amortization of transaction-related intangibles, and (2) certain expenses reimbursed by the Blackstone Funds, which are presented gross under GAAP but netted against Management and Advisory Fees, Net in the Total Segment measures. (e) Represents (1) the add back of Principal Investment Income, including general partner income, earned from consolidated Blackstone Funds which have been eliminated in consolidation, and (2) the removal of amounts associated with the ownership of Blackstone consolidated operating partnerships held by non-controlling interests. (f) Represents (1) the add back of Other Revenues earned from consolidated Blackstone Funds which have been eliminated in consolidation, and (2) the removal of interest expense associated with the Tax Receivable Agreement. QTD FY (Dollars in Thousands) 4Q'18 1Q'19 2Q'19 3Q'19 4Q'19 FY'18 FY'19 Realized Performance Compensation GAAP Incentive Fee Compensation 10,260 $ 5,406 $ 8,886 $ 5,419 $ 24,589 $ 33,916 $ 44,300 $ Realized Performance Allocations Compensation 212,174 86,395 125,825 155,663 295,059 711,076 662,942 GAAP 222,434 $ 91,801 $ 134,711 $ 161,082 $ 319,648 $ 744,992 $ 707,242 $ Total Segment Less: Fee Related Performance Compensation (19,655) (3,493) (6,365) (14,781) (70,158) (53,844) (94,797) Less: Equity-Based Compensation - Performance Compensation (3,134) (3,068) (2,880) (2,431) (131) (13,007) (8,510) Total Segment 199,645 $ 85,240 $ 125,466 $ 143,870 $ 249,359 $ 678,141 $ 603,935 $ Realized Principal Investment Income GAAP 109,901 $ 73,261 $ 145,040 $ 74,642 $ 100,535 $ 415,862 $ 393,478 $ Segment Adjustment (e) (62,803) (47,353) (21,483) (38,494) (61,993) (179,804) (169,323) Total Segment 47,098 $ 25,908 $ 123,557 $ 36,148 $ 38,542 $ 236,058 $ 224,155 $ GAAP Interest and Dividend Revenue net of Interest Expense to Total Segment Net Interest Income (Loss) GAAP Interest and Dividend Revenue 47,885 44,084 43,686 42,482 52,146 171,947 182,398 Interest Expense (44,644) (42,002) (43,596) (53,362) (60,688) (163,990) (199,648) GAAP 3,241 $ 2,082 $ 90 $ (10,880) $ (8,542) $ 7,957 $ (17,250) $ Segment Adjustment (f) 8,682 2,979 2,671 3,113 6,046 13,968 14,809 Total Segment 11,923 $ 5,061 $ 2,761 $ (7,767) $ (2,496) $ 21,925 $ (2,441) $ |
 Blackstone 32 Definitions and Dividend Policy Blackstone discloses the following operating metrics and financial measures that are calculated and presented on the basis of methodologies other than in accordance with generally accepted accounting principles in the United States of America (“non-GAAP”) in this presentation: • Segment Distributable Earnings, or “Segment DE”, is Blackstone’s segment profitability measure used to make operating decisions and assess performance across Blackstone’s four segments. Segment DE represents the net realized earnings of Blackstone’s segments and is the sum of Fee Related Earnings and Net Realizations for each segment. Blackstone’s segments are presented on a basis that deconsolidates Blackstone Funds, eliminates non-controlling ownership interests in Blackstone’s consolidated Operating Partnerships, removes the amortization of intangible assets and removes Transaction-Related Charges. Segment DE excludes unrealized activity and is derived from and reconciled to, but not equivalent to, its most directly comparable GAAP measure of Income (Loss) Before Provision (Benefit) for Taxes. o Net Realizations is presented on a segment basis and is the sum of Realized Principal Investment Income and Realized Performance Revenues (which refers to Realized Performance Revenues excluding Fee Related Performance Revenues), less Realized Performance Compensation (which refers to Realized Performance Compensation excluding Fee Related Performance Compensation and Equity-Based Performance Compensation). o Total Segment Revenues and Segment Revenues represent Net Management and Advisory Fees, Fee Related Performance Revenues, Realized Performance Revenues and Realized Principal Investment Income. • Distributable Earnings, or “DE”, is derived from Blackstone’s segment reported results. DE is used to assess performance and amounts available for dividends to Blackstone shareholders, including Blackstone personnel and others who are limited partners of the Blackstone Holdings Partnerships. DE is the sum of Segment DE plus Net Interest Income (Loss) less Taxes and Related Payables. DE excludes unrealized activity and is derived from and reconciled to, but not equivalent to, its most directly comparable GAAP measure of Income (Loss) Before Provision (Benefit) for Taxes. o Net Interest Income (Loss) is presented on a segment basis and is equal to Interest and Dividend Revenue less Interest Expense, adjusted for the impact of consolidation of Blackstone Funds, and interest expense associated with the Tax Receivable Agreement. o Taxes and Related Payables represent the total GAAP tax provision adjusted to include only the current tax provision (benefit) calculated on Income (Loss) Before Provision (Benefit) for Taxes excluding the tax impact of any divestitures and including the Payable under the Tax Receivable Agreement. • Fee Related Earnings, or “FRE”, is a performance measure used to assess Blackstone’s ability to generate profits from revenues that are measured and received on a recurring basis and not subject to future realization events. FRE equals management and advisory fees (net of management fee reductions and offsets) plus Fee Related Performance Revenues, less (a) Fee Related Compensation on a segment basis, and (b) Other Operating Expenses. FRE is derived from and reconciled to, but not equivalent to, its most directly comparable GAAP measure of Income (Loss) Before Provision (Benefit) for Taxes. o Fee Related Compensation is presented on a segment basis and refers to the compensation expense, excluding Equity-Based Compensation, directly related to (a) Management and Advisory Fees, Net and (b) Fee Related Performance Revenues, referred to as Fee Related Performance Compensation. o Fee Related Performance Revenues refers to the realized portion of Performance Revenues from Perpetual Capital that are (a) measured and received on a recurring basis, and (b) not dependent on realization events from the underlying investments. o Perpetual Capital refers to the component of assets under management with an indefinite term, that is not in liquidation, and for which there is no requirement to return capital to investors through redemption requests in the ordinary course of business, except where funded by new capital inflows. Includes co- investment capital with an investor right to convert into Perpetual Capital. |
 Blackstone 33 Definitions and Dividend Policy – Continued • Adjusted Earnings Before Interest, Taxes and Depreciation and Amortization, or “Adjusted EBITDA”, is a supplemental measure used to assess performance derived from Blackstone’s segment results and may be used to assess its ability to service its borrowings. Adjusted EBITDA represents Distributable Earnings plus the addition of (a) Interest Expense on a segment basis, (b) Taxes and Related Payables, and (c) Depreciation and Amortization. Adjusted EBITDA is derived from and reconciled to, but not equivalent to, its most directly comparable GAAP measure of Income (Loss) Before Provision (Benefit) for Taxes. • Performance Revenues collectively refers to: (a) Incentive Fees, and (b) Performance Allocations. • Performance Compensation collectively refers to: (a) Incentive Fee Compensation, and (b) Performance Allocations Compensation. • Transaction-Related Charges arise from corporate actions including acquisitions, divestitures, and Blackstone’s initial public offering. They consist primarily of equity-based compensation charges, gains and losses on contingent consideration arrangements, changes in the balance of the Tax Receivable Agreement resulting from a change in tax law or similar event, transaction costs and any gains or losses associated with these corporate actions. Dividend Policy. Blackstone’s intention is to pay to holders of Class A common stock a quarterly dividend representing approximately 85% of The Blackstone Group Inc.’s share of Distributable Earnings, subject to adjustment by amounts determined by Blackstone’s board of directors to be necessary or appropriate to provide for the conduct of its business, to make appropriate investments in its business and funds, to comply with applicable law, any of its debt instruments or other agreements, or to provide for future cash requirements such as tax-related payments, clawback obligations and dividends to shareholders for any ensuing quarter. The dividend amount could also be adjusted upward in any one quarter. All of the foregoing is subject to the qualification that the declaration and payment of any dividends are at the sole discretion of Blackstone’s board of directors and our board of directors may change our dividend policy at any time, including, without limitation, to eliminate such dividends entirely. |
 Blackstone 34 Forward-Looking Statements This presentation may contain forward-looking statements within the meaning of Section 27A of the Securities Act of 1933 and Section 21E of the Securities Exchange Act of 1934 which reflect our current views with respect to, among other things, our operations, taxes , earnings and financial performance, share repurchases and dividends. You can identify these forward-looking statements by the use of words such as “outlook,” “indicator,” “believes,” “expects,” “potential,” “continues,” “may,” “will,” “should,” “seeks,” “approximately,” “predicts,” “intends,” “plans,” “estimates,” “anticipates” or the negative version of these words or other comparable words. Such forward-looking statements are subject to various risks and uncertainties. Accordingly, there are or will be important factors that could cause actual outcomes or results to differ materially from those indicated in these statements. We believe these factors include but are not limited to those described under the section entitled “Risk Factors” in our Annual Report on Form 10-K for the year ended December 31, 2018 and in our Quarterly Report on Form 10-Q for the quarter ended March 31, 2019, as such factors may be updated from time to time in our periodic filings with the United States Securities and Exchange Commission (“SEC”), which are accessible on the SEC’s website at www.sec.gov. These factors should not be construed as exhaustive and should be read in conjunction with the other cautionary statements that are included in this report and in our other periodic filings. The forward-looking statements speak only as of the date of this report, and we undertake no obligation to publicly update or review any forward-looking statement, whether as a result of new information, future developments or otherwise. This presentation does not constitute an offer of any Blackstone Fund. |