MANAGEMENT’S DISCUSSION AND ANALYSIS
Management's discussion and analysis (“MD&A”) is dated October 24, 2018 and should be read in conjunction with the unaudited consolidated financial statements for the period ended September 30, 2018 and the audited consolidated financial statements for the year ended December 31, 2017 for a full understanding of the financial position and results of operations of Crescent Point Energy Corp. (the “Company” or “Crescent Point”).
The unaudited consolidated financial statements and comparative information for the period ended September 30, 2018 have been prepared in accordance with International Financial Reporting Standards (“IFRS”), specifically International Accounting Standard ("IAS") 34, Interim Financial Reporting.
STRUCTURE OF THE BUSINESS
The principal undertaking of Crescent Point is to carry on the business of acquiring, developing and holding interests in petroleum and natural gas properties and assets related thereto through a general partnership and wholly owned subsidiaries. Amounts in this report are in Canadian dollars unless noted otherwise. References to “US$” are to United States (“U.S.”) dollars.
Results of Operations
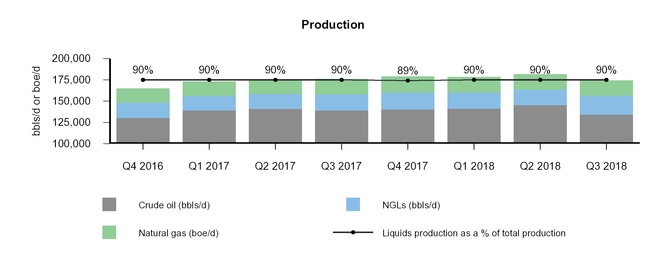
Production
| Three months ended September 30 | Nine months ended September 30 | ||||||||||||||||
| 2018 | 2017 | % Change | 2018 | 2017 | % Change | ||||||||||||
| Crude oil (bbls/d) | 134,146 | 139,254 | (4 | ) | 140,304 | 139,811 | — | ||||||||||
| NGLs (bbls/d) | 22,257 | 18,811 | 18 | 19,668 | 17,850 | 10 | |||||||||||
| Natural gas (mcf/d) | 107,231 | 108,021 | (1 | ) | 109,098 | 104,117 | 5 | ||||||||||
| Total (boe/d) | 174,275 | 176,069 | (1 | ) | 178,155 | 175,014 | 2 | ||||||||||
| Crude oil and NGLs (%) | 90 | 90 | — | 90 | 90 | — | |||||||||||
| Natural gas (%) | 10 | 10 | — | 10 | 10 | — | |||||||||||
| Total (%) | 100 | 100 | — | 100 | 100 | — | |||||||||||
Total production remained relatively consistent in the three and nine months ended September 30, 2018 compared to the same periods in 2017, as the impact of non-core dispositions and natural declines was largely offset by new production added through the Company's capital development program. Natural gas liquids ("NGLs") volumes increased mainly due to positive prior period adjustments recorded in the third quarter of 2018.
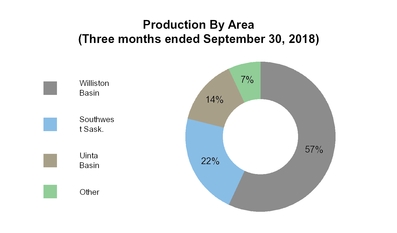
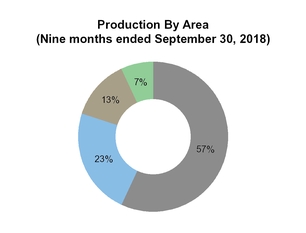
In the three and nine months ended September 30, 2018, the Company drilled 215 (169.2 net) wells and 583 (465.8 net) wells, respectively, focused primarily in the Williston Basin, Southwest Saskatchewan and the Uinta Basin.
The Company's weighting to crude oil and NGLs in the three and nine months ended September 30, 2018 remained consistent with the 2017 comparative periods.
Exhibit 1
| CRESCENT POINT ENERGY CORP. | 1 |
The following is a summary of Crescent Point's production by area:
| Three months ended September 30 | Nine months ended September 30 | |||||||||||||||||
| Production By Area (boe/d) | 2018 | 2017 | % Change | 2018 | 2017 | % Change | ||||||||||||
| Williston Basin | 99,758 | 101,717 | (2 | ) | 101,301 | 102,795 | (1 | ) | ||||||||||
| Southwest Saskatchewan | 37,960 | 39,176 | (3 | ) | 40,863 | 42,341 | (3 | ) | ||||||||||
| Uinta Basin | 23,666 | 21,836 | 8 | 22,737 | 16,894 | 35 | ||||||||||||
| Other | 12,891 | 13,340 | (3 | ) | 13,254 | 12,984 | 2 | |||||||||||
| Total | 174,275 | 176,069 | (1 | ) | 178,155 | 175,014 | 2 | |||||||||||
Exhibit 2
Marketing and Prices
The average selling prices reported are before realized derivatives and transportation.
| Three months ended September 30 | Nine months ended September 30 | |||||||||||||||||
Average Selling Prices (1) | 2018 | 2017 | % Change | 2018 | 2017 | % Change | ||||||||||||
| Crude oil ($/bbl) | 80.11 | 54.74 | 46 | 74.50 | 57.28 | 30 | ||||||||||||
| NGLs ($/bbl) | 33.35 | 25.89 | 29 | 33.98 | 25.46 | 33 | ||||||||||||
| Natural gas ($/mcf) | 2.00 | 2.10 | (5 | ) | 2.01 | 2.72 | (26 | ) | ||||||||||
| Total ($/boe) | 67.15 | 47.35 | 42 | 63.66 | 49.97 | 27 | ||||||||||||
| Three months ended September 30 | Nine months ended September 30 | |||||||||||||||||
| Benchmark Pricing | 2018 | 2017 | % Change | 2018 | 2017 | % Change | ||||||||||||
| Crude Oil Prices | ||||||||||||||||||
WTI crude oil (US$/bbl) (1) | 69.50 | 48.24 | 44 | 66.79 | 49.45 | 35 | ||||||||||||
| WTI crude oil (Cdn$/bbl) | 90.85 | 60.45 | 50 | 85.96 | 64.56 | 33 | ||||||||||||
| Crude Oil Differentials | ||||||||||||||||||
LSB crude oil (Cdn$/bbl) (2) | (8.00 | ) | (4.12 | ) | 94 | (7.88 | ) | (4.81 | ) | 64 | ||||||||
FOS crude oil (Cdn$/bbl) (3) | (21.46 | ) | (10.07 | ) | 113 | (22.58 | ) | (13.75 | ) | 64 | ||||||||
Wax crude oil (US$/bbl) (4) | (9.90 | ) | (4.75 | ) | 108 | (8.08 | ) | (4.75 | ) | 70 | ||||||||
UHC crude oil (US$/bbl) (5) | 0.79 | (0.21 | ) | (476 | ) | (0.41 | ) | (0.64 | ) | (36 | ) | |||||||
| Natural Gas Prices | ||||||||||||||||||
AECO daily spot natural gas (Cdn$/mcf) (6) | 1.19 | 1.46 | (18 | ) | 1.48 | 2.31 | (36 | ) | ||||||||||
| AECO monthly index natural gas (Cdn$/mcf) | 1.35 | 2.04 | (34 | ) | 1.41 | 2.58 | (45 | ) | ||||||||||
NYMEX natural gas (US$/mmbtu) (7) | 2.91 | 3.00 | (3 | ) | 2.89 | 3.16 | (9 | ) | ||||||||||
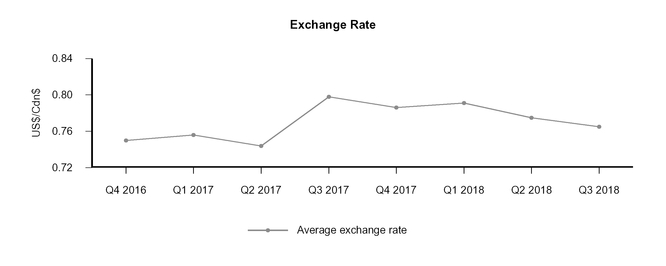
| Foreign Exchange Rate | ||||||||||||||||||
| Exchange rate (US$/Cdn$) | 0.765 | 0.798 | (4 | ) | 0.777 | 0.766 | 1 | |||||||||||
| (1) | WTI refers to the West Texas Intermediate crude oil price. |
| (2) | LSB refers to the Light Sour Blend crude oil price. |
| (3) | FOS refers to the Fosterton crude oil price, which typically receives a premium to Western Canadian Select prices. |
| (4) | Wax crude oil is based on posted yellow wax prices in Salt Lake City. Black wax pricing is relatively consistent with yellow wax. |
| (5) | UHC refers to the Sweet at Clearbrook crude oil price. |
| (6) | AECO refers to the Alberta Energy Company natural gas price. |
| (7) | NYMEX refers to the New York Mercantile Exchange natural gas price. |
| CRESCENT POINT ENERGY CORP. | 2 |
In the third quarter of 2018, the Company's average selling price for crude oil increased 46 percent from the same period in 2017, primarily as a result of a 44 percent increase in the US$ WTI benchmark price and a weaker Canadian dollar, partially offset by a wider corporate oil price differential. Crescent Point's corporate oil differential relative to Cdn$ WTI for the third quarter of 2018 was $10.74 per bbl compared to $5.71 per bbl in the third quarter of 2017.
In the nine months ended September 30, 2018, the Company's average selling price for oil increased 30 percent from the same period in 2017, primarily as a result of a 35 percent increase in the US$ WTI benchmark price, partially offset by a wider corporate oil price differential and a stronger Canadian dollar. The Company's corporate oil differential compared to Cdn$ WTI for the nine months ended September 30, 2018 was $11.46 per bbl compared to $7.28 per bbl in the same period of 2017.
Exhibit 3
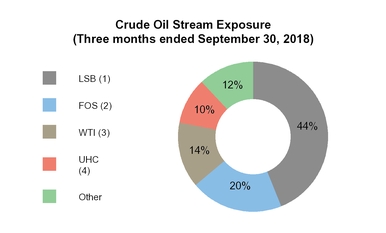
| (1) | LSB refers to the Light Sour Blend crude oil price. |
| (2) | FOS refers to the Fosterton crude oil price, which typically receives a premium to Western Canadian Select prices. |
| (3) | Utah production is priced at a negotiated discount to WTI. |
| (4) | UHC refers to the Sweet at Clearbrook crude oil price. |
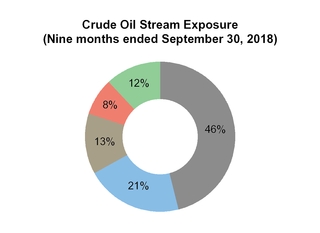
The Company's crude oil production is exposed to differentials primarily based on the geography and quality of its production base. In the three and nine months ended September 30, 2018, approximately 45 percent of the Company's crude oil production was in southeast Saskatchewan and was exposed to LSB crude oil pricing. Approximately 20 percent of the Company's crude oil production was in southwest Saskatchewan, weighted to medium crude oil, and was exposed to FOS crude oil pricing. Approximately 15 percent of the Company's crude oil production was in the Uinta Basin, priced at a negotiated discount to WTI that is primarily based on yellow and black wax posted prices. Approximately 10 percent of the Company's crude oil production was in North Dakota, exposed to UHC crude oil pricing. The remainder of the Company's crude oil production was exposed to Alberta-indexed crude oil pricing.
Canadian crude oil differentials widened in 2018 due to increased oil supply in Western Canada, lack of rail capacity, pipeline apportionment and refinery turnarounds late in the third quarter. In the U.S., yellow and black wax differentials widened due to increased production in the Uinta Basin and outages in the Salt Lake City refining complex. The Company's corporate oil differentials for the three and nine months ended September 30, 2018 widened as a result of the changes in these market differentials. However, as approximately 90 percent of the Company's crude oil production is either located downstream of recent apportionment points or in the U.S., Crescent Point expects its realized pricing to be significantly stronger than Canadian index prices.
The Company's average selling price for NGLs in the three and nine months ended September 30, 2018 increased 29 percent from $25.89 per bbl to $33.35 per bbl and 33 percent from $25.46 per bbl to $33.98 per bbl, respectively. Average selling prices for NGLs were impacted by the strengthening of propane, butane and condensate prices resulting from the increases in crude oil prices and offshore propane exports.
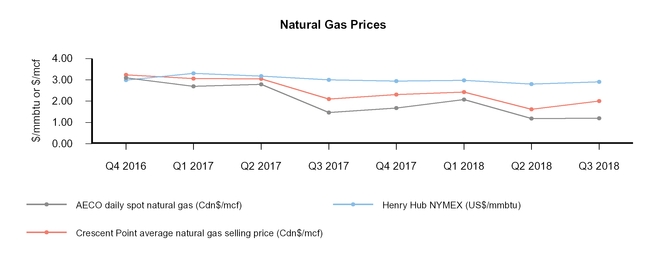
The Company's average selling price for natural gas in the three and nine months ended September 30, 2018 decreased 5 percent from $2.10 per mcf to $2.00 per mcf and 26 percent from $2.72 per mcf to $2.01 per mcf, respectively, primarily as a result of the decrease in the AECO and NYMEX benchmark prices.
| CRESCENT POINT ENERGY CORP. | 3 |
Exhibit 4
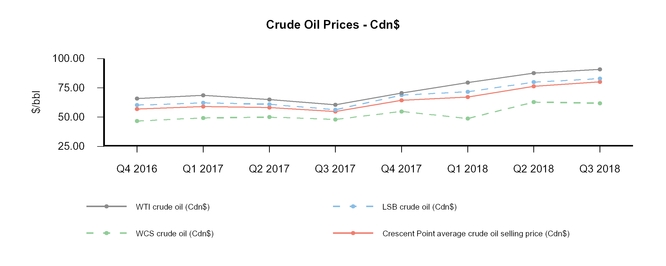
Exhibit 5
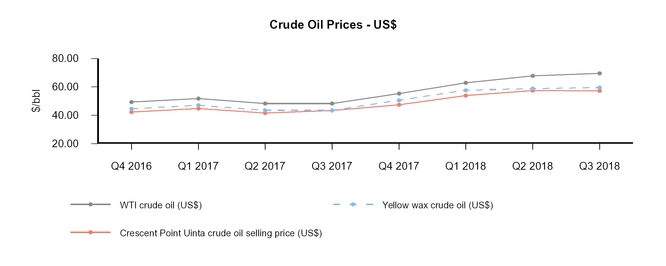
Exhibit 6
| CRESCENT POINT ENERGY CORP. | 4 |
Exhibit 7
Derivatives
The following is a summary of the realized derivative gains (losses) on crude oil and natural gas derivative contracts:
| Three months ended September 30 | Nine months ended September 30 | |||||||||||||||||
| ($ millions, except volume amounts) | 2018 | 2017 | % Change | 2018 | 2017 | % Change | ||||||||||||
Average crude oil volumes hedged (bbls/d) (1) | 82,500 | 51,750 | 59 | 77,908 | 54,374 | 43 | ||||||||||||
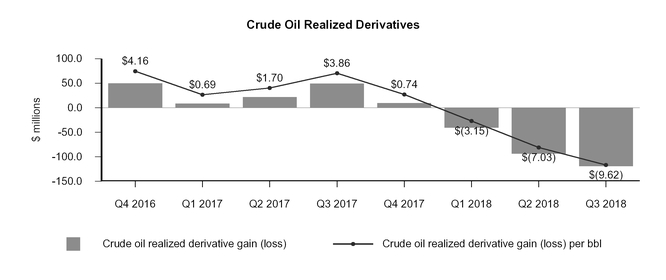
Crude oil realized derivative gain (loss) (1) | (118.8 | ) | 49.4 | (340 | ) | (252.0 | ) | 79.9 | (415 | ) | ||||||||
| per bbl | (9.62 | ) | 3.86 | (349 | ) | (6.58 | ) | 2.09 | (415 | ) | ||||||||
Average natural gas volumes hedged (GJ/d) (2) | 32,000 | 40,000 | (20 | ) | 34,637 | 41,813 | (17 | ) | ||||||||||
| Natural gas realized derivative gain | 4.4 | 3.9 | 13 | 14.1 | 7.4 | 91 | ||||||||||||
| per mcf | 0.44 | 0.40 | 10 | 0.47 | 0.26 | 81 | ||||||||||||
Average barrels of oil equivalent hedged (boe/d) (1) | 87,555 | 58,069 | 51 | 83,380 | 60,979 | 37 | ||||||||||||
Total realized derivative gains (losses) (1) | (114.4 | ) | 53.3 | (315 | ) | (237.9 | ) | 87.3 | (373 | ) | ||||||||
| per boe | (7.14 | ) | 3.29 | (317 | ) | (4.89 | ) | 1.83 | (367 | ) | ||||||||
| (1) | The crude oil realized derivative gain for the three and nine months ended September 30, 2017 includes realized derivative gains and losses on financial price differential contracts. The average crude oil volumes hedged and average barrels of oil equivalent hedged do not include the hedged volumes related to financial price differential contracts. |
| (2) | GJ/d is defined as gigajoules per day. |
Management of cash flow variability is an integral component of Crescent Point's business strategy. Crescent Point regularly monitors changing business and market conditions and reviews such conditions with the Board of Directors to establish risk management guidelines used by management in carrying out the Company's strategic risk management program. Crescent Point proactively manages the risk exposure inherent in movements in the price of crude oil, natural gas and power, and in fluctuations in the US/Cdn dollar exchange rate and interest rates through the use of derivatives with investment-grade counterparties.
The Company's crude oil and natural gas derivatives are referenced to WTI and the AECO monthly index, respectively, unless otherwise noted. Crescent Point utilizes a variety of derivatives, including swaps, collars and put options to protect against downward commodity price movements while providing the opportunity for some upside participation during periods of rising prices. For commodities, Crescent Point's risk management program allows for hedging a forward profile of up to 3½ years and up to 65 percent of net royalty interest production, unless otherwise approved by the Board of Directors.
With the ongoing volatility of price differentials between WTI and western Canadian crude prices, Crescent Point also hedges price differentials as a part of its risk management program. The Company uses a combination of financial derivatives and fixed differential physical contracts to hedge these price differentials. For price differential hedging, Crescent Point's risk management program allows for hedging a forward profile of up to 3½ years, and up to 35 percent net of royalty interest production. In addition, the Company can deliver crude oil through its various rail terminals to provide access to diversified markets and pricing. See Note 23 - "Financial Instruments and Derivatives" in the unaudited consolidated financial statements for the period ended September 30, 2018 for additional information on the Company's derivatives.
The Company recorded total realized derivative losses of $114.4 million and $237.9 million for the three and nine months ended September 30, 2018, respectively, compared to total realized derivative gains of $53.3 million and $87.3 million in the respective periods in 2017.
| CRESCENT POINT ENERGY CORP. | 5 |
The Company's realized derivative losses for crude oil were $118.8 million and $252.0 million for the three and nine months ended September 30, 2018, respectively, compared to realized derivative gains of $49.4 million and $79.9 million for the respective periods in 2017. The realized derivative losses in the three and nine months ended September 30, 2018 were largely attributable to the increase in the Cdn$ WTI benchmark price, partially offset by the increase in the Company's average derivative crude oil price. During the three months ended September 30, 2018, the Company's average derivative crude oil price increased by 6 percent or $4.52 per bbl, from $70.68 per bbl in 2017 to $75.20 per bbl in 2018. During the nine months ended September 30, 2018, the Company's average derivative oil price increased 6 percent or $4.17 per bbl, from $69.94 per bbl in 2017 to $74.11 per bbl in 2018.
Crescent Point's realized derivative gains for gas were $4.4 million and $14.1 million for the three and nine months ended September 30, 2018, respectively, compared to $3.9 million and $7.4 million for the respective periods in 2017. The increased realized derivative gains in the three and nine months ended September 30, 2018 were largely attributable to the decrease in the AECO monthly index price, partially offset by the decreases in the Company's average derivative gas price and gas volumes hedged. During the three months ended September 30, 2018, the Company's average derivative gas price decreased by 8 percent or $0.25 per GJ, from $3.01 per GJ in 2017 to $2.76 per GJ in 2018. During the nine months ended September 30, 2018, the Company's average derivative gas price decreased by 9 percent or $0.28 per GJ, from $3.10 per GJ in 2017 to $2.82 per GJ in 2018.
The Company has not designated any of its risk management activities as accounting hedges under IFRS 9, Financial Instruments and, accordingly, has recorded its derivatives at fair value with changes in fair value recorded in net income.
Exhibit 8
The following is a summary of the Company's unrealized derivative gains (losses):
| Three months ended September 30 | Nine months ended September 30 | |||||||||||||||||
| ($ millions) | 2018 | 2017 | % Change | 2018 | 2017 | % Change | ||||||||||||
| Crude oil | 35.4 | (72.0 | ) | (149 | ) | (330.8 | ) | 102.7 | (422 | ) | ||||||||
| Natural gas | (4.1 | ) | 3.6 | (214 | ) | (12.2 | ) | 17.8 | (169 | ) | ||||||||
| Interest | (0.4 | ) | 4.5 | (109 | ) | (2.1 | ) | 7.4 | (128 | ) | ||||||||
| Power | — | 0.1 | (100 | ) | — | 0.4 | (100 | ) | ||||||||||
| Cross currency | (60.0 | ) | 6.7 | (996 | ) | 45.9 | (110.3 | ) | (142 | ) | ||||||||
| Foreign exchange | (0.1 | ) | (0.9 | ) | (89 | ) | 0.7 | (1.6 | ) | (144 | ) | |||||||
| Total unrealized derivative gains (losses) | (29.2 | ) | (58.0 | ) | (50 | ) | (298.5 | ) | 16.4 | (1,920 | ) | |||||||
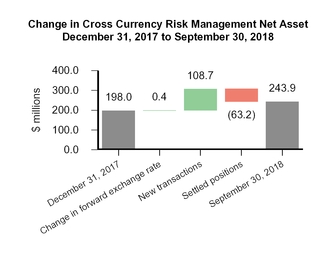
The Company recognized total unrealized derivative losses of $29.2 million for the three months ended September 30, 2018 compared to $58.0 million in the same period in 2017. The losses were primarily due to a $60.0 million unrealized derivative loss on Cross Currency Swaps ("CCS") compared to a $6.7 million unrealized derivative gain in 2017. The unrealized CCS derivative loss in the third quarter of 2018 was primarily the result of the stronger forward Canadian dollar at September 30, 2018 compared to June 30, 2018.
The total unrealized derivative losses in the three months ended September 30, 2018 were partially offset by a $35.4 million unrealized derivative gain on crude oil contracts compared to a $72.0 million unrealized derivative loss for the same period in 2017. The unrealized crude oil derivative gain for the three months ended September 30, 2018 was primarily attributable to the maturity of out-of-the-money contract months, partially offset by the increase in the Cdn$ WTI and US$ WTI forward benchmark prices at September 30, 2018 as compared to June 30, 2018.
| CRESCENT POINT ENERGY CORP. | 6 |
During the nine months ended September 30, 2018, the Company recognized total unrealized derivative losses of $298.5 million compared to total unrealized derivative gains of $16.4 million in the same period in 2017, primarily due to a $330.8 million unrealized derivative loss on crude oil contracts compared to a $102.7 million unrealized derivative gain for the same period in 2017. The unrealized crude oil derivative loss for the nine months ended September 30, 2018 was primarily attributable to the increase in the Cdn$ WTI and US$ WTI forward benchmark prices at September 30, 2018 compared to December 31, 2017, partially offset by the maturity of out-of-the-money contract months.
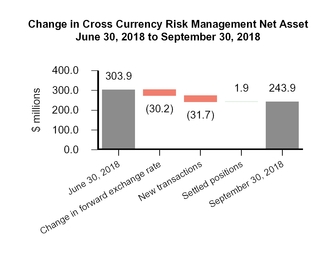
The total unrealized derivative losses in the nine months ended September 30, 2018 were partially offset by a $45.9 million gain on CCS compared to a $110.3 million loss in the same period in 2017. The unrealized CCS derivative gain for the nine months ended September 30, 2018 was primarily the result of the weaker forward Canadian dollar at September 30, 2018 compared to December 31, 2017.
Exhibit 9

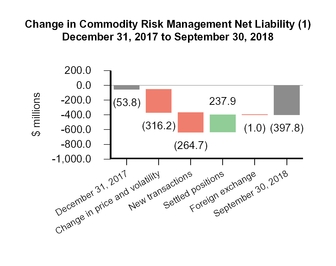
(1) Includes oil and gas contracts.
Exhibit 10
Oil and Gas Sales
| Three months ended September 30 | Nine months ended September 30 | |||||||||||||||||
($ millions) (1) | 2018 | 2017 | % Change | 2018 | 2017 | % Change | ||||||||||||
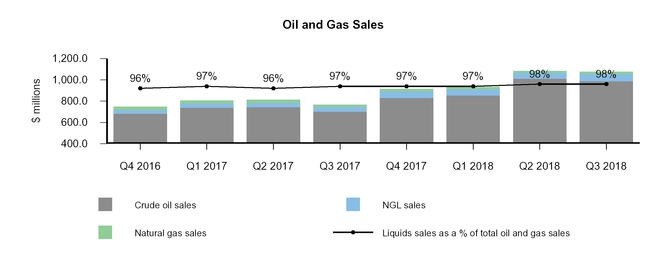
| Crude oil sales | 988.7 | 701.3 | 41 | 2,853.5 | 2,186.3 | 31 | ||||||||||||
| NGL sales | 68.3 | 44.8 | 52 | 182.4 | 124.1 | 47 | ||||||||||||
| Natural gas sales | 19.7 | 20.9 | (6 | ) | 60.0 | 77.3 | (22 | ) | ||||||||||
| Total oil and gas sales | 1,076.7 | 767.0 | 40 | 3,095.9 | 2,387.7 | 30 | ||||||||||||
| (1) | Oil and gas sales are reported before realized derivatives. |
| CRESCENT POINT ENERGY CORP. | 7 |
Crude oil sales increased 41 percent in the three months ended September 30, 2018, from $701.3 million in 2017 to $988.7 million in 2018, primarily due to the 46 percent increase in realized prices, partially offset by the 4 percent decrease in crude oil production. Crude oil sales increased 31 percent in the nine months ended September 30, 2018, from $2.19 billion in 2017 to $2.85 billion in 2018, primarily due to the 30 percent increase in realized prices.
NGL sales increased 52 percent and 47 percent in the three and nine months ended September 30, 2018, respectively, compared to the same periods in 2017, primarily due to the 29 percent and 33 percent increases in realized NGL prices, respectively, and the 18 percent and 10 percent increases in NGL production, respectively.
Natural gas sales decreased 6 percent and 22 percent in the three and nine months ended September 30, 2018, respectively, compared to the same periods in 2017, primarily due to the 5 percent and 26 percent respective decreases in realized natural gas prices, largely due to the decreases in the AECO and NYMEX daily benchmark prices.
Exhibit 11
Royalties
| Three months ended September 30 | Nine months ended September 30 | |||||||||||||||
| ($ millions, except % and per boe amounts) | 2018 | 2017 | % Change | 2018 | 2017 | % Change | ||||||||||
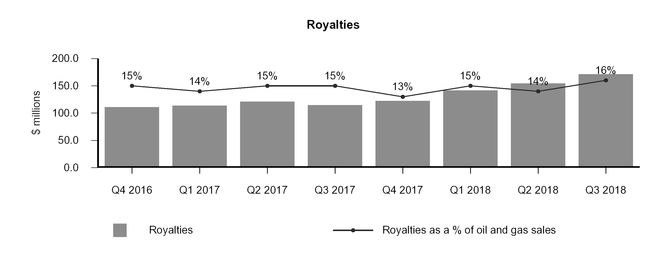
| Royalties | 171.3 | 114.8 | 49 | 467.7 | 349.7 | 34 | ||||||||||
| As a % of oil and gas sales | 16 | 15 | 1 | 15 | 15 | — | ||||||||||
| Per boe | 10.68 | 7.08 | 51 | 9.62 | 7.32 | 31 | ||||||||||
Royalties increased 49 percent and 34 percent in the three and nine months ended September 30, 2018, respectively, compared to the same periods in 2017, largely due to the 40 percent and 30 percent increases in oil and gas sales, respectively.
Royalties as a percentage of oil and gas sales increased by 1 percent in the three months ended September 30, 2018 primarily due to growing revenues in the United States with higher associated royalty burdens. Royalties as a percentage of oil and gas sales remained consistent in the nine months ended September 30, 2018.
| CRESCENT POINT ENERGY CORP. | 8 |
Exhibit 12
Operating Expenses
| Three months ended September 30 | Nine months ended September 30 | |||||||||||||||
| ($ millions, except per boe amounts) | 2018 | 2017 | % Change | 2018 | 2017 | % Change | ||||||||||
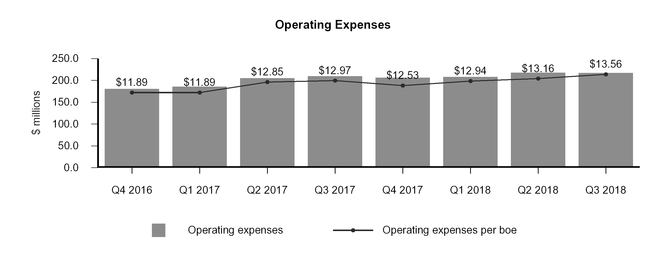
| Operating expenses | 217.4 | 210.0 | 4 | 642.9 | 600.9 | 7 | ||||||||||
| Per boe | 13.56 | 12.97 | 5 | 13.22 | 12.58 | 5 | ||||||||||
Operating expenses per boe increased 5 percent in both the three and nine months ended September 30, 2018 compared to the same periods in 2017. The increases were primarily due to increases in Saskatchewan power rates, increased labour costs from increased activity levels, higher trucking costs and increased chemical usage. Maintenance activity levels in 2018 also increased compared to 2017 in response to stronger commodity prices. Operating expenses per boe for the three months ended September 30, 2018 were also impacted by the effect of the weaker Canadian dollar on the translation of the Company's U.S. operations.
Operating expenses increased 4 percent and 7 percent in the three and nine months ended September 30, 2018, respectively, compared to the same periods in 2017, primarily due to the increases noted above. Operating expenses for the nine months ended September 30, 2018 were also impacted by slightly higher production volumes.
Exhibit 13
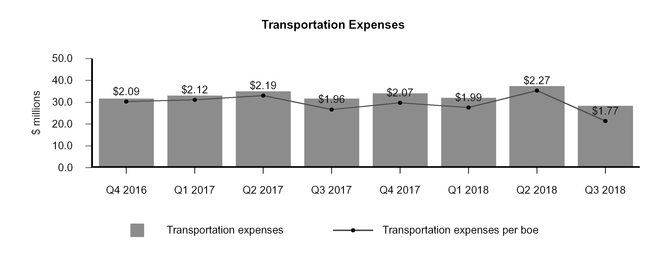
Transportation Expenses
| Three months ended September 30 | Nine months ended September 30 | |||||||||||||||||
| ($ millions, except per boe amounts) | 2018 | 2017 | % Change | 2018 | 2017 | % Change | ||||||||||||
| Transportation expenses | 28.4 | 31.7 | (10 | ) | 97.8 | 99.7 | (2 | ) | ||||||||||
| Per boe | 1.77 | 1.96 | (10 | ) | 2.01 | 2.09 | (4 | ) | ||||||||||
| CRESCENT POINT ENERGY CORP. | 9 |
Transportation expenses per boe decreased 10 percent and 4 percent in the three and nine months ended September 30, 2018, respectively, compared to the same periods in 2017. The decreases were primarily due to lower Canadian production volumes resulting from non-core dispositions which had higher associated transportation expenses.
Transportation expenses decreased 10 percent and 2 percent in the three and months ended September 30, 2018, respectively, compared to the same periods in 2017, primarily due to the decrease in per boe transportation expenses as noted above. Transportation expenses in the nine months ended September 30, 2018 were also impacted by slightly higher production volumes.
Exhibit 14
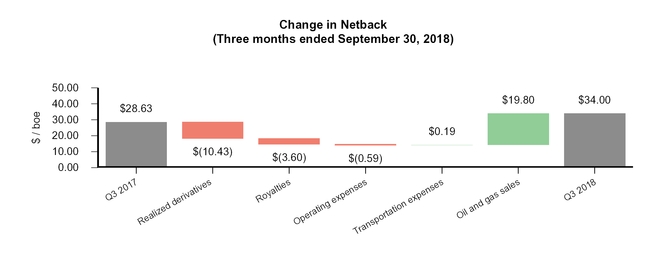
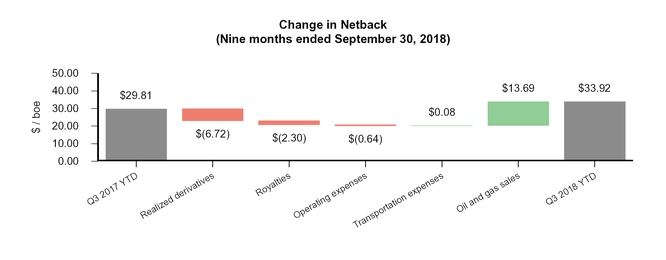
Netback
| Three months ended September 30 | Nine months ended September 30 | |||||||||||||||||
| 2018 | 2017 | 2018 | 2017 | |||||||||||||||
Total (2) ($/boe) | Total (2) ($/boe) | % Change | Total (2) ($/boe) | Total (2) ($/boe) | % Change | |||||||||||||
| Average selling price | 67.15 | 47.35 | 42 | 63.66 | 49.97 | 27 | ||||||||||||
| Royalties | (10.68 | ) | (7.08 | ) | 51 | (9.62 | ) | (7.32 | ) | 31 | ||||||||
| Operating expenses | (13.56 | ) | (12.97 | ) | 5 | (13.22 | ) | (12.58 | ) | 5 | ||||||||
| Transportation expenses | (1.77 | ) | (1.96 | ) | (10 | ) | (2.01 | ) | (2.09 | ) | (4 | ) | ||||||
Operating netback (1) | 41.14 | 25.34 | 62 | 38.81 | 27.98 | 39 | ||||||||||||
| Realized gain (loss) on derivatives | (7.14 | ) | 3.29 | (317 | ) | (4.89 | ) | 1.83 | (367 | ) | ||||||||
Netback (1) | 34.00 | 28.63 | 19 | 33.92 | 29.81 | 14 | ||||||||||||
| (1) | Non-GAAP financial measure that does not have any standardized meaning prescribed by IFRS and, therefore, may not be comparable with the calculation of similar measures presented by other entities. Refer to the Non-GAAP Financial Measures section in this MD&A for further information. |
| (2) | The dominant production category for the Company's properties is crude oil. These properties include associated natural gas and NGL volumes, therefore, the total operating netback and netback have been presented. |
The Company's operating netback for the three months ended September 30, 2018 increased 62 percent to $41.14 per boe from $25.34 per boe in the same period in 2017. The Company's netback for the three months ended September 30, 2018 increased 19 percent to $34.00 per boe from $28.63 per boe in the same period in 2017. The increase in the Company's operating netback was primarily the result of the increase in average selling price and the decrease in transportation expenses, partially offset by the increases in royalties and operating expenses. The increase in the Company's netback was the result of the increase in the operating netback, partially offset by the loss on commodity derivatives.
The Company's operating netback for the nine months ended September 30, 2018 increased 39 percent to $38.81 per boe from $27.98 per boe in the same period in 2017. The Company's netback for the nine months ended September 30, 2018 increased 14 percent to $33.92 per boe from $29.81 per boe in the same period in 2017. The increase in the Company's operating netback is primarily the result of the increase in average selling price and the decrease in transportation expenses, partially offset by the increases in royalties and operating expenses. The increase in the Company's netback was the result of the increase in the operating netback, partially offset by the loss on commodity derivatives.
| CRESCENT POINT ENERGY CORP. | 10 |
Exhibit 15
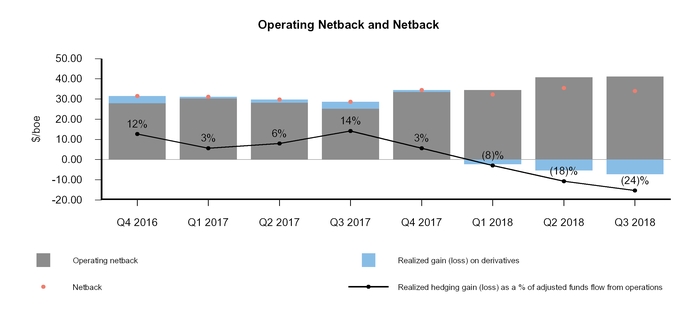
Exhibit 16
| CRESCENT POINT ENERGY CORP. | 11 |
Exhibit 17
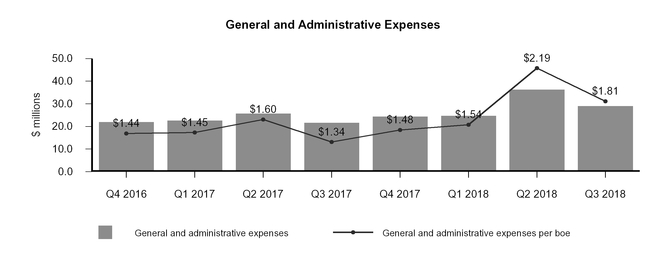
General and Administrative Expenses
| Three months ended September 30 | Nine months ended September 30 | ||||||||||||||||
| ($ millions, except per boe amounts) | 2018 | 2017 | % Change | 2018 | 2017 | % Change | |||||||||||
| General and administrative costs | 39.9 | 31.2 | 28 | 125.4 | 101.7 | 23 | |||||||||||
| Capitalized | (9.5 | ) | (10.0 | ) | (5 | ) | (31.1 | ) | (29.5 | ) | 5 | ||||||
| Total general and administrative expenses | 30.4 | 21.2 | 43 | 94.3 | 72.2 | 31 | |||||||||||
| Transaction costs | (1.4 | ) | 0.4 | (450 | ) | (4.3 | ) | (2.3 | ) | 87 | |||||||
| General and administrative expenses | 29.0 | 21.6 | 34 | 90.0 | 69.9 | 29 | |||||||||||
| Per boe | 1.81 | 1.34 | 35 | 1.85 | 1.46 | 27 | |||||||||||
General and administrative ("G&A") expenses increased $7.4 million or 34 percent in the third quarter of 2018 compared to the same period in 2017, primarily due to $5.7 million of severance costs from an organizational restructuring, which resulted in a 17 percent decrease in the Company's workforce. G&A expenses increased 29 percent or $20.1 million in the nine months ended September 30, 2018 compared to the same period in 2017, primarily due to severance costs recorded in the second and third quarters, increased shareholder costs and lower overhead recoveries. For the nine months ended September 30, 2018, total severance costs of $16.4 million were included in G&A.
G&A expenses per boe increased 35 percent and 27 percent in the three and nine months ended September 30, 2018, respectively, compared to the same periods in 2017. The increases were due to the increase in total G&A as noted above. G&A expenses per boe for the nine months ended September 30, 2018 were also partially offset by slightly higher production volumes.
Transaction costs incurred in the three and nine months ended September 30, 2018 relate primarily to major and minor property acquisitions and dispositions. Refer to the Capital Acquisitions section in this MD&A for further information.
Exhibit 18
| CRESCENT POINT ENERGY CORP. | 12 |
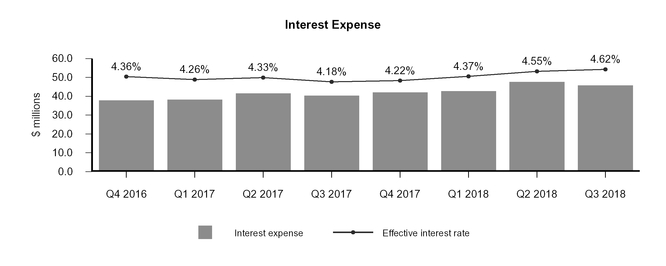
Interest Expense
| Three months ended September 30 | Nine months ended September 30 | |||||||||||||||
| ($ millions, except per boe amounts) | 2018 | 2017 | % Change | 2018 | 2017 | % Change | ||||||||||
| Interest expense | 45.8 | 40.4 | 13 | 136.2 | 120.2 | 13 | ||||||||||
| Per boe | 2.86 | 2.49 | 15 | 2.80 | 2.51 | 12 | ||||||||||
In the three months ended September 30, 2018, interest expense per boe and interest expense increased 15 percent and 13 percent, respectively, compared to the same period in 2017, primarily due to the Company's higher effective interest rate. The Company's effective interest rate in the three months ended September 30, 2018 increased to 4.62 percent from 4.18 percent in the same period in 2017 due to the increase in underlying market interest rates on floating rate debt.
In the nine months ended September 30, 2018, interest expense per boe and interest expense increased 12 percent and 13 percent, respectively, compared to the same period in 2017, reflecting the Company's higher average debt balance and effective interest rate. The Company's effective interest rate in the nine months ended September 30, 2018 increased to 4.51 percent from 4.26 percent in the same period in 2017 due to the increase in underlying market interest rates on floating rate debt.
Crescent Point actively manages interest rate exposure through a combination of interest rate swaps and a debt portfolio including short-term floating rate bank debt and long-term fixed rate senior guaranteed notes. At September 30, 2018, 57 percent of the Company's long-term debt, including the impact of CCS and the foreign exchange swap on its US dollar senior guaranteed notes, had fixed interest rates.
Exhibit 19
Foreign Exchange Gain (Loss)
| Three months ended September 30 | Nine months ended September 30 | |||||||||||||||||
| ($ millions) | 2018 | 2017 | % Change | 2018 | 2017 | % Change | ||||||||||||
| Realized gain (loss) | ||||||||||||||||||
| CCS - US dollar long-term debt maturities and interest payments | (1.8 | ) | (128.4 | ) | (99 | ) | 63.2 | (103.7 | ) | (161 | ) | |||||||
| US dollar long-term debt maturities | 5.6 | 131.5 | (96 | ) | (50.1 | ) | 115.8 | (143 | ) | |||||||||
| Other | (0.7 | ) | (7.3 | ) | (90 | ) | 1.3 | (3.0 | ) | (143 | ) | |||||||
| Unrealized gain (loss) | ||||||||||||||||||
| Translation of US dollar long-term debt | 62.9 | 13.4 | 369 | (69.8 | ) | 147.5 | (147 | ) | ||||||||||
| Other | 0.6 | 1.9 | (68 | ) | (0.9 | ) | 0.5 | (280 | ) | |||||||||
| Foreign exchange gain (loss) | 66.6 | 11.1 | 500 | (56.3 | ) | 157.1 | (136 | ) | ||||||||||
The Company has US dollar denominated debt, including London Inter-bank Offered Rate ("LIBOR") loans under its bank credit facilities and US dollar senior guaranteed notes. Concurrent with the drawdown of US$1.46 billion of LIBOR loans and the issuance of US$1.45 billion senior guaranteed notes, the Company entered into various CCS to hedge its foreign exchange exposure. Under the terms of the CCS, the US dollar amounts of the LIBOR loans and senior guaranteed notes were fixed for purposes of interest and principal repayments at notional amounts of $1.89 billion and $1.58 billion, respectively. Concurrent with the issuance of US$30.0 million senior guaranteed notes, the Company entered a foreign exchange swap which fixed the principal repayment at a notional amount of $32.2 million. The unrealized derivative gains and losses on the CCS and foreign exchange swap are recognized in derivative gains and losses. Refer to the Derivatives section in this MD&A for further information.
| CRESCENT POINT ENERGY CORP. | 13 |
The Company records unrealized foreign exchange gains or losses on the translation of the US dollar long-term debt and related accrued interest. During the three and nine months ended September 30, 2018, the Company recorded an unrealized foreign exchange gain of $62.9 million and an unrealized foreign exchange loss of $69.8 million, respectively, on the translation of US dollar long-term debt and accrued interest compared to unrealized gains of $13.4 million and $147.5 million, respectively, in the same periods in 2017. The unrealized foreign exchange gain from the translation of US dollar long-term debt and accrued interest for the third quarter of 2018 was attributable to a stronger Canadian dollar at September 30, 2018 as compared to June 30, 2018. The unrealized foreign exchange loss from the translation of US dollar long-term debt and accrued interest for the nine months ended September 30, 2018 is attributable to a weaker Canadian dollar as at September 30, 2018 as compared to December 31, 2017.
Share-based Compensation Expense
| Three months ended September 30 | Nine months ended September 30 | |||||||||||||||||
| ($ millions, except per boe amounts) | 2018 | 2017 | % Change | 2018 | 2017 | % Change | ||||||||||||
| Share-based compensation costs | 1.9 | 14.2 | (87 | ) | 57.4 | 43.3 | 33 | |||||||||||
| Capitalized | (1.0 | ) | (3.3 | ) | (70 | ) | (8.0 | ) | (8.7 | ) | (8 | ) | ||||||
| Share-based compensation expense | 0.9 | 10.9 | (92 | ) | 49.4 | 34.6 | 43 | |||||||||||
| Per boe | 0.06 | 0.67 | (92 | ) | 1.02 | 0.72 | 42 | |||||||||||
During the three and nine months ended September 30, 2018, the Company recorded share-based compensation costs of $1.9 million and $57.4 million, respectively. The 87 percent decrease in the three months ended September 30, 2018 was due to lower costs associated with the Company's Performance Share Unit ("PSU") Plan resulting from reduced performance multiplier estimates and a lower share price, along with lower expenses associated with base compensation restricted shares. The increase of 33 percent for the the nine months ended September 30, 2018, was primarily due to the grant of PSUs under the PSU Plan in April 2017, partially offset by the decrease in expenses associated with base compensation restricted shares. The Company recorded share-based compensation expense of nil and $2.8 million related to executive severance in the three and nine months ended September 30, 2018, respectively.
During the three and nine months ended September 30, 2018, the Company capitalized share-based compensation costs of $1.0 million and $8.0 million, respectively, decreases of 70 percent and 8 percent from the same periods in 2017, respectively. The decrease in the three months ended September 30, 2018 was primarily due to the decrease in expenses associated with incentive awards and base compensation restricted shares. The decrease for the nine months ended September 30, 2018 was primarily due to the decrease in expenses associated with base compensation restricted shares, partially offset by the increase in expenses associated with incentive awards.
Exhibit 20

Restricted Share Bonus Plan
The Company has a Restricted Share Bonus Plan pursuant to which the Company may grant restricted shares to directors, officers, employees and consultants. The restricted shares vest on terms up to three years from the grant date as determined by the Board of Directors. Restricted shares are settled upon vesting, at the Company's discretion, in common shares or cash.
Under the Restricted Share Bonus Plan at September 30, 2018, the Company was authorized to issue up to 14,548,718 common shares (September 30, 2017 - 12,957,494 common shares). The Company had 3,361,662 restricted shares outstanding at September 30, 2018 (September 30, 2017 - 3,649,378 restricted shares outstanding).
As of the date of this report, the Company had 3,404,889 restricted shares outstanding.
| CRESCENT POINT ENERGY CORP. | 14 |
Performance Share Unit Plan
The Company has a PSU Plan for designated employees. The PSUs vest on terms up to three years from the grant date as determined by the Board of Directors. PSUs are settled in cash upon vesting based on the prevailing Crescent Point share price, accrued dividends and the performance multipliers. Based on underlying units prior to any effect of the performance multiplier, the Company had 2,667,611 PSUs outstanding at September 30, 2018 (September 30, 2017 - 4,423,474 PSUs outstanding).
As of the date of this report, the Company had 2,426,830 PSUs outstanding based on underlying units prior to any effect of the performance multiplier.
Deferred Share Unit Plan
The Company has a Deferred Share Unit (“DSU”) Plan for directors. Each DSU vests on the date of the grant, however, the settlement of the DSU occurs following a change of control or when the individual ceases to be a director of the Company. Deferred Share Units are settled in cash based on the prevailing Crescent Point share price. The Company had 246,013 DSUs outstanding at September 30, 2018 (September 30, 2017 - 187,601 DSUs outstanding).
As of the date of this report, the Company had 295,792 DSUs outstanding.
Stock Option Plan
In May 2018, the Company approved a Stock Option Plan for designated employees. The Options have a maximum term of seven years and vest on terms as determined by the Board of Directors. Share-based compensation expense is determined based on the estimated fair value of the stock options on the date of the grant. The Company had 2,110,115 stock options outstanding at September 30, 2018 (September 30, 2017 - nil).
The following table summarizes information regarding stock options outstanding as at September 30, 2018:
| Number of stock options outstanding | Weighted average exercise price per share for options outstanding ($) | Vest year | Weighted average remaining term (years) | Number of stock options exercisable | Weighted average exercise price per share for options exercisable ($) | |||||||||||
| 621,323 | 10.04 | 2019 | 6.28 | — | — | |||||||||||
| 372,198 | 10.02 | 2020 | 6.30 | — | — | |||||||||||
| 372,198 | 10.02 | 2021 | 6.30 | — | — | |||||||||||
| 744,396 | 10.02 | 2022 | 6.30 | — | — | |||||||||||
As of the date of this report, the Company had 2,048,115 stock options outstanding.
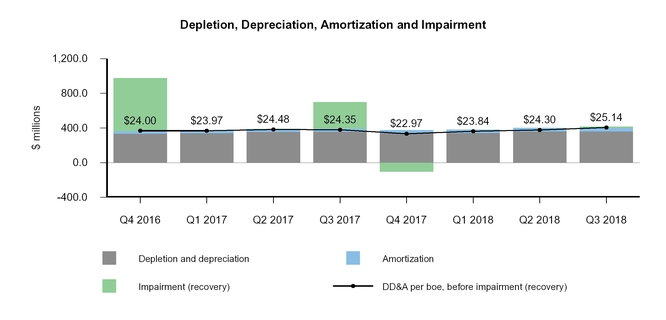
Depletion, Depreciation, Amortization and Impairment
| Three months ended September 30 | Nine months ended September 30 | |||||||||||||||||
| ($ millions, except per boe amounts) | 2018 | 2017 | % Change | 2018 | 2017 | % Change | ||||||||||||
| Depletion and depreciation | 363.1 | 360.6 | 1 | 1,069.7 | 1,060.0 | 1 | ||||||||||||
| Amortization of exploration and evaluation undeveloped land | 39.9 | 33.7 | 18 | 118.2 | 99.5 | 19 | ||||||||||||
| Depletion, depreciation and amortization | 403.0 | 394.3 | 2 | 1,187.9 | 1,159.5 | 2 | ||||||||||||
| Impairment | 15.2 | 306.5 | (95 | ) | 15.2 | 306.5 | (95 | ) | ||||||||||
| Depletion, depreciation, amortization and impairment | 418.2 | 700.8 | (40 | ) | 1,203.1 | 1,466.0 | (18 | ) | ||||||||||
| Per boe, before impairment | 25.14 | 24.35 | 3 | 24.42 | 24.27 | 1 | ||||||||||||
| Per boe | 26.08 | 43.27 | (40 | ) | 24.74 | 30.68 | (19 | ) | ||||||||||
The Company's depletion, depreciation and amortization (“DD&A”) rate before impairment remained relatively consistent for the three and nine months ended September 30, 2018 compared to the same periods in 2017.
At September 30, 2018, the Company classified certain non-core assets as held for sale. Immediately prior to classifying the assets as held for sale, the Company conducted a review of the assets' recoverable amounts based on expected consideration of $12.2 million and recorded impairment losses of $15.2 million as a component of depletion, depreciation, amortization and impairment expense, of which $14.1 million related to PP&E and $1.1 million related to goodwill.
At September 30, 2017, the Company recorded impairment expense, net of recoveries, of $306.5 million. The impairments of $601.6 million in the Southeast Saskatchewan, Southwest Saskatchewan and South Alberta CGUs were largely a result of the decrease in forecast benchmark commodity prices. The Company also recorded impairment on assets held for sale of $14.9 million. The recoveries of $310.0 million in the Northern U.S. and Utah CGUs were largely a result of the positive impact of technical and development reserve additions, partially offset by the decrease in forecast benchmark commodity prices.
Any property, plant and equipment ("PP&E") impairment recorded is recoverable to its original value less any associated DD&A expense should there be indicators that the recoverable amount of PP&E has increased in value since the impairment expense was recorded. Goodwill impairments are not reversed.
| CRESCENT POINT ENERGY CORP. | 15 |
Exhibit 21
Other Income (Loss)
The Company recorded other losses of $38.8 million and $110.4 million in the three and nine months ended September 30, 2018, respectively, compared to other income of $9.5 million and $2.9 million, respectively, in the same periods in 2017. The other losses in the three and nine months ended September 30, 2018 were comprised primarily of losses on capital dispositions and net unrealized losses on long-term investments. The other income in the three and nine months ended September 30, 2017 were comprised primarily of gains on capital dispositions, partially offset by net unrealized losses on long-term investments.
Taxes
| Three months ended September 30 | Nine months ended September 30 | ||||||||||||||||
| ($ millions) | 2018 | 2017 | % Change | 2018 | 2017 | % Change | |||||||||||
| Current tax expense | — | — | — | — | — | — | |||||||||||
| Deferred tax expense (recovery) | 10.8 | (84.2 | ) | (113 | ) | (94.9 | ) | (47.5 | ) | 100 | |||||||
Current Tax Expense
In the three and nine months ended September 30, 2018 and 2017, the Company recorded current tax expense of nil. Refer to the Company's Annual Information Form for the year ended December 31, 2017 for information on the Company's expected tax horizon.
Deferred Tax Expense (Recovery)
In the three months ended September 30, 2018, the Company recorded a deferred tax expense of $10.8 million, reflecting the pre-tax income recorded in the three months ended September 30, 2018. In the nine months ended September 30, 2018, the Company recorded a deferred tax recovery of $94.9 million, primarily due to the pre-tax loss recorded.
In the three and nine months ended September 30, 2017, the Company recorded deferred tax recoveries of $84.2 million and $47.5 million, respectively, primarily due to the pre-tax losses and changes in the amount of estimated usable tax pools. The recovery in the nine month period ended September 30, 2017 also reflects the benefit of the one percent decrease in the Saskatchewan corporate income tax rate. The Saskatchewan corporate income tax rate decreased from 12 percent to 11.5 percent on July 1, 2017, however, the rate was subsequently changed back to 12 percent effective January 1, 2018.
| CRESCENT POINT ENERGY CORP. | 16 |
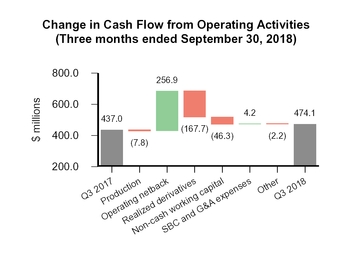
Cash Flow from Operating Activities, Adjusted Funds Flow from Operations, Net Income (Loss) and Adjusted Net Earnings from Operations
| Three months ended September 30 | Nine months ended September 30 | ||||||||||||||||
| ($ millions, except per share amounts) | 2018 | 2017 | % Change | 2018 | 2017 | % Change | |||||||||||
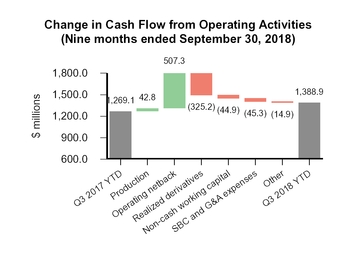
| Cash flow from operating activities | 474.1 | 437.0 | 8 | 1,388.9 | 1,269.1 | 9 | |||||||||||
Adjusted funds flow from operations (1) | 474.7 | 389.0 | 22 | 1,403.9 | 1,234.1 | 14 | |||||||||||
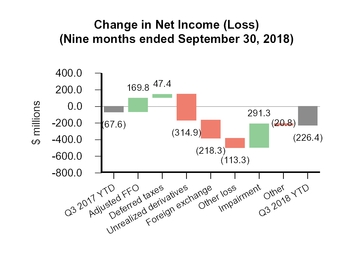
| Net income (loss) | 30.5 | (270.6 | ) | (111 | ) | (226.4 | ) | (67.6 | ) | 235 | |||||||
| Net income (loss) per share - diluted | 0.06 | (0.50 | ) | (112 | ) | (0.41 | ) | (0.12 | ) | 242 | |||||||
Adjusted net earnings from operations (1) | 84.8 | 33.7 | 152 | 250.9 | 135.1 | 86 | |||||||||||
Adjusted net earnings from operations per share - diluted (1) | 0.15 | 0.06 | 150 | 0.46 | 0.25 | 84 | |||||||||||
| (1) | Non-GAAP financial measure that does not have any standardized meaning prescribed by IFRS and, therefore, may not be comparable with the calculation of similar measures presented by other entities. Refer to the Non-GAAP Financial Measures section in this MD&A for further information. |
Cash flow from operating activities increased 8 percent to $474.1 million in the third quarter of 2018, compared to $437.0 million in the same period in 2017, due to the changes in adjusted funds flow from operations and fluctuations in working capital, transaction costs and decommissioning expenditures. In the nine months ended September 30, 2018, cash flow from operating activities increased 9 percent to $1.39 billion compared to $1.27 billion in the same period in 2017, due to the changes in adjusted funds flow from operations and fluctuations in working capital, transaction costs and decommissioning expenditures.
Exhibit 22
Adjusted funds flow from operations increased to $474.7 million in the third quarter of 2018 from $389.0 million in the same period in 2017. The increase was primarily the result of the increases in the Cdn$ WTI benchmark price, partially offset by the realized hedging loss and the increases in royalties and operating expenses.
Adjusted funds flow from operations increased to $1.40 billion in the nine months ended September 30, 2018 from $1.23 billion in the same period in 2017. The increase is primarily the result of the increases in the Cdn$ WTI benchmark price and production volumes, partially offset by the realized hedging loss, the increases in royalties, operating expenses and cash-settled share-based compensation, and severance charges.
| CRESCENT POINT ENERGY CORP. | 17 |
Exhibit 23


The Company reported net income of $30.5 million in the third quarter of 2018, compared to a net loss of $270.6 million in the same period in 2017, primarily as a result of the decrease in impairment expense, the increase in adjusted funds flow from operations, the increase in foreign exchange gain on long-term debt and the decrease in unrealized derivative losses, partially offset by fluctuations in deferred taxes and other loss. In the three months ended September 30, 2018, the Company recorded net income per share - diluted of $0.06 compared to net loss per share - diluted of $0.50 in the same period in 2017, due to the same reasons discussed above.
In the nine month period ended September 30, 2018, the Company reported a net loss of $226.4 million compared to $67.6 million in the same period in 2017, primarily as a result of the increases in unrealized derivative losses, foreign exchange loss on long-term debt and other loss, partially offset by the decrease in impairment expense, the increase in adjusted funds flow from operations and fluctuations in deferred taxes. In the nine months ended September 30, 2018, the Company recorded net loss per share - diluted of $0.41 compared to net loss per share - diluted of $0.12 in the same period in 2017, due to the same reasons discussed above.
Exhibit 24

The Company reported adjusted net earnings from operations of $84.8 million in the third quarter of 2018 compared to $33.7 million in the same period in 2017, primarily as a result of the increase in adjusted funds flow from operations, partially offset by fluctuations in deferred taxes. Adjusted net earnings from operations per share - diluted for the three months ended September 30, 2018 increased 150 percent to $0.15 compared to $0.06 in the same period in 2017, primarily due to the same reasons discussed above.
Adjusted net earnings for the nine month period ended September 30, 2018 was $250.9 million compared to $135.1 million in the same period in 2017, primarily as a result of the increase in adjusted funds flow from operations, partially offset by fluctuations in deferred taxes. Adjusted net earnings from operations per share - diluted for the nine months ended September 30, 2018 increased 84 percent to $0.46 compared to $0.25 in the same period in 2017, primarily due to the same reasons discussed above.
| CRESCENT POINT ENERGY CORP. | 18 |
As noted in the Derivatives section, the Company has not designated any of its risk management activities as accounting hedges under IFRS 9, Financial Instruments, and, accordingly, has recorded its derivatives at fair value with changes in fair value recorded in net income.
Crescent Point uses financial commodity derivatives, including swaps, collars and put options, to reduce the volatility of the selling price of its crude oil and natural gas production. This provides a measure of stability to the Company's cash flow and the ability to fund dividends over time. The Company's commodity derivatives portfolio can extend out over 3½ years from the current quarter.
IFRS 9, Financial Instruments, gives guidelines for accounting for financial derivatives not designated as accounting hedges. Financial derivatives that have not settled during the current quarter are fair valued. The change in fair value from the previous quarter represents a gain or loss that is recorded in net income. As such, if benchmark oil and natural gas prices rise during the quarter, the Company records a loss based on the change in price multiplied by the volume of oil and natural gas hedged. If prices fall during the quarter, the Company records a gain. The prices used to record the actual gain or loss are subject to an adjustment for volatility and the resulting gain (asset) or loss (liability) is discounted to a present value using a risk free rate adjusted for counterparty credit risk.
Crescent Point's underlying physical reserves are not fair valued each quarter, hence no gain or loss associated with price changes is recorded; the Company realizes the benefit/detriment of any price increase/decrease in the period in which the physical sales occur.
The Company's financial results should be viewed with the understanding that the estimated future gain or loss on financial derivatives is recorded in the current period's results, while the estimated future value of the underlying physical sales is not.
Dividends
The following table provides a reconciliation of dividends:
| Three months ended September 30 | Nine months ended September 30 | |||||||||||||||
| ($ millions, except per share amounts) | 2018 | 2017 | % Change | 2018 | 2017 | % Change | ||||||||||
| Accumulated dividends, beginning of period | 7,507.9 | 7,309.7 | 3 | 7,408.6 | 7,210.9 | 3 | ||||||||||
| Dividends declared to shareholders | 49.8 | 49.4 | 1 | 149.1 | 148.2 | 1 | ||||||||||
| Accumulated dividends, end of period | 7,557.7 | 7,359.1 | 3 | 7,557.7 | 7,359.1 | 3 | ||||||||||
| Accumulated dividends per share, beginning of period | 31.98 | 31.62 | 1 | 31.80 | 31.44 | 1 | ||||||||||
| Dividends declared to shareholders per share | 0.09 | 0.09 | — | 0.27 | 0.27 | — | ||||||||||
| Accumulated dividends per share, end of period | 32.07 | 31.71 | 1 | 32.07 | 31.71 | 1 | ||||||||||
Dividends remained relatively consistent in the three and nine months ended September 30, 2018 compared to the same periods in 2017.
Exhibit 25

| (1) | Non-GAAP financial measure that does not have any standardized meaning prescribed by IFRS and, therefore, may not be comparable with the calculation of similar measures presented by other entities. Refer to the Non-GAAP Financial Measures section in this MD&A for further information. |
| CRESCENT POINT ENERGY CORP. | 19 |
Long-Term Investments
Public Companies
The Company holds common shares in publicly traded oil and gas companies. The investments are classified as financial assets at fair value through profit or loss and are fair valued each period with the resulting gain or loss recorded in net income. At September 30, 2018, the investments were recorded at a fair value of $13.5 million which was $7.5 million more than the original cost of the investments.
Private Company
The Company holds common shares in a private oil and gas company. The investment is classified as financial assets at fair value through profit or loss and is fair valued each period with the resulting gain or loss recorded in net income. At September 30, 2018, the investment was recorded at a fair value of $6.5 million which was $18.5 million less than the original cost of the investment.
Other Long-Term Assets
At September 30, 2018, other long-term assets consist of $12.3 million related to the reclamation fund and $15.8 million of investment tax credits.
The reclamation fund decreased by $6.0 million during the third quarter of 2018 due to $12.5 million of expenditures, partially offset by contributions of $6.5 million. The expenditures related primarily to decommissioning work completed in Alberta, Saskatchewan and the United States.
Related Party Transactions
All related party transactions are recorded at the exchange amount.
During the three and nine months ended September 30, 2018, Crescent Point recorded $2.7 million and $9.3 million, respectively, (three and nine months ended September 30, 2017 - $3.3 million and $9.5 million, respectively) of expenditures in the normal course of business to an oilfield services company of which a director of Crescent Point is a director and officer. The oilfield services company is one of only a few specialized service providers in their area of expertise with capacity and geographical presence to meet the Company’s needs. The service company was selected, along with a few other key vendors, to provide goods and services as part of a comprehensive and competitive request for proposal process with key factors of its success being the unique nature of proprietary products, the ability to service specific geographic regions, proven safety performance and/or competitive pricing.
Executive Severance
During the three and nine months ended September 30, 2018, the Company recorded G&A expenses related to executive severance of nil and $10.7 million, respectively (three and nine months ended September 30, 2017 - nil). The Company recorded share-based compensation expense related to executive severance of nil and $2.8 million in the three and nine months ended September 30, 2018, respectively (three and nine months ended September 30, 2017 - nil).
Capital Expenditures
| Three months ended September 30 | Nine months ended September 30 | |||||||||||||||||
| ($ millions) | 2018 | 2017 | % Change | 2018 | 2017 | % Change | ||||||||||||
Capital acquisitions (dispositions), (net) (1) | (21.4 | ) | (12.7 | ) | 69 | (298.0 | ) | 157.8 | (289 | ) | ||||||||
| Development capital expenditures | 416.0 | 505.7 | (18 | ) | 1,462.6 | 1,332.4 | 10 | |||||||||||
Capitalized administration (2) | 9.5 | 10.0 | (5 | ) | 31.1 | 29.5 | 5 | |||||||||||
| Corporate assets | 1.9 | 0.8 | 138 | 6.6 | 2.6 | 154 | ||||||||||||
| Total | 406.0 | 503.8 | (19 | ) | 1,202.3 | 1,522.3 | (21 | ) | ||||||||||
| (1) | Capital acquisitions represent total consideration for the transactions including net debt and acquired common shares and excludes transaction costs. |
| (2) | Capitalized administration excludes capitalized equity-settled share-based compensation. |
Capital Acquisitions and Dispositions
Major Property Disposition
Southeast Saskatchewan Asset Disposition
In the nine months ended September 30, 2018, the Company completed the disposition of non-core assets in southeast Saskatchewan and southwest Manitoba ($288.7 million disposed PP&E, including $26.8 million related to disposed decommissioning liability, $2.4 million disposed exploration and evaluation ("E&E") assets and $6.2 million disposed goodwill). This disposition was completed with full tax pools and no working capital items. Proceeds included long-term investments.
| CRESCENT POINT ENERGY CORP. | 20 |
Minor Property Acquisitions and Dispositions
In the nine months ended September 30, 2018, the Company completed minor property acquisitions and dispositions including assets and associated liabilities held for sale at December 31, 2017 ($146.2 million net disposed PP&E, including $10.9 million related to net disposed decommissioning liability, $7.6 million net acquired E&E assets and $0.6 million disposed goodwill). These minor property acquisitions and dispositions were completed with full tax pools, no working capital items and proceeds included long-term investments.
Development Capital Expenditures
The Company's development capital expenditures in the third quarter of 2018 were $416.0 million, compared to $505.7 million in the same period in 2017. In the third quarter of 2018, 215 (169.2 net) wells were drilled and $49.6 million was spent on on facilities, land and seismic.
The Company's development capital expenditures for the nine months ended September 30, 2018 were $1.46 billion compared to $1.33 billion in the same period in 2017. In the nine months ended September 30, 2018, 583 (465.8 net) wells were drilled and $204.8 million was spent on on facilities, land and seismic.
Crescent Point's budgeted capital expenditure guidance for 2018 is $1.775 billion, before net land and property acquisitions.
Goodwill
The Company's goodwill balance is attributable to corporate acquisitions completed during the period 2003 through 2012. The goodwill balance as at September 30, 2018 was $244.0 million compared to $251.9 million at December 31, 2017. The decrease of $7.9 million is attributable to the Southeast Saskatchewan asset disposition, other minor property dispositions and transfers to assets held for sale. At September 30, 2018, the value of the Company's market capitalization as compared to net asset value was an indicator of goodwill impairment. The Company concluded that the estimated recoverable amount exceeded the carrying amount and no impairment was recorded.
Other Current Liabilities
At September 30, 2018, other current liabilities consist of $12.7 million related to the current portion of long-term compensation liability, $3.4 million related to a lease inducement, $2.4 million related to the estimated unrecoverable portion of building leases and $39.0 million related to decommissioning liability.
Other Long-Term Liabilities
At September 30, 2018, other long-term liabilities consist of $5.4 million of long-term compensation liability related to share-based compensation, $37.3 million related to a lease inducement and $7.6 million related to the estimated unrecoverable portion of building leases. The Company's lease inducement is associated with the building lease for Crescent Point's corporate office. This non-cash liability is amortized on a straight-line basis over the term of the lease to June 2030.
Decommissioning Liability
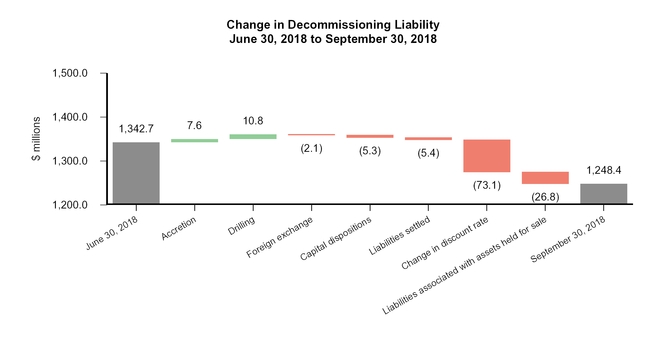
The decommissioning liability decreased by $94.3 million during the third quarter of 2018 from $1.34 billion at June 30, 2018 to $1.25 billion at September 30, 2018. The decrease relates to $73.1 million change in estimate pertaining to discount rates, $26.8 million reclassified as liabilities associated with assets held for sale, $5.4 million for liabilities settled, $5.3 million as a result of capital dispositions and $2.1 million related to foreign exchange, partially offset by $10.8 million in respect of drilling and $7.6 million of accretion expense.
| CRESCENT POINT ENERGY CORP. | 21 |
Exhibit 26
Liquidity and Capital Resources
Capitalization Table ($ millions, except share, per share, ratio and percent amounts) | September 30, 2018 | December 31, 2017 | ||||
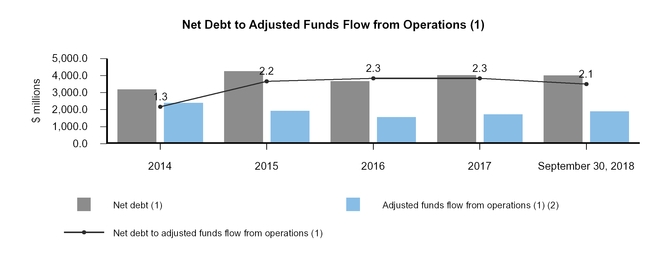
Net debt (1) | 4,006.9 | 4,024.9 | ||||
| Shares outstanding | 549,859,325 | 545,794,384 | ||||
| Market price at end of period (per share) | 8.22 | 9.58 | ||||
Market capitalization (1) | 4,519.8 | 5,228.7 | ||||
Enterprise value (1) | 8,526.7 | 9,253.6 | ||||
| Net debt as a percentage of enterprise value | 47 | 43 | ||||
Adjusted funds flow from operations (1) (2) | 1,898.6 | 1,728.8 | ||||
Net debt to adjusted funds flow from operations (1) | 2.1 | 2.3 | ||||
| (1) | Non-GAAP financial measure that does not have any standardized meaning prescribed by IFRS and, therefore, may not be comparable with the calculation of similar measures presented by other entities. Refer to the Non-GAAP Financial Measures section in this MD&A for further information. |
| (2) | The sum of adjusted funds flow from operations for the trailing four quarters. |
At September 30, 2018, Crescent Point's enterprise value was $8.53 billion and the Company was capitalized with 53 percent equity compared to $9.25 billion and 57 percent at December 31, 2017, respectively. The Company's net debt to adjusted funds flow from operations ratio at September 30, 2018 decreased to 2.1 times compared to 2.3 times at December 31, 2017, largely due to the increase in adjusted funds flow from operations, primarily as a result of the increase in the Cdn $ WTI benchmark price. Crescent Point's objective is to manage net debt to adjusted funds flow from operations to be well positioned to maximize shareholder return.
| CRESCENT POINT ENERGY CORP. | 22 |
Exhibit 27
| (1) | Includes cash of $65.5 million. |
Exhibit 28
| (1) | Non-GAAP financial measure that does not have any standardized meaning prescribed by IFRS and, therefore, may not be comparable with the calculation of similar measures presented by other entities. Refer to the Non-GAAP Financial Measures section in this MD&A for further information. |
| (2) | The sum of adjusted funds flow from operations for the trailing four quarters. |
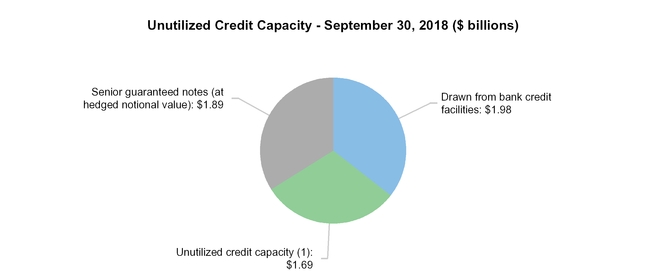
The Company has combined credit facilities of $3.60 billion, including a $3.50 billion syndicated unsecured credit facility with fourteen banks and a $100.0 million unsecured operating credit facility with one Canadian chartered bank. The syndicated unsecured credit facility also includes an accordion feature that allows the Company to increase the facility by up to $500.0 million under certain conditions. The current maturity date of the syndicated unsecured credit facility and the unsecured operating credit facility is June 10, 2021. Both of these facilities constitute revolving credit facilities and are extendible annually. As at September 30, 2018, the Company had approximately $1.98 billion drawn on bank credit facilities, including $7.5 million outstanding pursuant to letters of credit, leaving unutilized borrowing capacity of approximately $1.69 billion including cash of $65.5 million.
The Company has made private offerings of senior guaranteed notes raising total gross proceeds of US$1.48 billion and Cdn$277.0 million. The notes are unsecured and rank pari passu with the Company's bank credit facilities and carry a bullet repayment on maturity. Crescent Point entered into various CCS and foreign exchange swaps to hedge its foreign exchange exposure on its US dollar long-term debt.
| CRESCENT POINT ENERGY CORP. | 23 |
The Company is in compliance with all debt covenants at September 30, 2018 which are listed in the table below:
| Covenant Description | Maximum Ratio | September 30, 2018 | |||
Senior debt to adjusted EBITDA (1) (2) | 3.5 | 2.0 | |||
Total debt to adjusted EBITDA (1) (3) | 4.0 | 2.0 | |||
Senior debt to capital (2) (4) | 0.55 | 0.32 | |||
| (1) | Adjusted EBITDA is calculated as earnings before interest, taxes, depletion, depreciation, amortization and impairment, adjusted for certain non-cash items. Adjusted EBITDA is calculated on a trailing twelve month basis adjusted for material acquisitions and dispositions. |
| (2) | Senior debt is calculated as the sum of amounts drawn on the combined facilities, outstanding letters of credit and the principal amount of the senior guaranteed notes. |
| (3) | Total debt is calculated as the sum of senior debt plus subordinated debt. Crescent Point does not have any subordinated debt. |
| (4) | Capital is calculated as the sum of senior debt and shareholder's equity and excludes the effect of unrealized derivative gains or losses. |
Crescent Point's budgeted capital expenditure guidance for 2018 is $1.78 billion, before net land and property acquisitions, with average 2018 production forecast at 177,000 boe/d.
The Company expects to finance its working capital deficiency and its ongoing working capital requirements through cash, adjusted funds flow from operations and its bank credit facilities.
Shareholders' Equity
At September 30, 2018, Crescent Point had 549.9 million common shares issued and outstanding compared to 545.8 million common shares at December 31, 2017. The increase of 4.1 million shares relates to shares issued pursuant to the Restricted Share Bonus Plan.
As of the date of this report, the Company had 550,151,561 common shares outstanding.
Critical Accounting Estimates
There have been no changes in Crescent Point's critical accounting estimates in the nine months ended September 30, 2018. Further information on the Company's critical accounting policies and estimates can be found in the notes to the annual consolidated
financial statements and MD&A for the year ended December 31, 2017.
Changes in Accounting Policies
In the current accounting period, the Company adopted the following changes to IFRS:
| • | IFRS 9 Financial Instruments - IFRS 9 was amended in July 2014 to include guidance to assess and recognize impairment losses on financial assets based on an expected loss model. The adoption of this amendment did not have a material impact on the valuation of its financial assets. |
| • | IFRS 15 Revenue from Contracts with Customers - The Company reviewed contracts with customers for its major revenue streams and concluded that the adoption of IFRS 15 did not have a material impact on the consolidated financial statements. The adoption of IFRS required the Company to expand its disclosures in the notes to the consolidated financial statements, including the disaggregation of revenue streams by product type. |
In future accounting periods, the Company will adopt the following IFRS:
IFRS 16 Leases
IFRS 16 was issued January 2016 and replaces IAS 17 Leases and IFRIC 4 Determining Whether an Arrangement Contains a Lease. The standard introduces a single lessee accounting model for leases with required recognition of assets and liabilities for most leases, where the Company is acting as a lessee. The adoption of IFRS 16 for lessees eliminates the dual classification model of leases as either operating leases or finance leases, effectively treating almost all leases as finance leases. Certain short-term leases (less than 12 months) and leases of low-value assets are exempt from recognition and will continue to be treated as operating leases. There is no significant impact from the adoption of IFRS 16 for lessors as the dual classification model of leases and the accounting for lessors remains virtually unchanged. The standard is effective for fiscal years beginning on or after January 1, 2019 with early adoption permitted if the Company is also applying IFRS 15. The standard is required to be adopted either retrospectively or using a modified retrospective approach.
| CRESCENT POINT ENERGY CORP. | 24 |
On January 1, 2019, the Company will adopt IFRS 16 and plans to use the modified retrospective approach. The Company intends to use the following practical expedients permitted under the standard. Some of these expedients are on a lease-by-lease basis and others are applicable by class of underlying assets.
| • | Account for leases with a remaining term of less than 12 months at January 1, 2019 as short-term leases; |
| • | Account for lease payments as an expense and not recognize a right-of-use ("ROU") asset if the underlying asset is of a lower dollar value; and |
| • | Use of the Company's previous assessment of impairment under IAS 37 for onerous contracts instead of re-assessing the ROU asset for impairment on January 1, 2019. |
The Company has substantially completed a detailed assessment on the potential impact of the standard on the consolidated financial statements. The actual impact of applying the standard will depend on the Company's borrowing rate, lease portfolio, whether the Company will exercise any lease renewal options and the practical expedients applied on January 1, 2019. On adoption of IFRS 16, the Company will recognize lease liabilities related to leases previously classified as operating leases. The lease liability will be calculated as the present value of the remaining lease payments, discounted using the Company's borrowing rate on January 1, 2019. The associated ROU asset will be measured as follows on a lease-by-lease basis:
| • | The amount equal to the lease liability on January 1, 2019 with no impact on retained earnings: or |
| • | The balance on January 1, 2019 as if IFRS 16 had always been applied on the commencement of the lease, using the Company's borrowing rate on January 1, 2019 and with an impact on retained earnings calculated as the difference between the lease liability and the ROU asset values. |
In addition, the presentation of expenses related to leases will change as the standard replaces the straight-line operating lease expense with accretion expense on the lease liability and depreciation expense on the ROU asset.
The Company has developed a process for identifying and reviewing contracts in order to identify potential leases. The review is substantially complete and the Company expects that the most significant impact the standard will have on the consolidated financial statements will be the recognition of lease obligations on operating leases for office space and the corresponding ROU assets. For the remainder of the year, the Company will be focused on developing and implementing changes to policies, internal controls, information systems and business and accounting processes.
| CRESCENT POINT ENERGY CORP. | 25 |
Summary of Quarterly Results
| 2018 | 2017 | 2016 | ||||||||||||||||||||||
| ($ millions, except per share amounts) | Q3 | Q2 | Q1 | Q4 | Q3 | Q2 | Q1 | Q4 | ||||||||||||||||
| Oil and gas sales | 1,076.7 | 1,084.0 | 935.2 | 916.2 | 767.0 | 813.8 | 806.9 | 749.1 | ||||||||||||||||
| Average daily production | ||||||||||||||||||||||||
| Crude oil (bbls/d) | 134,146 | 145,532 | 141,312 | 140,544 | 139,254 | 140,878 | 139,303 | 130,386 | ||||||||||||||||
| NGLs (bbls/d) | 22,257 | 17,934 | 18,775 | 19,437 | 18,811 | 17,658 | 17,061 | 18,083 | ||||||||||||||||
| Natural gas (mcf/d) | 107,231 | 110,110 | 109,983 | 113,963 | 108,021 | 102,471 | 101,791 | 99,765 | ||||||||||||||||
| Total (boe/d) | 174,275 | 181,818 | 178,418 | 178,975 | 176,069 | 175,615 | 173,329 | 165,097 | ||||||||||||||||
Net income (loss) | 30.5 | (166.2 | ) | (90.7 | ) | (56.4 | ) | (270.6 | ) | 83.6 | 119.4 | (510.6 | ) | |||||||||||
| Net income (loss) per share | 0.06 | (0.30 | ) | (0.17 | ) | (0.10 | ) | (0.50 | ) | 0.15 | 0.22 | (0.94 | ) | |||||||||||
| Net income (loss) per share – diluted | 0.06 | (0.30 | ) | (0.17 | ) | (0.10 | ) | (0.50 | ) | 0.15 | 0.22 | (0.94 | ) | |||||||||||
Adjusted net earnings (loss) from operations (1) | 84.8 | 102.7 | 63.4 | (35.1 | ) | 33.7 | 39.5 | 61.9 | 100.6 | |||||||||||||||
Adjusted net earnings (loss) from operations per share (1) | 0.15 | 0.19 | 0.12 | (0.06 | ) | 0.06 | 0.07 | 0.11 | 0.19 | |||||||||||||||
Adjusted net earnings (loss) from operations per share – diluted (1) | 0.15 | 0.19 | 0.12 | (0.06 | ) | 0.06 | 0.07 | 0.11 | 0.18 | |||||||||||||||
| Cash flow from operating activities | 474.1 | 452.8 | 462.0 | 449.6 | 437.0 | 415.9 | 416.2 | 438.5 | ||||||||||||||||
Adjusted funds flow from operations (1) | 474.7 | 500.3 | 428.9 | 494.7 | 389.0 | 418.0 | 427.1 | 422.0 | ||||||||||||||||
Adjusted working capital (deficiency) (2) | (139.9 | ) | (90.4 | ) | (339.8 | ) | (133.3 | ) | (259.1 | ) | (171.6 | ) | (202.0 | ) | (277.0 | ) | ||||||||
| Total assets | 15,948.9 | 16,174.7 | 16,481.6 | 16,005.3 | 15,945.1 | 16,419.2 | 16,568.8 | 16,163.6 | ||||||||||||||||
| Total liabilities | 7,049.5 | 7,210.1 | 7,374.7 | 6,842.4 | 6,696.7 | 6,777.0 | 6,910.7 | 6,572.4 | ||||||||||||||||
Net debt (1) | 4,006.9 | 4,015.7 | 4,409.3 | 4,024.9 | 4,135.9 | 3,966.7 | 3,987.7 | 3,677.1 | ||||||||||||||||
| Total long-term derivative liability | 17.9 | 35.3 | 17.4 | 16.6 | 8.8 | — | — | 3.0 | ||||||||||||||||
| Weighted average shares – diluted (millions) | 551.1 | 551.0 | 548.4 | 546.9 | 546.2 | 546.1 | 546.2 | 544.5 | ||||||||||||||||
Capital expenditures (3) | 406.0 | 57.6 | 738.7 | 334.2 | 503.8 | 338.3 | 680.2 | 429.8 | ||||||||||||||||
| Dividends declared | 49.8 | 49.7 | 49.6 | 49.5 | 49.4 | 49.4 | 49.4 | 49.2 | ||||||||||||||||
| Dividends declared per share | 0.09 | 0.09 | 0.09 | 0.09 | 0.09 | 0.09 | 0.09 | 0.09 | ||||||||||||||||
| (1) | Non-GAAP financial measure that does not have any standardized meaning prescribed by IFRS and, therefore, may not be comparable with the calculation of similar measures presented by other entities. Refer to the Non-GAAP Financial Measures section in this MD&A for further information. |
| (2) | Adjusted working capital deficiency is calculated as accounts payable and accrued liabilities, dividends payable and long-term compensation liability, less cash, accounts receivable, prepaids and deposits and long-term investments. |
| (3) | Capital expenditures exclude capitalized share-based compensation and include capital acquisitions and dispositions. Capital acquisitions and dispositions represent total consideration for the transactions including long-term debt, working capital assumed and acquired common shares, and excludes transaction costs. |
Over the past eight quarters, the Company's oil and gas sales have fluctuated due to movement in the Cdn$ WTI benchmark price, changes in production and fluctuations in corporate oil price differentials. The Company's production has fluctuated due to its successful capital development program, several business combinations, non-core dispositions and natural declines.
Net income has fluctuated primarily due to changes in adjusted funds flow from operations, unrealized derivative gains and losses, which fluctuate with the changes in forward market prices, net impairments to PP&E recorded in the third quarters of 2018 and 2017 and fourth quarter of 2016, net recovery of PP&E recorded in the fourth quarter of 2017 and gains and losses on capital dispositions, along with associated fluctuations in deferred tax expense (recovery).
Adjusted net earnings from operations has fluctuated over the past eight quarters primarily due to changes in adjusted funds flow from operations, depletion and share-based compensation expense along with associated fluctuations in deferred tax expense (recovery).
Capital expenditures fluctuated through this period as a result of timing of acquisitions, non-core dispositions and the Company's capital development program. Cash flow from operating activities and adjusted funds flow from operations throughout the last eight quarters has allowed the Company to pay monthly dividends.
| CRESCENT POINT ENERGY CORP. | 26 |
Internal Control Update
Crescent Point is required to comply with Multilateral Instrument 52-109 Certification of Disclosure on Issuers' Annual and Interim
Filings. The certificate requires that Crescent Point disclose in the interim MD&A any weaknesses in Crescent Point's internal control over financial reporting that occurred during the period that have materially affected, or are reasonably likely to materially affect
Crescent Point's internal controls over financial reporting. Crescent Point confirms that no such weaknesses were identified in the Company's internal controls over financial reporting during the third quarter of 2018.
Outlook
Crescent Point's guidance for 2018 is as follows:
| Production | ||||
| Total average annual production (boe/d) | 177,000 | |||
| % Oil and NGLs | 90% | |||
Capital expenditures (1) | ||||
| Drilling and development ($ millions) | 1,575.0 | |||
| Facilities and seismic ($ millions) | 200.0 | |||
| Total ($ millions) | 1,775.0 | |||
| (1) | The projection of capital expenditures excludes property and land acquisitions, which are separately considered and evaluated. |
Additional information relating to Crescent Point, including the Company's December 31, 2017 Annual Information Form, is available on SEDAR at www.sedar.com and on EDGAR at www.sec.gov/edgar.shtml.
| CRESCENT POINT ENERGY CORP. | 27 |
Non-GAAP Financial Measures
Throughout this MD&A, the Company uses the terms "operating netback", "netback", “adjusted funds flow from operations”, “adjusted net earnings from operations”, “adjusted net earnings from operations per share”, “adjusted net earnings from operations per share - diluted”, "payout ratio", “net debt”, “net debt to adjusted funds flow from operations”, “market capitalization” and “enterprise value”. These terms do not have any standardized meaning as prescribed by IFRS and, therefore, may not be comparable with the calculation of similar measures presented by other issuers.
Operating netback is calculated on a per boe basis as oil and gas sales, less royalties, operating and transportation expenses. Netback is calculated on a per boe basis as operating netback plus realized derivative gains and losses. Operating netback and netback are common metrics used in the oil and gas industry and are used by management to measure operating results on a per boe basis to better analyze performance against prior periods on a comparable basis. The calculations of operating netback and netback are shown in the Results of Operations section in this MD&A.
Adjusted funds flow from operations is calculated based on cash flow from operating activities before changes in non-cash working capital, transaction costs and decommissioning expenditures. Transaction costs are excluded as they vary based on the Company's acquisition and disposition activity and to ensure that this metric is more comparable between periods. Decommissioning expenditures are excluded as the Company has a voluntary reclamation fund to fund decommissioning costs. Management utilizes adjusted funds flow from operations as a key measure to assess the ability of the Company to finance dividends, operating activities, capital expenditures and debt repayments. Adjusted funds flow from operations as presented is not intended to represent cash flow from operating activities, net earnings or other measures of financial performance calculated in accordance with IFRS.
The following table reconciles cash flow from operating activities to adjusted funds flow from operations:
| Three months ended September 30 | Nine months ended September 30 | |||||||||||||||||
| ($ millions) | 2018 | 2017 | % Change | 2018 | 2017 | % Change | ||||||||||||
| Cash flow from operating activities | 474.1 | 437.0 | 8 | 1,388.9 | 1,269.1 | 9 | ||||||||||||
| Changes in non-cash working capital | (6.2 | ) | (52.5 | ) | (88 | ) | (9.3 | ) | (54.2 | ) | (83 | ) | ||||||
| Transaction costs | 1.4 | (0.4 | ) | (450 | ) | 4.3 | 2.3 | 87 | ||||||||||
| Decommissioning expenditures | 5.4 | 4.9 | 10 | 20.0 | 16.9 | 18 | ||||||||||||
| Adjusted funds flow from operations | 474.7 | 389.0 | 22 | 1,403.9 | 1,234.1 | 14 | ||||||||||||
Adjusted net earnings from operations is calculated based on net income before amortization of E&E undeveloped land, impairment or impairment recoveries, unrealized derivative gains or losses, unrealized foreign exchange gain or loss on translation of hedged US dollar long-term debt, unrealized gains or losses on long-term investments, gains or losses on the sale of long-term investments and gains or losses on capital acquisitions and dispositions. Adjusted net earnings from operations per share and adjusted net earnings from operations per share - diluted are calculated as adjusted net earnings from operations divided by the number of weighted average basic and diluted shares outstanding, respectively. Management utilizes adjusted net earnings from operations to present a measure of financial performance that is more comparable between periods. Adjusted net earnings from operations as presented is not intended to represent net earnings or other measures of financial performance calculated in accordance with IFRS.
The following table reconciles net income to adjusted net earnings from operations:
| Three months ended September 30 | Nine months ended September 30 | |||||||||||||||||
| ($ millions) | 2018 | 2017 | % Change | 2018 | 2017 | % Change | ||||||||||||
| Net income (loss) | 30.5 | (270.6 | ) | (111 | ) | (226.4 | ) | (67.6 | ) | 235 | ||||||||
| Amortization of E&E undeveloped land | 39.9 | 33.7 | 18 | 118.2 | 99.5 | 19 | ||||||||||||
| Impairment | 15.2 | 306.5 | (95 | ) | 15.2 | 306.5 | (100 | ) | ||||||||||
| Unrealized derivative (gains) losses | 29.2 | 58.0 | (50 | ) | 298.5 | (16.4 | ) | (1,920 | ) | |||||||||
| Unrealized foreign exchange (gain) loss on translation of hedged US dollar long-term debt | (62.9 | ) | (13.4 | ) | 369 | 69.8 | (147.5 | ) | (147 | ) | ||||||||
| Unrealized loss on long-term investments | 6.1 | 0.6 | 917 | 12.4 | 7.2 | 72 | ||||||||||||
| (Gain) loss on sale of long-term investments | 2.8 | — | — | (1.7 | ) | — | — | |||||||||||
| Net (gain) loss on capital dispositions | 30.2 | (10.1 | ) | (399 | ) | 100.8 | (10.1 | ) | (1,098 | ) | ||||||||
| Deferred tax relating to adjustments | (6.2 | ) | (71.0 | ) | (91 | ) | (135.9 | ) | (36.5 | ) | 272 | |||||||
| Adjusted net earnings from operations | 84.8 | 33.7 | 152 | 250.9 | 135.1 | 86 | ||||||||||||
Payout ratio is calculated on a percentage basis as dividends declared divided by adjusted funds flow from operations. Payout ratio is used by management to monitor the dividend policy and the amount of adjusted funds flow from operations retained by the Company for capital reinvestment.
Net debt is calculated as long-term debt plus accounts payable and accrued liabilities, dividends payable and long-term compensation liability, less cash, accounts receivable, prepaids and deposits and long-term investments, excluding the unrealized foreign exchange on translation of US dollar long-term debt. Management utilizes net debt as a key measure to assess the liquidity of the Company.
| CRESCENT POINT ENERGY CORP. | 28 |
The following table reconciles long-term debt to net debt:
| ($ millions) | September 30, 2018 | December 31, 2017 | % Change | ||||||
Long-term debt (1) | 4,156.2 | 4,111.0 | 1 | ||||||
| Accounts payable and accrued liabilities | 653.2 | 613.3 | 7 | ||||||
| Dividends payable | 16.8 | 16.8 | — | ||||||
Long-term compensation liability (2) | 18.1 | 22.9 | (21 | ) | |||||
| Cash | (65.5 | ) | (62.4 | ) | 5 | ||||
| Accounts receivable | (455.7 | ) | (380.2 | ) | 20 | ||||
| Prepaids and deposits | (7.0 | ) | (4.5 | ) | 56 | ||||
| Long-term investments | (20.0 | ) | (72.6 | ) | (72 | ) | |||
| Excludes: | |||||||||
| Unrealized foreign exchange on translation of US dollar long-term debt | (289.2 | ) | (219.4 | ) | 32 | ||||
| Net debt | 4,006.9 | 4,024.9 | — | ||||||
| (1) | Includes current portion of long-term debt. |
| (2) | Includes current portion of long-term compensation liability. |
Net debt to adjusted funds flow from operations is calculated as the period end net debt divided by the sum of adjusted funds flow from operations for the trailing four quarters. The ratio of net debt to adjusted funds flow from operations is used by management to measure the Company's overall debt position and to measure the strength of the Company's balance sheet. Crescent Point monitors this ratio and uses this as a key measure in making decisions regarding financing, capital spending and dividend levels.
Market capitalization is calculated by applying the period end closing share trading price to the number of shares outstanding. Market capitalization is an indication of enterprise value. Refer to the Liquidity and Capital Resources section in this MD&A for further information.
Enterprise value is calculated as market capitalization plus net debt. Management uses enterprise value to assess the valuation of the Company. Refer to the Liquidity and Capital Resources section in this MD&A for further information.
Management believes the presentation of the Non-GAAP measures above provide useful information to investors and shareholders as the measures provide increased transparency and the ability to better analyze performance against prior periods on a comparable basis.
| CRESCENT POINT ENERGY CORP. | 29 |
Forward-Looking Information
Certain statements contained in this management's discussion and analysis constitute forward-looking statements and are based on Crescent Point's beliefs and assumptions based on information available at the time the assumption was made. By its nature, such forward-looking information involves known and unknown risks, uncertainties and other factors that may cause actual results or events to differ materially from those anticipated in such forward-looking statements. The Company believes the expectations reflected in those forward-looking statements are reasonable but no assurance can be given that these expectations will prove to be correct and such forward-looking statements should not be unduly relied upon. These statements are effective only as of the date of this report. Crescent Point undertakes no obligation to update publicly or revise any forward-looking statements, whether as a result of new information, future events or otherwise, unless required to do so pursuant to applicable law.
Any “financial outlook” or “future oriented financial information” in this management’s discussion and analysis, as defined by applicable securities legislation, has been approved by management of Crescent Point. Such financial outlook or future oriented financial information is provided for the purpose of providing information about management’s current expectations and plans relating to the future. Readers are cautioned that reliance on such information may not be appropriate for other purposes.
Certain statements contained in this report, including statements related to Crescent Point's capital expenditures, projected asset growth, view and outlook toward future commodity prices, drilling activity and statements that contain words such as "could", "should", "can", "anticipate", "expect", "believe", "will", "may", “projected”, “sustain”, “continues”, “strategy”, “potential”, “projects”, “grow”, “take advantage”, “estimate”, “well positioned” and similar expressions and statements relating to matters that are not historical facts constitute "forward-looking information" within the meaning of applicable Canadian securities legislation. The material assumptions and factors in making these forward-looking statements are disclosed in this MD&A under the headings "Derivatives", “Liquidity and Capital Resources”, “Changes in Accounting Policies” and “Outlook”.
In particular, forward-looking statements include:
This information contains certain forward-looking estimates that involve substantial known and unknown risks and uncertainties, certain of which are beyond Crescent Point's control. Such risks and uncertainties include, but are not limited to: financial risk of marketing reserves at an acceptable price given market conditions; volatility in market prices for oil and natural gas; delays in business operations, pipeline restrictions, blowouts; the risk of carrying out operations with minimal environmental impact; industry conditions including changes in laws and regulations including the adoption of new environmental laws and regulations and changes in how they are interpreted and enforced; uncertainties associated with estimating oil and natural gas reserves; risks and uncertainties related to oil and gas interests and operations on tribal lands; economic risk of finding and producing reserves at a reasonable cost; uncertainties associated with partner plans and approvals; operational matters related to non-operated properties; increased competition for, among other things, capital, acquisitions of reserves and undeveloped lands; competition for and availability of qualified personnel or management; incorrect assessments of the value of acquisitions and dispositions, and exploration and development programs; unexpected geological, technical, drilling, construction, processing and transportation problems; availability of insurance; fluctuations in foreign exchange and interest rates; stock market volatility; general economic, market and business conditions; uncertainties associated with regulatory approvals; uncertainty of government policy changes; uncertainties associated with credit facilities and counterparty credit risk; changes in income tax laws, tax laws, crown royalty rates and incentive programs relating to the oil and gas industry; and other factors, many of which are outside the control of the Company. Therefore, Crescent Point's actual results, performance or achievement could differ materially from those expressed in, or implied by, these forward-looking estimates and if such actual results, performance or achievements transpire or occur, or if any of them do so, there can be no certainty as to what benefits or detriments Crescent Point will derive therefrom.
l Crescent Point's objective to manage net debt to adjusted funds flow from operations to be well positioned to maximize shareholder return; l Crescent Point's approach to proactively manage the risk exposure inherent in movements in the price of crude oil, natural gas and power, fluctuations in the US/Cdn dollar exchange rate and interest rates movements through the use of derivatives with investment-grade counterparties; l Crescent Point's use of financial commodity derivatives to reduce the volatility of the selling price of its crude oil and natural gas production and how this provides a measure of stability to cash flow and the ability to fund dividends; | l Crescent Point’s 2018 average production and capital expenditure guidance; l The Company's expectation that its realized pricing will be stronger than Canadian index prices because the majority of its production is located downstream of recent apportionment points or in the U.S.; l Management's belief that the Company is well positioned to execute its business strategy; l How the Company expects to finance its working capital deficiency and ongoing working capital requirements; and l Expected adoption of new accounting policies. |
Barrels of oil equivalent (“boe”) may be misleading, particularly if used in isolation. A boe conversion ratio of 6 Mcf : 1 Bbl is based on an energy equivalency conversion method primarily applicable at the burner tip and does not represent a value equivalency at the wellhead. Given that the value ratio based on the current price of crude oil as compared to natural gas is significantly different from the energy equivalency of oil, utilizing a conversion on a 6:1 basis may be misleading as an indication of value.
Crude oil and natural gas information is provided in accordance with the United States Financial Accounting Standards Board (FASB) Topic 932 - "Extractive Activities - Oil and Gas" and where applicable, financial information is prepared in accordance with International Financial Reporting Standards (IFRS).
| CRESCENT POINT ENERGY CORP. | 30 |
For the years ended December 31, 2017, 2016, 2015, and 2014 the Company filed its reserves information under National Instrument 51-101 - "Standards of Disclosure of Oil and Gas Activities" (NI 51-101), which prescribes the standards for the preparation and disclosure of reserves and related information for companies listed in Canada.
There are significant differences to the type of volumes disclosed and the basis from which the volumes are economically determined under the United States Securities and Exchange Commission (“SEC”) requirements and NI 51-101. The SEC requires disclosure of net reserves, after royalties, using trailing 12-month average prices and current costs; whereas NI 51-101 requires Company gross reserves, before royalties, using forecast pricing and costs. Therefore the difference between the reported numbers under the two disclosure standards can be material.
| CRESCENT POINT ENERGY CORP. | 31 |
Directors Robert Heinemann, Chairman Rene Amirault (4) Peter Bannister (3) (4) Laura Cillis (1) (2) Ted Goldthorpe (1) (5) Mike Jackson (1) (2) (5) Francois Langlois (3) (4) (5) Barbara Munroe (2) (5) Gerald Romanzin (1) (3) Craig Bryksa (4) (1) Member of the Audit Committee of the Board of Directors (2) Member of the Human Resources and Compensation Committee of the Board of Directors (3) Member of the Reserves Committee of the Board of Directors (4) Member of the Environmental, Health & Safety Committee of the Board of Directors (5) Member of the Corporate Governance and Nominating Committee Officers Craig Bryksa President and Chief Executive Officer Ken Lamont Chief Financial Officer Ryan Gritzfeldt Chief Operating Officer Brad Borggard Senior Vice President, Corporate Planning and Capital Markets Derek Christie Senior Vice President, Exploration Mark Eade Senior Vice President, General Counsel and Corporate Secretary Scott Tuttle Senior Vice President, Human Resources and Corporate Services Steven Toews Vice President, Engineering and Operations Head Office Suite 2000, 585 - 8th Avenue S.W. Calgary, Alberta T2P 1G1 Tel: (403) 693-0020 Fax: (403) 693-0070 Toll Free: (888) 693-0020 Banker The Bank of Nova Scotia Calgary, Alberta | Auditor PricewaterhouseCoopers LLP Calgary, Alberta Legal Counsel Norton Rose Fulbright Canada LLP Calgary, Alberta Evaluation Engineers GLJ Petroleum Consultants Ltd. Calgary, Alberta Sproule Associates Ltd. Calgary, Alberta Registrar and Transfer Agent Investors are encouraged to contact Crescent Point's Registrar and Transfer Agent for information regarding their security holdings: Computershare Trust Company of Canada 600, 530 - 8th Avenue S.W. Calgary, Alberta T2P 3S8 Tel: (403) 267-6800 Stock Exchanges Toronto Stock Exchange - TSX New York Stock Exchange - NYSE Stock Symbol CPG Investor Contacts Brad Borggard Senior Vice President, Corporate Planning and Capital Markets (403) 693-0020 Shant Madian Vice President, Investor Relations and Corporate Communications (403) 693-0020 | |
| CRESCENT POINT ENERGY CORP. | 32 |