UNITED STATES
SECURITIES AND EXCHANGE COMMISSION
Washington, D.C. 20549
FORM N-CSR
CERTIFIED SHAREHOLDER REPORT OF REGISTERED
MANAGEMENT INVESTMENT COMPANIES
Investment Company Act file number 811-22743
Blackstone Alternative Investment Funds
(Exact Name of Registrant as Specified in Charter)
345 Park Avenue
28th Floor
New York, NY 10154
(Address of Principal Executive Offices)
Registrant’s telephone number, including area code: (212) 583-5000
Peter Koffler, Esq.
c/o Blackstone Alternative Investment Advisors LLC
345 Park Avenue
28th Floor
New York, NY 10154
(Name and Address of Agent for Service)
With a copy to:
James E. Thomas, Esq.
Ropes & Gray LLP
Prudential Tower
800 Boylston Street
Boston, MA 02199-3600
Date of fiscal year end: March 31
Date of reporting period: March 31, 2015
| Item 1. | Reports to Stockholders. |
The Report to Shareholders is attached hereto.
Blackstone
|
Blackstone Alternative Multi-Manager Fund
Blackstone Alternative Multi-Strategy Fund
Series of Blackstone Alternative Investment Funds
Annual Report For the Period Ended March 31, 2015
|
TABLE OF CONTENTS
| 1 | |||||
| 4 | |||||
| 5 | |||||
| 13 | |||||
| 219 | |||||
| 221 | |||||
| 222 | |||||
| 225 | |||||
| 229 | |||||
| 233 | |||||
| 266 | |||||
| 267 | |||||
| 270 |
Important Risks: An investment in a Fund should be considered a speculative investment that entails substantial risks; you may lose part or all of your investment or your investment may not perform as well as other investments. A Fund’s investments involve special risks including, but not limited to, loss of all or a significant portion of the investment due to leveraging, short-selling, or other speculative practices, lack of liquidity and volatility of returns. The following is a summary description of certain additional principal risks of investing in a Fund.
Allocation Risk - Blackstone’s judgment about the attractiveness, value or market trends affecting a particular asset class, investment style, sub-adviser or security may be incorrect and this may have a negative impact upon performance. Derivatives Risk - the use of derivatives involves the risk that their value may not move as expected relative to the value of the relevant underlying assets, rates, or indices. Derivatives can be subject to counterparty credit risk and may entail investment exposure greater than their notional amount. Distressed Securities Risk - investments in securities of business enterprises involved in workouts, liquidations, reorganizations, bankruptcies and similar situations involve a high degree of risk of loss since there is typically substantial uncertainty concerning the outcome of such situations. Event-Driven Trading Risk -involves the risk that the specific event identified may not occur as anticipated and that this may have a negative impact upon the market price or the securities involved. Foreign Investments/Emerging Markets Risk - involves special risks caused by foreign political, social and economic factors, including exposure to currency fluctuations, less liquidity, less developed and less efficient trading markets, political instability and less developed legal and auditing standards. High Portfolio Turnover Risk - active trading of securities can increase transaction costs (thus lowering performance) and taxable distributions. Model and Technology Risk - involves the risk that model-based strategies, data gathering systems, order execution and trade allocation systems and risk management systems may not be successful on an ongoing basis or could contains errors, omissions, imperfections or malfunctions. Multi-Manager Risk - managers may make investment decisions which conflict with each other and as a result, the Fund could incur transaction costs without accomplishing any net investment result.
BLACKSTONE ALTERNATIVE INVESTMENT FUNDS
Dear Blackstone Investor,
We are pleased to present this annual shareholder report for Blackstone Alternative Investment Funds (“BAIF”), which includes Blackstone Alternative Multi-Manager Fund (“Multi-Manager Fund”) and Blackstone Alternative Multi-Strategy Fund (“Multi-Strategy Fund”) (each individually referred to as a “Fund,” and collectively, the “Funds”). This report includes portfolio commentary, a listing of each Fund’s investments and each Fund’s audited financial statements. Audited financial statements for Multi-Manager Fund cover the period from April 1, 2014 to March 31, 2015 (“Multi-Manager Fund Reporting Period”), while the audited financial statements for Multi-Strategy Fund cover the period from June 16, 2014, the inception date of the Fund, to March 31, 2015 (“Multi-Strategy Fund Reporting Period”, and together with the Multi-Manager Fund Reporting Period, the “Reporting Period”).
Each Fund’s investment objective is to seek capital appreciation. Each Fund seeks this objective by allocating its assets among a variety of nontraditional, or “alternative,” investment strategies. Blackstone Alternative Investment Advisors LLC (the “Investment Adviser”) determines the allocations of a Fund’s assets and allocates a majority of a Fund’s assets among investment sub-advisers with experience managing alternative investment strategies and among investment funds. Each sub-adviser is responsible for the day-to-day management of a Fund’s assets that the Investment Adviser allocates to it. Subject to oversight by the Board of Trustees, the Investment Adviser is responsible for making recommendations with respect to hiring, terminating and/or replacing the Funds’ investment sub-advisers, and it may also manage a portion of the Funds’ assets directly.
Multi-Manager Fund Performance1
During the Multi-Manager Fund Reporting Period, Multi-Manager Fund generated a cumulative return, net of fees and expenses, of 5.24%2 and realized an annualized volatility3 of 4.11% with a Sharpe ratio4 of 1.27. Over the same period, the HFRX Absolute Return Index, a measure of hedge fund performance, returned 1.15%; the MSCI World Total Return Index, a measure of global equity market performance, returned 6.60%; and the Barclays Aggregate Bond Index, a measure of U.S. investment grade bond performance, returned 5.72%.
| 1 | The volatility of the indices presented may be materially different from that of the performance of the Multi-Manager Fund and the Multi-Strategy Fund. In addition, the indices employ different investment guidelines and criteria than the Funds; as a result, the holdings in the Funds may differ significantly from the securities that comprise the indices. The performance of the indices has not been selected to represent an appropriate benchmark to compare to the performance of the Funds, but rather is disclosed to allow for comparison of the Funds’ performance to that of well-known and widely recognized indices. A summary of the investment guidelines for the indices presented are available upon request. In the case of equity indices, performance of the indices reflects the reinvestment of dividends. |
| 2 | Past performance is not indicative of future results and there is no assurance that the Fund will achieve its objectives or avoid significant losses. Returns are shown net of fees and expenses. |
| 3 | “Volatility” refers to the standard deviation of returns. Standard deviation is a measure of how spread out a set of data is from its mean. The more spread apart the data, the higher the standard deviation. Standard deviation is calculated by taking the square root of the “variance” (the average of the squared difference between each number and the mean of the data set). |
| 4 | “Sharpe ratio” is a ratio to measure risk-adjusted performance that is calculated by subtracting the risk-free rate (such as the 10-year U.S. Treasury bond) from the rate of return for the a portfolio and dividing the result by the Standard Deviation (defined below) of the portfolio returns. The greater a portfolio’s Sharpe ratio, the better its risk-adjusted performance has been. |
1
Multi-Strategy Fund Performance1
During the Multi-Strategy Fund Reporting Period, Multi-Strategy Fund generated a cumulative return, net of fees and expenses, of 4.43%2 and realized an annualized volatility3 of 3.72% with a Sharpe ratio4 of 1.50. Over the same period, the HFRX Absolute Return Index returned 0.91%; the MSCI World Total Return Index returned 2.48%; and the Barclays Aggregate Bond Index returned 4.14%.
We are pleased with each Fund’s performance results thus far and remain focused on pursuing the Funds’ investment objective. As the world’s largest discretionary allocator to hedge funds5, with a 25 year track record in hedge fund investing, we will continue to leverage our due diligence, risk management, and investment expertise in identifying alternative investment strategies and investment sub-advisers for the Funds.
Portfolio Commentary
The fiscal year ended March 31, 2015 is one that saw continued sentiment changes and market gyrations in reaction to mixed global economic data, geopolitical events, and out of sync monetary policy announcements from the European Central Bank (“ECB”) and Federal Reserve (“Fed”). The Eurozone was a key driver of market action as the ECB’s efforts to counter the threat of deflation and to boost the economy led investors to anticipate looser monetary policy. Conversely, as the Fed became increasingly comfortable with signs of an improving U.S. economy and labor market, investors prepared for a steady course of tightening with rate hikes widely believed to start in late 2015/early 2016. A surge in the U.S. dollar (“USD”), arguably driven by the Fed’s response to the strengthening U.S. macroeconomic backdrop, also played a large role in global markets. An additional theme this year was the dislocation in energy markets caused by the plunge in crude oil prices by more than half.
During the Reporting Period, the Funds’ equity strategies were the largest contributor to performance, which was attributable to top-down allocation decisions as well as to bottom-up fundamental security selection. From a top-down perspective, although the U.S. equity market lacked a clear market trend, there were certainly pockets of opportunity as certain sectors significantly outperformed the broader market and offered investors greater opportunity for performance dispersion-based alpha. Thus, it was important where each Fund invested, and being overweight in particular sectors like healthcare and technology contributed to performance. Additionally, the current low interest rate environment is one that is conducive to M&A activity, and sub-advisers with expertise in anticipating transactions were able to capitalize on high levels of corporate activity. The Funds also benefited from successful bottom-up security selection by the sub-advisers. Equity long/short sub-advisers typically seek to maintain a hedged exposure profile that allows stock picking to be the primary driver of alpha6 on both the long and short sides of the portfolio. Two bottom-up investment themes that emerged over the course of the Reporting Period related to identifying companies that would thrive or suffer from the relative strength in the USD and to weakness in oil prices. For example, the strengthening USD negatively impacts multinational corporations, whose goods become more expensive in local currencies, disproportionately more than corporations that derive the majority of revenues domestically in the U.S. Along the same lines, sub-advisers sought to capitalize on the significant dislocation in oil prices by identifying companies that would benefit or suffer from lower oil prices. While one always hopes to be on the positive side of these trades, certainly there were instances where these themes detracted from performance, including when these themes resulted in heightened volatility. During the Reporting Period, two generalist equity sub-advisers were added to the portfolios.
| 5 | This statement refers to the Hedge Fund Solutions business of The Blackstone Group L.P., which includes the Funds’ investment adviser. Source: InvestHedge Billion Dollar Club. Data as of December 31, 2014. |
| 6 | “Alpha” is a measure of risk-adjusted performance which captures risk attributable to the specific security or portfolio rather than the overall market. A high alpha value implies that the investment has performed better than would have been expected relative to the overall market (beta). It is often called the “excess return” on an investment above a benchmark index or “risk free” rate of return. |
2
The Funds’ credit strategies generally fared well over the past twelve months. While strategies in mortgage-backed securities and asset-backed securities were mixed overall, residential mortgage-backed securities continued to benefit from the U.S. economic recovery, which was a function of falling unemployment in the U.S. and continued housing price appreciation. As a result, these exposures appreciated during the Reporting Period and produced interest income. The key detractor within each Fund’s credit strategies was related to certain exposures in the energy sector and to debt from certain emerging markets countries that have a high reliance on oil and energy. Choppy markets such as those in October 2014 and December 2014 can also be difficult to navigate for trading-oriented sub-advisers that have shorter-term views and tighter risk limits. During the Reporting Period, two credit sub-advisers were added to the portfolios—one that specializes in liquid U.S. commercial real estate securities and one that focuses on non-mortgage related asset-backed securities.
We allocate a portion of each Fund’s assets to multi-asset/quantitative strategies because their expected lower correlations to equity and credit markets may offer diversification benefits to the Fund’s portfolio. During the Reporting Period, the Funds’ multi-asset/quantitative strategies collectively contributed positively to performance. Quantitative strategies posted gains across a variety of models and asset classes. In addition to positive performance, the quantitative strategies delivered diversification benefits during the period as evidenced by their low beta7 to traditional asset classes. On the other hand, certain global macro and emerging markets strategies detracted from performance. The key themes that impacted the macroeconomic landscape were the steep decline in oil prices, the strength of the USD and the flow of funds given the end of quantitative easing and the impending rate hikes by the Fed. Each of these themes was a headwind for exposures in emerging markets countries, particularly those that have high reliance on oil as a key export, and for exposures to emerging market debt instruments that are denominated in the local currency. During the Reporting Period, a sub-adviser with a focus on emerging markets credit, rates and currencies was added to the portfolio.
As mentioned above, five sub-advisers were hired for the Funds during the Reporting Period. These additions, together with the allocation decisions that occurred during the Reporting Period, reflect a deliberate, systematic approach to strategy selection that seeks to be able to react to and capture the changing opportunity set. This investment process requires forming a point of view on world economies, market fundamentals, investment techniques and strategies, and then refining that view to satisfy the Funds’ investment goals and restrictions. After framing our top-down views, an assessment is made of the relative attractiveness of certain investment strategies to the current and anticipated market environment. Having selected the strategies to which we want to allocate, we then allocate the Funds’ assets to sub-advisers with expertise in those strategies based upon our belief as to which sub-advisers are best able to profit in the current and anticipated environment.
Looking forward to the remainder of 2015, if the U.S. continues to slowly recover, we believe that distortions from central bank activity may recede over the next few quarters and interest rates will begin to normalize, shifting focus from macroeconomic policy to microeconomic fundamentals. This environment could produce relatively high levels of dispersion among stocks, which may enable alpha generation for sub-advisers who are focused on security selection. Outside of the U.S., we are exploring cross-geography and cross-asset class opportunistic themes given diverging stages of economic recovery and, thus, very different central bank policy responses. However, despite a healthy pipeline of opportunities, we remain cautious given current valuations and potential risks that could disrupt markets, and will position the portfolio with a focus on capital preservation.
Thank you for your continued confidence in us. We look forward to continuing to service your investment needs in the years to come.
Sincerely,
Stephen Sullens
Alberto Santulin
Rich Scarinci
| 7 | “Beta” is a measure of the sensitivity of a fund’s return to the return of an index. If the beta = 1, then the return will move with that of the index. If the beta is > 1, the return is more volatile than the index whereas if the beta is < 1, the return is less volatile than the index. |
3
Performance quoted represents past performance, which may be higher or lower than current performance. Past performance is not indicative of future results. Investment returns and principal value of an investment will fluctuate so that an investor’s shares, when redeemed, may be worth more or less than their original cost. The returns shown do not reflect taxes that an investor would pay on fund distributions or on the sale of fund shares. To obtain the most recent month-end performance, visit www.blackstone.com/blackstone-alternative-investment-funds.
Value of a $10,000 Investment Since the Beginning of the Fiscal Year at Net Asset Value*
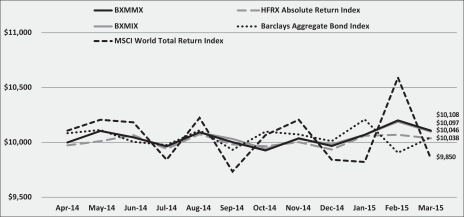
| * | The line graph represents historical performance of a hypothetical investment of $10,000 from April 1, 2014 to March 31, 2015, assuming the reinvestment of distributions. |
Cumulative Total Return
| For the Year Ended March 31, 2015 | |||||
Multi-Manager Fund—Class I Shares (“BXMMX”) | 5.24% | ||||
Multi-Strategy Fund—Class I Shares (“BXMIX”) | 4.43% | * | |||
HFRX Absolute Return Index | 1.15% | ||||
MSCI World Total Return Index | 6.60% | ||||
Barclays Aggregate Bond Index | | 5.72% | | ||
| * | Cumulative total return from June 16, 2014, commencement of operations, to March 31, 2015. |
4
Blackstone Alternative Multi-Manager Fund and Subsidiaries
March 31, 2015 (Unaudited)
Geographic Breakdown | Percentage of Total Net Assets | ||||
United States | 67.7 | % | |||
Cayman Islands | 6.1 | ||||
Japan | 2.2 | ||||
United Kingdom | 1.8 | ||||
Germany | 1.3 | ||||
Israel | 0.8 | ||||
Netherlands | 0.8 | ||||
Switzerland | 0.8 | ||||
Canada | 0.7 | ||||
Brazil | 0.6 | ||||
France | 0.6 | ||||
China | 0.5 | ||||
Italy | 0.5 | ||||
Venezuela | 0.4 | ||||
Ireland | 0.3 | ||||
Spain | 0.3 | ||||
Poland | 0.2 | ||||
Belgium | 0.1 | ||||
Bermuda | 0.1 | ||||
Ecuador | 0.1 | ||||
Greece | 0.1 | ||||
Hong Kong | 0.1 | ||||
Luxembourg | 0.1 | ||||
Mexico | 0.1 | ||||
Sweden | 0.1 | ||||
Argentina | 0.0 | 1 | |||
Bahamas | 0.0 | 1 | |||
Chile | 0.0 | 1 | |||
Czech Republic | 0.0 | 1 | |||
Denmark | 0.0 | 1 | |||
India | 0.0 | 1 | |||
Nigeria | 0.0 | 1 | |||
Norway | 0.0 | 1 | |||
Puerto Rico | 0.0 | 1 | |||
Republic of Korea | 0.0 | 1 | |||
Russian Federation | 0.0 | 1 | |||
Singapore | 0.0 | 1 | |||
South Africa | 0.0 | 1 | |||
Taiwan | 0.0 | 1 | |||
Thailand | 0.0 | 1 | |||
Other2 | 3.8 | ||||
Securities Sold Short | (21.7 | ) | |||
Other Assets and Liabilities3 | 31.5 | ||||
|
| ||||
Total | 100.0 | % | |||
|
| ||||
| 1 | Represents less than 0.1%. |
| 2 | Includes Sovereign Debt, Exchange-Traded Funds and Purchased Options. |
| 3 | Assets, other than investments in securities, net of other liabilities. See Consolidated Statement of Assets and Liabilities. A significant portion of the balance represents cash collateral for derivatives. |
See Notes to Consolidated Financial Statements.
5
Blackstone Alternative Multi-Manager Fund and Subsidiaries
Portfolio Information (Continued)
March 31, 2015 (Unaudited)
Portfolio Composition | Percentage of Total Net Assets | ||||
Common Stock | 44.0 | % | |||
Mortgage-Backed Securities | 24.3 | ||||
Asset-Backed Securities | 7.3 | ||||
Corporate Bonds & Notes | 6.6 | ||||
Sovereign Debt | 3.1 | ||||
U.S. Government Sponsored Agency Securities | 2.1 | ||||
Bank Loans | 1.4 | ||||
Convertible Bonds | 0.7 | ||||
Exchange-Traded Funds | 0.2 | ||||
Preferred Stock | 0.0 | 1 | |||
Rights | 0.0 | 1 | |||
Other2 | 0.5 | ||||
Securities Sold Short | (21.7 | ) | |||
Other Assets and Liabilities3 | 31.5 | ||||
|
| ||||
Total | 100.0 | % | |||
|
| ||||
| 1 | Represents less than 0.1%. |
| 2 | Includes Purchased Options. |
| 3 | Assets, other than investments in securities, net of other liabilities. See Consolidated Statement of Assets and Liabilities. A significant portion of the balance represents cash collateral for derivatives. |
Credit Quality Allocation4 | Percentage of Total Investments in Securities | ||||
AAA/Aaa5 | 2.7 | % | |||
AA/Aa | 0.4 | ||||
A | 1.6 | ||||
BBB/Baa | 6.4 | ||||
BB/Ba | 6.4 | ||||
B | 8.4 | ||||
CCC/Caa | 7.4 | ||||
CC/Ca | 0.3 | ||||
C | 0.1 | ||||
D | 0.5 | ||||
Not Rated | 16.2 | ||||
Other6 | 49.6 | ||||
|
| ||||
Total Investments in Securities | 100.0 | % | |||
|
| ||||
| 4 | Using the higher of Standard & Poor’s or Moody’s Investor Service ratings. |
| 5 | Includes U.S. Government Sponsored Agency Securities which are deemed AAA/Aaa by the Investment Adviser. |
| 6 | Includes Common Stock, Preferred Stock, Exchange-Traded Funds and Purchased Options. |
Industry | Percentage of Total Net Assets | ||||
Biotechnology & Pharmaceuticals | 7.0 | % | |||
Media | 4.4 | ||||
Banking | 4.3 | ||||
Health Care Facilities/Services | 2.8 | ||||
Insurance | 2.7 | ||||
Real Estate | 2.6 | ||||
Oil, Gas & Coal | 2.5 | ||||
Medical Equipment/Devices | 2.3 | ||||
Financial Services | 2.1 | ||||
Asset Management | 1.9 | ||||
Hardware | 1.3 | ||||
Electrical Equipment | 1.2 | ||||
Retail Discretionary | 1.0 | ||||
Gaming, Lodging & Restaurants | 0.9 | ||||
Retail—Consumer Staples | 0.9 | ||||
Containers & Packaging | 0.8 | ||||
Specialty Finance | 0.8 | ||||
See Notes to Consolidated Financial Statements.
6
Blackstone Alternative Multi-Manager Fund and Subsidiaries
Portfolio Information (Continued)
March 31, 2015 (Unaudited)
Industry | Percentage of Total Net Assets | ||||
Banks | 0.7 | ||||
Integrated Oils | 0.7 | ||||
Publishing & Broadcasting | 0.7 | ||||
Semiconductors | 0.7 | ||||
Software | 0.7 | ||||
Wireless Telecommunication Services | 0.7 | ||||
Automotive | 0.6 | ||||
Retail—Consumer Discretionary | 0.6 | ||||
Aerospace & Defense | 0.5 | ||||
Consumer Products | 0.5 | ||||
Engineering & Construction Services | 0.5 | ||||
Institutional Financial Service | 0.4 | ||||
Machinery | 0.4 | ||||
Casinos & Gaming | 0.3 | ||||
Chemicals | 0.3 | ||||
Distributors—Consumer Staples | 0.3 | ||||
Exploration & Production | 0.3 | ||||
Industrial Services | 0.3 | ||||
Renewable Energy | 0.3 | ||||
Technology Services | 0.3 | ||||
Transportation & Logistics | 0.3 | ||||
Auto Parts Manufacturing | 0.2 | ||||
Automobiles Manufacturing | 0.2 | ||||
Commercial Services | 0.2 | ||||
Construction Materials | 0.2 | ||||
Food & Beverage | 0.2 | ||||
Metals & Mining | 0.2 | ||||
Property & Casualty | 0.2 | ||||
Advertising & Marketing | 0.1 | ||||
Apparel & Textile Products | 0.1 | ||||
Cable & Satellite | 0.1 | ||||
Communications Equipment | 0.1 | ||||
Consumer Finance | 0.1 | ||||
Consumer Services | 0.1 | ||||
Design Manufacturing & Distribution | 0.1 | ||||
Entertainment Resources | 0.1 | ||||
Home Improvement | 0.1 | ||||
Industrial Other | 0.1 | ||||
Passenger Transportation | 0.1 | ||||
Refining & Marketing | 0.1 | ||||
Software & Services | 0.1 | ||||
Supermarkets | 0.1 | ||||
Telecommunications | 0.1 | ||||
Transportation Equipment | 0.1 | ||||
Utilities | 0.1 | ||||
Airlines | 0.0 | 1 | |||
See Notes to Consolidated Financial Statements.
7
Blackstone Alternative Multi-Manager Fund and Subsidiaries
Portfolio Information (Continued)
March 31, 2015 (Unaudited)
Industry | Percentage of Total Net Assets | ||||
Construction Materials Manufacturing | 0.0 | 1 | |||
Distributors—Discretionary | 0.0 | 1 | |||
Forest & Paper Products | 0.0 | 1 | |||
Home & Office Products | 0.0 | 1 | |||
Internet Media | 0.0 | 1 | |||
Iron & Steel | 0.0 | 1 | |||
Leisure Products | 0.0 | 1 | |||
Machinery Manufacturing | 0.0 | 1 | |||
Manufactured Goods | 0.0 | 1 | |||
Mass Merchants | 0.0 | 1 | |||
Oil & Gas Services | 0.0 | 1 | |||
Pharmaceuticals | 0.0 | 1 | |||
Pipeline | 0.0 | 1 | |||
Railroad | 0.0 | 1 | |||
Recreation Facilities & Services | 0.0 | 1 | |||
Travel Lodging & Dining | 0.0 | 1 | |||
Waste & Environmental Service Equipment & Facility | 0.0 | 1 | |||
Other2 | 37.5 | ||||
Securities Sold Short | (21.7 | ) | |||
Other Assets and Liabilities3 | 31.5 | ||||
|
| ||||
Total Investments | 100.0 | % | |||
|
| ||||
| 1 | Represents less than 0.1%. |
| 2 | Includes Asset-Backed Securities, Sovereign Debt, Mortgage-Backed Securities, U.S. Government Sponsored Agency Securities, Exchange-Traded Funds and Purchased Options. |
| 3 | Assets, other than investments in securities, net of other liabilities. See Consolidated Statement of Assets and Liabilities. A significant portion of the balance represents cash collateral for derivatives. |
See Notes to Consolidated Financial Statements.
8
Blackstone Alternative Multi-Strategy Fund and Subsidiaries
Portfolio Information
March 31, 2015 (Unaudited)
Geographic Breakdown | Percentage of Total Net Assets | ||||
United States | 56.6 | % | |||
Cayman Islands | 6.1 | ||||
Japan | 2.2 | ||||
United Kingdom | 1.5 | ||||
Switzerland | 0.9 | ||||
Germany | 0.8 | ||||
Israel | 0.8 | ||||
Netherlands | 0.6 | ||||
Canada | 0.5 | ||||
China | 0.5 | ||||
France | 0.5 | ||||
Brazil | 0.4 | ||||
Italy | 0.4 | ||||
Ireland | 0.3 | ||||
Venezuela | 0.3 | ||||
Belgium | 0.1 | ||||
Bermuda | 0.1 | ||||
Ecuador | 0.1 | ||||
Greece | 0.1 | ||||
Hong Kong | 0.1 | ||||
Luxembourg | 0.1 | ||||
Poland | 0.1 | ||||
Puerto Rico | 0.1 | ||||
Spain | 0.1 | ||||
Argentina | 0.0 | 1 | |||
Chile | 0.0 | 1 | |||
Czech Republic | 0.0 | 1 | |||
Denmark | 0.0 | 1 | |||
India | 0.0 | 1 | |||
Mexico | 0.0 | 1 | |||
Nigeria | 0.0 | 1 | |||
Norway | 0.0 | 1 | |||
Republic of Korea | 0.0 | 1 | |||
Russian Federation | 0.0 | 1 | |||
Singapore | 0.0 | 1 | |||
South Africa | 0.0 | 1 | |||
Sweden | 0.0 | 1 | |||
Taiwan | 0.0 | 1 | |||
Thailand | 0.0 | 1 | |||
Other2 | 2.8 | ||||
Securities Sold Short | (21.7 | ) | |||
Other Assets and Liabilities3 | 45.6 | ||||
|
| ||||
Total | 100.0 | % | |||
|
| ||||
| 1 | Represents less than 0.1%. |
| 2 | Includes Sovereign Debt, Exchange-Traded Funds and Purchased Options. |
| 3 | Assets, other than investments in securities, net of other liabilities. See Consolidated Statement of Assets and Liabilities. A significant portion of the balance represents cash collateral for derivatives. |
See Notes to Consolidated Financial Statements.
9
Blackstone Alternative Multi-Strategy Fund and Subsidiaries
Portfolio Information (Continued)
March 31, 2015 (Unaudited)
Portfolio Composition | Percentage of Total Net Assets | ||||
Common Stock | 42.9 | % | |||
Mortgage-Backed Securities | 17.7 | ||||
Asset-Backed Securities | 7.6 | ||||
Corporate Bonds & Notes | 3.8 | ||||
Sovereign Debt | 2.3 | ||||
U.S. Government Sponsored Agency Securities | 1.0 | ||||
Convertible Bonds | 0.2 | ||||
Bank Loans | 0.1 | ||||
Exchange-Traded Funds | 0.1 | ||||
Investment in Investee Fund | 0.0 | 1 | |||
Preferred Stock | 0.0 | 1 | |||
Rights | 0.0 | 1 | |||
Other2 | 0.4 | ||||
Securities Sold Short | (21.7 | ) | |||
Other Assets and Liabilities3 | 45.6 | ||||
|
| ||||
Total | 100.0 | % | |||
|
| ||||
| 1 | Represents less than 0.1%. |
| 2 | Includes Purchased Options. |
| 3 | Assets, other than investments in securities, net of other liabilities. See Consolidated Statement of Assets and Liabilities. A significant portion of the balance represents cash collateral for derivatives. |
Credit Quality Allocation4 | Percentage of Total Investments in Securities | ||||
AAA/Aaa5 | 1.5 | % | |||
AA/Aa | 0.3 | ||||
A | 0.7 | ||||
BBB/Baa | 8.5 | ||||
BB/Ba | 5.5 | ||||
B | 6.9 | ||||
CCC/Caa | 6.2 | ||||
CC/Ca | 0.9 | ||||
C | — | ||||
D | 1.4 | ||||
Not Rated | 11.0 | ||||
Other6 | 57.1 | ||||
|
| ||||
Total Investments in Securities | 100.0 | % | |||
|
| ||||
| 4 | Using the higher of Standard & Poor’s or Moody’s Investor Service ratings. |
| 5 | Includes U.S. Government Sponsored Agency Securities which are deemed AAA/Aaa by the Investment Adviser. |
| 6 | Includes Common Stock, Preferred Stock, Exchange-Traded Funds and Purchased Options. |
Industry | Percentage of Total Net Assets | ||||
Biotechnology & Pharmaceuticals | 6.9 | % | |||
Banking | 4.3 | ||||
Media | 4.0 | ||||
Health Care Facilities/Services | 2.7 | ||||
Real Estate | 2.7 | ||||
Insurance | 2.4 | ||||
Oil, Gas & Coal | 2.4 | ||||
Medical Equipment/Devices | 2.2 | ||||
Asset Management | 1.9 | ||||
Electrical Equipment | 1.3 | ||||
Hardware | 1.1 | ||||
Gaming, Lodging & Restaurants | 1.0 | ||||
Retail Discretionary | 1.0 | ||||
Retail—Consumer Staples | 0.9 | ||||
Software | 0.7 | ||||
Specialty Finance | 0.7 | ||||
Automotive | 0.6 | ||||
See Notes to Consolidated Financial Statements.
10
Blackstone Alternative Multi-Strategy Fund and Subsidiaries
Portfolio Information (Continued)
March 31, 2015 (Unaudited)
Industry | Percentage of Total Net Assets | ||||
Consumer Products | 0.6 | ||||
Containers & Packaging | 0.6 | ||||
Semiconductors | 0.6 | ||||
Aerospace & Defense | 0.5 | ||||
Integrated Oils | 0.5 | ||||
Machinery | 0.5 | ||||
Publishing & Broadcasting | 0.5 | ||||
Engineering & Construction Services | 0.4 | ||||
Wireless Telecommunication Services | 0.4 | ||||
Banks | 0.3 | ||||
Chemicals | 0.3 | ||||
Distributors—Consumer Staples | 0.3 | ||||
Institutional Financial Service | 0.3 | ||||
Retail—Consumer Discretionary | 0.3 | ||||
Technology Services | 0.3 | ||||
Transportation & Logistics | 0.3 | ||||
Apparel & Textile Products | 0.2 | ||||
Casinos & Gaming | 0.2 | ||||
Commercial Services | 0.2 | ||||
Construction Materials | 0.2 | ||||
Exploration & Production | 0.2 | ||||
Industrial Services | 0.2 | ||||
Property & Casualty | 0.2 | ||||
Renewable Energy | 0.2 | ||||
Telecommunications | 0.2 | ||||
Utilities | 0.2 | ||||
Advertising & Marketing | 0.1 | ||||
Auto Parts Manufacturing | 0.1 | ||||
Cable & Satellite | 0.1 | ||||
Communications Equipment | 0.1 | ||||
Consumer Finance | 0.1 | ||||
Consumer Services | 0.1 | ||||
Design Manufacturing & Distribution | 0.1 | ||||
Entertainment Resources | 0.1 | ||||
Financial Services | 0.1 | ||||
Manufactured Goods | 0.1 | ||||
Metals & Mining | 0.1 | ||||
Passenger Transportation | 0.1 | ||||
Refining & Marketing | 0.1 | ||||
Software & Services | 0.1 | ||||
Supermarkets | 0.1 | ||||
Transportation Equipment | 0.1 | ||||
Airlines | 0.0 | 1 | |||
Automobiles Manufacturing | 0.0 | 1 | |||
Construction Materials Manufacturing | 0.0 | 1 | |||
Distributors—Discretionary | 0.0 | 1 | |||
See Notes to Consolidated Financial Statements.
11
Blackstone Alternative Multi-Strategy Fund and Subsidiaries
Portfolio Information (Continued)
March 31, 2015 (Unaudited)
Industry | Percentage of Total Net Assets | ||||
Food & Beverage | 0.0 | 1 | |||
Forest & Paper Products | 0.0 | 1 | |||
Home & Office Products | 0.0 | 1 | |||
Home Improvement | 0.0 | 1 | |||
Industrial Other | 0.0 | 1 | |||
Internet Media | 0.0 | 1 | |||
Iron & Steel | 0.0 | 1 | |||
Leisure Products | 0.0 | 1 | |||
Machinery Manufacturing | 0.0 | 1 | |||
Mass Merchants | 0.0 | 1 | |||
Oil & Gas Services | 0.0 | 1 | |||
Pharmaceuticals | 0.0 | 1 | |||
Pipeline | 0.0 | 1 | |||
Railroad | 0.0 | 1 | |||
Recreation Facilities & Services | 0.0 | 1 | |||
Travel Lodging & Dining | 0.0 | 1 | |||
Waste & Environmental Service Equipment & Facility | 0.0 | 1 | |||
Other2 | 29.0 | ||||
Securities Sold Short | (21.7 | ) | |||
Other Assets and Liabilities3 | 45.6 | ||||
|
| ||||
Total Investments | 100.0 | % | |||
|
| ||||
| 1 | Represents less than 0.1%. |
| 2 | Includes Asset-Backed Securities, Sovereign Debt, Mortgage-Backed Securities, U.S. Government Sponsored Agency Securities, Exchange-Traded Funds and Purchased Options. |
| 3 | Assets, other than investments in securities, net of other liabilities. See Consolidated Statement of Assets and Liabilities. A significant portion of the balance represents cash collateral for derivatives. |
See Notes to Consolidated Financial Statements.
12
Blackstone Alternative Multi-Manager Fund and Subsidiaries
Consolidated Schedule of Investments
March 31, 2015
Security Description | Shares | Value | ||||||||
INVESTMENTS IN SECURITIES — 90.2% | ||||||||||
COMMON STOCK — 44.0% | ||||||||||
Argentina — 0.0% | ||||||||||
Iron & Steel — 0.0% | ||||||||||
Ternium SA ADR (a) | 8,500 | $ | 153,595 | |||||||
|
| |||||||||
Total Argentina | 153,595 | |||||||||
|
| |||||||||
Bahamas — 0.0% | ||||||||||
Transportation & Logistics — 0.0% | ||||||||||
Ultrapetrol Bahamas Ltd. (b) | 1,300 | 1,885 | ||||||||
|
| |||||||||
Total Bahamas | 1,885 | |||||||||
|
| |||||||||
Belgium — 0.1% | ||||||||||
Consumer Products — 0.0% | ||||||||||
Anheuser-Busch InBev NV | 3,585 | 437,963 | ||||||||
|
| |||||||||
Insurance — 0.1% | ||||||||||
Ageas | 35,139 | 1,261,929 | ||||||||
|
| |||||||||
Retail—Consumer Staples — 0.0% | ||||||||||
Delhaize Group SA ADR | 200 | 4,474 | ||||||||
|
| |||||||||
Total Belgium | 1,704,366 | |||||||||
|
| |||||||||
Bermuda — 0.1% | ||||||||||
Media — 0.0% | ||||||||||
Global Sources Ltd. (b) | 85 | 498 | ||||||||
|
| |||||||||
Transportation & Logistics — 0.1% | ||||||||||
Golar LNG Ltd. (c) | 23,623 | 786,173 | ||||||||
Teekay Corp. | 5,200 | 242,164 | ||||||||
|
| |||||||||
| 1,028,337 | ||||||||||
|
| |||||||||
Total Bermuda | 1,028,835 | |||||||||
|
| |||||||||
Brazil — 0.0% | ||||||||||
Banking — 0.0% | ||||||||||
Itau Unibanco Holding SA ADR | 33,271 | 367,977 | ||||||||
|
| |||||||||
Insurance — 0.0% | ||||||||||
Brasil Insurance Participacoes e Administracao SA | 43,000 | 26,272 | ||||||||
|
| |||||||||
Oil, Gas & Coal — 0.0% | ||||||||||
Cosan Ltd. A Shares | 2,029 | 12,844 | ||||||||
|
| |||||||||
Retail—Consumer Staples — 0.0% | ||||||||||
Cia Brasileira de Distribuicao ADR (a) | 2,100 | 62,622 | ||||||||
|
| |||||||||
See Notes to Consolidated Financial Statements.
13
Blackstone Alternative Multi-Manager Fund and Subsidiaries
Consolidated Schedule of Investments (Continued)
March 31, 2015
Security Description | Shares | Value | ||||||||
Utilities — 0.0% | ||||||||||
Cia Energetica de Minas Gerais ADR (a) | 41,300 | $ | 168,917 | |||||||
|
| |||||||||
Total Brazil | 638,632 | |||||||||
|
| |||||||||
Canada — 0.5% | ||||||||||
Asset Management — 0.1% | ||||||||||
Fairfax India Holdings Corp. (b) | 97,200 | 1,117,800 | ||||||||
|
| |||||||||
Banking — 0.2% | ||||||||||
Bank of Nova Scotia | 16,400 | 822,751 | ||||||||
Canadian Imperial Bank of Commerce | 11,200 | 811,957 | ||||||||
National Bank of Canada | 22,400 | 817,793 | ||||||||
|
| |||||||||
| 2,452,501 | ||||||||||
|
| |||||||||
Biotechnology & Pharmaceuticals — 0.0% | ||||||||||
QLT, Inc. (b) | 5,700 | 22,287 | ||||||||
|
| |||||||||
Consumer Products — 0.0% |
| |||||||||
Cott Corp. (a) | 14,600 | 136,802 | ||||||||
|
| |||||||||
Gaming, Lodging & Restaurants — 0.0% |
| |||||||||
Restaurant Brands International | 3 | 115 | ||||||||
|
| |||||||||
Media — 0.0% |
| |||||||||
Points International Ltd. (b) | 200 | 2,026 | ||||||||
|
| |||||||||
Metals & Mining — 0.1% |
| |||||||||
Dominion Diamond Corp. (a),(b) | 11,800 | 201,662 | ||||||||
Fortuna Silver Mines, Inc. (b) | 500 | 1,920 | ||||||||
Kinross Gold Corp. (a),(b) | 107,900 | 241,696 | ||||||||
MFC Industrial Ltd. (a) | 800 | 3,248 | ||||||||
Nevsun Resources Ltd. | 11,700 | 39,663 | ||||||||
Silvercorp Metals, Inc. | 800 | 944 | ||||||||
Taseko Mines Ltd. (a),(b) | 2,000 | 1,280 | ||||||||
|
| |||||||||
| 490,413 | ||||||||||
|
| |||||||||
Oil, Gas & Coal — 0.0% |
| |||||||||
Advantage Oil & Gas Ltd. (a),(b) | 8,500 | 45,560 | ||||||||
Bellatrix Exploration Ltd. (b) | 100 | 243 | ||||||||
Gran Tierra Energy, Inc. (a),(b) | 46,400 | 126,672 | ||||||||
TransGlobe Energy Corp. (a) | 3,100 | 10,974 | ||||||||
|
| |||||||||
| 183,449 | ||||||||||
|
| |||||||||
Passenger Transportation — 0.0% |
| |||||||||
Student Transportation, Inc. | 500 | 2,700 | ||||||||
|
| |||||||||
Renewable Energy — 0.1% |
| |||||||||
Canadian Solar, Inc. (a),(b),(c) | 40,697 | 1,358,873 | ||||||||
|
| |||||||||
See Notes to Consolidated Financial Statements.
14
Blackstone Alternative Multi-Manager Fund and Subsidiaries
Consolidated Schedule of Investments (Continued)
March 31, 2015
Security Description | Shares | Value | ||||||||
Waste & Environmental Service Equipment & Facility — 0.0% |
| |||||||||
Progressive Waste Solutions Ltd. (a) | 8,300 | $ | 243,854 | |||||||
|
| |||||||||
Total Canada | 6,010,820 | |||||||||
|
| |||||||||
Chile — 0.0% | ||||||||||
Real Estate — 0.0% |
| |||||||||
Parque Arauco SA | 82,892 | 158,975 | ||||||||
|
| |||||||||
Total Chile | �� | 158,975 | ||||||||
|
| |||||||||
China — 0.5% | ||||||||||
Automotive — 0.0% |
| |||||||||
China Automotive Systems, Inc. (a) | 2,600 | 18,928 | ||||||||
|
| |||||||||
Biotechnology & Pharmaceuticals — 0.0% |
| |||||||||
Sinovac Biotech Ltd. (b) | 1,900 | 9,424 | ||||||||
|
| |||||||||
Consumer Services — 0.1% |
| |||||||||
New Oriental Education & Technology Group, Inc. ADR (a),(b) | 41,900 | 928,923 | ||||||||
|
| |||||||||
Health Care Facilities/Services — 0.0% |
| |||||||||
WuXi PharmaTech Cayman, Inc. ADR (a),(b) | 8,200 | 317,996 | ||||||||
|
| |||||||||
Institutional Financial Service — 0.0% |
| |||||||||
GF Securities Co. Ltd. | 13,800 | 33,553 | ||||||||
|
| |||||||||
Insurance — 0.0% |
| |||||||||
CNinsure, Inc. ADR (a),(b) | 4,200 | 36,246 | ||||||||
|
| |||||||||
Machinery — 0.0% |
| |||||||||
Hollysys Automation Technologies Ltd. | 3,800 | 75,506 | ||||||||
|
| |||||||||
Media — 0.2% |
| |||||||||
Autohome, Inc. ADR (b) | 100 | 4,397 | ||||||||
Ctrip.com International Ltd. ADR (b) | 400 | 23,448 | ||||||||
Leju Holdings Ltd. ADR (b) | 5 | 40 | ||||||||
Qihoo 360 Technology Co. Ltd. ADR (b),(c) | 29,935 | 1,532,672 | ||||||||
Sohu.com, Inc. (a),(b) | 4,000 | 213,320 | ||||||||
Zhaopin Ltd. ADR (a),(b) | 1,340 | 21,105 | ||||||||
|
| |||||||||
| 1,794,982 | ||||||||||
|
| |||||||||
Medical Equipment/Devices — 0.0% | ||||||||||
Mindray Medical International Ltd. ADR (a) | 7,400 | 202,390 | ||||||||
|
| |||||||||
Passenger Transportation — 0.0% | ||||||||||
China Southern Airlines Co. Ltd. ADR | 1,100 | 39,644 | ||||||||
Guangshen Railway Co. Ltd. ADR | 200 | 4,624 | ||||||||
|
| |||||||||
| 44,268 | ||||||||||
|
| |||||||||
See Notes to Consolidated Financial Statements.
15
Blackstone Alternative Multi-Manager Fund and Subsidiaries
Consolidated Schedule of Investments (Continued)
March 31, 2015
Security Description | Shares | Value | ||||||||
Real Estate — 0.0% | ||||||||||
E-House China Holdings Ltd. ADR | 800 | $ | 4,344 | |||||||
Nam Tai Property, Inc. | 8,600 | 34,142 | ||||||||
Xinyuan Real Estate Co. Ltd. ADR (a) | 10,000 | 29,800 | ||||||||
|
| |||||||||
| 68,286 | ||||||||||
|
| |||||||||
Renewable Energy — 0.0% | ||||||||||
JA Solar Holdings Co. Ltd. ADR (b) | 700 | 6,692 | ||||||||
Trina Solar Ltd. ADR (a),(b) | 9,300 | 112,437 | ||||||||
|
| |||||||||
| 119,129 | ||||||||||
|
| |||||||||
Retail Discretionary — 0.2% | ||||||||||
Alibaba Group Holding Ltd. ADR (b) | 1,525 | 126,941 | ||||||||
Vipshop Holdings Ltd. ADR (b) | 79,075 | 2,327,968 | ||||||||
|
| |||||||||
| 2,454,909 | ||||||||||
|
| |||||||||
Software — 0.0% | ||||||||||
Changyou.com Ltd. ADR (b) | 100 | 2,589 | ||||||||
Perfect World Co. Ltd. ADR (a) | 16,800 | 312,144 | ||||||||
|
| |||||||||
| 314,733 | ||||||||||
|
| |||||||||
Total China | 6,419,273 | |||||||||
|
| |||||||||
Czech Republic — 0.0% | ||||||||||
Media — 0.0% | ||||||||||
Central European Media Enterprises Ltd. A Shares (b) | 1,800 | 4,788 | ||||||||
|
| |||||||||
Total Czech Republic | 4,788 | |||||||||
|
| |||||||||
Denmark — 0.0% | ||||||||||
Commercial Services — 0.0% | ||||||||||
ISS A/S (b) | 8,813 | 277,784 | ||||||||
|
| |||||||||
Total Denmark | 277,784 | |||||||||
|
| |||||||||
France — 0.2% | ||||||||||
Banking — 0.2% | ||||||||||
BNP Paribas SA | 17,793 | 1,082,633 | ||||||||
Credit Agricole SA | 63,039 | 926,356 | ||||||||
Societe Generale SA | 16,319 | 787,914 | ||||||||
|
| |||||||||
Total France | 2,796,903 | |||||||||
|
| |||||||||
Germany — 0.8% | ||||||||||
Automotive — 0.0% | ||||||||||
Volkswagen AG | 526 | 135,246 | ||||||||
|
| |||||||||
Biotechnology & Pharmaceuticals — 0.0% | ||||||||||
Bayer AG | 446 | 66,729 | ||||||||
|
| |||||||||
See Notes to Consolidated Financial Statements.
16
Blackstone Alternative Multi-Manager Fund and Subsidiaries
Consolidated Schedule of Investments (Continued)
March 31, 2015
Security Description | Shares | Value | ||||||||
Health Care Facilities/Services — 0.7% | ||||||||||
Fresenius SE & Co. KGaA | 143,078 | $ | 8,529,809 | |||||||
|
| |||||||||
Real Estate — 0.1% | ||||||||||
Deutsche Annington Immobilien SE | 24,906 | 839,273 | ||||||||
Deutsche Wohnen AG | 4,761 | 121,771 | ||||||||
LEG Immobilien AG | 4,314 | 342,209 | ||||||||
|
| |||||||||
| 1,303,253 | ||||||||||
|
| |||||||||
Total Germany | 10,035,037 | |||||||||
|
| |||||||||
Greece — 0.1% | ||||||||||
Banking — 0.1% | ||||||||||
Eurobank Ergasias SA (b) | 3,490,778 | 393,907 | ||||||||
Piraeus Bank SA (b) | 703,660 | 271,579 | ||||||||
|
| |||||||||
| 665,486 | ||||||||||
|
| |||||||||
Real Estate — 0.0% | ||||||||||
Grivalia Properties REIC | 68,589 | 559,761 | ||||||||
|
| |||||||||
Transportation & Logistics — 0.0% | ||||||||||
Aegean Marine Petroleum Network, Inc. | 1,900 | 27,303 | ||||||||
Costamare, Inc. | 6,800 | 119,748 | ||||||||
Paragon Shipping, Inc. A Shares (b) | 400 | 400 | ||||||||
Safe Bulkers, Inc. | 8,700 | 31,233 | ||||||||
StealthGas, Inc. (b) | 2,100 | 13,755 | ||||||||
|
| |||||||||
| 192,439 | ||||||||||
|
| |||||||||
Total Greece | 1,417,686 | |||||||||
|
| |||||||||
Hong Kong — 0.1% | ||||||||||
Consumer Services — 0.0% | ||||||||||
Nord Anglia Education, Inc. (b) | 100 | 2,272 | ||||||||
|
| |||||||||
Insurance — 0.1% | ||||||||||
AIA Group Ltd. | 135,600 | 850,490 | ||||||||
|
| |||||||||
Total Hong Kong | 852,762 | |||||||||
|
| |||||||||
India — 0.0% | ||||||||||
Banking — 0.0% | ||||||||||
HDFC Bank Ltd. ADR | 965 | 56,829 | ||||||||
|
| |||||||||
Metals & Mining — 0.0% | ||||||||||
Sesa Sterlite Ltd. ADR (a) | 20 | 248 | ||||||||
|
| |||||||||
Technology Services — 0.0% | ||||||||||
WNS Holdings Ltd. ADR (b) | 400 | 9,728 | ||||||||
|
| |||||||||
Total India | 66,805 | |||||||||
|
| |||||||||
See Notes to Consolidated Financial Statements.
17
Blackstone Alternative Multi-Manager Fund and Subsidiaries
Consolidated Schedule of Investments (Continued)
March 31, 2015
Security Description | Shares | Value | ||||||||
Ireland — 0.2% | ||||||||||
Biotechnology & Pharmaceuticals — 0.2% | ||||||||||
Shire PLC | 215 | $ | 17,140 | |||||||
Shire PLC ADR | 7,923 | 1,895,895 | ||||||||
|
| |||||||||
| 1,913,035 | ||||||||||
|
| |||||||||
Medical Equipment/Devices — 0.0% | ||||||||||
Trinity Biotech PLC ADR | 1,100 | 21,175 | ||||||||
|
| |||||||||
Software — 0.0% | ||||||||||
King Digital Entertainment PLC | 17,600 | 282,304 | ||||||||
|
| |||||||||
Specialty Finance — 0.0% | ||||||||||
Fly Leasing Ltd. ADR | 200 | 2,912 | ||||||||
|
| |||||||||
Total Ireland | 2,219,426 | |||||||||
|
| |||||||||
Israel — 0.8% | ||||||||||
Banking — 0.1% | ||||||||||
Israel Discount Bank Ltd. A Shares (b) | 484,166 | 817,451 | ||||||||
|
| |||||||||
Biotechnology & Pharmaceuticals — 0.7% | ||||||||||
Teva Pharmaceutical Industries Ltd. ADR (d) | 151,837 | 9,459,445 | ||||||||
|
| |||||||||
Electrical Equipment — 0.0% | ||||||||||
Orbotech Ltd. (b) | 9,800 | 157,094 | ||||||||
|
| |||||||||
Hardware — 0.0% | ||||||||||
AudioCodes Ltd. (b) | 1,000 | 4,600 | ||||||||
Ceragon Networks Ltd. (b) | 100 | 114 | ||||||||
Radware Ltd. (b) | 2,400 | 50,184 | ||||||||
|
| |||||||||
| 54,898 | ||||||||||
|
| |||||||||
Medical Equipment/Devices — 0.0% | ||||||||||
Lumenis Ltd. (b) | 200 | 2,394 | ||||||||
Syneron Medical Ltd. (b) | 7,300 | 90,374 | ||||||||
|
| |||||||||
| 92,768 | ||||||||||
|
| |||||||||
Semiconductors — 0.0% | ||||||||||
Nova Measuring Instruments Ltd. (b) | 2,900 | 33,408 | ||||||||
Tower Semiconductor Ltd. (b) | 3,000 | 50,940 | ||||||||
|
| |||||||||
| 84,348 | ||||||||||
|
| |||||||||
Software — 0.0% | ||||||||||
Sapiens International Corp. NV (b) | 100 | 820 | ||||||||
|
| |||||||||
Technology Services — 0.0% | ||||||||||
ClickSoftware Technologies Ltd. (b) | 2,200 | 19,338 | ||||||||
See Notes to Consolidated Financial Statements.
18
Blackstone Alternative Multi-Manager Fund and Subsidiaries
Consolidated Schedule of Investments (Continued)
March 31, 2015
Security Description | Shares | Value | ||||||||
Magic Software Enterprises Ltd. | 1,200 | $ | 7,776 | |||||||
|
| |||||||||
| 27,114 | ||||||||||
|
| |||||||||
Telecommunications — 0.0% | ||||||||||
Allot Communications Ltd. (b) | 100 | 879 | ||||||||
|
| |||||||||
Total Israel | 10,694,817 | |||||||||
|
| |||||||||
Italy — 0.5% | ||||||||||
Asset Management — 0.1% | ||||||||||
Anima Holding SpA (b) | 178,173 | 1,317,312 | ||||||||
|
| |||||||||
Banking — 0.4% | ||||||||||
Banca Generali SpA | 22,206 | 696,281 | ||||||||
Banca Popolare di Milano Scarl (b),(d) | 1,291,705 | 1,303,383 | ||||||||
Banco Popolare (b),(d) | 85,429 | 1,329,886 | ||||||||
FinecoBank SpA (b) | 144,464 | 996,106 | ||||||||
|
| |||||||||
| 4,325,656 | ||||||||||
|
| |||||||||
Home & Office Products — 0.0% | ||||||||||
De’ Longhi SpA | 6,907 | 149,501 | ||||||||
|
| |||||||||
Technology Services — 0.0% | ||||||||||
Cerved Information Solutions SpA (b) | 35,971 | 239,312 | ||||||||
|
| |||||||||
Total Italy | 6,031,781 | |||||||||
|
| |||||||||
Japan — 2.2% | ||||||||||
Automotive — 0.3% | ||||||||||
Aisin Seiki Co. Ltd. | 1,011 | 36,654 | ||||||||
Honda Motor Co. Ltd. | 1,015 | 33,133 | ||||||||
Toyota Motor Corp. | 66,530 | 4,644,041 | ||||||||
|
| |||||||||
| 4,713,828 | ||||||||||
|
| |||||||||
Banking — 0.4% | ||||||||||
Mitsubishi UFJ Financial Group, Inc. (c) | 626,637 | 3,881,021 | ||||||||
Mizuho Financial Group, Inc. | 18,425 | 32,382 | ||||||||
Shinsei Bank Ltd. | 436,000 | 866,915 | ||||||||
Sumitomo Mitsui Financial Group, Inc. | 854 | 32,712 | ||||||||
|
| |||||||||
| 4,813,030 | ||||||||||
|
| |||||||||
Distributors—Consumer Staples — 0.3% |
| |||||||||
Mitsubishi Corp. | 195,100 | 3,920,307 | ||||||||
|
| |||||||||
Electrical Equipment — 0.5% | ||||||||||
Daikin Industries Ltd. (c) | 37,100 | 2,480,284 | ||||||||
Mitsubishi Heavy Industries Ltd. | 517,842 | 2,849,308 | ||||||||
SMC Corp. | 3,600 | 1,071,950 | ||||||||
|
| |||||||||
| 6,401,542 | ||||||||||
|
| |||||||||
See Notes to Consolidated Financial Statements.
19
Blackstone Alternative Multi-Manager Fund and Subsidiaries
Consolidated Schedule of Investments (Continued)
March 31, 2015
Security Description | Shares | Value | ||||||||
Institutional Financial Service — 0.0% |
| |||||||||
Daiwa Securities Group, Inc. | 4,361 | $ | 34,329 | |||||||
|
| |||||||||
Insurance — 0.1% | ||||||||||
Tokio Marine Holdings, Inc. | 26,900 | 1,015,389 | ||||||||
|
| |||||||||
Machinery — 0.3% | ||||||||||
Kubota Corp. (c) | 225,127 | 3,556,761 | ||||||||
|
| |||||||||
Passenger Transportation — 0.0% | ||||||||||
Japan Airlines Co. Ltd. | 1,700 | 52,882 | ||||||||
|
| |||||||||
Real Estate — 0.3% | ||||||||||
Mitsubishi Estate Co. Ltd. (c) | 91,000 | 2,110,467 | ||||||||
Mitsui Fudosan Co. Ltd. | 40,000 | 1,174,720 | ||||||||
Sumitomo Realty & Development Co. Ltd. (c) | 37,000 | 1,332,050 | ||||||||
|
| |||||||||
| 4,617,237 | ||||||||||
|
| |||||||||
Specialty Finance — 0.0% | ||||||||||
Orix Corp. ADR | 200 | 14,068 | ||||||||
|
| |||||||||
Total Japan | 29,139,373 | |||||||||
|
| |||||||||
Mexico — 0.1% | ||||||||||
Engineering & Construction Services — 0.1% |
| |||||||||
OHL Mexico SAB de CV (b) | 146,579 | 278,773 | ||||||||
|
| |||||||||
Gaming, Lodging & Restaurants — 0.0% |
| |||||||||
Hoteles City Express SAB de CV (b) | 54,659 | 83,528 | ||||||||
|
| |||||||||
Real Estate — 0.0% | ||||||||||
Corp. Inmobiliaria Vesta SAB de CV | 69,002 | 128,247 | ||||||||
Mexico Real Estate Management SA de CV | 19,769 | 31,014 | ||||||||
Prologis Property Mexico SA de CV | 57,746 | 103,351 | ||||||||
|
| |||||||||
| 262,612 | ||||||||||
|
| |||||||||
Specialty Finance — 0.0% | ||||||||||
Concentradora Hipotecaria SAPI de CV | 85,389 | 144,148 | ||||||||
|
| |||||||||
Total Mexico | 769,061 | |||||||||
|
| |||||||||
Netherlands — 0.6% | ||||||||||
Banking — 0.1% | ||||||||||
ING Groep NV CVA (b) | 124,356 | 1,821,564 | ||||||||
|
| |||||||||
Institutional Financial Service — 0.1% |
| |||||||||
KAS Bank NV CVA | 49,895 | 658,903 | ||||||||
|
| |||||||||
Insurance — 0.1% | ||||||||||
Delta Lloyd NV | 80,681 | 1,521,635 | ||||||||
|
| |||||||||
See Notes to Consolidated Financial Statements.
20
Blackstone Alternative Multi-Manager Fund and Subsidiaries
Consolidated Schedule of Investments (Continued)
March 31, 2015
Security Description | Shares | Value | ||||||||
Metals & Mining — 0.0% | ||||||||||
Constellium NV Class A (b) | 2,400 | $ | 48,768 | |||||||
|
| |||||||||
Oil, Gas & Coal — 0.0% | ||||||||||
Royal Dutch Shell PLC ADR | 400 | 23,860 | ||||||||
|
| |||||||||
Semiconductors — 0.1% | ||||||||||
NXP Semiconductor NV (b),(d) | 12,054 | 1,209,739 | ||||||||
|
| |||||||||
Specialty Finance — 0.2% | ||||||||||
AerCap Holdings NV (b) | 75,318 | 3,287,631 | ||||||||
|
| |||||||||
Total Netherlands | 8,572,100 | |||||||||
|
| |||||||||
Norway — 0.0% | ||||||||||
Oil, Gas & Coal — 0.0% | ||||||||||
North Atlantic Drilling Ltd. | 1,000 | 1,160 | ||||||||
Statoil ASA ADR | 100 | 1,759 | ||||||||
|
| |||||||||
Total Norway | 2,919 | |||||||||
|
| |||||||||
Poland — 0.1% | ||||||||||
Banking — 0.1% | ||||||||||
Alior Bank SA (b) | 41,562 | 911,964 | ||||||||
|
| |||||||||
Total Poland | 911,964 | |||||||||
|
| |||||||||
Puerto Rico — 0.0% | ||||||||||
Banking — 0.0% | ||||||||||
First BanCorp (b) | 3,900 | 24,180 | ||||||||
Popular, Inc. (b) | 12,000 | 412,680 | ||||||||
|
| |||||||||
| 436,860 | ||||||||||
|
| |||||||||
Health Care Facilities/Services — 0.0% |
| |||||||||
Triple-S Management Corp. B Shares (b) | 3,400 | 67,592 | ||||||||
|
| |||||||||
Total Puerto Rico | 504,452 | |||||||||
|
| |||||||||
Republic of Korea — 0.0% | ||||||||||
Automotive — 0.0% | ||||||||||
Hyundai Motor Co. | 881 | 133,420 | ||||||||
|
| |||||||||
Hardware — 0.0% | ||||||||||
LG Display Co. Ltd. ADR | 100 | 1,431 | ||||||||
Samsung Electronics Co. Ltd. | 203 | 263,241 | ||||||||
|
| |||||||||
| 264,672 | ||||||||||
|
| |||||||||
Semiconductors — 0.0% | ||||||||||
Magnachip Semiconductor Corp. (a),(b) | 300 | 1,641 | ||||||||
|
| |||||||||
See Notes to Consolidated Financial Statements.
21
Blackstone Alternative Multi-Manager Fund and Subsidiaries
Consolidated Schedule of Investments (Continued)
March 31, 2015
Security Description | Shares | Value | ||||||||
Telecommunications — 0.0% | ||||||||||
KT Corp. ADR | 1,500 | $ | 19,620 | |||||||
|
| |||||||||
Total Republic of Korea | 419,353 | |||||||||
|
| |||||||||
Russian Federation — 0.0% | ||||||||||
Media — 0.0% | ||||||||||
Yandex NV | 1,500 | 22,747 | ||||||||
|
| |||||||||
Total Russian Federation | 22,747 | |||||||||
|
| |||||||||
Singapore — 0.0% | ||||||||||
Real Estate — 0.0% | ||||||||||
Ascendas Real Estate Investment Trust | 19,008 | 35,854 | ||||||||
CapitaCommercial Trust | 38,522 | 49,586 | ||||||||
CapitaMall Trust | 13,906 | 22,262 | ||||||||
Mapletree Logistics Trust | 38,091 | 34,556 | ||||||||
Suntec Real Estate Investment Trust | 16,937 | 22,874 | ||||||||
|
| |||||||||
| 165,132 | ||||||||||
|
| |||||||||
Semiconductors — 0.0% |
| |||||||||
Kulicke & Soffa Industries, Inc. (a),(b) | 21,100 | 329,793 | ||||||||
|
| |||||||||
Total Singapore | 494,925 | |||||||||
|
| |||||||||
South Africa — 0.0% | ||||||||||
Metals & Mining — 0.0% |
| |||||||||
Gold Fields Ltd. ADR (a) | 28,500 | 114,285 | ||||||||
Harmony Gold Mining Co. Ltd. ADR (a) | 33,600 | 58,464 | ||||||||
|
| |||||||||
| 172,749 | ||||||||||
|
| |||||||||
Oil, Gas & Coal — 0.0% |
| |||||||||
Sasol Ltd. ADR | 300 | 10,212 | ||||||||
|
| |||||||||
Specialty Finance — 0.0% |
| |||||||||
Net 1 UEPS Technologies, Inc. (a),(b) | 14,100 | 192,888 | ||||||||
|
| |||||||||
Total South Africa | 375,849 | |||||||||
|
| |||||||||
Spain — 0.0% | ||||||||||
Biotechnology & Pharmaceuticals — 0.0% |
| |||||||||
Grifols SA ADR (a) | 3,600 | 118,116 | ||||||||
|
| |||||||||
Total Spain | 118,116 | |||||||||
|
| |||||||||
Sweden — 0.0% | ||||||||||
Media — 0.0% |
| |||||||||
Com Hem Holding AB (b) | 20,310 | 165,081 | ||||||||
|
| |||||||||
Total Sweden | 165,081 | |||||||||
|
| |||||||||
See Notes to Consolidated Financial Statements.
22
Blackstone Alternative Multi-Manager Fund and Subsidiaries
Consolidated Schedule of Investments (Continued)
March 31, 2015
Security Description | Shares | Value | ||||||||
Switzerland — 0.8% | ||||||||||
Asset Management — 0.6% |
| |||||||||
Julius Baer Group Ltd. | 22,520 | $ | 1,125,635 | |||||||
UBS Group AG | 337,145 | 6,321,839 | ||||||||
|
| |||||||||
| 7,447,474 | ||||||||||
|
| |||||||||
Biotechnology & Pharmaceuticals — 0.0% |
| |||||||||
Roche Holding AG (d) | 887 | 243,741 | ||||||||
|
| |||||||||
Institutional Financial Service — 0.2% |
| |||||||||
Credit Suisse Group AG (d) | 79,329 | 2,134,261 | ||||||||
|
| |||||||||
Retail Discretionary — 0.0% |
| |||||||||
Dufry AG (b) | 1,167 | 172,536 | ||||||||
|
| |||||||||
Specialty Finance — 0.0% |
| |||||||||
Cembra Money Bank AG | 4,447 | 272,038 | ||||||||
|
| |||||||||
Transportation & Logistics — 0.0% |
| |||||||||
Flughafen Zuerich AG | 351 | 276,165 | ||||||||
|
| |||||||||
Total Switzerland | 10,546,215 | |||||||||
|
| |||||||||
Taiwan — 0.0% | ||||||||||
Semiconductors — 0.0% |
| |||||||||
Advanced Semiconductor Engineering, Inc. ADR | 200 | 1,440 | ||||||||
ChipMOS Technologies Bermuda Ltd. | 7,100 | 175,086 | ||||||||
Silicon Motion Technology Corp. ADR (a) | 4,200 | 112,896 | ||||||||
|
| |||||||||
Total Taiwan | 289,422 | |||||||||
|
| |||||||||
Thailand — 0.0% | ||||||||||
Design Manufacturing & Distribution — 0.0% |
| |||||||||
Fabrinet (b) | 1,500 | 28,485 | ||||||||
|
| |||||||||
Total Thailand | 28,485 | |||||||||
|
| |||||||||
United Kingdom — 1.6% | ||||||||||
Automotive — 0.1% |
| |||||||||
Delphi Automotive PLC (d) | 9,058 | 722,285 | ||||||||
|
| |||||||||
Banking — 0.1% |
| |||||||||
HSBC Holdings PLC | 131,200 | 1,118,010 | ||||||||
|
| |||||||||
Commercial Services — 0.0% |
| |||||||||
SSP Group PLC (b) | 38,143 | 168,047 | ||||||||
|
| |||||||||
Gaming, Lodging & Restaurants — 0.0% |
| |||||||||
InterContinental Hotels Group PLC ADR | 4,000 | 156,640 | ||||||||
|
| |||||||||
See Notes to Consolidated Financial Statements.
23
Blackstone Alternative Multi-Manager Fund and Subsidiaries
Consolidated Schedule of Investments (Continued)
March 31, 2015
Security Description | Shares | Value | ||||||||
Insurance — 0.1% |
| |||||||||
Aviva PLC ADR | 138,519 | $ | 1,109,587 | |||||||
Aviva PLC ADR | 4,969 | 80,349 | ||||||||
Prudential PLC ADR | 48 | 2,394 | ||||||||
|
| |||||||||
| 1,192,330 | ||||||||||
|
| |||||||||
Media — 1.1% |
| |||||||||
Liberty Global PLC (b) | 228,310 | 11,372,121 | ||||||||
Liberty Global PLC A Shares (b) | 56,200 | 2,892,614 | ||||||||
|
| |||||||||
| 14,264,735 | ||||||||||
|
| |||||||||
Medical Equipment/Devices — 0.0% |
| |||||||||
Smith & Nephew PLC ADR | 9,600 | 328,032 | ||||||||
|
| |||||||||
Real Estate — 0.1% |
| |||||||||
Kennedy Wilson Europe Real Estate PLC | 117,320 | 1,912,617 | ||||||||
|
| |||||||||
Recreation Facilities & Services — 0.0% |
| |||||||||
Manchester United PLC Class A (b) | 800 | 12,728 | ||||||||
|
| |||||||||
Semiconductors — 0.1% |
| |||||||||
ARM Holdings PLC ADR (a),(d) | 22,647 | 1,116,497 | ||||||||
|
| |||||||||
Telecommunications — 0.0% |
| |||||||||
BT Group PLC ADR | 1,600 | 104,272 | ||||||||
Vodafone Group PLC ADR (a) | 8,400 | 274,512 | ||||||||
|
| |||||||||
| 378,784 | ||||||||||
|
| |||||||||
Total United Kingdom | 21,370,705 | |||||||||
|
| |||||||||
United States — 34.7% | ||||||||||
Aerospace & Defense — 0.4% |
| |||||||||
Aerovironment, Inc. (a),(b) | 1,000 | 26,510 | ||||||||
Astronics Corp. (b) | 100 | 7,370 | ||||||||
Ducommun, Inc. (b) | 100 | 2,590 | ||||||||
Exelis, Inc. (a) | 32,000 | 779,840 | ||||||||
GenCorp, Inc. (b) | 11,600 | 269,004 | ||||||||
General Dynamics Corp. | 100 | 13,573 | ||||||||
Huntington Ingalls Industries, Inc. (a) | 4,200 | 588,630 | ||||||||
L-3 Communications Holdings, Inc. (a) | 8,500 | 1,069,215 | ||||||||
Moog, Inc. Class A (b) | 300 | 22,515 | ||||||||
Orbital ATK, Inc. (a) | 1 | 77 | ||||||||
Spirit AeroSystems Holdings, Inc. Class A (a),(b) | 5,200 | 271,492 | ||||||||
TransDigm Group, Inc. (a) | 10,300 | 2,252,816 | ||||||||
|
| |||||||||
| 5,303,632 | ||||||||||
|
| |||||||||
Apparel & Textile Products — 0.1% |
| |||||||||
Albany International Corp. Class A | 300 | 11,925 | ||||||||
See Notes to Consolidated Financial Statements.
24
Blackstone Alternative Multi-Manager Fund and Subsidiaries
Consolidated Schedule of Investments (Continued)
March 31, 2015
Security Description | Shares | Value | ||||||||
Carter’s, Inc. | 2,500 | $ | 231,175 | |||||||
Culp, Inc. | 1,200 | 32,100 | ||||||||
Deckers Outdoor Corp. (b) | 200 | 14,574 | ||||||||
Perry Ellis International, Inc. (a),(b) | 4,500 | 104,220 | ||||||||
Ralph Lauren Corp. (a) | 10,400 | 1,367,600 | ||||||||
Vince Holding Corp. (b) | 900 | 16,695 | ||||||||
|
| |||||||||
| 1,778,289 | ||||||||||
|
| |||||||||
Asset Management — 1.1% | ||||||||||
American Capital Ltd. (a),(b) | 109,974 | 1,626,516 | ||||||||
Apollo Investment Corp. (a) | 3,000 | 23,025 | ||||||||
Ares Capital Corp. (a) | 48,300 | 829,311 | ||||||||
BlackRock Kelso Capital Corp. | 29,400 | 266,364 | ||||||||
Calamos Asset Management, Inc. Class A (a) | 5,600 | 75,320 | ||||||||
Carlyle Group LP | 6,261 | 169,673 | ||||||||
Charles Schwab Corp. (c) | 218,584 | 6,653,697 | ||||||||
E*TRADE Financial Corp. (a),(b) | 5,400 | 154,197 | ||||||||
Fidus Investment Corp. | 6,100 | 93,757 | ||||||||
Fifth Street Finance Corp. | 7,500 | 54,750 | ||||||||
Firsthand Technology Value Fund, Inc. | 900 | 12,906 | ||||||||
Franklin Resources, Inc. | 200 | 10,264 | ||||||||
Garrison Capital, Inc. (a) | 4,300 | 64,070 | ||||||||
Gladstone Capital Corp. (a) | 7,900 | 69,599 | ||||||||
Gladstone Investment Corp. (a) | 11,000 | 81,400 | ||||||||
Horizon Technology Finance Corp. (a) | 4,800 | 66,336 | ||||||||
Invesco Ltd. | 21,200 | 841,428 | ||||||||
Janus Capital Group, Inc. (a) | 44,700 | 768,393 | ||||||||
KCAP Financial, Inc. (a) | 15,100 | 101,623 | ||||||||
Legg Mason, Inc. (a) | 18,662 | 1,030,142 | ||||||||
Medallion Financial Corp. (a) | 11,500 | 106,490 | ||||||||
MVC Capital, Inc. | 2,200 | 20,856 | ||||||||
OHA Investment Corp. (a) | 5,200 | 27,404 | ||||||||
PennantPark Floating Rate Capital Ltd. | 300 | 4,209 | ||||||||
PennantPark Investment Corp. (a) | 41,600 | 376,480 | ||||||||
Solar Capital Ltd. (a) | 10,600 | 214,544 | ||||||||
Solar Senior Capital Ltd. (a) | 2,200 | 35,442 | ||||||||
Stellus Capital Investment Corp. (a) | 1,500 | 18,105 | ||||||||
THL Credit, Inc. | 7,800 | 95,862 | ||||||||
TICC Capital Corp. (a) | 31,100 | 215,212 | ||||||||
TPG Specialty Lending, Inc. | 1,300 | 22,373 | ||||||||
WhiteHorse Finance, Inc. | 2,653 | 32,950 | ||||||||
WisdomTree Investments, Inc. | 43,514 | 933,811 | ||||||||
|
| |||||||||
| 15,096,509 | ||||||||||
|
| |||||||||
Automotive — 0.2% | ||||||||||
Fuel Systems Solutions, Inc. (b) | 600 | 6,624 | ||||||||
See Notes to Consolidated Financial Statements.
25
Blackstone Alternative Multi-Manager Fund and Subsidiaries
Consolidated Schedule of Investments (Continued)
March 31, 2015
Security Description | Shares | Value | ||||||||
Goodyear Tire & Rubber Co. (a) | 32,900 | $ | 890,932 | |||||||
Lear Corp. (a) | 1,200 | 132,984 | ||||||||
Methode Electronics, Inc. | 100 | 4,704 | ||||||||
Modine Manufacturing Co. (b) | 1,000 | 13,470 | ||||||||
Remy International, Inc. | 206 | 4,575 | ||||||||
Tenneco, Inc. (a),(b) | 100 | 5,742 | ||||||||
Tower International, Inc. (a),(b) | 7,100 | 188,860 | ||||||||
TriMas Corp. (b) | 400 | 12,316 | ||||||||
Visteon Corp. (a),(b) | 8,200 | 790,480 | ||||||||
|
| |||||||||
| 2,050,687 | ||||||||||
|
| |||||||||
Banking — 2.6% | ||||||||||
Ameris Bancorp | 100 | 2,639 | ||||||||
Arrow Financial Corp. | 302 | 8,199 | ||||||||
Bancorp, Inc. (b) | 2,300 | 20,769 | ||||||||
Bank Mutual Corp. (a) | 4,700 | 34,404 | ||||||||
Bank of Kentucky Financial Corp. | 100 | 4,905 | ||||||||
BankUnited, Inc. | 39,851 | 1,304,722 | ||||||||
Beneficial Bancorp, Inc. (a),(b) | 97,147 | 1,096,790 | ||||||||
Blue Hills Bancorp, Inc. (a),(b) | 2,400 | 31,728 | ||||||||
BNC Bancorp | 400 | 7,240 | ||||||||
Boston Private Financial Holdings, Inc. | 2,500 | 30,375 | ||||||||
Central Pacific Financial Corp. | 4,300 | 98,771 | ||||||||
Charter Financial Corp. | 2,200 | 25,300 | ||||||||
Chemical Financial Corp. (a) | 2,500 | 78,400 | ||||||||
Citigroup, Inc. (a) | 64,395 | 3,317,630 | ||||||||
Citizens Financial Group, Inc. (c) | 319,707 | 7,714,530 | ||||||||
City Holding Co. | 700 | 32,921 | ||||||||
Comerica, Inc. (a) | 51,900 | 2,342,247 | ||||||||
Dime Community Bancshares, Inc. | 1,600 | 25,760 | ||||||||
EverBank Financial Corp. (a) | 64,110 | 1,155,903 | ||||||||
Farmers Capital Bank Corp. (b) | 100 | 2,325 | ||||||||
Fidelity Southern Corp. | 1,900 | 32,072 | ||||||||
First Busey Corp. | 1,500 | 10,035 | ||||||||
First Citizens BancShares, Inc. Class A (a) | 5,543 | 1,439,462 | ||||||||
First Community Bancshares, Inc. | 900 | 15,777 | ||||||||
First Connecticut Bancorp, Inc./Farmington | 100 | 1,537 | ||||||||
First Financial Northwest, Inc. | 500 | 6,175 | ||||||||
First Interstate BancSystem, Inc. Class A | 5,100 | 141,882 | ||||||||
First Midwest Bancorp, Inc. | 100 | 1,737 | ||||||||
First Republic Bank (a) | 16,758 | 956,714 | ||||||||
Heritage Commerce Corp. | 1,000 | 9,130 | ||||||||
HomeTrust Bancshares, Inc. (a),(b) | 1,500 | 23,955 | ||||||||
Hudson City Bancorp, Inc. | 1,000 | 10,480 | ||||||||
Hudson Valley Holding Corp. | 1,500 | 38,340 | ||||||||
Independent Bank Corp. (a) | 2,500 | 32,075 | ||||||||
See Notes to Consolidated Financial Statements.
26
Blackstone Alternative Multi-Manager Fund and Subsidiaries
Consolidated Schedule of Investments (Continued)
March 31, 2015
Security Description | Shares | Value | ||||||||
Independent Bank Group, Inc. | 400 | $ | 15,564 | |||||||
Investors Bancorp, Inc. | 10 | 117 | ||||||||
Legacy Texas Financial Group | 700 | 15,911 | ||||||||
Macatawa Bank Corp. | 100 | 535 | ||||||||
Meridian Bancorp, Inc. (a),(b) | 8,300 | 109,311 | ||||||||
National Bankshares, Inc. | 100 | 2,984 | ||||||||
Northrim BanCorp, Inc. | 100 | 2,454 | ||||||||
Northwest Bancshares, Inc. | 13,600 | 161,160 | ||||||||
Oritani Financial Corp. (a) | 2,000 | 29,100 | ||||||||
Pacific Continental Corp. | 100 | 1,322 | ||||||||
Pacific Premier Bancorp, Inc. (b) | 300 | 4,857 | ||||||||
Park Sterling Corp. | 400 | 2,840 | ||||||||
PNC Financial Services Group, Inc. (a) | 32,370 | 3,018,179 | ||||||||
Preferred Bank | 600 | 16,482 | ||||||||
Regions Financial Corp. (a) | 61,300 | 579,285 | ||||||||
Renasant Corp. | 1,300 | 39,065 | ||||||||
S&T Bancorp, Inc. | 400 | 11,352 | ||||||||
Southwest Bancorp, Inc. | 3,100 | 55,149 | ||||||||
Square 1 Financial, Inc. (b) | 600 | 16,062 | ||||||||
State Bank Financial Corp. | 2,600 | 54,600 | ||||||||
Sterling Bancorp | 5,739 | 76,960 | ||||||||
SVB Financial Group (b) | 900 | 114,336 | ||||||||
Talmer Bancorp, Inc. Class A (a) | 48,800 | 747,372 | ||||||||
Territorial Bancorp, Inc. (a) | 1,000 | 23,760 | ||||||||
Towne Bank | 2,540 | 40,843 | ||||||||
Trico Bancshares | 1,100 | 26,543 | ||||||||
TriState Capital Holdings, Inc. (a),(b) | 4,400 | 46,068 | ||||||||
TrustCo Bank Corp. | 700 | 4,816 | ||||||||
Union Bankshares Corp. (a) | 38 | 844 | ||||||||
United Community Financial Corp. | 200 | 1,092 | ||||||||
United Financial Bancorp, Inc. (a) | 20 | 249 | ||||||||
Univest Corp. of Pennsylvania | 1,000 | 19,790 | ||||||||
Valley National Bancorp | 12 | 113 | ||||||||
Wells Fargo & Co. (a) | 142,214 | 7,736,442 | ||||||||
WesBanco, Inc. | 1,500 | 48,870 | ||||||||
Western Alliance Bancorp (b) | 2,700 | 80,028 | ||||||||
Wilshire Bancorp, Inc. | 2,800 | 27,916 | ||||||||
Zions BanCorp. (a) | 61,949 | 1,672,623 | ||||||||
|
| |||||||||
| 34,859,923 | ||||||||||
|
| |||||||||
Biotechnology & Pharmaceuticals — 6.1% | ||||||||||
AbbVie, Inc. | 767 | 44,900 | ||||||||
Achillion Pharmaceuticals, Inc. (b),(c) | 19,601 | 193,266 | ||||||||
Acorda Therapeutics, Inc. (b) | 800 | 26,624 | ||||||||
Actavis PLC (b),(c) | 28,747 | 8,555,638 | ||||||||
Alexion Pharmaceuticals, Inc. (a),(b) | 1,300 | 225,290 | ||||||||
See Notes to Consolidated Financial Statements.
27
Blackstone Alternative Multi-Manager Fund and Subsidiaries
Consolidated Schedule of Investments (Continued)
March 31, 2015
Security Description | Shares | Value | ||||||||
Anacor Pharmaceuticals, Inc. (b) | 3,600 | $ | 208,260 | |||||||
ArQule, Inc. (b) | 3,000 | 6,720 | ||||||||
Array BioPharma, Inc. (b) | 3,800 | 28,006 | ||||||||
Biogen Idec, Inc. (a),(b),(d) | 16,167 | 6,826,354 | ||||||||
BioSpecifics Technologies Corp. (b) | 400 | 15,660 | ||||||||
Bristol-Myers Squibb Co. (d) | 323 | 20,834 | ||||||||
Cambrex Corp. (a),(b) | 7,900 | 313,077 | ||||||||
Celladon Corp. (b) | 500 | 9,470 | ||||||||
Cempra, Inc. (b) | 100 | 3,431 | ||||||||
Concert Pharmaceuticals, Inc. (b) | 100 | 1,515 | ||||||||
Depomed, Inc. (a),(b) | 15,100 | 338,391 | ||||||||
Dyax Corp. (a),(b) | 39,800 | 666,849 | ||||||||
Emergent Biosolutions, Inc. (b) | 900 | 25,884 | ||||||||
Endo International PLC (b),(c),(d) | 51,509 | 4,620,357 | ||||||||
Gilead Sciences, Inc. (a),(b),(d) | 39,065 | 3,833,448 | ||||||||
Horizon Pharma PLC (b) | 1,800 | 46,746 | ||||||||
Incyte Corp. (a),(b) | 30,900 | 2,832,294 | ||||||||
Jazz Pharmaceuticals PLC (b),(c),(d) | 24,300 | 4,198,797 | ||||||||
Mallinckrodt PLC (b),(c),(d) | 123,563 | 15,649,254 | ||||||||
Medivation, Inc. (a),(b),(c),(d) | 44,300 | 5,717,801 | ||||||||
Merck & Co., Inc. (a),(d) | 116,700 | 6,707,916 | ||||||||
Merrimack Pharmaceuticals, Inc. (b) | 19,200 | 228,096 | ||||||||
Momenta Pharmaceuticals, Inc. (b) | 1,300 | 19,760 | ||||||||
Mylan NV (b),(c),(d) | 90,500 | 5,371,175 | ||||||||
Omega Protein Corp. (a),(b) | 2,400 | 32,856 | ||||||||
Omeros Corp. (a),(b) | 2,800 | 61,684 | ||||||||
OncoGenex Pharmaceuticals, Inc. (b) | 100 | 215 | ||||||||
PDL BioPharma, Inc. | 15,100 | 106,228 | ||||||||
Pernix Therapeutics Holdings, Inc. (b) | 600 | 6,414 | ||||||||
Perrigo Co. PLC (d) | 44 | 7,284 | ||||||||
Pfizer, Inc. (a),(d) | 98,862 | 3,439,409 | ||||||||
Phibro Animal Health Corp. Class A | 5,300 | 187,673 | ||||||||
Portola Pharmaceuticals, Inc. (b) | 500 | 18,980 | ||||||||
Pozen, Inc. (a),(b) | 1,700 | 13,124 | ||||||||
PTC Therapeutics, Inc. (b) | 416 | 25,314 | ||||||||
Puma Biotechnology, Inc. (b) | 200 | 47,222 | ||||||||
Receptos, Inc. (b) | 123 | 20,281 | ||||||||
Revance Therapeutics, Inc. (b) | 100 | 2,073 | ||||||||
Rigel Pharmaceuticals, Inc. (a),(b) | 9,100 | 32,487 | ||||||||
SciClone Pharmaceuticals, Inc. (a),(b) | 6,200 | 54,932 | ||||||||
Sorrento Therapeutics, Inc. (b) | 100 | 1,156 | ||||||||
Sucampo Pharmaceuticals, Inc. Class A (b) | 500 | 7,780 | ||||||||
Supernus Pharmaceuticals, Inc. (b) | 500 | 6,045 | ||||||||
Targacept, Inc. (a),(b) | 300 | 891 | ||||||||
TESARO, Inc. (b) | 1,300 | 74,620 | ||||||||
USANA Health Sciences, Inc. (b) | 900 | 100,008 | ||||||||
See Notes to Consolidated Financial Statements.
28
Blackstone Alternative Multi-Manager Fund and Subsidiaries
Consolidated Schedule of Investments (Continued)
March 31, 2015
Security Description | Shares | Value | ||||||||
Valeant Pharmaceuticals International, Inc. (b) | 29,722 | $ | 5,903,384 | |||||||
Vertex Pharmaceuticals, Inc. (a),(b),(d) | 35,500 | 4,187,935 | ||||||||
Vical, Inc. (b) | 400 | 378 | ||||||||
Xencor, Inc. (b) | 800 | 12,256 | ||||||||
XenoPort, Inc. (b) | 2,000 | 14,240 | ||||||||
Zoetis, Inc. (a) | 800 | 37,032 | ||||||||
|
| |||||||||
| 81,137,714 | ||||||||||
|
| |||||||||
Chemicals — 0.2% | ||||||||||
Air Products & Chemicals, Inc. | 311 | 47,048 | ||||||||
Albemarle Corp. (a) | 26 | 1,374 | ||||||||
Cabot Corp. | 300 | 13,500 | ||||||||
Calgon Carbon Corp. | 4,200 | 88,494 | ||||||||
Cytec Industries, Inc. (a) | 4,300 | 232,372 | ||||||||
Dow Chemical Co. | 2,600 | 124,748 | ||||||||
Ferro Corp. (b) | 200 | 2,510 | ||||||||
FutureFuel Corp. | 100 | 1,027 | ||||||||
GrafTech International Ltd. (b) | 600 | 2,334 | ||||||||
Innophos Holdings, Inc. | 1,400 | 78,904 | ||||||||
Intrepid Potash, Inc. (a),(b) | 9,400 | 108,570 | ||||||||
KMG Chemicals, Inc. | 200 | 5,346 | ||||||||
Kraton Performance Polymers, Inc. (a),(b) | 1,800 | 36,378 | ||||||||
Lydall, Inc. (b) | 900 | 28,548 | ||||||||
LyondellBasell Industries NV Class A | 14,400 | 1,264,320 | ||||||||
Minerals Technologies, Inc. | 100 | 7,310 | ||||||||
Mosaic Co. | 300 | 13,818 | ||||||||
OM Group, Inc. (a) | 3,200 | 96,096 | ||||||||
OMNOVA Solutions, Inc. (a),(b) | 1,800 | 15,354 | ||||||||
Orion Engineered Carbons SA | 500 | 9,000 | ||||||||
Quaker Chemical Corp. | 500 | 42,820 | ||||||||
Stepan Co. | 2,000 | 83,320 | ||||||||
Westlake Chemical Corp. (a) | 4,800 | 345,312 | ||||||||
|
| |||||||||
| 2,648,503 | ||||||||||
|
| |||||||||
Commercial Services — 0.2% | ||||||||||
ADT Corp. (a) | 3,800 | 157,776 | ||||||||
AMN Healthcare Services, Inc. (b) | 1,800 | 41,526 | ||||||||
ARC Document Solutions, Inc. (a),(b) | 4,700 | 43,381 | ||||||||
CBIZ, Inc. (b) | 3,200 | 29,856 | ||||||||
CDI Corp. (a) | 700 | 9,835 | ||||||||
Collectors Universe, Inc. (a) | 1,200 | 27,072 | ||||||||
Computer Task Group, Inc. (a) | 5,100 | 37,281 | ||||||||
CorVel Corp. (b) | 100 | 3,441 | ||||||||
Courier Corp. | 100 | 2,448 | ||||||||
CRA International, Inc. (b) | 2,900 | 90,248 | ||||||||
Ennis, Inc. | 700 | 9,884 | ||||||||
See Notes to Consolidated Financial Statements.
29
Blackstone Alternative Multi-Manager Fund and Subsidiaries
Consolidated Schedule of Investments (Continued)
March 31, 2015
Security Description | Shares | Value | ||||||||
Franklin Covey Co. (b) | 200 | $ | 3,852 | |||||||
Hackett Group, Inc. (a) | 2,700 | 24,138 | ||||||||
Heidrick & Struggles International, Inc. | 500 | 12,290 | ||||||||
Insperity, Inc. (a) | 13,100 | 684,999 | ||||||||
KAR Auction Services, Inc. | 14,200 | 538,606 | ||||||||
Kforce, Inc. | 100 | 2,231 | ||||||||
Manpowergroup, Inc. | 200 | 17,230 | ||||||||
Navigant Consulting, Inc. (a),(b) | 13,700 | 177,552 | ||||||||
PRGX Global, Inc. (a),(b) | 5,400 | 21,708 | ||||||||
Quad/Graphics, Inc. | 3,900 | 89,622 | ||||||||
Resources Connection, Inc. | 300 | 5,250 | ||||||||
RPX Corp. (a),(b) | 6,400 | 92,096 | ||||||||
ServiceMaster Global Holdings, Inc. (a),(b) | 14,200 | 479,250 | ||||||||
TrueBlue, Inc. (b) | 2,500 | 60,875 | ||||||||
Viad Corp. | 100 | 2,782 | ||||||||
|
| |||||||||
| 2,665,229 | ||||||||||
|
| |||||||||
Construction Materials — 0.2% | ||||||||||
Carlisle Cos., Inc. (a) | 1,200 | 111,156 | ||||||||
Continental Building Products, Inc. (b) | 7,300 | 164,907 | ||||||||
Headwaters, Inc. (a),(b) | 14,700 | 269,598 | ||||||||
Patrick Industries, Inc. (b) | 2,500 | 155,675 | ||||||||
Trex Co., Inc. (b) | 200 | 10,906 | ||||||||
Universal Forest Products, Inc. | 100 | 5,548 | ||||||||
US Concrete, Inc. (b) | 7,900 | 267,652 | ||||||||
Vulcan Materials Co. (a) | 15,400 | 1,298,220 | ||||||||
|
| |||||||||
| 2,283,662 | ||||||||||
|
| |||||||||
Consumer Products — 0.5% | ||||||||||
Alliance One International, Inc. (b) | 600 | 660 | ||||||||
Cal-Maine Foods, Inc. | 100 | 3,906 | ||||||||
Central Garden and Pet Co. Class A (b) | 1,800 | 19,116 | ||||||||
Coca-Cola Enterprises, Inc. (a) | 32,800 | 1,449,760 | ||||||||
Coty, Inc. Class A | 38,600 | 936,822 | ||||||||
Diamond Foods, Inc. (b) | 300 | 9,771 | ||||||||
Female Health Co. | 600 | 1,698 | ||||||||
Herbalife Ltd. | 100 | 4,276 | ||||||||
Inventure Foods, Inc. (a),(b) | 2,000 | 22,380 | ||||||||
John B Sanfilippo & Son, Inc. | 1,300 | 56,030 | ||||||||
Mead Johnson Nutrition Co. (d) | 15,726 | 1,580,935 | ||||||||
Molson Coors Brewing Co. Class B | 1,666 | 124,034 | ||||||||
Mondelez International, Inc. Class A (a) | 12,484 | 450,547 | ||||||||
Nu Skin Enterprises, Inc. (a),(c) | 14,648 | 881,956 | ||||||||
Philip Morris International, Inc. (a) | 7,600 | 572,508 | ||||||||
Pilgrim’s Pride Corp. (a) | 16,200 | 365,958 | ||||||||
Revlon, Inc. Class A (b) | 600 | 24,720 | ||||||||
See Notes to Consolidated Financial Statements.
30
Blackstone Alternative Multi-Manager Fund and Subsidiaries
Consolidated Schedule of Investments (Continued)
March 31, 2015
Security Description | Shares | Value | ||||||||
Vector Group Ltd. (a) | 526 | $ | 11,556 | |||||||
|
| |||||||||
| 6,516,633 | ||||||||||
|
| |||||||||
Consumer Services — 0.0% | ||||||||||
Aaron’s, Inc. | 1,200 | 33,972 | ||||||||
American Public Education, Inc. (b) | 4,900 | 146,902 | ||||||||
Bridgepoint Education, Inc. (a),(b) | 2,600 | 25,090 | ||||||||
Capella Education Co. | 800 | 51,904 | ||||||||
Career Education Corp. (b) | 900 | 4,527 | ||||||||
Carriage Services, Inc. (a) | 1,100 | 26,257 | ||||||||
DeVry Education Group, Inc. | 1,400 | 46,704 | ||||||||
K12, Inc. (b) | 300 | 4,716 | ||||||||
Nutrisystem, Inc. | 1,400 | 27,972 | ||||||||
Universal Technical Institute, Inc. | 2,300 | 22,080 | ||||||||
|
| |||||||||
| 390,124 | ||||||||||
|
| |||||||||
Containers & Packaging — 0.8% | ||||||||||
Berry Plastics Group, Inc. (a),(b) | 82,000 | 2,967,580 | ||||||||
Crown Holdings, Inc. (a),(b) | 10,200 | 551,004 | ||||||||
Graphic Packaging Holding Co. | 3,000 | 43,620 | ||||||||
MeadWestvaco Corp. (a) | 56,200 | 2,802,694 | ||||||||
Owens-Illinois, Inc. (b) | 18,400 | 429,088 | ||||||||
Rock-Tenn Co. Class A (a) | 45,200 | 2,915,400 | ||||||||
Sealed Air Corp. (a) | 6,600 | 300,696 | ||||||||
ZAGG, Inc. (b) | 1,100 | 9,537 | ||||||||
|
| |||||||||
| 10,019,619 | ||||||||||
|
| |||||||||
Design Manufacturing & Distribution — 0.1% | ||||||||||
Benchmark Electronics, Inc. (a),(b) | 2,300 | 55,269 | ||||||||
CTS Corp. | 300 | 5,397 | ||||||||
Flextronics International Ltd. (b) | 86,000 | 1,090,050 | ||||||||
Plexus Corp. (b) | 1,600 | 65,232 | ||||||||
|
| |||||||||
| 1,215,948 | ||||||||||
|
| |||||||||
Distributors—Consumer Staples — 0.0% | ||||||||||
Andersons, Inc. (a) | 2,800 | 115,836 | ||||||||
Sysco Corp. | 200 | 7,546 | ||||||||
|
| |||||||||
| 123,382 | ||||||||||
|
| |||||||||
Distributors—Discretionary — 0.0% | ||||||||||
ePlus, Inc. (b) | 600 | 52,158 | ||||||||
Insight Enterprises, Inc. (a),(b) | 3,800 | 108,376 | ||||||||
ScanSource, Inc. (a),(b) | 2,500 | 101,625 | ||||||||
|
| |||||||||
| 262,159 | ||||||||||
|
| |||||||||
See Notes to Consolidated Financial Statements.
31
Blackstone Alternative Multi-Manager Fund and Subsidiaries
Consolidated Schedule of Investments (Continued)
March 31, 2015
Security Description | Shares | Value | ||||||||
Electrical Equipment — 0.7% | ||||||||||
Acuity Brands, Inc. | 2,600 | $ | 437,216 | |||||||
Allegion PLC | 34,156 | 2,089,323 | ||||||||
American Science & Engineering, Inc. | 400 | 19,544 | ||||||||
Argan, Inc. (a) | 1,400 | 50,638 | ||||||||
Checkpoint Systems, Inc. (a) | 5,200 | 56,264 | ||||||||
Eaton Corp. PLC | 800 | 54,352 | ||||||||
Emerson Electric Co. (a) | 18,900 | 1,070,118 | ||||||||
FARO Technologies, Inc. (b) | 2,300 | 142,899 | ||||||||
General Electric Co. | 8,884 | 220,412 | ||||||||
Global Power Equipment Group, Inc. | 400 | 5,280 | ||||||||
Houston Wire & Cable Co. | 500 | 4,865 | ||||||||
Ingersoll-Rand PLC | 76,977 | 5,240,594 | ||||||||
Itron, Inc. (b) | 300 | 10,953 | ||||||||
Keysight Technologies, Inc. (b) | 3,100 | 115,165 | ||||||||
OSI Systems, Inc. (b) | 700 | 51,982 | ||||||||
|
| |||||||||
| 9,569,605 | ||||||||||
|
| |||||||||
Engineering & Construction Services — 0.4% | ||||||||||
AECOM Technology Corp. (a),(b) | 7,132 | 219,808 | ||||||||
Chicago Bridge & Iron Co. NV | 800 | 39,408 | ||||||||
Comfort Systems USA, Inc. (a) | 4,300 | 90,472 | ||||||||
Dycom Industries, Inc. (a),(b) | 1,900 | 92,796 | ||||||||
Fluor Corp. (a) | 33,200 | 1,897,712 | ||||||||
Great Lakes Dredge & Dock Corp. | 2,200 | 13,222 | ||||||||
Jacobs Engineering Group, Inc. (a),(b) | 31,000 | 1,399,960 | ||||||||
KBR, Inc. (a) | 78,600 | 1,138,128 | ||||||||
MasTec, Inc. (b) | 3,200 | 61,760 | ||||||||
Mistras Group, Inc. (a),(b) | 500 | 9,630 | ||||||||
MYR Group, Inc. (b) | 2,100 | 65,814 | ||||||||
Orion Marine Group, Inc. (b) | 6,200 | 54,932 | ||||||||
Quanta Services, Inc. (a),(b) | 14,800 | 422,244 | ||||||||
Team, Inc. (b) | 500 | 19,490 | ||||||||
Tutor Perini Corp. (a),(b) | 1,200 | 28,020 | ||||||||
|
| |||||||||
| 5,553,396 | ||||||||||
|
| |||||||||
Forest & Paper Products — 0.0% | ||||||||||
Mercer International, Inc. (a),(b) | 18,300 | 281,088 | ||||||||
|
| |||||||||
Gaming, Lodging & Restaurants — 0.9% | ||||||||||
BJ’s Restaurants, Inc. (b) | 3,800 | 191,710 | ||||||||
Bloomin’ Brands, Inc. (a) | 28,100 | 683,673 | ||||||||
Bravo Brio Restaurant Group, Inc. (b) | 12,600 | 185,094 | ||||||||
Buffalo Wild Wings, Inc. (a),(b) | 6,500 | 1,178,060 | ||||||||
Caesars Acquisition Co. Class A (b) | 3,800 | 25,840 | ||||||||
Chipotle Mexican Grill, Inc. (a),(b) | 2,900 | 1,886,566 | ||||||||
See Notes to Consolidated Financial Statements.
32
Blackstone Alternative Multi-Manager Fund and Subsidiaries
Consolidated Schedule of Investments (Continued)
March 31, 2015
Security Description | Shares | Value | ||||||||
Choice Hotels International, Inc. | 100 | $ | 6,407 | |||||||
Churchill Downs, Inc. | 3,100 | 356,407 | ||||||||
Cracker Barrel Old Country Store, Inc. (a) | 5,000 | 760,700 | ||||||||
Darden Restaurants, Inc. (a) | 2,800 | 194,152 | ||||||||
Denny’s Corp. (a),(b) | 48,000 | 547,200 | ||||||||
Diamond Resorts International, Inc. (b) | 300 | 10,029 | ||||||||
DineEquity, Inc. (a) | 3,200 | 342,432 | ||||||||
Domino’s Pizza, Inc. (a) | 21,300 | 2,141,715 | ||||||||
Dunkin’ Brands Group, Inc. | 1,300 | 61,828 | ||||||||
Hyatt Hotels Corp. Class A (a),(b) | 22,700 | 1,344,294 | ||||||||
Isle of Capri Casinos, Inc. (a),(b) | 10,600 | 148,930 | ||||||||
Jack in the Box, Inc. | 1,200 | 115,104 | ||||||||
La Quinta Holdings, Inc. (b) | 6,500 | 153,920 | ||||||||
Marriott International, Inc. Class A (a) | 12,400 | 995,968 | ||||||||
Monarch Casino & Resort, Inc. (b) | 1,400 | 26,796 | ||||||||
Morgans Hotel Group Co. (a),(b) | 4,200 | 32,550 | ||||||||
Papa Murphy’s Holdings, Inc. (b) | 1,900 | 34,466 | ||||||||
Penn National Gaming, Inc. (a),(b) | 58,900 | 922,374 | ||||||||
Popeyes Louisiana Kitchen, Inc. (b) | 2,000 | 119,640 | ||||||||
Potbelly Corp. (b) | 1,300 | 17,810 | ||||||||
Red Robin Gourmet Burgers, Inc. (b) | 1,100 | 95,700 | ||||||||
Ruby Tuesday, Inc. (b) | 300 | 1,803 | ||||||||
Ruth’s Hospitality Group, Inc. (a) | 1,600 | 25,408 | ||||||||
|
| |||||||||
| 12,606,576 | ||||||||||
|
| |||||||||
Hardware — 1.2% | ||||||||||
Apple, Inc. (a),(d) | 85,544 | 10,644,240 | ||||||||
Clearfield, Inc. (b) | 600 | 8,892 | ||||||||
CommScope Holding Co., Inc. (a),(b) | 16,700 | 476,618 | ||||||||
Comtech Telecommunications Corp. (a) | 3,100 | 89,745 | ||||||||
Corning, Inc. | 8,000 | 181,440 | ||||||||
Cray, Inc. (b) | 500 | 14,040 | ||||||||
Daktronics, Inc. (a) | 1,100 | 11,891 | ||||||||
Datalink Corp. (b) | 1,300 | 15,652 | ||||||||
Dolby Laboratories, Inc. Class A (a) | 2,700 | 103,032 | ||||||||
Dot Hill Systems Corp. (b) | 1,100 | 5,830 | ||||||||
DTS, Inc. (b) | 800 | 27,256 | ||||||||
Eastman Kodak Co. (b) | 100 | 1,899 | ||||||||
Electronics For Imaging, Inc. (b) | 200 | 8,350 | ||||||||
FLIR Systems, Inc. | 100 | 3,128 | ||||||||
Harmonic, Inc. (b) | 1,100 | 8,151 | ||||||||
Harris Corp. (a) | 19,964 | 1,572,365 | ||||||||
Hutchinson Technology, Inc. (b) | 5,500 | 14,685 | ||||||||
Imation Corp. (b) | 1,800 | 7,254 | ||||||||
Immersion Corp. (b) | 100 | 918 | ||||||||
Ixia (b) | 100 | 1,213 | ||||||||
See Notes to Consolidated Financial Statements.
33
Blackstone Alternative Multi-Manager Fund and Subsidiaries
Consolidated Schedule of Investments (Continued)
March 31, 2015
Security Description | Shares | Value | ||||||||
JDS Uniphase Corp. (b) | 900 | $ | 11,808 | |||||||
Knowles Corp. (b) | 6,200 | 119,474 | ||||||||
KVH Industries, Inc. (b) | 600 | 9,072 | ||||||||
Mercury Systems, Inc. (a),(b) | 8,200 | 127,510 | ||||||||
NetApp, Inc. | 500 | 17,730 | ||||||||
Novatel Wireless, Inc. (b) | 500 | 2,410 | ||||||||
QLogic Corp. (a),(b) | 10,900 | 160,666 | ||||||||
Quantum Corp. (b) | 200 | 320 | ||||||||
Rovi Corp. (b) | 1,600 | 29,136 | ||||||||
Sanmina Corp. (a),(b) | 3,200 | 77,408 | ||||||||
ShoreTel, Inc. (a),(b) | 3,900 | 26,598 | ||||||||
Skullcandy, Inc. (a),(b) | 2,200 | 24,860 | ||||||||
Super Micro Computer, Inc. (b) | 1,000 | 33,210 | ||||||||
Telenav, Inc. (a),(b) | 1,400 | 11,088 | ||||||||
TTM Technologies, Inc. (b) | 2,300 | 20,723 | ||||||||
ViaSat, Inc. (a),(b) | 3,300 | 196,713 | ||||||||
Vicor Corp. (b) | 700 | 10,640 | ||||||||
Vishay Precision Group, Inc. (b) | 2,200 | 35,046 | ||||||||
VOXX International Corp. (a),(b) | 1,700 | 15,572 | ||||||||
Western Digital Corp. (a),(d) | 17,044 | 1,551,174 | ||||||||
|
| |||||||||
| 15,677,757 | ||||||||||
|
| |||||||||
Health Care Facilities/Services — 1.9% | ||||||||||
Addus HomeCare Corp. (b) | 300 | 6,906 | ||||||||
Aetna, Inc. (a),(d) | 54,000 | 5,752,620 | ||||||||
Alliance HealthCare Services, Inc. (b) | 1,200 | 26,616 | ||||||||
Almost Family, Inc. (b) | 1,100 | 49,181 | ||||||||
Amedisys, Inc. (a),(b) | 2,400 | 64,272 | ||||||||
Brookdale Senior Living, Inc. (a),(b),(c),(d) | 123,500 | 4,663,360 | ||||||||
Capital Senior Living Corp. (b) | 1,000 | 25,940 | ||||||||
Cigna Corp. (d) | 11,900 | 1,540,336 | ||||||||
Digirad Corp. (a) | 2,200 | 9,988 | ||||||||
Envision Healthcare Holdings, Inc. (b) | 2,800 | 107,380 | ||||||||
Five Star Quality Care, Inc. (a),(b) | 4,300 | 19,092 | ||||||||
Genesis Healthcare, Inc. (b) | 4,300 | 30,616 | ||||||||
HCA Holdings, Inc. (a),(b) | 36,739 | 2,763,875 | ||||||||
Health Net, Inc. (a),(b) | 900 | 54,441 | ||||||||
Healthways, Inc. (b) | 3,800 | 74,860 | ||||||||
IPC The Hospitalist Co., Inc. (b) | 1,000 | 46,640 | ||||||||
Kindred Healthcare, Inc. | 3 | 71 | ||||||||
Laboratory Corp. of America Holdings (a),(b),(c),(d) | 43,700 | 5,510,133 | ||||||||
LHC Group, Inc. (b) | 100 | 3,303 | ||||||||
Molina Healthcare, Inc. (b) | 1,100 | 74,019 | ||||||||
Omnicare, Inc. (c) | 2,390 | 184,174 | ||||||||
Quintiles Transnational Holdings, Inc. (b),(d) | 13,333 | 892,911 | ||||||||
RadNet, Inc. (a),(b) | 7,300 | 61,320 | ||||||||
See Notes to Consolidated Financial Statements.
34
Blackstone Alternative Multi-Manager Fund and Subsidiaries
Consolidated Schedule of Investments (Continued)
March 31, 2015
Security Description | Shares | Value | ||||||||
Select Medical Holdings Corp. (a) | 4,500 | $ | 66,735 | |||||||
UnitedHealth Group, Inc. (a),(d) | 22,000 | 2,602,380 | ||||||||
Universal American Corp. (a),(b) | 1,100 | 11,748 | ||||||||
US Physical Therapy, Inc. | 200 | 9,500 | ||||||||
|
| |||||||||
| 24,652,417 | ||||||||||
|
| |||||||||
Home & Office Products — 0.0% | ||||||||||
American Woodmark Corp. (a),(b) | 3,700 | 202,501 | ||||||||
Century Communities, Inc. (b) | 800 | 15,464 | ||||||||
Griffon Corp. | 100 | 1,743 | ||||||||
Herman Miller, Inc. | 200 | 5,552 | ||||||||
Hooker Furniture Corp. | 500 | 9,525 | ||||||||
Interface, Inc. | 500 | 10,390 | ||||||||
Kimball International, Inc. Class B (a) | 4,300 | 45,064 | ||||||||
Libbey, Inc. (a) | 3,700 | 147,667 | ||||||||
PGT, Inc. (b) | 1,600 | 17,880 | ||||||||
WCI Communities, Inc. (b) | 100 | 2,395 | ||||||||
|
| |||||||||
| 458,181 | ||||||||||
|
| |||||||||
Industrial Services — 0.3% | ||||||||||
Electro Rent Corp. | 500 | 5,670 | ||||||||
Furmanite Corp. (a),(b) | 3,100 | 24,459 | ||||||||
H&E Equipment Services, Inc. (a) | 100 | 2,499 | ||||||||
HD Supply Holdings, Inc. (a),(b) | 103,996 | 3,239,995 | ||||||||
WW Grainger, Inc. | 837 | 197,373 | ||||||||
|
| |||||||||
| 3,469,996 | ||||||||||
|
| |||||||||
Institutional Financial Service — 0.1% | ||||||||||
Cowen Group, Inc. Class A (b) | 10,900 | 56,680 | ||||||||
Gain Capital Holdings, Inc. | 1,300 | 12,701 | ||||||||
INTL. FCStone, Inc. (b) | 5,900 | 175,407 | ||||||||
Investment Technology Group, Inc. (b) | 3,100 | 93,961 | ||||||||
Lazard Ltd. Class A | 6,900 | 362,871 | ||||||||
Moelis & Co. Class A | 3,700 | 111,444 | ||||||||
|
| |||||||||
| 813,064 | ||||||||||
|
| |||||||||
Insurance — 2.2% | ||||||||||
American International Group, Inc. | 263,290 | 14,425,659 | ||||||||
AMERISAFE, Inc. | 200 | 9,250 | ||||||||
AmTrust Financial Services, Inc. | 30 | 1,710 | ||||||||
Assured Guaranty Ltd. | 98,192 | 2,591,287 | ||||||||
Axis Capital Holdings Ltd. | 37,500 | 1,934,250 | ||||||||
Crawford & Co. Class B | 200 | 1,728 | ||||||||
Employers Holdings, Inc. | 7,400 | 199,726 | ||||||||
FBL Financial Group, Inc. Class A (a) | 1,200 | 74,412 | ||||||||
Fidelity & Guaranty Life | 700 | 14,840 | ||||||||
See Notes to Consolidated Financial Statements.
35
Blackstone Alternative Multi-Manager Fund and Subsidiaries
Consolidated Schedule of Investments (Continued)
March 31, 2015
Security Description | Shares | Value | ||||||||
Genworth Financial, Inc. Class A (a),(b) | 31,600 | $ | 230,996 | |||||||
Greenlight Capital Re Ltd. A Shares (b) | 300 | 9,540 | ||||||||
Hartford Financial Services Group, Inc. | 26,794 | 1,120,525 | ||||||||
Heritage Insurance Holdings, Inc. (b) | 5,300 | 116,653 | ||||||||
Lincoln National Corp. | 200 | 11,492 | ||||||||
Maiden Holdings Ltd. | 1,900 | 28,177 | ||||||||
National General Holdings Corp. | 100 | 1,870 | ||||||||
OneBeacon Insurance Group Ltd. Class A | 700 | 10,647 | ||||||||
PartnerRe Ltd. | 26,100 | 2,984,013 | ||||||||
Principal Financial Group, Inc. (a) | 23,121 | 1,187,726 | ||||||||
Prudential Financial, Inc. (a) | 7,417 | 595,659 | ||||||||
Selective Insurance Group, Inc. | 1,500 | 43,575 | ||||||||
State Auto Financial Corp. | 664 | 16,129 | ||||||||
Third Point Reinsurance Ltd. (b) | 7,200 | 101,880 | ||||||||
United Fire Group, Inc. | 100 | 3,177 | ||||||||
Universal Insurance Holdings, Inc. | 3,600 | 92,124 | ||||||||
Unum Group | 5,547 | 187,100 | ||||||||
Voya Financial, Inc. (a) | 69,700 | 3,004,767 | ||||||||
|
| |||||||||
| 28,998,912 | ||||||||||
|
| |||||||||
Iron & Steel — 0.0% | ||||||||||
Carpenter Technology Corp. | 300 | 11,664 | ||||||||
Northwest Pipe Co. (b) | 100 | 2,295 | ||||||||
Shiloh Industries, Inc. (b) | 800 | 11,232 | ||||||||
Steel Dynamics, Inc. (a) | 14,900 | 299,490 | ||||||||
Worthington Industries, Inc. | 100 | 2,661 | ||||||||
|
| |||||||||
| 327,342 | ||||||||||
|
| |||||||||
Leisure Products — 0.0% | ||||||||||
Arctic Cat, Inc. | 200 | 7,264 | ||||||||
Black Diamond, Inc. (b) | 1,200 | 11,340 | ||||||||
Fox Factory Holding Corp. (b) | 600 | 9,204 | ||||||||
JAKKS Pacific, Inc. (b) | 500 | 3,420 | ||||||||
Johnson Outdoors, Inc. Class A | 100 | 3,311 | ||||||||
Nautilus, Inc. (b) | 1,000 | 15,270 | ||||||||
Vista Outdoor, Inc. (b) | 1,722 | 73,736 | ||||||||
|
| |||||||||
| 123,545 | ||||||||||
|
| |||||||||
Machinery — 0.1% | ||||||||||
Alamo Group, Inc. | 300 | 18,939 | ||||||||
Altra Industrial Motion Corp. | 700 | 19,348 | ||||||||
China Yuchai International Ltd. | 2,800 | 55,272 | ||||||||
CIRCOR International, Inc. | 2,100 | 114,870 | ||||||||
Crane Co. | 100 | 6,241 | ||||||||
Curtiss-Wright Corp. | 300 | 22,182 | ||||||||
Federal Signal Corp. | 100 | 1,579 | ||||||||
See Notes to Consolidated Financial Statements.
36
Blackstone Alternative Multi-Manager Fund and Subsidiaries
Consolidated Schedule of Investments (Continued)
March 31, 2015
Security Description | Shares | Value | ||||||||
Flowserve Corp. (a) | 4,800 | $ | 271,152 | |||||||
Graham Corp. | 100 | 2,397 | ||||||||
Hyster-Yale Materials Handling, Inc. | 300 | 21,987 | ||||||||
Intevac, Inc. (b) | 700 | 4,298 | ||||||||
ITT Corp. | 1,900 | 75,829 | ||||||||
Joy Global, Inc. (a) | 6,600 | 258,588 | ||||||||
Kadant, Inc. | 300 | 15,783 | ||||||||
MTS Systems Corp. | 100 | 7,565 | ||||||||
Parker-Hannifin Corp. | 200 | 23,756 | ||||||||
Rofin-Sinar Technologies, Inc. (a),(b) | 4,100 | 99,343 | ||||||||
Terex Corp. (a) | 9,500 | 252,605 | ||||||||
Titan International, Inc. | 4,200 | 39,312 | ||||||||
Toro Co. (a) | 4,500 | 315,540 | ||||||||
Xerium Technologies, Inc. (b) | 1,000 | 16,220 | ||||||||
|
| |||||||||
| 1,642,806 | ||||||||||
|
| |||||||||
Manufactured Goods — 0.0% | ||||||||||
Aegion Corp. (a),(b) | 2,700 | 48,735 | ||||||||
Ampco-Pittsburgh Corp. (a) | 1,500 | 26,190 | ||||||||
Barnes Group, Inc. | 300 | 12,147 | ||||||||
Chart Industries, Inc. (a),(b) | 8,700 | 305,152 | ||||||||
Dynamic Materials Corp. (a) | 900 | 11,493 | ||||||||
Gibraltar Industries, Inc. (b) | 600 | 9,846 | ||||||||
Insteel Industries, Inc. | 300 | 6,489 | ||||||||
Rogers Corp. (b) | 600 | 49,326 | ||||||||
RTI International Metals, Inc. (b) | 300 | 10,773 | ||||||||
Timken Co. (a) | 4,000 | 168,560 | ||||||||
|
| |||||||||
| 648,711 | ||||||||||
|
| |||||||||
Media — 3.1% | ||||||||||
AOL, Inc. (b) | 100 | 3,961 | ||||||||
Autobytel, Inc. (b) | 1,000 | 14,770 | ||||||||
Bankrate, Inc. (b) | 1,300 | 14,742 | ||||||||
Blucora, Inc. (b) | 1,000 | 13,660 | ||||||||
Boingo Wireless, Inc. (a),(b) | 5,100 | 38,454 | ||||||||
Clear Channel Outdoor Holdings, Inc. Class A (a) | 8,000 | 80,960 | ||||||||
Comcast Corp. Class A (c) | 153,134 | 8,647,477 | ||||||||
Dice Holdings, Inc. (a),(b) | 11,500 | 102,580 | ||||||||
DISH Network Corp. Class A (a),(b) | 40,500 | 2,837,430 | ||||||||
EchoStar Corp. Class A (b) | 1,400 | 72,408 | ||||||||
Entercom Communications Corp. Class A (b) | 200 | 2,430 | ||||||||
Eros International PLC (b) | 700 | 12,229 | ||||||||
EW Scripps Co. Class A (b) | 800 | 22,752 | ||||||||
Facebook, Inc. Class A (b),(c),(d) | 99,170 | 8,153,262 | ||||||||
Google, Inc. Class A (b),(d) | 1,761 | 976,827 | ||||||||
Google, Inc. Class C (b) | 1,061 | 581,428 | ||||||||
See Notes to Consolidated Financial Statements.
37
Blackstone Alternative Multi-Manager Fund and Subsidiaries
Consolidated Schedule of Investments (Continued)
March 31, 2015
Security Description | Shares | Value | ||||||||
Gray Television, Inc. (b) | 2,700 | $ | 37,314 | |||||||
Harte-Hanks, Inc. (a) | 4,400 | 34,320 | ||||||||
HealthStream, Inc. (b) | 200 | 5,040 | ||||||||
Houghton Mifflin Harcourt Co. (b) | 10,700 | 251,236 | ||||||||
IAC/InterActiveCorp | 2,300 | 155,181 | ||||||||
Interpublic Group of Cos., Inc. (a) | 9,100 | 201,292 | ||||||||
Journal Communications, Inc. Class A (a),(b) | 8,200 | 121,524 | ||||||||
Liberty TripAdvisor Holdings, Inc. Class A (b) | 1,200 | 38,148 | ||||||||
Martha Stewart Living Omnimedia, Inc. Class A (b) | 100 | 650 | ||||||||
McClatchy Co. Class A (b) | 1,300 | 2,392 | ||||||||
MDC Partners, Inc. Class A | 750 | 21,262 | ||||||||
Monster Worldwide, Inc. (b) | 2,500 | 15,850 | ||||||||
National CineMedia, Inc. (a) | 8,500 | 128,350 | ||||||||
News Corp. Class A (a),(b) | 55,400 | 886,954 | ||||||||
Nexstar Broadcasting Group, Inc. Class A (a) | 10,900 | 623,698 | ||||||||
QuinStreet, Inc. (b) | 300 | 1,785 | ||||||||
RealD, Inc. (b) | 400 | 5,116 | ||||||||
RetailMeNot, Inc. (b) | 400 | 7,204 | ||||||||
Starz (a),(b) | 13,001 | 447,364 | ||||||||
TechTarget, Inc. (a),(b) | 4,500 | 51,885 | ||||||||
Time Warner Cable, Inc. (a) | 20,700 | 3,102,516 | ||||||||
Twenty-First Century Fox, Inc. Class A (a),(c) | 260,544 | 8,816,809 | ||||||||
Twitter, Inc. (b),(d) | 11,008 | 551,281 | ||||||||
VeriSign, Inc. (a),(b) | 4,200 | 281,274 | ||||||||
Walt Disney Co. (a),(c) | 20,759 | 2,177,411 | ||||||||
XO Group, Inc. (b) | 3,300 | 58,311 | ||||||||
Yahoo!, Inc. (a),(b) | 36,400 | 1,617,434 | ||||||||
|
| |||||||||
| 41,216,971 | ||||||||||
|
| |||||||||
Medical Equipment/Devices — 2.3% | ||||||||||
ABIOMED, Inc. (b) | 700 | 50,106 | ||||||||
Accuray, Inc. (b) | 800 | 7,440 | ||||||||
Affymetrix, Inc. (b) | 24,200 | 303,952 | ||||||||
Agilent Technologies, Inc. (a),(d) | 114,900 | 4,774,095 | ||||||||
Alere, Inc. (b) | 2,600 | 127,140 | ||||||||
AngioDynamics, Inc. (a),(b) | 6,400 | 113,856 | ||||||||
Bio-Rad Laboratories, Inc. Class A (b) | 300 | 40,554 | ||||||||
Boston Scientific Corp. (a),(b),(d) | 318,200 | 5,648,050 | ||||||||
Bruker Corp. (b) | 1,100 | 20,317 | ||||||||
CONMED Corp. (a) | 300 | 15,147 | ||||||||
CR Bard, Inc. (d) | 14,600 | 2,443,310 | ||||||||
CryoLife, Inc. | 3,600 | 37,332 | ||||||||
Cutera, Inc. (b) | 600 | 7,752 | ||||||||
Cyberonics, Inc. (a),(b) | 5,000 | 324,600 | ||||||||
Danaher Corp. (a),(d) | 34,700 | 2,946,030 | ||||||||
Edwards Lifesciences Corp. (b),(c),(d) | 15,400 | 2,193,884 | ||||||||
See Notes to Consolidated Financial Statements.
38
Blackstone Alternative Multi-Manager Fund and Subsidiaries
Consolidated Schedule of Investments (Continued)
March 31, 2015
Security Description | Shares | Value | ||||||||
Exactech, Inc. (b) | 1,100 | $ | 28,193 | |||||||
GenMark Diagnostics, Inc. (b) | 1,700 | 22,066 | ||||||||
Genomic Health, Inc. (b) | 500 | 15,275 | ||||||||
Harvard Bioscience, Inc. (b) | 600 | 3,492 | ||||||||
HeartWare International, Inc. (b) | 100 | 8,777 | ||||||||
ICU Medical, Inc. (a),(b) | 2,400 | 223,536 | ||||||||
Illumina, Inc. (a),(b),(d) | 19,900 | 3,694,236 | ||||||||
Inogen, Inc. (b) | 2,600 | 83,174 | ||||||||
Luminex Corp. (a),(b) | 3,500 | 56,000 | ||||||||
Masimo Corp. (a),(b) | 1,000 | 32,980 | ||||||||
Meridian Bioscience, Inc. | 1,000 | 19,080 | ||||||||
Merit Medical Systems, Inc. (b) | 1,000 | 19,250 | ||||||||
Nanosphere, Inc. (b) | 800 | 186 | ||||||||
NxStage Medical, Inc. (b) | 2,600 | 44,980 | ||||||||
OraSure Technologies, Inc. (b) | 2,300 | 15,042 | ||||||||
Orthofix International NV (b) | 1,700 | 61,013 | ||||||||
Quidel Corp. (b) | 800 | 21,584 | ||||||||
RTI Surgical, Inc. (a),(b) | 1,800 | 8,892 | ||||||||
Sequenom, Inc. (b) | 4,600 | 18,170 | ||||||||
SurModics, Inc. (b) | 800 | 20,824 | ||||||||
Thermo Fisher Scientific, Inc. (a),(c),(d) | 36,300 | 4,876,542 | ||||||||
Tornier NV (b) | 16,300 | 427,386 | ||||||||
Vascular Solutions, Inc. (b) | 800 | 24,256 | ||||||||
Wright Medical Group, Inc. (a),(b) | 45,700 | 1,179,060 | ||||||||
Zeltiq Aesthetics, Inc. (b) | 2,600 | 80,158 | ||||||||
|
| |||||||||
| 30,037,717 | ||||||||||
|
| |||||||||
Metals & Mining — 0.0% | ||||||||||
Encore Wire Corp. | 1,600 | 60,608 | ||||||||
Newmont Mining Corp. | 500 | 10,855 | ||||||||
Stillwater Mining Co. (b) | 1,600 | 20,672 | ||||||||
|
| |||||||||
| 92,135 | ||||||||||
|
| |||||||||
Oil, Gas & Coal — 2.5% | ||||||||||
Anadarko Petroleum Corp. | 794 | 65,751 | ||||||||
Baker Hughes, Inc. (a) | 187,706 | 11,934,348 | ||||||||
California Resources Corp. | 67,000 | 509,870 | ||||||||
Cameron International Corp. (a),(b) | 45,500 | 2,052,960 | ||||||||
Carrizo Oil & Gas, Inc. (b) | 200 | 9,930 | ||||||||
Cheniere Energy, Inc. (a),(b) | 16,100 | 1,246,140 | ||||||||
Cloud Peak Energy, Inc. (a),(b) | 9,900 | 57,618 | ||||||||
Dawson Geophysical Co. (b) | 4,576 | 19,540 | ||||||||
Delek US Holdings, Inc. (a) | 12,900 | 512,775 | ||||||||
Diamond Offshore Drilling, Inc. | 900 | 24,111 | ||||||||
Dresser-Rand Group, Inc. (b),(c) | 16,388 | 1,316,776 | ||||||||
Dril-Quip, Inc. (a),(b) | 4,300 | 294,077 | ||||||||
See Notes to Consolidated Financial Statements.
39
Blackstone Alternative Multi-Manager Fund and Subsidiaries
Consolidated Schedule of Investments (Continued)
March 31, 2015
Security Description | Shares | Value | ||||||||
Energy Transfer Equity LP | 1,909 | $ | 120,954 | |||||||
Ensco PLC Class A | 28,600 | 602,602 | ||||||||
EOG Resources, Inc. | 1,592 | 145,970 | ||||||||
Evolution Petroleum Corp. (a) | 500 | 2,975 | ||||||||
FMC Technologies, Inc. (a),(b) | 19,200 | 710,592 | ||||||||
Frank’s International NV | 1,300 | 24,310 | ||||||||
Gulf Island Fabrication, Inc. | 300 | 4,458 | ||||||||
Gulfport Energy Corp. (a),(b) | 11,000 | 505,010 | ||||||||
Hallador Energy Co. | 300 | 3,507 | ||||||||
Halliburton Co. (a) | 72,800 | 3,194,464 | ||||||||
Helix Energy Solutions Group, Inc. (b) | 7,900 | 118,184 | ||||||||
Hess Corp. | 700 | 47,509 | ||||||||
Marathon Petroleum Corp. (a) | 18,900 | 1,935,171 | ||||||||
Matrix Service Co. (b) | 3,500 | 61,460 | ||||||||
McDermott International, Inc. (b) | 7,200 | 27,648 | ||||||||
Mitcham Industries, Inc. (b) | 600 | 2,760 | ||||||||
MRC Global, Inc. (a),(b) | 24,600 | 291,510 | ||||||||
Murphy Oil Corp. | 700 | 32,620 | ||||||||
Nabors Industries Ltd. | 30,700 | 419,055 | ||||||||
National Oilwell Varco, Inc. (a) | 6,900 | 344,931 | ||||||||
Natural Gas Services Group, Inc. (b) | 300 | 5,766 | ||||||||
Newfield Exploration Co. (a),(b) | 33,300 | 1,168,497 | ||||||||
Newpark Resources, Inc. (b) | 500 | 4,555 | ||||||||
Noble Corp. PLC | 400 | 5,712 | ||||||||
NOW, Inc. (b) | 400 | 8,656 | ||||||||
Oceaneering International, Inc. (a) | 5,300 | 285,829 | ||||||||
Oil States International, Inc. (b) | 8,600 | 342,022 | ||||||||
PDC Energy, Inc. (b) | 100 | 5,404 | ||||||||
Penn Virginia Corp. (b) | 10,400 | 67,392 | ||||||||
Phillips 66 | 437 | 34,348 | ||||||||
Pioneer Natural Resources Co. | 159 | 25,998 | ||||||||
QEP Resources, Inc. | 3,300 | 68,805 | ||||||||
Southwestern Energy Co. (a),(b) | 76,000 | 1,762,440 | ||||||||
Superior Energy Services, Inc. | 6,000 | 134,040 | ||||||||
Targa Resources Corp. (a) | 300 | 28,737 | ||||||||
Tesco Corp. (a) | 3,900 | 44,343 | ||||||||
Tidewater, Inc. | 100 | 1,914 | ||||||||
Unit Corp. (a),(b) | 1,600 | 44,768 | ||||||||
Valero Energy Corp. (a) | 29,700 | 1,889,514 | ||||||||
Warren Resources, Inc. (a),(b) | 16,100 | 14,329 | ||||||||
Weatherford International PLC (b) | 10,500 | 129,150 | ||||||||
Western Refining, Inc. | 900 | 44,451 | ||||||||
Whiting Petroleum Corp. (b) | 49 | 1,514 | ||||||||
|
| |||||||||
| 32,757,770 | ||||||||||
|
| |||||||||
See Notes to Consolidated Financial Statements.
40
Blackstone Alternative Multi-Manager Fund and Subsidiaries
Consolidated Schedule of Investments (Continued)
March 31, 2015
Security Description | Shares | Value | ||||||||
Passenger Transportation — 0.1% | ||||||||||
Hawaiian Holdings, Inc. (a),(b) | 13,900 | $ | 306,147 | |||||||
Spirit Airlines, Inc. (a),(b) | 7,038 | 544,460 | ||||||||
|
| |||||||||
| 850,607 | ||||||||||
|
| |||||||||
Real Estate — 2.1% | ||||||||||
Agree Realty Corp. | 2,600 | 85,722 | ||||||||
American Realty Capital Properties, Inc. (a) | 207,567 | 2,044,535 | ||||||||
American Residential Properties, Inc. (a),(b) | 500 | 8,995 | ||||||||
American Tower Corp. (a),(d) | 20,070 | 1,889,591 | ||||||||
Armada Hoffler Properties, Inc. (a) | 7,000 | 74,620 | ||||||||
Ashford Hospitality Prime, Inc. | 600 | 10,062 | ||||||||
Ashford Hospitality Trust, Inc. (a) | 145,784 | 1,402,442 | ||||||||
Aviv REIT, Inc. | 5,300 | 193,450 | ||||||||
Brixmor Property Group, Inc. (a) | 2,700 | 71,685 | ||||||||
CBL & Associates Properties, Inc. | 100 | 1,980 | ||||||||
CBRE Group, Inc. (a),(b) | 21,100 | 816,781 | ||||||||
Cedar Realty Trust, Inc. | 1,200 | 8,988 | ||||||||
Columbia Property Trust, Inc. | 4,800 | 129,696 | ||||||||
Crown Castle International Corp. (a),(d) | 14,803 | 1,221,840 | ||||||||
FelCor Lodging Trust, Inc. (a) | 26,400 | 303,336 | ||||||||
Forest City Enterprises, Inc. Class A (a),(b) | 89,704 | 2,289,246 | ||||||||
Getty Realty Corp. | 100 | 1,820 | ||||||||
Gladstone Commercial Corp. (a) | 7,200 | 133,992 | ||||||||
iStar Financial, Inc. (b) | 200 | 2,600 | ||||||||
Kennedy-Wilson Holdings, Inc. (a) | 35,597 | 930,506 | ||||||||
Lamar Advertising Co. Class A (a),(c) | 187,723 | 11,126,342 | ||||||||
Mid-America Apartment Communities, Inc. | 24 | 1,854 | ||||||||
Monmouth Real Estate Investment Corp. Class A | 1,400 | 15,554 | ||||||||
New York REIT, Inc. (a) | 188,211 | 1,972,451 | ||||||||
Parkway Properties Inc/Md | 38 | 659 | ||||||||
Potlatch Corp. | 400 | 16,016 | ||||||||
QTS Realty Trust, Inc. Class A | 900 | 32,769 | ||||||||
Realogy Holdings Corp. (a),(b),(c) | 77,843 | 3,540,300 | ||||||||
Rouse Properties, Inc. | 1,300 | 24,648 | ||||||||
Silver Bay Realty Trust Corp. | 2,000 | 32,320 | ||||||||
Strategic Hotels & Resorts, Inc. (b) | 44 | 547 | ||||||||
Taubman Centers, Inc. | 300 | 23,139 | ||||||||
Urstadt Biddle Properties, Inc. Class A | 1,100 | 25,366 | ||||||||
Winthrop Realty Trust | 1,500 | 24,480 | ||||||||
|
| |||||||||
| 28,458,332 | ||||||||||
|
| |||||||||
Recreation Facilities & Services — 0.0% |
| |||||||||
Carmike Cinemas, Inc. (a),(b) | 2,000 | 67,200 | ||||||||
ClubCorp Holdings, Inc. | 4,000 | 77,440 | ||||||||
International Speedway Corp. Class A | 100 | 3,261 | ||||||||
See Notes to Consolidated Financial Statements.
41
Blackstone Alternative Multi-Manager Fund and Subsidiaries
Consolidated Schedule of Investments (Continued)
March 31, 2015
Security Description | Shares | Value | ||||||||
Marcus Corp. | 500 | $ | 10,645 | |||||||
RCI Hospitality Holdings, Inc. (b) | 100 | 1,041 | ||||||||
Regal Entertainment Group Class A (a) | 2,800 | 63,952 | ||||||||
Speedway Motorsports, Inc. | 1,800 | 40,950 | ||||||||
Town Sports International Holdings, Inc. (a) | 3,700 | 25,197 | ||||||||
Vail Resorts, Inc. | 700 | 72,394 | ||||||||
|
| |||||||||
| 362,080 | ||||||||||
|
| |||||||||
Renewable Energy — 0.2% |
| |||||||||
Ameresco, Inc. Class A (b) | 100 | 740 | ||||||||
Broadwind Energy, Inc. (b) | 1,000 | 5,000 | ||||||||
First Solar, Inc. (a),(b) | 19,100 | 1,141,989 | ||||||||
Renewable Energy Group, Inc. (b) | 1,900 | 17,518 | ||||||||
REX American Resources Corp. (a),(b) | 2,400 | 145,944 | ||||||||
SunEdison, Inc. (a),(b),(d) | 43,454 | 1,042,896 | ||||||||
|
| |||||||||
| 2,354,087 | ||||||||||
|
| |||||||||
Retail—Consumer Staples — 0.9% |
| |||||||||
CVS Health Corp. (d) | 29,881 | 3,084,018 | ||||||||
Dollar General Corp. (a),(b) | 17,701 | 1,334,301 | ||||||||
Dollar Tree, Inc. (b) | 600 | 48,687 | ||||||||
Ingles Markets, Inc. Class A | 200 | 9,896 | ||||||||
Rite Aid Corp. (a),(b),(d) | 727,900 | 6,325,451 | ||||||||
SUPERVALU, Inc. (a),(b) | 64,500 | 750,135 | ||||||||
TravelCenters of America LLC (a),(b) | 13,000 | 226,720 | ||||||||
|
| |||||||||
| 11,779,208 | ||||||||||
|
| |||||||||
Retail Discretionary — 0.8% |
| |||||||||
1-800-Flowers.com, Inc. Class A (a),(b) | 9,500 | 112,385 | ||||||||
Asbury Automotive Group, Inc. (a),(b) | 3,000 | 249,300 | ||||||||
Ascena Retail Group, Inc. (a),(b) | 8,700 | 126,237 | ||||||||
AutoNation, Inc. (b) | 100 | 6,433 | ||||||||
Beacon Roofing Supply, Inc. (b) | 3,300 | 103,290 | ||||||||
Big 5 Sporting Goods Corp. (a) | 8,000 | 106,160 | ||||||||
Boise Cascade Co. (b) | 200 | 7,492 | ||||||||
Brown Shoe Co., Inc. | 1,900 | 62,320 | ||||||||
Burlington Stores, Inc. (a),(b) | 35,600 | 2,115,352 | ||||||||
Chegg, Inc. (b) | 100 | 795 | ||||||||
Chico’s FAS, Inc. | 5,300 | 93,757 | ||||||||
Citi Trends, Inc. (a),(b) | 4,900 | 132,300 | ||||||||
eBay, Inc. (b) | 1,142 | 65,871 | ||||||||
EVINE Live, Inc. (b) | 1,100 | 7,381 | ||||||||
Express, Inc. (b) | 15,500 | 256,215 | ||||||||
First Cash Financial Services, Inc. (b) | 100 | 4,652 | ||||||||
Foot Locker, Inc. | 2,400 | 151,200 | ||||||||
GNC Holdings, Inc. Class A | 3,510 | 172,236 | ||||||||
See Notes to Consolidated Financial Statements.
42
Blackstone Alternative Multi-Manager Fund and Subsidiaries
Consolidated Schedule of Investments (Continued)
March 31, 2015
Security Description | Shares | Value | ||||||||
Guess?, Inc. | 100 | $ | 1,859 | |||||||
Haverty Furniture Cos., Inc. | 100 | 2,488 | ||||||||
Hibbett Sports, Inc. (b) | 1,200 | 58,872 | ||||||||
JC Penney Co., Inc. (b) | 6,100 | 51,301 | ||||||||
Kirkland’s, Inc. (b) | 1,100 | 26,125 | ||||||||
L Brands, Inc. (a) | 34,700 | 3,271,863 | ||||||||
Liberty Interactive Corp. Class A (a),(b) | 12,300 | 359,037 | ||||||||
Liquidity Services, Inc. (b) | 500 | 4,940 | ||||||||
Lowe’s Cos., Inc. | 2,138 | 159,046 | ||||||||
MarineMax, Inc. (a),(b) | 3,100 | 82,181 | ||||||||
Michaels Cos., Inc. (b) | 300 | 8,118 | ||||||||
New York & Co., Inc. (b) | 300 | 750 | ||||||||
Overstock.com, Inc. (b) | 4,700 | 113,834 | ||||||||
Pep Boys-Manny Moe & Jack (b) | 900 | 8,658 | ||||||||
PetMed Express, Inc. | 1,900 | 31,388 | ||||||||
Sally Beauty Holdings, Inc. (b) | 1,300 | 44,681 | ||||||||
Shoe Carnival, Inc. | 1,200 | 35,328 | ||||||||
Staples, Inc. (a) | 35,500 | 578,117 | ||||||||
Stein Mart, Inc. | 9,100 | 113,295 | ||||||||
Tiffany & Co. (a) | 3,600 | 316,836 | ||||||||
Tilly’s, Inc. Class A (b) | 2,200 | 34,430 | ||||||||
Ulta Salon Cosmetics & Fragrance, Inc. (a),(b) | 11,000 | 1,659,350 | ||||||||
United Online, Inc. (a) | 3,342 | 53,238 | ||||||||
Urban Outfitters, Inc. (b) | 1,000 | 45,650 | ||||||||
Williams-Sonoma, Inc. (a) | 1,958 | 156,072 | ||||||||
|
| |||||||||
| 10,990,833 | ||||||||||
|
| |||||||||
Semiconductors — 0.5% |
| |||||||||
Alpha & Omega Semiconductor Ltd. (b) | 1,900 | 16,929 | ||||||||
Amkor Technology, Inc. (b) | 11,600 | 102,486 | ||||||||
Axcelis Technologies, Inc. (a),(b) | 2,500 | 5,950 | ||||||||
Cabot Microelectronics Corp. (b) | 1,000 | 49,970 | ||||||||
Cascade Microtech, Inc. (b) | 600 | 8,148 | ||||||||
CEVA, Inc. (b) | 700 | 14,924 | ||||||||
Coherent, Inc. (b) | 300 | 19,488 | ||||||||
Cohu, Inc. | 2,700 | 29,538 | ||||||||
Cree, Inc. (a),(b) | 36,900 | 1,309,581 | ||||||||
Cypress Semiconductor Corp. | 7,570 | 106,813 | ||||||||
DSP Group, Inc. (b) | 2,200 | 26,356 | ||||||||
Entropic Communications, Inc. (b) | 3,600 | 10,656 | ||||||||
FormFactor, Inc. (a),(b) | 10,600 | 94,022 | ||||||||
Freescale Semiconductor Ltd. (b) | 16,000 | 652,160 | ||||||||
GSI Technology, Inc. (b) | 518 | 3,056 | ||||||||
Integrated Device Technology, Inc. (a),(b) | 3,400 | 68,068 | ||||||||
IPG Photonics Corp. (b) | 200 | 18,540 | ||||||||
Kemet Corp. (a),(b) | 5,100 | 21,114 | ||||||||
See Notes to Consolidated Financial Statements.
43
Blackstone Alternative Multi-Manager Fund and Subsidiaries
Consolidated Schedule of Investments (Continued)
March 31, 2015
Security Description | Shares | Value | ||||||||
KLA-Tencor Corp. (a) | 20,800 | $ | 1,212,432 | |||||||
Lattice Semiconductor Corp. (a),(b) | 15,100 | 95,734 | ||||||||
M/A-COM Technology Solutions Holdings, Inc. (b) | 300 | 11,178 | ||||||||
Marvell Technology Group Ltd. | 1,400 | 20,580 | ||||||||
Maxim Integrated Products, Inc. (a),(d) | 28,439 | 989,962 | ||||||||
MaxLinear, Inc. Class A (b) | 400 | 3,252 | ||||||||
Micron Technology, Inc. (b) | 14,150 | 383,889 | ||||||||
MKS Instruments, Inc. | 1,100 | 37,191 | ||||||||
Nanometrics, Inc. (b) | 300 | 5,046 | ||||||||
NeoPhotonics Corp. (b) | 1,400 | 9,450 | ||||||||
Newport Corp. (a),(b) | 2,800 | 53,368 | ||||||||
NVE Corp. | 200 | 13,784 | ||||||||
Oclaro, Inc. (b) | 400 | 792 | ||||||||
OmniVision Technologies, Inc. (a),(b) | 4,000 | 105,480 | ||||||||
ON Semiconductor Corp. (b) | 4,200 | 50,862 | ||||||||
Pericom Semiconductor Corp. | 5,700 | 88,179 | ||||||||
Photronics, Inc. (a),(b) | 6,300 | 53,550 | ||||||||
Qorvo, Inc. (a),(b) | 1,987 | 158,364 | ||||||||
Qualcomm, Inc. (a) | 3,187 | 220,987 | ||||||||
Rambus, Inc. (a),(b) | 1,500 | 18,862 | ||||||||
Rudolph Technologies, Inc. (a),(b) | 2,800 | 30,856 | ||||||||
Sigma Designs, Inc. (a),(b) | 4,900 | 39,347 | ||||||||
Ultra Clean Holdings, Inc. (a),(b) | 3,500 | 25,025 | ||||||||
Ultratech, Inc. (a),(b) | 2,900 | 50,286 | ||||||||
Vishay Intertechnology, Inc. | 200 | 2,764 | ||||||||
Xcerra Corp. (b) | 300 | 2,667 | ||||||||
Xilinx, Inc. | 1,700 | 71,910 | ||||||||
|
| |||||||||
| 6,313,596 | ||||||||||
|
| |||||||||
Software — 0.7% |
| |||||||||
2U, Inc. (b) | 1,700 | 43,486 | ||||||||
Acxiom Corp. (a),(b) | 1,900 | 35,131 | ||||||||
Agilysys, Inc. (b) | 700 | 6,888 | ||||||||
Allscripts Healthcare Solutions, Inc. (b) | 4,900 | 58,604 | ||||||||
American Software, Inc. Class A | 300 | 3,066 | ||||||||
Autodesk, Inc. (a),(b) | 16,700 | 979,288 | ||||||||
Bazaarvoice, Inc. (b) | 1,500 | 8,475 | ||||||||
Calix, Inc. (b) | 900 | 7,551 | ||||||||
Carbonite, Inc. (b) | 3,900 | 55,770 | ||||||||
CDK Global, Inc. | 1,433 | 67,007 | ||||||||
Digi International, Inc. (b) | 2,600 | 25,948 | ||||||||
Ebix, Inc. | 800 | 24,304 | ||||||||
Envestnet, Inc. (b) | 17,278 | 968,950 | ||||||||
Epiq Systems, Inc. | 200 | 3,586 | ||||||||
inContact, Inc. (b) | 4,600 | 50,140 | ||||||||
Infoblox, Inc. (b) | 6,500 | 155,155 | ||||||||
See Notes to Consolidated Financial Statements.
44
Blackstone Alternative Multi-Manager Fund and Subsidiaries
Consolidated Schedule of Investments (Continued)
March 31, 2015
Security Description | Shares | Value | ||||||||
Informatica Corp. (a),(b) | 46,800 | $ | 2,052,414 | |||||||
Intralinks Holdings, Inc. (b) | 7,500 | 77,550 | ||||||||
Limelight Networks, Inc. (a),(b) | 11,100 | 40,293 | ||||||||
Lionbridge Technologies, Inc. (a),(b) | 3,300 | 18,876 | ||||||||
Merge Healthcare, Inc. (b) | 11,500 | 51,405 | ||||||||
Microsoft Corp. | 5,696 | 231,571 | ||||||||
MicroStrategy, Inc. Class A (b) | 100 | 16,919 | ||||||||
Model N, Inc. (b) | 3,700 | 44,252 | ||||||||
Monotype Imaging Holdings, Inc. | 500 | 16,320 | ||||||||
Paycom Software, Inc. (b) | 100 | 3,206 | ||||||||
PDF Solutions, Inc. (b) | 1,700 | 30,464 | ||||||||
QAD, Inc. Class A | 3,000 | 72,600 | ||||||||
Quality Systems, Inc. (a) | 3,100 | 49,538 | ||||||||
Qualys, Inc. (b) | 800 | 37,184 | ||||||||
Rackspace Hosting, Inc. (a),(b) | 6,000 | 309,540 | ||||||||
RealNetworks, Inc. (a),(b) | 3,300 | 22,209 | ||||||||
salesforce.com, Inc. (b),(d) | 9,395 | 627,680 | ||||||||
Seachange International, Inc. (b) | 3,100 | 24,335 | ||||||||
ServiceNow, Inc. (b),(d) | 5,284 | 416,274 | ||||||||
Support.com, Inc. (b) | 2,500 | 3,900 | ||||||||
Tableau Software, Inc. Class A (b) | 1,600 | 148,032 | ||||||||
Veeva Systems, Inc. Class A (b) | 3,100 | 79,143 | ||||||||
VMware, Inc. Class A (a),(b) | 22,800 | 1,869,828 | ||||||||
Zendesk, Inc. (b) | 1,200 | 27,228 | ||||||||
|
| |||||||||
| 8,764,110 | ||||||||||
|
| |||||||||
Specialty Finance — 0.6% | ||||||||||
AG Mortgage Investment Trust, Inc. | 200 | 3,768 | ||||||||
Air Lease Corp. | 500 | 18,870 | ||||||||
American Capital Agency Corp. (a) | 115,035 | 2,453,697 | ||||||||
American Capital Mortgage Investment Corp. (a) | 13,600 | 244,256 | ||||||||
Annaly Capital Management, Inc. | 200 | 2,080 | ||||||||
Anworth Mortgage Asset Corp. | 1,000 | 5,090 | ||||||||
Apollo Commercial Real Estate Finance, Inc. (a) | 51,900 | 891,642 | ||||||||
Arbor Realty Trust, Inc. (a) | 6,700 | 46,766 | ||||||||
Cherry Hill Mortgage Investment Corp. (a) | 1,600 | 28,208 | ||||||||
Chimera Investment Corp. (a) | 309,200 | 970,888 | ||||||||
CIT Group, Inc. | 8,405 | 379,234 | ||||||||
Consumer Portfolio Services, Inc. (a),(b) | 500 | 3,495 | ||||||||
Dynex Capital, Inc. | 13,300 | 112,651 | ||||||||
Ellington Residential Mortgage REIT (a) | 4,300 | 70,434 | ||||||||
Essent Group Ltd. (b) | 1,600 | 38,256 | ||||||||
Five Oaks Investment Corp. | 4,700 | 50,055 | ||||||||
FNFV Group (b) | 7,834 | 110,459 | ||||||||
Global Cash Access Holdings, Inc. (a),(b) | 17,100 | 130,302 | ||||||||
Hatteras Financial Corp. | 100 | 1,816 | ||||||||
See Notes to Consolidated Financial Statements.
45
Blackstone Alternative Multi-Manager Fund and Subsidiaries
Consolidated Schedule of Investments (Continued)
March 31, 2015
Security Description | Shares | Value | ||||||||
HomeStreet, Inc. | 100 | $ | 1,832 | |||||||
Invesco Mortgage Capital, Inc. | 4 | 62 | ||||||||
Ladder Capital Corp. (b) | 100 | 1,851 | ||||||||
Meta Financial Group, Inc. | 1,000 | 39,730 | ||||||||
MFA Financial, Inc. | 1,600 | 12,576 | ||||||||
New Residential Investment Corp. | 59,550 | 895,036 | ||||||||
Nicholas Financial, Inc. (b) | 800 | 11,208 | ||||||||
On Deck Capital, Inc. (b) | 556 | 11,837 | ||||||||
Visa, Inc. A Shares (a),(d) | 16,856 | 1,102,551 | ||||||||
Walker & Dunlop, Inc. (b) | 4,700 | 83,331 | ||||||||
ZAIS Financial Corp. (a) | 1,300 | 23,192 | ||||||||
|
| |||||||||
| 7,745,173 | ||||||||||
|
| |||||||||
Technology Services — 0.3% | ||||||||||
Amdocs Ltd. | 4,900 | 266,560 | ||||||||
Ciber, Inc. (a),(b) | 5,500 | 22,660 | ||||||||
comScore, Inc. (b) | 500 | 25,600 | ||||||||
CSG Systems International, Inc. | 7,700 | 234,003 | ||||||||
Cubic Corp. | 3,400 | 176,018 | ||||||||
DST Systems, Inc. (a) | 6,400 | 708,544 | ||||||||
EPAM Systems, Inc. (b) | 2,600 | 159,354 | ||||||||
ExlService Holdings, Inc. (a),(b) | 3,500 | 130,200 | ||||||||
Leidos Holdings, Inc. | 12,800 | 537,088 | ||||||||
Luxoft Holding, Inc. (b) | 12,800 | 662,272 | ||||||||
Markit Ltd. (b) | 22,800 | 613,320 | ||||||||
NIC, Inc. (a) | 2,700 | 47,709 | ||||||||
Nielsen NV | 893 | 39,801 | ||||||||
Perficient, Inc. (a),(b) | 2,200 | 45,518 | ||||||||
Sabre Corp. | 300 | 7,290 | ||||||||
Science Applications International Corp. (a) | 2,000 | 102,700 | ||||||||
Sykes Enterprises, Inc. (b) | 1,200 | 29,820 | ||||||||
TeleTech Holdings, Inc. | 200 | 5,090 | ||||||||
|
| |||||||||
| 3,813,547 | ||||||||||
|
| |||||||||
Telecommunications — 0.1% | ||||||||||
Cincinnati Bell, Inc. (b) | 1,000 | 3,530 | ||||||||
Equinix, Inc. | 48 | 11,177 | ||||||||
FairPoint Communications, Inc. (a),(b) | 3,000 | 52,800 | ||||||||
General Communication, Inc. Class A (a),(b) | 9,900 | 156,024 | ||||||||
GTT Communications, Inc. (b) | 300 | 5,664 | ||||||||
Hawaiian Telcom Holdco, Inc. (b) | 1,600 | 42,608 | ||||||||
IDT Corp. Class B | 1,300 | 23,075 | ||||||||
Inteliquent, Inc. | 12,500 | 196,750 | ||||||||
Internap Network Services Corp. (b) | 8,300 | 84,909 | ||||||||
Level 3 Communications, Inc. (b) | 50 | 2,692 | ||||||||
Lumos Networks Corp. | 1,400 | 21,364 | ||||||||
See Notes to Consolidated Financial Statements.
46
Blackstone Alternative Multi-Manager Fund and Subsidiaries
Consolidated Schedule of Investments (Continued)
March 31, 2015
Security Description | Shares | Value | ||||||||
ORBCOMM, Inc. (b) | 100 | $ | 597 | |||||||
Premiere Global Services, Inc. (a),(b) | 4,400 | 42,064 | ||||||||
Shenandoah Telecommunications Co. | 200 | 6,232 | ||||||||
Spok Holdings, Inc. (a) | 800 | 15,336 | ||||||||
TeleCommunication Systems, Inc. Class A (b) | 900 | 3,447 | ||||||||
Vonage Holdings Corp. (b) | 100 | 491 | ||||||||
West Corp. (a) | 16,200 | 546,426 | ||||||||
Zix Corp. (a),(b) | 4,800 | 18,864 | ||||||||
|
| |||||||||
| 1,234,050 | ||||||||||
|
| |||||||||
Transportation & Logistics — 0.1% | ||||||||||
Air Transport Services Group, Inc. (a),(b) | 9,200 | 84,824 | ||||||||
Atlas Air Worldwide Holdings, Inc. (b) | 800 | 34,416 | ||||||||
Con-way, Inc. | 100 | 4,413 | ||||||||
Hornbeck Offshore Services, Inc. (b) | 100 | 1,881 | ||||||||
Hub Group, Inc. Class A (b) | 400 | 15,716 | ||||||||
Kirby Corp. (b) | 2,300 | 172,615 | ||||||||
ModusLink Global Solutions, Inc. (b) | 1,600 | 6,160 | ||||||||
Quality Distribution, Inc. (a),(b) | 7,400 | 76,442 | ||||||||
Saia, Inc. (b) | 400 | 17,720 | ||||||||
Scorpio Bulkers, Inc. (b) | 3,400 | 8,058 | ||||||||
Stamps.com, Inc. (b) | 2,800 | 188,412 | ||||||||
Swift Transportation Co. (b) | 600 | 15,612 | ||||||||
Tsakos Energy Navigation Ltd. | 900 | 7,362 | ||||||||
Union Pacific Corp. | 3,144 | 340,527 | ||||||||
USA Truck, Inc. (b) | 800 | 22,152 | ||||||||
|
| |||||||||
| 996,310 | ||||||||||
|
| |||||||||
Transportation Equipment — 0.1% | ||||||||||
Accuride Corp. (b) | 700 | 3,262 | ||||||||
Allison Transmission Holdings, Inc. (a) | 33,600 | 1,073,184 | ||||||||
Commercial Vehicle Group, Inc. (b) | 100 | 644 | ||||||||
Spartan Motors, Inc. | 200 | 970 | ||||||||
Trinity Industries, Inc. | 1,500 | 53,265 | ||||||||
WABCO Holdings, Inc. (b) | 500 | 61,440 | ||||||||
|
| |||||||||
| 1,192,765 | ||||||||||
|
| |||||||||
Travel Lodging & Dining — 0.0% | ||||||||||
Boyd Gaming Corp. (b) | 200 | 2,840 | ||||||||
Panera Bread Co. Class A (b) | 100 | 15,999 | ||||||||
|
| |||||||||
| 18,839 | ||||||||||
|
| |||||||||
Utilities — 0.0% | ||||||||||
Atmos Energy Corp. (a) | 700 | 38,710 | ||||||||
California Water Service Group | 3,100 | 75,981 | ||||||||
CenterPoint Energy, Inc. (a) | 22,000 | 449,020 | ||||||||
See Notes to Consolidated Financial Statements.
47
Blackstone Alternative Multi-Manager Fund and Subsidiaries
Consolidated Schedule of Investments (Continued)
March 31, 2015
Security Description | Shares | Value | ||||||||
Integrys Energy Group, Inc. | 500 | $ | 36,010 | |||||||
Middlesex Water Co. | 400 | 9,104 | ||||||||
Pinnacle West Capital Corp. (a) | 34 | 2,167 | ||||||||
Unitil Corp. | 500 | 17,385 | ||||||||
|
| |||||||||
| 628,377 | ||||||||||
|
| |||||||||
Waste & Environmental Service Equipment & Facility — 0.0% | ||||||||||
Casella Waste Systems, Inc. Class A (a),(b) | 8,100 | 44,550 | ||||||||
Ceco Environmental Corp. (a) | 42 | 446 | ||||||||
Fuel Tech, Inc. (b) | 100 | 313 | ||||||||
|
| |||||||||
| 45,309 | ||||||||||
|
| |||||||||
Total United States | 460,827,225 | |||||||||
|
| |||||||||
TOTAL COMMON STOCK | 585,072,162 | |||||||||
|
| |||||||||
PREFERRED STOCK — 0.0% | ||||||||||
Germany — 0.0% | ||||||||||
Automotive — 0.0% | ||||||||||
Volkswagen AG Preference Shares | 371 | 98,390 | ||||||||
|
| |||||||||
Total Germany | 98,390 | |||||||||
|
| |||||||||
Republic of Korea — 0.0% | ||||||||||
Hardware — 0.0% | ||||||||||
Samsung Electronics Co. Ltd. Preference Shares | 143 | 141,993 | ||||||||
|
| |||||||||
Total Republic of Korea | 141,993 | |||||||||
|
| |||||||||
United States — 0.0% | ||||||||||
Pharmaceuticals — 0.0% | ||||||||||
Actavis PLC | 87 | 88,044 | ||||||||
|
| |||||||||
Total United States | 88,044 | |||||||||
|
| |||||||||
TOTAL PREFERRED STOCK | 328,427 | |||||||||
|
| |||||||||
Security Description | Principal Amount | Value | ||||||||
ASSET-BACKED SECURITIES — 7.3% | ||||||||||
Cayman Islands — 4.5% |
| |||||||||
ABCLO Ltd., Series 2007-1A, Class C, 2.10%, 04/15/21 (d),(e),(f) | $ | 1,000,000 | 985,500 | |||||||
ALESCO Preferred Funding VII Ltd., Series 7A, Class A1B, 0.66%, 07/23/35 (d),(e),(f) | 3,264,124 | 2,774,505 | ||||||||
ALESCO Preferred Funding XIIII Ltd., Series 13A, Class A2, 0.66%, 09/23/37 (d),(e),(f) | 2,067,000 | 1,219,530 | ||||||||
See Notes to Consolidated Financial Statements.
48
Blackstone Alternative Multi-Manager Fund and Subsidiaries
Consolidated Schedule of Investments (Continued)
March 31, 2015
Security Description | Principal Amount | Value | ||||||||
Atlas Senior Loan Fund II Ltd., Series 2012-2A, Class D, 4.50%, 01/30/24 (d),(e),(f) | $ | 500,000 | $ | 496,050 | ||||||
Babson CLO Ltd., Series 2013-IA, Class D, 3.76%, 04/20/25 (d),(e),(f) | 300,000 | 294,960 | ||||||||
Bridgeport CLO Ltd., Series 2006-1A, Class C, 1.76%, 07/21/20 (d),(e),(f) | 2,000,000 | 1,861,400 | ||||||||
Catamaran CLO Ltd., | ||||||||||
Series 2015-1A, Class D, 3.93%, 04/22/27 (d),(e),(f) | 700,000 | 665,840 | ||||||||
Series 2015-1A, Class E, 5.43%, 04/22/27 (d),(e),(f) | 700,000 | 626,570 | ||||||||
ColumbusNova CLO IV Ltd., Series 2007-2A, Class D, 4.75%, 10/15/21 (d),(e),(f) | 850,000 | 850,170 | ||||||||
ColumbusNova CLO Ltd., Series 2007-1A, Class E, 3.86%, 05/16/19 (d),(e),(f) | 539,000 | 520,782 | ||||||||
Comstock Funding Ltd., Series 2006-1A, Class C, 2.01%, 05/30/20 (d),(e),(f) | 1,500,000 | 1,451,250 | ||||||||
Crown Point CLO Ltd., Series 2012-1A, Class B1L, 5.26%, 11/21/22 (d),(e),(f) | 500,000 | 501,550 | ||||||||
Cutwater Ltd., Series 2014-1A, Class C, 3.95%, 07/15/26 (d),(e),(f) | 2,203,000 | 2,092,850 | ||||||||
Duane Street CLO, Series 2007-5X, Class B, REG S, 8.00%, 10/14/21 (d),(f) | 1,533,000 | 1,535,759 | ||||||||
Eaton Vance CDO VIII Ltd., Series 2006-8A, Class D, 3.68%, 08/15/22 (d),(e),(f) | 400,000 | 380,840 | ||||||||
Flagship CLO VIII Ltd., Series 2014-8A, Class D, 3.90%, 01/16/26 (d),(e),(f) | 515,000 | 498,571 | ||||||||
Fraser Sullivan CLO VII Ltd., Series 2012-7A, Class D, 5.76%, 04/20/23 (d),(e),(f) | 1,400,000 | 1,400,000 | ||||||||
Galaxy XIV CLO Ltd., Series 2012-14A, Class D, 4.66%, 11/15/24 (d),(e),(f) | 2,600,000 | 2,608,580 | ||||||||
Golub Capital Partners CLO Ltd., Series 2011-10AR, Class DR, 4.11%, 10/20/21 (d),(e),(f) | 750,000 | 745,875 | ||||||||
Harbourview CDO III Ltd., Series 3A, Class A, 0.73%, 09/15/31 (d),(e),(f),(g) | 2,944,999 | 2,650,499 | ||||||||
ING IM CLO Ltd., Series 2013-2A, Class C, 3.76%, 04/25/25 (d),(e),(f) | 429,000 | 417,932 | ||||||||
JFIN CLO Ltd., Series 2007-1A, Class D, 3.06%, 07/20/21 (d),(e),(f) | 1,500,000 | 1,471,800 | ||||||||
Katonah Ltd., Series 2007-10A, Class E, 4.26%, 04/17/20 (d),(e),(f) | 1,805,000 | 1,737,493 | ||||||||
Kingsland IV Ltd., Series 2007-4A, Class E, 3.60%, 04/16/21 (d),(e),(f) | 628,000 | 580,209 | ||||||||
KKR Financial CLO Ltd., | ||||||||||
Series 10, Class D, 3.98%, 01/15/26 (d),(e),(f) | 1,200,000 | 1,142,280 | ||||||||
See Notes to Consolidated Financial Statements.
49
Blackstone Alternative Multi-Manager Fund and Subsidiaries
Consolidated Schedule of Investments (Continued)
March 31, 2015
Security Description | Principal Amount | Value | ||||||||
Series 2012-1A, Class C, | $ | 500,000 | $ | 503,800 | ||||||
LightPoint CLO V Ltd., Series 2006-5A, Class D, 3.91%, 08/05/19 (d),(e),(f) | 670,000 | 662,094 | ||||||||
MidOcean Credit CLO III, | ||||||||||
Series 2014-3A, Class D, | 3,268,000 | 3,132,378 | ||||||||
Series 2014-3A, Class E, | 2,594,000 | 2,313,070 | ||||||||
MSIM Peconic Bay Ltd., Series 2007-1A, Class E, 5.76%, 07/20/19 (d),(e),(f) | 184,256 | 184,237 | ||||||||
Octagon Investment Partners XIV Ltd., | 350,000 | 350,000 | ||||||||
Octagon Investment Partners XX Ltd., | ||||||||||
Series 2014-1A, Class D, | 1,156,000 | 1,116,927 | ||||||||
Series 2014-1A, Class E, | 875,000 | 800,450 | ||||||||
OZLM Funding V Ltd., Series 2013-5A, Class C, 3.76%, 01/17/26 (d),(e),(f) | 2,050,000 | 1,957,545 | ||||||||
OZLM VII Ltd., Series 2014-7A, Class C, 3.86%, 07/17/26 (d),(e),(f) | 1,300,000 | 1,258,140 | ||||||||
Preferred Term Securities X Ltd. / Preferred Term Securities X, Inc., 0.99%, 07/03/33 (d),(e),(f) | 569,597 | 512,638 | ||||||||
Preferred Term Securities XXIV Ltd. / Preferred Term Securities XXIV, Inc., 0.57%, 03/22/37 (d),(e),(f) | 3,615,873 | 2,711,905 | ||||||||
Red River CLO Ltd., Series 1A, Class D, | 5,500,000 | 5,395,500 | ||||||||
Symphony CLO IX Ltd., | ||||||||||
Series 2012-9A, Class D, | 3,350,000 | 3,366,415 | ||||||||
Series 2012-9A, Class E, | 1,000,000 | 986,000 | ||||||||
Symphony CLO VII Ltd., Series 2011-7A, Class E, 3.86%, 07/28/21 (d),(e),(f) | 1,000,000 | 1,003,300 | ||||||||
Symphony CLO XII Ltd., Series 2013-12A, Class D, 3.75%, 10/15/25 (d),(e),(f) | 500,000 | 483,750 | ||||||||
Trapeza CDO XIII LLC, Series 2007-13A, Class A3, 0.69%, 11/09/42 (d),(e),(f) | 863,000 | 500,540 | ||||||||
Venture XI CDO Ltd., Series 2012-11A, Class D, 5.26%, 11/14/22 (d),(e),(f) | 2,500,000 | 2,516,250 | ||||||||
Vibrant CLO Ltd., Series 2015-3A, Class C, 3.91%, 04/20/26 (d),(e),(f) | 483,000 | 444,167 | ||||||||
See Notes to Consolidated Financial Statements.
50
Blackstone Alternative Multi-Manager Fund and Subsidiaries
Consolidated Schedule of Investments (Continued)
March 31, 2015
Security Description | Principal Amount | Value | ||||||||
WhiteHorse VI Ltd., | ||||||||||
Series 2012-1A, Class B2L, | $ | 396,000 | $ | 367,805 | ||||||
Series 2013-1A, Class B2L, | 417,000 | 359,579 | ||||||||
|
| |||||||||
Total Cayman Islands | 60,437,285 | |||||||||
|
| |||||||||
United States — 2.8% | ||||||||||
AmeriCredit Automobile Receivables Trust, Series 2012-4, Class E, 3.82%, 02/10/20 (d),(e) | 2,500,000 | 2,563,000 | ||||||||
Ares IIIR/IVR CLO Ltd., Series 2007-3RA, | 436,000 | 401,687 | ||||||||
Ascentium Equipment Receivable, Series 2015-1A, Class E, 5.92%, 06/12/23 (d),(e),(g) | 410,000 | 415,617 | ||||||||
Countrywide Home Equity Loan Trust, Series | 6,849 | 5,907 | ||||||||
CPS Auto Receivables Trust, | ||||||||||
Series 2014-B, Class D, 4.62%, 05/15/20 (d),(e) | 433,000 | 424,816 | ||||||||
Series 2014-C, Class D, 4.83%, 08/17/20 (d),(e) | 881,000 | 864,702 | ||||||||
Drive Auto Receivables Trust, Series 2015-AA, Class D, 4.12%, 06/15/22 (d),(e) | 200,000 | 201,360 | ||||||||
DT Auto Owner Trust, Series 2014-3A, Class D, 4.47%, 11/15/21 (d),(e) | 1,300,000 | 1,326,000 | ||||||||
Education Funding LLC, Series 2006-1A, Class A2, 0.51%, 10/25/29 (d),(e),(f) | 2,610,057 | 2,428,397 | ||||||||
Exeter Automobile Receivables Trust, | ||||||||||
Series 2013-2A, Class D, 6.81%, 08/17/20 (d),(e) | 2,200,000 | 2,312,420 | ||||||||
Series 2014-2A, Class D, 4.93%, 12/15/20 (d),(e) | 400,000 | 401,320 | ||||||||
Series 2014-3A, Class C, 4.17%, 06/15/20 (d),(e) | 2,600,000 | 2,621,840 | ||||||||
FFCA Secured Lending Corp., Series 1999-2, Class WA1C, 7.85%, 05/18/26 (d),(e),(g) | 180,975 | 185,861 | ||||||||
Fraser Sullivan CLO II Ltd., Series 2006-2A, Class E, 3.77%, 12/20/20 (d),(e),(f) | 2,284,000 | 2,247,456 | ||||||||
GE Business Loan Trust, Series 2004-1, Class C, 1.37%, 05/15/32 (d),(e),(f) | 50,455 | 47,074 | ||||||||
GE Business Loan Trust 2004-1, Series 2004-1, Class B, 0.87%, 05/15/32 (d),(e),(f) | 114,731 | 105,885 | ||||||||
Harch CLO III Ltd., Series 2007-1A, Class E, 4.00%, 04/17/20 (d),(e),(f) | 2,451,000 | 2,340,460 | ||||||||
HSI Asset Securitization Corp. Trust, Series 2005-I1, Class 2A3, 0.46%, 11/25/35 (d),(f) | 978,186 | 909,713 | ||||||||
InCaps Funding II Ltd. / InCaps Funding II Corp., 1.45%, 01/15/34 (d),(e),(f),(g) | 1,171,722 | 1,118,995 | ||||||||
Morgan Stanley ABS Capital I, Inc. Trust, | ||||||||||
Series 2006-HE3, Class A2C, 0.33%, 04/25/36 (d),(f) | 1,022,048 | 995,270 | ||||||||
See Notes to Consolidated Financial Statements.
51
Blackstone Alternative Multi-Manager Fund and Subsidiaries
Consolidated Schedule of Investments (Continued)
March 31, 2015
Security Description | Principal Amount | Value | ||||||||
Series 2006-NC4, Class A2C, 0.32%, 06/25/36 (d),(f) | $ | 1,336,160 | $ | 1,252,650 | ||||||
Nationstar Home Equity Loan Trust, Series 2007-C, Class 2AV2, 0.30%, 06/25/37 (d),(f) | 3,763,052 | 3,662,579 | ||||||||
Preferred Term Securities XVII Ltd. / Preferred Term Securities XVII, Inc., 0.77%, 06/23/35 (d),(e),(f) | 945,000 | 576,450 | ||||||||
SLM Private Credit Student Loan Trust, Series 2004-A, Class C, 1.22%, 06/15/33 (d),(f) | 167,405 | 156,122 | ||||||||
Soundview Home Loan Trust, Series 2007-OPT3, Class 2A2, 0.30%, 08/25/37 (d),(f) | 2,569,432 | 2,505,196 | ||||||||
Venture IX CDO Ltd., Series 2007-9A, Class D, 4.40%, 10/12/21 (d),(e),(f) | 1,500,000 | 1,500,000 | ||||||||
Vericrest Opportunity Loan Trust, Series 2015-NPL4, Class A1, 3.50%, 02/25/55 (d),(e),(f) | 98,070 | 98,060 | ||||||||
Vericrest Opportunity Loan XXXI LLC, Series 2015-NPL2, Class A1, | 2,959,641 | 2,959,641 | ||||||||
Westgate Resorts LLC, Series 2014-1A, Class C, 5.50%, 12/20/26 (d),(e) | 2,419,566 | 2,416,905 | ||||||||
|
| |||||||||
Total United States | 37,045,383 | |||||||||
|
| |||||||||
TOTAL ASSET-BACKED SECURITIES | 97,482,668 | |||||||||
|
| |||||||||
CONVERTIBLE BONDS — 0.7% | ||||||||||
France — 0.2% | ||||||||||
Auto Parts Manufacturing — 0.2% | ||||||||||
Faurecia REG S, 3.25%, 01/01/18 (d) | 5,468,800 | EUR | 2,414,463 | |||||||
|
| |||||||||
Total France | 2,414,463 | |||||||||
|
| |||||||||
Germany — 0.2% | ||||||||||
Automobiles Manufacturing — 0.2% | ||||||||||
Volkswagen International Finance NV Co. REG S, 5.50%, 11/09/15 (d) | 1,600,000 | EUR | 2,465,059 | |||||||
|
| |||||||||
Total Germany | 2,465,059 | |||||||||
|
| |||||||||
Spain — 0.3% | ||||||||||
Wireless Telecommunication Services — 0.3% | ||||||||||
Telefonica Participacion Co. REG S, 4.90%, 09/25/17 (d) | 3,600,000 | EUR | 4,213,089 | |||||||
|
| |||||||||
Total Spain | 4,213,089 | |||||||||
|
| |||||||||
TOTAL CONVERTIBLE BONDS | 9,092,611 | |||||||||
|
| |||||||||
See Notes to Consolidated Financial Statements.
52
Blackstone Alternative Multi-Manager Fund and Subsidiaries
Consolidated Schedule of Investments (Continued)
March 31, 2015
Security Description | Principal Amount | Value | ||||||||
BANK LOANS — 1.4% | ||||||||||
Netherlands — 0.2% | ||||||||||
Exploration & Production — 0.2% | ||||||||||
Endeavour International Holding BV, 11.00%, 01/02/17 (d),(f),(g) | $ | 2,619,844 | $ | 2,063,128 | ||||||
|
| |||||||||
Transportation & Logistics — 0.0% | ||||||||||
Ceva Intercompany BV, 6.50%, 03/19/21 (d),(f),(g) | 110,351 | 103,132 | ||||||||
|
| |||||||||
Total Netherlands | 2,166,260 | |||||||||
|
| |||||||||
United Kingdom — 0.0% | ||||||||||
Transportation & Logistics — 0.0% | ||||||||||
Ceva Logistics U.S. Holdings, | 152,208 | 142,251 | ||||||||
Ceva Logistics, 6.50%, 03/19/21 (d),(f),(g) | 19,026 | 17,781 | ||||||||
Ceva Group PLC, 6.50%, 03/19/21 (d),(f),(g) | 105,663 | 98,751 | ||||||||
|
| |||||||||
Total United Kingdom | 258,783 | |||||||||
|
| |||||||||
United States — 1.2% | ||||||||||
Financial Services — 1.2% | ||||||||||
MF Global Finance USA, Inc. (d),(f),(g),(h) | 25,000,000 | 15,531,250 | ||||||||
|
| |||||||||
Publishing & Broadcasting — 0.0% | ||||||||||
Clear Channel Communications, | 334,527 | 317,650 | ||||||||
|
| |||||||||
Total United States | 15,848,900 | |||||||||
|
| |||||||||
TOTAL BANK LOANS | 18,273,943 | |||||||||
|
| |||||||||
CORPORATE BONDS & NOTES — 6.6% | ||||||||||
Brazil — 0.6% | ||||||||||
Banks — 0.3% | ||||||||||
Banco Bradesco SA REG S, 5.90%, 01/16/21 (a) | 1,040,000 | 1,094,652 | ||||||||
Banco do Brasil SA/Cayman REG S, | 980,000 | 960,400 | ||||||||
Banco Estado Rio Grande Sul SA REG S, | 100,000 | 93,875 | ||||||||
Banco Votorantim SA REG S, 7.38%, 01/21/20 | 770,000 | 791,560 | ||||||||
Itau Unibanco Holding SA REG S, | ||||||||||
5.75%, 01/22/21 | 380,000 | 388,550 | ||||||||
6.20%, 04/15/20 - 12/21/21 (a) | 770,000 | 813,600 | ||||||||
|
| |||||||||
| 4,142,637 | ||||||||||
|
| |||||||||
See Notes to Consolidated Financial Statements.
53
Blackstone Alternative Multi-Manager Fund and Subsidiaries
Consolidated Schedule of Investments (Continued)
March 31, 2015
Security Description | Principal Amount | Value | ||||||||
Food & Beverage — 0.0% | ||||||||||
Cosan Luxembourg SA REG S, 5.00%, 03/14/23 | $ | 410,000 | $ | 363,875 | ||||||
Cosan Overseas Ltd. REG S, 8.25% (i) | 100,000 | 98,610 | ||||||||
|
| |||||||||
| 462,485 | ||||||||||
|
| |||||||||
Integrated Oils — 0.3% | ||||||||||
Petrobras Global Finance BV, 5.75%, 01/20/20 | 3,720,000 | 3,458,335 | ||||||||
|
| |||||||||
Total Brazil | 8,063,457 | |||||||||
|
| |||||||||
Canada — 0.2% | ||||||||||
Aerospace & Defense — 0.1% | ||||||||||
Bombardier, Inc., | ||||||||||
5.50%, 09/15/18 (d),(e) | 600,000 | 599,250 | ||||||||
7.50%, 03/15/25 (c),(d),(e) | 700,000 | 690,812 | ||||||||
|
| |||||||||
| 1,290,062 | ||||||||||
|
| |||||||||
Oil & Gas Services — 0.0% | ||||||||||
Sanjel Corp. REG S, 7.50%, 06/19/19 (e),(g) | 200,000 | 127,000 | ||||||||
|
| |||||||||
Publishing & Broadcasting — 0.1% | ||||||||||
Postmedia Network, Inc., 12.50%, 07/15/18 (a),(d) | 1,324,000 | 1,383,580 | ||||||||
|
| |||||||||
Total Canada | 2,800,642 | |||||||||
|
| |||||||||
Ecuador — 0.1% | ||||||||||
Refining & Marketing — 0.1% | ||||||||||
EP PetroEcuador via Noble Sovereign Funding I Ltd. REG S, 5.90%, 09/24/19 (f) | 1,101,789 | 964,065 | ||||||||
|
| |||||||||
Total Ecuador | 964,065 | |||||||||
|
| |||||||||
France — 0.2% | ||||||||||
Property & Casualty — 0.2% | ||||||||||
Groupama SA REG S, 6.38% (d),(f),(i) | 2,300,000 | EUR | 2,664,739 | |||||||
|
| |||||||||
Total France | 2,664,739 | |||||||||
|
| |||||||||
Germany — 0.3% | ||||||||||
Banks — 0.3% | ||||||||||
HSH Nordbank AG REG S, MTN, | ||||||||||
0.85%, 02/14/17 (d),(f) | 2,321,000 | EUR | 2,105,710 | |||||||
0.89%, 02/14/17 (d),(f) | 2,094,000 | EUR | 1,902,580 | |||||||
|
| |||||||||
Total Germany | 4,008,290 | |||||||||
|
| |||||||||
Hong Kong — 0.0% | ||||||||||
Casinos & Gaming — 0.0% | ||||||||||
MCE Finance Ltd. (a),(c),(d),(e) | $ | 214,000 | 200,090 | |||||||
|
| |||||||||
Total Hong Kong | 200,090 | |||||||||
|
| |||||||||
See Notes to Consolidated Financial Statements.
54
Blackstone Alternative Multi-Manager Fund and Subsidiaries
Consolidated Schedule of Investments (Continued)
March 31, 2015
Security Description | Principal Amount | Value | ||||||||
Ireland — 0.1% | ||||||||||
Banks — 0.1% | ||||||||||
UT2 Funding PLC, 5.32%, 06/30/16 (d) | 1,350,000 | EUR | $ | 1,476,991 | ||||||
|
| |||||||||
Total Ireland | 1,476,991 | |||||||||
|
| |||||||||
Luxembourg — 0.1% | ||||||||||
Wireless Telecommunication Services — 0.1% |
| |||||||||
Intelsat Luxembourg SA, 7.75%, 06/01/21 (c),(d) | $ | 1,337,000 | 1,233,382 | |||||||
|
| |||||||||
Total Luxembourg | 1,233,382 | |||||||||
|
| |||||||||
Mexico — 0.0% | ||||||||||
Oil & Gas Services — 0.0% |
| |||||||||
Oro Negro Drilling Pte Ltd. REG S (e) | 200,000 | 144,000 | ||||||||
|
| |||||||||
Total Mexico | 144,000 | |||||||||
|
| |||||||||
Nigeria — 0.0% | ||||||||||
Oil & Gas Services — 0.0% |
| |||||||||
Sea Trucks Group Ltd. REG S, | 750,000 | 465,000 | ||||||||
|
| |||||||||
Total Nigeria | 465,000 | |||||||||
|
| |||||||||
Poland — 0.1% | ||||||||||
Food & Beverage — 0.1% |
| |||||||||
CEDC Finance Corp. International, Inc. (d),(j) | 1,419,858 | 1,299,170 | ||||||||
|
| |||||||||
Total Poland | 1,299,170 | |||||||||
|
| |||||||||
Sweden — 0.1% | ||||||||||
Chemicals — 0.1% | ||||||||||
Perstorp Holding AB, | ||||||||||
8.75%, 05/15/17 (d),(e) | 598,000 | 618,930 | ||||||||
11.00%, 08/15/17 (d),(e) | 241,000 | 250,038 | ||||||||
|
| |||||||||
Total Sweden | 868,968 | |||||||||
|
| |||||||||
United Kingdom — 0.2% | ||||||||||
Financial Services — 0.1% | ||||||||||
Depfa Funding III LP REG S, 1.72% (d),(f),(i) | 1,728,000 | EUR | 1,044,772 | |||||||
|
| |||||||||
Transportation & Logistics — 0.1% | ||||||||||
Algeco Scotsman Global Finance PLC, | $ | 206,000 | 204,198 | |||||||
CEVA Group PLC, 4.00%, 05/01/18 (d),(e) | 1,528,180 | 1,386,823 | ||||||||
|
| |||||||||
| 1,591,021 | ||||||||||
|
| |||||||||
Total United Kingdom | 2,635,793 | |||||||||
|
| |||||||||
See Notes to Consolidated Financial Statements.
55
Blackstone Alternative Multi-Manager Fund and Subsidiaries
Consolidated Schedule of Investments (Continued)
March 31, 2015
Security Description | Principal Amount | Value | ||||||||
United States — 4.2% | ||||||||||
Advertising & Marketing — 0.1% | ||||||||||
Visant Corp., 10.00%, 10/01/17 (a),(c),(d) | $ | 1,489,000 | $ | 1,332,655 | ||||||
|
| |||||||||
Airlines — 0.0% | ||||||||||
American Airlines Group Co., 4.63%, 03/01/20 (d),(e) | 210,000 | 205,669 | ||||||||
|
| |||||||||
Cable & Satellite — 0.1% | ||||||||||
CCOH Safari LLC, 5.75%, 12/01/24 (a),(d) | 303,000 | 312,090 | ||||||||
WideOpenWest Finance LLC / WideOpenWest Capital Corp., 10.25%, 07/15/19 (d) | 1,000,000 | 1,075,000 | ||||||||
|
| |||||||||
| 1,387,090 | ||||||||||
|
| |||||||||
Casinos & Gaming — 0.3% | ||||||||||
Boyd Gaming Corp., 9.00%, 07/01/20 (d) | 240,000 | 258,900 | ||||||||
Downstream Development Authority of the Quapaw Tribe of Oklahoma, | 1,194,000 | 1,053,705 | ||||||||
Golden Nugget Escrow, Inc., | 738,000 | 756,450 | ||||||||
Greektown Holdings LLC/Greektown Mothership Corp., 8.88%, 03/15/19 (a),(c),(d),(e) | 1,290,000 | 1,360,950 | ||||||||
Isle of Capri Casinos, Inc., 8.88%, 06/15/20 (c),(d) | 448,000 | 483,840 | ||||||||
Scientific Games International, Inc., 7.00%, 01/01/22 (a),(c),(d),(e) | 250,000 | 255,625 | ||||||||
|
| |||||||||
| 4,169,470 | ||||||||||
|
| |||||||||
Communications Equipment — 0.1% |
| |||||||||
Avaya, Inc., | ||||||||||
9.00%, 04/01/19 (a),(d),(e) | 406,000 | 416,150 | ||||||||
10.50%, 03/01/21 (c),(d),(e) | 780,000 | 664,950 | ||||||||
|
| |||||||||
| 1,081,100 | ||||||||||
|
| |||||||||
Construction Materials Manufacturing — 0.0% |
| |||||||||
NWH Escrow Corp., 7.50%, 08/01/21 (d),(e) | 420,000 | 394,800 | ||||||||
|
| |||||||||
Consumer Finance — 0.1% |
| |||||||||
DFC Finance Corp., 10.50%, 06/15/20 (d),(e) | 1,700,000 | 1,330,250 | ||||||||
Springleaf Finance Corp., 5.25%, 12/15/19 (c),(d) | 379,000 | 374,736 | ||||||||
|
| |||||||||
| 1,704,986 | ||||||||||
|
| |||||||||
Consumer Services — 0.0% |
| |||||||||
Quad/Graphics, Inc., 7.00%, 05/01/22 (d),(e) | 337,000 | 324,362 | ||||||||
RR Donnelley & Sons Co., 6.00%, 04/01/24 (a),(d) | 73,000 | 75,373 | ||||||||
|
| |||||||||
| 399,735 | ||||||||||
|
| |||||||||
See Notes to Consolidated Financial Statements.
56
Blackstone Alternative Multi-Manager Fund and Subsidiaries
Consolidated Schedule of Investments (Continued)
March 31, 2015
Security Description | Principal Amount | Value | ||||||||
Containers & Packaging — 0.0% |
| |||||||||
Owens-Brockway Glass Container, Inc., | ||||||||||
5.00%, 01/15/22 (d),(e) | $ | 135,000 | $ | 137,518 | ||||||
5.38%, 01/15/25 (c),(d),(e) | 135,000 | 138,712 | ||||||||
|
| |||||||||
| 276,230 | ||||||||||
|
| |||||||||
Entertainment Resources — 0.1% |
| |||||||||
Mohegan Tribal Gaming Authority, PIK, 11.00%, 09/15/18 (a),(d),(e) | 1,299,000 | 1,295,752 | ||||||||
|
| |||||||||
Exploration & Production — 0.1% |
| |||||||||
Antero Resources Corp., 5.63%, 06/01/23 (c),(d),(e) | 200,000 | 198,250 | ||||||||
Newfield Exploration Co., 5.38%, 01/01/26 (c),(d) | 200,000 | 202,025 | ||||||||
Oasis Petroleum, Inc., 6.50%, 11/01/21 (c),(d) | 398,000 | 380,090 | ||||||||
Rice Energy, Inc., 7.25%, 05/01/23 (d),(e) | 189,000 | 189,000 | ||||||||
|
| |||||||||
| 969,365 | ||||||||||
|
| |||||||||
Financial Services — 0.8% |
| |||||||||
Harland Clarke Holdings Corp., | 380,000 | 368,600 | ||||||||
MF Global Holdings Ltd., | ||||||||||
02/01/16 (b),(d),(g),(h) | 18,472,000 | 5,541,600 | ||||||||
08/01/18 (b),(d),(g),(h) | 6,000,000 | 1,800,000 | ||||||||
08/08/16 (b),(d),(g),(h) | 4,000,000 | 1,220,000 | ||||||||
ROC Finance LLC / ROC Finance 1 Corp., 12.13%, 09/01/18 (a),(d),(e) | 1,762,000 | 1,845,695 | ||||||||
|
| |||||||||
| 10,775,895 | ||||||||||
|
| |||||||||
Food & Beverage — 0.1% |
| |||||||||
Dean Foods Co., 6.50%, 03/15/23 (c),(d),(e) | 420,000 | 422,100 | ||||||||
Post Holdings, Inc., | ||||||||||
6.75%, 12/01/21 (a),(d),(e) | 115,000 | 116,150 | ||||||||
7.38%, 02/15/22 (c),(d) | 335,000 | 346,725 | ||||||||
|
| |||||||||
| 884,975 | ||||||||||
|
| |||||||||
Hardware — 0.1% |
| |||||||||
Real Alloy Holding, Inc., 10.00%, 01/15/19 (d),(e) | 823,000 | 832,259 | ||||||||
|
| |||||||||
Health Care Facilities/Services — 0.2% |
| |||||||||
inVentiv Health, Inc., 11.00%, 08/15/18 (d),(e),(j) | 1,089,500 | 1,045,920 | ||||||||
Kindred Escrow Corp. II, 8.00%, 01/15/20 (a),(d),(e) | 460,000 | 493,637 | ||||||||
Universal Hospital Services, Inc., | 1,530,000 | 1,338,750 | ||||||||
|
| |||||||||
| 2,878,307 | ||||||||||
|
| |||||||||
See Notes to Consolidated Financial Statements.
57
Blackstone Alternative Multi-Manager Fund and Subsidiaries
Consolidated Schedule of Investments (Continued)
March 31, 2015
Security Description | Principal Amount | Value | ||||||||
Home Improvement — 0.1% |
| |||||||||
Apex Tool Group LLC, 7.00%, 02/01/21 (d),(e) | $ | 190,000 | $ | 178,600 | ||||||
Empire Today LLC / Empire Today Finance Corp., 11.38%, 02/01/17 (d),(e) | 570,000 | 460,275 | ||||||||
|
| |||||||||
| 638,875 | ||||||||||
|
| |||||||||
Industrial Other — 0.1% | ||||||||||
Sabine Pass Liquefaction LLC, | 525,000 | 518,438 | ||||||||
|
| |||||||||
Internet Media — 0.0% | ||||||||||
VeriSign, Inc., 5.25%, 04/01/25 (c),(d),(e) | 190,000 | 194,275 | ||||||||
|
| |||||||||
Machinery Manufacturing — 0.0% | ||||||||||
Renaissance Acquisition Corp., | 190,000 | 172,425 | ||||||||
|
| |||||||||
Mass Merchants — 0.0% | ||||||||||
Family Tree Escrow LLC, 5.75%, 03/01/23 (d),(e) | 105,000 | 110,250 | ||||||||
|
| |||||||||
Metals & Mining — 0.1% | ||||||||||
AK Steel Corp., | ||||||||||
7.63%, 05/15/20 - 10/01/21 (c),(d) | 1,484,000 | 1,239,790 | ||||||||
8.38%, 04/01/22 (d) | 27,000 | 22,275 | ||||||||
|
| |||||||||
| 1,262,065 | ||||||||||
|
| |||||||||
Pharmaceuticals — 0.0% | ||||||||||
Endo Finance LLC / Endo Finco, Co., | 330,000 | 329,175 | ||||||||
|
| |||||||||
Pipeline — 0.0% | ||||||||||
Crestwood Midstream Partners LP / Crestwood Midstream Finance Corp., 6.25%, 04/01/23 (d),(e) | 100,000 | 101,000 | ||||||||
|
| |||||||||
Publishing & Broadcasting — 0.6% | ||||||||||
American Media, Inc., 11.50%, 12/15/17 (a),(d) | 2,890,000 | 2,947,800 | ||||||||
Knight Ridder, Inc., 5.75%, 09/01/17 (a),(d) | 586,000 | 610,905 | ||||||||
LBI Media, Inc., | ||||||||||
10.00%, 04/15/19 (d),(e) | 1,985,000 | 2,069,362 | ||||||||
13.50%, 04/15/20 (d),(e) | 594,000 | 611,820 | ||||||||
Lee Enterprises, Inc., 9.50%, 03/15/22 (a),(d),(e) | 1,148,000 | 1,185,310 | ||||||||
McClatchy Co., 9.00%, 12/15/22 (c),(d) | 892,000 | 860,780 | ||||||||
|
| |||||||||
| 8,285,977 | ||||||||||
|
| |||||||||
Railroad — 0.0% | ||||||||||
Florida East Coast Holdings Corp., | 125,000 | 125,938 | ||||||||
|
| |||||||||
See Notes to Consolidated Financial Statements.
58
Blackstone Alternative Multi-Manager Fund and Subsidiaries
Consolidated Schedule of Investments (Continued)
March 31, 2015
Security Description | Principal Amount | Value | ||||||||
Real Estate — 0.0% | ||||||||||
Kennedy-Wilson, Inc., 5.88%, 04/01/24 (d) | $ | 251,000 | $ | 251,628 | ||||||
|
| |||||||||
Retail—Consumer Discretionary — 0.6% | ||||||||||
Claire’s Stores, Inc., 9.00%, 03/15/19 (d),(e) | 2,162,000 | 1,962,015 | ||||||||
DriveTime Automotive Group, Inc. / DT Acceptance Corp., 8.00%, 06/01/21 (d),(e) | 6,046,000 | 5,758,815 | ||||||||
Netflix, Inc., 5.50%, 02/15/22 (a),(d),(e) | 200,000 | 204,500 | ||||||||
|
| |||||||||
| 7,925,330 | ||||||||||
|
| |||||||||
Software & Services — 0.1% | ||||||||||
iPayment, Inc., 9.50%, 12/15/19 (c),(d),(e) | 1,273,509 | 1,190,731 | ||||||||
|
| |||||||||
Supermarkets — 0.1% | ||||||||||
Rite Aid Corp., 6.13%, 04/01/23 (d),(e) | 665,000 | 681,625 | ||||||||
SUPERVALU, Inc., 7.75%, 11/15/22 (a),(c),(d) | 245,000 | 260,925 | ||||||||
|
| |||||||||
| 942,550 | ||||||||||
|
| |||||||||
Transportation & Logistics — 0.0% | ||||||||||
XPO Logistics, Inc., 7.88%, 09/01/19 (d),(e) | 440,000 | 465,300 | ||||||||
|
| |||||||||
Utilities — 0.1% | ||||||||||
AES Corp., 5.50%, 04/15/25 (d) | 950,000 | 940,500 | ||||||||
|
| |||||||||
Wireless Telecommunication Services — 0.3% | ||||||||||
Frontier Communications Corp., | 1,100,000 | 1,089,000 | ||||||||
Sprint Communications, Inc., 6.00%, 11/15/22 (c),(d) | 351,000 | 333,450 | ||||||||
Sprint Corp., | ||||||||||
7.63%, 02/15/25 (c),(d) | 420,000 | 418,425 | ||||||||
7.88%, 09/15/23 (c),(d) | 280,000 | 285,600 | ||||||||
Windstream Corp., | ||||||||||
6.38%, 08/01/23 (c),(d) | 603,000 | 543,791 | ||||||||
7.50%, 06/01/22 (c),(d) | 608,000 | 586,720 | ||||||||
7.75%, 10/01/21 (c),(d) | 247,000 | 246,012 | ||||||||
|
| |||||||||
| 3,502,998 | ||||||||||
|
| |||||||||
Total United States | 55,545,743 | |||||||||
|
| |||||||||
Venezuela — 0.4% | ||||||||||
Integrated Oils — 0.4% |
| |||||||||
Petroleos de Venezuela SA REG S, | 17,327,000 | 5,441,321 | ||||||||
|
| |||||||||
Total Venezuela | 5,441,321 | |||||||||
|
| |||||||||
TOTAL CORPORATE BONDS & NOTES | 87,811,651 | |||||||||
|
| |||||||||
See Notes to Consolidated Financial Statements.
59
Blackstone Alternative Multi-Manager Fund and Subsidiaries
Consolidated Schedule of Investments (Continued)
March 31, 2015
Security Description | Principal Amount | Value | ||||||||
SOVEREIGN DEBT— 3.1% | ||||||||||
Argentina Boden Bonds, 7.00%, 10/03/15 | $ | 7,773,000 | $ | 7,535,923 | ||||||
Argentina Bonar Bonds, 7.00%, 04/17/17 | 4,959,000 | 4,822,627 | ||||||||
Argentine Republic Government International Bond, 12/31/33 (b),(h),(k) | 4,966,019 | 4,968,502 | ||||||||
Ecuador Government International Bond REG S, 10.50%, 03/24/20 | 3,713,000 | 3,722,282 | ||||||||
Hellenic Republic Government Bond, 3.00%, 02/24/24 - 02/24/42 (j) | 4,608,000 | EUR | 2,430,829 | |||||||
Hellenic Republic Government Bond REG S, 3.00%, 02/24/23 - 02/24/32 (j) | 512,000 | EUR | 285,763 | |||||||
Hungary Government International Bond, 5.38%, 03/25/24 | $ | 2,320,000 | 2,601,300 | |||||||
Pakistan Government International Bond REG S, 6.75%, 12/03/19 (k) | 4,393,000 | 4,466,240 | ||||||||
Portugal Obrigacoes do Tesouro OT REG S, 4.10%, 02/15/45 (e) | 3,720,000 | EUR | 5,398,867 | |||||||
Republic of Iraq REG S, 5.80%, 01/15/28 | $ | 6,095,000 | 5,089,325 | |||||||
|
| |||||||||
TOTAL SOVEREIGN DEBT | 41,321,658 | |||||||||
|
| |||||||||
MORTGAGE-BACKED SECURITIES — 24.3% | ||||||||||
Cayman Islands — 1.6% | ||||||||||
Collateralized Debt Obligation (Commercial) — 1.2% | ||||||||||
Gramercy Real Estate CDO Ltd., Series 2007-1A, Class A1, 0.54%, 08/15/56 (d),(e),(f) | 1,481,022 | 1,318,998 | ||||||||
N-Star REL CDO VI Ltd., Series 2006-6A, Class B, 0.71%, 06/16/41 (d),(e),(f) | 1,936,000 | 1,631,661 | ||||||||
NorthStar Real Estate CDO Ltd., Series 2013-1A, Class B, 5.17%, 08/25/29 (d),(e),(f) | 1,000,000 | 1,002,100 | ||||||||
RAIT CRE CDO I Ltd., Series 2006-1A, Class A2, 0.53%, 11/20/46 (d),(e),(f),(g) | 474,000 | 406,550 | ||||||||
Resource Capital Corp. Ltd., | ||||||||||
Series 2014-CRE2, Class B, | 1,329,000 | 1,314,248 | ||||||||
Series 2015-CRE3, Class D, | 2,100,000 | 2,100,000 | ||||||||
SRERS Funding Ltd., Series 2011-RS, Class A1B1, 0.43%, 05/09/46 (d),(e),(f),(k) | 8,016,807 | 7,753,855 | ||||||||
|
| |||||||||
| 15,527,412 | ||||||||||
|
| |||||||||
Commercial Mortgage-Backed Securities — 0.4% | ||||||||||
PFP III Ltd., Series 2014-1, Class D, | 5,300,000 | 5,315,900 | ||||||||
|
| |||||||||
Total Cayman Islands | 20,843,312 | |||||||||
|
| |||||||||
See Notes to Consolidated Financial Statements.
60
Blackstone Alternative Multi-Manager Fund and Subsidiaries
Consolidated Schedule of Investments (Continued)
March 31, 2015
Security Description | Principal Amount | Value | ||||||||
United States — 22.7% | ||||||||||
Collateralized Debt Obligation (Commercial) — 0.1% | ||||||||||
Arbor Realty Mortgage Securities LLC, Series 2006-1A, Class A2, 0.57%, 01/26/42 (d),(e),(f),(k) | $ | 887,970 | $ | 870,832 | ||||||
|
| |||||||||
Collateralized Mortgage Obligation (Residential) — 13.1% | ||||||||||
Adjustable Rate Mortgage Trust, Series 2005-1, Class 2A1, 2.75%, 05/25/35 (d),(f) | 2,037,212 | 2,013,784 | ||||||||
Banc of America Alternative Loan Trust, Series 2005-6, Class 2CB2, 6.00%, 07/25/35 (d) | 739,604 | 707,875 | ||||||||
Banc of America Funding Corp., | ||||||||||
Series 2006-A, Class 3A2, 2.77%, 02/20/36 (d),(f) | 1,182,918 | 987,736 | ||||||||
Series 2006-H, Class 2A3, 2.78%, 09/20/46 (d),(f) | 5,750,493 | 4,922,422 | ||||||||
Series 2006-I, Class 6A1, 0.37%, 10/20/46 (d),(f) | 753,529 | 602,447 | ||||||||
Chase Mortgage Finance Trust, Series 2007-A2, Class 3A2, 2.56%, 07/25/37 (d),(f) | 502,277 | 477,113 | ||||||||
Citicorp Mortgage Securities REMIC Pass-Through Certificates Trust, Series 2005-7, Class 1A4, 5.50%, 10/25/35 (d) | 608,134 | 614,033 | ||||||||
Citicorp Mortgage Securities Trust, | ||||||||||
Series 2006-3, Class 1A10, 6.25%, 06/25/36 (d) | 3,382,885 | 3,477,605 | ||||||||
Series 2007-1, Class 1A3, 5.75%, 01/25/37 (d) | 879,854 | 894,371 | ||||||||
Connecticut Avenue Securities, | ||||||||||
Series 2014-C02, Class 1M2, 2.77%, 05/25/24 (d),(f),(k) | 7,651,567 | 6,992,767 | ||||||||
Series 2014-C03, Class 1M2, 3.17%, 07/25/24 (d),(f),(k) | 10,739,817 | 10,105,094 | ||||||||
Series 2014-C03, Class 2M2, 3.07%, 07/25/24 (d),(f),(k) | 23,987,452 | 22,411,476 | ||||||||
Series 2014-C04, Class 2M2, 5.17%, 11/25/24 (d),(f),(k) | 1,365,420 | 1,433,418 | ||||||||
Series 2015-C01, Class 1M2, 4.47%, 02/25/25 (d),(f),(k) | 11,759,329 | 11,966,293 | ||||||||
Series 2015-C01, Class 2M2, 4.72%, 02/25/25 (d),(f),(k) | 16,108,671 | 16,458,229 | ||||||||
Countrywide Alternative Loan Trust, | ||||||||||
Series 2005-21CB, Class A17 SEQ, 6.00%, 06/25/35 (d) | 853,010 | 862,564 | ||||||||
Series 2005-J2, Class 1A5, 0.67%, 04/25/35 (d),(f) | 1,044,822 | 926,234 | ||||||||
Countrywide Asset-Backed Certificates, Series 2006-BC4, Class 2A2, 0.33%, 11/25/36 (d),(f) | 2,284,835 | 2,124,212 | ||||||||
Countrywide Home Loans Mortgage Pass-Through Trust, Series 2005-19, Class 1A1, 5.50%, 08/25/35 (d) | 264,930 | 266,520 | ||||||||
See Notes to Consolidated Financial Statements.
61
Blackstone Alternative Multi-Manager Fund and Subsidiaries
Consolidated Schedule of Investments (Continued)
March 31, 2015
Security Description | Principal Amount | Value | ||||||||
First Horizon Alternative Mortgage Securities Trust, Series 2005-AA7, Class 2A1, 2.24%, 09/25/35 (d),(f) | $ | 6,075,669 | $ | 5,468,102 | ||||||
GSR Mortgage Loan Trust, Series 2005-AR6, Class 3A2, 2.68%, 09/25/35 (d),(f) | 449,657 | 438,640 | ||||||||
JP Morgan Alternative Loan Trust, | ||||||||||
Series 2005-A2, Class 1A1, 0.69%, 01/25/36 (d),(f) | 125,503 | 116,254 | ||||||||
Series 2006-S4, Class A3A, 5.78%, 12/25/36 (d),(f),(j) | 616,517 | 581,684 | ||||||||
Series 2006-S4, Class A6, 5.71%, 12/25/36 (d),(f),(j) | 418,634 | 405,028 | ||||||||
JP Morgan Mortgage Acquisition Trust, Series 2007-CH1, Class AF3 SEQ, 4.51%, 11/25/36 (d),(f),(j) | 580,556 | 596,870 | ||||||||
JP Morgan Mortgage Trust, Series 2007-A1, Class 5A6, 2.56%, 07/25/35 (d),(f) | 286,622 | 278,166 | ||||||||
Morgan Stanley Mortgage Loan Trust, Series 2005-11AR, Class A1, 0.45%, 01/25/36 (d),(f) | 1,102,615 | 832,695 | ||||||||
PHH Mortgage Pass-Through Certificates Trust, Series 2008-CIM1, Class 21A2, 6.00%, 05/25/38 (d) | 428,823 | 441,473 | ||||||||
RALI Trust, Series 2005-QA13, Class 2A1, 3.55%, 12/25/35 (d),(f) | 1,440,595 | 1,240,352 | ||||||||
Structured Agency Credit Risk, | ||||||||||
Series 2013-DN2, Class M2, 4.42%, 11/25/23 (d),(f),(k) | 17,722,350 | 18,216,804 | ||||||||
Series 2014-DN1, Class M3, 4.67%, 02/25/24 (d),(f),(k) | 3,346,943 | 3,479,817 | ||||||||
Series 2014-DN3, Class M2, 2.57%, 08/25/24 (d),(f),(k) | 2,500,000 | 2,530,500 | ||||||||
Series 2014-DN4, Class M3, 4.72%, 10/25/24 (d),(f) | 3,299,885 | 3,412,081 | ||||||||
Series 2014-HQ1, Class M2, | 7,500,000 | 7,554,750 | ||||||||
Series 2014-HQ2, Class M3, 3.92%, 09/25/24 (d),(f),(k) | 3,909,266 | 3,818,571 | ||||||||
Series 2015-DN1, Class M3, 4.32%, 01/25/25 (d),(f) | 4,922,040 | 5,054,935 | ||||||||
Series 2015-HQ1, Class M3, 3.97%, 03/25/25 (d),(f) | 2,234,334 | 2,248,634 | ||||||||
Structured Asset Securities Corp. Trust, | ||||||||||
Series 2005-4XS, Class 1A3, 5.00%, 03/25/35 (d),(f),(j) | 357,324 | 360,183 | ||||||||
Series 2005-6, Class 2A1, 5.50%, 05/25/35 (d) | 496,313 | 511,699 | ||||||||
WaMu Mortgage Pass-Through Certificates Trust, | ||||||||||
Series 2006-AR11, Class 3A1A, 1.05%, 09/25/46 (d),(f) | 7,105,482 | 5,943,735 | ||||||||
See Notes to Consolidated Financial Statements.
62
Blackstone Alternative Multi-Manager Fund and Subsidiaries
Consolidated Schedule of Investments (Continued)
March 31, 2015
Security Description | Principal Amount | Value | ||||||||
Series 2006-AR19, Class 1A, 0.87%, 01/25/47 (d),(f) | $ | 3,597,249 | $ | 2,973,127 | ||||||
Series 2006-AR7, Class 2A, 1.11%, 07/25/46 (d),(f) | 5,129,231 | 4,308,555 | ||||||||
Series 2006-AR9, Class 1A, 1.13%, 08/25/46 (d),(f) | 8,069,053 | 7,103,187 | ||||||||
Series 2007-OA1, Class A1A, 0.83%, 02/25/47 (d),(f) | 5,221,432 | 4,273,742 | ||||||||
Series 2007-OA6, Class 1A, 0.94%, 07/25/47 (d),(f) | 1,678,383 | 1,435,018 | ||||||||
Wells Fargo Mortgage-Backed Securities Trust, | ||||||||||
Series 2005-9, Class 1A12, 5.50%, 10/25/35 (d) | 137,018 | 139,758 | ||||||||
Series 2006-13, Class A5, 6.00%, 10/25/36 (d) | 470,806 | 487,519 | ||||||||
Series 2007-12, Class A6, 5.50%, 09/25/37 (d) | 310,809 | 320,445 | ||||||||
Series 2007-14, Class 1A1, 6.00%, 10/25/37 (d) | 569,650 | 577,055 | ||||||||
Series 2007-16, Class 1A7, 6.00%, 12/28/37 (d) | 365,223 | 380,307 | ||||||||
|
| |||||||||
| 173,773,879 | ||||||||||
|
| |||||||||
Commercial Mortgage-Backed Securities — 8.3% | ||||||||||
BAMLL Commercial Mortgage Securities Trust, | ||||||||||
Series 2013-DSNY, Class F, 3.68%, 09/15/26 (d),(e),(f) | 900,000 | 902,520 | ||||||||
Series 2014-ICTS, Class E, 3.12%, 06/15/28 (d),(e),(f) | 900,000 | 896,580 | ||||||||
Series 2014-INLD, Class D, 3.67%, 12/15/29 (d),(e),(f) | 2,400,000 | 2,410,320 | ||||||||
BAMLL Mezzanine Securities Trust, Series 2015-ASMB, Class MZB, 9.10%, 01/09/17 (d),(e),(f),(g) | 11,925,000 | 11,930,962 | ||||||||
Banc of America Commercial Mortgage Trust, Series 2007-2, Class AJ, 5.60%, 04/10/49 (a),(f),(k) | 1,731,754 | 1,747,340 | ||||||||
Bear Stearns Commercial Mortgage Securities Trust, | ||||||||||
Series 2005-PW10, Class AJ, 5.45%, 12/11/40 (d),(f),(k) | 5,413,708 | 5,373,647 | ||||||||
Series 2006-PW14, Class B, 5.33%, 12/11/38 (d),(e) | 36,000 | 33,224 | ||||||||
Series 2007-PW15, Class AM SEQ, 5.36%, 02/11/44 (k) | 2,641,841 | 2,738,532 | ||||||||
Series 2007-PW15, Class AMFX SEQ, 5.36%, 02/11/44 (e) | 925,774 | 961,046 | ||||||||
Boca Hotel Portfolio Trust, Series 2013-BOCA, Class E, 3.92%, 08/15/26 (d),(e),(f) | 1,000,000 | 1,002,600 | ||||||||
CD Commercial Mortgage Trust, Series 2007-CD4, Class AJ, 5.40%, 12/11/49 (d),(f),(k) | 3,517,000 | 2,981,361 | ||||||||
CDGJ Commercial Mortgage Trust, Series 2014-BXCH, Class DPB, 4.02%, 12/15/27 (d),(e),(f) | 3,450,000 | 3,463,800 | ||||||||
See Notes to Consolidated Financial Statements.
63
Blackstone Alternative Multi-Manager Fund and Subsidiaries
Consolidated Schedule of Investments (Continued)
March 31, 2015
Security Description | Principal Amount | Value | ||||||||
CGBAM Commercial Mortgage Trust, Series 2014-HD, Class E, 3.17%, 02/15/31 (d),(e),(f),(k) | $ | 1,590,000 | $ | 1,581,573 | ||||||
Citigroup Commercial Mortgage Trust, Series 2006-C5, Class AJ SEQ, 5.48%, 10/15/49 (a) | 1,761,523 | 1,748,488 | ||||||||
COBALT CMBS Commercial Mortgage Trust, Series 2006-C1, Class AM SEQ, 5.25%, 08/15/48 (a) | 3,251,226 | 3,347,137 | ||||||||
Commercial Mortgage Loan Trust, Series 2008-LS1, Class AM, 6.03%, 12/10/49 (f),(k) | 2,647,992 | 2,721,341 | ||||||||
Commercial Mortgage Trust, | ||||||||||
Series 2000-C1, Class G, 6.85%, 08/15/33 (d),(e),(f) | 407,905 | 415,247 | ||||||||
Series 2014-PAT, Class E, 3.33%, 08/13/27 (d),(e),(f) | 4,800,000 | 4,814,400 | ||||||||
Credit Suisse Commercial Mortgage Trust, Series 2007-C1, Class AM, 5.42%, 02/15/40 (a) | 646,307 | 667,053 | ||||||||
Credit Suisse Commercial Mortgage Trust, | ||||||||||
Series 2007-C1, Class AMFX, 5.42%, 02/15/40 (k) | 1,609,824 | 1,660,211 | ||||||||
Series 2007-C5, Class A1AM, 5.87%, 09/15/40 (f),(k) | 1,076,886 | 1,107,254 | ||||||||
Series 2007-C5, Class AM, 5.87%, 09/15/40 (f),(k) | 1,126,578 | 1,167,923 | ||||||||
Credit Suisse Commercial Mortgage Trust Series, Series 2006-C5, Class AJ SEQ, 5.37%, 12/15/39 | 1,607,871 | 1,568,961 | ||||||||
Credit Suisse Mortgage Trust, | ||||||||||
Series 2006-C4, Class AJ, 5.54%, 09/15/39 (a),(d),(f) | 5,887,489 | 5,958,139 | ||||||||
Series 2007-C1, Class AMFL, 0.37%, 02/15/40 (d),(f) | 39,000 | 35,104 | ||||||||
GCCFC Commercial Mortgage Trust, | ||||||||||
Series 2007-GG11, Class AJ, 6.02%, 12/10/49 (d),(f) | 5,170,000 | 5,434,187 | ||||||||
Series 2007-GG9, Class AJ, 5.51%, 03/10/39 (f) | 1,632,369 | 1,554,342 | ||||||||
GE Capital Commercial Mortgage Corp., Series 2005-C3, Class G, 5.15%, 07/10/45 (d),(e),(f) | 1,500,000 | 1,506,600 | ||||||||
GS Mortgage Securities Corp. III, Series 2005-GG4, Class D, 4.94%, 07/10/39 (d),(f) | 72,000 | 70,819 | ||||||||
GS Mortgage Securities Trust, | ||||||||||
Series 2006-GG6, Class D, 5.55%, 04/10/38 (d),(f) | 1,009,000 | 992,251 | ||||||||
Series 2007-GG10, Class AM, 5.80%, 08/10/45 (f),(k) | 3,353,656 | 3,451,583 | ||||||||
Hilton Mortgage Trust, Series 2014-ORL, Class F, 3.92%, 07/15/29 (e),(f) | 1,410,840 | 1,369,220 | ||||||||
Hilton USA Trust, | ||||||||||
Series 2013-HLF, Class EFL, 3.92%, 11/05/30 (d),(e),(f) | 3,380,145 | 3,380,145 | ||||||||
See Notes to Consolidated Financial Statements.
64
Blackstone Alternative Multi-Manager Fund and Subsidiaries
Consolidated Schedule of Investments (Continued)
March 31, 2015
Security Description | Principal Amount | Value | ||||||||
Series 2014-ORL, Class E, 3.42%, 07/15/29 (d),(e),(f),(k) | $ | 810,000 | $ | 810,000 | ||||||
Irvine Core Office Trust, Series 2013-IRV, Class F, 3.17%, 05/15/48 (e),(f) | 370,175 | 304,025 | ||||||||
JP Morgan Chase Commercial Mortgage Securities Trust, | ||||||||||
Series 2005-CB13, Class AJ, 5.33%, 01/12/43 (d),(f),(k) | 1,787,000 | 1,756,800 | ||||||||
Series 2006-CB15, Class AM, 5.86%, 06/12/43 (d),(f) | 3,474,891 | 3,550,991 | ||||||||
Series 2006-LDP8, Class C, 5.55%, 05/15/45 (d),(f) | 1,300,000 | 1,293,630 | ||||||||
Series 2007-LD11, Class AM, 5.78%, 06/15/49 (f),(k) | 2,932,016 | 3,083,015 | ||||||||
Series 2013-JWRZ, Class E, 3.91%, 04/15/30 (d),(e),(f) | 600,000 | 600,780 | ||||||||
Merrill Lynch Mortgage Trust, Series 2007-C1, Class AM, 5.84%, 06/12/50 (f),(k) | 2,792,446 | 2,910,008 | ||||||||
ML-CFC Commercial Mortgage Trust, Series 2007-8, Class AMA, 5.87%, 08/12/49 (a),(f),(k) | 3,571,880 | 3,686,537 | ||||||||
Morgan Stanley Bank of America Merrill Lynch Trust, Series 2015-C21, Class D, 4.16%, 03/15/48 (d),(e),(f),(k) | 2,145,000 | 1,960,530 | ||||||||
Morgan Stanley Capital I Trust, | ||||||||||
Series 2007-HQ13, Class AM, 5.93%, 12/15/44 (f) | 305,754 | 313,948 | ||||||||
Series 2007-IQ14, Class AM SEQ, 5.65%, 04/15/49 (a),(f),(k) | 1,419,327 | 1,491,003 | ||||||||
Series 2007-IQ16, Class AJFX, 6.13%, 12/12/49 (f) | 1,889,750 | 1,850,065 | ||||||||
Series 2007-T25, Class AJ, 5.57%, 11/12/49 (d),(f) | 6,000,000 | 6,130,800 | ||||||||
Wachovia Bank Commercial Mortgage Trust, | ||||||||||
Series 2005-C22, Class B, 5.36%, 12/15/44 (d),(f) | 270,000 | 269,109 | ||||||||
Series 2005-C22, Class C, 5.36%, 12/15/44 (d),(f) | 147,000 | 140,018 | ||||||||
Wells Fargo Commercial Mortgage Trust, Series 2015-LC20, Class D, 4.51%, 04/15/50 (d),(f) | 2,125,000 | 1,942,888 | ||||||||
|
| |||||||||
| 111,088,057 | ||||||||||
|
| |||||||||
Interest Only Commercial Mortgage-Backed Securities — 1.2% | ||||||||||
Commercial Mortgage Trust, | ||||||||||
Series 2014-CR18, Class XA, 1.30%, 07/15/47 (d),(f),(k) | 43,781,284 | 3,371,159 | ||||||||
Series 2014-LC17, Class XA, 1.03%, 10/10/47 (d),(f) | 5,247,558 | 310,131 | ||||||||
Series 2014-UBS4, Class XA, 1.29%, 08/10/47 (d),(f),(k) | 71,175,194 | 5,736,721 | ||||||||
See Notes to Consolidated Financial Statements.
65
Blackstone Alternative Multi-Manager Fund and Subsidiaries
Consolidated Schedule of Investments (Continued)
March 31, 2015
Security Description | Principal Amount | Value | ||||||||
Series 2014-UBS5, Class XA, 1.11%, 09/10/47 (d),(f) | $ | 10,949,528 | $ | 733,618 | ||||||
CSAIL Commercial Mortgage Trust, Series 2015-C1, Class XA, 1.12%, 04/15/50 (d),(f) | 6,760,000 | 473,876 | ||||||||
GS Mortgage Securities Trust, Series 2014-GC24, Class XA, 0.90%, 09/10/47 (d),(f),(k) | 23,743,793 | 1,400,884 | ||||||||
JPMBB Commercial Mortgage Securities Trust, | ||||||||||
Series 2014-C21, Class XA, 1.13%, 08/15/47 (d),(f) | 8,398,417 | 649,197 | ||||||||
Series 2014-C22, Class XA, 0.99%, 09/15/47 (d),(f) | 8,190,796 | 549,602 | ||||||||
Morgan Stanley Bank of America Merrill Lynch Trust, | ||||||||||
Series 2014-C17, Class XA, 1.28%, 08/15/47 (d),(f) | 15,869,262 | 1,223,520 | ||||||||
Series 2014-C19, Class XA, 1.17%, 12/15/47 (d),(f),(k) | 21,496,923 | 1,592,922 | ||||||||
WFRBS Commercial Mortgage Trust, Series 2014-C22, Class XA, 0.97%, 09/15/57 (d),(f) | 5,404,965 | 350,242 | ||||||||
|
| |||||||||
| 16,391,872 | ||||||||||
|
| |||||||||
Total United States | 302,124,640 | |||||||||
|
| |||||||||
TOTAL MORTGAGE-BACKED SECURITIES | 322,967,952 | |||||||||
|
| |||||||||
U.S. GOVERNMENT SPONSORED AGENCY SECURITIES — 2.1% | ||||||||||
United States — 2.1% | ||||||||||
Interest Only Collateralized Mortgage Obligations (Residential) — 1.5% | ||||||||||
Federal Home Loan Mortgage Corp., | ||||||||||
Series 4029, Class MI, 4.00%, 04/15/41 (d) | 14,776,361 | 2,547,445 | ||||||||
Series 4123, Class IP, 4.50%, 07/15/42 (d) | 4,834,433 | 1,052,456 | ||||||||
Series 4141, Class HI, 3.50%, 10/15/42 (d) | 12,092,793 | 1,975,962 | ||||||||
Series 4172, Class PI, 3.00%, 07/15/40 (d) | 20,495,384 | 2,014,696 | ||||||||
Series 4194, Class GI, 4.00%, 04/15/43 (d) | 12,780,141 | 2,406,501 | ||||||||
Series 4257, Class IK, 4.00%, 12/15/42 (d) | 13,266,312 | 2,638,669 | ||||||||
Federal National Mortgage Association, | ||||||||||
Series 2012-12, Class PI, 4.50%, 08/25/40 (d) | 12,410,139 | 2,145,713 | ||||||||
Series 2012-148, Class CI, 3.00%, 11/25/42 (d) | 17,647,695 | 1,831,831 | ||||||||
Series 2013-54, Class IN, 3.50%, 03/25/43 (d) | 14,347,723 | 2,061,768 | ||||||||
Series 2013-83, Class PI, 3.00%, 10/25/41 (d) | 9,125,455 | 890,644 | ||||||||
|
| |||||||||
| 19,565,685 | ||||||||||
|
| |||||||||
Inverse Interest Only Collateralized Mortgage Obligations (Residential) — 0.6% | ||||||||||
Federal Home Loan Mortgage Corp., | ||||||||||
Series 4094, Class SK, 5.88%, 08/15/42 (d),(f) | 1,463,879 | 348,403 | ||||||||
Series 4132, Class ES, 5.98%, 11/15/42 (d),(f) | 5,158,495 | 1,209,667 | ||||||||
See Notes to Consolidated Financial Statements.
66
Blackstone Alternative Multi-Manager Fund and Subsidiaries
Consolidated Schedule of Investments (Continued)
March 31, 2015
Security Description | Principal Amount | Value | ||||||||
Federal National Mortgage Association, | ||||||||||
Series 2012-111, Class ES, 5.98%, 12/25/41 (d),(f) | $ | 9,675,975 | $ | 1,805,537 | ||||||
Series 2013-84, Class PS, 5.98%, 11/25/42 (d),(f) | 13,108,382 | 2,369,995 | ||||||||
Series 2014-73, Class AS, 5.88%, 11/25/44 (d),(f) | 4,563,456 | 1,196,538 | ||||||||
Government National Mortgage Association, | ||||||||||
Series 2009-101, Class SB, 6.27%, 08/20/39 (d),(f) | 3,305,480 | 523,258 | ||||||||
Series 2010-61, Class SJ, 5.88%, 05/16/40 (d),(f) | 3,343,861 | 556,084 | ||||||||
Series 2011-56, Class SI, 6.47%, 04/20/41 (d),(f) | 2,887,471 | 554,972 | ||||||||
|
| |||||||||
| 8,564,454 | ||||||||||
|
| |||||||||
Total United States | 28,130,139 | |||||||||
|
| |||||||||
TOTAL U.S. GOVERNMENT SPONSORED AGENCY SECURITIES | 28,130,139 | |||||||||
|
| |||||||||
Security Description | Shares | Value | ||||||||
EXCHANGE-TRADED FUNDS — 0.2% | ||||||||||
Financial Select Sector SPDR Fund | 9,685 | 233,505 | ||||||||
iShares China Large-Cap ETF | 2,774 | 123,304 | ||||||||
iShares MSCI Japan ETF | 49,245 | 617,040 | ||||||||
iShares MSCI Taiwan ETF | 6,136 | 96,581 | ||||||||
iShares Russell 2000 ETF | 12,829 | 1,595,286 | ||||||||
|
| |||||||||
TOTAL EXCHANGE-TRADED FUND | 2,665,716 | |||||||||
|
| |||||||||
RIGHTS — 0.0% | ||||||||||
Sweden — 0.0% | ||||||||||
Com Hem Holding AB (b) | 17,723 | 204 | ||||||||
|
| |||||||||
TOTAL RIGHTS | 204 | |||||||||
|
| |||||||||
Security Description | Contracts | Value | ||||||||
PURCHASED OPTIONS — 0.5% | ||||||||||
Exchange-Traded Call Options — 0.3% | ||||||||||
American Realty Capital Property Strike Price 11.00 USD Expires 04/17/15 | 1,946 | 9,730 | ||||||||
Apple, Inc. Strike Price 125.00 USD Expires 05/01/15 | 654 | 298,878 | ||||||||
CBOE SPX Volatility Index Strike Price 15.00 USD Expires 04/15/15 | 327 | 57,225 | ||||||||
CBOE SPX Volatility Index Strike Price 17.00 USD Expires 06/17/15 | 655 | 180,125 | ||||||||
CBOE SPX Volatility Index Strike Price 18.00 USD Expires 05/20/15 | 322 | 62,790 | ||||||||
See Notes to Consolidated Financial Statements.
67
Blackstone Alternative Multi-Manager Fund and Subsidiaries
Consolidated Schedule of Investments (Continued)
March 31, 2015
Security Description | Contracts | Value | ||||||||
DAX Index Strike Price 12,200.00 EUR Expires 04/17/15 | 25 | $ | 14,287 | |||||||
Facebook, Inc. Strike Price 80.00 USD Expires 01/15/16 | 147 | 147,441 | ||||||||
Facebook, Inc. Strike Price 60.00 USD Expires 01/15/16 | 426 | 1,043,700 | ||||||||
Imperial Tobacco Group PLC Strike Price 30.00 GBP Expires 04/17/15 | 17 | 20,174 | ||||||||
Imperial Tobacco Group PLC Strike Price 31.00 GBP Expires 04/17/15 | 10 | 7,269 | ||||||||
Imperial Tobacco Group PLC Strike Price 32.00 GBP Expires 04/17/15 | 40 | 17,356 | ||||||||
Imperial Tobacco Group PLC Strike Price 33.00 GBP Expires 05/15/15 | 18 | 7,743 | ||||||||
Lloyds Banking Group PLC Strike Price 82.00 GBP Expires 06/19/15 | 3,187 | 130,009 | ||||||||
S&P 500 Index Strike Price 2,150.00 USD Expires 05/15/15 | 15 | 7,350 | ||||||||
Smith & Nephew PLC Strike Price 12.50 GBP Expires 04/17/15 | 60 | 3,560 | ||||||||
Yahoo, Inc. Strike Price 35.00 USD Expires 01/15/16 | 1,191 | 1,322,010 | ||||||||
|
| |||||||||
| 3,329,647 | ||||||||||
|
| |||||||||
Exchange-Traded Put Options — 0.1% | ||||||||||
Euro Stoxx 50 Index Strike Price 3,200.00 EUR Expires 04/17/15 | 34 | 1,097 | ||||||||
Euro Stoxx 50 Index Strike Price 3,625.00 EUR Expires 05/15/15 | 18 | 16,761 | ||||||||
FTSE 100 Index Strike Price 6,950.00 GBP Expires 06/19/15 | 18 | 81,572 | ||||||||
iShares Russell 2000 ETF Strike Price 110.00 USD Expires 05/15/15 | 196 | 7,056 | ||||||||
iShares Russell 2000 ETF Strike Price 124.00 USD Expires 05/15/15 | 196 | 53,900 | ||||||||
S&P 500 Index Strike Price 2,000.00 USD Expires 04/17/15 | 58 | 46,400 | ||||||||
S&P 500 Index Strike Price 1,950.00 USD Expires 04/30/15 | 38 | 29,640 | ||||||||
S&P 500 Index Strike Price 2,025.00 USD Expires 04/17/15 | 32 | 38,880 | ||||||||
S&P 500 Index Strike Price 2,030.00 USD Expires 04/17/15 | 261 | 349,740 | ||||||||
S&P 500 Index Strike Price 1,850.00 USD Expires 06/19/15 | 97 | 136,770 | ||||||||
SPDR S&P 500 ETF Trust Strike Price 197.00 USD Expires 04/17/15 | 327 | 15,696 | ||||||||
See Notes to Consolidated Financial Statements.
68
Blackstone Alternative Multi-Manager Fund and Subsidiaries
Consolidated Schedule of Investments (Continued)
March 31, 2015
Security Description | Contracts | Value | ||||||||
SPDR S&P 500 ETF Trust Strike Price 207.00 USD Expires 04/10/15 | 983 | $ | 226,090 | |||||||
SPDR S&P 500 ETF Trust Strike Price 207.00 USD Expires 04/17/15 | 327 | 88,944 | ||||||||
SPDR S&P 500 ETF Trust Strike Price 207.50 USD Expires 04/02/15 | 656 | 101,680 | ||||||||
SPDR S&P 500 ETF Trust Strike Price 188.00 USD Expires 05/15/15 | 524 | 36,680 | ||||||||
SPDR S&P 500 ETF Trust Strike Price 203.00 USD Expires 05/15/15 | 524 | 158,772 | ||||||||
|
| |||||||||
| 1,389,678 | ||||||||||
|
| |||||||||
Security Description | Notional Amount | Value | ||||||||
FX OTC Call Options — 0.1% | ||||||||||
USD/BRL Currency Strike Price 2.60 BRL Expires 12/31/15 Counterparty JPMorgan Chase Bank, N.A. | 1,895,400 | USD | 471,103 | |||||||
USD/CNH Currency Strike Price 6.30 CNH Expires 11/05/15 Counterparty JPMorgan Chase Bank, N.A. | 9,340,000 | USD | 142,626 | |||||||
USD/CNH Currency Strike Price 6.40 CNH Expires 11/05/15 Counterparty Morgan Stanley Capital Services LLC | 7,660,200 | USD | 79,791 | |||||||
USD/CNH Currency Strike Price 6.40 CNH Expires 11/06/17 Counterparty Morgan Stanley Capital Services LLC | 8,500,000 | USD | 472,325 | |||||||
USD/CNH Currency Strike Price 6.80 CNH Expires 11/05/15 Counterparty Morgan Stanley Capital Services LLC | 12,140,000 | USD | 45,224 | |||||||
USD/JPY Currency Strike Price 124.00 JPY Expires 01/12/16 Counterparty Morgan Stanley Capital Services LLC | 5,390,000 | USD | 110,186 | |||||||
|
| |||||||||
| 1,321,255 | ||||||||||
|
| |||||||||
FX OTC Put Options — 0.0% | ||||||||||
EUR/USD Currency Strike Price 1.05 USD Expires 06/30/15 Counterparty JPMorgan Chase Bank, N.A. | 5,446,928 | EUR | 87,100 | |||||||
USD/BRL Currency Strike Price 2.40 BRL Expires 12/31/15 Counterparty Morgan Stanley Capital Services LLC | 1,895,400 | USD | 425 | |||||||
|
| |||||||||
| 87,525 | ||||||||||
|
| |||||||||
Security Description | Contracts | Value | ||||||||
OTC Put Options — 0.0% | ||||||||||
BSK/KE Strike Price 2,950.00 USD Expires 06/19/15 Counterparty Credit Suisse International | 1,004 | 6,900 | ||||||||
See Notes to Consolidated Financial Statements.
69
Blackstone Alternative Multi-Manager Fund and Subsidiaries
Consolidated Schedule of Investments (Continued)
March 31, 2015
Security Description | Contracts | Value | ||||||||
BSK/KE Strike Price 3,050.00 USD Expires 04/17/15 Counterparty Credit Suisse International | 1,004 | $ | 218 | |||||||
Financial Select Sector SPDR Fund Strike Price 21.90 USD Expires 06/17/15 Counterparty Morgan Stanley & Co. International plc | 415,800 | 104,489 | ||||||||
iShares Russell 2000 Index 107.95 USD Expires 06/19/15 Counterparty JPMorgan Chase Bank, N.A. | 52,582 | 42,227 | ||||||||
iShares Trust Strike Price 111.00 USD Expires 09/18/15 Counterparty Morgan Stanley & Co. International plc | 53,200 | 114,003 | ||||||||
KOSPI 200 Index Strike Price 232.83 KRW Expires 09/10/15 Counterparty JPMorgan Chase Bank, N.A. | 29,389,535 | 46,598 | ||||||||
|
| |||||||||
| 314,435 | �� | |||||||||
|
| |||||||||
TOTAL PURCHASED OPTIONS | 6,442,540 | |||||||||
|
| |||||||||
TOTAL INVESTMENTS IN SECURITIES — 90.2% | 1,199,589,671 | |||||||||
|
| |||||||||
TOTAL SECURITIES SOLD SHORT— (21.7)% | (289,246,390 | ) | ||||||||
|
| |||||||||
Other Assets (l) — 31.5% | 419,015,615 | |||||||||
|
| |||||||||
Net Assets — 100.0% | $ | 1,329,358,896 | ||||||||
|
| |||||||||
Security Description | Shares | Value | ||||||||
SECURITIES SOLD SHORT — (21.7)% | ||||||||||
COMMON STOCK — (17.8)% | ||||||||||
Argentina — (0.0)% | ||||||||||
Gaming, Lodging & Restaurants — (0.0)% | ||||||||||
Arcos Dorados Holdings, Inc. A Shares | 8,700 | $ | (42,891 | ) | ||||||
|
| |||||||||
Total Argentina | (42,891 | ) | ||||||||
|
| |||||||||
Australia — (0.1)% | ||||||||||
Banking — (0.0)% | ||||||||||
Westpac Banking Corp. ADR | 1,900 | (56,829 | ) | |||||||
|
| |||||||||
Iron & Steel — (0.1)% | ||||||||||
BHP Billiton Ltd. ADR | 19,000 | (882,930 | ) | |||||||
|
| |||||||||
Total Australia | (939,759 | ) | ||||||||
|
| |||||||||
Belgium — (0.2)% | ||||||||||
Consumer Products — (0.2)% | ||||||||||
Anheuser-Busch InBev NV ADR | 16,700 | (2,035,897 | ) | |||||||
|
| |||||||||
Software — (0.0)% | ||||||||||
Materialise NV ADR | 1,400 | (9,786 | ) | |||||||
|
| |||||||||
Total Belgium | (2,045,683 | ) | ||||||||
|
| |||||||||
See Notes to Consolidated Financial Statements.
70
Blackstone Alternative Multi-Manager Fund and Subsidiaries
Consolidated Schedule of Investments (Continued)
March 31, 2015
Security Description | Shares | Value | ||||||||
Bermuda — (0.1)% | ||||||||||
Insurance — (0.0)% | ||||||||||
Montpelier Re Holdings Ltd. | 12,500 | $ | (480,500 | ) | ||||||
|
| |||||||||
Transportation & Logistics — (0.1)% | ||||||||||
Golar LNG Ltd. | 18,900 | (628,992 | ) | |||||||
Knightsbridge Shipping Ltd. | 700 | (3,500 | ) | |||||||
|
| |||||||||
| (632,492 | ) | |||||||||
|
| |||||||||
Total Bermuda | (1,112,992 | ) | ||||||||
|
| |||||||||
Brazil — (0.2)% | ||||||||||
Banking — (0.1)% | ||||||||||
Banco Bradesco SA ADR | 39,096 | (362,811 | ) | |||||||
Banco Santander Brasil SA ADR | 5,300 | (23,373 | ) | |||||||
Itau Unibanco Holding SA ADR | 900 | (9,954 | ) | |||||||
|
| |||||||||
| (396,138 | ) | |||||||||
|
| |||||||||
Chemicals — (0.0)% | ||||||||||
Braskem SA ADR | 1,900 | (13,186 | ) | |||||||
|
| |||||||||
Consumer Products — (0.0)% | ||||||||||
AMBEV SA ADR | 27,100 | (156,096 | ) | |||||||
|
| |||||||||
Home & Office Products — (0.0)% | ||||||||||
Gafisa SA ADR | 700 | (924 | ) | |||||||
|
| |||||||||
Iron & Steel — (0.0)% | ||||||||||
Cia Siderurgica Nacional SA ADR | 86,800 | (145,824 | ) | |||||||
|
| |||||||||
Oil, Gas & Coal — (0.1)% | ||||||||||
Cosan Ltd. A Shares | 3,200 | (20,256 | ) | |||||||
Petroleo Brasileiro SA ADR | 260,100 | (1,563,201 | ) | |||||||
|
| |||||||||
| (1,583,457 | ) | |||||||||
|
| |||||||||
Passenger Transportation — (0.0)% | ||||||||||
Gol Linhas Aereas Inteligentes SA ADR | 20,400 | (49,572 | ) | |||||||
|
| |||||||||
Telecommunications — (0.0)% | ||||||||||
Oi SA ADR | 18,970 | (29,214 | ) | |||||||
|
| |||||||||
Total Brazil | (2,374,411 | ) | ||||||||
|
| |||||||||
Canada — (1.1)% | ||||||||||
Apparel & Textile Products — (0.0)% | ||||||||||
Gildan Activewear, Inc. | 12,400 | (366,048 | ) | |||||||
|
| |||||||||
Automotive — (0.0)% | ||||||||||
Westport Innovations, Inc. | 7,900 | (31,126 | ) | |||||||
|
| |||||||||
See Notes to Consolidated Financial Statements.
71
Blackstone Alternative Multi-Manager Fund and Subsidiaries
Consolidated Schedule of Investments (Continued)
March 31, 2015
Security Description | Shares | Value | ||||||||
Banking — (0.5)% | ||||||||||
Bank of Montreal | 5,800 | $ | (347,826 | ) | ||||||
Bank of Nova Scotia | 3,700 | (185,851 | ) | |||||||
Canadian Imperial Bank of Commerce | 2,100 | (152,250 | ) | |||||||
Royal Bank of Canada | 17,500 | (1,056,300 | ) | |||||||
Royal Bank of Canada | 54,348 | (3,271,479 | ) | |||||||
Toronto-Dominion Bank | 40,794 | (1,746,036 | ) | |||||||
Toronto-Dominion Bank | 9,000 | (385,650 | ) | |||||||
|
| |||||||||
| (7,145,392 | ) | |||||||||
|
| |||||||||
Biotechnology & Pharmaceuticals — (0.0)% | ||||||||||
Tekmira Pharmaceuticals Corp. | 3,100 | (54,126 | ) | |||||||
|
| |||||||||
Hardware — (0.0)% | ||||||||||
DragonWave, Inc. | 100 | (56 | ) | |||||||
|
| |||||||||
Industrial Services — (0.1)% | ||||||||||
Ritchie Bros Auctioneers, Inc. | 28,500 | (710,790 | ) | |||||||
|
| |||||||||
Insurance — (0.0)% | ||||||||||
Manulife Financial Corp. | 25,200 | (428,652 | ) | |||||||
|
| |||||||||
Iron & Steel — (0.0)% | ||||||||||
Turquoise Hill Resources Ltd. | 176,100 | (549,432 | ) | |||||||
|
| |||||||||
Medical Equipment/Devices — (0.0)% | ||||||||||
Novadaq Technologies, Inc. | 800 | (12,992 | ) | |||||||
|
| |||||||||
Metals & Mining — (0.1)% | ||||||||||
Agnico Eagle Mines Ltd. | 12,300 | (343,662 | ) | |||||||
AuRico Gold, Inc. | 18,300 | (50,691 | ) | |||||||
B2GOLD Corp. | 1,100 | (1,672 | ) | |||||||
Endeavour Silver Corp. | 11,800 | (22,420 | ) | |||||||
First Majestic Silver Corp. | 15,000 | (81,150 | ) | |||||||
Franco-Nevada Corp. | 5,000 | (242,700 | ) | |||||||
Goldcorp, Inc. | 12,100 | (219,252 | ) | |||||||
North American Palladium Ltd. | 27,500 | (5,791 | ) | |||||||
NOVAGOLD Resources, Inc. | 22,900 | (67,784 | ) | |||||||
Pan American Silver Corp. | 10,500 | (92,085 | ) | |||||||
Primero Mining Corp. | 12,483 | (42,817 | ) | |||||||
Rubicon Minerals Corp. | 100 | (95 | ) | |||||||
Sandstorm Gold Ltd. | 1,700 | (5,576 | ) | |||||||
Seabridge Gold, Inc. | 27,100 | (148,779 | ) | |||||||
Silver Standard Resources, Inc. | 400 | (1,812 | ) | |||||||
| 1,700 | (595 | ) | ||||||||
|
| |||||||||
| (1,326,881 | ) | |||||||||
|
| |||||||||
See Notes to Consolidated Financial Statements.
72
Blackstone Alternative Multi-Manager Fund and Subsidiaries
Consolidated Schedule of Investments (Continued)
March 31, 2015
Security Description | Shares | Value | ||||||||
Oil, Gas & Coal — (0.1)% | ||||||||||
Baytex Energy Corp. | 11,900 | $ | (188,020 | ) | ||||||
Cenovus Energy, Inc. | 2,000 | (33,760 | ) | |||||||
Crescent Point Energy Corp. | 400 | (8,936 | ) | |||||||
Enbridge, Inc. | 9,900 | (480,150 | ) | |||||||
Encana Corp. | 600 | (6,690 | ) | |||||||
Enerplus Corp. | 600 | (6,084 | ) | |||||||
Pembina Pipeline Corp. | 400 | (12,664 | ) | |||||||
Pengrowth Energy Corp. | 17,700 | (52,923 | ) | |||||||
Penn West Petroleum Ltd. | 24,400 | (40,260 | ) | |||||||
Precision Drilling Corp. | 6,500 | (41,210 | ) | |||||||
Talisman Energy, Inc. | 93,700 | (719,616 | ) | |||||||
TransCanada Corp. | 400 | (17,088 | ) | |||||||
|
| |||||||||
| (1,607,401 | ) | |||||||||
|
| |||||||||
Real Estate — (0.1)% | ||||||||||
Brookfield Asset Management, Inc. Class A | 11,600 | (621,876 | ) | |||||||
|
| |||||||||
Renewable Energy — (0.0)% | ||||||||||
Ballard Power Systems, Inc. | 12,900 | (27,090 | ) | |||||||
|
| |||||||||
Software — (0.0)% | ||||||||||
Open Text Corp. | 6,100 | (322,629 | ) | |||||||
|
| |||||||||
Technology Services — (0.0)% | ||||||||||
CGI Group, Inc. Class A | 4,300 | (182,535 | ) | |||||||
|
| |||||||||
Telecommunications — (0.1)% | ||||||||||
BCE, Inc. | 16,900 | (715,884 | ) | |||||||
|
| |||||||||
Transportation & Logistics — (0.1)% | ||||||||||
Canadian National Railway Co. | 16,100 | (1,076,607 | ) | |||||||
|
| |||||||||
Waste & Environmental Service Equipment & Facility — (0.0)% | ||||||||||
Denison Mines Corp. | 400 | (316 | ) | |||||||
|
| |||||||||
Total Canada | (15,179,833 | ) | ||||||||
|
| |||||||||
Cayman Islands — (0.0)% | ||||||||||
Biotechnology & Pharmaceuticals — (0.0)% | ||||||||||
Theravance Biopharma, Inc. | 1,500 | (26,025 | ) | |||||||
|
| |||||||||
Total Cayman Islands | (26,025 | ) | ||||||||
|
| |||||||||
Chile — (0.0)% | ||||||||||
Consumer Products — (0.0)% | ||||||||||
Cia Cervecerias Unidas SA ADR | 100 | (2,076 | ) | |||||||
|
| |||||||||
Passenger Transportation — (0.0)% | ||||||||||
Latam Airlines Group SA ADR | 43,962 | (354,334 | ) | |||||||
|
| |||||||||
See Notes to Consolidated Financial Statements.
73
Blackstone Alternative Multi-Manager Fund and Subsidiaries
Consolidated Schedule of Investments (Continued)
March 31, 2015
Security Description | Shares | Value | ||||||||
Retail—Consumer Staples — (0.0)% | ||||||||||
Cencosud SA ADR | 500 | $ | (3,515 | ) | ||||||
|
| |||||||||
Total Chile | (359,925 | ) | ||||||||
|
| |||||||||
China — (0.5)% | ||||||||||
Automotive — (0.0)% | ||||||||||
Kandi Technologies Group, Inc. | 8,500 | (105,315 | ) | |||||||
|
| |||||||||
Consumer Services — (0.0)% | ||||||||||
Tarena International, Inc. ADR | 500 | (4,865 | ) | |||||||
|
| |||||||||
Gaming, Lodging & Restaurants — (0.0)% | ||||||||||
500.com Ltd. Class A ADR | 3,700 | (39,923 | ) | |||||||
China Lodging Group Ltd. ADR | 200 | (3,940 | ) | |||||||
Homeinns Hotel Group ADR | 100 | (2,367 | ) | |||||||
|
| |||||||||
| (46,230 | ) | |||||||||
|
| |||||||||
Media — (0.3)% | ||||||||||
58.com, Inc. ADR | 3,500 | (185,080 | ) | |||||||
iDreamsky Technology Ltd. ADR | 200 | (1,418 | ) | |||||||
Qihoo 360 Technology Co. Ltd. ADR | 36,600 | (1,873,920 | ) | |||||||
Qunar Cayman Islands Ltd. ADR | 2,100 | (86,625 | ) | |||||||
SINA Corp. | 8,400 | (270,144 | ) | |||||||
SouFun Holdings Ltd. ADR | 5,300 | (31,800 | ) | |||||||
Weibo Corp. ADR | 8,000 | (103,120 | ) | |||||||
Xunlei Ltd. ADR | 700 | (4,459 | ) | |||||||
Youku Tudou, Inc. ADR | 122,700 | (1,533,750 | ) | |||||||
|
| |||||||||
| (4,090,316 | ) | |||||||||
|
| |||||||||
Oil, Gas & Coal — (0.1)% | ||||||||||
China Petroleum & Chemical Corp. ADR | 200 | (15,938 | ) | |||||||
CNOOC Ltd. ADR | 1,400 | (198,548 | ) | |||||||
PetroChina Co. Ltd. ADR | 4,900 | (544,929 | ) | |||||||
Yanzhou Coal Mining Co. Ltd. ADR | 2,300 | (19,228 | ) | |||||||
|
| |||||||||
| (778,643 | ) | |||||||||
|
| |||||||||
Renewable Energy — (0.0)% | ||||||||||
JinkoSolar Holding Co. Ltd. ADR | 9,100 | (233,324 | ) | |||||||
ReneSola Ltd. ADR | 20,700 | (30,429 | ) | |||||||
Yingli Green Energy Holding Co. Ltd. ADR | 32,200 | (59,570 | ) | |||||||
|
| |||||||||
| (323,323 | ) | |||||||||
|
| |||||||||
Retail Discretionary — (0.1)% | ||||||||||
Alibaba Group Holding Ltd. ADR | 6,100 | (507,764 | ) | |||||||
E-Commerce China Dangdang, Inc. A Shares ADR | 7,000 | (66,850 | ) | |||||||
See Notes to Consolidated Financial Statements.
74
Blackstone Alternative Multi-Manager Fund and Subsidiaries
Consolidated Schedule of Investments (Continued)
March 31, 2015
Security Description | Shares | Value | ||||||||
JD.com, Inc. ADR | 14,400 | $ | (423,072 | ) | ||||||
LightInTheBox Holding Co. Ltd. ADR | 1,300 | (6,552 | ) | |||||||
|
| |||||||||
| (1,004,238 | ) | |||||||||
|
| |||||||||
Software — (0.0)% | ||||||||||
Momo, Inc. ADR | 300 | (3,180 | ) | |||||||
NQ Mobile, Inc. ADR | 18,200 | (67,886 | ) | |||||||
|
| |||||||||
| (71,066 | ) | |||||||||
|
| |||||||||
Telecommunications — (0.0)% | ||||||||||
21Vianet Group, Inc. ADR | 5,500 | (97,130 | ) | |||||||
China Mobile Ltd. ADR | 6,500 | (422,695 | ) | |||||||
|
| |||||||||
| (519,825 | ) | |||||||||
|
| |||||||||
Total China | (6,943,821 | ) | ||||||||
|
| |||||||||
Colombia — (0.1)% | ||||||||||
Banking — (0.1)% | ||||||||||
Bancolombia SA ADR | 15,900 | (625,347 | ) | |||||||
|
| |||||||||
Oil, Gas & Coal — (0.0)% | ||||||||||
Ecopetrol SA ADR | 1,700 | (25,874 | ) | |||||||
|
| |||||||||
Passenger Transportation — (0.0)% | ||||||||||
Avianca Holdings SA ADR | 9,100 | (103,012 | ) | |||||||
|
| |||||||||
Total Colombia | (754,233 | ) | ||||||||
|
| |||||||||
Cyprus — (0.0)% | ||||||||||
Oil, Gas & Coal — (0.0)% | ||||||||||
Ocean Rig UDW, Inc. | 11,600 | (76,444 | ) | |||||||
|
| |||||||||
Total Cyprus | (76,444 | ) | ||||||||
|
| |||||||||
Denmark — (0.1)% | ||||||||||
Biotechnology & Pharmaceuticals — (0.1)% | ||||||||||
Novo Nordisk A/S ADR | 2,900 | (154,831 | ) | |||||||
Novo Nordisk A/S B Shares (d) | 26,700 | (1,425,346 | ) | |||||||
|
| |||||||||
Total Denmark | (1,580,177 | ) | ||||||||
|
| |||||||||
Germany — (0.1)% | ||||||||||
Banking — (0.0)% | ||||||||||
Deutsche Bank AG | 22,800 | (791,844 | ) | |||||||
|
| |||||||||
Software — (0.1)% | ||||||||||
SAP SE ADR | 15,900 | (1,147,503 | ) | |||||||
|
| |||||||||
Total Germany | (1,939,347 | ) | ||||||||
|
| |||||||||
See Notes to Consolidated Financial Statements.
75
Blackstone Alternative Multi-Manager Fund and Subsidiaries
Consolidated Schedule of Investments (Continued)
March 31, 2015
Security Description | Shares | Value | ||||||||
Greece — (0.0)% | ||||||||||
Banking — (0.0)% | ||||||||||
National Bank of Greece SA ADR | 3,100 | $ | (3,968 | ) | ||||||
|
| |||||||||
Oil, Gas & Coal — (0.0)% | ||||||||||
DryShips, Inc. | 11,700 | (8,892 | ) | |||||||
|
| |||||||||
Transportation & Logistics — (0.0)% | ||||||||||
Diana Containerships, Inc. | 1,100 | (2,706 | ) | |||||||
Navios Maritime Holdings, Inc. | 3,800 | (15,884 | ) | |||||||
Star Bulk Carriers Corp. | 1,200 | (4,356 | ) | |||||||
|
| |||||||||
| (22,946 | ) | |||||||||
|
| |||||||||
Total Greece | (35,806 | ) | ||||||||
|
| |||||||||
Hong Kong — (0.0)% | ||||||||||
Gaming, Lodging & Restaurants — (0.0)% | ||||||||||
Melco Crown Entertainment Ltd. ADR | 11,400 | (244,644 | ) | |||||||
|
| |||||||||
Total Hong Kong | (244,644 | ) | ||||||||
|
| |||||||||
India — (0.0)% | ||||||||||
Banking — (0.0)% | ||||||||||
HDFC Bank Ltd. ADR | 3,200 | (188,448 | ) | |||||||
|
| |||||||||
Technology Services — (0.0)% | ||||||||||
Wipro Ltd. ADR | 1,100 | (14,652 | ) | |||||||
|
| |||||||||
Total India | (203,100 | ) | ||||||||
|
| |||||||||
Ireland — (0.0)% | ||||||||||
Biotechnology & Pharmaceuticals — (0.0)% | ||||||||||
Amarin Corp. PLC ADR | 90,000 | (210,600 | ) | |||||||
|
| |||||||||
Insurance — (0.0)% | ||||||||||
XL Group PLC | 700 | (25,760 | ) | |||||||
|
| |||||||||
Transportation & Logistics — (0.0)% | ||||||||||
Ardmore Shipping Corp. | 400 | (4,028 | ) | |||||||
|
| |||||||||
Total Ireland | (240,388 | ) | ||||||||
|
| |||||||||
Israel — (0.0)% | ||||||||||
Chemicals — (0.0)% | ||||||||||
Israel Chemicals Ltd. | 100 | (709 | ) | |||||||
|
| |||||||||
Consumer Products — (0.0)% | ||||||||||
SodaStream International Ltd. | 900 | (18,234 | ) | |||||||
|
| |||||||||
See Notes to Consolidated Financial Statements.
76
Blackstone Alternative Multi-Manager Fund and Subsidiaries
Consolidated Schedule of Investments (Continued)
March 31, 2015
Security Description | Shares | Value | ||||||||
Semiconductors — (0.0)% | ||||||||||
Mellanox Technologies Ltd. | 300 | $ | (13,602 | ) | ||||||
On Track Innovations Ltd. | 100 | (149 | ) | |||||||
|
| |||||||||
| (13,751 | ) | |||||||||
|
| |||||||||
Total Israel | (32,694 | ) | ||||||||
|
| |||||||||
Japan — (0.1)% | ||||||||||
Automotive — (0.1)% | ||||||||||
Honda Motor Co. Ltd. ADR | 2,500 | (81,900 | ) | |||||||
Toyota Motor Corp. ADR | 1,800 | (251,802 | ) | |||||||
|
| |||||||||
| (333,702 | ) | |||||||||
|
| |||||||||
Hardware — (0.0)% | ||||||||||
Canon, Inc. ADR | 1,700 | (60,129 | ) | |||||||
Nidec Corp. ADR | 100 | (1,672 | ) | |||||||
|
| |||||||||
| (61,801 | ) | |||||||||
|
| |||||||||
Institutional Financial Service — (0.0)% | ||||||||||
Nomura Holdings, Inc. ADR | 1,500 | (8,805 | ) | |||||||
|
| |||||||||
Telecommunications — (0.0)% | ||||||||||
Nippon Telegraph & Telephone Corp. ADR | 7,000 | (215,740 | ) | |||||||
NTT Docomo, Inc. ADR | 5,200 | (90,636 | ) | |||||||
|
| |||||||||
| (306,376 | ) | |||||||||
|
| |||||||||
Total Japan | (710,684 | ) | ||||||||
|
| |||||||||
Luxembourg — (0.0)% | ||||||||||
Iron & Steel — (0.0)% |
| |||||||||
ArcelorMittal | 3,100 | (29,202 | ) | |||||||
|
| |||||||||
Total Luxembourg | (29,202 | ) | ||||||||
|
| |||||||||
Mexico — (0.0)% | ||||||||||
Metals & Mining — (0.0)% |
| |||||||||
Southern Copper Corp. | 12,600 | (367,668 | ) | |||||||
|
| |||||||||
Total Mexico | (367,668 | ) | ||||||||
|
| |||||||||
Monaco — (0.1)% | ||||||||||
Transportation & Logistics — (0.1)% |
| |||||||||
GasLog Ltd. | 19,500 | (378,690 | ) | |||||||
Scorpio Tankers, Inc. | 45,800 | (431,436 | ) | |||||||
|
| |||||||||
Total Monaco | (810,126 | ) | ||||||||
|
| |||||||||
Netherlands — (0.1)% | ||||||||||
Banking — (0.0)% |
| |||||||||
ING Groep NV ADR | 25,400 | (371,094 | ) | |||||||
|
| |||||||||
See Notes to Consolidated Financial Statements.
77
Blackstone Alternative Multi-Manager Fund and Subsidiaries
Consolidated Schedule of Investments (Continued)
March 31, 2015
Security Description | Shares | Value | ||||||||
Insurance — (0.0)% |
| |||||||||
Aegon NV | 13 | $ | (103 | ) | ||||||
|
| |||||||||
Semiconductors — (0.0)% |
| |||||||||
ASML Holding NV New York Shares | 700 | (70,721 | ) | |||||||
|
| |||||||||
Specialty Finance — (0.1)% |
| |||||||||
AerCap Holdings NV | 10,600 | (462,690 | ) | |||||||
|
| |||||||||
Telecommunications — (0.0)% |
| |||||||||
VimpelCom Ltd. ADR | 50,500 | (264,620 | ) | |||||||
|
| |||||||||
Total Netherlands | (1,169,228 | ) | ||||||||
|
| |||||||||
Norway — (0.0)% | ||||||||||
Oil, Gas & Coal — (0.0)% |
| |||||||||
Seadrill Ltd. | 8,400 | (78,540 | ) | |||||||
|
| |||||||||
Transportation & Logistics — (0.0)% |
| |||||||||
Frontline Ltd. | 7,200 | (16,128 | ) | |||||||
|
| |||||||||
Total Norway | (94,668 | ) | ||||||||
|
| |||||||||
Philippines — (0.0)% | ||||||||||
Telecommunications — (0.0)% |
| |||||||||
Philippine Long Distance Telephone Co. ADR | 600 | (37,494 | ) | |||||||
|
| |||||||||
Total Philippines | (37,494 | ) | ||||||||
|
| |||||||||
Republic of Korea — (0.0)% | ||||||||||
Banking — (0.0)% |
| |||||||||
KB Financial Group, Inc. ADR | 1,100 | (38,654 | ) | |||||||
|
| |||||||||
Utilities — (0.0)% |
| |||||||||
Korea Electric Power Corp. ADR | 800 | (16,400 | ) | |||||||
|
| |||||||||
Total Republic of Korea | (55,054 | ) | ||||||||
|
| |||||||||
Spain — (0.0)% | ||||||||||
Banking — (0.0)% |
| |||||||||
Banco Bilbao Vizcaya Argentaria SA ADR | 3 | (30 | ) | |||||||
Banco Santander SA ADR | 1 | (7 | ) | |||||||
|
| |||||||||
| (37 | ) | |||||||||
|
| |||||||||
Telecommunications — (0.0)% | ||||||||||
Telefonica SA ADR | 6,600 | (94,710 | ) | |||||||
|
| |||||||||
Total Spain | (94,747 | ) | ||||||||
|
| |||||||||
Sweden — (0.0)% | ||||||||||
Automotive — (0.0)% | ||||||||||
Autoliv, Inc. | 900 | (105,993 | ) | |||||||
See Notes to Consolidated Financial Statements.
78
Blackstone Alternative Multi-Manager Fund and Subsidiaries
Consolidated Schedule of Investments (Continued)
March 31, 2015
Security Description | Shares | Value | ||||||||
Hardware — (0.0)% | ||||||||||
Telefonaktiebolaget LM Ericsson ADR | 100 | $ | (1,255 | ) | ||||||
|
| |||||||||
Total Sweden | (107,248 | ) | ||||||||
|
| |||||||||
Switzerland — (0.4)% | ||||||||||
Asset Management — (0.0)% | ||||||||||
UBS Group AG | 6,900 | (129,513 | ) | |||||||
|
| |||||||||
Biotechnology & Pharmaceuticals — (0.3)% | ||||||||||
Novartis AG (d) | 33,300 | (3,286,726 | ) | |||||||
Roche Holding AG | 3,500 | (961,772 | ) | |||||||
|
| |||||||||
| (4,248,498 | ) | |||||||||
|
| |||||||||
Institutional Financial Service — (0.1)% | ||||||||||
Credit Suisse Group AG ADR | 26,000 | (700,180 | ) | |||||||
|
| |||||||||
Total Switzerland | (5,078,191 | ) | ||||||||
|
| |||||||||
Taiwan — (0.0)% | ||||||||||
Semiconductors — (0.0)% | ||||||||||
United Microelectronics Corp. ADR | 6 | (15 | ) | |||||||
|
| |||||||||
Telecommunications — (0.0)% | ||||||||||
Chunghwa Telecom Co. Ltd. ADR | 5,000 | (160,350 | ) | |||||||
|
| |||||||||
Total Taiwan | (160,365 | ) | ||||||||
|
| |||||||||
United Kingdom — (0.1)% | ||||||||||
Banking — (0.0)% | ||||||||||
Barclays PLC ADR | 23,828 | (347,174 | ) | |||||||
Royal Bank of Scotland Group PLC ADR | 2,700 | (27,243 | ) | |||||||
|
| |||||||||
| (374,417 | ) | |||||||||
|
| |||||||||
Consumer Products — (0.1)% | ||||||||||
Unilever NV | 9,723 | (406,032 | ) | |||||||
|
| |||||||||
Machinery — (0.0)% | ||||||||||
CNH Industrial NV | 35 | (286 | ) | |||||||
Pentair PLC | 2,400 | (150,936 | ) | |||||||
|
| |||||||||
| (151,222 | ) | |||||||||
|
| |||||||||
Media — (0.0)% | ||||||||||
Pearson PLC ADR | 600 | (12,966 | ) | |||||||
WPP PLC ADR | 100 | (11,377 | ) | |||||||
|
| |||||||||
| (24,343 | ) | |||||||||
|
| |||||||||
Total United Kingdom | (956,014 | ) | ||||||||
|
| |||||||||
See Notes to Consolidated Financial Statements.
79
Blackstone Alternative Multi-Manager Fund and Subsidiaries
Consolidated Schedule of Investments (Continued)
March 31, 2015
Security Description | Shares | Value | ||||||||
United States — (14.5)% | ||||||||||
Aerospace & Defense — (0.1)% | ||||||||||
Sturm Ruger & Co., Inc. | 5,000 | $ | (248,150 | ) | ||||||
Taser International, Inc. | 26,700 | (643,737 | ) | |||||||
|
| |||||||||
| (891,887 | ) | |||||||||
|
| |||||||||
Apparel & Textile Products — (0.1)% | ||||||||||
G-III Apparel Group Ltd. | 100 | (11,265 | ) | |||||||
Iconix Brand Group, Inc. | 41,400 | (1,393,938 | ) | |||||||
Quiksilver, Inc. | 1,700 | (3,145 | ) | |||||||
Wolverine World Wide, Inc. | 1,700 | (56,865 | ) | |||||||
|
| |||||||||
| (1,465,213 | ) | |||||||||
|
| |||||||||
Asset Management — (0.6)% | ||||||||||
Acacia Research Corp. | 2,400 | (25,680 | ) | |||||||
Artisan Partners Asset Management, Inc. Class A | 16,300 | (740,998 | ) | |||||||
Cohen & Steers, Inc. | 700 | (28,665 | ) | |||||||
Federated Investors, Inc. Class B | 100 | (3,389 | ) | |||||||
Home Loan Servicing Solutions Ltd. | 79,400 | (1,313,276 | ) | |||||||
Janus Capital Group, Inc. | 176,200 | (3,028,878 | ) | |||||||
Leucadia National Corp. | 104,200 | (2,322,618 | ) | |||||||
Medley Capital Corp. | 31,400 | (287,310 | ) | |||||||
Prospect Capital Corp. | 1,800 | (15,210 | ) | |||||||
Triangle Capital Corp. | 1,700 | (38,777 | ) | |||||||
|
| |||||||||
| (7,804,801 | ) | |||||||||
|
| |||||||||
Automotive — (0.2)% | ||||||||||
Dana Holding Corp. | 6,900 | (146,004 | ) | |||||||
Dorman Products, Inc. | 300 | (14,925 | ) | |||||||
Federal-Mogul Holdings Corp. | 1,311 | (17,449 | ) | |||||||
Gentherm, Inc. | 200 | (10,102 | ) | |||||||
Quantum Fuel Systems Technologies Worldwide, Inc. | 12,600 | (33,642 | ) | |||||||
Tesla Motors, Inc. | 16,400 | (3,095,828 | ) | |||||||
|
| |||||||||
| (3,317,950 | ) | |||||||||
|
| |||||||||
Banking — (0.5)% | ||||||||||
Banc of California, Inc. | 5,000 | (61,550 | ) | |||||||
Bank of America Corp. | 195,200 | (3,004,128 | ) | |||||||
Bank of the Ozarks, Inc. | 10 | (369 | ) | |||||||
Centerstate Banks, Inc. | 25 | (298 | ) | |||||||
Citigroup, Inc. | 57,400 | (2,957,248 | ) | |||||||
Commerce Bancshares, Inc. | 100 | (4,232 | ) | |||||||
ConnectOne Bancorp, Inc. | 23 | (447 | ) | |||||||
EverBank Financial Corp. | 1,200 | (21,636 | ) | |||||||
First Horizon National Corp. | 1,500 | (21,435 | ) | |||||||
First Niagara Financial Group, Inc. | 4,300 | (38,012 | ) | |||||||
See Notes to Consolidated Financial Statements.
80
Blackstone Alternative Multi-Manager Fund and Subsidiaries
Consolidated Schedule of Investments (Continued)
March 31, 2015
Security Description | Shares | Value | ||||||||
FNB Corp. | 300 | $ | (3,942 | ) | ||||||
Heritage Financial Corp. | 9 | (153 | ) | |||||||
MB Financial, Inc. | 422 | (13,213 | ) | |||||||
PacWest Bancorp | 57 | (2,673 | ) | |||||||
TFS Financial Corp. | 2,800 | (41,104 | ) | |||||||
Umpqua Holdings Corp. | 7,065 | (121,377 | ) | |||||||
United Bankshares, Inc. | 846 | (31,793 | ) | |||||||
Wells Fargo & Co. | 9,100 | (495,040 | ) | |||||||
|
| |||||||||
| (6,818,650 | ) | |||||||||
|
| |||||||||
Biotechnology & Pharmaceuticals — (2.4)% | ||||||||||
ACADIA Pharmaceuticals, Inc. | 22,100 | (720,239 | ) | |||||||
AcelRx Pharmaceuticals, Inc. | 3,700 | (14,282 | ) | |||||||
Achillion Pharmaceuticals, Inc. | 9,600 | (94,656 | ) | |||||||
Aegerion Pharmaceuticals, Inc. | 21,500 | (562,655 | ) | |||||||
Aerie Pharmaceuticals, Inc. | 400 | (12,536 | ) | |||||||
Amgen, Inc. (d) | 15,400 | (2,461,690 | ) | |||||||
Ampio Pharmaceuticals, Inc. | 28,100 | (211,593 | ) | |||||||
ANI Pharmaceuticals, Inc. | 300 | (18,765 | ) | |||||||
Antares Pharma, Inc. | 6,800 | (18,428 | ) | |||||||
Apricus Biosciences, Inc. | 100 | (187 | ) | |||||||
Aratana Therapeutics, Inc. | 200 | (3,202 | ) | |||||||
Arena Pharmaceuticals, Inc. | 42,800 | (187,036 | ) | |||||||
Arrowhead Research Corp. | 13,100 | (88,622 | ) | |||||||
BIND Therapeutics, Inc. | 100 | (549 | ) | |||||||
BioTime, Inc. | 100 | (497 | ) | |||||||
Bristol-Myers Squibb Co. | 22,500 | (1,451,250 | ) | |||||||
Catalyst Pharmaceutical Partners, Inc. | 2,300 | (9,959 | ) | |||||||
Celldex Therapeutics, Inc. | 23,900 | (666,093 | ) | |||||||
Clovis Oncology, Inc. | 4,700 | (348,881 | ) | |||||||
Coronado Biosciences, Inc. | 5,300 | (20,405 | ) | |||||||
CTI BioPharma Corp. | 18,500 | (33,485 | ) | |||||||
CytRx Corp. | 51,900 | (174,903 | ) | |||||||
Discovery Laboratories, Inc. | 1,200 | (1,428 | ) | |||||||
Dynavax Technologies Corp. | 1,110 | (24,897 | ) | |||||||
Eli Lilly & Co. (d) | 36,500 | (2,651,725 | ) | |||||||
Enanta Pharmaceuticals, Inc. | 6,600 | (202,092 | ) | |||||||
Endo International PLC | 32,000 | (2,870,400 | ) | |||||||
Endocyte, Inc. | 20,400 | (127,704 | ) | |||||||
Epizyme, Inc. | 3,200 | (60,096 | ) | |||||||
Exelixis, Inc. | 21,800 | (56,026 | ) | |||||||
Galectin Therapeutics, Inc. | 2,100 | (7,035 | ) | |||||||
Galena Biopharma, Inc. | 57,500 | (79,925 | ) | |||||||
Geron Corp. | 5,300 | (19,981 | ) | |||||||
Halozyme Therapeutics, Inc. | 9,100 | (129,948 | ) | |||||||
Heron Therapeutics, Inc. | 100 | (1,455 | ) | |||||||
See Notes to Consolidated Financial Statements.
81
Blackstone Alternative Multi-Manager Fund and Subsidiaries
Consolidated Schedule of Investments (Continued)
March 31, 2015
Security Description | Shares | Value | ||||||||
Hospira, Inc. | 34,200 | $ | (3,004,128 | ) | ||||||
Idera Pharmaceuticals, Inc. | 12,800 | (47,488 | ) | |||||||
IGI Laboratories, Inc. | 4,000 | (32,640 | ) | |||||||
ImmunoGen, Inc. | 2,500 | (22,375 | ) | |||||||
Immunomedics, Inc. | 2,000 | (7,660 | ) | |||||||
Inovio Pharmaceuticals, Inc. | 31,500 | (257,040 | ) | |||||||
Intercept Pharmaceuticals, Inc. | 4,600 | (1,297,292 | ) | |||||||
Intrexon Corp. | 900 | (40,833 | ) | |||||||
Ironwood Pharmaceuticals, Inc. | 2,000 | (32,000 | ) | |||||||
Isis Pharmaceuticals, Inc. (d) | 12,200 | (776,774 | ) | |||||||
Johnson & Johnson (d) | 40,700 | (4,094,420 | ) | |||||||
Karyopharm Therapeutics, Inc. | 3,100 | (94,891 | ) | |||||||
Keryx Biopharmaceuticals, Inc. | 81,800 | (1,041,314 | ) | |||||||
Kite Pharma, Inc. | 800 | (46,144 | ) | |||||||
La Jolla Pharmaceutical Co. | 200 | (3,660 | ) | |||||||
Lexicon Pharmaceuticals, Inc. | 7,600 | (7,177 | ) | |||||||
MannKind Corp. | 6,900 | (35,880 | ) | |||||||
Mast Therapeutics, Inc. | 3,400 | (1,649 | ) | |||||||
Mylan NV | 3,700 | (219,595 | ) | |||||||
NanoViricides, Inc. | 600 | (1,350 | ) | |||||||
Neuralstem, Inc. | 6,100 | (11,590 | ) | |||||||
Northwest Biotherapeutics, Inc. | 1,000 | (7,370 | ) | |||||||
Oncothyreon, Inc. | 700 | (1,141 | ) | |||||||
OPKO Health, Inc. | 19,000 | (269,230 | ) | |||||||
Orexigen Therapeutics, Inc. | 21,000 | (164,430 | ) | |||||||
Organovo Holdings, Inc. | 30,200 | (106,908 | ) | |||||||
OXiGENE, Inc. | 13,000 | (18,980 | ) | |||||||
Peregrine Pharmaceuticals, Inc. | 10,700 | (14,445 | ) | |||||||
Perrigo Co. PLC | 8,900 | (1,473,395 | ) | |||||||
Pfizer, Inc. | 32,500 | (1,130,675 | ) | |||||||
Progenics Pharmaceuticals, Inc. | 3,200 | (19,136 | ) | |||||||
Provectus Biopharmaceuticals, Inc. Class A | 2,000 | (1,630 | ) | |||||||
Raptor Pharmaceutical Corp. | 4,700 | (51,089 | ) | |||||||
Relypsa, Inc. | 700 | (25,249 | ) | |||||||
Repros Therapeutics, Inc. | 13,300 | (114,247 | ) | |||||||
Retrophin, Inc. | 200 | (4,792 | ) | |||||||
Rexahn Pharmaceuticals, Inc. | 20,800 | (15,184 | ) | |||||||
Salix Pharmaceuticals Ltd. | 19,000 | (3,283,390 | ) | |||||||
Sarepta Therapeutics, Inc. | 27,700 | (367,856 | ) | |||||||
StemCells, Inc. | 3,400 | (3,468 | ) | |||||||
Sunesis Pharmaceuticals, Inc. | 200 | (490 | ) | |||||||
Synergy Pharmaceuticals, Inc. | 47,800 | (220,836 | ) | |||||||
Synta Pharmaceuticals Corp. | 27,000 | (52,380 | ) | |||||||
Synthetic Biologics, Inc. | 8,000 | (17,520 | ) | |||||||
Tenax Therapeutics, Inc. | 4,200 | (13,692 | ) | |||||||
TG Therapeutics, Inc. | 500 | (7,740 | ) | |||||||
See Notes to Consolidated Financial Statements.
82
Blackstone Alternative Multi-Manager Fund and Subsidiaries
Consolidated Schedule of Investments (Continued)
March 31, 2015
Security Description | Shares | Value | ||||||||
TherapeuticsMD, Inc. | 14,400 | $ | (87,120 | ) | ||||||
Theravance, Inc. | 19,500 | (306,540 | ) | |||||||
Threshold Pharmaceuticals, Inc. | 4,100 | (16,646 | ) | |||||||
Tonix Pharmaceuticals Holding Corp. | 1,200 | (7,584 | ) | |||||||
Vanda Pharmaceuticals, Inc. | 19,600 | (182,280 | ) | |||||||
Venaxis, Inc. | 100 | (46 | ) | |||||||
VIVUS, Inc. | 40,900 | (100,614 | ) | |||||||
XOMA Corp. | 14,500 | (52,780 | ) | |||||||
ZIOPHARM Oncology, Inc. | 200 | (2,154 | ) | |||||||
Zogenix, Inc. | 2,900 | (3,973 | ) | |||||||
|
| |||||||||
| (32,553,535 | ) | |||||||||
|
| |||||||||
Chemicals — (0.3)% | ||||||||||
Balchem Corp. | 2,900 | (160,602 | ) | |||||||
FMC Corp. | 4,400 | (251,900 | ) | |||||||
Marrone Bio Innovations, Inc. | 100 | (387 | ) | |||||||
Platform Specialty Products Corp. | 9,500 | (243,770 | ) | |||||||
Polypore International, Inc. | 28,900 | (1,702,210 | ) | |||||||
Rentech, Inc. | 5,900 | (6,608 | ) | |||||||
Sensient Technologies Corp. | 100 | (6,888 | ) | |||||||
Sigma-Aldrich Corp. | 6,500 | (898,625 | ) | |||||||
Trinseo SA | 600 | (11,880 | ) | |||||||
Tronox Ltd. Class A | 3,300 | (67,089 | ) | |||||||
|
| |||||||||
| (3,349,959 | ) | |||||||||
|
| |||||||||
Commercial Services — (0.1)% | ||||||||||
Brady Corp. Class A | 100 | (2,829 | ) | |||||||
Care.com, Inc. | 1,800 | (13,644 | ) | |||||||
Corporate Executive Board Co. | 400 | (31,944 | ) | |||||||
HMS Holdings Corp. | 41,900 | (647,355 | ) | |||||||
InterCloud Systems, Inc. | 11,100 | (24,420 | ) | |||||||
Robert Half International, Inc. | 1,000 | (60,520 | ) | |||||||
Sotheby’s | 400 | (16,904 | ) | |||||||
|
| |||||||||
| (797,616 | ) | |||||||||
|
| |||||||||
Construction Materials — (0.0)% | ||||||||||
Louisiana-Pacific Corp. | 14,100 | (232,791 | ) | |||||||
Martin Marietta Materials, Inc. | 30 | (4,194 | ) | |||||||
USG Corp. | 1,000 | (26,700 | ) | |||||||
|
| |||||||||
| (263,685 | ) | |||||||||
|
| |||||||||
Consumer Products — (0.1)% | ||||||||||
22nd Century Group, Inc. | 2,000 | (1,720 | ) | |||||||
Church & Dwight Co., Inc. | 900 | (76,878 | ) | |||||||
Darling Ingredients, Inc. | 5,500 | (77,055 | ) | |||||||
Dean Foods Co. | 1,300 | (21,489 | ) | |||||||
See Notes to Consolidated Financial Statements.
83
Blackstone Alternative Multi-Manager Fund and Subsidiaries
Consolidated Schedule of Investments (Continued)
March 31, 2015
Security Description | Shares | Value | ||||||||
Elizabeth Arden, Inc. | 400 | $ | (6,240 | ) | ||||||
HRG Group, Inc. | 3,700 | (46,176 | ) | |||||||
Keurig Green Mountain, Inc. | 9,900 | (1,106,127 | ) | |||||||
Senomyx, Inc. | 1,600 | (7,056 | ) | |||||||
Snyder’s-Lance, Inc. | 1,600 | (51,136 | ) | |||||||
TreeHouse Foods, Inc. | 2,200 | (187,044 | ) | |||||||
|
| |||||||||
| (1,580,921 | ) | |||||||||
|
| |||||||||
Consumer Services — (0.0)% | ||||||||||
Weight Watchers International, Inc. | 7,000 | (48,930 | ) | |||||||
|
| |||||||||
Distributors—Consumer Staples — (0.0)% | ||||||||||
United Natural Foods, Inc. | 3,200 | (246,528 | ) | |||||||
|
| |||||||||
Distributors—Discretionary — (0.0)% | ||||||||||
Fastenal Co. | 1,100 | (45,578 | ) | |||||||
|
| |||||||||
Electrical Equipment — (0.0)% | ||||||||||
Capstone Turbine Corp. | 59,400 | (38,610 | ) | |||||||
Cognex Corp. | 800 | (39,672 | ) | |||||||
Mobileye NV | 200 | (8,406 | ) | |||||||
Revolution Lighting Technologies, Inc. | 6,400 | (7,104 | ) | |||||||
|
| |||||||||
| (93,792 | ) | |||||||||
|
| |||||||||
Engineering & Construction Services — (0.0)% | ||||||||||
Kratos Defense & Security Solutions, Inc. | 3,800 | (21,014 | ) | |||||||
Willbros Group, Inc. | 100 | (331 | ) | |||||||
|
| |||||||||
| (21,345 | ) | |||||||||
|
| |||||||||
Gaming, Lodging & Restaurants — (0.2)% | ||||||||||
Caesars Entertainment Corp. | 10,700 | (112,671 | ) | |||||||
Pinnacle Entertainment, Inc. | 10,600 | (382,554 | ) | |||||||
Scientific Games Corp. Class A | 2,500 | (26,175 | ) | |||||||
Wynn Resorts Ltd. | 12,500 | (1,573,500 | ) | |||||||
Yum! Brands, Inc. | 659 | (51,876 | ) | |||||||
Zoe’s Kitchen, Inc. | 500 | (16,645 | ) | |||||||
|
| |||||||||
| (2,163,421 | ) | |||||||||
|
| |||||||||
Hardware — (0.5)% | ||||||||||
3D Systems Corp. | 24,400 | (669,048 | ) | |||||||
Aerohive Networks, Inc. | 3,300 | (14,718 | ) | |||||||
Alliance Fiber Optic Products, Inc. | 500 | (8,710 | ) | |||||||
Aruba Networks, Inc. | 94,300 | (2,309,407 | ) | |||||||
Ciena Corp. | 1,600 | (30,896 | ) | |||||||
Control4 Corp. | 600 | (7,188 | ) | |||||||
Digital Ally, Inc. | 300 | (3,825 | ) | |||||||
Emulex Corp. | 15,700 | (125,129 | ) | |||||||
See Notes to Consolidated Financial Statements.
84
Blackstone Alternative Multi-Manager Fund and Subsidiaries
Consolidated Schedule of Investments (Continued)
March 31, 2015
Security Description | Shares | Value | ||||||||
ExOne Co. | 9,400 | $ | (128,310 | ) | ||||||
Extreme Networks, Inc. | 800 | (2,528 | ) | |||||||
Gigamon, Inc. | 300 | (6,372 | ) | |||||||
GoPro, Inc. Class A | 1,300 | (56,433 | ) | |||||||
Lexmark International, Inc. Class A | 1,200 | (50,808 | ) | |||||||
MicroVision, Inc. | 8,800 | (30,184 | ) | |||||||
Neonode, Inc. | 6,700 | (21,239 | ) | |||||||
Procera Networks, Inc. | 2,800 | (26,292 | ) | |||||||
Riverbed Technology, Inc. | 65,665 | (1,373,055 | ) | |||||||
Ruckus Wireless, Inc. | 5,800 | (74,646 | ) | |||||||
Silicon Graphics International Corp. | 200 | (1,738 | ) | |||||||
Stratasys Ltd. | 17,600 | (928,928 | ) | |||||||
Synaptics, Inc. | 1,700 | (138,219 | ) | |||||||
Turtle Beach Corp. | 2,300 | (4,278 | ) | |||||||
Ubiquiti Networks, Inc. | 12,500 | (369,375 | ) | |||||||
Uni-Pixel, Inc. | 4,400 | (30,800 | ) | |||||||
VeriFone Systems, Inc. | 1 | (35 | ) | |||||||
Violin Memory, Inc. | 5,600 | (21,112 | ) | |||||||
Vocera Communications, Inc. | 400 | (3,968 | ) | |||||||
|
| |||||||||
| (6,437,241 | ) | |||||||||
|
| |||||||||
Health Care Facilities/Services — (0.5)% | ||||||||||
Acadia Healthcare Co., Inc. | 5,200 | (372,320 | ) | |||||||
Adeptus Health, Inc. Class A | 300 | (15,066 | ) | |||||||
AmerisourceBergen Corp. (d) | 18,300 | (2,080,161 | ) | |||||||
BioScrip, Inc. | 23,200 | (102,776 | ) | |||||||
Brookdale Senior Living, Inc. | 11,206 | (423,139 | ) | |||||||
Diplomat Pharmacy, Inc. | 600 | (20,748 | ) | |||||||
Express Scripts Holding Co. (d) | 16,100 | (1,396,997 | ) | |||||||
NeoStem, Inc. | 14,600 | (37,084 | ) | |||||||
Quest Diagnostics, Inc. (d) | 26,300 | (2,021,155 | ) | |||||||
UnitedHealth Group, Inc. | 100 | (11,829 | ) | |||||||
|
| |||||||||
| (6,481,275 | ) | |||||||||
|
| |||||||||
Home & Office Products — (0.4)% | ||||||||||
Beazer Homes USA, Inc. | 16,800 | (297,696 | ) | |||||||
Cenveo, Inc. | 400 | (856 | ) | |||||||
Green Brick Partners, Inc. | 3,600 | (29,790 | ) | |||||||
Hovnanian Enterprises, Inc. Class A | 97,600 | (347,456 | ) | |||||||
KB Home | 40,500 | (632,610 | ) | |||||||
M/I Homes, Inc. | 1,300 | (30,992 | ) | |||||||
Masonite International Corp. | 100 | (6,726 | ) | |||||||
MDC Holdings, Inc. | 25,900 | (738,150 | ) | |||||||
Meritage Homes Corp. | 1,400 | (68,096 | ) | |||||||
Ryland Group, Inc. | 8,600 | (419,164 | ) | |||||||
Snap-on, Inc. | 12,500 | (1,838,250 | ) | |||||||
See Notes to Consolidated Financial Statements.
85
Blackstone Alternative Multi-Manager Fund and Subsidiaries
Consolidated Schedule of Investments (Continued)
March 31, 2015
Security Description | Shares | Value | ||||||||
Taylor Morrison Home Corp. Class A | 7,000 | $ | (145,950 | ) | ||||||
TRI Pointe Homes, Inc. | 74,800 | (1,154,164 | ) | |||||||
William Lyon Homes Class A | 3,100 | (80,042 | ) | |||||||
|
| |||||||||
| (5,789,942 | ) | |||||||||
|
| |||||||||
Industrial Services — (0.0)% | ||||||||||
Titan Machinery, Inc. | 1,400 | (18,690 | ) | |||||||
|
| |||||||||
Institutional Financial Service — (0.3)% | ||||||||||
FXCM, Inc. Class A | 12,800 | (27,264 | ) | |||||||
Goldman Sachs Group, Inc. | 17,000 | (3,195,490 | ) | |||||||
Intercontinental Exchange, Inc. | 31 | (7,231 | ) | |||||||
Morgan Stanley | 26,900 | (960,061 | ) | |||||||
RCS Capital Corp. Class A | 17,200 | (183,008 | ) | |||||||
|
| |||||||||
| (4,373,054 | ) | |||||||||
|
| |||||||||
Insurance — (0.1)% | ||||||||||
American International Group, Inc. | 19,300 | (1,057,447 | ) | |||||||
HCI Group, Inc. | 900 | (41,283 | ) | |||||||
Markel Corp. | 300 | (230,688 | ) | |||||||
MBIA, Inc. | 14,100 | (131,130 | ) | |||||||
Torchmark Corp. | 49 | (2,691 | ) | |||||||
|
| |||||||||
| (1,463,239 | ) | |||||||||
|
| |||||||||
Iron & Steel — (0.1)% | ||||||||||
AK Steel Holding Corp. | 161,800 | (723,246 | ) | |||||||
AM Castle & Co. | 700 | (2,555 | ) | |||||||
Cliffs Natural Resources, Inc. | 56,700 | (272,727 | ) | |||||||
Walter Energy, Inc. | 93,400 | (57,908 | ) | |||||||
|
| |||||||||
| (1,056,436 | ) | |||||||||
|
| |||||||||
Leisure Products — (0.0)% | ||||||||||
Callaway Golf Co. | 400 | (3,812 | ) | |||||||
Winnebago Industries, Inc. | 4,500 | (95,670 | ) | |||||||
|
| |||||||||
| (99,482 | ) | |||||||||
|
| |||||||||
Machinery — (0.0)% | ||||||||||
Adept Technology, Inc. | 2,000 | (12,300 | ) | |||||||
Arotech Corp. | 700 | (2,177 | ) | |||||||
Colfax Corp. | 1,500 | (71,595 | ) | |||||||
Mueller Water Products, Inc. Class A | 400 | (3,940 | ) | |||||||
Oshkosh Corp. | 600 | (29,274 | ) | |||||||
Power Solutions International, Inc. | 400 | (25,716 | ) | |||||||
|
| |||||||||
| (145,002 | ) | |||||||||
|
| |||||||||
See Notes to Consolidated Financial Statements.
86
Blackstone Alternative Multi-Manager Fund and Subsidiaries
Consolidated Schedule of Investments (Continued)
March 31, 2015
Security Description | Shares | Value | ||||||||
Manufactured Goods — (0.0)% | ||||||||||
Proto Labs, Inc. | 4,700 | $ | (329,000 | ) | ||||||
|
| |||||||||
Media — (1.1)% | ||||||||||
Alliance Data Systems Corp. | 1,159 | (343,354 | ) | |||||||
Angie’s List, Inc. | 19,400 | (113,878 | ) | |||||||
Borderfree, Inc. | 200 | (1,202 | ) | |||||||
Cablevision Systems Corp. Class A | 600 | (10,980 | ) | |||||||
Coupons.com, Inc. | 3,800 | (44,612 | ) | |||||||
Covisint Corp. | 22 | (45 | ) | |||||||
Cumulus Media, Inc. Class A | 71,200 | (175,864 | ) | |||||||
Demand Media, Inc. | 160 | (915 | ) | |||||||
Dex Media, Inc. | 2,100 | (8,799 | ) | |||||||
DreamWorks Animation SKG, Inc. Class A | 7,600 | (183,920 | ) | |||||||
Everyday Health, Inc. | 1,300 | (16,718 | ) | |||||||
Liberty Media Corp. | 33 | (1,272 | ) | |||||||
Lions Gate Entertainment Corp. | 9,600 | (325,632 | ) | |||||||
LiveDeal, Inc. | 1,400 | (4,410 | ) | |||||||
Marin Software, Inc. | 2,400 | (15,096 | ) | |||||||
Media General, Inc. | 900 | (14,841 | ) | |||||||
MeetMe, Inc. | 5,700 | (10,602 | ) | |||||||
Millennial Media, Inc. | 44,200 | (64,090 | ) | |||||||
Orbitz Worldwide, Inc. | 100,300 | (1,169,498 | ) | |||||||
Pandora Media, Inc. | 155,700 | (2,523,897 | ) | |||||||
Rocket Fuel, Inc. | 15,500 | (142,600 | ) | |||||||
Tremor Video, Inc. | 100 | (234 | ) | |||||||
Twitter, Inc. | 53,800 | (2,694,304 | ) | |||||||
Yahoo!, Inc. | 69,713 | (3,097,697 | ) | |||||||
Yelp, Inc. | 63,900 | (3,025,665 | ) | |||||||
YOU On Demand Holdings, Inc. | 700 | (1,491 | ) | |||||||
Zillow Group, Inc. Class A | 45 | (4,513 | ) | |||||||
|
| |||||||||
| (13,996,129 | ) | |||||||||
|
| |||||||||
Medical Equipment/Devices — (1.0)% | ||||||||||
Abaxis, Inc. | 11,800 | (756,498 | ) | |||||||
Biolase, Inc. | 3,646 | (7,365 | ) | |||||||
BioTelemetry, Inc. | 3,600 | (31,860 | ) | |||||||
Cepheid | 200 | (11,380 | ) | |||||||
Cerus Corp. | 10,600 | (44,202 | ) | |||||||
Cytori Therapeutics, Inc. | 900 | (1,062 | ) | |||||||
DENTSPLY International, Inc. (d) | 66,200 | (3,368,918 | ) | |||||||
EnteroMedics, Inc. | 1,900 | (1,738 | ) | |||||||
Exact Sciences Corp. | 4,300 | (94,686 | ) | |||||||
Foundation Medicine, Inc. | 100 | (4,811 | ) | |||||||
IDEXX Laboratories, Inc. | 1,500 | (231,720 | ) | |||||||
ImmunoCellular Therapeutics Ltd. | 7,900 | (3,831 | ) | |||||||
See Notes to Consolidated Financial Statements.
87
Blackstone Alternative Multi-Manager Fund and Subsidiaries
Consolidated Schedule of Investments (Continued)
March 31, 2015
Security Description | Shares | Value | ||||||||
IsoRay, Inc. | 18,700 | $ | (29,359 | ) | ||||||
Medtronic PLC (d) | 84,039 | (6,554,202 | ) | |||||||
Navidea Biopharmaceuticals, Inc. | 10,600 | (16,854 | ) | |||||||
Pacific Biosciences of California, Inc. | 1,600 | (9,344 | ) | |||||||
QIAGEN NV | 3 | (76 | ) | |||||||
Rockwell Medical, Inc. | 12,800 | (139,904 | ) | |||||||
Rosetta Genomics Ltd. | 100 | (307 | ) | |||||||
Sirona Dental Systems, Inc. | 16,100 | (1,448,839 | ) | |||||||
Spectranetics Corp. | 5,400 | (187,704 | ) | |||||||
Stereotaxis, Inc. | 1,400 | (2,884 | ) | |||||||
Sunshine Heart, Inc. | 200 | (848 | ) | |||||||
TearLab Corp. | 6,800 | (13,532 | ) | |||||||
Unilife Corp. | 8,300 | (33,283 | ) | |||||||
Varian Medical Systems, Inc. (d) | 6,600 | (620,994 | ) | |||||||
|
| |||||||||
| (13,616,201 | ) | |||||||||
|
| |||||||||
Metals & Mining — (0.1)% | ||||||||||
Gold Resource Corp. | 4,600 | (14,674 | ) | |||||||
Golden Star Resources Ltd. | 13,500 | (3,271 | ) | |||||||
Hecla Mining Co. | 51,900 | (154,662 | ) | |||||||
McEwen Mining, Inc. | 8,800 | (8,976 | ) | |||||||
Midway Gold Corp. | 6,200 | (1,984 | ) | |||||||
Molycorp, Inc. | 95,200 | (36,681 | ) | |||||||
Noranda Aluminum Holding Corp. | 5,000 | (14,850 | ) | |||||||
Paramount Gold and Silver Corp. | 6,600 | (6,666 | ) | |||||||
Royal Gold, Inc. | 3,000 | (189,330 | ) | |||||||
Thompson Creek Metals Co., Inc. | 28,400 | (37,488 | ) | |||||||
Ur-Energy, Inc. | 800 | (760 | ) | |||||||
Uranerz Energy Corp. | 2,200 | (2,442 | ) | |||||||
Uranium Energy Corp. | 20,600 | (30,900 | ) | |||||||
US Silica Holdings, Inc. | 11,500 | (409,515 | ) | |||||||
|
| |||||||||
| (912,199 | ) | |||||||||
|
| |||||||||
Oil, Gas & Coal — (1.3)% | ||||||||||
Abraxas Petroleum Corp. | 600 | (1,950 | ) | |||||||
Alon USA Energy, Inc. | 1,300 | (21,541 | ) | |||||||
Alpha Natural Resources, Inc. | 132,800 | (132,787 | ) | |||||||
American Eagle Energy Corp. | 100 | (18 | ) | |||||||
Antero Resources Corp. | 5,400 | (190,728 | ) | |||||||
Approach Resources, Inc. | 1,100 | (7,249 | ) | |||||||
Arch Coal, Inc. | 194,800 | (194,781 | ) | |||||||
Basic Energy Services, Inc. | 8,000 | (55,440 | ) | |||||||
Bill Barrett Corp. | 5,600 | (46,480 | ) | |||||||
Bonanza Creek Energy, Inc. | 11,000 | (271,260 | ) | |||||||
Clayton Williams Energy, Inc. | 100 | (5,063 | ) | |||||||
Clean Energy Fuels Corp. | 8,200 | (43,747 | ) | |||||||
See Notes to Consolidated Financial Statements.
88
Blackstone Alternative Multi-Manager Fund and Subsidiaries
Consolidated Schedule of Investments (Continued)
March 31, 2015
Security Description | Shares | Value | ||||||||
Cobalt International Energy, Inc. | 167,800 | $ | (1,578,998 | ) | ||||||
Comstock Resources, Inc. | 34,700 | (123,879 | ) | |||||||
Dresser-Rand Group, Inc. | 1,500 | (120,525 | ) | |||||||
Eclipse Resources Corp. | 13,800 | (77,556 | ) | |||||||
Emerald Oil, Inc. | 64,700 | (47,878 | ) | |||||||
Enbridge Energy Management LLC | 1 | (36 | ) | |||||||
Energy XXI Ltd. | 114,589 | (417,104 | ) | |||||||
EnLink Midstream LLC | 400 | (13,016 | ) | |||||||
EP Energy Corp. Class A | 700 | (7,336 | ) | |||||||
EXCO Resources, Inc. | 183,400 | (335,622 | ) | |||||||
Flotek Industries, Inc. | 14,400 | (212,256 | ) | |||||||
FMSA Holdings, Inc. | 2,500 | (18,100 | ) | |||||||
FX Energy, Inc. | 5,100 | (6,375 | ) | |||||||
Gastar Exploration, Inc. | 600 | (1,572 | ) | |||||||
Goodrich Petroleum Corp. | 7,500 | (26,625 | ) | |||||||
Halcon Resources Corp. | 63,900 | (98,406 | ) | |||||||
Halliburton Co. | 152,396 | (6,687,136 | ) | |||||||
Harvest Natural Resources, Inc. | 300 | (134 | ) | |||||||
Hercules Offshore, Inc. | 30,900 | (12,953 | ) | |||||||
ION Geophysical Corp. | 13,100 | (28,427 | ) | |||||||
Jones Energy, Inc. | 900 | (8,082 | ) | |||||||
Kinder Morgan, Inc. | 36,284 | (1,526,105 | ) | |||||||
Kosmos Energy Ltd. | 2,900 | (22,939 | ) | |||||||
LinnCo LLC | 19,401 | (185,668 | ) | |||||||
Magnum Hunter Resources Corp. | 116,566 | (311,231 | ) | |||||||
Matador Resources Co. | 600 | (13,152 | ) | |||||||
Midstates Petroleum Co., Inc. | 25,100 | (21,335 | ) | |||||||
Miller Energy Resources, Inc. | 2,600 | (1,625 | ) | |||||||
Northern Oil and Gas, Inc. | 10,000 | (77,100 | ) | |||||||
Nuverra Environmental Solutions, Inc. | 9,670 | (34,425 | ) | |||||||
Oasis Petroleum, Inc. | 27,300 | (388,206 | ) | |||||||
Pacific Drilling SA | 14,100 | (54,849 | ) | |||||||
Parker Drilling Co. | 5,800 | (20,242 | ) | |||||||
PBF Energy, Inc. Class A | 28,200 | (956,544 | ) | |||||||
Peabody Energy Corp. | 168,300 | (828,036 | ) | |||||||
PetroQuest Energy, Inc. | 6,400 | (14,720 | ) | |||||||
Pioneer Natural Resources Co. | 300 | (49,053 | ) | |||||||
Resolute Energy Corp. | 4,600 | (2,592 | ) | |||||||
Rex Energy Corp. | 4,100 | (15,252 | ) | |||||||
Rice Energy, Inc. | 23,100 | (502,656 | ) | |||||||
Ring Energy, Inc. | 100 | (1,062 | ) | |||||||
Rosetta Resources, Inc. | 6,400 | (108,928 | ) | |||||||
RPC, Inc. | 800 | (10,248 | ) | |||||||
Sanchez Energy Corp. | 32,500 | (422,825 | ) | |||||||
SandRidge Energy, Inc. | 42,700 | (76,006 | ) | |||||||
Seventy Seven Energy, Inc. | 2,500 | (10,375 | ) | |||||||
See Notes to Consolidated Financial Statements.
89
Blackstone Alternative Multi-Manager Fund and Subsidiaries
Consolidated Schedule of Investments (Continued)
March 31, 2015
Security Description | Shares | Value | ||||||||
SM Energy Co. | 200 | $ | (10,336 | ) | ||||||
Synergy Resources Corp. | 800 | (9,480 | ) | |||||||
Transocean Ltd. | 41,000 | (601,470 | ) | |||||||
Triangle Petroleum Corp. | 14,200 | (71,426 | ) | |||||||
Ultra Petroleum Corp. | 19,300 | (301,659 | ) | |||||||
W&T Offshore, Inc. | 47,300 | (241,703 | ) | |||||||
ZaZa Energy Corp. | 520 | (848 | ) | |||||||
|
| |||||||||
| (17,685,156 | ) | |||||||||
|
| |||||||||
Real Estate — (1.8)% | ||||||||||
Alexandria Real Estate Equities, Inc. | 5,800 | (568,632 | ) | |||||||
American Realty Capital Properties, Inc. | 321,460 | (3,166,381 | ) | |||||||
AvalonBay Communities, Inc. | 3,500 | (609,875 | ) | |||||||
BioMed Realty Trust, Inc. | 11,300 | (256,058 | ) | |||||||
Boston Properties, Inc. | 400 | (56,192 | ) | |||||||
Brandywine Realty Trust | 2,300 | (36,754 | ) | |||||||
Camden Property Trust | 38,300 | (2,992,379 | ) | |||||||
Campus Crest Communities, Inc. | 38,100 | (272,796 | ) | |||||||
CBL & Associates Properties, Inc. | 55,371 | (1,096,346 | ) | |||||||
CubeSmart | 300 | (7,245 | ) | |||||||
CyrusOne, Inc. | 100 | (3,112 | ) | |||||||
DDR Corp. | 7,600 | (141,512 | ) | |||||||
Duke Realty Corp. | 100 | (2,177 | ) | |||||||
Education Realty Trust, Inc. | 30,400 | (1,075,552 | ) | |||||||
Equity Residential | 2,200 | (171,292 | ) | |||||||
Essex Property Trust, Inc. | 10,700 | (2,459,930 | ) | |||||||
Extra Space Storage, Inc. | 3,100 | (209,467 | ) | |||||||
Federal Realty Investment Trust | 3,100 | (456,351 | ) | |||||||
Gaming and Leisure Properties, Inc. | 32 | (1,180 | ) | |||||||
Government Properties Income Trust | 6,700 | (153,095 | ) | |||||||
Gramercy Property Trust, Inc. | 14,575 | (409,120 | ) | |||||||
HCP, Inc. | 1,800 | (77,778 | ) | |||||||
Health Care REIT, Inc. (d) | 28,700 | (2,220,232 | ) | |||||||
Hersha Hospitality Trust | 52,702 | (340,982 | ) | |||||||
Host Hotels & Resorts, Inc. | 300 | (6,054 | ) | |||||||
Kilroy Realty Corp. | 1,200 | (91,404 | ) | |||||||
Kimco Realty Corp. | 5,300 | (142,305 | ) | |||||||
Kite Realty Group Trust | 3,150 | (88,736 | ) | |||||||
LaSalle Hotel Properties | 3,000 | (116,580 | ) | |||||||
National Retail Properties, Inc. | 19,800 | (811,206 | ) | |||||||
New York REIT, Inc. | 27,000 | (282,960 | ) | |||||||
Pebblebrook Hotel Trust | 3,200 | (149,024 | ) | |||||||
Physicians Realty Trust | 2,300 | (40,503 | ) | |||||||
Public Storage | 7,600 | (1,498,264 | ) | |||||||
Realty Income Corp. | 30,300 | (1,563,480 | ) | |||||||
Regency Centers Corp. | 7,300 | (496,692 | ) | |||||||
See Notes to Consolidated Financial Statements.
90
Blackstone Alternative Multi-Manager Fund and Subsidiaries
Consolidated Schedule of Investments (Continued)
March 31, 2015
Security Description | Shares | Value | ||||||||
STAG Industrial, Inc. | 3,500 | $ | (82,320 | ) | ||||||
Summit Hotel Properties, Inc. | 700 | (9,849 | ) | |||||||
Sunstone Hotel Investors, Inc. | 30,981 | (516,453 | ) | |||||||
UDR, Inc. | 1,500 | (51,045 | ) | |||||||
Ventas, Inc. | 4,900 | (357,798 | ) | |||||||
Vornado Realty Trust | 2,900 | (324,800 | ) | |||||||
Washington Real Estate Investment Trust | 100 | (2,763 | ) | |||||||
|
| |||||||||
| (23,416,674 | ) | |||||||||
|
| |||||||||
Recreation Facilities & Services — (0.1)% | ||||||||||
Life Time Fitness, Inc. | 17,000 | (1,206,320 | ) | |||||||
SFX Entertainment, Inc. | 2,700 | (11,043 | ) | |||||||
|
| |||||||||
| (1,217,363 | ) | |||||||||
|
| |||||||||
Renewable Energy — (0.3)% | ||||||||||
American Superconductor Corp. | 10 | (65 | ) | |||||||
Ascent Solar Technologies, Inc. | 700 | (784 | ) | |||||||
Enphase Energy, Inc. | 7,800 | (102,882 | ) | |||||||
FuelCell Energy, Inc. | 76,000 | (95,000 | ) | |||||||
Gevo, Inc. | 2,400 | (482 | ) | |||||||
Pacific Ethanol, Inc. | 29,800 | (321,542 | ) | |||||||
Plug Power, Inc. | 73,200 | (189,588 | ) | |||||||
Silver Spring Networks, Inc. | 3,500 | (31,290 | ) | |||||||
SolarCity Corp. | 60,700 | (3,112,696 | ) | |||||||
Solazyme, Inc. | 20,100 | (57,486 | ) | |||||||
Vivint Solar, Inc. | 3,300 | (40,062 | ) | |||||||
|
| |||||||||
| (3,951,877 | ) | |||||||||
|
| |||||||||
Retail—Consumer Staples — (0.1)% | ||||||||||
Fairway Group Holdings Corp. | 1,800 | (12,186 | ) | |||||||
Roundy’s, Inc. | 12,700 | (62,103 | ) | |||||||
Whole Foods Market, Inc. | 21,500 | (1,119,720 | ) | |||||||
|
| |||||||||
| (1,194,009 | ) | |||||||||
|
| |||||||||
Retail Discretionary — (0.5)% | ||||||||||
Aeropostale, Inc. | 30,600 | (106,182 | ) | |||||||
American Apparel, Inc. | 21,600 | (15,146 | ) | |||||||
bebe stores, Inc. | 1,000 | (3,630 | ) | |||||||
Best Buy Co., Inc. | 3,300 | (124,707 | ) | |||||||
Blyth, Inc. | 900 | (6,831 | ) | |||||||
Bon-Ton Stores, Inc. | 12,600 | (87,696 | ) | |||||||
Build-A-Bear Workshop, Inc. | 100 | (1,965 | ) | |||||||
Builders FirstSource, Inc. | 1,000 | (6,670 | ) | |||||||
Cabela’s, Inc. | 32,900 | (1,841,742 | ) | |||||||
Container Store Group, Inc. | 6,200 | (118,110 | ) | |||||||
Ethan Allen Interiors, Inc. | 100 | (2,764 | ) | |||||||
See Notes to Consolidated Financial Statements.
91
Blackstone Alternative Multi-Manager Fund and Subsidiaries
Consolidated Schedule of Investments (Continued)
March 31, 2015
Security Description | Shares | Value | ||||||||
Francesca’s Holdings Corp. | 8,500 | $ | (151,300 | ) | ||||||
Lumber Liquidators Holdings, Inc. | 5,200 | (160,056 | ) | |||||||
Nordstrom, Inc. | 2,300 | (184,736 | ) | |||||||
Office Depot, Inc. | 3 | (28 | ) | |||||||
PHH Corp. | 2,700 | (65,259 | ) | |||||||
Sears Holdings Corp. | 5,600 | (231,728 | ) | |||||||
Tile Shop Holdings, Inc. | 2,500 | (30,275 | ) | |||||||
Tractor Supply Co. | 34,100 | (2,900,546 | ) | |||||||
Wayfair, Inc. Class A | 1,000 | (32,120 | ) | |||||||
|
| |||||||||
| (6,071,491 | ) | |||||||||
|
| |||||||||
Semiconductors — (0.2)% | ||||||||||
Advanced Micro Devices, Inc. | 88,600 | (237,448 | ) | |||||||
ANADIGICS, Inc. | 200 | (272 | ) | |||||||
Applied Micro Circuits Corp. | 15,700 | (80,070 | ) | |||||||
Applied Optoelectronics, Inc. | 500 | (6,940 | ) | |||||||
Atmel Corp. | 5,400 | (44,442 | ) | |||||||
Brooks Automation, Inc. | 300 | (3,489 | ) | |||||||
Cavium, Inc. | 3,200 | (226,624 | ) | |||||||
Inphi Corp. | 100 | (1,783 | ) | |||||||
InvenSense, Inc. | 36,400 | (553,644 | ) | |||||||
Lam Research Corp. | 6,500 | (456,527 | ) | |||||||
ParkerVision, Inc. | 2,500 | (2,075 | ) | |||||||
Pixelworks, Inc. | 20,100 | (100,902 | ) | |||||||
QuickLogic Corp. | 8,000 | (15,440 | ) | |||||||
Rubicon Technology, Inc. | 4,000 | (15,760 | ) | |||||||
Semtech Corp. | 200 | (5,329 | ) | |||||||
Universal Display Corp. | 17,300 | (808,775 | ) | |||||||
Vitesse Semiconductor Corp. | 2,100 | (11,151 | ) | |||||||
|
| |||||||||
| (2,570,671 | ) | |||||||||
|
| |||||||||
Software — (0.7)% | ||||||||||
A10 Networks, Inc. | 5,000 | (21,650 | ) | |||||||
Advent Software, Inc. | 5,200 | (229,372 | ) | |||||||
Amber Road, Inc. | 400 | (3,700 | ) | |||||||
ANSYS, Inc. | 2,000 | (176,380 | ) | |||||||
Benefitfocus, Inc. | 2,900 | (106,691 | ) | |||||||
Brightcove, Inc. | 2,400 | (17,592 | ) | |||||||
Castlight Health, Inc. Class B | 1,500 | (11,640 | ) | |||||||
Cerner Corp. (d) | 29,300 | (2,146,518 | ) | |||||||
ChannelAdvisor Corp. | 6,500 | (62,985 | ) | |||||||
Cornerstone OnDemand, Inc. | 9,100 | (262,899 | ) | |||||||
Datawatch Corp. | 1,200 | (8,148 | ) | |||||||
Dealertrack Technologies, Inc. | 14,700 | (566,244 | ) | |||||||
Digital Turbine, Inc. | 592 | (1,930 | ) | |||||||
FireEye, Inc. | 9,500 | (372,875 | ) | |||||||
See Notes to Consolidated Financial Statements.
92
Blackstone Alternative Multi-Manager Fund and Subsidiaries
Consolidated Schedule of Investments (Continued)
March 31, 2015
Security Description | Shares | Value | ||||||||
Glu Mobile, Inc. | 126,500 | $ | (633,765 | ) | ||||||
Guidewire Software, Inc. | 400 | (21,044 | ) | |||||||
HubSpot, Inc. | 400 | (15,960 | ) | |||||||
Imperva, Inc. | 6,600 | (281,820 | ) | |||||||
Jack Henry & Associates, Inc. | 1,000 | (69,890 | ) | |||||||
Jive Software, Inc. | 9,500 | (48,735 | ) | |||||||
KEYW Holding Corp. | 2,300 | (18,929 | ) | |||||||
LogMeIn, Inc. | 6,700 | (375,133 | ) | |||||||
Manhattan Associates, Inc. | 700 | (35,427 | ) | |||||||
Mitek Systems, Inc. | 4,000 | (12,640 | ) | |||||||
OPOWER, Inc. | 600 | (6,078 | ) | |||||||
Rally Software Development Corp. | 1,000 | (15,690 | ) | |||||||
Rosetta Stone, Inc. | 100 | (761 | ) | |||||||
salesforce.com, Inc. | 900 | (60,129 | ) | |||||||
Solera Holdings, Inc. | 36,500 | (1,885,590 | ) | |||||||
Splunk, Inc. | 12,800 | (757,760 | ) | |||||||
Tangoe, Inc. | 2,100 | (28,980 | ) | |||||||
Textura Corp. | 1,500 | (40,770 | ) | |||||||
Ultimate Software Group, Inc. | 200 | (33,991 | ) | |||||||
Varonis Systems, Inc. | 1,000 | (25,660 | ) | |||||||
VirnetX Holding Corp. | 8,600 | (52,374 | ) | |||||||
Vringo, Inc. | 59,900 | (38,959 | ) | |||||||
Zynga, Inc. Class A | 136,700 | (389,595 | ) | |||||||
|
| |||||||||
| (8,838,304 | ) | |||||||||
|
| |||||||||
Specialty Finance — (0.4)% | ||||||||||
Ally Financial, Inc. | 21,500 | (451,070 | ) | |||||||
Altisource Portfolio Solutions SA | 200 | (2,574 | ) | |||||||
Altisource Residential Corp. | 200 | (4,172 | ) | |||||||
Apollo Residential Mortgage, Inc. | 14,600 | (232,870 | ) | |||||||
Ares Commercial Real Estate Corp. | 5,700 | (62,985 | ) | |||||||
ARMOUR Residential REIT, Inc. | 210,335 | (666,762 | ) | |||||||
Blackstone Mortgage Trust, Inc. Class A | 4,200 | (119,154 | ) | |||||||
CIT Group, Inc. | 400 | (18,048 | ) | |||||||
Colony Financial, Inc. | 3,800 | (98,496 | ) | |||||||
Credit Acceptance Corp. | 200 | (39,000 | ) | |||||||
CYS Investments, Inc. | 20,700 | (184,437 | ) | |||||||
Ellie Mae, Inc. | 3,000 | (165,930 | ) | |||||||
Encore Capital Group, Inc. | 2,300 | (95,657 | ) | |||||||
Flagstar Bancorp, Inc. | 1,100 | (15,961 | ) | |||||||
Higher One Holdings, Inc. | 800 | (1,936 | ) | |||||||
JAVELIN Mortgage Investment Corp. | 6,210 | (46,948 | ) | |||||||
JG Wentworth Co. Class A | 800 | (8,312 | ) | |||||||
LendingClub Corp. | 11,700 | (229,905 | ) | |||||||
MoneyGram International, Inc. | 3,700 | (31,968 | ) | |||||||
Nationstar Mortgage Holdings, Inc. | 18,300 | (453,291 | ) | |||||||
See Notes to Consolidated Financial Statements.
93
Blackstone Alternative Multi-Manager Fund and Subsidiaries
Consolidated Schedule of Investments (Continued)
March 31, 2015
Security Description | Shares | Value | ||||||||
New York Mortgage Trust, Inc. | 7,500 | $ | (58,200 | ) | ||||||
Newcastle Investment Corp. | 17 | (82 | ) | |||||||
NorthStar Realty Finance Corp. | 5,400 | (97,848 | ) | |||||||
Ocwen Financial Corp. | 60,500 | (499,125 | ) | |||||||
Orchid Island Capital, Inc. | 2,900 | (38,396 | ) | |||||||
PRA Group, Inc. | 45 | (2,444 | ) | |||||||
RAIT Financial Trust | 21,400 | (146,804 | ) | |||||||
Redwood Trust, Inc. | 15,800 | (282,346 | ) | |||||||
Regional Management Corp. | 2,300 | (33,948 | ) | |||||||
Stonegate Mortgage Corp. | 2,100 | (22,722 | ) | |||||||
Walter Investment Management Corp. | 32,200 | (520,030 | ) | |||||||
Western Asset Mortgage Capital Corp. | 55,235 | (832,944 | ) | |||||||
Xoom Corp. | 14,700 | (215,943 | ) | |||||||
|
| |||||||||
| (5,680,308 | ) | |||||||||
|
| |||||||||
Technology Services — (0.1)% | ||||||||||
Bottomline Technologies de, Inc. | 800 | (21,896 | ) | |||||||
CoStar Group, Inc. | 100 | (19,783 | ) | |||||||
Cyan, Inc. | 400 | (1,596 | ) | |||||||
Gartner, Inc. | 800 | (67,080 | ) | |||||||
iGATE Corp. | 4,600 | (196,236 | ) | |||||||
MarketAxess Holdings, Inc. | 100 | (8,290 | ) | |||||||
Rentrak Corp. | 200 | (11,112 | ) | |||||||
Spherix, Inc. | 800 | (669 | ) | |||||||
Thomson Reuters Corp. | 18,700 | (758,472 | ) | |||||||
Zayo Group Holdings, Inc. | 6,800 | (190,128 | ) | |||||||
|
| |||||||||
| (1,275,262 | ) | |||||||||
|
| |||||||||
Telecommunications — (0.1)% | ||||||||||
8x8, Inc. | 1,700 | (14,280 | ) | |||||||
Alaska Communications Systems Group, Inc. | 600 | (1,008 | ) | |||||||
Consolidated Communications Holdings, Inc. | 800 | (16,320 | ) | |||||||
DigitalGlobe, Inc. | 15,200 | (517,864 | ) | |||||||
Global Eagle Entertainment, Inc. | 2,800 | (37,268 | ) | |||||||
Globalstar, Inc. | 10,300 | (34,299 | ) | |||||||
Gogo, Inc. | 51,000 | (972,060 | ) | |||||||
Intelsat SA | 400 | (4,800 | ) | |||||||
NTELOS Holdings Corp. | 600 | (2,880 | ) | |||||||
Sprint Corp. | 12,800 | (60,672 | ) | |||||||
WidePoint Corp. | 100 | (132 | ) | |||||||
|
| |||||||||
| (1,661,583 | ) | |||||||||
|
| |||||||||
Transportation & Logistics — (0.1)% | ||||||||||
Baltic Trading Ltd. | 31,700 | (47,233 | ) | |||||||
Landstar System, Inc. | 1,000 | (66,300 | ) | |||||||
Nordic American Tankers Ltd. | 60,600 | (721,746 | ) | |||||||
See Notes to Consolidated Financial Statements.
94
Blackstone Alternative Multi-Manager Fund and Subsidiaries
Consolidated Schedule of Investments (Continued)
March 31, 2015
Security Description | Shares | Value | ||||||||
Odyssey Marine Exploration, Inc. | 1,500 | $ | (1,050 | ) | ||||||
XPO Logistics, Inc. | 14,700 | (668,409 | ) | |||||||
|
| |||||||||
| (1,504,738 | ) | |||||||||
|
| |||||||||
Transportation Equipment — (0.0)% | ||||||||||
Clean Diesel Technologies, Inc. | 600 | (1,092 | ) | |||||||
Greenbrier Cos., Inc. | 800 | (46,400 | ) | |||||||
Navistar International Corp. | 10,300 | (303,850 | ) | |||||||
Wabash National Corp. | 7,500 | (105,750 | ) | |||||||
|
| |||||||||
| (457,092 | ) | |||||||||
|
| |||||||||
Utilities — (0.1)% | ||||||||||
Aqua America, Inc. | 1,600 | (42,160 | ) | |||||||
Atlantic Power Corp. | 59,800 | (168,038 | ) | |||||||
Exelon Corp. | 100 | (3,361 | ) | |||||||
Laclede Group, Inc. | 9,700 | (496,834 | ) | |||||||
NorthWestern Corp. | 400 | (21,516 | ) | |||||||
NRG Energy, Inc. | 18,400 | (463,496 | ) | |||||||
NRG Yield, Inc. Class A | 1,700 | (86,241 | ) | |||||||
Pepco Holdings, Inc. | 100 | (2,683 | ) | |||||||
|
| |||||||||
| (1,284,329 | ) | |||||||||
|
| |||||||||
Waste & Environmental Service Equipment & Facility — (0.0)% |
| |||||||||
CLARCOR, Inc. | 400 | (26,424 | ) | |||||||
US Ecology, Inc. | 1,200 | (59,964 | ) | |||||||
Vertex Energy, Inc. | 600 | (2,220 | ) | |||||||
|
| |||||||||
| (88,608 | ) | |||||||||
|
| |||||||||
Total United States | (193,079,166 | ) | ||||||||
|
| |||||||||
TOTAL COMMON STOCK | (236,882,028 | ) | ||||||||
|
| |||||||||
Security Description | Principal Amount | Value | ||||||||
CORPORATE BONDS & NOTES — (0.2)% | ||||||||||
Canada — (0.0)% | ||||||||||
Restaurants — (0.0)% | ||||||||||
1011778 BC ULC / New Red Finance, Inc. (d),(e) | $ | 520,000 | (544,050 | ) | ||||||
|
| |||||||||
Total Canada | (544,050 | ) | ||||||||
|
| |||||||||
United States — (0.2)% | ||||||||||
Casinos & Gaming — (0.1)% | ||||||||||
Scientific Games International, 10.00%, 12/01/22 (d),(e) | 760,000 | (720,100 | ) | |||||||
|
| |||||||||
See Notes to Consolidated Financial Statements.
95
Blackstone Alternative Multi-Manager Fund and Subsidiaries
Consolidated Schedule of Investments (Continued)
March 31, 2015
Security Description | Principal Amount | Value | ||||||||
Consumer Products — (0.1)% | ||||||||||
American Achievement Corp., | $ | 790,000 | $ | (778,150 | ) | |||||
|
| |||||||||
Exploration & Production — (0.0)% | ||||||||||
California Resources Corp., 6.00%, 11/15/24 (d),(e) | 785,000 | (695,706 | ) | |||||||
|
| |||||||||
Semiconductors — (0.0)% | ||||||||||
Amkor Technology, Inc., 6.38%, 10/01/22 (d) | 250,000 | (260,000 | ) | |||||||
|
| |||||||||
Total United States | (2,453,956 | ) | ||||||||
|
| |||||||||
TOTAL CORPORATE BONDS & NOTES | (2,998,006 | ) | ||||||||
|
| |||||||||
Security Description | Shares | Value | ||||||||
EXCHANGE-TRADED FUNDS — (3.7)% | ||||||||||
Alerian MLP ETF | 14,529 | (240,746 | ) | |||||||
Consumer Staples Select Sector SPDR Fund | 4,848 | (236,291 | ) | |||||||
Energy Select Sector SPDR Fund | 1,915 | (148,566 | ) | |||||||
Financial Select Sector SPDR Fund | 269,316 | (6,493,209 | ) | |||||||
Health Care Select Sector SPDR Fund (d) | 69,800 | (5,060,500 | ) | |||||||
iShares iBoxx $ Investment Grade Corporate Bond ETF | 22,468 | (2,734,580 | ) | |||||||
iShares MSCI Emerging Markets ETF | 1,717 | (68,903 | ) | |||||||
iShares Nasdaq Biotechnology ETF | 6,112 | (2,099,044 | ) | |||||||
iShares Russell 2000 ETF | 42,181 | (5,245,207 | ) | |||||||
iShares U.S. Healthcare ETF (d) | 3,900 | (601,848 | ) | |||||||
iShares U.S. Healthcare Providers ETF (d) | 4,700 | (625,382 | ) | |||||||
SPDR S&P 500 ETF Trust (d) | 27,600 | (5,697,468 | ) | |||||||
SPDR S&P Biotech ETF (d) | 11,800 | (2,660,900 | ) | |||||||
SPDR S&P Regional Banking ETF | 185,734 | (7,583,519 | ) | |||||||
Vanguard FTSE Developed Markets ETF | 247,808 | (9,870,193 | ) | |||||||
|
| |||||||||
TOTAL EXCHANGE-TRADED FUNDS | (49,366,356 | ) | ||||||||
|
| |||||||||
TOTAL SECURITIES SOLD SHORT — (21.7)% | $ | (289,246,390 | ) | |||||||
|
| |||||||||
Footnote Legend:
| (a) | All or a portion of this security is pledged as collateral for derivative financial instruments. |
| (b) | Non-income producing. |
| (c) | All or a portion of this security is temporarily on loan to unaffiliated broker/dealers. In addition, “Other Assets” may include pending sales that are also on loan. |
| (d) | Security is held by a consolidated wholly-owned subsidiary of Blackstone Alternative Multi-Manager Fund. |
See Notes to Consolidated Financial Statements.
96
Blackstone Alternative Multi-Manager Fund and Subsidiaries
Consolidated Schedule of Investments (Continued)
March 31, 2015
| (e) | Security is exempt from registration pursuant to Rule 144A under the Securities Act of 1933, as amended. Security may only be sold to qualified institutional buyers unless registered under the Securities Act of 1933, as amended, or otherwise exempt from registration. |
| (f) | Variable/floating interest rate security. Rate presented is as of March 31, 2015. |
| (g) | Security considered illiquid. |
| (h) | Security is currently in default due to bankruptcy or failure to make payment of principal or interest. |
| (i) | Security is perpetual in nature and has no stated maturity. |
| (j) | Represents a step-up bond. Coupon rate increases in increments to maturity. Rate presented is as of March 31, 2015. Maturity date presented is the ultimate maturity. |
| (k) | All or a portion of this security is pledged as collateral in connection with reverse repurchase agreements. |
| (l) | Assets, other than investments in securities, less liabilities. |
Options Written Contracts Outstanding at March 31, 2015
Strike | Expiration | Contracts | Premium | Market | Unrealized | |||||||||||||||
Exchange-Traded Call Options Written |
| |||||||||||||||||||
Apple, Inc. | 131.00 USD | 05/01/15 | 1,308 | $ | (313,862 | ) | $ | (289,068 | ) | $ | 24,794 | |||||||||
CBOE SPX Volatility Index | 20.00 USD | 04/15/15 | 327 | (14,702 | ) | (14,715 | ) | (13 | ) | |||||||||||
CBOE SPX Volatility Index | 22.00 USD | 06/17/15 | 655 | (98,880 | ) | (101,525 | ) | (2,645 | ) | |||||||||||
CBOE SPX Volatility Index | 24.00 USD | 05/20/15 | 322 | (51,546 | ) | (27,370 | ) | 24,176 | ||||||||||||
Microsoft Corp. | 46.00 USD | 05/15/15 | 10 | (740 | ) | (70 | ) | 670 | ||||||||||||
Phillips 66 | 82.50 USD | 05/15/15 | 4 | (712 | ) | (620 | ) | 92 | ||||||||||||
Qualcomm, Inc. | 72.50 USD | 04/17/15 | 8 | (1,030 | ) | (168 | ) | 862 | ||||||||||||
| $ | (481,472 | ) | $ | (433,536 | ) | $ | 47,936 | |||||||||||||
Exchange-Traded Put Options Written |
| |||||||||||||||||||
iShares Russell 2000 ETF | 115.00 USD | 05/15/15 | 196 | $ | (12,928 | ) | $ | (15,288 | ) | $ | (2,360 | ) | ||||||||
iShares Russell 2000 ETF | 119.00 USD | 05/15/15 | 196 | (23,708 | ) | (26,068 | ) | (2,360 | ) | |||||||||||
S&P 500 Index | 1,930.00 USD | 04/17/15 | 116 | (92,447 | ) | (24,128 | ) | 68,319 | ||||||||||||
S&P 500 Index | 1,550.00 USD | 06/19/15 | 97 | (90,210 | ) | (17,945 | ) | 72,265 | ||||||||||||
Smith & Nephew PLC | 11.50 GBP | 04/17/15 | 36 | (33,685 | ) | (18,691 | ) | 14,994 | ||||||||||||
SPDR S&P 500 ETF Trust | 201.00 USD | 04/17/15 | 327 | (20,915 | ) | (32,700 | ) | (11,785 | ) | |||||||||||
SPDR S&P 500 ETF Trust | 203.00 USD | 04/17/15 | 327 | (30,070 | ) | (46,761 | ) | (16,691 | ) | |||||||||||
SPDR S&P 500 ETF Trust | 206.00 USD | 04/10/15 | 983 | (120,867 | ) | (179,889 | ) | (59,022 | ) | |||||||||||
SPDR S&P 500 ETF Trust | 206.50 USD | 04/02/15 | 656 | (31,461 | ) | (64,944 | ) | (33,483 | ) | |||||||||||
SPDR S&P 500 ETF Trust | 193.00 USD | 05/15/15 | 524 | (70,718 | ) | (62,356 | ) | 8,362 | ||||||||||||
See Notes to Consolidated Financial Statements.
97
Blackstone Alternative Multi-Manager Fund and Subsidiaries
Consolidated Schedule of Investments (Continued)
March 31, 2015
Strike | Expiration | Contracts | Premium | Market | Unrealized | |||||||||||||||
SPDR S&P 500 ETF Trust | 198.00 USD | 05/15/15 | 524 | $ | (114,209 | ) | $ | (98,512 | ) | $ | 15,697 | |||||||||
| $ | (641,218 | ) | $ | (587,282 | ) | $ | 53,936 | |||||||||||||
Counterparty | Strike | Expiration | Notional | Premium | Market | Unrealized | ||||||||||||||||||||
FX OTC Call Options Written |
| |||||||||||||||||||||||||
USD/BRL Currency | Morgan Stanley Capital Services LLC | 2.60 BRL | 12/31/15 | 550,000 USD | $ | (35,530 | ) | $ | (136,703 | ) | $ | (101,173 | ) | |||||||||||||
USD/BRL Currency | Morgan Stanley Capital Services LLC | 2.60 BRL | 12/31/15 | 510,000 USD | (57,911 | ) | (126,479 | ) | (68,568 | ) | ||||||||||||||||
USD/BRL Currency | Morgan Stanley Capital Services LLC | 2.60 BRL | 12/31/15 | 835,400 USD | (75,787 | ) | (207,330 | ) | (131,543 | ) | ||||||||||||||||
USD/CNH Currency | Morgan Stanley Capital Services LLC | 7.40 CNH | 11/06/17 | 2,490,000 USD | (67,230 | ) | (46,002 | ) | 21,228 | |||||||||||||||||
USD/CNH Currency | Morgan Stanley Capital Services LLC | 7.40 CNH | 11/06/17 | 5,340,000 USD | (142,551 | ) | (98,655 | ) | 43,896 | |||||||||||||||||
USD/CNH Currency | Morgan Stanley Capital Services LLC | 6.40 CNH | 11/05/15 | 820,000 USD | (10,820 | ) | (8,565 | ) | 2,255 | |||||||||||||||||
USD/CNH Currency | Morgan Stanley Capital Services LLC | 6.80 CNH | 11/05/15 | 800,000 USD | (4,880 | ) | (2,989 | ) | 1,891 | |||||||||||||||||
USD/CNH Currency | Morgan Stanley Capital Services LLC | 6.80 CNH | 11/05/15 | 2,000,000 USD | (10,410 | ) | (7,473 | ) | 2,937 | |||||||||||||||||
USD/CNH Currency | Morgan Stanley Capital Services LLC | 6.30 CNH | 11/05/15 | 2,720,000 USD | (50,578 | ) | (41,536 | ) | 9,042 | |||||||||||||||||
USD/CNH Currency | JPMorgan Chase Bank, N.A. | 6.80 CNH | 11/05/15 | 9,340,000 USD | (57,348 | ) | (34,900 | ) | 22,448 | |||||||||||||||||
USD/CNH Currency | Morgan Stanley Capital Services LLC | 6.30 CNH | 11/05/15 | 4,860,200 USD | (62,794 | ) | (73,879 | ) | (11,085 | ) | ||||||||||||||||
USD/CNH Currency | Morgan Stanley Capital Services LLC | 6.40 CNH | 11/05/15 | 2,590,000 USD | (23,877 | ) | (26,936 | ) | (3,059 | ) | ||||||||||||||||
USD/CNH Currency | Morgan Stanley Capital Services LLC | 6.30 CNH | 11/05/15 | 1,759,800 USD | (19,622 | ) | (26,751 | ) | (7,129 | ) | ||||||||||||||||
USD/CNH Currency | Morgan Stanley Capital Services LLC | 6.40 CNH | 11/06/17 | 670,000 USD | (23,628 | ) | (37,242 | ) | (13,614 | ) | ||||||||||||||||
USD/CNH Currency | Morgan Stanley Capital Services LLC | 6.40 CNH | 11/05/15 | 4,250,200 USD | (30,261 | ) | (44,108 | ) | (13,847 | ) | ||||||||||||||||
See Notes to Consolidated Financial Statements.
98
Blackstone Alternative Multi-Manager Fund and Subsidiaries
Consolidated Schedule of Investments (Continued)
March 31, 2015
Counterparty | Strike | Expiration | Notional | Premium | Market | Unrealized | ||||||||||||||||||||
USD/JPY Currency | Morgan Stanley Capital Services LLC | 137.00 JPY | 01/12/16 | 600,000 USD | $ | (4,578 | ) | $ | (3,345 | ) | $ | 1,233 | ||||||||||||||
USD/JPY Currency | Morgan Stanley Capital Services LLC | 150.00 JPY | 01/12/16 | 600,000 USD | (1,851 | ) | (918 | ) | 933 | |||||||||||||||||
USD/JPY Currency | Morgan Stanley Capital Services LLC | 137.00 JPY | 01/12/16 | 900,000 USD | (4,104 | ) | (5,017 | ) | (913 | ) | ||||||||||||||||
USD/JPY Currency | Morgan Stanley Capital Services LLC | 150.00 JPY | 01/12/16 | 900,000 USD | (1,318 | ) | (1,376 | ) | (58 | ) | ||||||||||||||||
USD/JPY Currency | Morgan Stanley Capital Services LLC | 137.00 JPY | 01/12/16 | 3,890,000 USD | (31,587 | ) | (21,693 | ) | 9,894 | |||||||||||||||||
USD/JPY Currency | Morgan Stanley Capital Services LLC | 150.00 JPY | 01/12/16 | 3,890,000 USD | (12,759 | ) | (5,952 | ) | 6,807 | |||||||||||||||||
| $ | (729,424 | ) | $ | (957,849 | ) | $ | (228,425 | ) | ||||||||||||||||||
FX OTC Put Options Written |
| |||||||||||||||||||||||||
USD/BRL Currency | JPMorgan Chase Bank, N.A. | 2.40 BRL | 12/31/15 | 1,895,400 USD | $ | (55,558 | ) | $ | (426 | ) | $ | 55,132 | ||||||||||||||
USD/JPY Currency | Morgan Stanley Capital Services LLC | 105.00 JPY | 01/12/16 | 900,000 USD | (3,987 | ) | (3,511 | ) | 476 | |||||||||||||||||
USD/JPY Currency | Morgan Stanley Capital Services LLC | 105.00 JPY | 01/12/16 | 600,000 USD | (5,052 | ) | (2,340 | ) | 2,712 | |||||||||||||||||
USD/JPY Currency | Morgan Stanley Capital Services LLC | 105.00 JPY | 01/12/16 | 3,890,000 USD | (33,376 | ) | (15,166 | ) | 18,210 | |||||||||||||||||
| $ | (97,973 | ) | $ | (21,443 | ) | $ | 76,530 | |||||||||||||||||||
OTC Put Options Written |
| |||||||||||||||||||||||||
Financial Select Sector SPDR Fund | Morgan Stanley & Co. International plc | 18.25 USD | 06/17/15 | 415,800 | $ | (41,413 | ) | $ | (23,432 | ) | $ | 17,981 | ||||||||||||||
iShares Russell 2000 Index | JPMorgan Chase Bank, N.A. | 89.96 USD | 06/19/15 | 52,582 | (25,639 | ) | (6,886 | ) | 18,753 | |||||||||||||||||
iShares Trust | Morgan Stanley & Co. International plc | 92.00 USD | 09/18/15 | 53,200 | (47,326 | ) | (26,870 | ) | 20,456 | |||||||||||||||||
| $ | (114,378 | ) | $ | (57,188 | ) | $ | 57,190 | |||||||||||||||||||
Total Options Written Outstanding |
| $ | (2,064,465 | ) | $ | (2,057,298 | ) | $ | 7,167 | |||||||||||||||||
See Notes to Consolidated Financial Statements.
99
Blackstone Alternative Multi-Manager Fund and Subsidiaries
Consolidated Schedule of Investments (Continued)
March 31, 2015
Reverse Repurchase Agreements Outstanding at March 31, 2015
Counterparty | Interest Rate | Trade Date | Maturity Date | Face Value | Face Value Including Accrued Interest | |||||||||||||
Credit Suisse Securities (Europe) Limited | (2.00)% | 02/25/15 | N/A | $ | 3,619,361 | $ | 3,612,525 | |||||||||||
Credit Suisse Securities (USA) LLC | 1.50% | 02/04/15 | 05/04/15 | 4,961,000 | 4,972,592 | |||||||||||||
Credit Suisse Securities (USA) LLC | 1.50% | 02/04/15 | 05/04/15 | 2,882,000 | 2,888,734 | |||||||||||||
Credit Suisse Securities (USA) LLC | 1.93% | 03/19/15 | 04/20/15 | 958,000 | 958,667 | |||||||||||||
Credit Suisse Securities (USA) LLC | 1.93% | 03/19/15 | 04/20/15 | 1,970,000 | 1,971,371 | |||||||||||||
Credit Suisse Securities (USA) LLC | 1.93% | 03/19/15 | 04/20/15 | 2,161,000 | 2,162,504 | |||||||||||||
Credit Suisse Securities (USA) LLC | 1.93% | 03/19/15 | 04/20/15 | 1,054,000 | 1,054,734 | |||||||||||||
Credit Suisse Securities (USA) LLC | 1.93% | 03/19/15 | 04/20/15 | 346,000 | 346,241 | |||||||||||||
Credit Suisse Securities (USA) LLC | 1.93% | 03/19/15 | 04/20/15 | 928,000 | 928,646 | |||||||||||||
Credit Suisse Securities (USA) LLC | 1.93% | 03/19/15 | 04/20/15 | 2,156,000 | 2,157,501 | |||||||||||||
Credit Suisse Securities (USA) LLC | 1.93% | 03/19/15 | 04/20/15 | 1,308,000 | 1,308,910 | |||||||||||||
Credit Suisse Securities (USA) LLC | 1.93% | 03/19/15 | 04/20/15 | 2,312,000 | 2,313,609 | |||||||||||||
Credit Suisse Securities (USA) LLC | 1.93% | 03/19/15 | 04/20/15 | 557,000 | 557,388 | |||||||||||||
J.P. Morgan Securities LLC | N/A | 03/25/15 | 04/07/15 | 1,761,349 | 1,761,349 | |||||||||||||
Merrill Lynch, Pierce, Fenner & Smith, Inc. | 1.52% | 03/09/15 | 04/09/15 | 5,401,000 | 5,406,245 | |||||||||||||
Merrill Lynch, Pierce, Fenner & Smith, Inc. | 1.58% | 03/19/15 | 04/21/15 | 1,970,000 | 1,971,124 | |||||||||||||
Merrill Lynch, Pierce, Fenner & Smith, Inc. | 1.58% | 03/19/15 | 04/21/15 | 5,975,000 | 5,978,409 | |||||||||||||
Merrill Lynch, Pierce, Fenner & Smith, Inc. | 1.67% | 03/06/15 | 04/08/15 | 3,901,000 | 3,905,705 | |||||||||||||
Merrill Lynch, Pierce, Fenner & Smith, Inc. | 1.67% | 03/26/15 | 04/27/15 | 8,993,000 | 8,995,503 | |||||||||||||
Merrill Lynch, Pierce, Fenner & Smith, Inc. | 1.67% | 03/26/15 | 04/27/15 | 12,082,000 | 12,085,363 | |||||||||||||
Merrill Lynch, Pierce, Fenner & Smith, Inc. | 1.67% | 03/19/15 | 06/19/15 | 887,000 | 887,535 | |||||||||||||
Merrill Lynch, Pierce, Fenner & Smith, Inc. | 1.67% | 03/25/15 | 04/24/15 | 2,624,000 | 2,624,852 | |||||||||||||
Merrill Lynch, Pierce, Fenner & Smith, Inc. | 1.68% | 03/19/15 | 04/21/15 | 4,154,000 | 4,156,520 | |||||||||||||
Merrill Lynch, Pierce, Fenner & Smith, Inc. | 1.68% | 03/19/15 | 04/21/15 | 2,691,000 | 2,692,633 | |||||||||||||
Merrill Lynch, Pierce, Fenner & Smith, Inc. | 1.68% | 03/20/15 | 04/22/15 | 2,702,000 | 2,703,513 | |||||||||||||
Merrill Lynch, Pierce, Fenner & Smith, Inc. | 1.77% | 03/04/15 | 04/07/15 | 515,000 | 515,709 | |||||||||||||
Merrill Lynch, Pierce, Fenner & Smith, Inc. | 1.77% | 03/02/15 | 04/02/15 | 84,000 | 84,124 | |||||||||||||
Merrill Lynch, Pierce, Fenner & Smith, Inc. | 1.77% | 03/04/15 | 04/07/15 | 1,923,000 | 1,925,647 | |||||||||||||
Merrill Lynch, Pierce, Fenner & Smith, Inc. | 1.77% | 03/23/15 | 04/02/15 | 281,000 | 281,124 | |||||||||||||
Merrill Lynch, Pierce, Fenner & Smith, Inc. | 1.78% | 03/19/15 | 04/21/15 | 567,000 | 567,364 | |||||||||||||
Merrill Lynch, Pierce, Fenner & Smith, Inc. | 1.78% | 03/23/15 | 04/23/15 | 2,093,000 | 2,093,931 | |||||||||||||
Merrill Lynch, Pierce, Fenner & Smith, Inc. | 1.80% | 01/29/15 | 04/29/15 | 5,004,000 | 5,019,512 | |||||||||||||
Merrill Lynch, Pierce, Fenner & Smith, Inc. | 1.84% | 03/17/15 | 06/17/15 | 779,000 | 779,597 | |||||||||||||
Merrill Lynch, Pierce, Fenner & Smith, Inc. | 1.85% | 01/30/15 | 04/30/15 | 3,983,000 | 3,995,486 | |||||||||||||
Merrill Lynch, Pierce, Fenner & Smith, Inc. | 1.86% | 02/05/15 | 05/05/15 | 1,821,000 | 1,826,175 | |||||||||||||
Merrill Lynch, Pierce, Fenner & Smith, Inc. | 1.86% | 02/06/15 | 05/06/15 | 4,250,000 | 4,261,857 | |||||||||||||
Merrill Lynch, Pierce, Fenner & Smith, Inc. | 1.86% | 02/06/15 | 05/06/15 | 4,815,000 | 4,828,434 | |||||||||||||
Merrill Lynch, Pierce, Fenner & Smith, Inc. | 1.86% | 02/06/15 | 05/06/15 | 7,576,000 | 7,597,137 | |||||||||||||
Merrill Lynch, Pierce, Fenner & Smith, Inc. | 1.87% | 03/05/15 | 06/05/15 | 965,000 | 966,353 | |||||||||||||
Royal Bank of Canada | 1.00% | 02/17/15 | 05/18/15 | 1,141,000 | 1,142,363 | |||||||||||||
Royal Bank of Canada | 1.48% | 02/17/15 | 08/17/15 | 3,032,000 | 3,037,369 | |||||||||||||
Royal Bank of Canada | 1.50% | 02/17/15 | 05/18/15 | 974,000 | 975,745 | |||||||||||||
See Notes to Consolidated Financial Statements.
100
Blackstone Alternative Multi-Manager Fund and Subsidiaries
Consolidated Schedule of Investments (Continued)
March 31, 2015
Counterparty | Interest Rate | Trade Date | Maturity Date | Face Value | Face Value Including Accrued Interest | |||||||||||
Royal Bank of Canada | 1.61% | 02/26/15 | 05/26/15 | $ | 1,444,000 | $ | 1,446,197 | |||||||||
Total Reverse Repurchase Agreements Outstanding |
| $ | 119,600,710 | $ | 119,746,297 | |||||||||||
Futures Contracts Outstanding at March 31, 2015
Description | Contracts | Exchange | Notional Amount | Expiration Date | Unrealized Appreciation (Depreciation) | |||||||||||||||
Long Futures | ||||||||||||||||||||
3 Month Euro Swiss Interest RT | 308 | LIF | 77,585,563 CHF | 09/19/16 | $ | (47,914 | ) | |||||||||||||
90 Day Eurodollar | 377 | CME | 93,264,324 USD | 06/13/16 | 14,901 | |||||||||||||||
90 Day Sterling | 627 | ICE | 77,754,990 GBP | 12/16/15 | 152,397 | |||||||||||||||
Brent Crude | 8 | ICE | 471,259 USD | 05/14/15 | (21,578 | ) | ||||||||||||||
CAC40 10 Euro | 58 | Euronext | 2,910,809 EUR | 04/17/15 | 10,828 | |||||||||||||||
Cocoa | 98 | ICE | 2,629,977 USD | 05/13/15 | 15,043 | |||||||||||||||
Coffee | 60 | ICE | 3,196,097 USD | 07/21/15 | (133,847 | ) | ||||||||||||||
Coffee | 31 | ICE | 1,930,891 USD | 05/18/15 | (385,929 | ) | ||||||||||||||
Cotton No. 2 | 35 | ICE | 1,115,365 USD | 05/06/15 | (11,115 | ) | ||||||||||||||
Euro Stoxx 50 | 75 | Eurex | 2,693,354 EUR | 06/19/15 | 32,145 | |||||||||||||||
Euro-BTP | 267 | Eurex | 37,296,224 EUR | 06/08/15 | 256,593 | |||||||||||||||
Euro-Oat | 63 | Eurex | 9,732,611 EUR | 06/08/15 | 105,954 | |||||||||||||||
Gold 100 Oz | 69 | COMEX | 8,316,800 USD | 06/26/15 | (152,720 | ) | ||||||||||||||
Hang Seng Index | 44 | HKFE | 54,025,556 HKD | 04/29/15 | 111,219 | |||||||||||||||
IBEX 35 Index | 37 | MEFF | 4,039,801 EUR | 04/17/15 | 227,533 | |||||||||||||||
Live Cattle | 91 | CME | 5,328,038 USD | 06/30/15 | 216,592 | |||||||||||||||
Long Gilt | 280 | ICE | 33,225,916 GBP | 06/26/15 | 866,430 | |||||||||||||||
Mex Bolsa Index | 336 | MexDer | 146,428,827 MXN | 06/19/15 | 1,981 | |||||||||||||||
Nasdaq 100 E-Mini | 27 | CME | 2,360,247 USD | 06/19/15 | (22,317 | ) | ||||||||||||||
Nikkei 225 | 81 | OSE | 1,504,500,850 JPY | 06/11/15 | 429,476 | |||||||||||||||
NY Harbor ULSD | 30 | NYMEX | 2,264,823 USD | 04/30/15 | (112,743 | ) | ||||||||||||||
OMXS30 Index | 519 | Nasdaq OMX | 85,706,882 SEK | 04/17/15 | 39,865 | |||||||||||||||
S&P 500 E-Mini | 64 | CME | 6,612,409 USD | 06/19/15 | (17,849 | ) | ||||||||||||||
Soybean Meal | 120 | CBOT | 3,875,475 USD | 05/14/15 | 46,125 | |||||||||||||||
Soybean Oil | 241 | CBOT | 4,793,661 USD | 07/14/15 | (366,009 | ) | ||||||||||||||
Sugar 11 | 58 | ICE | 925,212 USD | 04/30/15 | (150,239 | ) | ||||||||||||||
Topix Index | 4 | OSE | 60,729,448 JPY | 06/11/15 | 8,426 | |||||||||||||||
U.S. Treasury 10-Year Note | 429 | CBOT | 54,873,303 USD | 06/19/15 | 427,479 | |||||||||||||||
|
| |||||||||||||||||||
| $ | 1,540,727 | |||||||||||||||||||
|
| |||||||||||||||||||
Short Futures | ||||||||||||||||||||
3 Month Euribor | 1,673 | ICE | 418,228,812 EUR | 09/14/15 | $ | (22,783 | ) | |||||||||||||
90 Day Bank Bill | 151 | SFE | 150,269,568 AUD | 09/10/15 | (36,895 | ) | ||||||||||||||
90 Day Eurodollar | 18 | CME | 4,468,691 USD | 09/14/15 | (9,709 | ) | ||||||||||||||
See Notes to Consolidated Financial Statements.
101
Blackstone Alternative Multi-Manager Fund and Subsidiaries
Consolidated Schedule of Investments (Continued)
March 31, 2015
Description | Contracts | Exchange | Notional Amount | Expiration Date | Unrealized Appreciation (Depreciation) | |||||||||||||||
90 Day Eurodollar | 17 | CME | 4,229,506 USD | 06/15/15 | $ | (6,469 | ) | |||||||||||||
90 Day Eurodollar | 14 | CME | 3,466,658 USD | 12/14/15 | (10,417 | ) | ||||||||||||||
90 Day Eurodollar | 38 | CME | 9,399,933 USD | 03/14/16 | (20,267 | ) | ||||||||||||||
90 Day Eurodollar | 37 | CME | 9,130,252 USD | 06/13/16 | (24,473 | ) | ||||||||||||||
90 Day Eurodollar | 37 | CME | 9,106,999 USD | 09/19/16 | (29,688 | ) | ||||||||||||||
90 Day Eurodollar | 35 | CME | 8,596,255 USD | 12/19/16 | (30,808 | ) | ||||||||||||||
90 Day Eurodollar | 7 | CME | 1,709,870 USD | 06/19/17 | (10,555 | ) | ||||||||||||||
90 Day Eurodollar | 7 | CME | 1,711,920 USD | 03/13/17 | (10,955 | ) | ||||||||||||||
90 Day Eurodollar | 7 | CME | 1,699,307 USD | 12/18/17 | (17,005 | ) | ||||||||||||||
90 Day Eurodollar | 8 | CME | 1,946,130 USD | 09/18/17 | (17,671 | ) | ||||||||||||||
90 Day Eurodollar | 6 | CME | 1,459,147 USD | 03/19/18 | (10,703 | ) | ||||||||||||||
90 Day Eurodollar | 5 | CME | 1,205,150 USD | 12/16/19 | (13,788 | ) | ||||||||||||||
90 Day Eurodollar | 9 | CME | 2,172,314 USD | 09/16/19 | (23,123 | ) | ||||||||||||||
90 Day Eurodollar | 4 | CME | 970,540 USD | 09/17/18 | (7,760 | ) | ||||||||||||||
90 Day Eurodollar | 2 | CME | 483,707 USD | 12/17/18 | (5,068 | ) | ||||||||||||||
90 Day Eurodollar | 2 | CME | 482,945 USD | 06/17/19 | (5,230 | ) | ||||||||||||||
90 Day Eurodollar | 5 | CME | 1,211,875 USD | 03/16/20 | (6,438 | ) | ||||||||||||||
90 Day Eurodollar | 5 | CME | 1,211,557 USD | 06/15/20 | (6,130 | ) | ||||||||||||||
90 Day Eurodollar | 3 | CME | 724,742 USD | 03/18/19 | (7,970 | ) | ||||||||||||||
90 Day Eurodollar | 6 | CME | 1,459,172 USD | 06/18/18 | (9,403 | ) | ||||||||||||||
Australian 10-Year Bond | 48 | SFE | 6,253,135 AUD | 06/15/15 | (87,790 | ) | ||||||||||||||
Banker’s Acceptance | 380 | CDE | 94,100,926 CAD | 09/19/16 | (19,797 | ) | ||||||||||||||
Canada 10-Year Bond | 202 | CDE | 28,933,854 CAD | 06/19/15 | 79,250 | |||||||||||||||
CBOE Volatility Index | 248 | CFE | 4,494,741 USD | 05/20/15 | 74,141 | |||||||||||||||
DAX Index | 10 | Eurex | 3,010,234 EUR | 06/19/15 | 8,182 | |||||||||||||||
Euro Stoxx 50 | 1,605 | Eurex | 57,526,652 EUR | 06/19/15 | (807,404 | ) | ||||||||||||||
Euro-Bund | 277 | Eurex | 43,521,500 EUR | 06/08/15 | (489,261 | ) | ||||||||||||||
FTSE 100 Index | 119 | ICE | 8,095,170 GBP | 06/19/15 | 133,565 | |||||||||||||||
FTSE/JSE Top 40 | 340 | Safex | 158,985,700 ZAR | 06/18/15 | 103,578 | |||||||||||||||
FTSE/MIB Index | 11 | IDEM | 1,229,780 EUR | 06/19/15 | (27,107 | ) | ||||||||||||||
Gasoil | 70 | ICE | 3,867,433 USD | 09/10/15 | 96,183 | |||||||||||||||
Gasoline RBOB | 11 | NYMEX | 853,375 USD | 04/30/15 | 35,635 | |||||||||||||||
Japan 10-Year Bond | 142 | OSE | 20,817,079,300 JPY | 06/11/15 | (735,071 | ) | ||||||||||||||
Lean Hogs | 107 | CME | 3,177,199 USD | 06/12/15 | (67,041 | ) | ||||||||||||||
Low Sulphur Gasoil | 33 | ICE | 1,779,786 USD | 06/11/15 | 47,286 | |||||||||||||||
Nasdaq 100 E-Mini | 112 | CME | 9,833,079 USD | 06/19/15 | 134,999 | |||||||||||||||
Natural Gas | 51 | NYMEX | 1,404,247 USD | 04/28/15 | 57,847 | |||||||||||||||
Natural Gas | 114 | NYMEX | 3,389,677 USD | 10/28/15 | 65,437 | |||||||||||||||
S&P 500 E-Mini | 1,214 | CME | 125,746,672 USD | 06/19/15 | 656,112 | |||||||||||||||
S&P/TSX 60 Index | 79 | CDE | 13,693,106 CAD | 06/18/15 | 16,869 | |||||||||||||||
SGX CNX Nifty | 28 | SGX | 483,172 USD | 04/30/15 | 4,988 | |||||||||||||||
Silver | 27 | COMEX | 2,203,817 USD | 05/27/15 | (36,913 | ) | ||||||||||||||
Soybean Oil | 290 | CBOT | 5,621,176 USD | 05/14/15 | 333,316 | |||||||||||||||
SPI 200 | 106 | SFE | 15,446,306 AUD | 06/18/15 | (115,462 | ) | ||||||||||||||
Sugar 11 | 335 | ICE | 5,233,652 USD | 06/30/15 | 708,740 | |||||||||||||||
See Notes to Consolidated Financial Statements.
102
Blackstone Alternative Multi-Manager Fund and Subsidiaries
Consolidated Schedule of Investments (Continued)
March 31, 2015
Description | Contracts | Exchange | Notional Amount | Expiration Date | Unrealized Appreciation (Depreciation) | |||||||||||||||
Swiss Market Index | 47 | Eurex | 4,261,879 CHF | 06/19/15 | $ | 32,320 | ||||||||||||||
Topix Index | 201 | OSE | 3,076,315,452 JPY | 06/11/15 | (217,781 | ) | ||||||||||||||
U.S. Treasury 10-Year Note | 27 | CBOT | 3,463,098 USD | 06/19/15 | (17,371 | ) | ||||||||||||||
U.S. Treasury Long Bond | 26 | CBOT | 4,094,929 USD | 06/19/15 | (165,822 | ) | ||||||||||||||
|
| |||||||||||||||||||
| $ | (541,680 | ) | ||||||||||||||||||
|
| |||||||||||||||||||
Total Futures Contracts Outstanding |
| $ | 999,047 | |||||||||||||||||
|
| |||||||||||||||||||
Forward Foreign Currency Exchange Contracts Outstanding at March 31, 2015
Currency | Amount in | Currency | Amount in | Counterparty | Settlement | Unrealized | ||||||||||||||||
AUD | 19,422 | USD | 14,893 | Morgan Stanley & Co. LLC | 06/30/15 | $ | (173 | ) | ||||||||||||||
AUD | 852,044 | USD | 649,147 | Morgan Stanley Capital Services LLC | 06/17/15 | (2,944 | ) | |||||||||||||||
AUD | 39,865 | USD | 30,252 | Morgan Stanley & Co. LLC | 06/30/15 | (39 | ) | |||||||||||||||
BRL | 488,370 | USD | 150,000 | State Street Bank and Trust Company | 06/02/15 | 372 | ||||||||||||||||
CHF | 1,524,980 | USD | 1,529,774 | Morgan Stanley & Co. LLC | 06/30/15 | 45,253 | ||||||||||||||||
CHF | 1,842,000 | USD | 1,833,995 | State Street Bank and Trust Company | 06/17/15 | 67,376 | ||||||||||||||||
CHF | 543,177 | USD | 541,067 | Morgan Stanley & Co. LLC | 06/17/15 | 19,618 | ||||||||||||||||
CHF | 543,177 | USD | 542,906 | Morgan Stanley & Co. LLC | 06/17/15 | 17,779 | ||||||||||||||||
CHF | 431,918 | USD | 432,428 | Morgan Stanley & Co. LLC | 06/17/15 | 13,411 | ||||||||||||||||
CHF | 43,110 | USD | 43,685 | Morgan Stanley & Co. LLC | 06/30/15 | 840 | ||||||||||||||||
CHF | 876,320 | USD | 919,608 | Morgan Stanley & Co. LLC | 06/30/15 | (14,529 | ) | |||||||||||||||
CHF | 1,127,990 | USD | 1,178,888 | Morgan Stanley & Co. LLC | 06/30/15 | (13,880 | ) | |||||||||||||||
CHF | 244,410 | USD | 254,659 | Morgan Stanley & Co. LLC | 06/30/15 | (2,228 | ) | |||||||||||||||
CHF | 679,587 | USD | 712,057 | Morgan Stanley & Co. LLC | 06/17/15 | (10,566 | ) | |||||||||||||||
CHF | 65,760 | USD | 68,281 | Morgan Stanley & Co. LLC | 06/30/15 | (363 | ) | |||||||||||||||
CHF | 756,933 | USD | 787,406 | Morgan Stanley & Co. LLC | 06/17/15 | (6,076 | ) | |||||||||||||||
CHF | 408,122 | USD | 420,805 | Morgan Stanley & Co. LLC | 06/17/15 | 471 | ||||||||||||||||
CHF | 257,575 | USD | 266,048 | Morgan Stanley & Co. LLC | 06/30/15 | (20 | ) | |||||||||||||||
CLP | 3,810,000 | USD | 5,890 | Morgan Stanley Capital Services LLC | 06/17/15 | 170 | ||||||||||||||||
CLP | 920,000 | USD | 1,422 | Morgan Stanley Capital Services LLC | 06/17/15 | 41 | ||||||||||||||||
DKK | 4,355,779 | USD | 624,262 | Morgan Stanley & Co. LLC | 06/30/15 | 4,402 | ||||||||||||||||
DKK | 208,244 | USD | 29,867 | Morgan Stanley & Co. LLC | 06/30/15 | 188 | ||||||||||||||||
DKK | 3,586,090 | USD | 525,963 | Morgan Stanley & Co. LLC | 06/30/15 | (8,388 | ) | |||||||||||||||
DKK | 68,870 | USD | 10,020 | Morgan Stanley & Co. LLC | 06/30/15 | (80 | ) | |||||||||||||||
DKK | 6,277,440 | USD | 906,412 | Morgan Stanley & Co. LLC | 06/30/15 | (397 | ) | |||||||||||||||
EUR | 250,000 | CHF | 265,363 | State Street Bank and Trust Company | 04/22/15 | (4,394 | ) | |||||||||||||||
See Notes to Consolidated Financial Statements.
103
Blackstone Alternative Multi-Manager Fund and Subsidiaries
Consolidated Schedule of Investments (Continued)
March 31, 2015
Currency | Amount in | Currency | Amount in | Counterparty | Settlement | Unrealized | ||||||||||||||||
EUR | 521,765 | USD | 553,395 | Morgan Stanley Capital Services LLC | 06/17/15 | $ | 8,215 | |||||||||||||||
EUR | 280,229 | USD | 297,435 | Morgan Stanley & Co. LLC | 06/17/15 | 4,194 | ||||||||||||||||
EUR | 376,692 | USD | 406,236 | Morgan Stanley & Co. LLC | 06/17/15 | (778 | ) | |||||||||||||||
EUR | 1,219,346 | USD | 1,331,806 | Morgan Stanley & Co. LLC | 06/17/15 | (19,345 | ) | |||||||||||||||
EUR | 34,408 | USD | 37,613 | Morgan Stanley & Co. LLC | 06/17/15 | (577 | ) | |||||||||||||||
EUR | 50,699 | USD | 54,970 | Morgan Stanley & Co. LLC | 06/30/15 | (388 | ) | |||||||||||||||
EUR | 1,302,174 | USD | 1,400,535 | Morgan Stanley Capital Services LLC | 06/17/15 | 1,080 | ||||||||||||||||
EUR | 411,207 | USD | 441,891 | Morgan Stanley & Co. LLC | 06/17/15 | 718 | ||||||||||||||||
GBP | 17,713,000 | USD | 26,200,184 | State Street Bank and Trust Company | 06/17/15 | 61,641 | ||||||||||||||||
GBP | 1,917,072 | USD | 2,817,137 | Morgan Stanley & Co. LLC | 06/17/15 | 25,171 | ||||||||||||||||
GBP | 202,231 | USD | 300,582 | Morgan Stanley & Co. LLC | 06/30/15 | (774 | ) | |||||||||||||||
GBP | 283,361 | USD | 420,029 | Morgan Stanley & Co. LLC | 06/30/15 | 54 | ||||||||||||||||
HKD | 7,510,000 | USD | 969,877 | Morgan Stanley Capital Services LLC | 07/26/17 | (1,170 | ) | |||||||||||||||
HKD | 7,182,926 | USD | 924,503 | Morgan Stanley & Co. LLC | 06/17/15 | 1,882 | ||||||||||||||||
INR | 42,975,115 | USD | 671,067 | Morgan Stanley Capital Services LLC | 06/17/15 | 10,757 | ||||||||||||||||
JPY | 1,692,785,000 | USD | 13,947,689 | State Street Bank and Trust Company | 06/17/15 | 181,483 | ||||||||||||||||
JPY | 26,126,003 | USD | 215,673 | Morgan Stanley & Co. LLC | 06/17/15 | 2,393 | ||||||||||||||||
JPY | 37,320,257 | USD | 308,271 | Morgan Stanley & Co. LLC | 06/17/15 | 3,230 | ||||||||||||||||
JPY | 53,690,736 | USD | 444,349 | Morgan Stanley & Co. LLC | 06/17/15 | 3,791 | ||||||||||||||||
JPY | 129,300,000 | USD | 1,082,170 | JPMorgan Chase Bank, N.A. | 04/30/15 | (3,672 | ) | |||||||||||||||
JPY | 358,132,309 | USD | 3,007,342 | Morgan Stanley & Co. LLC | 06/17/15 | (18,118 | ) | |||||||||||||||
JPY | 39,533,551 | USD | 329,991 | Morgan Stanley & Co. LLC | 06/17/15 | (16 | ) | |||||||||||||||
JPY | 258,355,688 | USD | 2,155,479 | Morgan Stanley & Co. LLC | 06/17/15 | 939 | ||||||||||||||||
KRW | 620,132,837 | USD | 559,687 | Morgan Stanley & Co. LLC | 06/17/15 | (2,013 | ) | |||||||||||||||
MXN | 6,775,335 | USD | 450,000 | State Street Bank and Trust Company | 06/02/15 | (7,511 | ) | |||||||||||||||
MXN | 10,156,449 | USD | 651,827 | Morgan Stanley Capital Services LLC | 06/17/15 | 10,822 | ||||||||||||||||
NOK | 53,427,000 | USD | 6,535,722 | State Street Bank and Trust Company | 06/17/15 | 83,646 | ||||||||||||||||
PHP | 15,126,140 | USD | 339,990 | Morgan Stanley Capital Services LLC | 06/17/15 | (2,596 | ) | |||||||||||||||
RUB | 433,379,000 | USD | 6,831,321 | State Street Bank and Trust Company | 06/17/15 | 392,626 | ||||||||||||||||
SEK | 4,859,714 | USD | 562,097 | Morgan Stanley Capital Services LLC | 06/17/15 | 2,866 | ||||||||||||||||
SEK | 34,899,000 | USD | 4,035,016 | State Street Bank and Trust Company | 06/17/15 | 22,149 | ||||||||||||||||
See Notes to Consolidated Financial Statements.
104
Blackstone Alternative Multi-Manager Fund and Subsidiaries
Consolidated Schedule of Investments (Continued)
March 31, 2015
Currency | Amount in | Currency | Amount in | Counterparty | Settlement | Unrealized | ||||||||||||||||
SGD | 790,033 | USD | 567,141 | Morgan Stanley Capital Services LLC | 06/17/15 | $ | 7,445 | |||||||||||||||
THB | 11,238,085 | USD | 337,886 | Morgan Stanley Capital Services LLC | 06/17/15 | 6,392 | ||||||||||||||||
TRY | 9,864,000 | USD | 3,647,767 | State Street Bank and Trust Company | 06/17/15 | 73,485 | ||||||||||||||||
ZAR | 155,396,000 | USD | 12,279,900 | State Street Bank and Trust Company | 06/17/15 | 372,333 | ||||||||||||||||
USD | 41,532,291 | AUD | 54,642,000 | State Street Bank and Trust Company | 06/17/15 | 91,005 | ||||||||||||||||
USD | 34,719 | AUD | 45,612 | Morgan Stanley & Co. LLC | 06/30/15 | 150 | ||||||||||||||||
USD | 363,707 | AUD | 479,243 | Morgan Stanley Capital Services LLC | 06/17/15 | 242 | ||||||||||||||||
USD | 3,448,509 | BRL | 10,210,000 | State Street Bank and Trust Company | 06/02/15 | 304,794 | ||||||||||||||||
USD | 880,000 | BRL | 2,600,840 | State Street Bank and Trust Company | 06/02/15 | 79,187 | ||||||||||||||||
USD | 4,628,769 | BRL | 13,647,000 | State Street Bank and Trust Company | 06/02/15 | 426,783 | ||||||||||||||||
USD | 5,428,376 | CHF | 5,438,147 | Morgan Stanley & Co. LLC | 06/17/15 | (185,050 | ) | |||||||||||||||
USD | 543,394 | CHF | 543,177 | Morgan Stanley & Co. LLC | 06/17/15 | (17,290 | ) | |||||||||||||||
USD | 541,704 | CHF | 543,177 | Morgan Stanley & Co. LLC | 06/17/15 | (18,981 | ) | |||||||||||||||
USD | 2,471,275 | CHF | 2,388,734 | Morgan Stanley & Co. LLC | 06/17/15 | 5,548 | ||||||||||||||||
USD | 2,500,000 | CHF | 2,394,750 | State Street Bank and Trust Company | 04/22/15 | 33,829 | ||||||||||||||||
USD | 124,965 | CLP | 80,415,033 | Morgan Stanley Capital Services LLC | 06/17/15 | (2,931 | ) | |||||||||||||||
USD | 30,276 | CLP | 19,482,502 | Morgan Stanley Capital Services LLC | 06/17/15 | (710 | ) | |||||||||||||||
USD | 18,669,114 | CZK | 481,062,000 | State Street Bank and Trust Company | 06/17/15 | (118,591 | ) | |||||||||||||||
USD | 669,368 | DKK | 4,564,023 | Morgan Stanley & Co. LLC | 06/30/15 | 10,649 | ||||||||||||||||
USD | 5,376,565 | EUR | 4,700,000 | State Street Bank and Trust Company | 05/11/15 | 320,297 | ||||||||||||||||
USD | 467,718 | EUR | 439,252 | Morgan Stanley & Co. LLC | 06/30/15 | (5,171 | ) | |||||||||||||||
USD | 1,104,162 | EUR | 1,043,414 | Morgan Stanley Capital Services LLC | 06/17/15 | (18,933 | ) | |||||||||||||||
USD | 3,121,749 | EUR | 2,950,000 | Morgan Stanley Capital Services LLC | 06/17/15 | (53,528 | ) | |||||||||||||||
USD | 25,492,081 | EUR | 24,093,000 | State Street Bank and Trust Company | 06/17/15 | (440,788 | ) | |||||||||||||||
USD | 5,357,362 | EUR | 5,101,277 | Morgan Stanley & Co. LLC | 06/17/15 | (133,476 | ) | |||||||||||||||
USD | 1,498,943 | EUR | 1,412,347 | Morgan Stanley Capital Services LLC | 06/17/15 | (21,259 | ) | |||||||||||||||
See Notes to Consolidated Financial Statements.
105
Blackstone Alternative Multi-Manager Fund and Subsidiaries
Consolidated Schedule of Investments (Continued)
March 31, 2015
Currency | Amount in | Currency | Amount in | Counterparty | Settlement | Unrealized | ||||||||||||||||
USD | 5,426,052 | EUR | 5,112,583 | Morgan Stanley Capital Services LLC | 06/17/15 | $ | (76,955 | ) | ||||||||||||||
USD | 57,959 | EUR | 54,395 | Morgan Stanley & Co. LLC | 06/30/15 | (602 | ) | |||||||||||||||
USD | 5,486,850 | EUR | 5,000,000 | State Street Bank and Trust Company | 04/22/15 | 109,189 | ||||||||||||||||
USD | 10,648,928 | EUR | 9,795,000 | JPMorgan Chase Bank, N.A. | 04/30/15 | 112,992 | ||||||||||||||||
USD | 11,041 | EUR | 10,100 | Morgan Stanley Capital Services LLC | 06/17/15 | 170 | ||||||||||||||||
USD | 217,794 | EUR | 199,463 | Morgan Stanley Capital Services LLC | 06/17/15 | 3,099 | ||||||||||||||||
USD | 851,017 | GBP | 572,013 | Morgan Stanley & Co. LLC | 06/30/15 | 3,008 | ||||||||||||||||
USD | 297,594 | GBP | 202,257 | Morgan Stanley & Co. LLC | 06/30/15 | (2,252 | ) | |||||||||||||||
USD | 1,130,944 | GBP | 760,000 | JPMorgan Chase Bank, N.A. | 04/30/15 | 3,767 | ||||||||||||||||
USD | 27,697 | GBP | 18,705 | Morgan Stanley & Co. LLC | 06/30/15 | (33 | ) | |||||||||||||||
USD | 966,662 | HKD | 7,510,000 | Morgan Stanley Capital Services LLC | 07/26/17 | (2,044 | ) | |||||||||||||||
USD | 164,579 | HKD | 1,276,000 | Morgan Stanley & Co. LLC | 05/04/15 | 5 | ||||||||||||||||
USD | 758,418 | HKD | 5,879,180 | Morgan Stanley & Co. LLC | 05/04/15 | 141 | ||||||||||||||||
USD | 5,283,238 | ILS | 21,243,000 | State Street Bank and Trust Company | 06/17/15 | (55,977 | ) | |||||||||||||||
USD | 380,000 | INR | 23,985,600 | Morgan Stanley Capital Services LLC | 06/17/15 | (545 | ) | |||||||||||||||
USD | 1,160,227 | JPY | 136,133,000 | JPMorgan Chase Bank, N.A. | 05/11/15 | 24,568 | ||||||||||||||||
USD | 350,876 | JPY | 42,567,744 | Morgan Stanley Capital Services LLC | 06/17/15 | (4,425 | ) | |||||||||||||||
USD | 45,088 | JPY | 5,470,000 | Morgan Stanley Capital Services LLC | 06/17/15 | (569 | ) | |||||||||||||||
USD | 215,321 | JPY | 26,126,003 | Morgan Stanley & Co. LLC | 06/17/15 | (2,745 | ) | |||||||||||||||
USD | 23,457,194 | JPY | 2,840,783,489 | Morgan Stanley & Co. LLC | 06/17/15 | (253,979 | ) | |||||||||||||||
USD | 107,422 | JPY | 13,013,693 | Morgan Stanley & Co. LLC | 06/17/15 | (1,199 | ) | |||||||||||||||
USD | 17,849 | JPY | 2,160,000 | Morgan Stanley Capital Services LLC | 06/17/15 | (180 | ) | |||||||||||||||
USD | 3,835,161 | JPY | 458,554,851 | Morgan Stanley & Co. LLC | 06/17/15 | 7,740 | ||||||||||||||||
USD | 10,012 | KRW | 11,349,200 | Morgan Stanley Capital Services LLC | 06/17/15 | (194 | ) | |||||||||||||||
USD | 61,159 | KRW | 69,326,000 | Morgan Stanley Capital Services LLC | 06/17/15 | (1,184 | ) | |||||||||||||||
USD | 9,880,138 | KRW | 11,246,561,000 | State Street Bank and Trust Company | 06/17/15 | (233,676 | ) | |||||||||||||||
USD | 1,795,600 | KRW | 2,051,203,789 | Morgan Stanley & Co. LLC | �� | 06/17/15 | (49,008 | ) | ||||||||||||||
See Notes to Consolidated Financial Statements.
106
Blackstone Alternative Multi-Manager Fund and Subsidiaries
Consolidated Schedule of Investments (Continued)
March 31, 2015
Currency | Amount in | Currency | Amount in | Counterparty | Settlement | Unrealized | ||||||||||||||||
USD | 121,766 | KRW | 135,428,309 | Morgan Stanley & Co. LLC | 06/17/15 | $ | (22 | ) | ||||||||||||||
USD | 380,000 | MXN | 5,829,618 | Morgan Stanley Capital Services LLC | 06/17/15 | (348 | ) | |||||||||||||||
USD | 4,002,088 | NZD | 5,511,000 | State Street Bank and Trust Company | 06/17/15 | (87,782 | ) | |||||||||||||||
USD | 160,000 | PHP | 7,180,800 | Morgan Stanley Capital Services LLC | 06/17/15 | (170 | ) | |||||||||||||||
USD | 553,838 | SEK | 4,859,714 | Morgan Stanley Capital Services LLC | 06/17/15 | (11,126 | ) | |||||||||||||||
USD | 160,000 | THB | 5,241,600 | Morgan Stanley Capital Services LLC | 06/17/15 | (576 | ) | |||||||||||||||
|
| |||||||||||||||||||||
Total Forward Foreign Currency Exchange Contracts Outstanding |
| $ | 1,061,062 | |||||||||||||||||||
|
| |||||||||||||||||||||
Centrally Cleared Credit Default Swaps on Index (Buy Protection) — Outstanding at March 31, 2015
Reference | The | Maturity | Counterparty | Notional Amount | Market | Upfront | Unrealized | |||||||||||||||||||
CDX.NA.IG.24 | (1.00%) | 06/20/20 | Credit Suisse Securities (USA) LLC | 17,388,150 USD | $ | (312,141) | $ | (317,565) | $ | 5,424 | ||||||||||||||||
Total Centrally Cleared Credit Default Swaps on Index (Buy Protection) |
| $ | (312,141) | $ | (317,565) | $ | 5,424 | |||||||||||||||||||
OTC Credit Default Swaps on Index (Buy Protection) — Outstanding at March 31, 2015
Reference | The | Maturity | Counterparty | Notional | Market | Upfront | Unrealized | |||||||||||||||||||
CDX.EM.21 | (5.00%) | 06/20/19 | JPMorgan Chase Bank, N.A. | 1,128,000 USD | $ | (24,272 | ) | $ | (88,548 | ) | $ | 64,276 | ||||||||||||||
CMBX.NA.BBB-.6 | (3.00%) | 05/11/63 | Credit Suisse International | 4,806,741 USD | (49,683 | ) | 35,108 | (84,791 | ) | |||||||||||||||||
CMBX.NA.BBB-.6 | (3.00%) | 05/11/63 | Morgan Stanley Capital Services LLC | 1,292,294 USD | (13,357 | ) | (14,837 | ) | 1,480 | |||||||||||||||||
CMBX.NA.BBB-.7 | (3.00%) | 01/17/47 | Credit Suisse International | 5,216,325 USD | 42,578 | 91,178 | (48,600 | ) | ||||||||||||||||||
See Notes to Consolidated Financial Statements.
107
Blackstone Alternative Multi-Manager Fund and Subsidiaries
Consolidated Schedule of Investments (Continued)
March 31, 2015
Reference | The | Maturity | Counterparty | Notional | Market | Upfront | Unrealized | |||||||||||||||||||
CMBX.NA.BBB-.7 | (3.00%) | 01/17/47 | Morgan Stanley Capital Services LLC | 1,978,818 USD | $ | 16,152 | $ | 18,384 | $ | (2,232 | ) | |||||||||||||||
iTraxx CEEMA Series 21 Version 1 | (1.00%) | 06/20/19 | JPMorgan Chase Bank, N.A. | 160,000 USD | 19,917 | 15,763 | 4,154 | |||||||||||||||||||
Total OTC Credit Default Swaps on Index (Buy Protection) |
| $ | (8,665) | $ | 57,048 | $ (65,713) | ||||||||||||||||||||
OTC Total Return Swaps Outstanding at March 31, 2015
Reference Instrument | Termination | Counterparty | Notional | Unrealized | ||||||||
Buys | ||||||||||||
Airbus Group | 12/28/15 | Credit Suisse Securities (Europe) Limited | 2,379,615 EUR | $ | (137,029 | ) | ||||||
Alstom | 02/09/16 | Credit Suisse Securities (Europe) Limited | 540,780 EUR | (18,345 | ) | |||||||
Amadeus IT Holding SA | 02/09/16 | Credit Suisse Securities (Europe) Limited | 2,690,520 EUR | 118,704 | ||||||||
Assicurazioni Generali | 12/28/15 | Credit Suisse Securities (Europe) Limited | 1,466,704 EUR | — | ||||||||
Astrazeneca PLC | 08/12/15 | Morgan Stanley Capital Services LLC | 1,235,673 GBP | (589 | ) | |||||||
Atlantia SpA | 08/18/16 | Credit Suisse Securities (Europe) Limited | 1,976,469 EUR | (14,674 | ) | |||||||
Atos | 02/09/16 | Credit Suisse Securities (Europe) Limited | 2,030,719 EUR | (51,600 | ) | |||||||
Axis Communications AB | 02/09/16 | Credit Suisse Securities (Europe) Limited | 3,038,139 SEK | 1,562 | ||||||||
Barclays PLC | 02/09/16 | Credit Suisse Securities (Europe) Limited | 1,354,210 GBP | (40,831 | ) | |||||||
Bayer AG | 02/08/16 | Credit Suisse Securities (Europe) Limited | 4,336,148 EUR | (170,127 | ) | |||||||
Bayer AG REG | 08/11/15 | Morgan Stanley Capital Services LLC | 3,109,073 EUR | 464,144 | ||||||||
BNP Paribas | 02/09/16 | Credit Suisse Securities (Europe) Limited | 2,411,244 EUR | 204,192 | ||||||||
Bovespa Index | 04/15/15 | Morgan Stanley Capital Services LLC | 5,947,339 BRL | 28,420 | ||||||||
BP PLC | 02/09/16 | Credit Suisse Securities (Europe) Limited | 620,700 GBP | 42,113 | ||||||||
Carrefour SA | 02/09/16 | Credit Suisse Securities (Europe) Limited | 1,612,595 EUR | 1,116 | ||||||||
Criteo SA | 10/14/15 | Credit Suisse Securities (Europe) Limited | 1,394,151 USD | (97,801 | ) | |||||||
Dassault Aviation SA | 12/28/15 | Credit Suisse Securities (Europe) Limited | 1,033,092 EUR | 104,475 | ||||||||
Domino Printing Sciences PLC | 02/09/16 | Credit Suisse Securities (Europe) Limited | 96,004 GBP | 58 | ||||||||
Electricite De France EDF | 02/09/16 | Credit Suisse Securities (Europe) Limited | 1,847,643 EUR | (15,004 | ) | |||||||
Enel SpA | 08/18/16 | Credit Suisse Securities (Europe) Limited | 842,687 EUR | 14,868 | ||||||||
ENI SpA Italia | 08/18/16 | Credit Suisse Securities (Europe) Limited | 867,872 EUR | 54,497 | ||||||||
Fresenius Medical Care AG & Co. KgaA | 02/08/16 | Credit Suisse Securities (Europe) Limited | 2,856,193 EUR | (92,295 | ) | |||||||
See Notes to Consolidated Financial Statements.
108
Blackstone Alternative Multi-Manager Fund and Subsidiaries
Consolidated Schedule of Investments (Continued)
March 31, 2015
Reference Instrument | Termination | Counterparty | Notional | Unrealized | ||||||||
Imperial Tobacoo Group PLC | 02/09/16 | Credit Suisse Securities (Europe) Limited | 1,004,056 GBP | $ | (79,180 | ) | ||||||
ING Groep NV | 02/09/16 | Credit Suisse Securities (Europe) Limited | 1,714,766 EUR | 7,279 | ||||||||
Jazztel PLC | 02/09/16 | Credit Suisse Securities (Europe) Limited | 1,730,092 EUR | 32,833 | ||||||||
KBC Groep NV | 06/13/16 | Credit Suisse Securities (Europe) Limited | 1,637,349 EUR | (20,855 | ) | |||||||
Koninklijke KPN NV | 02/09/16 | Credit Suisse Securities (Europe) Limited | 3,687,908 EUR | 141,715 | ||||||||
Kospi2 Index | 06/12/15 | Morgan Stanley Capital Services LLC | 634,463,250 KRW | 8,596 | ||||||||
Linde AG | 02/08/16 | Credit Suisse Securities (Europe) Limited | 2,241,685 EUR | (51,615 | ) | |||||||
Lloyds Banking Group PLC | 02/09/16 | Credit Suisse Securities (Europe) Limited | 1,813,944 GBP | (38,338 | ) | |||||||
Lloyds Banking Group PLC | 02/26/20 | Credit Suisse Securities (Europe) Limited | 2,151,429 GBP | (40,634 | ) | |||||||
Lloyds Banking Group PLC | 04/02/20 | Credit Suisse Securities (Europe) Limited | 381,452 GBP | (7,239 | ) | |||||||
Mead Johnson Nutrition Co. | 10/14/15 | Credit Suisse Securities (Europe) Limited | 1,963,540 USD | (11,650 | ) | |||||||
Next PLC | 03/10/20 | Credit Suisse Securities (Europe) Limited | 1,813,566 GBP | (143,589 | ) | |||||||
Orange | 02/09/16 | Credit Suisse Securities (Europe) Limited | 1,287,275 EUR | (9,366 | ) | |||||||
Peugeot SA | 02/09/16 | Credit Suisse Securities (Europe) Limited | 936,720 EUR | (59,855 | ) | |||||||
Pirelli & Co. | 12/28/15 | Credit Suisse Securities (Europe) Limited | 943,700 EUR | (3,365 | ) | |||||||
Prudential PLC | 02/09/16 | Credit Suisse Securities (Europe) Limited | 1,653,994 GBP | (42,539 | ) | |||||||
Publicis Groupe | 12/28/15 | Credit Suisse Securities (Europe) Limited | 3,113,782 EUR | (203,154 | ) | |||||||
Puma SE | 12/24/15 | Credit Suisse Securities (Europe) Limited | 1,135,828 EUR | (27,647 | ) | |||||||
Reed Elsevier PLC | 02/09/16 | Credit Suisse Securities (Europe) Limited | 72,420 GBP | (43 | ) | |||||||
Rexel SA | 02/09/16 | Credit Suisse Securities (Europe) Limited | 1,549,060 EUR | (40,704 | ) | |||||||
Reynolds American, Inc. | 10/14/15 | Credit Suisse Securities (Europe) Limited | 295,340 USD | (7,640 | ) | |||||||
Roche Holding AG Genusschein | 12/29/15 | Credit Suisse Securities (Europe) Limited | 1,793,636 CHF | 4,918 | ||||||||
Royal Bank of Scotland Group | 04/04/19 | Credit Suisse Securities (Europe) Limited | 4,029,444 GBP | (585,635 | ) | |||||||
Royal Dutch Petroleum | 02/09/16 | Credit Suisse Securities (Europe) Limited | 1,996,099 EUR | 51,723 | ||||||||
RSA Insurance Group PLC | 02/09/16 | Credit Suisse Securities (Europe) Limited | 1,774,439 GBP | 686 | ||||||||
RWE AG | 12/24/15 | Credit Suisse Securities (Europe) Limited | 1,186,645 EUR | (536 | ) | |||||||
SabMiller PLC | 02/09/16 | Credit Suisse Securities (Europe) Limited | 1,953,421 GBP | (126,312 | ) | |||||||
Safran SA | 02/09/16 | Credit Suisse Securities (Europe) Limited | 1,361,476 EUR | (65,613 | ) | |||||||
Samsung Electonics Co. Ltd. | 12/07/16 | Morgan Stanley Capital Services LLC | 1,319,024 USD | 91,518 | ||||||||
Sanofi Aventis | 02/09/16 | Credit Suisse Securities (Europe) Limited | 2,265,935 EUR | (3,705 | ) | |||||||
Shire PLC | 08/12/15 | Morgan Stanley Capital Services LLC | 2,932,620 GBP | 548,968 | ||||||||
Shire PLC | 04/04/19 | Credit Suisse Securities (Europe) Limited | 5,170,405 GBP | 1,511,874 | ||||||||
See Notes to Consolidated Financial Statements.
109
Blackstone Alternative Multi-Manager Fund and Subsidiaries
Consolidated Schedule of Investments (Continued)
March 31, 2015
Reference Instrument | Termination | Counterparty | Notional | Unrealized | ||||||||
Smith & Nephew PLC | 02/09/16 | Credit Suisse Securities (Europe) Limited | 3,662,277 GBP | $ | (27,561 | ) | ||||||
Societe Generale SA | 02/09/16 | Credit Suisse Securities (Europe) Limited | 2,229,188 EUR | 122,115 | ||||||||
STM IM | 08/18/16 | Credit Suisse Securities (Europe) Limited | 1,431,361 EUR | (83,736 | ) | |||||||
Telecom Italia SpA | 08/18/16 | Credit Suisse Securities (Europe) Limited | 1,755,425 EUR | (81,059 | ) | |||||||
Tim Participacs | 10/14/15 | Credit Suisse Securities (Europe) Limited | 1,622,186 USD | (160,775 | ) | |||||||
UBM PLC | 02/09/16 | Credit Suisse Securities (Europe) Limited | 1,567,768 GBP | (72,410 | ) | |||||||
Vodafone Group PLC | 02/09/16 | Credit Suisse Securities (Europe) Limited | 2,553,634 GBP | (36,587 | ) | |||||||
|
| |||||||||||
Total Buys | $ | 886,737 | ||||||||||
|
| |||||||||||
Sells | ||||||||||||
ABB Ltd. REG | 12/29/15 | Credit Suisse Securities (Europe) Limited | 207,496 CHF | (765 | ) | |||||||
Allianz SE REG | 02/08/16 | Credit Suisse Securities (Europe) Limited | 1,131,966 EUR | (14,458 | ) | |||||||
America Movil ADR | 06/23/15 | Credit Suisse Securities (Europe) Limited | 411,038 USD | (13,487 | ) | |||||||
BASF SE | 02/08/16 | Credit Suisse Securities (Europe) Limited | 1,032,957 EUR | 2,395 | ||||||||
British American Tobacco PLC | 02/09/16 | Credit Suisse Securities (Europe) Limited | 79,584 GBP | 7,003 | ||||||||
BT Group PLC | 02/09/16 | Credit Suisse Securities (Europe) Limited | 178,228 GBP | 7,962 | ||||||||
Bureau Veritas SA | 02/09/16 | Credit Suisse Securities (Europe) Limited | 1,736,045 EUR | 28,150 | ||||||||
Cap Gemini | 12/28/15 | Credit Suisse Securities (Europe) Limited | 202,666 EUR | 143 | ||||||||
CSL LTD | 03/02/17 | Morgan Stanley Capital Services LLC | 1,149,858 AUD | (8,267 | ) | |||||||
Deutsche Telekom AG | 02/08/16 | Credit Suisse Securities (Europe) Limited | 524,641 EUR | 4,432 | ||||||||
Distribuidora Internacional | 02/09/16 | Credit Suisse Securities (Europe) Limited | 710,658 EUR | (49,587 | ) | |||||||
Faurecia | 12/28/15 | Credit Suisse Securities (Europe) Limited | 2,277,861 EUR | 116,632 | ||||||||
GlaxoSmithKline PLC | 08/12/15 | Morgan Stanley Capital Services LLC | 749,307 GBP | (76,426 | ) | |||||||
Heineken NV | 02/09/16 | Credit Suisse Securities (Europe) Limited | 213,910 EUR | 11,651 | ||||||||
iShares MSCI Brazil Capped ETF | 10/14/15 | Credit Suisse Securities (Europe) Limited | 238,167 USD | (14,926 | ) | |||||||
L’Oreal | 12/28/15 | Credit Suisse Securities (Europe) Limited | 63,774 EUR | 772 | ||||||||
Lorillard, Inc. | 10/14/15 | Credit Suisse Securities (Europe) Limited | 988,477 USD | 34,171 | ||||||||
Merck KgaA | 08/11/15 | Morgan Stanley Capital Services LLC | 1,108,691 EUR | (33,229 | ) | |||||||
Muenchener Rueckver AG REG | 02/08/16 | Credit Suisse Securities (Europe) Limited | 865,717 EUR | (9,841 | ) | |||||||
Nestle SA REG | 12/29/15 | Credit Suisse Securities (Europe) Limited | 196,277 CHF | 6,653 | ||||||||
Pernod Ricard SA | 12/28/15 | Credit Suisse Securities (Europe) Limited | 122,396 EUR | (1,756 | ) | |||||||
Philip Morris International | 10/14/15 | Credit Suisse Securities (Europe) Limited | 94,714 USD | 3,113 | ||||||||
Reed Elsevier NV | 12/28/15 | Credit Suisse Securities (Europe) Limited | 991,995 EUR | 9,346 | ||||||||
See Notes to Consolidated Financial Statements.
110
Blackstone Alternative Multi-Manager Fund and Subsidiaries
Consolidated Schedule of Investments (Continued)
March 31, 2015
Reference Instrument | Termination | Counterparty | Notional | Unrealized | ||||||||
Sainsbury (J) PLC | 02/09/16 | Credit Suisse Securities (Europe) Limited | 428,191 GBP | $ | 22,229 | |||||||
SAP AG | 12/24/15 | Credit Suisse Securities (Europe) Limited | 237,532 EUR | (7,956 | ) | |||||||
Siemens AG REG | 02/08/16 | Credit Suisse Securities (Europe) Limited | 1,006,262 EUR | 53,128 | ||||||||
Standard Chartered PLC | 02/09/16 | Credit Suisse Securities (Europe) Limited | 1,229,544 GBP | (261,675 | ) | |||||||
Telefonica Brasil | 10/14/15 | Credit Suisse Securities (Europe) Limited | 694,434 USD | 13,800 | ||||||||
Telefonica SA | 02/09/16 | Credit Suisse Securities (Europe) Limited | 3,025,221 EUR | 277 | ||||||||
Teliasonera AB | 02/09/16 | Credit Suisse Securities (Europe) Limited | 449,646 SEK | (1,570 | ) | |||||||
Texas Instruments, Inc. | 10/14/15 | Credit Suisse Securities (Europe) Limited | 1,074,205 USD | 21,086 | ||||||||
Unilever DR | 02/09/16 | Credit Suisse Securities (Europe) Limited | 857,970 EUR | 36,542 | ||||||||
Unilever PLC | 02/09/16 | Credit Suisse Securities (Europe) Limited | 276,652 GBP | 10,096 | ||||||||
Volkswagen AG | 02/08/16 | Credit Suisse Securities (Europe) Limited | 2,868,703 EUR | 88,839 | ||||||||
|
| |||||||||||
Total Sells | $ | (15,523 | ) | |||||||||
|
| |||||||||||
Total OTC Total Return Swaps Outstanding | $ | 871,214 | ||||||||||
|
| |||||||||||
Centrally Cleared Interest Rate Swaps Outstanding at March 31, 2015
The | Floating | Fixed | Maturity | Counterparty | Notional | Market | Upfront | Unrealized | ||||||||||||||||||
Pays | Three-Month Libor | 2.750% | 06/17/25 | Credit Suisse Securities (USA) LLC | 16,361,000 USD | $ | 1,003,815 | $ | 848,041 | $ | 155,774 | |||||||||||||||
Pays | Three-Month Libor | 3.250% | 06/19/45 | Credit Suisse Securities (USA) LLC | 5,892,000 USD | 1,094,999 | 923,432 | 171,567 | ||||||||||||||||||
Receives | Three-Month Libor | 1.250% | 06/19/17 | Credit Suisse Securities (USA) LLC | 51,378,000 USD | (319,177 | ) | (139,032 | ) | (180,145 | ) | |||||||||||||||
Receives | Three-Month Libor | 1.919% | 09/30/19 | Morgan Stanley Capital Services LLC | 6,923,000 USD | (144,038 | ) | — | (144,038 | ) | ||||||||||||||||
Receives | Three-Month Libor | 2.250% | 06/17/20 | Credit Suisse Securities (USA) LLC | 7,238,000 USD | (219,812 | ) | (158,249 | ) | (61,563 | ) | |||||||||||||||
Receives | Three-Month Libor | 2.304% | 01/27/25 | Morgan Stanley & Co. LLC | 2,430,000 USD | (62,675 | ) | — | (62,675 | ) | ||||||||||||||||
Receives | Three-Month Libor | 2.534% | 09/25/24 | Morgan Stanley & Co. LLC | 8,180,000 USD | (386,466 | ) | — | (386,466 | ) | ||||||||||||||||
Total Centrally Cleared Interest Rate Swaps Outstanding |
| $ | 966,646 | $ | 1,474,192 | $ | (507,546) | |||||||||||||||||||
See Notes to Consolidated Financial Statements.
111
Blackstone Alternative Multi-Manager Fund and Subsidiaries
Consolidated Schedule of Investments (Continued)
March 31, 2015
| Abbreviation Legend: | ||||
| ADR | American Depository Receipt | |||
| CBOT | Chicago Board of Trade | |||
| CDE | Montreal Exchange | |||
| CFE | CBOE Futures Exchange | |||
| CME | Chicago Mercantile Exchange | |||
| COMEX | Commodities Exchange Center | |||
| Eurex | Eurex Exchange | |||
| Euronext | Euronext Paris | |||
| HKFE | Hong Kong Futures Exchange Ltd. | |||
| ICE | Ice Futures Europe | |||
| IDEM | Italian Derivatives Exchange Market | |||
| LIBOR | London Interbank Offered Rate | |||
| LIF | New York Stock Exchange Euronext Liffe | |||
| MEFF | MEFF Renta Variable | |||
| MTN | Medium Term Note | |||
| MexDer | Mexican Derivatives Exchange | |||
| NYMEX | New York Mercantile Exchange | |||
| OSE | Osaka Exchange | |||
| OTC | Over the Counter | |||
| PIK | Payment in Kind | |||
| REG S | Regulation-S | |||
| REIC | Real Estate Investment Company | |||
| REIT | Real Estate Investment Trust | |||
| SFE | ASX Trade24 | |||
| SGX | Singapore Exchange | |||
| Safex | South African Futures Exchange | |||
| VRN | Variable Rate Notes | |||
| Currency Legend: | ||||
| AUD | Australian Dollar | |||
| BRL | Brazilian Real | |||
| CAD | Canadian Dollar | |||
| CHF | Swiss Franc | |||
| CLP | Chilean Peso | |||
| CZK | Czech Koruna | |||
| DKK | Danish Krone | |||
| EUR | Euro | |||
| GBP | British Pound | |||
| HKD | Hong Kong Dollar | |||
| ILS | Israeli Shekel | |||
| INR | Indian Rupee | |||
| JPY | Japanese Yen | |||
| KRW | South Korea Won | |||
| MXN | Mexican Peso | |||
| NOK | Norwegian Krone | |||
| NZD | New Zealand Dollar | |||
| PHP | Philippine Peso | |||
| RUB | Russian Ruble | |||
See Notes to Consolidated Financial Statements.
112
Blackstone Alternative Multi-Manager Fund and Subsidiaries
Consolidated Schedule of Investments (Continued)
March 31, 2015
| SEK | Swedish Krona | |||
| SGD | Singapore Dollar | |||
| THB | Thai Baht | |||
| TRY | Turkish Lira | |||
| USD | United States Dollar | |||
| ZAR | South African Rand |
See Notes to Consolidated Financial Statements.
113
Blackstone Alternative Multi-Strategy Fund and Subsidiaries
Consolidated Schedule of Investments
March 31, 2015
Security Description | Shares | Value | ||||||||
INVESTMENTS IN SECURITIES — 76.1% | ||||||||||
COMMON STOCK — 42.9% | ||||||||||
Argentina — 0.0% | ||||||||||
Iron & Steel — 0.0% | ||||||||||
Ternium SA ADR (d) | 8,600 | $ | 155,402 | |||||||
|
| |||||||||
Total Argentina | 155,402 | |||||||||
|
| |||||||||
Belgium — 0.1% | ||||||||||
Consumer Products — 0.0% | ||||||||||
Anheuser-Busch InBev NV (d) | 1,949 | 238,100 | ||||||||
|
| |||||||||
Insurance — 0.1% | ||||||||||
Ageas (d) | 30,019 | 1,078,057 | ||||||||
|
| |||||||||
Retail—Consumer Staples — 0.0% | ||||||||||
Delhaize Group SA ADR (d) | 1,200 | 26,844 | ||||||||
|
| |||||||||
Total Belgium | 1,343,001 | |||||||||
|
| |||||||||
Bermuda — 0.1% | ||||||||||
Transportation & Logistics — 0.1% | ||||||||||
Golar LNG Ltd. (d) | 21,103 | 702,308 | ||||||||
Teekay Corp. (d) | 3,200 | 149,024 | ||||||||
|
| |||||||||
Total Bermuda | 851,332 | |||||||||
|
| |||||||||
Brazil — 0.1% | ||||||||||
Aerospace & Defense — 0.0% | ||||||||||
Embraer SA ADR | 500 | 15,375 | ||||||||
|
| |||||||||
Banking — 0.1% | ||||||||||
Itau Unibanco Holding SA ADR | 19,579 | 216,544 | ||||||||
|
| |||||||||
Oil, Gas & Coal — 0.0% | ||||||||||
Cosan Ltd. A Shares (d) | 957 | 6,058 | ||||||||
|
| |||||||||
Retail—Consumer Staples — 0.0% | ||||||||||
Cia Brasileira de Distribuicao ADR (d) | 5,500 | 164,010 | ||||||||
|
| |||||||||
Utilities — 0.0% | ||||||||||
Cia de Saneamento Basico do Estado de Sao Paulo ADR (d) | 700 | 3,794 | ||||||||
Cia Energetica de Minas Gerais ADR (d) | 31,300 | 128,017 | ||||||||
|
| |||||||||
| 131,811 | ||||||||||
|
| |||||||||
Total Brazil | 533,798 | |||||||||
|
| |||||||||
Canada — 0.4% | ||||||||||
Asset Management — 0.1% | ||||||||||
Fairfax India Holdings Corp. (b) | 68,600 | 788,900 | ||||||||
|
| |||||||||
See Notes to Consolidated Financial Statements.
114
Blackstone Alternative Multi-Strategy Fund and Subsidiaries
Consolidated Schedule of Investments (Continued)
March 31, 2015
Security Description | Shares | Value | ||||||||
Banking — 0.2% | ||||||||||
Bank of Nova Scotia | 14,000 | $ | 702,349 | |||||||
Canadian Imperial Bank of Commerce | 9,600 | 695,963 | ||||||||
National Bank of Canada | 19,200 | 700,965 | ||||||||
|
| |||||||||
| 2,099,277 | ||||||||||
|
| |||||||||
Biotechnology & Pharmaceuticals — 0.0% | ||||||||||
QLT, Inc. (b) | 5,800 | 22,678 | ||||||||
|
| |||||||||
Consumer Products — 0.0% | ||||||||||
Cott Corp. (d),(a) | 10,700 | 100,259 | ||||||||
|
| |||||||||
Gaming, Lodging & Restaurants — 0.0% | ||||||||||
Restaurant Brands International | 21 | 807 | ||||||||
|
| |||||||||
Media — 0.0% | ||||||||||
Points International Ltd. (b) | 100 | 1,013 | ||||||||
|
| |||||||||
Metals & Mining — 0.0% | ||||||||||
Dominion Diamond Corp. (b),(a) | 8,900 | 152,101 | ||||||||
Fortuna Silver Mines, Inc. (b) | 500 | 1,920 | ||||||||
IAMGOLD Corp. (b) | 900 | 1,683 | ||||||||
Kinross Gold Corp. (b),(a) | 82,400 | 184,576 | ||||||||
MFC Industrial Ltd. (d) | 400 | 1,624 | ||||||||
Nevsun Resources Ltd. (d) | 7,300 | 24,747 | ||||||||
Silvercorp Metals, Inc. (d) | 100 | 118 | ||||||||
Taseko Mines Ltd. (b) | 600 | 384 | ||||||||
Yamana Gold, Inc. (d) | 1,600 | 5,744 | ||||||||
|
| |||||||||
| 372,897 | ||||||||||
|
| |||||||||
Oil, Gas & Coal — 0.0% | ||||||||||
Advantage Oil & Gas Ltd. (b),(a) | 5,800 | 31,088 | ||||||||
Gran Tierra Energy, Inc. (b),(a) | 29,000 | 79,170 | ||||||||
TransGlobe Energy Corp. (d),(a) | 2,700 | 9,558 | ||||||||
|
| |||||||||
| 119,816 | ||||||||||
|
| |||||||||
Passenger Transportation — 0.0% | ||||||||||
Student Transportation, Inc. (d) | 1,600 | 8,640 | ||||||||
|
| |||||||||
Renewable Energy — 0.1% | ||||||||||
Canadian Solar, Inc. (b),(a),(c) | 26,176 | 874,017 | ||||||||
|
| |||||||||
Waste & Environmental Service Equipment & Facility — 0.0% |
| |||||||||
Progressive Waste Solutions Ltd. (d),(a) | 6,000 | 176,280 | ||||||||
|
| |||||||||
Total Canada | 4,564,584 | |||||||||
|
| |||||||||
See Notes to Consolidated Financial Statements.
115
Blackstone Alternative Multi-Strategy Fund and Subsidiaries
Consolidated Schedule of Investments (Continued)
March 31, 2015
Security Description | Shares | Value | ||||||||
Chile — 0.0% | ||||||||||
Real Estate — 0.0% | ||||||||||
Parque Arauco SA (d) | 49,201 | $ | 94,360 | |||||||
|
| |||||||||
Total Chile | 94,360 | |||||||||
|
| |||||||||
China — 0.5% | ||||||||||
Automotive — 0.0% | ||||||||||
China Automotive Systems, Inc. (d) | 1,900 | 13,832 | ||||||||
|
| |||||||||
Biotechnology & Pharmaceuticals — 0.0% | ||||||||||
Sinovac Biotech Ltd. (b) | 500 | 2,480 | ||||||||
|
| |||||||||
Consumer Services — 0.1% | ||||||||||
New Oriental Education & Technology Group, Inc. ADR (b) | 39,900 | 884,583 | ||||||||
|
| |||||||||
Health Care Facilities/Services — 0.0% | ||||||||||
WuXi PharmaTech Cayman, Inc. ADR (b) | 7,300 | 283,094 | ||||||||
|
| |||||||||
Institutional Financial Service — 0.0% | ||||||||||
GF Securities Co. Ltd. | 11,800 | 28,691 | ||||||||
|
| |||||||||
Insurance — 0.0% | ||||||||||
CNinsure, Inc. ADR (b) | 4,000 | 34,520 | ||||||||
|
| |||||||||
Machinery — 0.0% | ||||||||||
Hollysys Automation Technologies Ltd. (d) | 4,600 | 91,402 | ||||||||
|
| |||||||||
Media — 0.2% | ||||||||||
51job, Inc. ADR (b) | 100 | 3,227 | ||||||||
Autohome, Inc. ADR (b) | 1,000 | 43,970 | ||||||||
Ctrip.com International Ltd. ADR (b) | 1,200 | 70,344 | ||||||||
Qihoo 360 Technology Co. Ltd. ADR (b) | 26,742 | 1,369,190 | ||||||||
Sohu.com, Inc. (b) | 5,900 | 314,647 | ||||||||
Zhaopin Ltd. ADR (b) | 840 | 13,230 | ||||||||
|
| |||||||||
| 1,814,608 | ||||||||||
|
| |||||||||
Medical Equipment/Devices — 0.0% | ||||||||||
Mindray Medical International Ltd. ADR (d) | 9,900 | 270,765 | ||||||||
|
| |||||||||
Passenger Transportation — 0.0% | ||||||||||
China Southern Airlines Co. Ltd. ADR (d) | 1,300 | 46,852 | ||||||||
Guangshen Railway Co. Ltd. ADR (d) | 200 | 4,624 | ||||||||
|
| |||||||||
| 51,476 | ||||||||||
|
| |||||||||
Real Estate — 0.0% | ||||||||||
E-House China Holdings Ltd. ADR (d) | 2,300 | 12,489 | ||||||||
Nam Tai Property, Inc. (d) | 300 | 1,191 | ||||||||
See Notes to Consolidated Financial Statements.
116
Blackstone Alternative Multi-Strategy Fund and Subsidiaries
Consolidated Schedule of Investments (Continued)
March 31, 2015
Security Description | Shares | Value | ||||||||
Xinyuan Real Estate Co. Ltd. ADR (d) | 2,600 | $ | 7,748 | |||||||
|
| |||||||||
| 21,428 | ||||||||||
|
| |||||||||
Renewable Energy — 0.0% | ||||||||||
JA Solar Holdings Co. Ltd. ADR (b) | 1,200 | 11,472 | ||||||||
Trina Solar Ltd. ADR (b) | 7,000 | 84,630 | ||||||||
|
| |||||||||
| 96,102 | ||||||||||
|
| |||||||||
Retail Discretionary — 0.2% | ||||||||||
Alibaba Group Holding Ltd. ADR (b) | 899 | 74,833 | ||||||||
Vipshop Holdings Ltd. ADR (b) | 70,641 | 2,079,671 | ||||||||
|
| |||||||||
| 2,154,504 | ||||||||||
|
| |||||||||
Software — 0.0% | ||||||||||
Changyou.com Ltd. ADR (b) | 400 | 10,356 | ||||||||
Perfect World Co. Ltd. ADR (d) | 10,500 | 195,090 | ||||||||
|
| |||||||||
| 205,446 | ||||||||||
|
| |||||||||
Total China | 5,952,931 | |||||||||
|
| |||||||||
Czech Republic — 0.0% | ||||||||||
Media — 0.0% | ||||||||||
Central European Media Enterprises Ltd. A Shares (b) | 1,700 | 4,522 | ||||||||
|
| |||||||||
Total Czech Republic | 4,522 | |||||||||
|
| |||||||||
Denmark — 0.0% | ||||||||||
Commercial Services — 0.0% | ||||||||||
ISS A/S (b) | 8,047 | 253,640 | ||||||||
|
| |||||||||
Total Denmark | 253,640 | |||||||||
|
| |||||||||
France — 0.2% | ||||||||||
Banking — 0.2% | ||||||||||
BNP Paribas SA (d) | 15,267 | 928,936 | ||||||||
Credit Agricole SA (d) | 54,099 | 794,982 | ||||||||
Societe Generale SA (d) | 13,981 | 675,031 | ||||||||
|
| |||||||||
Total France | 2,398,949 | |||||||||
|
| |||||||||
Germany — 0.7% | ||||||||||
Automotive — 0.0% | ||||||||||
Volkswagen AG (d) | 314 | 80,736 | ||||||||
|
| |||||||||
Biotechnology & Pharmaceuticals — 0.0% | ||||||||||
Bayer AG (d) | 263 | 39,349 | ||||||||
|
| |||||||||
Health Care Facilities/Services — 0.6% | ||||||||||
Fresenius SE & Co. KGaA (d) | 123,951 | 7,389,525 | ||||||||
|
| |||||||||
See Notes to Consolidated Financial Statements.
117
Blackstone Alternative Multi-Strategy Fund and Subsidiaries
Consolidated Schedule of Investments (Continued)
March 31, 2015
Security Description | Shares | Value | ||||||||
Real Estate — 0.1% | ||||||||||
Deutsche Annington Immobilien SE (d) | 19,099 | $ | 643,591 | |||||||
Deutsche Wohnen AG (d) | 2,807 | 71,794 | ||||||||
LEG Immobilien AG (d) | 2,544 | 201,803 | ||||||||
|
| |||||||||
| 917,188 | ||||||||||
|
| |||||||||
Total Germany | 8,426,798 | |||||||||
|
| |||||||||
Greece — 0.1% | ||||||||||
Banking — 0.1% | ||||||||||
Eurobank Ergasias SA (b) | 3,008,343 | 339,468 | ||||||||
Piraeus Bank SA (b) | 608,024 | 234,668 | ||||||||
|
| |||||||||
| 574,136 | ||||||||||
|
| |||||||||
Real Estate — 0.0% | ||||||||||
Grivalia Properties REIC (d) | 58,803 | 479,896 | ||||||||
|
| |||||||||
Transportation & Logistics — 0.0% | ||||||||||
Aegean Marine Petroleum Network, Inc. (d) | 1,800 | 25,866 | ||||||||
Costamare, Inc. (d) | 4,400 | 77,484 | ||||||||
Safe Bulkers, Inc. (d) | 2,200 | 7,898 | ||||||||
StealthGas, Inc. (b) | 1,500 | 9,825 | ||||||||
|
| |||||||||
| 121,073 | ||||||||||
|
| |||||||||
Total Greece | 1,175,105 | |||||||||
|
| |||||||||
Hong Kong — 0.1% | ||||||||||
Insurance — 0.1% | ||||||||||
AIA Group Ltd. (d) | 116,000 | 727,558 | ||||||||
|
| |||||||||
Total Hong Kong | 727,558 | |||||||||
|
| |||||||||
India — 0.0% | ||||||||||
Banking — 0.0% | ||||||||||
HDFC Bank Ltd. ADR (d) | 506 | 29,798 | ||||||||
|
| |||||||||
Technology Services ��� 0.0% | ||||||||||
WNS Holdings Ltd. ADR (b) | 1,200 | 29,184 | ||||||||
|
| |||||||||
Total India | 58,982 | |||||||||
|
| |||||||||
Ireland — 0.2% | ||||||||||
Biotechnology & Pharmaceuticals — 0.2% | ||||||||||
Shire PLC | 145 | 11,560 | ||||||||
Shire PLC ADR (d) | 6,826 | 1,633,393 | ||||||||
|
| |||||||||
| 1,644,953 | ||||||||||
|
| |||||||||
Medical Equipment/Devices — 0.0% | ||||||||||
Trinity Biotech PLC ADR (d) | 600 | 11,550 | ||||||||
|
| |||||||||
See Notes to Consolidated Financial Statements.
118
Blackstone Alternative Multi-Strategy Fund and Subsidiaries
Consolidated Schedule of Investments (Continued)
March 31, 2015
Security Description | Shares | Value | ||||||||
Software — 0.0% | ||||||||||
King Digital Entertainment PLC (d) | 16,300 | $ | 261,452 | |||||||
|
| |||||||||
Specialty Finance — 0.0% | ||||||||||
Fly Leasing Ltd. ADR (d) | 400 | 5,824 | ||||||||
|
| |||||||||
Total Ireland | 1,923,779 | |||||||||
|
| |||||||||
Israel — 0.8% | ||||||||||
Banking — 0.1% | ||||||||||
Israel Discount Bank Ltd. A Shares (b) | 413,218 | 697,664 | ||||||||
|
| |||||||||
Biotechnology & Pharmaceuticals — 0.7% | ||||||||||
Teva Pharmaceutical Industries Ltd. ADR (d) | 133,910 | 8,342,593 | ||||||||
|
| |||||||||
Electrical Equipment — 0.0% | ||||||||||
Orbotech Ltd. (b) | 5,700 | 91,371 | ||||||||
|
| |||||||||
Hardware — 0.0% | ||||||||||
Ceragon Networks Ltd. (b) | 300 | 342 | ||||||||
Radware Ltd. (b) | 2,000 | 41,820 | ||||||||
|
| |||||||||
| 42,162 | ||||||||||
|
| |||||||||
Medical Equipment/Devices — 0.0% | ||||||||||
Lumenis Ltd. (b) | 700 | 8,379 | ||||||||
Syneron Medical Ltd. (b) | 7,500 | 92,850 | ||||||||
|
| |||||||||
| 101,229 | ||||||||||
|
| |||||||||
Semiconductors — 0.0% | ||||||||||
Nova Measuring Instruments Ltd. (b) | 1,600 | 18,432 | ||||||||
Tower Semiconductor Ltd. (b) | 4,000 | 67,920 | ||||||||
|
| |||||||||
| 86,352 | ||||||||||
|
| |||||||||
Software — 0.0% | ||||||||||
Check Point Software Technologies Ltd. (b) | 3,700 | 303,289 | ||||||||
Sapiens International Corp. NV (b) | 100 | 820 | ||||||||
|
| |||||||||
| 304,109 | ||||||||||
|
| |||||||||
Technology Services — 0.0% | ||||||||||
ClickSoftware Technologies Ltd. (b) | 2,900 | 25,491 | ||||||||
Magic Software Enterprises Ltd. (d) | 600 | 3,888 | ||||||||
|
| |||||||||
| 29,379 | ||||||||||
|
| |||||||||
Telecommunications — 0.0% | ||||||||||
Allot Communications Ltd. (b) | 400 | 3,516 | ||||||||
|
| |||||||||
Total Israel | 9,698,375 | |||||||||
|
| |||||||||
See Notes to Consolidated Financial Statements.
119
Blackstone Alternative Multi-Strategy Fund and Subsidiaries
Consolidated Schedule of Investments (Continued)
March 31, 2015
Security Description | Shares | Value | ||||||||
Italy — 0.4% | ||||||||||
Asset Management — 0.1% | ||||||||||
Anima Holding SpA (b) | 152,843 | $ | 1,130,037 | |||||||
|
| |||||||||
Banking — 0.3% | ||||||||||
Banca Generali SpA (d) | 18,963 | 594,595 | ||||||||
Banca Popolare di Milano Scarl (b),(d) | 1,234,822 | 1,245,986 | ||||||||
Banco Popolare (b),(d) | 81,667 | 1,271,322 | ||||||||
FinecoBank SpA (b) | 123,974 | 854,823 | ||||||||
|
| |||||||||
| 3,966,726 | ||||||||||
|
| |||||||||
Home & Office Products — 0.0% | ||||||||||
De’ Longhi SpA (d) | 3,863 | 83,614 | ||||||||
|
| |||||||||
Technology Services — 0.0% | ||||||||||
Cerved Information Solutions SpA (b) | 21,921 | 145,839 | ||||||||
|
| |||||||||
Total Italy | 5,326,216 | |||||||||
|
| |||||||||
Japan — 2.2% | ||||||||||
Automotive — 0.4% | ||||||||||
Aisin Seiki Co. Ltd. (d) | 500 | 18,127 | ||||||||
Honda Motor Co. Ltd. (d) | 583 | 19,031 | ||||||||
Toyota Motor Corp. (d) | 67,319 | 4,699,117 | ||||||||
|
| |||||||||
| 4,736,275 | ||||||||||
|
| |||||||||
Banking — 0.3% | ||||||||||
Mitsubishi UFJ Financial Group, Inc. (d) | 558,137 | 3,456,772 | ||||||||
Mizuho Financial Group, Inc. (d) | 10,947 | 19,239 | ||||||||
Shinsei Bank Ltd. (d) | 373,000 | 741,650 | ||||||||
Sumitomo Mitsui Financial Group, Inc. (d) | 471 | 18,042 | ||||||||
|
| |||||||||
| 4,235,703 | ||||||||||
|
| |||||||||
Distributors—Consumer Staples — 0.3% | ||||||||||
Mitsubishi Corp. (d) | 174,300 | 3,502,355 | ||||||||
|
| |||||||||
Electrical Equipment — 0.5% | ||||||||||
Daikin Industries Ltd. (d) | 33,100 | 2,212,868 | ||||||||
Mitsubishi Electric Corp. | 42,000 | 498,602 | ||||||||
Mitsubishi Heavy Industries Ltd. (d) | 459,000 | 2,525,543 | ||||||||
SMC Corp. | 3,200 | 952,845 | ||||||||
|
| |||||||||
| 6,189,858 | ||||||||||
|
| |||||||||
Institutional Financial Service — 0.0% | ||||||||||
Daiwa Securities Group, Inc. (d) | 2,300 | 18,105 | ||||||||
|
| |||||||||
Insurance — 0.1% | ||||||||||
Tokio Marine Holdings, Inc. (d) | 22,900 | 864,402 | ||||||||
|
| |||||||||
See Notes to Consolidated Financial Statements.
120
Blackstone Alternative Multi-Strategy Fund and Subsidiaries
Consolidated Schedule of Investments (Continued)
March 31, 2015
Security Description | Shares | Value | ||||||||
Machinery — 0.3% | ||||||||||
Kubota Corp. (d) | 200,486 | $ | 3,167,460 | |||||||
|
| |||||||||
Passenger Transportation — 0.0% | ||||||||||
Japan Airlines Co. Ltd. (d) | 800 | 24,886 | ||||||||
|
| |||||||||
Real Estate — 0.3% | ||||||||||
Mitsubishi Estate Co. Ltd. (d) | 82,000 | 1,901,739 | ||||||||
Mitsui Fudosan Co. Ltd. (d) | 36,000 | 1,057,248 | ||||||||
Sumitomo Realty & Development Co. Ltd. (d) | 33,000 | 1,188,045 | ||||||||
|
| |||||||||
| 4,147,032 | ||||||||||
|
| |||||||||
Specialty Finance — 0.0% | ||||||||||
Orix Corp. ADR (d) | 300 | 21,102 | ||||||||
|
| |||||||||
Total Japan | 26,907,178 | |||||||||
|
| |||||||||
Mexico — 0.0% | ||||||||||
Engineering & Construction Services — 0.0% | ||||||||||
OHL Mexico SAB de CV (b) | 90,937 | 172,949 | ||||||||
|
| |||||||||
Gaming, Lodging & Restaurants — 0.0% | ||||||||||
Hoteles City Express SAB de CV (b) | 24,882 | 38,024 | ||||||||
|
| |||||||||
Real Estate — 0.0% | ||||||||||
Corp. Inmobiliaria Vesta SAB de CV (d) | 36,906 | 68,593 | ||||||||
Mexico Real Estate Management SA de CV (d) | 14,129 | 22,166 | ||||||||
Prologis Property Mexico SA de CV (d) | 44,842 | 80,256 | ||||||||
|
| |||||||||
| 171,015 | ||||||||||
|
| |||||||||
Specialty Finance — 0.0% | ||||||||||
Concentradora Hipotecaria SAPI de CV (d) | 58,395 | 98,579 | ||||||||
|
| |||||||||
Total Mexico | 480,567 | |||||||||
|
| |||||||||
Netherlands — 0.5% | ||||||||||
Banking — 0.1% | ||||||||||
ING Groep NV CVA (b) | 106,659 | 1,562,339 | ||||||||
|
| |||||||||
Insurance — 0.1% | ||||||||||
Delta Lloyd NV (d) | 62,990 | 1,187,985 | ||||||||
|
| |||||||||
Metals & Mining — 0.0% | ||||||||||
Constellium NV Class A (b) | 3,600 | 73,152 | ||||||||
|
| |||||||||
Oil, Gas & Coal — 0.0% | ||||||||||
Royal Dutch Shell PLC ADR (d) | 2,700 | 161,055 | ||||||||
|
| |||||||||
Semiconductors — 0.1% | ||||||||||
NXP Semiconductor NV (b),(d) | 5,687 | 570,747 | ||||||||
|
| |||||||||
See Notes to Consolidated Financial Statements.
121
Blackstone Alternative Multi-Strategy Fund and Subsidiaries
Consolidated Schedule of Investments (Continued)
March 31, 2015
Security Description | Shares | Value | ||||||||
Specialty Finance — 0.2% | ||||||||||
AerCap Holdings NV (b) | 64,393 | $ | 2,810,754 | |||||||
|
| |||||||||
Total Netherlands | 6,366,032 | |||||||||
|
| |||||||||
Norway — 0.0% | ||||||||||
Oil, Gas & Coal — 0.0% | ||||||||||
North Atlantic Drilling Ltd. (d) | 500 | 580 | ||||||||
Statoil ASA ADR (d) | 200 | 3,518 | ||||||||
|
| |||||||||
Total Norway | 4,098 | |||||||||
|
| |||||||||
Poland — 0.1% | ||||||||||
Banking — 0.1% | ||||||||||
Alior Bank SA (b) | 34,183 | 750,052 | ||||||||
|
| |||||||||
Total Poland | 750,052 | |||||||||
|
| |||||||||
Puerto Rico — 0.1% | ||||||||||
Banking — 0.1% | ||||||||||
First BanCorp (b) | 3,000 | 18,600 | ||||||||
Popular, Inc. (b) | 16,800 | 577,752 | ||||||||
|
| |||||||||
| 596,352 | ||||||||||
|
| |||||||||
Health Care Facilities/Services — 0.0% | ||||||||||
Triple-S Management Corp. B Shares (b) | 3,400 | 67,592 | ||||||||
|
| |||||||||
Total Puerto Rico | 663,944 | |||||||||
|
| |||||||||
Republic of Korea — 0.0% | ||||||||||
Automotive — 0.0% | ||||||||||
Hyundai Motor Co. (d) | 583 | 88,290 | ||||||||
|
| |||||||||
Hardware — 0.0% | ||||||||||
LG Display Co. Ltd. ADR | 800 | 11,448 | ||||||||
Samsung Electronics Co. Ltd. (d) | 102 | 132,269 | ||||||||
|
| |||||||||
| 143,717 | ||||||||||
|
| |||||||||
Semiconductors — 0.0% | ||||||||||
Magnachip Semiconductor Corp. (b) | 600 | 3,282 | ||||||||
|
| |||||||||
Telecommunications — 0.0% | ||||||||||
KT Corp. ADR | 5,300 | 69,324 | ||||||||
|
| |||||||||
Total Republic of Korea | 304,613 | |||||||||
|
| |||||||||
Russian Federation — 0.0% | ||||||||||
Media — 0.0% | ||||||||||
Yandex NV A Shares (b) | 3,500 | 53,078 | ||||||||
|
| |||||||||
Total Russian Federation | 53,078 | |||||||||
|
| |||||||||
See Notes to Consolidated Financial Statements.
122
Blackstone Alternative Multi-Strategy Fund and Subsidiaries
Consolidated Schedule of Investments (Continued)
March 31, 2015
Security Description | Shares | Value | ||||||||
Singapore — 0.0% | ||||||||||
Real Estate — 0.0% | ||||||||||
Ascendas Real Estate Investment Trust (d) | 4,491 | $ | 8,471 | |||||||
CapitaCommercial Trust (d) | 18,800 | 24,200 | ||||||||
CapitaMall Trust (d) | 3,000 | 4,803 | ||||||||
Mapletree Logistics Trust (d) | 9,857 | 8,942 | ||||||||
Suntec Real Estate Investment Trust (d) | 4,000 | 5,402 | ||||||||
|
| |||||||||
| 51,818 | ||||||||||
|
| |||||||||
Semiconductors — 0.0% | ||||||||||
Kulicke & Soffa Industries, Inc. (b) | 13,700 | 214,131 | ||||||||
|
| |||||||||
Total Singapore | 265,949 | |||||||||
|
| |||||||||
South Africa — 0.0% | ||||||||||
Metals & Mining — 0.0% | ||||||||||
Gold Fields Ltd. ADR (d) | 6,400 | 25,664 | ||||||||
Harmony Gold Mining Co. Ltd. ADR | 6,800 | 11,832 | ||||||||
|
| |||||||||
| 37,496 | ||||||||||
|
| |||||||||
Oil, Gas & Coal — 0.0% | ||||||||||
Sasol Ltd. ADR (d) | 500 | 17,020 | ||||||||
|
| |||||||||
Specialty Finance — 0.0% | ||||||||||
Net 1 UEPS Technologies, Inc. (b) | 8,300 | 113,544 | ||||||||
|
| |||||||||
Total South Africa | 168,060 | |||||||||
|
| |||||||||
Spain — 0.0% | ||||||||||
Banking — 0.0% | ||||||||||
Banco Santander SA ADR (d) | 32 | 238 | ||||||||
|
| |||||||||
Biotechnology & Pharmaceuticals — 0.0% | ||||||||||
Grifols SA ADR (d) | 3,300 | 108,273 | ||||||||
|
| |||||||||
Total Spain | 108,511 | |||||||||
|
| |||||||||
Sweden — 0.0% | ||||||||||
Media — 0.0% | ||||||||||
Com Hem Holding AB (b) | 11,144 | 90,579 | ||||||||
|
| |||||||||
Total Sweden | 90,579 | |||||||||
|
| |||||||||
Switzerland — 0.9% | ||||||||||
Asset Management — 0.7% | ||||||||||
Julius Baer Group Ltd. (d) | 19,246 | 961,988 | ||||||||
UBS Group AG (d) | 354,848 | 6,653,790 | ||||||||
|
| |||||||||
| 7,615,778 | ||||||||||
|
| |||||||||
See Notes to Consolidated Financial Statements.
123
Blackstone Alternative Multi-Strategy Fund and Subsidiaries
Consolidated Schedule of Investments (Continued)
March 31, 2015
Security Description | Shares | Value | ||||||||
Biotechnology & Pharmaceuticals — 0.0% | ||||||||||
Roche Holding AG (d) | 522 | $ | 143,441 | |||||||
|
| |||||||||
Institutional Financial Service — 0.2% | ||||||||||
Credit Suisse Group AG (d) | 75,837 | 2,040,313 | ||||||||
|
| |||||||||
Retail Discretionary — 0.0% | ||||||||||
Dufry AG (b) | 799 | 118,129 | ||||||||
|
| |||||||||
Specialty Finance — 0.0% | ||||||||||
Cembra Money Bank AG (d) | 2,769 | 169,389 | ||||||||
|
| |||||||||
Transportation & Logistics — 0.0% | ||||||||||
Flughafen Zuerich AG (d) | 199 | 156,572 | ||||||||
|
| |||||||||
Total Switzerland | 10,243,622 | |||||||||
|
| |||||||||
Taiwan — 0.0% | ||||||||||
Semiconductors — 0.0% | ||||||||||
Advanced Semiconductor Engineering, Inc. ADR | 1,100 | 7,920 | ||||||||
ChipMOS Technologies Bermuda Ltd. (d) | 4,400 | 108,504 | ||||||||
Himax Technologies, Inc. ADR (d) | 100 | 633 | ||||||||
Silicon Motion Technology Corp. ADR (d) | 2,700 | 72,576 | ||||||||
|
| |||||||||
Total Taiwan | 189,633 | |||||||||
|
| |||||||||
Thailand — 0.0% | ||||||||||
Design Manufacturing & Distribution — 0.0% | ||||||||||
Fabrinet (b) | 100 | 1,899 | ||||||||
|
| |||||||||
Total Thailand | 1,899 | |||||||||
|
| |||||||||
United Kingdom — 1.4% | ||||||||||
Automotive — 0.0% | ||||||||||
Delphi Automotive PLC (d) | 3,379 | 269,441 | ||||||||
|
| |||||||||
Banking — 0.1% | ||||||||||
HSBC Holdings PLC | 112,400 | 957,807 | ||||||||
|
| |||||||||
Biotechnology & Pharmaceuticals — 0.0% | ||||||||||
GlaxoSmithKline PLC ADR | 2,000 | 92,300 | ||||||||
|
| |||||||||
Commercial Services — 0.0% | ||||||||||
SSP Group PLC (b) | 22,435 | 98,842 | ||||||||
|
| |||||||||
Consumer Products — 0.0% | ||||||||||
British American Tobacco PLC ADR | 200 | 20,754 | ||||||||
|
| |||||||||
Gaming, Lodging & Restaurants — 0.0% | ||||||||||
InterContinental Hotels Group PLC ADR (d) | 4,700 | 184,052 | ||||||||
|
| |||||||||
See Notes to Consolidated Financial Statements.
124
Blackstone Alternative Multi-Strategy Fund and Subsidiaries
Consolidated Schedule of Investments (Continued)
March 31, 2015
Security Description | Shares | Value | ||||||||
Insurance — 0.1% | ||||||||||
Aviva PLC ADR | 118,442 | $ | 948,763 | |||||||
Aviva PLC ADR (d) | 3,400 | 54,978 | ||||||||
Prudential PLC ADR (d) | 37 | 1,846 | ||||||||
|
| |||||||||
| 1,005,587 | ||||||||||
|
| |||||||||
Media — 1.0% | ||||||||||
Liberty Global PLC (b),(c) | 197,738 | 9,849,330 | ||||||||
Liberty Global PLC A Shares (b) | 34,800 | 1,791,156 | ||||||||
|
| |||||||||
| 11,640,486 | ||||||||||
|
| |||||||||
Medical Equipment/Devices — 0.0% | ||||||||||
Smith & Nephew PLC ADR (d) | 10,500 | 358,785 | ||||||||
|
| |||||||||
Oil, Gas & Coal — 0.0% | ||||||||||
BP PLC ADR | 200 | 7,822 | ||||||||
|
| |||||||||
Real Estate — 0.1% | ||||||||||
Kennedy Wilson Europe Real Estate PLC (d) | 99,397 | 1,620,426 | ||||||||
|
| |||||||||
Recreation Facilities & Services — 0.0% | ||||||||||
Manchester United PLC Class A (b) | 1,400 | 22,274 | ||||||||
|
| |||||||||
Semiconductors — 0.0% | ||||||||||
ARM Holdings PLC ADR (d) | 8,449 | 416,536 | ||||||||
|
| |||||||||
Telecommunications — 0.1% | ||||||||||
BT Group PLC ADR (d) | 2,300 | 149,891 | ||||||||
Vodafone Group PLC ADR (d),(a) | 18,400 | 601,312 | ||||||||
|
| |||||||||
| 751,203 | ||||||||||
|
| |||||||||
Total United Kingdom | 17,446,315 | |||||||||
|
| |||||||||
United States — 34.0% | ||||||||||
Aerospace��& Defense — 0.5% | ||||||||||
Aerovironment, Inc. (b),(a) | 100 | 2,651 | ||||||||
Ducommun, Inc. (b) | 100 | 2,590 | ||||||||
Exelis, Inc. (d),(a) | 25,000 | 609,250 | ||||||||
GenCorp, Inc. (b) | 12,600 | 292,194 | ||||||||
General Dynamics Corp. (d) | 1,100 | 149,303 | ||||||||
Huntington Ingalls Industries, Inc. (d),(a) | 4,900 | 686,735 | ||||||||
L-3 Communications Holdings, Inc. (d),(a) | 13,800 | 1,735,902 | ||||||||
LMI Aerospace, Inc. (b) | 200 | 2,442 | ||||||||
Moog, Inc. Class A (b) | 100 | 7,505 | ||||||||
Orbital ATK, Inc. (d),(a) | 8 | 613 | ||||||||
Spirit AeroSystems Holdings, Inc. Class A (b),(a) | 4,900 | 255,829 | ||||||||
TransDigm Group, Inc. (d),(a) | 8,400 | 1,837,248 | ||||||||
|
| |||||||||
| 5,582,262 | ||||||||||
|
| |||||||||
See Notes to Consolidated Financial Statements.
125
Blackstone Alternative Multi-Strategy Fund and Subsidiaries
Consolidated Schedule of Investments (Continued)
March 31, 2015
Security Description | Shares | Value | ||||||||
Apparel & Textile Products — 0.2% | ||||||||||
Albany International Corp. Class A (d) | 600 | $ | 23,850 | |||||||
Carter’s, Inc. (a) | 4,400 | 406,868 | ||||||||
Culp, Inc. | 1,400 | 37,450 | ||||||||
Deckers Outdoor Corp. (b) | 500 | 36,435 | ||||||||
Michael Kors Holdings Ltd. (b) | 3,900 | 256,425 | ||||||||
Perry Ellis International, Inc. (b),(a) | 3,200 | 74,112 | ||||||||
Ralph Lauren Corp. (d),(a) | 12,100 | 1,591,150 | ||||||||
Vera Bradley, Inc. (b) | 100 | 1,623 | ||||||||
Vince Holding Corp. (b) | 1,300 | 24,115 | ||||||||
|
| |||||||||
| 2,452,028 | ||||||||||
|
| |||||||||
Asset Management — 1.0% | ||||||||||
American Capital Ltd. (b),(a) | 94,100 | 1,391,739 | ||||||||
Ares Capital Corp. (d),(a) | 35,000 | 600,950 | ||||||||
BlackRock Kelso Capital Corp. (d),(a) | 17,300 | 156,738 | ||||||||
Calamos Asset Management, Inc. Class A (d) | 500 | 6,725 | ||||||||
Carlyle Group LP (d),(a) | 4,733 | 128,264 | ||||||||
Charles Schwab Corp. (d) | 195,270 | 5,944,019 | ||||||||
E*TRADE Financial Corp. (b) | 8,100 | 231,296 | ||||||||
Fidus Investment Corp. (d) | 3,600 | 55,332 | ||||||||
Fifth Street Finance Corp. (d) | 10,200 | 74,460 | ||||||||
Firsthand Technology Value Fund, Inc. (d) | 1,000 | 14,340 | ||||||||
Franklin Resources, Inc. | 1,900 | 97,508 | ||||||||
Garrison Capital, Inc. (d),(a) | 2,500 | 37,250 | ||||||||
Gladstone Capital Corp. (d),(a) | 4,700 | 41,407 | ||||||||
Gladstone Investment Corp. (d) | 6,500 | 48,100 | ||||||||
Horizon Technology Finance Corp. (d) | 3,300 | 45,606 | ||||||||
Invesco Ltd. (d) | 18,100 | 718,389 | ||||||||
Janus Capital Group, Inc. (d) | 38,100 | 654,939 | ||||||||
KCAP Financial, Inc. (d) | 8,800 | 59,224 | ||||||||
Legg Mason, Inc. (d),(a) | 17,200 | 949,440 | ||||||||
Medallion Financial Corp. (d),(a) | 8,700 | 80,562 | ||||||||
MVC Capital, Inc. (d) | 2,300 | 21,804 | ||||||||
OHA Investment Corp. (d),(a) | 3,000 | 15,810 | ||||||||
Oppenheimer Holdings, Inc. Class A (d) | 200 | 4,692 | ||||||||
PennantPark Floating Rate Capital Ltd. (d) | 700 | 9,821 | ||||||||
PennantPark Investment Corp. (d),(a) | 24,000 | 217,200 | ||||||||
Solar Capital Ltd. (d) | 6,100 | 123,464 | ||||||||
Solar Senior Capital Ltd. (d) | 1,300 | 20,943 | ||||||||
Stellus Capital Investment Corp. (d) | 1,100 | 13,277 | ||||||||
THL Credit, Inc. (d) | 7,800 | 95,862 | ||||||||
TICC Capital Corp. (d),(a) | 20,100 | 139,092 | ||||||||
TPG Specialty Lending, Inc. (d) | 2,700 | 46,467 | ||||||||
TriplePoint Venture Growth BDC Corp. | 100 | 1,411 | ||||||||
See Notes to Consolidated Financial Statements.
126
Blackstone Alternative Multi-Strategy Fund and Subsidiaries
Consolidated Schedule of Investments (Continued)
March 31, 2015
Security Description | Shares | Value | ||||||||
WhiteHorse Finance, Inc. (d),(a) | 1,500 | $ | 18,630 | |||||||
|
| |||||||||
| 12,064,761 | ||||||||||
|
| |||||||||
Automotive — 0.2% | ||||||||||
Actuant Corp. Class A | 200 | 4,748 | ||||||||
American Axle & Manufacturing Holdings, Inc. (b) | 200 | 5,166 | ||||||||
Cooper Tire & Rubber Co. (d) | 500 | 21,420 | ||||||||
Fuel Systems Solutions, Inc. (b) | 1,000 | 11,040 | ||||||||
Goodyear Tire & Rubber Co. (d),(a) | 35,600 | 964,048 | ||||||||
Harley-Davidson, Inc. | 100 | 6,074 | ||||||||
Lear Corp. (d),(a) | 1,200 | 132,984 | ||||||||
Remy International, Inc. (d) | 795 | 17,657 | ||||||||
Tenneco, Inc. (b) | 400 | 22,968 | ||||||||
Tower International, Inc. (b),(a) | 3,300 | 87,780 | ||||||||
TriMas Corp. (b) | 800 | 24,632 | ||||||||
Visteon Corp. (b),(a) | 10,400 | 1,002,560 | ||||||||
|
| |||||||||
| 2,301,077 | ||||||||||
|
| |||||||||
Banking — 2.6% | ||||||||||
Arrow Financial Corp. (d),(a) | 302 | 8,199 | ||||||||
Astoria Financial Corp. (d) | 400 | 5,180 | ||||||||
Bancorp, Inc. (b) | 1,900 | 17,157 | ||||||||
BancorpSouth, Inc. (d) | 100 | 2,322 | ||||||||
Bank Mutual Corp. (d) | 2,700 | 19,764 | ||||||||
BankUnited, Inc. (d),(a) | 34,100 | 1,116,434 | ||||||||
Beneficial Bancorp, Inc. (b),(a) | 71,517 | 807,427 | ||||||||
Blue Hills Bancorp, Inc. (b) | 1,900 | 25,118 | ||||||||
BNC Bancorp (d) | 900 | 16,290 | ||||||||
Boston Private Financial Holdings, Inc. (d) | 2,400 | 29,160 | ||||||||
Brookline Bancorp, Inc. (d) | 400 | 4,020 | ||||||||
Centerstate Banks, Inc. (d) | 29 | 345 | ||||||||
Central Pacific Financial Corp. (d) | 1,600 | 36,752 | ||||||||
Charter Financial Corp. (d) | 1,200 | 13,800 | ||||||||
Chemical Financial Corp. (d),(a) | 2,400 | 75,264 | ||||||||
Citigroup, Inc. (d),(a) | 51,747 | 2,666,006 | ||||||||
Citizens Financial Group, Inc. (c),(d) | 292,124 | 7,048,952 | ||||||||
City Holding Co. (d) | 600 | 28,218 | ||||||||
Clifton Bancorp, Inc. (d) | 100 | 1,411 | ||||||||
Comerica, Inc. (d),(a) | 40,300 | 1,818,739 | ||||||||
Community Trust Bancorp, Inc. (d) | 100 | 3,316 | ||||||||
Customers Bancorp, Inc. (b) | 300 | 7,308 | ||||||||
CVB Financial Corp. | 200 | 3,188 | ||||||||
Dime Community Bancshares, Inc. (d) | 2,000 | 32,200 | ||||||||
EverBank Financial Corp. (d),(a) | 54,800 | 988,044 | ||||||||
Farmers Capital Bank Corp. (b) | 100 | 2,325 | ||||||||
Fidelity Southern Corp. (d) | 1,100 | 18,568 | ||||||||
See Notes to Consolidated Financial Statements.
127
Blackstone Alternative Multi-Strategy Fund and Subsidiaries
Consolidated Schedule of Investments (Continued)
March 31, 2015
Security Description | Shares | Value | ||||||||
Fifth Third Bancorp (d),(a) | 49,100 | $ | 925,535 | |||||||
Financial Institutions, Inc. (d) | 200 | 4,586 | ||||||||
First Busey Corp. (d) | 1,100 | 7,359 | ||||||||
First Citizens BancShares, Inc. Class A (d),(a) | 4,700 | 1,220,543 | ||||||||
First Community Bancshares, Inc. | 1,300 | 22,789 | ||||||||
First Financial Northwest, Inc. (d) | 200 | 2,470 | ||||||||
First Interstate BancSystem, Inc. Class A (d) | 2,800 | 77,896 | ||||||||
First Midwest Bancorp, Inc. (d) | 400 | 6,948 | ||||||||
First Republic Bank (d),(a) | 14,300 | 816,387 | ||||||||
HomeTrust Bancshares, Inc. (b) | 1,000 | 15,970 | ||||||||
Hudson City Bancorp, Inc. (d) | 6,400 | 67,072 | ||||||||
Hudson Valley Holding Corp. (d) | 1,400 | 35,784 | ||||||||
Independent Bank Corp. (d) | 1,400 | 17,962 | ||||||||
Independent Bank Group, Inc. (d) | 400 | 15,564 | ||||||||
Investors Bancorp, Inc. | 300 | 3,516 | ||||||||
KeyCorp (d) | 900 | 12,744 | ||||||||
Legacy Texas Financial Group (d) | 300 | 6,819 | ||||||||
Meridian Bancorp, Inc. (b),(a) | 5,600 | 73,752 | ||||||||
National Bank Holdings Corp. Class A (d) | 600 | 11,286 | ||||||||
National Bankshares, Inc. (d) | 200 | 5,968 | ||||||||
NewBridge Bancorp | 100 | 892 | ||||||||
Northwest Bancshares, Inc. (d) | 20,800 | 246,480 | ||||||||
Oritani Financial Corp. (d) | 2,400 | 34,920 | ||||||||
Pacific Premier Bancorp, Inc. (b) | 400 | 6,476 | ||||||||
Park Sterling Corp. (d) | 200 | 1,420 | ||||||||
Peoples Bancorp, Inc. | 100 | 2,364 | ||||||||
PNC Financial Services Group, Inc. (d),(a) | 27,700 | 2,582,748 | ||||||||
Preferred Bank (d) | 500 | 13,735 | ||||||||
PrivateBancorp, Inc. (d) | 100 | 3,517 | ||||||||
Regions Financial Corp. (d),(a) | 104,700 | 989,415 | ||||||||
Renasant Corp. (d) | 2,400 | 72,120 | ||||||||
S&T Bancorp, Inc. (d) | 300 | 8,514 | ||||||||
Southwest Bancorp, Inc. (d) | 2,100 | 37,359 | ||||||||
Square 1 Financial, Inc. (b) | 300 | 8,031 | ||||||||
State Bank Financial Corp. (d) | 1,500 | 31,500 | ||||||||
Sterling Bancorp (d) | 7,600 | 101,916 | ||||||||
Stock Yards Bancorp, Inc. (d) | 100 | 3,443 | ||||||||
Sun Bancorp, Inc. (b) | 20 | 378 | ||||||||
Susquehanna Bancshares, Inc. (d) | 1,700 | 23,307 | ||||||||
SVB Financial Group (b) | 600 | 76,224 | ||||||||
Talmer Bancorp, Inc. Class A (d),(a) | 43,900 | 672,329 | ||||||||
Towne Bank (d),(a) | 1,660 | 26,693 | ||||||||
Trico Bancshares (d) | 1,000 | 24,130 | ||||||||
TriState Capital Holdings, Inc. (b),(a) | 3,100 | 32,457 | ||||||||
TrustCo Bank Corp. (d) | 1,300 | 8,944 | ||||||||
United Community Financial Corp. (d) | 100 | 546 | ||||||||
See Notes to Consolidated Financial Statements.
128
Blackstone Alternative Multi-Strategy Fund and Subsidiaries
Consolidated Schedule of Investments (Continued)
March 31, 2015
Security Description | Shares | Value | ||||||||
Univest Corp. of Pennsylvania (d) | 600 | $ | 11,874 | |||||||
Wells Fargo & Co. (d) | 125,730 | 6,839,712 | ||||||||
WesBanco, Inc. (d) | 1,400 | 45,612 | ||||||||
Western Alliance Bancorp (b) | 3,400 | 100,776 | ||||||||
Wilshire Bancorp, Inc. (d) | 1,800 | 17,946 | ||||||||
Yadkin Financial Corp. (b) | 200 | 4,060 | ||||||||
Zions BanCorp. (d),(a) | 60,300 | 1,628,100 | ||||||||
|
| |||||||||
| 31,804,395 | ||||||||||
|
| |||||||||
Biotechnology & Pharmaceuticals — 6.0% | ||||||||||
AbbVie, Inc. (d) | 970 | 56,784 | ||||||||
Achillion Pharmaceuticals, Inc. (b),(c) | 17,510 | 172,649 | ||||||||
Acorda Therapeutics, Inc. (b) | 2,100 | 69,888 | ||||||||
Actavis PLC (b),(c) | 24,939 | 7,422,276 | ||||||||
Alexion Pharmaceuticals, Inc. (b),(a) | 4,500 | 779,850 | ||||||||
Alimera Sciences, Inc. (b) | 200 | 1,002 | ||||||||
Amgen, Inc. (d),(a) | 3,300 | 527,505 | ||||||||
Amphastar Pharmaceuticals, Inc. (b) | 200 | 2,992 | ||||||||
Anacor Pharmaceuticals, Inc. (b),(a) | 3,600 | 208,260 | ||||||||
ArQule, Inc. (b) | 1,700 | 3,808 | ||||||||
Array BioPharma, Inc. (b) | 5,900 | 43,483 | ||||||||
Biogen Idec, Inc. (d),(b),(a) | 14,125 | 5,964,140 | ||||||||
BioSpecifics Technologies Corp. (b) | 200 | 7,830 | ||||||||
Bristol-Myers Squibb Co. | 190 | 12,255 | ||||||||
Cambrex Corp. (b) | 7,000 | 277,410 | ||||||||
Celladon Corp. (b) | 1,400 | 26,516 | ||||||||
Cempra, Inc. (b) | 500 | 17,155 | ||||||||
Concert Pharmaceuticals, Inc. (b) | 300 | 4,544 | ||||||||
Curis, Inc. (b) | 200 | 480 | ||||||||
Depomed, Inc. (b),(a) | 15,500 | 347,355 | ||||||||
Dyax Corp. (b),(a) | 22,200 | 371,961 | ||||||||
Emergent Biosolutions, Inc. (b) | 1,000 | 28,760 | ||||||||
Endo International PLC (b) | 45,839 | 4,111,758 | ||||||||
Gilead Sciences, Inc. (d),(b),(c),(a) | 37,962 | 3,725,211 | ||||||||
Horizon Pharma PLC (b) | 2,800 | 72,716 | ||||||||
Hyperion Therapeutics, Inc. (b) | 200 | 9,180 | ||||||||
Incyte Corp. (b),(a) | 17,800 | 1,631,548 | ||||||||
Jazz Pharmaceuticals PLC (d),(b),(c) | 21,300 | 3,680,427 | ||||||||
Lannett Co., Inc. (b) | 300 | 20,313 | ||||||||
Mallinckrodt PLC (d),(b),(c) | 108,929 | 13,795,858 | ||||||||
Medicines Co. (b) | 100 | 2,802 | ||||||||
Medivation, Inc. (d),(b),(c),(a) | 39,500 | 5,098,265 | ||||||||
Merck & Co., Inc. (d),(a) | 102,300 | 5,880,204 | ||||||||
Merrimack Pharmaceuticals, Inc. (b),(a) | 19,800 | 235,224 | ||||||||
Momenta Pharmaceuticals, Inc. (b) | 2,300 | 34,960 | ||||||||
Mylan NV (d),(b),(c) | 79,300 | 4,706,455 | ||||||||
See Notes to Consolidated Financial Statements.
129
Blackstone Alternative Multi-Strategy Fund and Subsidiaries
Consolidated Schedule of Investments (Continued)
March 31, 2015
Security Description | Shares | Value | ||||||||
Omega Protein Corp. (b) | 1,400 | $ | 19,166 | |||||||
Omeros Corp. (b) | 2,900 | 63,887 | ||||||||
PDL BioPharma, Inc. (d) | 20,900 | 147,032 | ||||||||
Pernix Therapeutics Holdings, Inc. (b) | 1,200 | 12,828 | ||||||||
Pfizer, Inc. (d),(a) | 84,684 | 2,946,156 | ||||||||
Pharmacyclics, Inc. (b) | 200 | 51,190 | ||||||||
Phibro Animal Health Corp. Class A (d),(a) | 6,100 | 216,001 | ||||||||
Portola Pharmaceuticals, Inc. (b) | 900 | 34,164 | ||||||||
Pozen, Inc. (b) | 500 | 3,860 | ||||||||
PTC Therapeutics, Inc. (b) | 245 | 14,908 | ||||||||
Puma Biotechnology, Inc. (b) | 100 | 23,611 | ||||||||
Receptos, Inc. (b) | 72 | 11,872 | ||||||||
Revance Therapeutics, Inc. (b) | 400 | 8,292 | ||||||||
Rigel Pharmaceuticals, Inc. (b),(a) | 5,200 | 18,564 | ||||||||
SciClone Pharmaceuticals, Inc. (b),(a) | 5,700 | 50,502 | ||||||||
Sorrento Therapeutics, Inc. (b) | 200 | 2,312 | ||||||||
Sucampo Pharmaceuticals, Inc. Class A (b) | 400 | 6,224 | ||||||||
Supernus Pharmaceuticals, Inc. (b) | 1,600 | 19,344 | ||||||||
TESARO, Inc. (b) | 1,900 | 109,060 | ||||||||
Trevena, Inc. (b) | 100 | 652 | ||||||||
Ultragenyx Pharmaceutical, Inc. (b) | 100 | 6,209 | ||||||||
USANA Health Sciences, Inc. (b) | 900 | 100,008 | ||||||||
Valeant Pharmaceuticals International, Inc. (b) | 26,552 | 5,273,758 | ||||||||
Vertex Pharmaceuticals, Inc. (d),(b),(a) | 31,200 | 3,680,664 | ||||||||
Vical, Inc. (b) | 300 | 283 | ||||||||
Xencor, Inc. (b) | 1,000 | 15,320 | ||||||||
XenoPort, Inc. (b) | 2,500 | 17,800 | ||||||||
Zoetis, Inc. (d),(a) | 9,000 | 416,610 | ||||||||
|
| |||||||||
| 72,622,101 | ||||||||||
|
| |||||||||
Chemicals — 0.3% | ||||||||||
Air Products & Chemicals, Inc. (d) | 142 | 21,482 | ||||||||
Albemarle Corp. (d),(a) | 25 | 1,321 | ||||||||
Ashland, Inc. | 100 | 12,731 | ||||||||
Axalta Coating Systems Ltd. (b) | 1,000 | 27,620 | ||||||||
Cabot Corp. (d) | 1,100 | 49,500 | ||||||||
Calgon Carbon Corp. | 5,100 | 107,457 | ||||||||
Cytec Industries, Inc. (d) | 6,396 | 345,640 | ||||||||
Dow Chemical Co. (a) | 9,900 | 475,002 | ||||||||
Ferro Corp. (b) | 200 | 2,510 | ||||||||
GrafTech International Ltd. (b) | 900 | 3,501 | ||||||||
Innophos Holdings, Inc. (d) | 600 | 33,816 | ||||||||
International Flavors & Fragrances, Inc. | 200 | 23,480 | ||||||||
Intrepid Potash, Inc. (b),(a) | 11,100 | 128,205 | ||||||||
KMG Chemicals, Inc. | 400 | 10,692 | ||||||||
Kraton Performance Polymers, Inc. (b) | 1,600 | 32,336 | ||||||||
See Notes to Consolidated Financial Statements.
130
Blackstone Alternative Multi-Strategy Fund and Subsidiaries
Consolidated Schedule of Investments (Continued)
March 31, 2015
Security Description | Shares | Value | ||||||||
Lydall, Inc. (b) | 200 | $ | 6,344 | |||||||
LyondellBasell Industries NV Class A (d) | 12,700 | 1,115,060 | ||||||||
Mosaic Co. (d),(a) | 9,200 | 423,752 | ||||||||
OM Group, Inc. (d),(a) | 2,600 | 78,078 | ||||||||
OMNOVA Solutions, Inc. (b) | 100 | 853 | ||||||||
Orion Engineered Carbons SA (d) | 800 | 14,400 | ||||||||
Rayonier Advanced Materials, Inc. (d) | 1,000 | 14,900 | ||||||||
RPM International, Inc. (d) | 300 | 14,397 | ||||||||
Stepan Co. (d) | 1,200 | 49,992 | ||||||||
Westlake Chemical Corp. (d),(a) | 5,200 | 374,088 | ||||||||
|
| |||||||||
| 3,367,157 | ||||||||||
|
| |||||||||
Commercial Services — 0.2% | ||||||||||
ADT Corp. (d) | 6,900 | 286,488 | ||||||||
AMN Healthcare Services, Inc. (b) | 2,100 | 48,447 | ||||||||
ARC Document Solutions, Inc. (b) | 2,400 | 22,152 | ||||||||
CBIZ, Inc. (b) | 4,200 | 39,186 | ||||||||
Collectors Universe, Inc. (d) | 800 | 18,048 | ||||||||
Computer Task Group, Inc. (d),(a) | 3,300 | 24,123 | ||||||||
Courier Corp. (d) | 100 | 2,448 | ||||||||
CRA International, Inc. (b),(a) | 1,700 | 52,904 | ||||||||
Ennis, Inc. (d) | 100 | 1,412 | ||||||||
GP Strategies Corp. (b) | 100 | 3,700 | ||||||||
Hackett Group, Inc. (d) | 200 | 1,788 | ||||||||
Heidrick & Struggles International, Inc. (d) | 200 | 4,916 | ||||||||
Insperity, Inc. (d),(a) | 11,200 | 585,648 | ||||||||
KAR Auction Services, Inc. (d) | 16,700 | 633,431 | ||||||||
Manpowergroup, Inc. (a) | 600 | 51,690 | ||||||||
Navigant Consulting, Inc. (b) | 10,100 | 130,896 | ||||||||
PRGX Global, Inc. (b) | 1,900 | 7,638 | ||||||||
Quad/Graphics, Inc. (d) | 5,200 | 119,496 | ||||||||
Resources Connection, Inc. (d) | 100 | 1,750 | ||||||||
RPX Corp. (b) | 6,600 | 94,974 | ||||||||
ServiceMaster Global Holdings, Inc. (b),(a) | 16,300 | 550,125 | ||||||||
TrueBlue, Inc. (b),(a) | 1,700 | 41,395 | ||||||||
Viad Corp. (d) | 200 | 5,564 | ||||||||
|
| |||||||||
| 2,728,219 | ||||||||||
|
| |||||||||
Construction Materials — 0.2% | ||||||||||
Carlisle Cos., Inc. (d) | 2,500 | 231,575 | ||||||||
Continental Building Products, Inc. (b),(a) | 7,100 | 160,389 | ||||||||
Headwaters, Inc. (b),(a) | 11,900 | 218,246 | ||||||||
Owens Corning (d) | 4,500 | 195,300 | ||||||||
Patrick Industries, Inc. (b) | 2,100 | 130,767 | ||||||||
Trex Co., Inc. (b) | 1,200 | 65,436 | ||||||||
US Concrete, Inc. (b) | 5,000 | 169,400 | ||||||||
See Notes to Consolidated Financial Statements.
131
Blackstone Alternative Multi-Strategy Fund and Subsidiaries
Consolidated Schedule of Investments (Continued)
March 31, 2015
Security Description | Shares | Value | ||||||||
Vulcan Materials Co. (d),(a) | 18,100 | $ | 1,525,830 | |||||||
|
| |||||||||
| 2,696,943 | ||||||||||
|
| |||||||||
Consumer Products — 0.6% | ||||||||||
Altria Group, Inc. | 1,000 | 50,020 | ||||||||
Avon Products, Inc. (d) | 600 | 4,794 | ||||||||
Boulder Brands, Inc. (b) | 100 | 953 | ||||||||
Cal-Maine Foods, Inc. | 200 | 7,812 | ||||||||
Central Garden and Pet Co. Class A (b) | 2,200 | 23,364 | ||||||||
Coca-Cola Enterprises, Inc. (d),(a) | 41,300 | 1,825,460 | ||||||||
Coty, Inc. Class A (d),(a) | 34,300 | 832,461 | ||||||||
Diamond Foods, Inc. (b) | 1,000 | 32,570 | ||||||||
Female Health Co. (d) | 200 | 566 | ||||||||
Herbalife Ltd. (d) | 100 | 4,276 | ||||||||
Inventure Foods, Inc. (b),(a) | 1,600 | 17,904 | ||||||||
John B Sanfilippo & Son, Inc. (d) | 1,500 | 64,650 | ||||||||
Kimberly-Clark Corp. | 600 | 64,266 | ||||||||
Mead Johnson Nutrition Co. (d) | 6,774 | 680,990 | ||||||||
Molson Coors Brewing Co. Class B (d) | 975 | 72,589 | ||||||||
Mondelez International, Inc. Class A (d),(a) | 7,665 | 276,630 | ||||||||
Nu Skin Enterprises, Inc. (c),(d) | 13,085 | 787,848 | ||||||||
PepsiCo, Inc. | 1,200 | 114,744 | ||||||||
Philip Morris International, Inc. (d),(a) | 23,000 | 1,732,590 | ||||||||
Pilgrim’s Pride Corp. (d),(a) | 16,100 | 363,699 | ||||||||
Pinnacle Foods, Inc. (d) | 4,000 | 163,240 | ||||||||
Revlon, Inc. Class A (b) | 100 | 4,120 | ||||||||
Spectrum Brands Holdings, Inc. (d) | 400 | 35,824 | ||||||||
Vector Group Ltd. (d) | 2,250 | 49,432 | ||||||||
|
| |||||||||
| 7,210,802 | ||||||||||
|
| |||||||||
Consumer Services — 0.0% | ||||||||||
Aaron’s, Inc. | 2,200 | 62,282 | ||||||||
American Public Education, Inc. (b),(a) | 3,300 | 98,934 | ||||||||
Bridgepoint Education, Inc. (b) | 2,000 | 19,300 | ||||||||
Career Education Corp. (b) | 1,400 | 7,042 | ||||||||
Carriage Services, Inc. | 1,200 | 28,644 | ||||||||
DeVry Education Group, Inc. | 2,200 | 73,392 | ||||||||
K12, Inc. (b) | 300 | 4,716 | ||||||||
Nutrisystem, Inc. (d) | 2,000 | 39,960 | ||||||||
Rent-A-Center, Inc. (d) | 300 | 8,232 | ||||||||
Universal Technical Institute, Inc. (d) | 3,200 | 30,720 | ||||||||
|
| |||||||||
| 373,222 | ||||||||||
|
| |||||||||
Containers & Packaging — 0.6% |
| |||||||||
Berry Plastics Group, Inc. (b),(a) | 50,400 | 1,823,976 | ||||||||
Crown Holdings, Inc. (b),(a) | 13,100 | 707,662 | ||||||||
See Notes to Consolidated Financial Statements.
132
Blackstone Alternative Multi-Strategy Fund and Subsidiaries
Consolidated Schedule of Investments (Continued)
March 31, 2015
Security Description | Shares | Value | ||||||||
Graphic Packaging Holding Co. (a) | 9,200 | $ | 133,768 | |||||||
MeadWestvaco Corp. (d),(a) | 35,700 | 1,780,359 | ||||||||
Owens-Illinois, Inc. (b),(a) | 19,700 | 459,404 | ||||||||
Rock-Tenn Co. Class A (d),(a) | 27,600 | 1,780,200 | ||||||||
Sealed Air Corp. (d),(a) | 8,000 | 364,480 | ||||||||
ZAGG, Inc. (b) | 1,600 | 13,872 | ||||||||
|
| |||||||||
| 7,063,721 | ||||||||||
|
| |||||||||
Design Manufacturing & Distribution — 0.1% |
| |||||||||
Benchmark Electronics, Inc. (b) | 3,000 | 72,090 | ||||||||
Flextronics International Ltd. (b) | 72,400 | 917,670 | ||||||||
Jabil Circuit, Inc. (d) | 400 | 9,352 | ||||||||
Plexus Corp. (b) | 1,100 | 44,847 | ||||||||
|
| |||||||||
| 1,043,959 | ||||||||||
|
| |||||||||
Distributors—Consumer Staples — 0.0% |
| |||||||||
Andersons, Inc. (d) | 2,800 | 115,836 | ||||||||
Sysco Corp. | 6,300 | 237,699 | ||||||||
|
| |||||||||
| 353,535 | ||||||||||
|
| |||||||||
Distributors—Discretionary — 0.0% |
| |||||||||
Bassett Furniture Industries, Inc. | 100 | 2,852 | ||||||||
ePlus, Inc. (b) | 500 | 43,465 | ||||||||
Insight Enterprises, Inc. (b) | 700 | 19,964 | ||||||||
ScanSource, Inc. (b) | 200 | 8,130 | ||||||||
|
| |||||||||
| 74,411 | ||||||||||
|
| |||||||||
Electrical Equipment — 0.8% |
| |||||||||
Acuity Brands, Inc. (d) | 2,600 | 437,216 | ||||||||
Allegion PLC (d) | 26,194 | 1,602,287 | ||||||||
Argan, Inc. (d) | 100 | 3,617 | ||||||||
Checkpoint Systems, Inc. | 4,600 | 49,772 | ||||||||
Eaton Corp. PLC (d) | 1,900 | 129,086 | ||||||||
Emerson Electric Co. (d),(a) | 31,400 | 1,777,868 | ||||||||
General Electric Co. (d) | 6,014 | 149,207 | ||||||||
Global Power Equipment Group, Inc. (d) | 100 | 1,320 | ||||||||
Houston Wire & Cable Co. (d) | 700 | 6,811 | ||||||||
Ingersoll-Rand PLC (d) | 69,467 | 4,729,314 | ||||||||
Itron, Inc. (b) | 700 | 25,557 | ||||||||
Keysight Technologies, Inc. (b) | 4,100 | 152,315 | ||||||||
OSI Systems, Inc. (b) | 200 | 14,852 | ||||||||
|
| |||||||||
| 9,079,222 | ||||||||||
|
| |||||||||
Engineering & Construction Services — 0.4% |
| |||||||||
AECOM Technology Corp. (b),(a) | 5,120 | 157,798 | ||||||||
Chicago Bridge & Iron Co. NV (d) | 1,300 | 64,038 | ||||||||
See Notes to Consolidated Financial Statements.
133
Blackstone Alternative Multi-Strategy Fund and Subsidiaries
Consolidated Schedule of Investments (Continued)
March 31, 2015
Security Description | Shares | Value | ||||||||
Comfort Systems USA, Inc. (d) | 3,600 | $ | 75,744 | |||||||
Dycom Industries, Inc. (b) | 1,900 | 92,796 | ||||||||
Fluor Corp. (d),(a) | 30,700 | 1,754,812 | ||||||||
Great Lakes Dredge & Dock Corp. | 100 | 601 | ||||||||
Jacobs Engineering Group, Inc. (b),(a) | 28,600 | 1,291,576 | ||||||||
KBR, Inc. (d),(a) | 47,200 | 683,456 | ||||||||
MasTec, Inc. (b) | 3,300 | 63,690 | ||||||||
MYR Group, Inc. (b) | 2,300 | 72,082 | ||||||||
Orion Marine Group, Inc. (b),(a) | 4,300 | 38,098 | ||||||||
Quanta Services, Inc. (b),(a) | 15,300 | 436,509 | ||||||||
Team, Inc. (b) | 200 | 7,796 | ||||||||
Tutor Perini Corp. (b) | 300 | 7,005 | ||||||||
|
| |||||||||
| 4,746,001 | ||||||||||
|
| |||||||||
Forest & Paper Products — 0.0% |
| |||||||||
Mercer International, Inc. (b),(a) | 13,700 | 210,432 | ||||||||
Resolute Forest Products, Inc. (b) | 500 | 8,625 | ||||||||
|
| |||||||||
| 219,057 | ||||||||||
|
| |||||||||
Gaming, Lodging & Restaurants — 1.0% |
| |||||||||
BJ’s Restaurants, Inc. (b) | 4,700 | 237,115 | ||||||||
Bloomin’ Brands, Inc. (a) | 24,900 | 605,817 | ||||||||
Bravo Brio Restaurant Group, Inc. (b),(a) | 7,800 | 114,582 | ||||||||
Buffalo Wild Wings, Inc. (b),(a) | 6,900 | 1,250,556 | ||||||||
Caesars Acquisition Co. Class A (b) | 500 | 3,400 | ||||||||
Carnival Corp. (d) | 500 | 23,920 | ||||||||
Carnival PLC ADR | 100 | 4,899 | ||||||||
Chipotle Mexican Grill, Inc. (b),(a) | 2,600 | 1,691,404 | ||||||||
Choice Hotels International, Inc. (d) | 200 | 12,814 | ||||||||
Churchill Downs, Inc. (d),(a) | 1,800 | 206,946 | ||||||||
Cracker Barrel Old Country Store, Inc. (d),(a) | 6,100 | 928,054 | ||||||||
Darden Restaurants, Inc. (a) | 6,200 | 429,908 | ||||||||
Del Frisco’s Restaurant Group, Inc. (b) | 700 | 14,105 | ||||||||
Denny’s Corp. (b),(a) | 27,900 | 318,060 | ||||||||
Diamond Resorts International, Inc. (b) | 300 | 10,029 | ||||||||
DineEquity, Inc. (d) | 2,900 | 310,329 | ||||||||
Domino’s Pizza, Inc. (d),(a) | 14,100 | 1,417,755 | ||||||||
Dunkin’ Brands Group, Inc. (d),(a) | 5,100 | 242,556 | ||||||||
Hyatt Hotels Corp. Class A (b),(a) | 16,400 | 971,208 | ||||||||
Isle of Capri Casinos, Inc. (b),(a) | 8,500 | 119,425 | ||||||||
Jack in the Box, Inc. (d) | 2,000 | 191,840 | ||||||||
La Quinta Holdings, Inc. (b) | 7,400 | 175,232 | ||||||||
Marriott International, Inc. Class A (d),(a) | 14,600 | 1,172,672 | ||||||||
Morgans Hotel Group Co. (b),(a) | 2,400 | 18,600 | ||||||||
Papa John’s International, Inc. (d) | 700 | 43,267 | ||||||||
Papa Murphy’s Holdings, Inc. (b) | 2,200 | 39,908 | ||||||||
See Notes to Consolidated Financial Statements.
134
Blackstone Alternative Multi-Strategy Fund and Subsidiaries
Consolidated Schedule of Investments (Continued)
March 31, 2015
Security Description | Shares | Value | ||||||||
Penn National Gaming, Inc. (b),(a) | 40,800 | $ | 638,928 | |||||||
Popeyes Louisiana Kitchen, Inc. (b) | 2,100 | 125,622 | ||||||||
Potbelly Corp. (b) | 2,000 | 27,400 | ||||||||
Red Robin Gourmet Burgers, Inc. (b),(a) | 1,500 | 130,500 | ||||||||
Ruby Tuesday, Inc. (b) | 600 | 3,606 | ||||||||
Ruth’s Hospitality Group, Inc. (d),(a) | 1,600 | 25,408 | ||||||||
Starwood Hotels & Resorts Worldwide, Inc. (d),(a) | 5,600 | 467,600 | ||||||||
Wendy’s Co. (d) | 1,100 | 11,990 | ||||||||
|
| |||||||||
| 11,985,455 | ||||||||||
|
| |||||||||
Hardware — 1.1% |
| |||||||||
ADTRAN, Inc. | 700 | 13,069 | ||||||||
Apple, Inc. (d),(a) | 71,183 | 8,857,301 | ||||||||
CommScope Holding Co., Inc. (b),(a) | 18,100 | 516,574 | ||||||||
Comtech Telecommunications Corp. (d),(a) | 1,100 | 31,845 | ||||||||
Corning, Inc. (d) | 17,300 | 392,364 | ||||||||
Cray, Inc. (b) | 900 | 25,272 | ||||||||
Daktronics, Inc. (d) | 200 | 2,162 | ||||||||
Dolby Laboratories, Inc. Class A (d),(a) | 2,500 | 95,400 | ||||||||
Dot Hill Systems Corp. (b) | 1,200 | 6,360 | ||||||||
DTS, Inc. (b) | 800 | 27,256 | ||||||||
Electronics For Imaging, Inc. (b) | 400 | 16,700 | ||||||||
EMC Corp. | 1,600 | 40,896 | ||||||||
F5 Networks, Inc. (b) | 800 | 91,952 | ||||||||
FLIR Systems, Inc. (d) | 1,300 | 40,664 | ||||||||
Harmonic, Inc. (b) | 2,000 | 14,820 | ||||||||
Harris Corp. (d),(a) | 22,100 | 1,740,596 | ||||||||
Hewlett-Packard Co. | 300 | 9,348 | ||||||||
Hutchinson Technology, Inc. (b) | 5,200 | 13,884 | ||||||||
Imation Corp. (b) | 900 | 3,627 | ||||||||
Ixia (b) | 100 | 1,213 | ||||||||
JDS Uniphase Corp. (b) | 4,700 | 61,664 | ||||||||
Knowles Corp. (b) | 8,300 | 159,941 | ||||||||
KVH Industries, Inc. (b) | 400 | 6,048 | ||||||||
Mercury Systems, Inc. (b) | 5,300 | 82,415 | ||||||||
Mitel Networks Corp. (b) | 100 | 1,017 | ||||||||
NetApp, Inc. (d) | 3,100 | 109,926 | ||||||||
NETGEAR, Inc. (b) | 200 | 6,576 | ||||||||
Novatel Wireless, Inc. (b) | 700 | 3,374 | ||||||||
Plantronics, Inc. | 500 | 26,475 | ||||||||
QLogic Corp. (b),(a) | 3,700 | 54,538 | ||||||||
Rovi Corp. (b) | 2,600 | 47,346 | ||||||||
Sanmina Corp. (b),(a) | 700 | 16,933 | ||||||||
ShoreTel, Inc. (b) | 3,700 | 25,234 | ||||||||
Skullcandy, Inc. (b) | 500 | 5,650 | ||||||||
Sonus Networks, Inc. (b) | 300 | 2,364 | ||||||||
See Notes to Consolidated Financial Statements.
135
Blackstone Alternative Multi-Strategy Fund and Subsidiaries
Consolidated Schedule of Investments (Continued)
March 31, 2015
Security Description | Shares | Value | ||||||||
Super Micro Computer, Inc. (b) | 700 | $ | 23,247 | |||||||
Telenav, Inc. (b),(a) | 1,600 | 12,672 | ||||||||
TiVo, Inc. (b) | 100 | 1,061 | ||||||||
TTM Technologies, Inc. (b) | 3,300 | 29,733 | ||||||||
ViaSat, Inc. (b) | 2,700 | 160,947 | ||||||||
Vicor Corp. (b) | 500 | 7,600 | ||||||||
Vishay Precision Group, Inc. (b) | 2,700 | 43,011 | ||||||||
VOXX International Corp. (b),(a) | 1,800 | 16,488 | ||||||||
Western Digital Corp. (d),(a) | 6,911 | 628,970 | ||||||||
|
| |||||||||
| 13,474,533 | ||||||||||
|
| |||||||||
Health Care Facilities/Services — 1.9% |
| |||||||||
Addus HomeCare Corp. (b) | 800 | 18,416 | ||||||||
Aetna, Inc. (d),(a) | 47,300 | 5,038,869 | ||||||||
Almost Family, Inc. (b) | 1,600 | 71,536 | ||||||||
Amedisys, Inc. (b),(a) | 1,900 | 50,882 | ||||||||
Bio-Reference Laboratories, Inc. (b) | 100 | 3,524 | ||||||||
Brookdale Senior Living, Inc. (d),(b),(c),(a) | 108,200 | 4,085,632 | ||||||||
Capital Senior Living Corp. (b) | 1,700 | 44,098 | ||||||||
Charles River Laboratories International, Inc. (b) | 400 | 31,716 | ||||||||
Cigna Corp. (d) | 10,400 | 1,346,176 | ||||||||
Digirad Corp. (d),(a) | 2,000 | 9,080 | ||||||||
Ensign Group, Inc. (d) | 300 | 14,058 | ||||||||
Envision Healthcare Holdings, Inc. (b) | 6,300 | 241,605 | ||||||||
Five Star Quality Care, Inc. (b) | 3,300 | 14,652 | ||||||||
Genesis Healthcare, Inc. (b) | 3,900 | 27,768 | ||||||||
HCA Holdings, Inc. (b),(a) | 33,697 | 2,535,026 | ||||||||
Health Net, Inc. (b) | 400 | 24,196 | ||||||||
Healthways, Inc. (b) | 4,400 | 86,680 | ||||||||
IPC The Hospitalist Co., Inc. (b) | 900 | 41,976 | ||||||||
Kindred Healthcare, Inc. | 51 | 1,213 | ||||||||
Laboratory Corp. of America Holdings (d),(b),(a) | 39,500 | 4,980,555 | ||||||||
Molina Healthcare, Inc. (b) | 2,200 | 148,038 | ||||||||
Omnicare, Inc. (c),(d) | 2,135 | 164,523 | ||||||||
OvaScience, Inc. (b) | 300 | 10,419 | ||||||||
PharMerica Corp. (b) | 200 | 5,638 | ||||||||
Quintiles Transnational Holdings, Inc. (d),(b) | 14,070 | 942,268 | ||||||||
RadNet, Inc. (b),(a) | 7,300 | 61,320 | ||||||||
Select Medical Holdings Corp. (d),(a) | 900 | 13,347 | ||||||||
UnitedHealth Group, Inc. (d),(a) | 19,300 | 2,282,997 | ||||||||
Universal American Corp. (b) | 1,600 | 17,088 | ||||||||
Universal Health Services, Inc. Class B (d) | 600 | 70,626 | ||||||||
US Physical Therapy, Inc. | 300 | 14,250 | ||||||||
|
| |||||||||
| 22,398,172 | ||||||||||
|
| |||||||||
See Notes to Consolidated Financial Statements.
136
Blackstone Alternative Multi-Strategy Fund and Subsidiaries
Consolidated Schedule of Investments (Continued)
March 31, 2015
Security Description | Shares | Value | ||||||||
Home & Office Products — 0.0% |
| |||||||||
American Woodmark Corp. (b),(a) | 3,300 | $ | 180,609 | |||||||
Armstrong World Industries, Inc. (b) | 100 | 5,747 | ||||||||
Century Communities, Inc. (b) | 300 | 5,799 | ||||||||
Griffon Corp. (d) | 300 | 5,229 | ||||||||
Herman Miller, Inc. (d) | 500 | 13,880 | ||||||||
Hooker Furniture Corp. (d) | 900 | 17,145 | ||||||||
Interface, Inc. (d) | 700 | 14,546 | ||||||||
Kimball International, Inc. Class B (d) | 3,900 | 40,872 | ||||||||
Libbey, Inc. (d) | 3,600 | 143,676 | ||||||||
PGT, Inc. (b) | 1,500 | 16,762 | ||||||||
Scotts Miracle-Gro Co. Class A (d) | 700 | 47,019 | ||||||||
WCI Communities, Inc. (b) | 300 | 7,185 | ||||||||
Whirlpool Corp. (d) | 200 | 40,412 | ||||||||
|
| |||||||||
| 538,881 | ||||||||||
|
| |||||||||
Industrial Services — 0.2% |
| |||||||||
Electro Rent Corp. (d) | 1,100 | 12,474 | ||||||||
Furmanite Corp. (b),(a) | 2,300 | 18,147 | ||||||||
HD Supply Holdings, Inc. (b),(a) | 61,002 | 1,900,517 | ||||||||
WESCO International, Inc. (b) | 200 | 13,978 | ||||||||
WW Grainger, Inc. (d) | 566 | 133,469 | ||||||||
|
| |||||||||
| 2,078,585 | ||||||||||
|
| |||||||||
Institutional Financial Service — 0.1% |
| |||||||||
Cowen Group, Inc. Class A (b) | 13,300 | 69,160 | ||||||||
Gain Capital Holdings, Inc. (d) | 2,800 | 27,356 | ||||||||
INTL. FCStone, Inc. (b) | 5,300 | 157,569 | ||||||||
Investment Technology Group, Inc. (b) | 3,300 | 100,023 | ||||||||
Lazard Ltd. Class A (d) | 8,200 | 431,238 | ||||||||
Moelis & Co. Class A (d),(a) | 3,100 | 93,372 | ||||||||
|
| |||||||||
| 878,718 | ||||||||||
|
| |||||||||
Insurance — 1.9% |
| |||||||||
American International Group, Inc. (d),(a) | 230,137 | 12,609,206 | ||||||||
AMERISAFE, Inc. (d) | 100 | 4,625 | ||||||||
Arthur J Gallagher & Co. (d) | 600 | 28,050 | ||||||||
Assurant, Inc. | 100 | 6,141 | ||||||||
Assured Guaranty Ltd. (d) | 72,600 | 1,915,914 | ||||||||
Axis Capital Holdings Ltd. (d) | 29,000 | 1,495,820 | ||||||||
Chubb Corp. | 300 | 30,330 | ||||||||
eHealth, Inc. (b) | 100 | 938 | ||||||||
Employers Holdings, Inc. (d),(a) | 5,000 | 134,950 | ||||||||
Fidelity & Guaranty Life (d) | 1,300 | 27,560 | ||||||||
Genworth Financial, Inc. Class A (b),(a) | 14,600 | 106,726 | ||||||||
Greenlight Capital Re Ltd. A Shares (b) | 600 | 19,080 | ||||||||
See Notes to Consolidated Financial Statements.
137
Blackstone Alternative Multi-Strategy Fund and Subsidiaries
Consolidated Schedule of Investments (Continued)
March 31, 2015
Security Description | Shares | Value | ||||||||
Hartford Financial Services Group, Inc. (d),(a) | 22,900 | $ | 957,678 | |||||||
Heritage Insurance Holdings, Inc. (b) | 5,800 | 127,658 | ||||||||
Lincoln National Corp. (d) | 1,000 | 57,460 | ||||||||
Maiden Holdings Ltd. (d) | 2,700 | 40,041 | ||||||||
National General Holdings Corp. | 100 | 1,870 | ||||||||
OneBeacon Insurance Group Ltd. Class A (d) | 800 | 12,168 | ||||||||
PartnerRe Ltd. (d) | 15,300 | 1,749,249 | ||||||||
Principal Financial Group, Inc. (d),(a) | 21,600 | 1,109,592 | ||||||||
ProAssurance Corp. | 100 | 4,591 | ||||||||
Prudential Financial, Inc. (d),(a) | 6,300 | 505,953 | ||||||||
Selective Insurance Group, Inc. (d),(a) | 1,500 | 43,575 | ||||||||
State Auto Financial Corp. (d) | 582 | 14,137 | ||||||||
Symetra Financial Corp. | 200 | 4,692 | ||||||||
Third Point Reinsurance Ltd. (b) | 8,500 | 120,275 | ||||||||
Universal Insurance Holdings, Inc. (d) | 3,700 | 94,683 | ||||||||
Unum Group (d) | 3,694 | 124,599 | ||||||||
Voya Financial, Inc. (d),(a) | 41,100 | 1,771,821 | ||||||||
|
| |||||||||
| 23,119,382 | ||||||||||
|
| |||||||||
Iron & Steel — 0.0% |
| |||||||||
Carpenter Technology Corp. | 700 | 27,216 | ||||||||
Reliance Steel & Aluminum Co. (d) | 200 | 12,216 | ||||||||
Steel Dynamics, Inc. (d) | 16,700 | 335,670 | ||||||||
SunCoke Energy, Inc. (d) | 300 | 4,482 | ||||||||
United States Steel Corp. | 200 | 4,880 | ||||||||
Worthington Industries, Inc. | 300 | 7,983 | ||||||||
|
| |||||||||
| 392,447 | ||||||||||
|
| |||||||||
Leisure Products — 0.0% |
| |||||||||
Black Diamond, Inc. (b) | 2,000 | 18,900 | ||||||||
Drew Industries, Inc. | 100 | 6,154 | ||||||||
Fox Factory Holding Corp. (b) | 200 | 3,068 | ||||||||
Hasbro, Inc. (d),(a) | 1,900 | 120,156 | ||||||||
JAKKS Pacific, Inc. (b) | 900 | 6,156 | ||||||||
LeapFrog Enterprises, Inc. (b) | 100 | 218 | ||||||||
Nautilus, Inc. (b) | 900 | 13,743 | ||||||||
|
| |||||||||
| 168,395 | ||||||||||
|
| |||||||||
Machinery — 0.2% |
| |||||||||
AGCO Corp. (d) | 200 | 9,528 | ||||||||
Alamo Group, Inc. | 100 | 6,313 | ||||||||
Altra Industrial Motion Corp. (d) | 600 | 16,584 | ||||||||
China Yuchai International Ltd. (d) | 1,600 | 31,584 | ||||||||
CIRCOR International, Inc. (d) | 2,100 | 114,870 | ||||||||
Crane Co. (d) | 300 | 18,723 | ||||||||
Curtiss-Wright Corp. (d) | 300 | 22,182 | ||||||||
See Notes to Consolidated Financial Statements.
138
Blackstone Alternative Multi-Strategy Fund and Subsidiaries
Consolidated Schedule of Investments (Continued)
March 31, 2015
Security Description | Shares | Value | ||||||||
Flowserve Corp. (d) | 6,400 | $ | 361,536 | |||||||
Graham Corp. (d) | 200 | 4,794 | ||||||||
Hyster-Yale Materials Handling, Inc. | 200 | 14,658 | ||||||||
Intevac, Inc. (b),(a) | 400 | 2,456 | ||||||||
ITT Corp. (d) | 2,300 | 91,793 | ||||||||
Joy Global, Inc. (d),(a) | 9,500 | 372,210 | ||||||||
Kadant, Inc. | 300 | 15,783 | ||||||||
MSA Safety, Inc. (d) | 100 | 4,988 | ||||||||
Parker-Hannifin Corp. (d) | 1,200 | 142,536 | ||||||||
Rofin-Sinar Technologies, Inc. (b),(a) | 3,300 | 79,959 | ||||||||
Terex Corp. (d) | 11,000 | 292,490 | ||||||||
Titan International, Inc. (d) | 6,100 | 57,096 | ||||||||
Toro Co. (d) | 5,100 | 357,612 | ||||||||
Xerium Technologies, Inc. (b) | 600 | 9,732 | ||||||||
|
| |||||||||
| 2,027,427 | ||||||||||
|
| |||||||||
Manufactured Goods — 0.1% |
| |||||||||
Aegion Corp. (b),(a) | 3,300 | 59,565 | ||||||||
Barnes Group, Inc. (d) | 400 | 16,196 | ||||||||
Chart Industries, Inc. (b),(a) | 7,800 | 273,585 | ||||||||
Dynamic Materials Corp. (d) | 200 | 2,554 | ||||||||
Gibraltar Industries, Inc. (b) | 200 | 3,282 | ||||||||
RTI International Metals, Inc. (b) | 800 | 28,728 | ||||||||
Timken Co. (d) | 5,900 | 248,626 | ||||||||
|
| |||||||||
| 632,536 | ||||||||||
|
| |||||||||
Media — 2.8% |
| |||||||||
AOL, Inc. (b) | 1,000 | 39,610 | ||||||||
Autobytel, Inc. (b) | 1,400 | 20,678 | ||||||||
Bankrate, Inc. (b) | 2,100 | 23,814 | ||||||||
Blucora, Inc. (b) | 1,600 | 21,856 | ||||||||
Boingo Wireless, Inc. (b) | 3,300 | 24,882 | ||||||||
Clear Channel Outdoor Holdings, Inc. Class A (d) | 4,700 | 47,564 | ||||||||
Comcast Corp. Class A (c),(d) | 137,567 | 7,768,408 | ||||||||
Covisint Corp. (b) | 165 | 335 | ||||||||
Dice Holdings, Inc. (b),(a) | 9,300 | 82,956 | ||||||||
DIRECTV (b) | 2,600 | 221,260 | ||||||||
DISH Network Corp. Class A (b),(a) | 25,000 | 1,751,500 | ||||||||
EchoStar Corp. Class A (b),(a) | 1,000 | 51,720 | ||||||||
Entercom Communications Corp. Class A (b) | 300 | 3,645 | ||||||||
Eros International PLC (b) | 600 | 10,482 | ||||||||
EW Scripps Co. Class A (b) | 1,100 | 31,284 | ||||||||
Facebook, Inc. Class A (d),(b) | 78,214 | 6,430,364 | ||||||||
Google, Inc. Class A (d),(b),(a) | 657 | 364,438 | ||||||||
Google, Inc. Class C (b),(a) | 623 | 341,404 | ||||||||
Gray Television, Inc. (b) | 3,100 | 42,842 | ||||||||
See Notes to Consolidated Financial Statements.
139
Blackstone Alternative Multi-Strategy Fund and Subsidiaries
Consolidated Schedule of Investments (Continued)
March 31, 2015
Security Description | Shares | Value | ||||||||
GrubHub, Inc. (b),(a) | 2,200 | $ | 99,858 | |||||||
Harte-Hanks, Inc. (d),(a) | 3,500 | 27,300 | ||||||||
HealthStream, Inc. (b) | 200 | 5,040 | ||||||||
Houghton Mifflin Harcourt Co. (b),(a) | 13,500 | 316,980 | ||||||||
IAC/InterActiveCorp (d),(a) | 5,500 | 371,085 | ||||||||
Interpublic Group of Cos., Inc. (d) | 13,200 | 291,984 | ||||||||
Journal Communications, Inc. Class A (b),(a) | 6,500 | 96,330 | ||||||||
Liberty Media Corp. (b) | 33 | 1,272 | ||||||||
Liberty TripAdvisor Holdings, Inc. Class A (b) | 1,300 | 41,327 | ||||||||
LinkedIn Corp. (b) | 300 | 74,958 | ||||||||
Martha Stewart Living Omnimedia, Inc. Class A (b) | 300 | 1,950 | ||||||||
MDC Partners, Inc. Class A (d) | 800 | 22,680 | ||||||||
Monster Worldwide, Inc. (b) | 3,900 | 24,726 | ||||||||
National CineMedia, Inc. (d) | 7,300 | 110,230 | ||||||||
News Corp. Class A (b),(a) | 49,700 | 795,697 | ||||||||
Nexstar Broadcasting Group, Inc. Class A (d),(a) | 9,600 | 549,312 | ||||||||
RealD, Inc. (b) | 900 | 11,511 | ||||||||
RetailMeNot, Inc. (b) | 1,000 | 18,010 | ||||||||
Rubicon Project, Inc. (b) | 100 | 1,792 | ||||||||
Shutterfly, Inc. (b) | 100 | 4,524 | ||||||||
Starz (b),(a) | 14,800 | 509,268 | ||||||||
TechTarget, Inc. (b),(a) | 3,200 | 36,896 | ||||||||
Time Warner Cable, Inc. (d),(a) | 12,100 | 1,813,548 | ||||||||
TripAdvisor, Inc. (b) | 800 | 66,536 | ||||||||
Twenty-First Century Fox, Inc. Class A (c),(d),(a) | 227,998 | 7,715,452 | ||||||||
Twitter, Inc. (d),(b) | 4,107 | 205,679 | ||||||||
VeriSign, Inc. (b),(a) | 6,300 | 421,911 | ||||||||
Walt Disney Co. (d),(a) | 17,027 | 1,785,962 | ||||||||
XO Group, Inc. (b) | 3,300 | 58,311 | ||||||||
Yahoo!, Inc. (b),(a) | 31,200 | 1,386,372 | ||||||||
|
| |||||||||
| 34,145,543 | ||||||||||
|
| |||||||||
Medical Equipment/Devices — 2.2% |
| |||||||||
ABIOMED, Inc. (b) | 1,400 | 100,212 | ||||||||
Accuray, Inc. (b) | 3,000 | 27,900 | ||||||||
Affymetrix, Inc. (b) | 24,600 | 308,976 | ||||||||
Agilent Technologies, Inc. (d),(a) | 107,400 | 4,462,470 | ||||||||
Alere, Inc. (b) | 5,200 | 254,280 | ||||||||
AngioDynamics, Inc. (b) | 4,700 | 83,613 | ||||||||
Becton Dickinson and Co. (d) | 100 | 14,359 | ||||||||
Bio-Rad Laboratories, Inc. Class A (b) | 900 | 121,662 | ||||||||
Boston Scientific Corp. (d),(b),(c),(a) | 262,200 | 4,654,050 | ||||||||
Bruker Corp. (b) | 2,700 | 49,869 | ||||||||
CONMED Corp. (d) | 200 | 10,098 | ||||||||
CR Bard, Inc. (d) | 12,700 | 2,125,345 | ||||||||
CryoLife, Inc. (d) | 2,500 | 25,925 | ||||||||
See Notes to Consolidated Financial Statements.
140
Blackstone Alternative Multi-Strategy Fund and Subsidiaries
Consolidated Schedule of Investments (Continued)
March 31, 2015
Security Description | Shares | Value | ||||||||
Cutera, Inc. (b) | 200 | $ | 2,584 | |||||||
Cyberonics, Inc. (b),(a) | 5,800 | 376,536 | ||||||||
Danaher Corp. (d),(a) | 30,400 | 2,580,960 | ||||||||
Edwards Lifesciences Corp. (d),(b),(a) | 13,500 | 1,923,210 | ||||||||
Exactech, Inc. (b) | 600 | 15,378 | ||||||||
GenMark Diagnostics, Inc. (b) | 1,400 | 18,172 | ||||||||
Genomic Health, Inc. (b),(a) | 400 | 12,220 | ||||||||
Harvard Bioscience, Inc. (b) | 200 | 1,164 | ||||||||
HeartWare International, Inc. (b) | 200 | 17,554 | ||||||||
ICU Medical, Inc. (b) | 1,100 | 102,454 | ||||||||
Illumina, Inc. (d),(b),(c),(a) | 17,400 | 3,230,136 | ||||||||
Inogen, Inc. (b) | 1,800 | 57,582 | ||||||||
Insulet Corp. (b) | 600 | 20,010 | ||||||||
Luminex Corp. (b),(a) | 5,400 | 86,400 | ||||||||
Masimo Corp. (b),(a) | 1,200 | 39,576 | ||||||||
Meridian Bioscience, Inc. (d) | 1,200 | 22,896 | ||||||||
Merit Medical Systems, Inc. (b) | 1,000 | 19,250 | ||||||||
Nanosphere, Inc. (b) | 200 | 46 | ||||||||
NuVasive, Inc. (b) | 400 | 18,396 | ||||||||
NxStage Medical, Inc. (b) | 3,200 | 55,360 | ||||||||
OraSure Technologies, Inc. (b) | 2,300 | 15,042 | ||||||||
Quidel Corp. (b) | 1,300 | 35,074 | ||||||||
RTI Surgical, Inc. (b) | 100 | 494 | ||||||||
Sequenom, Inc. (b) | 7,000 | 27,650 | ||||||||
St Jude Medical, Inc. | 200 | 13,080 | ||||||||
SurModics, Inc. (b) | 1,300 | 33,839 | ||||||||
Thermo Fisher Scientific, Inc. (d),(c),(a) | 31,800 | 4,272,012 | ||||||||
Tornier NV (b) | 9,300 | 243,846 | ||||||||
Vascular Solutions, Inc. (b) | 300 | 9,096 | ||||||||
Wright Medical Group, Inc. (b),(a) | 26,700 | 688,860 | ||||||||
Zeltiq Aesthetics, Inc. (b) | 3,700 | 114,071 | ||||||||
|
| |||||||||
| 26,291,707 | ||||||||||
|
| |||||||||
Metals & Mining — 0.0% | ||||||||||
Alcoa, Inc. | 1,200 | 15,504 | ||||||||
Compass Minerals International, Inc. (d) | 500 | 46,605 | ||||||||
Encore Wire Corp. (d) | 1,200 | 45,456 | ||||||||
Newmont Mining Corp. | 6,800 | 147,628 | ||||||||
Stillwater Mining Co. (b) | 2,300 | 29,716 | ||||||||
|
| |||||||||
| 284,909 | ||||||||||
|
| |||||||||
Oil, Gas & Coal — 2.4% | ||||||||||
Anadarko Petroleum Corp. (d) | 474 | 39,252 | ||||||||
Baker Hughes, Inc. (d),(a) | 149,800 | 9,524,284 | ||||||||
California Resources Corp. | 67,800 | �� | 515,958 | |||||||
Cameron International Corp. (b),(a) | 39,600 | 1,786,752 | ||||||||
See Notes to Consolidated Financial Statements.
141
Blackstone Alternative Multi-Strategy Fund and Subsidiaries
Consolidated Schedule of Investments (Continued)
March 31, 2015
Security Description | Shares | Value | ||||||||
Carrizo Oil & Gas, Inc. (b) | 200 | $ | 9,930 | |||||||
Cheniere Energy, Inc. (b),(a) | 10,100 | 781,740 | ||||||||
Cimarex Energy Co. (d),(a) | 400 | 46,036 | ||||||||
Cloud Peak Energy, Inc. (b) | 10,400 | 60,528 | ||||||||
Dawson Geophysical Co. (b) | 2,640 | 11,273 | ||||||||
Delek US Holdings, Inc. (d),(a) | 14,200 | 564,450 | ||||||||
Diamond Offshore Drilling, Inc. (d) | 2,700 | 72,333 | ||||||||
Dresser-Rand Group, Inc. (b),(c) | 14,640 | 1,176,324 | ||||||||
Dril-Quip, Inc. (b),(a) | 4,700 | 321,433 | ||||||||
Energy Transfer Equity LP (d) | 1,139 | 72,167 | ||||||||
Ensco PLC Class A (d) | 35,700 | 752,199 | ||||||||
EOG Resources, Inc. (d) | 946 | 86,739 | ||||||||
Evolution Petroleum Corp. (d),(a) | 400 | 2,380 | ||||||||
FMC Technologies, Inc. (b),(a) | 24,400 | 903,044 | ||||||||
Frank’s International NV (d) | 1,300 | 24,310 | ||||||||
Gulf Island Fabrication, Inc. (d) | 200 | 2,972 | ||||||||
Gulfmark Offshore, Inc. Class A | 100 | 1,304 | ||||||||
Gulfport Energy Corp. (b),(a) | 14,100 | 647,331 | ||||||||
Hallador Energy Co. | 400 | 4,676 | ||||||||
Halliburton Co. (d),(a) | 43,300 | 1,900,004 | ||||||||
Helix Energy Solutions Group, Inc. (b),(a) | 8,900 | 133,144 | ||||||||
Hess Corp. (d) | 2,600 | 176,462 | ||||||||
Marathon Petroleum Corp. (d),(a) | 18,100 | 1,853,259 | ||||||||
Matrix Service Co. (b) | 3,500 | 61,460 | ||||||||
McDermott International, Inc. (b) | 7,500 | 28,800 | ||||||||
Mitcham Industries, Inc. (b) | 200 | 920 | ||||||||
MRC Global, Inc. (b) | 25,600 | 303,360 | ||||||||
Murphy Oil Corp. (d) | 2,100 | 97,860 | ||||||||
Nabors Industries Ltd. (d) | 18,900 | 257,985 | ||||||||
National Oilwell Varco, Inc. (d),(a) | 14,900 | 744,851 | ||||||||
Newfield Exploration Co. (b),(a) | 30,500 | 1,070,245 | ||||||||
Newpark Resources, Inc. (b) | 700 | 6,377 | ||||||||
Noble Corp. PLC (d) | 800 | 11,424 | ||||||||
NOW, Inc. (b) | 700 | 15,148 | ||||||||
Oceaneering International, Inc. (d) | 7,000 | 377,510 | ||||||||
Oil States International, Inc. (b),(a) | 9,200 | 365,884 | ||||||||
Penn Virginia Corp. (b) | 11,100 | 71,928 | ||||||||
Phillips 66 (d) | 301 | 23,658 | ||||||||
Pioneer Natural Resources Co. (d) | 73 | 11,936 | ||||||||
PowerSecure International, Inc. (b) | 100 | 1,316 | ||||||||
QEP Resources, Inc. (d),(a) | 6,600 | 137,610 | ||||||||
Range Resources Corp. | 1,200 | 62,448 | ||||||||
Rowan Cos. PLC Class A (d) | 600 | 10,626 | ||||||||
Southwestern Energy Co. (b),(a) | 65,800 | 1,525,902 | ||||||||
Superior Energy Services, Inc. | 6,000 | 134,040 | ||||||||
Tesco Corp. (d) | 1,800 | 20,466 | ||||||||
Tidewater, Inc. | 500 | 9,570 | ||||||||
See Notes to Consolidated Financial Statements.
142
Blackstone Alternative Multi-Strategy Fund and Subsidiaries
Consolidated Schedule of Investments (Continued)
March 31, 2015
Security Description | Shares | Value | ||||||||
TransAtlantic Petroleum Ltd. (b) | 300 | $ | 1,602 | |||||||
Unit Corp. (b) | 1,000 | 27,980 | ||||||||
Valero Energy Corp. (d),(a) | 26,900 | 1,711,378 | ||||||||
Warren Resources, Inc. (b),(a) | 4,500 | 4,005 | ||||||||
Weatherford International PLC (b) | 11,200 | 137,760 | ||||||||
Western Refining, Inc. | 1,300 | 64,207 | ||||||||
|
| |||||||||
| 28,768,540 | ||||||||||
|
| |||||||||
Passenger Transportation — 0.1% | ||||||||||
Hawaiian Holdings, Inc. (b),(a) | 10,500 | 231,262 | ||||||||
Spirit Airlines, Inc. (b),(a) | 5,100 | 394,536 | ||||||||
|
| |||||||||
| 625,798 | ||||||||||
|
| |||||||||
Real Estate — 2.1% | ||||||||||
Agree Realty Corp. (d) | 2,500 | 82,425 | ||||||||
American Homes 4 Rent | 400 | 6,620 | ||||||||
American Realty Capital Properties, Inc. (d) | 132,406 | 1,304,199 | ||||||||
American Residential Properties, Inc. (b),(a) | 3,200 | 57,568 | ||||||||
American Tower Corp. (d),(a) | 11,365 | 1,070,015 | ||||||||
Armada Hoffler Properties, Inc. (d),(a) | 4,000 | 42,640 | ||||||||
Ashford Hospitality Prime, Inc. (d) | 900 | 15,093 | ||||||||
Ashford Hospitality Trust, Inc. (d),(a) | 93,495 | 899,422 | ||||||||
Aviv REIT, Inc. (d) | 6,400 | 233,600 | ||||||||
Brixmor Property Group, Inc. (d),(a) | 15,700 | 416,835 | ||||||||
CBL & Associates Properties, Inc. (d) | 2,500 | 49,500 | ||||||||
CBRE Group, Inc. (b),(a) | 34,200 | 1,323,882 | ||||||||
Cedar Realty Trust, Inc. (d) | 2,500 | 18,725 | ||||||||
Chambers Street Properties (d) | 100 | 788 | ||||||||
Columbia Property Trust, Inc. (d),(a) | 18,400 | 497,168 | ||||||||
Crown Castle International Corp. (d),(a) | 17,022 | 1,404,996 | ||||||||
Empire State Realty Trust, Inc. Class A (d),(a) | 2,100 | 39,501 | ||||||||
Equity One, Inc. | 400 | 10,676 | ||||||||
FelCor Lodging Trust, Inc. (d) | 27,100 | 311,379 | ||||||||
First Potomac Realty Trust | 100 | 1,189 | ||||||||
Forest City Enterprises, Inc. Class A (b),(a) | 75,000 | 1,914,000 | ||||||||
Franklin Street Properties Corp. | 800 | 10,256 | ||||||||
General Growth Properties, Inc. (d) | 2,000 | 59,100 | ||||||||
Getty Realty Corp. (d) | 400 | 7,280 | ||||||||
Gladstone Commercial Corp. (d) | 4,200 | 78,162 | ||||||||
Hannon Armstrong Sustainable Infrastructure Capital, Inc. (d) | 500 | 9,140 | ||||||||
Investors Real Estate Trust (d) | 400 | 3,000 | ||||||||
iStar Financial, Inc. (b),(a) | 2,300 | 29,900 | ||||||||
Kennedy-Wilson Holdings, Inc. (d),(a) | 30,500 | 797,270 | ||||||||
Lamar Advertising Co. Class A (c),(d) | 163,523 | 9,692,008 | ||||||||
Macerich Co. | 100 | 8,433 | ||||||||
See Notes to Consolidated Financial Statements.
143
Blackstone Alternative Multi-Strategy Fund and Subsidiaries
Consolidated Schedule of Investments (Continued)
March 31, 2015
Security Description | Shares | Value | ||||||||
Monmouth Real Estate Investment Corp. Class A (d) | 2,700 | $ | 29,997 | |||||||
New York REIT, Inc. (d),(a) | 120,059 | 1,258,218 | ||||||||
Post Properties, Inc. | 200 | 11,386 | ||||||||
Potlatch Corp. | 1,500 | 60,060 | ||||||||
QTS Realty Trust, Inc. Class A | 2,000 | 72,820 | ||||||||
Realogy Holdings Corp. (b),(a),(c) | 75,128 | 3,416,822 | ||||||||
Retail Properties of America, Inc. (d) | 3,200 | 51,296 | ||||||||
RLJ Lodging Trust | 300 | 9,393 | ||||||||
Rouse Properties, Inc. (d) | 3,500 | 66,360 | ||||||||
Select Income REIT (d) | 400 | 9,996 | ||||||||
Silver Bay Realty Trust Corp. (d) | 5,400 | 87,264 | ||||||||
Taubman Centers, Inc. (d) | 4,100 | 316,233 | ||||||||
Urstadt Biddle Properties, Inc. Class A (d) | 1,300 | 29,978 | ||||||||
Weyerhaeuser Co. | 100 | 3,315 | ||||||||
Winthrop Realty Trust (d) | 4,900 | 79,968 | ||||||||
|
| |||||||||
| 25,897,876 | ||||||||||
|
| |||||||||
Recreation Facilities & Services — 0.0% | ||||||||||
Carmike Cinemas, Inc. (b) | 500 | 16,800 | ||||||||
Cinemark Holdings, Inc. | 200 | 9,014 | ||||||||
ClubCorp Holdings, Inc. (d),(a) | 4,100 | 79,376 | ||||||||
Madison Square Garden Co. Class A (b) | 400 | 33,860 | ||||||||
Marcus Corp. | 300 | 6,387 | ||||||||
RCI Hospitality Holdings, Inc. (b) | 200 | 2,082 | ||||||||
Regal Entertainment Group Class A (d) | 4,900 | 111,916 | ||||||||
Six Flags Entertainment Corp. | 600 | 29,046 | ||||||||
Speedway Motorsports, Inc. (d) | 1,600 | 36,400 | ||||||||
Town Sports International Holdings, Inc. (d) | 900 | 6,129 | ||||||||
Vail Resorts, Inc. | 1,500 | 155,130 | ||||||||
|
| |||||||||
| 486,140 | ||||||||||
|
| |||||||||
Renewable Energy — 0.1% | ||||||||||
Ameresco, Inc. Class A (b) | 300 | 2,220 | ||||||||
Broadwind Energy, Inc. (b) | 200 | 1,000 | ||||||||
First Solar, Inc. (b),(a) | 15,900 | 950,661 | ||||||||
Renewable Energy Group, Inc. (b) | 2,100 | 19,362 | ||||||||
REX American Resources Corp. (b),(a) | 1,600 | 97,296 | ||||||||
SunEdison, Inc. (d),(b),(a) | 16,211 | 389,064 | ||||||||
|
| |||||||||
| 1,459,603 | ||||||||||
|
| |||||||||
Retail—Consumer Staples — 0.9% | ||||||||||
CVS Health Corp. (d),(a) | 24,224 | 2,500,159 | ||||||||
Dollar General Corp. (b),(a) | 24,612 | 1,855,253 | ||||||||
Dollar Tree, Inc. (b) | 4,400 | 357,038 | ||||||||
Ingles Markets, Inc. Class A | 400 | 19,792 | ||||||||
Rite Aid Corp. (d),(b),(c),(a) | 521,000 | 4,527,490 | ||||||||
See Notes to Consolidated Financial Statements.
144
Blackstone Alternative Multi-Strategy Fund and Subsidiaries
Consolidated Schedule of Investments (Continued)
March 31, 2015
Security Description | Shares | Value | ||||||||
SUPERVALU, Inc. (b),(a) | 68,000 | $ | 790,840 | |||||||
Target Corp. (d) | 4,100 | 336,487 | ||||||||
TravelCenters of America LLC (b) | 13,100 | 228,464 | ||||||||
|
| |||||||||
| 10,615,523 | ||||||||||
|
| |||||||||
Retail Discretionary — 0.8% | ||||||||||
1-800-Flowers.com, Inc. Class A (b) | 9,600 | 113,568 | ||||||||
Asbury Automotive Group, Inc. (b),(a) | 2,900 | 240,990 | ||||||||
Ascena Retail Group, Inc. (b) | 17,100 | 248,121 | ||||||||
AutoNation, Inc. (b) | 700 | 45,031 | ||||||||
Avis Budget Group, Inc. (b) | 400 | 23,606 | ||||||||
Beacon Roofing Supply, Inc. (b) | 4,900 | 153,370 | ||||||||
bebe stores, Inc. (d) | 100 | 363 | ||||||||
Bed Bath & Beyond, Inc. (b) | 400 | 30,710 | ||||||||
Big 5 Sporting Goods Corp. (d) | 4,800 | 63,696 | ||||||||
Brown Shoe Co., Inc. (d) | 2,200 | 72,160 | ||||||||
Burlington Stores, Inc. (b),(a) | 30,000 | 1,782,600 | ||||||||
Chegg, Inc. (b) | 400 | 3,180 | ||||||||
Chico’s FAS, Inc. (d) | 7,700 | 136,213 | ||||||||
Citi Trends, Inc. (b),(a) | 2,800 | 75,600 | ||||||||
Destination Maternity Corp. | 200 | 3,012 | ||||||||
Dick’s Sporting Goods, Inc. (d) | 400 | 22,796 | ||||||||
eBay, Inc. (b) | 1,266 | 73,023 | ||||||||
EVINE Live, Inc. (b) | 1,200 | 8,052 | ||||||||
Express, Inc. (b) | 19,100 | 315,723 | ||||||||
First Cash Financial Services, Inc. (b) | 400 | 18,608 | ||||||||
Foot Locker, Inc. (d) | 7,200 | 453,600 | ||||||||
GNC Holdings, Inc. Class A (d),(a) | 1,951 | 95,736 | ||||||||
Guess?, Inc. (d) | 600 | 11,154 | ||||||||
Haverty Furniture Cos., Inc. (d) | 100 | 2,488 | ||||||||
Hibbett Sports, Inc. (b) | 2,200 | 107,932 | ||||||||
JC Penney Co., Inc. (b),(a) | 13,000 | 109,330 | ||||||||
Kirkland’s, Inc. (b) | 800 | 19,000 | ||||||||
L Brands, Inc. (d),(a) | 20,400 | 1,923,516 | ||||||||
Liberty Interactive Corp. Class A (b),(a) | 18,200 | 531,258 | ||||||||
Liquidity Services, Inc. (b) | 900 | 8,892 | ||||||||
Lowe’s Cos., Inc. (d) | 1,305 | 97,079 | ||||||||
MarineMax, Inc. (b),(a) | 2,400 | 63,624 | ||||||||
Michaels Cos., Inc. (b) | 400 | 10,824 | ||||||||
New York & Co., Inc. (b) | 400 | 1,000 | ||||||||
Office Depot, Inc. (b) | 300 | 2,760 | ||||||||
Overstock.com, Inc. (b),(a) | 4,400 | 106,568 | ||||||||
Pacific Sunwear of California, Inc. (b) | 100 | 276 | ||||||||
Penske Automotive Group, Inc. | 200 | 10,298 | ||||||||
Pep Boys-Manny Moe & Jack (b) | 1,400 | 13,468 | ||||||||
PetMed Express, Inc. (d) | 2,800 | 46,256 | ||||||||
See Notes to Consolidated Financial Statements.
145
Blackstone Alternative Multi-Strategy Fund and Subsidiaries
Consolidated Schedule of Investments (Continued)
March 31, 2015
Security Description | Shares | Value | ||||||||
Sally Beauty Holdings, Inc. (b) | 3,300 | $ | 113,421 | |||||||
Shoe Carnival, Inc. (d) | 1,200 | 35,328 | ||||||||
Staples, Inc. (d) | 49,700 | 809,364 | ||||||||
Stein Mart, Inc. (d) | 8,800 | 109,560 | ||||||||
Tiffany & Co. (a) | 6,700 | 589,667 | ||||||||
Tilly’s, Inc. Class A (b) | 2,500 | 39,125 | ||||||||
Ulta Salon Cosmetics & Fragrance, Inc. (b),(a) | 7,000 | 1,055,950 | ||||||||
United Online, Inc. (a) | 2,900 | 46,197 | ||||||||
Urban Outfitters, Inc. (b),(a) | 1,600 | 73,040 | ||||||||
Williams-Sonoma, Inc. (d),(a) | 890 | 70,942 | ||||||||
|
| |||||||||
| 9,988,075 | ||||||||||
|
| |||||||||
Semiconductors — 0.5% | ||||||||||
Alpha & Omega Semiconductor Ltd. (b) | 900 | 8,019 | ||||||||
Amkor Technology, Inc. (b) | 11,500 | 101,603 | ||||||||
Axcelis Technologies, Inc. (b) | 3,100 | 7,378 | ||||||||
Cabot Microelectronics Corp. (b) | 700 | 34,979 | ||||||||
Cascade Microtech, Inc. (b) | 400 | 5,432 | ||||||||
CEVA, Inc. (b),(a) | 600 | 12,792 | ||||||||
Coherent, Inc. (b) | 200 | 12,992 | ||||||||
Cohu, Inc. (d) | 1,700 | 18,598 | ||||||||
Cree, Inc. (b),(a) | 31,400 | 1,114,386 | ||||||||
Cypress Semiconductor Corp. (d) | 10,865 | 153,305 | ||||||||
DSP Group, Inc. (b) | 2,100 | 25,158 | ||||||||
Entropic Communications, Inc. (b) | 7,200 | 21,312 | ||||||||
FormFactor, Inc. (b) | 10,700 | 94,909 | ||||||||
Freescale Semiconductor Ltd. (b) | 14,700 | 599,172 | ||||||||
GSI Technology, Inc. (b) | 418 | 2,466 | ||||||||
Integrated Device Technology, Inc. (b) | 600 | 12,012 | ||||||||
Intel Corp. | 5,900 | 184,493 | ||||||||
IPG Photonics Corp. (b) | 400 | 37,080 | ||||||||
Kemet Corp. (b) | 5,500 | 22,770 | ||||||||
KLA-Tencor Corp. (d),(a) | 18,000 | 1,049,220 | ||||||||
Lattice Semiconductor Corp. (b),(a) | 10,700 | 67,838 | ||||||||
M/A-COM Technology Solutions Holdings, Inc. (b) | 400 | 14,904 | ||||||||
Marvell Technology Group Ltd. (d) | 6,000 | 88,200 | ||||||||
Maxim Integrated Products, Inc. (d),(a) | 10,610 | 369,334 | ||||||||
MaxLinear, Inc. Class A (b) | 700 | 5,691 | ||||||||
Micron Technology, Inc. (b) | 16,551 | 449,029 | ||||||||
MKS Instruments, Inc. (d) | 900 | 30,429 | ||||||||
NeoPhotonics Corp. (b) | 2,100 | 14,175 | ||||||||
Oclaro, Inc. (b) | 800 | 1,584 | ||||||||
OmniVision Technologies, Inc. (b) | 5,900 | 155,583 | ||||||||
ON Semiconductor Corp. (b) | 5,300 | 64,183 | ||||||||
Pericom Semiconductor Corp. (d),(a) | 4,100 | 63,427 | ||||||||
Photronics, Inc. (b),(a) | 5,000 | 42,500 | ||||||||
See Notes to Consolidated Financial Statements.
146
Blackstone Alternative Multi-Strategy Fund and Subsidiaries
Consolidated Schedule of Investments (Continued)
March 31, 2015
Security Description | Shares | Value | ||||||||
Qualcomm, Inc. (d) | 3,189 | $ | 221,125 | |||||||
Rambus, Inc. (b) | 800 | 10,060 | ||||||||
Rudolph Technologies, Inc. (b),(a) | 2,400 | 26,448 | ||||||||
Sigma Designs, Inc. (b) | 2,800 | 22,484 | ||||||||
Tessera Technologies, Inc. (d) | 400 | 16,112 | ||||||||
Ultratech, Inc. (b),(a) | 2,200 | 38,148 | ||||||||
Veeco Instruments, Inc. (b) | 300 | 9,165 | ||||||||
Vishay Intertechnology, Inc. (d) | 800 | 11,056 | ||||||||
Xcerra Corp. (b) | 300 | 2,667 | ||||||||
Xilinx, Inc. (d) | 5,100 | 215,730 | ||||||||
|
| |||||||||
| 5,457,948 | ||||||||||
|
| |||||||||
Software — 0.7% | ||||||||||
2U, Inc. (b) | 2,700 | 69,066 | ||||||||
Acxiom Corp. (b),(a) | 1,300 | 24,037 | ||||||||
Agilysys, Inc. (b) | 700 | 6,888 | ||||||||
Allscripts Healthcare Solutions, Inc. (b),(a) | 11,000 | 131,560 | ||||||||
Audience, Inc. (b) | 100 | 454 | ||||||||
Autodesk, Inc. (b),(a) | 19,600 | 1,149,344 | ||||||||
AVG Technologies NV (b) | 700 | 15,155 | ||||||||
Bazaarvoice, Inc. (b) | 1,800 | 10,170 | ||||||||
Cadence Design Systems, Inc. (b) | 600 | 11,064 | ||||||||
Calix, Inc. (b) | 300 | 2,517 | ||||||||
Carbonite, Inc. (b) | 3,800 | 54,340 | ||||||||
CDK Global, Inc. (d) | 927 | 43,347 | ||||||||
CommVault Systems, Inc. (b) | 500 | 21,850 | ||||||||
Digi International, Inc. (b) | 1,400 | 13,972 | ||||||||
Ebix, Inc. (d),(a) | 600 | 18,228 | ||||||||
Electronic Arts, Inc. (b) | 200 | 11,763 | ||||||||
Envestnet, Inc. (b),(a) | 12,800 | 717,824 | ||||||||
Five9, Inc. (b) | 700 | 3,892 | ||||||||
inContact, Inc. (b) | 5,900 | 64,310 | ||||||||
Infoblox, Inc. (b),(a) | 4,900 | 116,963 | ||||||||
Informatica Corp. (b),(a) | 40,800 | 1,789,284 | ||||||||
InnerWorkings, Inc. (b) | 200 | 1,344 | ||||||||
Intralinks Holdings, Inc. (b) | 5,800 | 59,972 | ||||||||
Limelight Networks, Inc. (b) | 11,600 | 42,108 | ||||||||
Lionbridge Technologies, Inc. (b) | 800 | 4,576 | ||||||||
LivePerson, Inc. (b) | 100 | 1,024 | ||||||||
Mavenir Systems, Inc. (b) | 100 | 1,774 | ||||||||
Merge Healthcare, Inc. (b) | 11,100 | 49,617 | ||||||||
Microsoft Corp. (d),(a) | 7,961 | 323,654 | ||||||||
MicroStrategy, Inc. Class A (b) | 100 | 16,919 | ||||||||
Model N, Inc. (b) | 3,000 | 35,880 | ||||||||
Monotype Imaging Holdings, Inc. (d) | 700 | 22,848 | ||||||||
Palo Alto Networks, Inc. (b),(a) | 500 | 73,040 | ||||||||
See Notes to Consolidated Financial Statements.
147
Blackstone Alternative Multi-Strategy Fund and Subsidiaries
Consolidated Schedule of Investments (Continued)
March 31, 2015
Security Description | Shares | Value | ||||||||
Paycom Software, Inc. (b) | 100 | $ | 3,206 | |||||||
PDF Solutions, Inc. (b) | 200 | 3,584 | ||||||||
Progress Software Corp. (b) | 300 | 8,151 | ||||||||
QAD, Inc. Class A (d) | 2,900 | 70,180 | ||||||||
Quality Systems, Inc. (d),(a) | 3,400 | 54,332 | ||||||||
Qualys, Inc. (b) | 1,100 | 51,128 | ||||||||
Rackspace Hosting, Inc. (b),(a) | 9,000 | 464,310 | ||||||||
Rally Software Development Corp. (b) | 400 | 6,276 | ||||||||
RealNetworks, Inc. (b) | 900 | 6,057 | ||||||||
Red Hat, Inc. (b) | 200 | 15,150 | ||||||||
salesforce.com, Inc. (d),(b) | 3,505 | 234,169 | ||||||||
Seachange International, Inc. (b) | 1,600 | 12,560 | ||||||||
ServiceNow, Inc. (d),(b) | 1,971 | 155,275 | ||||||||
Support.com, Inc. (b) | 1,400 | 2,184 | ||||||||
Synopsys, Inc. (b) | 200 | 9,264 | ||||||||
Tableau Software, Inc. Class A (b) | 2,500 | 231,300 | ||||||||
Veeva Systems, Inc. Class A (b) | 4,900 | 125,097 | ||||||||
VMware, Inc. Class A (b),(a) | 21,400 | 1,755,014 | ||||||||
Zendesk, Inc. (b),(a) | 1,100 | 24,959 | ||||||||
|
| |||||||||
| 8,140,980 | ||||||||||
|
| |||||||||
Specialty Finance — 0.5% | ||||||||||
AG Mortgage Investment Trust, Inc. (d) | 1,300 | 24,492 | ||||||||
Air Lease Corp. | 1,200 | 45,288 | ||||||||
American Capital Agency Corp. (d),(a) | 84,438 | 1,801,062 | ||||||||
American Capital Mortgage Investment Corp. (d),(a) | 14,800 | 265,808 | ||||||||
American Express Co. | 1,000 | 78,120 | ||||||||
Annaly Capital Management, Inc. (d) | 38,100 | �� | 396,240 | |||||||
Anworth Mortgage Asset Corp. | 4,800 | 24,432 | ||||||||
Apollo Commercial Real Estate Finance, Inc. (d),(a) | 30,300 | 520,554 | ||||||||
Arbor Realty Trust, Inc. (d) | 4,100 | 28,618 | ||||||||
Blackhawk Network Holdings, Inc. Class B (b) | 400 | 14,220 | ||||||||
Capstead Mortgage Corp. (d) | 100 | 1,177 | ||||||||
Cherry Hill Mortgage Investment Corp. (d) | 1,400 | 24,682 | ||||||||
Chimera Investment Corp. (d),(a) | 211,900 | 665,366 | ||||||||
CIT Group, Inc. (d),(a) | 5,166 | 233,090 | ||||||||
Consumer Portfolio Services, Inc. (b) | 100 | 699 | ||||||||
Dynex Capital, Inc. (d) | 9,400 | 79,618 | ||||||||
Ellington Residential Mortgage REIT (d),(a) | 2,500 | 40,950 | ||||||||
Essent Group Ltd. (b) | 3,400 | 81,294 | ||||||||
Five Oaks Investment Corp. (d) | 3,300 | 35,145 | ||||||||
FleetCor Technologies, Inc. (b) | 100 | 15,092 | ||||||||
FNF Group (d) | 200 | 7,352 | ||||||||
FNFV Group (b) | 13,567 | 191,295 | ||||||||
Global Cash Access Holdings, Inc. (b),(a) | 11,300 | 86,106 | ||||||||
Green Dot Corp. Class A (b) | 100 | 1,592 | ||||||||
See Notes to Consolidated Financial Statements.
148
Blackstone Alternative Multi-Strategy Fund and Subsidiaries
Consolidated Schedule of Investments (Continued)
March 31, 2015
Security Description | Shares | Value | ||||||||
Hatteras Financial Corp. (d) | 5,500 | $ | 99,880 | |||||||
HomeStreet, Inc. (d) | 400 | 7,328 | ||||||||
Invesco Mortgage Capital, Inc. (d) | 33 | 512 | ||||||||
Ladder Capital Corp. (b) | 100 | 1,851 | ||||||||
McGrath RentCorp | 100 | 3,291 | ||||||||
Meta Financial Group, Inc. (d) | 1,400 | 55,622 | ||||||||
MFA Financial, Inc. (d) | 14,000 | 110,040 | ||||||||
New Residential Investment Corp. (d) | 48,200 | 724,446 | ||||||||
Newcastle Investment Corp. | 33 | 160 | ||||||||
Nicholas Financial, Inc. (b) | 900 | 12,609 | ||||||||
On Deck Capital, Inc. (b) | 254 | 5,408 | ||||||||
PennyMac Mortgage Investment Trust (d) | 1,800 | 38,322 | ||||||||
Visa, Inc. A Shares (d),(a) | 6,288 | 411,298 | ||||||||
Walker & Dunlop, Inc. (b) | 4,800 | 85,104 | ||||||||
ZAIS Financial Corp. (d) | 700 | 12,488 | ||||||||
|
| |||||||||
| 6,230,651 | ||||||||||
|
| |||||||||
Technology Services — 0.3% | ||||||||||
Amdocs Ltd. (d) | 10,400 | 565,760 | ||||||||
Broadridge Financial Solutions, Inc. (d),(a) | 600 | 33,006 | ||||||||
Ciber, Inc. (b) | 2,700 | 11,124 | ||||||||
comScore, Inc. (b) | 1,000 | 51,200 | ||||||||
CSG Systems International, Inc. (d) | 7,500 | 227,925 | ||||||||
Cubic Corp. (d) | 2,800 | 144,956 | ||||||||
DST Systems, Inc. (d),(a) | 6,000 | 664,260 | ||||||||
EPAM Systems, Inc. (b),(a) | 2,500 | 153,225 | ||||||||
ExlService Holdings, Inc. (b) | 200 | 7,440 | ||||||||
Leidos Holdings, Inc. (d),(a) | 12,500 | 524,500 | ||||||||
Luxoft Holding, Inc. (b) | 9,600 | 496,704 | ||||||||
Markit Ltd. (b) | 19,500 | 524,550 | ||||||||
NIC, Inc. (d) | 2,200 | 38,874 | ||||||||
Nielsen NV | 526 | 23,444 | ||||||||
Perficient, Inc. (b) | 300 | 6,207 | ||||||||
Sabre Corp. (d) | 1,700 | 41,310 | ||||||||
Science Applications International Corp. (d) | 3,300 | 169,455 | ||||||||
ServiceSource International, Inc. (b) | 200 | 620 | ||||||||
Sykes Enterprises, Inc. (b) | 1,400 | 34,790 | ||||||||
Xerox Corp. (d) | 8,500 | 109,225 | ||||||||
|
| |||||||||
| 3,828,575 | ||||||||||
|
| |||||||||
Telecommunications — 0.1% | ||||||||||
Cincinnati Bell, Inc. (b) | 2,600 | 9,178 | ||||||||
FairPoint Communications, Inc. (b),(a) | 1,500 | 26,400 | ||||||||
General Communication, Inc. Class A (b),(a) | 6,200 | 97,712 | ||||||||
GTT Communications, Inc. (b) | 500 | 9,440 | ||||||||
Hawaiian Telcom Holdco, Inc. (b) | 900 | 23,967 | ||||||||
See Notes to Consolidated Financial Statements.
149
Blackstone Alternative Multi-Strategy Fund and Subsidiaries
Consolidated Schedule of Investments (Continued)
March 31, 2015
Security Description | Shares | Value | ||||||||
IDT Corp. Class B (d) | 1,200 | $ | 21,300 | |||||||
Inteliquent, Inc. (d),(a) | 9,500 | 149,530 | ||||||||
Internap Network Services Corp. (b) | 6,300 | 64,449 | ||||||||
Level 3 Communications, Inc. (b) | 4,220 | 227,205 | ||||||||
Lumos Networks Corp. (d) | 1,500 | 22,890 | ||||||||
ORBCOMM, Inc. (b) | 200 | 1,194 | ||||||||
Pendrell Corp. (b) | 200 | 260 | ||||||||
Premiere Global Services, Inc. (b) | 4,500 | 43,020 | ||||||||
Shenandoah Telecommunications Co. (d) | 200 | 6,232 | ||||||||
Spok Holdings, Inc. (d) | 100 | 1,917 | ||||||||
TeleCommunication Systems, Inc. Class A (b) | 700 | 2,681 | ||||||||
Telephone & Data Systems, Inc. | 400 | 9,960 | ||||||||
Vonage Holdings Corp. (b) | 400 | 1,964 | ||||||||
West Corp. (d),(a) | 15,800 | 532,934 | ||||||||
Zix Corp. (b),(a) | 2,100 | 8,253 | ||||||||
|
| |||||||||
| 1,260,486 | ||||||||||
|
| |||||||||
Transportation & Logistics — 0.1% | ||||||||||
Air Transport Services Group, Inc. (b) | 6,400 | 59,008 | ||||||||
Atlas Air Worldwide Holdings, Inc. (b) | 600 | 25,812 | ||||||||
Con-way, Inc. (d) | 900 | 39,717 | ||||||||
Heartland Express, Inc. | 100 | 2,376 | ||||||||
Hornbeck Offshore Services, Inc. (b) | 200 | 3,762 | ||||||||
Hub Group, Inc. Class A (b) | 500 | 19,645 | ||||||||
Kirby Corp. (b),(a) | 3,600 | 270,180 | ||||||||
ModusLink Global Solutions, Inc. (b) | 2,500 | 9,625 | ||||||||
Navios Maritime Acquisition Corp. (d) | 100 | 354 | ||||||||
Quality Distribution, Inc. (b) | 2,500 | 25,825 | ||||||||
Saia, Inc. (b) | 600 | 26,580 | ||||||||
Scorpio Bulkers, Inc. (b) | 1,100 | 2,607 | ||||||||
Stamps.com, Inc. (b) | 2,500 | 168,225 | ||||||||
Swift Transportation Co. (b) | 1,700 | 44,234 | ||||||||
Tsakos Energy Navigation Ltd. | 1,300 | 10,634 | ||||||||
Union Pacific Corp. (d),(a) | 1,925 | 208,497 | ||||||||
USA Truck, Inc. (b) | 700 | 19,383 | ||||||||
UTi Worldwide, Inc. (b) | 100 | 1,230 | ||||||||
Werner Enterprises, Inc. (d) | 300 | 9,423 | ||||||||
|
| |||||||||
| 947,117 | ||||||||||
|
| |||||||||
Transportation Equipment — 0.1% | ||||||||||
Accuride Corp. (b) | 1,000 | 4,660 | ||||||||
Allison Transmission Holdings, Inc. (d),(a) | 39,900 | 1,274,406 | ||||||||
PACCAR, Inc. | 500 | 31,570 | ||||||||
Spartan Motors, Inc. (d),(a) | 200 | 970 | ||||||||
Trinity Industries, Inc. (d) | 3,200 | 113,632 | ||||||||
See Notes to Consolidated Financial Statements.
150
Blackstone Alternative Multi-Strategy Fund and Subsidiaries
Consolidated Schedule of Investments (Continued)
March 31, 2015
Security Description | Shares | Value | ||||||||
WABCO Holdings, Inc. (b) | 400 | $ | 49,152 | |||||||
|
| |||||||||
| 1,474,390 | ||||||||||
|
| |||||||||
Travel Lodging & Dining — 0.0% | ||||||||||
Boyd Gaming Corp. (b) | 500 | 7,100 | ||||||||
Panera Bread Co. Class A (b),(a) | 300 | 47,998 | ||||||||
|
| |||||||||
| 55,098 | ||||||||||
|
| |||||||||
Utilities — 0.1% | ||||||||||
AGL Resources, Inc. | 300 | 14,895 | ||||||||
Atmos Energy Corp. (d),(a) | 3,800 | 210,140 | ||||||||
California Water Service Group (d) | 2,400 | 58,824 | ||||||||
Calpine Corp. (b) | 100 | 2,287 | ||||||||
CenterPoint Energy, Inc. (d),(a) | 42,600 | 869,466 | ||||||||
CMS Energy Corp. (d) | 2,000 | 69,820 | ||||||||
DTE Energy Co. (d) | 800 | 64,552 | ||||||||
Edison International | 100 | 6,247 | ||||||||
Hawaiian Electric Industries, Inc. (d) | 800 | 25,696 | ||||||||
Integrys Energy Group, Inc. (d),(a) | 1,000 | 72,020 | ||||||||
Middlesex Water Co. (d) | 500 | 11,380 | ||||||||
OGE Energy Corp. | 800 | 25,288 | ||||||||
PG&E Corp. (d) | 1,200 | 63,684 | ||||||||
Questar Corp. (d) | 1,800 | 42,948 | ||||||||
Unitil Corp. (d) | 200 | 6,954 | ||||||||
|
| |||||||||
| 1,544,201 | ||||||||||
|
| |||||||||
Waste & Environmental Service Equipment & Facility — 0.0% |
| |||||||||
Casella Waste Systems, Inc. Class A (b) | 5,300 | 29,150 | ||||||||
Clean Harbors, Inc. (b) | 300 | 17,034 | ||||||||
|
| |||||||||
| 46,184 | ||||||||||
|
| |||||||||
Total United States | 411,026,748 | |||||||||
|
| |||||||||
TOTAL COMMON STOCK | 518,560,210 | |||||||||
|
| |||||||||
PREFERRED STOCK — 0.0% | ||||||||||
Germany — 0.0% | ||||||||||
Automotive — 0.0% |
| |||||||||
Volkswagen AG Preference Shares (d) | 246 | 65,240 | ||||||||
|
| |||||||||
Total Germany | 65,240 | |||||||||
|
| |||||||||
Republic of Korea — 0.0% | ||||||||||
Hardware — 0.0% |
| |||||||||
Samsung Electronics Co. Ltd. Preference Shares (d) | 60 | 59,577 | ||||||||
|
| |||||||||
Total Republic of Korea | 59,577 | |||||||||
|
| |||||||||
See Notes to Consolidated Financial Statements.
151
Blackstone Alternative Multi-Strategy Fund and Subsidiaries
Consolidated Schedule of Investments (Continued)
March 31, 2015
Security Description | Shares | Value | ||||||||
United States — 0.0% | ||||||||||
Pharmaceuticals — 0.0% |
| |||||||||
Actavis PLC | 51 | $ | 51,612 | |||||||
|
| |||||||||
Total United States | 51,612 | |||||||||
|
| |||||||||
TOTAL PREFERRED STOCK | 176,429 | |||||||||
|
| |||||||||
Security Description | Principal Amount | Value | ||||||||
ASSET-BACKED SECURITIES — 7.6% | ||||||||||
Cayman Islands — 4.5% | ||||||||||
ACIS CLO Ltd., Series 2015-6A, Class D, | $ | 2,300,000 | 2,139,000 | |||||||
ALESCO Preferred Funding VII Ltd., Series 7A, | 2,089,998 | 1,776,499 | ||||||||
ALESCO Preferred Funding XIIII Ltd., Series 13A, Class A2, 0.66%, 09/23/37 (d),(e),(f) | 996,000 | 587,640 | ||||||||
Ares XXVIII CLO Ltd., Series 2013-3A, Class D, 3.76%, 10/17/24 (d),(e),(f) | 650,000 | 623,805 | ||||||||
Atlas Senior Loan Fund II Ltd., Series 2012-2A, | 600,000 | 595,260 | ||||||||
Babson CLO Ltd., Series 2013-IA, Class D, | 800,000 | 786,560 | ||||||||
Bridgeport CLO Ltd., Series 2006-1A, Class C, | 500,000 | 465,350 | ||||||||
Canyon Capital CLO Ltd., Series 2012-1A, Class D, 4.55%, 01/15/24 (d),(e),(f) | 400,000 | 400,000 | ||||||||
Catamaran CLO Ltd., | ||||||||||
Series 2015-1A, Class D, | 600,000 | 570,720 | ||||||||
Series 2015-1A, Class E, | 600,000 | 537,060 | ||||||||
CIFC Funding 2015-1 Ltd., Series 2015-1A, Class D, 4.26%, 01/22/27 (d),(e),(f) | 1,600,000 | 1,541,920 | ||||||||
CIFC Funding Ltd., | ||||||||||
Series 2006-1BA, Class B2L, | 400,000 | 390,200 | ||||||||
Series 2014-4A, Class D, | 1,200,000 | 1,126,320 | ||||||||
ColumbusNova CLO IV Ltd., Series 2007-2A, Class D, 4.75%, 10/15/21 (d),(e),(f) | 250,000 | 250,050 | ||||||||
Crown Point CLO Ltd., Series 2012-1A, Class B1L, 5.26%, 11/21/22 (d),(e),(f) | 1,800,000 | 1,805,580 | ||||||||
See Notes to Consolidated Financial Statements.
152
Blackstone Alternative Multi-Strategy Fund and Subsidiaries
Consolidated Schedule of Investments (Continued)
March 31, 2015
Security Description | Principal Amount | Value | ||||||||
Cutwater Ltd., Series 2014-1A, Class C, 3.95%, 07/15/26 (d),(e),(f) | $ | 1,512,000 | $ | 1,436,400 | ||||||
Duane Street CLO, Series 2007-5X, Class B, REG S, 8.00%, 10/14/21 (d),(f) | 467,000 | 467,841 | ||||||||
Eastland CLO Ltd., Series 2007-1A, Class C, 1.75%, 05/01/22 (d),(e),(f) | 400,000 | 354,640 | ||||||||
Flagship CLO VIII Ltd., Series 2014-8A, Class D, 3.90%, 01/16/26 (d),(e),(f) | 789,000 | 763,831 | ||||||||
Fore CLO Ltd., Series 2007-1A, Class D, 3.26%, 07/20/19 (d),(e),(f) | 1,356,017 | 1,334,185 | ||||||||
Fraser Sullivan CLO VII Ltd., Series 2012-7A, Class D, 5.76%, 04/20/23 (d),(e),(f) | 500,000 | 500,000 | ||||||||
Galaxy XII CLO Ltd., Series 2012-12A, Class D, 4.26%, 05/19/23 (d),(e),(f) | 1,100,000 | 1,094,500 | ||||||||
Galaxy XIV CLO Ltd., Series 2012-14A, Class D, 4.66%, 11/15/24 (d),(e),(f) | 1,400,000 | 1,404,620 | ||||||||
Golub Capital Partners CLO Ltd., Series 2011-10AR, Class DR, 4.11%, 10/20/21 (d),(e),(f) | 250,000 | 248,625 | ||||||||
Halcyon Loan Advisors Funding Ltd., Series 2014-2A, Class C, 3.73%, 04/28/25 (d),(e),(f) | 1,800,000 | 1,683,180 | ||||||||
Harbourview CDO III Ltd., Series 3A, Class A, 0.73%, 09/15/31 (d),(e),(f),(g) | 876,011 | 788,410 | ||||||||
ING IM CLO Ltd., Series 2013-2A, Class C, 3.76%, 04/25/25 (d),(e),(f) | 658,000 | 641,024 | ||||||||
Katonah Ltd., Series 2007-10A, Class E, 4.26%, 04/17/20 (d),(e),(f) | 681,000 | 655,531 | ||||||||
Kingsland VI Ltd., Series 2013-6A, Class D, 3.91%, 10/28/24 (d),(e),(f) | 900,000 | 854,910 | ||||||||
KKR Financial CLO Ltd., | ||||||||||
Series 10, Class D, 3.98%, 01/15/26 (d),(e),(f) | 500,000 | 475,950 | ||||||||
Series 2012-1A, Class C, 4.77%, 12/15/24 (d),(e),(f) | 3,500,000 | 3,526,600 | ||||||||
LCM XI LP, Series 11A, Class D2, 4.21%, 04/19/22 (d),(e),(f) | 800,000 | 794,000 | ||||||||
MidOcean Credit CLO III, | ||||||||||
Series 2014-3A, Class D, 4.01%, 07/21/26 (d),(e),(f) | 732,000 | 701,622 | ||||||||
Series 2014-3A, Class E, 5.51%, 07/21/26 (d),(e),(f) | 581,000 | 518,078 | ||||||||
MSIM Peconic Bay Ltd., Series 2007-1A, Class E, 5.76%, 07/20/19 (d),(e),(f) | 292,335 | 292,306 | ||||||||
Nelder Grove CLO Ltd., Series 2014-1A, Class D1, 4.78%, 08/28/26 (d),(e),(f) | 1,800,000 | 1,812,780 | ||||||||
Ocean Trails CLO IV, Series 2013-4A, Class D, 4.26%, 08/13/25 (d),(e),(f) | 300,000 | 294,330 | ||||||||
Ocean Trails CLO V, Series 2014-5A, Class D, 4.23%, 10/13/26 (d),(e),(f) | 1,000,000 | 975,900 | ||||||||
See Notes to Consolidated Financial Statements.
153
Blackstone Alternative Multi-Strategy Fund and Subsidiaries
Consolidated Schedule of Investments (Continued)
March 31, 2015
Security Description | Principal Amount | Value | ||||||||
Octagon Investment Partners XII Ltd., Series 2012-1AR, Class DR, 4.06%, 05/05/23 (d),(e),(f) | $ | 1,400,000 | $ | 1,408,960 | ||||||
Octagon Investment Partners XIV Ltd., Series 2012-1A, Class C, 4.25%, 01/15/24 (d),(e),(f) | 250,000 | 250,000 | ||||||||
Octagon Investment Partners XX Ltd., Series 2014-1A, Class D, 3.91%, 08/12/26 (d),(e),(f) | 344,000 | 332,373 | ||||||||
Octagon Investment Partners XXI Ltd., Series 2014-1A, Class D, 6.85%, 11/14/26 (d),(e),(f) | 1,100,000 | 1,093,290 | ||||||||
OZLM Funding IV Ltd., Series 2013-4A, Class C, 3.46%, 07/22/25 (d),(e),(f) | 800,000 | 763,280 | ||||||||
OZLM Funding V Ltd., | ||||||||||
Series 2013-5A, Class C, | 1,200,000 | 1,145,880 | ||||||||
Series 2013-5A, Class D, | 600,000 | 553,380 | ||||||||
OZLM VII Ltd., Series 2014-7A, Class C, | 1,500,000 | 1,451,700 | ||||||||
OZLM XI Ltd., Series 2015-11A, Class D, 5.67%, 01/30/27 (d),(e),(f) | 800,000 | 727,520 | ||||||||
Preferred Term Securities X Ltd. / Preferred Term Securities X, Inc., 0.99%, 07/03/33 (d),(e),(f) | 209,599 | 188,639 | ||||||||
Preferred Term Securities XXIV Ltd. / Preferred Term Securities XXIV, Inc., 0.57%, 03/22/37 (d),(e),(f) | 971,885 | 728,913 | ||||||||
Race Point VI CLO Ltd., Series 2012-6RA, Class DR, 4.34%, 05/24/23 (d),(e),(f) | 350,000 | 345,835 | ||||||||
Red River CLO Ltd., Series 1A, Class D, 1.90%, 07/27/18 (d),(e),(f) | 900,000 | 882,900 | ||||||||
Sound Point CLO I Ltd., Series 2012-1A, Class D, 4.81%, 10/20/23 (d),(e),(f) | 900,000 | 906,030 | ||||||||
Symphony CLO IV Ltd., Series 2007-4A, Class E, 5.76%, 07/18/21 (d),(e),(f) | 739,000 | 739,295 | ||||||||
Symphony CLO IX Ltd., Series 2012-9A, Class D, 4.50%, 04/16/22 (d),(e),(f) | 1,900,000 | 1,909,310 | ||||||||
Symphony CLO VII Ltd., Series 2011-7A, Class E, 3.86%, 07/28/21 (d),(e),(f) | 400,000 | 401,320 | ||||||||
Symphony CLO XII Ltd., Series 2013-12A, Class D, 3.75%, 10/15/25 (d),(e),(f) | 250,000 | 241,875 | ||||||||
Trapeza CDO XIII LLC, Series 2007-13A, Class A3, 0.69%, 11/09/42 (d),(e),(f) | 270,000 | 156,600 | ||||||||
Venture CDO Ltd., Series 2014-16A, Class B1L, 3.70%, 04/15/26 (d),(e),(f) | 3,400,000 | 3,288,820 | ||||||||
Venture XIV CLO Ltd., Series 2013-14A, Class D, 4.01%, 08/28/25 (d),(e),(f) | 700,000 | 669,480 | ||||||||
Vibrant CLO Ltd., Series 2015-3A, Class C, 3.91%, 04/20/26 (d),(e),(f) | 1,082,000 | 995,007 | ||||||||
See Notes to Consolidated Financial Statements.
154
Blackstone Alternative Multi-Strategy Fund and Subsidiaries
Consolidated Schedule of Investments (Continued)
March 31, 2015
Security Description | Principal Amount | Value | ||||||||
WhiteHorse VIII Ltd., Series 2014-1A, Class E, VRN, 4.81%, 05/01/26 (d),(e),(f) | $ | 420,000 | $ | 351,624 | ||||||
|
| |||||||||
Total Cayman Islands | 54,747,258 | |||||||||
|
| |||||||||
United States — 3.1% | ||||||||||
AmeriCredit Automobile Receivables Trust, Series 2012-4, Class E, 3.82%, 02/10/20 (d),(e) | 800,000 | 820,160 | ||||||||
Ascentium Equipment Receivable, Series 2015-1A, Class E, 5.92%, 06/12/23 (d),(e),(g) | 758,000 | 768,385 | ||||||||
Countrywide Home Equity Loan Trust, | ||||||||||
Series 2004-I, Class A, 0.46%, 02/15/34 (d),(f) | 1,373,104 | 1,235,793 | ||||||||
Series 2004-P, Class 2A, 0.49%, 03/15/34 (d),(f) | 30,700 | 26,479 | ||||||||
CPS Auto Receivables Trust, | ||||||||||
Series 2014-B, Class D, 4.62%, 05/15/20 (d),(e) | 156,000 | 153,052 | ||||||||
Series 2014-C, Class D, 4.83%, 08/17/20 (d),(e) | 391,000 | 383,767 | ||||||||
Drive Auto Receivables Trust, Series 2015-AA, Class D, 4.12%, 06/15/22 (d),(e) | 3,900,000 | 3,926,520 | ||||||||
DT Auto Owner Trust, | ||||||||||
Series 2014-3A, Class D, 4.47%, 11/15/21 (d),(e) | 600,000 | 612,000 | ||||||||
Series 2015-1A, Class D, 4.26%, 02/15/22 (d),(e) | 1,000,000 | 1,007,200 | ||||||||
Education Funding LLC, Series 2006-1A, Class A2, 0.51%, 10/25/29 (d),(e),(f) | 1,266,908 | 1,178,731 | ||||||||
Exeter Automobile Receivables Trust, | ||||||||||
Series 2014-1A, Class D, 5.53%, 02/16/21 (d),(e) | 4,300,000 | 4,398,040 | ||||||||
Series 2014-2A, Class D, 4.93%, 12/15/20 (d),(e) | 800,000 | 802,640 | ||||||||
Series 2014-3A, Class C, 4.17%, 06/15/20 (d),(e) | 1,900,000 | 1,915,960 | ||||||||
FFCA Secured Lending Corp., Series 1999-2, Class WA1C, 7.85%, 05/18/26 (d),(e),(g) | 72,279 | 74,231 | ||||||||
Fraser Sullivan CLO II Ltd., Series 2006-2A, Class E, 3.77%, 12/20/20 (d),(e),(f) | 716,000 | 704,544 | ||||||||
GE Business Loan Trust, Series 2004-1, Class C, 1.37%, 05/15/32 (d),(e),(f) | 98,374 | 91,783 | ||||||||
GE Business Loan Trust 2004-1, Series 2004-1, Class B, 0.87%, 05/15/32 (d),(e),(f) | 68,701 | 63,404 | ||||||||
Harch CLO III Ltd., Series 2007-1A, Class E, 4.00%, 04/17/20 (d),(e),(f) | 549,000 | 524,240 | ||||||||
HSI Asset Securitization Corp. Trust, Series 2005-I1, Class 2A3, 0.46%, 11/25/35 (d),(f) | 391,275 | 363,885 | ||||||||
InCaps Funding II Ltd. / InCaps Funding II Corp., 1.45%, 01/15/34 (d),(e),(f),(g) | 1,424,297 | 1,360,204 | ||||||||
Morgan Stanley ABS Capital I, Inc. Trust, | ||||||||||
Series 2006-HE3, Class A2C, 0.33%, 04/25/36 (d),(f) | 912,821 | 888,905 | ||||||||
Series 2006-NC4, Class A2C, 0.32%, 06/25/36 (d),(f) | 2,977,340 | 2,791,257 | ||||||||
See Notes to Consolidated Financial Statements.
155
Blackstone Alternative Multi-Strategy Fund and Subsidiaries
Consolidated Schedule of Investments (Continued)
March 31, 2015
Security Description | Principal Amount | Value | ||||||||
Nationstar Home Equity Loan Trust, Series 2007-C, Class 2AV2, 0.30%, 06/25/37 (d),(f) | $ | 1,726,577 | $ | 1,680,477 | ||||||
Preferred Term Securities XVII Ltd. / Preferred Term Securities XVII, Inc., 0.77%, 06/23/35 (d),(e),(f) | 211,000 | 128,710 | ||||||||
SLM Private Credit Student Loan Trust, Series 2004-A, Class C, 1.22%, 06/15/33 (d),(f) | 175,975 | 164,114 | ||||||||
Soundview Home Loan Trust, Series 2007-OPT3, Class 2A2, 0.30%, 08/25/37 (d),(f) | 1,505,625 | 1,467,985 | ||||||||
US Residential Opportunity Fund Trust, | 3,463,533 | 3,475,656 | ||||||||
Vericrest Opportunity Loan Trust, Series 2015-NPL4, Class A1, 3.50%, 02/25/55 (d),(e),(f) | 2,942,105 | 2,941,811 | ||||||||
Vericrest Opportunity Loan XXXI LLC, | 1,874,439 | 1,874,439 | ||||||||
Westgate Resorts LLC, Series 2014-1A, Class C, 5.50%, 12/20/26 (d),(e) | 1,233,209 | 1,231,853 | ||||||||
|
| |||||||||
Total United States | 37,056,225 | |||||||||
|
| |||||||||
TOTAL ASSET-BACKED SECURITIES | 91,803,483 | |||||||||
|
| |||||||||
CONVERTIBLE BONDS — 0.2% | ||||||||||
France — 0.1% | ||||||||||
Auto Parts Manufacturing — 0.1% | ||||||||||
Faurecia REG S, 3.25%, 01/01/18 (d) | 1,369,300 | EUR | 604,543 | |||||||
|
| |||||||||
Total France | 604,543 | |||||||||
|
| |||||||||
Germany — 0.0% | ||||||||||
Automobiles Manufacturing — 0.0% | ||||||||||
Volkswagen International Finance NV Co. REG S (d) | $ | 300,000 | 462,199 | |||||||
|
| |||||||||
Total Germany | 462,199 | |||||||||
|
| |||||||||
Spain — 0.1% | ||||||||||
Wireless Telecommunication Services — 0.1% | ||||||||||
Telefonica Participacion Co. REG S (d) | 1,400,000 | 1,638,423 | ||||||||
|
| |||||||||
Total Spain | 1,638,423 | |||||||||
|
| |||||||||
TOTAL CONVERTIBLE BONDS | 2,705,165 | |||||||||
|
| |||||||||
BANK LOANS — 0.1% | ||||||||||
Netherlands — 0.1% | ||||||||||
Exploration & Production — 0.1% | ||||||||||
Endeavour International Holding BV, 11.00%, 01/02/17 (d),(f),(g) | 1,048,524 | 825,713 | ||||||||
|
| |||||||||
See Notes to Consolidated Financial Statements.
156
Blackstone Alternative Multi-Strategy Fund and Subsidiaries
Consolidated Schedule of Investments (Continued)
March 31, 2015
Security Description | Principal Amount | Value | ||||||||
Transportation & Logistics — 0.0% | ||||||||||
Ceva Intercompany BV, 6.50%, 03/19/21 (d),(f),(g) | $ | 39,418 | $ | 36,839 | ||||||
|
| |||||||||
Total Netherlands | 862,552 | |||||||||
|
| |||||||||
United Kingdom — 0.0% | ||||||||||
Transportation & Logistics — 0.0% | ||||||||||
Ceva Group PLC, 6.50%, 03/19/21 (d),(f),(g) | 37,739 | 35,270 | ||||||||
Ceva Logistics, 6.50%, 03/19/21 (d),(f),(g) | 6,796 | 6,351 | ||||||||
Ceva Logistics U.S. Holdings, 6.50%, 03/19/21 (d),(f),(g) | 54,369 | 50,813 | ||||||||
|
| |||||||||
Total United Kingdom | 92,434 | |||||||||
|
| |||||||||
United States — 0.0% | ||||||||||
Publishing & Broadcasting — 0.0% | ||||||||||
Clear Channel Communications, 6.93%, 01/30/19 (d),(f),(g) | 113,167 | 107,458 | ||||||||
|
| |||||||||
Total United States | 107,458 | |||||||||
|
| |||||||||
TOTAL BANK LOANS | 1,062,444 | |||||||||
|
| |||||||||
CORPORATE BONDS & NOTES — 3.8% | ||||||||||
Brazil — 0.3% | ||||||||||
Banks — 0.1% | ||||||||||
Banco Bradesco SA REG S, 5.90%, 01/16/21 (d) | 350,000 | 368,393 | ||||||||
Banco do Brasil SA/Cayman REG S, 5.88%, 01/26/22 (d) | 300,000 | 294,000 | ||||||||
Banco Votorantim SA REG S, 7.38%, 01/21/20 (d) | 150,000 | 154,200 | ||||||||
Itau Unibanco Holding SA REG S, | ||||||||||
5.75%, 01/22/21 (d) | 200,000 | 204,500 | ||||||||
6.20%, 04/15/20 (d) | 150,000 | 159,300 | ||||||||
|
| |||||||||
| 1,180,393 | ||||||||||
|
| |||||||||
Food & Beverage — 0.0% |
| |||||||||
Cosan Luxembourg SA REG S, 5.00%, 03/14/23 (d) | 100,000 | 88,750 | ||||||||
|
| |||||||||
Integrated Oils — 0.2% |
| |||||||||
Petrobras Global Finance BV, 5.75%, 01/20/20 | 2,573,000 | 2,392,015 | ||||||||
|
| |||||||||
Total Brazil | 3,661,158 | |||||||||
|
| |||||||||
Canada — 0.1% | ||||||||||
Aerospace & Defense — 0.0% |
| |||||||||
Bombardier, Inc., | ||||||||||
5.50%, 09/15/18 (d),(e) | 420,000 | 419,475 | ||||||||
See Notes to Consolidated Financial Statements.
157
Blackstone Alternative Multi-Strategy Fund and Subsidiaries
Consolidated Schedule of Investments (Continued)
March 31, 2015
Security Description | Principal Amount | Value | ||||||||
7.50%, 03/15/25 (d),(e),(c) | $ | 490,000 | $ | 483,569 | ||||||
|
| |||||||||
| 903,044 | ||||||||||
|
| |||||||||
Publishing & Broadcasting — 0.1% |
| |||||||||
Postmedia Network, Inc., 12.50%, 07/15/18 (d),(a) | 920,000 | 961,400 | ||||||||
|
| |||||||||
Total Canada | 1,864,444 | |||||||||
|
| |||||||||
Ecuador — 0.1% | ||||||||||
Refining & Marketing — 0.1% |
| |||||||||
EP PetroEcuador via Noble Sovereign Funding I Ltd. REG S, 5.90%, 09/24/19 (f) | 761,684 | 666,473 | ||||||||
|
| |||||||||
Total Ecuador | 666,473 | |||||||||
|
| |||||||||
France — 0.2% | ||||||||||
Property & Casualty — 0.2% | ||||||||||
Groupama SA REG S, 6.38%, (d),(f),(i) | 1,900,000 | 2,201,306 | ||||||||
|
| |||||||||
Total France | 2,201,306 | |||||||||
|
| |||||||||
Germany — 0.1% | ||||||||||
Banks — 0.1% | ||||||||||
HSH Nordbank AG REG S, MTN, | ||||||||||
0.85%, 02/14/17 (d),(f) | 549,000 | EUR | 498,076 | |||||||
0.89%, 02/14/17 (d),(f) | 610,000 | EUR | 554,238 | |||||||
|
| |||||||||
Total Germany | 1,052,314 | |||||||||
|
| |||||||||
Hong Kong — 0.0% | ||||||||||
Casinos & Gaming — 0.0% | ||||||||||
MCE Finance Ltd. (d),(e) | $ | 94,000 | 87,890 | |||||||
|
| |||||||||
Total Hong Kong | 87,890 | |||||||||
|
| |||||||||
Ireland — 0.1% | ||||||||||
Banks — 0.1% | ||||||||||
UT2 Funding PLC, 5.32%, 06/30/16 (d) | 1,100,000 | 1,203,474 | ||||||||
|
| |||||||||
Total Ireland | 1,203,474 | |||||||||
|
| |||||||||
Luxembourg — 0.1% | ||||||||||
Wireless Telecommunication Services — 0.1% | ||||||||||
Intelsat Luxembourg SA, 7.75%, 06/01/21 (d),(c) | 928,000 | 856,080 | ||||||||
|
| |||||||||
Total Luxembourg | 856,080 | |||||||||
|
| |||||||||
Mexico — 0.0% | ||||||||||
Oil & Gas Services — 0.0% | ||||||||||
Oro Negro Drilling Pte Ltd. REG S (e) | 100,000 | 72,000 | ||||||||
|
| |||||||||
Total Mexico | 72,000 | |||||||||
|
| |||||||||
See Notes to Consolidated Financial Statements.
158
Blackstone Alternative Multi-Strategy Fund and Subsidiaries
Consolidated Schedule of Investments (Continued)
March 31, 2015
Security Description | Principal Amount | Value | ||||||||
Nigeria — 0.0% | ||||||||||
Oil & Gas Services — 0.0% | ||||||||||
Sea Trucks Group Ltd. REG S, 9.00%, 03/26/18 (e),(g) | $ | 200,000 | $ | 124,000 | ||||||
|
| |||||||||
Total Nigeria | 124,000 | |||||||||
|
| |||||||||
Poland — 0.0% | ||||||||||
Food & Beverage — 0.0% | ||||||||||
CEDC Finance Corp. International, Inc. (d),(j) | 193,082 | 176,670 | ||||||||
|
| |||||||||
Total Poland | 176,670 | |||||||||
|
| |||||||||
Sweden — 0.0% | ||||||||||
Chemicals — 0.0% | ||||||||||
Perstorp Holding AB, | ||||||||||
8.75%, 05/15/17 (d),(e) | 202,000 | 209,070 | ||||||||
11.00%, 08/15/17 (d),(e) | 200,000 | 207,500 | ||||||||
|
| |||||||||
Total Sweden | 416,570 | |||||||||
|
| |||||||||
United Kingdom — 0.1% | ||||||||||
Financial Services — 0.0% | ||||||||||
Depfa Funding III LP REG S, 1.72% (d),(f),(i) | 676,000 | EUR | 408,718 | |||||||
|
| |||||||||
Transportation & Logistics — 0.1% | ||||||||||
Algeco Scotsman Global Finance PLC, 8.50%, 10/15/18 (d),(e) | $ | 99,000 | 98,134 | |||||||
CEVA Group PLC, 4.00%, 05/01/18 (d),(e) | 1,010,128 | 916,691 | ||||||||
|
| |||||||||
| 1,014,825 | ||||||||||
|
| |||||||||
Total United Kingdom | 1,423,543 | |||||||||
|
| |||||||||
United States — 2.4% | ||||||||||
Advertising & Marketing — 0.1% | ||||||||||
Visant Corp., 10.00%, 10/01/17 (d),(c) | 1,034,000 | 925,430 | ||||||||
|
| |||||||||
Airlines — 0.0% | ||||||||||
American Airlines Group Co., 4.63%, 03/01/20 (d),(e) | 140,000 | 137,113 | ||||||||
|
| |||||||||
Cable & Satellite — 0.1% | ||||||||||
CCOH Safari LLC, 5.75%, 12/01/24 (d) | 210,000 | 216,300 | ||||||||
WideOpenWest Finance LLC / WideOpenWest Capital Corp., 10.25%, 07/15/19 (d),(c) | 980,000 | 1,053,500 | ||||||||
|
| |||||||||
| 1,269,800 | ||||||||||
|
| |||||||||
Casinos & Gaming — 0.2% | ||||||||||
Boyd Gaming Corp., 9.00%, 07/01/20 (d),(c) | 110,000 | 118,663 | ||||||||
Downstream Development Authority of the Quapaw Tribe of Oklahoma, 10.50%, 07/01/19 (d),(e) | 829,000 | 731,592 | ||||||||
See Notes to Consolidated Financial Statements.
159
Blackstone Alternative Multi-Strategy Fund and Subsidiaries
Consolidated Schedule of Investments (Continued)
March 31, 2015
Security Description | Principal Amount | Value | ||||||||
Golden Nugget Escrow, Inc., 8.50%, 12/01/21 (d),(e) | $ | 513,000 | $ | 525,825 | ||||||
Greektown Holdings LLC/Greektown Mothership Corp., 8.88%, 03/15/19 (d),(e) | 896,000 | 945,280 | ||||||||
Isle of Capri Casinos, Inc., 8.88%, 06/15/20 (d),(c) | 195,000 | 210,600 | ||||||||
Scientific Games International, Inc., 7.00%, 01/01/22 (d),(e),(c),(a) | 110,000 | 112,475 | ||||||||
|
| |||||||||
| 2,644,435 | ||||||||||
|
| |||||||||
Communications Equipment — 0.1% | ||||||||||
Avaya, Inc., | ||||||||||
9.00%, 04/01/19 (d),(e),(c) | 283,000 | 290,075 | ||||||||
10.50%, 03/01/21 (d),(e),(c) | 541,000 | 461,202 | ||||||||
|
| |||||||||
| 751,277 | ||||||||||
|
| |||||||||
Construction Materials Manufacturing — 0.0% | ||||||||||
NWH Escrow Corp., 7.50%, 08/01/21 (d),(e) | 280,000 | 263,200 | ||||||||
|
| |||||||||
Consumer Finance — 0.1% | ||||||||||
DFC Finance Corp., 10.50%, 06/15/20 (d),(e) | 1,017,000 | 795,803 | ||||||||
Springleaf Finance Corp., 5.25%, 12/15/19 (d),(c) | 263,000 | 260,041 | ||||||||
|
| |||||||||
| 1,055,844 | ||||||||||
|
| |||||||||
Consumer Services — 0.0% | ||||||||||
Quad/Graphics, Inc., 7.00%, 05/01/22 (d),(e),(a) | 233,000 | 224,263 | ||||||||
RR Donnelley & Sons Co., 6.00%, 04/01/24 (d),(a) | 50,000 | 51,625 | ||||||||
|
| |||||||||
| 275,888 | ||||||||||
|
| |||||||||
Containers & Packaging — 0.0% | ||||||||||
Owens-Brockway Glass Container, Inc., | ||||||||||
5.00%, 01/15/22 (d),(e),(c) | 60,000 | 61,119 | ||||||||
5.38%, 01/15/25 (d),(e),(c) | 60,000 | 61,650 | ||||||||
|
| |||||||||
| 122,769 | ||||||||||
|
| |||||||||
Entertainment Resources — 0.1% | ||||||||||
Mohegan Tribal Gaming Authority, PIK, 11.00%, 09/15/18 (d),(e),(c),(a) | 902,000 | 899,745 | ||||||||
|
| |||||||||
Exploration & Production — 0.1% | ||||||||||
Antero Resources Corp., 5.63%, 06/01/23 (d),(e),(c) | 140,000 | 138,775 | ||||||||
Newfield Exploration Co., 5.38%, 01/01/26 (d),(c) | 140,000 | 141,418 | ||||||||
Oasis Petroleum, Inc., 6.50%, 11/01/21 (d),(c) | 345,000 | 329,475 | ||||||||
Rice Energy, Inc., 7.25%, 05/01/23 (d),(e) | 131,000 | 131,000 | ||||||||
|
| |||||||||
| 740,668 | ||||||||||
|
| |||||||||
Financial Services — 0.1% | ||||||||||
Harland Clarke Holdings Corp., 9.25%, 03/01/21 (d),(e) | 260,000 | 252,200 | ||||||||
See Notes to Consolidated Financial Statements.
160
Blackstone Alternative Multi-Strategy Fund and Subsidiaries
Consolidated Schedule of Investments (Continued)
March 31, 2015
Security Description | Principal Amount | Value | ||||||||
ROC Finance LLC / ROC Finance 1 Corp., 12.13%, 09/01/18 (d),(e),(a) | $ | 1,224,000 | $ | 1,282,140 | ||||||
|
| |||||||||
| 1,534,340 | ||||||||||
|
| |||||||||
Food & Beverage — 0.0% | ||||||||||
Dean Foods Co., 6.50%, 03/15/23 (d),(e) | 280,000 | 281,400 | ||||||||
Post Holdings, Inc., | ||||||||||
6.75%, 12/01/21 (d),(e),(c) | 50,000 | 50,500 | ||||||||
7.38%, 02/15/22 (d),(c) | 150,000 | 155,250 | ||||||||
|
| |||||||||
| 487,150 | ||||||||||
|
| |||||||||
Hardware — 0.0% | ||||||||||
Real Alloy Holding, Inc., 10.00%, 01/15/19 (d),(e) | 572,000 | 578,435 | ||||||||
|
| |||||||||
Health Care Facilities/Services — 0.2% | ||||||||||
inVentiv Health, Inc., 11.00%, 08/15/18 (d),(e),(j) | 756,500 | 726,240 | ||||||||
Kindred Escrow Corp. II, 8.00%, 01/15/20 (d),(e),(a) | 332,000 | 356,277 | ||||||||
Universal Hospital Services, Inc., | 1,062,000 | 929,250 | ||||||||
|
| |||||||||
| 2,011,767 | ||||||||||
|
| |||||||||
Home Improvement — 0.0% | ||||||||||
Apex Tool Group LLC, 7.00%, 02/01/21 (d),(e) | 130,000 | 122,200 | ||||||||
Empire Today LLC / Empire Today Finance Corp., 11.38%, 02/01/17 (d),(e) | 390,000 | 314,925 | ||||||||
|
| |||||||||
| 437,125 | ||||||||||
|
| |||||||||
Industrial Other — 0.0% | ||||||||||
Sabine Pass Liquefaction LLC, 5.63%, 03/01/25 (d),(e) | 350,000 | 345,625 | ||||||||
|
| |||||||||
Internet Media — 0.0% | ||||||||||
VeriSign, Inc., 5.25%, 04/01/25 (d),(e),(c) | 130,000 | 132,925 | ||||||||
|
| |||||||||
Machinery Manufacturing — 0.0% | ||||||||||
Renaissance Acquisition Corp., 6.88%, 08/15/21 (d),(e) | 130,000 | 117,975 | ||||||||
|
| |||||||||
Mass Merchants — 0.0% | ||||||||||
Family Tree Escrow LLC, 5.75%, 03/01/23 (d),(e) | 75,000 | 78,750 | ||||||||
|
| |||||||||
Metals & Mining — 0.1% | ||||||||||
AK Steel Corp., | ||||||||||
7.63%, 05/15/20 - 10/01/21 (d) | 1,070,000 | 894,900 | ||||||||
8.38%, 04/01/22 (d) | 15,000 | 12,375 | ||||||||
|
| |||||||||
| 907,275 | ||||||||||
|
| |||||||||
See Notes to Consolidated Financial Statements.
161
Blackstone Alternative Multi-Strategy Fund and Subsidiaries
Consolidated Schedule of Investments (Continued)
March 31, 2015
Security Description | Principal Amount | Value | ||||||||
Pharmaceuticals — 0.0% | ||||||||||
Endo Finance LLC / Endo Finco, Co., | $ | 140,000 | $ | 139,650 | ||||||
|
| |||||||||
Pipeline — 0.0% | ||||||||||
Crestwood Midstream Partners LP / Crestwood Midstream Finance Corp., 6.25%, 04/01/23 (d),(e) | 70,000 | 70,700 | ||||||||
|
| |||||||||
| 70,700 | ||||||||||
|
| |||||||||
Publishing & Broadcasting — 0.4% | ||||||||||
American Media, Inc., 11.50%, 12/15/17 (d),(a) | 1,250,000 | 1,275,000 | ||||||||
Knight Ridder, Inc., 5.75%, 09/01/17 (d) | 123,000 | 128,228 | ||||||||
LBI Media, Inc., | ||||||||||
10.00%, 04/15/19 (d),(e) | 233,000 | 242,902 | ||||||||
13.50%, 04/15/20 (d),(e) | 1,707,000 | 1,758,210 | ||||||||
Lee Enterprises, Inc., 9.50%, 03/15/22 (d),(e) | 797,000 | 822,902 | ||||||||
McClatchy Co., 9.00%, 12/15/22 (d),(c),(a) | 619,000 | 597,335 | ||||||||
|
| |||||||||
| 4,824,577 | ||||||||||
|
| |||||||||
Railroad — 0.0% | ||||||||||
Florida East Coast Holdings Corp., | 54,000 | 54,405 | ||||||||
|
| |||||||||
Real Estate — 0.0% | ||||||||||
Kennedy-Wilson, Inc., 5.88%, 04/01/24 (d) | 178,000 | 178,445 | ||||||||
|
| |||||||||
Retail—Consumer Discretionary — 0.3% | ||||||||||
Claire’s Stores, Inc., 9.00%, 03/15/19 (d),(e) | 639,000 | 579,893 | ||||||||
DriveTime Automotive Group, Inc. / DT Acceptance Corp., 8.00%, 06/01/21 (d),(e) | 2,539,000 | 2,418,397 | ||||||||
Netflix, Inc., 5.50%, 02/15/22 (d),(e),(c) | 140,000 | 143,150 | ||||||||
|
| |||||||||
| 3,141,440 | ||||||||||
|
| |||||||||
Software & Services — 0.1% | ||||||||||
iPayment, Inc., 9.50%, 12/15/19 (d),(e),(c) | 883,000 | 825,605 | ||||||||
|
| |||||||||
Supermarkets — 0.1% | ||||||||||
Rite Aid Corp., 6.13%, 04/01/23 (d),(e) | 455,000 | 466,375 | ||||||||
SUPERVALU, Inc., 7.75%, 11/15/22 (d),(c) | 210,000 | 223,650 | ||||||||
|
| |||||||||
| 690,025 | ||||||||||
|
| |||||||||
Transportation & Logistics — 0.0% | ||||||||||
XPO Logistics, Inc., 7.88%, 09/01/19 (d),(e) | 240,000 | 253,800 | ||||||||
|
| |||||||||
Utilities — 0.1% | ||||||||||
AES Corp., 5.50%, 04/15/25 (d) | 650,000 | 643,500 | ||||||||
|
| |||||||||
See Notes to Consolidated Financial Statements.
162
Blackstone Alternative Multi-Strategy Fund and Subsidiaries
Consolidated Schedule of Investments (Continued)
March 31, 2015
Security Description | Principal Amount | Value | ||||||||
Wireless Telecommunication Services — 0.2% | ||||||||||
Frontier Communications Corp., 6.88%, 01/15/25 (d) | $ | 764,000 | $ | 756,360 | ||||||
Sprint Communications, Inc., 6.00%, 11/15/22 (d),(a) | 394,000 | 374,300 | ||||||||
Sprint Corp., | ||||||||||
7.63%, 02/15/25 (d),(c) | 280,000 | 278,950 | ||||||||
7.88%, 09/15/23 (d) | 200,000 | 204,000 | ||||||||
Windstream Corp., | ||||||||||
6.38%, 08/01/23 (d),(c) | 420,000 | 378,760 | ||||||||
7.50%, 06/01/22 (d),(c) | 254,000 | 245,110 | ||||||||
7.75%, 10/01/21 (d),(c) | 173,000 | 172,308 | ||||||||
|
| |||||||||
| 2,409,788 | ||||||||||
|
| |||||||||
Total United States | 28,949,471 | |||||||||
|
| |||||||||
Venezuela — 0.3% | ||||||||||
Integrated Oils — 0.3% | ||||||||||
Petroleos de Venezuela SA REG S, 6.00%, 05/16/24 - 11/15/26 (d) | 11,486,000 | 3,615,601 | ||||||||
|
| |||||||||
Total Venezuela | 3,615,601 | |||||||||
|
| |||||||||
TOTAL CORPORATE BONDS & NOTES | 46,370,994 | |||||||||
|
| |||||||||
SOVEREIGN DEBT — 2.3% | ||||||||||
Argentina Boden Bonds, 7.00%, 10/03/15 (d) | 5,345,000 | 4,996,981 | ||||||||
Argentina Bonar Bonds, 7.00%, 04/17/17 (d) | 3,442,000 | 3,237,583 | ||||||||
Argentine Republic Government International Bond, 12/31/33 (a),(b),(h),(k) | 3,418,169 | 3,349,122 | ||||||||
Ecuador Government International Bond REG S, 10.50%, 03/24/20 | 2,585,000 | 2,591,462 | ||||||||
Hellenic Republic Government Bond, 3.00%, 02/24/24 - 02/24/42 (j) | 2,304,000 | EUR | 1,215,415 | |||||||
Hellenic Republic Government Bond REG S, 3.00%, 02/24/23 - 02/24/32 (j) | 256,000 | EUR | 142,881 | |||||||
Hungary Government International Bond, 5.38%, 03/25/24 (d) | $ | 1,604,000 | 1,798,485 | |||||||
Pakistan Government International Bond REG S, 6.75%, 12/03/19 (a),(d),(k) | 3,007,000 | 3,057,133 | ||||||||
Portugal Obrigacoes do Tesouro OT REG S, 4.10%, 02/15/45 (e) | 2,573,000 | EUR | 3,734,216 | |||||||
Republic of Iraq REG S, 5.80%, 01/15/28 (d) | $ | 4,165,000 | 3,477,775 | |||||||
|
| |||||||||
TOTAL SOVEREIGN DEBT | 27,601,053 | |||||||||
|
| |||||||||
See Notes to Consolidated Financial Statements.
163
Blackstone Alternative Multi-Strategy Fund and Subsidiaries
Consolidated Schedule of Investments (Continued)
March 31, 2015
Security Description | Principal Amount | Value | ||||||||
MORTGAGE-BACKED SECURITIES — 17.7% | ||||||||||
Cayman Islands — 1.6% | ||||||||||
Collateralized Debt Obligation (Commercial) — 1.5% | ||||||||||
Gramercy Real Estate CDO Ltd., | ||||||||||
Series 2006-1A, Class B, 0.63%, 07/25/41 (d),(e),(f) | $ | 3,000,000 | $ | 2,898,900 | ||||||
Series 2007-1A, Class A1, 0.54%, 08/15/56 (d),(e),(f) | 545,395 | 485,728 | ||||||||
N-Star REL CDO IV Ltd., Series 2005-4A, Class C, 0.93%, 07/27/40 (d),(e),(f) | 2,546,000 | 2,481,077 | ||||||||
N-Star REL CDO VI Ltd., Series 2006-6A, Class B, 0.71%, 06/16/41 (d),(e),(f) | 3,718,000 | 3,133,530 | ||||||||
Resource Capital Corp. Ltd., | ||||||||||
Series 2014-CRE2, Class B, | 300,000 | 296,670 | ||||||||
Series 2015-CRE3, Class D, | 1,500,000 | 1,500,000 | ||||||||
SRERS Funding Ltd., Series 2011-RS, Class A1B1, 0.43%, 05/09/46 (d),(e),(f) | 7,433,322 | 7,189,509 | ||||||||
|
| |||||||||
| 17,985,414 | ||||||||||
|
| |||||||||
Commercial Mortgage-Backed Securities — 0.1% | ||||||||||
PFP III Ltd., Series 2014-1, Class D, 4.27%, 06/14/31 (d),(e),(f) | 1,000,000 | 1,003,000 | ||||||||
|
| |||||||||
Total Cayman Islands | 18,988,414 | |||||||||
|
| |||||||||
United States — 16.1% | ||||||||||
Collateralized Debt Obligation (Commercial) — 0.1% | ||||||||||
Arbor Realty Mortgage Securities LLC, Series 2006-1A, Class A2, 0.57%, 01/26/42 (a),(d),(e),(f),(k) | 876,071 | 859,163 | ||||||||
|
| |||||||||
Collateralized Mortgage Obligation (Residential) — 8.4% |
| |||||||||
Banc of America Funding Corp., Series 2006-A, Class 3A2, 2.77%, 02/20/36 (d),(f) | 3,270,610 | 2,730,960 | ||||||||
Banc of America Funding Trust, Series 2007-B, Class A1, 0.39%, 04/20/47 (d),(f) | 3,250,713 | 2,443,561 | ||||||||
Chase Mortgage Finance Trust, Series 2007-A2, Class 3A2, 2.56%, 07/25/37 (d),(f) | 328,412 | 311,959 | ||||||||
CHL Mortgage Pass-Through Trust, Series 2005-HYB3, Class 3A2, 2.45%, 06/20/35 (d),(f) | 3,563,444 | 3,420,906 | ||||||||
Citicorp Mortgage Securities Trust, | ||||||||||
Series 2006-3, Class 1A10, 6.25%, 06/25/36 (d) | 780,666 | 802,524 | ||||||||
Series 2007-1, Class 1A3, 5.75%, 01/25/37 (d) | 240,079 | 244,040 | ||||||||
See Notes to Consolidated Financial Statements.
164
Blackstone Alternative Multi-Strategy Fund and Subsidiaries
Consolidated Schedule of Investments (Continued)
March 31, 2015
Security Description | Principal Amount | Value | ||||||||
Citigroup Mortgage Loan Trust, Inc., Series 2005-3, Class 2A2, 2.57%, 08/25/35 (d),(f) | $ | 4,074,528 | $ | 3,853,281 | ||||||
Connecticut Avenue Securities, | ||||||||||
Series 2014-C02, Class 1M2, 2.77%, 05/25/24 (a),(d),(f),(k) | 2,302,501 | 2,104,256 | ||||||||
Series 2014-C03, Class 1M2, 3.17%, 07/25/24 (a),(d),(f),(k) | 3,375,184 | 3,175,711 | ||||||||
Series 2014-C03, Class 2M2, 3.07%, 07/25/24 (a),(d),(f),(k) | 7,658,522 | 7,155,357 | ||||||||
Series 2014-C04, Class 2M2, 5.17%, 11/25/24 (d),(f) | 634,580 | 666,182 | ||||||||
Series 2015-C01, Class 1M2, 4.47%, 02/25/25 (a),(d),(f),(k) | 7,994,418 | 8,135,120 | ||||||||
Series 2015-C01, Class 2M2, 4.72%, 02/25/25 (d),(f) | 10,951,257 | 11,188,899 | ||||||||
Countrywide Alternative Loan Trust, | ||||||||||
Series 2005-21CB, Class A17 SEQ, 6.00%, 06/25/35 (d) | 632,878 | 639,967 | ||||||||
Series 2005-J2, Class 1A5, 0.67%, 04/25/35 (d),(f) | 659,041 | 584,240 | ||||||||
Countrywide Asset-Backed Certificates, | ||||||||||
Series 2005-15, Class 1AF6, 4.57%, 04/25/36 (d),(f) | 185,401 | 189,127 | ||||||||
Series 2006-BC4, Class 2A2, 0.33%, 11/25/36 (d),(f) | 641,531 | 596,431 | ||||||||
First Horizon Alternative Mortgage Securities Trust, Series 2005-AA9, Class 3A1, 2.28%, 11/25/35 (d),(f) | 4,279,263 | 3,605,279 | ||||||||
JP Morgan Alternative Loan Trust, | ||||||||||
Series 2005-A2, Class 1A1, 0.69%, 01/25/36 (d),(f) | 909,897 | 842,837 | ||||||||
Series 2006-S4, Class A3A, 5.78%, 12/25/36 (d),(f),(j) | 154,129 | 145,421 | ||||||||
Morgan Stanley Mortgage Loan Trust, Series 2005-11AR, Class A1, 0.45%, 01/25/36 (d),(f) | 3,043,094 | 2,298,144 | ||||||||
RALI Trust, Series 2005-QA13, Class 2A1, 3.55%, 12/25/35 (d),(f) | 6,795,398 | 5,850,838 | ||||||||
Structured Adjustable Rate Mortgage Loan Trust, Series 2006-4, Class 6A, 4.80%, 05/25/36 (d),(f) | 2,274,656 | 1,914,123 | ||||||||
Structured Agency Credit Risk, | ||||||||||
Series 2013-DN2, Class M2, 4.42%, 11/25/23 (a),(d),(f),(k) | 4,897,650 | 5,034,295 | ||||||||
Series 2014-DN1, Class M3, 4.67%, 02/25/24 (d),(f) | 2,013,142 | 2,093,064 | ||||||||
Series 2014-DN3, Class M2, 2.57%, 08/25/24 (d),(f) | 800,000 | 809,760 | ||||||||
Series 2014-DN4, Class M3, 4.72%, 10/25/24 (d),(f) | 1,533,624 | 1,585,767 | ||||||||
See Notes to Consolidated Financial Statements.
165
Blackstone Alternative Multi-Strategy Fund and Subsidiaries
Consolidated Schedule of Investments (Continued)
March 31, 2015
Security Description | Principal Amount | Value | ||||||||
Series 2014-HQ1, Class M2, 2.67%, 08/25/24 (d),(f) | $ | 2,400,000 | $ | 2,417,520 | ||||||
Series 2014-HQ2, Class M3, 3.92%, 09/25/24 (a),(d),(f),(k) | 1,381,835 | 1,349,777 | ||||||||
Series 2015-DN1, Class M3, 4.32%, 01/25/25 (d),(f) | 2,960,542 | 3,040,477 | ||||||||
Series 2015-HQ1, Class M3, 3.97%, 03/25/25 (d),(f) | 1,853,958 | 1,865,823 | ||||||||
WaMu Mortgage Pass-Through Certificates, Series 2006-AR17, Class 1A, 0.94%, 12/25/46 (d),(f) | 6,161,225 | 4,990,593 | ||||||||
WaMu Mortgage Pass-Through Certificates Trust, | ||||||||||
Series 2006-AR12, Class 1A2, 2.26%, 10/25/36 (d),(f) | 3,289,218 | 2,970,164 | ||||||||
Series 2006-AR18, Class 1A1, 1.78%, 01/25/37 (d),(f) | 3,285,561 | 2,856,138 | ||||||||
Series 2007-HY6, Class 2A3, 2.15%, 06/25/37 (d),(f) | 2,720,244 | 2,418,297 | ||||||||
Series 2007-OA6, Class 1A, 0.94%, 07/25/47 (d),(f) | 7,918,175 | 6,770,040 | ||||||||
Wells Fargo Mortgage Backed Securities Trust, Series 2007-10, Class 2A5, 6.25%, 07/25/37 (d) | 271,833 | 277,623 | ||||||||
Wells Fargo Mortgage-Backed Securities Trust, Series 2005-9, Class 1A12, 5.50%, 10/25/35 (d) | 274,035 | 279,516 | ||||||||
|
| |||||||||
| 101,658,017 | ||||||||||
|
| |||||||||
Commercial Mortgage-Backed Securities — 7.1% | ||||||||||
BAMLL Commercial Mortgage Securities Trust, | ||||||||||
Series 2013-DSNY, Class F, 3.68%, 09/15/26 (d),(e),(f) | 1,000,000 | 1,002,800 | ||||||||
Series 2014-ICTS, Class E, 3.12%, 06/15/28 (d),(e),(f) | 900,000 | 896,580 | ||||||||
Series 2014-INLD, Class D, 3.67%, 12/15/29 (d),(e),(f) | 1,500,000 | 1,506,450 | ||||||||
BAMLL Mezzanine Securities Trust, | 19,075,000 | 19,084,537 | ||||||||
Banc of America Commercial Mortgage Trust, Series 2007-2, Class AJ, 5.60%, 04/10/49 (a),(d),(f),(k) | 1,104,671 | 1,114,613 | ||||||||
BBCMS Trust, Series 2014-BXO, Class E, 2.73%, 08/15/27 (d),(e),(f) | 1,000,000 | 1,002,800 | ||||||||
Bear Stearns Commercial Mortgage Securities Trust, | ||||||||||
Series 2005-PW10, Class AJ, 5.45%, 12/11/40 (a),(d),(f),(k) | 4,111,209 | 4,080,786 | ||||||||
Series 2006-PW14, Class B, 5.33%, 12/11/38 (d),(e) | 55,000 | 50,760 | ||||||||
See Notes to Consolidated Financial Statements.
166
Blackstone Alternative Multi-Strategy Fund and Subsidiaries
Consolidated Schedule of Investments (Continued)
March 31, 2015
Security Description | Principal Amount | Value | ||||||||
Series 2007-PW15, Class AM SEQ, 5.36%, 02/11/44 (a),(d),(k) | $ | 1,685,218 | $ | 1,746,897 | ||||||
Series 2007-PW15, Class AMFX SEQ, 5.36%, 02/11/44 (e) | 590,553 | 613,053 | ||||||||
CD Commercial Mortgage Trust, Series 2007-CD4, Class AJ, 5.40%, 12/11/49 (a),(d),(f),(k) | 1,795,000 | 1,521,622 | ||||||||
CDGJ Commercial Mortgage Trust, Series 2014-BXCH, Class DPB, 4.02%, 12/15/27 (d),(e),(f) | 3,000,000 | 3,012,000 | ||||||||
CGBAM Commercial Mortgage Trust, Series 2014-HD, Class E, 3.17%, 02/15/31 (a),(d),(e),(f),(k) | 900,000 | 895,230 | ||||||||
Citigroup Commercial Mortgage Trust, Series 2006-C5, Class AJ SEQ, 5.48%, 10/15/49 (d) | 1,123,671 | 1,115,356 | ||||||||
COBALT CMBS Commercial Mortgage Trust, | ||||||||||
Series 2006-C1, Class AM SEQ, 5.25%, 08/15/48 (d) | 2,073,946 | 2,135,127 | ||||||||
Series 2007-C3, Class C, 5.76%, 05/15/46 (d),(f) | 32,000 | 28,755 | ||||||||
COMM 2007-C9 Mortgage Trust, Series 2007-C9, Class G, 5.80%, 12/10/49 (d),(e),(f) | 800,000 | 797,360 | ||||||||
Commercial Mortgage Loan Trust, Series 2008-LS1, Class AM, 6.03%, 12/10/49 (a),(d),(f),(k) | 1,689,146 | 1,735,935 | ||||||||
Commercial Mortgage Trust, Series 2014-PAT, Class E, 3.33%, 08/13/27 (d),(e),(f) | 1,800,000 | 1,805,400 | ||||||||
Credi Suisse Commercial Mortgage Trust, | 412,274 | 425,508 | ||||||||
Credit Suisse Commercial Mortgage Trust, | ||||||||||
Series 2007-C1, Class AMFX, 5.42%, 02/15/40 (a),(d),(k) | 1,026,902 | 1,059,044 | ||||||||
Series 2007-C5, Class A1AM, 5.87%, 09/15/40 (a),(d),(f),(k) | 686,943 | 706,315 | ||||||||
Series 2007-C5, Class AM, 5.87%, 09/15/40 (a),(d),(f),(k) | 718,641 | 745,015 | ||||||||
Credit Suisse Commercial Mortgage Trust Series, Series 2006-C5, Class AJ SEQ, 5.37%, 12/15/39 (d),(a) | 1,025,657 | 1,000,836 | ||||||||
Credit Suisse Mortgage Trust, | ||||||||||
Series 2006-C4, Class AJ, 5.54%, 09/15/39 (d),(f) | 3,014,337 | 3,050,509 | ||||||||
Series 2007-C1, Class AMFL, 0.37%, 02/15/40 (d),(f) | 32,000 | 28,803 | ||||||||
GCCFC Commercial Mortgage Trust, | ||||||||||
Series 2007-GG11, Class AJ, 6.02%, 12/10/49 (d),(f) | 900,000 | 945,990 | ||||||||
Series 2007-GG9, Class AJ, 5.51%, 03/10/39 (d),(f),(a) | 1,041,284 | 991,511 | ||||||||
GS Mortgage Securities Corp. III, Series 2005-GG4, Class D, 4.94%, 07/10/39 (d),(f) | 197,000 | 193,769 | ||||||||
See Notes to Consolidated Financial Statements.
167
Blackstone Alternative Multi-Strategy Fund and Subsidiaries
Consolidated Schedule of Investments (Continued)
March 31, 2015
Security Description | Principal Amount | Value | ||||||||
GS Mortgage Securities Trust, | ||||||||||
Series 2006-GG6, Class D, 5.55%, 04/10/38 (a),(d),(f),(k) | $ | 1,750,000 | $ | 1,720,950 | ||||||
Series 2007-GG10, Class AM, 5.80%, 08/10/45 (a),(d),(f),(k) | 2,139,288 | 2,201,755 | ||||||||
Hilton Mortgage Trust, Series 2014-ORL, Class F, 3.92%, 07/15/29 (e),(f) | 899,972 | 873,423 | ||||||||
Hilton USA Trust, | ||||||||||
Series 2013-HLF, Class EFL, 3.92%, 11/05/30 (d),(e),(f) | 2,020,203 | 2,020,203 | ||||||||
Series 2014-ORL, Class E, 3.42%, 07/15/29 (d),(e),(f) | 280,000 | 280,000 | ||||||||
Irvine Core Office Trust, Series 2013-IRV, Class F, 3.17%, 05/15/48 (e),(f) | 236,133 | 193,936 | ||||||||
JP Morgan Chase Commercial Mortgage Securities Trust, | ||||||||||
Series 2005-CB13, Class AJ, 5.33%, 01/12/43 (d),(f) | 3,306,000 | 3,250,129 | ||||||||
Series 2006-CB15, Class AM, 5.86%, 06/12/43 (d),(f) | 675,352 | 690,142 | ||||||||
Series 2007-LD11, Class AM, 5.78%, 06/15/49 (a),(d),(f),(k) | 1,870,325 | 1,966,647 | ||||||||
Series 2013-JWRZ, Class E, 3.91%, 04/15/30 (d),(e),(f) | 1,000,000 | 1,001,300 | ||||||||
Series 2014-FL5, Class D, 3.67%, 07/15/31 (d),(e),(f) | 5,625,000 | 5,605,875 | ||||||||
Merrill Lynch Mortgage Trust, Series 2007-C1, Class AM, 5.84%, 06/12/50 (a),(d),(f),(k) | 1,781,294 | 1,856,286 | ||||||||
ML-CFC Commercial Mortgage Trust, Series 2007-8, Class AMA, 5.87%, 08/12/49 (a),(d),(f),(k) | 2,278,473 | 2,351,612 | ||||||||
Morgan Stanley Bank of America Merrill Lynch Trust, Series 2015-C21, Class D, 4.16%, 03/15/48 (d),(e),(f) | 1,290,000 | 1,179,060 | ||||||||
Morgan Stanley Capital I Trust, | ||||||||||
Series 2007-HQ13, Class AM, 5.93%, 12/15/44 (d),(f) | 195,040 | 200,267 | ||||||||
Series 2007-IQ14, Class AM SEQ, 5.65%, 04/15/49 (a),(d),(f),(k) | 905,382 | 951,104 | ||||||||
Series 2007-IQ16, Class AJFX, 6.13%, 12/12/49 (a),(d),(f) | 1,205,463 | 1,180,148 | ||||||||
Series 2007-T25, Class AJ, 5.57%, 11/12/49 (d),(f) | 1,800,000 | 1,839,240 | ||||||||
Wachovia Bank Commercial Mortgage Trust, | ||||||||||
Series 2005-C22, Class B, 5.36%, 12/15/44 (d),(f) | 422,753 | 421,358 | ||||||||
Series 2005-C22, Class C, 5.36%, 12/15/44 (d),(f) | 99,000 | 94,298 | ||||||||
Wells Fargo Commercial Mortgage Trust, | ||||||||||
Series 2015-C27, Class D, 3.77%, 02/15/48 (d),(e) | 1,505,000 | 1,302,879 | ||||||||
See Notes to Consolidated Financial Statements.
168
Blackstone Alternative Multi-Strategy Fund and Subsidiaries
Consolidated Schedule of Investments (Continued)
March 31, 2015
Security Description | Principal Amount | Value | ||||||||
Series 2015-LC20, Class D, 4.51%, 04/15/50 (d),(f) | $ | 1,740,000 | $ | 1,590,882 | ||||||
|
| |||||||||
| 86,064,855 | ||||||||||
|
| |||||||||
Interest Only Commercial Mortgage-Backed Securities — 0.5% | ||||||||||
Commercial Mortgage Trust, | ||||||||||
Series 2014-CR18, Class XA, | 10,517,847 | 809,874 | ||||||||
Series 2014-LC17, Class XA, | 1,999,543 | 118,173 | ||||||||
Series 2014-UBS4, Class XA, 1.29%, 08/10/47 (a),(d),(f),(k) | 21,202,920 | 1,708,955 | ||||||||
Series 2014-UBS5, Class XA, | 4,121,648 | 276,150 | ||||||||
CSAIL Commercial Mortgage Trust, Series 2015-C1, Class XA, 1.12%, 04/15/50 (d),(f) | 5,545,000 | 388,705 | ||||||||
GS Mortgage Securities Trust, Series 2014-GC24, Class XA, 0.90%, 09/10/47 (d),(f) | 14,279,135 | 842,469 | ||||||||
JPMBB Commercial Mortgage Securities Trust, | ||||||||||
Series 2014-C21, Class XA, 1.13%, 08/15/47 (d),(f) | 2,500,596 | 193,296 | ||||||||
Series 2014-C22, Class XA, 0.99%, 09/15/47 (d),(f) | 2,819,195 | 189,168 | ||||||||
Morgan Stanley Bank of America Merrill Lynch Trust, | ||||||||||
Series 2014-C17, Class XA, 1.28%, 08/15/47 (d),(f) | 4,896,630 | 377,530 | ||||||||
Series 2014-C19, Class XA, 1.17%, 12/15/47 (d),(f) | 12,930,105 | 958,121 | ||||||||
WFRBS Commercial Mortgage Trust, Series 2014-C22, Class XA, 0.97%, 09/15/57 (d),(f) | 1,878,039 | 121,697 | ||||||||
|
| |||||||||
| 5,984,138 | ||||||||||
|
| |||||||||
Total United States | 194,566,173 | |||||||||
|
| |||||||||
TOTAL MORTGAGE-BACKED SECURITIES | 213,554,587 | |||||||||
|
| |||||||||
U.S. GOVERNMENT SPONSORED AGENCY SECURITIES — 1.0% |
| |||||||||
United States — 1.0% | ||||||||||
Interest Only Collateralized Mortgage Obligations (Residential) — 0.5% | ||||||||||
Federal Home Loan Mortgage Corp., Series 4123, Class IP, 4.50%, 07/15/42 (d) | 16,961,694 | 3,692,561 | ||||||||
Federal National Mortgage Association, | ||||||||||
Series 2012-12, Class PI, 4.50%, 08/25/40 (d) | 6,249,438 | 1,080,528 | ||||||||
Series 2012-144, Class SD, 5.93%, 01/25/43 (d),(f) | 4,773,450 | 1,138,467 | ||||||||
|
| |||||||||
| 5,911,556 | ||||||||||
|
| |||||||||
Inverse Interest Only Collateralized Mortgage Obligations (Residential) — 0.5% |
| |||||||||
Federal Home Loan Mortgage Corp., Series 4132, Class ES, 5.98%, 11/15/42 (d),(f) | 9,210,730 | 2,159,916 | ||||||||
See Notes to Consolidated Financial Statements.
169
Blackstone Alternative Multi-Strategy Fund and Subsidiaries
Consolidated Schedule of Investments (Continued)
March 31, 2015
Security Description | Principal Amount | Value | ||||||||
Federal National Mortgage Association, | ||||||||||
Series 2012-111, Class ES, 5.98%, 12/25/41 (d),(f) | $ | 9,676,148 | $ | 1,805,569 | ||||||
Series 2012-55, Class ID, 4.50%, 05/25/42 (d) | 7,132,066 | 1,467,066 | ||||||||
Series 2014-73, Class AS, 5.88%, 11/25/44 (d),(f) | 1,521,480 | 398,932 | ||||||||
Government National Mortgage Association, | ||||||||||
Series 2009-101, Class SB, 6.27%, 08/20/39 (d),(f) | 1,101,924 | 174,435 | ||||||||
Series 2011-56, Class SI, 6.47%, 04/20/41 (d),(f) | 962,612 | 185,014 | ||||||||
|
| |||||||||
| 6,190,932 | ||||||||||
|
| |||||||||
Total United States | 12,102,488 | |||||||||
|
| |||||||||
TOTAL U.S. GOVERNMENT SPONSORED AGENCY SECURITIES |
| 12,102,488 | ||||||||
|
| |||||||||
Security Description | Shares | Value | ||||||||
EXCHANGE-TRADED FUNDS — 0.1% | ||||||||||
Financial Select Sector SPDR Fund (d) | 5,691 | 137,210 | ||||||||
iShares China Large-Cap ETF (d) | 1,634 | 72,631 | ||||||||
iShares MSCI Japan ETF (d) | 29,170 | 365,500 | ||||||||
iShares MSCI Taiwan ETF | 3,616 | 56,916 | ||||||||
iShares Russell 2000 ETF (d) | 3,227 | 401,278 | ||||||||
|
| |||||||||
TOTAL EXCHANGE-TRADED FUND | 1,033,535 | |||||||||
|
| |||||||||
INVESTMENT IN INVESTEE FUND — 0.0% | ||||||||||
Channel Islands — 0.0% | ||||||||||
Pershing Square Holdings Ltd/Fund (b) | 8,000 | 212,000 | ||||||||
|
| |||||||||
TOTAL INVESTMENT IN INVESTEE FUND | 212,000 | |||||||||
|
| |||||||||
RIGHTS — 0.0% | ||||||||||
Sweden — 0.0% | ||||||||||
Com Hem Holding AB (b) | 9,620 | 111 | ||||||||
|
| |||||||||
TOTAL RIGHTS | 111 | |||||||||
|
| |||||||||
Security Description | Contracts | Value | ||||||||
PURCHASED OPTIONS — 0.4% | ||||||||||
Exchange-Traded Call Options — 0.3% | ||||||||||
American Realty Capital Property Strike Price 11.00 USD Expires 04/17/15 | 1,241 | 6,205 | ||||||||
Apple, Inc. Strike Price 125.00 USD Expires 05/01/15 | 585 | 267,345 | ||||||||
CBOE SPX Volatility Index Strike Price 15.00 USD Expires 04/15/15 | 209 | 36,575 | ||||||||
CBOE SPX Volatility Index Strike Price 17.00 USD Expires 06/17/15 | 418 | 114,950 | ||||||||
See Notes to Consolidated Financial Statements.
170
Blackstone Alternative Multi-Strategy Fund and Subsidiaries
Consolidated Schedule of Investments (Continued)
March 31, 2015
Security Description | Contracts | Value | ||||||||
CBOE SPX Volatility Index Strike Price 18.00 USD Expires 05/20/15 | 205 | $ | 39,975 | |||||||
DAX Index Strike Price 12,200.00 EUR Expires 04/17/15 | 20 | 11,430 | ||||||||
Facebook, Inc. Strike Price 80.00 USD Expires 01/15/16 | 129 | 129,387 | ||||||||
Facebook, Inc. Strike Price 60.00 USD Expires 01/15/16 | 372 | 911,400 | ||||||||
Imperial Tobacco Group PLC Strike Price 30.00 GBP Expires 04/17/15 | 16 | 18,987 | ||||||||
Imperial Tobacco Group PLC Strike Price 31.00 GBP Expires 04/17/15 | 10 | 7,269 | ||||||||
Imperial Tobacco Group PLC Strike Price 32.00 GBP Expires 04/17/15 | 40 | 17,356 | ||||||||
Imperial Tobacco Group PLC Strike Price 33.00 GBP Expires 05/15/15 | 14 | 6,023 | ||||||||
Lloyds Banking Group PLC Strike Price 82.00 GBP Expires 06/19/15 | 2,635 | 107,491 | ||||||||
S&P 500 Index Strike Price 2,150.00 USD Expires 05/15/15 | 12 | 5,880 | ||||||||
Smith & Nephew PLC Strike Price 12.50 GBP Expires 04/17/15 | 49 | 2,907 | ||||||||
Yahoo, Inc. Strike Price 35.00 USD Expires 01/15/16 | 1,064 | 1,181,040 | ||||||||
|
| |||||||||
| 2,864,220 | ||||||||||
|
| |||||||||
Exchange-Traded Put Options — 0.1% | ||||||||||
Euro Stoxx 50 Index Strike Price 3,200.00 EUR Expires 04/17/15 | 23 | 742 | ||||||||
Euro Stoxx 50 Index Strike Price 3,625.00 EUR Expires 05/15/15 | 15 | 13,967 | ||||||||
FTSE 100 Index Strike Price 6,950.00 GBP Expires 06/19/15 | 16 | 72,509 | ||||||||
iShares Russell 2000 ETF Strike Price 110.00 USD Expires 05/15/15 | 125 | 4,500 | ||||||||
iShares Russell 2000 ETF Strike Price 124.00 USD Expires 05/15/15 | 125 | 34,375 | ||||||||
S&P 500 Index Strike Price 2,000.00 USD Expires 04/17/15 | 45 | 36,000 | ||||||||
S&P 500 Index Strike Price 1,950.00 USD Expires 04/30/15 | 26 | 20,280 | ||||||||
S&P 500 Index Strike Price 2,025.00 USD Expires 04/17/15 | 22 | 26,730 | ||||||||
S&P 500 Index Strike Price 2,030.00 USD Expires 04/17/15 | 354 | 474,360 | ||||||||
S&P 500 Index Strike Price 1,850.00 USD Expires 06/19/15 | 83 | 117,030 | ||||||||
SPDR S&P 500 ETF Trust Strike Price 197.00 USD Expires 04/17/15 | 209 | 10,032 | ||||||||
See Notes to Consolidated Financial Statements.
171
Blackstone Alternative Multi-Strategy Fund and Subsidiaries
Consolidated Schedule of Investments (Continued)
March 31, 2015
Security Description | Contracts | Value | ||||||||
SPDR S&P 500 ETF Trust Strike Price 207.00 USD Expires 04/10/15 | 627 | $ | 144,210 | |||||||
SPDR S&P 500 ETF Trust Strike Price 207.00 USD Expires 04/17/15 | 209 | 56,848 | ||||||||
SPDR S&P 500 ETF Trust Strike Price 207.50 USD Expires 04/02/15 | 418 | 64,790 | ||||||||
SPDR S&P 500 ETF Trust Strike Price 188.00 USD Expires 05/15/15 | 334 | 23,380 | ||||||||
SPDR S&P 500 ETF Trust Strike Price 203.00 USD Expires 05/15/15 | 334 | 101,202 | ||||||||
|
| |||||||||
| 1,200,955 | ||||||||||
|
| |||||||||
Security Description | Notional Amount | Value | ||||||||
FX OTC Call Options — 0.0% | ||||||||||
USD/CNH Currency Strike Price 6.40 CNH Expires 11/06/17 Counterparty Morgan Stanley Capital Services LLC | 4,620,000 | USD | 256,736 | |||||||
USD/JPY Currency Strike Price 124.00 JPY Expires 01/12/16 Counterparty Morgan Stanley Capital Services LLC | 3,170,000 | USD | 64,800 | |||||||
|
| |||||||||
| 321,536 | ||||||||||
|
| |||||||||
FX OTC Put Options — 0.0% | ||||||||||
EUR/USD Currency Strike Price 1.05 USD Expires 06/30/15 Counterparty JPMorgan Chase Bank, N.A. | 4,659,072 | EUR | 74,501 | |||||||
|
| |||||||||
Security Description | Contracts | Value | ||||||||
OTC Put Options — 0.0% | ||||||||||
BSK.KE Strike Price 2,950.00 USD Expires 06/19/15 Counterparty Credit Suisse International | 648 | 4,454 | ||||||||
BSK/KE Strike Price 3,050.00 USD Expires 04/17/15 Counterparty Credit Suisse International | 648 | 140 | ||||||||
Financial Select Sector SPDR Fund Strike Price 21.90 USD Expires 06/17/15 Counterparty Morgan Stanley & Co. International plc | 355,800 | 89,411 | ||||||||
iShares Russell 2000 Index Strike Price 107.95 USD Expires 06/19/15 Counterparty JPMorgan Chase Bank, N.A. | 45,010 | 36,146 | ||||||||
iShares Trust Strike Price 111.00 USD Expires 09/18/15 Counterparty Morgan Stanley & Co. International plc | 45,500 | 97,503 | ||||||||
See Notes to Consolidated Financial Statements.
172
Blackstone Alternative Multi-Strategy Fund and Subsidiaries
Consolidated Schedule of Investments (Continued)
March 31, 2015
Security Description | Contracts | Value | ||||||||
KOSPI 200 Index Strike Price 232.83 KRW Expires 09/10/15 Counterparty JPMorgan Chase Bank N.A. | 25,128,206 | $ | 39,841 | |||||||
|
| |||||||||
| 267,495 | ||||||||||
|
| |||||||||
TOTAL PURCHASED OPTIONS | 4,728,707 | |||||||||
|
| |||||||||
TOTAL INVESTMENTS IN SECURITIES — 76.1% | 919,911,206 | |||||||||
|
| |||||||||
TOTAL SECURITIES SOLD SHORT— (21.7)% | (262,301,315 | ) | ||||||||
|
| |||||||||
Other Assets (l) — 45.6% | 551,942,427 | |||||||||
|
| |||||||||
Net Assets — 100.0% | $ | 1,209,552,318 | ||||||||
|
| |||||||||
Security Description | Shares | Value | ||||||||
SECURITIES SOLD SHORT — (21.7)% | ||||||||||
COMMON STOCK — (18.1)% | ||||||||||
Argentina — (0.0)% | ||||||||||
Gaming, Lodging & Restaurants — (0.0)% | ||||||||||
Arcos Dorados Holdings, Inc. A Shares (d) | 5,900 | (29,087 | ) | |||||||
|
| |||||||||
Total Argentina | (29,087 | ) | ||||||||
|
| |||||||||
Australia — (0.1)% | ||||||||||
Banking — (0.0)% | ||||||||||
Westpac Banking Corp. ADR (d) | 2,200 | (65,802 | ) | |||||||
|
| |||||||||
Iron & Steel — (0.1)% | ||||||||||
BHP Billiton Ltd. ADR (d) | 18,900 | (878,283 | ) | |||||||
BHP Billiton PLC ADR (d) | 100 | (4,426 | ) | |||||||
|
| |||||||||
| (882,709 | ) | |||||||||
|
| |||||||||
Total Australia | (948,511 | ) | ||||||||
|
| |||||||||
Belgium — (0.1)% | ||||||||||
Consumer Products — (0.1)% | ||||||||||
Anheuser-Busch InBev NV ADR (d) | 9,900 | (1,206,909 | ) | |||||||
|
| |||||||||
Software — (0.0)% | ||||||||||
Materialise NV ADR (d) | 1,800 | (12,582 | ) | |||||||
|
| |||||||||
Total Belgium | (1,219,491 | ) | ||||||||
|
| |||||||||
Bermuda — (0.0)% | ||||||||||
Insurance — (0.0)% | ||||||||||
Montpelier Re Holdings Ltd. (d) | 9,800 | (376,712 | ) | |||||||
|
| |||||||||
See Notes to Consolidated Financial Statements.
173
Blackstone Alternative Multi-Strategy Fund and Subsidiaries
Consolidated Schedule of Investments (Continued)
March 31, 2015
Security Description | Shares | Value | ||||||||
Transportation & Logistics — (0.0)% | ||||||||||
Golar LNG Ltd. (d) | 18,700 | $ | (622,336 | ) | ||||||
Knightsbridge Shipping Ltd. (d) | 1,100 | (5,500 | ) | |||||||
|
| |||||||||
| (627,836 | ) | |||||||||
|
| |||||||||
Total Bermuda | (1,004,548 | ) | ||||||||
|
| |||||||||
Brazil — (0.1)% | ||||||||||
Banking — (0.0)% | ||||||||||
Banco Bradesco SA ADR (d) | 23,008 | (213,510 | ) | |||||||
Banco Santander Brasil SA ADR (d) | 6,300 | (27,783 | ) | |||||||
Itau Unibanco Holding SA ADR (d) | 5,800 | (64,148 | ) | |||||||
|
| |||||||||
| (305,441 | ) | |||||||||
|
| |||||||||
Chemicals — (0.0)% | ||||||||||
Braskem SA ADR (d) | 200 | (1,388 | ) | |||||||
|
| |||||||||
Consumer Products — (0.0)% | ||||||||||
AMBEV SA ADR (d) | 28,400 | (163,584 | ) | |||||||
BRF SA ADR (d) | 500 | (9,890 | ) | |||||||
|
| |||||||||
| (173,474 | ) | |||||||||
|
| |||||||||
Home & Office Products — (0.0)% | ||||||||||
Gafisa SA ADR (d) | 700 | (924 | ) | |||||||
|
| |||||||||
Iron & Steel — (0.0)% | ||||||||||
Cia Siderurgica Nacional SA ADR (d) | 71,000 | (119,280 | ) | |||||||
|
| |||||||||
Oil, Gas & Coal — (0.1)% | ||||||||||
Cosan Ltd. A Shares (d) | 3,800 | (24,054 | ) | |||||||
Petroleo Brasileiro SA ADR (d) | 197,800 | (1,188,778 | ) | |||||||
Ultrapar Participacoes SA ADR (d) | 500 | (10,100 | ) | |||||||
|
| |||||||||
| (1,222,932 | ) | |||||||||
|
| |||||||||
Passenger Transportation — (0.0)% | ||||||||||
Gol Linhas Aereas Inteligentes SA ADR (d) | 16,900 | (41,067 | ) | |||||||
|
| |||||||||
Telecommunications — (0.0)% | ||||||||||
Oi SA ADR (d) | 10,640 | (16,386 | ) | |||||||
|
| |||||||||
Total Brazil | (1,880,892 | ) | ||||||||
|
| |||||||||
Canada — (1.0)% | ||||||||||
Apparel & Textile Products — (0.0)% | ||||||||||
Gildan Activewear, Inc. (d) | 14,000 | (413,280 | ) | |||||||
|
| |||||||||
Automotive — (0.0)% | ||||||||||
Westport Innovations, Inc. (d) | 800 | (3,152 | ) | |||||||
|
| |||||||||
See Notes to Consolidated Financial Statements.
174
Blackstone Alternative Multi-Strategy Fund and Subsidiaries
Consolidated Schedule of Investments (Continued)
March 31, 2015
Security Description | Shares | Value | ||||||||
Banking — (0.4)% | ||||||||||
Bank of Montreal (d) | 6,700 | $ | (401,799 | ) | ||||||
Bank of Nova Scotia (d) | 6,800 | (341,564 | ) | |||||||
Canadian Imperial Bank of Commerce (d) | 3,100 | (224,750 | ) | |||||||
Royal Bank of Canada (d) | 34,126 | (2,054,215 | ) | |||||||
Royal Bank of Canada (d) | 10,500 | (633,780 | ) | |||||||
Toronto-Dominion Bank (d) | 25,615 | (1,096,356 | ) | |||||||
Toronto-Dominion Bank (d) | 12,500 | (535,625 | ) | |||||||
|
| |||||||||
| (5,288,089 | ) | |||||||||
|
| |||||||||
Biotechnology & Pharmaceuticals — (0.0)% |
| |||||||||
Tekmira Pharmaceuticals Corp. (d) | 2,700 | (47,142 | ) | |||||||
|
| |||||||||
Hardware — (0.0)% |
| |||||||||
Blackberry Ltd. | 500 | (4,465 | ) | |||||||
DragonWave, Inc. (d) | 100 | (55 | ) | |||||||
Sierra Wireless, Inc. | 500 | (16,545 | ) | |||||||
|
| |||||||||
| (21,065 | ) | |||||||||
|
| |||||||||
Industrial Services — (0.0)% |
| |||||||||
Ritchie Bros Auctioneers, Inc. (d) | 24,200 | (603,548 | ) | |||||||
|
| |||||||||
Insurance — (0.0)% |
| |||||||||
Manulife Financial Corp. (d) | 28,500 | (484,785 | ) | |||||||
|
| |||||||||
Iron & Steel — (0.0)% |
| |||||||||
Turquoise Hill Resources Ltd. (d) | 45,500 | (141,960 | ) | |||||||
|
| |||||||||
Medical Equipment/Devices — (0.0)% |
| |||||||||
Novadaq Technologies, Inc. (d) | 900 | (14,616 | ) | |||||||
|
| |||||||||
Metals & Mining — (0.1)% |
| |||||||||
Agnico Eagle Mines Ltd. (d) | 8,200 | (229,108 | ) | |||||||
B2GOLD Corp. (d) | 500 | (760 | ) | |||||||
Endeavour Silver Corp. (d) | 8,700 | (16,530 | ) | |||||||
First Majestic Silver Corp. (d) | 11,400 | (61,674 | ) | |||||||
Franco-Nevada Corp. (d) | 3,800 | (184,452 | ) | |||||||
Goldcorp, Inc. (d) | 6,200 | (112,344 | ) | |||||||
North American Palladium Ltd. (d) | 18,400 | (3,875 | ) | |||||||
NOVAGOLD Resources, Inc. (d) | 10,200 | (30,192 | ) | |||||||
Pan American Silver Corp. (d) | 6,600 | (57,882 | ) | |||||||
Primero Mining Corp. (d) | 10,600 | (36,358 | ) | |||||||
Sandstorm Gold Ltd. (d) | 700 | (2,296 | ) | |||||||
Seabridge Gold, Inc. (d) | 18,400 | (101,016 | ) | |||||||
|
| |||||||||
| (836,487 | ) | |||||||||
|
| |||||||||
See Notes to Consolidated Financial Statements.
175
Blackstone Alternative Multi-Strategy Fund and Subsidiaries
Consolidated Schedule of Investments (Continued)
March 31, 2015
Security Description | Shares | Value | ||||||||
Oil, Gas & Coal — (0.2)% | ||||||||||
Baytex Energy Corp. (d) | 13,400 | $ | (211,720 | ) | ||||||
Cenovus Energy, Inc. (d) | 4,300 | (72,584 | ) | |||||||
Crescent Point Energy Corp. | 900 | (20,106 | ) | |||||||
Enbridge, Inc. (d) | 11,700 | (567,450 | ) | |||||||
Encana Corp. | 2,800 | (31,220 | ) | |||||||
Enerplus Corp. (d) | 1,300 | (13,182 | ) | |||||||
Imperial Oil Ltd. (d) | 200 | (7,976 | ) | |||||||
Pembina Pipeline Corp. (d) | 1,200 | (37,992 | ) | |||||||
Pengrowth Energy Corp. (d) | 16,700 | (49,933 | ) | |||||||
Penn West Petroleum Ltd. (d) | 25,000 | (41,250 | ) | |||||||
Precision Drilling Corp. (d) | 11,900 | (75,446 | ) | |||||||
Talisman Energy, Inc. (d) | 75,200 | (577,536 | ) | |||||||
TransCanada Corp. (d) | 2,900 | (123,888 | ) | |||||||
|
| |||||||||
| (1,830,283 | ) | |||||||||
|
| |||||||||
Real Estate — (0.1)% | ||||||||||
Brookfield Asset Management, Inc. Class A (d) | 12,800 | (686,208 | ) | |||||||
|
| |||||||||
Renewable Energy — (0.0)% | ||||||||||
Ballard Power Systems, Inc. (d) | 9,600 | (20,160 | ) | |||||||
|
| |||||||||
Software — (0.0)% | ||||||||||
Open Text Corp. (d) | 7,800 | (412,542 | ) | |||||||
|
| |||||||||
Technology Services — (0.0)% | ||||||||||
CGI Group, Inc. Class A (d) | 5,700 | (241,965 | ) | |||||||
|
| |||||||||
Telecommunications — (0.1)% | ||||||||||
BCE, Inc. (d) | 14,200 | (601,512 | ) | |||||||
Rogers Communications, Inc. B Shares (d) | 200 | (6,696 | ) | |||||||
|
| |||||||||
| (608,208 | ) | |||||||||
|
| |||||||||
Transportation & Logistics — (0.1)% | ||||||||||
Canadian National Railway Co. (d) | 14,000 | (936,180 | ) | |||||||
Canadian Pacific Railway Ltd. (d) | 600 | (109,620 | ) | |||||||
|
| |||||||||
| (1,045,800 | ) | |||||||||
|
| |||||||||
Waste & Environmental Service Equipment & Facility — (0.0)% |
| |||||||||
Denison Mines Corp. (d) | 400 | (316 | ) | |||||||
|
| |||||||||
Total Canada | (12,699,606 | ) | ||||||||
|
| |||||||||
Cayman Islands — (0.0)% | ||||||||||
Biotechnology & Pharmaceuticals — (0.0)% | ||||||||||
Theravance Biopharma, Inc. (d) | 1,500 | (26,025 | ) | |||||||
|
| |||||||||
Total Cayman Islands | (26,025 | ) | ||||||||
|
| |||||||||
See Notes to Consolidated Financial Statements.
176
Blackstone Alternative Multi-Strategy Fund and Subsidiaries
Consolidated Schedule of Investments (Continued)
March 31, 2015
Security Description | Shares | Value | ||||||||
Chile — (0.0)% | ||||||||||
Consumer Products — (0.0)% | ||||||||||
Cia Cervecerias Unidas SA ADR | 100 | $ | (2,076 | ) | ||||||
|
| |||||||||
Passenger Transportation — (0.0)% | ||||||||||
Latam Airlines Group SA ADR (d) | 28,200 | (227,292 | ) | |||||||
|
| |||||||||
Retail—Consumer Staples — (0.0)% | ||||||||||
Cencosud SA ADR (d) | 300 | (2,109 | ) | |||||||
|
| |||||||||
Utilities — (0.0)% | ||||||||||
Empresa Nacional de Electricidad SA ADR | 100 | (4,505 | ) | |||||||
Enersis SA ADR (d) | 600 | (9,756 | ) | |||||||
|
| |||||||||
| (14,261 | ) | |||||||||
|
| |||||||||
Total Chile | (245,738 | ) | ||||||||
|
| |||||||||
China — (0.5)% | ||||||||||
Automotive — (0.0)% | ||||||||||
Kandi Technologies Group, Inc. (d) | 5,200 | (64,428 | ) | |||||||
|
| |||||||||
Consumer Services — (0.0)% | ||||||||||
Tarena International, Inc. ADR (d) | 400 | (3,892 | ) | |||||||
|
| |||||||||
Gaming, Lodging & Restaurants — (0.0)% | ||||||||||
500.com Ltd. Class A ADR (d) | 3,600 | (38,844 | ) | |||||||
|
| |||||||||
Media — (0.3)% | ||||||||||
58.com, Inc. ADR (d) | 3,400 | (179,792 | ) | |||||||
iDreamsky Technology Ltd. ADR (d) | 200 | (1,418 | ) | |||||||
Leju Holdings Ltd. ADR (d) | 100 | (796 | ) | |||||||
Qihoo 360 Technology Co. Ltd. ADR (d) | 34,500 | (1,766,400 | ) | |||||||
Qunar Cayman Islands Ltd. ADR (d) | 1,900 | (78,375 | ) | |||||||
SINA Corp. (d) | 9,200 | (295,872 | ) | |||||||
SouFun Holdings Ltd. ADR | 7,000 | (42,000 | ) | |||||||
Weibo Corp. ADR (d) | 7,400 | (95,386 | ) | |||||||
Xunlei Ltd. ADR (d) | 1,100 | (7,007 | ) | |||||||
Youku Tudou, Inc. ADR (d) | 65,600 | (820,000 | ) | |||||||
|
| |||||||||
| (3,287,046 | ) | |||||||||
|
| |||||||||
Oil, Gas & Coal — (0.0)% | ||||||||||
China Petroleum & Chemical Corp. ADR (d) | 500 | (39,845 | ) | |||||||
CNOOC Ltd. ADR (d) | 1,200 | (170,184 | ) | |||||||
PetroChina Co. Ltd. ADR (d) | 2,900 | (322,509 | ) | |||||||
Yanzhou Coal Mining Co. Ltd. ADR (d) | 700 | (5,852 | ) | |||||||
|
| |||||||||
| (538,390 | ) | |||||||||
|
| |||||||||
See Notes to Consolidated Financial Statements.
177
Blackstone Alternative Multi-Strategy Fund and Subsidiaries
Consolidated Schedule of Investments (Continued)
March 31, 2015
Security Description | Shares | Value | ||||||||
Renewable Energy — (0.0)% | ||||||||||
JinkoSolar Holding Co. Ltd. ADR (d) | 8,700 | $ | (223,068 | ) | ||||||
ReneSola Ltd. ADR (d) | 12,200 | (17,934 | ) | |||||||
Yingli Green Energy Holding Co. Ltd. ADR (d) | 23,600 | (43,660 | ) | |||||||
|
| |||||||||
| (284,662 | ) | |||||||||
|
| |||||||||
Retail Discretionary — (0.1)% | ||||||||||
Alibaba Group Holding Ltd. ADR (d) | 6,200 | (516,088 | ) | |||||||
E-Commerce China Dangdang, Inc. A Shares ADR | 100 | (955 | ) | |||||||
JD.com, Inc. ADR (d) | 26,600 | (781,508 | ) | |||||||
LightInTheBox Holding Co. Ltd. ADR (d) | 400 | (2,016 | ) | |||||||
|
| |||||||||
| (1,300,567 | ) | |||||||||
|
| |||||||||
Software — (0.0)% | ||||||||||
Momo, Inc. ADR | 200 | (2,120 | ) | |||||||
NQ Mobile, Inc. ADR (d) | 17,600 | (65,648 | ) | |||||||
|
| |||||||||
| (67,768 | ) | |||||||||
|
| |||||||||
Telecommunications — (0.1)% | ||||||||||
21Vianet Group, Inc. ADR (d) | 5,700 | (100,662 | ) | |||||||
China Mobile Ltd. ADR (d) | 7,400 | (481,222 | ) | |||||||
|
| |||||||||
| (581,884 | ) | |||||||||
|
| |||||||||
Total China | (6,167,481 | ) | ||||||||
|
| |||||||||
Colombia — (0.1)% | ||||||||||
Banking — (0.1)% | ||||||||||
Bancolombia SA ADR (d) | 14,700 | (578,151 | ) | |||||||
|
| |||||||||
Oil, Gas & Coal — (0.0)% | ||||||||||
Ecopetrol SA ADR (d) | 2,500 | (38,050 | ) | |||||||
|
| |||||||||
Passenger Transportation — (0.0)% | ||||||||||
Avianca Holdings SA ADR (d) | 5,500 | (62,260 | ) | |||||||
|
| |||||||||
Total Colombia | (678,461 | ) | ||||||||
|
| |||||||||
Cyprus — (0.0)% | ||||||||||
Oil, Gas & Coal — (0.0)% | ||||||||||
Ocean Rig UDW, Inc. (d) | 9,300 | (61,287 | ) | |||||||
|
| |||||||||
Total Cyprus | (61,287 | ) | ||||||||
|
| |||||||||
Denmark — (0.1)% | ||||||||||
Biotechnology & Pharmaceuticals — (0.1)% | ||||||||||
Novo Nordisk A/S ADR (d) | 4,500 | (240,255 | ) | |||||||
Novo Nordisk A/S B Shares (d) | 23,400 | (1,249,180 | ) | |||||||
|
| |||||||||
Total Denmark | (1,489,435 | ) | ||||||||
|
| |||||||||
See Notes to Consolidated Financial Statements.
178
Blackstone Alternative Multi-Strategy Fund and Subsidiaries
Consolidated Schedule of Investments (Continued)
March 31, 2015
Security Description | Shares | Value | ||||||||
Finland — (0.0)% | ||||||||||
Hardware — (0.0)% | ||||||||||
Nokia Oyj ADR (d) | 3,000 | $ | (22,740 | ) | ||||||
|
| |||||||||
Total Finland | (22,740 | ) | ||||||||
|
| |||||||||
Germany — (0.1)% | ||||||||||
Banking — (0.0)% | ||||||||||
Deutsche Bank AG (d) | 13,400 | (465,382 | ) | |||||||
|
| |||||||||
Software — (0.1)% | ||||||||||
SAP SE ADR (d) | 9,300 | (671,181 | ) | |||||||
|
| |||||||||
Total Germany | (1,136,563 | ) | ||||||||
|
| |||||||||
Greece — (0.0)% | ||||||||||
Oil, Gas & Coal — (0.0)% | ||||||||||
DryShips, Inc. (d) | 15,700 | (11,932 | ) | |||||||
|
| |||||||||
Transportation & Logistics — (0.0)% | ||||||||||
Diana Containerships, Inc. (d) | 200 | (492 | ) | |||||||
Navios Maritime Holdings, Inc. (d) | 3,900 | (16,302 | ) | |||||||
Star Bulk Carriers Corp. (d) | 1,700 | (6,171 | ) | |||||||
|
| |||||||||
| (22,965 | ) | |||||||||
|
| |||||||||
Total Greece | (34,897 | ) | ||||||||
|
| |||||||||
Hong Kong — (0.0)% | ||||||||||
Gaming, Lodging & Restaurants — (0.0)% | ||||||||||
Melco Crown Entertainment Ltd. ADR (d) | 19,300 | (414,178 | ) | |||||||
|
| |||||||||
Total Hong Kong | (414,178 | ) | ||||||||
|
| |||||||||
India — (0.0)% | ||||||||||
Banking — (0.0)% | ||||||||||
HDFC Bank Ltd. ADR (d) | 3,800 | (223,782 | ) | |||||||
|
| |||||||||
Technology Services — (0.0)% | ||||||||||
Wipro Ltd. ADR (d) | 800 | (10,656 | ) | |||||||
|
| |||||||||
Total India | (234,438 | ) | ||||||||
|
| |||||||||
Ireland — (0.0)% | ||||||||||
Biotechnology & Pharmaceuticals — (0.0)% | ||||||||||
Amarin Corp. PLC ADR (d) | 28,200 | (65,988 | ) | |||||||
|
| |||||||||
Insurance — (0.0)% | ||||||||||
XL Group PLC | 4,900 | (180,320 | ) | |||||||
|
| |||||||||
Total Ireland | (246,308 | ) | ||||||||
|
| |||||||||
See Notes to Consolidated Financial Statements.
179
Blackstone Alternative Multi-Strategy Fund and Subsidiaries
Consolidated Schedule of Investments (Continued)
March 31, 2015
Security Description | Shares | Value | ||||||||
Israel — (0.0)% | ||||||||||
Chemicals — (0.0)% | ||||||||||
Israel Chemicals Ltd. | 400 | $ | (2,836 | ) | ||||||
|
| |||||||||
Consumer Products — (0.0)% | ||||||||||
SodaStream International Ltd. (d) | 800 | (16,208 | ) | |||||||
|
| |||||||||
Semiconductors — (0.0)% | ||||||||||
Mellanox Technologies Ltd. (d) | 1,300 | (58,942 | ) | |||||||
|
| |||||||||
Total Israel | (77,986 | ) | ||||||||
|
| |||||||||
Japan — (0.1)% | ||||||||||
Automotive — (0.1)% | ||||||||||
Honda Motor Co. Ltd. ADR (d) | 4,800 | (157,248 | ) | |||||||
Toyota Motor Corp. ADR (d) | 1,000 | (139,890 | ) | |||||||
|
| |||||||||
| (297,138 | ) | |||||||||
|
| |||||||||
Hardware — (0.0)% | ||||||||||
Canon, Inc. ADR (d) | 2,300 | (81,351 | ) | |||||||
Nidec Corp. ADR | 100 | (1,672 | ) | |||||||
|
| |||||||||
| (83,023 | ) | |||||||||
|
| |||||||||
Institutional Financial Service — (0.0)% | ||||||||||
Nomura Holdings, Inc. ADR (d) | 1,500 | (8,805 | ) | |||||||
|
| |||||||||
Telecommunications — (0.0)% | ||||||||||
Nippon Telegraph & Telephone Corp. ADR (d) | 5,300 | (163,346 | ) | |||||||
NTT Docomo, Inc. ADR (d) | 3,200 | (55,776 | ) | |||||||
|
| |||||||||
| (219,122 | ) | |||||||||
|
| |||||||||
Total Japan | (608,088 | ) | ||||||||
|
| |||||||||
Luxembourg — (0.0)% | ||||||||||
Iron & Steel — (0.0)% | ||||||||||
ArcelorMittal | 9,800 | (92,316 | ) | |||||||
|
| |||||||||
Total Luxembourg | (92,316 | ) | ||||||||
|
| |||||||||
Mexico — (0.0)% | ||||||||||
Metals & Mining | ||||||||||
Southern Copper Corp. | 17,800 | (519,404 | ) | |||||||
|
| |||||||||
Total Mexico | (519,404 | ) | ||||||||
|
| |||||||||
Monaco — (0.1)% | ||||||||||
Transportation & Logistics — (0.1)% | ||||||||||
GasLog Ltd. (d) | 16,700 | (324,314 | ) | |||||||
Scorpio Tankers, Inc. (d) | 33,900 | (319,338 | ) | |||||||
|
| |||||||||
Total Monaco | (643,652 | ) | ||||||||
|
| |||||||||
See Notes to Consolidated Financial Statements.
180
Blackstone Alternative Multi-Strategy Fund and Subsidiaries
Consolidated Schedule of Investments (Continued)
March 31, 2015
Security Description | Shares | Value | ||||||||
Netherlands — (0.1)% | ||||||||||
Banking — (0.0)% | ||||||||||
ING Groep NV ADR (d) | 18,900 | $ | (276,129 | ) | ||||||
|
| |||||||||
Insurance — (0.0)% | ||||||||||
Aegon NV | 32 | (254 | ) | |||||||
|
| |||||||||
Semiconductors — (0.0)% | ||||||||||
ASML Holding NV New York Shares (d) | 2,300 | (232,369 | ) | |||||||
|
| |||||||||
Specialty Finance — (0.1)% | ||||||||||
AerCap Holdings NV (d) | 18,700 | (816,255 | ) | |||||||
|
| |||||||||
Telecommunications — (0.0)% | ||||||||||
VimpelCom Ltd. ADR (d) | 35,800 | (187,592 | ) | |||||||
|
| |||||||||
Total Netherlands | (1,512,599 | ) | ||||||||
|
| |||||||||
Norway — (0.1)% | ||||||||||
Oil, Gas & Coal — (0.0)% | ||||||||||
Seadrill Ltd. (d) | 14,400 | (134,640 | ) | |||||||
|
| |||||||||
Transportation & Logistics — (0.1)% | ||||||||||
Frontline Ltd. (d) | 3,400 | (7,616 | ) | |||||||
Ship Finance International Ltd. | 100 | (1,480 | ) | |||||||
|
| |||||||||
| (9,096 | ) | |||||||||
|
| |||||||||
Total Norway | (143,736 | ) | ||||||||
|
| |||||||||
Philippines — (0.0)% | ||||||||||
Telecommunications — (0.0)% | ||||||||||
Philippine Long Distance Telephone Co. ADR (d) | 700 | (43,743 | ) | |||||||
|
| |||||||||
Total Philippines | (43,743 | ) | ||||||||
|
| |||||||||
Republic of Korea — (0.0)% | ||||||||||
Banking — (0.0)% | ||||||||||
KB Financial Group, Inc. ADR (d) | 1,300 | (45,682 | ) | |||||||
|
| |||||||||
Utilities — (0.0)% | ||||||||||
Korea Electric Power Corp. ADR (d) | 1,800 | (36,900 | ) | |||||||
|
| |||||||||
Total Republic of Korea | (82,582 | ) | ||||||||
|
| |||||||||
Spain — (0.0)% | ||||||||||
Telecommunications — (0.0)% | ||||||||||
Telefonica SA ADR (d) | 7,300 | (104,755 | ) | |||||||
|
| |||||||||
Total Spain | (104,755 | ) | ||||||||
|
| |||||||||
See Notes to Consolidated Financial Statements.
181
Blackstone Alternative Multi-Strategy Fund and Subsidiaries
Consolidated Schedule of Investments (Continued)
March 31, 2015
Security Description | Shares | Value | ||||||||
Sweden — (0.0)% | ||||||||||
Automotive — (0.0)% | ||||||||||
Autoliv, Inc. (d) | 2,500 | $ | (294,425 | ) | ||||||
|
| |||||||||
Hardware — (0.0)% | ||||||||||
Telefonaktiebolaget LM Ericsson ADR (d) | 2,500 | (31,375 | ) | |||||||
|
| |||||||||
Total Sweden | (325,800 | ) | ||||||||
|
| |||||||||
Switzerland — (0.4)% | ||||||||||
Asset Management — (0.0)% | ||||||||||
UBS Group AG (d) | 10,400 | (195,208 | ) | |||||||
|
| |||||||||
Biotechnology & Pharmaceuticals — (0.3)% | ||||||||||
Novartis AG (d) | 29,200 | (2,882,054 | ) | |||||||
Novartis AG ADR (d) | 800 | (78,888 | ) | |||||||
Roche Holding AG (d) | 3,100 | (851,855 | ) | |||||||
|
| |||||||||
| (3,812,797 | ) | |||||||||
|
| |||||||||
Chemicals — (0.0)% | ||||||||||
Syngenta AG ADR (d) | 300 | (20,343 | ) | |||||||
|
| |||||||||
Institutional Financial Service — (0.1)% | ||||||||||
Credit Suisse Group AG ADR (d) | 15,300 | (412,029 | ) | |||||||
|
| |||||||||
Total Switzerland | (4,440,377 | ) | ||||||||
|
| |||||||||
Taiwan — (0.0)% | ||||||||||
Telecommunications — (0.0)% | ||||||||||
Chunghwa Telecom Co. Ltd. ADR (d) | 3,500 | (112,245 | ) | |||||||
|
| |||||||||
Total Taiwan | (112,245 | ) | ||||||||
|
| |||||||||
United Kingdom — (0.2)% | ||||||||||
Banking — (0.0)% | ||||||||||
Barclays PLC ADR (d) | 30,204 | (440,072 | ) | |||||||
Royal Bank of Scotland Group PLC ADR (d) | 3,500 | (35,315 | ) | |||||||
|
| |||||||||
| (475,387 | ) | |||||||||
|
| |||||||||
Consumer Products — (0.1)% | ||||||||||
Unilever NV (d) | 16,876 | (704,742 | ) | |||||||
|
| |||||||||
Iron & Steel — (0.0)% | ||||||||||
Rio Tinto PLC ADR (d) | 3,200 | (132,480 | ) | |||||||
|
| |||||||||
Machinery — (0.1)% | ||||||||||
Pentair PLC (d) | 9,300 | (584,877 | ) | |||||||
|
| |||||||||
Media — (0.0)% | ||||||||||
Pearson PLC ADR | 1,200 | (25,932 | ) | |||||||
See Notes to Consolidated Financial Statements.
182
Blackstone Alternative Multi-Strategy Fund and Subsidiaries
Consolidated Schedule of Investments (Continued)
March 31, 2015
Security Description | Shares | Value | ||||||||
WPP PLC ADR (d) | 300 | $ | (34,131 | ) | ||||||
|
| |||||||||
| (60,063 | ) | |||||||||
|
| |||||||||
Semiconductors — (0.0)% | ||||||||||
ARM Holdings PLC ADR (d) | 7,400 | (364,820 | ) | |||||||
|
| |||||||||
Total United Kingdom | (2,322,369 | ) | ||||||||
|
| |||||||||
United States — (14.9)% | ||||||||||
Aerospace & Defense — (0.1)% | ||||||||||
Lockheed Martin Corp. | 100 | (20,296 | ) | |||||||
Rockwell Collins, Inc. | 100 | (9,655 | ) | |||||||
Sturm Ruger & Co., Inc. (d) | 5,200 | (258,076 | ) | |||||||
Taser International, Inc. (d) | 31,200 | (752,232 | ) | |||||||
|
| |||||||||
| (1,040,259 | ) | |||||||||
|
| |||||||||
Apparel & Textile Products — (0.1)% | ||||||||||
G-III Apparel Group Ltd. (d) | 600 | (67,590 | ) | |||||||
Iconix Brand Group, Inc. (d) | 27,700 | (932,659 | ) | |||||||
PVH Corp. (d) | 100 | (10,656 | ) | |||||||
Quiksilver, Inc. (d) | 100 | (185 | ) | |||||||
Wolverine World Wide, Inc. (d) | 2,700 | (90,315 | ) | |||||||
|
| |||||||||
| (1,101,405 | ) | |||||||||
|
| |||||||||
Asset Management — (0.4)% | ||||||||||
Acacia Research Corp. (d) | 800 | (8,560 | ) | |||||||
Artisan Partners Asset Management, Inc. Class A (d) | 9,700 | (440,962 | ) | |||||||
Federated Investors, Inc. Class B (d) | 400 | (13,556 | ) | |||||||
FS Investment Corp. | 500 | (5,070 | ) | |||||||
Home Loan Servicing Solutions Ltd. (d) | 61,700 | (1,020,518 | ) | |||||||
Janus Capital Group, Inc. (d) | 104,400 | (1,794,636 | ) | |||||||
Leucadia National Corp. (d) | 63,400 | (1,413,186 | ) | |||||||
Medley Capital Corp. (d) | 19,500 | (178,425 | ) | |||||||
Prospect Capital Corp. (d) | 4,500 | (38,025 | ) | |||||||
TD Ameritrade Holding Corp. | 300 | (11,178 | ) | |||||||
Triangle Capital Corp. (d) | 2,300 | (52,463 | ) | |||||||
|
| |||||||||
| (4,976,579 | ) | |||||||||
|
| |||||||||
Automotive — (0.2)% | ||||||||||
Dana Holding Corp. (d) | 13,900 | (294,124 | ) | |||||||
Dorman Products, Inc. (d) | 300 | (14,925 | ) | |||||||
Federal-Mogul Holdings Corp. (d) | 1,009 | (13,430 | ) | |||||||
Ford Motor Co. (d) | 24,900 | (401,886 | ) | |||||||
Gentherm, Inc. (d) | 1,200 | (60,612 | ) | |||||||
Quantum Fuel Systems Technologies Worldwide, Inc. (d) | 5,700 | (15,219 | ) | |||||||
See Notes to Consolidated Financial Statements.
183
Blackstone Alternative Multi-Strategy Fund and Subsidiaries
Consolidated Schedule of Investments (Continued)
March 31, 2015
Security Description | Shares | Value | ||||||||
Tesla Motors, Inc. (d) | 9,500 | $ | (1,793,315 | ) | ||||||
|
| |||||||||
| (2,593,511 | ) | |||||||||
|
| |||||||||
Banking — (0.5)% | ||||||||||
Banc of California, Inc. (d) | 3,800 | (46,778 | ) | |||||||
Bank of America Corp. (d) | 115,200 | (1,772,928 | ) | |||||||
Citigroup, Inc. (d) | 34,900 | (1,798,048 | ) | |||||||
Commerce Bancshares, Inc. | 1,100 | (46,552 | ) | |||||||
ConnectOne Bancorp, Inc. (d) | 23 | (448 | ) | |||||||
EverBank Financial Corp. | 2,100 | (37,863 | ) | |||||||
First Horizon National Corp. | 4,000 | (57,160 | ) | |||||||
First Niagara Financial Group, Inc. (d) | 8,300 | (73,372 | ) | |||||||
FNB Corp. | 500 | (6,570 | ) | |||||||
JPMorgan Chase & Co. (d) | 12,700 | (769,366 | ) | |||||||
MB Financial, Inc. (d) | 1,436 | (44,961 | ) | |||||||
PacWest Bancorp (d) | 3,100 | (145,359 | ) | |||||||
TFS Financial Corp. (d) | 4,052 | (59,483 | ) | |||||||
Umpqua Holdings Corp. (d) | 7,200 | (123,696 | ) | |||||||
United Bankshares, Inc. (d) | 600 | (22,548 | ) | |||||||
Wells Fargo & Co. (d) | 21,000 | (1,142,400 | ) | |||||||
|
| |||||||||
| (6,147,532 | ) | |||||||||
|
| |||||||||
Biotechnology & Pharmaceuticals — (2.2)% | ||||||||||
ACADIA Pharmaceuticals, Inc. (d) | 9,000 | (293,310 | ) | |||||||
AcelRx Pharmaceuticals, Inc. (d) | 3,000 | (11,580 | ) | |||||||
Achillion Pharmaceuticals, Inc. (d) | 11,400 | (112,404 | ) | |||||||
Actavis PLC (d) | 770 | (229,167 | ) | |||||||
Aegerion Pharmaceuticals, Inc. (d) | 14,500 | (379,465 | ) | |||||||
Aerie Pharmaceuticals, Inc. (d) | 300 | (9,402 | ) | |||||||
Akorn, Inc. (d) | 1,200 | (57,012 | ) | |||||||
Amgen, Inc. (d) | 13,500 | (2,157,975 | ) | |||||||
Ampio Pharmaceuticals, Inc. (d) | 17,300 | (130,269 | ) | |||||||
ANI Pharmaceuticals, Inc. (d) | 400 | (25,020 | ) | |||||||
Antares Pharma, Inc. (d) | 5,600 | (15,176 | ) | |||||||
Arena Pharmaceuticals, Inc. (d) | 24,500 | (107,065 | ) | |||||||
Arrowhead Research Corp. (d) | 10,100 | (68,326 | ) | |||||||
BioDelivery Sciences International, Inc. (d) | 400 | (4,200 | ) | |||||||
Bristol-Myers Squibb Co. (d) | 19,700 | (1,270,650 | ) | |||||||
Catalyst Pharmaceutical Partners, Inc. (d) | 2,100 | (9,093 | ) | |||||||
Celgene Corp. (d) | 200 | (23,056 | ) | |||||||
Celldex Therapeutics, Inc. (d) | 19,800 | (551,826 | ) | |||||||
Chimerix, Inc. | 100 | (3,769 | ) | |||||||
Clovis Oncology, Inc. (d) | 4,300 | (319,189 | ) | |||||||
CTI BioPharma Corp. (d) | 8,700 | (15,747 | ) | |||||||
CytRx Corp. (d) | 34,900 | (117,613 | ) | |||||||
Discovery Laboratories, Inc. (d) | 600 | (714 | ) | |||||||
See Notes to Consolidated Financial Statements.
184
Blackstone Alternative Multi-Strategy Fund and Subsidiaries
Consolidated Schedule of Investments (Continued)
March 31, 2015
Security Description | Shares | Value | ||||||||
Dynavax Technologies Corp. (d) | 1,030 | $ | (23,103 | ) | ||||||
Eli Lilly & Co. (d) | 32,100 | (2,332,065 | ) | |||||||
Enanta Pharmaceuticals, Inc. (d) | 7,200 | (220,464 | ) | |||||||
Endo International PLC (d) | 28,000 | (2,511,600 | ) | |||||||
Endocyte, Inc. (d) | 17,100 | (107,046 | ) | |||||||
Epizyme, Inc. (d) | 3,100 | (58,218 | ) | |||||||
Exelixis, Inc. (d) | 10,200 | (26,214 | ) | |||||||
Galectin Therapeutics, Inc. (d) | 1,700 | (5,695 | ) | |||||||
Galena Biopharma, Inc. (d) | 38,700 | (53,793 | ) | |||||||
Geron Corp. (d) | 7,500 | (28,275 | ) | |||||||
Halozyme Therapeutics, Inc. (d) | 10,700 | (152,796 | ) | |||||||
Heron Therapeutics, Inc. (d) | 400 | (5,820 | ) | |||||||
Hospira, Inc. (d) | 20,100 | (1,765,584 | ) | |||||||
Idera Pharmaceuticals, Inc. (d) | 8,800 | (32,648 | ) | |||||||
IGI Laboratories, Inc. (d) | 6,100 | (49,776 | ) | |||||||
ImmunoGen, Inc. (d) | 800 | (7,160 | ) | |||||||
Immunomedics, Inc. (d) | 1,800 | (6,894 | ) | |||||||
Inovio Pharmaceuticals, Inc. (d) | 20,900 | (170,544 | ) | |||||||
Intercept Pharmaceuticals, Inc. (d) | 3,900 | (1,099,878 | ) | |||||||
Intrexon Corp. (d) | 600 | (27,222 | ) | |||||||
Isis Pharmaceuticals, Inc. (d) | 10,900 | (694,003 | ) | |||||||
Johnson & Johnson (d) | 35,700 | (3,591,420 | ) | |||||||
Karyopharm Therapeutics, Inc. (d) | 3,200 | (97,952 | ) | |||||||
Keryx Biopharmaceuticals, Inc. (d) | 42,600 | (542,298 | ) | |||||||
Kite Pharma, Inc. (d) | 900 | (51,912 | ) | |||||||
Lexicon Pharmaceuticals, Inc. (d) | 8,300 | (7,838 | ) | |||||||
MannKind Corp. (d) | 3,400 | (17,680 | ) | |||||||
Mast Therapeutics, Inc. (d) | 1,600 | (776 | ) | |||||||
Mylan NV | 7,500 | (445,125 | ) | |||||||
NanoViricides, Inc. (d) | 300 | (675 | ) | |||||||
Neuralstem, Inc. (d) | 3,400 | (6,460 | ) | |||||||
Northwest Biotherapeutics, Inc. (d) | 800 | (5,896 | ) | |||||||
Novavax, Inc. | 300 | (2,481 | ) | |||||||
OncoMed Pharmaceuticals, Inc. | 200 | (5,156 | ) | |||||||
Oncothyreon, Inc. (d) | 800 | (1,304 | ) | |||||||
OPKO Health, Inc. (d) | 13,900 | (196,963 | ) | |||||||
Orexigen Therapeutics, Inc. (d) | 2,800 | (21,924 | ) | |||||||
Organovo Holdings, Inc. (d) | 27,300 | (96,642 | ) | |||||||
OXiGENE, Inc. (d) | 9,100 | (13,286 | ) | |||||||
Peregrine Pharmaceuticals, Inc. (d) | 2,400 | (3,240 | ) | |||||||
Perrigo Co. PLC (d) | 7,800 | (1,291,290 | ) | |||||||
Pfizer, Inc. (d) | 49,400 | (1,718,626 | ) | |||||||
Progenics Pharmaceuticals, Inc. (d) | 3,800 | (22,724 | ) | |||||||
Provectus Biopharmaceuticals, Inc. Class A (d) | 1,400 | (1,141 | ) | |||||||
Raptor Pharmaceutical Corp. (d) | 1,700 | (18,479 | ) | |||||||
Relypsa, Inc. | 900 | (32,463 | ) | |||||||
See Notes to Consolidated Financial Statements.
185
Blackstone Alternative Multi-Strategy Fund and Subsidiaries
Consolidated Schedule of Investments (Continued)
March 31, 2015
Security Description | Shares | Value | ||||||||
Repros Therapeutics, Inc. (d) | 8,700 | $ | (74,733 | ) | ||||||
Retrophin, Inc. (d) | 100 | (2,396 | ) | |||||||
Rexahn Pharmaceuticals, Inc. (d) | 15,800 | (11,534 | ) | |||||||
Salix Pharmaceuticals Ltd. (d) | 11,200 | (1,935,472 | ) | |||||||
Sarepta Therapeutics, Inc. (d) | 17,700 | (235,056 | ) | |||||||
StemCells, Inc. (d) | 1,100 | (1,122 | ) | |||||||
Sunesis Pharmaceuticals, Inc. (d) | 200 | (490 | ) | |||||||
Synergy Pharmaceuticals, Inc. (d) | 21,000 | (97,020 | ) | |||||||
Synta Pharmaceuticals Corp. (d) | 21,100 | (40,934 | ) | |||||||
Synthetic Biologics, Inc. (d) | 7,100 | (15,549 | ) | |||||||
Tenax Therapeutics, Inc. (d) | 2,600 | (8,476 | ) | |||||||
TG Therapeutics, Inc. | 500 | (7,740 | ) | |||||||
TherapeuticsMD, Inc. (d) | 11,900 | (71,995 | ) | |||||||
Theravance, Inc. (d) | 14,400 | (226,368 | ) | |||||||
Threshold Pharmaceuticals, Inc. (d) | 3,100 | (12,586 | ) | |||||||
Tonix Pharmaceuticals Holding Corp. (d) | 1,000 | (6,320 | ) | |||||||
Vanda Pharmaceuticals, Inc. (d) | 13,600 | (126,480 | ) | |||||||
VIVUS, Inc. (d) | 32,500 | (79,950 | ) | |||||||
XOMA Corp. (d) | 14,400 | (52,416 | ) | |||||||
ZIOPHARM Oncology, Inc. | 900 | (9,693 | ) | |||||||
Zogenix, Inc. (d) | 2,000 | (2,740 | ) | |||||||
|
| |||||||||
| (26,503,647 | ) | |||||||||
|
| |||||||||
Chemicals — (0.4)% | ||||||||||
Balchem Corp. (d) | 3,900 | (215,982 | ) | |||||||
CF Industries Holdings, Inc. | 200 | (56,736 | ) | |||||||
FMC Corp. (d) | 9,200 | (526,700 | ) | |||||||
LSB Industries, Inc. (d) | 100 | (4,133 | ) | |||||||
Marrone Bio Innovations, Inc. (d) | 100 | (387 | ) | |||||||
Olin Corp. (d) | 100 | (3,204 | ) | |||||||
Platform Specialty Products Corp. (d) | 15,900 | (407,994 | ) | |||||||
Polypore International, Inc. (d) | 29,300 | (1,725,770 | ) | |||||||
Rentech, Inc. (d) | 2,600 | (2,912 | ) | |||||||
Sensient Technologies Corp. (d) | 600 | (41,328 | ) | |||||||
Sigma-Aldrich Corp. (d) | 12,700 | (1,755,775 | ) | |||||||
Trinseo SA (d) | 1,000 | (19,800 | ) | |||||||
Tronox Ltd. Class A (d) | 4,200 | (85,386 | ) | |||||||
|
| |||||||||
| (4,846,107 | ) | |||||||||
|
| |||||||||
Commercial Services — (0.1)% | ||||||||||
Brady Corp. Class A (d) | 300 | (8,487 | ) | |||||||
Care.com, Inc. (d) | 1,000 | (7,580 | ) | |||||||
Corporate Executive Board Co. (d) | 800 | (63,888 | ) | |||||||
Ecolab, Inc. (d) | 300 | (34,314 | ) | |||||||
Healthcare Services Group, Inc. (d) | 1,000 | (32,130 | ) | |||||||
HMS Holdings Corp. (d) | 20,400 | (315,180 | ) | |||||||
See Notes to Consolidated Financial Statements.
186
Blackstone Alternative Multi-Strategy Fund and Subsidiaries
Consolidated Schedule of Investments (Continued)
March 31, 2015
Security Description | Shares | Value | ||||||||
InterCloud Systems, Inc. (d) | 6,640 | $ | (14,608 | ) | ||||||
On Assignment, Inc. (d) | 100 | (3,837 | ) | |||||||
Robert Half International, Inc. (d) | 6,500 | (393,380 | ) | |||||||
Rollins, Inc. (d) | 150 | (3,710 | ) | |||||||
Sotheby’s (d) | 2,200 | (92,972 | ) | |||||||
|
| |||||||||
| (970,086 | ) | |||||||||
|
| |||||||||
Construction Materials — (0.0)% | ||||||||||
Louisiana-Pacific Corp. (d) | 15,800 | (260,858 | ) | |||||||
Martin Marietta Materials, Inc. (d) | 30 | (4,194 | ) | |||||||
Ply Gem Holdings, Inc. | 100 | (1,300 | ) | |||||||
USG Corp. (d) | 3,500 | (93,450 | ) | |||||||
|
| |||||||||
| (359,802 | ) | |||||||||
|
| |||||||||
Consumer Products — (0.2)% | ||||||||||
22nd Century Group, Inc. (d) | 1,000 | (860 | ) | |||||||
B&G Foods, Inc. (d) | 300 | (8,829 | ) | |||||||
Brown-Forman Corp. Class B (d) | 300 | (27,105 | ) | |||||||
Church & Dwight Co., Inc. (d) | 4,000 | (341,680 | ) | |||||||
Darling Ingredients, Inc. (d) | 11,300 | (158,313 | ) | |||||||
Dean Foods Co. (d) | 3,100 | (51,243 | ) | |||||||
Elizabeth Arden, Inc. (d) | 400 | (6,240 | ) | |||||||
HRG Group, Inc. (d) | 5,100 | (63,648 | ) | |||||||
Ingredion, Inc. (d) | 1,700 | (132,294 | ) | |||||||
Keurig Green Mountain, Inc. (d) | 12,900 | (1,441,317 | ) | |||||||
Senomyx, Inc. (d) | 1,400 | (6,174 | ) | |||||||
Snyder’s-Lance, Inc. (d) | 1,000 | (31,960 | ) | |||||||
TreeHouse Foods, Inc. (d) | 3,200 | (272,064 | ) | |||||||
Tyson Foods, Inc. Class A | 1,200 | (45,960 | ) | |||||||
|
| |||||||||
| (2,587,687 | ) | |||||||||
|
| |||||||||
Consumer Services — (0.0)% | ||||||||||
Apollo Education Group, Inc. (d) | 1,600 | (30,272 | ) | |||||||
Weight Watchers International, Inc. (d) | 1,200 | (8,388 | ) | |||||||
|
| |||||||||
| (38,660 | ) | |||||||||
|
| |||||||||
Containers & Packaging — (0.0)% | ||||||||||
KapStone Paper and Packaging Corp. | 800 | (26,272 | ) | |||||||
Packaging Corp. of America (d) | 2,000 | (156,380 | ) | |||||||
|
| |||||||||
| (182,652 | ) | |||||||||
|
| |||||||||
Distributors—Consumer Staples — (0.0)% | ||||||||||
United Natural Foods, Inc. (d) | 4,800 | (369,792 | ) | |||||||
|
| |||||||||
Distributors—Discretionary — (0.0)% | ||||||||||
Fastenal Co. (d) | 7,200 | (298,332 | ) | |||||||
|
| |||||||||
See Notes to Consolidated Financial Statements.
187
Blackstone Alternative Multi-Strategy Fund and Subsidiaries
Consolidated Schedule of Investments (Continued)
March 31, 2015
Security Description | Shares | Value | ||||||||
Electrical Equipment — (0.0)% | ||||||||||
Capstone Turbine Corp. (d) | 45,200 | $ | (29,380 | ) | ||||||
Cognex Corp. (d) | 2,200 | (109,098 | ) | |||||||
Mobileye NV | 400 | (16,812 | ) | |||||||
Revolution Lighting Technologies, Inc. (d) | 6,000 | (6,660 | ) | |||||||
Roper Industries, Inc. (d) | 300 | (51,600 | ) | |||||||
|
| |||||||||
| (213,550 | ) | |||||||||
|
| |||||||||
Engineering & Construction Services — (0.0)% | ||||||||||
Kratos Defense & Security Solutions, Inc. (d) | 2,600 | (14,378 | ) | |||||||
Willbros Group, Inc. (d) | 100 | (331 | ) | |||||||
|
| |||||||||
| (14,709 | ) | |||||||||
|
| |||||||||
Gaming, Lodging & Restaurants — (0.2)% | ||||||||||
Caesars Entertainment Corp. (d) | 8,600 | (90,558 | ) | |||||||
Las Vegas Sands Corp. (d) | 800 | (44,032 | ) | |||||||
McDonald’s Corp. | 600 | (58,464 | ) | |||||||
Pinnacle Entertainment, Inc. (d) | 9,900 | (357,291 | ) | |||||||
Scientific Games Corp. Class A (d) | 1,600 | (16,752 | ) | |||||||
Wynn Resorts Ltd. | 13,900 | (1,749,732 | ) | |||||||
Yum! Brands, Inc. (d) | 1,420 | (111,782 | ) | |||||||
Zoe’s Kitchen, Inc. (d) | 300 | (9,987 | ) | |||||||
|
| |||||||||
| (2,438,598 | ) | |||||||||
|
| |||||||||
Hardware — (0.5)% | ||||||||||
3D Systems Corp. (d) | 22,200 | (608,724 | ) | |||||||
Aerohive Networks, Inc. (d) | 2,800 | (12,488 | ) | |||||||
Alliance Fiber Optic Products, Inc. (d) | 1,000 | (17,420 | ) | |||||||
Aruba Networks, Inc. | 71,900 | (1,760,831 | ) | |||||||
Ciena Corp. (d) | 6,000 | (115,860 | ) | |||||||
Control4 Corp. (d) | 400 | (4,792 | ) | |||||||
Digital Ally, Inc. (d) | 400 | (5,100 | ) | |||||||
Emulex Corp. (d) | 16,500 | (131,505 | ) | |||||||
ExOne Co. (d) | 5,300 | (72,345 | ) | |||||||
Extreme Networks, Inc. (d) | 400 | (1,264 | ) | |||||||
Fortinet, Inc. (d) | 1,700 | (59,415 | ) | |||||||
Gigamon, Inc. (d) | 200 | (4,248 | ) | |||||||
GoPro, Inc. Class A (d) | 1,100 | (47,751 | ) | |||||||
Identiv, Inc. (d) | 100 | (858 | ) | |||||||
Lexmark International, Inc. Class A (d) | 2,500 | (105,850 | ) | |||||||
MicroVision, Inc. (d) | 6,600 | (22,638 | ) | |||||||
NCR Corp. | 100 | (2,951 | ) | |||||||
Neonode, Inc. (d) | 3,000 | (9,510 | ) | |||||||
Nimble Storage, Inc. (d) | 500 | (11,155 | ) | |||||||
Procera Networks, Inc. (d) | 100 | (939 | ) | |||||||
Riverbed Technology, Inc. (d) | 68,403 | (1,430,307 | ) | |||||||
See Notes to Consolidated Financial Statements.
188
Blackstone Alternative Multi-Strategy Fund and Subsidiaries
Consolidated Schedule of Investments (Continued)
March 31, 2015
Security Description | Shares | Value | ||||||||
Ruckus Wireless, Inc. (d) | 5,500 | $ | (70,785 | ) | ||||||
Silicon Graphics International Corp. (d) | 200 | (1,738 | ) | |||||||
Stratasys Ltd. (d) | 12,900 | (680,862 | ) | |||||||
Synaptics, Inc. (d) | 4,400 | (357,742 | ) | |||||||
Turtle Beach Corp. (d) | 1,600 | (2,976 | ) | |||||||
Ubiquiti Networks, Inc. (d) | 13,500 | (398,925 | ) | |||||||
Uni-Pixel, Inc. (d) | 1,000 | (7,000 | ) | |||||||
Violin Memory, Inc. (d) | 3,300 | (12,441 | ) | |||||||
Vocera Communications, Inc. (d) | 100 | (992 | ) | |||||||
|
| |||||||||
| (5,959,412 | ) | |||||||||
|
| |||||||||
Health Care Facilities/Services — (0.5)% | ||||||||||
Acadia Healthcare Co., Inc. (d) | 6,300 | (451,080 | ) | |||||||
Adeptus Health, Inc. Class A (d) | 500 | (25,110 | ) | |||||||
AmerisourceBergen Corp. (d) | 16,400 | (1,864,188 | ) | |||||||
BioScrip, Inc. (d) | 6,700 | (29,681 | ) | |||||||
Brookdale Senior Living, Inc. (d) | 14,591 | (550,956 | ) | |||||||
Catamaran Corp. (d) | 2,700 | (160,758 | ) | |||||||
Cigna Corp. | 600 | (77,664 | ) | |||||||
Diplomat Pharmacy, Inc. | 900 | (31,122 | ) | |||||||
Express Scripts Holding Co. (d) | 14,700 | (1,275,519 | ) | |||||||
Humana, Inc. | 400 | (71,208 | ) | |||||||
NeoStem, Inc. (d) | 6,900 | (17,526 | ) | |||||||
Quest Diagnostics, Inc. (d) | 23,700 | (1,821,345 | ) | |||||||
UnitedHealth Group, Inc. | 1,000 | (118,290 | ) | |||||||
VWR Corp. (d) | 900 | (23,391 | ) | |||||||
|
| |||||||||
| (6,517,838 | ) | |||||||||
|
| |||||||||
Home & Office Products — (0.4)% | ||||||||||
Beazer Homes USA, Inc. (d) | 17,400 | (308,328 | ) | |||||||
Cenveo, Inc. (d) | 500 | (1,070 | ) | |||||||
Fortune Brands Home & Security, Inc. | 100 | (4,748 | ) | |||||||
Green Brick Partners, Inc. (d) | 2,200 | (18,205 | ) | |||||||
Hovnanian Enterprises, Inc. Class A (d) | 59,400 | (211,464 | ) | |||||||
iRobot Corp. (d) | 500 | (16,315 | ) | |||||||
KB Home (d) | 44,000 | (687,280 | ) | |||||||
Lennar Corp. Class A (d) | 3,200 | (165,792 | ) | |||||||
M/I Homes, Inc. (d) | 1,500 | (35,760 | ) | |||||||
Masonite International Corp. (d) | 100 | (6,726 | ) | |||||||
MDC Holdings, Inc. (d) | 24,000 | (684,000 | ) | |||||||
Meritage Homes Corp. (d) | 1,400 | (68,096 | ) | |||||||
Ryland Group, Inc. (d) | 7,100 | (346,054 | ) | |||||||
Snap-on, Inc. (d) | 9,300 | (1,367,658 | ) | |||||||
Standard Pacific Corp. (d) | 100 | (900 | ) | |||||||
Taylor Morrison Home Corp. Class A (d) | 6,400 | (133,440 | ) | |||||||
TRI Pointe Homes, Inc. (d) | 44,200 | (682,006 | ) | |||||||
See Notes to Consolidated Financial Statements.
189
Blackstone Alternative Multi-Strategy Fund and Subsidiaries
Consolidated Schedule of Investments (Continued)
March 31, 2015
Security Description | Shares | Value | ||||||||
William Lyon Homes Class A (d) | 2,900 | $ | (74,878 | ) | ||||||
|
| |||||||||
| (4,812,720 | ) | |||||||||
|
| |||||||||
Institutional Financial Service — (0.3)% | ||||||||||
FXCM, Inc. Class A (d) | 5,400 | (11,502 | ) | |||||||
Goldman Sachs Group, Inc. (d) | 10,000 | (1,879,700 | ) | |||||||
Morgan Stanley (d) | 48,600 | (1,734,534 | ) | |||||||
Raymond James Financial, Inc. (d) | 300 | (17,034 | ) | |||||||
RCS Capital Corp. Class A (d) | 16,500 | (175,560 | ) | |||||||
|
| |||||||||
| (3,818,330 | ) | |||||||||
|
| |||||||||
Insurance — (0.3)% | ||||||||||
American International Group, Inc. (d) | 32,100 | (1,758,759 | ) | |||||||
Aspen Insurance Holdings Ltd. | 500 | (23,615 | ) | |||||||
Berkshire Hathaway, Inc. Class B (d) | 6,700 | (966,944 | ) | |||||||
HCC Insurance Holdings, Inc. (d) | 1,800 | (102,006 | ) | |||||||
HCI Group, Inc. (d) | 600 | (27,522 | ) | |||||||
Markel Corp. (d) | 100 | (76,896 | ) | |||||||
MBIA, Inc. (d) | 15,300 | (142,290 | ) | |||||||
Torchmark Corp. (d) | 49 | (2,691 | ) | |||||||
|
| |||||||||
| (3,100,723 | ) | |||||||||
|
| |||||||||
Iron & Steel — (0.1)% | ||||||||||
AK Steel Holding Corp. (d) | 154,600 | (691,062 | ) | |||||||
AM Castle & Co. (d) | 700 | (2,555 | ) | |||||||
Cliffs Natural Resources, Inc. (d) | 54,800 | (263,588 | ) | |||||||
Walter Energy, Inc. (d) | 24,100 | (14,942 | ) | |||||||
|
| |||||||||
| (972,147 | ) | |||||||||
|
| |||||||||
Leisure Products — (0.0)% | ||||||||||
Brunswick Corp. (d) | 500 | (25,725 | ) | |||||||
Callaway Golf Co. (d) | 500 | (4,765 | ) | |||||||
Winnebago Industries, Inc. (d) | 5,400 | (114,804 | ) | |||||||
|
| |||||||||
| (145,294 | ) | |||||||||
|
| |||||||||
Machinery — (0.1)% | ||||||||||
Adept Technology, Inc. (d) | 1,100 | (6,765 | ) | |||||||
Arotech Corp. (d) | 200 | (622 | ) | |||||||
Colfax Corp. (d) | 3,400 | (162,282 | ) | |||||||
Graco, Inc. (d) | 200 | (14,432 | ) | |||||||
IDEX Corp. (d) | 400 | (30,332 | ) | |||||||
Mueller Water Products, Inc. Class A (d) | 1,300 | (12,805 | ) | |||||||
Nordson Corp. (d) | 600 | (47,004 | ) | |||||||
Oshkosh Corp. | 3,500 | (170,765 | ) | |||||||
Power Solutions International, Inc. (d) | 100 | (6,429 | ) | |||||||
See Notes to Consolidated Financial Statements.
190
Blackstone Alternative Multi-Strategy Fund and Subsidiaries
Consolidated Schedule of Investments (Continued)
March 31, 2015
Security Description | Shares | Value | ||||||||
Sensata Technologies Holding NV (d) | 5,800 | $ | (333,210 | ) | ||||||
|
| |||||||||
| (784,646 | ) | |||||||||
|
| |||||||||
Manufactured Goods — (0.0)% | ||||||||||
EnPro Industries, Inc. (d) | 100 | (6,595 | ) | |||||||
Proto Labs, Inc. (d) | 5,200 | (364,000 | ) | |||||||
|
| |||||||||
| (370,595 | ) | |||||||||
|
| |||||||||
Media — (1.0)% | ||||||||||
Alliance Data Systems Corp. (d) | 2,845 | (842,831 | ) | |||||||
Angie’s List, Inc. (d) | 16,300 | (95,681 | ) | |||||||
Borderfree, Inc. (d) | 100 | (601 | ) | |||||||
Cablevision Systems Corp. Class A | 4,300 | (78,690 | ) | |||||||
Coupons.com, Inc. (d) | 3,800 | (44,612 | ) | |||||||
Cumulus Media, Inc. Class A (d) | 47,000 | (116,090 | ) | |||||||
Dex Media, Inc. (d) | 500 | (2,095 | ) | |||||||
DreamWorks Animation SKG, Inc. Class A (d) | 6,700 | (162,140 | ) | |||||||
Everyday Health, Inc. (d) | 1,300 | (16,718 | ) | |||||||
Gannett Co., Inc. | 200 | (7,416 | ) | |||||||
Lions Gate Entertainment Corp. (d) | 10,500 | (356,160 | ) | |||||||
LiveDeal, Inc. (d) | 1,300 | (4,095 | ) | |||||||
Marin Software, Inc. (d) | 700 | (4,403 | ) | |||||||
Media General, Inc. (d) | 1,700 | (28,033 | ) | |||||||
MeetMe, Inc. (d) | 2,700 | (5,022 | ) | |||||||
Millennial Media, Inc. (d) | 9,700 | (14,065 | ) | |||||||
Omnicom Group, Inc. | 800 | (62,384 | ) | |||||||
Orbitz Worldwide, Inc. (d) | 96,800 | (1,128,688 | ) | |||||||
Pandora Media, Inc. (d) | 107,600 | (1,744,196 | ) | |||||||
Rocket Fuel, Inc. (d) | 13,800 | (126,960 | ) | |||||||
Shutterstock, Inc. | 400 | (27,468 | ) | |||||||
Sirius XM Holdings, Inc. (d) | 10,000 | (38,200 | ) | |||||||
Time Warner, Inc. (d) | 5,300 | (447,532 | ) | |||||||
Twitter, Inc. (d) | 35,600 | (1,782,848 | ) | |||||||
Walt Disney Co. (d) | 300 | (31,467 | ) | |||||||
Yahoo!, Inc. (d) | 62,277 | (2,767,279 | ) | |||||||
Yelp, Inc. (d) | 37,400 | (1,770,890 | ) | |||||||
YOU On Demand Holdings, Inc. (d) | 500 | (1,065 | ) | |||||||
Zillow Group, Inc. Class A (d) | 123 | (12,337 | ) | |||||||
|
| |||||||||
| (11,719,966 | ) | |||||||||
|
| |||||||||
Medical Equipment/Devices — (1.0)% | ||||||||||
Abaxis, Inc. (d) | 7,000 | (448,770 | ) | |||||||
Abbott Laboratories (d) | 9,700 | (449,401 | ) | |||||||
BioTelemetry, Inc. (d) | 1,100 | (9,735 | ) | |||||||
Cepheid (d) | 700 | (39,830 | ) | |||||||
Cerus Corp. (d) | 2,200 | (9,174 | ) | |||||||
See Notes to Consolidated Financial Statements.
191
Blackstone Alternative Multi-Strategy Fund and Subsidiaries
Consolidated Schedule of Investments (Continued)
March 31, 2015
Security Description | Shares | Value | ||||||||
Cytori Therapeutics, Inc. (d) | 600 | $ | (708 | ) | ||||||
DENTSPLY International, Inc. (d) | 58,000 | (2,951,620 | ) | |||||||
EnteroMedics, Inc. (d) | 200 | (183 | ) | |||||||
Exact Sciences Corp. (d) | 5,600 | (123,312 | ) | |||||||
IDEXX Laboratories, Inc. (d) | 1,800 | (278,064 | ) | |||||||
ImmunoCellular Therapeutics Ltd. (d) | 2,500 | (1,213 | ) | |||||||
IsoRay, Inc. (d) | 14,800 | (23,236 | ) | |||||||
Medtronic PLC (d) | 79,003 | (6,161,444 | ) | |||||||
Navidea Biopharmaceuticals, Inc. (d) | 1,000 | (1,590 | ) | |||||||
Pacific Biosciences of California, Inc. (d) | 1,800 | (10,512 | ) | |||||||
Pall Corp. | 100 | (10,039 | ) | |||||||
QIAGEN NV (d) | 17 | (428 | ) | |||||||
ResMed, Inc. | 100 | (7,178 | ) | |||||||
Rockwell Medical, Inc. (d) | 8,800 | (96,184 | ) | |||||||
Rosetta Genomics Ltd. | 100 | (307 | ) | |||||||
Sirona Dental Systems, Inc. (d) | 10,900 | (980,891 | ) | |||||||
Spectranetics Corp. (d) | 5,100 | (177,276 | ) | |||||||
Sunshine Heart, Inc. | 100 | (424 | ) | |||||||
TearLab Corp. (d) | 500 | (995 | ) | |||||||
Unilife Corp. (d) | 1,400 | (5,614 | ) | |||||||
Varian Medical Systems, Inc. (d) | 5,800 | (545,722 | ) | |||||||
|
| |||||||||
| (12,333,850 | ) | |||||||||
|
| |||||||||
Metals & Mining — (0.1)% | ||||||||||
Freeport-McMoRan Copper & Gold, Inc. | 100 | (1,895 | ) | |||||||
Gold Resource Corp. (d) | 2,700 | (8,613 | ) | |||||||
Hecla Mining Co. (d) | 22,900 | (68,242 | ) | |||||||
McEwen Mining, Inc. (d) | 6,700 | (6,834 | ) | |||||||
Midway Gold Corp. (d) | 4,100 | (1,312 | ) | |||||||
Molycorp, Inc. (d) | 64,100 | (24,698 | ) | |||||||
Noranda Aluminum Holding Corp. (d) | 5,600 | (16,632 | ) | |||||||
Paramount Gold and Silver Corp. (d) | 2,800 | (2,828 | ) | |||||||
Royal Gold, Inc. (d) | 3,000 | �� | (189,330 | ) | ||||||
Thompson Creek Metals Co., Inc. (d) | 18,900 | (24,948 | ) | |||||||
Ur-Energy, Inc. (d) | 900 | (855 | ) | |||||||
Uranerz Energy Corp. (d) | 800 | (888 | ) | |||||||
Uranium Energy Corp. (d) | 14,300 | (21,450 | ) | |||||||
US Silica Holdings, Inc. (d) | 12,600 | (448,686 | ) | |||||||
|
| |||||||||
| (817,211 | ) | |||||||||
|
| |||||||||
Oil, Gas & Coal — (1.5)% | ||||||||||
Abraxas Petroleum Corp. (d) | 1,700 | (5,525 | ) | |||||||
Alpha Natural Resources, Inc. (d) | 17,600 | (17,598 | ) | |||||||
American Eagle Energy Corp. | 200 | (36 | ) | |||||||
Antero Resources Corp. (d) | 9,500 | (335,540 | ) | |||||||
Approach Resources, Inc. | 1,100 | (7,249 | ) | |||||||
See Notes to Consolidated Financial Statements.
192
Blackstone Alternative Multi-Strategy Fund and Subsidiaries
Consolidated Schedule of Investments (Continued)
March 31, 2015
Security Description | Shares | Value | ||||||||
Arch Coal, Inc. (d) | 55,300 | $ | (55,295 | ) | ||||||
Basic Energy Services, Inc. (d) | 8,500 | (58,905 | ) | |||||||
Bill Barrett Corp. (d) | 7,100 | (58,930 | ) | |||||||
Bonanza Creek Energy, Inc. (d) | 12,900 | (318,114 | ) | |||||||
Chesapeake Energy Corp. | 1,900 | (26,904 | ) | |||||||
Clayton Williams Energy, Inc. | 300 | (15,189 | ) | |||||||
Clean Energy Fuels Corp. (d) | 6,000 | (32,010 | ) | |||||||
Cobalt International Energy, Inc. (d) | 108,800 | (1,023,808 | ) | |||||||
Comstock Resources, Inc. (d) | 17,400 | (62,118 | ) | |||||||
ConocoPhillips (d) | 200 | (12,452 | ) | |||||||
Continental Resources, Inc. (d) | 200 | (8,734 | ) | |||||||
Core Laboratories NV | 600 | (62,694 | ) | |||||||
Dresser-Rand Group, Inc. (d) | 15,000 | (1,205,250 | ) | |||||||
Eclipse Resources Corp. (d) | 13,900 | (78,118 | ) | |||||||
Emerald Oil, Inc. (d) | 17,900 | (13,246 | ) | |||||||
Energy XXI Ltd. (d) | 72,700 | (264,628 | ) | |||||||
EnLink Midstream LLC | 1,000 | (32,540 | ) | |||||||
EOG Resources, Inc. (d) | 5,700 | (522,633 | ) | |||||||
EP Energy Corp. Class A (d) | 2,000 | (20,960 | ) | |||||||
EXCO Resources, Inc. (d) | 98,000 | (179,340 | ) | |||||||
Flotek Industries, Inc. (d) | 16,600 | (244,684 | ) | |||||||
FMSA Holdings, Inc. (d) | 3,400 | (24,616 | ) | |||||||
FX Energy, Inc. (d) | 2,900 | (3,625 | ) | |||||||
Gastar Exploration, Inc. (d) | 700 | (1,834 | ) | |||||||
Goodrich Petroleum Corp. (d) | 6,800 | (24,140 | ) | |||||||
Halcon Resources Corp. (d) | 68,500 | (105,490 | ) | |||||||
Halliburton Co. (d) | 133,840 | (5,872,899 | ) | |||||||
Hercules Offshore, Inc. (d) | 14,700 | (6,162 | ) | |||||||
ION Geophysical Corp. (d) | 9,700 | (21,049 | ) | |||||||
Jones Energy, Inc. (d) | 1,000 | (8,980 | ) | |||||||
Kinder Morgan, Inc. (d) | 33,732 | (1,418,768 | ) | |||||||
Kosmos Energy Ltd. (d) | 5,100 | (40,341 | ) | |||||||
Laredo Petroleum, Inc. (d) | 1,600 | (20,864 | ) | |||||||
LinnCo LLC (d) | 21,800 | (208,626 | ) | |||||||
Magnum Hunter Resources Corp. (d) | 96,400 | (257,388 | ) | |||||||
Matador Resources Co. (d) | 1,800 | (39,456 | ) | |||||||
Midstates Petroleum Co., Inc. (d) | 3,800 | (3,230 | ) | |||||||
Miller Energy Resources, Inc. (d) | 1,100 | (688 | ) | |||||||
Noble Energy, Inc. (d) | 300 | (14,670 | ) | |||||||
Northern Oil and Gas, Inc. (d) | 11,300 | (87,123 | ) | |||||||
Nuverra Environmental Solutions, Inc. (d) | 4,000 | (14,240 | ) | |||||||
Oasis Petroleum, Inc. (d) | 37,600 | (534,672 | ) | |||||||
Pacific Drilling SA (d) | 15,300 | (59,517 | ) | |||||||
Parker Drilling Co. (d) | 6,200 | (21,638 | ) | |||||||
PBF Energy, Inc. Class A (d) | 28,200 | (956,544 | ) | |||||||
Peabody Energy Corp. (d) | 153,100 | (753,252 | ) | |||||||
See Notes to Consolidated Financial Statements.
193
Blackstone Alternative Multi-Strategy Fund and Subsidiaries
Consolidated Schedule of Investments (Continued)
March 31, 2015
Security Description | Shares | Value | ||||||||
PetroQuest Energy, Inc. (d) | 6,500 | $ | (14,950 | ) | ||||||
Pioneer Energy Services Corp. (d) | 300 | (1,626 | ) | |||||||
Pioneer Natural Resources Co. (d) | 2,100 | (343,371 | ) | |||||||
Rex Energy Corp. (d) | 5,000 | (18,600 | ) | |||||||
Rice Energy, Inc. (d) | 24,400 | (530,944 | ) | |||||||
Ring Energy, Inc. (d) | 400 | (4,248 | ) | |||||||
Rosetta Resources, Inc. (d) | 6,600 | (112,332 | ) | |||||||
RPC, Inc. (d) | 2,300 | (29,463 | ) | |||||||
RSP Permian, Inc. | 500 | (12,595 | ) | |||||||
Sanchez Energy Corp. (d) | 33,000 | (429,330 | ) | |||||||
SandRidge Energy, Inc. (d) | 22,700 | (40,406 | ) | |||||||
Schlumberger Ltd. (d) | 500 | (41,720 | ) | |||||||
Seventy Seven Energy, Inc. (d) | 2,400 | (9,960 | ) | |||||||
SM Energy Co. (d) | 1,700 | (87,856 | ) | |||||||
Synergy Resources Corp. (d) | 1,900 | (22,515 | ) | |||||||
Transocean Ltd. (d) | 51,200 | (751,104 | ) | |||||||
Triangle Petroleum Corp. (d) | 13,100 | (65,893 | ) | |||||||
Ultra Petroleum Corp. (d) | 10,000 | (156,300 | ) | |||||||
W&T Offshore, Inc. (d) | 50,700 | (259,077 | ) | |||||||
Whiting Petroleum Corp. (d) | 3,947 | (121,962 | ) | |||||||
ZaZa Energy Corp. (d) | 500 | (815 | ) | |||||||
|
| |||||||||
| (18,217,379 | ) | |||||||||
|
| |||||||||
Real Estate — (1.7)% | ||||||||||
Alexandria Real Estate Equities, Inc. (d) | 7,100 | (696,084 | ) | |||||||
American Campus Communities, Inc. (d) | 100 | (4,287 | ) | |||||||
American Realty Capital Properties, Inc. (d) | 187,500 | (1,846,875 | ) | |||||||
AvalonBay Communities, Inc. (d) | 4,700 | (818,975 | ) | |||||||
BioMed Realty Trust, Inc. (d) | 8,500 | (192,610 | ) | |||||||
Boston Properties, Inc. (d) | 1,400 | (196,672 | ) | |||||||
Brandywine Realty Trust (d) | 100 | (1,598 | ) | |||||||
Camden Property Trust (d) | 22,400 | (1,750,112 | ) | |||||||
Campus Crest Communities, Inc. (d) | 22,400 | (160,384 | ) | |||||||
CBL & Associates Properties, Inc. (d) | 35,321 | (699,356 | ) | |||||||
Cousins Properties, Inc. | 300 | (3,180 | ) | |||||||
CubeSmart (d) | 1,000 | (24,150 | ) | |||||||
DDR Corp. (d) | 8,600 | (160,132 | ) | |||||||
Douglas Emmett, Inc. | 100 | (2,981 | ) | |||||||
Duke Realty Corp. (d) | 800 | (17,416 | ) | |||||||
Education Realty Trust, Inc. (d) | 18,266 | (646,251 | ) | |||||||
Equity Residential (d) | 3,300 | (256,938 | ) | |||||||
Essex Property Trust, Inc. (d) | 7,900 | (1,816,210 | ) | |||||||
Extra Space Storage, Inc. (d) | 4,400 | (297,308 | ) | |||||||
Federal Realty Investment Trust (d) | 4,000 | (588,840 | ) | |||||||
Government Properties Income Trust (d) | 6,100 | (139,385 | ) | |||||||
Gramercy Property Trust, Inc. | 13,450 | (377,541 | ) | |||||||
See Notes to Consolidated Financial Statements.
194
Blackstone Alternative Multi-Strategy Fund and Subsidiaries
Consolidated Schedule of Investments (Continued)
March 31, 2015
Security Description | Shares | Value | ||||||||
HCP, Inc. (d) | 3,200 | $ | (138,272 | ) | ||||||
Health Care REIT, Inc. (d) | 27,300 | (2,111,928 | ) | |||||||
Hersha Hospitality Trust (d) | 33,618 | (217,508 | ) | |||||||
Host Hotels & Resorts, Inc. | 4,400 | (88,792 | ) | |||||||
Kilroy Realty Corp. (d) | 1,300 | (99,021 | ) | |||||||
Kimco Realty Corp. (d) | 7,200 | (193,320 | ) | |||||||
Kite Realty Group Trust (d) | 1,900 | (53,523 | ) | |||||||
LaSalle Hotel Properties (d) | 6,400 | (248,704 | ) | |||||||
National Retail Properties, Inc. (d) | 18,300 | (749,751 | ) | |||||||
New York REIT, Inc. (d) | 22,800 | (238,944 | ) | |||||||
Pebblebrook Hotel Trust (d) | 4,800 | (223,536 | ) | |||||||
Physicians Realty Trust (d) | 2,900 | (51,069 | ) | |||||||
Public Storage (d) | 8,600 | (1,695,404 | ) | |||||||
Realty Income Corp. (d) | 22,200 | (1,145,520 | ) | |||||||
Regency Centers Corp. (d) | 7,400 | (503,496 | ) | |||||||
Spirit Realty Capital, Inc. | 500 | (6,040 | ) | |||||||
STAG Industrial, Inc. (d) | 3,200 | (75,264 | ) | |||||||
Summit Hotel Properties, Inc. (d) | 1,800 | (25,326 | ) | |||||||
Sunstone Hotel Investors, Inc. (d) | 32,477 | (541,392 | ) | |||||||
UDR, Inc. (d) | 2,700 | (91,881 | ) | |||||||
Ventas, Inc. (d) | 4,800 | (350,496 | ) | |||||||
Vornado Realty Trust (d) | 5,800 | (649,600 | ) | |||||||
Washington Real Estate Investment Trust (d) | 300 | (8,289 | ) | |||||||
|
| |||||||||
| (20,204,361 | ) | |||||||||
|
| |||||||||
Recreation Facilities & Services — (0.1)% | ||||||||||
Life Time Fitness, Inc. | 18,700 | (1,326,952 | ) | |||||||
SFX Entertainment, Inc. (d) | 1,900 | (7,771 | ) | |||||||
|
| |||||||||
| (1,334,723 | ) | |||||||||
|
| |||||||||
Renewable Energy — (0.2)% | ||||||||||
Ascent Solar Technologies, Inc. (d) | 600 | (672 | ) | |||||||
Enphase Energy, Inc. (d) | 7,800 | (102,882 | ) | |||||||
FuelCell Energy, Inc. (d) | 59,800 | (74,750 | ) | |||||||
Gevo, Inc. (d) | 100 | (20 | ) | |||||||
Pacific Ethanol, Inc. (d) | 19,000 | (205,010 | ) | |||||||
Plug Power, Inc. (d) | 54,700 | (141,673 | ) | |||||||
Silver Spring Networks, Inc. (d) | 2,800 | (25,032 | ) | |||||||
SolarCity Corp. (d) | 35,700 | (1,830,696 | ) | |||||||
Solazyme, Inc. (d) | 4,700 | (13,442 | ) | |||||||
SunEdison, Inc. (d) | 9,800 | (235,200 | ) | |||||||
Vivint Solar, Inc. (d) | 5,500 | (66,770 | ) | |||||||
|
| |||||||||
| (2,696,147 | ) | |||||||||
|
| |||||||||
Retail—Consumer Staples — (0.2)% | ||||||||||
CVS Health Corp. (d) | 400 | (41,284 | ) | |||||||
See Notes to Consolidated Financial Statements.
195
Blackstone Alternative Multi-Strategy Fund and Subsidiaries
Consolidated Schedule of Investments (Continued)
March 31, 2015
Security Description | Shares | Value | ||||||||
Fairway Group Holdings Corp. (d) | 800 | $ | (5,416 | ) | ||||||
Whole Foods Market, Inc. (d) | 33,800 | (1,760,304 | ) | |||||||
|
| |||||||||
| (1,807,004 | ) | |||||||||
|
| |||||||||
Retail Discretionary — (0.5)% | ||||||||||
Aeropostale, Inc. (d) | 9,300 | (32,271 | ) | |||||||
American Apparel, Inc. (d) | 16,500 | (11,570 | ) | |||||||
Best Buy Co., Inc. (d) | 15,600 | (589,524 | ) | |||||||
Bon-Ton Stores, Inc. (d) | 7,800 | (54,288 | ) | |||||||
Buckle, Inc. (d) | 800 | (40,872 | ) | |||||||
Build-A-Bear Workshop, Inc. (d) | 100 | (1,965 | ) | |||||||
Builders FirstSource, Inc. | 1,300 | (8,671 | ) | |||||||
Cabela’s, Inc. (d) | 21,000 | (1,175,580 | ) | |||||||
CarMax, Inc. (d) | 400 | (27,604 | ) | |||||||
Container Store Group, Inc. (d) | 4,200 | (80,010 | ) | |||||||
Francesca’s Holdings Corp. (d) | 7,100 | (126,380 | ) | |||||||
Hertz Global Holdings, Inc. (d) | 200 | (4,336 | ) | |||||||
Lumber Liquidators Holdings, Inc. (d) | 4,200 | (129,276 | ) | |||||||
Macy’s, Inc. (d) | 7,500 | (486,825 | ) | |||||||
Nordstrom, Inc. (d) | 8,900 | (714,848 | ) | |||||||
PHH Corp. | 2,900 | (70,093 | ) | |||||||
Ross Stores, Inc. (d) | 1,100 | (115,896 | ) | |||||||
Sears Holdings Corp. (d) | 1,500 | (62,070 | ) | |||||||
Tile Shop Holdings, Inc. (d) | 800 | (9,688 | ) | |||||||
TJX Cos., Inc. | 1,700 | (119,085 | ) | |||||||
Tractor Supply Co. (d) | 21,500 | (1,828,790 | ) | |||||||
Vitamin Shoppe, Inc. (d) | 600 | (24,714 | ) | |||||||
Wayfair, Inc. Class A (d) | 1,000 | (32,120 | ) | |||||||
|
| |||||||||
| (5,746,476 | ) | |||||||||
|
| |||||||||
Semiconductors — (0.3)% | ||||||||||
Advanced Micro Devices, Inc. (d) | 64,400 | (172,592 | ) | |||||||
Altera Corp. (d) | 5,000 | (214,550 | ) | |||||||
Applied Micro Circuits Corp. (d) | 11,600 | (59,160 | ) | |||||||
Applied Optoelectronics, Inc. (d) | 400 | (5,552 | ) | |||||||
Atmel Corp. (d) | 14,400 | (118,512 | ) | |||||||
Brooks Automation, Inc. (d) | 1,000 | (11,630 | ) | |||||||
Cavium, Inc. (d) | 6,500 | (460,330 | ) | |||||||
Inphi Corp. | 400 | (7,132 | ) | |||||||
Intersil Corp. Class A | 100 | (1,432 | ) | |||||||
InvenSense, Inc. (d) | 10,600 | (161,226 | ) | |||||||
Lam Research Corp. (d) | 17,600 | (1,236,136 | ) | |||||||
Mattson Technology, Inc. (d) | 200 | (788 | ) | |||||||
Pixelworks, Inc. (d) | 12,400 | (62,248 | ) | |||||||
Power Integrations, Inc. (d) | 200 | (10,416 | ) | |||||||
Qorvo, Inc. | 23 | (1,833 | ) | |||||||
See Notes to Consolidated Financial Statements.
196
Blackstone Alternative Multi-Strategy Fund and Subsidiaries
Consolidated Schedule of Investments (Continued)
March 31, 2015
Security Description | Shares | Value | ||||||||
QuickLogic Corp. (d) | 5,000 | $ | (9,650 | ) | ||||||
Rubicon Technology, Inc. (d) | 1,100 | (4,334 | ) | |||||||
Semtech Corp. (d) | 800 | (21,316 | ) | |||||||
Skyworks Solutions, Inc. (d) | 3,800 | (373,502 | ) | |||||||
Universal Display Corp. (d) | 12,700 | (593,725 | ) | |||||||
Vitesse Semiconductor Corp. (d) | 2,300 | (12,213 | ) | |||||||
|
| |||||||||
| (3,538,277 | ) | |||||||||
|
| |||||||||
Software — (0.7)% | ||||||||||
A10 Networks, Inc. (d) | 4,300 | (18,619 | ) | |||||||
Advent Software, Inc. (d) | 7,200 | (317,592 | ) | |||||||
Amber Road, Inc. (d) | 300 | (2,775 | ) | |||||||
ANSYS, Inc. (d) | 5,300 | (467,407 | ) | |||||||
athenahealth, Inc. | 300 | (35,817 | ) | |||||||
Benefitfocus, Inc. (d) | 2,900 | (106,691 | ) | |||||||
Brightcove, Inc. (d) | 1,400 | (10,262 | ) | |||||||
Castlight Health, Inc. Class B (d) | 1,300 | (10,088 | ) | |||||||
Cerner Corp. (d) | 27,500 | (2,014,650 | ) | |||||||
ChannelAdvisor Corp. (d) | 2,900 | (28,101 | ) | |||||||
Cornerstone OnDemand, Inc. (d) | 9,400 | (271,566 | ) | |||||||
Datawatch Corp. (d) | 800 | (5,432 | ) | |||||||
Dealertrack Technologies, Inc. (d) | 5,900 | (227,268 | ) | |||||||
Digital Turbine, Inc. (d) | 500 | (1,630 | ) | |||||||
FireEye, Inc. (d) | 15,100 | (592,675 | ) | |||||||
Glu Mobile, Inc. (d) | 80,600 | (403,806 | ) | |||||||
Guidewire Software, Inc. (d) | 1,300 | (68,393 | ) | |||||||
HubSpot, Inc. | 600 | (23,940 | ) | |||||||
Imperva, Inc. (d) | 5,600 | (239,120 | ) | |||||||
Interactive Intelligence Group, Inc. (d) | 100 | (4,118 | ) | |||||||
Jack Henry & Associates, Inc. (d) | 2,800 | (195,692 | ) | |||||||
Jive Software, Inc. (d) | 3,900 | (20,007 | ) | |||||||
KEYW Holding Corp. (d) | 1,000 | (8,230 | ) | |||||||
LogMeIn, Inc. (d) | 4,500 | (251,955 | ) | |||||||
Manhattan Associates, Inc. (d) | 1,100 | (55,671 | ) | |||||||
MedAssets, Inc. (d) | 200 | (3,764 | ) | |||||||
Mitek Systems, Inc. (d) | 700 | (2,212 | ) | |||||||
NetSuite, Inc. (d) | 100 | (9,276 | ) | |||||||
OPOWER, Inc. | 500 | (5,065 | ) | |||||||
Oracle Corp. (d) | 2,500 | (107,875 | ) | |||||||
salesforce.com, Inc. | 6,400 | (427,584 | ) | |||||||
Solera Holdings, Inc. (d) | 19,900 | (1,028,034 | ) | |||||||
Splunk, Inc. (d) | 21,400 | (1,266,880 | ) | |||||||
Ultimate Software Group, Inc. (d) | 300 | (50,987 | ) | |||||||
Varonis Systems, Inc. | 1,300 | (33,358 | ) | |||||||
Verint Systems, Inc. | 200 | (12,386 | ) | |||||||
VirnetX Holding Corp. (d) | 7,400 | (45,066 | ) | |||||||
See Notes to Consolidated Financial Statements.
197
Blackstone Alternative Multi-Strategy Fund and Subsidiaries
Consolidated Schedule of Investments (Continued)
March 31, 2015
Security Description | Shares | Value | ||||||||
Vringo, Inc. (d) | 18,600 | $ | (12,097 | ) | ||||||
Yodlee, Inc. | 100 | (1,346 | ) | |||||||
Zynga, Inc. Class A (d) | 47,900 | (136,515 | ) | |||||||
|
| |||||||||
| (8,523,950 | ) | |||||||||
|
| |||||||||
Specialty Finance — (0.4)% | ||||||||||
Ally Financial, Inc. (d) | 27,900 | (585,342 | ) | |||||||
Altisource Portfolio Solutions SA | 300 | (3,861 | ) | |||||||
Altisource Residential Corp. | 500 | (10,430 | ) | |||||||
Apollo Residential Mortgage, Inc. (d) | 8,300 | (132,385 | ) | |||||||
Ares Commercial Real Estate Corp. (d) | 2,000 | (22,100 | ) | |||||||
ARMOUR Residential REIT, Inc. (d) | 124,200 | (393,714 | ) | |||||||
Blackstone Mortgage Trust, Inc. Class A (d) | 5,700 | (161,709 | ) | |||||||
CIT Group, Inc. | 1,900 | (85,728 | ) | |||||||
Colony Financial, Inc. (d) | 6,000 | (155,520 | ) | |||||||
CYS Investments, Inc. (d) | 6,600 | (58,806 | ) | |||||||
Ellie Mae, Inc. (d) | 1,100 | (60,841 | ) | |||||||
Encore Capital Group, Inc. (d) | 1,900 | (79,021 | ) | |||||||
Flagstar Bancorp, Inc. (d) | 1,500 | (21,765 | ) | |||||||
JAVELIN Mortgage Investment Corp. (d) | 4,100 | (30,996 | ) | |||||||
JG Wentworth Co. Class A (d) | 500 | (5,195 | ) | |||||||
LendingClub Corp. (d) | 14,500 | (284,925 | ) | |||||||
MGIC Investment Corp. (d) | 900 | (8,667 | ) | |||||||
MoneyGram International, Inc. (d) | 2,200 | (19,008 | ) | |||||||
Nationstar Mortgage Holdings, Inc. (d) | 12,900 | (319,533 | ) | |||||||
New York Mortgage Trust, Inc. (d) | 7,500 | (58,200 | ) | |||||||
NorthStar Realty Finance Corp. | 14,200 | (257,304 | ) | |||||||
Ocwen Financial Corp. (d) | 53,400 | (440,550 | ) | |||||||
Orchid Island Capital, Inc. (d) | 3,300 | (43,692 | ) | |||||||
RAIT Financial Trust (d) | 16,100 | (110,446 | ) | |||||||
Redwood Trust, Inc. (d) | 8,300 | (148,321 | ) | |||||||
Regional Management Corp. (d) | 1,300 | (19,188 | ) | |||||||
Santander Consumer USA Holdings, Inc. | 100 | (2,314 | ) | |||||||
Starwood Property Trust, Inc. (d) | 2,300 | (55,890 | ) | |||||||
Stonegate Mortgage Corp. (d) | 1,700 | (18,394 | ) | |||||||
Walter Investment Management Corp. (d) | 17,900 | (289,085 | ) | |||||||
Western Asset Mortgage Capital Corp. (d) | 31,900 | (481,052 | ) | |||||||
Xoom Corp. (d) | 11,000 | (161,590 | ) | |||||||
|
| |||||||||
| (4,525,572 | ) | |||||||||
|
| |||||||||
Technology Services — (0.2)% | ||||||||||
Accenture PLC Class A (d) | 7,100 | (665,199 | ) | |||||||
FactSet Research Systems, Inc. (d) | 200 | (31,840 | ) | |||||||
FICO STRIPS—PRINCIPAL (d) | 300 | (26,616 | ) | |||||||
Gartner, Inc. (d) | 3,000 | (251,550 | ) | |||||||
Genpact Ltd. (d) | 200 | (4,650 | ) | |||||||
See Notes to Consolidated Financial Statements.
198
Blackstone Alternative Multi-Strategy Fund and Subsidiaries
Consolidated Schedule of Investments (Continued)
March 31, 2015
Security Description | Shares | Value | ||||||||
iGATE Corp. (d) | 4,700 | $ | (200,502 | ) | ||||||
International Business Machines Corp. (d) | 3,500 | (561,750 | ) | |||||||
MarketAxess Holdings, Inc. (d) | 100 | (8,290 | ) | |||||||
MAXIMUS, Inc. | 100 | (6,676 | ) | |||||||
Paychex, Inc. | 400 | (19,846 | ) | |||||||
Rentrak Corp. (d) | 200 | (11,112 | ) | |||||||
Spherix, Inc. (d) | 500 | (418 | ) | |||||||
Thomson Reuters Corp. (d) | 22,700 | (920,712 | ) | |||||||
Zayo Group Holdings, Inc. (d) | 7,900 | (220,884 | ) | |||||||
|
| |||||||||
| (2,930,045 | ) | |||||||||
|
| |||||||||
Telecommunications — (0.1)% | ||||||||||
8x8, Inc. (d) | 2,100 | (17,640 | ) | |||||||
Alaska Communications Systems Group, Inc. (d) | 200 | (336 | ) | |||||||
Consolidated Communications Holdings, Inc. (d) | 1,400 | (28,560 | ) | |||||||
DigitalGlobe, Inc. (d) | 8,700 | (296,409 | ) | |||||||
Equinix, Inc. (d) | 27 | (6,287 | ) | |||||||
Global Eagle Entertainment, Inc. (d) | 2,400 | (31,944 | ) | |||||||
Globalstar, Inc. (d) | 10,800 | (35,964 | ) | |||||||
Gogo, Inc. (d) | 37,200 | (709,032 | ) | |||||||
Intelsat SA (d) | 700 | (8,400 | ) | |||||||
NTELOS Holdings Corp. (d) | 300 | (1,440 | ) | |||||||
Sprint Corp. (d) | 10,000 | (47,400 | ) | |||||||
WidePoint Corp. (d) | 400 | (528 | ) | |||||||
|
| |||||||||
| (1,183,940 | ) | |||||||||
|
| |||||||||
Transportation & Logistics — (0.1)% | ||||||||||
Baltic Trading Ltd. (d) | 17,000 | (25,330 | ) | |||||||
Landstar System, Inc. (d) | 2,500 | (165,750 | ) | |||||||
Nordic American Tankers Ltd. (d) | 36,400 | (433,524 | ) | |||||||
Odyssey Marine Exploration, Inc. (d) | 800 | (560 | ) | |||||||
XPO Logistics, Inc. (d) | 12,800 | (582,016 | ) | |||||||
|
| |||||||||
| (1,207,180 | ) | |||||||||
|
| |||||||||
Transportation Equipment — (0.1)% | ||||||||||
Clean Diesel Technologies, Inc. (d) | 400 | (728 | ) | |||||||
Greenbrier Cos., Inc. | 1,700 | (98,600 | ) | |||||||
Navistar International Corp. (d) | 10,900 | (321,550 | ) | |||||||
Wabash National Corp. (d) | 13,000 | (183,300 | ) | |||||||
Wabtec Corp. (d) | 100 | (9,501 | ) | |||||||
|
| |||||||||
| (613,679 | ) | |||||||||
|
| |||||||||
Utilities — (0.1)% | ||||||||||
Aqua America, Inc. (d) | 5,400 | (142,290 | ) | |||||||
Atlantic Power Corp. (d) | 24,600 | (69,126 | ) | |||||||
Cleco Corp. (d) | 200 | (10,904 | ) | |||||||
See Notes to Consolidated Financial Statements.
199
Blackstone Alternative Multi-Strategy Fund and Subsidiaries
Consolidated Schedule of Investments (Continued)
March 31, 2015
Security Description | Shares | Value | ||||||||
Dynegy, Inc. (d) | 1,300 | $ | (40,859 | ) | ||||||
Exelon Corp. (d) | 1,000 | (33,610 | ) | |||||||
Laclede Group, Inc. (d) | 6,500 | (332,930 | ) | |||||||
New Jersey Resources Corp. (d) | 200 | (6,212 | ) | |||||||
NiSource, Inc. | 300 | (13,248 | ) | |||||||
NorthWestern Corp. (d) | 600 | (32,274 | ) | |||||||
NRG Energy, Inc. (d) | 13,000 | (327,470 | ) | |||||||
NRG Yield, Inc. Class A (d) | 2,700 | (136,971 | ) | |||||||
ONE Gas, Inc. (d) | 100 | (4,323 | ) | |||||||
Pepco Holdings, Inc. | 7,100 | (190,493 | ) | |||||||
|
| |||||||||
| (1,340,710 | ) | |||||||||
|
| |||||||||
Waste & Environmental Service Equipment & Facility — (0.0)% |
| |||||||||
CLARCOR, Inc. (d) | 1,500 | (99,090 | ) | |||||||
Donaldson Co., Inc. (d) | 700 | (26,397 | ) | |||||||
US Ecology, Inc. (d) | 1,000 | (49,970 | ) | |||||||
Vertex Energy, Inc. (d) | 500 | (1,850 | ) | |||||||
|
| |||||||||
| (177,307 | ) | |||||||||
|
| |||||||||
Total United States | (180,082,390 | ) | ||||||||
|
| |||||||||
TOTAL COMMON STOCK | (219,651,728 | ) | ||||||||
|
| |||||||||
Security Description | Principal Amount | Value | ||||||||
CORPORATE BONDS & NOTES — (0.1)% | ||||||||||
Canada — (0.0)% | ||||||||||
Restaurants — (0.0)% | ||||||||||
1011778 BC ULC / New Red Finance, Inc. (d),(e) | $ | 220,000 | (230,175 | ) | ||||||
|
| |||||||||
Total Canada | (230,175 | ) | ||||||||
|
| |||||||||
United States — (0.1)% | ||||||||||
Casinos & Gaming — (0.0)% | ||||||||||
Scientific Games International, 10.00%, 12/01/22 (d),(e) | 320,000 | (303,200 | ) | |||||||
|
| |||||||||
Consumer Products — (0.0)% | ||||||||||
American Achievement Corp., 10.88%, 04/15/16 (d),(e) | 195,000 | (192,075 | ) | |||||||
|
| |||||||||
Exploration & Production — (0.1)% | ||||||||||
California Resources Corp., 6.00%, 11/15/24 (d),(e) | 490,000 | (434,263 | ) | |||||||
|
| |||||||||
Semiconductors — (0.0)% | ||||||||||
Amkor Technology, Inc., 6.38%, 10/01/22 (d) | 110,000 | (114,400 | ) | |||||||
|
| |||||||||
Total United States | (1,043,938 | ) | ||||||||
|
| |||||||||
TOTAL CORPORATE BONDS & NOTES | (1,274,113 | ) | ||||||||
|
| |||||||||
See Notes to Consolidated Financial Statements.
200
Blackstone Alternative Multi-Strategy Fund and Subsidiaries
Consolidated Schedule of Investments (Continued)
March 31, 2015
Security Description | Shares | Value | ||||||||
EXCHANGE-TRADED FUNDS — (3.5)% | ||||||||||
Alerian MLP ETF (d) | 11,500 | $ | (190,555 | ) | ||||||
Consumer Staples Select Sector SPDR Fund (d) | 3,106 | (151,386 | ) | |||||||
Energy Select Sector SPDR Fund (d) | 1,174 | (91,079 | ) | |||||||
Financial Select Sector SPDR Fund (d) | 230,300 | (5,552,533 | ) | |||||||
Health Care Select Sector SPDR Fund (d) | 61,200 | (4,437,000 | ) | |||||||
iShares iBoxx $ Investment Grade Corporate Bond ETF (d) | 19,100 | (2,324,661 | ) | |||||||
iShares MSCI Emerging Markets ETF (d) | 902 | (36,197 | ) | |||||||
iShares Nasdaq Biotechnology ETF (d) | 1,406 | (482,863 | ) | |||||||
iShares Russell 2000 ETF (d) | 10,294 | (1,280,059 | ) | |||||||
iShares U.S. Healthcare ETF (d) | 3,400 | (524,688 | ) | |||||||
iShares U.S. Healthcare Providers ETF (d) | 4,100 | (545,546 | ) | |||||||
Powershares QQQ Trust Series 1 (d) | 16,500 | (1,742,400 | ) | |||||||
SPDR S&P 500 ETF Trust (d) | 32,700 | (6,750,261 | ) | |||||||
SPDR S&P Biotech ETF (d) | 10,300 | (2,322,650 | ) | |||||||
SPDR S&P Regional Banking ETF (d) | 158,700 | (6,479,721 | ) | |||||||
Vanguard FTSE Developed Markets ETF (d) | 212,500 | (8,463,875 | ) | |||||||
|
| |||||||||
TOTAL EXCHANGE-TRADED FUNDS (PROCEEDS $40,450,056) | (41,375,474 | ) | ||||||||
|
| |||||||||
TOTAL SECURITIES SOLD SHORT— (21.7)% (PROCEEDS $266,144,329) | $ | (262,301,315 | ) | |||||||
|
| |||||||||
Footnote Legend:
| (a) | All or a portion of this security is pledged as collateral for derivative financial instruments. |
| (b) | Non-income producing. |
| (c) | All or a portion of this security is temporarily on loan to unaffiliated broker/dealers. In addition, “Other Assets” may include pending sales that are also on loan. |
| (d) | Security is held by a consolidated wholly-owned subsidiary of Blackstone Alternative Multi-Strategy Fund. |
| (e) | Security is exempt from registration pursuant to Rule 144A under the Securities Act of 1933, as amended. Security may only be sold to qualified institutional buyers unless registered under the Securities Act of 1933, as amended, or otherwise exempt from registration. |
| (f) | Variable/floating interest rate security. Rate presented is as of March 31, 2015. |
| (g) | Security considered illiquid. |
| (h) | Security is currently in default due to bankruptcy or failure to make payment of principal or interest. |
| (i) | Security is perpetual in nature and has no stated maturity. |
| (j) | Represents a step-up bond. Coupon rate increases in increments to maturity. Rate presented is as of March 31, 2015. Maturity date presented is the ultimate maturity. |
| (k) | All or a portion of this security is pledged as collateral in connection with reverse repurchase agreements. |
| (l) | Assets, other than investments in securities, less liabilities. |
See Notes to Consolidated Financial Statements.
201
Blackstone Alternative Multi-Strategy Fund and Subsidiaries
Consolidated Schedule of Investments (Continued)
March 31, 2015
Options Written Contracts Outstanding at March 31, 2015
Strike | Expiration | Contracts | Premium | Market | Unrealized | |||||||||||||||
Exchange-Traded Call Options Written |
| |||||||||||||||||||
Apple, Inc. | 131.00 USD | 05/01/15 | 1,170 | $ | (280,748 | ) | $ | (258,570 | ) | $ | 22,178 | |||||||||
CBOE SPX Volatility Index | 20.00 USD | 04/15/15 | 209 | (9,397 | ) | (9,405 | ) | (8 | ) | |||||||||||
CBOE SPX Volatility Index | 22.00 USD | 06/17/15 | 418 | (63,102 | ) | (64,790 | ) | (1,688 | ) | |||||||||||
CBOE SPX Volatility Index | 24.00 USD | 05/20/15 | 205 | (32,816 | ) | (17,425 | ) | 15,391 | ||||||||||||
Microsoft Corp. | 46.00 USD | 05/15/15 | 6 | (444 | ) | (42 | ) | 402 | ||||||||||||
Phillips 66 | 82.50 USD | 05/15/15 | 3 | (534 | ) | (465 | ) | 69 | ||||||||||||
Qualcomm, Inc. | 72.50 USD | 04/17/15 | 4 | (515 | ) | (84 | ) | 431 | ||||||||||||
| $ | (387,556 | ) | $ | (350,781 | ) | $ | 36,775 | |||||||||||||
Exchange-Traded Put Options Written |
| |||||||||||||||||||
iShares Russell 2000 ETF | 115.00 USD | 05/15/15 | 125 | $ | (8,245 | ) | $ | (9,750 | ) | $ | (1,505 | ) | ||||||||
iShares Russell 2000 ETF | 119.00 USD | 05/15/15 | 125 | (15,120 | ) | (16,625 | ) | (1,505 | ) | |||||||||||
S&P 500 Index | 1,930.00 USD | 04/17/15 | 90 | (71,726 | ) | (18,720 | ) | 53,006 | ||||||||||||
S&P 500 Index | 1,550.00 USD | 06/19/15 | 83 | (66,468 | ) | (15,355 | ) | 51,113 | ||||||||||||
Smith & Nephew PLC | 11.50 GBP | 04/17/15 | 29 | (27,141 | ) | (15,056 | ) | 12,085 | ||||||||||||
SPDR S&P 500 ETF Trust | 201.00 USD | 04/17/15 | 209 | (13,367 | ) | (20,900 | ) | (7,533 | ) | |||||||||||
SPDR S&P 500 ETF Trust | 203.00 USD | 04/17/15 | 209 | (19,219 | ) | (29,887 | ) | (10,668 | ) | |||||||||||
SPDR S&P 500 ETF Trust | 206.00 USD | 04/10/15 | 627 | (77,095 | ) | (114,741 | ) | (37,646 | ) | |||||||||||
SPDR S&P 500 ETF Trust | 206.50 USD | 04/02/15 | 418 | (20,047 | ) | (41,382 | ) | (21,335 | ) | |||||||||||
SPDR S&P 500 ETF Trust | 193.00 USD | 05/15/15 | 334 | (45,076 | ) | (39,746 | ) | 5,330 | ||||||||||||
SPDR S&P 500 ETF Trust | 198.00 USD | 05/15/15 | 334 | (72,797 | ) | (62,792 | ) | 10,005 | ||||||||||||
| $ | (436,301 | ) | $ | (384,954 | ) | $ | 51,347 | |||||||||||||
Counterparty | Strike | Expiration | Notional | Premium | Market | Unrealized | ||||||||||||||||||
FX OTC Call Options Written |
| |||||||||||||||||||||||
USD/CNH Currency | Morgan Stanley Capital Services LLC | 7.40 CNH | 11/06/17 | 1,030,000 USD | $ | (27,604 | ) | $ | (19,029 | ) | $ | 8,575 | ||||||||||||
See Notes to Consolidated Financial Statements.
202
Blackstone Alternative Multi-Strategy Fund and Subsidiaries
Consolidated Schedule of Investments (Continued)
March 31, 2015
Counterparty | Strike | Expiration | Notional | Premium | Market | Unrealized | ||||||||||||||||||
USD/CNH Currency | Morgan Stanley Capital Services LLC | 7.40 CNH | 11/06/17 | 1,160,000 USD | $ | (31,320 | ) | $ | (21,431 | ) | $ | 9,889 | ||||||||||||
USD/CNH Currency | Morgan Stanley Capital Services LLC | 7.40 CNH | 11/06/17 | 2,430,000 USD | (64,869 | ) | (44,893 | ) | 19,976 | |||||||||||||||
USD/JPY Currency | Morgan Stanley Capital Services LLC | 137.00 JPY | 01/12/16 | 1,770,000 USD | (14,372 | ) | (9,870 | ) | 4,502 | |||||||||||||||
USD/JPY Currency | Morgan Stanley Capital Services LLC | 150.00 JPY | 01/12/16 | 1,770,000 USD | (5,806 | ) | (2,708 | ) | 3,098 | |||||||||||||||
USD/JPY Currency | Morgan Stanley Capital Services LLC | 137.00 JPY | 01/12/16 | 280,000 USD | (2,136 | ) | (1,561 | ) | 575 | |||||||||||||||
USD/JPY Currency | Morgan Stanley Capital Services LLC | 137.00 JPY | 01/12/16 | 590,000 USD | (4,071 | ) | (3,289 | ) | 782 | |||||||||||||||
USD/JPY Currency | Morgan Stanley Capital Services LLC | 150.00 JPY | 01/12/16 | 280,000 USD | (864 | ) | (428 | ) | 436 | |||||||||||||||
USD/JPY Currency | Morgan Stanley Capital Services LLC | 150.00 JPY | 01/12/16 | 590,000 USD | (1,593 | ) | (902 | ) | 691 | |||||||||||||||
USD/JPY Currency | Morgan Stanley Capital Services LLC | 137.00 JPY | 01/12/16 | 530,000 USD | (2,417 | ) | (2,954 | ) | (537 | ) | ||||||||||||||
USD/JPY Currency | Morgan Stanley Capital Services LLC | 150.00 JPY | 01/12/16 | 530,000 USD | (776 | ) | (811 | ) | (35 | ) | ||||||||||||||
| $ | (155,828 | ) | $ | (107,876 | ) | $ | 47,952 | |||||||||||||||||
FX OTC Put Options Written |
| |||||||||||||||||||||||
USD/JPY Currency | Morgan Stanley Capital Services LLC | 105.00 JPY | 01/12/16 | 530,000 USD | $ | (2,348 | ) | $ | (2,067 | ) | $ | 281 | ||||||||||||
See Notes to Consolidated Financial Statements.
203
Blackstone Alternative Multi-Strategy Fund and Subsidiaries
Consolidated Schedule of Investments (Continued)
March 31, 2015
Counterparty | Strike | Expiration | Notional | Premium | Market | Unrealized | ||||||||||||||||||
USD/JPY Currency | Morgan Stanley Capital Services LLC | 105.00 JPY | 01/12/16 | 590,000 USD | $ | (4,307 | ) | $ | (2,301 | ) | $ | 2,006 | ||||||||||||
USD/JPY Currency | Morgan Stanley Capital Services LLC | 105.00 JPY | 01/12/16 | 280,000 USD | (2,357 | ) | (1,092 | ) | 1,265 | |||||||||||||||
USD/JPY Currency | Morgan Stanley Capital Services LLC | 105.00 JPY | 01/12/16 | 1,770,000 USD | (15,187 | ) | (6,901 | ) | 8,286 | |||||||||||||||
| $ | (24,199 | ) | $ | (12,361 | ) | $ | 11,838 | |||||||||||||||||
OTC Put Options Written |
| |||||||||||||||||||||||
Financial Select Sector SPDR Fund | Morgan Stanley & Co. International plc | 18.25 USD | 06/17/15 | 355,800 | $ | (32,925 | ) | $ | (20,051 | ) | $ | 12,874 | ||||||||||||
iShares Russell 2000 Index | JPMorgan Chase Bank, N.A. | 89.96 USD | 06/19/15 | 45,010 | (19,024 | ) | (5,894 | ) | 13,130 | |||||||||||||||
iShares Trust | Morgan Stanley & Co. International plc | 92.00 USD | 09/18/15 | 45,500 | (39,656 | ) | (22,981 | ) | 16,675 | |||||||||||||||
| $ | (91,605 | ) | $ | (48,926 | ) | $ | 42,679 | |||||||||||||||||
Total Options Written Outstanding |
| $ | (1,095,489 | ) | $ | (904,898 | ) | $ | 190,591 | |||||||||||||||
Reverse Repurchase Agreements Outstanding at March 31, 2015
Counterparty | Interest Rate | Trade Date | Maturity Date | Face Value | Face Value Including Accrued Interest | |||||||||||
Credit Suisse Securities (Europe) Limited | (2.00)% | 02/25/15 | N/A | $ | 1,853,845 | $ | 1,850,343 | |||||||||
Credit Suisse Securities (USA) LLC | 1.50% | 02/04/15 | 05/04/15 | 1,478,000 | 1,481,453 | |||||||||||
Credit Suisse Securities (USA) LLC | 1.50% | 02/04/15 | 05/04/15 | 692,000 | 693,617 | |||||||||||
Credit Suisse Securities (USA) LLC | 1.93% | 03/19/15 | 04/20/15 | 611,000 | 611,425 | |||||||||||
Credit Suisse Securities (USA) LLC | 1.93% | 03/19/15 | 04/20/15 | 1,475,000 | 1,476,027 | |||||||||||
Credit Suisse Securities (USA) LLC | 1.93% | 03/19/15 | 04/20/15 | 1,379,000 | 1,379,960 | |||||||||||
See Notes to Consolidated Financial Statements.
204
Blackstone Alternative Multi-Strategy Fund and Subsidiaries
Consolidated Schedule of Investments (Continued)
March 31, 2015
Counterparty | Interest Rate | Trade Date | Maturity Date | Face Value | Face Value Including Accrued Interest | |||||||||||
Credit Suisse Securities (USA) LLC | 1.93% | 03/19/15 | 04/20/15 | $ | 355,000 | $ | 355,247 | |||||||||
Credit Suisse Securities (USA) LLC | 1.93% | 03/19/15 | 04/20/15 | 221,000 | 221,154 | |||||||||||
Credit Suisse Securities (USA) LLC | 1.93% | 03/19/15 | 04/20/15 | 592,000 | 592,412 | |||||||||||
Credit Suisse Securities (USA) LLC | 1.93% | 03/19/15 | 04/20/15 | 1,376,000 | 1,376,958 | |||||||||||
Credit Suisse Securities (USA) LLC | 1.93% | 03/19/15 | 04/20/15 | 834,000 | 834,580 | |||||||||||
Credit Suisse Securities (USA) LLC | 1.93% | 03/19/15 | 04/20/15 | 672,000 | 672,468 | |||||||||||
Credit Suisse Securities (USA) LLC | 1.93% | 03/19/15 | 04/20/15 | 1,256,000 | 1,256,874 | |||||||||||
J.P. Morgan Securities LLC | N/A | 03/25/15 | 04/07/15 | 502,865 | 502,865 | |||||||||||
Merrill Lynch, Pierce, Fenner & Smith, Inc. | 1.77% | 03/02/15 | 04/02/15 | 1,087,000 | 1,088,810 | |||||||||||
Merrill Lynch, Pierce, Fenner & Smith, Inc. | 1.77% | 03/02/15 | 04/02/15 | 1,029,000 | 1,030,714 | |||||||||||
Merrill Lynch, Pierce, Fenner & Smith, Inc. | 1.67% | 03/26/15 | 04/27/15 | 6,114,000 | 6,115,702 | |||||||||||
Merrill Lynch, Pierce, Fenner & Smith, Inc. | 1.68% | 03/20/15 | 04/22/15 | 939,000 | 939,526 | |||||||||||
Merrill Lynch, Pierce, Fenner & Smith, Inc. | 1.77% | 03/02/15 | 04/02/15 | 241,000 | 241,355 | |||||||||||
Merrill Lynch, Pierce, Fenner & Smith, Inc. | 1.77% | 03/04/15 | 04/07/15 | 508,000 | 508,699 | |||||||||||
Merrill Lynch, Pierce, Fenner & Smith, Inc. | 1.77% | 03/04/15 | 04/07/15 | 658,000 | 658,906 | |||||||||||
Merrill Lynch, Pierce, Fenner & Smith, Inc. | 1.77% | 03/23/15 | 04/02/15 | 333,000 | 333,148 | |||||||||||
Merrill Lynch, Pierce, Fenner & Smith, Inc. | 1.78% | 03/23/15 | 04/23/15 | 763,000 | 763,340 | |||||||||||
Merrill Lynch, Pierce, Fenner & Smith, Inc. | 1.80% | 01/29/15 | 04/29/15 | 1,495,000 | 1,499,634 | |||||||||||
Merrill Lynch, Pierce, Fenner & Smith, Inc. | 1.85% | 01/30/15 | 04/30/15 | 1,186,000 | 1,189,718 | |||||||||||
Merrill Lynch, Pierce, Fenner & Smith, Inc. | 1.86% | 02/05/15 | 05/05/15 | 534,000 | 535,517 | |||||||||||
Merrill Lynch, Pierce, Fenner & Smith, Inc. | 1.86% | 02/06/15 | 05/06/15 | 1,259,000 | 1,262,513 | |||||||||||
Merrill Lynch, Pierce, Fenner & Smith, Inc. | 1.86% | 02/06/15 | 05/06/15 | 1,416,000 | 1,419,951 | |||||||||||
Merrill Lynch, Pierce, Fenner & Smith, Inc. | 1.86% | 02/06/15 | 05/06/15 | 1,982,000 | 1,987,530 | |||||||||||
Royal Bank of Canada | 1.48% | 02/17/15 | 08/17/15 | 1,934,000 | 1,937,424 | |||||||||||
Royal Bank of Canada | 1.52% | 03/04/15 | 04/06/15 | 513,000 | 513,608 | |||||||||||
Total Reverse Repurchase Agreements Outstanding | $ | 35,288,710 | $ | 35,331,478 | ||||||||||||
Futures Contracts Outstanding at March 31, 2015
Description | Contracts | Exchange | Notional | Expiration | Unrealized | |||||||||||||||
Long Futures | ||||||||||||||||||||
3 Month Euro Swiss Interest RT | 284 | LIF | 71,531,715 CHF | 09/19/16 | $ | (35,723 | ) | |||||||||||||
90 Day Eurodollar | 336 | CME | 83,092,564 USD | 06/13/16 | 42,236 | |||||||||||||||
90 Day Sterling | 582 | ICE | 72,184,349 GBP | 12/16/15 | 126,832 | |||||||||||||||
Brent Crude | 8 | ICE | 471,259 USD | 05/14/15 | (21,579 | ) | ||||||||||||||
CAC40 10 Euro | 53 | Euronext | 2,661,138 EUR | 04/17/15 | 8,540 | |||||||||||||||
Cocoa | 96 | ICE | 2,594,752 USD | 05/13/15 | (3,712 | ) | ||||||||||||||
Coffee | 53 | ICE | 2,821,120 USD | 07/21/15 | (116,133 | ) | ||||||||||||||
Coffee | 27 | ICE | 1,659,571 USD | 05/18/15 | (313,958 | ) | ||||||||||||||
Cotton No. 2 | 32 | ICE | 1,015,351 USD | 05/06/15 | (5,751 | ) | ||||||||||||||
Euro Stoxx 50 | 68 | Eurex | 2,443,485 EUR | 06/19/15 | 27,522 | |||||||||||||||
Euro-BTP | 249 | Eurex | 34,839,981 EUR | 06/08/15 | 176,813 | |||||||||||||||
See Notes to Consolidated Financial Statements.
205
Blackstone Alternative Multi-Strategy Fund and Subsidiaries
Consolidated Schedule of Investments (Continued)
March 31, 2015
Description | Contracts | Exchange | Notional | Expiration | Unrealized | |||||||||||||||
Euro-Oat | 56 | Eurex | 8,662,132 EUR | 06/08/15 | $ | 82,437 | ||||||||||||||
Gold 100 Oz | 64 | COMEX | 7,714,133 USD | 06/26/15 | (141,653 | ) | ||||||||||||||
Hang Seng Index | 40 | HKFE | 49,142,210 HKD | 04/29/15 | 97,488 | |||||||||||||||
IBEX 35 Index | 35 | MEFF | 3,827,966 EUR | 04/17/15 | 208,211 | |||||||||||||||
Live Cattle | 82 | CME | 4,801,216 USD | 06/30/15 | 195,044 | |||||||||||||||
Long Gilt | 255 | ICE | 30,316,438 GBP | 06/26/15 | 704,336 | |||||||||||||||
Mex Bolsa Index | 306 | MexDer | 133,430,774 MXN | 06/19/15 | (3,175 | ) | ||||||||||||||
Nasdaq 100 E-Mini | 24 | CME | 2,099,609 USD | 06/19/15 | (21,449 | ) | ||||||||||||||
Nikkei 225 | 71 | OSE | 1,326,958,350 JPY | 06/11/15 | 308,097 | |||||||||||||||
NY Harbor ULSD | 36 | NYMEX | 2,653,036 USD | 04/30/15 | (70,540 | ) | ||||||||||||||
OMXS30 Index | 478 | Nasdaq OMX | 79,002,828 SEK | 04/17/15 | 28,979 | |||||||||||||||
S&P 500 E-Mini | 58 | CME | 5,996,747 USD | 06/19/15 | (20,427 | ) | ||||||||||||||
Soybean Meal | 115 | CBOT | 3,714,355 USD | 05/14/15 | 43,846 | |||||||||||||||
Soybean Oil | 230 | CBOT | 4,518,184 USD | 07/14/15 | (292,624 | ) | ||||||||||||||
Sugar 11 | 56 | ICE | 876,431 USD | 04/30/15 | (128,181 | ) | ||||||||||||||
Topix Index | 2 | OSE | 30,364,724 JPY | 06/11/15 | 4,213 | |||||||||||||||
U.S. Treasury 10-Year Note | 329 | CBOT | 42,130,612 USD | 06/19/15 | 279,544 | |||||||||||||||
|
| |||||||||||||||||||
| $ | 1,159,233 | |||||||||||||||||||
|
| |||||||||||||||||||
Short Futures | ||||||||||||||||||||
3 Month Euribor | 1,562 | ICE | 390,481,360 EUR | 09/14/15 | $ | (20,043 | ) | |||||||||||||
90 Day Bank Bill | 138 | SFE | 137,329,767 AUD | 09/10/15 | (35,764 | ) | ||||||||||||||
90 Day Eurodollar | 1 | CME | 244,910 USD | 06/19/17 | (865 | ) | ||||||||||||||
90 Day Eurodollar | 1 | CME | 242,930 USD | 06/15/20 | (608 | ) | ||||||||||||||
90 Day Eurodollar | 6 | CME | 1,489,041 USD | 09/14/15 | (3,759 | ) | ||||||||||||||
90 Day Eurodollar | 4 | CME | 990,096 USD | 12/14/15 | (3,354 | ) | ||||||||||||||
90 Day Eurodollar | 22 | CME | 5,443,219 USD | 03/14/16 | (10,581 | ) | ||||||||||||||
90 Day Eurodollar | 22 | CME | 5,415,832 USD | 09/19/16 | (16,793 | ) | ||||||||||||||
90 Day Eurodollar | 20 | CME | 4,915,000 USD | 12/19/16 | (14,750 | ) | ||||||||||||||
90 Day Eurodollar | 4 | CME | 970,740 USD | 12/18/17 | (10,010 | ) | ||||||||||||||
90 Day Eurodollar | 1 | CME | 243,310 USD | 09/18/17 | (2,165 | ) | ||||||||||||||
90 Day Eurodollar | 4 | CME | 973,952 USD | 03/19/18 | (5,948 | ) | ||||||||||||||
90 Day Eurodollar | 2 | CME | 482,132 USD | 12/16/19 | (5,443 | ) | ||||||||||||||
90 Day Eurodollar | 2 | CME | 482,582 USD | 09/16/19 | (5,293 | ) | ||||||||||||||
90 Day Eurodollar | 6 | CME | 1,493,247 USD | 06/15/15 | (1,803 | ) | ||||||||||||||
90 Day Eurodollar | 3 | CME | 735,167 USD | 03/13/17 | (3,208 | ) | ||||||||||||||
90 Day Eurodollar | 3 | CME | 730,630 USD | 06/18/18 | (3,658 | ) | ||||||||||||||
90 Day Eurodollar | 1 | CME | 242,010 USD | 09/17/18 | (2,565 | ) | ||||||||||||||
90 Day Eurodollar | 2 | CME | 486,620 USD | 03/16/20 | (705 | ) | ||||||||||||||
90 Day Eurodollar | 20 | CME | 4,937,525 USD | 06/13/16 | (10,975 | ) | ||||||||||||||
Australian 10-Year Bond | 43 | SFE | 5,608,152 AUD | 06/15/15 | (73,782 | ) | ||||||||||||||
Banker’s Acceptance | 343 | CDE | 84,950,940 CAD | 09/19/16 | (8,022 | ) | ||||||||||||||
Canada 10-Year Bond | 183 | CDE | 26,196,823 CAD | 06/19/15 | 59,534 | |||||||||||||||
CBOE Volatility Index | 216 | CFE | 3,919,524 USD | 05/20/15 | 69,324 | |||||||||||||||
See Notes to Consolidated Financial Statements.
206
Blackstone Alternative Multi-Strategy Fund and Subsidiaries
Consolidated Schedule of Investments (Continued)
March 31, 2015
Description | Contracts | Exchange | Notional | Expiration | Unrealized | |||||||||||||||
DAX Index | 9 | Eurex | 2,709,211 EUR | 06/19/15 | $ | 7,364 | ||||||||||||||
Euro Stoxx 50 | 1,527 | Eurex | 54,740,650 EUR | 06/19/15 | (757,751 | ) | ||||||||||||||
Euro-Bund | 260 | Eurex | 40,886,642 EUR | 06/08/15 | (420,378 | ) | ||||||||||||||
FTSE 100 Index | 110 | ICE | 7,486,320 GBP | 06/19/15 | 128,493 | |||||||||||||||
FTSE/JSE Top 40 | 318 | Safex | 148,707,140 ZAR | 06/18/15 | 97,598 | |||||||||||||||
FTSE/MIB Index | 10 | IDEM | 1,117,982 EUR | 06/19/15 | (24,643 | ) | ||||||||||||||
Gasoil | 69 | ICE | 3,812,184 USD | 09/10/15 | 94,809 | |||||||||||||||
Gasoline RBOB | 10 | NYMEX | 769,676 USD | 04/30/15 | 26,276 | |||||||||||||||
Japan 10-Year Bond | 128 | OSE | 18,776,941,200 JPY | 06/11/15 | (560,460 | ) | ||||||||||||||
Lean Hogs | 87 | CME | 2,586,571 USD | 06/12/15 | (51,269 | ) | ||||||||||||||
Low Sulphur Gasoil | 33 | ICE | 1,779,786 USD | 06/11/15 | 47,286 | |||||||||||||||
Nasdaq 100 E-Mini | 42 | CME | 3,686,960 USD | 06/19/15 | 50,180 | |||||||||||||||
Natural Gas | 45 | NYMEX | 1,243,412 USD | 04/28/15 | 55,412 | |||||||||||||||
Natural Gas | 100 | NYMEX | 2,981,118 USD | 10/28/15 | 65,118 | |||||||||||||||
S&P 500 E-Mini | 1,042 | CME | 107,836,631 USD | 06/19/15 | 468,951 | |||||||||||||||
S&P/TSX 60 Index | 73 | CDE | 12,655,100 CAD | 06/18/15 | 17,149 | |||||||||||||||
SGX CNX Nifty | 26 | SGX | 448,844 USD | 04/30/15 | 4,816 | |||||||||||||||
Silver | 25 | COMEX | 2,029,319 USD | 05/27/15 | (45,431 | ) | ||||||||||||||
Soybean Oil | 277 | CBOT | 5,322,616 USD | 05/14/15 | 271,798 | |||||||||||||||
SPI 200 | 96 | SFE | 14,032,688 AUD | 06/18/15 | (71,376 | ) | ||||||||||||||
Sugar 11 | 325 | ICE | 5,001,784 USD | 06/30/15 | 611,945 | |||||||||||||||
Swiss Market Index | 42 | Eurex | 3,810,987 CHF | 06/19/15 | 31,454 | |||||||||||||||
Topix Index | 49 | OSE | 749,947,548 JPY | 06/11/15 | (53,091 | ) | ||||||||||||||
U.S. Treasury 10-Year Note | 14 | CBOT | 1,795,680 USD | 06/19/15 | (9,007 | ) | ||||||||||||||
U.S. Treasury Long Bond | 13 | CBOT | 2,075,964 USD | 06/19/15 | (54,410 | ) | ||||||||||||||
|
| |||||||||||||||||||
| $ | (180,403 | ) | ||||||||||||||||||
|
| |||||||||||||||||||
Total Futures Contracts Outstanding |
| $ | 978,830 | |||||||||||||||||
|
| |||||||||||||||||||
Forward Foreign Currency Exchange Contracts Outstanding at March 31, 2015
Currency | Amount in | Currency | Amount in | Counterparty | Settlement | Unrealized | ||||||||||||||||
AUD | 31,323 | USD | 23,770 | Morgan Stanley & Co. LLC | 06/30/15 | $ | (30 | ) | ||||||||||||||
AUD | 15,260 | USD | 11,701 | Morgan Stanley & Co. LLC | 06/30/15 | (136 | ) | |||||||||||||||
AUD | 505,816 | USD | 385,366 | Morgan Stanley Capital Services LLC | 06/17/15 | (1,755 | ) | |||||||||||||||
BRL | 488,370 | USD | 150,000 | State Street Bank and Trust Company | 06/02/15 | 372 | ||||||||||||||||
CHF | 421,968 | USD | 421,757 | Morgan Stanley & Co. LLC | 06/17/15 | 13,857 | ||||||||||||||||
CHF | 336,664 | USD | 337,062 | Morgan Stanley & Co. LLC | 06/17/15 | 10,489 | ||||||||||||||||
CHF | 64,875 | USD | 65,740 | Morgan Stanley & Co. LLC | 06/30/15 | 1,265 | ||||||||||||||||
CHF | 63,000 | USD | 64,757 | State Street Bank and Trust Company | 06/17/15 | 274 | ||||||||||||||||
CHF | 730,250 | USD | 766,322 | Morgan Stanley & Co. LLC | 06/30/15 | (12,107 | ) | |||||||||||||||
See Notes to Consolidated Financial Statements.
207
Blackstone Alternative Multi-Strategy Fund and Subsidiaries
Consolidated Schedule of Investments (Continued)
March 31, 2015
Currency | Amount in | Currency | Amount in | Counterparty | Settlement | Unrealized | ||||||||||||||||
CHF | 939,985 | USD | 982,387 | Morgan Stanley & Co. LLC | 06/30/15 | $ | (11,554 | ) | ||||||||||||||
CHF | 203,725 | USD | 212,268 | Morgan Stanley & Co. LLC | 06/30/15 | (1,857 | ) | |||||||||||||||
CHF | 562,805 | USD | 589,695 | Morgan Stanley & Co. LLC | 06/17/15 | (8,690 | ) | |||||||||||||||
CHF | 54,850 | USD | 56,953 | Morgan Stanley & Co. LLC | 06/30/15 | (303 | ) | |||||||||||||||
CHF | 626,701 | USD | 651,931 | Morgan Stanley & Co. LLC | 06/17/15 | (4,963 | ) | |||||||||||||||
CHF | 471,231 | USD | 485,875 | Morgan Stanley & Co. LLC | 06/17/15 | 594 | ||||||||||||||||
CHF | 404,370 | USD | 417,672 | Morgan Stanley & Co. LLC | 06/30/15 | (32 | ) | |||||||||||||||
CHF | 1,240,635 | USD | 1,244,535 | Morgan Stanley & Co. LLC | 06/30/15 | 36,815 | ||||||||||||||||
CHF | 1,466,000 | USD | 1,459,629 | State Street Bank and Trust Company | 06/17/15 | 53,623 | ||||||||||||||||
CHF | 421,968 | USD | 420,329 | Morgan Stanley & Co. LLC | 06/17/15 | 15,285 | ||||||||||||||||
CHF | 168,000 | USD | 167,961 | State Street Bank and Trust Company | 06/17/15 | 5,454 | ||||||||||||||||
CLP | 550,000 | USD | 850 | Morgan Stanley Capital Services LLC | 06/17/15 | 25 | ||||||||||||||||
CLP | 2,260,000 | USD | 3,494 | Morgan Stanley Capital Services LLC | 06/17/15 | 101 | ||||||||||||||||
DKK | 403,099 | USD | 57,826 | Morgan Stanley & Co. LLC | 06/30/15 | 352 | ||||||||||||||||
DKK | 2,994,570 | USD | 439,207 | Morgan Stanley & Co. LLC | 06/30/15 | (7,004 | ) | |||||||||||||||
DKK | 57,510 | USD | 8,367 | Morgan Stanley & Co. LLC | 06/30/15 | (67 | ) | |||||||||||||||
DKK | 5,652,720 | USD | 816,207 | Morgan Stanley & Co. LLC | 06/30/15 | (358 | ) | |||||||||||||||
DKK | 3,425,497 | USD | 490,936 | Morgan Stanley & Co. LLC | 06/30/15 | 3,462 | ||||||||||||||||
EUR | 250,000 | CHF | 265,363 | State Street Bank and Trust Company | 04/22/15 | (4,394 | ) | |||||||||||||||
EUR | 1,925,411 | USD | 2,044,478 | State Street Bank and Trust Company | 06/17/15 | 27,967 | ||||||||||||||||
EUR | 311,040 | USD | 329,896 | Morgan Stanley Capital Services LLC | 06/17/15 | 4,892 | ||||||||||||||||
EUR | 218,894 | USD | 232,334 | Morgan Stanley & Co. LLC | 06/17/15 | 3,273 | ||||||||||||||||
EUR | 1,142,021 | USD | 1,247,350 | Morgan Stanley & Co. LLC | 06/17/15 | (18,135 | ) | |||||||||||||||
EUR | 42,678 | USD | 46,653 | Morgan Stanley & Co. LLC | 06/17/15 | (717 | ) | |||||||||||||||
EUR | 42,434 | USD | 46,008 | Morgan Stanley & Co. LLC | 06/30/15 | (325 | ) | |||||||||||||||
EUR | 670,247 | USD | 720,875 | Morgan Stanley Capital Services LLC | 06/17/15 | 546 | ||||||||||||||||
EUR | 126,174 | USD | 135,589 | Morgan Stanley & Co. LLC | 06/17/15 | 218 | ||||||||||||||||
GBP | 1,444,000 | USD | 2,128,442 | State Street Bank and Trust Company | 06/17/15 | 12,476 | ||||||||||||||||
GBP | 923,000 | USD | 1,376,710 | State Street Bank and Trust Company | 06/17/15 | (8,242 | ) | |||||||||||||||
GBP | 169,230 | USD | 251,521 | Morgan Stanley & Co. LLC | 06/30/15 | (638 | ) | |||||||||||||||
GBP | 39,797 | USD | 58,949 | Morgan Stanley & Co. LLC | 06/30/15 | 50 | ||||||||||||||||
GBP | 245,866 | USD | 364,546 | Morgan Stanley & Co. LLC | 06/30/15 | (49 | ) | |||||||||||||||
GBP | 14,100,000 | USD | 20,856,015 | State Street Bank and Trust Company | 06/17/15 | 49,068 | ||||||||||||||||
GBP | 338,421 | USD | 497,309 | Morgan Stanley & Co. LLC | 06/17/15 | 4,438 | ||||||||||||||||
See Notes to Consolidated Financial Statements.
208
Blackstone Alternative Multi-Strategy Fund and Subsidiaries
Consolidated Schedule of Investments (Continued)
March 31, 2015
Currency | Amount in | Currency | Amount in | Counterparty | Settlement | Unrealized | ||||||||||||||||
HKD | 3,410,000 | USD | 440,384 | Morgan Stanley Capital Services LLC | 07/26/17 | $ | (347 | ) | ||||||||||||||
HKD | 970,000 | USD | 125,191 | Morgan Stanley Capital Services LLC | 07/26/17 | (20 | ) | |||||||||||||||
HKD | 1,859,528 | USD | 239,337 | Morgan Stanley & Co. LLC | 06/17/15 | 491 | ||||||||||||||||
INR | 25,490,526 | USD | 398,041 | Morgan Stanley Capital Services LLC | 06/17/15 | 6,702 | ||||||||||||||||
JPY | 98,837,000 | USD | 816,012 | State Street Bank and Trust Company | 06/17/15 | 8,951 | ||||||||||||||||
JPY | 29,622,344 | USD | 244,685 | Morgan Stanley & Co. LLC | 06/17/15 | 2,566 | ||||||||||||||||
JPY | 41,962,844 | USD | 347,288 | Morgan Stanley & Co. LLC | 06/17/15 | 2,967 | ||||||||||||||||
JPY | 73,100,000 | USD | 608,599 | State Street Bank and Trust Company | 06/17/15 | 1,545 | ||||||||||||||||
JPY | 59,800,000 | USD | 499,467 | JPMorgan Chase Bank, N.A. | 04/30/15 | (666 | ) | |||||||||||||||
JPY | 295,877,729 | USD | 2,484,572 | Morgan Stanley & Co. LLC | 06/17/15 | (14,942 | ) | |||||||||||||||
JPY | 32,205,899 | USD | 268,826 | Morgan Stanley & Co. LLC | 06/17/15 | (10 | ) | |||||||||||||||
JPY | 49,310,682 | USD | 411,402 | Morgan Stanley & Co. LLC | 06/17/15 | 184 | ||||||||||||||||
JPY | 1,347,528,000 | USD | 11,102,947 | State Street Bank and Trust Company | 06/17/15 | 144,468 | ||||||||||||||||
JPY | 20,310,317 | USD | 167,664 | Morgan Stanley & Co. LLC | 06/17/15 | 1,862 | ||||||||||||||||
KRW | 231,315,079 | USD | 208,768 | Morgan Stanley & Co. LLC | 06/17/15 | (751 | ) | |||||||||||||||
MXN | 5,269,705 | USD | 350,000 | State Street Bank and Trust Company | 06/02/15 | (5,842 | ) | |||||||||||||||
MXN | 6,021,061 | USD | 386,424 | Morgan Stanley Capital Services LLC | 06/17/15 | 6,431 | ||||||||||||||||
NOK | 5,952,000 | USD | 716,401 | State Street Bank and Trust Company | 06/17/15 | 21,026 | ||||||||||||||||
NOK | 1,561,000 | USD | 193,747 | State Street Bank and Trust Company | 06/17/15 | (346 | ) | |||||||||||||||
NOK | 42,530,000 | USD | 5,202,693 | State Street Bank and Trust Company | 06/17/15 | 66,586 | ||||||||||||||||
PHP | 8,973,845 | USD | 201,705 | Morgan Stanley Capital Services LLC | 06/17/15 | (1,451 | ) | |||||||||||||||
RUB | 3,298,000 | USD | 53,792 | State Street Bank and Trust Company | 06/17/15 | 1,182 | ||||||||||||||||
RUB | 344,988,000 | USD | 5,438,020 | State Street Bank and Trust Company | 06/17/15 | 312,547 | ||||||||||||||||
RUB | 24,205,000 | USD | 378,055 | State Street Bank and Trust Company | 06/17/15 | 25,415 | ||||||||||||||||
SEK | 1,876,000 | USD | 217,467 | State Street Bank and Trust Company | 06/17/15 | 627 | ||||||||||||||||
SEK | 2,897,025 | USD | 335,084 | Morgan Stanley Capital Services LLC | 06/17/15 | 1,716 | ||||||||||||||||
See Notes to Consolidated Financial Statements.
209
Blackstone Alternative Multi-Strategy Fund and Subsidiaries
Consolidated Schedule of Investments (Continued)
March 31, 2015
Currency | Amount in | Currency | Amount in | Counterparty | Settlement | Unrealized | ||||||||||||||||
SEK | 27,781,000 | USD | 3,212,034 | State Street Bank and Trust Company | 06/17/15 | $ | 17,631 | |||||||||||||||
SEK | 2,660,000 | USD | 307,113 | State Street Bank and Trust Company | 06/17/15 | 2,124 | ||||||||||||||||
SGD | 480,556 | USD | 344,977 | Morgan Stanley Capital Services LLC | 06/17/15 | 4,578 | ||||||||||||||||
THB | 6,667,260 | USD | 200,459 | Morgan Stanley Capital Services LLC | 06/17/15 | 3,801 | ||||||||||||||||
TRY | 842,000 | USD | 315,415 | State Street Bank and Trust Company | 06/17/15 | 2,235 | ||||||||||||||||
TRY | 385,000 | USD | 146,393 | State Street Bank and Trust Company | 06/17/15 | (1,150 | ) | |||||||||||||||
TRY | 7,852,000 | USD | 2,903,717 | State Street Bank and Trust Company | 06/17/15 | 58,496 | ||||||||||||||||
ZAR | 15,562,000 | USD | 1,237,879 | State Street Bank and Trust Company | 06/17/15 | 29,168 | ||||||||||||||||
ZAR | 6,017,000 | USD | 493,225 | State Street Bank and Trust Company | 06/17/15 | (3,325 | ) | |||||||||||||||
ZAR | 123,702,000 | USD | 9,775,337 | State Street Bank and Trust Company | 06/17/15 | 296,394 | ||||||||||||||||
USD | 2,119,222 | AUD | 2,745,000 | State Street Bank and Trust Company | 06/17/15 | 37,375 | ||||||||||||||||
USD | 28,866 | AUD | 37,923 | Morgan Stanley & Co. LLC | 06/30/15 | 125 | ||||||||||||||||
USD | 193,096 | AUD | 254,435 | Morgan Stanley Capital Services LLC | 06/17/15 | 132 | ||||||||||||||||
USD | 33,061,960 | AUD | 43,498,000 | State Street Bank and Trust Company | 06/17/15 | 72,445 | ||||||||||||||||
USD | 2,597,370 | AUD | 3,431,000 | State Street Bank and Trust Company | 06/17/15 | (4,750 | ) | |||||||||||||||
USD | 2,836,491 | BRL | 8,398,000 | State Street Bank and Trust Company | 06/02/15 | 250,701 | ||||||||||||||||
USD | 720,000 | BRL | 2,127,960 | State Street Bank and Trust Company | 06/02/15 | 64,790 | ||||||||||||||||
USD | 3,592,918 | BRL | 10,593,000 | State Street Bank and Trust Company | 06/02/15 | 331,275 | ||||||||||||||||
USD | 1,128,728 | BRL | 3,766,000 | State Street Bank and Trust Company | 06/02/15 | (30,844 | ) | |||||||||||||||
USD | 544,265 | BRL | 1,789,000 | State Street Bank and Trust Company | 06/02/15 | (6,578 | ) | |||||||||||||||
USD | 2,000,000 | CHF | 1,915,800 | State Street Bank and Trust Company | 04/22/15 | 27,063 | ||||||||||||||||
USD | 422,136 | CHF | 421,968 | Morgan Stanley & Co. LLC | 06/17/15 | (13,477 | ) | |||||||||||||||
USD | 420,823 | CHF | 421,968 | Morgan Stanley & Co. LLC | 06/17/15 | (14,790 | ) | |||||||||||||||
USD | 4,025,326 | CHF | 4,032,572 | Morgan Stanley & Co. LLC | 06/17/15 | (137,651 | ) | |||||||||||||||
USD | 2,365,166 | CHF | 2,304,736 | Morgan Stanley & Co. LLC | 06/17/15 | (14,101 | ) | |||||||||||||||
See Notes to Consolidated Financial Statements.
210
Blackstone Alternative Multi-Strategy Fund and Subsidiaries
Consolidated Schedule of Investments (Continued)
March 31, 2015
Currency | Amount in | Currency | Amount in | Counterparty | Settlement | Unrealized | ||||||||||||||||
USD | 18,046 | CLP | 11,612,289 | Morgan Stanley Capital Services LLC | 06/17/15 | $ | (426 | ) | ||||||||||||||
USD | 74,104 | CLP | 47,685,711 | Morgan Stanley Capital Services LLC | 06/17/15 | (1,750 | ) | |||||||||||||||
USD | 14,861,416 | CZK | 382,946,000 | State Street Bank and Trust Company | 06/17/15 | (94,403 | ) | |||||||||||||||
USD | 1,922,114 | CZK | 49,296,079 | State Street Bank and Trust Company | 06/17/15 | (3,127 | ) | |||||||||||||||
USD | 951,312 | CZK | 24,205,556 | State Street Bank and Trust Company | 06/17/15 | 5,972 | ||||||||||||||||
USD | 561,509 | DKK | 3,828,596 | Morgan Stanley & Co. LLC | 06/30/15 | 8,933 | ||||||||||||||||
USD | 5,486,850 | EUR | 5,000,000 | State Street Bank and Trust Company | 04/22/15 | 109,189 | ||||||||||||||||
USD | 7,960,523 | EUR | 7,295,000 | JPMorgan Chase Bank, N.A. | 04/30/15 | 113,832 | ||||||||||||||||
USD | 11,041 | EUR | 10,100 | Morgan Stanley Capital Services LLC | 06/17/15 | 170 | ||||||||||||||||
USD | 1,133,980 | EUR | 1,038,535 | Morgan Stanley Capital Services LLC | 06/17/15 | 16,152 | ||||||||||||||||
USD | 1,820,138 | EUR | 1,720,000 | Morgan Stanley Capital Services LLC | 06/17/15 | (31,184 | ) | |||||||||||||||
USD | 20,292,725 | EUR | 19,179,000 | State Street Bank and Trust Company | 06/17/15 | (350,885 | ) | |||||||||||||||
USD | 5,804,232 | EUR | 5,526,787 | Morgan Stanley & Co. LLC | 06/17/15 | (144,527 | ) | |||||||||||||||
USD | 746,548 | EUR | 703,419 | Morgan Stanley Capital Services LLC | 06/17/15 | (10,577 | ) | |||||||||||||||
USD | 2,723,855 | EUR | 2,566,495 | Morgan Stanley Capital Services LLC | 06/17/15 | (38,593 | ) | |||||||||||||||
USD | 347,979 | EUR | 326,800 | Morgan Stanley & Co. LLC | 06/30/15 | (3,847 | ) | |||||||||||||||
USD | 704,298 | EUR | 665,550 | Morgan Stanley Capital Services LLC | 06/17/15 | (12,067 | ) | |||||||||||||||
USD | 46,453 | EUR | 43,593 | Morgan Stanley & Co. LLC | 06/30/15 | (478 | ) | |||||||||||||||
USD | 474,714 | EUR | 439,591 | Morgan Stanley & Co. LLC | 06/17/15 | 1,560 | ||||||||||||||||
USD | 1,043,979 | EUR | 966,200 | State Street Bank and Trust Company | 06/17/15 | 3,995 | ||||||||||||||||
USD | 862,245 | GBP | 580,000 | JPMorgan Chase Bank, N.A. | 04/30/15 | 2,032 | ||||||||||||||||
USD | 128,908 | GBP | 87,152 | Morgan Stanley & Co. LLC | 06/17/15 | (305 | ) | |||||||||||||||
USD | 690,380 | GBP | 464,040 | Morgan Stanley & Co. LLC | 06/30/15 | 2,440 | ||||||||||||||||
USD | 236,917 | GBP | 160,989 | Morgan Stanley & Co. LLC | 06/30/15 | (1,749 | ) | |||||||||||||||
USD | 282,651 | HKD | 2,191,084 | Morgan Stanley & Co. LLC | 05/04/15 | 53 | ||||||||||||||||
USD | 60,621 | HKD | 470,000 | Morgan Stanley & Co. LLC | 05/04/15 | 2 | ||||||||||||||||
USD | 563,779 | HKD | 4,380,000 | Morgan Stanley Capital Services LLC | 07/26/17 | (1,429 | ) | |||||||||||||||
See Notes to Consolidated Financial Statements.
211
Blackstone Alternative Multi-Strategy Fund and Subsidiaries
Consolidated Schedule of Investments (Continued)
March 31, 2015
Currency | Amount in | Currency | Amount in | Counterparty | Settlement | Unrealized | ||||||||||||||||
USD | 4,205,599 | ILS | 16,910,000 | State Street Bank and Trust Company | 06/17/15 | $ | (44,559 | ) | ||||||||||||||
USD | 275,871 | ILS | 1,105,000 | State Street Bank and Trust Company | 06/17/15 | (1,860 | ) | |||||||||||||||
USD | 266,976 | ILS | 1,083,000 | State Street Bank and Trust Company | 06/17/15 | (5,226 | ) | |||||||||||||||
USD | 190,000 | INR | 11,992,800 | Morgan Stanley Capital Services LLC | 06/17/15 | (423 | ) | |||||||||||||||
USD | 3,952,965 | JPY | 472,640,190 | Morgan Stanley & Co. LLC | 06/17/15 | 7,935 | ||||||||||||||||
USD | 578,064 | JPY | 67,826,000 | JPMorgan Chase Bank, N.A. | 05/11/15 | 12,236 | ||||||||||||||||
USD | 167,390 | JPY | 20,310,317 | Morgan Stanley & Co. LLC | 06/17/15 | (2,136 | ) | |||||||||||||||
USD | 21,024,279 | JPY | 2,546,145,248 | Morgan Stanley & Co. LLC | 06/17/15 | (227,868 | ) | |||||||||||||||
USD | 64,858 | JPY | 7,857,217 | Morgan Stanley & Co. LLC | 06/17/15 | (725 | ) | |||||||||||||||
USD | 44,016 | JPY | 5,340,000 | Morgan Stanley Capital Services LLC | 06/17/15 | (556 | ) | |||||||||||||||
USD | 159,777 | JPY | 19,383,890 | Morgan Stanley Capital Services LLC | 06/17/15 | (2,017 | ) | |||||||||||||||
USD | 9,007 | JPY | 1,090,000 | Morgan Stanley Capital Services LLC | 06/17/15 | (91 | ) | |||||||||||||||
USD | 669,800 | KRW | 765,146,147 | Morgan Stanley & Co. LLC | 06/17/15 | (18,281 | ) | |||||||||||||||
USD | 45,469 | KRW | 50,570,626 | Morgan Stanley & Co. LLC | 06/17/15 | (8 | ) | |||||||||||||||
USD | 7,865,004 | KRW | 8,952,734,000 | State Street Bank and Trust Company | 06/17/15 | (186,016 | ) | |||||||||||||||
USD | 675,185 | KRW | 765,457,000 | State Street Bank and Trust Company | 06/17/15 | (13,176 | ) | |||||||||||||||
USD | 28,471 | KRW | 32,273,000 | Morgan Stanley Capital Services LLC | 06/17/15 | (564 | ) | |||||||||||||||
USD | 15,219 | KRW | 17,250,900 | Morgan Stanley Capital Services LLC | 06/17/15 | (302 | ) | |||||||||||||||
USD | 419,492 | KRW | 469,202,000 | State Street Bank and Trust Company | 06/17/15 | (2,452 | ) | |||||||||||||||
USD | 190,000 | MXN | 2,914,809 | Morgan Stanley Capital Services LLC | 06/17/15 | (182 | ) | |||||||||||||||
USD | 3,185,839 | NZD | 4,387,000 | State Street Bank and Trust Company | 06/17/15 | (69,878 | ) | |||||||||||||||
USD | 260,867 | NZD | 360,000 | State Street Bank and Trust Company | 06/17/15 | (6,299 | ) | |||||||||||||||
USD | 200,087 | NZD | 267,000 | State Street Bank and Trust Company | 06/17/15 | 1,939 | ||||||||||||||||
USD | 80,000 | PHP | 3,590,400 | Morgan Stanley Capital Services LLC | 06/17/15 | (121 | ) | |||||||||||||||
USD | 330,160 | SEK | 2,897,025 | Morgan Stanley Capital Services LLC | 06/17/15 | (6,640 | ) | |||||||||||||||
See Notes to Consolidated Financial Statements.
212
Blackstone Alternative Multi-Strategy Fund and Subsidiaries
Consolidated Schedule of Investments (Continued)
March 31, 2015
Currency | Amount in | Currency | Amount in | Counterparty | Settlement | Unrealized | ||||||||||||||||
USD | 90,000 | THB | 2,948,400 | Morgan Stanley Capital Services LLC | 06/17/15 | $ | (328 | ) | ||||||||||||||
|
| |||||||||||||||||||||
Total Forward Foreign Currency Exchange Contracts Outstanding | $ | 717,483 | ||||||||||||||||||||
|
| |||||||||||||||||||||
Centrally Cleared Credit Default Swaps on Index (Buy Protection) — Outstanding at March 31, 2015
Reference | The | Maturity | Counterparty | Notional | Market | Upfront | Unrealized | |||||||||||||||||||
CDX.NA.IG.24 | (1.00%) | 06/20/20 | Credit Suisse Securities (USA) LLC | 11,091,773 USD | $ | (199,113) | $ | (202,572) | $ | 3,459 | ||||||||||||||||
Total Centrally Cleared Credit Default Swaps on Index (Buy Protection) |
| $ | (199,113) | $ | (202,572) | $ | 3,459 | |||||||||||||||||||
OTC Credit Default Swaps on Index (Buy Protection) — Outstanding at March 31, 2015
Reference | The | Maturity | Counterparty | Notional | Market | Upfront | Unrealized | |||||||||||||||||||
CDX.EM.21 | (5.00% | ) | 06/20/19 | JPMorgan Chase Bank, N.A. | 571,200 USD | $ | (12,291 | ) | $ | (52,551 | ) | $ | 40,260 | |||||||||||||
CMBX.NA.BBB-.6 | (3.00% | ) | 05/11/63 | Credit Suisse International | 3,066,208 USD | (31,693 | ) | 22,395 | (54,088 | ) | ||||||||||||||||
CMBX.NA.BBB-.6 | (3.00% | ) | 05/11/63 | Morgan Stanley Capital Services LLC | 824,351 USD | (8,521 | ) | (9,464 | ) | 943 | ||||||||||||||||
CMBX.NA.BBB-.7 | (3.00% | ) | 01/17/47 | Credit Suisse International | 3,327,474 USD | 27,161 | 58,162 | (31,001 | ) | |||||||||||||||||
CMBX.NA.BBB-.7 | (3.00% | ) | 01/17/47 | Morgan Stanley Capital Services LLC | 1,262,289 USD | 10,304 | 11,727 | (1,423 | ) | |||||||||||||||||
iTraxx CEEMA Series 21 Version 1 | (1.00% | ) | 06/20/19 | JPMorgan Chase Bank, N.A. | 80,000 USD | 9,958 | 5,931 | 4,027 | ||||||||||||||||||
Total OTC Credit Default Swaps on Index (Buy Protection) |
| $ | (5,082 | ) | $ | 36,200 | $ | (41,282 | ) | |||||||||||||||||
See Notes to Consolidated Financial Statements.
213
Blackstone Alternative Multi-Strategy Fund and Subsidiaries
Consolidated Schedule of Investments (Continued)
March 31, 2015
OTC Total Return Swaps Outstanding at March 31, 2015
Reference Instrument | Termination | Counterparty | Notional | Unrealized | |||||||||||||
Buys |
| ||||||||||||||||
Airbus Group | 12/28/15 | Credit Suisse Securities (Europe) Limited | 2,269,475 EUR | $ | (125,247 | ) | |||||||||||
Alstom | 12/28/15 | Credit Suisse Securities (Europe) Limited | 513,219 EUR | (17,130 | ) | ||||||||||||
Amadeus IT Holding SA | 12/29/15 | Credit Suisse Securities (Europe) Limited | 2,571,438 EUR | 114,107 | |||||||||||||
Assicurazioni Generali | 12/28/15 | Credit Suisse Securities (Europe) Limited | 1,401,704 EUR | 767 | |||||||||||||
Astrazeneca PLC | 06/23/16 | Morgan Stanley Capital Services LLC | 1,082,949 GBP | (516 | ) | ||||||||||||
Atlantia SpA | 12/28/15 | Credit Suisse Securities (Europe) Limited | 1,888,015 EUR | (11,684 | ) | ||||||||||||
Atos | 12/28/15 | Credit Suisse Securities (Europe) Limited | 1,990,361 EUR | (50,706 | ) | ||||||||||||
Axis Communications AB | 12/28/15 | Credit Suisse Securities (Europe) Limited | 2,907,113 SEK | 1,449 | |||||||||||||
Barclays PLC | 12/29/15 | Credit Suisse Securities (Europe) Limited | 1,293,903 GBP | (39,158 | ) | ||||||||||||
Bayer AG REG | 12/24/15 | Morgan Stanley Capital Services LLC | 2,789,704 EUR | 341,055 | |||||||||||||
Bayer AG REG | 12/24/15 | Credit Suisse Securities (Europe) Limited | 4,140,950 EUR | (158,274 | ) | ||||||||||||
BNP Parbias SA | 12/28/15 | Credit Suisse Securities (Europe) Limited | 2,305,720 EUR | 195,759 | |||||||||||||
Bovespa Index | 04/15/15 | Morgan Stanley Capital Services LLC | 6,192,344 BRL | 35,532 | |||||||||||||
BP PLC | 12/29/15 | Credit Suisse Securities (Europe) Limited | 595,000 GBP | 38,044 | |||||||||||||
Carrefour SA | 12/28/15 | Credit Suisse Securities (Europe) Limited | 1,541,904 EUR | 707 | |||||||||||||
Criteo SA Spon ADR | 07/27/15 | Credit Suisse Securities (Europe) Limited | 1,316,159 USD | (92,370 | ) | ||||||||||||
Dassault Aviation SA | 12/28/15 | Credit Suisse Securities (Europe) Limited | 931,020 EUR | 94,153 | |||||||||||||
Domino Printing Sciences PLC | 12/29/15 | Credit Suisse Securities (Europe) Limited | 91,464 GBP | 440 | |||||||||||||
Electricite De France EDF | 12/28/15 | Credit Suisse Securities (Europe) Limited | 1,766,558 EUR | (15,302 | ) | ||||||||||||
Enel SpA | 12/28/15 | Credit Suisse Securities (Europe) Limited | 805,393 EUR | 14,412 | |||||||||||||
ENI SpA Italia | 12/28/15 | Credit Suisse Securities (Europe) Limited | 830,772 EUR | 51,098 | |||||||||||||
Fresenius Medical Care AG & Co. KgaA | 12/24/15 | Credit Suisse Securities (Europe) Limited | 2,725,214 EUR | (82,640 | ) | ||||||||||||
Imperial Tobacco Group PLC | 12/29/15 | Credit Suisse Securities (Europe) Limited | 866,889 GBP | (76,484 | ) | ||||||||||||
ING Groep NV | 12/28/15 | Credit Suisse Securities (Europe) Limited | 1,638,128 EUR | 7,110 | |||||||||||||
Jazztel PLC | 12/29/15 | Credit Suisse Securities (Europe) Limited | 1,654,882 EUR | 30,501 | |||||||||||||
KBC Groep NV | 06/13/16 | Credit Suisse Securities (Europe) Limited | 1,562,006 EUR | (16,464 | ) | ||||||||||||
Koninklijke KPN NV | 12/28/15 | Credit Suisse Securities (Europe) Limited | 3,519,890 EUR | 138,716 | |||||||||||||
Kospi2 Index | 06/12/15 | Morgan Stanley Capital Services LLC | 507,570,60 KRW | 6,877 | |||||||||||||
Linde AG | 12/24/15 | Credit Suisse Securities (Europe) Limited | 2,143,108 EUR | (49,417 | ) | ||||||||||||
Lloyds Banking Group PLC | 12/29/15 | Credit Suisse Securities (Europe) Limited | 1,734,318 GBP | (36,748 | ) | ||||||||||||
Lloyds Banking Group PLC | 04/02/20 | Credit Suisse Securities (Europe) Limited | 2,303,151 GBP | (33,177 | ) | ||||||||||||
See Notes to Consolidated Financial Statements.
214
Blackstone Alternative Multi-Strategy Fund and Subsidiaries
Consolidated Schedule of Investments (Continued)
March 31, 2015
Reference Instrument | Termination | Counterparty | Notional | Unrealized | |||||||||||||
Lloyds Banking Group PLC | 02/26/20 | Credit Suisse Securities (Europe) Limited | 422,205 GBP | $ | (6,082 | ) | |||||||||||
Mead Johnson Nutrition Co. | 07/27/15 | Credit Suisse Securities (Europe) Limited | 2,709,301 USD | (12,785 | ) | ||||||||||||
Next PLC | 03/10/20 | Credit Suisse Securities (Europe) Limited | 1,615,734 GBP | (121,067 | ) | ||||||||||||
Orange | 12/28/15 | Credit Suisse Securities (Europe) Limited | 1,229,855 EUR | (8,948 | ) | ||||||||||||
Peugeot SA | 12/28/15 | Credit Suisse Securities (Europe) Limited | 888,590 EUR | (50,398 | ) | ||||||||||||
Pirelli & Co. | 12/28/15 | Credit Suisse Securities (Europe) Limited | 863,095 EUR | (3,036 | ) | ||||||||||||
Prudential PLC | 12/29/15 | Credit Suisse Securities (Europe) Limited | 1,582,854 GBP | (43,164 | ) | ||||||||||||
Publicis Groupe | 12/28/15 | Credit Suisse Securities (Europe) Limited | 2,972,987 EUR | (190,324 | ) | ||||||||||||
Puma SE | 12/24/15 | Credit Suisse Securities (Europe) Limited | 472,849 EUR | (11,510 | ) | ||||||||||||
Rexel SA | 12/28/15 | Credit Suisse Securities (Europe) Limited | 1,480,608 EUR | (38,663 | ) | ||||||||||||
Reynolds American, Inc. | 07/27/15 | Credit Suisse Securities (Europe) Limited | 279,825 USD | (6,666 | ) | ||||||||||||
Roche Holding AG Genusschein | 12/29/15 | Credit Suisse Securities (Europe) Limited | 1,713,158 CHF | 4,967 | |||||||||||||
Royal Bank of Scotland Group | 06/20/19 | Credit Suisse Securities (Europe) Limited | 3,486,193 GBP | (477,866 | ) | ||||||||||||
Royal Dutch Petroleum | 12/28/15 | Credit Suisse Securities (Europe) Limited | 1,911,927 EUR | 45,916 | |||||||||||||
RSA Insurance Group PLC | 12/29/15 | Credit Suisse Securities (Europe) Limited | 1,693,433 GBP | (1,731 | ) | ||||||||||||
RWE AG | 12/24/15 | Credit Suisse Securities (Europe) Limited | 1,136,433 EUR | (2,696 | ) | ||||||||||||
SabMiller PLC | 12/29/15 | Credit Suisse Securities (Europe) Limited | 1,861,621 GBP | (120,104 | ) | ||||||||||||
Safran SA | 12/28/15 | Credit Suisse Securities (Europe) Limited | 1,298,343 EUR | (60,142 | ) | ||||||||||||
Samsung Electronics Co. Ltd. | 12/07/16 | Credit Suisse Securities (Europe) Limited | 491,851 USD | 34,180 | |||||||||||||
Sanofi Aventis | 12/28/15 | Credit Suisse Securities (Europe) Limited | 2,167,579 EUR | (5,000 | ) | ||||||||||||
Shire PLC | 06/20/19 | Credit Suisse Securities (Europe) Limited | 4,718,537 GBP | 972,095 | |||||||||||||
Shire PLC | 06/23/16 | Morgan Stanley Capital Services LLC | 2,746,132 GBP | 316,821 | |||||||||||||
Smith & Nephew PLC | 12/29/15 | Credit Suisse Securities (Europe) Limited | 3,561,198 GBP | (26,839 | ) | ||||||||||||
Societe Generale SA | 12/28/15 | Credit Suisse Securities (Europe) Limited | 2,129,848 EUR | 119,119 | |||||||||||||
STM IM | 12/28/15 | Credit Suisse Securities (Europe) Limited | 1,366,558 EUR | (79,455 | ) | ||||||||||||
Telecom Italia SpA | 12/28/15 | Credit Suisse Securities (Europe) Limited | 1,672,577 EUR | (72,562 | ) | ||||||||||||
Tim Participacoes ADR | 07/27/15 | Credit Suisse Securities (Europe) Limited | 1,547,567 USD | (154,465 | ) | ||||||||||||
UBM PLC | 12/29/15 | Credit Suisse Securities (Europe) Limited | 1,498,519 GBP | (68,913 | ) | ||||||||||||
Vodafone Group PLC | 12/29/15 | Credit Suisse Securities (Europe) Limited | 2,443,174 GBP | (37,939 | ) | ||||||||||||
|
| ||||||||||||||||
Total Buys | $ | 158,153 | |||||||||||||||
|
| ||||||||||||||||
Sells |
| ||||||||||||||||
ABB Ltd. REG | 12/29/15 | Credit Suisse Securities (Europe) Limited | 198,226 CHF | (730 | ) | ||||||||||||
Allianz SE REG | 12/24/15 | Credit Suisse Securities (Europe) Limited | 1,081,418 EUR | (14,687 | ) | ||||||||||||
America Movil ADR | 08/03/15 | Credit Suisse Securities (Europe) Limited | 393,414 USD | (12,410 | ) | ||||||||||||
See Notes to Consolidated Financial Statements.
215
Blackstone Alternative Multi-Strategy Fund and Subsidiaries
Consolidated Schedule of Investments (Continued)
March 31, 2015
Reference Instrument | Termination | Counterparty | Notional | Unrealized | |||||||||||||
BASF SE | 12/24/15 | Credit Suisse Securities (Europe) Limited | 986,202 EUR | $ | 884 | ||||||||||||
British American Tobacco PLC | 12/29/15 | Credit Suisse Securities (Europe) Limited | 76,468 GBP | 6,986 | |||||||||||||
BT Group PLC | 12/29/15 | Credit Suisse Securities (Europe) Limited | 170,526 GBP | 7,829 | |||||||||||||
Bureau Veritas SA | 12/28/15 | Credit Suisse Securities (Europe) Limited | 1,647,455 EUR | 27,018 | |||||||||||||
Cap Gemini | 12/28/15 | Credit Suisse Securities (Europe) Limited | 193,810 EUR | (19 | ) | ||||||||||||
CSL LTD | 03/02/17 | Morgan Stanley Capital Services LLC | 1,007,122 AUD | (4,720 | ) | ||||||||||||
Deutsche Telekom AG | 12/24/15 | Credit Suisse Securities (Europe) Limited | 512,109 EUR | 3,533 | |||||||||||||
Distribuidora Internacional | 12/29/15 | Credit Suisse Securities (Europe) Limited | 679,392 EUR | (47,372 | ) | ||||||||||||
Faurecia | 12/28/15 | Credit Suisse Securities (Europe) Limited | 570,555 EUR | 29,214 | |||||||||||||
GlaxoSmithKline PLC | 06/23/16 | Morgan Stanley Capital Services LLC | 667,023 GBP | (51,714 | ) | ||||||||||||
Heineken NV | 12/28/15 | Credit Suisse Securities (Europe) Limited | 204,287 EUR | 10,927 | |||||||||||||
iShares MSCI Brazil Capped ETF | 07/27/15 | Credit Suisse Securities (Europe) Limited | 228,199 USD | (13,758 | ) | ||||||||||||
L’Oreal | 12/28/15 | Credit Suisse Securities (Europe) Limited | 60,780 EUR | 684 | |||||||||||||
Lorillard, Inc. | 07/27/15 | Credit Suisse Securities (Europe) Limited | 940,708 USD | 31,101 | |||||||||||||
Merck KgaA | 08/11/15 | Morgan Stanley Capital Services LLC | 978,753 EUR | (26,803 | ) | ||||||||||||
Muenchener Rueckver AG REG | 12/24/15 | Credit Suisse Securities (Europe) Limited | 827,515 EUR | (9,473 | ) | ||||||||||||
Nestle SA REG | 12/29/15 | Credit Suisse Securities (Europe) Limited | 187,664 CHF | 6,399 | |||||||||||||
Pernod Ricard SA | 12/28/15 | Credit Suisse Securities (Europe) Limited | 144,606 EUR | (2,036 | ) | ||||||||||||
Philp Morris International | 07/27/15 | Credit Suisse Securities (Europe) Limited | 92,114 USD | 2,923 | |||||||||||||
Reed Elsevier NV | 12/28/15 | Credit Suisse Securities (Europe) Limited | 404,546 EUR | 3,812 | |||||||||||||
Reed Elsevier PLC | 12/29/15 | Credit Suisse Securities (Europe) Limited | 312,532 GBP | (4,441 | ) | ||||||||||||
Sainsbury (J) PLC | 12/29/15 | Credit Suisse Securities (Europe) Limited | 409,501 GBP | 21,496 | |||||||||||||
SAP SE | 12/24/15 | Credit Suisse Securities (Europe) Limited | 227,254 EUR | (7,607 | ) | ||||||||||||
Siemens AG REG | 12/24/15 | Credit Suisse Securities (Europe) Limited | 961,591 EUR | 50,464 | |||||||||||||
Standard Chartered PLC | 12/29/15 | Credit Suisse Securities (Europe) Limited | 1,182,388 GBP | (241,436 | ) | ||||||||||||
Telefonica Brasil | 07/27/15 | Credit Suisse Securities (Europe) Limited | 665,539 USD | 15,133 | |||||||||||||
Telefonica SA | 12/29/15 | Credit Suisse Securities (Europe) Limited | 1,248,114 EUR | 103 | |||||||||||||
Teliasonera AB | 12/28/15 | Credit Suisse Securities (Europe) Limited | 430,306 SEK | (1,449 | ) | ||||||||||||
Texas Instruments, Inc. | 07/27/15 | Credit Suisse Securities (Europe) Limited | 1,111,901 USD | 20,639 | |||||||||||||
Unilever DR | 12/28/15 | Credit Suisse Securities (Europe) Limited | 820,014 EUR | 34,769 | |||||||||||||
Unilever PLC | 12/29/15 | Credit Suisse Securities (Europe) Limited | 264,705 GBP | 9,954 | |||||||||||||
Volkswagen AG | 12/24/15 | Credit Suisse Securities (Europe) Limited | 1,180,633 EUR | 34,245 | |||||||||||||
|
| ||||||||||||||||
Total Sells | $ | (120,542 | ) | ||||||||||||||
|
| ||||||||||||||||
Total OTC Total Return Swaps Outstanding | $ | 37,611 | |||||||||||||||
|
| ||||||||||||||||
See Notes to Consolidated Financial Statements.
216
Blackstone Alternative Multi-Strategy Fund and Subsidiaries
Consolidated Schedule of Investments (Continued)
March 31, 2015
Centrally Cleared Interest Rate Swaps Outstanding at March 31, 2015
The | Floating | Fixed | Maturity | Counterparty | Notional | Market | Upfront | Unrealized | ||||||||||||||||||
Pays | Three-Month Libor | 3.250% | 06/19/45 | Credit Suisse Securities (USA) LLC | 1,536,000 USD | $ | 285,458 | $ | 237,563 | $ | 47,895 | |||||||||||||||
Pays | Three-Month Libor | 2.750% | 06/17/25 | Credit Suisse Securities (USA) LLC | 530,000 USD | 32,518 | 31,730 | 788 | ||||||||||||||||||
Receives | Three-Month Libor | 2.250% | 06/17/20 | Credit Suisse Securities (USA) LLC | 9,429,000 USD | (286,351 | ) | (188,046 | ) | (98,305 | ) | |||||||||||||||
Receives | Three-Month Libor | 1.250% | 06/19/17 | Credit Suisse Securities (USA) LLC | 22,634,000 USD | (140,610 | ) | (62,009 | ) | (78,601 | ) | |||||||||||||||
Receives | Three-Month Libor | 2.304% | 01/27/25 | Morgan Stanley & Co. LLC | 2,430,000 USD | (62,675 | ) | — | (62,675 | ) | ||||||||||||||||
Receives | Three-Month Libor | 2.534% | 09/25/24 | Morgan Stanley & Co. LLC | 2,130,000 USD | (100,632 | ) | — | (100,632 | ) | ||||||||||||||||
Receives | Three-Month Libor | 1.919% | 09/30/19 | Morgan Stanley & Co. LLC | 2,311,250 USD | (48,087 | ) | — | (48,087 | ) | ||||||||||||||||
Total Centrally Cleared Interest Rate Swaps Outstanding |
| $ | (320,379 | ) | $ | 19,238 | $ | (339,617) | ||||||||||||||||||
Abbreviation Legend: | ||||
| ADR | American Depository Receipt | |||
| CBOT | Chicago Board of Trade | |||
| CDE | Montreal Exchange | |||
| CFE | CBOE Futures Exchange | |||
| CME | Chicago Mercantile Exchange | |||
| COMEX | Commodities Exchange Center | |||
| Eurex | Eurex Exchange | |||
| Euronext | Euronext Paris | |||
| HKFE | Hong Kong Futures Exchange Ltd. | |||
| ICE | Ice Futures Europe | |||
| IDEM | Italian Derivatives Exchange Market | |||
| LIBOR | London Interbank Offered Rate | |||
| LIF | New York Stock Exchange Euronext Liffe | |||
| MEFF | MEFF Renta Variable | |||
| MTN | Medium Term Note | |||
| MexDer | Mexican Derivatives Exchange | |||
| NYMEX | New York Mercantile Exchange | |||
| OSE | Osaka Exchange | |||
| OTC | Over the Counter | |||
See Notes to Consolidated Financial Statements.
217
Blackstone Alternative Multi-Strategy Fund and Subsidiaries
Consolidated Schedule of Investments (Continued)
March 31, 2015
| PIK | Payment in Kind | |||
| REG S | Regulation-S | |||
| REIC | Real Estate Investment Company | |||
| REIT | Real Estate Investment Trust | |||
| SFE | ASX Trade24 | |||
| SGX | Singapore Exchange | |||
| Safex | South African Futures Exchange | |||
| VRN | Variable Rate Notes | |||
Currency Legend: | ||||
| AUD | Australian Dollar | |||
| BRL | Brazilian Real | |||
| CAD | Canadian Dollar | |||
| CHF | Swiss Franc | |||
| CLP | Chilean Peso | |||
| CZK | Czech Koruna | |||
| DKK | Danish Krone | |||
| EUR | Euro | |||
| GBP | British Pound | |||
| HKD | Hong Kong Dollar | |||
| ILS | Israeli Shekel | |||
| INR | Indian Rupee | |||
| JPY | Japanese Yen | |||
| KRW | South Korea Won | |||
| MXN | Mexican Peso | |||
| NOK | Norwegian Krone | |||
| NZD | New Zealand Dollar | |||
| PHP | Philippine Peso | |||
| RUB | Russian Ruble | |||
| SEK | Swedish Krona | |||
| SGD | Singapore Dollar | |||
| THB | Thai Baht | |||
| TRY | Turkish Lira | |||
| USD | United States Dollar | |||
| ZAR | South African Rand | |||
See Notes to Consolidated Financial Statements.
218
Blackstone Alternative Investment Funds and Subsidiaries
Consolidated Statement of Assets and Liabilities
As of March 31, 2015
Multi-Manager | Multi-Strategy | |||||||
Assets: | ||||||||
Total investments in securities, at value (cost of $1,176,776,219 and $902,637,553, respectively)2 | $ | 1,199,589,671 | $ | 919,911,206 | ||||
Cash | 276,096,042 | 373,565,803 | ||||||
Cash denominated in foreign currencies (cost $10,648,708 and $5,701,481, respectively) | 9,497,074 | 5,767,921 | ||||||
Segregated cash balance with broker for securities sold short | 289,835,869 | 255,474,448 | ||||||
Segregated cash balance with custodian for derivative financial instruments | 16,214,227 | 14,166,594 | ||||||
Segregated cash balance with broker for futures contracts | 27,137,166 | 23,797,288 | ||||||
Segregated cash balance with counterparties for swaps, other derivative financial instruments and reverse repurchase agreements | 4,862,706 | 1,298,897 | ||||||
Unrealized appreciation on forward foreign currency exchange contracts | 2,984,396 | 2,334,935 | ||||||
Income receivable | 5,184,018 | 3,528,995 | ||||||
Receivable for investments sold | 36,221,120 | 27,716,207 | ||||||
Receivable for Fund shares sold | 927,121 | 33,885,541 | ||||||
Receivable for periodic payments from swap contracts | 483,146 | 407,004 | ||||||
Variation margin receivable | 2,599,797 | 1,890,431 | ||||||
Swap contracts, premium paid | 160,433 | 98,215 | ||||||
Unrealized appreciation on swap contracts | 4,104,704 | 2,927,168 | ||||||
Receivable from Investment Adviser | 538,978 | 356,446 | ||||||
Prepaid expenses and other assets | 19,664 | 74,750 | ||||||
|
|
|
| |||||
Total Assets | 1,876,456,132 | 1,667,201,849 | ||||||
|
|
|
| |||||
Liabilities: | ||||||||
Securities sold short, at value (proceeds of $301,152,448 and $266,144,329, respectively) | 289,246,390 | 262,301,315 | ||||||
Securities lending collateral | 74,949,395 | 71,359,374 | ||||||
Cash received as collateral for swaps and reverse repurchase agreements | 1,705,808 | 1,251,878 | ||||||
Options written, at value (premiums received $2,064,465 and $1,095,489, respectively) | 2,057,298 | 904,898 | ||||||
Unrealized depreciation on forward foreign currency exchange contracts | 1,923,334 | 1,617,452 | ||||||
Payable for reverse repurchase agreements | 119,746,297 | 35,331,478 | ||||||
Payable for investments purchased | 44,922,387 | 56,487,119 | ||||||
Payable for Fund shares redeemed | 696,576 | 18,324,541 | ||||||
Swap contracts, premium received | 103,385 | 62,015 | ||||||
Unrealized depreciation on swap contracts | 3,299,203 | 2,930,839 | ||||||
Variation margin payable | 20,843 | 39,699 | ||||||
Payable for periodic payments from swap contracts | 173,870 | 139,458 | ||||||
Dividend and interest income payable on securities sold short | 401,673 | 297,664 | ||||||
Management fee payable | 6,327,340 | 4,643,480 | ||||||
Accrued expenses and other liabilities | 1,523,437 | 1,958,321 | ||||||
|
|
|
| |||||
Total Liabilities | 547,097,236 | 457,649,531 | ||||||
|
|
|
| |||||
Net Assets | $ | 1,329,358,896 | $ | 1,209,552,318 | ||||
|
|
|
| |||||
See Notes to Consolidated Financial Statements.
219
Blackstone Alternative Investment Funds and Subsidiaries
Consolidated Statement of Assets and Liabilities (Continued)
As of March 31, 2015
Multi-Manager | Multi-Strategy | |||||||
Net Assets Consist of: | ||||||||
Paid-in capital | $ | 1,286,323,943 | $ | 1,174,323,434 | ||||
Accumulated undistributed net investment loss | (14,761,581 | ) | (4,814,384 | ) | ||||
Accumulated undistributed net realized gain | 20,903,779 | 17,454,910 | ||||||
Net unrealized appreciation | 36,892,755 | 22,588,358 | ||||||
|
|
|
| |||||
Net Assets | $ | 1,329,358,896 | $ | 1,209,552,318 | ||||
|
|
|
| |||||
Net Asset Value: | ||||||||
Class I Shares | ||||||||
Net Assets | $ | 1,329,358,896 | $ | 1,097,916,809 | ||||
Class I Shares outstanding, no par value, unlimited shares authorized | 128,717,599 | 105,770,058 | ||||||
|
|
|
| |||||
Net asset value per share | $ | 10.33 | $ | 10.38 | ||||
|
|
|
| |||||
Class D Shares3 | ||||||||
Net Assets | $ | 6,011,573 | ||||||
Class D Shares outstanding, no par value, unlimited shares authorized | 579,311 | |||||||
|
| |||||||
Net asset value per share | $ | 10.38 | ||||||
|
| |||||||
Class Y Shares3 | ||||||||
Net Assets | $ | 105,623,936 | ||||||
Class Y Shares outstanding, no par value, unlimited shares authorized | 10,263,435 | |||||||
|
| |||||||
Net asset value per share | $ | 10.29 | ||||||
|
| |||||||
| 1 | The Fund commenced investment operations on June 16, 2014. |
| 2 | Includes $72,515,411 and $69,038,609, respectively, of investments in securities on loan. |
| 3 | Class D Shares and Class Y Shares are currently only offered by the Multi-Strategy Fund. See Note 6. |
See Notes to Consolidated Financial Statements.
220
Blackstone Alternative Investment Funds and Subsidiaries
Consolidated Statement of Operations
For the Period Ended March 31, 2015
Multi-Manager | Multi-Strategy | |||||||
Investment Income: | ||||||||
Dividends (including net foreign taxes withheld of $202,770 and $50,542, respectively) | $ | 7,677,339 | $ | 2,896,555 | ||||
Interest | 24,755,827 | 7,153,134 | ||||||
|
|
|
| |||||
Total income | 32,433,166 | 10,049,689 | ||||||
|
|
|
| |||||
Expenses: | ||||||||
Management fees | $ | 24,525,452 | $ | 9,488,096 | ||||
Administration fees | 2,114,985 | 1,033,933 | ||||||
Custodian fees | 1,227,686 | 701,350 | ||||||
Trustees’ fees | 100,551 | 90,000 | ||||||
Distribution fees – Class D | — | 3,159 | ||||||
Shareholder service fees | 91,042 | 515,056 | ||||||
Offering costs | 205,395 | 194,892 | ||||||
Registration fees | 82,799 | 145,365 | ||||||
Printing and postage fees | 637,601 | 122,990 | ||||||
Professional fees | 1,183,560 | 863,741 | ||||||
Dividends and interest on securities sold short | 4,255,485 | 1,928,032 | ||||||
Organization fees | — | 149,697 | ||||||
Financing fees on securities sold short | 2,603,977 | 881,341 | ||||||
Line of credit fee | 112,328 | 103,801 | ||||||
Interest fees | 1,393,871 | 370,083 | ||||||
Other | 164,800 | 98,678 | ||||||
|
|
|
| |||||
Total expenses | 38,699,532 | 16,690,214 | ||||||
|
|
|
| |||||
Expenses recouped (reimbursed) by Investment Adviser | 482,505 | (1,245,166 | ) | |||||
|
|
|
| |||||
Net expenses | 39,182,037 | 15,445,048 | ||||||
|
|
|
| |||||
Net investment income (loss) | (6,748,871 | ) | (5,395,359 | ) | ||||
|
|
|
| |||||
Net Realized and Unrealized Gain (Loss): | ||||||||
Net realized gain (loss) on investments in securities | 71,750,263 | 16,199,527 | ||||||
Net realized gain (loss) on securities sold short | (15,565,382 | ) | (5,785,369 | ) | ||||
Net realized gain (loss) on forward foreign currency exchange contracts | 23,280,520 | 11,461,809 | ||||||
Net realized gain (loss) on foreign currency transactions | (838,642 | ) | (1,252,221 | ) | ||||
Net realized gain (loss) on futures contracts | (29,339,384 | ) | (11,487,256 | ) | ||||
Net realized gain (loss) on options written | 7,480,941 | 1,732,994 | ||||||
Net realized gain (loss) on swap contracts | 14,405,968 | 10,072,055 | ||||||
Net change in unrealized appreciation (depreciation) on investments in securities | (21,954,328 | ) | 17,273,653 | |||||
Net change in unrealized appreciation (depreciation) on securities sold short | 17,857,517 | 3,843,014 | ||||||
Net change in unrealized appreciation (depreciation) on forward foreign currency exchange contracts | 1,860,561 | 717,483 | ||||||
Net change in unrealized appreciation (depreciation) on foreign currency translations | (82,736 | ) | (75,384 | ) | ||||
Net change in unrealized appreciation (depreciation) on futures contracts | 1,744,840 | 978,830 | ||||||
Net change in unrealized appreciation (depreciation) on options written | (997,433 | ) | 190,591 | |||||
Net change in unrealized appreciation (depreciation) on swap contracts | 2,708,775 | (339,829 | ) | |||||
|
|
|
| |||||
Net realized and unrealized gain (loss) | 72,311,480 | 43,529,897 | ||||||
|
|
|
| |||||
Net increase in net assets resulting from operations | $ | 65,562,609 | $ | 38,134,538 | ||||
|
|
|
| |||||
| 1 | The Fund commenced investment operations on June 16, 2014. |
See Notes to Consolidated Financial Statements.
221
Blackstone Alternative Investment Funds and Subsidiaries
Consolidated Statement of Changes in Net Assets
| Multi-Manager Fund | ||||||||
| Year Ended 3/31/2015 | Period Ended 3/31/20141 | |||||||
Increase (Decrease) in Net Assets | ||||||||
Operations: | ||||||||
Net investment loss | $ | (6,748,871 | ) | $ | (4,934,568 | ) | ||
Net realized gain | 71,174,284 | 45,913,995 | ||||||
Net unrealized appreciation (depreciation) | 1,137,196 | 35,755,559 | ||||||
|
|
|
| |||||
Net increase in net assets resulting from operations | 65,562,609 | 76,734,986 | ||||||
|
|
|
| |||||
Distributions: | ||||||||
Distributions from net investment income | (9,088,938 | ) | (4,570,359 | ) | ||||
Distributions from net realized capital gains | (93,347,991 | ) | — | |||||
|
|
|
| |||||
Total distribution to shareholders | (102,436,929 | ) | (4,570,359 | ) | ||||
|
|
|
| |||||
Capital Transactions: | ||||||||
Proceeds from sale of Class I Shares | 253,883,210 | 1,232,785,935 | ||||||
Net asset value of Class I Shares issued to shareholders in payment of distributions declared | 102,434,576 | 4,570,359 | ||||||
Cost of Class I Shares redeemed | (172,989,869 | ) | (126,715,622 | ) | ||||
|
|
|
| |||||
Net increase in net assets resulting from capital transactions | 183,327,917 | 1,110,640,672 | ||||||
|
|
|
| |||||
Net increase in net assets | 146,453,597 | 1,182,805,299 | ||||||
|
|
|
| |||||
Net Assets: | ||||||||
Beginning of period | 1,182,905,299 | 100,000 | ||||||
|
|
|
| |||||
End of period | $ | 1,329,358,896 | $ | 1,182,905,299 | ||||
|
|
|
| |||||
| Accumulated undistributed net investment loss | $ | (14,761,581 | ) | $ | (9,860,042 | ) | ||
|
|
|
| |||||
Share Transactions: | ||||||||
Beginning of period | 110,951,809 | 10,000 | ||||||
Class I Shares sold | 23,965,692 | 122,884,070 | ||||||
Class I Shares reinvested | 10,301,507 | 440,716 | ||||||
Class I Shares redeemed | (16,501,409 | ) | (12,382,977 | ) | ||||
|
|
|
| |||||
Net change in shares resulting from share transactions | 17,765,790 | 110,941,809 | ||||||
|
|
|
| |||||
End of period | 128,717,599 | 110,951,809 | ||||||
|
|
|
| |||||
| 1 | The Fund commenced investment operations on August 6, 2013. |
See Notes to Consolidated Financial Statements.
222
Blackstone Alternative Investment Funds and Subsidiaries
Consolidated Statement of Changes in Net Assets (Continued)
Multi-Strategy Fund | ||||
Period | ||||
Increase (Decrease) in Net Assets | ||||
Operations: | ||||
Net investment loss | $ | (5,395,359 | ) | |
Net realized gain | 20,941,539 | |||
Net unrealized appreciation (depreciation) | 22,588,358 | |||
|
| |||
Net increase in net assets resulting from operations | 38,134,538 | |||
|
| |||
Distributions: | ||||
Distributions from net investment income: | ||||
Class I Shares | (1,545,443 | ) | ||
Class D Shares | (2,255 | ) | ||
Distributions from net realized capital gains: | ||||
Class I Shares | (2,768,920 | ) | ||
Class D Shares | (7,654 | ) | ||
|
| |||
Total distribution to shareholders | (4,324,272 | ) | ||
|
| |||
Capital Transactions: | ||||
Shareholder subscriptions: | ||||
Proceeds from sale of Class I Shares | 1,227,560,311 | |||
Proceeds from sale of Class D Shares | 5,979,685 | |||
Proceeds from sale of Class Y Shares | 103,401,481 | |||
Shareholder reinvestments: | ||||
Net asset value of Class I Shares issued to shareholders in payment of distributions declared | 3,060,022 | |||
Net asset value of Class D Shares issued to shareholders in payment of distributions declared | 9,908 | |||
Shareholder redemptions: | ||||
Cost of Class I Shares redeemed | (164,142,829 | ) | ||
Cost of Class D Shares redeemed | (126,526 | ) | ||
|
| |||
Net increase in net assets resulting from capital transactions | 1,175,742,052 | |||
|
| |||
Net increase in net assets | 1,209,552,318 | |||
|
| |||
Net Assets: | ||||
Beginning of period | — | |||
|
| |||
End of period | $ | 1,209,552,318 | ||
|
| |||
Accumulated undistributed net investment loss | $ | (4,814,384 | ) | |
|
| |||
See Notes to Consolidated Financial Statements.
223
Blackstone Alternative Investment Funds and Subsidiaries
Consolidated Statement of Changes in Net Assets (Continued)
Multi-Strategy Fund | ||||
Period | ||||
Share Transactions: | ||||
Class I Shares | ||||
Shares issued | 121,648,983 | |||
Reinvestment in Shares | 306,002 | |||
Shares repurchased | (16,184,927 | ) | ||
|
| |||
Net change in shares resulting from share transactions | 105,770,058 | |||
|
| |||
End of period | 105,770,058 | |||
|
| |||
Class D Shares | ||||
Shares issued | 590,597 | |||
Reinvestment in Shares | 990 | |||
Shares repurchased | (12,276 | ) | ||
|
| |||
Net change in shares resulting from share transactions | 579,311 | |||
|
| |||
End of period | 579,311 | |||
|
| |||
Class Y Shares | ||||
Shares issued | 10,263,435 | |||
|
| |||
Net change in shares resulting from share transactions | 10,263,435 | |||
|
| |||
End of period | 10,263,435 | |||
|
| |||
| 1 | The Fund commenced investment operations on June 16, 2014. |
See Notes to Consolidated Financial Statements.
224
Blackstone Alternative Investment Funds and Subsidiaries
Consolidated Statement of Cash Flows
| Multi-Manager Fund | ||||
Year | ||||
Cash Flows from Operating Activities: | ||||
Net increase in net assets resulting from operations | $ | 65,562,609 | ||
Adjustments to reconcile net increase (decrease) in net assets resulting from operations to net cash used for operating activities: | ||||
Purchases of investments in securities | (3,103,361,045 | ) | ||
Proceeds from disposition of investments in securities | 2,878,324,254 | |||
Proceeds from securities sold short | 1,038,759,359 | |||
Payments to cover securities sold short | (966,081,498 | ) | ||
Premiums paid on closing options written | (2,142,255 | ) | ||
Proceeds from premiums received from options written | 9,503,062 | |||
Net realized gain on investments in securities | (71,750,263 | ) | ||
Net realized loss on securities sold short | 15,565,382 | |||
Net realized gain on options written | (7,480,941 | ) | ||
Net accretion of bond discount and amortization of bond and swap premium | (2,941,130 | ) | ||
Net change in unrealized depreciation of investments in securities | 21,954,328 | |||
Net change in unrealized appreciation of securities sold short | (17,857,517 | ) | ||
Net change in unrealized depreciation on options written | 997,433 | |||
Changes in assets and liabilities: | ||||
(Increase) decrease in assets: | ||||
Segregated cash balance with broker for securities sold short | (79,309,107 | ) | ||
Segregated cash balance with custodian for derivative financial instruments | 7,416,569 | |||
Segregated cash balance with broker for futures contracts | (6,481,294 | ) | ||
Segregated cash balance with counterparties for swaps, other derivative financial instruments and reverse repurchase agreements | 3,523,036 | |||
Unrealized appreciation on forward foreign currency exchange contracts | (1,607,823 | ) | ||
Income receivable | (1,283,941 | ) | ||
Receivable for periodic payments from swap contracts | (483,146 | ) | ||
Variation margin receivable | (2,207,129 | ) | ||
Swap contracts, premium paid | 1,914,124 | |||
Unrealized appreciation on swap contracts | (3,026,090 | ) | ||
Receivable from Investment Adviser | 2,457,882 | |||
Prepaid expenses and other assets | 322,350 | |||
Increase (decrease) in liabilities: | ||||
Securities lending collateral | 43,779,272 | |||
Cash received as collateral for swaps and reverse repurchase agreements | 1,705,808 | |||
Unrealized depreciation on forward foreign currency exchange contracts | (252,738 | ) | ||
Swap contracts, premium received | (531,294 | ) | ||
Unrealized depreciation on swap contracts | (317,190 | ) | ||
Variation margin payable | (28,676 | ) | ||
Payable for periodic payments from swap contracts | (1,430,672 | ) | ||
Dividend and interest income payable on securities sold short | 59,013 | |||
Interest payable on reverse repurchase agreements | 101,039 | |||
Management fee payable | 774,141 | |||
Accrued expenses and other liabilities | (8,508 | ) | ||
|
| |||
Net cash used in operating activities | $ | (175,862,596 | ) | |
|
| |||
See Notes to Consolidated Financial Statements.
225
Blackstone Alternative Investment Funds and Subsidiaries
Consolidated Statement of Cash Flows (Continued)
| Multi-Manager Fund | ||||
Year | ||||
Cash Flows from Financing Activities | ||||
Proceeds from shares sold | $ | 254,130,027 | ||
Cost of shares repurchased | (172,822,108 | ) | ||
Proceeds from reverse repurchase agreements | 673,899,167 | |||
Repayment of reverse repurchase agreements | (593,441,408 | ) | ||
Distributions paid (net of reinvestment) | (2,353 | ) | ||
|
| |||
Net cash provided by financing activities | 161,763,325 | |||
|
| |||
Net increase (decrease) in cash and foreign currency | (14,099,271 | ) | ||
Cash and foreign currency, beginning of period | 299,692,387 | |||
|
| |||
Cash and foreign currency, end of period | $ | 285,593,116 | ||
|
| |||
Supplemental Disclosure of Cash Flow Information: | ||||
Cash paid during the period for interest | $ | 1,334,858 | ||
|
| |||
Non-Cash Financing Activities | ||||
Capital shares issued in reinvestment of distribution | $ | 102,434,576 | ||
|
| |||
See Notes to Consolidated Financial Statements.
226
Blackstone Alternative Investment Funds and Subsidiaries
Consolidated Statement of Cash Flows (Continued)
| Multi-Strategy Fund | ||||
Period | ||||
Cash Flows from Operating Activities: | ||||
Net increase in net assets resulting from operations | $ | 38,134,538 | ||
Adjustments to reconcile net increase (decrease) in net assets resulting from operations to net cash used for operating activities: | ||||
Purchases of investments in securities | (1,796,519,786 | ) | ||
Proceeds from disposition of investments in securities | 946,815,158 | |||
Proceeds from securities sold short | 659,897,692 | |||
Payments to cover securities sold short | (406,752,202 | ) | ||
Premiums paid on closing options written | (855,610 | ) | ||
Proceeds from premiums received from options written | 3,684,093 | |||
Net realized gain on investments in securities | (16,199,527 | ) | ||
Net realized loss on securities sold short | 5,785,369 | |||
Net realized gain on options written | (1,732,994 | ) | ||
Net accretion of bond discount and amortization of bond and swap premium | (749,037 | ) | ||
Net change in unrealized appreciation of investments in securities | (17,273,653 | ) | ||
Net change in unrealized appreciation of securities sold short | (3,843,014 | ) | ||
Net change in unrealized depreciation on options written | (190,591 | ) | ||
Changes in assets and liabilities: | ||||
(Increase) decrease in assets: | ||||
Segregated cash balance with broker for securities sold short | (255,474,448 | ) | ||
Segregated cash balance with custodian for derivative financial instruments | (14,166,594 | ) | ||
Segregated cash balance with broker for futures contracts | (23,797,288 | ) | ||
Segregated cash balance with counterparties for swaps, other derivative financial instruments and reverse repurchase agreements | (1,298,897 | ) | ||
Unrealized appreciation on forward foreign currency exchange contracts | (2,334,935 | ) | ||
Income receivable | (3,528,995 | ) | ||
Receivable for periodic payments from swap contracts | (407,004 | ) | ||
Variation margin receivable | (1,890,431 | ) | ||
Swap contracts, premium paid | (98,215 | ) | ||
Unrealized appreciation on swap contracts | (2,927,168 | ) | ||
Receivable from Investment Adviser | (356,446 | ) | ||
Prepaid expenses and other assets | (74,750 | ) | ||
Increase (decrease) in liabilities: | ||||
Securities lending collateral | 71,359,374 | |||
Cash received as collateral for swaps and reverse repurchase agreements | 1,251,878 | |||
Unrealized depreciation on forward foreign currency exchange contracts | 1,617,452 | |||
Swap contracts, premium received | 62,015 | |||
Unrealized appreciation on swap contracts | 2,930,839 | |||
Variation margin payable | 39,699 | |||
Payable for periodic payments from swap contracts | 139,458 | |||
Dividend and interest income payable on securities sold short | 297,664 | |||
Interest payable on reverse repurchase agreements | 42,768 | |||
Management fee payable | 4,643,480 | |||
Accrued expenses and other liabilities | 1,958,321 | |||
|
| |||
Net cash used in operating activities | $ | (811,811,787 | ) | |
|
| |||
See Notes to Consolidated Financial Statements.
227
Blackstone Alternative Investment Funds and Subsidiaries
Consolidated Statement of Cash Flows (Continued)
| Multi-Strategy Fund | ||||
Period | ||||
Cash Flows from Financing Activities | ||||
Proceeds from shares sold | $ | 1,303,055,936 | ||
Cost of shares repurchased | (145,944,814 | ) | ||
Proceeds from reverse repurchase agreements | 189,180,702 | |||
Repayment of reverse repurchase agreements | (153,891,972 | ) | ||
Distributions paid (net of reinvestment) | (1,254,341 | ) | ||
|
| |||
Net cash provided by financing activities | 1,191,145,511 | |||
|
| |||
Net increase (decrease) in cash and foreign currency | 379,333,724 | |||
Cash and foreign currency, beginning of period | — | |||
|
| |||
Cash and foreign currency, end of period | $ | 379,333,724 | ||
|
| |||
Supplemental Disclosure of Cash Flow Information: | ||||
Cash paid during the period for interest | $ | 72,419 | ||
|
| |||
Non-Cash Financing Activities | ||||
Capital shares issued in reinvestment of distribution | $ | 3,069,930 | ||
|
| |||
| 1 | The Fund commenced investment operations on June 16, 2014. |
See Notes to Consolidated Financial Statements.
228
Blackstone Alternative Investment Funds and Subsidiaries
Consolidated Financial Highlights
(For a Share Outstanding Throughout Each Period)
| Multi-Manager Fund—Class I | ||||||||
Year | Period | |||||||
Net Asset Value, Beginning of Period | $ | 10.66 | $ | 10.00 | ||||
Income From Investment Operations: | ||||||||
Net investment loss | (0.06 | )2 | (0.05 | )2 | ||||
Net realized and unrealized gain | 0.59 | 0.75 | ||||||
|
|
|
| |||||
Total From Investment Operations | 0.53 | 0.70 | ||||||
|
|
|
| |||||
Less Distributions to Shareholders: | ||||||||
From net investment income | (0.08 | ) | (0.04 | ) | ||||
From net realized capital gains | (0.78 | ) | — | |||||
|
|
|
| |||||
Total Distributions | (0.86 | ) | (0.04 | ) | ||||
|
|
|
| |||||
Net Asset Value, End of Period | $ | 10.33 | $ | 10.66 | ||||
|
|
|
| |||||
Total Return3 | 5.24 | % | 7.04 | % | ||||
|
|
|
| |||||
Ratios to Average Net Assets:4,5 | ||||||||
Total expenses before recoupment (reimbursement) from Investment Adviser | 3.08 | % | 3.33 | % | ||||
Recoupment (reimbursement) from Investment Adviser | 0.04 | % | (0.27 | )% | ||||
|
|
|
| |||||
Net expenses after recoupment (reimbursement) from Investment Adviser | 3.12 | % | 3.06 | % | ||||
Excluded Expenses6 | (0.72 | )% | (0.66 | )% | ||||
|
|
|
| |||||
Expenses, net of impact of excluded expenses | 2.40 | % | 2.40 | % | ||||
|
|
|
| |||||
Net investment loss | (0.54 | )% | (0.69 | )% | ||||
|
|
|
| |||||
Supplemental Data: | ||||||||
Net assets, end of period (in thousands) | $ | 1,329,359 | $ | 1,182,905 | ||||
Portfolio turnover3 | 265 | % | 135 | % | ||||
| 1 | For the period August 6, 2013 (commencement of operations) through March 31, 2014. |
| 2 | Calculated using average shares outstanding during the period. |
| 3 | Percentage represents the results for the period and is not annualized. |
| 4 | Financial ratios for periods of less than one year have been annualized except for non-recurring costs. |
| 5 | The ratios do not reflect the Fund’s share of the income and expenses of the underlying Investee Fund. |
| 6 | Represents expenses excluded from reimbursement by the Investment Adviser, as defined in the Expense Limitation and Reimbursement Agreement, except for Management Fees. See Note 7. |
See Notes to Consolidated Financial Statements.
229
Blackstone Alternative Investment Funds and Subsidiaries
Consolidated Financial Highlights (Continued)
(For a Share Outstanding Throughout the Period)
| Multi-Strategy Fund—Class I | |||||
Period | |||||
Net Asset Value, Beginning of Period | $ | 10.00 | |||
Income From Investment Operations: | |||||
Net investment loss | (0.09 | )2 | |||
Net realized and unrealized gain | 0.53 | ||||
|
| ||||
Total From Investment Operations | 0.44 | ||||
|
| ||||
Less Distributions to Shareholders: | |||||
From net investment income | (0.02 | ) | |||
From net realized capital gains | (0.04 | ) | |||
|
| ||||
Total Distributions | (0.06 | ) | |||
|
| ||||
Net Asset Value, End of Period | $ | 10.38 | |||
|
| ||||
Total Return3 | 4.43 | % | |||
|
| ||||
Ratios to Average Net Assets:4 | |||||
Total expenses before reimbursement from Investment Adviser | 3.41 | % | |||
Reimbursement from Investment Adviser | (0.24 | )% | |||
|
| ||||
Net expenses after reimbursement from Investment Adviser | 3.17 | % | |||
Excluded Expenses5 | (0.77 | )% | |||
|
| ||||
Expenses, net of impact of excluded expenses | 2.40 | % | |||
|
| ||||
Net investment loss | (1.11 | )% | |||
|
| ||||
Supplemental Data: | |||||
Net assets, end of period (in thousands) | $ | 1,097,917 | |||
Portfolio turnover3,6 | 194 | % | |||
| 1 | For the period June 16, 2014 (commencement of operations) to March 31, 2015. |
| 2 | Calculated using average shares outstanding during the period. |
| 3 | Percentage represents the results for the period and is not annualized. |
| 4 | Financial ratios have been annualized except for non-recurring costs. |
| 5 | Represents expenses excluded from reimbursement by the Investment Adviser, as defined in the Expense Limitation and Reimbursement Agreement. See Note 7. |
| 6 | Represents the Fund’s portfolio turnover rate for the period ended March 31, 2015. |
See Notes to Consolidated Financial Statements.
230
Blackstone Alternative Investment Funds and Subsidiaries
Consolidated Financial Highlights (Continued)
(For a Share Outstanding Throughout the Period)
| Multi-Strategy Fund—Class D | |||||
Period | |||||
Net Asset Value, Beginning of Period | $ | 10.00 | |||
Income From Investment Operations: | |||||
Net investment loss | (0.05 | )2 | |||
Net realized and unrealized gain | 0.48 | ||||
|
| ||||
Total From Investment Operations | 0.43 | ||||
|
| ||||
Less Distributions to Shareholders: | |||||
From net investment income | (0.01 | ) | |||
From net realized capital gains | (0.04 | ) | |||
|
| ||||
Total Distributions | (0.05 | ) | |||
|
| ||||
Net Asset Value, End of Period | $ | 10.38 | |||
|
| ||||
Total Return3 | 4.32 | % | |||
|
| ||||
Ratios to Average Net Assets:4 | |||||
Total expenses before reimbursement from Investment Adviser | 3.54 | % | |||
Reimbursement from Investment Adviser | (0.14 | )% | |||
|
| ||||
Net expenses after reimbursement from Investment Adviser | 3.40 | % | |||
Excluded Expenses5 | (1.00 | )% | |||
|
| ||||
Expenses, net of impact of excluded expenses | 2.40 | % | |||
|
| ||||
Net investment loss | (1.29 | )% | |||
|
| ||||
Supplemental Data: | |||||
Net assets, end of period (in thousands) | $ | 6,012 | |||
Portfolio turnover3,6 | 194 | % | |||
| 1 | For the period November 17, 2014 (commencement of operations) to March 31, 2015. |
| 2 | Calculated using average shares outstanding during the period. |
| 3 | Percentage represents the results for the period and is not annualized. |
| 4 | Financial ratios have been annualized except for non-recurring costs. |
| 5 | Represents expenses excluded from reimbursement by the Investment Adviser, as defined in the Expense Limitation and Reimbursement Agreement. See Note 7. |
| 6 | Represents the Fund’s portfolio turnover rate for the period ended March 31, 2015. |
See Notes to Consolidated Financial Statements.
231
Blackstone Alternative Investment Funds and Subsidiaries
Consolidated Financial Highlights (Continued)
(For a Share Outstanding Throughout the Period)
| Multi-Strategy Fund—Class Y | |||||
Period | |||||
Net Asset Value, Beginning of Period | $ | 10.00 | |||
Income From Investment Operations: | |||||
Net investment loss | (0.02 | )2 | |||
Net realized and unrealized gain | 0.31 | ||||
|
| ||||
Total From Investment Operations | 0.29 | ||||
|
| ||||
Net Asset Value, End of Period | $ | 10.29 | |||
|
| ||||
Total Return3 | 2.90 | % | |||
|
| ||||
Ratios to Average Net Assets:4 | |||||
Total expenses before reimbursement from Investment Adviser | 3.26 | % | |||
Reimbursement from Investment Adviser | (0.07 | )% | |||
|
| ||||
Net expenses after reimbursement from Investment Adviser | 3.19 | % | |||
Excluded Expenses5 | (0.79 | )% | |||
|
| ||||
Expenses, net of impact of excluded expenses | 2.40 | % | |||
|
| ||||
Net investment loss | (1.03 | )% | |||
|
| ||||
Supplemental Data: | |||||
Net assets, end of period (in thousands) | $ | 105,624 | |||
Portfolio turnover3,6 | 194 | % | |||
| 1 | For the period January 28, 2015 (commencement of operations) to March 31, 2015. |
| 2 | Calculated using average shares outstanding during the period. |
| 3 | Percentage represents the results for the period and is not annualized. |
| 4 | Financial ratios have been annualized except for non-recurring costs. |
| 5 | Represents expenses excluded from reimbursement by the Investment Adviser, as defined in the Expense Limitation and Reimbursement Agreement. See Note 7. |
| 6 | Represents the Fund’s portfolio turnover rate for the period ended March 31, 2015. |
See Notes to Consolidated Financial Statements.
232
Blackstone Alternative Investment Funds and Subsidiaries
Notes to Consolidated Financial Statements
For the Period Ended March 31, 2015
1. Organization
Blackstone Alternative Investment Funds (the “Trust”) is a Massachusetts business trust authorized to issue an unlimited number of shares of beneficial interest, which may be divided into different series and classes. The Trust is registered as an open-end management investment company under the Investment Company Act of 1940, as amended (the “1940 Act”). The Trust currently consists of two series that have commenced operations, Blackstone Alternative Multi-Manager Fund (“Multi-Manager Fund”) and Blackstone Alternative Multi-Strategy Fund (“Multi-Strategy Fund”) (each individually referred to as a “Fund”, and collectively, the “Funds”). The Multi-Manager Fund and the Multi-Strategy Fund are non-diversified funds that commenced operations offering Class I Shares on August 6, 2013 and June 16, 2014, respectively. The Multi-Strategy Fund also offers Class D Shares, Class Y Shares and Class R Shares, of which, Class D Shares and Class Y Shares commenced operations on November 17, 2014 and January 28, 2015, respectively.
The investment adviser of the Funds is Blackstone Alternative Investment Advisors LLC (“BAIA” or the “Investment Adviser”), a registered investment adviser under the Investment Advisers Act of 1940, as amended. The Board of Trustees (the “Board” and each member a “Trustee”) of the Trust supervises the conduct of each Fund’s affairs and, pursuant to an investment management agreement, has engaged BAIA to manage each Fund’s day-to-day investment activities. Each Fund’s investment objective is to seek capital appreciation. The Investment Adviser seeks to achieve the Funds’ objectives by allocating the Funds’ assets among a variety of non-traditional or, “alternative,” investment strategies. The Investment Adviser determines the allocations of the Funds�� assets and allocates a majority of the Funds’ assets among the sub-advisers (the “Sub-Advisers”) with experience managing alternative investment strategies and among investment funds, and may also manage a portion of the Funds’ assets directly. Each Sub-Adviser is responsible for the day-to-day management of the Funds’ assets that the Investment Adviser allocates to it. The Investment Adviser has the responsibility to oversee each Sub-Adviser (subject to the oversight of the Board).
Each Fund’s assets may be invested in three wholly-owned and controlled subsidiaries of the Fund (collectively, the “Subsidiaries”), each of which has the same investment objective as the Funds. One of each Fund’s Subsidiaries, Blackstone Alternative Multi-Manager Sub Fund II Ltd. and Blackstone Alternative Multi-Strategy Sub Fund II Ltd. (the “Cayman Subsidiaries”), is a Cayman Islands exempted company. Each of the other Subsidiaries, Blackstone Alternative Multi-Manager Sub Fund III L.L.C. and Blackstone Alternative Multi-Strategy Sub Fund III L.L.C., (the “Domestic Subsidiaries III”), and Blackstone Alternative Multi-Manager Sub Fund IV L.L.C. and Blackstone Alternative Multi-Strategy Sub Fund IV L.L.C. (the “Domestic Subsidiaries IV”), are Delaware limited liability companies. The Cayman Subsidiaries invest, directly or indirectly through the use of derivatives, in securities and commodity interests. Domestic Subsidiaries III and Domestic Subsidiaries IV invest, directly or indirectly through the use of derivatives, almost entirely in securities (with only de minimis exposure to commodity interests). The consolidated financial statements include the financial statements of the Multi-Manager Fund and its applicable Subsidiaries and the Multi-Strategy Fund and its applicable Subsidiaries. Except where context otherwise requires, the term “Fund” refers to the Fund together with the applicable Subsidiaries.
The Funds and the Cayman Subsidiaries are each a commodity pool subject to regulation by the Commodity Futures Trading Commission (“CFTC”). BAIA, the commodity pool operator of the Funds and the Cayman Subsidiaries, is registered as such with the CFTC, but has claimed relief under Rules 4.12(c)(3) and 4.7 of the Commodity Exchange Act (“CEA”), respectively, from certain disclosure, reporting, and recordkeeping requirements otherwise applicable to commodity pools. None of the Domestic Subsidiaries III and Domestic Subsidiaries IV intend to invest more than a de minimis level of its net assets in “commodity interests” (as defined under the CEA). Accordingly, BAIA has claimed an exemption under Rule 4.13(a)(3) from
233
Blackstone Alternative Investment Funds and Subsidiaries
Notes to Consolidated Financial Statements (Continued)
For the Period Ended March 31, 2015
registration as a commodity pool operator with respect to the Domestic Subsidiaries III and the Domestic Subsidiaries IV, and such pools are not subject to regulation by the CFTC.
Capitalized terms used, but not defined herein, shall have the meaning assigned to them in the respective Prospectus of each of the Funds.
2. Basis of Presentation
Each Fund’s consolidated financial statements are prepared in accordance with accounting principles generally accepted in the United States of America (“U.S. GAAP”) and are stated in U.S. dollars. All inter-company accounts and transactions have been eliminated in consolidation. The preparation of financial statements in accordance with U.S. GAAP requires management to make certain estimates and assumptions that affect the reported amount of assets and liabilities, the disclosure of contingent assets and liabilities, and the reported amounts of income and expenses during the reporting period. Actual results could differ from these estimates and these differences could be material.
The Funds are investment companies in accordance with Accounting Standards Codification 946, Financial Services – Investment Companies (“ASC 946”), which defines investment companies and prescribes specialized accounting and reporting requirements for investment companies.
3. Significant Accounting Policies
The net asset value (“NAV”) of each Fund’s shares is calculated as of the close of regular trading on the New York Stock Exchange (“NYSE”) (generally 4:00 pm Eastern Time) on each day that the NYSE is open for business (a “Business Day”).
Valuation Policy
For purposes of calculating the NAV, each Fund values its investments in securities, securities sold short, derivative financial instruments and other investments at fair value. U.S. GAAP defines fair value as the price that each Fund would receive to sell an asset or pay to transfer a liability (i.e. the exit price) in an orderly transaction between market participants at the measurement date. The Board has established procedures for determining the fair value of securities, including securities sold short, and derivative financial instruments and other investments (together the “investments”) (the “Valuation Procedures”). The Board has delegated to the Investment Adviser day-to-day responsibility for implementing the Valuation Procedures. The Investment Adviser’s management has formed the Fair Value Committee (the “FVC”), which provides oversight of the valuation and pricing function of each Fund for all investments. Pursuant to the Valuation Procedures, if market quotations are not readily available (or are otherwise not reliable for a particular investment), the fair value will be determined, in good faith by the FVC, and such determinations shall be reported to the Board. Due to the inherent uncertainty of these estimates, estimates of fair value may differ from the values that would have been used had a ready market for these investments existed and the differences could be material.
Market quotes are considered not readily available in circumstances where there is an absence of current or reliable market-based data (e.g., trade information, bid/ask information, or broker-dealer quotations), including where events occur after the close of the relevant market, but prior to the close of the NYSE, that materially affect the values of a Fund’s investments. In addition, market quotes are considered not readily available when, due to extraordinary circumstances, the exchanges or markets on which securities trade do not open for trading for the entire day and no other market prices are available. The Board has delegated to the FVC and the Investment Adviser the responsibility for monitoring significant events that may materially
234
Blackstone Alternative Investment Funds and Subsidiaries
Notes to Consolidated Financial Statements (Continued)
For the Period Ended March 31, 2015
affect the values of each Fund’s investments and for determining whether the value of the applicable investments should be re-evaluated in light of such significant events. There were no instances of such determination made as of March 31, 2015.
Fair Value Measurements
Fair value guidance defines fair value, establishes a framework for measuring fair value, and expands disclosures about fair value measurements. The hierarchy established under the fair value guidance gives the highest priority to unadjusted quoted prices in active markets for identical assets or liabilities (Level 1) and the lowest priority to unobservable inputs (Level 3).
The availability of observable inputs can vary from security to security and is affected by a wide variety of factors, including, for example, the type of security, whether the security is new and not yet established in the marketplace, the liquidity of markets, and other characteristics particular to the security. To the extent that valuation is based on models or inputs that are less observable or unobservable in the market, the determination of fair value requires more judgment. Accordingly, the degree of judgment exercised in determining fair value is greatest for investments categorized in Level 3. The inputs or methodology used for valuing an investment are not necessarily an indication of the risk associated with investing in those securities.
Investments measured and reported at fair value are classified and disclosed in one of the following levels within the fair value hierarchy based on the lowest level of input that is significant to the fair value measurement:
Level 1 – quoted prices are available in active markets for identical investments as of the measurement date. The Funds do not adjust the quoted price for these investments.
The types of investments categorized within Level 1 generally include actively traded domestic and certain foreign equity securities, and derivative financial instruments actively traded on recognized exchanges.
Level 2 – quoted prices are available in markets that are not active or model inputs are based on inputs that are either directly or indirectly observable as of the measurement date. Investments in investment funds or hedge funds (“Investee Funds”) are classified as Level 2 if the Funds have the ability to redeem their investment in the Investee Fund at the reported net asset value per share (or its equivalent) at the measurement date or within 90 days thereof, upon no greater than 90 days prior written notice and there are no other potential liquidity restrictions that could be invoked within 90 days of the measurement date.
The types of investments categorized within Level 2 generally include certain foreign equities; fixed income securities including corporate and convertible bonds, loans, trade claims, sovereign debt obligations, U.S. Treasury obligations, and asset-backed and mortgage-backed securities; over-the-counter (“OTC”) derivative financial instruments such as total return swaps, interest rate swaps, credit default swaps, OTC options; and forward foreign currency exchange contracts.
Level 3 – pricing inputs are unobservable and include instances where there is little, if any, market activity for the investment. Inputs reflect the best estimate of what market participants would use in determining fair value of investments as of the measurement date. Investments in Investee Funds that are subject to a minimum holding period or lockup greater than 90 days from the measurement date, are in liquidation, cannot be redeemed within 90 days of the measurement date, are subject to redemption notice periods in excess of 90 days, have limited the individual amount of shareholder redemptions and/or aggregate amount of shareholder redemptions, or have suspended redemptions are classified as Level 3.
235
Blackstone Alternative Investment Funds and Subsidiaries
Notes to Consolidated Financial Statements (Continued)
For the Period Ended March 31, 2015
Changes in valuation techniques may result in transfers in or out of an investment’s assigned level within the fair value hierarchy. In addition, in periods of market dislocation, the observability of prices and inputs may be reduced for many instruments. This condition, as well as changes related to liquidity of investments, could cause an investment to be reclassified between Level 1, Level 2, or Level 3.
A description of the valuation techniques applied to each Fund’s major categories of investments measured at fair value on a recurring basis are as follows:
Exchange-Traded Securities
Equity securities, including common stock, listed preferred stock, exchange-traded funds, and derivative financial instruments, such as futures contracts and option contracts, that are traded on a recognized securities exchange or on the NASDAQ Global Market System (“NASDAQ”) are valued at the last reported sales price (or the official closing price of certain foreign exchanges) or the NASDAQ official closing price, as applicable. For securities traded on more than one exchange, the last reported sales price on the exchange where the security is primarily traded is used. To the extent these securities and derivative financial instruments are actively traded and adjustments are not applied, they are categorized as Level 1 within the fair value hierarchy.
The Funds may use a third-party fair valuation service provider to value foreign equity securities that are primarily traded outside of North and South America. The third-party fair valuation service provider calculates a factor that is applied to adjust the last price of each such security in the event that there is movement in excess of a specified trigger as measured by the movement between the prior close and the current close of the U.S. market. Foreign equities for which the last price has been adjusted by such factor will generally be categorized as Level 2 within the fair value hierarchy. As of March 31, 2015, no such adjustments have been made.
OTC Derivative Financial Instruments
Derivative financial instruments, such as forward foreign currency exchange contracts, OTC options contracts, or swap agreements, derive their value from underlying referenced instruments or obligations, indices, reference rates, and other inputs or a combination thereof. These contracts are normally valued by pricing service providers or based on broker dealer quotations. Depending on the nature of the instruments and the terms of the transaction, the value of derivative financial instruments can be estimated by a pricing service provider using a series of techniques, including simulation pricing models. The pricing models use inputs that are observed from actively quoted markets such as issuer details, indices, spreads, interest rates, yield curves, dividends and exchange rates. Derivative financial instruments that use similar valuation techniques and inputs as described above are categorized as Level 2 within the fair value hierarchy.
Centrally cleared swaps listed or traded on a multilateral or trade facility platform, such as a registered exchange, are valued at the daily settlement price determined by the respective exchange. For centrally cleared credit default swaps the clearing facility requires its members to provide actionable levels across complete term structures. These levels along with external third-party prices are used to produce daily settlement prices. Centrally cleared interest rate swaps are valued using a pricing model that references the underlying rates to produce the daily settlement price. These securities are categorized as Level 2 within the fair value hierarchy.
Fixed Income Securities
Fixed income securities, including corporate and convertible bonds, U.S. Treasury obligations, foreign debt obligations, bank loans, and trade claims, are normally valued by pricing service providers on the basis of last
236
Blackstone Alternative Investment Funds and Subsidiaries
Notes to Consolidated Financial Statements (Continued)
For the Period Ended March 31, 2015
available bid price. In determining the value of a particular investment, pricing service providers may use broker-dealer quotations, reported trades or valuation estimates from their internal pricing models to determine the reported price. The pricing service providers’ internal models use observable inputs such as issuer details, interest rates, yield curves, prepayment speeds, credit risks/spreads, default rates and quoted prices for similar assets. Securities that use similar valuation techniques and inputs as described above are categorized as Level 2 within the fair value hierarchy.
Mortgage-related and asset-backed securities (“ABS”) are usually issued as separate tranches, or classes, of securities within each deal. These securities are also normally valued by pricing service providers that use broker-dealer quotations or valuation estimates from their internal pricing models. The pricing models for these securities usually consider tranche-level attributes, current market data, estimated cash flows and market-based yield spreads for each tranche, and incorporate deal collateral performance, as available. Mortgage-related and ABS that use similar valuation techniques and inputs as described above are categorized as Level 2 within the fair value hierarchy.
Level 3 securities are valued by broker quotes or pricing services that may employ valuation techniques with unobservable inputs. At March 31, 2015, the values of these Level 3 securities for Multi-Manager Fund and Multi-Strategy Fund were approximately $11,930,962 and $19,084,537, respectively. The appropriateness of fair values for these securities are monitored on an ongoing basis which may include results of backtesting, results of pricing due diligence, unchanged price review, use of specialists, and consideration of macro security specific events.
Investment in Investee Fund
The fair value of investments in Investee Funds is generally determined using the reported net asset value per share of the Investee Fund, or its equivalent, as a practical expedient for fair value, unless the investment in Investee Fund is traded on a recognized securities exchange and a quoted price is available as of the measurement date. If there is no quoted price available, the Funds may, as a practical expedient, estimate the fair value of an Investee Fund based on the reported net asset value per share or its equivalent if the reported net asset value per share or its equivalent of the Investee Fund is calculated in a manner consistent with the measurement principles applied to investment companies, in accordance with ASC 946.
Securities and Other Investments
Bank Loans
The Funds may invest in bank loans including, for example, corporate loans, loan participations, direct debt, bank debt, and bridge debt. Each Fund invests in loans through novations, assignments, and participation interests. In a novation, a Fund typically assumes all of the rights of a lending institution in a loan, including the right to receive payments of principal and interest and other amounts directly from the borrower and to enforce its rights as a lender directly against the borrower. When a Fund takes an assignment of a loan, the Fund acquires some or all of the interest of another lender (or assignee) in the loan. In such cases, the Funds may be required generally to rely upon the assignor to demand payment and enforce rights under the loan. If a Fund acquires a participation in the loan, the Fund purchases an indirect interest in a loan held by a third party and the Fund typically will have a contractual relationship only with the third party loan investor, not with the borrower. As a result, the Fund may have the right to receive payments of principal, interest, and any fees to which it is entitled only from the loan investor selling the participation and only upon receipt by such loan investor of such payments from the borrower. In such cases, the Fund assumes the credit risk of both the borrower and the loan investor selling the participation, and the Fund may be unable to realize some or all of the value of its interest in the loan in the event of the insolvency of the third party.
237
Blackstone Alternative Investment Funds and Subsidiaries
Notes to Consolidated Financial Statements (Continued)
For the Period Ended March 31, 2015
Changes in the financial condition of the borrower or economic conditions or other circumstances may reduce the capacity of the borrower to make principal and interest payments on such instruments and may lead to defaults.
Mortgage-Related and Other Asset-Backed Securities
The Funds may invest in mortgage-related securities (residential and commercial) and other ABS. These securities include mortgage pass-through securities, collateralized mortgage obligations (“CMO”), commercial mortgage-backed securities (“CMBS”), residential mortgage-backed securities (“RMBS”), collateralized debt obligations (“CDO”) and other securities that directly or indirectly represent a participation, or are secured by and payable from mortgage loans on real property. Mortgage related and other ABS represent interests in pools of mortgages, loans or other assets. Mortgage-related securities are created from pools of residential or commercial mortgage loans, including loans made by savings and loans institutions, mortgage bankers, commercial banks and others. These securities provide a monthly payment which consists of both interest and principal payments. Interest payments may be determined by fixed or adjustable rates. Although ABS and CMBS generally experience less prepayment risk than RMBS, each of RMBS, CMBS and ABS, like traditional fixed-income securities, are subject to credit, interest rate, prepayment and extension risks.
Small movements in interest rates (both increases and decreases) may quickly and significantly reduce the value of certain mortgage-backed securities. The Funds’ investments in ABS are subject to risks similar to those associated with mortgage-related securities, as well as additional risks associated with the nature of the assets and the servicing of those assets. These securities also are subject to the risk of default on the underlying mortgage or assets, particularly during periods of economic downturn. The timely payment of principal and interest of certain mortgage-related securities is guaranteed by the full faith and credit of the U.S Government.
Mortgage-backed securities may be either pass-through securities or CMO. Pass-through securities represent a right to receive principal and interest payments collected on a pool of mortgages, which are passed through to security holders. CMO are created by dividing the principal and interest payments collected on a pool of mortgages into several revenue streams (tranches) with different priority rights to portions of the underlying mortgage payments. Certain CMO tranches may represent a right to receive interest only (“IOs”), principal only (“POs”) or an amount that remains after floating-rate tranches are paid (an “inverse floater”). These securities may be extremely sensitive to changes in interest rates. Interest rates on inverse floaters, for example, vary inversely with a short-term floating rate (which may be reset periodically). Interest rates on inverse floaters will decrease when short-term rates increase, and will increase when short-term rates decrease. These securities have the effect of providing a degree of investment leverage. In response to changes in market interest rates or other market conditions, the value of an inverse floater may increase or decrease at a multiple of the increase or decrease in the value of the underlying securities. If a Fund invests in CMO tranches (including CMO tranches issued by government agencies) and interest rates move in a manner not anticipated by the Investment Adviser, it is possible that the Fund could lose all or substantially all of its investment.
Securities Sold Short
The Funds may sell securities short (a “Short Sale”). A Short Sale is a transaction whereby a Fund sells securities it does not own in anticipation of a decline in the market price of those securities, whereby a Fund’s broker will execute a borrow transaction to deliver the securities resulting from the Fund’s Short Sale. The Funds are obligated to repurchase the securities at the market price at the time of replacement. The Fund’s obligations to replace the securities in connection with a Short Sale are secured by collateral.
238
Blackstone Alternative Investment Funds and Subsidiaries
Notes to Consolidated Financial Statements (Continued)
For the Period Ended March 31, 2015
Upon entering into a Short Sale, the Funds establish a liability which is recorded as securities sold short in the Consolidated Statement of Assets and Liabilities to represent securities due under the Short Sale agreement. The Funds are liable to pay any dividends declared and/or interest income earned during the period the Short Sale is open. These dividends and interest are recorded as dividend and interest expense on securities sold short in the Consolidated Statement of Operations. Unrealized appreciation or depreciation for the difference between the proceeds received and the fair value of the open Short Sale position is recorded as net unrealized appreciation or depreciation from investments on securities sold short in the Consolidated Statement of Operations. A realized gain or loss is recognized when the short position is closed as a net realized gain or loss from investments on securities sold short in the Consolidated Statement of Operations.
Investment Transactions and Related Investment Income
Investment transactions are recorded as of the trade date for financial reporting purposes. Dividend income is recorded on the ex-dividend date or, for certain foreign securities, when notified. Interest income, which includes amortization of premiums and accretion of discounts on non-defaulted fixed income securities, is recorded on an accrual basis. Realized gains and losses on investments are determined on the identified cost basis, which is the same basis used for federal income tax purposes. Foreign income and foreign capital gains on some foreign securities may be subject to foreign taxes, which are accrued as applicable.
Cash
At March 31, 2015, the Multi-Manager Fund and the Multi-Strategy Fund had $276,096,042 and $373,565,803, respectively, in domestic cash and $9,497,074 and $5,767,921, respectively, in foreign cash held at a major U.S. bank.
Foreign Currency
The functional currency of each Fund is the U.S. dollar. Assets and liabilities denominated in foreign currencies are translated into U.S. dollars at the closing prices of such currencies on each Business Day. Purchases and sales of investments and income and expenses are translated on the respective dates of such transactions or when accrued. The Funds do not isolate the portion of realized or unrealized gains or losses resulting from changes in the foreign exchange rate on investments from fluctuations arising from changes in the fair value of the investments. Such gains and losses are included with net realized and unrealized gain or loss on investments. Net realized gains and losses on foreign currency transactions represent net realized exchange gains or losses on disposition of foreign currencies and currency gains and losses realized between trade and settlement dates on investment transactions. Net unrealized appreciation and deprecation of assets and liabilities, other than investments, attributable to foreign currency fluctuations are recorded as net unrealized appreciation or depreciation on foreign currency translations in the Consolidated Statement of Operations.
Contingencies
Under the Trust’s Declaration of Trust, each of the Funds’ officers and Trustees are indemnified against certain liabilities that may arise out of the performance of their duties to the Funds. Additionally, in the normal course of business, the Funds may enter into contracts that contain a variety of representations and indemnifications. The Funds expect the risk of loss pursuant to these indemnifications to be remote.
Income Taxes
The Funds’ policy is to comply with the provisions of the Internal Revenue Code, as amended, applicable to regulated investment companies and to distribute all of its investment company taxable income and net long-term capital gains to its shareholders.
239
Blackstone Alternative Investment Funds and Subsidiaries
Notes to Consolidated Financial Statements (Continued)
For the Period Ended March 31, 2015
Therefore, no federal income tax provision is expected to be required. The Funds plan to file U.S. federal and various state and local tax returns.
For the open tax years and all major jurisdictions, management of the Funds has concluded that there are no significant uncertain tax positions that would require recognition in the consolidated financial statements.
Organization Costs
Organizational expenses associated with the establishment of the Funds were expensed by the Funds as incurred and reimbursed by the Investment Adviser in accordance with the terms of the Expense Limitation and Reimbursement agreement (see Note 7).
Offering Costs
Offering costs are amortized over 12 months on a straight-line basis beginning on the date of commencement of operations.
Dividends and Distributions to Shareholders
Dividends from net investment income and distributions of net realized capital gains of the Funds, if any, are generally declared and paid in December, however, the Funds may make additional distributions at other times. Dividends and capital gain distributions paid by the Funds will be reinvested in additional Shares (see Note 6) of the Funds or, if elected by the Shareholder, paid in cash.
Segregation and Collateralization
In cases in which the 1940 Act and the interpretive positions of the Securities and Exchange Commission (“SEC”) and its staff require that a Fund either delivers collateral or segregates assets in connection with certain investments (e.g., futures contracts, forward foreign currency exchange contracts, swaps and options written), or transactions considered to reflect borrowings (e.g., reverse repurchase agreements), the Fund will, consistent with SEC rules and/or certain interpretive guidance issued by the SEC, segregate collateral or designate on its books and records cash or liquid securities having a market value at least equal to the amount that would otherwise be required to be physically segregated. Furthermore, based on requirements and agreements with certain exchanges and third party broker-dealers, a Fund engaging in such transactions may have requirements to deliver/deposit securities to/with an exchange or broker-dealer as collateral for certain investments to the extent consistent with the 1940 Act and interpretive positions of the SEC and its staff. The Funds may mitigate counterparty risk by procuring collateral and through netting provisions included within an International Swaps and Derivatives Association, Inc. master agreement (“ISDA Master Agreement”) implemented between each Fund and each of its respective counterparties. An ISDA Master Agreement may contain certain provisions regarding, among other things, the parties’ general obligations, representations, agreements, collateral requirements, events of default and early termination. Certain ISDA Master Agreements, or similar agreements, may allow the Funds to offset certain derivative financial instruments’ with collateral. At March 31, 2015, the Funds used the gross method of presentation in their consolidated financial statements and did not elect to offset amounts eligible for offset under enforceable master netting arrangements or similar agreements. The amount of collateral moved to/from applicable counterparties is generally based upon minimum transfer amounts of up to $250,000. Collateral pledged by the Funds is segregated by the Funds’ custodian and identified as such in each Fund’s portfolio. Collateral can be in the form of cash or securities as agreed to by the Funds and the applicable counterparty. Typically, the Funds and counterparties are not permitted to sell, repledge or use the collateral they receive unless explicitly permitted by each respective governing agreement.
240
Blackstone Alternative Investment Funds and Subsidiaries
Notes to Consolidated Financial Statements (Continued)
For the Period Ended March 31, 2015
The Funds manage counterparty risk by entering into agreements only with counterparties that are believed to have the financial resources to honor their obligations and by monitoring the financial stability of those counterparties. The agreements entered into by the Funds may contain credit risk related contingent features that may be triggered in certain circumstances to protect either party from a deterioration in creditworthiness of the other. Such circumstances may include a decrease in credit rating or, in the case of a Fund, a decrease in net asset value. If triggered, the fund or counterparty may be entitled to additional cash margin and/or to terminate the contract. Please refer to Note 9 for a further discussion of the risks of a Fund, including Credit and Counterparty Risk.
Reverse Repurchase Agreements
The Funds may enter into reverse repurchase agreements. In a reverse repurchase agreement, a Fund sells a security in exchange for cash to a financial institution, the counterparty, with a simultaneous agreement to repurchase the same or substantially the same security at an agreed upon price and date, under the terms of a Master Repurchase Agreement (“MRA”). The Fund is entitled to receive principal and interest payments, if any, made on the security delivered to the counterparty during the term of the agreement. Cash received in exchange for securities delivered plus accrued interest payments to be made by the Fund to counterparties is reflected as a liability. Reverse repurchase agreements involve the risk that the market value of the securities purchased with the proceeds from the sale of securities received by the Fund may decline below the price of the securities the Fund is obligated to repurchase. Reverse repurchase agreements also involve credit risk with the counterparty to the extent that the value of securities subject to repurchase exceed the Fund’s liability under the reverse repurchase agreement. Securities subject to repurchase under reverse repurchase agreements, if any, are designated as such in the Consolidated Schedule of Investments. Due to the short term nature of the reverse repurchase agreements, face value approximates fair value. As of March 31, 2015, the face values of open reverse repurchase agreements for Multi-Manager Fund and Multi-Strategy Fund were $119,600,710 and $35,288,710, respectively. The weighted average daily balances of reverse repurchase agreements outstanding during the period ended March 31, 2015 for Multi-Manager Fund and Multi-Strategy Fund were approximately $61,215,119 and $21,420,961, respectively, at a weighted average weekly interest rate of 1.59% and 1.61%, respectively.
An MRA contains provisions for, among other things, initiation, income payments, events of default and maintenance of securities for repurchase agreements. An MRA also permits offsetting with collateral to create one single net payment in the event of default or similar events, including the bankruptcy or insolvency of a counterparty. The following table presents the reverse repurchase agreements, which are subject to enforceable MRAs, as well as the collateral delivered related to those reverse repurchase agreements.
Multi-Manager Fund
Counterparty | Reverse Repurchase Agreements | Fair Value of Non-Cash Collateral(1) | Cash Collateral Pledged(1) | Net Amount | ||||||||||||||||
Credit Suisse Securities (USA) LLC | $ | (21,620,897 | ) | $ | 21,620,897 | $ | — | $ | — | |||||||||||
Credit Suisse Securities (Europe) LLC | (3,612,525 | ) | 3,612,525 | — | — | |||||||||||||||
J.P. Morgan Securities LLC | (1,761,349 | ) | 1,761,349 | — | — | |||||||||||||||
Merrill Lynch, Pierce, Fenner & Smith, Inc. | (86,149,852 | ) | 86,149,852 | — | — | |||||||||||||||
Royal Bank of Canada | (6,601,674 | ) | 6,601,674 | — | — | |||||||||||||||
|
|
|
|
|
|
|
| |||||||||||||
Total | $ | (119,746,297 | ) | $ | 119,746,297 | $ | — | $ | — | |||||||||||
|
|
|
|
|
|
|
| |||||||||||||
| (1) | Excess of collateral pledged is not shown for financial reporting purposes. The total fair value of non-cash and cash collateral pledged at March 31, 2015 was $163,038,933 and $2,342,297, respectively. |
241
Blackstone Alternative Investment Funds and Subsidiaries
Notes to Consolidated Financial Statements (Continued)
For the Period Ended March 31, 2015
Multi-Strategy Fund
Counterparty | Reverse Repurchase Agreements | Fair Value of Non-Cash Collateral(1) | Cash Collateral Pledged(1) | Net Amount | ||||||||||||||||
Credit Suisse Securities (USA) LLC | $ | (10,952,175 | ) | $ | 10,952,175 | $ | — | $ | — | |||||||||||
Credit Suisse Securities (Europe) LLC | (1,850,343 | ) | 1,850,343 | — | — | |||||||||||||||
J.P. Morgan Securities LLC | (502,865 | ) | 502,865 | — | — | |||||||||||||||
Merrill Lynch, Pierce, Fenner & Smith, Inc. | (19,575,063 | ) | 19,575,063 | — | — | |||||||||||||||
Royal Bank of Canada | (2,451,032 | ) | 2,451,032 | — | — | |||||||||||||||
|
|
|
|
|
|
|
| |||||||||||||
Total | $ | (35,331,478 | ) | $ | 35,331,478 | $ | — | $ | — | |||||||||||
|
|
|
|
|
|
|
| |||||||||||||
| (1) | Excess of collateral pledged is not shown for financial reporting purposes. The total fair value of non-cash and cash collateral pledged at March 31, 2015 was $48,249,946 and $365,546, respectively. |
Securities Lending
The Funds may lend securities, through their agent, to certain qualified financial institutions. The loans are collateralized by cash in an amount at least equal to the market value of the securities loaned. The market value of securities loaned is determined daily and any additional required collateral is allocated to each Fund on the next Business Day. The initial collateral received by each Fund should have a value of at least 102% of the current value of loaned securities for U.S. securities and at least 105% for all other securities. The risk of borrower default will be borne by the Fund’s agent; the Funds will bear the risk of loss with respect to the investment of the cash collateral. The advantage of such loans is that each Fund continues to receive income on loaned securities while earning returns on the cash amounts which may be reinvested for the purchase of investment in securities. Income from securities lending is included in investment income on the Consolidated Statement of Operations. As of March 31, 2015, the market value of securities loaned for Multi-Manager Fund and Multi-Strategy Fund amounted to $72,515,411 and $69,038,609, respectively, and each Fund had received cash collateral of $74,949,395 and $71,359,374, respectively.
The securities lending agreement entered into by each Fund provides the right, in the event of default, for the non-defaulting party to liquidate the collateral and calculate a net exposure to the defaulting party or request additional collateral. Under the agreement, the Funds can reinvest cash collateral.
The following table is a summary of each Fund’s securities lending agreements by borrower/counterparty which are subject to offset under the securities lending agreement as of March 31, 2015:
Multi-Manager Fund
Borrower/Counterparty | Securities Loaned at Value | Cash Collateral Received(1) | Net Amount | ||||||||||||
BNP Paribas Prime Brokerage, Inc. | $ | 3,061,836 | $ | (3,061,836 | ) | $ | — | ||||||||
Citadel Securities LLC | 977,803 | (977,803 | ) | — | |||||||||||
Citigroup Global Markets, Inc. | 2,457,734 | (2,457,734 | ) | — | |||||||||||
Credit Suisse Securities (USA) LLC | 3,373,971 | (3,373,971 | ) | — | |||||||||||
Deutsche Bank Securities, Inc. | 1,669,522 | (1,669,522 | ) | — | |||||||||||
Goldman Sachs & Co. | 2,293,236 | (2,293,236 | ) | — | |||||||||||
Janney Montgomery Scott LLC | 166,513 | (166,513 | ) | — | |||||||||||
Jefferies LLC | 1,665,443 | (1,665,443 | ) | — | |||||||||||
242
Blackstone Alternative Investment Funds and Subsidiaries
Notes to Consolidated Financial Statements (Continued)
For the Period Ended March 31, 2015
Borrower/Counterparty | Securities Loaned at Value | Cash Collateral Received(1) | Net Amount | ||||||||||||
JP Morgan Clearing Corp. | $ | 6,230,721 | $ | (6,230,721 | ) | $ | — | ||||||||
JP Morgan Securities LLC | 801,010 | (801,010 | ) | — | |||||||||||
Merrill Lynch, Pierce, Fenner & Smith, Inc. | 13,430,699 | (13,430,699 | ) | — | |||||||||||
Pershing LLC | 537,642 | (537,642 | ) | — | |||||||||||
RBC Capital Markets, LLC | 2,854,713 | (2,854,713 | ) | — | |||||||||||
Sanford C. Bernstein & Co. LLC | 828,338 | (828,338 | ) | — | |||||||||||
State Street Bank and Trust Company | 32,166,230 | (32,166,230 | ) | — | |||||||||||
|
| ||||||||||||||
Total | $ | 72,515,411 | $ | (72,515,411 | ) | $ | — | ||||||||
|
| ||||||||||||||
Multi-Strategy Fund
Borrower/Counterparty | Securities Loaned at Value | Cash Collateral Received(1) | Net Amount | ||||||||||||
Banca IMI Securities Corp. | $ | 17,963 | $ | (17,963 | ) | $ | — | ||||||||
BNP Paribas Prime Brokerage, Inc. | 1,474,222 | (1,474,222 | ) | — | |||||||||||
BNP Paribas Securities Corp. | 106,500 | (106,500 | ) | — | |||||||||||
Citadel Securities LLC | 120,884 | (120,884 | ) | — | |||||||||||
Citigroup Global Markets, Inc. | 3,669,137 | (3,669,137 | ) | — | |||||||||||
Deutsche Bank Securities, Inc. | 10,914,444 | (10,914,444 | ) | — | |||||||||||
Goldman Sachs & Co. | 1,488,425 | (1,488,425 | ) | — | |||||||||||
Industrial & Commercial Bank of China Financial Services LLC | 96,500 | (96,500 | ) | — | |||||||||||
Janney Montgomery Scott LLC | 737,707 | (737,707 | ) | — | |||||||||||
JP Morgan Clearing Corp. | 4,129,613 | (4,129,613 | ) | — | |||||||||||
JP Morgan Securities LLC | 206,520 | (206,520 | ) | — | |||||||||||
Merrill Lynch, Pierce, Fenner & Smith, Inc. | 22,850,363 | (22,850,363 | ) | — | |||||||||||
Morgan Stanley & Co. LLC | 1,486,602 | (1,486,602 | ) | — | |||||||||||
Natixis Securities Americas, LLC | 15,411,650 | (15,411,650 | ) | — | |||||||||||
Pershing LLC | 4,372,787 | (4,372,787 | ) | — | |||||||||||
Sanford C. Bernstein & Co. LLC | 133,443 | (133,443 | ) | — | |||||||||||
SG Americas Securities, LLC | 1,519,629 | (1,519,629 | ) | — | |||||||||||
UBS Securities LLC | 302,220 | (302,220 | ) | — | |||||||||||
|
| ||||||||||||||
Total | $ | 69,038,609 | $ | (69,038,609 | ) | $ | — | ||||||||
|
| ||||||||||||||
| (1) | Excess of collateral received from the individual counterparty is not shown for financial reporting purposes. |
Recent Accounting Pronouncements
In June 2014, The Financial Accounting Standards Board (“FASB”) issued Accounting Standards Update (“ASU”) No. 2014-11, Transfers and Servicing (Topic 860) – Repurchase-to-Maturity Transactions, Repurchase Financings, and Disclosures. The guidance requires that repurchase-to-maturity transactions and repurchase agreements executed as a repurchase financing be accounted for as secured borrowings. The guidance also requires new disclosure for transactions economically similar to repurchase agreements in which the transferor retains substantially all of the exposure to the economic return on the transferred financial assets throughout the term of the transaction and expanded disclosures about the nature of collateral
243
Blackstone Alternative Investment Funds and Subsidiaries
Notes to Consolidated Financial Statements (Continued)
For the Period Ended March 31, 2015
pledged in repurchase agreements and similar transactions accounted for as secured borrowings. The guidance is effective for interim and annual periods beginning after December 15, 2014. The Funds are still evaluating the impact of this guidance.
4. Derivative Financial Instruments
In the normal course of business, the Funds enter into derivative financial instrument contracts for trading and/or economic hedging purposes to increase the returns of the Funds or to protect against exposure to certain risks such as credit risk, equity risk, interest rate risk, foreign currency exchange risk or other risk (e.g. inflation risk). These contracts may be transacted on a recognized exchange or OTC. The following disclosures contain information on how the Funds use derivative financial instruments. The derivative financial instruments outstanding as of period end are disclosed in the Consolidated Schedule of Investments.
Forward Foreign Currency Exchange Contracts
The Funds may enter into forward foreign currency exchange contracts to obtain investment exposure, enhance return or hedge or protect its portfolio holdings against the risk of future movements in certain foreign currency exchange rates. Forward foreign currency exchange contracts, are agreements between two parties to receive or deliver a fixed quantity of foreign currency for an agreed-upon price on an agreed upon future date. The market value of a forward foreign currency contract fluctuates with the changes in foreign currency exchange rates. These contracts are valued daily and the change in market value is recorded as an unrealized gain or loss on forward foreign currency exchange contracts. When a contract is closed, each Fund recognizes a realized gain or loss equal to the difference between the value of the contract at the time it was opened and the value at the time it was closed.
The use of forward foreign currency exchange contracts does not eliminate fluctuations in the underlying prices of the securities of the Funds, but it does establish a rate of exchange that can be achieved in the future. Although forward foreign currency exchange contracts may limit the risk of loss due to a decline in the value of the currency holdings, they also limit any potential gain that might result should the value of the currency increase. In addition, the Funds could be exposed to losses if the counterparties to the contracts are unable to meet the terms of the contracts. Each Fund’s maximum potential loss from such contracts is the aggregate face value in U.S. dollars at the time the contract was opened. These contracts involve market and/or credit risk in excess of the amount recognized in the Consolidated Statement of Assets and Liabilities.
Futures Contracts
The Funds may enter into futures contracts to maintain investment exposure to a target asset class or to enhance return. The Funds may be subject to fluctuations in equity prices, interest rates, commodity prices and foreign currency exchange rates in the normal course of pursuing its investment objective. Futures contracts are standardized agreements to buy or sell a security, or deliver a final cash settlement price in connection with an index, interest rate, currency, or other asset. A Fund must deposit an amount (“initial margin”) equal to a certain percentage of the face value of the futures contract. The initial margin may be in the form of cash or securities which is returned when the Fund’s obligations under the contract have been satisfied. If cash is deposited as the initial margin, it is shown as segregated cash balance with broker for futures contracts on the Consolidated Statement of Assets and Liabilities. Futures contracts are marked-to-market daily and subsequent payments (“variation margin”) are made or received by a Fund depending on whether unrealized gains or losses are incurred. When the contract is closed or expires, a Fund records a realized gain or loss equal to the difference between the value of the contract at the time it was opened and the value at the time it was closed. The potential risk to the Funds is that the change in value of futures contracts may not correspond to the change in the value of the hedge investments. In addition, losses may
244
Blackstone Alternative Investment Funds and Subsidiaries
Notes to Consolidated Financial Statements (Continued)
For the Period Ended March 31, 2015
arise from changes in the value of the underlying instrument, if interest or exchange rates move unexpectedly or if the counterparty is unable to perform. With futures, there is minimal counterparty credit risk to the Funds since futures are exchange traded and the exchanges’ clearinghouse, as counterparty to all exchange traded futures, guarantees the futures against default.
Options Contracts
The Funds purchase and write call and put options. An option contract purchased by a Fund gives the Fund the right, but not the obligation, to buy (call) or sell (put) an underlying instrument at a fixed exercise price during a specified period. Call options written by a Fund give the holder the right to buy the underlying instrument from the Fund at a fixed exercise price; put options written by a Fund give the holder the right to sell the underlying instrument to the Fund at a fixed exercise price. The Funds may use options to hedge against changes in values of securities or currencies it owns or expects to own, to gain or to maintain exposure to interest rates, currencies or broad equity markets, to generate additional income or to enhance returns.
Options trading involve certain additional risks. Specific market movements of the option and the instruments underlying the option cannot be predicted. No assurance can be given that a liquid secondary market will exist for any particular option or at any particular time. A Fund might not be able to enter into a closing transaction for the option as a result of an illiquid market for the option. To realize any profit in the case of an option, therefore, the option holder would need to exercise the option and comply with margin requirements for the underlying instrument. A writer could not terminate the obligation until the option expired or the writer was assigned an exercise notice. The purchaser of an option is subject to the risk of losing the entire purchase price of the option. The writer of an option is subject to the risk of loss resulting from the difference between the premium received for the option and the price of the futures contract underlying the option that the writer must purchase or deliver upon exercise of the option. The writer of a naked option may have to purchase the underlying contract in the market for substantially more than the exercise price of the option in order to satisfy his delivery obligations. This could result in a large net loss.
Equity, foreign currency or index options that may be purchased or sold by the Funds may include options not traded on a securities exchange. The risk of nonperformance by the counterparty on such option may be greater and the ability of a Fund to enter into a closing transaction with respect to such option may be less than in the case of an exchange traded option.
Purchases of put and call options are recorded as investments, the value of which are marked-to-market daily. When a purchased option expires without being exercised, the Fund will realize a loss equal to the premium paid. When a Fund enters into a closing sale transaction, the Fund will realize a gain or loss depending on whether the sales proceeds from the closing sale transaction are greater or less than the premium initially paid for the option. When a Fund exercises a put option, it will realize a gain or loss from the sale of the underlying instrument and the proceeds from such sale will be decreased by the premium originally paid for the put option. When a Fund exercises a call option, the cost of the security which the Fund purchases upon exercise will be increased by the premium originally paid for the call option. Realized gains and losses on purchased options are included in realized gains and losses on investments.
The premium received for a written option is recorded as an asset and an equivalent liability. The liability is marked-to-market daily in accordance with the option’s valuation policy. When a written option expires without being exercised or a Fund enters into a closing purchase transaction, the Fund realizes a gain (or loss if the cost of the closing purchase transaction exceeds the premium received when the option was sold) without regard to any unrealized gain or loss on the underlying instrument and the liability related to such option is eliminated. When a written call option is exercised, the Fund realizes a gain or loss, as adjusted for
245
Blackstone Alternative Investment Funds and Subsidiaries
Notes to Consolidated Financial Statements (Continued)
For the Period Ended March 31, 2015
the premium received, from the sale of the underlying instrument. When a written put option is exercised, the premium received is offset against the amount paid for the purchase of the underlying instrument.
Options Written
Each Fund’s transactions in written call and put options during the period ended March 31, 2015 were as follows:
Multi-Manager Fund
| Calls | Puts | |||||||||||||||||||||||||||||
| Contracts | Notional | Premiums | Contracts | Notional | Premiums | |||||||||||||||||||||||||
Options Outstanding, March 31, 2014 | — | 52,760,000 | $ | 1,144,349 | 1,239,307 | 22,480,000 | $ | 1,040,251 | ||||||||||||||||||||||
Options written | 29,586 | 67,492,600 | 5,713,808 | 1,437,153 | 8,120,800 | 3,789,254 | ||||||||||||||||||||||||
Options bought back | (8,543 | ) | (19,640,000 | ) | (1,630,713 | ) | (1,539,246 | ) | (7,605,400 | ) | (2,221,622 | ) | ||||||||||||||||||
Options expired | (18,409 | ) | (50,297,000 | ) | (4,016,548 | ) | (611,650 | ) | (15,710,000 | ) | (1,754,314 | ) | ||||||||||||||||||
|
|
|
|
|
|
|
|
|
|
|
| |||||||||||||||||||
Options Outstanding, March 31, 2015 | 2,634 | 50,315,600 | $ | 1,210,896 | 525,564 | 7,285,400 | $ | 853,569 | ||||||||||||||||||||||
|
|
|
|
|
|
|
|
|
|
|
| |||||||||||||||||||
Multi-Strategy Fund
| Calls | Puts | |||||||||||||||||||||||||||||
| Contracts | Notional | Premiums | Contracts | Notional | Premiums | |||||||||||||||||||||||||
Options Outstanding, June 16, 2014 (commencement of operations) | — | — | $ | — | — | — | $ | — | ||||||||||||||||||||||
Options written | 12,930 | 23,296,800 | 2,032,902 | 638,357 | 5,670,000 | 1,651,191 | ||||||||||||||||||||||||
Options bought back | (2,959 | ) | (11,437,000 | ) | (464,765 | ) | (1,848 | ) | (2,500,000 | ) | (619,553 | ) | ||||||||||||||||||
Options expired | (7,956 | ) | (899,800 | ) | (1,024,753 | ) | (187,616 | ) | — | (479,533 | ) | |||||||||||||||||||
|
|
|
|
|
|
|
|
|
|
|
| |||||||||||||||||||
Options Outstanding, March 31, 2015 | 2,015 | 10,960,000 | $ | 543,384 | 448,893 | 3,170,000 | $ | 552,105 | ||||||||||||||||||||||
|
|
|
|
|
|
|
|
|
|
|
| |||||||||||||||||||
Swap Agreements
The Funds may enter into total return, interest rate, and credit default swap agreements (“Swaps”). Swaps are bilaterally negotiated agreements between a Fund and a counterparty in which the Fund and counterparty agree to make either periodic net payments on a specified notional amount or a net payment upon termination. Swap agreements are privately negotiated in the over-the-counter market or may be executed in a multilateral or other trade facility platform, such as a registered exchange (“centrally cleared swaps”). A Fund may enter into swap agreements for the purposes of managing exposure to interest rate, credit or market risk, or for other purposes. In connection with these agreements, securities or cash (“segregated cash” or “collateral”) may be paid or received, as applicable, by the Funds as collateral or margin in accordance with the terms of the respective swap agreements to provide assets of value and recourse in the event of default or bankruptcy/insolvency. Securities posted by a Fund as collateral for swaps are identified in the Consolidated Schedule of Investments and segregated cash, if any, is reflected on the Consolidated Statement of Assets and Liabilities.
246
Blackstone Alternative Investment Funds and Subsidiaries
Notes to Consolidated Financial Statements (Continued)
For the Period Ended March 31, 2015
Swap transactions involve, to varying degrees, elements of interest rate, credit and market risk in excess of the amounts recognized in the Consolidated Statement of Assets and Liabilities. Such risks involve the possibility that there will be no liquid market for these agreements, that the counterparty to the agreements may default on its obligation to perform, or that there may be unfavorable changes in market conditions or interest rates. In addition, entering into swap agreements involves documentation risk resulting from the possibility that the parties to a swap agreement may disagree as to the meaning of contractual terms in the agreement. A Fund’s maximum risk of loss from counterparty credit risk is the discounted value of the net cash flows to be received from the counterparty over the contract’s remaining life, to the extent that amount is positive, or the fair value of the contract. The risk may be mitigated by having a master netting arrangement between a Fund and the counterparty and by the posting of collateral by the counterparty to cover the Fund’s exposure to the counterparty. Counterparty risk related to centrally cleared swaps is mitigated due to the protection against defaults provided by the exchange on which these contracts trade.
Interest Rate Swaps: The Funds may enter into OTC and/or centrally cleared interest rate swap contracts to hedge interest rate risk, to gain exposure on interest rates and to hedge prepayment risk. The Funds are subject to interest rate risk exposure in the normal course of pursuing their investment objectives. The Funds may hold fixed rate bonds, and the value of these bonds may decrease if interest rates rise. Interest rate swaps are agreements in which one party pays a stream of interest payments, either fixed or floating rate, for another party’s stream of interest payments, either fixed or floating, on the same notional amount for a specified period of time. A Fund’s maximum risk of loss from counterparty credit risk, as opposed to investment and other types of risk, in respect of interest rate swaps is typically the discounted net value of the cash flows to be received from the counterparty over the contracts remaining life, to the extent that amount is positive.
Interest rate swaps can be purchased or sold with an upfront premium. An upfront payment received by a Fund is recorded as a liability on the Fund’s Consolidated Statement of Assets and Liabilities. An upfront payment made by a Fund is recorded as an asset on the Consolidated Statement of Assets and Liabilities. Interest rate swaps are marked-to-market daily and any change is recorded as an unrealized gain or loss on swaps. Daily fluctuations in the value of centrally cleared interest rate swaps are recorded as a receivable or payable for variation margin on the Consolidated Statement of Assets and Liabilities. Payments, including upfront premiums, received or made are recorded as realized gains or losses at the closing of the contract.
Total Return Swaps: The Funds may enter into total return swap agreements to obtain exposure to a security, index or market without owning such security or investing directly in that security, index or market or to transfer the risk/return of one market (e.g., fixed income) to another market (e.g., equity) (equity risk and/or interest rate risk). Total return swaps are agreements in which one party agrees to make periodic payments to another party based on the change in market value of the underlying instrument, which may include a specified security, index, basket of securities or securities indices during the specific period, in return for periodic payments based on a fixed or floating rate or the total return from other underlying assets. To the extent the total return of the instrument underlying the transaction exceeds or falls short of the offsetting interest rate obligation, a Fund will receive a payment from or make a payment to the counterparty. Total return swaps can also be structured without an interest payment, so that one party pays the other party if the value of the underlying instrument increases and receives payment from the other party if the value of the underlying asset decreases.
Credit Default Swaps: The Funds may enter into OTC credit default swap contracts to hedge credit risk, to hedge market risk, or to gain exposure on single-name issues and/or baskets of securities.
In an OTC credit default swap contract, the protection buyer typically makes an upfront payment and a periodic stream of payments to a counterparty, the protection seller, in exchange for the right to receive a contingent payment upon the occurrence of a credit event on the reference obligation or all other equally
247
Blackstone Alternative Investment Funds and Subsidiaries
Notes to Consolidated Financial Statements (Continued)
For the Period Ended March 31, 2015
ranked obligations of the reference entity. Credit events are contract specific but may include bankruptcy, failure to pay, restructurings and obligation acceleration. An upfront payment received by a Fund or made by a Fund is recorded as a liability or asset, respectively, in the Consolidated Statement of Assets and Liabilities. Periodic payments received or paid by a Fund are recorded as realized gains or losses. Credit default swap contracts are marked-to-market daily and the change is recorded as an unrealized gain or loss on swaps. Upon the occurrence of a credit event, the difference between the par value and the market value of the reference obligation, net of any proportional amount of upfront payment, is recorded as a realized gain or loss on swaps.
Interest rate swaps, total return swaps and credit default swaps outstanding at period end are listed after the Funds’ Consolidated Schedule of Investments.
At March 31, 2015, the Multi-Manager Fund had the following derivative financial instruments, presented on a gross basis and categorized by risk exposure:
Multi-Manager Fund
Asset Derivatives | Liability Derivatives | |||||||||||
Risk Exposure | Consolidated Statement of | Fair Value | Consolidated Statement of | Fair Value | ||||||||
Interest Rate | Centrally cleared swaps, at fair value (b) | $ | 2,098,814 | Centrally cleared swaps, at fair value (b) | $ | (1,132,168 | ) | |||||
| Unrealized appreciation on futures contracts (b) | 1,903,004 | Unrealized depreciation on futures contracts (b) | (1,906,333 | ) | ||||||||
Equity | Swap contracts, at fair value (a) | 4,034,794 | Swap contracts, at fair value (a) | (3,163,580 | ) | |||||||
| Unrealized appreciation on futures contracts (b) | 2,026,227 | Unrealized depreciation on futures contracts (b) | (1,207,920 | ) | ||||||||
| Purchased options, at fair value (c) | 5,033,760 | Options written, at value | (1,078,006 | ) | ||||||||
Commodity | Unrealized appreciation on futures contracts (b) | 1,622,204 | Unrealized depreciation on futures contracts (b) | (1,438,135 | ) | |||||||
Credit | Swaps contracts, at fair value (a) | 78,647 | Swaps contracts, at fair value (a) | (87,312 | ) | |||||||
| Centrally cleared swaps, at fair value (b) | — | Centrally cleared swaps, at fair value (b) | (312,141 | ) | ||||||||
Foreign Exchange | Purchased options, at fair value (c) | 1,408,780 | Options written, at value | (979,292 | ) | |||||||
| Unrealized appreciation on forward foreign currency exchange contracts | 2,984,396 | Unrealized depreciation on forward foreign currency exchange contracts | (1,923,334 | ) | ||||||||
|
|
|
| |||||||||
Total | $ | 21,190,626 | $ | (13,228,221 | ) | |||||||
|
|
|
| |||||||||
Amount not subject to MNA(1) | (12,369,578 | ) | 7,017,512 | |||||||||
|
|
|
| |||||||||
Total gross amounts subject to MNA | $ | 8,821,048 | $ | (6,210,709 | ) | |||||||
|
|
|
| |||||||||
| (1) | See below for disclosure of financial instruments assets and liabilities subject to offset under enforceable master netting arrangements. |
248
Blackstone Alternative Investment Funds and Subsidiaries
Notes to Consolidated Financial Statements (Continued)
For the Period Ended March 31, 2015
The following tables present information about the amount of net realized gain (loss) and net unrealized appreciation (depreciation) on derivative financial instruments for the period ended March 31, 2015:
Consolidated | Average Notional USD(1) | Commodity | Interest Rate | Credit | Equity | Foreign Exchange | Total | ||||||||||||||||||||||||||||
Swap contracts | $ | 358,413,066 | $ | — | $ | (271,497 | ) | $ | (921,397 | ) | $ | 15,598,862 | $ | — | $ | 14,405,968 | |||||||||||||||||||
Futures contracts | 2,693,210,437 | (4,106,945 | ) | 12,459 | — | (25,244,898 | ) | — | (29,339,384 | ) | |||||||||||||||||||||||||
Purchased options (c)(d) | 69,938,584 | — | — | — | (16,655,082 | ) | 575,904 | (16,079,178 | ) | ||||||||||||||||||||||||||
Options written (e) | 68,809,017 | — | — | — | 4,981,191 | 2,499,750 | 7,480,941 | ||||||||||||||||||||||||||||
Forward foreign currency exchange contracts | 668,550,720 | — | — | — | — | 23,280,520 | 23,280,520 | ||||||||||||||||||||||||||||
|
|
|
|
|
|
|
|
|
|
|
| ||||||||||||||||||||||||
| $ | (4,106,945 | ) | $ | (259,038 | ) | $ | (921,397 | ) | $ | (21,319,927 | ) | $ | 26,356,174 | $ | (251,133 | ) | |||||||||||||||||||
|
|
|
|
|
|
|
|
|
|
|
| ||||||||||||||||||||||||
| (1) | Averages are based on monthly activity levels during the period ended March 31, 2015. |
Consolidated Statement of | Commodity | Interest Rate | Credit | Equity | Foreign Exchange | Total | ||||||||||||||||||||||||
Swap contracts (b) | $ | — | $ | (607,672 | ) | $ | 126,908 | $ | 3,189,539 | $ | — | $ | 2,708,775 | |||||||||||||||||
Futures contracts (b) | 145,810 | (975,486 | ) | — | 2,574,516 | — | 1,744,840 | |||||||||||||||||||||||
Purchased options (c) | — | 40,735 | — | 1,156,995 | 355,785 | 1,553,515 | ||||||||||||||||||||||||
Options written | — | — | — | (154,051 | ) | (843,382 | ) | (997,433 | ) | |||||||||||||||||||||
Forward foreign currency exchange contracts | — | — | — | — | 1,860,561 | 1,860,561 | ||||||||||||||||||||||||
|
|
|
|
|
|
|
|
|
|
|
| |||||||||||||||||||
| $ | 145,810 | $ | (1,542,423 | ) | $ | 126,908 | $ | 6,766,999 | $ | 1,372,964 | $ | 6,870,258 | ||||||||||||||||||
|
|
|
|
|
|
|
|
|
|
|
| |||||||||||||||||||
At March 31, 2015, the Multi-Strategy Fund had the following derivative financial instruments, presented on a gross basis and categorized by risk exposure:
Multi-Strategy Fund
Asset Derivatives | Liability Derivatives | |||||||||||
Risk Exposure | Consolidated Statement of | Fair Value | Consolidated Statement of | Fair Value | ||||||||
Interest Rate | Centrally cleared swaps, at fair value (b) | $ | 317,976 | Centrally cleared swaps, at fair value (b) | $ | (638,355 | ) | |||||
| Unrealized appreciation on futures contracts (b) | 1,471,733 | Unrealized depreciation on futures contracts (b) | (1,320,072 | ) | ||||||||
Equity | Swap contracts, at fair value (a) | 2,881,938 | Swap contracts, at fair value (a) | (2,844,327 | ) | |||||||
| Unrealized appreciation on futures contracts (b) | 1,558,379 | Unrealized depreciation on futures contracts (b) | (951,911 | ) | ||||||||
249
Blackstone Alternative Investment Funds and Subsidiaries
Notes to Consolidated Financial Statements (Continued)
For the Period Ended March 31, 2015
Asset Derivatives | Liability Derivatives | |||||||||||
Risk Exposure | Consolidated Statement of | Fair Value | Consolidated Statement of | Fair Value | ||||||||
| Purchased options, at fair value (c) | $ | 4,332,670 | Options written, at value | $ | (784,661 | ) | ||||||
Commodity | Unrealized appreciation on futures contracts (b) | 1,411,533 | Unrealized depreciation on futures contracts (b) | (1,190,832 | ) | |||||||
Credit | Swaps contracts, at fair value (a) | 47,423 | Swaps contracts, at fair value (a) | (52,505 | ) | |||||||
| Centrally cleared swaps, at fair value (b) | — | Centrally cleared swaps, at fair value (b) | (199,113 | ) | ||||||||
Foreign Exchange | Purchased options, at fair value (c) | 396,037 | Options written, at value | (120,237 | ) | |||||||
| Unrealized appreciation on forward foreign currency exchange contracts | 2,334,935 | Unrealized depreciation on forward foreign currency exchange contracts | (1,617,452 | ) | ||||||||
|
|
|
| |||||||||
Total | $ | 14,752,624 | $ | (9,719,465 | ) | |||||||
|
|
|
| |||||||||
Amount not subject to MNA(1) | (8,824,803 | ) | 5,036,025 | |||||||||
|
|
|
| |||||||||
Total gross amounts subject to MNA | $ | 5,927,821 | $ | (4,683,440 | ) | |||||||
|
|
|
| |||||||||
| (1) | See below for disclosure of financial instruments assets and liabilities subject to offset under enforceable master netting arrangements. |
The following tables present information about the amount of net realized gain (loss) and net unrealized appreciation (depreciation) on derivative financial instruments for the period ended March 31, 2015:
Consolidated | Average Notional USD(1) | Commodity | Interest Rate | Credit | Equity | Foreign Exchange | Total | ||||||||||||||||||||||||||||
Swap contracts | $ | 141,464,734 | $ | — | $ | (118,072 | ) | $ | (527,308 | ) | $ | 10,717,435 | $ | — | $ | 10,072,055 | |||||||||||||||||||
Futures contracts | 1,124,373,068 | (930,342 | ) | (718,182 | ) | — | (9,838,732 | ) | — | (11,487,256 | ) | ||||||||||||||||||||||||
Purchased options (c)(d) | 12,571,956 | — | — | — | (5,879,690 | ) | 1,072,130 | (4,807,560 | ) | ||||||||||||||||||||||||||
Options written (e) | 9,846,280 | — | — | — | 1,863,425 | (130,431 | ) | 1,732,994 | |||||||||||||||||||||||||||
Forward foreign currency exchange contracts | 281,246,944 | — | — | — | — | 11,461,809 | 11,461,809 | ||||||||||||||||||||||||||||
|
|
|
|
|
|
|
|
|
|
|
| ||||||||||||||||||||||||
| $ | (930,342 | ) | $ | (836,254 | ) | $ | (527,308 | ) | $ | (3,137,562 | ) | $ | 12,403,508 | $ | 6,972,042 | ||||||||||||||||||||
|
|
|
|
|
|
|
|
|
|
|
| ||||||||||||||||||||||||
| (1) | Averages are based on monthly activity levels during the period June 16, 2014 (commencement of operations) through March 31, 2015. |
250
Blackstone Alternative Investment Funds and Subsidiaries
Notes to Consolidated Financial Statements (Continued)
For the Period Ended March 31, 2015
Consolidated Statement of | Commodity | Interest Rate | Credit | Equity | Foreign Exchange | Total | ||||||||||||||||||||||||
Swap contracts (b) | $ | — | $ | (339,617 | ) | $ | (37,823 | ) | $ | 37,611 | $ | — | $ | (339,829 | ) | |||||||||||||||
Futures contracts (b) | 220,701 | 151,661 | — | 606,468 | — | 978,830 | ||||||||||||||||||||||||
Purchased options (c) | — | — | — | (494,776 | ) | 28,280 | (466,496 | ) | ||||||||||||||||||||||
Options written | — | — | — | 130,801 | 59,790 | 190,591 | ||||||||||||||||||||||||
Forward foreign currency exchange contracts | — | — | — | — | 717,483 | 717,483 | ||||||||||||||||||||||||
|
|
|
|
|
|
|
|
|
|
|
| |||||||||||||||||||
| $ | 220,701 | $ | (187,956 | ) | $ | (37,823 | ) | $ | 280,104 | $ | 805,553 | $ | 1,080,579 | |||||||||||||||||
|
|
|
|
|
|
|
|
|
|
|
| |||||||||||||||||||
| (a) | Includes swap contracts premium paid/received and unrealized appreciation/depreciation on swap contracts. |
| (b) | Includes unrealized appreciation/depreciation of futures contracts and centrally cleared swaps as reported in the Notes to Consolidated Schedule of Investments. Only the current day’s variation margin is reported within the Consolidated Statement of Assets and Liabilities. |
| (c) | Includes options purchased that are part of investments in securities as shown in the Consolidated Statement of Assets and Liabilities and net realized gain (loss) on investments in securities and net unrealized appreciation (depreciation) on investments in securities as shown in the Consolidated Statement of Operations. |
| (d) | The notional of FX OTC options purchased is disclosed above. Additionally, the average number of Exchange-Traded Options and other OTC options purchased for Multi-Manager Fund and Multi-Strategy Fund were contracts of approximately 15,487,600 and 2,575,829, respectively, for the period ended March 31, 2015. |
| (e) | The notional of FX OTC options written is disclosed above. Additionally, the average number of Exchange-Traded Options and other OTC options written for Multi-Manager Fund and Multi-Strategy Fund were contracts of approximately 280,808 and 57,493, respectively, for the period ended March 31, 2015. |
Netting Arrangements
The Funds use master netting arrangements, which allow certain derivative financial instruments and collateral with the same counterparty to be offset to minimize counterparty credit exposure.
251
Blackstone Alternative Investment Funds and Subsidiaries
Notes to Consolidated Financial Statements (Continued)
For the Period Ended March 31, 2015
Multi-Manager Fund
The following table represents the Fund’s derivative financial instrument assets and liabilities by counterparty net of amounts available for offset under an MNA and net of related collateral received/pledged by the Fund as of March 31, 2015:
| Gross Amounts Not Offset in the Consolidated Statement of Assets and Liabilities | |||||||||||||||||||||||||
Gross Amount of | Derivative | Cash | Non-Cash | Net | |||||||||||||||||||||
By Counterparty (1) | |||||||||||||||||||||||||
Credit Suisse International | $ | 49,696 | $ | (49,683 | ) | $ | — | $ | — | $ | 13 | ||||||||||||||
Credit Suisse Securities (Europe) Limited | 1,511,874 | (777,097 | ) | — | — | 734,777 | |||||||||||||||||||
JP Morgan Chase Bank, N.A. | 950,896 | (70,156 | ) | (260,000 | ) | — | 620,740 | ||||||||||||||||||
Morgan Stanley & Co. LLC | 106,885 | (106,885 | ) | — | — | — | |||||||||||||||||||
Morgan Stanley Capital Services LLC | 775,401 | (775,401 | ) | — | — | — | |||||||||||||||||||
Morgan Stanley & Co. International plc | 218,492 | (50,302 | ) | — | — | 168,190 | |||||||||||||||||||
Cayman Subsidiary | |||||||||||||||||||||||||
Morgan Stanley Capital Services LLC | 37,016 | — | — | — | 37,016 | ||||||||||||||||||||
State Street Bank and Trust | 2,077,321 | (936,813 | ) | — | (639,058 | ) | 501,450 | ||||||||||||||||||
Domestic Subsidiary III | |||||||||||||||||||||||||
Credit Suisse Securities (Europe) Limited | 1,381,274 | (1,381,274 | ) | — | — | — | |||||||||||||||||||
State Street Bank and Trust | 222,576 | (11,904 | ) | — | (210,672 | ) | — | ||||||||||||||||||
Domestic Subsidiary IV | |||||||||||||||||||||||||
Morgan Stanley & Co. LLC | 64,689 | (64,689 | ) | — | — | — | |||||||||||||||||||
Morgan Stanley Capital Services LLC | 1,104,631 | (118,512 | ) | — | — | 986,119 | |||||||||||||||||||
State Street Bank and Trust | 320,297 | — | — | (269,158 | ) | 51,139 | |||||||||||||||||||
|
|
|
|
|
|
|
|
|
| ||||||||||||||||
Total | $ | 8,821,048 | $ | (4,342,716 | ) | $ | (260,000 | ) | $ | (1,118,888 | ) | $ | 3,099,444 | ||||||||||||
|
|
|
|
|
|
|
|
|
| ||||||||||||||||
252
Blackstone Alternative Investment Funds and Subsidiaries
Notes to Consolidated Financial Statements (Continued)
For the Period Ended March 31, 2015
| Gross Amounts Not Offset in the Consolidated Statement of Assets and Liabilities | |||||||||||||||||||||||||
Gross Amounts of | Derivative | Cash | Non-Cash | Net | |||||||||||||||||||||
By Counterparty (1) | |||||||||||||||||||||||||
Credit Suisse International | $ | (49,683 | ) | $ | 49,683 | $ | — | $ | — | $ | — | ||||||||||||||
Credit Suisse Securities (Europe) Limited | (777,097 | ) | 777,097 | — | — | — | |||||||||||||||||||
JP Morgan Chase Bank, N.A. | (70,156 | ) | 70,156 | — | — | — | |||||||||||||||||||
Morgan Stanley & Co. LLC | (668,195 | ) | 106,885 | (561,310 | ) | ||||||||||||||||||||
Morgan Stanley Capital Services LLC | (1,159,710 | ) | 775,401 | 380,000 | — | (4,309 | ) | ||||||||||||||||||
Morgan Stanley & Co. International plc | (50,302 | ) | 50,302 | — | — | — | |||||||||||||||||||
Cayman Subsidiary | |||||||||||||||||||||||||
State Street Bank and Trust | (936,813 | ) | 936,813 | — | — | — | |||||||||||||||||||
Domestic Subsidiary III | |||||||||||||||||||||||||
Credit Suisse Securities (Europe) Limited | (2,267,978 | ) | 1,381,274 | 886,704 | — | — | |||||||||||||||||||
State Street Bank and Trust | (11,904 | ) | 11,904 | — | — | — | |||||||||||||||||||
Domestic Subsidiary IV | |||||||||||||||||||||||||
Morgan Stanley & Co. LLC | (100,359 | ) | 64,689 | — | — | (35,670 | ) | ||||||||||||||||||
Morgan Stanley Capital Services LLC | (118,512 | ) | 118,512 | — | — | — | |||||||||||||||||||
|
|
|
|
|
|
|
|
|
| ||||||||||||||||
Total | $ | (6,210,709 | ) | $ | 4,342,716 | $ | 1,266,704 | $ | — | $ | (601,289 | ) | |||||||||||||
|
|
|
|
|
|
|
|
|
| ||||||||||||||||
253
Blackstone Alternative Investment Funds and Subsidiaries
Notes to Consolidated Financial Statements (Continued)
For the Period Ended March 31, 2015
Multi-Strategy Fund
The following table represents the Fund’s derivative financial instrument assets and liabilities by counterparty net of amounts available for offset under an MNA and net of related collateral received/pledged by the Fund as of March 31, 2015:
| Gross Amounts Not Offset in the Consolidated Statement of Assets and Liabilities | |||||||||||||||||||||||||
Gross Amount of | Derivative | Cash | Non-Cash | Net | |||||||||||||||||||||
By Counterparty (1) | |||||||||||||||||||||||||
Credit Suisse International | $ | 31,754 | $ | (31,693 | ) | $ | — | $ | — | $ | 61 | ||||||||||||||
Credit Suisse Securities (Europe) Limited | 972,095 | (638,192 | ) | — | — | 333,903 | |||||||||||||||||||
JP Morgan Chase Bank, N.A. | 288,546 | (18,851 | ) | — | — | 269,695 | |||||||||||||||||||
Morgan Stanley & Co. LLC | 65,720 | (65,720 | ) | — | — | — | |||||||||||||||||||
Morgan Stanley Capital Services LLC | 377,086 | (239,580 | ) | — | — | 137,506 | |||||||||||||||||||
Morgan Stanley & Co. International plc | 186,914 | (43,031 | ) | — | — | 143,883 | |||||||||||||||||||
Cayman Subsidiary | |||||||||||||||||||||||||
Morgan Stanley Capital Services LLC | 42,409 | — | — | — | 42,409 | ||||||||||||||||||||
State Street Bank and Trust | 1,840,957 | (833,116 | ) | — | (579,886 | ) | 427,955 | ||||||||||||||||||
Domestic Subsidiary III | |||||||||||||||||||||||||
Credit Suisse Securities (Europe) Limited | 1,175,377 | (1,175,377 | ) | — | — | — | |||||||||||||||||||
State Street Bank and Trust | 201,412 | (10,235 | ) | — | (191,177 | ) | — | ||||||||||||||||||
Domestic Subsidiary IV | |||||||||||||||||||||||||
Morgan Stanley & Co. LLC | 53,496 | (53,496 | ) | — | — | — | |||||||||||||||||||
Morgan Stanley Capital Services LLC | 692,055 | (83,753 | ) | — | — | 608,302 | |||||||||||||||||||
|
|
|
|
|
|
|
|
|
| ||||||||||||||||
Total | $ | 5,927,821 | $ | (3,193,044 | ) | $ | — | $ | (771,063 | ) | $ | 1,963,714 | |||||||||||||
|
|
|
|
|
|
|
|
|
| ||||||||||||||||
254
Blackstone Alternative Investment Funds and Subsidiaries
Notes to Consolidated Financial Statements (Continued)
For the Period Ended March 31, 2015
| Gross Amounts Not Offset in the Consolidated Statement of Assets and Liabilities | |||||||||||||||||||||||||
Gross Amounts of | Derivative | Cash | Non-Cash | Net | |||||||||||||||||||||
By Counterparty (1) | |||||||||||||||||||||||||
Credit Suisse International | $ | (31,693 | ) | $ | 31,693 | $ | — | $ | — | $ | — | ||||||||||||||
Credit Suisse Securities (Europe) Limited | (638,192 | ) | 638,192 | — | — | — | |||||||||||||||||||
JP Morgan Chase Bank, N.A. | (18,851 | ) | 18,851 | — | — | — | |||||||||||||||||||
Morgan Stanley & Co. LLC | (603,036 | ) | 65,720 | — | — | (537,316 | ) | ||||||||||||||||||
Morgan Stanley Capital Services LLC | (239,580 | ) | 239,580 | — | — | — | |||||||||||||||||||
Morgan Stanley & Co. International plc | (43,031 | ) | 43,031 | — | — | — | |||||||||||||||||||
Cayman Subsidiary | |||||||||||||||||||||||||
State Street Bank and Trust | (833,116 | ) | 833,116 | — | — | — | |||||||||||||||||||
Domestic Subsidiary III | |||||||||||||||||||||||||
Credit Suisse Securities (Europe) Limited | (2,122,380 | ) | 1,175,377 | 947,003 | — | — | |||||||||||||||||||
State Street Bank and Trust | (10,235 | ) | 10,235 | — | — | — | |||||||||||||||||||
Domestic Subsidiary IV | |||||||||||||||||||||||||
Morgan Stanley & Co. LLC | (59,573 | ) | 53,496 | — | — | (6,077 | ) | ||||||||||||||||||
Morgan Stanley Capital Services LLC | (83,753 | ) | 83,753 | — | — | — | |||||||||||||||||||
|
|
|
|
|
|
|
|
|
| ||||||||||||||||
Total | $ | (4,683,440 | ) | $ | 3,193,044 | $ | 947,003 | $ | — | $ | (543,393 | ) | |||||||||||||
|
|
|
|
|
|
|
|
|
| ||||||||||||||||
| (1) | The Fund and each Subsidiary are subject to separate MNA’s with each individual counterparty. |
| (2) | Net amount represents the net amount receivable from the counterparty in the event of default. |
| (3) | Net amount represents the net amount payable to the individual counterparty in the event of default. |
| (4) | Excess of collateral received from the individual counterparty is not shown for financial reporting purposes. |
| (5) | Excess of collateral pledged to the individual counterparty is not shown for financial reporting purposes. |
| (6) | At March 31, 2015, the Fund received securities as collateral for derivative financial instruments. |
255
Blackstone Alternative Investment Funds and Subsidiaries
Notes to Consolidated Financial Statements (Continued)
For the Period Ended March 31, 2015
5. Fair Value Measurements
The following table presents information about the classification of each Fund’s investments measured at fair value within the fair value hierarchy as of March 31, 2015:
Multi-Manager Fund
| Asset Description: | Level 1 | Level 2 | Level 3 | Total | ||||||||||||||||
Investments in Securities: | ||||||||||||||||||||
Common Stock | $ | 516,611,239 | $ | 68,460,923 | $ | — | $ | 585,072,162 | ||||||||||||
Preferred Stock | 88,044 | 240,383 | — | 328,427 | ||||||||||||||||
Asset-Backed Securities | — | 97,482,668 | — | 97,482,668 | ||||||||||||||||
Convertible Bonds | — | 9,092,611 | — | 9,092,611 | ||||||||||||||||
Bank Loans | — | 18,273,943 | — | 18,273,943 | ||||||||||||||||
Corporate Bonds & Notes | — | 87,811,651 | — | 87,811,651 | ||||||||||||||||
Sovereign Debt | — | 41,321,658 | — | 41,321,658 | ||||||||||||||||
Mortgage-Backed Securities | — | 311,036,990 | 11,930,962 | 322,967,952 | ||||||||||||||||
U.S. Government Sponsored Agency Securities | — | 28,130,139 | — | 28,130,139 | ||||||||||||||||
Exchange-Traded Funds | 2,665,716 | �� | — | — | 2,665,716 | |||||||||||||||
Rights | 204 | — | — | 204 | ||||||||||||||||
Purchased Options | 4,709,595 | 1,732,945 | — | 6,442,540 | ||||||||||||||||
Total Investments in Securities | $ | 524,074,798 | $ | 663,583,911 | $ | 11,930,962 | $ | 1,199,589,671 | ||||||||||||
Forward Foreign Currency Exchange Contracts | — | 2,984,396 | — | 2,984,396 | ||||||||||||||||
Futures Contracts | 5,551,435 | — | — | 5,551,435 | ||||||||||||||||
OTC Credit Default Swaps | — | 78,647 | — | 78,647 | ||||||||||||||||
OTC Total Return Swaps | — | 4,034,794 | — | 4,034,794 | ||||||||||||||||
Interest Rate Swaps | — | 2,098,814 | — | 2,098,814 | ||||||||||||||||
Total Assets | $ | 529,626,233 | $ | 672,780,562 | $ | 11,930,962 | $ | 1,214,337,757 | ||||||||||||
| Liability Description: | Level 1 | Level 2 | Level 3 | Total | ||||||||||||||||
Securities Sold Short | $ | 280,574,540 | $ | 8,671,850 | $ | — | $ | 289,246,390 | ||||||||||||
Options Written | 1,020,818 | 1,036,480 | — | 2,057,298 | ||||||||||||||||
Reverse Repurchase Agreements | — | 119,746,297 | — | 119,746,297 | ||||||||||||||||
Securities Lending Collateral | — | 74,949,395 | — | 74,949,395 | ||||||||||||||||
Forward Foreign Currency Exchange Contracts | — | 1,923,334 | — | 1,923,334 | ||||||||||||||||
Futures Contracts | 4,552,388 | — | — | 4,552,388 | ||||||||||||||||
Centrally Cleared Credit Default Swaps | — | 312,141 | — | 312,141 | ||||||||||||||||
OTC Credit Default Swaps | — | 87,312 | — | 87,312 | ||||||||||||||||
OTC Total Return Swaps | — | 3,163,580 | — | 3,163,580 | ||||||||||||||||
Interest Rate Swaps | — | 1,132,168 | — | 1,132,168 | ||||||||||||||||
Total Liabilities | $ | 286,147,746 | $ | 211,022,557 | $ | — | $ | 497,170,303 | ||||||||||||
256
Blackstone Alternative Investment Funds and Subsidiaries
Notes to Consolidated Financial Statements (Continued)
For the Period Ended March 31, 2015
The changes in investments measured at fair value for which the Multi-Manager Fund used Level 3 inputs to determine fair value are as follows:
Multi-Manager Fund
Asset Description: Investments in Securities | Investment in Investee Fund | Mortgage- Backed Securities | Total | ||||||||||||
Balance as of April 1, 2014 | $ | 27,801,750 | $ | — | $ | 27,801,750 | |||||||||
Transfers In | — | — | — | ||||||||||||
Transfers Out | (27,801,750 | ) | — | (27,801,750 | ) | ||||||||||
Purchases | — | 11,860,686 | 11,860,686 | ||||||||||||
Sales | — | — | — | ||||||||||||
Net realized gain (loss) | — | — | — | ||||||||||||
Net change in unrealized appreciation | — | 70,276 | 70,276 | ||||||||||||
|
|
|
|
|
| ||||||||||
Balance as of March 31, 2015 | $ | — | $ | 11,930,962 | $ | 11,930,962 | |||||||||
|
|
|
|
|
| ||||||||||
Net change in unrealized appreciation related to investments held as of March 31, 2015 | $ | — | $ | 70,276 | $ | 70,276 | |||||||||
|
|
|
|
|
| ||||||||||
The following table summarizes the quantitative inputs and assumptions used for investments in securities classified within Level 3 of the fair value hierarchy as of March 31, 2015.
Assets | Fair Value at | Valuation | Unobservable | Range of inputs (Weighted | ||||||||||||||||||
Investments in Securities: | ||||||||||||||||||||||
Mortgage-Backed Securities | $ | 11,930,962 | Discounted Cash Flow | Discount Rate | 9.95 | % | ||||||||||||||||
| Revenue CAGR | 3.05 | % | ||||||||||||||||||||
| Exit Cap Rate | 8.21 | % | ||||||||||||||||||||
|
| |||||||||||||||||||||
Total Investments in Securities | $ | 11,930,962 | ||||||||||||||||||||
|
| |||||||||||||||||||||
Multi-Strategy Fund
| Asset Description: | Level 1 | Level 2 | Level 3 | Total | ||||||||||||||||
Investments in Securities: | ||||||||||||||||||||
Common Stock | $ | 457,684,305 | $ | 60,875,905 | $ | — | $ | 518,560,210 | ||||||||||||
Preferred Stock | 51,612 | 124,817 | — | 176,429 | ||||||||||||||||
Asset-Backed Securities | — | 91,803,483 | — | 91,803,483 | ||||||||||||||||
Convertible Bonds | — | 2,705,165 | — | 2,705,165 | ||||||||||||||||
Bank Loans | — | 1,062,444 | — | 1,062,444 | ||||||||||||||||
Corporate Bonds & Notes | — | 46,370,994 | — | 46,370,994 | ||||||||||||||||
Sovereign Debt | — | 27,601,053 | — | 27,601,053 | ||||||||||||||||
Mortgage-Backed Securities | — | 194,470,050 | 19,084,537 | 213,554,587 | ||||||||||||||||
U.S. Government Sponsored Agency Securities | — | 12,102,488 | — | 12,102,488 | ||||||||||||||||
Exchange-Traded Funds | 1,033,535 | — | — | 1,033,535 | ||||||||||||||||
257
Blackstone Alternative Investment Funds and Subsidiaries
Notes to Consolidated Financial Statements (Continued)
For the Period Ended March 31, 2015
| Asset Description: | Level 1 | Level 2 | Level 3 | Total | ||||||||||||||||
Investment in Investee Fund | $ | 212,000 | $ | — | $ | — | $ | 212,000 | ||||||||||||
Rights | 111 | — | — | 111 | ||||||||||||||||
Purchased Options | 4,058,970 | 669,737 | — | 4,728,707 | ||||||||||||||||
Total Investments in Securities | $ | 463,040,533 | $ | 437,786,136 | $ | 19,084,537 | $ | 919,911,206 | ||||||||||||
Forward Foreign Currency Exchange Contracts | — | 2,334,935 | — | 2,334,935 | ||||||||||||||||
Futures Contracts | 4,441,645 | — | — | 4,441,645 | ||||||||||||||||
OTC Credit Default Swaps | — | 47,423 | — | 47,423 | ||||||||||||||||
OTC Total Return Swaps | — | 2,881,938 | — | 2,881,938 | ||||||||||||||||
Interest Rate Swaps | — | 317,976 | — | 317,976 | ||||||||||||||||
Total Assets | $ | 467,482,178 | $ | 443,368,408 | $ | 19,084,537 | $ | 929,935,123 | ||||||||||||
| Liability Description: | Level 1 | Level 2 | Level 3 | Total | ||||||||||||||||
Securities Sold Short | $ | 256,044,113 | $ | 6,257,202 | $ | — | $ | 262,301,315 | ||||||||||||
Options Written | 735,735 | 169,163 | — | 904,898 | ||||||||||||||||
Reverse Repurchase Agreements | — | 35,331,478 | — | 35,331,478 | ||||||||||||||||
Securities Lending Collateral | — | 71,359,374 | — | 71,359,374 | ||||||||||||||||
Forward Foreign Currency Exchange Contracts | — | 1,617,452 | — | 1,617,452 | ||||||||||||||||
Futures Contracts | 3,462,815 | — | — | 3,462,815 | ||||||||||||||||
Centrally Cleared Credit Default Swaps | — | 199,113 | — | 199,113 | ||||||||||||||||
OTC Credit Default Swaps | — | 52,505 | — | 52,505 | ||||||||||||||||
OTC Total Return Swaps | — | 2,844,327 | — | 2,844,327 | ||||||||||||||||
Interest Rate Swaps | — | 638,355 | — | 638,355 | ||||||||||||||||
Total Liabilities | $ | 260,242,663 | $ | 118,468,969 | $ | — | $ | 378,711,632 | ||||||||||||
The changes in investments measured at fair value for which the Multi-Strategy Fund used Level 3 inputs to determine fair value are as follows:
Multi-Strategy Fund
Asset Description: Investments in Securities | Mortgage- Backed Securities | ||||
Balance as of April 1, 2014 | $ | — | |||
Transfers In | — | ||||
Transfers Out | — | ||||
Purchases | 18,972,125 | ||||
Sales | — | ||||
Net realized gain (loss) | — | ||||
Net change in unrealized appreciation | 112,412 | ||||
|
| ||||
Balance as of March 31, 2015 | $ | 19,084,537 | |||
|
| ||||
Net change in unrealized appreciation related to investments held as of March 31, 2015 | $ | 112,412 | |||
|
| ||||
258
Blackstone Alternative Investment Funds and Subsidiaries
Notes to Consolidated Financial Statements (Continued)
For the Period Ended March 31, 2015
The following table summarizes the quantitative inputs and assumptions used for investments in securities classified within Level 3 of the fair value hierarchy as of March 31, 2015.
Assets | Fair Value at March 31, 2015 | Valuation Technique | Unobservable Inputs | Range of inputs (Weighted Average) | |||||||||||||||||
Investments in Securities: | |||||||||||||||||||||
Mortgage-Backed Securities | $ | 19,084,537 | Discounted Cash Flow | Discount Rate | 9.95 | % | |||||||||||||||
| Revenue CAGR | 3.05 | % | |||||||||||||||||||
| Exit Cap Rate | 8.21 | % | |||||||||||||||||||
|
| ||||||||||||||||||||
Total Investments in Securities | $ | 19,084,537 | |||||||||||||||||||
|
| ||||||||||||||||||||
The Funds had no transfers between Level 1 and Level 2 during the period ended March 31, 2015.
The Funds recognize transfers within the fair value hierarchy as of the beginning of the period. For the Multi-Manager Fund, transfers out of Level 3 were primarily related to the expiration of liquidity restrictions in its investment in Investee Fund. There were no transfers for the Multi-Strategy Fund for the period ended March 31, 2015.
Unrealized appreciation recorded for Level 3 investments are reported as net change in unrealized appreciation from investments in securities in the Consolidated Statement of Operations.
6. Purchase and Sale of Fund Shares
The Multi-Manager Fund currently offers Class I Shares and the Multi-Strategy Fund currently offers Class D Shares, Class I Shares, Class R Shares and Class Y Shares. For the period ended March 31, 2015, only Class D Shares, Class I Shares and Class Y Shares are outstanding.
Multi-Manager Fund Class I Shares are offered to investors who are clients of investment advisors, consultants, broker-dealers or other financial intermediaries who: (a) charge such clients fees for advisory, investment, consulting or similar services and (b) have entered into an agreement with Blackstone Advisory Partners L.P. to offer shares. Multi-Manager Fund Class I Shares may also be offered for investment by personnel of the Investment Adviser, and as otherwise may be determined by the Board. Class I Shares of Multi-Manager Fund are held exclusively by a single financial advisor who holds shares on behalf of its clients.
Multi-Strategy Fund Class D Shares are offered primarily through broker-dealers and other financial intermediaries that have entered into an agreement with Blackstone Advisory Partners L.P. (the “Distributor”) for the use of the Multi-Strategy Fund in investment products, programs, or accounts such as mutual fund supermarkets or other no transaction fee platforms. Multi-Strategy Fund Class I Shares are offered to institutional investors and individual investors who are clients of investment advisors, broker-dealers, financial institutions or registered investment advisors that: (a) may charge such clients fees for advisory, investment, consulting or similar services and (b) have entered into an arrangement approved by the Distributor to provide certain administrative services to investors. Multi-Strategy Fund Class I Shares and Class Y Shares may be offered to institutional investors and individuals who meet the minimum investment requirements and purchase directly from the Multi-Strategy Fund, including purchases by individuals through individual retirement accounts. Class Y Shares of Multi-Strategy Fund may also be offered to employees, officers and directors/trustees of the Adviser, the Fund or their respective affiliates. Multi-Strategy Class R Shares do not have a minimum investment requirement and are generally available only to special benefit plans.
Shares of the Funds may be purchased or redeemed each Business Day.
259
Blackstone Alternative Investment Funds and Subsidiaries
Notes to Consolidated Financial Statements (Continued)
For the Period Ended March 31, 2015
7. Investment Adviser Fees and Other Transactions with Affiliates
Management Fee
Pursuant to the investment management agreement between the Investment Adviser and the Trust, on behalf of the Funds, each Fund pays the Investment Adviser a management fee (the “Fund Management Fee”) at an annual rate based on each Fund’s average daily net assets, excluding the net assets of the applicable Subsidiaries. The Investment Adviser receives additional compensation at an annual rate based on each Subsidiary’s average daily net assets for providing management services to the Subsidiaries. For collective net assets of each Fund and the respective Subsidiaries up to $2.5 billion, the Fund Management Fee shall be 1.95% (annualized) and for collective net assets greater than or equal to $2.5 billion, the Fund Management Fee shall be 1.80% (annualized). During the fiscal year ending March 31, 2015, the Multi-Manager Fund paid the Investment Adviser $24,525,452 in management fees. From this amount, the Investment Adviser paid $11,594,518 in sub-advisory fees to non-affiliated Sub-Advisers with respect to the Multi-Manager Fund, which amounted to 0.87% of the Fund’s net assets. The Investment Adviser also paid $343,356 in sub-advisory fees to Bayview Asset Management, LLC (“Bayview”), a Sub-Adviser that, during the fiscal year ended March 31, 2015, was an affiliate of the Investment Adviser, with respect to the Multi-Manager Fund, which amounted to 0.03% of the Fund’s net assets. During the period from June 16, 2014 (the date the Multi-Strategy Fund commenced operations) to March 31, 2015, the Multi-Strategy Fund paid the Investment Adviser $9,642,200 in management fees. From this amount, the Investment Adviser paid $4,446,937 in sub-advisory fees to non-affiliated sub-advisers with respect to the Multi-Strategy Fund, which amounted to 0.37% of the Fund’s net assets. The Investment Adviser also paid $193,353 in sub-advisory fees to Bayview with respect to the Multi-Strategy Fund, which amounted to 0.02% of the Fund’s net assets.
Sub-Advisory Fees
Pursuant to the sub-advisory agreements between the Investment Adviser and the Sub-Advisers, the Sub-Advisers are compensated for the services they provide to the Funds by the Investment Adviser from the Management Fee received by the Investment Adviser.
Distribution and Service Fees
Pursuant to the amended and restated Distribution and Service Plan, Multi-Strategy Fund Class D Shares bear distribution and service fees at an annual rate of 0.25% of the average daily net assets of the Fund attributable to Class D Shares. Payments of the distribution and service fee may be made without regard to expenses actually incurred. Multi-Manager Class I Shares and Multi-Strategy Class I Shares and Class Y Shares are not subject to distribution and service fees.
Expense Limitation and Reimbursement
The Investment Adviser has entered into an Expense Limitation and Reimbursement Agreement (the “Multi-Manager Fund Agreement”) with the Multi-Manager Fund to limit the amount of Specified Expenses (as defined below) of the Fund to 0.45% per annum of the Fund’s net assets (the “Multi-Manager Fund Total Expense Cap”). Specified Expenses include all expenses incurred by the Multi-Manager Fund with the exception of (i) the Management Fee, (ii) the distribution and service fees, (iii) acquired fund fees and expenses, (iv) brokerage and trading costs, (v) interest payments (including any interest expenses, commitment fees, or other expenses related to any line of credit of the Fund), (vi) taxes, (vii) dividends and interest on short positions, and (viii) extraordinary expenses (as determined in the sole discretion of BAIA) (together, the “Multi-Manager Fund Excluded Expenses”).
The Investment Adviser has also entered into an Expense Limitation and Reimbursement Agreement (the “Multi-Strategy Fund Agreement”) with the Multi-Strategy Fund to limit the amount of Specified Expenses
260
Blackstone Alternative Investment Funds and Subsidiaries
Notes to Consolidated Financial Statements (Continued)
For the Period Ended March 31, 2015
(as defined below) of the Fund to 2.40% per annum of the Fund’s net assets for Class D Shares, Class I Shares and Class Y Shares and 2.55% per annum of the Fund’s net assets for Class R Shares (collectively, the “Multi-Strategy Total Expense Cap”). Specified Expenses include all expenses incurred by the Multi-Strategy Fund with the exception of (i) the distribution or service fees, (ii) acquired fund fees and expenses, (iii) brokerage and trading costs, (iv) interest payments (including any interest expenses, commitment fees, or other expenses related to any line of credit of the Fund), (v) taxes, (vi) dividends and interest on short positions, and (vii) extraordinary expenses (as determined in the sole discretion of BAIA) (together, the “Multi-Strategy Excluded Expenses”).
To the extent the estimated annualized specified expenses for any month exceeds the total expense cap, the Investment Adviser will waive its fees and/or make payments to the Funds for expenses to the extent necessary to eliminate such excess. The Investment Adviser may discontinue its obligations under the agreements at any time in its sole discretion after May 31, 2016 upon written notice to a Fund. The Funds have agreed to repay the amounts borne by the Investment Adviser under their respective agreements within the thirty-six month period after the Investment Adviser bears the expense, to the extent the estimated annualized Specified Expenses for a given month are less than the lower of the Total Expense Cap and any expense limitation agreement then in effect. The repayment may not raise the level of estimated annualized specified expenses in the month of repayment to exceed the total expense cap.
During the year-ended March 31, 2015, repayments to the Investment Adviser were as follows:
Multi-Manager Fund | $ | 482,505 |
As of March 31, 2015, the repayments that potentially may be made by the Funds are as follows:
| Expenses reimbursed on May 8, 2013(1) | Expenses reimbursed in fiscal period ending, March 31, | ||||||||||||||
| 2014 | 2015 | ||||||||||||||
Class | Subject to repayment until expiration date of May 8, 2016(1) | Subject to repayment until maximum expiration date of March 31, | |||||||||||||
| 2017 | 2018 | ||||||||||||||
Multi-Manager Fund - Class I | $ | 526,211 | $ | 1,987,694 | $ | — | |||||||||
Multi-Strategy Fund - Class I(2) | N/A | N/A | 1,226,650 | ||||||||||||
Multi-Strategy Fund - Class D(3) | N/A | N/A | 2,288 | ||||||||||||
Multi-Strategy Fund - Class Y(4) | N/A | N/A | 16,228 | ||||||||||||
| (1) | Multi-Manager Fund - Class I commenced operations on August 6, 2013. Amount reflects remaining repayment related to reimbursement of organization expenses incurred as of May 8, 2013. |
| (2) | Multi-Strategy Fund - Class I commenced operations on June 16, 2014. |
| (3) | Multi-Strategy Fund - Class D commenced operations on November 17, 2014. |
| (4) | Multi-Strategy Fund - Class Y commenced operations on January 28, 2015. |
8. Other Agreements
State Street Bank and Trust Company serves as the administrator, custodian and transfer agent to the Funds. Blackstone Advisory Partners L.P., an affiliate of the Investment Adviser, serves as the Funds’ distributor.
261
Blackstone Alternative Investment Funds and Subsidiaries
Notes to Consolidated Financial Statements (Continued)
For the Period Ended March 31, 2015
9. Financial Instruments and Off-Balance Sheet Risk
Market Risk: In the normal course of business, the Funds invest in securities and enters into transactions where risks exist due to fluctuations in the market (market risk) or failure of the other party to a transaction to perform (credit and counterparty risk). The value of securities held by the Funds may decline in response to certain events, including those directly involving the companies whose securities are owned by the Funds; conditions affecting the general economy; overall market changes; local, regional or global political, social or economic instability; and currency and interest rate and price fluctuations.
Credit and Counterparty Risk: The Funds may be exposed to counterparty risk, or the risk that an entity with which the Funds have unsettled or open transactions may default. The potential loss could exceed the value of the financial assets and liabilities recorded in the consolidated financial statements. Financial assets that potentially expose the Funds to credit and counterparty risk consist principally of cash due from counterparties and investments. The Funds manage counterparty risk by entering into agreements only with counterparties that they believe have the financial resources to honor their obligations and by monitoring the financial stability of those counterparties. The Funds’ Investment Adviser attempts to mitigate counterparty risk by (i) periodically assessing the creditworthiness of its trading partners, (ii) monitoring and/or limiting the amount of its net exposure to each individual counterparty based on its assessment and (iii) requiring collateral from the counterparty for certain transactions. In order to preserve certain safeguards for non-standard settlement trades, the Funds restrict exposure to credit and counterparty losses by entering into master netting agreements with counterparties (approved brokers) with whom they undertake a significant volume of transactions. Collateral requirements may differ by type of derivative or investment, as applicable. Collateral or margin requirements are set by the broker or exchange clearing house for exchange traded derivatives (e.g., futures contracts and exchange traded options) while collateral terms are contract specific for OTC traded derivatives (e.g., forward foreign currency exchange contracts, swap agreements and OTC options). For derivatives traded under an ISDA Master Agreement or similar master agreement, the collateral requirements may be netted across all transactions traded under such agreement and certain counterparties may allow one amount to be posted from one party to the other to collateralized such obligations. The ISDA Master Agreement gives each party to the agreement the right to terminate all transactions traded under such agreement if there is a certain deterioration in the credit quality of the other party. The ISDA Master Agreement gives each Fund the right, upon an event of default by the applicable counterparty or a termination of the agreement, to close out all transactions traded under such agreement and may permit net amounts owed under each transaction to be netted to derive one net amount payable by one party to the other. This right to close out and net payments across all transactions traded under the ISDA Master Agreement could result in a reduction of the Fund’s credit risk to such counterparty equal to any amounts payable by the Fund under the applicable transactions, if any. The enforceability of the right to offset may vary by jurisdiction. Cash collateral that has been pledged to cover obligations of a Fund under derivative financial instrument contracts, if any, will be reported separately in the Consolidated Statement of Assets and Liabilities. Securities pledged as collateral, if any, for the same purpose are noted in the Consolidated Schedule of Investments.
Foreign Investment Risk: The investments by the Funds in foreign securities may involve risks not present in domestic investments. Since securities may be denominated in foreign currencies, require settlement in foreign currencies and pay interest or dividends in foreign currencies, changes in the relationship of these foreign currencies to the U.S. dollar can significantly affect the value of the investments and earnings of the Funds. Foreign investments may also subject the Funds to foreign government exchange restrictions, expropriation, taxation or other political, social or economic developments, all of which could affect the market and/or credit risk of the investments. In addition to the risks described above, risks may arise from forward foreign currency exchange contracts with respect to the potential inability of counterparties to meet the terms of their contracts.
262
Blackstone Alternative Investment Funds and Subsidiaries
Notes to Consolidated Financial Statements (Continued)
For the Period Ended March 31, 2015
Liquidity Risk: Some securities held by the Funds may be difficult to sell, or illiquid, particularly during times of market turmoil. Illiquid securities may also be difficult to value. If a Fund is forced to sell an illiquid asset to meet redemption requests or other cash needs, the Fund may be forced to sell at a loss.
Non-Diversification Risk: Each Fund is classified as a “non-diversified” investment company, which means that the percentage of its assets that may be invested in the securities of a single issuer is not limited by the 1940 Act. As a result, the Funds’ investment portfolios may be subject to greater risk and volatility than if investments had been made in the securities of a broad range of issuers.
Additional risks associated with each type of investment are described within the respective security type notes. Each Fund’s Prospectus includes a discussion of the principal risks of investing in the Fund.
10. Investment Transactions
The aggregate cost of purchases and proceeds of sales of investments in securities (excluding U.S. Treasury obligations and U.S. government sponsored agency securities) (including maturities), other than short-term investments (if applicable), for the period ended March 31, 2015 were as follows:
| Multi-Manager Fund | Multi-Strategy Fund | |||||||||
Purchases | $ | 2,974,691,782 | $ | 1,773,629,881 | ||||||
Sales | $ | 2,689,798,434 | $ | 931,165,768 | ||||||
11. Income Tax Information
The Funds intend to qualify each tax year as a regulated investment company under Subchapter M of the Internal Revenue Code of 1986, as amended (the “Code”). The Funds have adopted a tax year-end of October 31, therefore unless otherwise indicated, all applicable tax disclosures reflect tax adjusted balances as of October 31, 2014. The Funds intend to distribute substantially all of its net investment income and all of its net realized short-term and long-term capital gain, if any, after giving effect to any available capital loss carryforwards for U.S. federal income tax purposes. Therefore, the Funds make no provision for U.S. federal income or excise taxes.
Each Fund’s policy is to declare and pay distributions from net investment income and from net realized short-term and long-term capital gain, if any, at least annually. All distributions are reinvested in additional shares of the Fund, at net asset value, unless the shareholder elects to receive cash distributions. Distributions to shareholders are recorded by the Funds on the ex-dividend date.
Income and capital gain distributions are determined in accordance with U.S. federal income tax regulations, which may differ from U.S. GAAP. Certain capital accounts in the financial statements are periodically adjusted for permanent differences in order to reflect their tax character. These adjustments have no impact on net assets or net asset value per share. Temporary differences that arise from recognizing certain items of income, expense, gain or loss in different periods for financial statement and tax purposes will reverse at some time in the future. Distributions in excess of net investment income or net realized gains are temporary over-distributions for financial statement purposes resulting from differences in the recognition or classification of income or distributions for financial statement and tax purposes.
263
Blackstone Alternative Investment Funds and Subsidiaries
Notes to Consolidated Financial Statements (Continued)
For the Period Ended March 31, 2015
The Funds made the following reclassifications at March 31, 2015 due to permanent book and tax differences primarily attributable to gain or loss from passive foreign investment companies, certain derivative financial instrument transactions, and income from the wholly-owned Cayman Subsidiaries from their tax year-ended October 31, 2014:
| Paid-in Capital | Accumulated Investment Income/(Loss) | Accumulated Net Realized Gain/(Loss) | |||||||||||||
Multi-Manager Fund | $ | (7,615,785 | ) | $ | 10,936,270 | $ | (3,320,485 | ) | |||||||
Multi-Strategy Fund | (1,418,618 | ) | 2,128,673 | (710,055 | ) | ||||||||||
The tax basis components of distributable earnings of the Funds at their tax year-ended October 31, 2014 was:
| Undistributed Ordinary Income | Undistributed Long- Term Capital Gains | Capital Loss Carryforward | |||||||||||||
Multi-Manager Fund | $ | 76,877,257 | $ | — | $ | — | |||||||||
Multi-Strategy Fund | 4,379,952 | — | — | ||||||||||||
In addition, the tax character of distributions paid to shareholders for the tax year-ended October 31, 2014 by the Funds are as follows:
| Ordinary Income | Long-Term Capital Gains | |||||||||
Multi-Manager Fund | $ | 4,989,130 | $ | — | ||||||
Multi-Strategy Fund | — | — | ||||||||
As of March 31, 2015, the approximate cost for U.S. federal income tax purposes and gross and net unrealized appreciation (depreciation) in value of investments were as follows:
| Aggregate Cost | Gross Unrealized Appreciation | Gross Unrealized (Depreciation) | Net Unrealized Appreciation (Depreciation) | |||||||||||||||||
Multi-Manager Fund | $ | 1,182,116,255 | $ | 43,141,699 | $ | (25,668,283 | ) | $ | 17,473,416 | |||||||||||
Multi-Strategy Fund | 905,421,478 | 26,939,411 | (12,449,683 | ) | 14,489,728 | |||||||||||||||
The Funds are subject to authoritative guidance related to the accounting and disclosure of uncertain tax positions under U.S. GAAP. This guidance sets forth a minimum threshold for the financial statement recognition of tax positions taken based on the technical merits of such positions. United States and non-U.S. tax rules (including the interpretation and application of tax laws) are subject to change. The Funds file tax returns and/or adopt certain tax positions in various jurisdictions. Non-U.S. taxes are provided for based on the Funds’ understanding of the prevailing tax rules of the non-U.S. markets in which they invest. Recently enacted tax rules, including interpretations of tax laws (e.g., regulations pertaining to the U.S. Foreign Account Tax Compliance Act) and proposed legislation currently under consideration in various jurisdictions, including the U.S., might affect the way the Funds and their investors are taxed prospectively and/or retroactively. Prior to the expiration of the relevant statutes of limitations, if any, the Funds are subject to examination by U.S. federal, state, local and non-U.S. jurisdictions with respect to the tax returns they have filed and the tax positions they have adopted. The Funds’ U.S. federal income tax returns are generally subject to examination by the Internal Revenue Service for a period of three years after they were filed. State, local and/or non-U.S. tax returns and/or other filings may be subject to examination for different periods, depending upon the tax rules of each applicable jurisdiction.
264
Blackstone Alternative Investment Funds and Subsidiaries
Notes to Consolidated Financial Statements (Continued)
For the Period Ended March 31, 2015
12. Borrowings Under Credit Facility
Each Fund has a secured revolving borrowing facility (the “Facility”) with State Street Bank and Trust Company (the “Bank”) for $30,000,000 (the “Aggregate Commitment Amount”). Borrowings under the Facility are used primarily for bridge financing purposes and are secured by the assets of the Funds. Under the terms of the agreement, the Aggregate Commitment Amount may be terminated or reduced from time to time upon written notice from the Funds to the Bank. Outstanding borrowings bear interest at a rate equal to 0.85% plus the Overnight LIBOR Rate per annum (0.96% at March 31, 2015). A commitment fee is charged in the amount of 0.20% per annum for each day during which the aggregate outstanding principal balance is less than 50% of the sum of the Aggregate Commitment Amount, and 0.10% per annum at all other times. Outstanding borrowings and accrued interest are due no later than February 1, 2016 and July 1, 2015 for the Multi-Manager Fund and Multi-Strategy Fund, respectively, the termination dates of each Fund’s Facility, at which time the Funds and the Bank can agree to extend the existing agreement. For the period ended March 31, 2015, the Funds made no borrowings under each Fund’s respective Facility.
13. Subsequent Events
The Investment Adviser has evaluated the impact of subsequent events through the date of financial statement issuance, and determined there were no subsequent events outside the normal course of business requiring adjustment to or disclosure in the consolidated financial statements.
265
REPORT OF INDEPENDENT REGISTERED PUBLIC ACCOUNTING FIRM
To the Shareholders of Blackstone Alternative Multi-Manager Fund and Blackstone Alternative Multi-Strategy Fund and Board of Trustees of Blackstone Alternative Investment Funds:
We have audited the accompanying consolidated statements of assets and liabilities, including the consolidated schedules of investments, of Blackstone Alternative Investment Funds (the “Funds”) comprising the Blackstone Alternative Multi-Manager Fund and Subsidiaries (the “Multi-Manager Fund”) and Blackstone Alternative Multi-Strategy Fund and Subsidiaries (the “Multi-Strategy Fund”) as of March 31, 2015, the related consolidated statements of operations and cash flows of the Multi-Manager Fund for the year then ended, and the consolidated statements of changes in net assets and the financial highlights for each of the periods presented; and the related consolidated statements of operations, cash flows and changes in net assets and the financial highlights of the Multi-Strategy Fund for the period June 16, 2014 (commencement of operations) to March 31, 2015. These financial statements and financial highlights are the responsibility of the Funds’ management. Our responsibility is to express an opinion on these financial statements and financial highlights based on our audits.
We conducted our audits in accordance with the standards of the Public Company Accounting Oversight Board (United States). Those standards require that we plan and perform the audit to obtain reasonable assurance about whether the financial statements and financial highlights are free of material misstatement. The Funds are not required to have, nor were we engaged to perform, an audit of their internal control over financial reporting. Our audits included consideration of internal control over financial reporting as a basis for designing audit procedures that are appropriate in the circumstances, but not for the purpose of expressing an opinion on the effectiveness of the Funds’ internal control over financial reporting. Accordingly, we express no such opinion. An audit also includes examining, on a test basis, evidence supporting the amounts and disclosures in the financial statements, assessing the accounting principles used and significant estimates made by management, as well as evaluating the overall financial statement presentation. Our procedures included confirmation of securities owned as of March 31, 2015, by correspondence with the custodian, brokers and agent banks; when replies were not received from brokers and agent banks, we performed other auditing procedures. We believe that our audits provide a reasonable basis for our opinion.
In our opinion, the consolidated financial statements and financial highlights referred to above present fairly, in all material respects, the consolidated financial position of Blackstone Alternative Multi-Manager Fund and Subsidiaries and Blackstone Alternative Multi-Strategy Fund and Subsidiaries each of Blackstone Alternative Investment Funds as of March 31, 2015, the consolidated results of operations and cash flows of the Multi-Manager Fund for the year then ended, and the consolidated changes in net assets and the financial highlights for each of the periods presented; and the consolidated results of operations, cash flows and the changes in net assets and the financial highlights of the Multi-Strategy Fund for the period June 16, 2014 (commencement of operations) to March 31, 2015 in conformity with accounting principles generally accepted in the United States of America.
Deloitte & Touche LLP
New York, New York
May 26, 2015
266
Blackstone Alternative Multi-Manager Fund and Subsidiaries
Shareholder Fee Example (Unaudited)
As a shareholder of the Multi-Manager Fund, you incur ongoing costs, including management fees and to the extent applicable, distribution (12b-1) fees and/or shareholder services fees and other Fund expenses. This Example is intended to help you to understand your ongoing costs (in dollars) of investing in the Fund and to compare these costs with the ongoing costs of investing in other mutual funds. The expense example is based on an investment of $1,000 invested at the beginning of the period and held through the six month period ended March 31, 2015.
Actual Expenses
The first line in the table below provides information about actual account values and actual expenses. You may use the information in this line, together with the amount you invested, to estimate the expenses that you paid over the period. Simply divide your account value by $1,000 (for example, an $8,600 account value divided by $1,000 = 8.6), then multiply the result by the number in the first line under the heading “Expenses Paid During Period” to estimate the expenses you paid on your account during this period.
Hypothetical Example for Comparison Purposes
The second line of the table below provides information about hypothetical account values and hypothetical expenses based on the Fund’s actual expense ratio and an assumed rate of return of 5% per year before expenses, which is not the actual return of the Fund. The hypothetical account values and expenses may not be used to estimate the actual ending account balance or expenses you paid for the period. You may use this information to compare the ongoing costs of investing in the Fund and other funds. To do so, compare this 5% hypothetical example with the 5% hypothetical examples that appear in the shareholder reports of the other funds.
Please note that the expenses shown in the table are meant to highlight your ongoing costs only and do not reflect any transactional costs, such as sales charges (loads) or redemption/exchange fees. Therefore, the second line of the table is useful in comparing ongoing costs only, and will not help you determine the relative total costs of owning different funds. In addition, if these transactional costs were included, your costs would have been higher.
| Beginning Account Value 10/1/2014 | Ending Account Value 3/31/2015 | Expenses Paid During Period1 | |||||||||||||
Actual | $1,000.00 | $1,030.80 | $16.05 | ||||||||||||
Hypothetical (assuming a 5% return before expenses) | $1,000.00 | $1,009.12 | $15.88 | ||||||||||||
| 1 | Expenses are equal to the Consolidated Fund’s annualized net expense ratio of 3.17%, multiplied by the average account value over the period, multiplied by 182/365 (to reflect the one-half-year period). |
267
Blackstone Alternative Multi-Strategy Fund and Subsidiaries
Shareholder Fee Example (Unaudited)
As a shareholder of the Multi-Strategy Fund, you incur ongoing costs, including management fees and to the extent applicable, distribution (12b-1) fees and/or shareholder services fees and other Fund expenses. This Example is intended to help you to understand your ongoing costs (in dollars) of investing in the Fund and to compare these costs with the ongoing costs of investing in other mutual funds. The expense example is based on an investment of $1,000 invested at the beginning of the period and held through the six month period ended March 31, 2015.
Actual Expenses
The first line in the table below provides information about actual account values and actual expenses. You may use the information in this line, together with the amount you invested, to estimate the expenses that you paid over the period. Simply divide your account value by $1,000 (for example, an $8,600 account value divided by $1,000 = 8.6), then multiply the result by the number in the first line under the heading “Expenses Paid During Period” to estimate the expenses you paid on your account during this period.
Hypothetical Example for Comparison Purposes
The second line of the table below provides information about hypothetical account values and hypothetical expenses based on the Fund’s actual expense ratio and an assumed rate of return of 5% per year before expenses, which is not the actual return of the Fund. The hypothetical account values and expenses may not be used to estimate the actual ending account balance or expenses you paid for the period. You may use this information to compare the ongoing costs of investing in the Fund and other funds. To do so, compare this 5% hypothetical example with the 5% hypothetical examples that appear in the shareholder reports of the other funds.
Please note that the expenses shown in the table are meant to highlight your ongoing costs only and do not reflect any transactional costs, such as sales charges (loads) or redemption/exchange fees. Therefore, the second line of the table is useful in comparing ongoing costs only, and will not help you determine the relative total costs of owning different funds. In addition, if these transactional costs were included, your costs would have been higher.
| Beginning Account Value 10/1/2014 | Ending Account Value 3/31/2015 | Expenses Paid During Period | |||||||||||||
Class I | |||||||||||||||
Actual | $ | 1,000.00 | $ | 1,030.90 | $ | 16.56 | 1 | ||||||||
Hypothetical (assuming a 5% return before expenses) | $ | 1,000.00 | $ | 1,008.63 | $ | 16.38 | 1 | ||||||||
Class D | |||||||||||||||
Actual | $ | 1,000.00 | $ | 1,043.20 | $ | 12.75 | 2 | ||||||||
Hypothetical (assuming a 5% return before expenses) | $ | 1,000.00 | $ | 1,007.98 | $ | 17.02 | 2 | ||||||||
Class Y | |||||||||||||||
Actual | $ | 1,000.00 | $ | 1,029.00 | $ | 5.50 | 3 | ||||||||
Hypothetical (assuming a 5% return before expenses) | $ | 1,000.00 | $ | 1,009.03 | $ | 15.98 | 3 | ||||||||
| 1 | Expenses are equal to the Consolidated Fund’s annualized net expense ratio of 3.27%, multiplied by the average account value over the period, multiplied by 182/365 (to reflect the one-half-year period). |
268
Blackstone Alternative Multi-Strategy Fund and Subsidiaries
Shareholder Fee Example (Continued) (Unaudited)
| 2 | “Actual” expense information for Class D Share is for the period from November 17, 2014 (commencement of operations) to March 15, 2015. Actual expenses are equal to the Fund’s annualized net expense ratio of 3.40%, multiplied by 134/365 (to reflect the period from commencement of operations to March 31, 2015). “Hypothetical” expense information is presented on the basis of the full one-half year period to enable comparison to other funds. It is based on assuming the same net expense ratio and average account value over the period, but it is multiplied by 182/365 (to reflect the full half-year period). |
| 3 | “Actual” expense information for Class Y Share is for the period from January 28, 2015 (commencement of operations) to March 15, 2015. Actual expenses are equal to the Fund’s annualized net expense ratio of 3.19%, multiplied by 62/365 (to reflect the period from commencement of operations to March 31, 2015). “Hypothetical” expense information is presented on the basis of the full one-half year period to enable comparison to other funds. It is based on assuming the same net expense ratio and average account value over the period, but it is multiplied by 182/365 (to reflect the full half-year period). |
269
Blackstone Alternative Investment Funds and Subsidiaries
Supplemental Information
March 31, 2015
Management of the Fund
The Funds’ operations are managed by the Investment Adviser and the Sub-Advisers (defined below), under the direction and oversight of the Board. A majority of the Trustees are not “interested persons” (as defined in the 1940 Act) of the Fund (the “Independent Trustees”). The Trustees and the Funds’ officers are subject to removal or replacement in accordance with Massachusetts law and the Trust’s Declaration of Trust. The Trustees were elected by the initial shareholder of the Trust.
Sub-Advisers
During the period covered by this report, the Investment Adviser engaged the following entities as sub-advisers (each, a “Sub-Adviser”, and together, the “Sub-Advisers”) to provide investment management services to the Funds or to one or more Subsidiaries.
| Ÿ | AlphaParity, LLC |
| Ÿ | Bayview Asset Management, LLC |
| Ÿ | Boussard & Gavaudan Investment Management, LLP |
| Ÿ | BTG Pactual Asset Management US, LLC |
| Ÿ | Caspian Capital LP |
| Ÿ | Cerberus Sub-Advisory I, LLC |
| Ÿ | Chatham Asset Management, LLC |
| Ÿ | Credit Suisse Hedging-Griffo Servicos Internacionais S.A. (until December 31, 2014) |
| Ÿ | EMSO Partners Limited |
| Ÿ | Good Hill Partners LP |
| Ÿ | GS Investment Strategies, LLC |
| Ÿ | HealthCor Management, L.P. |
| Ÿ | Nephila Capital, Ltd. (Multi-Manager Fund only) |
| Ÿ | Rail-Splitter Capital Management, LLC |
| Ÿ | Sorin Capital Management, LLC |
| Ÿ | Two Sigma Advisers, LLC |
| Ÿ | Union Point Advisors, LLC |
| Ÿ | Verde Serviços Internacionais S.A. |
| Ÿ | Waterfall Asset Management, LLC |
| Ÿ | Wellington Management Company LLP |
Trustees and Officers
The following tables set forth information concerning the Trustees and officers (“Officers”) of the Funds. Unless otherwise noted, the business address of each Officer and Trustee is c/o Blackstone Alternative Investment Advisors LLC, 345 Park Avenue, 28th Floor, New York, NY 10154.
270
Blackstone Alternative Investment Funds and Subsidiaries
Supplemental Information (Continued)
March 31, 2015
Independent Trustees:
| Name and Year of Birth of Trustee | Position Held with the Funds | Term of Office1 and Length of Time Served | Principal Occupation(s) During Past 5 Years | Number of Portfolios in Fund Complex2 Overseen by Trustee | Other Trusteeships Held by Trustee During the Past 5 Years | |||||
John M. Brown (1959) | Trustee | Since inception | Retired (2012 – Present) Independent Consultant (2010 – 2012) Principal, Aquiline Holdings (Private Equity) (2006 – 2010) | 5 | None | |||||
Frank J. Coates (1964) | Trustee | Since inception | CEO, Wheelhouse Analytics, LLC (2010 – Present) (Technology Solutions) CEO, Coates Analytics, LP (PNC Bank) (2005 – 2010) (Technology Solutions) | 5 | Member of the Board of Managers of Evermore Global Advisors, LLC | |||||
Paul J. Lawler (1948) | Trustee | Since inception | Retired (2010 – Present) VP Investments & Chief Investment Officer, W.K. Kellogg Foundation and W.K. Kellogg Foundation Trust (1998 – 2010) | 5 | Trustee, First Eagle Variable Funds (1 portfolio); Trustee, First Eagle Funds (8 portfolios); Trustee (Audit Committee and Finance Committee Member), American University in Cairo | |||||
Kristen Leopold (1967) | Trustee | Since inception | CFO, KL Associates LLC (CFO Consulting) (2007 – Present) CFO, WFL Real Estate Services, LLC (2007 – Present) | 5 | Trustee, CPG Alternative Strategies Fund, LLC; Trustee, CPG Carlyle Private Equity Fund, LLC; Trustee, CPG Carlyle Private Equity Master Fund, LLC |
271
Blackstone Alternative Investment Funds and Subsidiaries
Supplemental Information (Continued)
March 31, 2015
Interested Trustee:
| Name and Year of Birth of Trustees | Position Held with Fund | Term of Office1 and Length of Time Served | Principal Occupation(s) During Past 5 Years | Number of Portfolios in Fund Complex2 Overseen by Trustee | Other Trusteeships Held by Trustee | |||||
Peter Koffler3 (1956) | Trustee | Since inception | Senior Managing Director,4 Blackstone Alternative Asset Management L.P. (“BAAM”) (2012 – Present) Chief Compliance Officer, The Blackstone Group L.P. (2013 – Present) General Counsel, Blackstone Alternative Investment Advisors LLC (“BAIA”) and BAAM (2010 – Present) Managing Director,4 BAAM (2006 – 2012) Chief Compliance Officer, BAAM (2008 – 2012) | 5 | None | |||||
| 1 | Term of office of each Trustee is indefinite until his or her resignation, removal, or death. Any Trustee of the Funds may be removed from office in accordance with the provisions of the Trust’s Agreement and Declaration of Trust and By-Laws. |
| 2 | The “Fund Complex” consists of the Funds, Blackstone Alternative Alpha Fund, Blackstone Alternative Alpha Fund II, and Blackstone Alternative Alpha Master Fund. |
| 3 | Peter Koffler is an “interested person” of the Funds, as defined in the 1940 Act, due to his position with BAIA and its affiliates. |
| 4 | Executive title, not a board directorship. |
272
Blackstone Alternative Investment Funds and Subsidiaries
Supplemental Information (Continued)
March 31, 2015
Officers:
| Name and Year of Birth of Officer | Position(s) Held with the Funds | Term of Office1 and Length of Time Served | Principal Occupation(s) During Past 5 Years | |||
Stephen Buehler (1977) | Secretary | March 2013 to present | Managing Director,2 BAAM (2014 – Present) Vice President, BAAM (2011 – 2013) Associate, BAAM (2010 – 2011) Associate, Merrill Lynch and Bank of America Merrill Lynch (2008 – 2010) | |||
Brian F. Gavin (1969) | President (Principal Executive Officer) | March 2013 to present | Chief Operating Officer & Senior Managing Director,2 BAAM (2007 – Present) | |||
Hayley Stein (1977) | Chief Compliance Officer and Anti- Money Laundering Officer | March 2013 to present | Managing Director,2 BAAM (2011 – Present) Chief Compliance Officer, BAIA and BAAM (2013 – Present) Vice President, BAAM (2006 – 2011) | |||
Arthur Liao (1972) | Treasurer (Principal Financial and Accounting Officer) | March 2013 to present | Chief Financial Officer & Managing Director,2 BAAM (2007 – Present) | |||
James Hannigan (1983) | Chief Legal Officer | March 2015 to present | Vice President, BAAM (2014 – Present) Associate, BAAM (2012 – 2014) |
| 1 | Term of office of each officer is indefinite until his or her death, resignation, removal or disqualification. |
| 2 | Executive title, not a board directorship. |
Compensation for Trustees
The Trust pays no compensation to any of its officers or to Trustees who are not Independent Trustees. Each Independent Trustee is paid $45,000 per fiscal year for his or her services to the Trust, and the Chairpersons of the Board and the Audit Committee are each paid an additional $3,000 per fiscal year from the Trust. Trustees are reimbursed by the Trust for their travel expenses related to Board meetings, continuing education and conferences.
Form N-Q Filings
The Funds file complete schedules of portfolio holdings with the Securities and Exchange Commission (“SEC”) for the first and third quarters of each fiscal year on Form N-Q. The Funds’ Form N-Q is available on the SEC’s website at http://www.sec.gov within 60 days after the Funds’ first and third fiscal quarters. The Funds’ Form N-Q may be reviewed and copied at the SEC’s Public Reference Room in Washington,
273
Blackstone Alternative Investment Funds and Subsidiaries
Supplemental Information (Continued)
March 31, 2015
D.C., and information regarding the operation of the Public Reference Room may be obtained by calling 1-800-SEC-0330. Holdings and allocations shown on any Form N-Q are as of the date indicated in the filing and may not be representative of future investments. Holdings and allocations should not be considered research or investment advice and should not be relied upon in making investment decisions.
Proxy Voting Policies
A description of the policies and procedures used to vote proxies related to the Funds’ portfolio securities and information regarding how the Funds voted proxies relating to their portfolio securities during the 12-month period ended June 30, 2014 will be available (1) without charge, upon request, by calling toll free, 1-855-890-7725 and (2) on the SEC’s website at http://www.sec.gov.
Board Approval of the Sub-Advisory Agreements
At meetings of the Board held in person on November 18-19, 2014, February 24-25, 2015 and March 31, 2015, the Board, including all of the Independent Trustees, considered and unanimously approved the sub-advisory agreements for the Funds (“New Sub-Advisory Agreements”) between BAIA and each of the following Sub-Advisers:
| Ÿ | Verde Serviços Internacionais S.A. (at November meeting) |
| Ÿ | Sorin Capital Management, LLC (at November meeting) |
| Ÿ | Bayview Asset Management, LLC (at February meeting) |
| Ÿ | Blackstone Senfina Advisors L.L.C. (at March meeting) |
At the Board’s November meeting, the Board, including all of the Independent Trustees, also considered and unanimously approved amended and restated sub-advisory agreements for the Funds (“Amended and Restated Sub-Advisory Agreements,” and together with the New Sub-Advisory Agreements,” the “Sub-Advisory Agreements”) between BAIA and Cerberus Sub-Advisory I, LLC.
The Independent Trustees were assisted in their review of the Sub-Advisory Agreements by independent legal counsel. The Board requested and evaluated all the information it deemed reasonably necessary under the circumstances in connection with the approval of the Sub-Advisory Agreements. The Board noted that BAIA and the Funds would rely on an exemptive order from the SEC that permitted the Funds to add or replace sub-advisers without a shareholder vote, provided that the Board, including a majority of Independent Trustees, approves the new sub-advisers and certain other conditions are met.
Before the meetings, the Board received, among other things, (a) materials prepared by independent legal counsel regarding the relevant factors to consider in evaluating the Sub-Advisory Agreements; (b) materials prepared by BAIA relating to each Sub-Adviser, including (1) summary information regarding: the investment thesis; strengths; a comparison to hedge fund strategies; a firm-wide risk evaluation and a strategy risk evaluation; an assessment of relevant valuation, liquidity, trade execution, allocation, and compliance matters; and a summary of the key terms of the relevant Sub-Advisory Agreement; (2) information in greater detail regarding each Sub-Adviser’s investment thesis, investment strategy, investment process, portfolio construction, organizational history and ownership, quantitative analysis, peer group analysis, risk review, and business and financial evaluation; (3) information regarding each Sub-Adviser’s product offerings and personnel, business viability, related entities, product and operational complexity, valuation, internal controls, service providers, and regulatory and compliance infrastructure; (4) a summary of each Sub-Adviser’s compliance program; and (5) information regarding the role of each Sub-Adviser as part of the Funds’ portfolios; and (c) materials prepared by each Sub-Adviser that addressed, among other things: (1) general financial information; (2) services and personnel; (3) portfolio management; (4) costs, fees, other benefits, and profitability; and (5) risk management and regulatory compliance matters.
274
Blackstone Alternative Investment Funds and Subsidiaries
Supplemental Information (Continued)
March 31, 2015
With respect to the Sub-Advisory Agreements for Verde Serviços Internacionais S.A. and Bayview Asset Management, LLC, the Board also received, among other things, (a) information about the restructuring plan and change of control transaction, respectively, applicable to such firms, the resulting entities of which would have the same resources and support as their respective predecessor firms and which would perform the same services for the Funds as their respective predecessor firms and (b) copies of the information reviewed in connection with the approvals of the sub-advisory agreements between BAIA and such predecessor firms.
With respect to the Amended and Restated Sub-Advisory Agreements, the Board received, among other things, information about the changes from the original sub-advisory agreements, as well as copies of the information reviewed in connection with the approvals of that Sub-Adviser’s original sub-advisory agreements.
At the meetings, there was discussion regarding the materials that had been provided to the Board, the terms of the Sub-Advisory Agreements, and other relevant considerations. Additionally, the Board (and separately, the Independent Trustees) conferred with their independent legal counsel to consider the information provided. In evaluating the Sub-Advisory Agreements, the Board took into account the fact that the compensation paid to the Sub-Advisers would be paid by BAIA from the investment management fee it receives from the Funds and would not increase the fees or expenses otherwise incurred by the Funds or their shareholders. In the case of the Amended and Restated Sub-Advisory Agreements, the Board also took into account its recent consideration and approval of the original sub-advisory agreements with Cerberus Sub-Advisory I, LLC, and the fact that the proposed changes to the original sub-advisory agreements were, with the exception of changes in sub-advisory fees, not substantive, and were not expected to result in any change in the nature, extent and quality of the services provided to the Funds. Following this discussion, the Board, including all of the Independent Trustees, determined to approve each of the New Sub-Advisory Agreements for an initial term of up to two years, and to approve each of the Amended and Restated Sub-Advisory Agreements, on the basis of the following considerations, among others:
Nature, Extent, and Quality of the Services
The Board discussed and considered with respect to each Sub-Adviser (1) personnel, operations, and financial condition; (2) investment expertise; (3) potential investment return on the assets that potentially would be managed by the Sub-Adviser; (4) where applicable, the Sub-Adviser’s experience and performance in managing hedge funds and the extent to which the Sub-Adviser’s strategy for the Funds would overlap with its hedge fund strategy; and (5) the experience and depth of the Sub-Adviser’s portfolio management team. Where applicable, the Board also considered information about the experience of BAIA’s affiliates in investing in hedge funds managed by the Sub-Adviser. The Board concluded that the nature, extent, and quality of the sub-advisory services to be provided by each Sub-Adviser were appropriate and thus supported a decision to approve the Sub-Advisory Agreements.
Costs of Services and Profitability
In analyzing the cost of services and profitability of each Sub-Adviser, the Board discussed the following factors: the proposed sub-advisory fee for managing the allocated Fund assets, including any breakpoints, the Sub-Adviser’s resources devoted to the Funds, and (where available) the information provided by each Sub-Adviser regarding the anticipated profitability to the Sub-Adviser from providing sub-advisory services to the Funds. Where applicable, the Board reviewed the performance of the Sub-Adviser’s comparable hedge fund as compared to relevant indices, as well as information about the management fees borne by those funds. The Board noted that the compensation paid to the Sub-Adviser was paid by BAIA, not the Funds, and, accordingly, that the retention of the Sub-Adviser did not increase the fees or expenses otherwise incurred by the Funds’ shareholders. The Board also considered information about the anticipated average sub-advisory
275
Blackstone Alternative Investment Funds and Subsidiaries
Supplemental Information (Continued)
March 31, 2015
fees that BAIA would pay in light of expected portfolio allocations and the resulting division of fees as between BAIA and the Sub-Advisers. In the case of the Sub-Advisory Agreement with Blackstone Senfina Advisors L.L.C., the Board also took into account that the compensation paid to the Sub-Adviser would benefit The Blackstone Group L.P., the indirect parent company of both BAIA and the Sub-Adviser. On the basis of the Board’s review of the fees to be charged by each Sub-Adviser for investment sub-advisory services, the relatively unique and highly specialized nature of the portfolio that the Sub-Adviser would manage, and the estimated costs associated with managing the portfolio, the Board concluded that the level of investment sub-advisory fees was appropriate in light of the services to be provided. It was noted that all of the Sub-Advisory Agreements were the result of arms-length negotiations.
Economies of Scale
The Board discussed various financial and economic considerations relating to the proposed arrangement with each Sub-Adviser, including economies of scale. The Board also noted that certain expenses of the Funds would be subject to an expense cap. The Board noted that it would have the opportunity to periodically re-examine whether the Funds had achieved economies of scale, as well as the appropriateness of sub-advisory fees payable to each Sub-Adviser, with respect to different asset sizes of the portfolio managed by such Sub-Adviser, in the future.
Investment Performance of the Sub-Advisers
Where applicable, the Board considered the investment performance of the Sub-Advisers. Since Sorin Capital Management, LLC and Blackstone Senfina Advisors L.L.C. had not previously sub-advised any of the Funds’ assets, the Trustees were unable to consider the performance of those Sub-Advisers on behalf of the Funds. The Trustees considered the performance of Cerberus Sub-Advisory I, LLC and the predecessor firms for Verde Serviços Internacionais S.A. and Bayview Asset Management, LLC, but noted that, since the Funds are relatively new, it was generally not possible to draw definitive conclusions as to the quality of those Sub-Advisers’ investment programs. The Trustees reviewed historical investment performance generated by each Sub-Adviser for other funds managed by the Sub-Adviser, but noted that the Funds were different in structure from certain of those other funds and, as a result, their investment programs and performance would differ from those of the other funds.
Other Benefits
The Board discussed other potential benefits that each Sub-Adviser might receive from the Funds, including soft dollar arrangements, receipt of brokerage and research services, and the opportunity to offer additional products and services to the Funds’ shareholders. The Board concluded that other benefits derived by each Sub-Adviser from its relationship with BAIA, BAAM, or the Funds, to the extent such benefits were identifiable or determinable, were reasonable and fair, resulted from the provision of appropriate services to the Funds and investors therein, and were consistent with industry practice and the best interests of the Funds and their shareholders.
Conclusion
The Board, including all of the Independent Trustees, concluded that the fees payable under each of the Sub-Advisory Agreements were fair and reasonable with respect to the services that the relevant Sub-Adviser would provide to the Funds and in light of the other factors described above and additional factors that the Board deemed relevant. After review and consideration of certain other terms and conditions of the Sub-Advisory Agreements and, the Board concluded that the terms of each Sub-Advisory Agreement were reasonable and fair and noted that they would have the opportunity to periodically re-examine the terms of
276
Blackstone Alternative Investment Funds and Subsidiaries
Supplemental Information (Continued)
March 31, 2015
the Sub-Advisory Agreements in the future. The Board based its decision on an evaluation of all these factors as a whole and did not consider any one factor as all-important or controlling. The Board was assisted by the advice of independent counsel in making these determinations.
Additional Information
The Funds’ registration statement and Statement of Additional Information include additional information about the Trustees. The registration statement and Statement of Additional Information are available upon request, without charge, by calling 1-855-890-7725.
277
Blackstone Registered Funds
Privacy Notice
Rev February, 2015
| FACTS | WHAT DO BLACKSTONE REGISTERED FUNDS DO WITH YOUR PERSONAL INFORMATION? |
| Why? | Financial companies choose how they share your personal information. Federal law gives consumers the right to limit some but not all sharing. Federal law also requires us to tell you how we collect, share, and protect your personal information. Please read this notice carefully to understand what we do. |
| What? | The types of personal information we collect and share depend on the product or service you have with us. This information can include: n Social Security number and income n Assets and investment experience n Risk tolerance and transaction history |
| How? | All financial companies need to share customers’ personal information to run their everyday business. In the section below, we list the reasons financial companies can share their customers’ personal information; the reasons Blackstone Registered Funds (as defined below) choose to share; and whether you can limit this sharing. |
| Reasons we can share your personal information | Do Blackstone Registered Funds share? | Can you limit this sharing? | ||
For our everyday business purposes— such as to process your transactions, maintain your account(s), respond to court orders and legal investigations, or report to credit bureaus | Yes | No | ||
For our marketing purposes— to offer our products and services to you | Yes | No | ||
| For joint marketing with other financial companies | No | We don’t share | ||
For our affiliates’ everyday business purposes— information about your transactions and experiences | No | We don’t share | ||
For our affiliates’ everyday business purposes— information about your creditworthiness | No | We don’t share | ||
| For our affiliates to market to you | No | We don’t share | ||
| For nonaffiliates to market to you | No | We don’t share | ||
| Questions? | Email us at GLB.privacy@blackstone.com | |
278
Blackstone Registered Funds
Privacy Notice (Continued)
Rev February, 2015
| Who we are | ||
| Who is providing this notice? | Blackstone Registered Funds include Blackstone Alternative Alpha Fund, Blackstone Alternative Alpha Fund II, Blackstone Real Estate Income Fund, Blackstone Real Estate Income Fund II, and Blackstone Alternative Investment Funds, on behalf of its series Blackstone Alternative Multi-Manager Fund and Blackstone Alternative Multi-Strategy Fund | |
| What we do | ||
| How do Blackstone Registered Funds protect my personal information? | To protect your personal information from unauthorized access and use, we use security measures that comply with federal law. These measures include computer safeguards and secured files and buildings. | |
| How do Blackstone Registered Funds collect my personal information? | We collect your personal information, for example, when you: n open an account or give us your income information n provide employment information or give us your contact information n tell us about your investment or retirement portfolio We also collect your personal information from others, such as credit bureaus, affiliates, or other companies. | |
| Why can’t I limit all sharing? | Federal law gives you the right to limit only: n sharing for affiliates’ everyday business purposes—information about your creditworthiness n affiliates from using your information to market to you n sharing for nonaffiliates to market to you State laws and individual companies may give you additional rights to limit sharing. See below for more on your rights under state law. | |
| What happens when I limit sharing for an account I hold jointly with someone else? | Your choices will apply to everyone on your account—unless you tell us otherwise. | |
| Definitions | ||
| Affiliates | Companies related by common ownership or control. They can be financial and nonfinancial companies. n Our affiliates include companies with a Blackstone name and financial companies such as GSO Capital Partners LP and Strategic Partners Fund Solutions. | |
| Nonaffiliates | Companies not related by common ownership or control. They can be financial and nonfinancial companies. n Blackstone Registered Funds do not share with nonaffiliates so they can market to you. | |
| Joint marketing | A formal agreement between nonaffiliated financial companies that together market financial products or services to you. n Our joint marketing partners include financial services companies. | |
| Other important information | ||
California Residents—In accordance with California law, we will not share information we collect about California residents with nonaffiliates except as permitted by law, such as with the consent of the customer or to service the customer’s accounts. We will also limit the sharing of information about you with our affiliates to the extent required by applicable California law.
Vermont Residents—In accordance with Vermont law, we will not share information we collect about Vermont residents with nonaffiliates except as permitted by law, such as with the consent of the customer or to service the customer’s accounts. We will not share creditworthiness information about Vermont residents among Blackstone Registered Funds’ affiliates except with the authorization or consent of the Vermont resident.
279
Blackstone Alternative Multi-Manager Fund
Blackstone Alternative Multi-Strategy Fund
Series of Blackstone Alternative Investment Funds
Trustees
John M. Brown, Chairman
Frank J. Coates
Paul J. Lawler
Kristen M. Leopold
Peter Koffler
Investment Manager
Blackstone Alternative Investment Advisors LLC
345 Park Avenue
New York, New York 10154
Administrator, Custodian and Transfer Agent
State Street Bank and Trust Company
One Lincoln Street
Boston, MA 02111
Officers
Brian F. Gavin, President and Principal Executive Officer
Arthur Liao, Treasurer and Principal Financial and Accounting Officer
Hayley Stein, Chief Compliance Officer
James Hannigan, Chief Legal Officer
Stephen Buehler, Secretary
Independent Registered Public Accounting Firm
Deloitte & Touche LLP
30 Rockefeller Plaza
New York, New York 10112
Legal Counsel
Ropes & Gray LLP
Prudential Tower
800 Boylston Street
Boston, Massachusetts 02199-3600
This report, including the financial information herein, is transmitted to the shareholders of Blackstone Alternative Multi-Manager Fund and Blackstone Alternative Multi-Strategy Fund for their information. It is not a prospectus or representation intended for use in the purchase of shares of the Funds or any securities mentioned in this report.
You can find each Fund’s prospectus and other information about the Funds, including each Fund’s statements of additional information, on the Funds’ website at www.blackstone.com/blackstone-alternative-investment-funds. You can also get this information at no cost by calling the Funds at 1-855-890-7725.
| Item 2. | Code of Ethics. |
| (a) | The registrant, as of the end of the period covered by the report, has adopted a code of ethics that applies to the registrant’s principal executive officer, principal financial officer, principal accounting officer or controller, or persons performing similar functions. This code of ethics is included as Exhibit 12(a)(1). |
| (b) | During the period covered by the report, with respect to the registrant’s code of ethics that applies to its principal executive officer, principal financial officer, principal accounting officer or controller, or persons performing similar functions, there have been no amendments to, nor any waivers granted from, a provision that relates to any element of the code of ethics definition enumerated in paragraph (b) of this Item 2. |
| Item 3. | Audit Committee Financial Expert. |
| (a) (1) | The registrant’s Board of Trustees has determined that the registrant has at least one audit committee financial expert serving on its Audit Committee (the “Committee”). |
| (b) (2) | The audit committee financial expert is Kristen M. Leopold, who is “independent” for purposes of this Item 3 of Form N-CSR. |
| Item 4. | Principal Accountant Fees and Services. |
| Current Year | Previous Year | |||||||||||
(a) | Audit Fees | $ | 300,000 | $ | 197,000 | |||||||
(b) | Audit-Related Fees | $ | 0 | $ | 0 | |||||||
(c) | Tax Fees(1) | $ | 70,800 | $ | 44,300 | |||||||
(d) | All Other Fees | $ | 0 | $ | 0 | |||||||
| (1) | The nature of the services includes tax compliance, tax advice and tax planning. |
| (e) (1) | Disclose the Committee’s pre-approval policies and procedures described in paragraph (c)(7) of Rule 2-01 of Regulation S-X. |
The charter for the Committee requires that the Committee pre-approve (i) all audit and non-audit services that the registrant’s independent auditors provide to the registrant, and (ii) all non-audit services that the registrant’s independent auditors provide to Blackstone Alternative Investment Advisors LLC, the investment adviser of the registrant (“BAIA”), and any entity controlling, controlled by, or under common control with BAIA that provides ongoing services to the registrant, if the engagement relates directly to the operations and financial reporting of the registrant; provided that the Committee may implement policies and procedures by which such services are approved other than by the full Committee prior to their ratification by the Committee.
| (e) (2) | Disclose the percentage of services described in each of paragraphs (b) through (d) of this item that were approved by the Committee pursuant to paragraph (c) (7)(i)(c) of Rule 2-01 of Regulation S-X. |
Current Year | Previous Year | |
| 100% | 100% |
| (f) | Not applicable. |
| (g) | Disclose the aggregate non-audit fees billed by the registrant’s accountant for services rendered to the registrant, and rendered to the registrant’s investment adviser, and any entity controlling, controlled by, or under common control with the adviser that provides ongoing services to the registrant for each of the last two fiscal years of the registrant. |
Current Year | Previous Year | |
| $0 | $0 |
| (h) | Not applicable. |
| Item 5. | Audit Committee of Listed Registrants. |
Not applicable.
| Item 6. | Schedule of Investments. |
| (a) | The registrant’s Consolidated Schedule of Investments as of the close of the reporting period is included in the Report to Stockholders filed under item 1 of this form. |
| (b) | Not applicable. |
| Item 7. | Disclosure of Proxy Voting Policies and Procedures for Closed-End Management Investment Companies. |
Not applicable.
| Item 8. | Portfolio Managers of Closed-End Investment Management Companies. |
Not applicable.
| Item 9. | Purchases of Equity Securities by Closed-End Management Investment Company and Affiliated Purchasers. |
Not applicable.
| Item 10. | Submission of Matters to a Vote of Security Holders. |
There have been no material changes to procedures by which the shareholders may recommend nominees to the registrant’s Board of Trustees.
| Item 11. | Controls and Procedures. |
| (a) | The registrant’s principal executive officer and principal financial officers, or persons performing similar functions, have concluded that the registrant’s disclosure controls and procedures as defined in Rule 30a-3(c) under the Investment Company Act of 1940, as amended (the “1940 Act”), are effective as of the date within 90 days of the filing date of this report based on the evaluation of these controls and procedures required by Rule 30a-3(b) under the 1940 Act and Rules 13a-15(b) or 15d-15(b) under the Securities Exchange Act of 1934, as amended. |
| (b) | There were no changes in the registrant’s internal control over financial reporting (as defined in Rule 30a- 3(d) under the 1940 Act) that occurred during the second fiscal quarter of the period covered by this report that have materially affected or are reasonably likely to materially affect, the registrant’s internal control over financial reporting. |
| Item 12. | Exhibits. |
| (a)(1) | Code of ethics, or any amendment thereto, that is the subject of disclosure required by Item 2 is attached hereto. |
| (a)(2) | Certifications pursuant to Rule 30a-2(a) are attached hereto. |
| (a)(3) | Not applicable. |
| (b) | Certifications pursuant to Rule 30a-2(b) are attached hereto. |
SIGNATURES
Pursuant to the requirements of the Securities Exchange Act of 1934 and the Investment Company Act of 1940, the registrant has duly caused this report to be signed on its behalf by the undersigned, thereunto duly authorized.
| (Registrant) | Blackstone Alternative Investment Funds |
| By (Signature and Title) | /s/ Brian F. Gavin | |
| Brian F. Gavin, President (Principal Executive Officer) |
| Date | June 5, 2015 |
Pursuant to the requirements of the Securities Exchange Act of 1934 and the Investment Company Act of 1940, this report has been signed below by the following persons on behalf of the registrant and in the capacities and on the dates indicated.
| By (Signature and Title) | /s/ Brian F. Gavin | |
| Brian F. Gavin, President (Principal Executive Officer) |
| Date | June 5, 2015 |
| By (Signature and Title) | /s/ Arthur Liao | |
| Arthur Liao, Treasurer (Principal Financial and Accounting Officer) |
| Date | June 5, 2015 |