0000313838 sony:InformationTechnologyCommunicationAndServiceSectorMember sony:NonMarketableEquityInstrumentsMember 2021-03-31 0000313838 sony:SonyCorporationOfAmericaMember 2021-04-01 2022-03-31
UNITED STATES
SECURITIES AND EXCHANGE COMMISSION
Washington, D.C. 20549
Form 20-F
| ☐ | REGISTRATION STATEMENT PURSUANT TO SECTION 12(b) OR 12(g) OF THE SECURITIES EXCHANGE ACT OF 1934 |
or
| ☑ | ANNUAL REPORT PURSUANT TO SECTION 13 OR 15(d) OF THE SECURITIES EXCHANGE ACT OF 1934 |
For the fiscal year ended March 31, 2022
or
| ☐ | TRANSITION REPORT PURSUANT TO SECTION 13 OR 15(d) OF THE SECURITIES EXCHANGE ACT OF 1934 |
For the transition period from/to
or
| ☐ | SHELL COMPANY REPORT PURSUANT TO SECTION 13 OR 15(d) OF THE SECURITIES EXCHANGE ACT OF 1934 |
Date of event requiring this shell company report:
Commission
file number
1-6439
Sony Group Kabushiki Kaisha
(Exact Name of Registrant as specified in its charter)
SONY GROUP CORPORATION
(Translation of Registrant’s name into English)
Japan
(Jurisdiction of incorporation or organization)
7-1,
KONAN1-CHOME
,MINATO-KU,
TOKYO
108-0075
JAPAN(Address of principal executive offices)
J. Justin Hill, Senior Vice President, Finance & Investor Relations
Sony Corporation of America
25 Madison Avenue, 26
th
FloorNew York, New York 10010-8601
Telephone:
212-833-6722
E-mail:
ir@sony.com(Name, Telephone,
E-mail
and Address of Company Contact Person)Securities registered or to be registered pursuant to Section 12(b) of the Act:
Title of Each Class | Trading Symbol(s) | Name of Each Exchange on Which Registered | ||
American Depositary Shares* | SONY | New York Stock Exchange | ||
| Common Stock** |
| * | American Depositary Shares evidenced by American Depositary Receipts. Each American Depositary Share represents one share of Common Stock. |
| ** | No par value per share. Not for trading, but only in connection with the listing of American Depositary Shares pursuant to the requirements of the New York Stock Exchange. |
Securities registered pursuant to Section 12(g) of the Act:
None
Securities for which there is a reporting obligation pursuant to Section 15(d) of the Act:
None
Indicate the number of outstanding shares of each of the issuer’s classes of capital or common stock as of the close of the period covered by the Annual Report:
Outstanding as of | |||||||||
March 31, 2022 | March 31, 2022 | ||||||||
Title of Class | (Tokyo Time) | (New York Time) | |||||||
Common Stock | 1,237,003,645 | ||||||||
American Depositary Shares | 119,812,598 | ||||||||
Indicate by check mark if the registrant is a well-known seasoned issuer, as defined in Rule 405 of the Securities Act. Yes ☑ No ☐
If this report is an annual or transition report, indicate by check mark if the registrant is not required to file reports pursuant to Section 13 or 15(d) of the Securities Exchange Act of 1934. Yes ☐ No ☑
Indicate by check mark whether the registrant: (1) has filed all reports required to be filed by Section 13 or 15(d) of the Securities Exchange Act of 1934 during the preceding 12 months (or for such shorter period that the registrant was required to file such reports), and (2) has been subject to such filing requirements for the past 90 days. Yes ☑ No ☐
Indicate by check mark whether the registrant has submitted electronically every Interactive Data File required to be submitted pursuant to Rule 405 of Regulation
S-T
during the preceding 12 months (or for such shorter period that the registrant was required to submit such files). Yes ☑ No ☐Indicate by check mark whether the registrant is a large accelerated filer, an accelerated filer, or a
non-accelerated
filer, or an emerging growth company. See definition of “large accelerated filer,” “accelerated filer” and “emerging growth company” in Rule12b-2
of the Exchange Act.☑ Large accelerated filer | ☐ Accelerated filer | ☐ Non-accelerated filer | ☐ Emerging growth company |
If an emerging growth company that prepares its financial statements in accordance with U.S. GAAP, indicate by check mark if the registrant has elected not to use the extended transition period for complying with any new or revised financial accounting standards† provided pursuant to Section 13(a) of the Exchange Act. ☐
† The term “new or revised financial accounting standard” refers to any update issued by the Financial Accounting Standards Board to its Accounting Standards Codification after April 5, 2012.
Indicate by check mark whether the registrant has filed a report on and attestation to its management’s assessment of the effectiveness of its internal control over financial reporting under Section 404(b) of the Sarbanes-Oxley Act (15 U.S.C. 7262(b)) by the registered public accounting firm that prepared or issued its audit report. ☑
Indicate by check mark which basis of accounting the registrant has used to prepare the financial statements included in this filing:
US GAAP ☐ | International Financial Reporting Standards as issued by the International Accounting Standards Board ☑ | Other ☐ |
If “Other” has been checked in response to the previous question, indicate by check mark which financial statement item the registrant has elected to follow.
Item 17 ☐ | Item 18 ☐ |
If this is an annual report, indicate by check mark whether the registrant is a shell company (as defined in
Rule 12b-2
of the Exchange Act).Yes ☐ | No ☑ |
On April 1, 2021, Sony Group Corporation changed its company name from “Sony Corporation” to “Sony Group Corporation.” All instances of the company name included in this Annual Report on Form
20-F
(“Form 20-F”)
have been updated to conform to this change, and Sony Group Corporation and its consolidated subsidiaries are together referred to as “Sony” or “Sony Group,” except where otherwise expressly stated or required by context. References to “Sony Corporation” in exhibits to this Form20-F
should also be read as referring to Sony Group Corporation. In addition, “Sales and financial services revenue” are referred to as “sales” in the narrative description except in the consolidated financial statements.Sony’s consolidated financial statements in this annual report have been prepared in accordance with International Financial Reporting Standards (“IFRS”), as issued by the International Accounting Standards Board (“IASB”), and are Sony’s first annual consolidated financial statements prepared in accordance with IFRS. In preparing these financial statements, the opening statement of financial position as of April 1, 2020, which is the date of Sony’s transition to IFRS, and the comparative financial statements as of and for the fiscal year ended March 31, 2021, have been prepared in accordance with IFRS. In addition to the consolidated financial statements included in this annual report, other disclosure in this annual report has also been updated to correspond to the transition to IFRS.
The consolidated financial statements included in Sony’s annual reports on Form
20-F
previously filed with the U.S. Securities and Exchange Commission, (the “SEC”) were prepared in accordance with the generally accepted accounting principles in the United States (“U.S. GAAP”) and the most recent annual consolidated financial statements prepared in accordance with U.S. GAAP are those as of and for the fiscal year ended March 31, 2021. IFRS differs in certain respects from U.S. GAAP. An explanation of how the transition to IFRS has affected Sony’s consolidated financial statements is provided in note 34 to Sony’s consolidated financial statements.Cautionary Statement
Statements made in this document with respect to Sony’s current plans, estimates, strategies and beliefs and other statements that are not historical facts are forward-looking statements about the future performance of Sony. Forward-looking statements include, but are not limited to, those statements using words such as “believe,” “expect,” “plans,” “strategy,” “prospects,” “forecast,” “estimate,” “project,” “anticipate,” “aim,” “intend,” “seek,” “may,” “might,” “could” or “should,” and words of similar meaning in connection with a discussion of future operations, financial performance, events or conditions. From time to time, oral or written forward-looking statements may also be included in other materials released to the public. These statements are based on management’s assumptions, judgments and beliefs in light of the information currently available to it. Sony cautions investors that a number of important risks and uncertainties could cause actual results to differ materially from those discussed in the forward-looking statements, and therefore investors should not place undue reliance on them. Sony adopted IFRS starting in the three months ended June 30, 2021, in lieu of the previously applied U.S. GAAP. The results for the fiscal year ended March 31, 2021 are also presented in accordance with IFRS. Investors also should not rely on any obligation of Sony to update or revise any forward-looking statements, whether as a result of new information, future events or otherwise. Sony disclaims any such obligation. Risks and uncertainties that might affect Sony include, but are not limited to:
| (i) | Sony’s ability to maintain product quality and customer satisfaction with its products and services; |
| (ii) | Sony’s ability to continue to design and develop and win acceptance of, as well as achieve sufficient cost reductions for, its products and services, including image sensors, game and network platforms, smartphones and televisions, which are offered in highly competitive markets characterized by severe price competition and continual new product and service introductions, rapid development in technology and subjective and changing customer preferences; |
| (iii) | Sony’s ability to implement successful hardware, software, and content integration strategies, and to develop and implement successful sales and distribution strategies in light of new technologies and distribution platforms; |
| (iv) | the effectiveness of Sony’s strategies and their execution, including but not limited to the success of Sony’s acquisitions, joint ventures, investments, capital expenditures, restructurings and other strategic initiatives; |
| (v) | changes in laws, regulations and government policies in the markets in which Sony and its third-party suppliers, service providers and business partners operate, including those related to taxation, as well as growing consumer focus on corporate social responsibility; |
- 2 -
| (vi) | Sony’s continued ability to identify the products, services and market trends with significant growth potential, to devote sufficient resources to research and development, to prioritize investments and capital expenditures correctly and to recoup its investments and capital expenditures, including those required for technology development and product capacity; |
| (vii) | Sony’s reliance on external business partners, including for the procurement of parts, components, software and network services for its products or services, the manufacturing, marketing and distribution of its products, and its other business operations; |
| (viii) | the global economic and political environment in which Sony operates and the economic and political conditions in Sony’s markets, particularly levels of consumer spending; |
| (ix) | Sony’s ability to meet operational and liquidity needs as a result of significant volatility and disruption in the global financial markets or a ratings downgrade; |
| (x) | Sony’s ability to forecast demands, manage timely procurement and control inventories; |
| (xi) | foreign exchange rates, particularly between the yen and the U.S. dollar, the euro and other currencies in which Sony makes significant sales and incurs production costs, or in which Sony’s assets, liabilities and operating results are denominated; |
| (xii) | Sony’s ability to recruit, retain and maintain productive relations with highly skilled personnel; |
| (xiii) | Sony’s ability to prevent unauthorized use or theft of intellectual property rights, to obtain or renew licenses relating to intellectual property rights and to defend itself against claims that its products or services infringe the intellectual property rights owned by others; |
| (xiv) | the impact of changes in interest rates and unfavorable conditions or developments (including market fluctuations or volatility) in the Japanese equity markets on the revenue and operating income of the Financial Services segment; |
| (xv) | shifts in customer demand for financial services such as life insurance and Sony’s ability to conduct successful asset liability management in the Financial Services segment; |
| (xvi) | risks related to catastrophic disasters, geopolitical conflicts, pandemic disease or similar events; |
| (xvii) | the ability of Sony, its third-party service providers or business partners to anticipate and manage cybersecurity risk, including the risk of unauthorized access to Sony’s business information and the personally identifiable information of its employees and customers, potential business disruptions or financial losses; and |
| (xviii) | the outcome of pending and/or future legal and/or regulatory proceedings. |
Risks and uncertainties also include the impact of any future events with material adverse impact. The continued impact of the Coronavirus Disease 2019
(“COVID-19”)
and developments relating to the situation in Ukraine and Russia could heighten many of the risks and uncertainties noted above.Important information regarding risks and uncertainties is also set forth elsewhere in this annual report, including in “Risk Factors” under “Item 3.,” “Item 4.,” “Item 5.,” “Legal Proceedings” included in “Item 8.” Sony’s consolidated financial statements referenced in “Item 8.” and “Item 11..”
Key Information
Information on the Company
Operating and Financial Review and Prospects
Financial Information
,
Financial Information
Quantitative and Qualitative Disclosures about Market Risk
- 3 -
TABLE OF CONTENTS
| 6 | ||||
| 6 | ||||
| 6 | ||||
| 6 | ||||
| 6 | ||||
| 6 | ||||
| 6 | ||||
| 18 | ||||
| 18 | ||||
| 21 | ||||
| 29 | ||||
| 30 | ||||
| 31 | ||||
| 31 | ||||
| 31 | ||||
| 46 | ||||
| 47 | ||||
| 48 | ||||
| 54 | ||||
| 57 | ||||
| 57 | ||||
| 62 | ||||
| 69 | ||||
| 78 | ||||
| 80 | ||||
| 80 | ||||
| 80 | ||||
| 81 | ||||
| 81 | ||||
| 81 | ||||
| 81 | ||||
| 81 | ||||
| 81 | ||||
| 81 | ||||
| 82 | ||||
| 82 | ||||
| 82 | ||||
| 82 | ||||
| 82 | ||||
| 82 | ||||
| 82 | ||||
| 82 | ||||
| 82 | ||||
| 82 | ||||
| 91 | ||||
| 91 | ||||
| 95 | ||||
| 98 | ||||
| 98 | ||||
| 98 | ||||
| 98 | ||||
| 98 | ||||
| 98 | ||||
| 98 | ||||
| 98 | ||||
| 98 | ||||
| 98 | ||||
| 100 |
- 4 -
| 100 | ||||
| 100 | ||||
| 101 | ||||
| 101 | ||||
| 101 | ||||
| 101 | ||||
| 101 | ||||
| 102 | ||||
| 102 | ||||
| 102 | ||||
| 103 | ||||
| 104 | ||||
| 109 | ||||
| 109 | ||||
| 109 | ||||
| 109 | ||||
| 110 | ||||
| 111 |
- 5 -
Item 1. | Identity of Directors, Senior Management and Advisers |
Not Applicable
Item 2. | Offer Statistics and Expected Timetable |
Not Applicable
Item 3. | Key Information |
A. | [Reserved] |
Selected Financial Data
Sony adopted IFRS for the first time this fiscal year (commenced on April 1, 2021 and ended on March 31, 2022). Therefore, the following selected financial data are provided in accordance with IFRS.
| Yen in millions | ||||||||
| Fiscal year ended March 31 | ||||||||
| 2021 | 2022 | |||||||
Consolidated Statements of Income data: | ||||||||
Sales and financial services revenue | 8,998,661 | 9,921,513 | ||||||
Operating income | 955,255 | 1,202,339 | ||||||
Income before income taxes | 997,965 | 1,117,503 | ||||||
Net income attributable to Sony Group Corporation’s stockholders | 1,029,610 | 882,178 | ||||||
Comprehensive income attributable to Sony Group Corporation’s stockholders | 1,118,628 | 623,678 | ||||||
Consolidated Statements of Financial Position data: | ||||||||
Sony Group Corporation’s stockholders’ equity | 6,680,343 | 7,144,471 | ||||||
Common stock | 880,214 | 880,365 | ||||||
Net assets | 6,724,339 | 7,197,249 | ||||||
Total assets | 27,507,843 | 30,480,967 | ||||||
Number of shares issued at fiscal year-end (thousands of shares of common stock) | 1,261,059 | 1,261,082 | ||||||
Ratio of stockholders’ equity to total assets (%) | 24.3 | 23.4 | ||||||
Data per share of Common Stock data: | ||||||||
Sony Group Corporation’s stockholders’ equity per share of common stock | 5,390.73 | 5,775.63 | ||||||
Net income attributable to Sony Group Corporation’s stockholders (Yen) | ||||||||
— Basic | 836.75 | 711.84 | ||||||
— Diluted | 823.77 | 705.16 | ||||||
Other data: | ||||||||
Cash dividends declared — Interim | 25.00 | 30.00 | ||||||
| (23.91 cents | ) | (26.55 cents | ) | |||||
Cash dividends declared — Fiscal year-end | 30.00 | 35.00 | ||||||
| (27.29 cents | ) | (26.72 cents | ) | |||||
B. | Capitalization and Indebtedness |
Not Applicable
C. | Reasons for the Offer and Use of Proceeds |
Not Applicable
D. | Risk Factors |
This section contains forward-looking statements that are subject to the Cautionary Statement appearing on page 2 of this annual report. Risks to Sony are also discussed elsewhere in this annual report.
- 6 -
The
COVID-19
pandemic has adversely affected, and is expected to continue to adversely affect, Sony’s business operations, operating results and financial condition.Although there has been a resurgence of new strains of
COVID-19,
vaccination is progressing and economic activities are resuming around the world, balanced with anti-infection measures. However, if economic activity stagnates again due to a future increase in infections, it could adversely affect the procurement of components and raw materials, production, development, sale and distribution of Sony’s products and services, resulting in a negative impact on Sony’s operating results and financial position. The timing and extent to which the pandemic further negatively impacts Sony’s business could vary greatly depending on the timing and extent to whichCOVID-19
declines, as well as the state of lockdowns and other measures in various geographic areas around the world, and their impact on macroeconomic conditions. For example, in the Game & Network Services (“G&NS”) segment, there could be a further adverse impact on the production of hardware due to issues in the component supply chain. In the Music segment, new music releases,in-person
concerts and other events, as well as the licensing of music in TV commercials, all of which are in the process of recovering, could be restricted again, causing related revenues to decrease. In the Pictures segment, if movie theaters are once again forced to close or limit their capacity, Sony’s theatrical revenues may decrease. Additionally, depending on the status of lockdowns or other anti-infection measures, as well as future increases in infections, Sony may be impacted by delays in the production schedules of new motion pictures and television programming, as well as decreased advertising revenue. Furthermore, as movie theaters continue to reopen and box office revenues recover, the theatrical release calendar of films by major studios could become crowded, increasing competition for available screen space. This situation could adversely affect revenues in the Pictures segment. The Electronics Products & Solutions (“EP&S”)* segment could continue to be adversely impacted by factory shutdowns and supply chain issues, and by the closure of retail stores globally. For example, in China in May 2021, certain manufacturing sites and suppliers’ manufacturing sites ceased production for a period of time pursuant to local government policy.Sony employees have been working both in the office and at home during the spread of
COVID-19
and are expected to continue doing so for the time being. Although Sony takes measures to ensure that appropriate information security protections are in place for the remote workforce, there can be no guarantee that Sony’s actions, security measures and controls designed to prevent, detect or respond to outside intrusion, limit access to data, prevent loss, destruction, alteration, or exfiltration of business information, or limit the negative impact from such attacks can provide absolute security.The continued impact of
COVID-19
could heighten many of the risks and uncertainties noted below.* The Electronics Products & Solutions (EP&S) segment has been renamed the Entertainment, Technology & Services (ET&S) segment effective from April 2022.
Sony must overcome increasingly intense competition, which could lead to lower revenue or operating margins.
Sony has several business segments in different industries with many product and service categories, which cause it to compete with many existing and new competitors ranging from large multinational companies to highly specialized entities that focus on only one or a few businesses and also, potentially, with outsourced manufacturing service partners that currently supply products to Sony. These competitors may have greater financial, technical, labor and marketing resources available to them than those available to Sony. Sony’s financial condition and operating results depend on its ability to efficiently anticipate and respond to these established and new competitors.
The competitive factors Sony faces vary depending on the nature of the business. For example, in the electronics area, Sony competes on the basis of various factors including price and function, while in the Music and Pictures segments, Sony competes for talent, such as artists, songwriters, actors, directors and producers, and for entertainment content that is created, acquired, licensed and/or distributed. Competition on price can lead to lower margins when costs do not fall at a proportional rate, and competition for talent and appealing product can also lead to lower profitability if the higher costs required for such talent and content cannot be recouped through greater sales. Moreover, even for those products where Sony believes it has a strong competitive advantage, such as image sensors, it is possible that its competitors’ technological capabilities will accelerate such that Sony would be unable to maintain its advantageous market position. In terms of consumer electronics products, to produce products that appeal to changing and increasingly diverse consumer preferences, including growing consumer interest in products that minimize energy consumption and other impacts on climate change, or to overcome the fact that a relatively high percentage of consumers already possess similar products, Sony must develop superior technology, anticipate consumer tastes and rapidly develop attractive and differentiated
- 7 -
products with competitive prices and features. Sony faces increasingly intense pricing pressure from competitors, retailer consolidation, new sales/distribution channels and shorter product cycles in a variety of consumer product categories. In the Music and Pictures segments, operating results can be impacted by worldwide consumer acceptance of their products, which is difficult to predict, by competing products released at or near the same time and by alternative forms of entertainment and leisure activities available to consumers. Additionally, the spread of
COVID-19
starting in the beginning of the 2020 calendar year resulted in lockdowns around the world, which are influencing changes in consumer behavior.If Sony is unable to maintain its advantageous market position in the fields in which it has a technological or other competitive advantage, Sony is unable to effectively anticipate and counter the ongoing price erosion that frequently affects its consumer products or the cost pressures affecting its businesses, there is a change in existing business models or consumer preferences, or the average prices of Sony’s products decrease faster than Sony is able to reduce manufacturing costs, Sony’s operating results and financial condition may be adversely impacted.
To remain competitive and stimulate customer demand, Sony must invest in research and development to achieve product and service innovations and successfully manage frequent introductions of such new products and services.
To strengthen the competitiveness of its products and services, Sony continues to invest in research and development (“R&D”), particularly in growth areas such as the Imaging & Sensing Solutions (“I&SS”) and G&NS segments. However, Sony may not be successful in investing in R&D if it fails to identify products, services and market trends with significant growth potential. In addition, Sony’s investments may not yield the innovation or the expected results quickly enough, or competitors may lead Sony in technological innovation. This may hinder Sony’s ability to commercialize new and competitive products and services.
Sony must continually introduce, enhance and stimulate customer demand for consumer electronic products and network services. Sales of these products and services are particularly sensitive to the significant weighting of consumer demand to the
year-end
holiday season. In the G&NS segment, the successful introduction and penetration of gaming platforms, including streaming, is a significant factor driving sales and profitability, and this success is affected by the ability to provide customers with attractive softwareline-ups
and online services. However, there is no assurance that third-party software developers and publishers, major contributors to this effort, will continue to develop and release software. In addition, Sony believes that integrating its hardware, software, entertainment content and network services and minimizing their energy consumption, as well as investing in R&D to effect such integration, is essential in generating revenue growth and profitability. However, this strategy depends on its ability to further develop network services technologies, coordinate and prioritize strategic and operational issues among Sony’s various business units and sales channels, continually introduce enhanced, energy efficient and competitively priced hardware that is seamlessly connected to energy efficient network platforms with user interfaces that are innovative and attractive to consumers and also standardize technological and interface specifications industry-wide and across Sony’s networked products and business units. In addition, the G&NS, Music and Pictures segments must invest substantial amounts, which may include significant upfront investments, in internally developed software titles, artist advances, motion picture productions, television productions and broadcast programming before knowing whether their products will receive customer acceptance. Furthermore, underperformance of Pictures’ products in the initial distribution market is correlated with weak performance in subsequent distribution markets, which would have an adverse effect on Sony’s results in the year of initial release as well as future years.The successful introductions of, and transitions to, new products and services depend on a number of factors, such as the timely and successful completion of development efforts, market acceptance, planning and executing an effective marketing strategy, managing new product introductions, managing production
ramp-up
issues, the availability of application software for new products, quality control and the concentration of consumer demand in theyear-end
holiday season. If Sony cannot achieve the expected results from its investment in R&D, adequately manage frequent introductions of new products and services and obtain consumer acceptance of its new products and services, or if Sony is not successful in implementing its integration strategy, Sony’s reputation, operating results and financial condition may be adversely impacted.Sony’s strategic initiatives, including acquisitions, joint ventures, investments, capital expenditures and restructurings, may not be successful in achieving their strategic objectives.
Sony actively engages in acquisitions, joint ventures, capital expenditures and other strategic investments to acquire new technologies, efficiently develop new businesses and enhance its business competitiveness. For
- 8 -
example, in September 2020, in order to achieve further growth and strengthen governance within the financial services business with the goal of enhancing the corporate value of the entire Sony Group, Sony acquired all of the common shares and related stock acquisition rights of Sony Financial Group Inc. (“SFGI”) not held by Sony and made SFGI a wholly-owned subsidiary of Sony, spending 396.7 billion yen. In addition, in the fiscal year ended March 31, 2021, Sony invested in Bilibili Inc. (“Bilibili”) and Epic Games, Inc. (“Epic Games”), and acquired minority interests in both companies, with the goal of accelerating business expansion in the area of entertainment. In the fiscal year ended March 31, 2022, Sony acquired 100% of the shares and related assets of certain subsidiaries of Kobalt Music Group Limited (“Kobalt”) including AWAL, Kobalt’s music distribution business mainly for independent recording artists, and Kobalt Neighbouring Rights, Kobalt’s music neighboring rights management business, for consideration of 49.8 billion yen. In addition, in the fiscal year ended March 31, 2022, Sony made an additional strategic investment in Epic Games, acquired 100% of the equity interest in Ellation Holdings, Inc. (“Ellation”), a subsidiary of AT&T Inc. which operated the anime business Crunchyroll, made a minority investment in Japan Advanced Semiconductor Manufacturing Inc. (“JASM”), a subsidiary of Taiwan Semiconductor Manufacturing Company Limited (TSMC), and acquired 100% of the shares and related assets of Som Livre, an independent music label in Brazil.
In some cases, the completion of mergers and acquisitions is subject to certain closing conditions, including regulatory approvals. As a result of anti-trust laws and regulations and anti-trust regulatory authorities becoming stricter, regulatory reviews following the signing of a definitive agreement may take longer than expected, or Sony may fail to obtain regulatory approvals, resulting in the loss of business opportunities and Sony’s inability to realize some or all of the initially expected results of mergers and acquisitions. As of the date of this report, mergers and acquisitions that Sony has already signed definitive agreements for and whose completion is subject to regulatory approvals include Sony Interactive Entertainment’s acquisition of Bungie, Inc. (“Bungie”), an independent videogame developer in the United States, and the merger of Sony Pictures Networks India (“SPNI”) with Zee Entertainment Enterprises Ltd. (“Zee”), a publicly listed Indian media and content company.
While Sony performs a comprehensive analysis and evaluation of merged or acquired organizations prior to their acquisition from various perspectives such as technology, accounting, tax, finance, human resources, and legal, Sony’s financial results may be adversely affected by factors including the significant cost of the acquisition and/or integration expenses, IT and information security risks introduced from newly acquired organizations, failure to achieve initially expected synergies, failure to generate expected revenue and cost improvements, loss of key personnel and assumption of liabilities.
When establishing joint ventures and strategic partnerships, Sony’s financial and operating results may be adversely affected by strategic or cultural differences with partners, conflicts of interest, failure to achieve synergies, additional funding or debt guarantees required to maintain the joint venture or partnership, requirements to buy out a joint venture partner, sell its shares or dissolve a partnership, insufficient management control including control over cash flow, loss of proprietary technology and
know-how,
impairment losses and reputational harm from the actions or activities of a joint venture that uses the Sony brand.Sony invests heavily in production facilities and equipment, including fabrication facilities used to make image sensors for smartphones and other products. Sony may not be able to execute these capital expenditures as planned or recover these capital expenditures in part or full or in the planned timeframe due to the competitive environment, lower-than-expected consumer demand, changes in the financial condition or business decisions of Sony’s major customers, or delays in the procurement of production facilities and equipment. Sony invested 180.0 billion yen and 237.1 billion yen of capital in the fiscal years ended March 31, 2021 and 2022, respectively, mainly for the purpose of increasing image sensor production capacity.
Further, Sony is implementing initiatives for restructuring and transformation to enhance profitability, business autonomy and shareholder value or to clearly position each business within the overall business portfolio. However, the expected benefits of these initiatives, including the expected level of profitability, may not be realized due to internal and external impediments or market conditions worsening beyond expectations. If Sony is not successful in achieving its restructuring and transformation initiatives, Sony’s operating results, financial condition, reputation, competitiveness or profitability may be adversely affected.
Sony’s sales and profitability may be affected by the operating performance of wholesalers, retailers, other resellers and third-party distributors.
Sony is dependent for the distribution of its products on wholesalers, retailers, other resellers and third-party distributors, many of whom also distribute competitors’ products. For example, in some cases, Sony’s smartphones sold through cellular network carriers are subsidized by the carriers. There is no assurance that such subsidies will be continued at all or in the same amounts upon renewal of Sony’s agreements with these carriers
- 9 -
or in agreements Sony enters into with new carriers. In addition, the Pictures segment depends on third parties to theatrically exhibit its motion pictures, and to operate cable, satellite, internet and other distribution systems to distribute its motion pictures and television programming. A decline in the licensing fees received from these third parties may adversely affect the Pictures segment’s sales. The Pictures segment’s worldwide television networks are also distributed on third-party cable, satellite and other distribution systems and the failure to renew, or the renewal on less favorable terms of, television carriage contracts (broadcasting agreements) with these third-party distributors may adversely affect the Pictures segment’s ability to generate advertising and subscription sales through these networks.
Sony invests in programs to incentivize wholesalers, retailers, and other resellers and third-party distributors to position and promote Sony’s products, but there is no assurance that these programs will provide a significant return or incremental revenue by persuading consumers to buy Sony products instead of competitors’ products.
The operating results and financial condition of many wholesalers, retailers, other resellers and third-party distributors have been adversely impacted by competition, especially from online retailers, and weak economic conditions. If their financial condition continues to weaken, they stop distributing Sony’s products, or uncertainty regarding demand for Sony’s products or other factors cause them to reduce their ordering, marketing, subsidizing, or distributing Sony’s products, Sony’s operating results and financial condition may be adversely impacted.
As a global company, Sony is subject to a wide range of laws and regulations and a growing consumer focus on corporate social responsibility in many countries. Those laws and regulations, as well as consumer and regulator focus, might change in significant ways, leading to an increase in the costs of Sony’s operations, a curtailment of Sony’s activities, and/or an adverse effect on Sony’s reputation.
As a global company, Sony is subject to the laws and regulations of many countries throughout the world that affect its business operations in a number of areas, including advertising, promotions, consumer protection, import and export requirements, anti-corruption, anti-trust, environmental protection (including decarbonizing regulations in connection with actions against climate change), data privacy and data protection, content and broadcast regulation, intellectual property, labor, product liability, taxation (including taxes from certain revenue on digital services), foreign investment, government procurement, foreign exchange controls, and economic sanctions.
Compliance with these laws and regulations may be onerous and expensive. These laws and regulations continue to develop and may be inconsistent from jurisdiction to jurisdiction, further increasing the cost of compliance and doing business. Any such developments could occur frequently and without warning and could make Sony’s products or services less attractive to its customers, delay or prohibit introduction of new products or services in one or more regions or cause Sony to change or limit its business practices. For example, imposition of restrictive trade measures in the United States and elsewhere, as well as retaliatory actions against such measures, could result in increased customs duties applicable to Sony’s products or increased costs for procuring parts and components, and could limit or prohibit the sales of Sony’s products and services to certain of its current or potential customers, which may adversely affect Sony’s operating results and financial condition. In the I&SS segment, Sony suspended product shipments of image sensors to a certain Chinese customer from September 15, 2020, pursuant to export restrictions announced by the U.S. government on August 17, 2020. As a result, image sensor sales decreased compared to before the export restrictions came into effect, although Sony resumed a portion of shipments to the customer after receiving a U.S. export license. Sony also recorded inventory write-downs of certain image sensors for the same customer in the fiscal year ended March 31, 2021. In addition, changes in laws or regulations or the judicial interpretation thereof that Sony relies on or Sony is subject to in conducting its operations, including online operations, as well as Sony’s failure to anticipate such changes, may subject Sony to greater risk of liability, increase the costs of compliance, or limit Sony’s ability to engage in or expand certain operations or lead to discontinuance of certain operations.
Violation of applicable laws or regulations by Sony, its employees, third-party suppliers, business partners and agents may subject Sony to monetary fines, penalties, legal judgments, restrictions on business operations and/or reputational damage. Additionally, there is a growing global regulatory and consumer focus on corporate social responsibility and sourcing practices and increasing regulatory obligations of public disclosure regarding these matters. In particular, there is increased attention on labor practices, including work environments at electronic component manufacturers and original design manufacturing/original equipment manufacturing, or ODM/OEM, product manufacturers operating in Asia. Increased regulation or public pressure in this area could cause Sony’s compliance costs to increase, particularly since Sony uses many parts, components and materials to manufacture its products and relies on suppliers to provide these parts, components and materials but does not
- 10 -
directly control the suppliers’ procurement or employment practices. A finding of
non-compliance,
or the perception that Sony has not responded appropriately to growing consumer concern for such issues, whether or not Sony is legally required to do so, may adversely affect Sony’s reputation, operating results and financial condition.Sony must manage its large volume of and widespread procurement from third-party suppliers and business partners to control inventory levels, availability, costs and quality of parts, components, materials, software and network services within volatile markets.
Sony’s products and services rely on a large volume of third-party suppliers and business partners for parts, components, materials, software and network services, including semiconductors, chipsets for PlayStation
®
game consoles and mobile products, LCD (liquid crystal display) panels and the Android OS that is used in mobile products, televisions and services. As a result, external suppliers’ and partners’ supply shortages, fluctuations in pricing, quality issues, discontinued support, changes in business terms or prioritization of customers outside the electronics area or of Sony’s competitors can adversely affect Sony’s operating results, brand and reputation. For example, although Sony continues to strive to secure a necessary supply of semiconductors and other components, the global shortages of semiconductors and other components that became pronounced in the latter half of the fiscal year ended March 31, 2021, continued as of the end of the fiscal year ended March 31, 2022. Additionally, logistical disruptions around the world have led to increasing lead times for procurement and shipping, resulting in an inability to adequately meet market demand for sales of hardware in the G&NS segment and a wide range of products in the EP&S segment. Worsened or prolonged supply shortages may further adversely affect the operating results of the G&NS, EP&S and I&SS segments. Reliance on third-party software and technologies may make it increasingly difficult for Sony to differentiate its products from competitors’ products. Also, shortages or delayed shipments of critical parts or components may result in a reduction or suspension of production at Sony’s or its business partners’ manufacturing sites, particularly where Sony is substantially reliant on one supplier, where there is limited production capacity for custom parts or components, or where there are initial manufacturing capacity constraints for products, parts or components that use new technologies.Sony places orders for parts and components in line with production and inventory plans determined in advance based on its forecast of consumer demand, which is highly volatile and difficult to predict. Inaccurate forecasts of consumer demand or inadequate business planning can lead to a shortage or excess inventory, which can disrupt production plans and result in lost sales opportunities or inventory adjustments, respectively. Sony writes down the value of its inventory when the underlying parts, components or products have become obsolete, when inventory levels exceed the amount expected to be used, or when the value of the inventory is otherwise recorded at a value higher than net realizable value. Such lost sales opportunities, inventory adjustments, or shortages of parts and components have had and may have an adverse impact on Sony’s operating results and financial condition.
Sony’s sales, profitability and operations are sensitive to global and regional economic and political trends and conditions.
Sony’s sales and profitability are sensitive to economic trends in its major markets, such as inflation. In the fiscal year ended March 31, 2022, 27.9%, 27.9% and 18.8% of Sony’s sales and financial services revenue were attributable to Japan, the U.S. and Europe, respectively. These markets may be subject to significant economic downturns, resulting in an adverse impact on Sony’s operating results and financial condition. An actual or expected deterioration of economic conditions in any of Sony’s major markets may result in a decline in consumers’ consumption and adverse impacts on the businesses of commercial customers, resulting in reduced demand for Sony’s products and services.
In addition, Sony’s operations are conducted in many countries and regions around the world, and these international operations, particularly in certain emerging markets, can create challenges. For example, in the EP&S, I&SS and G&NS segments, production and procurement of products, parts and components in China and other Asian countries and regions increase the time necessary to supply products to other markets worldwide, which can make it more difficult to meet changing customer demand in a timely manner. Further, in certain countries and regions, Sony may encounter difficulty in planning and managing operations due to unfavorable political or economic factors, such as armed conflicts, deterioration in foreign relations, changes in trade policies,
non-compliance
with expected business conduct and a lack of adequate infrastructure. If international or domestic political and military instability disrupts Sony’s business operations or those of its business partners Sony’s operating results and financial condition may be adversely affected. For example, as a response to the worsening of the situation in Ukraine and Russia that began in the fiscal year ended March 31, 2022, as of the- 11 -
date of this report, Sony has suspended its business in Russia. If this situation worsens further in the future, it could create global uncertainty, possibly leading to the worsening of Sony’s businesses in other regions or a deterioration in global economic conditions resulting in an adverse impact on Sony’s operating results and financial condition.
Foreign exchange rate fluctuations can affect Sony’s operating results and financial condition.
Sony’s operating results and financial condition are sensitive to foreign exchange rate fluctuations because many of Sony’s products are sold in countries other than the ones in which they were developed and/or manufactured. For example, within Sony’s electronics area, R&D and headquarters’ overhead costs are incurred mainly in yen, and manufacturing costs, including material costs, costs of procurement of parts and components, and costs of outsourced manufacturing services, are incurred mainly in U.S. dollars and yen. Sales are recorded in yen, U.S. dollars, euros, Chinese renminbi, and local currencies of other areas, including emerging markets. Consequently, foreign exchange rate fluctuations have had and may have an adverse impact on Sony’s operating results, especially when the yen or the euro weaken significantly against the U.S. dollar, when the yen strengthens significantly against the euro, or when the U.S. dollar strengthens against emerging market currencies. Sony’s operating results may also be adversely impacted by foreign exchange rate fluctuations since Sony’s consolidated statements of income are prepared by translating the local currency denominated operating results of its subsidiaries around the world into yen. Furthermore, as Sony’s businesses have expanded in China and other areas, including emerging markets, the impact of fluctuations of foreign currency exchange rates in these areas against the U.S. dollar and yen has increased.
Mid-
to long-term changes in exchange rate levels may interfere with Sony’s global allocation of resources and hinder Sony’s ability to engage in R&D, procurement, production, logistics, and sales activities while maintaining profitability.Although Sony seeks to reduce its exposure to foreign exchange risk by hedging a portion of its net short-term foreign currency exposure shortly before the transactions occur, such hedging activity may not offset, or may offset only a portion of, the adverse financial effects of unfavorable movements in foreign exchange rates over the limited time the hedges are in place.
Moreover, since Sony’s consolidated statements of financial position are prepared by translating the local currency denominated assets and liabilities of its subsidiaries around the world into yen, Sony’s equity capital may be adversely impacted when the yen strengthens significantly against the U.S. dollar, the euro and/or other foreign currencies.
Ratings downgrades or significant volatility and disruption in the global financial markets may adversely affect the availability and cost of Sony’s funding.
Sony’s credit ratings may be adversely impacted by unfavorable operating results and a decline in its financial condition. Any credit rating downgrades may, in turn, result in an increase in Sony’s cost of funding and may have an adverse impact on Sony’s ability to access commercial paper or
mid-
to long-term debt markets on acceptable terms.Additionally, global financial markets may experience significant levels of volatility and disruption, generally putting downward pressure on financial and other asset prices and impacting credit availability. Historically, Sony’s primary sources of funds have been cash flows from operations, the issuance of commercial paper and other debt securities, such as term debt, as well as borrowings from banks and other institutional lenders. There can be no assurance that such sources will continue to be available on acceptable terms or be sufficient to meet Sony’s needs.
As a result, Sony may seek other sources of financing to fund operations, such as the draw-down of funds from contractually committed lines of credit from financial institutions or the sale of assets, in order to repay commercial paper and
mid-
to long-term debt as they become due, and to meet other operational and liquidity needs. However, such funding sources may also not be available at acceptable terms or be sufficient to meet Sony’s requirements. As a result, Sony’s operating results, financial condition and liquidity may be adversely affected.Sony’s success depends on the ability to recruit, retain and maintain productive relations with diverse people who embrace a challenging spirit and possess the ambition to grow.
In order to continue to create content, develop services, design, manufacture, market, and sell products, in increasingly competitive markets, Sony must attract, retain and maintain productive relations with key personnel,
- 12 -
both internally and externally, who possess high levels of expertise and broad experience, including its executive team, other management professionals, creative talent, and hardware and software engineers. However, such key personnel are in high demand. In addition, business divestitures, restructuring or other transformation initiatives may lead to an unintended loss of experienced human resources or
know-how.
Actual or threatened work slowdowns or stoppages related to unionized workers, particularly in the entertainment field, could lead to delayed releases or cost increases. If these incidents occur or if Sony is unable to attract, retain and maintain productive relations with employees with high levels of expertise and broad experience as well as key management professionals, Sony’s operating results and financial condition may be adversely affected.Sony’s intellectual property might be subject to unauthorized use or theft and it might encounter restrictions in its use of intellectual property owned by third parties.
Sony’s intellectual property might be subject to unauthorized use or theft. For example, digital technology, the availability of digital media, and global internet penetration impact Sony’s ability to protect its copyrighted content from unauthorized duplication, digital theft and counterfeiting, putting pressure on legitimate product sales. Sony has incurred and will continue to incur expenses to help protect its intellectual property rights; however, Sony’s various initiatives to prevent such unauthorized use or theft of intellectual property might not achieve their intended result, which could adversely affect Sony’s competitive position and the value of its investment in R&D. Additionally, Sony’s intellectual property rights may be challenged or invalidated, or such intellectual property rights may not be sufficient to provide Sony with competitive advantages.
Many of Sony’s products and services are designed under the license of patents and other intellectual property rights owned by third parties. Based upon past experience and industry practice, Sony believes it will be able to obtain or renew licenses relating to various intellectual property rights that its business needs in the future; however, such licenses may not be available at all or on acceptable terms, and as a consequence Sony may need to redesign or discontinue its marketing, selling or distribution of such products or services.
Claims have been and may be asserted against Sony that its products or services, including third-party parts, components, software and network services used in Sony’s products or services, infringe the intellectual property rights of other parties. Such claims may be asserted by competitors or by other rights holders, particularly as products and services evolve to include new technologies and enhanced functionality. Such claims might require Sony to enter into settlement or license agreements, pay significant damage awards, face an injunction or refrain from marketing, selling or distributing certain of its products and services.
The failure to prevent unauthorized use or theft of Sony’s intellectual property rights, the failure to enter into licenses for necessary third-party intellectual property rights, the invalidation of Sony’s intellectual property rights or the settlement of an infringement claim against Sony by others may adversely impact Sony’s reputation, operating results and financial condition.
Changes in consumer behavior resulting from new technologies and distribution platforms, as well as increasing concentration of digital music distributors and creation of content by distributors themselves, may adversely affect operating results in the Music and Pictures segments.
Technology, particularly digital technology, used in the Music and Pictures segments continues to evolve, rapidly leading to alternative methods and platforms for the discovery and consumption of digital content. These technological advancements have changed consumer behavior and empowered consumers to seek more control over when, where and how they consume digital content.
The prevalence of digital streaming networks and other new media may negatively impact traditional television and
in-theater
motion picture viewership, which could adversely affect operating results of the Pictures segment.Furthermore, as more music and video content is consumed over digital streaming networks, digital music distributors are becoming increasingly concentrated, which may decrease the competitiveness of Sony’s music content and adversely affect its pricing. In addition, digital music and video distributors may increase the amount of content they create for their own services, which may reduce the demand for content created or produced by Sony. If Sony is unable to adequately respond to these changes or fails to effectively adapt to new market changes, Sony’s operating results and financial condition may be adversely impacted.
- 13 -
Changes in the regulation and performance of financial markets may adversely affect the operating results and financial condition of the Financial Services segment.
The Financial Services segment operates in industries subject to comprehensive regulation and supervision, including the Japanese insurance and banking industries. Future developments or changes in laws, regulations or policies may lead to increased compliance costs or limitations on operations in the Financial Services segment. In addition, Sony Group Corporation’s ability to receive funds from its wholly-owned subsidiary SFGI in the form of financial support or loans is restricted by guidelines issued by regulatory agencies in Japan.
Changes in interest rates, foreign exchange rates and the value of Japanese government and corporate bonds, U.S. treasury bonds, equities, real estate and other asset classes may have an adverse effect on the operating results and financial condition of the Financial Services segment. For example, the life insurance business has invested most of its general account assets in ultra-long-term Japanese government and corporate bonds, as well as ultra-long-term U.S. treasury bonds, to match the liability characteristics of the long-term maturity insurance policies it has underwritten. The life insurance business has guaranteed yields on outstanding policies while its investment portfolio could be reduced by the market changes discussed above. The banking business has invested most of its total loan balance, or over half of its total assets, in its mortgage loans account. An increase in
non-performing
loans or a decline in prices of the real estate collateral from the market changes discussed above or deterioration of credit quality may have an adverse effect on operating results and financial condition through an increase in the allowance for credit losses.The market changes discussed above, Sony’s management of these changes or the occurrence of earthquakes, pandemic disease or other catastrophic events in Japan could expose the life and
non-life
insurance businesses to increasing costs or adverse impact on their ability to meet policy commitments.The insurance businesses’ policy reserves and deferred insurance acquisition costs are calculated based on many actuarial assumptions that are uncertain. Significant differences between these actuarial assumptions and actual situations may result in additional policy reserves being recorded and the accelerated amortization of deferred acquisition costs, through the changes of calculation assumptions. In particular, the insurance businesses calculate policy reserves and deferred insurance acquisition costs based on the actuarial assumptions, assuming the future schedule of insurance premium revenue, yield of investments, claims to be paid for occurrence of insured events and other factors. The review of these actuarial assumptions is required at least once in each fiscal year.
Sony’s facilities and operations are subject to damage and disruption as a result of catastrophic disasters, outages or similar events that could lead to supply chain, manufacturing and other business disruptions and have an adverse impact on Sony’s operating results.
Sony’s headquarters and many of Sony’s most advanced manufacturing facilities, including those for image sensors, are located in Japan, where the risk of earthquakes is relatively high. A major earthquake in Japan, especially in Tokyo, the Tokai area or the Kyushu and Tohoku areas, where Sony headquarters, certain consumer electronics product manufacturing sites and image sensor manufacturing sites, respectively, are located, could cause substantial damage to Sony’s business operations, including damage to buildings, machinery, equipment and inventories, and the interruption of production at manufacturing facilities. For example, the earthquake of April 14, 2016 and subsequent earthquakes in the Kumamoto region in Japan caused damage to an image sensor manufacturing site in Kyushu, which interrupted production at the site.
In addition, offices and facilities used by Sony, its suppliers, service providers and business partners, including those used for network, telecommunications and information systems infrastructure, R&D, material procurement, manufacturing, motion picture and television production, logistics, sales, and online and other services are located throughout the world and are subject to possible destruction, temporary stoppage or disruption as a result of unexpected catastrophic events such as natural disasters, pandemic diseases, terrorist attacks, armed conflicts, large-scale power outages and large-scale fires. If any of these facilities or offices were to experience a significant loss as a result of any of the above events, it may disrupt Sony’s operations, delay design, development or production, interrupt shipments and postpone the recording of sales, and/or result in large expenses to repair or replace these facilities or offices. For example, starting in the beginning of the 2020 calendar year, production delays for a portion of Sony’s products occurred due to temporary shutdowns and reduced operations at
in-house
manufacturing plants, factories to which Sony outsources and at Sony’s third-party suppliers, as a result of the spread ofCOVID-19.
Sony may also be exposed to price increases for raw materials, parts and components, and lower demand from commercial customers. These situations may have an adverse impact on Sony’s operating results and financial condition. In addition, extreme weather conditions may- 14 -
become more severe and frequent as the temperature rises due to the effects of climate change, and such extreme weather conditions could heighten the risks and uncertainties noted above.
Sony’s brand image, reputation and business may be harmed and Sony may be subject to legal claims if there is a breach or other compromise of Sony’s information security or that of its third-party service providers or business partners.
Sony, its third-party service providers, suppliers and other business partners make extensive use of information technology to support business operations, and to provide network and online services to customers. These operations and services, as well as Sony’s business information, may be intentionally or inadvertently compromised by malicious third parties, including state-sponsored organizations, criminal organizations, Sony employees, third-party service providers or other business partners. Such organizations or individuals may use a variety and combination of techniques, such as installing malicious software, exploiting vulnerabilities in information technology, using social engineering to mislead employees and business partners into disclosing passwords and sensitive information, and coordinating distributedattacks to render services unavailable. As cyber-attacks become increasingly sophisticated and automated, and as tools and resources become more readily available, there can be no guarantee that Sony’s actions, security measures and controls designed to prevent, detect or respond to outside intrusion, limit access to data, prevent loss, destruction, alteration, or exfiltration of business information, or limit the negative impact from such attacks can provide absolute security. As a result, Sony’s business information, including personally identifiable information, may be lost, destroyed, disclosed, misappropriated, altered, or accessed without consent, and Sony’s information technology systems or operations, or those of its service providers or other business partners, may be disrupted. Malicious adversaries may also use unauthorized access to Sony’s networks as a platform to compromise Sony’s third-party business partners without Sony’s knowledge. Sony has previously been the subject of sophisticated and targeted attacks. For example, in the fiscal year ended March 31, 2015, the Pictures segment was subject to a cyber-attack that resulted in unauthorized access to, and theft and disclosure of, Sony business information, including employee information and other information, and the destruction of data. Additionally, Sony’s network services, online game businesses and websites have been subject to cyber-attacks by groups and individuals with a range of motives and expertise, resulting in unauthorized access, denial of service, and the theft and/or disclosure of customer information.
denial-of-service
Any of the above incidents can result in significant remediation costs. In addition, a disruption to Sony’s network and online services, information technology, or other compromise of its information security may have serious consequences to its business and operations, including lost revenues, damage to relationships with business partners and other third parties, disclosure, alteration, destruction or use of proprietary information and the failure to retain or attract customers. Moreover, such disruptions and breaches may result in a diversion of management’s attention and resources. Further, it may result in adverse media coverage, which may harm Sony’s brand image and reputation. Sony may also be subject to legal claims or legal proceedings, including regulatory investigations and actions. Sony’s cyber insurance may not cover all expenses and losses and, accordingly, such breaches or other compromises of Sony’s information security or that of its third-party service providers or business partners may have an adverse impact on Sony’s operating results and financial condition.
Sony’s business may suffer as a result of adverse outcomes of litigation and regulatory actions.
Sony faces the risk of litigation and regulatory actions in different countries in connection with its operations. Legal proceedings, including regulatory actions, may seek to recover very large indeterminate amounts or to limit Sony’s operations, and the possibility that they may arise and their magnitude may remain unknown for substantial periods of time. For example, legal proceedings, including regulatory actions, may result from antitrust scrutiny of market practices for anti-competitive conduct. A substantial legal liability or adverse regulatory outcome and the substantial cost to defend the litigation or regulatory actions may have an adverse effect on Sony’s reputation, operating results and financial condition.
Sony is subject to financial and reputational risks due to product quality, product security, and liability issues.
Sony’s products and services, such as consumer electronics products,
non-consumer
products, parts and components, semiconductors, software and network services are becoming increasingly sophisticated and complicated as rapid advancements in technologies occur and as demand increases for mobile products and online services. Also, many Sony products are connected to the internet, and regularly communicate with services provided by Sony or third parties.- 15 -
Sony’s efforts to adapt to rapid advancements in technologies and increased demand for mobile products and online services, while also maintaining product quality and product security, may not be successful and may increase exposure to product liability. As a result, Sony may incur both reputational damages and expenses in connection with, for example, product recalls and after-sales services. In addition, Sony may not be successful in introducing after-sales upgrades, enhancements or new features to existing products and services, or in enabling existing products and services to continue to conveniently and effectively integrate with other technologies and online services. Moreover, cyber-attacks targeting internet-connected products have increased significantly. For example, customer information and Sony or third-party technical information may be misappropriated, the functionality of Sony’s products and services may be impaired, or Sony products may be used inattacks. There can be no guarantee that Sony’s security measures will prevent products from being compromised.
denial-of-service
As a result, the quality of Sony’s existing products and services may not remain satisfactory to consumers and become less marketable, less competitive or obsolete, and Sony’s reputation, operating results and financial condition may be adversely affected. Moreover, allegations of security vulnerability, health and safety issues related to Sony products, or lawsuits related to product quality, health issues arising from products or product safety, regardless of merit, may adversely impact Sony’s operating results and financial condition, either directly or as a result of the impact on Sony’s brand image and reputation as a producer of high-quality products and services. These issues are relevant to Sony products sold directly to customers, whether manufactured by Sony or a third party, and also to products of other companies that are equipped with Sony’s components, such as semiconductors.
Sony’s financial results and condition may be adversely affected by its employee benefit obligations.
Sony recognizes a net defined benefit liability or asset for its defined benefit pension plans based on (i) the present value of defined benefit obligations (“DBO”) under each pension plan less (ii) the fair value of plan assets, in accordance with the accounting guidance for defined benefit plans. If the fair value of plan assets is in excess of the present value of DBO, the amount of any asset to be recognized is limited to the present value of any economic benefits available in the form of refunds from the plan or reductions in the future contributions to the plan. Any decrease in the fair value of plan assets or increases in the present value of DBO due to a lower discount rate and changes in certain other actuarial assumptions may increase or decrease the net defined benefit liability or asset and may have an adverse effect on Sony’s financial results and condition.
Also, Sony’s financial results and condition could be adversely affected by future pension funding requirements pursuant to the Japanese Defined Benefit Corporate Pension Plan Act (“Act”). Under the Act, Sony is required to conduct a periodic actuarial revaluation and to ascertain whether certain financial criteria have been met after the annual accounting closing. In the event that the fair value of plan assets falls below the actuarial reserve required by law and the shortfall may not be recovered within a certain moratorium period permitted by laws and/or special legislative decree, Sony may be required to make an additional contribution to its plans, which may reduce cash flows. Similarly, if Sony is required to make an additional contribution to a foreign plan to meet any funding requirements in accordance with local laws and regulations in each country, Sony’s cash flows might be adversely affected. If Sony is required to increase cash contributions to its pension plans when actuarial assumptions, such as an expected long-term rate of return of the plan assets, are updated for purposes of determining statutory contributions, it may have an adverse impact on Sony’s cash flows.
Further losses in jurisdictions where Sony has assessed deferred tax assets as unrecognized, the inability of Sony to fully utilize its deferred tax assets, limitations on the use of its deferred tax assets under local law, exposure to additional tax liabilities or changes in Sony’s tax rates could adversely affect Sony’s operating results and financial condition.
Sony is subject to income taxes in Japan and numerous other jurisdictions, and in the ordinary course of its business there are many situations where the ultimate tax determination can be uncertain, because of the transfer pricing for its intercompany transactions, and because Sony is subject to continuous review by tax authorities of numerous jurisdictions. The calculation of Sony’s tax provision and the carrying value of tax assets, including net operating loss carryforwards and tax credit carryforwards, require significant judgment and the use of estimates, including estimates of future taxable income. At the end of each reporting period, Sony reassesses unrecognized deferred tax assets and determines whether these assets should be recognized. As of March 31, 2022, the unrecognized deferred tax assets amounted to 240.8 billion yen. An increase in unrecognized deferred tax assets may have an adverse impact on Sony’s operating results and financial condition.
- 16 -
Deferred tax assets are evaluated on a jurisdiction by jurisdiction basis. As of March 31, 2022, Sony and/or its subsidiaries had unrecognized deferred tax assets, principally in Japan for local taxes. Additionally, deferred tax assets could expire unused or otherwise not be realizable for a variety of reasons including the lack of sufficient taxable income in the appropriate jurisdiction. Sony’s operating results and financial condition could be adversely affected when the deferred tax assets expire unused.
In some jurisdictions, the use of net operating loss carryforwards or tax credits to reduce taxable income in a subsequent period is limited to a fixed percentage of taxable income or may only be used to offset taxes on income from certain sources. Thus, it is possible that even with significant net operating loss carryforwards or tax credits, Sony could record and pay taxes in a jurisdiction where it has taxable income.
In addition to the above, Sony’s future effective tax rates may be unfavorably affected by changes in both the statutory rates and the mix of earnings in countries with differing statutory rates or by other factors such as changes in tax laws and regulations or their interpretation, including minimum tax requirements and limitations or restrictions on various tax deductions and credits, including deductions for royalties and interest.
Sony could incur asset impairment losses for goodwill, intangible assets or other
non-current
assets.Sony has a significant amount of goodwill, intangible assets and other
non-current
assets, including production facilities and equipment. A decline in financial performance, market capitalization, reduced estimates of future cash flows, changes in global economic conditions or changes in estimates and assumptions used in the impairment analysis, which in many cases requires significant judgment, could result in impairment losses against these assets. Events or changes in circumstances which would indicate impairment include unfavorable variances from or adjustments to established business plans, significant changes in forecasted results or volatility inherent to external markets and industries. The increased levels of global competition and the faster pace of technological change to which Sony is exposed can result in greater volatility of these estimates, assumptions and judgments, and increase the likelihood of impairment losses. Any such loss may adversely affect Sony’s operating results and financial condition.Holders of American Depositary Shares have fewer rights than shareholders and may not be able to enforce judgments based on U.S. securities laws.
The rights of shareholders under Japanese law to take actions, including voting their shares, receiving dividends and distributions, bringing derivative actions, examining Sony’s accounting books and records, and exercising appraisal rights, are available only to shareholders of record. Because the depositary, through its custodian agents, is the record holder of the shares underlying the American Depositary Shares (“ADSs”), only the depositary can exercise those rights in connection with the deposited shares. The depositary will make efforts to vote the shares underlying ADSs in accordance with the instructions of ADS holders and will pay the dividends and distributions collected from Sony. However, ADS holders will not be able to bring a derivative action, examine Sony’s accounting books and records, or exercise appraisal rights through the depositary.
Sony Group Corporation is incorporated in Japan with limited liability. A majority of Sony’s directors and corporate executive officers are
non-U.S.
residents, and a substantial portion of the assets of Sony Group Corporation and the assets of Sony’s directors and corporate executive officers are located outside the U.S. As a result, it may be more difficult for investors to enforce against Sony Group Corporation or such persons, judgments obtained in U.S. courts predicated upon civil liability provisions of the federal and state securities laws of the U.S. or similar judgments obtained in other courts outside Japan. There is doubt as to the enforceability in Japanese courts, in original actions or in actions for enforcement of judgments of U.S. courts, of civil liabilities predicated solely upon the federal and state securities laws of the U.S.Prior notification under the Foreign Exchange and Foreign Trade Act of Japan may be required in the case of an acquisition by a foreign investor of a certain portion of our shares.
Because Sony is engaged in certain businesses designated by the Foreign Exchange and Foreign Trade Act of Japan (the “FEFTA”) and its related cabinet orders and ministerial ordinances (collectively, the “Foreign Exchange Regulations”), if a foreign investor intends to consummate an acquisition of shares of common stock of Sony Group Corporation and that acquisition constitutes an “inward direct investment” under the Foreign Exchange Regulations, the foreign investor, subject to certain exemptions, must file a prior notification of such inward direct investment with the Minister of Finance and any other competent Ministers. Under the Foreign Exchange Regulations, an “inward direct investment” includes an acquisition by a foreign investor of shares of common stock of Sony Group Corporation, the consummation of which results in such foreign investor, in
- 17 -
combination with any existing shareholding, directly or indirectly holding 1% or more of the total number of issued shares of common stock or the total number of voting rights of Sony Group Corporation, unless certain exemptions apply.
If such prior notification is filed, the proposed acquisition may not be consummated until the prescribed screening period expires. In some cases, the Ministers may extend the screening period, and may recommend or order any modification or the abandonment of such acquisition. In addition, if certain conditions – including those prescribed in light of the national security of Japan – under the Foreign Exchange Regulations are met, the Ministers may order the foreign investor to divest the shares acquired or take other measures. Consequently, any proposed acquisition by a foreign investor of shares of common stock of Sony Group Corporation that constitutes an “inward direct investment” may not be consummated in an expected time frame in accordance with an intended plan, or at all.
Additionally, if a foreign investor directly or indirectly holds 1% or more of the total voting rights of Sony Group Corporation and, at a general meeting of shareholders, consents to certain proposals having a material influence on the management of Sony Group Corporation such as the (i) election of such foreign investor or any of its related persons (as defined in the Foreign Exchange Regulations) as a director of Sony Group Corporation or (ii) transfer or discontinuation of its business, such consent, subject to certain exemptions, also constitutes an “inward direct investment” requiring prior notification. If such prior notification is filed, such consent cannot be given until the prescribed screening period expires. As a result, such foreign investors may have difficulties giving such consent in accordance with an intended plan, or at all.
The discussion above is not exhaustive of all possible foreign exchange controls considerations that may apply to a particular investor, and potential investors are advised to satisfy themselves as to the overall foreign exchange controls consequences of the acquisition, ownership and disposition of shares of common stock or voting rights of Sony Group Corporation by consulting their own advisors. For a more detailed discussion on the requirements and procedures regarding the prior notifications under the Foreign Exchange Regulations, refer to “D. Exchange Controls” in “Item 10..”
Additional Information
Item 4. | Information on the Company |
A. | History and Development of the Company |
Sony Group Corporation was established in Japan in May 1946 as Tokyo Tsushin Kogyo Kabushiki Kaisha, a joint stock company () under Japanese law. It changed its name to Sony Kabushiki Kaisha (“Sony Corporation” in English) in January 1958, and changed its name again to Sony Group Kabushiki Kaisha (“Sony Group Corporation” in English) in April 2021 in order to focus on its role as the headquarters of the Sony Group.
Kabushiki Kaisha
In December 1958, Sony Group Corporation was listed on the Tokyo Stock Exchange (the “TSE”). In June 1961, Sony Group Corporation issued American Depositary Receipts in the U.S.
In March 1968, Sony Group Corporation established CBS/Sony Records Inc. in Japan, as a
50-50
joint venture company between Sony Group Corporation and CBS Inc. in the U.S. In January 1988, the joint venture became a wholly-owned subsidiary of Sony Group Corporation, and in April 1991, changed its name to Sony Music Entertainment (Japan) Inc. (“SMEJ”). In November 1991, SMEJ was listed on the Second Section of the TSE.In September 1970, Sony Group Corporation was listed on the New York Stock Exchange (the “NYSE”).
In August 1979, Sony Group Corporation established Sony Prudential Life Insurance Co., Ltd. in Japan, as a
50-50
joint venture company between Sony Group Corporation and The Prudential Insurance Company of America. In April 1991, the joint venture changed its name to Sony Life Insurance Co., Ltd. (“Sony Life”). In March 1996, Sony Life became a wholly-owned subsidiary of Sony Group Corporation.In July 1984, Sony Magnescale Inc., a subsidiary of Sony Group Corporation, was listed on the Second Section of the TSE. The subsidiary changed its name to Sony Precision Technology Inc. in October 1996 and then to Sony Manufacturing Systems Corporation in April 2004. In April 2012, Sony Manufacturing Systems was merged into Sony EMCS Corporation. Sony EMCS Corporation changed its name to Sony Global Manufacturing & Operations Corporation in April 2016.
In July 1987, Sony Chemicals Corporation, a subsidiary of Sony Group Corporation, was listed on the Second Section of the TSE. The subsidiary changed its name to Sony Chemical & Information Device Corporation in July 2006, and changed its name again to Dexerials Corporation in October 2012.
- 18 -
In January 1988, Sony Group Corporation acquired CBS Records Inc., the music business division of CBS Inc. in the U.S. The acquired company changed its name to Sony Music Entertainment Inc. in January 1991 and then to Sony Music Holdings Inc. in December 2008.
In November 1989, Sony Group Corporation acquired Columbia Pictures Entertainment, Inc. in the U.S. In August 1991, Columbia Pictures Entertainment, Inc. changed its name to Sony Pictures Entertainment Inc. (“SPE”).
In November 1993, Sony Group Corporation established Sony Computer Entertainment Inc. in Japan. Sony Computer Entertainment Inc. changed its name to Sony Interactive Entertainment Inc. in April 2016.
In October 1995, Sony/ATV Music Publishing LLC (“Sony/ATV”) was formed as a
50-50
joint venture company between Sony Group Corporation and Michael Jackson. In September 2016, the joint venture became a wholly-owned subsidiary of Sony Group Corporation. In January 2021, Sony/ATV Music Publishing LLC changed its name to Sony Music Publishing (US) LLC.In January 2000, acquisition transactions by way of a share exchange were completed such that three subsidiaries which had been listed on the TSE — SMEJ, Sony Chemicals Corporation (currently Dexerials Corporation), and Sony Precision Technology Inc. (which was merged into Sony EMCS Corporation) — became wholly-owned subsidiaries of Sony Group Corporation. In September 2012, Sony Group Corporation completed the sale of certain of its chemical products businesses, including Sony Chemical & Information Device Corporation (currently Dexerials Corporation) to Development Bank of Japan Inc.
In October 2001, Sony Ericsson Mobile Communications AB (“Sony Ericsson”), a
50-50
joint venture company between Sony Group Corporation and Telefonaktiebolaget LM Ericsson (“Ericsson”) of Sweden, was established. In February 2012, Sony acquired Ericsson’s 50% equity interest in Sony Ericsson. As a result of the acquisition, Sony Ericsson became a wholly-owned subsidiary of Sony and changed its name to Sony Mobile Communications AB.In October 2002, Aiwa Co., Ltd. (“Aiwa”), then a
TSE-listed
subsidiary, became a wholly-owned subsidiary of Sony Group Corporation. In December 2002, Aiwa was merged into Sony Group Corporation.In June 2003, Sony Group Corporation adopted the “Company with Three Committees” corporate governance system in line with the revised Japanese Commercial Code then effective. (Refer to “Board Practices” in “Item 6.”)
Directors, Senior Management and Employees.
In April 2004, Sony Group Corporation established Sony Financial Holdings, Inc. (“SFH”), a financial holding company, in Japan. Sony Life, Sony Assurance Inc. (“Sony Assurance”), and Sony Bank Inc. (“Sony Bank”) became subsidiaries of SFH. In October 2007, SFH was listed on the First Section of the TSE in conjunction with the global initial public offering of shares of SFH by Sony Group Corporation and SFH. In September 2020, SFH became a wholly-owned subsidiary of Sony Group Corporation through Sony’s tender offer for the common shares and the related stock acquisition rights of SFH and the subsequent procedures for the purchase of all of SFH’s remaining common shares. In October 2021, SFH changed its company name to Sony Financial Group Inc. (SFGI).
In April 2004,
S-LCD
Corporation(“S-LCD”),
a joint venture between Sony Group Corporation and Samsung Electronics Co., Ltd. of Korea for the manufacture of amorphous thin film transistor LCD (liquid crystal display) panels, was established in Korea. Sony’s stake inS-LCD
was 50% minus 1 share. In January 2012, Sony sold all of its shares ofS-LCD
to Samsung Electronics Co., Ltd.In August 2004, Sony combined its worldwide recorded music business, excluding its recorded music business in Japan, with the worldwide recorded music business of Bertelsmann AG (“Bertelsmann”), forming a
50-50
joint venture, SONY BMG MUSIC ENTERTAINMENT (“SONY BMG”). In October 2008, Sony acquired Bertelsmann’s 50% equity interest in SONY BMG. As a result of the acquisition, SONY BMG became a wholly-owned subsidiary of Sony. In January 2009, SONY BMG changed its name to Sony Music Entertainment (“SME”).In December 2005, Sony Communication Network Corporation, a subsidiary of Sony Group Corporation, was listed on the Mother’s market of the TSE, and was later listed on the First Section of the TSE in January 2008. Sony Communication Network Corporation was renamed
So-net
Corporation(“So-net”)
in July 2013. In January 2013, Sony Group Corporation acquired all of the common shares ofSo-net
through a tender offer and subsequent share exchange and, as a result of the acquisition,So-net
became a wholly-owned subsidiary of Sony Group Corporation.So-net
was renamed Sony Network Communications Inc. (“SNC”) in July 2016.- 19 -
In June 2012, an investor group including Sony Corporation of America (“SCA”) established DH Publishing, L.P. (“EMI”) to own and manage EMI Music Publishing, which it then acquired. This acquisition resulted in Nile Acquisition LLC (“Nile”), of which SCA owned 74.9% and the Estate of Michael Jackson (the “Estate”) owned 25.1%, acquiring approximately 40% of the equity interest in EMI. In July 2018, Sony completed the acquisition of the Estate’s equity interest in Nile, resulting in Sony owning approximately 40% of the equity interest in EMI. In November 2018, Sony completed the acquisition of the remaining approximately 60% equity interest in EMI, resulting in EMI becoming a wholly-owned subsidiary of Sony. In January 2021, Nile changed its name to Sony Music Publishing LLC (“SMP”). SMP encompasses both the former Sony/ATV and EMI.
In April 2013, Sony Olympus Medical Solutions Inc. (“SOMED”), a medical business venture between Sony Group Corporation and Olympus Corporation was established in Japan. Sony’s stake in SOMED is 51%.
In July 2014, Sony Group Corporation sold its personal computer (“PC”) business operated under the VAIO brand to Japan Industrial Partners, Inc.
In July 2014, pursuant to a separation of Sony’s businesses into distinct subsidiaries, the television business was split out and began operations as Sony Visual Products Inc. (“SVP”).
In October 2015, the video and sound business was split out and began operations as Sony Video & Sound Products Inc. (“SVS”).
In April 2016, the imaging and sensing solutions business was split out and began operations as Sony Semiconductor Solutions Corporation (“SSS”).
In April 2017, the imaging products and solutions business was split out and began operations as Sony Imaging Products & Solutions Inc. (“SIPS”), which completed the sequential separation of Sony’s business units into distinct subsidiaries.
In September 2017, Sony transferred its battery businesses to the Murata Manufacturing Co., Ltd. Group.
In April 2019, SVP and SVS merged to become Sony Home Entertainment & Sound Products Inc. (“SHES”).
In April 2020, Sony established Sony Electronics Corporation, an intermediate holding company encompassing the electronics products and solutions businesses.
In April 2021, in connection with the above-mentioned launch of Sony Group Corporation, Sony Electronics Corporation, SHES, SIPS and Sony Mobile Communications Inc. (“SOMC”) were merged into one company, which was renamed Sony Corporation. Additionally, certain support functions for the electronics products and solutions businesses and the imaging products and solutions business that had been carried out by Sony Group Corporation were transferred to Sony Corporation and SSS.
In April 2022, due to a restructuring of the segments of the TSE, Sony Group Corporation moved from the First Section to the Prime Market of the TSE.
Sony Group Corporation’s registered office is located atIts website is
7-1,
Konan1-chome,
Minato-ku,
Tokyo108-0075,
Japan, telephone+81-3-6748-2111.
https://www.sony.com/en/
.The agent in the U.S. for purposes of this Item 4 is Sony Corporation of America, 25 Madison Avenue, 26
th
Floor, New York, NY 10010-8601 (Attn: Office of the General Counsel).Sony files reports and other information with the SEC pursuant to the SEC’s rules and regulations that apply to foreign private issuers. The SEC maintains a website that contains reports, proxy and information statements, and other information regarding issuers that file electronically with the SEC. Sony’s electronic filings are available for viewing on this website, at
https://www.sec.gov
.Principal Capital Investments
In the fiscal years ended March 31, 2021 and 2022, Sony’s capital
expenditures
were 542.4 billion yen and 697.2 billion yen, respectively. For a breakdown of principal capital expenditures and divestitures (including interests in other companies), refer to “Item 5.Operating and Financial Review and Prospects.
” The funding requirements of such various capital expenditures are expected to be financed by cash provided principally by operating and financing activities or the existing balance of cash and cash equivalents.- 20 -
In the fiscal year ended March 31, 2022, Sony invested approximately 255.8 billion yen in the I&SS segment. This investment included approximately 237.1 billion yen to increase image sensor production capacity.
B. | Business Overview |
Due to organizational changes as of April 1, 2021, from the first quarter of the fiscal year ended March 31, 2022, Sony transferred some of the businesses and functions previously included within All Other and Corporate and elimination to the EP&S segment. In connection with these organizational changes, sales and operating income (loss) of each segment for the fiscal year ended March 31, 2021 are presented to conform to the organizational structure for the fiscal year ended March 31, 2022.
Sony is engaged in the development, design, production, manufacture and sale of various kinds of electronic equipment, instruments and components for consumer, professional and industrial markets such as network services, game hardware and software, televisions, audio and video recorders and players, still and video cameras, mobile phones, and image sensors. Sony is engaged in the development, production, manufacture, and distribution of recorded music and the management and licensing of the words and music of songs as well as the production and distribution of animation titles, including game applications based on animation titles. Sony is also engaged in the production, acquisition and distribution of motion pictures and television programming and the operation of television and digital networks. Further, Sony is also engaged in various financial services businesses, including life and
non-life
insurance operations through its Japanese insurance subsidiaries and banking operations through a Japanese internet-based banking subsidiary.Products and Services
Game & Network Services (G&NS)
Sony Interactive Entertainment LLC undertakes product research, development, design, marketing, sales, production, distribution and customer service for PlayStation
®
hardware, software, content and network services.The G&NS segment includes the Digital Software and
Add-on
Content, Network Services and Hardware and Others categories. Digital Software andAdd-on
Content includes distribution of software titles andadd-on
content through digital networks by Sony Interactive Entertainment; Network Services includes network services relating to game, video and music content; and Hardware and Others includes home gaming consoles, packaged software, peripheral devices and first-party software for third-party platforms.Music
Recorded Music:
“Recorded Music” includes the distribution of physical and digital recorded music and revenue derived from artists’ live performances. SME, a global entertainment company, excluding Japan, is engaged primarily in the development, production, marketing and distribution of recorded music in all commercial formats and genres. SMEJ is an entertainment company focused on the Japanese market, which includes a Japanese domestic recorded music business that produces recorded music and music videos through contracts with many artists in all music genres.
Music Publishing:
“Music Publishing” includes the management and licensing of the words and music of songs. SMP is a U.S.-based music publishing business that owns and acquires rights to musical compositions, exploiting and marketing these compositions and receiving royalties or fees for their use.
Visual Media and Platform:
“Visual Media and Platform” includes the production and distribution of animation titles and game applications, and various service offerings for music and visual products. These businesses are operated primarily by SMEJ.
- 21 -
Pictures
Motion Pictures:
“Motion Pictures” includes the worldwide production, acquisition and distribution of live-action and animated motion pictures. SPE’s motion picture production organizations include Columbia Pictures, Screen Gems, TriStar Pictures, 3000 Pictures, Sony Pictures Animation, Stage 6 Films, AFFIRM Films and Sony Pictures Classics. SPE also operates Sony Pictures Imageworks, a visual effects and animation unit, and manages a studio facility, Sony Pictures Studios, which includes post-production facilities.
Television Productions:
“Television Productions” includes the worldwide production, acquisition and distribution of programming, including scripted series, unscripted “reality” or “light entertainment,” daytime serials, game shows, animated series, made for television movies and miniseries and other programming.
Media Networks:
“Media Networks” includes the operation of television and digital networks worldwide. SPE’s television networks around the world include SPNI, which operates television networks in India, and Game Show Network, LLC, which operates a U.S.-based network delivered on cable, satellite and other distribution platforms. Digital networks include SonyLIV, a general entertainment streaming service in India, in addition to Crunchyroll, a streaming service primarily focused on anime content, and Pure Flix, a streaming service primarily focused on faith and family-based content, both primarily in North America.
Electronics Products & Solutions (EP&S)
TV
Audio
& Video:
Sony Corporation undertakes product research, development, design, marketing, sales, production, distribution and customer services for televisions and video and sound products.
Still and Video Cameras:
Sony Corporation undertakes product research, development, design, manufacturing, sales, distribution and customer service for interchangeable lens cameras, compact digital cameras, consumer and professional video cameras as well as display products such as projectors and medical equipment. Additionally, it is responsible for the broadcast/professional solutions business and the FeliCa contactless IC (integrated circuit) card technology business. SOMED undertakes development support to provide comprehensive medical and imaging device solutions for operating rooms and other medical areas.
Mobile Communications:
Sony Corporation undertakes product research, development, design, marketing, sales, production, distribution and customer services for mobile phones, accessories and applications. SNC provides internet broadband network services to subscribers as well as creates and distributes content through its portal services to various electronics product platforms such as PCs and mobile phones.
Imaging & Sensing Solutions (I&SS)
SSS and its subsidiary Sony Semiconductor Manufacturing Corporation undertake product research, development, design, manufacturing, marketing, sales, production, distribution and customer services primarily for complementary metal oxide semiconductor (“CMOS”) image sensors, in addition to charge-coupled devices (“CCDs”), large-scale integration systems (“LSIs”) and other semiconductors. These CMOS image sensors are used in a wide variety of applications, primarily smartphones, as well as other products such as digital cameras and security cameras, factory automation systems and automobiles.
Financial Services
SFGI conducts insurance, banking and other operations primarily through Sony Life, a Japanese life insurance company, Sony Assurance, a Japanese
non-life
insurance company, and Sony Bank, a Japanese internet-based bank, which are all wholly-owned by SFGI.- 22 -
All Other
All Other consists of various operating activities, including the disc manufacturing business outside of Japan, and the recording media and storage media businesses. In addition, certain costs related to the after-sales services of the PC business, which was sold in 2014, remain in All Other.
Sales and Distribution
G&NS, EP&S and I&SS
In the G&NS segment, PlayStation
®
hardware and peripheral devices, software and content and network services are marketed and distributed by Sony Interactive Entertainment LLC, Sony Interactive Entertainment Inc. and Sony Interactive Entertainment Europe Ltd. Digital software, includingadd-on
content, is primarily sold via the PlayStation Store, while software for third-party platforms is sold via third-party distributors. Hardware and physical software are sold both indirectly via third-party distributors as well as directly via PlayStation’s proprietary website.Sony’s products and services in the EP&S and I&SS segments are primarily marketed throughout the world under the trademark “Sony.”
In most cases, Sony’s products in the EP&S and I&SS segments are sold to sales subsidiaries of Sony Group Corporation located in or responsible for sales in various countries and territories. These subsidiaries then sell those products to unaffiliated local distributors and dealers or through direct sales, such as through the internet. In some regions, certain products and services are sold directly to local distributors by Sony Group Corporation.
Sales of such products and services are particularly seasonal and vary significantly with the timing of new product introductions and the economic conditions of each country. Sales for the third quarter ending December 31 of each fiscal year are generally higher than other quarters of the same fiscal year mainly in the G&NS and EP&S segments due to demand in the
year-end
holiday season.Japan:
Sony Marketing (Japan) Inc. markets consumer electronics products mainly through retailers. It also markets professional electronics products and services. For electronic components, Sony sells products directly to wholesalers and manufacturers.
United States:
Sony markets its electronics products and services in these segments through Sony Electronics Inc. and other wholly-owned subsidiaries in the U.S.
Europe:
In Europe, Sony’s products and services in these segments are marketed through sales subsidiaries including Sony Europe B.V., which is headquartered in the United Kingdom and has branches in European countries, and Sony Electronics JSC in Russia.
China:
Sony markets products and services in these segments through Sony (China) Limited, Sony Corporation of Hong Kong Limited and other wholly-owned subsidiaries in China.
Asia-Pacific:
In Asia-Pacific, Sony’s products and services in these segments are marketed through sales subsidiaries including Sony India Private Limited, Sony Electronics of Korea Corporation, Sony Taiwan Limited and Sony Electronics Vietnam.
Other Areas:
In overseas areas other than the U.S., Europe, China and Asia-Pacific, Sony’s products and services in these segments are marketed through sales subsidiaries including Sony Brasil Ltda., Sony Middle East & Africa FZE in the United Arab Emirates and Sony de Mexico S.A.de C.V.
- 23 -
Along with certain of its global corporate functions in Japan, Sony Mobile has sales and marketing operations in many major regions of the world, as well as a major manufacturing site in Thailand and product development sites in Japan and Sweden. Sony Mobile brings its products to market through direct and indirect distribution channels, such as third-party cellular network carriers and retailers, as well as through its website.
Music
SME and SMEJ develop, produce, market, and distribute recorded music in various commercial formats. SME and its affiliates conduct business globally under “Columbia Records,” “Epic Records,” “RCA Records” and other labels. SMEJ conducts business in Japan under “Sony Music Records,” “Epic Records Japan,” “SME Records,” “Ki/oon Music,” “Sony Music Associated Records” and other labels.
Sony owns and acquires rights to musical compositions, exploits and markets these compositions, receives royalties or fees for their use and conducts its music publishing business in countries other than Japan under the Sony Music Publishing name.
SMEJ creates artwork and produces packaged home entertainment products including music and games. It also organizes various events in Japan through Sony Music Communications Inc. and its affiliates. In addition, SMEJ produces, markets and distributes animation products and game applications based on animation titles under the Aniplex name.
Pictures
SPE generally retains all rights relating to the worldwide distribution of its internally produced motion pictures and television programming, including rights for theatrical exhibition, home entertainment distribution, pay and free television and digital exhibition and other markets. SPE also acquires distribution rights to motion pictures and television programming produced by other companies, and jointly produces and distributes motion pictures and television programming with other studios, television networks and production companies. These rights may be limited to particular geographic regions, specific forms of media or periods of time.
Within the U.S., SPE uses its own distribution service businesses, Sony Pictures Releasing and Sony Pictures Classics, for the U.S. theatrical release of its motion pictures and for the theatrical release of motion pictures acquired from and produced by others.
Outside the U.S., SPE generally distributes and markets motion pictures through one of its Sony Pictures Releasing International subsidiaries or affiliates. In certain countries, however, SPE has joint distribution or
sub-distribution
arrangements with other studios, or arrangements with independent local distributors or other entities.The worldwide home entertainment distribution of SPE’s motion pictures and television programming (and product acquired or licensed from others) is handled through Sony Pictures Home Entertainment, except in certain countries where SPE has joint distribution ordistributed on digital platforms, cable networks and direct broadcast satellite (“DBS”) providers.
sub-distribution
arrangements with other studios, or arrangements with independent local distributors. Product is distributed in various home media formats including DVD,Blu-ray
Disc™
and Digital Distribution. Digital Distribution includes electronic sell-through andvideo-on-demand
The worldwide television distribution of SPE’s motion pictures and television programming (and product acquired or licensed from others) is handled through Sony Pictures Television. SPE’s library of motion pictures and television programming is licensed to linear distributors such as broadcast television networks, digital platforms, cable networks and DBS providers. Digital platforms include subscription and advertising supported platforms (including Sony’s PlayStation
™
Network, Netflix and Amazon Prime Video).SPE’s television networks are distributed through digital platforms (including SonyLIV in India, as well as Crunchyroll and Pure Flix primarily in North America), cable, DBS providers and telecommunications companies to viewers around the world. These networks generate advertising, subscription and other ancillary revenues.
Financial Services
Sony Life conducts its life insurance business primarily in Japan. Sony Life’s core business is providing death protection and other insurance products to individuals, primarily through a consulting-based sales approach utilizing its experienced team of Lifeplanner
®
sales specialists as well as partner independent sales agents. Sony- 24 -
Life provides tailor-made life insurance products that are optimized for each customer. As of March 31, 2022, Sony Life employed 5,338 Lifeplanner
®
sales specialists. Sony Life maintains an extensive service network which mainly consists of the Lifeplanner®
channel and the independent agent channel in Japan. The Lifeplanner®
channel is characterized by recruitment of high-caliber sales professionals from industries outside the life insurance industry, quality improvement through education and training, performance-linked compensation and high productivity. Lifeplanner®
sales specialists offer custom-made packages. Most of the agents in the independent agent channel are corporate andnon-exclusive
agents, primarily shop-style agents. Shop-style agents are asub-channel
of the independent agent channel, who offer insurance in local stores and provide customers with opportunities to compare various insurers’ products. To enhance Sony Life’s relationship with independent agents, Sony Life’s agent support staff provides independent agents with various support services, including recruiting, training and sales promotion activities. As part of its plan to expand its sales of individual annuity products, Sony Life established AEGON Sony Life Insurance Co., Ltd. (“AEGON Sony Life”) in August 2007 and SA Reinsurance (“SA Re”) in October 2009, both50-50
joint venture companies with AEGON N.V. AEGON Sony Life and SA Re began operations in Japan in December 2009 and in Bermuda in January 2010, respectively. In January 2020, Sony Life acquired from AEGON International B.V. the remaining 50% stakes of AEGON Sony Life and SA Re, resulting in both AEGON Sony Life and SA Re becoming wholly-owned subsidiaries of Sony Life. AEGON Sony Life changed its trade name to Sony Life With Insurance Co., Ltd. (“Sony Life With”) on April 1, 2020. Furthermore, on April 1, 2021, Sony Life undertook an absorption-type merger with Sony Life With, with Sony Life as the surviving company.Sony Assurance has conducted a
non-life
insurance business in Japan since October 1999. Sony Assurance’s core business is providing automobile insurance and fire insurance products, as well as medical insurance and overseas travel insurance products, to individual customers, primarily through direct marketing via the internet and via telephone. The direct marketing business model employed by Sony Assurance enables it to improve operating efficiency and lower the costs of marketing and maintaining its insurance policies, creating savings which it passes on to policyholders in the form of competitively priced premiums.Sony Bank has conducted banking operations in Japan since June 2001. As an internet bank focusing on the asset management and borrowing needs of individual customers, Sony Bank offers an array of products and services including yen and foreign currency deposits, investment trusts and mortgages. By using Sony Bank’s transaction channel, the “MONEYKit” service website, account holders can invest and manage assets over the internet according to their life plans. On July 1, 2011, Sony Bank acquired Sony’s 57% equity interest in Sony Payment Services Inc. (“Sony Payment Services”), resulting in Sony Payment Services becoming a consolidated subsidiary of Sony Bank. Sony Payment Services provides credit card settlement services to members of its internet network.
All Other
Sony DADC group offers Ultra HD
Blu-ray
™
,Blu-ray
Disc™
, DVD and CD media replication services as well as digital and physical supply chain solutions to business customers. Sony Storage Media Solutions Corporation sells its storage media products through its own sales forces, as well as through Sony’s sales companies mentioned in the above description of Sales and Distribution for the G&NS, EP&S and I&SS segments.Sales to External Customers by Geographic Area
The following table shows Sony’s consolidated sales to external customers in each of its major markets for the periods indicated.
Fiscal year ended March 31 | ||||||||
| 2021 | 2022 | |||||||
(Yen in millions) | ||||||||
Japan | 2,965,936 | 2,764,321 | ||||||
United States | 2,147,686 | 2,766,021 | ||||||
Europe | 1,817,854 | 1,870,091 | ||||||
China | 762,766 | 771,006 | ||||||
Asia-Pacific | 861,623 | 1,149,261 | ||||||
Other Areas | 442,796 | 600,813 | ||||||
Total | 8,998,661 | 9,921,513 | ||||||
- 25 -
Sources of Supply
Sony procures parts, components and raw materials used in the production of its products on a global basis on the most favorable terms that it can achieve. These items are purchased from various suppliers around the world. Sony has a general policy of maintaining multiple suppliers for important parts and components. In the fiscal year ended March 31, 2022, Sony continued to optimize the number of its suppliers to achieve efficiencies and to minimize procurement risks when possible.
When parts, components and raw materials become scarce, it not only causes production costs to rise but also may affect production. For example, semiconductors, LCD panels and other discrete components, which are used in multiple applications, can influence Sony’s performance when the availability of such parts and components is significantly limited. Regarding raw materials, the market price of resin and sheet steel, which are widely used in mechanical parts, electronic parts and components, may also fluctuate and impact the cost of those parts and components.
After-Sales Service
Sony provides repair and servicing functions in the areas where its G&NS, EP&S and I&SS products are sold. Sony provides these services through its own online support network, call centers, service centers, factories, authorized independent service centers, authorized servicing dealers and subsidiaries.
In line with industry practices of these businesses, almost all of Sony’s
consumer-use
products that are sold in Japan carry a warranty, generally for a period of one year from the date of purchase, covering repairs, free of charge, in the case of a malfunction in the course of ordinary use of the product. Warranties outside of Japan generally provide coverage for various periods of time depending on the product and the area in which it is marketed. In the case of broadcast- andprofessional-use
products, Sony maintains support contracts with customers in addition to warranties.To further help ensure customer satisfaction, Sony maintains customer information centers in its principal markets and web support information for all markets.
Patents and Licenses
Sony has a number of Japanese and foreign patents relating to its products and services. Sony is licensed to use a number of patents owned by others, covering a wide range of products and services. Certain of these licenses are important to Sony’s business. Sony products that employ
Blu-ray
Disc™
player functionality, including PlayStation®
4 (“PS4™
”) and PlayStation®
5 (“PS5™
”) hardware, are substantially dependent upon patents that relate to technologies specified in theBlu-ray
Disc™
specifications and are licensed by MPEG LA LLC andOne-Blue,
LLC. Sony considers its overall license position beneficial to its operations.Competition
In each of its principal product lines and services, Sony encounters intense competition throughout the world. Sony believes, however, that in the aggregate it competes successfully and has a major position in all of the principal product lines and services in which it is engaged, although the strength of its position varies with products and markets. Refer to “Risk Factors” in “Item 3.”
Key Information.
G&NS, EP&S, I&SS and All Other
Sony believes that its product planning and product design expertise, the high quality of its products, its record of innovative product introductions and product improvements, the user experience it provides and the ecosystem that supports such an experience, its price competitiveness derived from reductions in manufacturing and indirect costs, and its extensive marketing and servicing efforts are important factors in maintaining its competitive position. Continuing to provide high-value added products, services and experiences is a key factor by which Sony aims to differentiate itself in these highly competitive markets. Sony believes that the success of the G&NS businesses is determined by the availability of attractive software titles and related content, downloadable content, network services and peripherals. In the I&SS segment, Sony puts significant effort into keeping Sony’s strong competitive position by investing in R&D and production capacity, while also trying to avoid overinvesting and increasing fixed costs by carefully monitoring customer demand, market trends and demand for
end-user
products.- 26 -
Music
Success in the music industry is dependent to a large extent upon the artistic and creative abilities of artists, producers and employees and is subject to the vagaries of public taste. The Music segment’s future competitive position depends on its continuing ability to attract and develop artists and products that can achieve a high degree of public acceptance as well as offer efficient services. In addition, Sony believes that the success of the Music segment’s animation products and game applications business, Aniplex, is largely dependent on the creative talent of game producers and developers, and is also subject to the vagaries of public taste.
Pictures
SPE faces intense competition from all forms of entertainment and other leisure activities to attract the attention of audiences worldwide. SPE competes with other motion picture studios and production companies to obtain story rights and talent, including writers, actors, directors and producers, which are essential to the success of SPE’s products. SPE competes with other companies, in particular technology companies, who are expanding into the production or distribution of film and television programing. In motion picture production and distribution, SPE faces competition to obtain exhibition and distribution outlets and optimal release dates for its products. In addition, SPE faces competition to acquire motion pictures and television programming from third parties. In television production and distribution, competition arises from the increasing fragmentation of audiences among broadcast and cable networks, digital platforms, DBS providers and other outlets both within and outside of the U.S. Furthermore, broadcast networks in the U.S., or their affiliated production companies, continue to produce their own shows internally, and major streaming services in and outside the United States are producing more content themselves or acquiring content from affiliated production companies. This competitive environment may result in fewer opportunities to produce shows for such networks and services, and may contribute to shorter lifespans for ordered shows that do not immediately achieve favorable ratings. SPE’s worldwide television networks compete for viewers with broadcast and cable networks, DBS providers, digital platforms and other forms of entertainment. The number of networks around the world continues to drive competition for advertising and subscription revenues, acquisition of programming, and distribution of SPE’s television networks by cable, DBS providers, digital platforms and other distribution systems.
Financial Services
In the Financial Services segment, Sony faces strong competition in the financial services markets in Japan.
Sony Life competes not only with traditional insurance companies in Japan but also with other companies including online insurance companies, foreign-owned life insurance companies and a number of Japanese cooperative associations.
Sony Assurance competes against insurers that sell their policies through sales agents as well as insurers that, like Sony Assurance, primarily sell their policies through direct marketing via the internet and via telephone.
Some of the competitors in the life insurance and
non-life
insurance businesses have advantages over Sony including:| • | greater financial resources and financial strength ratings; |
| • | greater brand awareness; |
| • | more extensive marketing and sales networks, including through tie-ups with other types of financial institutions; |
| • | more competitive pricing; |
| • | larger customer bases; and |
| • | a wider range of products and services. |
Sony Bank has focused on providing retail asset management and mortgage services for individuals, and faces significant competition in Japan’s retail financial services market. Sony Bank competes with traditional banking institutions, regional banks, trust banks,
non-bank
companies, and newer financial groups providing online full-services of bank and brokerage in Japan.- 27 -
In the Financial Services segment, it is important to maintain a strong and healthy financial foundation for the business as well as to meet diversifying customer needs. Sony Life and Sony Assurance have maintained a high solvency margin ratio, relative to the Japanese domestic minimum solvency margin ratio requirements. Sony Bank has maintained a sufficient capital adequacy ratio relative to the Japanese domestic criteria.
Government Regulations
Sony’s business activities are subject to various governmental regulations in different countries in which it operates, including regulations relating to: various business/investment approvals; trade affairs, including customs, import and export control; competition and antitrust; anti-bribery; advertising and promotion; intellectual property; broadcasting, consumer and business taxation; foreign exchange controls; economic sanctions; personal information protection; product safety; labor; human rights; conflict; occupational health and safety; environmental; and recycling requirements.
In Japan, Sony’s insurance businesses are subject to the Insurance Business Act and approvals and oversight from the Financial Services Agency (“FSA”). The primary purpose of the Insurance Business Act and related regulations is to protect policyholders, not shareholders. The Insurance Business Act specifies the types of businesses insurance companies may engage in, imposes limits on the types and amounts of investments that can be made and requires insurance companies to maintain specified reserves and a minimum solvency margin ratio. In particular, life insurance companies must maintain a premium reserve (for the portion of their portfolio other than unearned premiums), an unearned premium reserve, a reserve for refunds with respect to certain insurance contracts of life insurance companies specified in the Insurance Business Act’s regulations, and a contingency reserve in amounts no lower than the amount of the “standard policy reserve” as set forth by the regulatory guidelines. The FSA maintains a solvency standard which is used by Japanese regulators to monitor the financial strength of insurance companies.
Non-life
insurance companies are also required to provide a policy reserve. Sony Bank is also subject to regulation by the FSA under the Banking Act of Japan, including the requirement that it maintain a minimum capital adequacy ratio in accordance with capital adequacy guidelines adopted by the FSA based on the Basel III agreement. The FSA has broad regulatory powers over insurance and banking businesses in Japan, including the authority to grant or revoke operating licenses and to request information and conduct onsite inspections of books and records. Sony’s subsidiaries in the Financial Services segment are subject to the Japanese Insurance Business Act and Banking Act that require insurance and business companies to maintain their financial credibility and to secure protection for policyholders and depositors in view of the public importance of insurance and banking services. As such, lending and borrowing between subsidiaries in the Financial Services segment and the other companies within Sony Group is strictly limited.In addition, Sony’s telecommunication businesses in Japan are subject to approvals and oversight from the Ministry of Internal Affairs and Communications, under the Telecommunications Business Act and other regulations related to the internet businesses and communication methods in Japan.
Social Responsibility Regulations Such as Environmental and Human Rights Regulations
Sony monitors, evaluates, and complies with laws and regulations that may affect its global operations and purchasing activities with respect to social responsibility, such as environmental, human rights, labor, and occupational health and safety issues. For example, Sony has taken steps to address new regulations or governmental policies related to climate change including carbon disclosure, greenhouse gas emission reduction, carbon taxes and energy efficiency for products in the G&NS, EP&S and I&SS segments.
Also refer to “Risk Factors” in “Item 3.”
Key Information.
Disclosure pursuant to Section 219 of the Iran Threat Reduction and Syria Human Rights Act of 2012
Section 219 of the Iran Threat Reduction and Syria Human Rights Act of 2012 added Section 13(r) to the Securities Exchange Act of 1934 (the “Exchange Act”), as amended. Section 13(r) requires an issuer to disclose in its annual or quarterly reports, as applicable, whether it or any of its affiliates knowingly engaged in certain activities, transactions or dealings relating to Iran or with designated natural persons or entities sanctioned under programs relating to terrorism or the proliferation of weapons of mass destruction. Disclosure is required even where the activities, transactions or dealings are conducted outside the U.S. by
non-U.S.
affiliates in compliance with applicable law, and whether or not the activities are sanctionable under U.S. law.Sony is aware that certain transactions during the fiscal year ended March 31, 2022, as described below, may be disclosable pursuant to Section 13(r) of the Exchange Act.
- 28 -
The information below is to the best of Sony’s knowledge, and in particular Sony may not be aware of all potentially reportable sales by third-party-owned dealers and distributors.
| • | Sony’s representative office in Tehran, Iran, which was established in 1992, has been closed and has been under liquidation processes since before the beginning of the fiscal year ended March 31, 2014. In the course of liquidation, Sony engages in certain incidental transactions (for example, permits, taxes, and similar matters incidental to the wind-down of the office in Iran) with Iranian government-owned entities. No material revenues or profits are associated with these transactions with the Iranian government-owned entities. |
Sony is not aware of any other activity, transaction or dealing by Sony Group Corporation or any of its affiliates during the fiscal year ended March 31, 2022 that is disclosable in this report under Section 13(r) of the Exchange Act. As of the date of this report, Sony does not anticipate that any activity, transaction or dealing that may be disclosable will be conducted during the fiscal year ending March 31, 2023, except as described above in connection with the wind-down of its representative office in Iran. Nevertheless, Sony has continued to monitor developments in this area, especially in the light of the United States’ decision that was implemented in its entirety on November 5, 2018 to cease its participation in the Joint Comprehensive Plan of Action of July 14, 2015, among the United States, the United Kingdom, China, France, Russia, Germany, the European Union and Iran and
re-impose
certain secondary sanctions (i.e., laws and regulations that threaten to impose U.S. economic sanctions onnon-U.S.
companies engaging in specified transactions with Iran outside U.S. jurisdiction). As sanctions against Iran continue to evolve, Sony will continue to assess whether and to what extent such sanctions may affect Sony’s business activities, which Sony intends to conduct in accordance with applicable laws and regulations.Sony believes, and maintains policies and procedures designed to ensure that, its transactions with Iran and elsewhere have been conducted in accordance with applicable economic sanctions laws and regulations and do not involve transactions likely to result in the imposition of sanctions or other penalties on Sony. However, there can be no assurance that Sony’s policies and procedures will be effective, and if the relevant authorities were to impose penalties or sanctions against Sony, the impact of such sanctions could be material.
C. | Organizational Structure |
The following table sets forth the significant subsidiaries owned, directly or indirectly, by Sony Group Corporation.
Name of company | Country of incorporation/residence | (As of March 31, 2022) Percentage owned | ||||
Sony Interactive Entertainment Inc. | Japan | 100.0 | ||||
Sony Music Entertainment (Japan) Inc. | Japan | 100.0 | ||||
Sony Corporation | Japan | 100.0 | ||||
Sony Global Manufacturing & Operations Corporation | Japan | 100.0 | ||||
Sony Semiconductor Solutions Corporation | Japan | 100.0 | ||||
Sony Semiconductor Manufacturing Corporation | Japan | 100.0 | ||||
Sony Semiconductor Energy Management Corporation | Japan | 100.0 | ||||
Sony Network Communications Inc. | Japan | 100.0 | ||||
Sony Marketing Inc. | Japan | 100.0 | ||||
Sony Storage Media Solutions Corporation | Japan | 100.0 | ||||
Sony Global Solutions Inc. | Japan | 100.0 | ||||
Sony Financial Group Inc. | Japan | 100.0 | ||||
Sony Life Insurance Co., Ltd. | Japan | 100.0 | ||||
Sony Bank Inc. | Japan | 100.0 | ||||
Sony Assurance Inc. | Japan | 100.0 | ||||
Sony Corporation of America | U.S.A. | 100.0 | ||||
Sony Interactive Entertainment LLC | U.S.A. | 100.0 | ||||
Sony Music Entertainment | U.S.A. | 100.0 | ||||
Sony Music Publishing LLC | U.S.A. | 100.0 | ||||
Sony Pictures Entertainment Inc. | U.S.A. | 100.0 | ||||
CPT Holdings, Inc. | U.S.A. | 100.0 | ||||
Sony Electronics Inc. | U.S.A. | 100.0 | ||||
Sony Europe B.V. | U.K. | 100.0 | ||||
Sony Interactive Entertainment Europe Ltd. | U.K. | 100.0 | ||||
Sony Global Treasury Services Plc | U.K. | 100.0 | ||||
Sony Overseas Holding B.V. | Netherlands | 100.0 | ||||
Sony (China) Limited | China | 100.0 | ||||
Sony EMCS (Malaysia) Sdn. Bhd. | Malaysia | 100.0 | ||||
Sony Electronics (Singapore) Pte. Ltd. | Singapore | 100.0 | ||||
- 29 -
D. | Property, Plant and Equipment |
Sony has a number of offices, plants and warehouses throughout the world. Most of the buildings and land in/on which such offices, plants and warehouses are located are owned by Sony.
The following table sets forth information as of March 31, 2022 with respect to plants used for the production of products mainly for products and services in the G&NS, EP&S and I&SS segments with floor space of more than 500,000 square feet:
Location | Approximate floor space | Principal products produced | ||||
(square feet) | ||||||
In Japan: | ||||||
Nagasaki (Sony Semiconductor Manufacturing Corporation — Nagasaki TEC) | 3,077,000 | CMOS Image Sensors | ||||
Kumamoto (Sony Semiconductor Manufacturing Corporation — Kumamoto TEC) | 2,293,000 | CMOS & CCD Image Sensors, Microdisplay | ||||
Kagoshima (Sony Semiconductor Manufacturing Corporation — Kagoshima TEC) | 1,789,000 | Analog LSI | ||||
Oita (Sony Semiconductor Manufacturing Corporation — Oita TEC) | 1,037,000 | CMOS Image Sensors (Wafer Process) | ||||
Kohda, Aichi (Sony Global Manufacturing & Operations Corporation — Tokai TEC — Kohda Site) | 903,000 | Digital Still Cameras, Interchangeable-lens Cameras, Lenses for Interchangeable-lens Cameras, Lenses, Lens Blocks, Audio Devices, aibo | ||||
Inazawa, Aichi (Sony Global Manufacturing & Operations Corporation — Tokai TEC — Inazawa Site) | 842,000 | Surface Mounted Boards, TVs | ||||
Tsuruoka, Yamagata (Sony Semiconductor Manufacturing Corporation — Yamagata TEC) | 698,000 | CMOS Image Sensors (Wafer Process) | ||||
Kosai, Shizuoka (Sony Global Manufacturing & Operations Corporation — Tokai TEC — Kosai Site) | 576,000 | Broadcasting/Professional Equipment (Cameras/Editing Systems), Projectors, Professional-use Microphones,Professional-use Monitors, Medical Peripheral Equipment, Flow Cytometers, Airpeak (Drone) | ||||
Kisarazu, Chiba (Sony Global Manufacturing & Operations Corporation — Kisarazu TEC) | 541,000 | PlayStation ® , FeliCa IC Cards and Related Devices, Audio Devices | ||||
Outside of Japan: | ||||||
Bangi, Malaysia (Sony EMCS (Malaysia) Sdn. Bhd.) | 1,183,000 | TVs, TV Components, Headphones, Home Audio, Blu-ray Disc ™ Players, Blu-ray Disc™ Recorders | ||||
Huizhou, China (Sony Precision Devices (Huizhou) Co., Ltd.) | 1,010,000 | Optical Pickups | ||||
Wuxi, China (Sony Digital Products (Wuxi) Co., Ltd.) | 798,000 | Digital Still Cameras, Lens Assembly, Interchangeable-lens Cameras, Lenses for Interchangeable-lens Cameras | ||||
Shanghai, China (Shanghai Souguang Visual Products Co., Ltd.) | 541,000 | TVs, Projectors, Camcorders, Industrial Cameras | ||||
Bangkadi, Thailand (Sony Device Technology (Thailand) Co., Ltd.) | 544,000 | Image Sensor Assembly | ||||
- 30 -
In addition to the above facilities, Sony has a number of other plants for electronic products throughout the world. Sony owns R&D facilities, and Sony Group Corporation’s headquarters building, with a total floor space of approximately 1,753,000 square feet, in Tokyo, Japan, where administrative functions and product development activities are carried out. Sony Interactive Entertainment Inc. has its corporate headquarters in Sony Group Corporation’s headquarters building and leases additional office space in Tokyo from a third party, where administrative functions, product development, and software development are carried out. Sony Interactive Entertainment LLC and Sony Interactive Entertainment Europe Ltd. lease their offices in the U.S. and Europe, respectively.
SPE’s corporate offices and motion picture and television production facilities are headquartered in Culver City, California, where it owns and operates a studio facility, Sony Pictures Studios, with aggregate floor space of approximately 1,939,200 square feet. SPE also leases office space and motion picture and television support facilities from third parties and affiliates of Sony Group Corporation in various worldwide locations. SPE’s film and videotape storage operations are located in various leased locations in the U.S. and Europe.
SME’s corporate offices are headquartered in New York, NY where it leases office space from SCA. SME also leases office space from third parties in various locations worldwide.
SMP’s corporate offices are headquartered in New York, NY where it leases office space from SCA. SMP also leases office space from third parties and affiliates of Sony Group Corporation in various locations worldwide.
Most of SMEJ’s offices, including leased premises, are located in Tokyo, Japan.
SCA’s corporate offices are headquartered in New York, NY where it leases office space from a third party.
SFGI’s corporate offices are headquartered in Tokyo, Japan where it leases office space from a third party.
Item 4A. | Unresolved Staff Comments |
None
Item 5. | Operating and Financial Review and Prospects |
The following discussion covers the fiscal years ended March 31, 2021 and 2022. Sony adopted IFRS starting in the three months ended June 30, 2021, in lieu of the previously applied U.S. GAAP. The results for the fiscal year ended March 31, 2021 are also presented in accordance with IFRS for the purpose of comparative analysis. For details of adjustments made in accordance with the transition from U.S. GAAP to IFRS, please refer to Note 34 of the consolidated financial statements.
A. | Operating Results |
Operating Performance
Fiscal year ended March 31 | ||||||||
| 2021 | 2022 | |||||||
(Yen in billions) | ||||||||
Sales and financial services revenue | 8,998.7 | 9,921.5 | ||||||
Operating income | 955.3 | 1,202.3 | ||||||
Income before income taxes | 998.0 | 1,117.5 | ||||||
Net income attributable to Sony Group Corporation’s stockholders | 1,029.6 | 882.2 | ||||||
Sales
For the fiscal year ended March 31, 2022, sales increased 922.9 billion yen compared to the fiscal year ended March 31, 2021to 9 trillion 921.5 billion yen. This was mainly due to significant increases in sales in the Pictures, EP&S and Music segments. A further breakdown of sales figures is presented under “Operating Performance by Business Segment” below.
(“year-on-year”)
Cost of Sales, Selling, General and Administrative Expenses and Other Operating (Income) Expense, net
“Sales” in the analysis of the ratio of “cost of sales” to sales, the ratio of “R&D costs” to sales, and the ratio of “selling, general and administrative expenses” (“SGA expenses”) to sales refers only to the net sales portions
- 31 -
of consolidated sales (which excludes financial services revenue). This is because financial services expenses are recorded separately from cost of sales and SGA expenses in the consolidated financial statements. The calculations of all ratios below that pertain to reportable segments include intersegment transactions.
For the fiscal year ended March 31, 2022, cost of sales increased 779.9 billion yento 5 trillion 845.8 billion yen. The ratio of cost of sales to sales deterioratedfrom 69.1% to 69.6%. Cost of sales in the previous fiscal year included 7.4 billion yen in inventory write-downs of certain image sensors for mobile products, recorded within the I&SS segment.
year-on-year
year-on-year
R&D costs (all R&D costs are included within cost of sales) increased 73.0 billion yento 618.4 billion yen. The ratio of R&D costs to sales remained unchanged from the fiscal year ended March 31, 2021 at 7.4%. For further details, refer to “” in Item 5.C.
year-on-year
Research and Development
SGA expenses increased 115.3 billion yento 1 trillion 588.5 billion yen. The ratio of SGA expenses to sales improvedfrom 20.1% to 18.9%.
year-on-year
year-on-year
Other operating (income) expense, net, improved 79.7 billion yento income of 65.5 billion yen. This significant improvement was mainly due to the following factors that occurred in the fiscal year ended March 31, 2022 and the absence of the following factors that occurred in the fiscal year ended March 31, 2021. Refer to Note 23 of the consolidated financial statements.
year-on-year
Factors that occurred in the fiscal year ended March 31, 2022
| • | Gain from the transfer of certain operations of Game Show Network, LLC: 70.0 billion yen (Pictures segment) |
Factors that occurred in the fiscal year ended March 31, 2021
| • | Gain on the sale of a portion of shares of Pledis Entertainment Co., Ltd. (“Pledis”): 7.2 billion yen (Music segment) |
| • | Gain recorded in connection with a business transfer: 5.9 billion yen (Music segment) |
| • | An impairment loss against non-current assets in the nursing care business: 7.4 billion yen (Financial Services segment) |
Share of profit of investments accounted for using the equity method
For the fiscal year ended March 31, 2022, the share of profit (loss) of investments accounted for using the equity method increased 12.1 billion yento income of 23.6 billion yen. This increase was mainly due to the recording of 5.1 billion yen in the share of profit of the investment in M3, Inc. (“M3”) related to a gain on a change in M3’s equity interest in an affiliated company, resulting from the issuance of new shares in connection with the affiliated company’s public listing.
year-on-year
Operating Income
For the fiscal year ended March 31, 2022, operating income increased 247.1 billion yento 1 trillion 202.3 billion yen. This significant increase was primarily due to significant increases in operating income in the Pictures and EP&S segments. Operating income for the current fiscal year as well as the previous fiscal year included the above-mentioned factors being recorded as other operating (income) expense, net. Operating income for the previous fiscal year also included 5.3 billion yen in expenses related to the Sony Global Relief Fund for
year-on-year
COVID-19
within Corporate and elimination, recorded mainly as SGA expenses. Operating income for the current fiscal year included aone-time
loss of 16.8 billion yen recorded at a subsidiary of Sony Life within Financial Services expenses and a settlement gain of 5.5 billion yen in connection with the termination of the defined benefit pension plan at certain U.S. subsidiaries, mainly within Corporate and elimination.Financial Income and Expenses
For the fiscal year ended March 31, 2022, financial income decreased by 64.5 billion yento 19.3 billion yen, while financial expenses increased by 63.1 billion yento 104.1 billion yen. The net effect of financial income and expenses was an expense of 84.8 billion yen, compared to income of 42.7 billion yen in the previous fiscal year. This deterioration was primarily due to the recording of unrealized losses mainly on Sony’s shares of Spotify Technology S.A. in the current fiscal year, compared to the recording of unrealized gains on such shares in the previous fiscal year.
year-on-year,
year-on-year,
- 32 -
Income before Income Taxes
For the fiscal year ended March 31, 2022, income before income taxes increased 119.5 billion yento 1 trillion 117.5 billion yen.
year-on-year
Income Taxes
During the fiscal year ended March 31, 2022, Sony recorded 229.1 billion yen of income tax expenses, included in which was a tax benefit of 33.4 billion yen resulting from the reversal of a previous write-down of certain deferred tax assets at certain companies in Japan. The effective tax rate of 20.5% in the current fiscal year was higher than the effective tax rate of negative 4.6% in the previous fiscal year, mainly due to the fact that the reversal of a previous write-down of a significant portion of the deferred tax assets of the consolidated tax filing group in Japan and the local taxes at some companies in Japan resulted in tax benefits of 214.3 billion yen and 7.6 billion yen, respectively, in the previous fiscal year. Additionally in the previous fiscal year, the reversal of a previous write-down of the deferred tax assets for foreign tax credits and certain research and development credits of the consolidated tax filing group in the United States resulted in tax benefits of 21.3 billion yen and 13.6 billion yen, respectively. Refer to Note 25 of the consolidated financial statements.
Net Income Attributable to Noncontrolling Interests
For the fiscal year ended March 31, 2022, net income attributable to noncontrolling interests of 6.2 billion yen was recorded, a decrease of 8.1 billion yenThis was primarily due to making SFGI a wholly-owned subsidiary. Refer to Note 20 of the consolidated financial statements.
year-on-year.
Net Income Attributable to Sony Group Corporation’s Stockholders
For the fiscal year ended March 31, 2022, net income attributable to Sony Group Corporation’s stockholders, which excludes net income attributable to noncontrolling interests, decreased 147.4 billion yento 882.2 billion yen.
year-on-year
Basic net income per share and diluted net income per share, attributable to Sony Group Corporation’s stockholders for the fiscal year ended March 31, 2022 were 711.84 yen and 705.16 yen, respectively, compared with 836.75 yen and 823.77 yen, respectively, for the fiscal year ended March 31, 2021. Refer to Note 26 of the consolidated financial statements.
Operating Performance by Business Segment
The following discussion is based on segment information. Sales in each business segment represents sales recorded before intersegment transactions are eliminated. Operating income (loss) in each business segment represents operating income (loss) reported before intersegment transactions are eliminated and excludes unallocated corporate expenses. Refer to Note 4 of the consolidated financial statements.
Game & Network Services (G&NS)
Key Financial Figures
Fiscal year ended March 31 | ||||||||
| 2021 | 2022 | |||||||
(Yen in millions) | ||||||||
Sales to external customers by product category | ||||||||
Digital Software and Add-on Content | 1,454,654 | 1,424,459 | ||||||
Network Services | 382,950 | 409,355 | ||||||
Hardware & Others | 767,109 | 840,542 | ||||||
Sales to external customers | 2,604,713 | 2,674,356 | ||||||
Intersegment sales | 51,565 | 65,407 | ||||||
G&NS segment total sales | 2,656,278 | 2,739,763 | ||||||
G&NS segment operating income | 341,718 | 346,089 | ||||||
(Units in millions) | ||||||||
Major product unit sales | ||||||||
PS4 ™ hardware | 5.7 | 1.0 | ||||||
PS5 ™ hardware | 7.8 | 11.5 | ||||||
- 33 -
For the fiscal year ended March 31, 2022, sales increased 83.5 billion yento 2 trillion 739.8 billion yen. This increase in sales was mainly due to the impact of foreign exchange rates as well as an increase in sales of hardware, partially offset primarily by a decrease in software sales, mainly from
year-on-year
non-first-party
titles includingadd-on
content.Operating income was 346.1 billion yen, essentially flatThis result was primarily due to a decrease in loss resulting from strategic price points for PS5
year-on-year.
™
hardware that were set lower than manufacturing costs, substantially offset by the impact of a decrease in sales ofnon-first-party
titles includingadd-on
content. During the current fiscal year, there was a 15.7 billion yen positive impact from foreign exchange rate fluctuations.Business Environment and Strategy
The operating performance of the G&NS segment for the fiscal year ended March 31, 2022 reflected steady sales of software and a continuous stable revenue contribution from network services, resulting from continued high levels of user engagement even asdemand in connection with the
stay-at-home
COVID-19
pandemic declined compared to the previous fiscal year. On the other hand, due to supply constraints for semiconductors and other components as well as disruptions in logistics, supply was unable to keep up with the strong demand for PS5™
hardware. In this environment, Sony will continue to work to secure components and promote market penetration of PS5™
, while also aiming to achieve future growth by maintaining and growing user engagement and by expanding the PlayStation community beyond the console. With this goal, Sony will pursue the three growth strategies of commercial expansion, portfolio expansion and audience expansion. Regarding commercial expansion, Sony has combined PlayStation®
Plus (“PS Plus”) and PlayStation™
Now into anall-new
PS Plus, and it will work to expand its online retail business through PlayStation’s proprietary consumer website. Regarding portfolio expansion, Sony intends to strengthen its existing IP portfolio and develop new IP by investing proactively in PlayStation Studios to strengthen its first-party software, as well as by investing in or acquiring third-party studios. For example, in January 2022, Sony signed definitive agreements to acquire Bungie as part of its efforts to promote portfolio expansion into the live service game area. Regarding audience expansion, Sony plans to strengthen the multiplatform deployment of its first-party titles on PC and mobile. In addition to these three growth strategies, Sony will continue to work towards increased levels of collaboration within the Sony Group, which is expected to lead to the further creation of films and television series based on PlayStation game IP.Music
Key Financial Figures
Fiscal year ended March 31 | ||||||||
| 2021 | 2022 | |||||||
(Yen in millions) | ||||||||
Sales to external customers by product category | ||||||||
Recorded Music — Streaming | 337,100 | 462,368 | ||||||
Recorded Music — Others | 179,167 | 206,412 | ||||||
Music Publishing | 156,862 | 200,334 | ||||||
Visual Media & Platform | 254,121 | 231,418 | ||||||
Sales to external customers | 927,250 | 1,100,532 | ||||||
Intersegment sales | 12,617 | 16,417 | ||||||
Music segment total sales | 939,867 | 1,116,949 | ||||||
Music segment operating income | 184,786 | 210,933 | ||||||
The Music segment results include the
yen-based
results of SMEJ and theyen-translated
results of SME and SMP, which aggregate the results of their worldwide subsidiaries on a U.S. dollar basis.For the fiscal year ended March 31, 2022, sales increased 177.1 billion yen to 1 trillion 116.9 billion yen. This significant increase in sales was primarily due to increases in sales for Recorded Music and Music Publishing, resulting from higher revenue from paid subscription streaming services as well as advertising-supported streaming services which were impacted by
COVID-19
in the previous fiscal year, and the impact of foreign exchange rates.Operating income increased 26.1 billion yento 210.9 billion yen, primarily due to the impact of the above-mentioned increase in sales as well as the positive impact of foreign exchange rates, partially offset
year-on-year
- 34 -
by the absence of a 7.2 billion yen gain on the sale of a portion of shares of Pledis and a 5.9 billion yen gain in connection with the transfer of an overseas business, both of which were recorded in the previous fiscal year.
Business Environment and Strategy
As digital streaming continued to expand globally, including due to the recovery from the impact of
COVID-19,
the operating performance of the Music segment for the fiscal year ended March 31, 2022 reflected an increase in revenues from streaming services resulting from the enhanced discovery and development of artists, strengthening of Sony’ship-hop
and rap repertoire, and proactive acquisitions including the acquisition of the Alamo Records label. In this environment, demand for music content is continuing to grow, and Sony has continued to proactively make investments to strengthen its content IP and its relationships with artists for future growth. For example, Sony strengthened its services for independent artists through its acquisition of AWAL in the fiscal year ended March 31, 2022. Additionally, in order to capitalize on the increasing penetration of streaming services in emerging markets, Sony is continuing to strengthen its approach in emerging markets by proactively investing in local talent and collaborating with local companies. For example, in the fiscal year ended March 31, 2022, Sony reinforced its business foundation in the Latin American market through the acquisition of the independent Brazilian music label Som Livre. Additionally, new business opportunities in the social, gaming and fitness areas are growing rapidly, and in the fiscal year ended March 31, 2022, Sony acquired Somethin’ Else, a leading podcast and audio producer in the U.K. In these new business areas, by collaborating with various service partners, Sony plans to continue to work to expand its earnings base by creating new opportunities for the use of music content, and strengthen its relationships with artists by creating opportunities for artists to increase their own earnings. In addition, by capitalizing on the Music segment’s position as a part of the diverse Sony Group, Sony aims to provide a wide variety of marketing opportunities to its artists going forward. In Visual Media and Platform, Sony will work to maximize the lifetime value of its anime IP through diversification and deployment of its content to a wider variety of channels, such as its own distribution through Crunchyroll and enhanced collaboration with other distribution partners.Pictures
Key Financial Figures
Fiscal year ended March 31 | ||||||||
| 2021 | 2022 | |||||||
(Yen in millions) | ||||||||
Sales to external customers by product category | ||||||||
Motion Pictures | 265,301 | 518,840 | ||||||
Television Productions | 267,123 | 419,494 | ||||||
Media Networks | 219,376 | 298,065 | ||||||
Sales to external customers | 751,800 | 1,236,399 | ||||||
Intersegment sales | 1,187 | 2,512 | ||||||
Pictures segment total sales | 752,987 | 1,238,911 | ||||||
Pictures segment operating income | 79,851 | 217,393 | ||||||
The Pictures segment results are the
yen-translated
results of SPE, which aggregates the results of its worldwide subsidiaries on a U.S. dollar basis. Management analyzes the results of SPE in U.S. dollars, so discussion of certain portions of its results is specified as being on “a U.S. dollar basis.”For the fiscal year ended March 31, 2022, sales increased 485.9 billion yen, a 65% increase(a 55% increase on a U.S. dollar basis), to 1 trillion 238.9 billion yen. This significant increase in sales was due to higher sales in all categories. Sales for Motion Pictures increased primarily due to higher theatrical revenues as a result of the contribution ofand other theatrical releases, as well as higher licensing revenues from digital streaming services for new film titles and higher licensing revenues for catalog product. These increases were partially offset by lower home entertainment and licensing revenues generated from prior year releases, due to the absence of significant theatrical releases in the previous fiscal year. Sales for Television Productions (“TV Productions”) increased primarily due to the recording of revenues from the licensing ofas well as an increase in deliveries of current year titles, as the previous fiscal year was negatively impacted by production delays due to
year-on-year
Spider-Man:
No Way HomeSeinfeld
COVID-19.
Sales for Media Networks increased primarily due to the impact of the acquisition of Crunchyroll.- 35 -
Operating income increased 137.5 billion yento 217.4 billion yen. This significant increase was primarily due to the impact of the above-mentioned increase in sales, and the recording of a 70.0 billion yen gain from the transfer of GSN Games, a division of Game Show Network, LLC, partially offset by the impact of higher marketing expenses for theatrical releases in Motion Pictures.
year-on-year
Business Environment and Strategy
The operating performance of the Pictures segment for the fiscal year ended March 31, 2022 reflected the results of Sony’s flexible release strategy aimed at maximizing the long-term value of its content by continuing to emphasize the theatrical release of films while also expanding to video streaming services. This strategy was influenced by progress in the recovery of box office revenue, which was significantly impacted by the spread ofdemand. In this environment, Sony plans to continue to leverage its strengths as an independent studio, working to create and strengthen its content IP and taking measures to expand its(“DTC”) services based around communities of interest. In Motion Pictures, Sony plans to pursue the development of its own IP and the revitalization and creation of new IP. For example, in April 2022 Sony released, which introduced a new character from Marvel, and intends to continue to expand the Sony Pictures Universe of Marvel Characters going forward. In Television Productions, Sony has acquired Industrial Media, which has an established reputation inin February 2022, Sony plans to further expand its films and television shows based on game IP. In Media Networks, Sony will work to strengthen its DTC services, including the anime streaming service Crunchyroll, the acquisition of which was completed in August 2021, and SonyLIV, a digital streaming service in India. The signing of definitive agreements for the merger of SPNI and Zee was announced in December 2021, and Sony believes that the merger represents an opportunity to further accelerate the expansion and digitization of its business by using the strengths of both companies to strengthen its digital distribution service in the rapidly-growing Indian media and entertainment market.
COVID-19
in the previous fiscal year, as well as increased demand for content from video streaming services resulting fromstay-at-home
direct-to-consumer
Morbius
non-scripted
and documentary content production, and Bad Wolf, a high-quality U.K. drama production studio, and plans to continue to diversify and strengthen its IP portfolio. Additionally, in Motion Pictures and Television Productions, efforts towards cooperation within the Sony Group have continued, and, following the theatrical release ofUncharted
Electronics Products & Solutions (EP&S)
Key Financial Figures
Fiscal year ended March 31 | ||||||||
| 2021 | 2022 | |||||||
(Yen in millions) | ||||||||
Sales to external customers by product category | ||||||||
TVs | 709,007 | 858,837 | ||||||
Audio & Video | 313,975 | 326,704 | ||||||
Still and Video Cameras | 338,694 | 414,898 | ||||||
Mobile Communications | 358,580 | 365,864 | ||||||
Other | 296,631 | 331,583 | ||||||
Sales to external customers | 2,016,887 | 2,297,886 | ||||||
Intersegment sales | 51,200 | 41,300 | ||||||
EP&S segment total sales | 2,068,087 | 2,339,186 | ||||||
EP&S segment operating income | 127,859 | 212,942 | ||||||
(Units in millions) | ||||||||
Major product unit sales | ||||||||
TVs | 9.3 | 8.5 | ||||||
For the fiscal year ended March 31, 2022, sales increased 271.1 billion yento 2 trillion 339.2 billion yen. This significant increase in sales was primarily due to an increase in sales of televisions and digital cameras resulting from an improvement in the product mix, as well as the impact of foreign exchange rates.
year-on-year
Operating income increased 85.1 billion yento 212.9 billion yen. This significant increase in operating income was due to an improvement in the product mix of digital cameras and televisions as well as the positive impact of foreign exchange rates, partially offset by the impact of decreases in unit sales of televisions and digital cameras. During the current fiscal year, there was a 27.2 billion yen positive impact from foreign exchange rate fluctuations.
year-on-year
- 36 -
Business Environment and Strategy
In the fiscal year ended March 31, 2022, extreme changes occurred in the business environment, including disruption in production and logistics due to
COVID-19,
supply restrictions for semiconductors and other components and increases in panel prices. However, the operating performance of the EP&S segment reflected the result of various measures implemented to respond promptly to this change in the business environment, such as by carrying out thorough supply chain management and reduction of fixed costs, as well as promoting a shift to high-value-added products centered on TVs and digital cameras. In this environment, Sony plans to conduct its business based on the direction of establishing a business structure with two axes: the “profit axis business area,” which aims to maintain and increase profitability, and the “growth axis business area,” which aims to realize growth through the creation and expansion of new businesses. In the profit axis business area, Sony intends to further evolve the high value-added channels for original technology that Sony has developed with creators in each product category, strengthen applications by working with other companies and promote collaboration between product categories to create new customer value. By doing so, Sony aims to continue to strengthen the appeal of its products. Additionally, Sony plans to promote consistent data coordination from production to sale, and strengthen its operations through digital transformation. In the growth axis business area, in order to create future entertainment together with creators, Sony plans to work with internal and external partners to create a recurring solutions business that provides new value to creators in the areas of the virtual production and media cloud businesses. Sony also plans to promote businesses such as the camera SDK business and the sports business, aiming to realize new sports entertainment that connects “live” and “virtual.” Additionally, Sony intends to expand and strengthen its life science business and network service business, with the aim of providing customers with peace of mind by utilizing the technology it has cultivated.Imaging & Sensing Solutions (I&SS)
Key Financial Figures
Fiscal year ended March 31 | ||||||||
| 2021 | 2022 | |||||||
(Yen in millions) | ||||||||
Sales to external customers | 937,859 | 992,200 | ||||||
Intersegment sales | 74,638 | 84,224 | ||||||
I&SS segment total sales | 1,012,497 | 1,076,424 | ||||||
I&SS segment operating income | 145,884 | 155,597 | ||||||
For the fiscal year ended March 31, 2022, sales increased 63.9 billion yento 1 trillion 76.4 billion yen. This increase in sales was mainly due to the impact of foreign exchange rates and an increase in unit sales of image sensors for digital cameras as well as for industrial equipment. These increases were partially offset by a decrease in sales of image sensors for mobile products due to a deterioration in the product mix, despite an increase in unit sales.
year-on-year
Operating income increased 9.7 billion yento 155.6 billion yen. This increase was mainly due to the impact of the above-mentioned increase in sales, the positive impact of foreign exchange rates, and the absence of the 7.2 billion yen of inventory write-downs recorded in the previous fiscal year for certain image sensors for mobile products whose shipments were suspended as a result of U.S. export restrictions. The increase was partially offset by an increase in research and development expenses as well as depreciation and amortization expenses, and the impact of the above-mentioned decrease in sales of image sensors for mobile products. During the current fiscal year, there was an 18.5 billion yen positive impact from foreign exchange rate fluctuations.
year-on-year
Business Environment and Strategy
In the I&SS segment in the fiscal year ended March 31, 2022, severe business conditions, such as weakness in the Chinese smartphone market and shortages of semiconductors and other components, continued for the image sensor business for mobile products. Despite these conditions, the business performance of the segment reflected both Sony’s efforts to diversify and expand its customer base as well as a recovery in market share on a volume basis, which Sony has been working toward since the latter half of the fiscal year ended March 31, 2020, when the business was impacted by U.S.-China trade friction. In this environment, there has been a notable trend in which image sensors are becoming larger, with higher image quality and more added value, especially in the
high-end
smartphone area, and Sony will work to improve profitability by continuing to introduce high-spec,- 37 -
high-quality custom sensors. Furthermore, Sony plans to continue actively promoting initiatives in new business areas such as automotive and industrial equipment in the sensing area, as well as the solutions business. The automotive area has been growing steadily, and Sony will continue to work to build relationships with OEMs and platformers with the aim of increasing revenue from automotive sensors. In the area of industrial sensors, Sony plans to take advantage of its diverse product lineup to provide solutions that can contribute to solving various
on-site
issues, including labor-saving and automation, which Sony expects to lead tomid-
to long-term business growth. In the solutions business, Sony aims to expand its recurring business through development of the edge AI sensing platform AITRIOS™
. Sony intends to continue to invest capital to increase production capacity to meet the growing demand for image sensors over themid-
to long-term. Additionally, in the fiscal year ended March 31, 2022, Sony made a minority investment in JASM for the stable procurement of logic semiconductors, which has been a significant business issue, for themid-
to long-term. Despite these increases in capital expenditure and investment, as well as an increase in R&D expenses to maintain and expand Sony’s technological advantage, Sony plans to continue promoting efforts to improve sales growth and profitability over the medium term, aiming to maintain its number one position in imaging applications worldwide, and aiming to attain the number one position worldwide in sensing applications as well.Financial Services
The Financial Services segment results include SFGI and SFGI’s consolidated subsidiaries such as Sony Life, Sony Assurance, and Sony Bank. The results of Sony Life discussed in the Financial Services segment differ from the results that SFGI and Sony Life disclose separately on a Japanese statutory basis.
Key Financial Figures
Fiscal year ended March 31 | ||||||||
| 2021 | 2022 | |||||||
(Yen in millions) | ||||||||
Financial services revenue | 1,674,002 | 1,533,829 | ||||||
Financial Services segment operating income | 154,765 | 150,111 | ||||||
Financial services revenue decreased 140.2 billion yento 1 trillion 533.8 billion yen, mainly due to a decrease in revenue at Sony Life. Revenue at Sony Life decreased 131.0 billion yen*to 1 trillion 350.5 billion yen, mainly due to a decrease in net gains on investments in the separate accounts, partially offset by an increase in insurance premium revenue.
year-on-year
year-on-year
Operating income decreased 4.7 billion yento 150.1 billion yen, mainly due to the recording of ato 147.2 billion yen. This increase in operating income was due to higher insurance premium revenue reflecting an increase in the policy amount in force, a decrease in expenses related to
year-on-year
one-time
loss of 16.8 billion yen at a subsidiary of Sony Life, partially offset by an increase in operating income at Sony Life. Operating income at Sony Life increased 13.7 billion yenyear-on-year
COVID-19
and a gain recorded on the sale of bonds, partially offset by an increase in the provision of policy reserves due to fluctuations in the stock market and interest rates.* Sony Life merged with its subsidiary which is engaged in the annuity business as of April 1, 2021. Due to the merger, from the fiscal year ended March 31, 2022, the revenue at this subsidiary is included in the revenue at Sony Life. Excluding the impact of the above merger, the revenue at Sony Life decreased 171.1 billion yen
year-on-year.
Business Environment and Strategy
The operating performance of the Financial Services segment for the fiscal year ended March 31, 2022 reflected conditions in the Japanese economy and bond market. As in the previous fiscal year, the Japanese economy continued to be significantly impacted by the
COVID-19
pandemic. In April 2021, another state of emergency was declared by the Japanese government due to the spread of the virus, and the economic recovery, especially in personal consumption, was hindered by reduced business in the restaurant industry and people’s self-restraint from going out. From the summer, infection by the Delta variant spread rapidly, further reinforcing the trend of voluntary restraint from going out. During the same period, local manufacturers’ business activities stagnated due to the spread of infection in Southeast Asia, leading to shortages of semiconductors and other components. As a result, production in the automobile industry stagnated and the Japanese economy worsened. On the other hand, Japan’s GDP growth rate returned to positive growth in the October-December period, as the Japanese government rapidly promoted vaccination and the infection situation improved significantly from- 38 -
October. However, the Omicron variant caused infections to spread again from the beginning of the 2022 calendar year, and the Japanese economy has been weak since the beginning of the year. The bond market in Japan was affected by speculation over fiscal and monetary policies and long-term interest rates in the U.S. In this environment, Sony aims to achieve sustainable growth in the entire financial group, including growth in profitability, by maximizing the value it provides to its customers. Sony is carrying out initiatives focused on five strategic pillars to realize this goal: strengthening core/unique competitive advantages, altering its profit structure to withstand low interest rates, further evolving customer-centric management, strengthening its competitive edge through technology and maximizing group synergies. These efforts have been proceeding as planned, and Sony has been steadily expanding the scale of its business by taking advantage of its strengths. For example, the productivity per Lifeplanner
®
sales specialist at Sony Life is improving due to the increase in the new policy amount in the corporate business, which is an area of focus, and the number of Lifeplanner®
sales specialists is steadily increasing. Going forward, Sony will continue to work to expand profit growth by making a qualitative shift toward higher productivity of Lifeplanner®
sales specialists and improvement of profitability. Additionally, Sony plans to promote efforts aimed at increasing the value it provides to customers by accelerating enhancement of its technological competitiveness through collaboration within the Sony Group, strengthening its acquisition of knowledge and technology from outside partners, and utilizing data that transcends the boundaries between the businesses within the Financial Services segment. The Financial Services segment also intends to focus on advancing sustainability and thoroughly enhancing governance in the financial group to fulfill its social responsibility as part of the Sony Group. Furthermore, over themid-
to long-term, Sony plans to expand its customer base and touchpoints with customers through wider applications of technology and strategic alliances, as well as through its increasing efforts to deepen relationships with core customers, aiming to maximize the lifetime customer value.Information on Operations Separating Out the Financial Services segment
The following schedules show unaudited condensed statements of income for the Financial Services segment and all other segments excluding the Financial Services segment. These presentations are not in accordance with IFRS, which is used by Sony to prepare its consolidated financial statements. However, because the Financial Services segment is different in nature from Sony’s other segments, Sony believes that a comparative presentation may be useful in understanding and analyzing Sony’s consolidated financial statements. Transactions between the Financial Services segment and Sony without the Financial Services segment, including noncontrolling interests, are included in those respective presentations, then eliminated in the consolidated figures shown below.
- 39 -
Fiscal year ended March 31 | ||||||||
Financial Services segment | 2021 | 2022 | ||||||
(Yen in millions) | ||||||||
Financial services revenue | 1,674,002 | 1,533,829 | ||||||
Financial services expenses | 1,510,685 | 1,383,054 | ||||||
Other operating (income) expense, net | 8,552 | 664 | ||||||
| 1,519,237 | 1,383,718 | |||||||
Share of profit (loss) of investments accounted for using the equity method | — | — | ||||||
Operating income | 154,765 | 150,111 | ||||||
Financial income (expenses), net | — | — | ||||||
Income before income taxes | 154,765 | 150,111 | ||||||
Income taxes | 42,939 | 45,402 | ||||||
Net income | 111,826 | 104,709 | ||||||
Net income of Financial Services | 111,133 | 104,216 | ||||||
Net income attributable to noncontrolling interests | 693 | 493 | ||||||
Fiscal year ended March 31 | ||||||||
Sony without Financial Services segment | 2021 | 2022 | ||||||
(Yen in millions) | ||||||||
Sales | 7,339,940 | 8,402,217 | ||||||
Costs of sales | 5,076,858 | 5,856,925 | ||||||
Selling, general and administrative | 1,468,672 | 1,582,850 | ||||||
Other operating (income) expense, net | 5,698 | (66,158 | ) | |||||
| 6,551,228 | 7,373,617 | |||||||
Share of profit (loss) of investments accounted for using the equity method | 11,551 | 23,646 | ||||||
Operating income | 800,263 | 1,052,246 | ||||||
Financial income (expenses), net | 62,523 | (45,698 | ) | |||||
Income before income taxes | 862,786 | 1,006,548 | ||||||
Income taxes | (89,162 | ) | 183,689 | |||||
Net income | 951,948 | 822,859 | ||||||
Net income of Sony without Financial Services | 949,824 | 817,123 | ||||||
Net income attributable to noncontrolling interests | 2,124 | 5,736 | ||||||
Fiscal year ended March 31 | ||||||||
Consolidated | 2021 | 2022 | ||||||
(Yen in millions) | ||||||||
Sales | 7,333,670 | 8,396,702 | ||||||
Financial services revenue | 1,664,991 | 1,524,811 | ||||||
Total sales and financial services revenue | 8,998,661 | 9,921,513 | ||||||
Costs of sales | 5,065,879 | 5,845,804 | ||||||
Selling, general and administrative | 1,473,154 | 1,588,473 | ||||||
Financial services expenses | 1,501,674 | 1,374,037 | ||||||
Other operating (income) expenses, net | 14,250 | (65,494 | ) | |||||
| 8,054,957 | 8,742,820 | |||||||
Share of profit (loss) of investments accounted for using the equity method | 11,551 | 23,646 | ||||||
Operating income | 955,255 | 1,202,339 | ||||||
Financial income (expenses), net | 42,710 | (84,836 | ) | |||||
Income before income taxes | 997,965 | 1,117,503 | ||||||
Income taxes | (45,931 | ) | 229,097 | |||||
Net income | 1,043,896 | 888,406 | ||||||
Net income attributable to Sony Group Corporation’s Stockholders | 1,029,610 | 882,178 | ||||||
Net income attributable to noncontrolling interests | 14,286 | 6,228 | ||||||
- 40 -
All Other
Sales for the fiscal year ended March 31, 2022 decreased 2.0 billion yento 98.8 billion yen. Operating income increased 10.8 billionto 18.0 billion yen. This significant increase in operating income was primarily due to an increase in the share of profit of the investment in M3.
year-on-year
year-on-year
Foreign Exchange Fluctuations and Risk Hedging
During the fiscal year ended March 31, 2022, the average rates of the yen were 112.3 yen against the U.S. dollar and 130.5 yen against the euro, which were 6.3 yen and 6.8 yen lower, respectively, than the fiscal year ended March 31, 2021.
For the fiscal year ended March 31, 2022, consolidated sales increased 922.9 billion yen (10%)to 9 trillion 921.5 billion yen. On a constant currency basis, sales increased approximately 6%
year-on-year
year-on-year.
Consolidated operating income increased 247.1 billion yento 1 trillion 202.3 billion yen. The foreign exchange fluctuations had a positive impact on the consolidated operating results in the G&NS, EP&S and I&SS segments.
year-on-year
The table below indicates the foreign exchange impact on sales and operating results in each of the G&NS, EP&S and I&SS segments. For further details, refer to “” which discusses the impact of foreign exchange rates within segments and categories where foreign exchange rate fluctuations had a significant impact.
Operating Performance by Business Segment
Fiscal year ended March 31 | Impact of changes in foreign exchange rates | |||||||||||||
| 2021 | 2022 | 2021 to 2022 | ||||||||||||
(Yen in billions) | ||||||||||||||
G&NS | Sales | 2,656.3 | 2,739.8 | +124.5 | ||||||||||
Operating income | 341.7 | 346.1 | +15.7 | |||||||||||
EP&S | Sales | 2,068.1 | 2,339.2 | +103.8 | ||||||||||
Operating income | 127.9 | 212.9 | +27.2 | |||||||||||
I&SS | Sales | 1,012.5 | 1,076.4 | +55.5 | ||||||||||
Operating income | 145.9 | 155.6 | +18.5 | |||||||||||
During the fiscal year ended March 31, 2022, sales for the Music segment increased 19%to 1 trillion 116.9 billion yen, while sales increased approximately 14%on a constant currency basis. In the Pictures segment, sales increased 65%to 1 trillion 238.9 billion yen, while sales increased approximately 55% on a U.S. dollar basis. For a detailed analysis of segment performance, refer to the Music and Pictures segments under “” Sony’s Financial Services segment consolidates the
year-on-year
year-on-year
year-on-year
Operating Performance by Business Segment.
yen-based
results of SFGI. As most of the operations in this segment are based in Japan, Sony management analyzes the performance of the Financial Services segment on a yen basis only.During the fiscal year ended March 31, 2022, Sony estimated that a one yen appreciation against the U.S. dollar would have decreased sales in the G&NS, EP&S and I&SS segments by approximately 26.8 billion yen, with a corresponding decrease in operating income of approximately 1.7 billion yen. A one yen appreciation against the euro was estimated to decrease sales in these segments by approximately 10.0 billion yen, with a corresponding decrease in operating income of approximately 5.5 billion yen. For more details, refer to “Risk Factors” in “Item 3.”
Key Information.
Sony’s consolidated operating results are subject to foreign currency rate fluctuations primarily due to different currency composition of revenue and costs. In the G&NS segment, a significant proportion of costs is incurred in U.S. dollars but sales are recorded in Japanese yen, U.S. dollars or euros. As a result, the yen appreciation against the U.S. dollar has a positive impact on operating income while the yen appreciation against the euro has a negative impact. In the EP&S segment, yen appreciation against the U.S. dollar has a positive impact on operating income, mainly due to a high proportion of manufacturing and other costs for certain key products being incurred in U.S. dollars. Meanwhile, a large portion of sales for certain key products is in emerging markets, resulting in yen appreciation against the currencies of emerging markets having a negative impact on operating profit in the EP&S segment. In the I&SS segment, a significant proportion of sales contracts are denominated in U.S. dollars, but manufacturing operations are located in Japan, and, therefore, yen appreciation against the U.S. dollar has a significantly negative impact on operating income.
- 41 -
In order to reduce the risk caused by foreign exchange rate fluctuations, Sony employs derivatives, including foreign exchange forward contracts and foreign currency option contracts, in accordance with a consistent risk management strategy. Such derivatives are used primarily to mitigate the effect of foreign currency exchange rate fluctuations on cash flows generated or anticipated by Sony’s transactions and accounts receivable and payable denominated in foreign currencies.
Sony Global Treasury Services Plc (“SGTS”) in the U.K. provides integrated treasury services for Sony Group Corporation, its subsidiaries, and affiliated companies. Sony’s policy is that Sony Group Corporation and all subsidiaries with foreign exchange exposures should enter into commitments with SGTS to hedge their exposures. Sony Group Corporation and most of its subsidiaries utilize SGTS for this purpose. Sony’s policy of concentrating its foreign exchange exposures means that SGTS and Sony Group Corporation hedge most of the net foreign exchange exposure within the Sony group. Sony has a policy on the use of derivatives that, in principle, SGTS should centrally deal with and manage derivatives with financial institutions for risk management purposes. SGTS enters into foreign exchange transactions with creditworthy third-party financial institutions. Most of these transactions are entered into against projected exposures before the actual export and import transactions take place. In general, SGTS hedges the projected exposures for a period of one month before the actual transactions take place. Sony enters into foreign exchange transactions with financial institutions primarily for hedging purposes. Sony does not use these derivative financial instruments for trading or speculative purposes except for certain derivatives in the Financial Services segment. In the Financial Services segment, Sony uses derivatives primarily for asset liability management.
Changes in the fair value of derivatives designated as cash flow hedges are initially recorded in accumulated other comprehensive income and reclassified into earnings when the hedged transaction affects earnings. Foreign exchange forward contracts, foreign currency option contracts and other derivatives that do not qualify as hedges arewith changes in value recognized in financial income and expenses. The net fair value of all the foreign exchange derivative contracts as of March 31, 2021 and 2022 was a liability of 4.5 billion yen and 6.4 billion yen, respectively. Refer to Note 15 of the consolidated financial statements.
marked-to-market
* Note: In this section, the impact of foreign exchange rate fluctuations on sales is calculated by applying the change in the yen’s periodic weighted average exchange rates for the previous fiscal year from the current fiscal year to the major transactional currencies in which the sales are denominated. The impact of foreign exchange rate fluctuations on operating income (loss) is calculated by subtracting from the impact on sales the impact on cost of sales and selling, general and administrative expenses calculated by applying the same major transactional currencies calculation process to cost of sales and selling, general and administrative expenses as for the impact on sales. The I&SS segment enters into its own foreign exchange hedging transactions, and the impact of those transactions is included in the impact of foreign exchange rate fluctuations on operating income (loss) for that segment. The descriptions of sales on a constant currency basis reflect sales obtained by applying the yen’s monthly average exchange rates from the fiscal year ended March 31, 2021 to local currency-denominated monthly sales in the fiscal year ended March 31, 2022. For SME and SMP in the Music segment, and in the Pictures segment, the constant currency amounts are calculated by applying the monthly average U.S. dollar / yen exchange rates after aggregation on a U.S. dollar basis. This information is not a substitute for Sony’s consolidated financial statements measured in accordance with IFRS. However, Sony believes that these disclosures provide additional useful analytical information to investors regarding the operating performance of Sony.
Assets, Liabilities and Stockholders’ Equity
The following schedule shows unaudited condensed statements of financial position for the Financial Services segment and all other segments excluding the Financial Services segment. These presentations are not in accordance with IFRS, which is used by Sony to prepare its consolidated financial statements. However, because the Financial Services segment is different in nature from Sony’s other segments, Sony believes that a comparative presentation may be useful in understanding and analyzing Sony’s consolidated financial statements. Both financial statements include transactions between the Financial Services segment and Sony without the Financial Services segment (including noncontrolling interests). The figures shown in the respective presentations for the Financial Services segment and Sony without the Financial Services segment are prior to the elimination and/or offset of such transactions and deferred tax assets and deferred tax liabilities of each. The “consolidated” column is presented net of the elimination and/or offset of such intercompany balances and deferred tax assets and liabilities.
- 42 -
Condensed Statements of Financial Position
Yen in millions | ||||||||||||||||||||||||||||||||||||
Financial Services | Sony without Financial Services | Consolidated | ||||||||||||||||||||||||||||||||||
| April 1, 2020 | March 31, 2021 | March 31, 2022 | April 1, 2020 | March 31, 2021 | March 31, 2022 | April 1, 2020 | March 31, 2021 | March 31, 2022 | ||||||||||||||||||||||||||||
ASSETS | ||||||||||||||||||||||||||||||||||||
Current assets: | ||||||||||||||||||||||||||||||||||||
Cash and cash equivalents *1 | ¥ | 550,039 | ¥ | 497,218 | ¥ | 889,140 | ¥ | 962,484 | ¥ | 1,289,764 | ¥ | 1,160,496 | ¥ | 1,512,523 | ¥ | 1,786,982 | ¥ | 2,049,636 | ||||||||||||||||||
Investments and advances in the Financial Services segment *2 | 327,092 | 411,982 | 360,673 | — | — | — | 327,092 | 411,982 | 360,673 | |||||||||||||||||||||||||||
Trade and other receivables, and contract assets | 115,592 | 119,791 | 169,929 | 1,086,457 | 1,261,321 | 1,478,620 | 1,194,334 | 1,365,493 | 1,628,521 | |||||||||||||||||||||||||||
Inventories | — | — | — | 559,779 | 636,668 | 874,007 | 559,779 | 636,668 | 874,007 | |||||||||||||||||||||||||||
Other financial assets | 79,721 | 73,349 | 81,174 | 55,762 | 44,498 | 68,124 | 135,482 | 117,682 | 149,301 | |||||||||||||||||||||||||||
Other current assets | 51,765 | 51,147 | 72,441 | 390,915 | 357,582 | 450,953 | 441,974 | 396,210 | 473,070 | |||||||||||||||||||||||||||
Total current assets | 1,124,209 | 1,153,487 | 1,573,357 | 3,055,397 | 3,589,833 | 4,032,200 | 4,171,184 | 4,715,017 | 5,535,208 | |||||||||||||||||||||||||||
Non-current assets: | ||||||||||||||||||||||||||||||||||||
Investments accounted for using the equity method | — | — | — | 204,291 | 225,086 | 268,513 | 204,291 | 225,086 | 268,513 | |||||||||||||||||||||||||||
Investments and advances in the Financial Services segment *2 | 16,352,285 | 17,296,546 | 18,445,088 | — | — | — | 16,352,285 | 17,296,546 | 18,445,088 | |||||||||||||||||||||||||||
Investments in Financial Services, at cost | — | — | — | 153,968 | 550,483 | 550,483 | — | — | — | |||||||||||||||||||||||||||
Property, plant and equipment | 18,256 | 19,260 | 18,010 | 899,185 | 971,336 | 1,095,241 | 917,198 | 990,541 | 1,113,213 | |||||||||||||||||||||||||||
Right-of-use | 57,892 | 65,775 | 73,774 | 315,431 | 292,262 | 339,658 | 373,282 | 358,034 | 413,430 | |||||||||||||||||||||||||||
Goodwill and intangible assets, including content assets | 62,660 | 66,133 | 72,578 | 1,998,413 | 2,113,578 | 2,672,466 | 2,061,073 | 2,179,711 | 2,745,044 | |||||||||||||||||||||||||||
Deferred insurance acquisition costs | 187,904 | 623,986 | 676,526 | — | — | — | 187,904 | 623,986 | 676,526 | |||||||||||||||||||||||||||
Deferred tax assets | 8,129 | — | — | 202,217 | 309,341 | 332,330 | 210,333 | 215,669 | 298,589 | |||||||||||||||||||||||||||
Other financial assets | 34,319 | 28,043 | 37,037 | 291,373 | 671,683 | 663,233 | 321,721 | 695,764 | 696,306 | |||||||||||||||||||||||||||
Other non-current assets | 87,933 | 86,287 | 77,657 | 155,643 | 195,713 | 284,834 | 167,795 | 207,489 | 289,050 | |||||||||||||||||||||||||||
Total non-current assets | 16,809,378 | 18,186,030 | 19,400,670 | 4,220,521 | 5,329,482 | 6,206,758 | 20,795,882 | 22,792,826 | 24,945,759 | |||||||||||||||||||||||||||
Total assets | ¥ | 17,933,587 | ¥ | 19,339,517 | ¥ | 20,974,027 | ¥ | 7,275,918 | ¥ | 8,919,315 | ¥ | 10,238,958 | ¥ | 24,967,066 | ¥ | 27,507,843 | ¥ | 30,480,967 | ||||||||||||||||||
LIABILITIES AND EQUITY | ||||||||||||||||||||||||||||||||||||
Current liabilities: | ||||||||||||||||||||||||||||||||||||
Short-term borrowings *3 | ¥ | 768,100 | ¥ | 1,160,896 | ¥ | 1,964,776 | ¥ | 154,884 | ¥ | 246,257 | ¥ | 183,187 | ¥ | 922,968 | ¥ | 1,407,153 | ¥ | 2,147,962 | ||||||||||||||||||
Trade and other payables | 43,975 | 80,189 | 118,921 | 1,273,946 | 1,531,502 | 1,744,011 | 1,310,536 | 1,596,563 | 1,843,242 | |||||||||||||||||||||||||||
Deposits from customers in the banking business | 2,347,387 | 2,682,156 | 2,886,361 | — | — | — | 2,347,387 | 2,682,156 | 2,886,361 | |||||||||||||||||||||||||||
Income taxes payables | 22,509 | 5,407 | 4,444 | 62,837 | 79,024 | 101,648 | 85,346 | 84,431 | 106,092 | |||||||||||||||||||||||||||
Participation and residual liabilities in the Pictures segment | — | — | — | 163,007 | 161,433 | 190,162 | 163,007 | 161,433 | 190,162 | |||||||||||||||||||||||||||
Other financial liabilities | 44,668 | 29,106 | 68,793 | 11,484 | 25,235 | 29,050 | 56,152 | 54,341 | 97,843 | |||||||||||||||||||||||||||
Other current liabilities | 179,652 | 192,728 | 242,937 | 1,085,330 | 1,187,975 | 1,296,205 | 1,263,944 | 1,367,527 | 1,488,488 | |||||||||||||||||||||||||||
Total current liabilities | 3,406,291 | 4,150,482 | 5,286,232 | 2,751,488 | 3,231,426 | 3,544,263 | 6,149,340 | 7,353,604 | 8,760,150 | |||||||||||||||||||||||||||
Non-current liabilities: | ||||||||||||||||||||||||||||||||||||
Long-term debt | 276,409 | 361,106 | 470,498 | 662,644 | 692,531 | 733,148 | 939,030 | 1,053,636 | 1,203,646 | |||||||||||||||||||||||||||
Defined benefit liabilities | 34,856 | 35,293 | 37,167 | 294,765 | 231,929 | 217,381 | 329,621 | 267,222 | 254,548 | |||||||||||||||||||||||||||
Deferred tax liabilities | 879,683 | 802,830 | 634,576 | 176,839 | 122,489 | 110,715 | 1,041,156 | 816,587 | 696,492 | |||||||||||||||||||||||||||
Future insurance policy benefits and other *4 | 6,519,577 | 6,614,585 | 7,039,034 | — | — | — | 6,519,577 | 6,614,585 | 7,039,034 | |||||||||||||||||||||||||||
Policyholders’ account in the life insurance business | 3,640,010 | 4,328,894 | 4,791,295 | — | — | — | 3,640,010 | 4,328,894 | 4,791,295 | |||||||||||||||||||||||||||
Participation and residual liabilities in the Pictures segment | — | — | — | 119,702 | 116,537 | 220,113 | 119,702 | 116,537 | 220,113 | |||||||||||||||||||||||||||
Other financial liabilities | 115,949 | 109,537 | 128,208 | 33,399 | 32,446 | 86,391 | 146,834 | 139,417 | 211,959 | |||||||||||||||||||||||||||
Other non-current liabilities | 4,217 | 5,309 | 5,864 | 106,693 | 109,808 | 121,558 | 87,320 | 93,022 | 106,481 | |||||||||||||||||||||||||||
Total non-current liabilities | 11,470,701 | 12,257,554 | 13,106,642 | 1,394,042 | 1,305,740 | 1,489,306 | 12,823,250 | 13,429,900 | 14,523,568 | |||||||||||||||||||||||||||
Total liabilities | 14,876,992 | 16,408,036 | 18,392,874 | 4,145,530 | 4,537,166 | 5,033,569 | 18,972,590 | 20,783,504 | 23,283,718 | |||||||||||||||||||||||||||
Equity: | ||||||||||||||||||||||||||||||||||||
Stockholders’ equity of Financial Services | 3,054,361 | 2,928,525 | 2,577,705 | — | — | — | — | — | — | |||||||||||||||||||||||||||
Stockholders’ equity of Sony without Financial Services | — | — | — | 3,084,820 | 4,341,109 | 5,156,059 | — | — | — | |||||||||||||||||||||||||||
Sony Group Corporation’s stockholders’ equity | — | — | — | — | — | — | 4,874,438 | 6,680,343 | 7,144,471 | |||||||||||||||||||||||||||
Noncontrolling interests | 2,234 | 2,956 | 3,448 | 45,568 | 41,040 | 49,330 | 1,120,038 | 43,996 | 52,778 | |||||||||||||||||||||||||||
Total equity | 3,056,595 | 2,931,481 | 2,581,153 | 3,130,388 | 4,382,149 | 5,205,389 | 5,994,476 | 6,724,339 | 7,197,249 | |||||||||||||||||||||||||||
Total liabilities and equity | ¥ | 17,933,587 | ¥ | 19,339,517 | ¥ | 20,974,027 | ¥ | 7,275,918 | ¥ | 8,919,315 | ¥ | 10,238,958 | ¥ | 24,967,066 | ¥ | 27,507,843 | ¥ | 30,480,967 | ||||||||||||||||||
*1 Refer to “Cash Flows” below for details regarding theincrease in Cash and cash equivalents as of March 31, 2022 in all segments excluding Financial Services segment.
year-on-year
*2 Refer to Note 5 of the consolidated financial statements for the fluctuations of Investments and advances in the Financial Services segment as of March 31, 2021 and March 31, 2022, respectively.
- 43 -
*3 Short-term borrowings as of March 31, 2022 in the Financial Services segment increaseddue to an increase in short-term borrowings mainly at Sony Life.
year-on-year
*4 Future insurance policy benefits and other as of March 31, 2022 in the Financial Services segment increaseddue to an increase in future insurance policy benefits mainly at Sony Life.
year-on-year
Cash Flows
Operating Activities: During the current fiscal year ended March 31, 2022, there was a net cash inflow of 1 trillion 233.6 billion yen from operating activities, an increase of 93.4 billion yen
year-on-year.
For all segments excluding the Financial Services segment, there was a net cash inflow of 813.3 billion yen, a decrease of 337.0 billion yenThis decrease was primarily due to a largerincrease in inventories and content assets, a smaller increase in trade payables and an increase in payments of income taxes, partially offset by the positive impact of aincrease in income before income tax after taking into account
year-on-year.
year-on-year
year-on-year
non-cash
adjustments (including depreciation and amortization, including amortization of contract costs, other operating (income) expense, net and (gain) loss on securities, net (other than the Financial Services segment)).The Financial Services segment had a net cash inflow of 459.7 billion yen, an increase of 449.8 billion yenThis increase was mainly due to a largerincrease in borrowings in the life insurance business and the banking business and a smallerincrease in investments and advances in the financial services business.
year-on-year.
year-on-year
year-on-year
Investing Activities: During the current fiscal year ended March 31, 2022, Sony used 728.8 billion yen of net cash in investing activities, an increase of 164.9 billion yen
year-on-year.
For all segments excluding the Financial Services segment, there was a net cash outflow of 711.1 billion yen, an increase of 169.0 billion yenThis increase was mainly due to payments for the purchase of the equity interest in Ellation, which operates the anime business Crunchyroll, the purchase of 100% of the shares and related assets of certain subsidiaries of Kobalt including AWAL, Kobalt’s music distribution business mainly for independent recording artists, and an additional investment in Epic Games, partially offset by the cash inflow from the transfer of GSN Games, a division of Game Show Network, LLC, and adecrease in payments for fixed asset purchases. Additionally, the previous fiscal year included a payment for an investment in Bilibili.
year-on-year.
year-on-year
The Financial Services segment used 17.6 billion yen of net cash in investing activities, essentially flat
year-on-year.
Financing Activities: Net cash outflow from financing activities during the current fiscal year ended March 31, 2022, was 336.6 billion yen, a decrease of 2.0 billion yen
year-on-year.
For all segments excluding the Financial Services segment, there was a 325.8 billion yen net cash outflow, an increase of 8.3 billion yenThis increase was primarily due to the redemption of straight bonds in this fiscal year, an increase in dividend payments and payments for the repurchase of Sony’s own common stock (7,400,600 shares for a total purchase price of 88.3 billion yen, as of March 31, 2022) which was approved at a meeting of the Board of Directors held on April 28, 2021. The previous fiscal year included the procurement of approximately 2 billion U.S. dollars in the form of a long-term bank loan. Additionally, the previous fiscal year included a total of 396.5 billion yen in short-term bank borrowings to fund the acquisition of all of the shares of SFGI and the related stock acquisition rights for 396.7 billion yen, in order to make SFGI a wholly-owned subsidiary of Sony Group Corporation. These borrowings, which were secured in July and October 2020, were fully repaid by the end of March 2021.
year-on-year.
In the Financial Services segment, there was a 50.1 billion yen net cash outflow, an increase of 9.3 billion yenThis increase was mainly due to an increase in dividend payments.
year-on-year.
Accounting for the above factors and the effect of fluctuations in foreign exchange rates, the total outstanding balance of cash and cash equivalents at March 31, 2022 was 2 trillion 49.6 billion yen. Cash and cash equivalents of all segments excluding the Financial Services segment was 1 trillion 160.5 billion yen at March 31, 2022, a decrease of 129.3 billion yen compared with the balance as of March 31, 2021. Within the Financial Services segment, the outstanding balance of cash and cash equivalents was 889.1 billion yen at March 31, 2022, an increase of 391.9 billion yen compared with the balance as of March 31, 2021.
- 44 -
Information on Cash Flows Separating Out the Financial Services Segment
The following schedule shows unaudited condensed statements of cash flows for the Financial Services segment and all other segments excluding the Financial Services segment. These presentations are not in accordance with IFRS, which is used by Sony to prepare its consolidated financial statements. However, because the Financial Services segment is different in nature from Sony’s other segments, Sony believes that a comparative presentation may be useful in understanding and analyzing Sony’s consolidated financial statements. Transactions between the Financial Services segment and Sony without the Financial Services segment, including noncontrolling interests, are included in those respective presentations, then eliminated in the consolidated figures shown below.
Condensed Statements of Cash Flows
Yen in millions | ||||||||||||||||||||||||
Fiscal year ended March 31 | ||||||||||||||||||||||||
| Financial Services | Sony without Financial Services | Consolidated | ||||||||||||||||||||||
| 2021 | 2022 | 2021 | 2022 | 2021 | 2022 | |||||||||||||||||||
Cash flows from operating activities: | ||||||||||||||||||||||||
Income (loss) before income taxes | 154,765 | 150,111 | 862,786 | 1,006,548 | 997,965 | 1,117,503 | ||||||||||||||||||
Adjustments to reconcile income (loss) before income taxes to net cash provided by (used in) operating activities: | ||||||||||||||||||||||||
Depreciation and amortization, including amortization of contract costs | 23,860 | 24,932 | 663,513 | 810,301 | 687,373 | 835,233 | ||||||||||||||||||
Amortization of deferred insurance acquisition costs | 44,738 | 69,237 | — | — | 44,738 | 69,237 | ||||||||||||||||||
Other operating (income) expense, net | 8,552 | 664 | 5,698 | (66,158 | ) | 14,250 | (65,494 | ) | ||||||||||||||||
(Gain) loss on securities, net (other than Financial Services segment) | — | — | (62,704 | ) | 60,402 | (62,704 | ) | 60,402 | ||||||||||||||||
Change in future insurance policy benefits and other | 358,666 | 458,880 | — | — | 358,666 | 458,880 | ||||||||||||||||||
Change in policyholders’ account in the life insurance business, less cash impact | 558,539 | 238,309 | — | — | 558,539 | 238,309 | ||||||||||||||||||
Net cash impact of policyholders’ account in the life insurance business | 134,299 | 227,262 | — | — | 134,299 | 227,262 | ||||||||||||||||||
Changes in assets and liabilities: | ||||||||||||||||||||||||
(Increase) decrease in trade receivables and contract assets | (4,597 | ) | (53,819 | ) | (141,064 | ) | (121,684 | ) | (137,939 | ) | (171,094 | ) | ||||||||||||
(Increase) decrease in inventories | — | — | (56,509 | ) | (194,624 | ) | (56,509 | ) | (194,624 | ) | ||||||||||||||
(Increase) decrease in investments and advances in the Financial Services segment | (1,901,928 | ) | (1,529,665 | ) | — | — | (1,901,928 | ) | (1,529,665 | ) | ||||||||||||||
(Increase) decrease in content assets | — | — | (325,664 | ) | (489,617 | ) | (325,664 | ) | (489,617 | ) | ||||||||||||||
(Increase) decrease in deferred insurance acquisition costs | (98,122 | ) | (117,337 | ) | — | — | (98,122 | ) | (117,337 | ) | ||||||||||||||
Increase (decrease) in trade payables | 37,044 | 37,885 | 258,994 | 93,660 | 288,854 | 126,989 | ||||||||||||||||||
Increase (decrease) in deposits from customers in the banking business | 333,075 | 230,236 | — | — | 333,075 | 230,236 | ||||||||||||||||||
Increase (decrease) in borrowings in the life insurance business and the banking business | 462,751 | 905,139 | — | — | 462,751 | 905,139 | ||||||||||||||||||
Other | (101,728 | ) | (182,124 | ) | (54,785 | ) | (285,560 | ) | (157,427 | ) | (467,716 | ) | ||||||||||||
Net cash provided by (used in) operating activities | 9,914 | 459,710 | 1,150,265 | 813,268 | 1,140,217 | 1,233,643 | ||||||||||||||||||
Cash flows from investing activities: | ||||||||||||||||||||||||
Payments for property, plant and equipment and other intangible assets | (19,368 | ) | (20,562 | ) | (458,700 | ) | (420,542 | ) | (477,931 | ) | (441,096 | ) | ||||||||||||
Payments for investments and advances (other than Financial Services segment) | — | — | (103,351 | ) | (91,082 | ) | (103,351 | ) | (91,082 | ) | ||||||||||||||
Proceeds from sales or return of investments and collections of advances (other than Financial Services segment) | — | — | 20,352 | 16,081 | 20,352 | 16,081 | ||||||||||||||||||
Other | (2,514 | )�� | 2,914 | (466 | ) | (215,597 | ) | (2,980 | ) | (212,683 | ) | |||||||||||||
Net cash provided by (used in) investing activities | (21,882 | ) | (17,648 | ) | (542,165 | ) | (711,140 | ) | (563,910 | ) | (728,780 | ) | ||||||||||||
Cash flows from financing activities: | ||||||||||||||||||||||||
Increase (decrease) in borrowings, net | (10,389 | ) | (10,975 | ) | 139,062 | (151,721 | ) | 128,683 | (162,696 | ) | ||||||||||||||
Dividends paid | (30,454 | ) | (39,159 | ) | (61,288 | ) | (74,342 | ) | (61,288 | ) | (74,342 | ) | ||||||||||||
Other | (10 | ) | (6 | ) | (395,279 | ) | (99,702 | ) | (405,928 | ) | (99,540 | ) | ||||||||||||
Net cash provided by (used in) financing activities | (40,853 | ) | (50,140 | ) | (317,505 | ) | (325,765 | ) | (338,533 | ) | (336,578 | ) | ||||||||||||
Effect of exchange rate changes on cash and cash equivalents | — | — | 36,685 | 94,369 | 36,685 | 94,369 | ||||||||||||||||||
Net increase (decrease) in cash and cash equivalents | (52,821 | ) | 391,922 | 327,280 | (129,268 | ) | 274,459 | 262,654 | ||||||||||||||||
Cash and cash equivalents at beginning of the fiscal year | 550,039 | 497,218 | 962,484 | 1,289,764 | 1,512,523 | 1,786,982 | ||||||||||||||||||
Cash and cash equivalents at end of the fiscal year | 497,218 | 889,140 | 1,289,764 | 1,160,496 | 1,786,982 | 2,049,636 | ||||||||||||||||||
- 45 -
B. | Liquidity and Capital Resources |
The description below covers basic financial policy and figures for Sony’s consolidated operations except for the Financial Services segment and certain subsidiaries, which secure liquidity on their own. Furthermore, the Financial Services segment is described separately in this section.
Liquidity Management and Market Access
An important financial objective of Sony is to maintain the strength of its financial condition, while securing adequate liquidity for business activities. Sony defines its liquidity sources as the amount of cash and cash equivalents (“cash balance”) (excluding restrictions on capital transfers mainly due to national regulations) and the unused amount of committed lines of credit.
Funding requirements that arise from maintaining liquidity are principally covered by cash flow from operating and investing activities (including asset sales) and by the available cash balance; however, Sony also raises funds as needed from financial and capital markets through means such as corporate bonds, commercial paper (“CP”) and bank loans.
Sony Group Corporation, SGTS and Sony Capital Corporation (“SCC”), a finance subsidiary in the U.S., maintain CP programs with access to the Japanese, U.S. and European CP markets. The borrowing limits under these CP programs, translated into yen, were 1,111.6 billion yen in total for Sony Group Corporation, SGTS and SCC as of March 31, 2022. There were no amounts outstanding under the CP programs as of March 31, 2022.
If disruption and volatility occur in financial and capital markets and Sony becomes unable to raise sufficient funds from these sources, Sony may also draw down funds from contractually committed lines of credit from various financial institutions. Sony has a total, translated into yen, of 611.4 billion yen in unused committed lines of credit, as of March 31, 2022. Details of those committed lines of credit are: a 275.0 billion yen committed line of credit contracted with a syndicate of Japanese banks, a 1.7 billion U.S. dollar multicurrency committed line of credit also contracted with a syndicate of Japanese banks and a 1,050 million U.S. dollar multi-currency committed line of credit contracted with a syndicate of foreign banks. Sony currently believes that it can sustain sufficient liquidity through access to committed lines of credit with financial institutions, together with its available cash balance, even in the event that financial and capital markets become illiquid.
Sony considers one of management’s top priorities to be the maintenance of stable and appropriate credit ratings in order to ensure financial flexibility for liquidity and capital management and continued adequate access to sufficient funding resources in the financial and capital markets. However, in the event of a downgrade in Sony’s credit ratings, there are no financial covenants in any of Sony’s material financial agreements with financial institutions that would cause an acceleration of the obligation. Even though the cost of borrowing for some committed lines of credit could change according to Sony’s credit ratings, there are no financial covenants that would cause any impairment on the ability to draw down on unused facilities.
Cash Management
Sony manages its global cash management activities primarily through Sony Group Corporation in Japan, SCC in the U.S. and SGTS in other regions. The excess or shortage of cash at most of Sony’s subsidiaries is invested or funded by Sony Group Corporation, SGTS and SCC on a net basis, although Sony recognizes that fund transfers are limited in certain countries and geographic areas due to restrictions on capital transactions. In order to pursue more efficient cash management, cash surpluses among Sony’s subsidiaries are deposited with Sony Group Corporation, SGTS and SCC, and cash shortfalls among subsidiaries are covered by loans through Sony Group Corporation, SGTS and SCC, so that Sony can make use of excess cash balances and reduce third-party borrowings. Where local restrictions prevent an efficient intercompany transfer of funds, Sony’s intent is that cash balances remain outside of Sony Group Corporation, SGTS and SCC and that Sony meets its liquidity needs through ongoing cash flows, external borrowings, or both. Sony does not expect restrictions of capital transactions on amounts held outside of Japan to have a material effect on Sony’s overall liquidity, financial condition or results of operations.
Financial Services segment
The management of SFGI, Sony Life, Sony Assurance and Sony Bank recognizes the importance of securing sufficient liquidity to cover the payment of obligations that these companies incur in the ordinary course of business. Sony Life, Sony Assurance and Sony Bank maintain a sufficient cash balance and secure sufficient
- 46 -
means to meet their obligations while abiding by laws and regulations such as the Insurance Business Act or the Banking Act of Japan, and restrictions imposed by the FSA and other regulatory authorities as well as establishing and operating under company guidelines that comply with these regulations. Sony Life and Sony Assurance establish a sufficient level of liquidity for the smooth payment of insurance claims by investing, primarily in securities, their cash inflows, which come mainly from policyholders’ insurance premiums. Sony Bank maintains a necessary level of liquidity for the smooth settlement of transactions by using its cash inflows, which come mainly from customers’ deposits in local currency, to offer mortgage loans to individuals and to invest mainly in marketable securities. Cash inflows from customers’ deposits in foreign currencies are invested mainly in investment instruments of the same currency.
In addition, Sony’s subsidiaries in the Financial Services segment are subject to the Japanese Insurance Business Act and Banking Act, which require insurance and business companies to maintain their financial credibility and to secure protection for policyholders and depositors in view of the public nature of insurance and banking services. As such, lending and borrowing between subsidiaries in the Financial Services segment and the other companies within Sony Group is strictly limited. Sony’s subsidiaries in the Financial Services segment are managed separately from Sony’s cash management activities through Sony Group Corporation, SGTS and SCC as mentioned above.
For further information about Sony’s views regarding utilization of cash flow from operating activities generated within the Sony Group for strategic investments, shareholder returns and as cash on hand, refer to “Issues Facing Sony and Management’s Response to those Issues: Fourth
Mid-Range
Plan — Financial Targets and their Progress.”Off-balance
Sheet ArrangementsSony has certain
off-balance
sheet arrangements that provide liquidity, capital resources and/or credit risk support.Refer to Note 28 of the consolidated financial statements for various arrangements with structured entities, including those where Sony does not control the entities and therefore does not consolidate such entities.
Contractual Obligations, Commitments, and Contingent Liabilities
Sony’s contractual obligations, commitments and contingent liabilities are summarized as follows:
Short-term borrowings and long-term debt
Refer to Note 6 and Note 14 of the consolidated financial statements.
Loan commitments, purchase commitments and litigation
Refer to Note 33 of the consolidated financial statements.
Insurance contract liabilities
Refer to Note 13 of the consolidated financial statements.
C. | Research and Development |
As a creative entertainment company with a solid foundation of technology, Sony promotes R&D based on its Purpose to “fill the world with emotion (or Kando) through the power of creativity and technology.” Sony also believes that it is essential to align itself with the motivations of both creators and users in order to achieve its corporate direction of “getting closer to people.” Sony aims to contribute to solving the challenges that people, society and the planet face through its diverse products, content and services, which have evolved based on people and technology.
In Corporate R&D (Sony Group Corporation’s R&D organization), Sony invests resources based on established financial discipline while envisioning the future business portfolio of the entire Sony Group. Prioritizing technologies that are expected to have applications in a variety of businesses, Sony will focus on areas of technology such as the “3R Technologies” of Reality, Real-time and Remote, as well as AI, sensing and security.
Corporate R&D carries out various research and development activities in collaboration with multiple R&D organizations located in Japan, China, India, Europe and the United States, utilizing the different characteristics
- 47 -
and strengths of each area. While striving to attract skilled research personnel locally, Corporate R&D aims to promote further collaboration between the various businesses within the Sony Group. Additionally, Corporate R&D continues to strive to enhance ease of movement for management and personnel between each R&D organization and strengthen its R&D from more diverse perspectives. For cross-sectional projects such as those in the entertainment and financial services areas, Corporate R&D assembles teams with members from various organizations to promote R&D activities through the flexible and efficient collection of knowledge. Corporate R&D is also proactively taking part in open innovation, including collaboration with universities and other research institutions, in an effort to gain insight into the motivations of creators and users from a wider perspective to enhance the potential of its business.
R&D costs for the fiscal year ended March 31, 2022 increased by 73.0 billion yen to 618.4 billion yen. The ratio of R&D costs to total revenue excluding the Financial Services segment was 7.4%, unchanged from the previous fiscal year.
The following table shows a breakdown of R&D costs for each business segment and Corporate R&D in the fiscal years ended March 31, 2021 and 2022.
Fiscal year ended March 31 | ||||||||
| 2021 | 2022 | |||||||
(Yen in billions) | ||||||||
R&D costs | ||||||||
G&NS | 144.6 | 175.7 | ||||||
EP&S* | 142.3 | 141.8 | ||||||
I&SS | 168.9 | 198.0 | ||||||
Corporate R&D | 43.3 | 48.7 | ||||||
* R&D costs in the EP&S segment for the fiscal year ended March 31, 2021 are reclassified to conform to the scope of R&D costs for the fiscal year ended March 31, 2022 due to a change in the scope of expenses included in R&D costs of the EP&S segment in the fiscal year ended March 31, 2022. As a result of this reclassification, R&D costs for EP&S have increased by 7.8 billion yen in the fiscal year ended March 31, 2021 compared to the amount before the reclassification. This change of the scope of R&D costs does not affect Sony’s consolidated R&D costs or operating income of the EP&S segment for the fiscal year ended March 31, 2021.
D. | Trend Information |
This section contains forward-looking statements about the possible future performance of Sony and should be read in light of the cautionary statement on that subject, which appears on the inside front cover page and applies to this entire document.
Issues Facing Sony and Management’s Response to those Issues
In the fiscal year ended March 31, 2022, the global economy recovered moderately as balanced measures to curb
COVID-19
infections and expand economic activities were implemented around the world, despite the impact of a resurgence of new strains ofCOVID-19.
On the other hand, the outlook for the global economy remains difficult to predict due to the economic sanctions, rapid fluctuations in foreign exchange rates and heightened resource prices triggered by Russia’s military invasion of Ukraine in February 2022 as well as inflation mainly in the United States.Sony has a wide range of businesses globally. In addition to these changes in the global economy, continuing global shortages of semiconductors and other components and disruptions in logistics are impacting each of Sony’s business segments.
Sony has responded swiftly to changes in the business environment and worked to strengthen the profit structure of each business, while continuing to prioritize management with a long-term view, with the goal of enhancing the corporate value of the entire Sony Group.
On May 18, 2022, Sony held its Corporate Strategy Meeting for the fiscal year ending March 31, 2023. Chairman, President and CEO Kenichiro Yoshida explained that Sony continues to engage in management with a long-term view, based on its Purpose (or reason for being) to “fill the world with emotion (or Kando) through the power of creativity and technology,” and its corporate direction of getting closer to people. He emphasized Sony’s “Responsibility” and “Contribution” to people, society and the Earth, and outlined the investment and growth Sony is making across its three business domains centered on people. He then presented the initiatives that Sony is implementing to support the evolution of entertainment through the power of creativity and
- 48 -
technology, including further strengthening its content IP and DTC services in its three entertainment businesses that “move people’s hearts,” its efforts to create new entertainment experiences in the Kando space centered around the metaverse and mobility, and its technological advancements centered around sensing technology that captures the real world and artificial intelligence (“AI”) that learns from the world. The details are as follows.
Responsibility and Contribution to People, Society and the Earth
Based on its Purpose, Sony is continuously devoted to management with a long-term view, centered around Kando and people, including creators, users and employees. Sony is also advancing initiatives across its businesses to fulfill its corporate responsibility to society and the global environment, and contribute through its technology and businesses. Sony is accelerating, by 10 years, its targets of achieving 100% renewable electricity use (RE100) and achieving carbon neutrality for the entire Sony Group.
Investment and Growth in Three Business Domains Centered on People
| • | Businesses that “move people’s hearts”: G&NS business, Music business and Pictures business |
| • | Over the past four years Sony has executed over 1 trillion yen in strategic investments to enhance its content IP and DTC services. |
| • | In the DTC space, Sony values its relationships with partners, and has a long-term vision of directly connecting the Sony Group with 1 billion people interested in entertainment. |
| • | Businesses that “connect people to people”: ET&S business and I&SS business |
| • | Provide technology, products and services to creators who create Kando content and to the users who experience it. |
| • | In the I&SS business, Sony has invested approximately 1 trillion yen in its image sensors over the last four years, and retains a leading share of the image sensor market. It also intends to advance its initiatives in automotive and IoT sensing as growth areas. |
| • | Businesses that “support people”: Medical business and Financial Services business |
| • | In the medical business, products that leverage Sony’s optical disc technology to study cells are contributing to research on cancer and viruses, and to the manufacture of cellular medicine. |
| • | The financial services business provides peace of mind and convenience in daily life to over 8 million customers through its life insurance, non-life insurance and banking services and products. |
| • | Sony has set growth in EPS (earnings per share) over the long-term as a crucial discipline for management, and intends to continue to make strategic investments for growth focused around content IP, DTC services and technology. Sony has also positioned the repurchase of its shares as part of its strategic investment, and plans to continue to make repurchases in a flexible manner. |
Initiatives in Three Entertainment Businesses that “Move People’s Hearts” — Content IP / DTC Services
Sony’s G&NS, Music and Pictures businesses that “move people’s hearts” have continuously grown since the fiscal year ended March 31, 2013. Their total sales exceeded 50% of Sony’s consolidated sales for the first time in the fiscal year ended March 31, 2022, and their operating income accounted for
two-thirds
of consolidated operating income.| • | G&NS business |
| • | Implemented initiatives to get closer to creators through the creation of IP while also getting closer to users through DTC services. |
| • | Consoles: Sony plans to achieve further growth with the 18 million PS5 ™ units it expects to sell during the fiscal year ending March 31, 2023. |
| • | Network services: PlayStation ™ Network (“PSN”) has generated more than 1 trillion 800 billion yen in cumulative sales over the network and more than 100 million accounts* access the service currently. A major renewal of the PlayStation® Plus subscription service is scheduled to roll out in June 2022 in order to strengthen PSN. |
- 49 -
| • | First-party studios: While Sony will continue to value its relationships with third-party studios, PlayStation Studios, which are its first-party studios, made numerous acquisitions and equity investments over the past year. |
| • | Sony Interactive Entertainment signed definitive agreements for the acquisition of Bungie, which represents a major step in becoming more multi-platform and enhancing Sony’s live game services. |
* As of the end of March 2022.
| • | Music business |
| • | Sony aims to be the closest company to artists and songwriters, and is focused on supporting them from the creative side. As a leader in the industry, which has been expanding since 2014 due to the growth of streaming services, Sony is continuously producing hits. |
| • | Independent labels: Sony provides various support to independent artists through The Orchard. Sony has also acquired the Brazilian music label Som Livre and launched a new label in India as part of its efforts to make more artists in growing emerging markets known to the world. |
| • | Independent artists: Sony is also strengthening its support of independent artists through AWAL, which provides them with music production and distribution services. |
| • | Expansion of distribution partners: In addition to distribution partners who operate streaming services, Sony is also collaborating with various service partners to expand the reach of its artists. |
| • | In Japan, Sony is engaging in efforts to discover and nurture artists through “social” initiatives. |
| • | Pictures business |
| • | As in the Music business, Sony is working to support creators, as well as to create and expand content IP. |
| • | Strengthening IP creation capability: Sony has made several acquisitions including drama production studios in the Television Productions space. |
| • | Expansion of the Sony Pictures Universe of Marvel Characters: In the Motion Pictures space, Sony continues to emphasize theaters. Spider-Man: No Way HomeMorbius |
| • | IP development that takes advantage of the diversity of the Sony Group: Sony is also creating film and television productions based on game IP. In addition to the movie Uncharted |
| • | DTC based on Communities of Interest: While continuing to value its collaboration with theaters and distribution partners, Sony is also expanding its DTC services based around “Communities of Interest” (where people share Kando experiences and similar interests). These include Crunchyroll for anime fans and SonyLIV in India, which is rooted in local culture. At the end of 2021, definitive agreements were reached to merge SPNI, a subsidiary of SPE, and Zee. Sony believes that the merger represents an opportunity to further accelerate the expansion and digitization of its business by using the strengths of both companies to strengthen its digital distribution service in the rapidly-growing Indian media and entertainment market. |
Creating New Entertainment Experiences in the Kando Space — Two Growth Areas of Metaverse and Mobility
As experiences over the network evolve through technology to become more “live,” Sony intends to leverage the unique strengths provided by its diverse businesses and expertise in game technology, which will form the basis of entertainment experiences going forward, creating new entertainment experiences in the area of the metaverse, where growth is anticipated. Furthermore, in the mobility growth area Sony will proceed with efforts to transform the moving space into a new entertainment space, and contribute to the evolution of mobility.
| • | Initiatives in the metaverse/live network space |
| • | From live services in the game space to its partnership with Manchester City Football Club in the sports space, and live virtual performances by Sony Music artists in the music space, Sony is strengthening its initiatives to create new live entertainment experiences. |
- 50 -
| • | Contribution in the mobility space |
| • | Sony aims to contribute to mobility in the three areas of safety, entertainment and adaptability. Sony is proceeding with discussions as part of its strategic alliance with Honda Motor Co., Ltd. (“Honda”), and Sony and Honda aim to start selling electric vehicles developed through this alliance in 2025. |
Technology that Supports the Evolution of Entertainment — Sensing and AI Technology
Sensing and AI technologies play an important role in Advanced Driver Assistance Systems (ADAS), which supports the safety of mobility. These technologies are also increasingly important in the area of audio and video that Sony has been working on for many years. For example, they are evolving image recognition capabilities in the image capturing process, and are also being used in areas such as game and movie production, as well as 3D model production. Furthermore, Sony also intends to support the evolution of the entertainment space in areas such as virtual production, sports and VR, through its sensing technology that captures the real world and the AI technology that learns from the world.
| • | Technology that gets closer to creators |
| • | Examples include virtual production that uses Crystal LED, and Hawk-Eye Innovations’ tracking system that converts athletes’ movements into data using advanced AI. |
| • | Technology that gets closer to users |
| • | Includes the PlayStation ® VR2 next-generation virtual reality system, an AI agent that increases the value of the experience in the game space, and aibo, which stays close to and grows together with people by acting on its own innate curiosity. |
Fourth
Mid-Range
Plan — Financial Targets and their Progress<Financial Targets>
On April 28, 2021, Sony announced the financial targets for a fourth
mid-range
plan (“fourthmid-range
plan”) that charts the path forward for Sony over the next three fiscal years, started on April 1, 2021 and ending on March 31, 2024. In order to continue managing Sony with a long-term view, Sony’s management established a three-year cumulative key performance indicator. That indicator, which is the most important metric of group performance for the fourthmid-range
plan, is Adjusted EBITDA*. Sony announced that it would target total Adjusted EBITDA of 4.3 trillion yen on a consolidated basis for the three fiscal years started on April 1, 2021 and ending on March 31, 2024. Management believes that Adjusted EBITDA is a performance metric suitable for the long-term management that Sony prioritizes. This is because (i) it represents the sustainable earnings power of a business as it does not include the effects ofone-time
gains and losses, (ii) it enables management to confirm that all the businesses of the Sony Group, including the Financial Services business, are expanding over themid-
to long-term through cycles of investment and return, and (iii) it is often used to calculate corporate value.Regarding the capital allocation plan in the fourth
mid-range
plan, Sony established a capital expenditure target of 1.5 trillion yen and a strategic investment target of 2 trillion yen or more including share repurchases as it aims to grow its business over the longer-term, beyond the duration of the plan. As in the past, Sony plans to increase dividends in a stable manner over the long term. Sony expects to fund its allocation of capital through expected cash generation of 3.8 trillion yen or more over the three fiscal years started on April 1, 2021 and ending on March 31, 2024. The expected cash generation includes 3.1 trillion yen or more of consolidated operating cash flow excluding the Financial Services segment, 300 billion or more of cash flow generated from the sale of businesses and assets executed as needed as well as borrowing with a strict eye on financial discipline, and 400 billion of cash left-over from the period of the thirdmid-range
plan started on April 1, 2018 and ended on March 31, 2021 and before.<Progress>
Adjusted EBITDA for the fiscal year ended March 31, 2022 was 1 trillion 597.9 billion yen**. Sales are on a higher growth curve than originally expected, driven by growth in Sony’s four priority investment areas: the G&NS, Music, Pictures and I&SS segments. Sony also expects operating income to increase significantly compared to the third
mid-range
plan started on April 1, 2018 and ended on March 31, 2021.- 51 -
Regarding capital allocation, Sony plans to increase capital expenditures in the I&SS segment by approximately 200 billion yen compared to the original plan to respond to the robust demand for image sensors and to capture growth opportunities, while the plan to make strategic investments of 2 trillion yen or more remains unchanged. A total of approximately 1 trillion 60 billion yen of strategic investments have been executed or determined already (as of May 10, 2022), including 97.4 billion yen in repurchases of Sony’s stock (as of April 28, 2022), and Sony believes that investments for the long term growth are progressing steadily. In terms of share repurchases, Sony has obtained an additional authorization to repurchase a maximum of 200 billion yen of Sony’s stock for the period from May 11, 2022 to May 10, 2023. These repurchases continue to be part of Sony’s strategic investments and are expected to be implemented in a flexible manner.
* Adjusted EBITDA (Earnings Before Interest, Taxes, Depreciation and Amortization) = Net income attributable to Sony Group Corporation’s stockholders + Net income attributable to noncontrolling interests + Income taxes + Interest expenses, net, recorded in Financial income and Financial expense — Gain on revaluation of equity instruments, net, recorded in Financial income and Financial expense + Depreciation and amortization expense excluding amortization for film costs and broadcasting rights included in Content assets as well as deferred insurance acquisition costs — the profit and loss amount that Sony deems to be
non-recurring***
.Adjusted EBITDA is not a measure in accordance with IFRS. However, Sony believes that this disclosure may be useful information to investors. Adjusted EBITDA should be considered in addition to, not as a substitute for, Sony’s results and cash flows in accordance with IFRS.
** The following table shows a reconciliation of net income attributable to Sony Group Corporation’s stockholders reported in accordance with IFRS to Adjusted EBITDA for the fiscal year ended March 31, 2022.
Fiscal year ended March 31 | ||||
2022 | ||||
(Yen in billions) | ||||
Net income attributable to Sony Group Corporation’s stockholders | 882.2 | |||
Net income attributable to noncontrolling interests | 6.2 | |||
Income taxes | 229.1 | |||
Interest expenses, net, recorded in Financial income and Financial expense | 7.6 | |||
Gain on revaluation of equity instruments, net, recorded in Financial income and Financial expense | (66.2 | ) | ||
Depreciation and amortization expense excluding amortization for film costs and broadcasting rights included in Content assets as well as deferred insurance acquisition costs | 470.4 | |||
Profit and loss amount that Sony deems to be non-recurring*** | (63.8 | ) | ||
Adjusted EBITDA | 1,597.9 | |||
*** The table below shows the details of the profit and loss amount that Sony deems to be
non-recurring
for the fiscal year ended March 31, 2022.Fiscal year ended March 31 | ||||
2022 | ||||
(Yen in billions) | ||||
Gain from the transfer of certain operations of Game Show Network, LLC (Pictures Segment) | 70.0 | |||
One-time loss recorded at a subsidiary of Sony Life (Financial Services segment) | (16.8 | ) | ||
The share of profit of the investment in M3 related to a gain on a change in M3’s equity interest in an affiliated company, resulting from the issuance of new shares in connection with the affiliated company’s public listing (All Other) | 5.1 | |||
Settlement gain in connection with the termination of the defined benefit pension plan at certain U.S. subsidiaries (mainly in Corporate and elimination) | 5.5 | |||
Total | 63.8 | |||
- 52 -
For details on the performance of each business segment in the fiscal year ended March 31, 2022, as well as the business environment and strategy of each business segment, also refer to “Operating Results” in “Item 5.”
Operating and Financial Review and Prospects.
Corporate Policy Regarding the Spread of
COVID-19
Sony is primarily focused on ensuring the safety of its employees and their families, as well as its customers and other stakeholders, in addition to preventing the further spread of
COVID-19.
Sony is also striving to answer the needs of society and its customers to the best of its ability, and to minimize the impact of the virus on its business. To accomplish these objectives, Sony is working to gather information and swiftly carry out necessary actions. As discussed above, Sony is also continuing to fulfill its social responsibility as a global company through various measures such as establishing a relief fund to support people around the world who have been affected by the spread ofCOVID-19.
For details of actual measures undertaken by Sony, refer to the following website: https://www.sony.com/en/SonyInfo/covid_19_response/.Group Medium-Term Environmental Targets “Green Management 2025”
Sony’s long-term vision was to achieve a “zero environmental footprint” throughout all stages of its product lifecycles and business activities by 2050 in the perspectives of climate change, resources, chemical substances and biodiversity. As climate change risks become more apparent and serious worldwide, and the transition to a decarbonized society has become an urgent issue, Sony made the decision in May 2022 to accelerate its environmental impact reduction activities and to bring forward the target year of achieving a zero environmental footprint in the climate change area by ten years. Additionally, Sony’s medium-term environmental targets have been created by backcasting (calculated backwards) in order to determine the necessary intermediate steps that need to be taken by the end of the fiscal year ending March 31, 2026 to achieve this long-term goal.
In September 2020, Sony Group Corporation announced the establishment of group environmental medium-term targets under Green Management 2025, effective from the fiscal year ended March 31, 2022 through the fiscal year ending March 31, 2026. Based on the following four pillars, Sony is implementing various initiatives to reduce the Sony Group’s environmental footprint:
| • | Reduce the amount of plastic and energy used by products |
In response to the serious and growing problem of ocean plastic pollution, Sony aims to implement the following initiatives to reduce the amount of plastic:
| • | Packaging materials: eliminate plastic packaging from newly-designed small electronics products and reduce the amount of plastic packaging per product unit by 10%* for other product sizes. |
| • | Electronics products: reduce the amount of virgin oil-based plastics per product unit by 10%* and accelerate the introduction of recycled plastics. |
| • | Power consumption: reduce the amount of annual power consumption per product unit by 5%* because product use accounts for a majority of lifecycle GHG (“greenhouse gas”) emissions of a product. |
* Average reduction rate compared to the level for the fiscal year ended March 31, 2019.
| • | Implement measures to mitigate climate change at facilities, such as expanding the use of renewable energy |
Sony Group Corporation has joined RE100, an initiative operated by the international
non-government
organization The Climate Group and CDP. It aims to use 100% renewable electricity at all of its business facilities. In May 2022, Sony announced the acceleration of the goal of achieving 100% renewable electricity used at its own sites by ten years, from 2040 to 2030. Sony plans to increase its usage rate of renewable electricity to 35%* or more of total electricity use at its facilities globally and is pursuing implementation efforts tailored to each region where its facilities are located.* Under Green Management 2025, in accordance with RE100’s provisions, the amount of renewable electricity used at facilities is set as a percentage target.
| • | Enhance engagement with raw material and component suppliers and subcontractors along the supply chain |
In order to reduce the environmental impact of its supply chain, Sony has requested the cooperation of its raw materials and component suppliers and manufacturing subcontractors. In accordance with Green Management 2025, Sony will further enhance its engagement with them as follows.
- 53 -
| • | Set mid- and long-term targets for GHG emission reduction that take into consideration the long-term reduction targets sought by the international community, and perform progress management |
| • | Set water consumption reduction targets and perform progress management, which take into consideration the water depletion risk in the areas where each site is located. |
| • | Continue to prohibit the use of certain substances specified by Sony in its manufacturing processes and perform appropriate management. |
| • | Strengthen efforts, particularly in the entertainment field, to raise awareness of sustainability issues |
Through activities such as hosting special events and utilizing characters from animated movies, the entire Sony Group has helped to raise awareness of the Sustainable Development Goals (SDGs), including those in relation to the environment, to more than 2 billion people around the world. Sony will continue to promote these activities and, primarily through its entertainment content, will seek to encourage more than 2.5 million people to engage in environmental activities.
Sony was the first Japanese company to have its Green Management 2020 climate change targets approved as Science-Based Targets (SBT)*. Sony has taken into consideration its long-term goals when formulating its climate change targets for Green Management 2025, and the climate change target to be achieved by the end of the fiscal year ending March 31, 2036 has been again approved by SBT as a 1.5°C target. Green Management 2025 serves as a milestone toward the climate change target.
* An international initiative to encourage companies to set science-based greenhouse gas reduction targets in order to limit the increase in the average global temperature due to climate change to 1.5 degrees Celsius above
pre-industrial
levels.Sony Group Corporation also plans to continue to participate in the World Wildlife Fund (WWF)’s Climate Savers Programme, which aims to achieve reductions in greenhouse gas emissions. Sony’s climate change targets are verified by WWF and a third-party verification body for their degrees of difficulty and progress.
Further details of Green Management 2025 and actual measures undertaken by Sony are reported in Sony’s Sustainability report available on the following website: https://www.sony.com/en/SonyInfo/csr_report/.
E. | Critical Accounting Estimates |
The preparation of the consolidated financial statements in conformity with IFRS requires management to make estimates and assumptions that affect the reported amounts of assets and liabilities, disclosure of contingent assets and liabilities at the date of the financial statements, and the reported amounts of revenues and expenses during the reporting period. On an ongoing basis, Sony evaluates its estimates, which are based on historical experience, future projections and various other assumptions that are believed to be reasonable under the circumstances. The results of these evaluations form the basis for making judgments about the carrying values of assets and liabilities and the reported amounts of expenses that are not readily apparent from other sources. Actual results may significantly differ from these estimates. The timing and extent to which the spread of
COVID-19
may negatively impact Sony’s business will depend on future developments, which are uncertain. This uncertainty could result in greater variability in accounting estimates and assumptions. Sony considers an accounting estimate to be critical if it is important to its financial condition and results, and requires significant judgment and estimates on the part of management in its application. Sony believes that the following represents its critical accounting estimates. The critical accounting estimates should be read in conjunction with Note 3 of the consolidated financial statements regarding Sony’s significant accounting policies.Financial instruments
Sony recognizes a financial instrument as a financial asset or a financial liability when Sony becomes party to the contractual provisions of the instrument. Financial assets and financial liabilities are initially measured at fair value.
Financial instruments held by Sony are classified according to the measurement method, and for financial instruments measured at fair value, future fluctuations in fair value may have a significant impact on the consolidated financial statements.
The assessment of credit losses for debt securities is often subjective in nature and involves certain assumptions and estimates concerning the credit risk ratings, expected operating results, business plans and
- 54 -
future cash flows of the issuer of the security. Accordingly, it is possible that Sony will record an allowance for credit losses for debt securities in the future, where such an allowance for credit losses is not currently recorded based on the assessment of subsequently available information such as a deterioration in the credit risk rating, continued poor operating results, future broad declines in the value of worldwide equity markets and the effect of worldwide interest rate fluctuations. As a result, downward adjustments in income may be recorded in the future due to the recording of such allowance for credit losses.
Impairment of
non-financial
assetsSony reviews the recoverability of its
non-financial
assets, except for inventories, contract costs and deferred tax assets, whenever there is any indication that an asset or a cash-generating unit (“CGU”) may be impaired. In addition, an annual impairment test for goodwill, intangible assets with indefinite useful lives or intangible assets not yet available for use is performed during the fourth quarter of the fiscal year for each CGU or group of CGUs to which the carrying amount of these assets is allocated.For all CGUs or groups of CGUs with goodwill, the recoverable amount exceeded the carrying amount, and therefore no impairment existed in the fiscal year ended March 31, 2022. Also, the recoverable amount of each CGU or group of CGUs with significant goodwill exceeded their respective carrying values by at least 10.0%. For intangible assets with indefinite useful lives or intangible assets not yet available for use, the recoverable amount exceeded the carrying amount, and therefore no impairment existed.
A discussion of the significant assumptions, other than the
mid-range
plan, including a sensitivity analysis with respect to their impact, of the recoverable amount of each CGU or group of CGUs for the impairment analysis for goodwill performed for the fiscal year ended March 31, 2022 is included below:| • | The post-tax discount rates ranged from 3.2% to 15.0%. A hypothetical one percentage point increase in the discount rate, holding all other assumptions constant, would not have resulted in an impairment. |
| • | The growth rates applied to the terminal values for the CGUs within the G&NS, EP&S and I&SS and Financial Services segments ranged from approximately 1.0% to 1.5%. The growth rates beyond the mid-range plan period for the CGUs in the Music segment ranged from 1.0% to 2.5%, and in the Pictures segment ranged from (5.0%) to 16.0%. A hypothetical one percentage point decrease in the growth rate, holding all other assumptions constant, would not have resulted in an impairment. |
| • | The earnings multiple used to calculate the terminal value in the Pictures CGU was 6.0x to 11.0x and the revenue multiple was 1.5x to 2.0x. A hypothetical reduction in earnings multiple by 1.0x and revenue multiple by 0.25x, respectively, holding all other assumptions constant, would not have resulted in an impairment. |
Management believes that the assumptions used in the impairment tests are reasonable, including, but not limited to, the potential impacts arising from the spread of
COVID-19;
however, in the future, changes in estimates resulting in lower recoverable amounts due to unforeseen changes in assumptions could negatively affect the valuations, which may result in Sony recognizing impairment losses fornon-financial
assets.Business combinations
Sony recognizes identifiable assets acquired and the liabilities assumed of an acquiree at their fair values at the acquisition date with limited exceptions. Sony recognizes goodwill when the aggregate of the consideration transferred in a business combination, the amount of any
non-controlling
interests in the acquiree and the fair value of Sony’s previously held equity interest in the acquiree exceeds the net amount of the identifiable assets and liabilities of the acquiree at the acquisition date. If the aggregate above is less than the net amount of identifiable assets and liabilities, the difference is recognized as a gain.Due to the inherent uncertainties involved in making the estimates and assumptions, the consideration transferred could be valued and allocated to the identifiable assets acquired and liabilities assumed differently. Actual results may differ, or unanticipated events and circumstances may affect such estimates, which could require Sony to record an impairment of an identifiable asset acquired and goodwill, or increase in the amounts recorded for identifiable liabilities assumed.
Estimation of ultimate revenue in the Pictures segment
An aspect of film accounting that requires the exercise of judgment relates to the process of estimating the total revenues to be received throughout a film’s life cycle. Such estimate of a film’s ultimate revenue is important for the measurement of film costs and participation and residual liabilities in the Pictures segment.
- 55 -
While a film is being produced and the related costs are being capitalized, it is necessary for management to estimate the ultimate revenue, less additional costs to be incurred, including exploitation costs which are expensed as incurred, in order to determine whether the value of a film has been impaired and thus requires an immediate
write-off
of unrecoverable film costs. In addition, the amount of film costs recognized as cost of sales for a given film as it is exhibited in various markets throughout its life cycle is based on the ratio of current period actual revenues to the estimated remaining total revenues.Management bases its estimates of ultimate revenue for each film on several factors including the historical performance of similar genre films, the star power of the lead actors, the expected number of theaters at which the film will be released, anticipated performance in the home entertainment, television and other ancillary markets, and agreements for future sales. Management updates such estimates on a regular basis based on the actual results to date and estimated future results for each film. For example, a film with lower than expected theatrical revenues in its initial weeks of release would generally have its theatrical, home entertainment and television distribution ultimate revenues adjusted downward; a failure to do so would result in the understatement of amortized film costs for the period. Also, participation and residual liabilities are accrued based on the ratio of current period actual revenues to the estimated remaining total revenues.
Valuation of deferred tax assets
Deferred tax assets are recognized to the extent that it is probable that taxable profit will be available against which the assets can be utilized. Accordingly, the valuation of deferred tax assets is assessed periodically with available evidence related to the realizability of the deferred tax assets.
The valuation of deferred tax assets, which is based on currently enacted tax laws and rates as of the end of the reporting period, reflects management’s judgment and best estimate of the likely future tax consequences of events that have been recognized in Sony’s financial statements and tax returns, the ability to implement various tax planning strategies and, in certain cases, future forecasts, business plans and other expectations about business outcomes. Changes in existing tax laws or rates in tax jurisdictions in which Sony operates could affect actual tax results, and market or economic deterioration or failure of management to achieve its restructuring objectives could affect future business results, either of which could affect the valuation of deferred tax assets over time. If future results are less than projected, if the results of tax examinations or the negotiations of advance pricing agreements covering transfer pricing of intercompany transactions result in a different allocation of profits and losses than currently anticipated, if tax planning alternatives are no longer viable, or if there is no excess appreciated asset value over the tax basis of the assets contemplated for sale, outstanding deferred tax assets may be required to be written down in the future. On the other hand, a forecasted improvement and consistency in future earnings or other factors, such as business reorganizations, could lead in the future, as a result of a review of all relevant factors, to the reversal of the previous write down of the deferred tax assets which would be recorded as a reduction to tax expense. These possible factors and other changes, that are not anticipated in current estimates, could have a material impact on Sony’s earnings or financial condition in the period or periods in which the impact is recorded or reversed.
Deferred insurance acquisition costs
Costs that vary with and are directly related to the acquisition or renewal of insurance policies are deferred as long as they are recoverable. The deferred insurance acquisition costs include such items as commissions, medical examination costs and inspection report fees, and are subject to recoverability testing at least annually to ensure that the capitalized amounts do not exceed the present value of anticipated gross profits or premiums less benefits and maintenance expenses, as applicable. The deferred insurance acquisition costs for traditional life insurance contracts are amortized over the premium-paying period of the related insurance policies using assumptions consistent with those used in computing future insurance policy benefits. The deferred insurance acquisition costs for
non-traditional
life insurance contracts are amortized over the expected life at a constant rate based on the present value of the estimated gross profit. Investment yields, mortality rates, lapse rates and discount rates are used as important assumptions for the present value of the estimated gross profit.Future insurance policy benefits
Liabilities for future insurance policy benefits are primarily comprised of the present value of estimated future payments to policyholders. These liabilities are computed by the net level premium method based upon the assumptions as to future investment yield, morbidity rates, mortality rates, lapse rates and other factors. These assumptions are reviewed on a periodic basis. Liabilities for future policy benefits include the liabilities for the minimum guarantee benefits of variable annuities and variable life insurance contracts.
- 56 -
Policyholders’ account in the life insurance business
Liabilities for policyholders’ account in the life insurance business represent the contract value that has accrued to the benefit of the policyholders as of the end of the reporting period. This liability is generally equal to the accumulated account deposits, plus interest credited, less policyholder withdrawals and other charges assessed against the account balances. Liabilities for policyholders’ account in the life insurance business include the liabilities related to the variable annuities and variable life insurance contracts with minimum guarantee benefits.
Item 6. | Directors, Senior Management and Employees |
A. | Directors and Senior Management |
Set forth below are the current members of the Board of Directors and Corporate Executive Officers of Sony Group Corporation (the “Corporation”), their responsibility as a director or officer, date of birth, the number of years they have served as a director or officer, and other principal business activities outside the Corporation as of June 28, 2022.
Board of Directors
Kenichiro Yoshida | ||
Responsibility as a Director: — | ||
Date of Birth: October 20, 1959 | ||
Number of Years Served as a Director: 8 years | ||
Principal Business Activities Outside the Corporation: Outside Director, M3, Inc. | ||
Brief Personal History: | ||
April 1983 | Joined the Corporation | |
July 2000 | Joined Sony Communication Network Corporation (currently Sony Network Communications Inc.) | |
September 2000 | Outside Director, So-net M3, Inc. (currently M3, Inc.) (present) | |
May 2001 | SVP, Sony Communication Network Corporation | |
April 2005 | President and Representative Director, Sony Communication Network Corporation | |
December 2013 | EVP, CSO and Deputy CFO, Corporate Executive Officer, the Corporation | |
April 2014 | EVP and CFO, Representative Corporate Executive Officer, the Corporation | |
June 2014 | Director, the Corporation (present) | |
April 2015 | Executive Deputy President and CFO, Representative Corporate Executive Officer, the Corporation | |
April 2018 | President and CEO, Representative Corporate Executive Officer, the Corporation | |
June 2020 | Chairman, President and CEO, Representative Corporate Executive Officer, the Corporation (present) | |
- 57 -
Hiroki Totoki | ||
Responsibility as a Director: — | ||
Date of Birth: July 17, 1964 | ||
Number of Years Served as a Director: 3 years | ||
Principal Business Activities Outside the Corporation: Outside Director, Recruit Co., Ltd. | ||
Brief Personal History: | ||
April 1987 | Joined the Corporation | |
February 2002 | Representative Director, Sony Bank Incorporated | |
June 2005 | Director, Corporate Executive Officer and Senior Managing Director, Sony Communication Network Corporation (currently Sony Network Communications Inc.) | |
April 2012 | Representative Director, Corporate Executive Officer and Senior Managing Director, So-net Entertainment Corporation (currently Sony Network Communications Inc.) | |
April 2013 | Representative Director, Corporate Executive Officer, Deputy President and CFO, So-net Entertainment Corporation | |
December 2013 | SVP, Corporate Executive, the Corporation | |
November 2014 | President and CEO, Sony Mobile Communications Inc. (currently Sony Corporation) | |
June 2015 | Director, Chairman, So-net Corporation (currently Sony Network Communications Inc.) | |
April 2016 | EVP, Corporate Executive Officer, the Corporation Officer in charge of New Business Platform Strategy, the Corporation President and Representative Director, So-net Corporation | |
June 2017 | CSO, the Corporation Officer in Charge of Mid-to-Long | |
April 2018 | Representative Corporate Executive Officer, CFO, the Corporation | |
June 2018 | Senior EVP, the Corporation Outside Director, Recruit Holdings Co., Ltd. (present) | |
June 2019 | Director, the Corporation (present) | |
June 2020 | Executive Deputy President and CFO, Representative Corporate Executive Officer, the Corporation (present) | |
Shuzo Sumi | ||
Responsibility as a Director: Chairman of the Board Chair of the Nominating Committee | ||
Date of Birth: July 11, 1947 | ||
Number of Years Served as a Director: 5 years | ||
Brief Personal History and Principal Business Activities Outside the Corporation: | ||
April 1970 | Joined Tokio Marine & Fire Insurance Co., Ltd. | |
June 2000 | Director and Chief Representative in London, Overseas Division, Tokio Marine & Fire Insurance Co., Ltd. | |
June 2002 | Managing Director, Tokio Marine & Fire Insurance Co., Ltd. | |
October 2004 | Managing Director, Tokio Marine & Nichido Fire Insurance Co., Ltd. | |
June 2005 | Senior Managing Director, Tokio Marine & Nichido Fire Insurance Co., Ltd. | |
June 2007 | President & Chief Executive Officer, Tokio Marine & Nichido Fire Insurance Co., Ltd. President & Chief Executive Officer, Tokio Marine Holdings, Inc. | |
June 2013 | Chairman of the Board, Tokio Marine & Nichido Fire Insurance Co., Ltd. Chairman of the Board, Tokio Marine Holdings, Inc. | |
June 2014 | Outside Director, Toyota Industries Corporation (present) | |
April 2016 | Senior Executive Advisor, Tokio Marine & Nichido Fire Insurance Co., Ltd. (present) | |
June 2017 | Director, the Corporation (present) | |
- 58 -
Tim Schaaff | ||
Responsibility as a Director: Director in charge of Information Security | ||
Date of Birth: December 5, 1959 | ||
Number of Years Served as a Director: 9 years | ||
Brief Personal History and Principal Business Activities Outside the Corporation: | ||
December 1982 | Joined New England Digital Corporation | |
July 1991 | Joined Apple Computer, Inc. | |
1998 | Vice President, Apple Computer, Inc. | |
December 2005 | Senior Vice President, Sony Corporation of America | |
November 2006 | Deputy President, Technology Development Group, the Corporation | |
June 2008 | President, Sony Media Software and Services Inc. | |
December 2009 | Director, President, Sony Network Entertainment International LLC | |
June 2013 | Director, the Corporation (present) | |
Toshiko Oka | ||
Responsibility as a Director: Chair of the Audit Committee | ||
Date of Birth: March 7, 1964 | ||
Number of Years Served as a Director: 4 years | ||
Brief Personal History and Principal Business Activities Outside the Corporation: | ||
April 1986 | Joined Tohmatsu Touche Ross Consulting Limited | |
July 2000 | Joined Asahi Arthur Anderson Limited | |
September 2002 | Principal, Deloitte Tohmatsu Consulting Co., Ltd. (currently ABeam Consulting Ltd.) | |
April 2005 | President and Representative Director, ABeam M&A Consulting Ltd. (currently PwC Advisory LLC) | |
April 2016 | Partner, PwC Advisory LLC | |
June 2016 | CEO, Oka & Company Ltd. (present) | |
June 2018 | Director, the Corporation (present) | |
June 2019 | Outside Director, Happinet Corporation (present) | |
June 2020 | Outside Director, ENEOS Holdings, Inc. (present) | |
April 2021 | Professor, Graduate School of Global Business, Meiji University (present) | |
June 2021 | Outside Director, Hitachi Construction Machinery Co., Ltd. (present) | |
Sakie Akiyama | ||
Responsibility as a Director: Member of the Compensation Committee | ||
Date of Birth: December 1, 1962 | ||
Number of Years Served as a Director: 3 years | ||
Brief Personal History and Principal Business Activities Outside the Corporation: | ||
April 1987 | Joined Arthur Andersen & Co. | |
April 1994 | Founder and CEO, Saki Corporation | |
October 2018 | Founder, Saki Corporation (present) | |
June 2019 | Director, the Corporation (present) Outside Director, Japan Post Holdings Co., Ltd. (present) Outside Director, Orix Corporation (present) | |
June 2020 | Outside Director, Mitsubishi Corporation (present) | |
- 59 -
Wendy Becker | ||
Responsibility as a Director: Chair of the Compensation Committee Member of the Nominating Committee | ||
Date of Birth: November 2, 1965 | ||
Number of Years Served as a Director: 3 years | ||
Brief Personal History and Principal Business Activities Outside the Corporation: | ||
September 1987 | Brand Manager, Procter & Gamble Company | |
September 1993 | Consultant, McKinsey & Company, Inc. | |
December 1998 | Partner, McKinsey & Company, Inc. | |
February 2008 | Managing Director, Residential, TalkTalk, The Carphone Warehouse Ltd. Board member, Member of Remuneration Committee, Whitbread plc | |
September 2009 | Chief Marketing Officer, Vodafone Group plc | |
September 2012 | Chief Operating Officer, Jack Wills Ltd. | |
October 2013 | CEO, Jack Wills Ltd. | |
February 2017 | Board member, Chair of Remuneration Committee, Great Portland Estates plc (present) | |
September 2017 | Board member, Logitech International S.A. (present) | |
June 2019 | Director, the Corporation (present) | |
September 2019 | Chair of the Board, Chair of Nominating Committee, Logitech International S.A. (present) | |
June 2021 | Board member, Chair of Remuneration Committee, Oxford Nanopore Technologies plc (present) | |
Yoshihiko Hatanaka | ||
Responsibility as a Director: Vice Chairman of the Board Member of the Nominating Committee Member of the Compensation Committee | ||
Date of Birth: April 20, 1957 | ||
Number of Years Served as a Director: 3 years | ||
Brief Personal History and Principal Business Activities Outside the Corporation: | ||
April 1980 | Joined Fujisawa Pharmaceutical Co., Ltd. (currently Astellas Pharma Inc.) | |
June 2005 | Corporate Executive, Vice President, Corporate Planning, Corporate Strategy, Astellas Pharma Inc. | |
April 2006 | Corporate Executive of Astellas Pharma Inc. and President & CEO, Astellas US LLC and President & CEO, Astellas Pharma US, Inc. | |
June 2008 | Senior Corporate Executive of Astellas Pharma Inc. and President & CEO, Astellas US LLC and President & CEO, Astellas Pharma US, Inc. | |
April 2009 | Senior Corporate Executive, Chief Strategy Officer and Chief Financial Officer, Astellas Pharma Inc. | |
June 2011 | Representative Director, President & CEO, Astellas Pharma Inc. | |
April 2018 | Representative Director, Chairman of the Board, Astellas Pharma Inc. | |
June 2019 | Director, the Corporation (present) | |
Keiko Kishigami | ||
Responsibility as a Director: Member of the Audit Committee | ||
Date of Birth: January 28, 1957 | ||
Number of Years Served as a Director: 2 years | ||
Brief Personal History and Principal Business Activities Outside the Corporation: | ||
October 1985 | Joined Peat Marwick Minato (currently Ernst & Young ShinNihon LLC) | |
August 1989 | Registered as Certified Public Accountant (present) | |
December 1997 | Partner, Century Audit Corporation (currently Ernst & Young ShinNihon LLC) | |
May 2004 | Representative Partner (position currently defined as “Senior Partner”), Ernst & Young ShinNihon (currently Ernst & Young ShinNihon LLC) | |
September 2018 | Board Member, WWF Japan (present) | |
June 2019 | Outside Auditor, Okamura Corporation (present) | |
June 2020 | Director, the Corporation (present) | |
June 2021 | Outside Director, Sumitomo Seika Chemicals Company, Limited (present) | |
- 60 -
Joseph A. Kraft Jr. | ||
Responsibility as a Director: Member of the Audit Committee Director in charge of Information Security | ||
Date of Birth: May 12, 1964 | ||
Number of Years Served as a Director: 2 years | ||
Brief Personal History and Principal Business Activities Outside the Corporation: | ||
July 1986 | Joined Morgan Stanley Inc. | |
January 2000 | Managing Director, Morgan Stanley Inc. | |
April 2007 | Managing Director, Head of Capital Markets Division, Dresdner Kleinwort Japan | |
March 2010 | Deputy Branch Manager & Managing Director, Bank of America Merrill Lynch Japan | |
July 2015 | CEO, Rorschach Advisory Inc. (present) | |
June 2020 | Director, the Corporation (present) | |
Corporate Executive Officers
In addition to Kenichiro Yoshida and Hiroki Totoki, the four individuals set forth below are the current Corporate Executive Officers of Sony Group Corporation as of June 28, 2022. Refer to “Board Practices” below.
Shiro Kambe | ||
Responsibility as an Officer: Senior EVP, Officer in charge of Legal, Compliance, Privacy, Corporate Communications, Brand Strategy, Sustainability and External Relations | ||
Date of Birth: December 18, 1961 | ||
Number of Years Served as a Corporate Executive Officer: 8 years | ||
Principal Business Activities Outside Sony: None | ||
Brief Personal History: | ||
April 1984 | Joined the Corporation | |
June 2010 | SVP, Corporate Executive, the Corporation | |
June 2014 | EVP, Corporate Executive Officer, the Corporation | |
June 2020 | Senior EVP, Corporate Executive Officer, the Corporation (present) | |
Kazushi Ambe | ||
Responsibility as an Officer: Senior EVP, Officer in charge of Human Resources and General Affairs | ||
Date of Birth: April 23, 1961 | ||
Number of Years Served as a Corporate Executive Officer: 6 years | ||
Principal Business Activities Outside Sony: None | ||
Brief Personal History: | ||
April 1984 | Joined the Corporation | |
October 2001 | Vice President, Sony Ericsson Mobile Communications | |
April 2006 | Senior Vice President, Sony Corporation of America | |
November 2014 | SVP, Corporate Executive, the Corporation | |
June 2016 | EVP, Corporate Executive Officer, the Corporation | |
June 2020 | Senior EVP, Corporate Executive Officer, the Corporation (present) | |
Toshimoto Mitomo | ||
Responsibility as an Officer: Senior EVP, Officer in charge of Intellectual Property and Business Incubation Platform, Sony Group China Representative | ||
Date of Birth: January 6, 1963 | ||
Number of Years Served as a Corporate Executive Officer: — | ||
Principal Business Activities Outside Sony: None | ||
Brief Personal History: | ||
April 1985 | Joined the Corporation | |
June 2013 | SVP, Corporate Executive, the Corporation | |
June 2019 | EVP, the Corporation | |
April 2022 | Senior EVP, Corporate Executive Officer, the Corporation (present) | |
- 61 -
Hiroaki Kitano | ||
Responsibility as an Officer: Senior EVP and CTO, Officer in charge of R&D and AI Collaboration | ||
Date of Birth: March 16, 1961 | ||
Number of Years Served as a Corporate Executive Officer: — | ||
Principal Business Activities Outside Sony: None | ||
Brief Personal History: | ||
April 1984 | Joined NEC Corporation | |
August 1993 | Joined Sony Computer Science Laboratories, Inc. | |
June 2002 | Director, Deputy Head of Research, Sony Computer Science Laboratories, Inc. | |
July 2008 | Director, Head of Research, Sony Computer Science Laboratories, Inc. | |
July 2011 | President and CEO, Sony Computer Science Laboratories, Inc. (present) | |
June 2016 | Corporate Executive, the Corporation | |
June 2018 | SVP, the Corporation | |
April 2020 | CEO, Sony AI Inc. (present) | |
June 2020 | EVP, the Corporation | |
April 2022 | Senior EVP and CTO, Corporate Executive Officer, the Corporation (present) | |
Kenichiro Yoshida, Hiroki Totoki, Shiro Kambe, Kazushi Ambe, Toshimoto Mitomo and Hiroaki Kitano are engaged on a full-time basis by Sony Group Corporation. There is no family relationship between any of the persons named above. There is no arrangement or understanding with major shareholders, customers, suppliers, or others pursuant to which any person named above was selected as a Director or a Corporate Executive Officer.
B. | Compensation |
Under the Financial Instruments and Exchange Act of Japan and related regulations, Sony Group Corporation is required to disclose the total remuneration paid by Sony Group Corporation to Directors and Corporate Executive Officers, as well as remuneration of any Director or Corporate Executive Officer who receives total aggregate annual remuneration exceeding 100 million yen from Sony in a fiscal year, on an individual basis. The following table and accompanying footnotes show the information on such matters that Sony Group Corporation has disclosed in its annual Securities Report for the fiscal year ended March 31, 2022 filed on June 28, 2022 with the Director General of the Kanto Local Finance Bureau of the Ministry of Finance in Japan.
(1) Total amounts of remuneration for Directors and Corporate Executive Officers and the number thereof
| Fixed remuneration (*3) | Remuneration linked to business results | Stock acquisition rights (*6) | Restricted stock (*3/*8) | Phantom Restricted Stock Plan (*9) | ||||||||||||||||
| Number of persons | Amount | Number of persons | Amount | Number of persons | Amount | Number of persons | Amount | Number of persons | Amount | |||||||||||
| Million Yen | Million Yen | Million Yen | Million Yen | Million Yen | ||||||||||||||||
Directors | 10 | 170 | — | — | — | — | 10 | 40 | — | — | ||||||||||
| (*4) | (*7) | |||||||||||||||||||
(Outside Directors) (*1, 2) | (9) | (149) | (—) | (—) | (—) | (—) | (9) | (36) | (—) | (—) | ||||||||||
Corporate Executive Officers | 6 | 539 | 6 | 777 | 6 | 540 | 6 | 796 | 1 | 135 | ||||||||||
| (*5) | ||||||||||||||||||||
Total | 16 | 708 | 6 | 777 | 6 | 540 | 16 | 835 | 1 | 135 | ||||||||||
*1 The number of persons does not include two Directors who concurrently serve as Corporate Executive Officers, because Sony Group Corporation does not pay any additional remuneration for services as a Director to Directors who concurrently serve as Corporate Executive Officers.
*2 The number of persons includes one Director who resigned on the day of the Ordinary General Meeting of Shareholders held on June 22, 2021, and one director who retired during his term of office.
*3 Due to rounding, individual sums may not total 100%.
*4 Sony Group Corporation does not pay remuneration linked to business results to Directors who do not concurrently serve as Corporate Executive Officers.
*5 This is the amount of remuneration linked to business results for the fiscal year ended March 31, 2022 that was paid in June 2022.
- 62 -
*6 This is the amount of expenses Sony Group Corporation recorded during the fiscal year ended March 31, 2022 applicable to the stock acquisition rights that were granted.
*7 Sony Group Corporation does not grant stock acquisition rights to Directors who do not concurrently serve as Corporate Executive Officers.
*8 This is the amount of expenses Sony Group Corporation recorded during the fiscal year ended March 31, 2022 applicable to restricted stock.
*9 The phantom restricted stock plan referenced above includes the amount which is to be paid to one Corporate Executive Officer who resigned on June 28, 2022, the date of the Ordinary General Meeting of Shareholders. Sony Group Corporation recorded 222 million yen in expenses during the fiscal year ended March 31, 2022 applicable to the phantom restricted stock plan for Directors and Corporate Executive Officers.
(2) Amounts of remuneration for Directors and Corporate Executive Officers on an individual basis.
Name | Position (*1) | Fixed Remuneration (*2) (Yen in millions) | Remuneration linked to business results (*2) (*3) (Yen in millions) | Phantom restricted stock plan (Yen in millions) | Total (*2) (Yen in millions) | Granted number of stock acquisition rights (*4) (Ten thousand shares) | Granted number of restricted stock (*5) (Ten thousand shares) | |||||||
Kenichiro Yoshida | Director, Chairman, President & CEO, and Representative Corporate Executive Officer (*6) (*7) | 215 | 391 | — | 606 | 15 | 7.5 | |||||||
Hiroki Totoki | Director, Executive Deputy President & CFO, and Representative Corporate Executive Officer (*6) (*7) | 77 | 143 | — | 220 | 5 | 2.5 | |||||||
Shigeki Ishizuka | Vice Chairman, Former Representative Corporate Executive Officer (Until June 28, 2022) (*7) | 68 | 69 | — | 137 | 2 | 0.5 | |||||||
Toru Katsumoto | Former Executive Deputy President, Former Corporate Executive Officer (Until June 28, 2022) (*7) | 64 | 66 | 135 | 265 | 3 | 1.5 | |||||||
Shiro Kambe | Senior Executive Vice President, Corporate Executive Officer (*7) | 52 | 55 | — | 106 | 2 | 0.6 | |||||||
Kazushi Ambe | Senior Executive Vice President, Corporate Executive Officer (*7) | 51 | 53 | — | 104 | 2 | 0.6 |
*1 This chart shows remuneration for Directors and Corporate Executive Officers who received, or who became likely to receive, total remuneration exceeding 100 million yen from Sony Group Corporation and its subsidiaries during the fiscal year ended March 31, 2022. Titles are as of the date of submission of this document.
*2 Due to rounding, individual sums may not total 100%.
*3 For the metrics and actual financial results used to determine the amount of remuneration linked to business results, please refer to “Corporate Executive Officer remuneration linked to business results for the fiscal year ended March 31, 2022” below.
*4 The weighted-average fair value per share at the date of grant of stock acquisition rights granted during the fiscal year ended March 31, 2022 was 2,994 yen and was estimated using the Black-Scholes option-pricing model with several assumptions. Refer to Note 21 of the consolidated financial statements for details. The weighted-average fair value per share does not indicate the actual value that would be realized by a Corporate Executive Officer upon the exercise of the above-mentioned stock acquisition rights. The actual value, if any, that is realized by a Corporate Executive Officer upon the exercise of any stock acquisition rights will depend on the extent to which the market value of Sony Group Corporation’s common stock (“Common Stock”) exceeds the exercise price of the stock
- 63 -
acquisition rights on the date of exercise, and several other restrictions imposed on the exercise of the stock acquisition rights, including the period when a Corporate Executive Officer could exercise the stock acquisition rights. Accordingly, there is no assurance that the value realized or to be realized by a Corporate Executive Officer upon the exercise of the stock acquisition rights is or will be at or near the weighted-average fair value per share presented above. In addition, the above weighted-average fair value per share was calculated to recognize compensation expense for the fiscal year ended March 31, 2022 for accounting purposes and should not be regarded as any indication or prediction of Sony with respect to its future stock performance.
*5 This indicates the total number of shares of restricted stock granted in the fiscal year ended March 31, 2022 for Corporate Executive Officers. The issue price per share of restricted stock was 11,000 yen.
*6 As noted above, Sony Group Corporation does not pay any remuneration for services as a Director to Directors who concurrently serve as Corporate Executive Officers.
*7 Apart from the remuneration contained in the table, Sony Group Corporation also provided certain personal benefits and perquisites, including fringe benefits and in some instances amounts to pay income taxes related to perquisites, totaling 8 million yen to Kenichiro Yoshida, 1 million yen to Hiroki Totoki, 1 million yen to Shigeki Ishizuka, 1 million yen to Toru Katsumoto, 1 million yen to Shiro Kambe and 1 million yen to Kazushi Ambe during the fiscal year ended March 31, 2022.
(3) Basic policy regarding Director and Senior Executive remuneration
The basic policy regarding remuneration for Directors and Senior Executives determined by the Compensation Committee is as follows:
(a) Basic policy regarding Director remuneration
Since the primary duty of Directors is to oversee management’s operation of Sony, which is a global company, the following two elements have been established as the basic policy for the determination of remuneration of Directors in order to improve that oversight function. No Director remuneration is paid to those Directors who concurrently serve as Corporate Executive Officers.
| • | Securing a talent pool of Directors possessing requisite abilities from a global perspective; and |
| • | Ensuring the effectiveness of the supervisory function of Directors. |
Based on the above, Director remuneration shall consist of the following components. The amount of each component and its percentage of total remuneration shall be set at an appropriate level determined in accordance with the basic policy above and research conducted by a third party regarding remuneration of directors of both Japanese and
non-Japanese
companies.Type of remuneration | Description | |
| Fixed remuneration | • Set at an appropriate level determined based on research conducted by a third party regarding remuneration of directors of both Japanese and non-Japanese companies with a view to the level of responsibility of the Director and maintaining competitiveness for securing talent. | |
Remuneration linked to stock price (restricted stock) | • Granted to further promote shared values between Directors and shareholders and incentivize Directors to develop and maintain a sound and transparent management system. • Any Director to whom restricted stock is granted, in principle, may not sell or transfer the granted shares during his or her tenure. This restriction is removed on the date such Director resigns. | |
| Phantom restricted stock plan | • Points determined by the Compensation Committee shall be granted to Directors every year during their term in office. Then, when they resign, the remuneration amount shall be calculated by multiplying the closing price of common stock by the individual’s accumulated points. * Because Sony replaced the phantom restricted stock plan for Directors with restricted stock from the fiscal year ended March 31, 2018, Sony did not grant new points to Directors during the fiscal year ended March 31, 2022. | |
- 64 -
(b) Basic policy regarding Senior Executive remuneration
Senior Executives are key members of management responsible for executing the operations of Sony as a whole, or of their respective businesses. In order to further improve the business results of Sony, the following two elements have been established as the basic policy for the determination of remuneration of Senior Executives.
| • | Securing a talent pool possessing requisite abilities from a global perspective; and |
| • | Providing effective incentives to improve business results on a short-, mid- and long-term basis. |
Based on the above, Senior Executive remuneration shall primarily consist of the following components. The amount of each component and its percentage of total remuneration shall be at an appropriate level determined in accordance with the above basic policy and the individual’s level of responsibility. The amount and percentage will also be based on research conducted by a third party regarding remuneration of management of both Japanese and
non-Japanese
companies, with an emphasis on linking Senior Executive remuneration to business results and shareholder value.Type of remuneration | Description | |
| Fixed remuneration | • Set at an appropriate level determined based on research conducted by a third party regarding remuneration of management of both Japanese and non-Japanese companies with a view to the level of responsibility of the Senior Executive and maintaining competitiveness for securing talent. | |
| Remuneration linked to business results | • Structured appropriately and based on appropriate metrics to ensure that such remuneration effectively incentivizes Senior Executives to achieve financial targets for the mid- to long-term and financial targets for the fiscal year for which compensation will be paid.• Specifically, the amount to be paid to Senior Executives shall be determined based on the level of achievement of the two metrics below and can fluctuate, in principle, from 0% to 200% of the standard payment amount (“Business Results Linked Standard Payment Amount”) based on the achievement of the below-mentioned targets. (1) Certain key performance indicators linked to the consolidated or individual business results of Sony during the fiscal year, such as Adjusted EBITDA and Adjusted EPS (net income attributable to Sony Group Corporation’s stockholders per share), which are selected based on the areas for which each Senior Executive is responsible. (2) Individual performance in the area(s) for which each Senior Executive is responsible. • Efforts to accelerate value creation through collaborations among the businesses of Sony, sustainability initiatives related to social value creation and ESG (environment, social and governance) and engagement indicators based on employee surveys shall be included in the evaluation factors for individual performance. • The Business Results Linked Standard Payment Amount shall be determined so that such amount is within an appropriate percentage of the cash compensation (total of the fixed remuneration and the remuneration linked to business results), which percentage shall be determined in accordance with each individual’s level of responsibility. | |
- 65 -
Type of remuneration | Description | |
Remuneration linked to stock price (Stock acquisition rights and restricted stock) | • Stock acquisition rights and restricted stock are granted to incentivize Senior Executives to increase mid-to long-term shareholder value.• The exercise of the stock acquisition rights is restricted during a one-year period from the allotment date, and in general,one-third of the total number of exercisable stock acquisition rights will be vested and exercisable each year thereafter. (All of the allocated stock acquisition rights will be exercisable on and after three years from the allotment date.)• The Senior Executives to whom restricted stock is granted, in principle, may not sell or transfer the granted stock before the third anniversary date of the Ordinary General Meeting of Shareholders of the fiscal year when the restricted stock was granted. • In principle, remuneration for a Senior Executive who has greater management responsibility and influence over Sony as a whole has a higher proportion of their remuneration linked to the corporate value. (Please see below “Reference: Executive Compensation Package Designed to Focus on Long-Term Management.”) • The amount of remuneration linked to the stock price shall be determined so that the amount is within an appropriate percentage of the total cash compensation (total of the fixed remuneration and the remuneration linked to business results) and remuneration linked to the stock price according to each individual’s level of responsibility. | |
| Phantom restricted stock plan | • Points determined by the Compensation Committee shall be granted to Senior Executives every year during their tenure, and at the time of resignation, the remuneration amount shall be calculated by multiplying the common stock price (closing price) by the individual’s accumulated points. | |
(Reference: Executive Compensation Package Designed to Focus on Long-Term Management)
The bar chart below shows the components of remuneration for Corporate Executive Officers for the fiscal year ended March 31, 2022. For this chart, the remuneration linked to business results is based on the Business Results Linked Standard Payment Amount for each Corporate Executive Officer. As to the remuneration linked to stock price, the underlying amount is calculated based on the fair value of a stock acquisition right as of the date such stock acquisition right was granted in the fiscal year ended March 31, 2022 and the issue price of the restricted stock when granted. Accordingly, the components of remuneration based on the amounts actually paid will be different from the chart below.
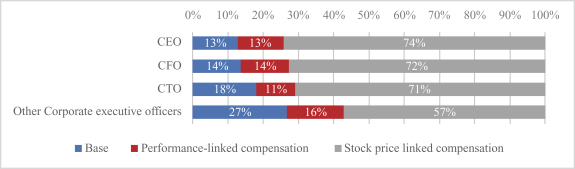
- 66 -
(4) Procedures to determine remuneration of Directors and Senior Executives
Based on the policy outlined above, the amount and content of the compensation for each Director and Senior Executive are determined by the Compensation Committee or otherwise under the supervision of the Compensation Committee. Specifically, in principle, each year at the meeting of the Compensation Committee held after the Ordinary General Meeting of the Shareholders, the amount of basic remuneration and the content of each Director’s and Corporate Executive Officer’s compensation for the corresponding fiscal year are determined. Thereafter, at the meeting of the Compensation Committee held after the corresponding fiscal year end, the final amount of compensation of each Director and Corporate Executive Officer, including the amount of remuneration linked to business results, is determined, and as for Senior Executives other than Corporate Executive Officers, such amount is otherwise determined under the supervision of the Compensation Committee.
To determine the amount of the remuneration linked to business results for each Senior Executive, the Business Results Linked Standard Payment Amount, the targets for the Financial Performance KPIs and the targets for the individual performance of the areas(s) for which each Senior Executive is responsible are first determined. Thereafter, the amount of such remuneration is determined based on the level of achievement of such targets for the Financial Performance KPIs and the individual performance at the meeting of the Compensation Committee held after the corresponding fiscal year end for Corporate Executive Officers or otherwise under the supervision of the Compensation Committee for Senior Executives other than Corporate Executive Officers.
The amount of compensation of each Director and Senior Executive for the fiscal year ended March 31, 2022 was also determined by the Compensation Committee or otherwise under the supervision of the Compensation Committee according to the procedure above.
(5) Corporate Executive Officer remuneration linked to business results for the fiscal year ended March 31, 2022
The Business Results Linked Standard Payment Amount for each Corporate Executive Officer for the fiscal year ended March 31, 2022 was determined to be in the range between 60% and 100% of the amount of their fixed remuneration of such Corporate Executive Officer according to his/her responsibility.
The formula to calculate the amount of the remuneration linked to business results to be paid to Corporate Executive Officers is as follows.
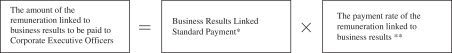
* Business Results Linked Standard Payment Amount: Determined to be in the range between 60% and 100% of the amount of the fixed remuneration of each Corporate Executive Officer.
** Payment rate of the remuneration linked to business results: Determined in principle, within the range from 0 percent to 200 percent based on the achievement of (i) Financial Performance KPIs based on the areas for which each Corporate Executive Officer is responsible and (ii) the individual performance of the area(s) for which each Corporate Executive Officer is responsible.
The financial performance KPIs and the weighting of such financial performance KPIs primarily used for Corporate Executive Officers in the fiscal year ended March 31, 2022 were as follows:
KPI | Weight | Target to be achieved for the fiscal year ended March 31, 2022 (Consolidated) | Result for the fiscal year ended March 31, 2022 (Consolidated) | |||
| Adjusted EBITDA (*1) | 50% | Amount determined in order to achieve the Adjusted EBITDA (defined below) target of 4.3 trillion yen for the three-year period from the fiscal year ended March 31, 2022 | 1,597.9 billion yen | |||
| Adjusted EPS (*2) | 50% | 523.2 yen | 640.2 yen (*3) | |||
Adjusted EBITDA, which is the most important financial performance KPI under the fourth
mid-range
plan, was selected as a Financial Performance KPI to enhance the growth potential of the entire Sony Group under the fourthmid-range
plan. Adjusted EPS was selected to incentivize awareness of shareholder value and capital efficiency.- 67 -
The Compensation Committee determined a target for Adjusted EBITDA for the fiscal year ended March 31, 2022 that was meant to incentivize management to achieve the 4.3 trillion yen for the three-year period from the fiscal year ended March 31, 2022. The target for Adjusted EPS for the fiscal year ended March 31, 2022 was 523.2 yen, which was obtained by dividing the forecast of net income attributable to Sony Group Corporation’s stockholders for the fiscal year ended March 31, 2022, which was disclosed in April, 2021 (660 billion yen) by the number of diluted shares outstanding at the beginning of such fiscal year. The results for the Financial Performance KPIs for the fiscal year ended March 31, 2022 were as follows: Adjusted EBITDA: 1,597.9 billion yen (while net income attributable to Sony Group Corporation’s stockholders for the fiscal year ended March 31, 2022 was 882.2 billion), and Adjusted EPS: 640.2 yen (*3), each exceeding the targeted amount. For reconciliation of Adjusted EBITDA to net income attributable to Sony Group Corporation’s stockholders, refer to “Issues Facing Sony and Management’s Response to those Issues: Fourth”
Mid-Range
Plan — Financial Targets and their Progress” in “Item 5.DTrend Information.
As outlined above under “(3) Basic policy regarding Director and Senior Executive remuneration” remuneration linked to business results for Senior Executives for the fiscal year ended March 31, 2022 was determined based on the level of achievement of the financial performance KPIs and the individual performance for which those Senior Executives were responsible. Consequently, the range of potential payment was determined to be, in principle, between 0% and 200% of the standard payment amount. As a result, the ratio of remuneration linked to business results of Corporate Executive Officers for the fiscal year ended March 31, 2022 varied from 167.8% to 178.5% of the Business Results Linked Standard Payment Amount.
*1 “Adjusted EBITDA (Earnings Before Interest, Taxes, Depreciation and Amortization)” = Net income attributable to Sony Group Corporation’s stockholders + Net income attributable to noncontrolling interests + Income taxes + Interest expenses, net, recorded in Financial income and Financial expense — Gain on revaluation of equity instruments, net, recorded in Financial income and Financial expense + Depreciation and amortization expense excluding amortization for film costs and broadcasting rights included in Content assets as well as deferred insurance acquisition costs — the profit and loss amount that Sony deems to be
non-recurring.
*2 “EPS (Earning Per Share)” means net income attributable to Sony Group Corporation’s stockholders per share.
“Adjusted EPS” is calculated by using the value excluding the profit and loss amount that Sony deems to be
non-recurring
from the value of the net income attributable to Sony Group Corporation’s stockholders.*3 Adjusted EPS result for the fiscal year ended March 31, 2022 is calculated by dividing adjusted net income attributable to Sony Group Corporation’s stockholders for the fiscal year ended March 31, 2022 by diluted weighted average number of shares during the fiscal year. The following table shows a reconciliation of net income attributable to Sony Group Corporation’s stockholders for diluted EPS computation reported in accordance with IFRS to Adjusted EPS for the fiscal year ended March 31, 2022.
Fiscal year ended March 31 | ||||
2022 | ||||
(Yen in billions, yen per share amounts) | ||||
Net income attributable to Sony Group Corporation’s stockholders for diluted EPS computation* | 882.3 | |||
Profit and loss amount that Sony deems to be non-recurring, including adjustments for income taxes and non-controlling interests** | (81.3 | ) | ||
Adjusted Net income attributable to Sony Group Corporation’s stockholders for diluted EPS computation | 801.1 | |||
Weighted-average shares for diluted EPS computation (thousands of shares)* | 1,251,260 | |||
Adjusted EPS | 640.2 | |||
* Refer to Note 26 of the consolidated financial statements.
** This amount is calculated by subtracting the tax effect of 15.0 billion yen and an adjustment of.”
non-controlling
interests of 0.9 billion yen from 63.8 billion yen, the total amount of profit and loss that Sony deems to benon-recurring,
included in income before income tax, then adding a tax benefit of 33.4 billion yen resulting from the reversal of a previous write-down of certain deferred tax assets at certain companies in Japan. For further information about the profit and loss amount that Sony deems to be non-recurring, refer to “Issues Facing Sony and Management’s Response to those Issues: Fourth Mid-Range Plan — Financial Targets and their Progress” in “Item 5.Operating and Financial Review and Prospects
- 68 -
(Reference: Restricted Stock)
Sony Group Corporation introduced a restricted stock plan starting from the fiscal year ended March 31, 2018, pursuant to which shares of restricted stock are allotted to Sony Group Corporation’s Corporate Executive Officers and other executives, as well as
non-executive
Directors of Sony Group Corporation(“Non-Executive
Directors”). The purpose of the plan for the Corporate Executive Officers and other executives of Sony Group Corporation is to further reinforce management’s alignment with shareholder value, and to incentivize management to improvemid-
to long-term performance and increase shareholder value. Furthermore, the purpose of the plan for theNon-Executive
Directors is to incentivize these Directors to develop and maintain a sound and transparent management system by further promoting shared values between the shareholders and theNon-Executive
Directors.The grantees are not able to sell or transfer granted shares during the restricted period, and Sony Group Corporation will acquire the granted shares from a grantee without any consideration to, or consent of, the grantee under certain conditions. Details of the plan, such as the length of the restricted period, vesting conditions, eligibility and the number of grants, are determined by the Compensation Committee.
C. | Board Practices |
General
Sony Group Corporation continuously strives to strengthen its corporate governance system based on the understanding that corporate governance is an essential basis to promote our management in order to fulfill the company’s corporate social responsibility and increase corporate value over the) and related regulations (collectively the “Companies Act”). Under this system, Sony Group Corporation has introduced its own requirements to help improve and maintain the soundness and transparency of its governance by strengthening the separation of the Directors’ function from that of management; maintaining what the company believes is an appropriate Board size, which enables the members of the Board to actively contribute to discussion; and advancing the proper functioning of the statutory committees.
mid-
to long-term. To operate Sony effectively, Sony Group Corporation continues to approach its corporate governance through two basic precepts: (a) the Board of Directors (the “Board”), a majority of which is comprised of independent outside Directors, focuses on effective oversight of management’s operation of the business and maintains a sound and transparent governance framework by utilizing the Nominating Committee, the Audit Committee and the Compensation Committee; and (b) the Board determines Sony’s fundamental management policies and other material matters and delegates to the Senior Executives (including Corporate Executive Officers), who assume important roles for the management of Sony, decision-making authority to conduct Sony’s business operations broadly in line with their respective responsibilities, as defined by the Board, with a view to promoting timely and efficient decision-making within Sony. In furtherance of these efforts, Sony Group Corporation has adopted a “Company with Three Committees” corporate governance system under the Companies Act of Japan (Kaishaho
Sony Group Corporation is governed by the Board, the members of which are elected at the Ordinary General Meeting of Shareholders. Under the Companies Act, a “Company with Three Committees” is required to have three committees: a Nominating Committee, an Audit Committee and a Compensation Committee, each consisting of Directors appointed by the Board. The Companies Act also requires the Board to appoint Corporate Executive Officers (), who make decisions regarding the execution of Sony’s business activities within the scope of the authority delegated to them by the Board. Sony Group Corporation has appointed its Chief Executive Officer (“CEO”), who is responsible for Sony’s overall management, and other officers who are responsible for important and extensive headquarters functions as Corporate Executive Officers. Sony Group Corporation has also appointed Corporate Executive Officers, including the CEO and other executives, that assume important roles for the management of Sony as Senior Executives. In addition, Sony grants titles, such as Senior Executive Vice President, Executive Vice President and Senior Vice President, to management team members in accordance with their respective roles and responsibilities.
Shikko-yaku
A summary of the governance system adopted by Sony Group Corporation is set forth below. For an explanation of the significant differences between the NYSE’s corporate governance standards and Sony’s corporate governance practices, refer to “Item 16G..”
Disclosure About Differences in Corporate Governance
- 69 -
Board of Directors
(1) Members: 10 Directors including 7 outside Directors (as of June 28, 2022)
Name | Position | |
Kenichiro Yoshida | Director | |
Hiroki Totoki | Director | |
Shuzo Sumi | Chairman of the Board Outside Director | |
Tim Schaaff | Non-Executive Director | |
Toshiko Oka | Outside Director | |
Sakie Akiyama | Outside Director | |
Wendy Becker | Outside Director | |
Yoshihiko Hatanaka | Vice Chairman of the Board Outside Director | |
Keiko Kishigami | Outside Director | |
Joseph A. Kraft Jr. | Outside Director | |
Under the Companies Act, the term of office of Directors expires at the conclusion of the Ordinary General Meeting of Shareholders held with respect to the last business year ending within one year after their election.
(2) Purpose/Authority
The primary roles of the Board are to: (a) determine Sony’s fundamental management policies; (b) oversee the management of Sony’s business operations as an entity independent from Sony’s management; (c) appoint and dismiss the statutory committee members; (d) appoint and dismiss Corporate Executive Officers and oversee the status of appointment/dismissal of Senior Executives other than Corporate Executive Officers; and (e) appoint and dismiss Representative Corporate Executive Officers.
For the matters to be decided by the Board and the matters to be reported to the Board, refer to Appendices 1 and 2 of the Charter of the Board of Directors (the “Board Charter”) attached as Exhibit 1.3 hereto.
(3) Policy Regarding Composition of the Board
With a view toward securing effective input and oversight by the Board, the Nominating Committee reviews and selects candidates for the Board with the aim of assuring that a substantial part of the Board is comprised of qualified outside Directors that satisfy the independence requirements established by Sony and by law. The Nominating Committee selects candidates that it views as well-suited to be Directors in light of the Board’s purpose of enhancing Sony’s corporate value. The Nominating Committee broadly considers various relevant factors, including a candidate’s capabilities (such as the candidate’s work and other experience, achievements and expertise), availability, and independence, as well as diversity, including gender and internationality, in the boardroom, the appropriate size of the Board, and the knowledge, experience and talent needed for the role. Under the Board Charter, Sony Group Corporation also requires that the Board consist of not fewer than 8 Directors and not more than 14 Directors. In addition, since 2005 the majority of the members of the Board have been outside Directors.
(4) Qualifications for Directors and Limitation of
Re-election
The qualifications for Directors of Sony Group Corporation under the Board Charter are generally as summarized below. As of June 28, 2022, all Directors satisfy the qualifications for Directors as set forth below, and all outside Directors satisfy the additional qualifications for outside Directors and are also qualified and designated as Independent Directors under the Securities Listing Regulations of the TSE. All Directors must meet the qualifications below:
| (a) | He/she shall not be a director, a statutory auditor, a corporate executive officer, a general manager or other employee of any company in competition with Sony in any of Sony’s principal businesses (a “Competing Company”) or own 3% or more of the shares of any Competing Company. |
- 70 -
| (b) | He/she shall not be or have been a representative partner or partner of Sony’s independent auditor the past three years before being nominated as a Director. |
| (c) | He/she shall not have any connection with any matter that may cause a material conflict of interest in performing the duties of a Director. |
Outside Directors must meet the additional qualifications below:
| (a) | He/she shall not have received directly from Sony, during any consecutive twelve-month period within the last three years, more than an amount equivalent to U.S. $120,000, other than Director and committee fees and pension or other forms of deferred compensation for prior service (provided such compensation is not contingent in any way on continued service). |
| (b) | He/she shall not be an executive director, corporate executive officer, general manager or other employee of any company whose aggregate amount of transactions with Sony, in any of the last three fiscal years, exceeds the greater of an amount equivalent to U.S. $1,000,000, or 2% of the annual consolidated sales of such company. |
For additional requirements for outside Directors under the Companies Act, refer to “Item 16G.”.
Disclosure About Differences in Corporate Governance
Also, each outside Director may, by resolution of the Nominating Committee, be nominated as a Director candidate for
re-election
up to five times, and thereafter by resolution of the Nominating Committee and by consent of all of the Directors. Even with the consent of all of the Directors, in no event may any outside Director bere-elected
more than eight times.(5) Matters related to Outside Directors
Sony Group Corporation expects that each outside Director play an important role in ensuring proper business decisions by Sony and effective input and oversight by the Board through actively exchanging opinions and having discussions about Sony’s business based on his or her various and broad experience, knowledge and expertise. Considering these expectations, the policy and procedures on the election of Director candidates, including independent outside Director candidates, are set forth as described above. As of June 28, 2022, the Board has 10 Directors, seven of whom are outside Directors. The Chairman of the Board and the Vice Chairman of the Board are outside Directors; all members of the Nominating Committee, the Compensation Committee and the Audit Committee are outside Directors.
Pursuant to the Articles of Incorporation, Sony Group Corporation has entered into a liability limitation agreement with all
non-executive
Directors including outside Directors. A summary of such liability limitation agreement is as follows:| (i) | In a case where a non-executive Director is liable to the company after the execution of the liability limitation agreement for damages pursuant to Article 423, Paragraph 1 of the Companies Act, such liabilities shall be limited to the greater of either 30 million yen or an amount equal to the aggregate sum of the amounts prescribed in each item of Article 425, Paragraph 1 of the Companies Act, only where thenon-executive Director acted in good faith without any gross negligence in performing his/her duties as a Director of the company. |
| (ii) | In a case where a non-executive Director is reelected as anon-executive Director of the company and reassumes his/her office as such on the expiration of the term of his/her office as anon-executive Director of the company, the liability limitation agreement shall continue to be effective after the reelection andre-assumption without any action or formality. |
In addition, Sony Group Corporation has a directors and officers liability insurance policy covering all Directors as insured parties. For an outline of the directors and officers liability insurance policy, refer to “”.
Outline of the Terms of Directors and Officers Liability Insurance Policy
(6) Policy and Procedure for Selection and Dismissal of Senior Executives
Sony Group Corporation appoints Corporate Executive Officers including the CEO and other officers that assume important roles for the management of Sony as “Senior Executives.”
The Board, has the authority to appoint and dismiss and assign the roles and responsibilities of or to request a report regarding such matters for Senior Executives, including the CEO, and exercises such authority as
- 71 -
necessary. In making decisions on the appointment of Corporate Executive Officers, including the CEO, the Board considers whether candidates for CEO meet certain qualifications for the CEO position which are set by the Nominating Committee and whether candidates for other Corporate Executive Officer positions have the necessary skills, capabilities, experiences and achievements that correspond to such Corporate Executive Officers’ expected roles and responsibilities. The Board also receives a report on the status of appointment and dismissal of Senior Executives other than Corporate Executive Officers.
The term of office of Senior Executives, including the CEO, is one year. The Board discusses, determines and/or oversees their
re-appointment
upon the expiration of each term considering the factors described above as well as their latest performance. The Board dismisses a Corporate Executive Officer, as necessary, in the event that the Board recognizes such Corporate Executive Officer is disqualified after discussions amongst the members of the Board or the Nominating Committee, even in the middle of the term for such Corporate Executive Officer.Nominating Committee
| (1) | Members: 3 outside Directors (as of June 28, 2022) |
Name | Position | |
Shuzo Sumi | Chair of the Nominating Committee (Outside Director) | |
Yoshihiko Hatanaka | Nominating Committee Member (Outside Director) | |
Wendy Becker | Nominating Committee Member (Outside Director) | |
(2) Purpose/Authority
The primary roles of the Nominating Committee are to: (a) determine the content of proposals regarding the appointment/dismissal of Directors to be submitted for approval at a General Meeting of Shareholders and (b) evaluate management succession plans, which the CEO develops, for the CEO and other executives designated by the Nominating Committee.
The Nominating Committee determines the content of proposals regarding the appointment and dismissal of Directors, considering the policy on composition of the Board, the qualifications for Directors and the limitation of
re-election
of Directors described above.(3) Policy Regarding Composition of the Nominating Committee
Under the Companies Act, the Nominating Committee shall consist of at least three Directors, the majority of whom shall be outside Directors. In addition, under the Board Charter, the chair is to be selected from among the outside Directors. In determining whether to appoint or remove a member of the Nominating Committee, continuity of the Nominating Committee shall be duly taken into account. As of June 28, 2022, the Nominating Committee is comprised of three outside Directors.
(4) Management Succession Plans
The Nominating Committee evaluates the succession plans, and the implementation of such plans, for the CEO and other executives designated by the Nominating Committee and reports the results of its evaluation to the Board, as appropriate.
Evaluations are conducted by having the CEO periodically submit draft succession plans to the Nominating Committee, which it reviews. As a part of such review, the Nominating Committee considers the development or promotion of the next generation of management and evaluates whether the succession plans have been prepared in a reasonable manner in light of Sony’s purpose to create sustainable social value and to enhance corporate value over the
mid-
to long-term.- 72 -
Audit Committee
(1) Members: 3 outside Directors (as of June 28, 2022)
Name | Position | |
Toshiko Oka | Chair of the Audit Committee (Outside Director) | |
Keiko Kishigami | Audit Committee Member (Outside Director) | |
Joseph A. Kraft Jr. | Audit Committee Member (Outside Director) | |
(2) Purpose/Authority
The primary roles of the Audit Committee are to: (a) monitor the performance of duties by Directors and Corporate Executive Officers and (b) oversee and evaluate the independent auditor.
(3) Policy Regarding Composition of the Audit Committee
Under the Companies Act, the Audit Committee shall consist of at least three Directors, the majority of whom shall be outside Directors. In addition, under the Board Charter, each member of the Audit Committee (“Audit Committee Member”) shall satisfy all of the following qualifications: (a) he/she shall not be a Director engaged in the business operations of Sony Group Corporation or any of its subsidiaries, a Corporate Executive Officer, an accounting counselor, a general manager or other employee of Sony and (b) he/she shall meet the independence requirements or such other equivalent requirements of the U.S. securities laws and regulations as may from time to time be applicable to Sony Group Corporation. The chair is to be selected from among the outside Directors. The Audit Committee Members shall be selected from among the persons who possess appropriate experience and talent as well as the necessary finance, accounting and legal knowledge to serve on the Audit Committee. In determining whether to appoint or remove the Audit Committee Member, continuity of the Audit Committee shall be duly taken into account.
Moreover, at least one Audit Committee Member shall meet the audit committee financial expert requirements or such other equivalent requirements of the U.S. securities laws and regulations as may from time to time be applicable to Sony Group Corporation. The Board makes a determination on whether or not such Audit Committee Members meet these requirements. As of June 28, 2022, the Audit Committee is comprised of three outside Directors, two of whom (Toshiko Oka and Keiko Kishigami) are “audit committee financial experts” within the meaning of Item 16A of Form
20-F
under the Exchange Act, as amended.(4) Policy on Selection of Independent Auditor Candidates and Independence of the Independent Auditor
With respect to the candidates for independent auditor nominated by the CEO and other Corporate Executive Officers, the Audit Committee evaluates the nomination, prior to making a decision on the candidates. The Audit Committee continues to evaluate the independence, the qualification and the reasonableness as well as the performance of the independent auditor so appointed.
- 73 -
Compensation Committee
(1) Members: 3 outside Directors (as of June 28, 2022)
Name | Position | |
Wendy Becker | Chair of the Compensation Committee (Outside Director) | |
Sakie Akiyama | Compensation Committee Member (Outside Director) | |
Yoshihiko Hatanaka | Compensation Committee Member (Outside Director) | |
(2) Purpose/Authority
The primary roles of the Compensation Committee are to: (a) set policy on the content of individual compensation for Directors, Corporate Executive Officers and other officers and (b) determine the amount and content of individual compensation of Directors and Corporate Executive Officers in accordance with the policy, and oversee the determination regarding the amount and content of individual compensation of Senior Executives other than Corporate Executive Officers.
For the basic policy regarding Director and Corporate Executive Officer compensation, refer to “Item 6B. Compensation”.
(3) Policy Regarding Composition of the Compensation Committee
Under the Companies Act, the Compensation Committee shall consist of at least three Directors, the majority of whom shall be outside Directors. In addition, under the Board Charter, a Director who is a CEO, a Chief Operating Officer (“COO”) or a Chief Financial Officer (“CFO”) of Sony Group Corporation or who holds any equivalent position shall not be a member of the Compensation Committee. In determining whether to appoint or remove a member of the Compensation Committee, continuity of the Compensation Committee shall be duly taken into account. As of June 28, 2022, the Compensation Committee is comprised of three outside Directors.
Senior Executives (Corporate Executive Officer, Senior Executive Vice President and Executive Vice President)
(1) Total number of Senior Executives: 18 (including 6 Corporate Executive Officers) (as of June 28, 2022)
(2) Purpose/Authority
The primary roles of Senior Executives are to determine and execute Sony’s business activities in accordance with their roles and responsibilities.
(3) Delegation of Authority from the Board
The Board determines the fundamental management policies and other material matters related to the operation of Sony’s business. The Board assigns the duties of Corporate Executive Officers including the CEO, by determining the areas over which each Corporate Executive Officer is in charge and by determining the scope of Senior Executives. Then, it delegates its decision-making authority to the CEO with a view to promoting timely and efficient decision-making within Sony. The CEO further subdelegates a part of such authority to other Senior Executives.
Other Officers (Senior Vice President)
(1) Total number of other officers: 8 (as of June 21, 2022)
- 74 -
(2) Purpose/Authority
The primary roles of other officers are to carry out their assignments within designated areas, such as headquarters functions and/or research and development, in accordance with the fundamental policies determined by the Board and Senior Executives.
Outline of the Terms of Directors and Officers Liability Insurance Policy
Sony Group Corporation has, at its expense through insurance premiums, entered into a directors and officers liability insurance policy for all Directors, Corporate Executive Officers, corporate auditors, and persons in equivalent positions (the “Executives”) of itself and its subsidiaries over which Sony Group Corporation has a direct or indirect ownership more than 50%. The outline of the terms of such directors and officers liability insurance policy is as follows:
| (i) | The insurance policy covers compensation for damages, litigation costs (including attorney’s fees) and other costs that may be incurred by the Executives as a result of assuming responsibility for the execution of their duties or receiving claims related to such responsibility. |
| (ii) | As a measure to ensure the appropriateness of the execution of duties by the Executives, there are certain exemptions, such as in the case of an act committed by the Executives with the knowledge that it constitutes a violation of laws or regulations. |
Meeting Record and Attendance Record of Outside Directors
During the fiscal year ended March 31, 2022, the Board convened 10 times. The Nominating Committee met five times, the Audit Committee met six times and the Compensation Committee met six times. All nine outside Directors, including Kazuo Matsunaga who retired in June 2021 and Adam Crozier who retired in December 2021, participated in all meetings of the Board held during their tenure period in the fiscal year ended March 31, 2022. Also, all outside Directors who are members of the Committees participated in all of the meetings of each Committee held during the fiscal year ended March 31, 2022.
Support for Activities of Directors, the Board and the Committees
Sony Group Corporation engages in various activities to enhance the oversight function of the Board over management’s operation of Sony’s business as follows:
(1) Outside Director Initiatives
The Chairman of the Board is elected from among those Directors that are not also the Representative Corporate Executive Officer, and the Chairman leads the Board’s activities and secures the appropriate cooperation, communication and arrangement among outside Directors and Senior Executives. For example, the Board conducted outside Directors’ meetings, generally the same day as each Board Meeting was held. The Board also conducted Directors’ corporate strategic workshops with management and meetings of the Chairman and the CEO. All these activities were aimed at securing better understanding by outside Directors of Sony’s business and management’s initiatives and encouraging corporate strategic discussions among Directors.
(2) Secretariat Offices for the Board and each Committee
The company has established the secretariat offices of the Board and each Committee to support the activities of the members and encourage constructive and proactive discussion at the meetings of the Board and each Committee. Each secretariat office endeavors to distribute necessary materials for the meetings in advance and to provide other information such as accounting information, organizational charts, press releases, external analyst reports and credit rating reports, as appropriate. Each secretariat office explains the meeting agenda to the members and provides them with presentation materials in advance of each meeting date and facilitates deliberation in separate meetings or briefing sessions depending on the nature of matters to be discussed. Each secretariat office also provides the absent members with a follow up briefing, as appropriate. In addition, each secretariat office shares the annual schedule of the meetings and anticipated agenda items in advance with the members in order to appropriately set the frequency of meetings and the number of agenda items to be deliberated at each meeting.
- 75 -
(3) Provision of Necessary Information
When the company is requested to provide additional information, each secretariat office endeavors to provide the members such information promptly. Also, each secretariat office verifies appropriately whether requested information is provided smoothly. In the event that the members consult with external specialists, participate in various seminars and so on to perform their duties, the costs and expenses in connection with such activities are borne by the company in accordance with applicable internal rules.
(4) Audit Committee Aide
With the approval of the Board and with the Audit Committee’s consent, the company has established the Audit Committee Aide to support the activities of the Audit Committee. The Audit Committee Aide does not concurrently hold positions related to the business operations of Sony and, upon instruction by each Audit Committee member, conducts investigations into and analyzes auditing matters and engages in physical inspections or visiting audits either by him/herself or by cooperating with relevant departments in order to support the Audit Committee.
(5) Policy on Director Training
Newly appointed Directors receive briefings by Senior Executives and outside experts regarding their expected roles and responsibilities, including their legal duties as a Director or as a member of the Committees, as well as briefings about the business, financial status, organization and governance structure of Sony. Also, throughout their tenure, each Director receives compliance-related training in accordance with internal protocols and briefings on matters relevant to each Director’s fulfillment of his/her roles and responsibilities including the current status of Sony’s business.
Evaluation of the Board and the Committees’ Effectiveness
(1) Policy for Evaluation
Sony Group Corporation believes that it is important to endeavor to improve the effectiveness of the Board and each Committee in order to support Sony’s business operations and enhance the corporate value of Sony. To achieve this goal, Sony Group Corporation conducts evaluations of the effectiveness of the Board and of each Committee (the “Evaluation”) at least annually.
(2) Recent Evaluation
From February through May 2022, under the leadership of the Chairman of the Board, the Board conducted the Evaluation mainly in respect of Board and Committee activities in the fiscal year ended March 31, 2022 after confirming that actions proposed in response to the results of the previous Evaluation were appropriately taken. The recent Evaluation was conducted, as the company did with the previous Evaluation, with the support of a third-party outside counsel with expertise in Japanese and global corporate governance practices (the “Outside Counsel”) in order to ensure transparency and objectivity and to obtain professional advice.
(3) Procedure of the Recent Evaluation
First, the Board discussed and confirmed that the actions proposed to be taken in response to the results of the previous Evaluation were taken, and it discussed and confirmed the proposed procedures for the Evaluation for the fiscal year ended March 31, 2022. Thereafter, the third-party evaluation was conducted by the Outside Counsel in accordance with the following steps:
| • | Reviewed relevant material, such as the minutes of Board meetings, and attended a Board meeting; |
| • | Confirmed with the Board secretariat office and each Committee’s secretariat office how meetings of the Board and Committees were conducted; |
| • | Gathered responses to a questionnaire from each Director about the current status and practices of the Board and each Committee, such as the composition of the Board, operation of the Board, commitments of each Director, activities of each Committee and procedures of the previous Evaluation; |
- 76 -
| • | Interviewed the Chairman of the Board and the Chair of each Committee, Directors who are concurrently in the positions of Corporate Executive Officers, and certain additional Corporate Executive Officers about the Board and Committee status and practices; and |
| • | Researched other global companies’ practices in Japan, the United States and Europe, and compared them with the company’s practices. |
The Board then received, reviewed and discussed the Outside Counsel’s report on the results of its evaluation. The Board confirmed the effectiveness of the Board and the Committees.
(4) Summary of the Results of the Recent Evaluation
The Outside Counsel reported that the Board is established and operated in a manner sufficient to be highly regarded, based on various points, including the self-evaluation results of the Directors and the comparison with benchmarked companies in Japan, the United States and Europe. Following discussion and analysis based on the Outside Counsel’s report, the Board
re-affirmed
that the Board and each Committee were functioning effectively as of May 2022.The Outside Counsel also provided examples of potential options, based on other companies’ practices, to help further improve effectiveness of the Board and Committees. The examples include conducting mutual evaluation among Directors (peer review), enhancing the involvement by the Board in sustainability and risk management, and conducting deeper discussion regarding Board succession at Board meetings.
(5) Actions in Response to the Results of the Evaluation
In order to increase the corporate value of Sony, Sony Group Corporation will take appropriate actions to further enhance functions of the Board and the Committees in response to the results of the Evaluation, as well as various comments and opinions given by Directors and the Outside Counsel during the Evaluation process.
For reference, after the previous Evaluation conducted from February through April 2021, Sony Group Corporation took the following actions, among others, to help improve the effectiveness of the Board:
| • | Continuously made periodic reports to the Board on sustainability, including ESG (Environment, Social and Governance) related matters; |
| • | Enhanced Board’s supervision over risks regarding economic security and geopolitics; |
| • | Focused on information security continuously through maintaining the number of Directors in charge of Information Security; |
| • | Held additional executive sessions; |
| • | Expanded disclosure in the table showing experiences and expertise of Directors; and |
| • | Continuously conducted visiting audits by Audit Committee members at Sony’s business sites. |
Internal Control and Governance Framework
At a Board meeting held on April 26, 2006, the Board reaffirmed the internal control and governance framework in effect as of the date of determination and determined to continue to evaluate and improve such framework going forward, as appropriate. At a Board meeting held on May 13, 2009 and April 30, 2015, the Board amended and updated the internal control and governance framework at a Board meeting held on May 10, 2022, the Board reaffirmed such framework in effect and determined to continue to evaluate and improve such framework going forward, as appropriate. These determinations were required by and met the requirements of the Companies Act.
A summary of the principal framework of the internal control and governance framework based on the Board determination above is as follows:
(1) Disclosure Control Framework
The securities of Sony Group Corporation are listed for trading on exchanges in Japan and the U.S. As a result, Sony is obligated to make various disclosures to the public in accordance with applicable securities laws,
- 77 -
regulations and rules in those countries and listing standards of the stock exchanges on which Sony Group Corporation’s shares are listed. Sony is committed to full compliance with all requirements applicable to its public disclosures. Sony Group Corporation’s policy on investor relations activities is to aim to disclose accurate information in a timely and fair manner, as well as to endeavor to promote constructive dialogue with shareholders and investors, with a view to maximizing the corporate value by building a relationship of trust with shareholders and investors. Sony Group Corporation has established disclosure controls and procedures as an approach to implement this policy. All personnel responsible for the preparation of submissions to and filings with the TSE, the SEC and other regulatory entities, or for other public communications made on behalf of Sony, or who provide information as part of that process, have a responsibility to ensure that such disclosures and information are full, fair, accurate, timely and understandable, and in compliance with the established disclosure controls and procedures.
Sony Group Corporation has established “Disclosure Controls and Procedures” outlining the process through which potentially material information is reported from important business units, subsidiaries, affiliated companies and corporate divisions and is reviewed and considered for disclosure in light of its materiality to Sony. As a body to assist the CEO and the CFO of Sony Group Corporation in designing, implementing and evaluating the Disclosure Controls and Procedures, Sony Group Corporation has established the “Disclosure Committee,” which is comprised of members of senior management who are in charge of a part of Sony’s headquarters functions. In order to assure appropriate and timely disclosure, the Disclosure Committee shall evaluate events that are reported from the important business units, subsidiaries, affiliated companies and corporate divisions in accordance with Sony’s internal rules in light of their materiality to Sony. Based on such evaluation, the Disclosure Committee shall review the necessity of disclosure in accordance with applicable securities laws, regulations and rules, as well as the listing standards of the relevant stock exchanges, and report to the CEO and CFO for their determination.
(2) Risk Management Framework
Each business unit, subsidiary/affiliated company and corporate division of Sony periodically reviews and assesses risks and establishes and maintains necessary risk management systems (such as detection, communication, evaluation and response) for the area for which they are responsible. In addition, Senior Executives, including the Corporate Executive Officers, of Sony Group Corporation have established and currently maintain a system to identify and control risks that may cause losses to Sony regarding the areas of which they are responsible. The Corporate Executive Officer in charge of group risk control shall comprehensively promote and manage the establishment and maintenance of the systems as stated above.
D. | Employees |
As of March 31, 2022, Sony had approximately 108,900 employees, a decrease of approximately 800 employees from March 31, 2021. During the fiscal year ended March 31, 2022, although there was an increase of employees mainly in the I&SS, Music (outside of Japan) and G&NS (outside of Japan) segments, there was a decrease of employees in the EP&S segment (outside of Japan) and All Other (outside of Japan). In the EP&S segment, this was mainly due to closure of manufacturing sites in Malaysia. Approximately 9% of the total number of employees were members of labor unions.
As of March 31, 2021, Sony had approximately 109,700 employees, a decrease of approximately 2,000 employees from March 31, 2020. During the fiscal year ended March 31, 2021, although there was an increase of employees in the I&SS and Financial Services segments, there was a decrease of employees in the EP&S and Pictures segments, as well as in All Other. In the EP&S segment, this was mainly due to closure of manufacturing sites in Malaysia and Brazil. Approximately 10% of the total number of employees were members of labor unions.
As of March 31, 2020, Sony had approximately 111,700 employees, a decrease of approximately 2,700 employees from March 31, 2019. During the fiscal year ended March 31, 2020, although there was an increase of employees in the G&NS (outside of Japan), I&SS (within Japan), Music and Financial Services segments, there was a decrease of employees in the EP&S and Pictures segments, as well as in All Other. In the EP&S segment and All Other, this was mainly due to the restructuring of the smartphone business and the disc manufacturing business. Approximately 11% of the total number of employees were members of labor unions.
- 78 -
The following table shows the number of employees of Sony by segment and region as of March 31, 2020, 2021 and 2022.
Number of Employees by Segment and Region
March 31 | ||||||||||||
| 2020 | 2021 | 2022 | ||||||||||
By segment: | ||||||||||||
G&NS | 9,500 | 9,600 | 10,200 | |||||||||
Music | 9,900 | 9,900 | 10,800 | |||||||||
Pictures | 8,400 | 8,000 | 8,100 | |||||||||
EP&S | 46,800 | 43,700 | 40,200 | |||||||||
I&SS | 15,800 | 16,800 | 18,100 | |||||||||
Financial Services | 12,300 | 12,900 | 13,200 | |||||||||
All Other | 3,200 | 2,800 | 2,300 | |||||||||
Unallocated — Corporate employees | 5,800 | 6,000 | 6,000 | |||||||||
By region: | ||||||||||||
Japan | 53,700 | 54,500 | 55,100 | |||||||||
Outside of Japan | 58,000 | 55,200 | 53,800 | |||||||||
Total | 111,700 | 109,700 | 108,900 | |||||||||
In addition, the average number of employees for the fiscal years ended March 31, 2020, 2021 and 2022 calculated by averaging the total number of employees at the end of each quarter, was approximately 113,000, 110,700 and 109,600 respectively.
Sony generally considers its labor relations to be good.
In Japan, Sony Group Corporation and several subsidiaries have labor unions.
In the G&NS, EP&S and I&SS segments, Sony owns many manufacturing sites, particularly in Asia, where a few sites have labor unions that have union contracts. In China, most employees are members of labor unions. In the Americas, some manufacturing sites have labor unions. Sony has generally maintained good relationships with these labor unions. In Europe, Sony also maintains good labor relations with the European Works Council and the local Unions and Works Councils.
In the Music segment, Sony has several labor unions and generally considers its labor relations to be good.
In the Pictures segment, Sony also generally considers its labor relations to be good. A number of Pictures’ subsidiaries are signatories to union contracts. During the fiscal year ended March 31, 2022, negotiations have been conducted and agreements reached with a number of unions. Negotiations were successfully concluded with the International Alliance of Theatrical and Stage Employees (“IATSE”) for the Basic Agreement, its Local Agreements in Los Angeles, its Area Standards Agreement, the Video and Electronic Supplement and with IATSE Local 52 in New York. Each of the new IATSE agreements is for a three-year term. New three-year deals were reached with the Teamsters for agreements covering drivers and Location Managers in Los Angeles. Agreements for three-year terms were reached with the International Brotherhood of Electrical Workers, Local 40, the Southern California District Council of Laborers and its affiliate, Studio Utility Employees, Local 724, the Operative Plasterers and Cement Masons International Association of the United States and Canada, Local 755, and the United Association of Journeymen and Apprentices of the Plumbing and Pipe Fitting Industry of the United States and Canada, Local 78. Negotiations were concluded for three-year agreements with the British Columbia Council of Film, the Union of British Columbia Performers, and in Ontario with IATSE Local 873, the Alliance of Canadian Cinema, Television and Radio Artists and the Directors Guild of Canada. An agreement was reached with the American Federation of Musicians to extend the Theatrical and Television Agreements through November 14, 2022. During the fiscal year, amendments to the
COVID-19
Return to Work Agreement with the Directors Guild of America, IATSE, the Screen Actors Guild-American Federation of Television and Radio Artists(“SAG-AFTRA”),
Teamsters and Basic Crafts coveringCOVID-19
safety protocols have been negotiated and are in effect through July 15, 2022. In addition, an agreement was reached withSAG-AFTRA
forCOVID-19
return to work protocols for theSAG-AFTRA
Network Code agreement. Negotiations have commenced with a number of unions. Negotiations are underway with IATSE for agreements covering The Animation Guild, the Art Directors Guild as well as for additional local agreements in New York. Negotiations have commenced with the Teamsters for agreements with Location Managers in New York, Casting Directors in New York and Los Angeles and drivers in Miami. Negotiations are underway withSAG-AFTRA
for the Network Code and The Animation Guild Agreement and with the Communications Workers of America,AFL-CIO
for parking production assistants in New York. Negotiations have commenced with the Directors Guild of Canada, British Columbia District Council (“DGC BC”). On April 26, 2022, the DGC BC issued a strike notice. It is not anticipated that these negotiations will result in an interruption in production.- 79 -
Sony continuously strives to provide competitive wages and benefits and good working conditions for all of its employees.
E. | Share Ownership |
The total number of shares of Common Stock beneficially owned by Directors and Corporate Executive Officers listed in “Directors and Senior Management” above (out of whom 10 people own shares) was approximately 0.031% of the total shares outstanding as of June 2, 2022.
During the fiscal year ended March 31, 2022, Sony Group Corporation granted stock acquisition rights, which represent rights to subscribe for shares of Common Stock, to Corporate Executive Officers and employees of Sony Group Corporation as well as directors, officers and employees of its subsidiaries. The stock acquisition rights cannot be exercised for one year from the date of grant and generally vest ratably up to three years from the date of grant and are generally exercisable up to ten years from the date of grant. The following table shows the portion of those stock acquisition rights which were granted by Sony Group Corporation to Directors and Corporate Executive Officers as of June 2, 2022 and which were outstanding as of the same date.
Year granted (Fiscal year ended March 31) | Total number of shares subject to stock acquisition rights | Exercise price per share | ||||||
(in thousands) | ||||||||
2022 | 290 | 14,350 yen | ||||||
2021 | 260 | 9,237 yen | ||||||
2020 | 253 | 6,705 yen | ||||||
2019 | 237 | 6,440 yen | ||||||
2018 | 97 | 5,231 yen | ||||||
2017 | 190 | 3,364 yen | ||||||
2016 | 45 | 3,404 yen | ||||||
2015 | 97 | 2,410.5 yen | ||||||
2014 | 7 | 2,007 yen | ||||||
Regarding the above compensation plans, refer to Note 21 of the consolidated financial statements.
Item 7. | Major Shareholders and Related Party Transactions |
A. | Major Shareholders |
As of March 31, 2022, there were 1,261,081,781 shares of Common Stock outstanding, including 24,078,136 shares of treasury stock. Out of the total outstanding shares, 119,812,598 shares were in the form of American Depositary Receipts (“ADRs”) and 225,103,726 shares were held of record in the form of Common Stock by residents in the U.S. As of March 31, 2022, the number of registered ADR holders was 4,810 and the number of registered holders of Common Stock in the U.S. was 397.
The Financial Instruments and Exchange Act of Japan requires any person who solely or jointly owns more than 5% of total issued voting shares of a company listed on any Japanese stock exchange to file with the Kanto Local Finance Bureau (the “Bureau”) a Bulk Shareholding Report. The following table summarizes the Bulk Shareholding Reports related to Sony (each a “Report”) submitted to the Bureau, where it is reported that ownership percentage by the reported entity exceeds 5% in the most recent updated Report. The Reports do not specify whether reported ownership is direct or beneficial.
Date of Report* | Reported entities | Reported number of direct or indirect owned and deemed owned shares** | Reported percentage of direct or indirect owned and deemed owned shares** | |||||||
March 22, 2017 | BlackRock Japan Co., Ltd. and 8 Joint Holders | 79,184,569 | 6.27 | |||||||
October 6, 2020 | Nomura Asset Management Co., Ltd. and 3 Joint Holders | 63,156,882 | 5.01 | |||||||
June 6, 2022 | Sumitomo Mitsui Trust Asset Management Co., Ltd. and 1 Joint Holder | 82,189,224 | 6.52 | |||||||
* The table above contains information from the most recent updated Reports.
** Shares issuable or transferable upon exchange of exchangeable securities, conversion of convertible securities or exercise of warrants or stock acquisition rights (including those incorporated in bonds with stock acquisition rights) are taken into account in determining both the size of the reported entity’s holding and Sony’s total issued share capital.
- 80 -
To the knowledge of Sony Group Corporation, it is not directly or indirectly owned or controlled by any other corporation, by any foreign government or by any other natural or legal person either severally or jointly. As far as is known to Sony Group Corporation, there are no arrangements the operation of which may, at a subsequent date, result in a change in control of Sony Group Corporation.
To the knowledge of Sony Group Corporation, there were no significant changes in the percentage ownership held by any other major beneficial shareholders during the past three fiscal years. Major shareholders of Sony Group Corporation do not have different voting rights from other shareholders.
B. | Related Party Transactions |
In the ordinary course of business, Sony purchases materials, supplies, and services from numerous suppliers throughout the world, including firms with which certain members of the Board of Directors are affiliated.
Refer to Note 32 of the consolidated financial statements for account balances and transactions with associates and joint ventures accounted for under the equity method.
C. | Interests of Experts and Counsel |
Not Applicable
Item 8. | Financial Information |
A. | Consolidated Statements and Other Financial Information |
Refer to the consolidated financial statements and the notes of the consolidated financial statements.
Legal Proceedings
Sony Group Corporation and certain of its subsidiaries are defendants or otherwise involved in pending legal and regulatory proceedings. However, based upon the information currently available, Sony believes that the outcome from such legal and regulatory proceedings would not have a material impact on Sony’s results of operations and financial position.
Dividend Policy
Sony believes that continuously increasing corporate value and providing dividends are essential to rewarding shareholders. It is Sony’s policy to utilize retained earnings, after ensuring the perpetuation of stable dividends, to carry out various investments that contribute to an increase in corporate value, such as those that ensure future growth and strengthen competitiveness. Going forward, Sony will determine the amount of dividends based on an overall consideration of Sony’s consolidated operating results, financial condition and future business expectations.
A fiscal
year-end
dividend of 35 yen per share of Common Stock of Sony Group Corporation was approved at the Board of Directors meeting held on May 10, 2022 and the payment of such dividend started on June 3, 2022. Sony Group Corporation has already paid an interim dividend for Common Stock of 30 yen per share to each shareholder; accordingly, the total annual dividend per share of Common Stock for the fiscal year ended March 31, 2022 is 65 yen.B. | Significant Changes |
Not applicable
- 81 -
Item 9. | The Offer and Listing |
A. | Offer and Listing Details |
Trading Markets
The principal trading markets for Sony Group Corporation’s ordinary shares are the TSE in the form of Common Stock and the NYSE in the form of ADSs evidenced by ADRs. Each ADS represents one share of Common Stock.
Sony Group Corporation’s Common Stock, with no par value per share, has been listed on the TSE since 1958 under the stock code “6758.”
Sony Group Corporation’s ADRs have been traded in the U.S. since 1961 and have been listed on the NYSE since 1970. As of April 1, 2021, the ticker symbol changed from “SNE” to “SONY.” Sony Group Corporation’s ADRs are issued and exchanged by Citibank, N.A., as the Depositary.
B. | Plan of Distribution |
Not Applicable
C. | Markets |
Please refer to “Item 9.A.”
Offer and Listing Details.
D. | Selling Shareholders |
Not Applicable
E. | Dilution |
Not Applicable
F. | Expenses of the Issue |
Not Applicable
Item 10. | Additional Information |
A. | Share Capital |
Not Applicable
B. | Memorandum and Articles of Association |
Organization
Sony Group Corporation is a joint stock corporationincorporated in Japan under the Companies Actof Japan. It is registered in the Commercial Registermaintained by the Minato Branch Office of the Tokyo Legal Affairs Bureau.
(Kabushiki Kaisha)
(Kaishaho)
(Shogyo Tokibo)
Objects and purposes
The Articles of Incorporation of Sony Group Corporation provide that its purpose is to engage in the following business activities:
| (i) | manufacture and sale of electronic and electrical machines and equipment, medical instruments, optical instruments and other equipment, machines and instruments; |
| (ii) | planning, production and sale of audio-visual software and computer software programs; |
| (iii) | manufacture and sale of metal industrial products, chemical industrial products and ceramic industrial products, textile products, paper products and wood-crafted articles, daily necessities, foodstuffs and toys, transportation machines and equipment, and petroleum and coal products; |
- 82 -
| (iv) | real estate activities, construction business, transportation business and warehousing business; |
| (v) | publishing business and printing business; |
| (vi) | advertising agency business, insurance agency business, broadcasting enterprise, recreation business such as travel, management of sporting facilities, etc. and other service enterprises; |
| (vii) | financial business; |
| (viii) | Type I and Type II telecommunications business under the Telecommunications Business Law; |
| (ix) | investing in stocks and bonds, etc.; |
| (x) | manufacture, sale, export and import of products which are incidental to or related to those mentioned above; |
| (xi) | rendering of services related to those mentioned above; |
| (xii) | investment in businesses mentioned above operated by other companies or persons; and |
| (xiii) | all businesses which are incidental to or related to those mentioned above. |
Directors
Under the Companies Act, because Sony Group Corporation has adopted the “Company with Three Committees” system, Directors have no power to execute the business of Sony Group Corporation except in limited circumstances as permitted by law. If a Director also serves concurrently as a Corporate Executive Officer, then he or she can execute the business of Sony Group Corporation in the capacity of Corporate Executive Officer. Under the Companies Act, Directors must refrain from engaging in any business competing with Sony Group Corporation unless approved by the Board of Directors, and any Director who has a material interest in the subject matter of a resolution to be taken by the Board of Directors cannot vote on such resolution. The amount of remuneration to each Director is determined by the Compensation Committee, which consists of Directors, the majority of whom are outside Directors (Refer to “Board Practices” in “Item 6.”). No member of the Compensation Committee may vote on a resolution with respect to his or her own compensation as a Director or a Corporate Executive Officer.
Directors, Senior Management and Employees
Neither the Companies Act nor Sony Group Corporation’s Articles of Incorporation make a special provision as to the borrowing powers exercisable by Directors (subject to requisite internal authorizations as required by the Companies Act), their retirement age, or a requirement to hold any shares of capital stock of Sony Group Corporation.
For more information on Directors, refer to “Board Practices” in “Item 6.”
Directors, Senior Management and Employees.
Capital stock
(General)
Unless indicated otherwise, set forth below is information relating to Sony Group Corporation’s capital stock, including brief summaries of the relevant provisions of Sony Group Corporation’s Articles of Incorporation and Share Handling Regulations, currently in effect, and of the Companies Act and related regulations.
The central book-entry transfer system for shares of Japanese listed companies under the Act Concerning Book-entry Transfer of Corporate Bonds, Shares, etc. (including regulations promulgated thereunder, “Book-entry Transfer Act”) is applied to the shares of Common Stock of Sony Group Corporation. Under this system, shares of all Japanese companies listed on any Japanese stock exchange are dematerialized, and shareholders must have accounts at account management institutions to hold their shares unless such shareholder has an account at Japan Securities Depository Center, Inc. (“JASDEC”). “Account management institutions” are financial instruments traders (i.e., securities companies), banks, trust companies and certain other financial institutions that meet the requirements prescribed by the Book-entry Transfer Act. Transfer of the shares of Common Stock of Sony Group Corporation is effected exclusively through entry in the records maintained by JASDEC and the account management institutions, and title to the shares passes to the transferee at the time when the transfer of the shares is recorded at the transferee’s account at an account management institution. The holder of an account at an account management institution is presumed to be the legal holder of the shares recorded in such account.
- 83 -
Under the Companies Act and the Book-entry Transfer Act, in order to assert shareholders’ rights against Sony Group Corporation, a shareholder of shares must have its name and address registered in Sony Group Corporation’s register of shareholders. Under the central book-entry transfer system operated by JASDEC, shareholders shall notify the relevant account management institutions of certain information prescribed under the Book-entry Transfer Act or Sony Group Corporation’s Share Handling Regulations, including their names and addresses, and the registration on Sony Group Corporation’s register of shareholders is updated upon receipt by Sony Group Corporation of necessary information from JASDEC (as described in “”). On the other hand, in order to assert, against Sony Group Corporation, shareholders’ rights to which shareholders are entitled, regardless of whether such shareholder held shares on the requisite record date, such as minority shareholders’ rights, including the right to propose a matter to be considered at a General Meeting of Shareholders, except for shareholders’ rights to request that Sony Group Corporation purchase or sell shares constituting less than a full unit (as described in “”), JASDEC shall, upon the shareholder’s request, issue a notice of certain information, including the name and address of such shareholder, to Sony Group Corporation.
(Record date)
(Unit share system)
Thereafter, such shareholder is required to present Sony Group Corporation a receipt of the notice request in accordance with the Sony Group Corporation’s Share Handling Regulations. Under the Book-entry Transfer Act, the shareholder shall exercise such shareholders’ right within four weeks after the notice above has been given to Sony Group Corporation.
Mitsubishi UFJ Trust and Banking Corporation is the transfer agent for Sony Group Corporation’s capital stock. As such, it keeps Sony Group Corporation’s register of shareholders in its office at
4-5,
Marunouchi1-chome,
Chiyoda-ku,
Tokyo.Non-resident
shareholders are required to appoint a standing proxy in Japan or file notice of a mailing address in Japan. Notices from Sony Group Corporation tonon-resident
shareholders are delivered to such standing proxies or mailing address. Japanese securities companies and commercial banks customarily act as standing proxies and provide related services for standard fees. The recorded holder of deposited shares underlying the ADSs is the depositary for the ADSs. Accordingly, holders of ADSs will not be able to directly assert shareholders’ rights against Sony Group Corporation.(Authorized capital)
Under the Articles of Incorporation of Sony Group Corporation, Sony Group Corporation may only issue shares of Common Stock. Sony Group Corporation’s Articles of Incorporation provide that the total number of shares authorized to be issued by Sony Group Corporation is 3.6 billion shares.
All shares of capital stock of Sony Group Corporation have no par value. All issued shares are fully-paid and
non-assessable.
(Distribution of Surplus)
Distribution of Surplus — General
Under the Companies Act, distributions of cash or other assets by joint stock corporations to their shareholders, so called “dividends,” are referred to as “distributions of Surplus” (“Surplus” is defined in “— Restriction on distribution of Surplus”). Sony Group Corporation may make distributions of Surplus to shareholders any number of times per business year, subject to certain limitations described in “— Restriction on distribution of Surplus.” Distributions of Surplus are required in principle to be authorized by a resolution of a General Meeting of Shareholders, but Sony Group Corporation may authorize distributions of Surplus by a resolution of the Board of Directors as long as its
non-consolidated
annual financial statements and certain documents for the last business year present fairly its assets and profit or loss, as required by ordinances of the Ministry of Justice.Distributions of Surplus may be made in cash or in kind in proportion to the number of shares of Common Stock held by each shareholder. A resolution of the Board of Directors or a General Meeting of Shareholders authorizing a distribution of Surplus must specify the kind and aggregate book value of the assets to be distributed, the manner of allocation of such assets to shareholders, and the effective date of the distribution. If a distribution of Surplus is to be made in kind, Sony Group Corporation may, pursuant to a resolution of the Board of Directors or (as the case may be) a General Meeting of Shareholders, grant a right to the shareholders to require Sony Group Corporation to make such distribution in cash instead of in kind. If no such right is granted to shareholders, the relevant distribution of Surplus must be approved by a special resolution of a General Meeting of Shareholders (refer to “” with respect to a “special resolution”).
(Voting rights)
- 84 -
Under the Articles of Incorporation of Sony Group Corporation,
year-end
dividends and interim dividends may be distributed in cash to shareholders appearing in Sony Group Corporation’s register of shareholders as of March 31 and September 30 each year, respectively, in proportion to the number of shares of Common Stock held by each shareholder following approval by the Board of Directors or (as the case may be) the General Meeting of Shareholders. Sony Group Corporation is not obliged to pay any dividends in cash unclaimed for a period of five years after the date on which they first became payable.In Japan, the
ex-dividend
date and the record date for dividends precede the date of determination of the amount of the dividends to be paid. The price of the shares of Common Stock generally goesex-dividend
on the business day immediately prior to the record date (or if the record date is not a business day, the second business day prior thereto).Distribution of Surplus — Restriction on distribution of Surplus
In making a distribution of Surplus, Sony Group Corporation must, until the sum of its additional
paid-in
capital and legal reserve reaches one quarter of its stated capital, set aside in its additionalpaid-in
capital and/or legal reserve an amount equal toone-tenth
of the amount of Surplus so distributed.The amount of Surplus at any given time must be calculated in accordance with the following formula:
A + B + C + D – (E + F + G)
In the above formula:
| “A” = | the total amount of other capital surplus and other retained earnings, each such amount being that appearing on the non-consolidated balance sheet as of the end of the last business year | |||
| “B” = | (if Sony Group Corporation has disposed of its treasury stock after the end of the last business year) the amount of the consideration for such treasury stock received by Sony Group Corporation less the book value thereof | |||
| “C” = | (if Sony Group Corporation has reduced its stated capital after the end of the last business year) the amount of such reduction less the portion thereof that has been transferred to additional paid-in capital or legal reserve (if any) | |||
| “D” = | (if Sony Group Corporation has reduced its additional paid-in capital or legal reserve after the end of the last business year) the amount of such reduction less the portion thereof that has been transferred to stated capital (if any) | |||
| “E” = | (if Sony Group Corporation has cancelled its treasury stock after the end of the last business year) the book value of such treasury stock | |||
“F” = | (if Sony Group Corporation has distributed Surplus to its shareholders after the end of the last business year) the total book value of the Surplus so distributed | |||
“G” = | certain other amounts set forth in ordinances of the Ministry of Justice, including (if Sony Group Corporation has reduced Surplus and increased its stated capital, additional paid-in capital or legal reserve after the end of the last business year) the amount of such reduction and (if Sony Group Corporation has distributed Surplus to the shareholders after the end of the last business year) the amount set aside in additionalpaid-in capital or legal reserve (if any) as required by ordinances of the Ministry of Justice. | |||
The aggregate book value of Surplus distributed by Sony Group Corporation may not exceed a prescribed distributable amount (the “Distributable Amount”), as calculated on the effective date of such distribution. The Distributable Amount at any given time shall be equal to the amount of Surplus less the aggregate of the following:
| (a) | the book value of its treasury stock; |
| (b) | the amount of consideration for any of treasury stock disposed of by Sony Group Corporation after the end of the last business year; and |
| (c) | certain other amounts set forth in ordinances of the Ministry of Justice, including (if the sum of one-half of goodwill and the deferred assets exceeds the total of stated capital, additionalpaid-in capital and legal reserve, each such amount being that appearing on thenon-consolidated balance |
- 85 -
sheet as of the end of the last business year) all or certain part of such exceeding amount as calculated in accordance with ordinances of the Ministry of Justice. |
As Sony Group Corporation has become a company with respect to which consolidated balance sheets should also be considered in the calculation of the Distributable Amount (), Sony Group Corporation must further deduct from the amount of Surplus the excess amount, if any, of (x) the total amount of stockholders’ equity appearing on the
renketsu haito kisei tekiyo kaisha
non-consolidated
balance sheet as of the end of the last business year and certain other amounts set forth by an ordinance of the Ministry of Justice over (y) the total amount of stockholders’ equity and certain other amounts set forth by an ordinance of the Ministry of Justice appearing on the consolidated balance sheet as of the end of the last business year.If Sony Group Corporation has prepared interim financial statements as described below, and if such interim financial statements have been approved by the Board of Directors or (if so required by the Companies Act) by a General Meeting of Shareholders, then the Distributable Amount must be adjusted to take into account the amount of profit or loss, and the amount of consideration for any of the treasury stock disposed of by Sony Group Corporation, during the period in respect of which such interim financial statements have been prepared. Sony Group Corporation may prepare
non-consolidated
interim financial statements consisting of a balance sheet as of any date subsequent to the end of the last business year and an income statement for the period from the first day of the current business year to the date of such balance sheet. Interim financial statements so prepared by Sony Group Corporation must be audited by the Audit Committee and the independent auditor, as required by the Companies Act and in accordance with the details prescribed by ordinances of the Ministry of Justice.(Capital and reserves)
Sony Group Corporation may generally reduce its additional”) and, if so decided by the same resolution, may account for the whole or any part of the amount of such reduction as additional
paid-in
capital or legal reserve by resolution of a General Meeting of Shareholders and, if so decided by the same resolution, may account for the whole or any part of the amount of such reduction as stated capital. On the other hand, Sony Group Corporation may generally reduce its stated capital by a special shareholders’ resolution (as defined in “(Voting rights)
paid-in
capital. In addition, Sony Group Corporation may reduce its Surplus and increase either (i) stated capital or (ii) additionalpaid-in
capital and/or legal reserve by the same amount, in either case by resolution of a General Meeting of Shareholders.(Stock splits)
Sony Group Corporation may at any time split shares in issue into a greater number of shares at the determination of the CEO, and may amend its Articles of Incorporation to increase the number of the authorized shares to be issued to allow such stock split pursuant to a resolution of the Board of Directors or a determination by a Corporate Executive Officer to whom the authority to make such determination has been delegated by a resolution of the Board of Directors, rather than relying on a special shareholders’ resolution, which is otherwise required for amending the Articles of Incorporation.
When a stock split is to be made, Sony Group Corporation must give public notice of the stock split, specifying the record date thereof, at least two weeks prior to such record date. Under the central book-entry transfer system operated by JASDEC, Sony Group Corporation must also give notice to JASDEC regarding a stock split at least two weeks prior to the relevant effective date of the stock split. On the effective date of the stock split, the numbers of shares recorded in all accounts held by Sony Group Corporation’s shareholders at account managing institutions or JASDEC will be increased in accordance with the applicable ratio.
(Consolidation of shares)
Sony Group Corporation may at any time consolidate issued shares into a smaller number of shares by a special shareholders’ resolution. When a consolidation of shares is to be made, Sony Group Corporation must give public notice or notice to each shareholder at least two weeks prior to the effective date of the consolidation of shares. Under the central book-entry transfer system operated by JASDEC, Sony Group Corporation must also give notice to JASDEC regarding a consolidation of shares at least two weeks prior to the effective date of the consolidation of shares. On the effective date of the consolidation of shares, the numbers of shares recorded in all accounts held by Sony Group Corporation’s shareholders at account managing institutions or JASDEC will be decreased in accordance with the applicable ratio. Sony Group Corporation must disclose the reason for the consolidation of shares at a General Meeting of Shareholders.
- 86 -
(General Meeting of Shareholders)
The Ordinary General Meeting of Shareholders of Sony Group Corporation for each business year is normally held in June of each year in Tokyo, Japan. In addition, Sony Group Corporation may hold an Extraordinary General Meeting of Shareholders whenever necessary by giving notice thereof at least two weeks prior to the date set for the meeting.
Notice of a shareholders’ meeting setting forth the place, time and purpose thereof must be mailed to each shareholder having voting rights (or, in the case of a
non-resident
shareholder, to such shareholder’s resident proxy or mailing address in Japan) at least two weeks prior to the date set for the meeting. Under the Companies Act, such notice may be given to shareholders by electronic means, subject to obtaining the consent of the relevant shareholders. The record date for voting rights at an Ordinary General Meeting of Shareholders is March 31 of each year.Pursuant to the amendments to the Companies Act, effective as of September 1, 2022, which will apply to all Japanese listed companies, including Sony Group Corporation, and the amendments to the Articles of Incorporation approved at the General Meeting of Shareholders held on June 28, 2022, Sony Group Corporation will take measures to electronically provide to its shareholders (“Electronic Provision”) the contents of reference materials for a General Meeting of Shareholders, etc. with effect from its General Meetings of Shareholders to be held on or after March 1, 2023.
After the Electronic Provision amendment goes into effect, notice of a shareholders meeting must set forth the contents of reference materials for a General Meeting of Shareholders, etc. to be provided by way of Electronic Provision and the URL of the website used for Electronic Provision, in addition to the place, time and purpose of the meeting. The contents of reference materials for a General Meeting of Shareholders, etc. must be posted on the website from the earlier of the date three weeks prior to the date set for the meeting or the date on which the notice of the shareholders meeting is dispatched until the date on which three months have elapsed from the meeting. Any shareholder (other than those shareholders consenting to receipt of notice of shareholders’ meeting by electronic means) is entitled to request printed paper copies of the contents of reference materials for a General Meeting of Shareholders, etc. by the record date for voting rights at the relevant General Meeting of Shareholders.
Any shareholder or group of shareholders holding at least 3% of the total number of voting rights for a period of six months or more may require the convocation of a General Meeting of Shareholders for a particular purpose. Unless such a shareholders’ meeting is convened promptly or a convocation notice of a meeting that is to be held no later than eight weeks from the day of such request is dispatched, the shareholder requesting the holding of the meeting may, upon obtaining a court’s approval, convene such a shareholders’ meeting.
Any shareholder or group of shareholders holding at least 300 voting rights or 1% of the total number of voting rights for a period of six months or more may propose a matter to be considered at a General Meeting of Shareholders by submitting a written request to Sony Group Corporation at least eight weeks prior to the date set for such meeting, provided that Sony Group Corporation may limit the number of such matters requested by each shareholder to 10.
If the Articles of Incorporation so provide, any of the minimum voting rights or percentages, time periods and number of voting rights necessary for exercising the minority shareholder rights described above may be decreased or shortened. Sony Group Corporation’s Articles of Incorporation currently do not include any such provisions.
(Voting rights)
So long as Sony Group Corporation maintains the unit share system, a holder of shares constituting one or more units is entitled to one vote for each such unit of stock (refer to “” below; currently 100 shares constitute one unit), except that no voting rights with respect to shares of capital stock of Sony Group Corporation are afforded to Sony Group Corporation or any corporate or certain other entities more than
(Unit share system)
one-quarter
of the total voting rights of which are directly or indirectly held by Sony Group Corporation. If Sony Group Corporation eliminates from its Articles of Incorporation the provisions relating to units of stock, holders of capital stock will have one vote for each share they hold. Except as otherwise provided by law or by the Articles of Incorporation of Sony Group Corporation, a resolution can be adopted at a General Meeting of Shareholders by a majority of the number of voting rights of all the shareholders represented at the meeting. The Companies Act and Sony Group Corporation’s Articles of Incorporation provide, however, that the quorum for the election of Directors shall beone-third
of the total number of voting rights of all the shareholders. Sony- 87 -
Group Corporation’s shareholders are not entitled to cumulative voting in the election of Directors. Shareholders may cast their votes in writing and may also exercise their voting rights through proxies, provided that the proxies are also shareholders holding voting rights. Shareholders may also exercise their voting rights by electronic means pursuant to the method designated by Sony Group Corporation.
The Companies Act and the Articles of Incorporation of Sony Group Corporation provide that in order to amend the Articles of Incorporation and in certain other instances, including:
| (1) | acquisition of its own shares from a specific party other than its subsidiaries; |
| (2) | consolidation of shares; |
| (3) | any offering of new shares or existing shares held by Sony Group Corporation as treasury stock at a “specially favorable” price (or any offering of stock acquisition rights to acquire shares of capital stock, or bonds with stock acquisition rights on “specially favorable” conditions) to any persons other than shareholders; |
| (4) | the exemption of liability of a Director, Corporate Executive Officer or independent auditor with certain exceptions; |
| (5) | a reduction of stated capital with certain exceptions; |
| (6) | a distribution of in-kind dividends which meets certain requirements; |
| (7) | dissolution, merger, consolidation, or corporate split with certain exceptions; |
| (8) | the transfer of the whole or a material part of the business; |
| (9) | the transfer of the whole or a part of the shares or equity interests in a subsidiary which meets certain requirements; |
| (10) | the taking over of the whole of the business of any other corporation with certain exceptions; |
| (11) | share exchange or share transfer for the purpose of establishing 100% parent-subsidiary relationships with certain exceptions; or |
| (12) | partial share exchange for the purpose of establishing parent-subsidiary relationships with certain exceptions, |
the quorum shall be
one-third
of the total number of voting rights of all the shareholders, and the approval by at leasttwo-thirds
of the number of voting rights of all the shareholders represented at the meeting is required (the “special shareholders’ resolutions”).(Issue of additional shares and
pre-emptive
rights)Holders of Sony Group Corporation’s shares of capital stock have no” above.
pre-emptive
rights under its Articles of Incorporation. Authorized but unissued shares may be issued, or existing shares held by Sony Group Corporation as treasury stock may be transferred, at such times and upon such terms as the Board of Directors or the CEO determines, subject to the limitations as to the offering of new shares or transfer of existing shares held by Sony Group Corporation as treasury stock at a “specially favorable” price mentioned under “(Voting rights)
In the case of an issuance of shares (including a transfer of existing shares held by Sony Group Corporation as treasury stock) or stock acquisition rights whereby any subscriber will hold more than 50% of the voting rights of all shareholders, generally Sony Group Corporation shall give public notice at least two weeks prior to the payment date for such issuance, and if shareholders who hold
one-tenth
or more of the voting rights of all shareholders dissent from the issuance of shares or stock acquisition rights, the approval by a resolution of a General Meeting of Shareholders is generally required before the payment date pursuant to the Companies Act. In addition, in the case of an issuance of shares (including a transfer of existing shares held by Sony Group Corporation as treasury stock) or stock acquisition rights by way of an allotment to a third party which would dilute the outstanding voting shares by 25% or more or change the controlling shareholder, in addition to a resolution of the Board of Directors or a determination by the CEO, the approval of the shareholders or an affirmative vote from a person independent of the management is generally required pursuant to the rules of the TSE. The Board of Directors or the CEO may, however, determine that shareholders shall be given subscription rights regarding a particular issue of new shares, in which case such rights must be given on uniform terms to all- 88 -
shareholders as of a record date of which not less than two weeks’ prior public notice is given. Each of the shareholders to whom such rights are given must also be given notice of the expiry thereof at least two weeks prior to the date on which such rights expire.
Subject to certain conditions, Sony Group Corporation may issue stock acquisition rights by a resolution of the Board of Directors or a determination by the CEO. Holders of stock acquisition rights may exercise their rights to acquire a certain number of shares within the exercise period as prescribed in the terms of their stock acquisition rights. Upon exercise of stock acquisition rights, Sony Group Corporation will be obliged to issue the relevant number of new shares or alternatively to transfer the necessary number of treasury stock held by it.
In cases where a particular issue of new shares or stock acquisition rights (i) violates laws and regulations or Sony Group Corporation’s Articles of Incorporation, or (ii) will be performed in a materially unfair manner, and shareholders may suffer disadvantages therefrom, such shareholders may file an injunction to enjoin such issue with a court.
(Liquidation rights)
In the event of a liquidation of Sony Group Corporation, the assets remaining after payment of all debts, liquidation expenses and taxes will be distributed among the holders of shares of Common Stock in proportion to the respective numbers of shares of Common Stock held.
(Record date)
March 31 is the record date for Sony Group Corporation’s
year-end
dividends, if declared. So long as Sony Group Corporation maintains the unit share system, shareholders who are registered as the holders of one or more unit of stock in Sony Group Corporation’s register of shareholders at the end of each March 31 are also entitled to exercise shareholders’ rights at the Ordinary General Meeting of Shareholders with respect to the business year ending on such March 31. September 30 is the record date for interim dividends, if declared. In addition, Sony Group Corporation may set a record date for determining the shareholders entitled to other rights and for other purposes by giving at least two weeks’ prior public notice.JASDEC is required to promptly give Sony Group Corporation notice of the names and addresses of Sony Group Corporation’s shareholders, the numbers of shares of Common Stock held by them and other relevant information as of such respective record dates.
The price of shares generally goes
ex-dividends
orex-rights
on Japanese stock exchanges on the business day immediately prior to a record date (or if the record date is not a business day, the second business day prior thereto), for the purpose of dividends or rights offerings.(Acquisition by Sony Group Corporation of its capital stock)
Under the Companies Act and the Articles of Incorporation of Sony Group Corporation, Sony Group Corporation may acquire shares of Common Stock (i) from a specific shareholder other than any of its subsidiaries (pursuant to the special shareholders’ resolution), (ii) from any of its subsidiaries (pursuant to a determination by the CEO as delegated by the Board of Directors), or (iii) by way of purchase on any Japanese stock exchange on which Sony Group Corporation’s shares of Common Stock are listed or by way of tender offer (pursuant to a resolution of the Board of Directors, as long as its
non-consolidated
annual financial statements and certain documents for the last business year present fairly its assets and profit or loss, as required by ordinances of the Ministry of Justice).In the case of (i) above, any other shareholder may make a request to Sony Group Corporation that such other shareholder be included as a seller in the proposed purchase, provided that no such right will be available if the purchase price or any other consideration to be received by the relevant specific shareholder will not exceed the last trading price of the shares on the relevant stock exchange on the day immediately preceding the date on which the resolution mentioned in (i) above was adopted (or, if there is no trading in the shares on the stock exchange or if the stock exchange is not open on such day, the price at which the shares are first traded on such stock exchange thereafter).
The total amount of the purchase price of shares of Common Stock may not exceed the Distributable Amount, as described in “() — Distributions of Surplus — Restriction on distribution of Surplus.”
Distribution of Surplus
- 89 -
Shares acquired by Sony Group Corporation may be held for any period or may be retired at the determination of the CEO. Sony Group Corporation may also transfer (by public or private sale or otherwise) to any person the treasury stock held by it, subject to a determination by the CEO, and subject also to other requirements similar to those applicable to the issuance of new shares, as described in “” above. Sony Group Corporation may also utilize its treasury stock for the purpose of transfer to any person upon exercise of stock acquisition rights or for the purpose of acquiring another company by way of merger, share exchange, partial share exchange or corporate split through exchange of treasury stock for shares or assets of the acquired company.
(Issue of additional shares and
pre-emptive
rights)(Unit share system)
The Articles of Incorporation of Sony Group Corporation provide that 100 shares constitute one “unit” of shares of stock. The Board of Directors or the Corporate Executive Officer to whom the authority to make such a determination has been delegated by a resolution of the Board of Directors is permitted to amend the Articles of Incorporation to reduce the number of shares that constitute a unit or to abolish the unit share system entirely. Under the Companies Act, the number of shares constituting one unit cannot exceed 1,000 shares nor 0.5% of the total number of issued shares.
Under the unit share system, shareholders have one voting right for each unit of stock that they hold. Any number of shares less than one full unit have neither voting rights nor rights related to voting rights. Holders of shares constituting less than one unit will have no other shareholder rights if Sony Group Corporation’s Articles of Incorporation so provide, except that such holders may not be deprived of certain rights specified in the Companies Act or an ordinance of the Ministry of Justice, including the right to receive distribution of Surplus.
A holder of shares constituting less than one full unit may require Sony Group Corporation to purchase such shares at their market value in accordance with the provisions of the Share Handling Regulations of Sony Group Corporation. In addition, the Articles of Incorporation of Sony Group Corporation provide that a holder of shares constituting less than one full unit may request Sony Group Corporation to sell to such holder such amount of shares which will, when added together with the shares constituting less than one full unit, constitute one full unit of stock. Such request by a holder and the sale by Sony Group Corporation must be made in accordance with the provisions of the Share Handling Regulations of Sony Group Corporation. As prescribed in the Share Handling Regulations, such requests shall be made through an account management institution and JASDEC pursuant to the rules set by JASDEC, without going through the notification procedure required for the exercise of the shareholders’ rights to which shareholders are entitled, regardless of whether such shareholder held shares on the requisite record date, as described in “.” Shares constituting less than a full unit are transferable, under the central book-entry transfer system described in “.” Under the rules of the Japanese stock exchanges, however, shares constituting less than a full unit do not comprise a trading unit, except in limited circumstances, and accordingly may not be sold on the Japanese stock exchanges.
(General)
(General)
(Sale by Sony Group Corporation of shares held by shareholders whose location is unknown)
Sony Group Corporation is not required to send a notice to a shareholder if a notice to such shareholder fails to arrive at the registered address of the shareholder in Sony Group Corporation’s register of shareholders or at the address otherwise notified to Sony Group Corporation continuously for five years or more.
In addition, Sony Group Corporation may sell or otherwise dispose of shares of capital stock for which the location of the shareholder is unknown. Generally, if (i) notices to a shareholder fail to arrive continuously for five years or more at the shareholder’s registered address in Sony Group Corporation’s register of shareholders or at the address otherwise notified to Sony Group Corporation, and (ii) the shareholder fails to receive distributions of Surplus on the shares continuously for five years or more at the address registered in Sony Group Corporation’s register of shareholders or at the address otherwise notified to Sony Group Corporation, Sony Group Corporation may sell or otherwise dispose of such shareholder’s shares at the then market price of the shares by a determination of a Corporate Executive Officer and after giving at least three months’ prior public and individual notice, and hold or deposit the proceeds of such sale or disposal of shares for such shareholder.
Reporting of substantial shareholdings
The Financial Instruments and Exchange Act of Japan and its related regulations require any person, regardless of residence, who has become, beneficially and solely or jointly, a holder of more than 5% of the total issued shares of capital stock of a company listed on any Japanese stock exchange or whose shares are traded on themarket in Japan to file with the Director General of the competent Local Finance Bureau of
over-the-counter
- 90 -
the Ministry of Finance within five business days a report concerning such shareholdings. A similar report must also be filed in respect of any subsequent change of 1% or more in any such holding, or any change in material matters set out in reports previously filed, with certain exceptions. For this purpose, shares issuable to such persons upon conversion of convertible securities or exercise of share subscription warrants or stock acquisition rights are taken into account in determining both the number of shares held by such holders and the issuer’s total issued share capital. Any such report shall be filed with the Director General of the relevant Local Finance Bureau of the Ministry of Finance through the Electronic Disclosure for Investors’ Network (EDINET) system.
Ownership restrictions
Except for the general limitation under Japanese anti-trust and anti-monopoly regulations against holding of shares of capital stock of a Japanese corporation which leads or may lead to a restraint of trade or monopoly, except for the limitations under the Foreign Exchange Regulations as described in “D. Exchange Controls” below, and except for general limitations under the Companies Act or Sony Group Corporation’s Articles of Incorporation on the rights of shareholders applicable regardless of residence or nationality, there is no limitation under Japanese laws and regulations applicable to Sony Group Corporation or under its Articles of Incorporation on the rights of
non-residents
or foreign shareholders to hold or exercise voting rights on the shares of capital stock of Sony Group Corporation.There is no provision in Sony Group Corporation’s Articles of Incorporation or internal regulations that would have an effect of delaying, deferring or preventing a change in control of Sony Group Corporation and that would operate only with respect to a merger, acquisition or corporate restructuring involving Sony Group Corporation.
C. | Material Contracts |
None
D. | Exchange Controls |
Japanese Foreign Exchange Controls Regulations
The following is a general summary of major Japanese foreign exchange controls regulations applicable to holders of shares of capital stock or voting rights of Sony Group Corporation or holders of ADSs who are “exchange
non-residents”
or “foreign investors,” as described below. The statements regarding Japanese foreign exchange control regulations set forth below are based on the laws and regulations in force and as interpreted by the Japanese authorities as of the date of this annual report and are subject to subsequent changes in the applicable Japanese laws or interpretations thereof. This summary is not exhaustive of all possible foreign exchange controls considerations that may apply to a particular investor, and potential investors are advised to satisfy themselves as to the overall foreign exchange controls consequences of the acquisition, ownership and disposition of shares of capital stock or voting rights of Sony Group Corporation or ADSs by consulting their own advisors.The Foreign Exchange and Foreign Trade Act of Japan (the FEFTA) and its related cabinet orders and ministerial ordinances (collectively, the “Foreign Exchange Regulations”) govern certain aspects relating to the acquisition and holding of shares of capital stock and voting rights of Sony Group Corporation by “exchange
non-residents”
and by “foreign investors” (as these terms are defined below). The Foreign Exchange Regulations also apply to the acquisition and holding of ADSs and the exercise of voting rights by holders of ADSs who are “foreign investors” that constitute an “inward direct investment” (as defined below).Capital Transaction
Except as described below with respect to an “inward direct investment” by a “foreign investor”, the Foreign Exchange Regulations currently in effect do not affect transactions between exchange
non-residents
to purchase or sell shares of a Japanese listed corporation outside Japan using currencies other than Japanese yen.In general, the acquisition of shares of a Japanese corporation (such as the shares of capital stock of Sony Group Corporation) by an exchange
non-resident
from an exchange resident requires post facto reporting by the exchange resident to the Minister of Finance. No such reporting requirement is imposed, however, if:| (i) | the aggregate purchase price of the relevant shares is 100 million yen or less; |
- 91 -
| (ii) | the acquisition is effected through any bank, financial instruments business operator or other entity prescribed by the Foreign Exchange Regulations acting as an agent or intermediary; or |
| (iii) | the acquisition constitutes an “inward direct investment” described below (in which case a prior notification requirement may apply). |
Exchange residents are defined in the Foreign Exchange Regulations as:
| (i) | individuals who reside within Japan; or |
| (ii) | corporations whose principal offices are located within Japan. |
Exchange
non-residents
are defined in the Foreign Exchange Regulations as:| (i) | individuals who do not reside in Japan; or |
| (ii) | corporations whose principal offices are located outside Japan. |
Generally, branches and other offices of
non-resident
corporations that are located within Japan are regarded as exchange residents. Conversely, branches and other offices of Japanese corporations located outside Japan are regarded as exchangenon-residents.
Inward Direct Investment in Shares of Listed Corporations
Definition of Foreign Investor
Foreign investors are defined in the Foreign Exchange Regulations as:
| (i) | individuals who are exchange non-residents; |
| (ii) | corporations or other entities that are organized under the laws of foreign countries or whose principal offices are located outside Japan; |
| (iii) | corporations of which 50% or more of the total voting rights are held, directly or indirectly, by individuals and/or corporations falling within (i) and/or (ii) above; |
| (iv) | partnerships under the Civil Code of Japan established to invest in corporations, limited partnerships for investment under the Limited Partnership Act for Investment of Japan or any other similar partnerships under foreign law of which (a) 50% or more of the total contributions are made by individuals and/or corporations falling within (i), (ii), (iii) above and/or (v) below or any other persons prescribed under the Foreign Exchange Regulations or (b) a majority of the general partners are individuals and/or corporations falling within (i), (ii), (iii) above and/or (v) below or any other persons prescribed under the Foreign Exchange Regulations; or |
| (v) | corporations or other entities, a majority of whose directors or other officers (or directors or other officers having the power of representation) are individuals who are exchange non-residents. |
Definition of Inward Direct Investment
If a foreign investor acquires shares or voting rights of a Japanese corporation that is listed on a Japanese stock exchange (such as the shares of capital stock of Sony Group Corporation) or that is traded on anmarket in Japan and, as a result of the acquisition, the foreign investor, in combination with any existing holdings, directly or indirectly holds 1% or more of the total number of issued shares or the total number of voting rights of the relevant corporation, such acquisition constitutes an “inward direct investment.” In addition, the acquisition of the authority to exercise, either directly or through instructions, voting rights held by other shareholders that results in the foreign investor, in combination with any existing shareholding, directly or indirectly holding 1% or more of the total number of voting rights of the relevant corporation constitutes an “inward direct investment.”
over-the-counter
In addition to the acquisitions of shares or voting rights described above, if a foreign investor (i) is granted the authority to exercise voting rights on behalf of other shareholders of a Japanese listed corporation regarding certain matters which may give such foreign investor the power to control, or may have a material influence on the management of such corporation, such as the election or removal of directors, or (ii) obtains consent from another foreign investor holding the voting rights of the relevant corporation to exercise the voting rights of such corporation held by such other foreign investor jointly, and, in each case, as a result of these arrangements, the
- 92 -
number of the voting rights directly or indirectly held by the foreign investor, including the total number of the voting rights subject to such authorization to exercise, or the sum of the number of the voting rights directly or indirectly held by the foreign investor and such other foreign investor subject to such joint voting agreement, as the case may be, is 10% or more of the total number of voting rights of the relevant corporation, each such arrangement regarding voting rights (hereinafter referred to as a “voting arrangement”) also constitutes an “inward direct investment”.
Additionally, if a foreign investor directly or indirectly holds 1% or more of the total voting rights of a Japanese listed corporation and, at a general meeting of shareholders, consents to certain proposals having a material influence on the management of such corporation such as the (i) election of such foreign investor or any of its related persons (as defined in the Foreign Exchange Regulations) as a director or corporate auditor of the relevant corporation or (ii) transfer or discontinuation of its business, such consent also constitutes an “inward direct investment.”
Prior Notification Requirements regarding Inward Direct Investment
If a foreign investor intends to consummate an acquisition of shares or voting rights of a Japanese listed corporation or the authority to exercise, either directly or through instructions, voting rights held by other shareholders that constitutes an “inward direct investment” as described above, unless certain exemptions apply (such as where the foreign investor is in a country that is listed on an exemption schedule in the Foreign Exchange Regulations and where that Japanese corporation is not engaged in certain businesses (the “Designated Businesses”) designated by the Foreign Exchange Regulations), a prior notification of the relevant inward direct investment is required to be filed with the Minister of Finance and any other competent Ministers.
However, if a foreign investor is seeking to acquire shares or voting rights of a Japanese listed corporation or the authority to exercise, either directly or through instructions, voting rights held by other shareholders and such acquisition would constitute an “inward direct investment”, such foreign investor may be eligible for the exemptions if certain conditions are met. In the case of an acquisition of shares or voting rights or the authority to exercise, either directly or through instructions, voting rights of a Japanese listed corporation that is engaged in a Designated Business other than certain Designated Business designated by the Foreign Exchange Regulations as a core sector business (the “Core Sector Designated Businesses”), the foreign investor may be exempted from the prior notification requirement if such foreign investor complies with the following conditions (the “Exemption Conditions”):
| (i) | the foreign investor or its related persons will not become directors or corporate auditors of the relevant corporation; |
| (ii) | the foreign investor will not make certain proposals (as prescribed in the Foreign Exchange Regulations) at the general meeting of shareholders, including transfer or discontinuation of the Designated Businesses of the relevant corporation; and |
| (iii) | the foreign investor will not access non-public technical information in relation to the Designated Businesses of the relevant corporation, or take certain other actions that may lead to the leak of suchnon-public technical information (as prescribed in the Foreign Exchange Regulations). |
In addition, in the case of an acquisition of shares or voting rights or the authority to exercise, directly or through instructions, voting rights of a Japanese listed corporation that is engaged in the Core Sector Designated Businesses, the foreign investor may be exempted from the prior notification requirement, if, as a result of such acquisition, the foreign investor, in combination with any existing holdings, directly or indirectly holds less than 10% of the total number of issued shares or voting rights of the relevant corporation and such foreign investor complies with the Exemption Conditions and the following additional conditions:
| (i) | the foreign investor will not attend, or not cause any persons designated by it to attend, meetings of the relevant corporation’s board of directors, or meetings of committees having authority to make important decisions, in respect of the Core Sector Designated Businesses of the relevant corporation; and |
| (ii) | the foreign investor will not make, or not cause any persons designated by it to make, proposals to such board or committees or their members in writing or electronic form requesting any response or actions by certain deadlines in respect of the Core Sector Designated Businesses of the relevant corporation. |
Notwithstanding the above, if a foreign investor falls under a category of disqualified investors designated by the Foreign Exchange Regulations (including (a) investors who have been sanctioned during the previous five
- 93 -
years due to violations of the FEFTA and (b) certain investors that are state-owned enterprises or other related entities that are not otherwise accredited by the Minister of Finance), in no event may such foreign investor be eligible for the exemptions described above. On the other hand, if a foreign investor, excluding the disqualified investors described in the foregoing sentence, falls under a category of certain foreign financial institutions (as prescribed in the Foreign Exchange Regulations) and complies with the Exemption Conditions, such foreign investor may be eligible for the exemptions described above, even if the acquisition results in such foreign investor’s directly or indirectly holding 10% or more of the total number of issued shares or voting rights of the corporation engaged in the Core Sector Designated Businesses.
For reference purposes only, the Minister of Finance publishes, and may update from time to time, a list that classifies Japanese listed corporations into the following categories: (i) corporations engaged only in businesses other than the Designated Businesses, (ii) corporations engaged in Designated Businesses other than Core Sector Designated Businesses and (iii) corporations engaged in the Core Sector Designated Businesses. According to the list published by the Minister of Finance, as of November 2, 2021, Sony Group Corporation is classified as category (iii) above.
In addition, if a foreign investor intends to make a voting arrangement with respect to a Japanese listed corporation engaged in the Designated Businesses or consents to a proposal at the general meeting of shareholders of such corporation, in each case, that constitutes an “inward direct investment” as described in “Definition of Inward Direct Investment” above, in certain circumstances, prior notification of the relevant inward direct investment must be filed with the Minister of Finance and any other competent Ministers. In such cases, the exemptions from the prior notification requirements may not be available, except for cases where the relevant voting arrangement is a joint voting agreement with other foreign investors to exercise voting rights regarding matters other than certain matters which may give such foreign investor the power to control, or may have a material influence on the management of the relevant corporation, such as the election or removal of directors.
Acquisitions of shares by foreign investors by way of stock split are not subject to the foregoing notification requirements.
Procedures for Prior Notification regarding Inward Direct Investment
If such prior notification is filed, the proposed inward direct investment may not be consummated until 30 days after the date of filing during which time the Ministers will review the proposed inward direct investment, although this screening period may be shortened by such Ministers if they no longer deem it necessary to review the proposed inward direct investment, or may be shortened to five business days, if the proposed inward direct investment is determined not to raise concerns from the perspective of national security or certain other factors. The Ministers may extend the screening period up to five months if they deem it necessary to continue to review the proposed inward direct investment, and may recommend any modification or abandonment of the proposed inward direct investment and, if the foreign investor does not accept such recommendation, the Ministers may order the modification or abandonment of such inward direct investment. In addition, if the Ministers consider the proposed inward direct investment to be an inward direct investment that is likely to cause damage to the national security of Japan, to interfere with the maintenance of public order or to pose an obstacle to the preservation of public safety, and, if a foreign investor (i) consummates such inward direct investment without filing the prior notification described above; (ii) consummates such inward direct investment before the expiration of the screening period described above; (iii) in connection with such inward direct investment, makes false statements in the prior notification described above; or (iv) does not follow the recommendation or order issued by the Ministers to modify or abandon such inward direct investment, the Ministers may order such foreign investor to divest all or part of the shares acquired or take other measures.
Post Facto Reporting Requirements regarding Inward Direct Investment
A foreign investor who consummates an inward direct investment as described above through an acquisition of shares or voting rights or the authority to exercise, directly or through instructions, voting rights of a Japanese listed corporation that is engaged in the Designated Businesses, but is not subject to the prior notification requirements described above due to the exemptions from such prior notification requirements, in general, must file a post facto report of the relevant inward direct investment with the Minister of Finance and any other competent Ministers having jurisdiction over such Japanese corporation within 45 days of the date when, as a result of such acquisition, the foreign investor, in combination with any existing holdings, directly or indirectly holds (i) 1% or more but less than 3% of the total number of issued shares or voting rights, for the first time, (ii) 3% or more but less than 10% of the total number of issued shares or voting rights, for the first time, or (iii) 10%
- 94 -
or more of the total number of issued shares or voting rights (excluding, in the cases of (i) and (ii) above, a foreign investor who falls under a category of certain foreign financial institutions (as prescribed in the Foreign Exchange Regulations)). In addition, if a foreign investor consummates the inward direct investment described above through the acquisition of shares or voting rights or the authority to exercise, directly or through instructions, voting rights of a Japanese listed corporation that is not engaged in the Designated Businesses (which is, in general, not subject to the prior notification requirements described above) and, as a result of such inward direct investment, such foreign investor, in combination with any existing holdings, directly or indirectly holds 10% or more of shares or voting rights of the total number of issued shares or voting rights of the relevant corporation, such foreign investor, in general, must file a post facto report of the relevant inward direct investment with the Minister of Finance and any other competent Ministers having jurisdiction over such Japanese corporation within 45 days of such inward direct investment.
In addition, if a foreign investor consummates the inward direct investment described above through a voting arrangement with respect to a Japanese listed corporation that is not engaged in the Designated Businesses (which is, in general, not subject to the prior notification requirements described above), such foreign investor, in general, must file a post facto report of the relevant inward direct investment with the Minister of Finance and any other competent Ministers having jurisdiction over such Japanese corporation within 45 days of such inward direct investment.
Acquisitions of shares by foreign investors by way of stock split are not subject to the foregoing reporting requirements.
Dividends and Proceeds of Sale
Under the Foreign Exchange Regulations, dividends paid on and the proceeds from sales in Japan of shares of capital stock of Sony Group Corporation held by exchange
non-residents
may generally be converted into any foreign currency and repatriated abroad.E. | Taxation |
The following is a summary of the major Japanese national tax and U.S. federal income tax consequences of the ownership, acquisition and disposition of shares of Common Stock of Sony Group Corporation and of ADRs evidencing ADSs representing shares of Common Stock of Sony Group Corporation by a
non-resident
of Japan or anon-Japanese
corporation without a permanent establishment in Japan. The summary does not purport to be a comprehensive description of all of the tax considerations that may be relevant to any particular investor, and does not take into account any specific individual circumstances of any particular investor. Accordingly, holders of shares of Common Stock or ADSs of Sony Group Corporation are encouraged to consult their tax advisors regarding the application of the considerations discussed below to their particular circumstances.This summary is based upon the representations of the depositary and the assumption that each obligation in the deposit agreement in relation to the ADSs dated as of October 15, 2014, and in any related agreement, will be performed in accordance with its terms.
For purposes of the income tax convention between Japan and the United States (the “Treaty”) and the U.S. Internal Revenue Code of 1986, as amended (the “Code”), U.S. holders of ADSs generally will be treated as owning shares of Common Stock of Sony Group Corporation underlying the ADSs evidenced by the ADRs. For the purposes of the following discussion, a “U.S. holder” is a holder that:
| (i) | is a resident of the U.S. for purposes of the Treaty; |
| (ii) | does not maintain a permanent establishment in Japan (a) with which shares of Common Stock or ADSs of Sony Group Corporation are effectively connected and through which the U.S. holder carries on or has carried on business or (b) of which shares of Common Stock or ADSs of Sony Group Corporation form part of the business property; and |
| (iii) | is eligible for benefits under the Treaty with respect to income and gain derived in connection with shares of Common Stock or ADSs of Sony Group Corporation. |
The following is a summary of the principal Japanese tax consequences (limited to national taxes) to
non-residents
of Japan ornon-Japanese
corporations without a permanent establishment in Japan(“non-resident
Holders”) who are holders of shares of Common Stock of Sony Group Corporation or of ADRs evidencing ADSs representing shares of Common Stock of Sony Group Corporation. The information given below regarding Japanese taxation is based on the tax laws and tax treaties in force and their interpretations by the Japanese tax- 95 -
authorities as of June 28, 2022. Tax laws and tax treaties as well as their interpretations may change at any time, possibly with retroactive effect. Sony Group Corporation will not update this summary for any changes in the tax laws or tax treaties or their interpretation that occurs after such date.
Generally,
non-resident
Holders are subject to Japanese withholding tax on dividends paid by Japanese corporations. Such taxes are withheld prior to payment of dividends as required by Japanese law. Stock splits are, in general, not a taxable event.In the absence of an applicable tax treaty, convention or agreement reducing the maximum rate of Japanese withholding tax or allowing exemption from Japanese withholding tax, the rate of Japanese withholding tax applicable to dividends paid by Japanese corporations to
non-resident
Holders is generally 20.42%, provided, with respect to dividends paid on listed shares issued by a Japanese corporation (such as the shares of Common Stock or ADSs of Sony Group Corporation) tonon-resident
Holders other than anynon-resident
Holder who is an individual holding 3% or more of the total shares issued by the relevant Japanese corporation, the aforementioned 20.42% withholding tax rate is reduced to 15.315% for dividends due and payable on or before December 31, 2037. Due to the imposition of a special additional withholding tax (2.1% of the original withholding tax amount) to secure funds for reconstruction from the Great East Japan Earthquake, the original withholding tax rates of 15% and 20% as applicable, have been effectively increased to 15.315% and 20.42%, respectively, until December 31, 2037.As of the date of this document, Japan has income tax treaties, conventions or agreements in force, whereby the above-mentioned withholding tax rate is reduced, in most cases to 15%, 10% or 5% for portfolio investors (15% under the income tax treaties with, among other countries, Canada, Denmark, Finland, Germany, Iceland, Ireland, Italy, Luxembourg, New Zealand, Norway and Singapore, 10% under the income tax treaties with, among other countries, Australia, Austria, Belgium, France, Hong Kong, the Netherlands, Portugal, Sweden, Switzerland, the U.K. and the United States, and 5% under the income tax treaties with, among other countries, Spain). Under the Treaty, the maximum rate of Japanese withholding tax that may be imposed on dividends paid by a Japanese corporation to a U.S. holder that does not own directly or indirectly at least 10% of the voting stock of the Japanese corporation is generally reduced to 10% of the gross amount actually distributed, and dividends paid by a Japanese corporation to a U.S. holder that is a pension fund are exempt from Japanese income taxation by way of withholding or otherwise unless such dividends are derived from the carrying on of a business, directly or indirectly, by such pension fund.
If the maximum tax rate provided for in the income tax treaty applicable to dividends paid by Sony Group Corporation to any particular
non-resident
Holder is lower than the withholding tax rate otherwise applicable under Japanese tax law, or if any particularnon-resident
Holder is exempt from Japanese income tax with respect to such dividends under the income tax treaty applicable to such particularnon-resident
Holder, suchnon-resident
Holder who is entitled to a reduced rate of or exemption from Japanese withholding tax on payment of dividends on shares of Common Stock by Sony Group Corporation is, in principle, required to submit an Application Form for Income Tax Convention Regarding Relief from Japanese Income Tax and Special Income Tax for Reconstruction on Dividends (together with any other required forms and documents) in advance through the withholding agent to the relevant tax authority before the payment of dividends. A standing proxy fornon-resident
Holders of a Japanese corporation may provide this application service. In this regard, a certain simplified special filing procedure is available fornon-resident
Holders to claim treaty benefits of exemption from or reduction of Japanese withholding tax, by submitting a Special Application Form for Income Tax Convention Regarding Relief from Japanese Tax and Special Income Tax for Reconstruction on Dividends of Listed Stock (together with any other required forms and documents). With respect to ADSs, this reduced rate or exemption is applicable if the depositary or its agent submits two Application Forms (one before payment of dividends and the other within eight months after the record date concerning such payment of dividends). To claim this reduced rate or exemption, anon-resident
Holder of ADSs will be required to file a proof of taxpayer status, residence and beneficial ownership (as applicable) and to provide other information or documents as may be required by the depositary. Anon-resident
Holder who is entitled, under an applicable income tax treaty, to a reduced rate which is lower than the withholding tax rate otherwise applicable under Japanese tax law or an exemption from the withholding tax, but failed to submit the required application in advance will be entitled to claim the refund of taxes withheld in excess of the rate under an applicable tax treaty (if suchnon-resident
Holder is entitled to a reduced treaty rate under the applicable income tax treaty) or the full amount of tax withheld (if suchnon-resident
Holder is entitled to an exemption under the applicable income tax treaty) from the relevant Japanese tax authority, by complying with a certain subsequent filing procedure. Sony Group Corporation does not assume any responsibility to ensure withholding at the reduced treaty rate or to ensure the absence of withholding for shareholders who would be so eligible under any applicable income tax treaty but where the required procedures as stated above are not followed.- 96 -
Gains derived from the sale of shares of Common Stock or ADSs of Sony Group Corporation outside Japan by a
non-resident
Holder holding such shares or ADSs as portfolio investors are, in general, not subject to Japanese income tax or corporation tax under Japanese tax law. U.S. holders are not subject to Japanese income or corporation tax with respect to such gains under the Treaty.Japanese inheritance tax and gift tax at progressive rates may be payable by an individual who has acquired from another individual shares of Common Stock or ADSs of Sony Group Corporation as a legatee, heir or donee even though neither the acquiring individual nor the deceased nor donor is a Japanese resident.
Holders of shares of Common Stock or ADSs of Sony Group Corporation should consult their tax advisors regarding the effect of these taxes and, in the case of U.S. holders, the possible application of the Estate and Gift Tax Treaty between the U.S. and Japan.
United States Taxation with respect to shares of Common Stock and ADSs
The U.S. dollar amount of dividends received (prior to deduction of Japanese taxes) by a U.S. holder of ADSs or Common Stock of Sony Group Corporation will be included in income as ordinary income for U.S. federal income tax purposes to the extent paid out of current or accumulated earnings and profits of Sony Group Corporation as determined for U.S. federal income tax purposes. Subject to certain exceptions for short-term and hedged positions, the U.S. dollar amount of dividends received by a
non-corporate
U.S. holder with respect to the ADSs or Common Stock will be subject to taxation at a reduced rate if the dividends are “qualified dividends.” Dividends paid on the ADSs or Common Stock will be treated as qualified dividends if Sony Group Corporation was not, in the year prior to the year in which the dividend was paid, and is not, in the year in which the dividend is paid a passive foreign investment company (“PFIC”). Based on Sony Group Corporation’s audited financial statements and relevant market and shareholder data, Sony Group Corporation believes that it was not treated as a PFIC for U.S. federal income tax purposes with respect to its taxable year ended March 31, 2022. In addition, based on Sony Group Corporation’s audited financial statements and Sony Group Corporation’s current expectations regarding the value and nature of its assets, the sources and nature of its income, and relevant market and shareholder data, Sony Group Corporation does not anticipate becoming a PFIC for the taxable year ending March 31, 2023. Holders of ADSs and Common Stock of Sony Group Corporation should consult their own tax advisors regarding the availability of the reduced dividend tax rate in light of the considerations discussed above and their own particular circumstances.Subject to applicable limitations and special considerations discussed below, a U.S. holder of ADSs or Common Stock of Sony Group Corporation may be entitled to a credit for Japanese tax withheld in accordance with the Treaty from dividends paid by Sony Group Corporation. The applicable limitations include new requirements recently adopted by the U.S. Internal Revenue Service that any Japanese tax will need to satisfy in order to be eligible to be a creditable tax for a U.S. holder. In the case of a U.S. holder that properly elects the benefits of the Treaty, the Japanese tax on dividends will be treated as meeting the new requirements and therefore as a creditable tax. In the case of all other U.S. holders, the application of these requirements to the Japanese tax on dividends is uncertain and Sony Group Corporation has not determined whether these requirements have been met. Foreign tax credits will not be allowed for withholding taxes imposed in respect of certain short-term or hedged positions and may not be allowed in respect of arrangements in which economic profit, after
non-U.S.
taxes, is insubstantial. If the Japanese dividend tax is not a creditable tax for a U.S. holder or the U.S. holder does not elect to claim a foreign tax credit for any foreign income taxes, the U.S. holder may be able to deduct the Japanese tax in computing such U.S. holder’s taxable income for U.S. federal income tax purposes. Holders of ADSs and Common Stock of Sony Group Corporation should consult their own tax advisors regarding the implications of these rules in light of their particular circumstances.For purposes of the foreign tax credit limitation, dividends will be foreign source income, and will generally constitute “passive” income.
Dividends paid by Sony Group Corporation to U.S. corporate holders of ADSs or Common Stock of Sony Group Corporation will not be eligible for the dividends-received deduction.
In general, a U.S. holder will recognize capital gain or loss upon the sale or other disposition of ADSs or Common Stock of Sony Group Corporation equal to the difference between the amount realized on the sale or disposition and the U.S. holder’s tax basis in the ADSs or Common Stock. Such capital gain or loss will be long-term capital gain or loss if the ADSs or Common Stock have been held for more than one year on the date of the sale or disposition. The net amount of long-term capital gain recognized by an individual holder is subject to lower rates of federal income taxation than ordinary income or short-term capital gain rates.
- 97 -
Under the Code, a U.S. holder of ADSs or Common Stock of Sony Group Corporation may be subject, under certain circumstances, to information reporting and possibly backup withholding with respect to dividends and proceeds from the sale or other disposition of ADSs or Common Stock, unless the U.S. holder provides proof of an applicable exemption or correct taxpayer identification number and otherwise complies with applicable requirements of the backup withholding rules. Any amount withheld under the backup withholding rules is not an additional tax and may be refunded or credited against the U.S. holder’s federal income tax liability, so long as the required information is furnished to the U.S. Internal Revenue Service.
F. | Dividends and Paying Agents |
Not Applicable
G. | Statement by Experts |
Not Applicable
H. | Documents on Display |
It is possible to read and copy documents referred to in this annual report on Formfor further information on the public reference rooms and their copy charges. You can also access the documents at the SEC’s home page (https://www.sec.gov).
20-F
that have been filed with the SEC at the SEC’s public reference room located at 100 F Street, N.E., Washington, D.C. 20549. Please call the SEC at1-800-SEC-0330
I. | Subsidiary Information |
Not Applicable
Item 11. | Quantitative and Qualitative Disclosures about Market Risk |
Sony’s business is continuously exposed to market fluctuation, such as fluctuations in currency exchange rates, interest rates or stock prices. For risk management policies and exposures for each risk, refer to Note 6 of the consolidated financial statements. For risk inherent in the insurance business, which is included in the Financial Services segment, refer to Note 13 of the consolidated financial statements. For derivative instruments and hedging activities utilized by Sony to reduce such risk, refer to Note 15 of the consolidated financial statements. For credit risk exposure for financial assets of debt instruments designated to be measured at fair value through profit or loss, refer to Note 6 of the consolidated financial statements.
Item 12. | Description of Securities Other Than Equity Securities |
A. | Debt Securities |
Not Applicable
B. | Warrants and Rights |
Not Applicable
C. | Other Securities |
Not Applicable
D. | American Depositary Shares |
Citibank N.A. (the “Depositary”) serves as the depositary for Sony Group Corporation’s ADSs pursuant to a deposit agreement between Sony Group Corporation, the Depositary, and the holders and beneficial owners of ADSs issued thereunder from time to time (the “Deposit Agreement”) (attached as Exhibit 2.1 to this report). ADS holders (“Holders”) may be required to pay various fees to the Depositary and the Depositary may refuse to provide any service for which a fee is assessed until the applicable fee has been paid. The following fees may at any time and from time to time be changed by agreement between Sony Group Corporation and the Depositary.
Under the terms of the Deposit Agreement, Holders may have to pay the following service fees to the Depositary.
- 98 -
Service | Rate | By Whom Paid | ||
Issuance of ADSs upon deposit of Sony Group Corporation’s Common Stock | Up to 5.00 U.S. dollar per 100 ADSs (or fraction thereof) issued | Person depositing Sony Group Corporation’s Common Stock or person receiving ADSs | ||
Delivery of deposited securities against surrender of ADSs | Up to 5.00 U.S. dollar per 100 ADSs (or fraction thereof) surrendered | Person surrendering ADSs for the purpose of withdrawal of deposited securities or person to whom deposited securities are delivered | ||
Distribution of cash dividends or other cash distributions (i.e., sale of rights and other entitlements) | Up to 5.00 U.S. dollar per 100 ADSs (or fraction thereof) held | Person to whom distribution is made | ||
Distribution of ADSs pursuant to (i) stock dividends or other free stock distributions, (ii) exercise of rights to purchase additional ADSs | Up to 5.00 U.S. dollar per 100 ADSs (or fraction thereof) held | Person to whom distribution is made | ||
Distribution of securities other than ADSs or rights purchase Additional ADSs (i.e., spin-off shares) | Up to 5.00 U.S. dollar per 100 ADSs (or fraction thereof) held | Person to whom distribution is made | ||
ADS Services | Up to 5.00 U.S. dollar per 100 ADSs (or fraction thereof) held on the applicable record date (s) established by the Depositary | Person holding ADSs on the applicable record date (s) established by the Depositary | ||
Holders will also be responsible for paying certain charges such as: (i) taxes (including applicable interest and penalties) and other governmental charges; (ii) such registration fees as may from time to time be in effect for the registration of Sony Group Corporation’s Common Stock or other deposited securities on the share register and applicable to transfer of Sony Group Corporation’s Common Stock or other deposited securities to or from the name of the custodian, the Depositary or any nominees upon the making of deposits and withdrawals, respectively; (iii) such cable, telex and facsimile transmission and delivery expenses as are expressly provided in the Deposit Agreement to be at the expense of the person depositing Sony Group Corporation’s Common Stock or withdrawing deposited securities or of the Holders and beneficial owners of ADSs; (iv) the expenses and charges incurred by the Depositary in the conversion of foreign currency; (v) such fees and expenses as are incurred by the Depositary in connection with compliance with exchange control regulations and other regulatory requirements applicable to Sony Group Corporation’s Common Stock, deposited securities, ADSs and ADRs; and (vi) the fees and expenses incurred by the Depositary, the custodian, or any nominee in connection with the servicing or delivery of deposited property.
ADS fees and charges payable upon (i) deposit of shares against issuance of ADSs and (ii) surrender of ADSs for cancellation and withdrawal of deposited securities will be payable by the person to whom the ADSs so issued are delivered by the Depositary (in the case of ADS issuances) or by the person who delivers the ADSs for cancellation to the Depositary (in the case of ADS cancellations). In the case of ADSs issued by the Depositary into the Depository Trust Company (DTC) or presented to the Depositary via DTC, the ADS issuance and cancellation fees and charges will be payable by the DTC participant (s) receiving the ADSs from the Depositary or the DTC participant (s) surrendering the ADSs to the Depositary for cancellation, as the case may be, on behalf of the beneficial owner (s) and will be charged by the DTC participant (s) to the account (s) of the applicable beneficial owner (s) in accordance with the procedures and practices of the DTC participant (s) as in effect at the time. ADS fees and charges in respect of distributions and the ADS service fee are payable by Holders as of the applicable ADS record date established by the Depositary. In the case of distributions of cash, the amount of the applicable ADS fees and charges is deducted from the funds being distributed. In the case of (i) distributions other than cash and (ii) the ADS service fee, the applicable Holders as of the ADS record date established by the Depositary will be invoiced for the amount of the ADS fees and charges. For ADSs held through DTC, the ADS fees and charges for distributions other than cash and the ADS service fee are charged to the DTC participants in accordance with the procedures and practices prescribed by DTC from time to time and the DTC participants in turn charge the amount of such ADS fees and charges to the beneficial owners for whom they hold ADSs.
- 99 -
In the event of refusal by a Holder to pay the Depositary fees, the Depositary may, under the terms of the Deposit Agreement, refuse the requested service until payment is received or may set off the amount of the Depositary fees from any distribution to be made to the Holder. Note that the fees and charges Holders may be required to pay may vary over time and may be changed by Sony Group Corporation and by the Depositary. Holders will receive prior notice of such changes. The Depositary may reimburse Sony Group Corporation for certain expenses incurred by Sony Group Corporation in respect of the ADR program, by making available a portion of the ADS fees charged in respect of the ADR program or otherwise, upon such terms and conditions as Sony Group Corporation and the Depositary agree from time to time.
Direct and Indirect Payments by the Depositary to Sony
The Depositary reimburses Sony for certain expenses Sony incurs in connection with its ADR program, subject to certain ceilings. These reimbursable expenses currently include, but are not limited to, legal and accounting fees, investor relations expenses and fees payable to service providers for the distribution of material to ADR holders. For the fiscal year ended March 31, 2022, such reimbursements totaled 5,228,886.37 U.S. dollars.
In addition, as part of its service to Sony, the Depositary waives fees in connection with its ADR program, subject to a ceiling. These waived expenses currently include, but are not limited to, standard costs associated with the administration of the ADR program, associated operating expenses, investor relations advice and access to an internet-based tool used in Sony’s investor relations activities. For the fiscal year ended March 31, 2022, the amount of such indirect payments was estimated to total 5,000 U.S. dollars.
Item 13. | Defaults, Dividend Arrearages and Delinquencies |
None
Item 14. | Material Modifications to the Rights of Security Holders and Use of Proceeds |
None
Item 15. | Controls and Procedures |
Item 15(a). Disclosure Controls and Procedures
Sony has carried out an evaluation under the supervision and with the participation of Sony’s management, including the CEO and CFO, of the effectiveness of the design and operation of Sony’s disclosure controls and procedures, as defined in Rules
13a-15(e)
and15d-15(e)
under the Exchange Act, as of March 31, 2022. Disclosure controls and procedures require that information to be disclosed in the reports Sony Group Corporation files or submits under the Securities and Exchange Act of 1934 is recorded, processed, summarized and reported as and when required, within the time periods specified in the applicable rules and forms, and that such information is accumulated and communicated to Sony’s management, including the CEO and CFO, as appropriate to allow timely decisions regarding required disclosure. There are inherent limitations to the effectiveness of any system of disclosure controls and procedures, including the possibility of human error and the circumvention or overriding of the controls and procedures. Accordingly, even effective disclosure controls and procedures can only provide reasonable assurance of achieving their control objectives. Based upon Sony’s evaluation, the CEO and CFO have concluded that, as of March 31, 2022, the disclosure controls and procedures were effective at the reasonable assurance level.Item 15(b). Management’s Annual Report on Internal Control over Financial Reporting
Sony’s management is responsible for establishing and maintaining adequate internal control over financial reporting, as defined in Rules
13a-15(f)
and15d-15(f)
under the Exchange Act. Sony’s internal control over financial reporting is designed to provide reasonable assurance regarding the reliability of financial reporting and the preparation of financial statements for external purposes in accordance with IFRS. Sony’s internal control over financial reporting includes those policies and procedures that:| (i) | pertain to the maintenance of records that, in reasonable detail, accurately and fairly reflect the transactions and dispositions of the assets of Sony; |
- 100 -
| (ii) | provide reasonable assurance that transactions are recorded as necessary to permit preparation of financial statements in accordance with generally accepted accounting principles, and that receipts and expenditures of Sony are being made only in accordance with authorizations of management and directors; and |
| (iii) | provide reasonable assurance regarding prevention or timely detection of unauthorized acquisition, use or disposition of Sony’s assets that could have a material effect on the financial statements. |
Because of its inherent limitations, internal control over financial reporting may not prevent or detect misstatements. Also, projections of any evaluation of effectiveness to future periods are subject to the risk that controls may become inadequate because of changes in conditions, or that the degree of compliance with the policies or procedures may deteriorate.
Sony’s management evaluated the effectiveness of Sony’s internal control over financial reporting as of March 31, 2022 based on the criteria established in “Internal Control — Integrated Framework (2013)” issued by the Committee of Sponsoring Organizations of the Treadway Commission (COSO). Based on the evaluation, management has concluded that Sony maintained effective internal control over financial reporting as of March 31, 2022.
Sony’s independent registered public accounting firm, PricewaterhouseCoopers Aarata LLC, has issued an audit report on the effectiveness of Sony’s internal control over financial reporting as of March 31, 2022, presented on page
(F-2).
Item 15(c). Attestation Report of the Registered Public Accounting Firm
Refer to the Report of Independent Registered Public Accounting Firm on page
(F-2).
Item 15(d). Changes in Internal Control over Financial Reporting
There has been no change in Sony’s internal control over financial reporting during the fiscal year ended March 31, 2022 that has materially affected, or is reasonably likely to materially affect, Sony’s internal control over financial reporting.
Item 16. | [Reserved] |
Item 16A. | Audit Committee Financial Expert |
Sony Group Corporation’s Board of Directors has determined that Toshiko Oka and Keiko Kishigami each qualifies as an “audit committee financial expert” as defined in Item 16A of Form
20-F
under the Exchange Act, as amended. In addition, both are determined to be independent as defined under the NYSE Corporate Governance Standards.Item 16B. | Code of Ethics |
Sony has adopted a code of ethics, as defined in Item 16B of Form
20-F
under the Exchange Act, as amended. The code of ethics applies to all directors, officers and employees of Sony. The code of ethics is available at:https://www.sony.com/en/SonyInfo/csr_report/compliance/
Item 16C. | Principal Accountant Fees and Services |
Audit and
Non-Audit
FeesThe following table presents fees for audit and other services rendered by PricewaterhouseCoopers for the fiscal years ended March 31, 2021 and 2022.
Fiscal year ended March 31 | ||||||||
| 2021 | 2022 | |||||||
Yen in millions | ||||||||
Audit Fees (1) | 4,207 | 4,514 | ||||||
Audit-Related Fees (2) | 128 | 175 | ||||||
Tax Fees | 0 | 0 | ||||||
All Other Fees (3) | 67 | 16 | ||||||
| 4,402 | 4,705 | |||||||
- 101 -
| (1) | Audit Fees consist of fees for the annual audit services engagement and other audit services, which are those services that only the external auditor can provide. |
| (2) | Audit-Related Fees consist of fees billed for assurance and related services, and audit services relating to benefit plans, business acquisitions and dispositions. |
| (3) | All Other Fees consist of fees primarily for services rendered with respect to advisory services. |
Audit Committee’s
Pre-Approval
Policies and ProceduresConsistent with the SEC rules regarding auditor independence, Sony Group Corporation’s Audit Committee is responsible for appointing, reviewing and setting compensation, retaining, and overseeing the work of Sony’s independent auditor, so that the auditor’s independence will not be impaired. The Audit Committee established a formal policy requiring
pre-approval
of all audit and permissiblenon-audit
services provided by the independent auditor to Sony Group Corporation or any of its subsidiaries. The Audit Committee periodically reviews this policy with due regard for compliance with laws and regulations of host countries where Sony Group Corporation is listed.Prior to the engagement of the independent auditor for the following fiscal year’s audit, management in charge of accounting or other relevant areas (“Accounting Management”) submits an application form to the Audit Committee for comprehensive
pre-approval
of all recurring services expected to be rendered during that year, other than services that are classified as “Tax” related services (“Tax Services”). In order to obtain comprehensivepre-approval,
Accounting Management must designate in which of two categories (Audit andNon-Audit)
the services will be classified as well as fees expected, both for each category in the aggregate and for each individual service, and detailedback-up
information regarding each service to the extent possible to ensure that the Audit Committee knows precisely what particular service and the expected fees it is being asked topre-approve
and that the scope of any service or the expected fees approved is unambiguous. Any additional services not within the scope of comprehensivepre-approval
and Tax Services require the Audit Committee’s separatepre-approval
on an individual basis. The Audit Committee approves, if necessary, any changes in terms, conditions and fees resulting from changes in the scope of services to be provided or from other circumstances, with respect to both services that are subject to comprehensive and individualpre-approval.
The Audit Committee or its designee establishes procedures to assure that the independent auditor is aware in a timely manner of the services that have beenpre-approved.
Item 16D. | Exemptions from the Listing Standards for Audit Committees |
Not Applicable
Item 16E. | Purchases of Equity Securities by the Issuer and Affiliated Purchasers |
The following table sets out information concerning purchases made by Sony Group Corporation during the fiscal year ended March 31, 2022.
Period | (a) Total number of shares purchased | (b) Average price paid per share (yen) | (c) Total number of shares purchased as part of publicly announced plans or programs *1,2 | (d) Maximum number of shares that may yet be purchased under the plans or programs *1,2 | ||||||||||
April 1 — 30, 2021 | 2,210 | 11,978.55 | N/A | N/A | ||||||||||
May 1 — 31, 2021 | 632,531 | 10,324.46 | 631,100 | 24,368,900 | ||||||||||
June 1 — 30, 2021 | 94,602 | 10,475.99 | 91,700 | 24,277,200 | ||||||||||
July 1 — 31, 2021 | 2,233 | 11,105.50 | 0 | 24,277,200 | ||||||||||
August 1 — 31, 2021 | 1,072,692 | 11,007.70 | 1,070,200 | 23,207,000 | ||||||||||
September 1 — 30, 2021 | 186,449 | 11,345.35 | 184,100 | 23,022,900 | ||||||||||
October 1 — 31, 2021 | 905,525 | 12,468.77 | 903,400 | 22,119,500 | ||||||||||
November 1 — 30, 2021 | 403,606 | 14,198.24 | 400,900 | 21,718,600 | ||||||||||
December 1 — 31, 2021 | 863,746 | 13,870.72 | 860,300 | 20,858,300 | ||||||||||
January 1 — 31, 2022 | 414,993 | 11,880.78 | 412,300 | 20,446,000 | ||||||||||
February 1 — 28, 2022 | 1,085,475 | 12,028.09 | 1,084,000 | 19,362,000 | ||||||||||
March 1 — 31, 2022 | 1,764,231 | 11,415.45 | 1,762,600 | 17,599,400 | ||||||||||
Total | 7,428,293 | 11,930.63 | 7,400,600 | N/A | ||||||||||
- 102 -
Column (a) represents the combined total number of shares purchased during the fiscal year ended March 31, 2022, including both fractional shares purchased from fractional shareholders in accordance with the Companies Act, and shares purchased in accordance with publicly announced plans, as shown in column (c).
Under the Companies Act, a holder of shares constituting less than one full unit may require Sony Group Corporation to purchase such shares at their market value (Refer to “B. Memorandum and Articles of Association — —” in “Item 10.”). During the fiscal year ended March 31, 2022, Sony Group Corporation purchased 27,693 shares of common stock for a total purchase price of 342,929,935 yen upon such requests from holders of shares constituting less than one full unit.
Capital stock
(Unit share system)
Additional Information
*1 Sony approved on April 28, 2021 by resolution of the Board of Directors the setting of the following parameters for repurchase of its own common stock pursuant to the Companies Act and Sony Group Corporation’s Articles of Incorporation
| • | Total number of shares for repurchase: 25 million shares (maximum) (2.02% of total number of shares issued and outstanding (excluding treasury stock)) |
| • | Total purchase price for repurchase of shares: 200 billion yen (maximum) |
| • | Period of repurchase: From April 30, 2021 to April 28, 2022 |
*2 The repurchase of shares of common stock based on the above approval at the Board of Directors was completed. The details are as follows.
| • | Total number of shares repurchased: 8,206,900 shares |
| • | Total purchase price for repurchased shares: 97,381,577,700 yen |
| • | Period of repurchase: April 30, 2021 to April 28, 2022 |
Item 16F. | Change in Registrant’s Certifying Accountant |
Not Applicable
- 103 -
Item 16G. | Disclosure About Differences in Corporate Governance |
The table below discloses the significant ways in which Sony’s corporate governance practices differ from those required for U.S. companies under the listing standards of the NYSE. As a foreign private issuer listed on the NYSE, Sony Group Corporation is exempt from most of the exchange’s corporate governance standards requirements. For further information on Sony’s corporate governance practices and history, please refer to “Board Practices” in “Item 6..”
Directors, Senior Management and Employees
NYSE Standards | Sony’s Corporate Governance Practices | |
Board Independence. | Sony Group Corporation has adopted the “Company with Three Committees” corporate governance system under the Companies Act. Sony Group Corporation’s Board Charter requires its board to consist of between 8 to 14 directors. The Companies Act does not require Sony Group Corporation to have a majority of “independent” (in the meaning given by the NYSE Corporate Governance Standards) directors on its board; rather, it requires Sony Group Corporation to have a majority of “outside” directors (the definition of the term “outside” director is summarized below) on each of three statutory committees (the Nominating Committee, the Audit Committee and the Compensation Committee). | |
Director Independence. (i) a person who the board determines has a material direct or indirect relationship with the company, its parent or a consolidated subsidiary; (ii) a person who, within the last three years, has been an employee of the company or has an immediate family member of an executive officer of the company, its parent or a consolidated subsidiary; (iii) a person who had received, or whose immediate family member had received, during any 12-month period within the last three years, more than 120,000 U.S. dollars per year in direct compensation from the company, its parent or a consolidated subsidiary, other than director and committee fees or deferred compensation for prior services (provided such compensation is not contingent in any way on continued service); (iv) (A) a person who is, or whose immediate family member is, a current partner or employee of a firm that is the company’s internal or external auditor; (B) a person whose immediate family member is a partner of such a firm; (C) a person who has an immediate family member who is a current employee of such a firm and who personally participates in the firm’s audit, assurance or tax compliance (but not tax planning) practice; or (D) a person who was, or has an immediate family member who was, within the last three years, a partner or employee of such a firm and personally worked on the listed company’s audit within that time; (v) a person who is, or whose immediate family member is, or has been within the last three years, employed as an executive officer of another company where any of | “Outside” director is defined in the Companies Act as a person who satisfies all of the requirements (i) through (v) below: (i) a person who is not a Director of Sony Group Corporation or any of its subsidiaries engaged in the business operations of Sony Group Corporation or such subsidiaries, as the case may be, or a Corporate Executive Officer or general manager or other employee (“Group Executive Director, etc.”) of Sony Group Corporation or any of its subsidiaries and who has not been a Group Executive Director, etc. of Sony Group Corporation or any of its subsidiaries for ten years prior to assuming his/her office; (ii) if a person who has been a director, accounting counselor (if the accounting counselor is a juridical person, a member who is in charge of the affairs), or corporate auditor of Sony Group Corporation or any of its subsidiaries (excluding a person who has been a Group Executive Director, etc.) at the time within ten years prior to assuming his/her office, a person who has not been a Group Executive Director, etc. of Sony Group Corporation or any of its subsidiaries for ten years prior to assuming his/her office as a director, an accounting counselor, or a corporate auditor; (iii) a person who is not a director or a Corporate Executive Officer or general manager or other employee of a parent company or any entity which controls the management of Sony Group Corporation; (iv) a person who is not a Group Executive Director, etc. of a direct/indirect subsidiary of Sony Group Corporation or any entity the management of which is directly or indirectly controlled by Sony Group Corporation; and (v) a person who is not a spouse or relative within the second degree of kinship of a Director or a Corporate Executive Officer or general manager or other | |
- 104 -
NYSE Standards | Sony’s Corporate Governance Practices | |
the listed company’s present executive officers at the same time serves or served on that company’s compensation committee; or (vi) an executive officer or employee of a company, or has an immediate family member of an executive officer of a company, that makes payments to, or receives payments from, the listed company, its parent or a consolidated subsidiary for property or services in an amount which, in any of the last three fiscal years, exceeds the greater of 1 million U.S. dollars or 2% of such other company’s consolidated gross revenues | employee of Sony Group Corporation. Under the Companies Act, a director’s status as an “outside” director is unaffected by the director’s compensation, his or her affiliation with business partners, or the board’s affirmative determination of independence. On the other hand, under the Companies Act, a director who has had a career as a management director, corporate executive officer, or other employee of the company, its subsidiaries or other group companies is by definition not an “outside” director. | |
Sony Group Corporation’s Board Charter includes a provision requiring that each “outside” director: (i) Shall not have received directly from Sony Group, during any consecutive 12-month period within the last three years, more than an amount equivalent to 120,000 U.S. dollars, other than Director and committee fees and pension or other forms of deferred compensation for prior service (provided such compensation is not contingent in any way on continued service); and(ii) Shall not be an executive director, a corporate executive officer, a general manager or other employee of any company whose aggregate amount of transactions with Sony Group, in any of the last three fiscal years, exceeds the greater of an amount equivalent to 1,000,000 U.S. dollars, or 2% of the annual consolidated sales of such company; | ||
In addition, the Securities Listing Regulations of the TSE require Sony Group Corporation to make efforts to have at least one “Independent Director” on the Board of Directors. “Independent Director” is defined in the Securities Listing Regulations of the TSE as an “outside” director who is unlikely to have conflicts of interest with shareholders. According to the guidelines of the TSE, if a person falls in any of the categories listed below, such person, in principle, will be considered to have a conflict of interest with shareholders of the listed company. (1) A person for which the listed company is a major client or a person who executes business of a person for which the listed company is a major client; (2) A major client of the listed company or a person who executes business of a major client of the listed company; (3) A consultant, accounting professional, or legal professional (or, if such consultant, accounting professional, or legal professional is a juridical person, a member of such juridical person) of the listed company who receives a large amount of money or other consideration other than remuneration for directorship/auditorship from such listed company; | ||
- 105 -
NYSE Standards | Sony’s Corporate Governance Practices | |
(4) A person who has fallen in any of categories (1) through (3) listed above until recently; (5) A person who has fallen in any of categories (a) or (b) listed below for ten years prior to assuming his/her office: (a) A person who executes business of a parent company of the listed company or a director who does not execute business of a parent company of the listed company; or (b) A person who executes business of a fellow subsidiary of the listed company. | ||
(6) A close relative of a person who falls in any of categories (a) through (f) listed below (only if such person is significant): (a) A person who falls in any of (1) through (5) listed above; (b) A person who executes business of a subsidiary of the listed company; (c) A director who does not execute business of a subsidiary of the listed company; (d) A person who executes business of a parent company of the listed company or a director who does not execute business of a parent company of the listed company; (e) A person who executes business of a fellow subsidiary of the listed company; or (f) A person who has fallen in any of categories (b) or (c) listed above or a person who has executed business of the listed company until recently. | ||
As of June 28, 2022, 7 of the 10 members of Sony Group Corporation’s Board of Directors qualified as “outside” directors. In addition, all 7 “outside” directors are qualified and designated as “Independent Directors” under the Securities Listing Regulations of the TSE. | ||
Executive Sessions. Non-management directors must meet in regularly scheduled executive sessions without management. Independent directors should meet alone in an executive session at least once a year. | An “outside” director, as defined under the Companies Act, is equivalent to a “non-management director” under the NYSE rules because an “outside” director does not engage in the execution of business operations of the company.The outside/non-management Directors generally meet several times a year without management, though neither the Companies Act nor Sony Group Corporation’s Board Charter requiresnon-management Directors to meet regularly without management and there is no requirement for the outside Directors to meet alone in an executive session at least once a year. | |
- 106 -
NYSE Standards | Sony’s Corporate Governance Practices | |
Nominating/Corporate Governance Committee. | Sony Group Corporation’s Nominating Committee shall consist of at least three Directors. Under the Companies Act, the Committee is responsible for determining the contents of proposals regarding the appointment and dismissal of Directors to be submitted for approval to the shareholders’ meeting. Unlike listed U.S. companies under NYSE rules, it is not responsible for developing governance guidelines or overseeing the evaluation of the board and management. Under the Companies Act, a majority of its members shall be “outside” directors, as defined under the Companies Act. | |
Compensation Committee. | Sony Group Corporation’s Compensation Committee shall consist of at least three Directors. Under the Companies Act, a majority of its members shall be “outside” directors, as defined under the Companies Act. Sony Group Corporation’s Board Charter prohibits the CEO, the COO and/or the CFO (or a person at any equivalent position) from serving on the Compensation Committee. Under the Companies Act, the Committee is responsible for, among others, determining the compensation of each director and Corporate Executive Officer. | |
Audit Committee. Rule 10A-3 under the Exchange Act is required. The committee must have at least three members. All members must be independent. The committee must have a charter addressing the committee’s purpose, an annual performance evaluation of the committee and the duties and responsibilities of the committee. | Sony Group Corporation’s Audit Committee shall consist of at least three Directors. Under the Companies Act, a majority of its members shall be “outside” Directors, as defined under the Companies Act. In addition, pursuant to the Companies Act, no member of the Committee shall be a Director of the company or any of its subsidiaries who is engaged in the business operations of the company or such subsidiary, as the case may be, or a corporate executive officer of the company or any of its subsidiaries, or an accounting counselor, general manager or other employee of any of such subsidiaries. Sony Group Corporation’s Board Charter also requires each member of the Audit Committee to meet the independence requirements of the applicable U.S. securities laws and regulations, and requires at least one member to meet the audit committee financial expert requirements. Currently, all the members of Sony Group Corporation’s Audit Committee are also “independent” as defined in the NYSE Corporate Governance Standards, and two members of the Committee are qualified as audit committee financial experts. | |
- 107 -
NYSE Standards | Sony’s Corporate Governance Practices | |
Equity Compensation Plans. | Under the Companies Act, if Sony Group Corporation wishes to adopt an equity compensation plan under which stock acquisition rights or shares of common stock are granted on specially favorable conditions, except where all of its shareholders are granted rights to subscribe for such stock acquisition rights/shares of common stock or such stock acquisition rights/shares of common stock are gratuitously allocated to all of its shareholders, each on a pro rata basis, then Sony Group Corporation must obtain shareholder approval by a “special resolution” at a General Meeting of Shareholders, where the quorum is one-third of the total number of voting rights of all of its shareholders and the approval by at leasttwo-thirds of the number of voting rights of all the shareholders represented at the meeting is required under Sony Group Corporation’s Articles of Incorporation.On the other hand, under the Companies Act, if Sony Group Corporation wishes to adopt an equity compensation plan under which stock acquisition rights or shares of common stock are granted against fair value thereof, such plan can be adopted by the resolution of Sony Group Corporation’s Compensation Committee, and grants of stock acquisition rights or shares pursuant to such plan may be decided by a resolution of the Board of Directors or a determination by a Corporate Executive Officer to whom the authority to make such determination has been delegated, and no shareholder approval is required. | |
Corporate Governance Guidelines. | Sony Group Corporation is required to disclose the status of its corporate governance under the Companies Act, Financial Instruments and Exchange Act and its related regulations, and the Securities Listing Regulations of the TSE; however, Sony Group Corporation does not have corporate governance guidelines that cover all the requirements described in the NYSE Corporate Governance Standards, as many of the provisions do not apply to Sony Group Corporation. Details of the status are posted on the following website: https://www.sony.net/SonyInfo/csr_report/governance/ | |
Code of Ethics. | Although this provision of the NYSE Corporate Governance Standards does not apply to Sony Group Corporation, Sony Group Corporation has adopted a code of conduct to be observed by all its directors, officers and other employees. The code of conduct is available at: (The latest version of Sustainability Report – Ethics and Compliance / The Sony Group Code of Conduct) https://www.sony.com/en/SonyInfo/csr/library/ reports/ The code’s content covers principal items described in the NYSE Corporate Governance Standards. | |
- 108 -
Item 16H. | Mine Safety Disclosure |
Not Applicable
Item 16I. | Disclosure Regarding Foreign Jurisdictions that Prevent Inspections |
Not Applicable
Item 17. | Financial Statements |
Not Applicable
Item 18. | Financial Statements |
Refer to the consolidated financial statements.
- 109 -
Item 19. | Exhibits |
Documents filed as exhibits to this annual report:
| 1.1 | ||
| 1.2 | ||
| 1.3 | ||
| 2.1 | ||
| 2.2 | ||
| 2.3 | ||
| 8.1 | ||
| 12.1 | ||
| 12.2 | ||
| 13.1 | ||
| 15.1 | ||
| 101.INS | Inline XBRL Instance Document — the instance document does not appear in the Interactive Data File because its XBRL tags are embedded within the Inline XBRL document | |
| 101.SCH | Inline XBRL Taxonomy Extension Schema Document | |
| 101.CAL | Inline XBRL Taxonomy Extension Calculation Linkbase Document | |
| 101.DEF | Inline XBRL Taxonomy Extension Definition Linkbase Document | |
| 101.LAB | Inline XBRL Taxonomy Extension Label Linkbase Document | |
| 101.PRE | Inline XBRL Taxonomy Extension Presentation Linkbase Document | |
| 104 | The cover page for the Company’s Annual Report on Form 20-F for the fiscal year ended March 31, 2022, has been formatted in Inline XBRL | |
- 110 -
SIGNATURES
Pursuant to the requirements of Section 12 of the Securities Exchange Act of 1934, the registrant hereby certifies that it meets all of the requirements for filing on Form
20-F
and that it has duly caused and authorized the undersigned to sign this annual report on its behalf.SONY GROUP CORPORATION | ||
(Registrant) | ||
By: | /s/ HIROKI TOTOKI | |
(Signature) | ||
Hiroki Totoki | ||
Executive Deputy President and Chief Financial Officer | ||
Date: June 28, 2022
- 111 -
INDEX TO CONSOLIDATED FINANCIAL STATEMENTS
SONY GROUP CORPORATION AND CONSOLIDATED SUBSIDIARIES
Page | ||
| F-2 | ||
| F-6 | ||
| F-8 | ||
| F-9 | ||
| F-10 | ||
| F-11 | ||
| F-13 | ||
| F-14 |
All other schedules are omitted because they are not applicable or the required information is shown in the financial statements or the notes thereto.
F-
1
Report of Independent Registered Public Accounting Firm
To the Board of Directors and Stockholders of Sony Group Corporation (Sony Group Kabushiki Kaisha)
Opinions on the Financial Statements and Internal Control over Financial Reporting
We have audited the accompanying consolidated statements of financial position of Sony Group Corporation and its subsidiaries (the “Company”) as of March 31, 2022 and 2021 and April 1, 2020, and the related consolidated statements of income, comprehensive income, changes in stockholders’ equity and cash flows for each of the two years in the period ended March 31, 2022, including the related notes (collectively referred to as the “consolidated financial statements”). We also have audited the Company’s internal control over financial reporting as of March 31, 2022, based on criteria established in(2013) issued by the Committee of Sponsoring Organizations of the Treadway Commission (COSO).
Internal Control — Integrated Framework
In our opinion, the consolidated financial statements referred to above present fairly, in all material respects, the financial position of the Company as of March 31, 2022 and 2021 and April 1, 2020, and the results of its operations and its cash flows for each of the two years in the period ended March 31, 2022 in conformity with International Financial Reporting Standards as issued by the International Accounting Standards Board. Also in our opinion, the Company maintained, in all material respects, effective internal control over financial reporting as of March 31, 2022, based on criteria established in(2013) issued by the COSO.
Internal Control — Integrated Framework
Basis for Opinions
The Company’s management is responsible for these consolidated financial statements, for maintaining effective internal control over financial reporting, and for its assessment of the effectiveness of internal control over financial reporting, included in Management’s Annual Report on Internal Control over Financial Reporting appearing under Item 15(b). Our responsibility is to express opinions on the Company’s consolidated financial statements and on the Company’s internal control over financial reporting based on our audits. We are a public accounting firm registered with the Public Company Accounting Oversight Board (United States) (PCAOB) and are required to be independent with respect to the Company in accordance with the U.S. federal securities laws and the applicable rules and regulations of the Securities and Exchange Commission and the PCAOB.
We conducted our audits in accordance with the standards of the PCAOB. Those standards require that we plan and perform the audits to obtain reasonable assurance about whether the consolidated financial statements are free of material misstatement, whether due to error or fraud, and whether effective internal control over financial reporting was maintained in all material respects.
Our audits of the consolidated financial statements included performing procedures to assess the risks of material misstatement of the consolidated financial statements, whether due to error or fraud, and performing procedures that respond to those risks. Such procedures included examining, on a test basis, evidence regarding the amounts and disclosures in the consolidated financial statements. Our audits also included evaluating the accounting principles used and significant estimates made by management, as well as evaluating the overall presentation of the consolidated financial statements. Our audit of internal control over financial reporting included obtaining an understanding of internal control over financial reporting, assessing the risk that a material weakness exists, and testing and evaluating the design and operating effectiveness of internal control based on the assessed risk. Our audits also included performing such other procedures as we considered necessary in the circumstances. We believe that our audits provide a reasonable basis for our opinions.
Definition and Limitations of Internal Control over Financial Reporting
A company’s internal control over financial reporting is a process designed to provide reasonable assurance regarding the reliability of financial reporting and the preparation of financial statements for external purposes in accordance with generally accepted accounting principles. A company’s internal control over financial reporting includes those policies and procedures that (i) pertain to the maintenance of records that, in reasonable detail, accurately and fairly reflect the transactions and dispositions of the assets of the company; (ii) provide reasonable assurance that transactions are recorded as necessary to permit preparation of financial statements in accordance with generally accepted accounting principles, and that receipts and expenditures of the company are being made only in accordance with authorizations of management and directors of the company; and (iii) provide reasonable assurance regarding prevention or timely detection of unauthorized acquisition, use, or disposition of the company’s assets that could have a material effect on the financial statements.
F-2
Because of its inherent limitations, internal control over financial reporting may not prevent or detect misstatements. Also, projections of any evaluation of effectiveness to future periods are subject to the risk that controls may become inadequate because of changes in conditions, or that the degree of compliance with the policies or procedures may deteriorate.
Critical Audit Matters
The critical audit matter communicated below is a matter arising from the current period audit of the consolidated financial statements that was communicated or required to be communicated to the audit committee and that (i) relates to accounts or disclosures that are material to the consolidated financial statements and (ii) involved our especially challenging, subjective, or complex judgments. The communication of critical audit matters does not alter in any way our opinion on the consolidated financial statements, taken as a whole, and we are not, by communicating the critical audit matter below, providing a separate opinion on the critical audit matter or on the accounts or disclosures to which it relates.
Valuation of liabilities for future insurance policy benefits and deferred acquisition costs
As described in Notes 3 and 13 to the consolidated financial statements, liabilities for future insurance policy benefits include liabilities for minimum guarantee benefits related to certain variable life insurance contracts. For these contract features, the liabilities for minimum guarantee benefits are calculated using current best-estimate assumptions and are based on the ratio of the present value of expected total excess payments divided by the present value of expected total assessments over the life of the contract. The significant assumptions in the valuation include mortality rates, lapse rates, discount rates and investment yields. As of March 31, 2022, the liabilities for minimum guarantee benefits for the variable life contracts were 63,392 million yen.
Also, the Company defers acquisition costs that are related directly to the acquisition or renewal of insurance policies to the extent such costs are determined to be recoverable from future profits. Among them, the deferred insurance acquisition costs for
non-traditional
life insurance contracts such as interest sensitive whole life contracts, individual annuity contracts and other contracts without life contingencies are amortized over the expected life at a constant rate based on the present value of the estimated gross profit. The present value of the estimated gross profit is affected by a number of significant assumptions, including investment yields, mortality rates, lapse rates and discount rates. At March 31, 2022, deferred insurance acquisition costs fornon-traditional
life insurance contracts were 261,475 million yen.In addition, as described in Notes 3, 13 and 34, the Company applies shadow accounting which requires a shadow liability adequacy test, in which future insurance policy benefits minus deferred insurance acquisition costs in the consolidated statements of financial position are compared to the valuation of future cash flows on a best-estimate basis as of the end of the reporting period to determine if the future insurance policy benefits are recorded at a sufficient level. The valuation of future cash flows is affected by a number of significant assumptions, including mortality rates, morbidity rates, lapse rates and discount rates. If there is a shortage compared to the valuation of future cash flows on a best-estimate basis at the time, the deferred insurance acquisition costs will be decreased to the extent of the shortage through other comprehensive income. If the deferred insurance acquisition costs are decreased to zero and the shortage remains, the future insurance policy benefits are increased by the remaining shortage through other comprehensive income. As of March 31, 2022, future insurance policy benefits and deferred insurance acquisition costs, the majority of which were subject to the shadow liability adequacy test, were 7,039,034 million yen and 676,526 million yen, respectively. As a result of the shadow liability adequacy test, the Company concluded that there was no shortage and has not reduced the deferred insurance acquisition costs or increased the future insurance policy benefits as of March 31, 2022.
The principal considerations for our determination that performing procedures relating to the valuation of liabilities for future insurance policy benefits and deferred acquisition costs is a critical audit matter are (i) the significant judgment involved by management in developing the aforementioned assumptions, (ii) this in turn led to a high degree of auditor judgment, subjectivity, and effort in performing procedures and evaluating audit evidence related to management’s significant assumptions, and (iii) the audit effort involved the use of professionals with specialized skill and knowledge.
Addressing the matter involved performing procedures and evaluating audit evidence in connection with forming our overall opinion on the consolidated financial statements. These procedures included testing the effectiveness of controls relating to the valuation of: (i) liabilities for minimum guarantee benefits for certain variable life insurance contracts, (ii) deferred insurance acquisition costs for
non-traditional
life insurance contracts, and (iii) deferred insurance acquisition costs and future insurance policy benefits related to traditional life insuranceF-3
contracts under the shadow liability adequacy test; including controls over the determination of significant assumptions related to mortality rates, morbidity rates, lapse rates, discount rates, and investment yields, and controls over the completeness and accuracy of data used by management to develop the assumptions, such as past claim, lapse, discount rates, and investment yield data. These procedures also included, among others, testing the completeness and accuracy of data used by management to develop the significant assumptions; and considering the reasonableness of the significant assumptions across products, in relation to prior periods, and in relation to management’s historical experience or industry knowledge. Professionals with specialized skill and knowledge were used to assist in evaluating the reasonableness of the methodology used by management to determine their assumptions and the reasonableness of the aforementioned assumptions used in the valuation of liabilities for minimum guarantee benefits for certain variable life contracts, deferred insurance acquisition costs for
non-traditional
life insurance contracts, and deferred insurance acquisition costs and future insurance policy benefits related to traditional life insurance contracts under the shadow liability adequacy test, based on industry knowledge and the Company’s historical data and experience./s/ PricewaterhouseCoopers Aarata LLC
Tokyo, Japan
June 28, 2022
We have served as the Company’s auditor since 2006.
F-4
[THIS PAGE IS INTENTIONALLY LEFT BLANK]
F-5
SONY GROUP CORPORATION AND CONSOLIDATED SUBSIDIARIES
Consolidated Statements of Financial Position
Yen in millions | ||||||||||||||
Note | April 1, 2020 | March 31, 2021 | March 31, 2022 | |||||||||||
ASSETS | ||||||||||||||
Current assets: | ||||||||||||||
Cash and cash equivalents | 27 | 1,512,523 | 1,786,982 | 2,049,636 | ||||||||||
Investments and advances in the Financial Services segment (including assets pledged that secured parties are permitted to sell or repledge of 54,745 million yen, 98,119 million yen and 94,147 million yen as of April 1, 2020, March 31, 2021 and 2022, respectively) | 5, 14 | 327,092 | 411,982 | 360,673 | ||||||||||
Trade and other receivables, and contract assets | 5, 22 | 1,194,334 | 1,365,493 | 1,628,521 | ||||||||||
Inventories | 7 | 559,779 | 636,668 | 874,007 | ||||||||||
Other financial assets | 5 | 135,482 | 117,682 | 149,301 | ||||||||||
Other current assets | 19 | 441,974 | 396,210 | 473,070 | ||||||||||
Total current assets | 4,171,184 | 4,715,017 | 5,535,208 | |||||||||||
Non-current assets: | ||||||||||||||
Investments accounted for using the equity method | 8 | 204,291 | 225,086 | 268,513 | ||||||||||
Investments and advances in the Financial Services segment (including assets pledged that secured parties are permitted to sell or repledge of 1,059,901 million yen, 1,853,736 million yen and 2,700,603 million yen as of April 1, 2020, March 31, 2021 and 2022, respectively) | 5, 14 | 16,352,285 | 17,296,546 | 18,445,088 | ||||||||||
Property, plant and equipment | 9 | 917,198 | 990,541 | 1,113,213 | ||||||||||
Right-of-use | 10 | 373,282 | 358,034 | 413,430 | ||||||||||
Goodwill | 11 | 690,929 | 726,109 | 952,895 | ||||||||||
Content assets | 11 | 992,644 | 1,062,547 | 1,342,046 | ||||||||||
Other intangible assets | 11 | 377,500 | 391,055 | 450,103 | ||||||||||
Deferred insurance acquisition costs | 13 | 187,904 | 623,986 | 676,526 | ||||||||||
Deferred tax assets | 25 | 210,333 | 215,669 | 298,589 | ||||||||||
Other financial assets | 5 | 321,721 | 695,764 | 696,306 | ||||||||||
Other non-current assets | 19 | 167,795 | 207,489 | 289,050 | ||||||||||
Total non-current assets | 20,795,882 | 22,792,826 | 24,945,759 | |||||||||||
Total assets | 24,967,066 | 27,507,843 | 30,480,967 | |||||||||||
(Continued on the following page.)
F-6
SONY GROUP CORPORATION AND CONSOLIDATED SUBSIDIARIES
Consolidated Statements of Financial Position (Continued)
Yen in millions | ||||||||||||||
Note | April 1, 2020 | March 31, 2021 | March 31, 2022 | |||||||||||
LIABILITIES | ||||||||||||||
Current liabilities: | ||||||||||||||
Short-term borrowings | 5, 14 | 824,045 | 1,201,747 | 1,976,553 | ||||||||||
Current portion of long-term debt | 5, 14 | 98,923 | 205,406 | 171,409 | ||||||||||
Trade and other payables | 5 | 1,310,536 | 1,596,563 | 1,843,242 | ||||||||||
Deposits from customers in the banking business | 5 | 2,347,387 | 2,682,156 | 2,886,361 | ||||||||||
Income taxes payables | 85,346 | 84,431 | 106,092 | |||||||||||
Participation and residual liabilities in the Pictures segment | 18 | 163,007 | 161,433 | 190,162 | ||||||||||
Other financial liabilities | 5 | 56,152 | 54,341 | 97,843 | ||||||||||
Other current liabilities | 19 | 1,263,944 | 1,367,527 | 1,488,488 | ||||||||||
Total current liabilities | 6,149,340 | 7,353,604 | 8,760,150 | |||||||||||
Non-current liabilities: | ||||||||||||||
Long-term debt | 5, 14 | 939,030 | 1,053,636 | 1,203,646 | ||||||||||
Defined benefit liabilities | 17 | 329,621 | 267,222 | 254,548 | ||||||||||
Deferred tax liabilities | 25 | 1,041,156 | 816,587 | 696,492 | ||||||||||
Future insurance policy benefits and other | 13 | 6,519,577 | 6,614,585 | 7,039,034 | ||||||||||
Policyholders’ account in the life insurance business | 13 | 3,640,010 | 4,328,894 | 4,791,295 | ||||||||||
Participation and residual liabilities in the Pictures segment | 18 | 119,702 | 116,537 | 220,113 | ||||||||||
Other financial liabilities | 5 | 146,834 | 139,417 | 211,959 | ||||||||||
Other non-current liabilities | 19 | 87,320 | 93,022 | 106,481 | ||||||||||
Total non-current liabilities | 12,823,250 | 13,429,900 | 14,523,568 | |||||||||||
Total liabilities | 18,972,590 | 20,783,504 | 23,283,718 | |||||||||||
EQUITY | ||||||||||||||
Sony Group Corporation’s stockholders’ equity: | 20 | |||||||||||||
Common stock | 880,214 | 880,214 | 880,365 | |||||||||||
Additional paid-in capital | 1,297,554 | 1,489,597 | 1,461,053 | |||||||||||
Retained earnings | 1,949,697 | 2,914,503 | 3,760,763 | |||||||||||
Accumulated other comprehensive income | 979,476 | 1,520,257 | 1,222,332 | |||||||||||
Treasury stock, at cost | (232,503 | ) | (124,228 | ) | (180,042 | ) | ||||||||
Equity attributable to Sony Group Corporation’s stockholders | 4,874,438 | 6,680,343 | 7,144,471 | |||||||||||
Noncontrolling interests | 1,120,038 | 43,996 | 52,778 | |||||||||||
Total equity | 5,994,476 | 6,724,339 | 7,197,249 | |||||||||||
Total liabilities and equity | 24,967,066 | 27,507,843 | 30,480,967 | |||||||||||
The accompanying notes are an integral part of these statements.
F-7
SONY GROUP CORPORATION AND CONSOLIDATED SUBSIDIARIES
Consolidated Statements of Income
Yen in millions | ||||||||||
Fiscal year ended March 31 | ||||||||||
Note | 2021 | 2022 | ||||||||
Sales and financial services revenue: | ||||||||||
Sales | 22 | 7,333,670 | 8,396,702 | |||||||
Financial services revenue | 5, | 1,664,991 | 1,524,811 | |||||||
Total sales and financial services revenue | 8,998,661 | 9,921,513 | ||||||||
Costs and expenses: | ||||||||||
Cost of sales | 7, 17, 23 | 5,065,879 | 5,845,804 | |||||||
Selling, general and administrative | 17, | 1,473,154 | 1,588,473 | |||||||
Financial services expenses | 5, | 1,501,674 | 1,374,037 | |||||||
Other operating (income) expense, net | 23, | 14,250 | (65,494 | ) | ||||||
Total costs and expenses | 8,054,957 | 8,742,820 | ||||||||
Share of profit (loss) of investments accounted for using the equity method | 8 | 11,551 | 23,646 | |||||||
Operating income | 955,255 | 1,202,339 | ||||||||
Financial income | 24 | 83,792 | 19,304 | |||||||
Financial expenses | 24 | 41,082 | 104,140 | |||||||
Income before income taxes | 997,965 | 1,117,503 | ||||||||
Income taxes | 25 | (45,931 | ) | 229,097 | ||||||
Net income | 1,043,896 | 888,406 | ||||||||
Net income attributable to | ||||||||||
Sony Group Corporation’s stockholders | 1,029,610 | 882,178 | ||||||||
Noncontrolling interests | 14,286 | 6,228 | ||||||||
Yen | ||||||||||
Fiscal year ended March 31 | ||||||||||
Note | 2021 | 2022 | ||||||||
Per share data: | 26 | |||||||||
Net income attributable to Sony Group Corporation’s stockholders | ||||||||||
— Basic | 836.75 | 711.84 | ||||||||
— Diluted | 823.77 | 705.16 | ||||||||
The accompanying notes are an integral part of these statements.
F-8
SONY GROUP CORPORATION AND CONSOLIDATED SUBSIDIARIES
Consolidated Statements of Comprehensive Income
Yen in millions | ||||||||||
Fiscal year ended March 31 | ||||||||||
Note | 2021 | 2022 | ||||||||
Net income | 1,043,896 | 888,406 | ||||||||
Other comprehensive income, net of tax — | 20 | |||||||||
Items that will not be reclassified to profit or loss | ||||||||||
Changes in equity instruments measured at fair value through other comprehensive income | 144,740 | (106,426 | ) | |||||||
Remeasurement of defined benefit pension plans | 11,555 | 33,641 | ||||||||
Share of other comprehensive income of investments accounted for using the equity method | 87 | 577 | ||||||||
Items that may be reclassified subsequently to profit or loss | ||||||||||
Changes in debt instruments measured at fair value through other comprehensive income | (205,549 | ) | (416,904 | ) | ||||||
Cash flow hedges | 51 | 4,735 | ||||||||
Insurance contract valuation adjustments | (3,120 | ) | 599 | |||||||
Exchange differences on translating foreign operations | 115,321 | 226,275 | ||||||||
Share of other comprehensive income of investments accounted for using the equity method | 798 | 1,501 | ||||||||
Total other comprehensive income, net of tax | 63,883 | (256,002 | ) | |||||||
Comprehensive income | 1,107,779 | 632,404 | ||||||||
Comprehensive income attributable to | ||||||||||
Sony Group Corporation’s stockholders | 1,118,628 | 623,678 | ||||||||
Noncontrolling interests | (10,849 | ) | 8,726 | |||||||
The accompanying notes are an integral part of these statements.
F-9
SONY GROUP CORPORATION AND CONSOLIDATED SUBSIDIARIES
Consolidated Statements of Changes in Stockholders’ Equity
Yen in millions | ||||||||||||||||||||||||||||||||||||
Note | Common stock | Additional paid-in capital | Retained earnings | Accumulated other comprehensive income | Treasury stock, at cost | Sony Group Corporation’s stockholders’ equity | Noncontrolling interests | Total equity | ||||||||||||||||||||||||||||
Balance at April 1, 2020 | 880,214 | 1,297,554 | 1,949,697 | 979,476 | (232,503 | ) | 4,874,438 | 1,120,038 | 5,994,476 | |||||||||||||||||||||||||||
Comprehensive income: | ||||||||||||||||||||||||||||||||||||
Net income | 1,029,610 | 1,029,610 | 14,286 | 1,043,896 | ||||||||||||||||||||||||||||||||
Other comprehensive income, net of tax | 20 | 89,018 | 89,018 | (25,135 | ) | 63,883 | ||||||||||||||||||||||||||||||
Total comprehensive income | 1,029,610 | 89,018 | 1,118,628 | (10,849 | ) | 1,107,779 | ||||||||||||||||||||||||||||||
Transfer to retained earnings | 5,472 | (5,472 | ) | — | — | |||||||||||||||||||||||||||||||
Transactions with stockholders and other: | ||||||||||||||||||||||||||||||||||||
Exercise of stock acquisition rights | (354 | ) | (735 | ) | 18,074 | 16,985 | 16,985 | |||||||||||||||||||||||||||||
Conversion of convertible bonds | (3,671 | ) | (8,198 | ) | 89,402 | 77,533 | 77,533 | |||||||||||||||||||||||||||||
Stock-based compensation | 1,577 | 1,577 | 1,577 | |||||||||||||||||||||||||||||||||
Dividends declared (50.00 yen per share) | (61,343 | ) | (61,343 | ) | (12,996 | ) | (74,339 | ) | ||||||||||||||||||||||||||||
Purchase of treasury stock | (366 | ) | (366 | ) | (366 | ) | ||||||||||||||||||||||||||||||
Reissuance of treasury stock | 354 | 1,165 | 1,519 | 1,519 | ||||||||||||||||||||||||||||||||
Transactions with noncontrolling interests shareholders and other | 20 | 194,137 | 457,235 | 651,372 | (1,052,197 | ) | (400,825 | ) | ||||||||||||||||||||||||||||
Balance at March 31, 2021 | 880,214 | 1,489,597 | 2,914,503 | 1,520,257 | (124,228 | ) | 6,680,343 | 43,996 | 6,724,339 | |||||||||||||||||||||||||||
Yen in millions | ||||||||||||||||||||||||||||||||||||
Note | Common stock | Additional paid-in capital | Retained earnings | Accumulated other comprehensive income | Treasury stock, at cost | Sony Group Corporation’s stockholders’ equity | Noncontrolling interests | Total equity | ||||||||||||||||||||||||||||
Balance at April 1, 2021 | 880,214 | 1,489,597 | 2,914,503 | 1,520,257 | (124,228 | ) | 6,680,343 | 43,996 | 6,724,339 | |||||||||||||||||||||||||||
Comprehensive income: | ||||||||||||||||||||||||||||||||||||
Net income | 882,178 | 882,178 | 6,228 | 888,406 | ||||||||||||||||||||||||||||||||
Other comprehensive income, net of tax | 20 | (258,500 | ) | (258,500 | ) | 2,498 | (256,002 | ) | ||||||||||||||||||||||||||||
Total comprehensive income | 882,178 | (258,500 | ) | 623,678 | 8,726 | 632,404 | ||||||||||||||||||||||||||||||
Transfer to retained earnings | 39,425 | (39,425 | ) | — | — | |||||||||||||||||||||||||||||||
Transactions with stockholders and other: | ||||||||||||||||||||||||||||||||||||
Issuance of new shares | 151 | 151 | 302 | 302 | ||||||||||||||||||||||||||||||||
Exercise of stock acquisition rights | 547 | 12,785 | 13,332 | 13,332 | ||||||||||||||||||||||||||||||||
Conversion of convertible bonds | (2,805 | ) | (958 | ) | 18,278 | 14,515 | 14,515 | |||||||||||||||||||||||||||||
Stock-based compensation | 6,643 | 6,643 | 6,643 | |||||||||||||||||||||||||||||||||
Dividends declared (60.00 yen per share) | (74,385 | ) | (74,385 | ) | (4,955 | ) | (79,340 | ) | ||||||||||||||||||||||||||||
Purchase of treasury stock | 20 | (88,624 | ) | (88,624 | ) | (88,624 | ) | |||||||||||||||||||||||||||||
Reissuance of treasury stock | 1,544 | 1,747 | 3,291 | 3,291 | ||||||||||||||||||||||||||||||||
Transactions with noncontrolling interests shareholders and other | (34,624 | ) | (34,624 | ) | 5,011 | (29,613 | ) | |||||||||||||||||||||||||||||
Balance at March 31, 2022 | 880,365 | 1,461,053 | 3,760,763 | 1,222,332 | (180,042 | ) | 7,144,471 | 52,778 | 7,197,249 | |||||||||||||||||||||||||||
The accompanying notes are an integral part of these statements.
F-10
SONY GROUP CORPORATION AND CONSOLIDATED SUBSIDIARIES
Consolidated Statements of Cash Flows
Yen in millions | ||||||||||||
Fiscal year ended March 31 | ||||||||||||
Note | 2021 | 2022 | ||||||||||
Cash flows from operating activities: | ||||||||||||
Income before income taxes | 997,965 | 1,117,503 | ||||||||||
Adjustments to reconcile income before income taxes to net cash provided by operating activities: | ||||||||||||
Depreciation and amortization, including amortization of contract costs | 687,373 | 835,233 | ||||||||||
Amortization of deferred insurance acquisition costs | 44,738 | 69,237 | ||||||||||
Other operating (income) expense, net | 2 3 | 14,250 | (65,494 | ) | ||||||||
(Gain) loss on securities, net (other than Financial Services segment) | 24 | (62,704 | ) | 60,402 | ||||||||
Share of profit of investments accounted for using the equity method, net of dividends | (5,012 | ) | (13,934 | ) | ||||||||
Change in future insurance policy benefits and other | 358,666 | 458,880 | ||||||||||
Change in policyholders’ account in the life insurance business, less cash impact | 558,539 | 238,309 | ||||||||||
Net cash impact of policyholders’ account in the life insurance business | 134,299 | 227,262 | ||||||||||
Changes in assets and liabilities: | ||||||||||||
Increase in trade receivables and contract assets | (137,939 | ) | (171,094 | ) | ||||||||
Increase in inventories | (56,509 | ) | (194,624 | ) | ||||||||
Increase in investments and advances in the Financial Services segment | (1,901,928 | ) | (1,529,665 | ) | ||||||||
Increase in content assets | (325,664 | ) | (489,617 | ) | ||||||||
Increase in deferred insurance acquisition costs | (98,122 | ) | (117,337 | ) | ||||||||
Increase in trade payables | 288,854 | 126,989 | ||||||||||
Increase in deposits from customers in the banking business | 333,075 | 230,236 | ||||||||||
Increase in borrowings in the life insurance business and the banking business | 462,751 | 905,139 | ||||||||||
Increase in other financial assets and other current assets | (9,703 | ) | (17,681 | ) | ||||||||
Increase in other financial liabilities and other current liabilities | 23,906 | 66,407 | ||||||||||
Income taxes paid | 25 | (102,732 | ) | (269,885 | ) | |||||||
Other | (63,886 | ) | (232,623 | ) | ||||||||
Net cash provided by operating activities | 1,140,217 | 1,233,643 | ||||||||||
(Continued on
the
following page.)
F-11
SONY GROUP CORPORATION AND CONSOLIDATED SUBSIDIARIES
Consolidated Statements of Cash Flows (Continued)
Yen in millions | ||||||||||||
Fiscal year ended March 31 | ||||||||||||
Note | 2021 | 2022 | ||||||||||
Cash flows from investing activities: | ||||||||||||
Payments for property, plant and equipment and other intangible assets | (477,931 | ) | (441,096 | ) | ||||||||
Proceeds from sales of property, plant and equipment and other intangible assets | 15,893 | 11,409 | ||||||||||
Payments for investments and advances (other than Financial Services segment) | (103,351 | ) | (91,082 | ) | ||||||||
Proceeds from sales or return of investments and collections of advances (other than Financial Services segment) | 20,352 | 16,081 | ||||||||||
Payments for purchases of businesses | (15,260 | ) | (277,618 | ) | ||||||||
Proceeds from sales of businesses | 3,151 | 64,609 | ||||||||||
Other | (6,764 | ) | (11,083 | ) | ||||||||
Net cash used in investing activities | (563,910 | ) | (728,780 | ) | ||||||||
Cash flows from financing activities: | ||||||||||||
Increase (decrease) in short-term borrowings, net | 14, 27 | (18,334 | ) | 408 | ||||||||
Proceeds from issuance of long-term debt | 14, 27 | 236,935 | 31,458 | |||||||||
Payments of long-term debt | 14, 27 | (89,918 | ) | (194,562 | ) | |||||||
Proceeds from issuance of short-term borrowings in connection with payment for purchase of noncontrolling interest in Sony Financial Group Inc. | 396,500 | — | ||||||||||
Payments of short-term borrowings in connection with payment for purchase of noncontrolling interest in Sony Financial Group Inc. | (396,500 | ) | — | |||||||||
Dividends paid | (61,288 | ) | (74,342 | ) | ||||||||
Payments for purchase s of treasury stock | 20 | (366 | ) | (88,624 | ) | |||||||
Payment for purchase of noncontrolling interest in Sony Financial Group Inc. | 20 | (396,698 | ) | — | ||||||||
Other | (8,864 | ) | (10,916 | ) | ||||||||
Net cash used in financing activities | (338,533 | ) | (336,578 | ) | ||||||||
Effect of exchange rate changes on cash and cash equivalents | 36,685 | 94,369 | ||||||||||
Net increase in cash and cash equivalents | 274,459 | 262,654 | ||||||||||
Cash and cash equivalents at beginning of the fiscal year | 27 | 1,512,523 | 1,786,982 | |||||||||
Cash and cash equivalents at end of the fiscal year | 27 | 1,786,982 | 2,049,636 | |||||||||
The accompanying notes are an integral part of these statements.
F-12
SONY GROUP CORPORATION AND CONSOLIDATED SUBSIDIARIES
Index to Notes to Consolidated Financial Statements
Sony Group Corporation and Consolidated Subsidiaries
Page | ||||||||
Notes to Consolidated Financial Statements | ||||||||
| 1. | F-14 | |||||||
| 2. | F-14 | |||||||
| 3. | F-15 | |||||||
| 4. | F-30 | |||||||
| 5. | F-35 | |||||||
| 6. | F-46 | |||||||
| 7. | F-58 | |||||||
| 8. | F-58 | |||||||
| 9. | F-60 | |||||||
| 10. | F-61 | |||||||
| 11. | F-62 | |||||||
| 12. | F-65 | |||||||
| 13. | F-66 | |||||||
| 14. | F-75 | |||||||
| 15. | F-76 | |||||||
| 16. | F-80 | |||||||
| 17. | F-81 | |||||||
| 18. | F-87 | |||||||
| 19. | F-88 | |||||||
| 20. | F-89 | |||||||
| 21. | F-92 | |||||||
| 22. | F-95 | |||||||
| 23. | F-96 | |||||||
| 24. | F-97 | |||||||
| 25. | F-97 | |||||||
| 26. | F-102 | |||||||
| 27. | F-102 | |||||||
| 28. | F-104 | |||||||
| 29. | F-106 | |||||||
| 30. | F-107 | |||||||
| 31. | F-108 | |||||||
| 32. | F-109 | |||||||
| 33. | F-110 | |||||||
| 34. | F-111 | |||||||
| 35. | F-125 | |||||||
F-13
SONY GROUP CORPORATION AND CONSOLIDATED SUBSIDIARIES
Notes to Consolidated Financial Statements
Sony Group Corporation and Consolidated Subsidiaries
1. | Reporting entity |
Sony Group Corporation is a public company domiciled in Japan. Sony Group Corporation and its consolidated subsidiaries (hereinafter collectively referred to as “Sony” or “Sony Group”) are engaged in the development, design, production, manufacture, offer and sale of various kinds of electronic equipment, instruments, and devices for consumer, professional and industrial markets such as network services, home gaming consoles and software, televisions, audio and video recorders and players, still and video cameras, smartphones, and image sensors. Sony’s primary manufacturing facilities are located in Asia including Japan. Sony also utilizes third-party contract manufacturers for certain products. Sony’s products and services are marketed throughout the world by sales subsidiaries and unaffiliated distributors as well as direct sales and offers via the internet. Sony is engaged in the development, production, manufacture, and distribution of recorded music and the management and licensing of the words and music of songs as well as production and distribution of animation titles and game applications. Sony is also engaged in the production, acquisition and distribution of motion pictures and television programming and the operation of television and digital networks. Further, Sony is also engaged in various financial services businesses, including life and
non-life
insurance businesses through its Japanese insurance subsidiaries and banking business through a Japanese internet-based banking subsidiary.2. | Basis of preparation |
Compliance with International Financial Reporting Standards
The consolidated financial statements of Sony have been prepared in accordance with International Financial Reporting Standards (“IFRS”), as issued by the International Accounting Standards Board (“IASB”). The term “IFRS” also includes International Accounting Standards (IASs) and the related interpretations of the interpretations committees (Standard Interpretations Committee (SIC) and International Financial Reporting Interpretations Committee (IFRIC)).
Sony adopted IFRS for the first time this fiscal year (commencing on April 1, 2021 and ending on March 31, 2022), and so the annual consolidated financial statements for this fiscal year are the first ones prepared in conformity with IFRS. The date of Sony’s transition to IFRS is April 1, 2020. Sony has adopted IFRS 1 “First-Time Adoption of International Financial Reporting Standards” (“IFRS 1”) for the transition to IFRS.
The effect of the transition to IFRS on Sony’s financial position, results of operations and cash flows is presented in Note 34.
Approval of consolidated financial statements
The consolidated financial statements were approved by Kenichiro Yoshida, Chairman, President and Chief Executive Officer and Representative Corporate Executive Officer, and Hiroki Totoki, Executive Deputy President and Chief Financial Officer and Representative Corporate Executive Officer, on June 28, 2022.
Basis of measurement
The consolidated financial statements have been prepared on a historical cost basis except for items such as financial instruments measured at fair value as separately described in Note 3.
Functional currency and presentation currency
The consolidated financial statements have been presented in Japanese yen, which is the functional currency of Sony Group Corporation. All financial information presented in Japanese yen has been rounded to the nearest million Japanese yen.
Use of estimates and judgments
The preparation of the consolidated financial statements in accordance with IFRS requires management to make judgments, estimates and assumptions that affect the application of accounting policies, the reported
F-14
SONY GROUP CORPORATION AND CONSOLIDATED SUBSIDIARIES
amounts of assets, liabilities, revenues and expenses, and disclosure of contingent assets and liabilities. Actual results could differ from these estimates and assumptions. These estimates and assumptions are reviewed on a continuous basis. Changes in these accounting estimates are recognized in the period in which the estimates are revised and in any future periods affected.
The timing and extent to which the spread of
COVID-19
may negatively impact Sony’s business will depend on future developments, which are uncertain. This uncertainty could result in greater variability in accounting estimates and assumptions.Information about judgments that have been made in the process of applying accounting policies that have significant effects on the amounts reported in the consolidated financial statements is as follows:
• | Classification of financial instruments (Note 3 I (5)) |
Information about accounting estimates and assumptions that have significant effects on the amounts reported in the consolidated financial statements is as follows:
• | Fair value of financial instruments (Note 3 I (5) and (15) and Note 5) |
• | Impairment of non-financial assets (Note 3 I (10) and Note 12) |
• | Measurement of deferred insurance acquisition costs, future insurance policy benefits, and policyholders’ account in the life insurance business (Note 3 I (11) and Note 13) |
• | Measurement of film costs and participation and residual liabilities in the Pictures segment (Note 3 I (9) and (12), Note 11, and Note 18) |
• | Recoverability of deferred tax assets (Note 3 I (23) and Note 25) |
• | Measurement of fair value of assets acquired and liabilities assumed in business combinations (Note 3 I (2) and Note 30) |
3. | Summary of significant accounting policies |
I. | Significant accounting policies |
(1) | Basis of consolidation - |
| i) | Subsidiaries |
A subsidiary is an entity controlled by Sony Group Corporation. Control is obtained when Sony Group Corporation is exposed, or has rights to variable returns from its involvement with the entity and has the ability to affect those returns through its power over the entity.
The financial statements of subsidiaries are included in the consolidated financial statements of Sony from the date on which control is obtained until the date on which control is lost.
All intercompany transactions and receivables and payables are eliminated in the preparation of the consolidated financial statements.
If any accounting policies applied by a subsidiary differ from those applied by Sony, adjustments are made to the financial statements of the subsidiary as necessary.
Any changes in ownership interest in a subsidiary that do not result in a loss of control are accounted for as equity transactions. The difference between the amount by which the
non-controlling
interests are adjusted and the fair value of the consideration is directly recognized in equity and attributed to the owners of Sony. When control over a subsidiary is lost, the investment retained in the former subsidiary is remeasured at fair value as of the date when control is lost, and any gain or loss resulting from the loss of control is recognized in profit or loss.| ii) | Associates and joint ventures |
An associate is an entity over which Sony has significant influence, but does not have control or joint control, in terms of financial and operating policies.
F-15
SONY GROUP CORPORATION AND CONSOLIDATED SUBSIDIARIES
A joint venture is an investee whereby two or more parties including Sony have the rights to the net assets of the investee in accordance with the terms of the joint arrangement. Joint control is the contractually agreed sharing of control of an arrangement, which exists only when decisions about the relevant activities require the unanimous consent of the parties sharing control.
Investments in associates and joint ventures are accounted for using the equity method from the date on which significant influence or joint control is obtained until the date on which significant influence or joint control is lost. Under the equity method, investments in associates and joint ventures are recognized at cost, adjusted for Sony’s share of the profit or loss and other comprehensive income of the associates and joint ventures from the date on which Sony obtains significant influence or joint control to the date on which Sony loses such significant influence or joint control. Sony recognizes its share of profit or loss of the investees, net of income taxes after the elimination of unrealized intercompany profits, in the consolidated operating income (loss) to the extent of Sony’s interest in these entities.
For investments accounted for using the equity method, the carrying amount of each investment is tested for impairment as a single asset, when there is objective evidence that the investments may be impaired.
If any accounting policies applied by an associate or a joint venture differ from those applied by Sony, adjustments are made to the financial statements of the associate or the joint venture as necessary.
When an investment ceases to be an associate or a joint venture and the use of the equity method is discontinued, any gain or loss arising from discontinuation of the equity method is recognized in profit or loss.
| iii) | Joint operations |
A joint operation is a joint arrangement whereby two or more parties including Sony have the rights to the assets, and obligations for the liabilities, relating to the investee in accordance with the terms of the joint arrangement.
Sony recognizes its share of the assets, liabilities, revenue and expenses related to joint operations.
| iv) | Structured entities |
A structured entity is an entity designed so that voting or similar rights are not the dominant factor in deciding who controls the entity.
Sony has control and, therefore, consolidates a structured entity when Sony has exposure or rights to variable returns and has the ability to use its power over the structured entity to affect returns.
(2) | Business combinations - |
Sony recognizes identifiable assets acquired and the liabilities assumed of an acquiree at their fair values at the acquisition date with limited exceptions.
Sony recognizes goodwill when the aggregate of the consideration transferred in a business combination, the amount of any
non-controlling
interests in the acquiree and the fair value of Sony’s previously held equity interest in the acquiree exceeds the net amount of the identifiable assets and liabilities of the acquiree at the acquisition date. If the aggregate above is less than the net amount of identifiable assets and liabilities, the difference is recognized as a gain. The consideration transferred is calculated as the sum of the fair values of the assets transferred, liabilities assumed and equity interest issued.Non-controlling
interests are measured either at fair value or based on thenon-controlling
interests’ proportionate share of the acquiree’s net identifiable assets for each business combination transaction.Acquisition-related costs are recognized as expenses in the period they are incurred.
F-16
SONY GROUP CORPORATION AND CONSOLIDATED SUBSIDIARIES
(3) | Foreign currency translation - |
| i) | Foreign currency transactions |
Foreign currency transactions are translated at the exchange rates prevailing at the transaction date or rates that approximate such rates. Monetary assets and liabilities denominated in foreign currencies are translated into the functional currency using the exchange rate at the end of the period. Foreign exchange gains and losses resulting from translation and settlement are generally recognized in profit or loss. They are deferred in other comprehensive income if they relate to qualifying cash flow hedges.
| ii) | Foreign operations |
Assets and liabilities of foreign operations such as overseas subsidiaries and associates are translated using the exchange rates at the end of the period, and revenue and expense items are translated using the average exchange rates for the period unless the exchange rates fluctuate significantly. Exchange differences arising from the translation are recognized in other comprehensive income.
On the disposal of a foreign operation, the cumulative amount of exchange differences relating to that foreign operation is reclassified to profit or loss.
(4) | Cash and cash equivalents - |
Cash and cash equivalents include all highly liquid investments, with original maturities of three months or less, that are readily convertible to known amounts of cash and which are subject to an insignificant risk of changes in value.
(5) | Financial instruments - |
Sony recognizes a financial instrument as a financial asset or a financial liability when Sony becomes party to the contractual provisions of the instrument.
Financial assets and financial liabilities are initially measured at fair value. Except for financial assets and financial liabilities measured at fair value through profit or loss, transaction costs that are directly attributable to the acquisition or issuance of the financial asset or financial liability are added to the fair value of financial assets or subtracted from the fair value of financial liabilities at initial recognition.
| i) | Non-derivative financial assets |
| a. | Classification and measurement |
Non-derivative
financial assets held by Sony are classified as financial assets measured at amortized cost, debt instruments measured at fair value through other comprehensive income, equity instruments measured at fair value through other comprehensive income or financial assets measured at fair value through profit or loss.Financial assets measured at amortized cost
Sony classifies a financial asset as measured at amortized cost if the financial asset is held within a business model whose objective is to collect contractual cash flows and the contractual terms of the financial asset give rise on specified dates to cash flows that are solely payments of principal and interest on the principal amount outstanding. The financial asset is measured at amortized cost by using the effective interest method after initial recognition. On derecognition of a financial asset measured at amortized cost, the difference between the carrying amount and the consideration received or receivable is recognized in profit or loss.
Debt instruments measured at fair value through other comprehensive income
A debt instrument is classified as a financial asset measured at fair value through other comprehensive income if the debt instrument is held within a business model whose objective is achieved by both collecting contractual cash flows and selling the financial asset and the contractual terms of the financial asset give rise on specified dates to cash flows that are solely payments of principal and interest on the principal amount outstanding. Changes in the fair value of the financial
F-17
SONY GROUP CORPORATION AND CONSOLIDATED SUBSIDIARIES
asset after initial recognition, except for impairment gains or losses and foreign exchange gains or losses, are recognized in other comprehensive income. Interest income from these financial assets is recognized in profit or loss using the effective interest method. On derecognition of a debt instrument measured at fair value through other comprehensive income, the cumulative amount previously recognized in other comprehensive income is reclassified to profit or loss.
In the life insurance business, the financial assets are held mainly from the perspective of asset-liability management (“ALM”). The objective of holding financial assets in the life insurance business is to match the interest rate sensitivity (duration) of financial assets and insurance contract liabilities (which mainly consist of future insurance policy benefits and the policyholders’ account in the life insurance business) as much as possible, in order to ensure sufficient cash flows are available to settle insurance claims when they come due. Sony manages these assets as one portfolio, based on the overall objective of managing duration and liquidity needs in a capital efficient manner. While some assets within the portfolio may be held for a longer period of time, Sony considers, because of its overall objective for these assets, that all the financial assets are held within one business model whose objective is achieved by both collecting cash flows and selling financial assets.
Equity instruments measured at fair value through other comprehensive income
For investments in equity instruments which are not held for trading, Sony may make an irrevocable election at initial recognition to present subsequent changes in fair value of the investments in other comprehensive income.
These financial assets are measured at fair value and subsequent changes in the fair value are recognized in other comprehensive income. Dividends from financial assets are recognized in profit or loss, and the cumulative amount recognized in other comprehensive income is transferred to retained earnings upon derecognition.
Financial assets measured at fair value through profit or loss
Financial assets other than those measured at amortized cost or fair value through other comprehensive income are classified as financial assets measured at fair value through profit or loss. Financial assets measured at fair value through profit or loss include financial assets held for trading.
In the life insurance business, investments held for variable annuities and variable life insurance contracts mainly consist of equity securities, debt securities and investment funds, which are measured at fair value through profit or loss.
For certain financial assets that would not normally be measured at fair value through profit or loss, Sony may, at initial recognition, choose the irrevocable option to measure such financial assets at fair value through profit or loss in order to eliminate or significantly reduce an accounting mismatch.
Sony has made the irrevocable election for some of the fixed-rate debt securities held by a subsidiary in the banking business as mentioned above. In relation to such debt securities, Sony utilizes derivatives to hedge the risk arising from the changes in the fair value of the debt securities due to unfavorable fluctuations of interest rates. Thus, this election is made to mitigate accounting mismatches derived from the changes in the fair value of the debt securities and derivatives used as hedging instruments by recognizing gains and losses from the changes in the fair value of the debt securities in profit or loss.
| b. | Derecognition |
Sony derecognizes a financial asset when the contractual rights to the cash flows from the financial asset expire, or when Sony transfers the contractual rights to receive the cash flows of the financial asset and transfers substantially all of the risks and rewards of the financial asset.
| c. | Impairment |
Sony estimates expected credit losses and recognizes loss allowances for financial assets measured at amortized cost and debt instruments measured at fair value through other comprehensive income. At
F-18
SONY GROUP CORPORATION AND CONSOLIDATED SUBSIDIARIES
each reporting date, Sony measures the loss allowance for a financial instrument at an amount equal to the lifetime expected credit losses if the credit risk on that financial instrument has increased significantly since initial recognition. If, at the reporting date, the credit risk on a financial instrument has not increased significantly since initial recognition, Sony measures the loss allowance for that financial instrument at an amount equal to
12-month
expected credit losses. In assessing whether the credit risk has increased significantly or not, Sony uses the change in the risk of a default occurring over the expected life of the financial instrument and estimates expected credit losses by using the method which reflects the past loss rate and other reasonable and supportable forward-looking information on macroeconomic factors affecting the ability of the customers to settle the receivables.Sony measures the expected credit losses of a financial asset in a way that reflects an unbiased and probability-weighted amount incorporating the time value of money and reasonable and supportable information that is available at the reporting date about past events, current conditions and forecasts of future economic conditions.
However, for trade and other receivables, and contract assets including
non-current
other receivables in the Pictures segment, the loss allowance is measured at an amount equal to lifetime expected credit losses irrespective of the change of credit risk on a collective basis or an individual basis incorporating factors such as thepast-due
status and the attributes of the counterparties.Sony determines a financial asset is credit-impaired when one or more events that have a detrimental impact on the estimated future cash flows of that financial asset have occurred. The criteria that Sony uses to determine that a financial asset is credit-impaired include a default or delinquency of more than 90 days past due in interest or principal payments.
Sony writes off the gross carrying amount of a financial asset when it cannot reasonably expect to recover all or part of the asset.
Debt securities and housing loans in the Financial Services segment
The expected credit losses for debt securities and housing loans in the Financial Services segment are the product of the probability of default (“PD”), loss given default (“LGD”) and exposure at default (“EAD”), by leveraging the Basel III regulatory framework or based on the external information published by major credit rating agencies. Forward-looking economic information is also included in determining the PD.
Assessments on significant increases in credit risk are performed at the reporting date by comparing the risk of default occurring with that at initial recognition. Sony recognizes and measures the expected credit losses on a collective basis or an individual basis using reasonable and supportable information that is available without undue cost or effort, such as asset type, credit ratings, collateral collectability,
past-due
status and other relevant characteristics of financial instruments.In addition, Sony has applied the low credit risk exemption for certain debt securities rated “investment grade” by major credit rating agencies at the reporting date. For such instruments, Sony assumes that the credit risk has not increased significantly since initial recognition.
If contractual terms of a loan have been modified, it is necessary to recalculate the gross carrying amount of that loan by using the original effective interest rate and recognize a modification gain or loss in profit or loss.
| ii) | Non-derivative financial liabilities |
Sony classifies
non-derivative
financial liabilities as either financial liabilities subsequently measured at amortized cost by using the effective interest method or financial liabilities measured at fair value through profit or loss.Sony derecognizes a financial liability when it is extinguished, meaning when the obligation specified in the contract is discharged, cancelled or expired.
F-19
SONY GROUP CORPORATION AND CONSOLIDATED SUBSIDIARIES
| iii) | Derivative financial instruments and hedge accounting |
All derivatives are recognized as either assets or liabilities in the consolidated statements of financial position at fair value. Changes in the fair value of derivative financial instruments are either recognized periodically through profit or loss or other comprehensive income, depending on whether the derivative financial instrument qualifies as a hedge and the derivative is being used to hedge changes in cash flows.
Derivative financial instruments held by Sony are accounted for as described below.
Cash flow hedges
Changes in the fair value of derivatives that are designated and determined to be effective as cash flow hedges for forecasted transactions or exposures associated with recognized assets or liabilities are initially recorded in other comprehensive income and reclassified to profit or loss when the hedged transaction affects profit or loss. Changes in the fair value of the ineffective portion are immediately recognized in profit or loss.
Derivatives not designated as hedges
Changes in the fair value of derivatives not designated as hedges are immediately recognized in profit or loss.
Assessment of hedge effectiveness
When applying hedge accounting, Sony formally documents all hedging relationships between the derivatives designated as hedges and the hedged items, as well as its risk management objectives and strategies for undertaking various hedging activities. Sony links all hedges that are designated as cash flow hedges to specific assets or liabilities in the consolidated statements of financial position or to the specific forecasted transactions. Sony also assesses, both at the inception of the hedge and on an
on-going
basis, whether the derivatives that are designated as hedges have an economic relationship with the hedged item in offsetting changes in fair value or cash flows of hedged items. The effect of credit risk does not dominate the value changes that result from the underlying economic relationship. In addition, the hedge ratio of the hedging relationship is designed to be the same as that resulting from the quantity of the hedged item that Sony actually hedges and the quantity of the hedging instrument that Sony actually uses to hedge that quantity of the hedged item. When it is determined that a derivative no longer has an economic relationship with the hedged item, Sony discontinues hedge accounting.| iv) | Offsetting a financial asset and a financial liability |
Sony offsets a financial asset and a financial liability and presents the net amount in the consolidated statements of financial position when Sony currently has a legally enforceable right to set off the recognized amounts and intends either to settle on a net basis or to realize the asset and settle the liability simultaneously.
(6) | Inventories - |
Inventories are measured at the lower of cost or net realizable value. The cost of inventories is determined on theweighted average costbasis. Net realizable value is the estimated selling price in the ordinary course of business less the estimated costs of completion and the estimated costs necessary to make the sale.
“
”
(7) | Property, plant and equipment and depreciation - |
Sony has adopted the cost model for the measurement of property, plant and equipment and presents an item of property, plant and equipment at its cost less any accumulated depreciation and any accumulated impairment losses. The cost of an item of property, plant and equipment includes any costs directly attributable to the acquisition of the asset as well as costs of its dismantlement, removal or restoration. Property, plant and equipment are depreciated on a straight-line basis over their useful lives (depreciation period ranging from 2 to 50 years for buildings and from 2 to 10 years for machinery and equipment). Sony reviews the residual values and the useful lives at each fiscal
year-end,
or sooner if circumstances require.F-20
SONY GROUP CORPORATION AND CONSOLIDATED SUBSIDIARIES
(8) | Leases - |
When entering into a contract, Sony determines whether an arrangement contains a lease at its inception. An arrangement contains a lease if it conveys the right to control the use of an identified asset for a period of time in exchange for consideration. Assets and liabilities recognized from leases are included in(“ROU”) assets, the current portion of long-term debt, and long-term debt in Sony’s consolidated statements of financial position.
right-of-use
ROU assets represent Sony’s right to use an underlying asset for the lease term and lease liabilities represent Sony’s obligation to make lease payments arising from the lease. ROU assets and lease liabilities are recognized at the commencement date based on the present value of lease payments over the lease term. ROU assets also include any lease payments and initial direct costs incurred on or before the commencement date and exclude lease incentives. In determining the present value of lease payments, Sony generally uses its incremental borrowing rate, as the implicit rate is not available for most of its leases. Sony determines its incremental borrowing rate based on the estimated rate of interest for collateralized borrowings, taking into account the lease term and the economic conditions of each country or region at commencement date. The lease terms may include options to extend or terminate the lease when it is reasonably certain that Sony will exercise that option. If the lease transfers ownership of the underlying asset to the lessee by the end of the lease term or the purchase option is reasonably certain to be exercised, Sony depreciates the ROU assets from the commencement date to the end of the useful life of the underlying assets. Otherwise, Sony depreciates the ROU assets from the commencement date to the earlier of the end of the useful life of the ROU assets or the end of the lease term. Sony accounts for the lease and
non-lease
components as a single lease component. Sony has applied the short-term lease exception for leases with a term of one year or less, where ROU assets and lease liabilities are not recognized and the expense is recognized on a straight-line basis.(9) | Intangible assets and amortization, including content assets - |
Intangible assets are measured using the cost model and stated at cost less accumulated amortization and impairment losses. Intangible assets acquired separately are initially recognized at cost.
Intangible assets with finite useful lives mainly consist of patent rights,
know-how,
license agreements, customer relationships, trademarks, software, television carriage contracts (broadcasting agreements), film costs, broadcasting rights, music catalogs, artist contracts and music distribution rights. Patent rights,know-how,
license agreements, trademarks and software are generally amortized on a straight-line basis over 3 to 10 years. Customer relationships, television carriage contracts (broadcasting agreements), music catalogs, artist contracts and music distribution rights are generally amortized on a straight-line basis, over 10 to 44 years. Film costs are amortized using an ultimate revenue method based on the ratio of current period actual revenues to the estimated remaining total revenues. Sony considers that amortization pursuant to the ultimate revenue method reflects the rate at which it plans to consume the future economic benefits related to the asset, and there is a high correlation between revenue and the consumption of the economic benefits embodied in the intangible assets. Broadcasting rights are generally amortized based on estimated usage or on a straight-line basis over the useful life.Amortization of intangible assets is included in cost of sales and selling, general and administrative expenses in the consolidated statements of income. Certain intangible assets are assessed to have indefinite lives because there is no foreseeable limit to the period over which such assets are expected to generate net cash flows for Sony.
Film costs, broadcasting rights, music catalogs, artist contracts, music distribution rights and other content assets are collectively classified and presented as content assets in the consolidated statements of financial position. Film costs include direct production costs, production overhead and acquisition costs for both motion picture and television productions. Broadcasting rights, consisting of acquired programming to be aired on Sony’s television and digital networks, are recognized when the license period begins and the program is available for use. Music catalogs are exclusive rights to the recorded music master or music copyrights, which consist of melodies and lyrics of songs, that can be exploited and marketed in various markets. Artist contracts are contracts with recorded music artists or songwriters that provide Sony with exclusive rights to musical works. Music distribution rights are agreements to distribute music content owned by third parties.
( 10) | Impairment of non-financial assets - |
Sony reviews the recoverability of its
non-financial
assets, except for inventories, contract costs and deferred tax assets, whenever there is any indication that an asset or a cash-generating unit (“CGU”) may beF-21
SONY GROUP CORPORATION AND CONSOLIDATED SUBSIDIARIES
impaired. In addition, an annual impairment test for goodwill, intangible assets with indefinite useful lives or intangible assets not yet available for use is performed during the fourth quarter of the fiscal year for each CGU or group of CGUs to which the carrying amount of these assets is allocated.
A CGU is the smallest identifiable group of assets that generates cash inflows that are largely independent of the cash inflows from other assets or group of assets. Goodwill is allocated to each CGU or group of CGUs that is expected to benefit from the synergies of a business combination. A CGU or group of CGUs to which goodwill is allocated is not larger than an operating segment.
The recoverable amount of an asset, a CGU or group of CGUs is the higher of its value in use and fair value less costs of disposal. In assessing value in use, the estimated future cash flows are discounted to their present value using a
pre-tax
discount rate that reflects current market assessments of the time value of money and the risks specific to the assets. This approach uses significant estimates and assumptions, including estimated future cash flows, the timing of such cash flows, discount rates reflecting the risk inherent in future cash flows, perpetual growth rates, earnings or revenue multiples, the determination of appropriate comparable entities and the determination of whether a premium or discount should be applied to comparables. The assumptions used for estimated future cash flows and the timing of such cash flows for each CGU are generally based on the three-yearmid-range
plan (“MRP”) and take into account such factors as historical experience, market and industry information, and current and forecasted economic conditions. Perpetual growth rates are generally utilized to determine a terminal value and are generally set after the three-year forecasted period for the MRP.If the recoverable amount is determined to be less than the carrying amount of a CGU or group of CGUs, an impairment loss would be recognized equal to the amount by which the carrying amount exceeds the recoverable amount. Such impairment losses are recognized by first reducing the carrying amount of any allocated goodwill and then are allocated to the other assets of the CGU on a pro rata basis of the carrying amount of each asset in the CGU. Impairment losses except for content assets are included in other operating (income) expense, net, and impairment losses for content assets are included in cost of sales in the consolidated statements of income.
Assets other than goodwill are reviewed to assess whether there is any indication that an impairment loss recognized in prior periods may no longer exist or may have decreased. If any such indication exists, the recoverable amount of the asset is determined and a reversal of an impairment loss is recognized when the recoverable amount of the asset exceeds the carrying amount. Any increase in the carrying amount of an asset attributable to the reversal of an impairment loss does not exceed the carrying amount of the asset, net of depreciation and amortization, which would have been determined if an impairment loss had never been recognized for the asset in prior periods.
(11) | Insurance-related accounts - |
In accordance with Sony’s first time adoption of IFRS 4 “Insurance Contracts” (“IFRS 4”) on April 1, 2020, insurance contracts are recognized and measured according to the same accounting principles previously applied under generally accepted accounting principles in the United States (“U.S. GAAP”).
| i) | Deferred insurance acquisition costs |
Costs that vary with and are directly related to the acquisition or renewal of insurance policies are deferred as long as they are recoverable. The deferred insurance acquisition costs include such items as commissions, medical examination costs and inspection report fees, and are subject to recoverability testing at least annually to ensure that the capitalized amounts do not exceed the present value of anticipated gross profits or premiums less benefits and maintenance expenses, as applicable. The deferred insurance acquisition costs for traditional life insurance contracts are amortized over the premium-paying period of the related insurance policies using assumptions consistent with those used in computing future insurance policy benefits. The deferred insurance acquisition costs for
non-traditional
life insurance contracts are amortized over the expected life at a constant rate based on the present value of the estimated gross profit. Investment yields, mortality rates, lapse rates and discount rates are used as important assumptions for the present value of the estimated gross profit.| ii) | Future insurance policy benefits |
Liabilities for future insurance policy benefits are primarily comprised of the present value of estimated future payments to policyholders. These liabilities are computed by the net level premium
F-22
SONY GROUP CORPORATION AND CONSOLIDATED SUBSIDIARIES
method based upon the assumptions as to future investment yield, morbidity rates, mortality rates, lapse rates and other factors. These assumptions are reviewed on a periodic basis. Liabilities for future policy benefits include the liabilities for the minimum guarantee benefits of variable annuities and variable life insurance contracts.
| iii) | Policyholders’ account in the life insurance business |
Liabilities for policyholders’ account in the life insurance business represent the contract value that has accrued to the benefit of the policyholders as of the end of the reporting period. This liability is generally equal to the accumulated account deposits, plus interest credited, less policyholder withdrawals and other charges assessed against the account balances. Liabilities for policyholders’ account in the life insurance business include the liabilities related to the variable annuities and variable life insurance contracts with minimum guarantee benefits.
| iv) | Insurance-related accounts measured at fair value |
Sony measures at fair value certain future insurance policy benefits and policyholders’ account in the life insurance business. The fair value measurement mitigates accounting mismatches related to the changes in the fair value between liabilities for those future insurance policy benefits and policyholders’ account due to changes in the minimum guarantee risk of contracts of variable annuities with minimum guarantee benefits, and the underlying investment managed for policyholders and derivatives entered into related to such investments. Changes in fair value resulting from changes in instrument-specific credit risk were estimated by incorporating the certain subsidiary’s current credit spreads, and are recognized in other comprehensive income, net of tax. The amount recognized in other comprehensive income is reclassified to profit or loss when the insurance contract liabilities are derecognized.
| v) | Shadow accounting in the life insurance business |
When holding financial assets that are measured at fair value through other comprehensive income and which correspond to insurance contract liabilities, shadow accounting is applied to evaluate insurance-related accounts as if the financial assets were sold as of the end of reporting period and realized valuation gains or losses for the purpose of reducing the accounting mismatches between the insurance contract liabilities and the financial assets.
Sony performs a shadow liability adequacy test on life insurance contracts quarterly. In a shadow liability adequacy test, mainly, future insurance policy benefits minus deferred insurance acquisition costs in the consolidated statements of financial position are compared to the valuation of future cash flow on a best-estimate basis as of the end of reporting period to determine that the future insurance policy benefits are recorded at a sufficient level. If there is a shortage compared to the valuation of future cash flows on a best-estimate basis at the time, the deferred insurance acquisition costs will be decreased to the extent of the shortage through other comprehensive income. If the deferred insurance acquisition costs are decreased to zero and the shortage remains, the future insurance policy benefits are increased by the remaining shortage through other comprehensive income.
Shadow accounting is an accounting treatment that affects the measurement of the insurance-related accounts in response to unrealized gains or losses recognized for the assets in a manner consistent with realized gains or losses. When the gains or losses from the assets are recognized in other comprehensive income, the fluctuations in the carrying amount of insurance-related accounts are also recognized in other comprehensive income.
(12) | Provisions - |
Provisions are recognized when Sony has present legal or constructive obligations as a result of past events, it is probable that outflows of resources embodying economic benefits will be required to settle the obligations, and reliable estimates can be made of the amount of obligations.
F-23
SONY GROUP CORPORATION AND CONSOLIDATED SUBSIDIARIES
Provisions mainly consist of participation and residual liabilities in the Pictures segment and product warranties.
| i) | Participation and residual liabilities in the Pictures segment |
Parties involved in the production or exploitation of film and television content may be compensated in part by contingent payments based on the financial results of a film or television show pursuant to contractual formulas (participations) and by contingent amounts due under provisions of collective bargaining agreements (residuals). Such parties are collectively referred to as participants, and such costs are referred to collectively as participation and residual costs. Participation and residual costs may be given to creative talent, such as actors or writers, investors or to entities from whom distribution rights are licensed.
Participation and residual liabilities are accrued based on the ratio of current period actual revenues to the estimated remaining total revenues. The participation and residual liabilities are expected to be relieved when the contingent payments are fixed and paid. The majority of the
non-current
portion of participation and residual liabilities is expected to be paid within the next 10 years.Sony also enters into arrangements with other studios to jointly produce and distribute films, under which each partner is responsible for the distribution of the film in specific territories or distribution windows. The partners’ shares in the profits and losses of the films under these arrangements are included within participation and residual costs.
| ii) | Product warranties |
Sony issues contractual product warranties under which it generally guarantees the performance of products delivered and services rendered for a certain period or term. Product warranties are calculated based upon product sales, estimated probability of failure and estimated cost per claim. The estimates and forecasts used in the calculation of product warranties are reviewed on a periodic basis.
(13) | Employee benefits - |
| i) | Post-employment benefits |
Sony adopts defined benefit plans and defined contribution plans.
Defined benefit plans
Sony recognizes the net defined benefit liability or asset of defined benefit plans in the consolidated statements of financial position as the amount of the present value of defined benefit obligations less the fair value of plan assets.
The present value of defined benefit obligations is calculated by discounting the expected future benefit, and service costs are determined by using the projected unit credit method. If the fair value of plan assets is in excess of the present value of defined benefit obligations, the amount of any asset to be recognized is limited to the present value of any economic benefits available in the form of refunds from the plan or reductions in the future contributions to the plan. The discount rate is determined by reference to market yields at each fiscal
year-end
on high-quality corporate bonds which have approximately the same term as the defined benefit obligations and are payable in the same currency as the benefit payments. Net interest on the net defined benefit liability or asset is calculated by multiplying the net defined benefit liability or asset by the discount rate.Past service cost, which is the change in the present value of the defined benefit obligation resulting from a plan amendment or curtailment, is recognized in profit or loss.
Remeasurements of the net defined benefit liability or asset are recognized in other comprehensive income when they occur and transferred to retained earnings immediately.
Defined contribution plans
Sony recognizes contributions to defined contribution plans as expenses when employees have rendered related services.
F-24
SONY GROUP CORPORATION AND CONSOLIDATED SUBSIDIARIES
| ii) | Short-term employee benefits |
Sony recognizes short-term employee benefits, such as salaries, bonuses and annual paid absences, as expenses at the amount expected to be paid in exchange for services when employees have rendered such services.
(14) | Stock-based compensation - |
| i) | Stock option plan |
Sony estimates the cost of stock options at their fair value on the grant date and recognizes the expense over the vesting period with a corresponding increase in equity. The fair value of options granted is calculated using the Black-Scholes option-pricing model with consideration for terms and conditions of the stock options.
| ii) | Restricted stock plan |
Sony estimates the cost of restricted stock compensation by the fair value of the stock granted on the grant date and recognizes the expense over the vesting period with a corresponding increase in equity.
(15) | Fair value measurement - |
Sony measures fair value as an exit price, or the amount that would be received to sell an asset or paid to transfer a liability in an orderly transaction between market participants as of the measurement date.
Sony determines a hierarchy of inputs to valuation techniques based on the extent to which inputs used in measuring fair value are observable in the market. Observable inputs reflect market data obtained from independent sources, while unobservable inputs reflect assumptions which Sony developed using the information that market participants would use in pricing the asset or liability. Observable market data is used if such data is available without undue cost and effort. Each fair value measurement is reported in one of three levels which is determined by the lowest level input that is significant to the fair value measurement in its entirety.
These levels are:
Level 1 | — | Inputs are unadjusted quoted prices for identical assets and liabilities in active markets. | ||
Level 2 | — | Inputs are based on observable inputs other than Level 1 prices, such as quoted prices for similar instruments in active markets, quoted prices for identical or similar instruments in markets that are not active and model-derived valuations, in which all significant inputs are observable in active markets. | ||
Level 3 | — | One or more significant inputs are unobservable. | ||
When available, Sony uses unadjusted quoted market prices in active markets to measure fair value and classifies such items within Level 1. If quoted market prices are not available, fair value is based upon internally developed valuation techniques that use, where possible, current market-based or independently sourced market parameters, such as interest rates, currency rates and option volatilities. Items valued using internally generated models are classified according to the lowest level input that is significant to the valuation. For certain financial assets and liabilities, Sony determines fair value using third-party information such as indicative quotes from dealers and quantitative input from investment advisors following Sony’s established valuation procedures including validation against internally developed prices. Additionally, Sony considers both counterparty credit risk and Sony’s own creditworthiness in determining fair value. Sony attempts to mitigate credit risk to third parties by entering into netting agreements and actively monitoring the creditworthiness of counterparties and its exposure to credit risk through the use of credit limits and by selecting major international banks and financial institutions as counterparties.
Transfers between levels are deemed to have occurred at the beginning of the interim period in which the transfers occur.
F-25
SONY GROUP CORPORATION AND CONSOLIDATED SUBSIDIARIES
(16) | Revenue recognition - |
Sony recognizes revenue in an amount that reflects the consideration Sony expects in exchange for satisfying performance obligations to transfer the goods or services promised in contracts with customers. This is in accordance with the following steps:
Step 1: Identify the contract(s) with a customer.
Step 2: Identify the performance obligations in the contract.
Step 3: Determine the transaction price.
Step 4: Allocate the transaction price to the performance obligations in the contract.
Step 5: Recognize revenue when (or as) Sony satisfies a performance obligation.
Sony owns a variety of intellectual property throughout its segments and recognizes revenue through the licensing of such intellectual property. Sony licenses rights to use its intellectual property and rights to access its intellectual property. When Sony grants a customer the right to use Sony’s intellectual property, Sony satisfies its performance obligation at the point in time when the customer obtains control and is entitled to benefit from the license. When Sony grants a customer the right to access Sony’s intellectual property, Sony satisfies its performance obligation over the license period.
Incremental costs of obtaining a contract and costs to fulfill a contract are recognized as assets when Sony expects to recover these costs. The incremental costs of obtaining a contract are those costs that would not have been incurred if the contract had not been obtained. Costs to fulfill a contract are those costs that are directly related to a contract or to an anticipated contract and that generate or enhance resources for Sony to satisfy its performance obligations. Sony applies a practical expedient and recognizes the incremental costs of obtaining a contract as an expense when incurred if the amortization period of the asset that would have been recognized is one year or less.
Performance obligations in contracts for the Electronics Products & Solutions (“EP&S”) and Imaging & Sensing Solutions (“I&SS”) segments are primarily to deliver various kinds of electronic equipment, instruments and devices to customers. Revenues from these performance obligations are generally recognized when a promised good is delivered to a customer. However, if the sales contract contains a customer acceptance provision, then revenues are recognized when the customer accepts the promised good or when a deemed acceptance occurs by the lapse of time. Revenues are also recognized over time, primarily from the provision of internet broadband network services to subscribers over the subscription period. Revenues are recognized net of anticipated returns and sales incentives.
Within the Game & Network Services (“G&NS”) segment, revenues from hardware, peripherals and software discs are recognized when performance obligations are satisfied by transferring control to the retailer/distributor, net of anticipated returns, sales incentives and cooperative advertising obligations. Revenues from platform licensing to publishers are recognized when physical software discs are delivered. Revenues from digital game content, which is a right to use Sony’s intellectual property, are recognized when the digital content is made available for use by the licensee via an online platform, net of anticipated sales incentives and credit card chargebacks. Revenues from digital game content involving multiple performance obligations, such as obligations to make content available on future dates, are allocated to each performance obligation based on the relative standalone selling prices that are observable in the market or Sony’s best estimate. Revenues from subscription fees for digital subscription services are recognized over the subscription period.
Within the Music segment, Sony licenses intellectual property that transfer to a customer either a right to use Sony’s intellectual property, or a right to access Sony’s intellectual property. Revenues are recognized when the customer has the right to use or access the intellectual property and obtains control of the use or access of that license. Digital revenues include revenues from contracts with digital streaming services typically recognized as a single performance obligation, which is ongoing access to intellectual property in an evolving library of content over the contract term, predicated on: (1) the business practice and contractual ability to remove specific content without a requirement to replace the content and without impact to minimum royalty guarantees and (2) the contracts not containing a specific listing of content subject to the license. For these contracts, revenues are recognized based on sales and usage royalties, except where there is a minimum royalty guarantee that is not expected to be recouped, or a fixed fee, which is recognized on a straight-line basis over the term of the contract. Revenues from the sale of physical products such as CDs, net of anticipated returns and sales incentives, are recognized when delivery has occurred and the product is available for sale to the public.
F-26
SONY GROUP CORPORATION AND CONSOLIDATED SUBSIDIARIES
Within the Pictures segment, revenues from the theatrical exhibition of motion pictures are recognized as the customer exhibits the film. Revenues from the licensing of motion picture and television programming for pay and free television exhibition and other markets are recognized when the product is available for use by the licensee. Revenues for motion picture and television program licensing arrangements involving multiple performance obligations, for example a fee for multiple titles, territories or availability dates, are allocated based on the relative standalone selling price of each performance obligation using Sony’s best estimate based on available information such as market conditions and internal pricing guidelines. Each individual motion picture or television programming product delivered generally represents a separate performance obligation. Licensing revenue associated with certain renewals or extensions of existing agreements for motion pictures and television programming is recognized when the licensee can use and benefit from the content under the renewal or extension. Licensing revenue associated with minimum guarantees for a right to access Sony’s intellectual property is recognized ratably over the license term. For home entertainment distribution, revenues from the sale of physical products such as DVDs andare recognized when the product is made available for viewing via digital distribution platforms. Revenues from the sale of broadcast advertising are recognized when the advertisement is aired, and the performance obligation in these arrangements is the delivery of advertising spots and may include a guaranteed amount of impressions. When a guarantee for a number of impressions is not achieved, revenues are not recognized until additional advertising spots are delivered to provide the guaranteed impressions. Revenues from subscription fees received by television and digital networks are recognized when the service is provided. The performance obligation under network subscription arrangements is a right to use Sony’s intellectual property that is satisfied as programming is provided over the term of the arrangement.
Blu-ray
Disc™
, net of anticipated returns and sales incentives, are recognized when delivery has occurred and the product is available for sale to the public. Revenues from electronic sell-through andvideo-on-demand
Within the Financial Services segment, traditional life insurance policies that the life insurance subsidiary underwrites, most of which are categorized as long-duration contracts, mainly consist of whole life, term life and accident and health insurance contracts. Premiums from these policies are reported as revenue when due from policyholders. Amounts received as payment for
non-traditional
contracts such as interest sensitive whole life contracts, individual annuity contracts and other contracts without life contingencies are recognized in policyholders’ account in the life insurance business. Revenues from these contracts are comprised of fees earned for administrative and contract-holder services, which are recognized over the period of the contracts, and included in financial services revenue. Property and casualty insurance policies that thenon-life
insurance subsidiary underwrites are primarily automotive insurance contracts which are categorized as short-duration contracts. Premiums from these policies are reported as revenue over the period of the contract in proportion to the amount of insurance protection provided.Revenue is recognized net of any taxes collected from customers and subsequently remitted to governmental authorities.
(17) | Cost of sales - |
Costs classified as cost of sales relate to the producing and manufacturing of products and include items such as material cost, subcontractor cost, depreciation of property, plant and equipment, amortization of intangible assets including content assets, employee benefits expenses and research and development costs.
(18) | Research and development expenditures - |
Research and development expenditures include items such as employee benefits expenses and other direct and indirect expenses associated with research and product development. Development expenditures are capitalized only when technical feasibility is achieved, Sony has the intention, ability and sufficient resources to use or sell the outcome of the development, it is probable that the outcome will generate a future economic benefit, and the cost can be reliably measured. Capitalized development costs are measured as the sum of total expenditures for development upon achieving the foregoing conditions for capitalization until development is completed. Research expenditures and other development expenditures that do not meet the foregoing conditions are expensed as incurred and included in the cost of sales in the consolidated statements of income.
(19) | Selling, general and administrative - |
Costs classified as selling expenses relate to promoting and selling products and include items such as advertising, promotion, shipping and warranty expenses. General and administrative expenses include operating
F-27
SONY GROUP CORPORATION AND CONSOLIDATED SUBSIDIARIES
items such as employee benefits expenses, depreciation of property, plant and equipment, office rental for sales, marketing and administrative divisions, loss allowance for trade receivables and amortization of intangible assets.
(20) | Financial services expenses - |
Financial services expenses include a provision for policy reserves and amortization of deferred insurance acquisition costs, interest expenses in the banking business, and all other operating costs, such as employee benefits expenses, depreciation of property, plant and equipment, and office rental of subsidiaries, in the Financial Services segment.
(21) | Advertising costs - |
Advertising costs are expensed as incurred.
(22) | Shipping and handling costs - |
The majority of shipping and handling, warehousing and internal transfer costs for finished goods are included in selling, general and administrative expenses. An exception to this is in the Pictures segment where such costs are charged to cost of sales as they are an integral part of producing and distributing motion pictures and television programming. All other costs related to Sony’s distribution network are included in cost of sales, including inbound freight charges, purchasing and receiving costs, inspection costs and warehousing costs for raw materials and
in-process
inventory. Shipping and handling activities that occur after control of the related good transfers are treated as separate performance obligations. Amounts paid by customers for shipping and handling costs are included in sales.(23) | Income taxes - |
Income taxes consist of current and deferred taxes. Current and deferred taxes are recognized in profit or loss, except to the extent that the tax arises from a business combination, or a transaction or event which is recognized, in the same or a different period, outside profit or loss, either in other comprehensive income or directly in equity.
Current taxes are computed based on taxable profit or loss for the year, using the tax rates enacted or substantively enacted at the end of the reporting period.
Deferred tax assets and liabilities are recognized for temporary differences between the tax bases of assets and liabilities and their carrying amounts at the end of the reporting period. Deferred tax liabilities include the liabilities being recognized for undistributed profits of subsidiaries and associates accounted for under the equity method that are expected to be remitted in the foreseeable future. Deferred income taxes are determined using tax rates and laws that have been enacted or substantively enacted by the end of the reporting period and are expected to apply when the related deferred income tax asset is realized or the deferred income tax liability is settled. Deferred tax assets and liabilities are not recognized in respect of temporary differences that arise from the initial recognition of an asset or liability in a transaction which is not a business combination and which, at the time of the transaction, affects neither accounting profit nor taxable profit (tax loss).
Deferred tax assets are recognized to the extent that it is probable that taxable profit will be available against which the assets can be utilized. Accordingly, the valuation of the deferred tax assets is assessed periodically with available evidence related to the recoverability of the deferred tax assets. Management’s judgment related to this assessment considers the nature, frequency and severity of current and cumulative losses on an individual tax jurisdiction basis, forecasts of future profitability after consideration of uncertain tax positions, excess of appreciated asset value over the tax basis of net assets, the duration of statutory carryforward periods, the past utilization of net operating loss carryforwards prior to expiration, as well as prudent and feasible tax planning strategies which would be employed by Sony to prevent net operating loss and tax credit carryforwards from expiring unutilized.
Sony records assets and liabilities resulting from uncertain tax positions taken or expected to be taken in a tax return. The amount of income taxes Sony pays is subject to ongoing audits by various taxing authorities, which may result in proposed assessments. In addition, several significant items related to intercompany transfer pricing are currently the subject of negotiations between taxing authorities in different jurisdictions as a result of
F-28
SONY GROUP CORPORATION AND CONSOLIDATED SUBSIDIARIES
pending advance pricing agreement applications and competent authority requests. Sony’s estimate for the potential outcome for any uncertain tax issues is judgmental and requires significant estimates. Sony assesses its income tax positions and records tax benefits and expenses for all years subject to examinations based upon the evaluation of the facts, circumstances and information available at that reporting date.
(24) | Net income (loss) attributable to Sony Group Corporation’s stockholders per share (“EPS”) - |
Basic EPS is computed based on the weighted-average number of shares of common stock outstanding during each period. The computation of diluted EPS reflects the maximum possible dilution from conversion, exercise, or contingent issuance of securities. All potentially dilutive securities are excluded from the calculation in a situation where there is a net loss attributable to Sony Group Corporation’s stockholders.
II. | New accounting standards and interpretations not yet adopted |
Major new or amended standards and interpretations that have been issued as of the date of approval of the consolidated financial statements which are not effective and have not yet been adopted by Sony as of March 31, 2022 are as follows:
IFRS 17 “Insurance Contracts”
The IASB issued IFRS 17 “Insurance Contracts” (“IFRS 17”) in May 2017 and Amendments to IFRS 17 in June 2020. IFRS 17 replaces IFRS 4 and sets out principles for the recognition, measurement, presentation and disclosure of insurance contracts within the scope of IFRS 17. IFRS 17 provides a general model, supplemented by a specific approach for contracts with direct participation features (the variable fee approach) and a simplified approach (the premium allocation approach) mainly for short-duration contracts. The main features of IFRS 17 are:
a. the measurement of the present value of future cash flows incorporating an explicit risk adjustment, remeasured at each reporting period;
b. a contractual service margin in the fulfilment cash flows representing the unearned profit of the insurance contracts to be recognized in profit or loss over the coverage period;
c. the presentation of insurance revenue and insurance service expenses in the statement of comprehensive income based on the concept of insurance services provided during the period; and
d. extensive disclosures to provide information on the recognized amounts from insurance contracts and the nature and extent of risks arising from these contracts.
IFRS 17 will be effective for Sony as of April 1, 2023. On transition Sony is required to apply IFRS 17 retrospectively unless such application is impracticable. If it is impracticable to apply IFRS 17 retrospectively for a group of insurance contracts, either the modified retrospective approach, which uses reasonable and supportable information, or the fair value approach, which uses the fair value as of the transition date for IFRS 17, may be applied. If Sony cannot obtain reasonable and supportable information necessary to apply the modified retrospective approach, Sony will apply the fair value approach. Applying IFRS 17 is expected to affect measurements of insurance-related accounts, which are currently included in future insurance policy benefits and other, policyholders’ account in the life insurance business and deferred insurance acquisition costs in the consolidated statements of financial position. The impact of IFRS 17 on Sony’s results of operations and financial position is being evaluated.
Amendments to IAS 1 “Presentation of Financial Statements”
In January 2020, the IASB issued “Classification of Liabilities as Current or
Non-current”
(“Amendments to IAS 1”). The amendments clarify the right to defer settlement, which is one of the existing requirements when classifying a liability to current ornon-current.
The amendments will be effective for Sony as of April 1, 2023. However, in November 2021, the IASB published an Exposure Draft with proposed revisions to the Amendments to IAS 1 and a proposed deferral of the effective date. The impact of the amendments on Sony’s results of operations and financial position is being evaluated.F-29
SONY GROUP CORPORATION AND CONSOLIDATED SUBSIDIARIES
4. | Business segment information |
The reportable segments presented below are the segments of Sony for which separate financial information is available and for which operating income or loss amounts are evaluated regularly by the chief operating decision maker (“CODM”) in deciding how to allocate resources and in assessing performance. The CODM does not evaluate segments using discrete asset information. Sony’s CODM is its Chairman, President and Chief Executive Officer.
Due to organizational changes as of April 1, 2021, from the first quarter of the fiscal year ended March 31, 2022, Sony transferred some of the businesses and functions previously included within All Other and Corporate and elimination to the EP&S segment. In connection with these organizational changes, sales and financial services revenue and operating income (loss) of each segment for the fiscal year ended March 31, 2021 are presented to conform to the organizational structure for the fiscal year ended March 31, 2022.
The G&NS segment includes the network services businesses, the manufacture and sales of home gaming products and the production and sales of software. The Music segment includes the Recorded Music, Music Publishing and Visual Media and Platform businesses. The Pictures segment includes the Motion Pictures, Television Productions and Media Networks businesses. The EP&S segment includes the Televisions business, the Audio and Video business, the Still and Video Cameras business, the smartphone business and the internet-related service business. The I&SS segment includes the image sensors business. The Financial Services segment primarily represents individual life insurance and
non-life
insurance businesses in the Japanese market and the banking business in Japan. All Other consists of various operating activities, including the disc manufacturing and recording media businesses. Sony’s products and services are generally unique to a single operating segment.F-30
SONY GROUP CORPORATION AND CONSOLIDATED SUBSIDIARIES
Segment sales and financial services revenue:
Yen in millions | ||||||||
Fiscal year ended March 31 | ||||||||
2021 | 2022 | |||||||
Sales and financial services revenue: | ||||||||
Game & Network Services — | ||||||||
Customers | 2,604,713 | 2,674,356 | ||||||
Intersegment | 51,565 | 65,407 | ||||||
Total | 2,656,278 | 2,739,763 | ||||||
Music — | ||||||||
Customers | 927,250 | 1,100,532 | ||||||
Intersegment | 12,617 | 16,417 | ||||||
Total | 939,867 | 1,116,949 | ||||||
Pictures — | ||||||||
Customers | 751,800 | 1,236,399 | ||||||
Intersegment | 1,187 | 2,512 | ||||||
Total | 752,987 | 1,238,911 | ||||||
Electronics Products & Solutions — | ||||||||
Customers | 2,016,887 | 2,297,886 | ||||||
Intersegment | 51,200 | 41,300 | ||||||
Total | 2,068,087 | 2,339,186 | ||||||
Imaging & Sensing Solutions — | ||||||||
Customers | 937,859 | 992,200 | ||||||
Intersegment | 74,638 | 84,224 | ||||||
Total | 1,012,497 | 1,076,424 | ||||||
Financial Services — | ||||||||
Customers | 1,664,991 | 1,524,811 | ||||||
Intersegment | 9,011 | 9,018 | ||||||
Total | 1,674,002 | 1,533,829 | ||||||
All Other — | ||||||||
Customers | 84,202 | 82,264 | ||||||
Intersegment | 16,534 | 16,519 | ||||||
Total | 100,736 | 98,783 | ||||||
Corporate and elimination | (205,793 | ) | (222,332 | ) | ||||
Consolidated total | 8,998,661 | 9,921,513 | ||||||
G&NS intersegment amounts primarily consist of transactions with the EP&S segment. EP&S intersegment amounts primarily consist of transactions with the G&NS segment. I&SS intersegment amounts primarily consist of transactions with the G&NS segment and the EP&S segment. Corporate and elimination includes certain brand and patent royalty income.
F-31
SONY GROUP CORPORATION AND CONSOLIDATED SUBSIDIARIES
Segment profit (loss):
Yen in millions | ||||||||
Fiscal year ended March 31 | ||||||||
2021 | 2022 | |||||||
Operating income (loss): | ||||||||
Game & Network Services | 341,718 | 346,089 | ||||||
Music | 184,786 | 210,933 | ||||||
Pictures | 79,851 | 217,393 | ||||||
Electronics Products & Solutions | 127,859 | 212,942 | ||||||
Imaging & Sensing Solutions | 145,884 | 155,597 | ||||||
Financial Services | 154,765 | 150,111 | ||||||
All Other | 7,178 | 17,981 | ||||||
Total | 1,042,041 | 1,311,046 | ||||||
Corporate and elimination | (86,786 | ) | (108,707 | ) | ||||
Consolidated operating income | 955,255 | 1,202,339 | ||||||
Financial income | 83,792 | 19,304 | ||||||
Financial expenses | (41,082 | ) | (104,140 | ) | ||||
Consolidated income before income taxes | 997,965 | 1,117,503 | ||||||
Operating income (loss) is sales and financial services revenue less costs and expenses, and includes the share of profit (loss) of investments accounted for using the equity method.
Other significant items:
Yen in millions | ||||||||
Fiscal year ended March 31 | ||||||||
2021 | 2022 | |||||||
Share of profit (loss) of investments accounted for using the equity method: | ||||||||
Game & Network Services | — | 14 | ||||||
Music | 570 | 4,073 | ||||||
Pictures | 123 | (664 | ) | |||||
Electronics Products & Solutions | 57 | 1,103 | ||||||
Imaging & Sensing Solutions | (123 | ) | (603 | ) | ||||
Financial Services | — | — | ||||||
All Other | 10,924 | 19,723 | ||||||
Consolidated total | 11,551 | 23,646 | ||||||
Depreciation and amortization: | ||||||||
Game & Network Services | 52,987 | 61,219 | ||||||
Music | 46,217 | 61,465 | ||||||
Pictures | 290,895 | 396,251 | ||||||
Electronics Products & Solutions | 82,174 | 91,759 | ||||||
Imaging & Sensing Solutions | 159,469 | 172,842 | ||||||
Financial Services, including deferred insurance acquisition costs | 68,598 | 94,169 | ||||||
All Other | 7,686 | 4,300 | ||||||
Total | 708,026 | 882,005 | ||||||
Corporate | 24,085 | 22,465 | ||||||
Consolidated total | 732,111 | 904,470 | ||||||
F-32
SONY GROUP CORPORATION AND CONSOLIDATED SUBSIDIARIES
Sales to customers by product category:
The following table is a breakdown of sales and financial services revenue to external customers by product category for each segment. Sony management views each segment as a single operating segment.
Yen in millions | ||||||||
Fiscal year ended March 31 | ||||||||
2021 | 2022 | |||||||
Sales and financial services revenue: | ||||||||
Game & Network Services | ||||||||
Digital Software and Add-on Content | 1,454,654 | 1,424,459 | ||||||
Network Services | 382,950 | 409,355 | ||||||
Hardware and Others | 767,109 | 840,542 | ||||||
Total | 2,604,713 | 2,674,356 | ||||||
Music | ||||||||
Recorded Music — Streaming | 337,100 | 462,368 | ||||||
Recorded Music — Others | 179,167 | 206,412 | ||||||
Music Publishing | 156,862 | 200,334 | ||||||
Visual Media and Platform | 254,121 | 231,418 | ||||||
Total | 927,250 | 1,100,532 | ||||||
Pictures | ||||||||
Motion Pictures | 265,301 | 518,840 | ||||||
Television Productions | 267,123 | 419,494 | ||||||
Media Networks | 219,376 | 298,065 | ||||||
Total | 751,800 | 1,236,399 | ||||||
Electronics Products & Solutions | ||||||||
Televisions | 709,007 | 858,837 | ||||||
Audio and Video | 313,975 | 326,704 | ||||||
Still and Video Cameras | 338,694 | 414,898 | ||||||
Mobile Communications | 358,580 | 365,864 | ||||||
Other | 296,631 | 331,583 | ||||||
Total | 2,016,887 | 2,297,886 | ||||||
Imaging & Sensing Solutions | 937,859 | 992,200 | ||||||
Financial Services | 1,664,991 | 1,524,811 | ||||||
All Other | 84,202 | 82,264 | ||||||
Corporate | 10,959 | 13,065 | ||||||
Consolidated total | 8,998,661 | 9,921,513 | ||||||
In the G&NS segment, Digital Software and
Add-on
Content includes distribution of software titles andadd-on
content through the network by Sony Interactive Entertainment; Network Services includes network services relating to game, video and music content; Hardware and Others includes home gaming consoles, packaged software, peripheral devices and first-party software for third-party platforms. In the Music segment, Recorded Music — Streaming includes the distribution of digital recorded music by streaming; Recorded Music — Others includes the distribution of recorded music by physical media and digital download as well as revenue derived from artists’ live performances; Music Publishing includes the management and licensing of the words and music of songs; Visual Media and Platform includes the production and distribution of animation titles and game applications, and various service offerings for music and visual products. In the Pictures segment, Motion Pictures includes the worldwide production, acquisition and distribution of live-action and animated motion pictures; Television Productions includes the production, acquisition and distribution of television programming; Media Networks includes the operation of television and digital networks worldwide. In the EP&S segment, Televisions includes LCD and OLED televisions; Audio and Video includesBlu-ray
disc players and recorders, home audio, headphones and memory-based portable audio devices; Still and Video Cameras includes interchangeable lens cameras, compact digital cameras, consumer video cameras and video cameras forF-33
SONY GROUP CORPORATION AND CONSOLIDATED SUBSIDIARIES
broadcast; Mobile Communications includes smartphones and an internet-related service business; Other includes display products such as projectors and medical equipment.
Geographic Information:
Sales and financial services revenue attributed to countries and areas based on location of external customers for the fiscal years ended March 31, 2021 and 2022 and
non-current
assets (property, plant and equipment, ROU assets, goodwill, content assets and other intangible assets) as of April 1, 2020, March 31, 2021 and 2022 are as follows:Yen in millions | ||||||||||||
Fiscal year ended March 31 | ||||||||||||
2021 | 2022 | |||||||||||
Sales and financial services revenue: | ||||||||||||
Japan | 2,965,936 | 2,764,321 | ||||||||||
United States | 2,147,686 | 2,766,021 | ||||||||||
Europe | 1,817,854 | 1,870,091 | ||||||||||
China | 762,766 | 771,006 | ||||||||||
Asia-Pacific | 861,623 | 1,149,261 | ||||||||||
Other Areas | 442,796 | 600,813 | ||||||||||
Total | 8,998,661 | 9,921,513 | ||||||||||
Yen in millions | ||||||||||||
April 1 | March 31 | |||||||||||
2020 | 2021 | 2022 | ||||||||||
Non-current assets (property, plant and equipment,right-of-use | ||||||||||||
Japan | 1,389,781 | 1,460,029 | 1,592,981 | |||||||||
United States | 1,328,295 | 1,378,343 | 1,830,602 | |||||||||
Europe | 410,989 | 459,201 | 565,044 | |||||||||
China | 27,108 | 27,091 | 34,029 | |||||||||
Asia-Pacific | 151,108 | 148,467 | 158,030 | |||||||||
Other Areas | 44,272 | 55,155 | 91,001 | |||||||||
Total | 3,351,553 | 3,528,286 | 4,271,687 | |||||||||
Major countries and areas in each geographic segment excluding Japan, United States and China are as follows:
(1) Europe: | United Kingdom, France, Germany, Russia, Spain and Italy | |
(2) Asia-Pacific: | India, South Korea, Oceania, Thailand and Malaysia | |
(3) Other Areas: | The Middle East/Africa, Brazil, Mexico and Canada |
There are no individually material countries with respect to sales and financial services revenue or
non-current
assets (property, plant and equipment, ROU assets, goodwill, content assets and other intangible assets) included in Europe, Asia-Pacific and Other Areas.Transfers between reportable business segments or geographic areas are made at individually negotiated prices that are intended to reflect a market-based transfer price.
There were no sales or financial services revenue with any single major external customer for the fiscal years ended March 31, 2021 and 2022.
F-34
SONY GROUP CORPORATION AND CONSOLIDATED SUBSIDIARIES
5. | Financial instruments |
(1) | Financial instruments by measurement method |
The carrying amount of Sony’s assets and liabilities by measurement method as of April 1, 2020, March 31, 2021 and 2022 are as follows:
Yen in millions | ||||||||||||
April 1 | March 31 | |||||||||||
2020 | 2021 | 2022 | ||||||||||
Assets: | ||||||||||||
Financial assets required to be measured at amortized cost (“AC”) | ||||||||||||
Investments and advances in the Financial Services segment | ||||||||||||
Debt securities | 255,447 | 298,794 | 358,238 | |||||||||
Housing loans in the banking business | 1,919,219 | 2,342,728 | 2,752,985 | |||||||||
Other loans | 252,875 | 236,828 | 230,516 | |||||||||
Trade and other receivables * | ||||||||||||
Trade receivables | 1,180,798 | 1,356,612 | 1,617,323 | |||||||||
Other receivables | 2,393 | 2,296 | 2,736 | |||||||||
Other financial assets | ||||||||||||
Time deposit | 20,705 | 21,165 | 39,223 | |||||||||
Security deposit | 110,399 | 114,490 | 121,856 | |||||||||
Non-current other receivables in the Pictures segment | 109,012 | 88,111 | 166,279 | |||||||||
Other | 19,968 | 17,218 | 16,425 | |||||||||
Financial assets required to be measured at fair value through profit or loss (“FVPL”) | ||||||||||||
Investments and advances in the Financial Services segment | ||||||||||||
Debt securities | 894,493 | 1,017,169 | 1,012,057 | |||||||||
Equity securities | 884,480 | 1,398,097 | 1,798,536 | |||||||||
Other financial assets | ||||||||||||
Debt securities | 8,509 | 9,671 | 16,013 | |||||||||
Equity securities | 86,628 | 182,985 | 120,274 | |||||||||
Derivative assets | 46,464 | 38,913 | 61,023 | |||||||||
Financial assets designated to be measured at FVPL | ||||||||||||
Investments and advances in the Financial Services segment | ||||||||||||
Debt securities | 247,289 | 295,314 | 267,169 | |||||||||
Financial assets required to be measured at fair value through other comprehensive income (“FVOCI”) | ||||||||||||
Investments and advances in the Financial Services segment | ||||||||||||
Debt securities | 12,222,667 | 12,113,844 | 12,378,244 | |||||||||
Other financial assets | ||||||||||||
Debt securities | 760 | 529 | 522 | |||||||||
Financial assets designated to be measured at FVOCI | ||||||||||||
Investments and advances in the Financial Services segment | ||||||||||||
Equity securities | 2,907 | 5,754 | 8,016 | |||||||||
Other financial assets | ||||||||||||
Equity securities | 54,758 | 340,364 | 303,992 | |||||||||
Total assets | 18,319,771 | 19,880,882 | 21,271,427 | |||||||||
Current assets | 1,645,765 | 1,888,572 | 2,130,033 | |||||||||
Non-current assets | 16,674,006 | 17,992,310 | 19,141,394 | |||||||||
F-35
SONY GROUP CORPORATION AND CONSOLIDATED SUBSIDIARIES
| * | The amounts of trade and other receivables exclude contract assets within trade and other receivables, and contract assets in the consolidated statements of financial position. |
Cash and cash equivalents are excluded from the table above. Refer to Note 27.
Yen in millions | ||||||||||||
April 1 | March 31 | |||||||||||
2020 | 2021 | 2022 | ||||||||||
Liabilities: | ||||||||||||
Financial liabilities required to be measured at AC | ||||||||||||
Short-term borrowings | 824,045 | 1,201,747 | 1,976,553 | |||||||||
Current portion of long-term debt | 98,923 | 205,406 | 171,409 | |||||||||
Trade and other payables | ||||||||||||
Trade payables | 1,139,093 | 1,455,751 | 1,716,316 | |||||||||
Other payables | 171,443 | 140,812 | 126,926 | |||||||||
Deposits from customers in the banking business * | 2,440,783 | 2,773,884 | 3,004,215 | |||||||||
Long-term debt | 939,030 | 1,053,636 | 1,203,646 | |||||||||
Other financial liabilities | 60,291 | 47,336 | 63,281 | |||||||||
Financial liabilities required to be measured at FVPL | ||||||||||||
Other financial liabilities | ||||||||||||
Derivative liabilities | 35,866 | 40,354 | 72,120 | |||||||||
Contingent consideration | 5,666 | 6,161 | 21,552 | |||||||||
Financial liabilities designated to be measured at FVPL | ||||||||||||
Other financial liabilities | ||||||||||||
Redeemable noncontrolling interests | 7,767 | 8,179 | 34,995 | |||||||||
Total liabilities | 5,722,907 | 6,933,266 | 8,391,013 | |||||||||
Current liabilities | 4,637,043 | 5,740,213 | 6,975,408 | |||||||||
Non-current liabilities | 1,085,864 | 1,193,053 | 1,415,605 | |||||||||
| * | Deposits from customers in the banking business includethe non-currentportion thatis recorded within other financial liabilities in the consolidated statements of financial position. |
(2) | Financial instruments measured at fair value on a recurring basis |
The following section describes the valuation techniques used by Sony to measure different financial instruments at fair value, including an indication of the level in the fair value hierarchy in which each instrument is generally classified.
Debt instruments and equity instruments
Where quoted prices of financial instruments are available in an active market, these instruments are classified in Level 1 of the fair value hierarchy. Level 1 financial instruments include exchange-traded equity instruments. If quoted market prices are not available for the specific financial instruments or the market is inactive, then fair values are estimated by using pricing models, quoted prices of financial instruments with similar characteristics or discounted cash flows and mainly classified in Level 2 of the fair value hierarchy. Level 2 financial instruments include debt instruments with quoted prices that are not traded as actively as exchange-traded instruments, such as the majority of government bonds and corporate bonds. In certain cases where there is limited activity or less transparency around inputs to the valuation, these instruments are classified within Level 3 of the fair value hierarchy. Level 3 financial instruments primarily include certain private equity investments, investment funds, securitized products which are not classified within Level 1 or Level 2 and domestic and foreign corporate bonds for which quoted prices are not available in a market and where there is less transparency around inputs. Sony estimates the fair value for private equity investments primarily by using comparable company analysis. The price book-value ratio and price earnings ratio of comparable companies are used as significant unobservable inputs in the fair value measurement of equity securities classified as Level 3. The fair value increases (decreases) as price book-value ratio and price earnings ratio of comparable companies
F-36
SONY GROUP CORPORATION AND CONSOLIDATED SUBSIDIARIES
rise (decline). Sony estimates the fair value for certain investment funds by using the net asset value. Sony estimates the fair value for securitized products and domestic and foreign corporate bonds for which quoted prices are not available in a market and where there is less transparency around inputs by using third-party information such as indicative quotes from dealers without adjustment or discounted cash flows. For validating the fair values of Level 3 financial instruments, Sony primarily uses internal models which include management judgment or estimation of assumptions that market participants would use in pricing the asset.
Derivatives
Exchange-traded derivatives valued using quoted prices are classified within Level 1 of the fair value hierarchy. However, few classes of derivative contracts are listed on an exchange; thus, the majority of Sony’s derivative positions are valued using internally developed models that use as their basis readily observable market parameters, meaning parameters that are actively quoted and can be validated to external sources, including pricing services. Depending on the types and contractual terms of derivatives, fair value can be modeled using a series of techniques, such as the Black-Scholes option pricing model, which are consistently applied. For derivative products that have been established for some time, Sony uses models that are widely accepted in the financial services industry. These models reflect the contractual terms of the derivatives, including the period to maturity, and market-based parameters such as interest rates, volatility, and the credit rating of the counterparty. Further, many of these models do not contain a high level of subjectivity as the techniques used in the models do not require significant judgment, and inputs to the model are readily observable from actively quoted markets. Such instruments are generally classified within Level 2 of the fair value hierarchy.
In determining the fair value of Sony’s interest rate swap derivatives, Sony uses the present value of expected cash flows based on market observable interest rate yield curves commensurate with the term of each instrument. For foreign currency derivatives, Sony’s approach is to use forward contract valuation models employing market observable inputs, such as spot currency rates and time value. These derivatives are classified within Level 2 since Sony primarily uses observable inputs in its valuation of its derivative assets and liabilities.
F-37
SONY GROUP CORPORATION AND CONSOLIDATED SUBSIDIARIES
The fair value of Sony’s assets and liabilities that are measured at fair value on a recurring basis as of April 1, 2020, March 31, 2021 and 2022 is as follows:
Yen in millions | ||||||||||||||||||||||||||||||||
April 1, 2020 | ||||||||||||||||||||||||||||||||
Presentation in the consolidated statements of financial position | ||||||||||||||||||||||||||||||||
Level 1 | Level 2 | Level 3 | Total | Investments and advances in the Financial Services segment (Current) | Other financial assets (Current) | Investments and advances in the Financial Services segment (Non-current) | Other financial assets (Non-current) | |||||||||||||||||||||||||
Assets: | ||||||||||||||||||||||||||||||||
Financial assets required to be measured at FVPL | ||||||||||||||||||||||||||||||||
Debt securities | ||||||||||||||||||||||||||||||||
Japanese national government bonds | — | 162,708 | — | 162,708 | 4,505 | — | 158,203 | — | ||||||||||||||||||||||||
Japanese local government bonds | — | 600 | — | 600 | — | — | 600 | — | ||||||||||||||||||||||||
Japanese corporate bonds | — | 9,395 | 30 | 9,425 | — | — | 9,395 | 30 | ||||||||||||||||||||||||
Foreign government bonds | 24,330 | 155,908 | — | 180,238 | 66 | — | 180,172 | — | ||||||||||||||||||||||||
Foreign corporate bonds | — | 32,157 | 683 | 32,840 | 7,903 | — | 24,254 | 683 | ||||||||||||||||||||||||
Securitized products | — | — | 5,787 | 5,787 | — | — | 5,787 | — | ||||||||||||||||||||||||
Investment funds | — | 483,613 | 27,791 | 511,404 | — | — | 503,608 | 7,796 | ||||||||||||||||||||||||
Equity securities | 958,414 | 9,757 | 2,937 | 971,108 | — | — | 884,480 | 86,628 | ||||||||||||||||||||||||
Derivative assets | ||||||||||||||||||||||||||||||||
Interest rate contracts | — | 1,604 | — | 1,604 | — | 53 | — | 1,551 | ||||||||||||||||||||||||
Foreign exchange contracts | 315 | 21,188 | — | 21,503 | — | 21,454 | — | 49 | ||||||||||||||||||||||||
Equity contracts | 604 | 18,281 | 4,081 | 22,966 | — | 22,966 | — | — | ||||||||||||||||||||||||
Other | 391 | — | — | 391 | — | 391 | — | — | ||||||||||||||||||||||||
Financial assets designated to be measured at FVPL | ||||||||||||||||||||||||||||||||
Debt securities | ||||||||||||||||||||||||||||||||
Japanese national government bonds | — | 51,664 | — | 51,664 | 10,011 | — | 41,653 | — | ||||||||||||||||||||||||
Japanese local government bonds | — | 28,604 | — | 28,604 | 6,822 | — | 21,782 | — | ||||||||||||||||||||||||
Japanese corporate bonds | — | 22,227 | — | 22,227 | 2,607 | — | 19,620 | — | ||||||||||||||||||||||||
Foreign government bonds | — | 41,089 | — | 41,089 | 9,618 | — | 31,471 | — | ||||||||||||||||||||||||
Foreign corporate bonds | — | 103,159 | 546 | 103,705 | 19,798 | — | 83,907 | — | ||||||||||||||||||||||||
Financial assets required to be measured at FVOCI | ||||||||||||||||||||||||||||||||
Debt securities | ||||||||||||||||||||||||||||||||
Japanese national government bonds | — | 9,918,197 | — | 9,918,197 | — | — | 9,918,197 | — | ||||||||||||||||||||||||
Japanese local government bonds | — | 40,569 | — | 40,569 | 8,513 | — | 32,056 | — | ||||||||||||||||||||||||
Japanese corporate bonds | — | 698,188 | 34,569 | 732,757 | 12,167 | — | 720,590 | — | ||||||||||||||||||||||||
Foreign government bonds | — | 1,298,020 | — | 1,298,020 | 1,517 | — | 1,296,400 | 103 | ||||||||||||||||||||||||
Foreign corporate bonds | — | 175,670 | 14,541 | 190,211 | 58,010 | — | 131,544 | 657 | ||||||||||||||||||||||||
Securitized products | — | 33,383 | 10,290 | 43,673 | — | — | 43,673 | — | ||||||||||||||||||||||||
Financial assets designated to be measured at FVOCI | ||||||||||||||||||||||||||||||||
Equity securities | 10,432 | — | 47,233 | 57,665 | — | — | 2,907 | 54,758 | ||||||||||||||||||||||||
Total assets | 994,486 | 13,305,981 | 148,488 | 14,448,955 | 141,537 | 44,864 | 14,110,299 | 152,255 | ||||||||||||||||||||||||
Presentation in the consolidated statements of financial position | ||||||||||||||||||||||||||||||||
Level 1 | Level 2 | Level 3 | Total | Other financial liabilities (Current) | Other financial liabilities (Non-current) | |||||||||||||||||||||||||||
Liabilities: | ||||||||||||||||||||||||||||||||
Financial liabilities required to be measured at FVPL | ||||||||||||||||||||||||||||||||
Derivative liabilities | ||||||||||||||||||||||||||||||||
Interest rate contracts | — | 17,679 | — | 17,679 | 483 | 17,196 | ||||||||||||||||||||||||||
Foreign exchange contracts | 226 | 16,110 | — | 16,336 | 14,581 | 1,755 | ||||||||||||||||||||||||||
Equity contracts | 1,476 | — | — | 1,476 | 1,476 | — | ||||||||||||||||||||||||||
Other | 375 | — | — | 375 | 375 | — | ||||||||||||||||||||||||||
Contingent consideration | — | — | 5,666 | 5,666 | 2,640 | 3,026 | ||||||||||||||||||||||||||
Financial liabilities designated to be measured at FVPL | ||||||||||||||||||||||||||||||||
Redeemable noncontrolling interests | — | — | 7,767 | 7,767 | — | 7,767 | ||||||||||||||||||||||||||
Total liabilities | 2,077 | 33,789 | 13,433 | 49,299 | 19,555 | 29,744 | ||||||||||||||||||||||||||
F-38
SONY GROUP CORPORATION AND CONSOLIDATED SUBSIDIARIES
Yen in millions | ||||||||||||||||||||||||||||||||
March 31, 2021 | ||||||||||||||||||||||||||||||||
Presentation in the consolidated statements of financial position | ||||||||||||||||||||||||||||||||
Level 1 | Level 2 | Level 3 | Total | Investments and advances in the Financial Services segment (Current) | Other financial assets (Current) | Investments and advances in the Financial Services segment (Non-current) | Other financial assets (Non-current) | |||||||||||||||||||||||||
Assets: | ||||||||||||||||||||||||||||||||
Financial assets required to be measured at FVPL | ||||||||||||||||||||||||||||||||
Debt securities | ||||||||||||||||||||||||||||||||
Japanese national government bonds | — | 168,281 | — | 168,281 | — | — | 168,281 | — | ||||||||||||||||||||||||
Japanese local government bonds | — | 600 | — | 600 | — | — | 600 | — | ||||||||||||||||||||||||
Japanese corporate bonds | — | 14,386 | 62 | 14,448 | — | — | 14,386 | 62 | ||||||||||||||||||||||||
Foreign government bonds | 30,164 | 183,994 | — | 214,158 | — | — | 214,158 | — | ||||||||||||||||||||||||
Foreign corporate bonds | — | 21,297 | 213 | 21,510 | 5,434 | — | 15,863 | 213 | ||||||||||||||||||||||||
Securitized products | — | — | 6,142 | 6,142 | — | — | 6,142 | — | ||||||||||||||||||||||||
Investment funds | — | 564,447 | 37,254 | 601,701 | — | — | 592,305 | 9,396 | ||||||||||||||||||||||||
Equity securities | 1,555,620 | 22,290 | 3,172 | 1,581,082 | 13,425 | — | 1,384,672 | 182,985 | ||||||||||||||||||||||||
Derivative assets | ||||||||||||||||||||||||||||||||
Interest rate contracts | — | 12,788 | — | 12,788 | — | 50 | — | 12,738 | ||||||||||||||||||||||||
Foreign exchange contracts | 3 | 15,688 | — | 15,691 | — | 14,104 | — | 1,587 | ||||||||||||||||||||||||
Equity contracts | 241 | — | 10,176 | 10,417 | — | 5,278 | — | 5,139 | ||||||||||||||||||||||||
Other | 17 | — | — | 17 | — | 17 | — | — | ||||||||||||||||||||||||
Financial assets designated to be measured at FVPL | ||||||||||||||||||||||||||||||||
Debt securities | ||||||||||||||||||||||||||||||||
Japanese national government bonds | — | 65,988 | — | 65,988 | 21,021 | — | 44,967 | — | ||||||||||||||||||||||||
Japanese local government bonds | — | 26,724 | — | 26,724 | 12,088 | — | 14,636 | — | ||||||||||||||||||||||||
Japanese corporate bonds | — | 16,422 | — | 16,422 | 12,483 | — | 3,939 | — | ||||||||||||||||||||||||
Foreign government bonds | — | 17,174 | — | 17,174 | — | — | 17,174 | — | ||||||||||||||||||||||||
Foreign corporate bonds | — | 169,006 | — | 169,006 | 24,700 | — | 144,306 | — | ||||||||||||||||||||||||
Financial assets required to be measured at FVOCI | ||||||||||||||||||||||||||||||||
Debt securities | ||||||||||||||||||||||||||||||||
Japanese national government bonds | — | 9,797,091 | — | 9,797,091 | — | — | 9,797,091 | — | ||||||||||||||||||||||||
Japanese local government bonds | — | 47,339 | — | 47,339 | 17,536 | — | 29,803 | — | ||||||||||||||||||||||||
Japanese corporate bonds | — | 723,335 | 93,288 | 816,623 | 12,497 | — | 804,126 | — | ||||||||||||||||||||||||
Foreign government bonds | — | 1,185,639 | — | 1,185,639 | — | — | 1,185,528 | 111 | ||||||||||||||||||||||||
Foreign corporate bonds | — | 195,992 | 18,066 | 214,058 | 88,412 | — | 125,243 | 403 | ||||||||||||||||||||||||
Securitized products | — | 44,105 | 9,402 | 53,507 | — | — | 53,507 | — | ||||||||||||||||||||||||
Other | — | 116 | — | 116 | — | — | 101 | 15 | ||||||||||||||||||||||||
Financial assets designated to be measured at FVOCI | ||||||||||||||||||||||||||||||||
Equity securities | 241,577 | — | 104,541 | 346,118 | — | — | 5,754 | 340,364 | ||||||||||||||||||||||||
Total assets | 1,827,622 | 13,292,702 | 282,316 | 15,402,640 | 207,596 | 19,449 | 14,622,582 | 553,013 | ||||||||||||||||||||||||
Presentation in the consolidated statements of financial position | ||||||||||||||||||||||||||||||||
Level 1 | Level 2 | Level 3 | Total | Other financial liabilities (Current) | Other financial liabilities (Non-current) | |||||||||||||||||||||||||||
Liabilities: | ||||||||||||||||||||||||||||||||
Financial liabilities required to be measured at FVPL | ||||||||||||||||||||||||||||||||
Derivative liabilities | ||||||||||||||||||||||||||||||||
Interest rate contracts | — | 14,962 | — | 14,962 | 694 | 14,268 | ||||||||||||||||||||||||||
Foreign exchange contracts | 128 | 20,105 | — | 20,233 | 20,233 | — | ||||||||||||||||||||||||||
Equity contracts | 986 | 4,171 | — | 5,157 | 5,157 | — | ||||||||||||||||||||||||||
Other | 2 | — | — | 2 | 2 | — | ||||||||||||||||||||||||||
Contingent consideration | — | — | 6,161 | 6,161 | 1,669 | 4,492 | ||||||||||||||||||||||||||
Financial liabilities designated to be measured at FVPL | ||||||||||||||||||||||||||||||||
Redeemable noncontrolling interests | — | — | 8,179 | 8,179 | 5,307 | 2,872 | ||||||||||||||||||||||||||
Total liabilities | 1,116 | 39,238 | 14,340 | 54,694 | 33,062 | 21,632 | ||||||||||||||||||||||||||
F-39
SONY GROUP CORPORATION AND CONSOLIDATED SUBSIDIARIES
Yen in millions | ||||||||||||||||||||||||||||||||
March 31, 2022 | ||||||||||||||||||||||||||||||||
Presentation in the consolidated statements of financial position | ||||||||||||||||||||||||||||||||
Level 1 | Level 2 | Level 3 | Total | Investments and advances in the Financial Services segment (Current) | Other financial assets (Current) | Investments and advances in the Financial Services segment (Non-current) | Other financial assets (Non-current) | |||||||||||||||||||||||||
Assets: | ||||||||||||||||||||||||||||||||
Financial assets required to be measured at FVPL | ||||||||||||||||||||||||||||||||
Debt securities | ||||||||||||||||||||||||||||||||
Japanese national government bonds | — | 368,273 | — | 368,273 | — | — | 368,273 | — | ||||||||||||||||||||||||
Japanese local government bonds | — | 600 | — | 600 | — | — | 600 | — | ||||||||||||||||||||||||
Japanese corporate bonds | — | 15,350 | 18 | 15,368 | — | — | 15,317 | 51 | ||||||||||||||||||||||||
Foreign government bonds | 29,237 | 185,238 | — | 214,475 | — | — | 214,475 | — | ||||||||||||||||||||||||
Foreign corporate bonds | — | — | 117 | 117 | — | — | — | 117 | ||||||||||||||||||||||||
Securitized products | — | — | 3,713 | 3,713 | — | — | 3,713 | — | ||||||||||||||||||||||||
Investment funds | — | 377,004 | 48,520 | 425,524 | 3 | — | 409,676 | 15,845 | ||||||||||||||||||||||||
Equity securities | 1,906,244 | 9,349 | 3,217 | 1,918,810 | — | — | 1,798,536 | 120,274 | ||||||||||||||||||||||||
Derivative assets | ||||||||||||||||||||||||||||||||
Interest rate contracts | — | 26,795 | — | 26,795 | — | 32 | — | 26,763 | ||||||||||||||||||||||||
Foreign exchange contracts | — | 30,204 | — | 30,204 | — | 28,147 | — | 2,057 | ||||||||||||||||||||||||
Equity contracts | — | — | 4,024 | 4,024 | — | 3,669 | — | 355 | ||||||||||||||||||||||||
Financial assets designated to be measured at FVPL | ||||||||||||||||||||||||||||||||
Debt securities | ||||||||||||||||||||||||||||||||
Japanese national government bonds | — | 48,711 | — | 48,711 | 4,002 | — | 44,709 | — | ||||||||||||||||||||||||
Japanese local government bonds | — | 26,612 | — | 26,612 | 5,315 | — | 21,297 | — | ||||||||||||||||||||||||
Japanese corporate bonds | — | 7,228 | — | 7,228 | 3,907 | — | 3,321 | — | ||||||||||||||||||||||||
Foreign government bonds | — | 17,598 | — | 17,598 | 1,466 | — | 16,132 | — | ||||||||||||||||||||||||
Foreign corporate bonds | — | 163,395 | 3,625 | 167,020 | 33,690 | — | 133,330 | — | ||||||||||||||||||||||||
Financial assets required to be measured at FVOCI | ||||||||||||||||||||||||||||||||
Debt securities | ||||||||||||||||||||||||||||||||
Japanese national government bonds | — | 9,667,158 | — | 9,667,158 | — | — | 9,667,158 | — | ||||||||||||||||||||||||
Japanese local government bonds | — | 36,369 | — | 36,369 | 12,435 | — | 23,934 | — | ||||||||||||||||||||||||
Japanese corporate bonds | — | 746,223 | 154,245 | 900,468 | 10,257 | — | 890,211 | — | ||||||||||||||||||||||||
Foreign government bonds | — | 1,353,394 | — | 1,353,394 | — | — | 1,353,277 | 117 | ||||||||||||||||||||||||
Foreign corporate bonds | — | 318,699 | 20,837 | 339,536 | 65,000 | — | 274,131 | 405 | ||||||||||||||||||||||||
Securitized products | — | 41,982 | 39,859 | 81,841 | — | — | 81,841 | — | ||||||||||||||||||||||||
Financial assets designated to be measured at FVOCI | ||||||||||||||||||||||||||||||||
Equity securities | 106,499 | — | 205,509 | 312,008 | — | — | 8,016 | 303,992 | ||||||||||||||||||||||||
Total assets | 2,041,980 | 13,440,182 | 483,684 | 15,965,846 | 136,075 | 31,848 | 15,327,947 | 469,976 | ||||||||||||||||||||||||
Presentation in the consolidated statements of financial position | ||||||||||||||||||||||||||||||||
Level 1 | Level 2 | Level 3 | Total | Other financial liabilities (Current) | Other financial liabilities (Non-current) | |||||||||||||||||||||||||||
Liabilities: | ||||||||||||||||||||||||||||||||
Financial liabilities required to be measured at FVPL | ||||||||||||||||||||||||||||||||
Derivative liabilities | ||||||||||||||||||||||||||||||||
Interest rate contracts | — | 7,530 | — | 7,530 | 471 | 7,059 | ||||||||||||||||||||||||||
Foreign exchange contracts | — | 36,582 | — | 36,582 | 36,582 | — | ||||||||||||||||||||||||||
Equity contracts | 11,903 | 16,105 | — | 28,008 | 28,008 | — | ||||||||||||||||||||||||||
Contingent consideration | — | — | 21,552 | 21,552 | 1,475 | 20,077 | ||||||||||||||||||||||||||
Financial liabilities designated to be measured at FVPL | ||||||||||||||||||||||||||||||||
Redeemable noncontrolling interests | — | — | 34,995 | 34,995 | 2,435 | 32,560 | ||||||||||||||||||||||||||
Total liabilities | 11,903 | 60,217 | 56,547 | 128,667 | 68,971 | 59,696 | ||||||||||||||||||||||||||
Cash and cash equivalents are excluded from the tables above. Refer to Note 27.
Transfers of debt securities from Level 2 to Level 1 were 900 million yen and 1,953 million yen for the fiscal years ended March 31, 2021 and 2022, respectively, as quoted prices in active markets for certain debt securities became available. Transfers of debt securities from Level 1 to Level 2 were 904 million yen and
F-40
SONY GROUP CORPORATION AND CONSOLIDATED SUBSIDIARIES
2,523 million yen for the fiscal years ended March 31, 2021 and 2022, respectively, as quoted prices in active markets for certain debt securities were not available.
Transfers of equity securities from Level 2 to Level 1 were 12,276 million yen for the fiscal year ended March 31, 2022 as quoted prices in active markets for certain equity securities became available. There were 0 transfers of equity securities from Level 2 to Level 1 for the fiscal year ended March 31, 2021.
The valuation techniques used to measure the fair value of assets and liabilities classified as Level 3, significant unobservable inputs, and their range are as follows:
Valuation technique(s) | Significant unobservable inputs | Range | ||||||||||||||||||
April 1, 2020 | March 31, 2021 | March 31, 2022 | ||||||||||||||||||
Financial assets required to be measured at FVOCI | ||||||||||||||||||||
Debt securities | ||||||||||||||||||||
Japanese corporate bonds | Discounted cash flow | | Credit spread * | 37bp-67bp | 27bp-65bp | 26bp-67bp | ||||||||||||||
Foreign corporate bonds | 40bp-280bp | 20bp-130bp | 0bp-170bp | |||||||||||||||||
Securitized products | 110bp-150bp | 100bp-150bp | 100bp-160bp | |||||||||||||||||
| * | bp = basis point |
The decrease (increase) in fair value is the result of higher (lower) credit spreads.
For the above assets classified as Level 3, the fair value would not change significantly, even if one or more of the significant unobservable inputs are changed to reflect reasonably possible alternative assumptions.
The changes in fair value of Level 3 assets and liabilities for the fiscal years ended March 31, 2021 and 2022 are as follows:
Yen in millions | ||||||||||||||||||||||||||||||||||||
Fiscal year ended March 31, 2021 | ||||||||||||||||||||||||||||||||||||
Total gains (losses) *1 | ||||||||||||||||||||||||||||||||||||
Beginning balance | Net income *2 | Other comprehensive income *3 | Purchases | Sales and settlements | Transfers to Level 3 *4 | Transfers out of Level 3 *5 | Other | Ending balance | ||||||||||||||||||||||||||||
Assets: | ||||||||||||||||||||||||||||||||||||
Financial assets required to be measured at FVPL | ||||||||||||||||||||||||||||||||||||
Debt securities | ||||||||||||||||||||||||||||||||||||
Japanese corporate bonds | 30 | — | — | 32 | — | — | — | — | 62 | |||||||||||||||||||||||||||
Foreign corporate bonds | 683 | — | — | 101 | — | — | — | (571 | ) | 213 | ||||||||||||||||||||||||||
Securitized products | 5,787 | — | — | 2,761 | (2,406 | ) | — | — | — | 6,142 | ||||||||||||||||||||||||||
Investment funds | 27,791 | 66 | 62 | 18,232 | (8,566 | ) | — | — | (331 | ) | 37,254 | |||||||||||||||||||||||||
Equity securities | 2,937 | 2,081 | 26 | 1,446 | (2,818 | ) | — | (500 | ) | — | 3,172 | |||||||||||||||||||||||||
Derivative assets | ||||||||||||||||||||||||||||||||||||
Equity contracts | 4,081 | 5,554 | 541 | — | — | — | — | — | 10,176 | |||||||||||||||||||||||||||
Financial assets designated to be measured at FVPL | ||||||||||||||||||||||||||||||||||||
Debt securities | ||||||||||||||||||||||||||||||||||||
Foreign corporate bonds | 546 | (19 | ) | — | — | (527 | ) | — | — | — | — | |||||||||||||||||||||||||
Financial assets required to be measured at FVOCI | ||||||||||||||||||||||||||||||||||||
Debt securities | ||||||||||||||||||||||||||||||||||||
Japanese corporate bonds | 34,569 | — | (5,580 | ) | 64,299 | — | — | — | — | 93,288 | ||||||||||||||||||||||||||
Foreign corporate bonds | 14,541 | 168 | 365 | 6,136 | (7,304 | ) | 4,544 | — | (384 | ) | 18,066 | |||||||||||||||||||||||||
Securitized products | 10,290 | 761 | 75 | — | (3,900 | ) | 2,176 | — | — | 9,402 | ||||||||||||||||||||||||||
Financial assets designated to be measured at FVOCI | ||||||||||||||||||||||||||||||||||||
Equity securities | 47,233 | — | 25,829 | 35,999 | (1,053 | ) | — | (4,559 | ) | 1,092 | 104,541 | |||||||||||||||||||||||||
Liabilities: | ||||||||||||||||||||||||||||||||||||
Financial liabilities required to be measured at FVPL | ||||||||||||||||||||||||||||||||||||
Contingent consideration | 5,666 | 16 | 101 | 2,041 | (1,532 | ) | — | — | (131 | ) | 6,161 | |||||||||||||||||||||||||
Financial liabilities designated to be measured at FVPL | ||||||||||||||||||||||||||||||||||||
Redeemable noncontrolling interests | 7,767 | 783 | 655 | 1,262 | (2,288 | ) | — | — | — | 8,179 | ||||||||||||||||||||||||||
F-4
1
SONY GROUP CORPORATION AND CONSOLIDATED SUBSIDIARIES
Yen in millions | ||||||||||||||||||||||||||||||||||||
Fiscal year ended March 31, 2022 | ||||||||||||||||||||||||||||||||||||
Total gains (losses) *1 | ||||||||||||||||||||||||||||||||||||
Beginning balance | Net income *2 | Other comprehensive income *3 | Purchases | Sales and settlements | Transfers to Level 3 *4 | Transfers out of Level 3 *5 | Other | Ending balance | ||||||||||||||||||||||||||||
Assets: | ||||||||||||||||||||||||||||||||||||
Financial assets required to be measured at FVPL | ||||||||||||||||||||||||||||||||||||
Debt securities | ||||||||||||||||||||||||||||||||||||
Japanese corporate bonds | 62 | — | — | 20 | — | — | (34 | ) | (30 | ) | 18 | |||||||||||||||||||||||||
Foreign corporate bonds | 213 | 5 | — | 10 | — | — | — | (111 | ) | 117 | ||||||||||||||||||||||||||
Securitized products | 6,142 | — | — | — | (2,429 | ) | — | — | — | 3,713 | ||||||||||||||||||||||||||
Investment funds | 37,254 | 5,678 | 394 | 22,079 | (16,885 | ) | — | — | — | 48,520 | ||||||||||||||||||||||||||
Equity securities | 3,172 | (395 | ) | (15 | ) | 477 | (22 | ) | — | — | — | 3,217 | ||||||||||||||||||||||||
Derivative assets | ||||||||||||||||||||||||||||||||||||
Equity contracts | 10,176 | (6,629 | ) | 477 | — | — | — | — | — | 4,024 | ||||||||||||||||||||||||||
Financial assets designated to be measured at FVPL | ||||||||||||||||||||||||||||||||||||
Debt securities | ||||||||||||||||||||||||||||||||||||
Foreign corporate bonds | — | 337 | — | — | — | 3,288 | — | — | 3,625 | |||||||||||||||||||||||||||
Financial assets required to be measured at FVOCI | ||||||||||||||||||||||||||||||||||||
Debt securities | ||||||||||||||||||||||||||||||||||||
Japanese corporate bonds | 93,288 | (1 | ) | (13,006 | ) | 73,964 | — | — | — | — | 154,245 | |||||||||||||||||||||||||
Foreign corporate bonds | 18,066 | 700 | (5 | ) | 12,000 | (9,868 | ) | — | — | (56 | ) | 20,837 | ||||||||||||||||||||||||
Securitized products | 9,402 | 279 | (82 | ) | 41,763 | (10,625 | ) | 3,166 | (4,044 | ) | — | 39,859 | ||||||||||||||||||||||||
Financial assets designated to be measured at FVOCI | ||||||||||||||||||||||||||||||||||||
Equity securities | 104,541 | — | 25,614 | 89,274 | (5,825 | ) | 63 | (7,884 | ) | (274 | ) | 205,509 | ||||||||||||||||||||||||
Liabilities: | ||||||||||||||||||||||||||||||||||||
Financial liabilities required to be measured at FVPL | ||||||||||||||||||||||||||||||||||||
Contingent consideration | 6,161 | 297 | 1,645 | 15,221 | (1,762 | ) | — | — | (10 | ) | 21,552 | |||||||||||||||||||||||||
Financial liabilities designated to be measured at FVPL | ||||||||||||||||||||||||||||||||||||
Redeemable noncontrolling interests | 8,179 | 2,008 | 2,978 | 27,240 | (5,285 | ) | — | — | (125 | ) | 34,995 | |||||||||||||||||||||||||
| *1 | For liability items, gains are presented as negative and losses are presented as positive. |
| *2 | Gains (losses) recognized in net income are included in financial services revenue, financial income and financial expenses in the consolidated statements of income. |
| *3 | Gains (losses) recognized in other comprehensive income are included in changes in equity instruments measured at fair value through other comprehensive income, changes in debt instruments measured at fair value through other comprehensive income and exchange differences on translating foreign operations in the consolidated statements of comprehensive income. |
| *4 | Certain debt and equity securities were transferred to Level 3 because differences between the fair value determined by indicative quotes from dealers and the fair value determined by internally developed prices became significant and the observability of the inputs used decreased. |
| *5 | Certain debt and equity securities were transferred from Level 3 because observable market data became available. |
F-42
SONY GROUP CORPORATION AND CONSOLIDATED SUBSIDIARIES
The changes in unrealized gains (losses) recognized in net income for Level 3 assets and liabilities held as of March 31, 2021 and 2022 are as follows:
Yen in millions | ||||||||
Fiscal year ended March 31 | ||||||||
2021 | 2022 | |||||||
Assets: | ||||||||
Financial assets required to be measured at FVPL | ||||||||
Debt securities | ||||||||
Foreign corporate bonds | — | 5 | ||||||
Investment funds | (914 | ) | 4,562 | |||||
Equity securities | (652 | ) | 98 | |||||
Derivative assets | ||||||||
Equity contracts | 5,554 | (6,629 | ) | |||||
Financial assets designated to be measured at FVPL | ||||||||
Debt securities | ||||||||
Foreign corporate bonds | — | 337 | ||||||
Financial assets required to be measured at FVOCI | ||||||||
Debt securities | ||||||||
Foreign corporate bonds | 168 | 700 | ||||||
Securitized products | 761 | 238 | ||||||
Liabilities: | ||||||||
Financial liabilities required to be measured at FVPL | ||||||||
Contingent consideration | — | (513 | ) | |||||
Financial liabilities designated to be measured at FVPL | ||||||||
Redeemable noncontrolling interests | (783 | ) | (1,878 | ) | ||||
Gains (losses) recognized in net income are included in financial services revenue, financial income and financial expenses in the consolidated statements of income.
Sony generally elects to designate investments in equity instruments held to promote its businesses and to maintain and enhance the business relationship as financial assets measured at fair value through other comprehensive income based on the purposes of holding the investments.
Equity instruments measured at fair value through other comprehensive income as of April 1, 2020, March 31, 2021 and 2022 comprise the following:
Yen in millions | ||||||||||||
April 1 | March 31 | |||||||||||
2020 | 2021 | 2022 | ||||||||||
Marketable equity instruments | 10,432 | 241,577 | 106,499 | |||||||||
Non-marketable equity instruments | 47,233 | 104,541 | 205,509 | |||||||||
Total | 57,665 | 346,118 | 312,008 | |||||||||
Significant marketable equity instruments measured at fair value through other comprehensive income as of April 1, 2020, March 31, 2021 and 2022 are as follows:
Yen in millions | ||||||||||||
April 1 | March 31 | |||||||||||
2020 | 2021 | 2022 | ||||||||||
Bilibili Inc. | — | 205,177 | 54,162 | |||||||||
KADOKAWA Corporation | — | 6,110 | 9,161 | |||||||||
Toei Animation Co., Ltd. | 3,411 | 8,851 | 8,371 | |||||||||
Safie Inc. | — | — | 7,122 | |||||||||
ClearView Wealth Limited | 1,472 | 4,228 | 6,987 | |||||||||
Devolver Digital, Inc. | — | — | 5,773 | |||||||||
Chicken Soup for the Soul Entertainment, Inc. | — | 4,717 | 5,521 | |||||||||
F-4
3
SONY GROUP CORPORATION AND CONSOLIDATED SUBSIDIARIES
The balances of the
non-marketable
instruments measured at fair value through other comprehensive income by major sector categories as of April 1, 2020, March 31, 2021 and 2022 are as follows:Yen in millions | ||||||||||||
April 1 | March 31 | |||||||||||
2020 | 2021 | 2022 | ||||||||||
Entertainment *1 | 7,634 | 52,458 | 148,283 | |||||||||
Manufacturing *2 | 24,806 | 33,579 | 35,406 | |||||||||
Information technology, Communication and Service *3 | 12,363 | 16,416 | 20,327 | |||||||||
| *1 | Major investments included were as follows: |
April 1, 2020: Crackle Plus, LLC
March 31, 2021: Epic Games, Inc.
March 31, 2022: Epic Games, Inc. and Scopely, Inc.
| *2 | Major investments included Nichia Corporation. |
| *3 | Major investments included MBS Media Holdings, Inc. |
In order to enhance the efficiency of using assets held effectively, Sony derecognizes equity instruments measured at fair value through other comprehensive income upon the sale of the investment. Information relating to investments derecognized during the fiscal years ended March 31, 2021 and 2022 is as follows:
Yen in millions | ||||||||
Fiscal year ended March 31 | ||||||||
2021 | 2022 | |||||||
Fair value at derecognition | 2,644 | 11,015 | ||||||
Cumulative amount recognized in other comprehensive income, net of tax * | (6,085 | ) | 5,784 | |||||
Dividend received | 5 | 70 | ||||||
| * | The cumulative amount recognized in other comprehensive income, net of tax , was transferred to retained earnings upon derecognition of the equity instruments. |
(3) | Financial instruments measured at amortized cost |
The fair values by fair value hierarchy level of certain financial instruments that are measured at amortized cost as of April 1, 2020, March 31, 2021 and 2022 are summarized as follows:
Yen in millions | ||||||||||||||||||||
April 1, 2020 | ||||||||||||||||||||
Fair value | Carrying amount | |||||||||||||||||||
Level 1 | Level 2 | Level 3 | Total | Total | ||||||||||||||||
Assets: | ||||||||||||||||||||
Debt securities | ||||||||||||||||||||
Japanese national government bonds | — | 94,062 | — | 94,062 | 72,064 | |||||||||||||||
Japanese local government bonds | — | 2,835 | — | 2,835 | 2,503 | |||||||||||||||
Japanese corporate bonds | — | 4,166 | — | 4,166 | 3,634 | |||||||||||||||
Foreign corporate bonds | — | 105 | — | 105 | 98 | |||||||||||||||
Securitized products | — | — | 160,760 | 160,760 | 174,772 | |||||||||||||||
Other | — | 41 | 2,335 | 2,376 | 2,376 | |||||||||||||||
Housing loans in the banking business | — | 2,161,432 | — | 2,161,432 | 1,919,219 | |||||||||||||||
Total assets | — | 2,262,641 | 163,095 | 2,425,736 | 2,174,666 | |||||||||||||||
Liabilities: | ||||||||||||||||||||
Long-term debt including the current portion | — | 605,444 | 25,401 | 630,845 | 631,716 | |||||||||||||||
Total liabilities | — | 605,444 | 25,401 | 630,845 | 631,716 | |||||||||||||||
F-44
SONY GROUP CORPORATION AND CONSOLIDATED SUBSIDIARIES
Yen in millions | ||||||||||||||||||||
March 31, 2021 | ||||||||||||||||||||
Fair value | Carrying amount | |||||||||||||||||||
Level 1 | Level 2 | Level 3 | Total | Total | ||||||||||||||||
Assets: | ||||||||||||||||||||
Debt securities | ||||||||||||||||||||
Japanese national government bonds | — | 87,705 | — | 87,705 | 71,420 | |||||||||||||||
Japanese local government bonds | — | 2,010 | — | 2,010 | 1,716 | |||||||||||||||
Japanese corporate bonds | — | 3,883 | — | 3,883 | 3,537 | |||||||||||||||
Foreign corporate bonds | — | 6,032 | — | 6,032 | 5,907 | |||||||||||||||
Securitized products | — | — | 211,229 | 211,229 | 211,271 | |||||||||||||||
Other | — | 41 | 4,902 | 4,943 | 4,943 | |||||||||||||||
Housing loans in the banking business | — | — | 2,559,073 | 2,559,073 | 2,342,728 | |||||||||||||||
Total assets | — | 99,671 | 2,775,204 | 2,874,875 | 2,641,522 | |||||||||||||||
Liabilities: | ||||||||||||||||||||
Long-term debt including the current portion | — | 794,479 | 55,451 | 849,930 | 857,019 | |||||||||||||||
Total liabilities | — | 794,479 | 55,451 | 849,930 | 857,019 | |||||||||||||||
Yen in millions | ||||||||||||||||||||
March 31, 2022 | ||||||||||||||||||||
Fair value | Carrying amount | |||||||||||||||||||
Level 1 | Level 2 | Level 3 | Total | Total | ||||||||||||||||
Assets: | ||||||||||||||||||||
Debt securities | ||||||||||||||||||||
Japanese national government bonds | — | 86,622 | — | 86,622 | 75,634 | |||||||||||||||
Japanese local government bonds | — | 1,963 | — | 1,963 | 1,717 | |||||||||||||||
Japanese corporate bonds | — | 3,727 | — | 3,727 | 3,583 | |||||||||||||||
Foreign corporate bonds | — | 5,121 | — | 5,121 | 5,047 | |||||||||||||||
Securitized products | — | — | 269,376 | 269,376 | 271,308 | |||||||||||||||
Other | — | 41 | 909 | 950 | 949 | |||||||||||||||
Housing loans in the banking business | — | — | 2,837,349 | 2,837,349 | 2,752,985 | |||||||||||||||
Total assets | — | 97,474 | 3,107,634 | 3,205,108 | 3,111,223 | |||||||||||||||
Liabilities: | ||||||||||||||||||||
Long-term debt including the current portion | — | 841,249 | 60,873 | 902,122 | 909,706 | |||||||||||||||
Total liabilities | — | 841,249 | 60,873 | 902,122 | 909,706 | |||||||||||||||
The table above does not include financial instruments measured at amortized cost whose carrying amounts approximate their fair values mainly due to their short-term nature.
The fair values of long-term debt, including the current portion classified as Level 2, were estimated mainly based on discounted future cash flows using Sony’s current rates for similar liabilities.
Financial instruments classified as Level 3 mainly include housing loans in the banking business, securitized products and certain bonds issued by Sony. In determining the fair value of such financial instruments, Sony uses the present value of expected cash flows based on risk-free interest rate yield curves with certain credit risk. Transfers of housing loans in the banking business to Level 3 occurred primarily due to increases in the significance of unobservable inputs during the fiscal year ended March 31, 2021.
(4) | Income and expenses related to financial instruments in the Financial Services segment |
Income and expenses related to financial instruments in the Financial Services segment are recorded in financial services revenue and financial services expenses in the consolidated statements of income. Income and expenses related to financial instruments in all segments other than Financial Services segment are recorded in Financial income and Financial expenses in the consolidated statements of income. Refer to Note 24.
F-45
SONY GROUP CORPORATION AND CONSOLIDATED SUBSIDIARIES
The breakdown of income and expenses related to financial instruments in the Financial Services segment for the fiscal years ended March 31, 2021 and 2022 is as follows:
Yen in millions | ||||||||||||||||||||||||||||
March 31, 2021 | ||||||||||||||||||||||||||||
Financial instruments required to be measured at FVPL | Financial instruments designated to be measured at FVPL | Financial assets measured at AC | Financial liabilities measured at AC | Debt instruments measured at FVOCI | Equity instruments measured at FVOCI | Total | ||||||||||||||||||||||
Income | ||||||||||||||||||||||||||||
Net gains (losses) recognized in profit or loss | 412,957 | 4,936 | (14,069 | ) | (5,569 | ) | 51,194 | — | 449,449 | |||||||||||||||||||
Total interest income | — | — | 26,141 | — | 169,072 | — | 195,213 | |||||||||||||||||||||
Dividend income | — | — | — | — | — | 2 | 2 | |||||||||||||||||||||
Expenses | ||||||||||||||||||||||||||||
Total interest expenses | — | — | — | 4,577 | — | — | 4,577 | |||||||||||||||||||||
Impairment losses (gains) on financial assets | — | — | (15 | ) | — | 18 | — | 3 | ||||||||||||||||||||
Yen in millions | ||||||||||||||||||||||||||||
March 31, 2022 | ||||||||||||||||||||||||||||
Financial instruments required to be measured at FVPL | Financial instruments designated to be measured at FVPL | Financial assets measured at AC | Financial liabilities measured at AC | Debt instruments measured at FVOCI | Equity instruments measured at FVOCI | Total | ||||||||||||||||||||||
Income | ||||||||||||||||||||||||||||
Net gains (losses) recognized in profit or loss | 225,922 | (6,673 | ) | 14,765 | (49,110 | ) | 148,813 | — | 333,717 | |||||||||||||||||||
Total interest income | — | — | 32,839 | — | 180,006 | — | 212,845 | |||||||||||||||||||||
Dividend income | — | — | — | — | — | 85 | 85 | |||||||||||||||||||||
Expenses | ||||||||||||||||||||||||||||
Total interest expenses | — | — | — | 3,838 | — | — | 3,838 | |||||||||||||||||||||
Impairment losses (gains) on financial assets | — | — | 19 | — | 24 | — | 43 | |||||||||||||||||||||
6. | Financial risk management |
(1) | Capital management |
Sony uses Return on Equity (“ROE”) as an indicator for capital management.
March 31 | ||||||||
2021 | 2022 | |||||||
ROE* | 17.8 | % | 12.8 | % | ||||
| * | ROE is calculated using equity attributable to Sony Group Corporation’s stockholders. |
Sony manages capital separately for the Financial Services segment and the Sony Group without the Financial Services segment because certain subsidiaries in the Financial Services segment are subject to the below restrictions. Sony also refers to the ratio of stockholders’ equity to total assets of the Sony Group without the Financial Services segment to ensure financial soundness.
The subsidiaries in the Financial Services segment are required to maintain the capital adequacy ratio and net assets at a certain level or higher based on the Insurance Business Act and the Banking Act in Japan. Material requirements which the subsidiaries in the Financial Services segment are subject to are as follows:
Insurance business: Maintain solvency margin ratio
The life insurance subsidiary and the
non-life
insurance subsidiary have maintained a high solvency margin ratio, relative to the Japanese domestic minimum solvency margin ratio requirements.F-46
SONY GROUP CORPORATION AND CONSOLIDATED SUBSIDIARIES
Banking business: Maintain capital adequacy ratio
The banking subsidiary has maintained a capital adequacy ratio relative to the Japanese domestic criteria.
Lending and borrowing between subsidiaries in the Financial
Services
segment and the other companies within Sony Group is strictly limited. The carrying amounts of total assets of Sony Financial Group Inc. (“SFGI”) as of April 1, 2020, March 31, 2021 and 2022 are 17,933,587 million yen, 19,339,517 million yen and 20,974,027 million yen, respectively. Total liabilities of SFGI as of April 1, 2020, March 31, 2021 and 2022 are 14,876,992 million yen, 16,408,036 million yen and 18,392,874 million yen, respectively. On October 1, 2021, SFGI changed its company name from Sony Financial Holdings Inc. (“SFH”).
(2) | Interest rate risk |
For interest rate risk inherent in the insurance business, which is included in the Financial Services segment, refer to Note 13. For interest rate risk inherent in the banking business, which is included in the Financial Services segment, refer to (7) Market risks for subsidiary in the banking business.
Risk management policy and exposure
Interest rate risk is the risk the fair value of a financial instrument or future cash flows of the financial instrument will fluctuate because of changes in market interest rates.
Sony without the Financial Services segment is exposed to interest rate risk that is mainly related to its liabilities such as short-term borrowings and long-term debt as well as bonds. The amount of interest will be affected by changes in market interest rates; therefore, Sony is exposed to the interest rate risk that the future cash outflows for interest payments will fluctuate.
Sony raises funds by issuing fixed-rate bonds in order to avoid an increase in future interest payments that is mainly resulting from an increase in interest rates.
Also, Sony utilizes interest rate swap agreements to reduce funding costs, to diversify sources of funding, and to hedge the downside risk on borrowings and debt securities resulting from unfavorable fluctuations of interest rates and currency exchange rates, and from changes in the fair value of financial instruments. Therefore, the interest risk associated with cash flows of Sony without the Financial Services segment is not significant.
(3) | Price risk |
For price risk inherent in the insurance business, which is included in the Financial Services segment, refer to Note 13. For price risk inherent in the banking business, which is included in the Financial Services segment, refer to (7) Market risks for a subsidiary in the banking business.
Risk management policy and exposure
Sony is exposed to securities price risk inherent in holding of equities in other entities in Japan and overseas countries. Sony periodically assesses fair values of equity instruments and the financial conditions of the issuers of such equity instruments, and reviews its portfolio on a regular basis.
Price sensitivity analysis
The table below shows the effects on income before income taxes and other comprehensive income (before considering the tax effects) as of April 1, 2020, March 31, 2021 and 2022 if market prices of marketable equity instruments (e.g., stocks) had decreased by 10%.
Yen in millions | ||||||||||||
April 1 | March 31 | |||||||||||
2020 | 2021 | 2022 | ||||||||||
Income before income taxes | (8,439 | ) | (17,930 | ) | (11,604 | ) | ||||||
Other comprehensive income (before considering the tax effects) | (769 | ) | (23,598 | ) | (9,871 | ) | ||||||
F-47
SONY GROUP CORPORATION AND CONSOLIDATED SUBSIDIARIES
(4) | Liquidity risk |
For liquidity risk inherent in the insurance business, which is included in the Financial Services segment, refer to Note 13. This section does not include information regarding the insurance business other than maturity analysis for financial liabilities.
Risk management policy
The description below covers basic financial policy and figures for Sony’s consolidated operations except for the Financial Services segment and certain subsidiaries, which secure liquidity on their own. Furthermore, the banking business in the Financial Services segment is described separately at the end of this section.
Liquidity Management and Market Access
An important financial objective of Sony is to maintain the strength of its financial condition, while securing adequate liquidity for business activities. Sony defines its liquidity sources as the amount of cash and cash equivalents (“cash balance”) (excluding restrictions on capital transfers mainly due to national regulations) and the unused amount of committed lines of credit. Funding requirements that arise from maintaining liquidity are principally covered by cash flow from operating and investing activities (including asset sales) and by the available cash balance; however, Sony also raises funds as needed from financial and capital markets through means such as corporate bonds, commercial paper (“CP”) and bank loans. Sony Group Corporation, Sony Global Treasury Services Plc (“SGTS”), a finance subsidiary in the U.K. and Sony Capital Corporation (“SCC”), a finance subsidiary in the U.S., maintain CP programs with access to the Japanese, U.S. and European CP markets. The borrowing limits under these CP programs, translated into yen, were 1,111.6 billion yen in total for Sony Group Corporation, SGTS and SCC as of March 31, 2022. There were 0 amounts outstanding under the CP programs as of March 31, 2022. If disruption and volatility occur in financial and capital markets and Sony becomes unable to raise sufficient funds from these sources, Sony may also draw down funds from contractually committed lines of credit from various financial institutions. Sony has a total, translated into yen, of 611.4 billion yen in unused committed lines of credit, as of March 31, 2022. Details of those committed lines of credit are: a 275.0 billion yen committed line of credit contracted with a syndicate of Japanese banks, a 1.7 billion U.S. dollar multicurrency committed line of credit also contracted with a syndicate of Japanese banks and a 1,050 million U.S. dollar multi-currency committed line of credit contracted with a syndicate of foreign banks. Sony currently believes that it can sustain sufficient liquidity through access to committed lines of credit with financial institutions, together with its available cash balance, even in the event that financial and capital markets become illiquid. Sony considers one of management’s top priorities to be the maintenance of stable and appropriate credit ratings in order to ensure financial flexibility for liquidity and capital management and continued adequate access to sufficient funding resources in the financial and capital markets. However, in the event of a downgrade in Sony’s credit ratings, there are no financial covenants in any of Sony’s material financial agreements with financial institutions that would cause an acceleration of the obligation. Even though the cost of borrowing for some committed lines of credit could change according to Sony’s credit ratings, there are no financial covenants that would cause any impairment on the ability to draw down on unused facilities.
Cash Management
Sony manages its global cash management activities primarily through Sony Group Corporation in Japan, SCC in the U.S. and SGTS in other regions. The excess or shortage of cash at most of Sony’s subsidiaries is invested or funded by Sony Group Corporation, SGTS and SCC on a net basis, although Sony recognizes that fund transfers are limited in certain countries and geographic areas due to restrictions on capital transactions. In order to pursue more efficient cash management, cash surpluses among Sony’s subsidiaries are deposited with Sony Group Corporation, SGTS and SCC, and cash shortfalls among subsidiaries are covered by loans through Sony Group Corporation, SGTS and SCC, so that Sony can make use of excess cash balances and reduce third-party borrowings. Where local restrictions prevent an efficient intercompany transfer of funds, Sony’s intent is that cash balances remain outside of Sony Group Corporation, SGTS and SCC and that Sony meets its liquidity needs through ongoing cash flows, external borrowings, or both. Sony does not expect restrictions of capital transactions on amounts held outside of Japan to have a material effect on Sony’s overall liquidity, financial condition or results of operations.
F-48
SONY GROUP CORPORATION AND CONSOLIDATED SUBSIDIARIES
Banking business in the Financial Services segment
By formulating and conforming with liquidity risk management policies, the banking subsidiary manages a variety of liquidity risks. The subsidiary defines liquidity risk as cash flow risk and market liquidity risk. Cash flow risk is the risk associated with losses due to the subsidiary’s inability to make cash payments because of a failure to maintain sufficient cash reserves at settlement, as well as risks associated with losses if the subsidiary is forced to raise funds under unfavorable conditions in order to fulfill cash payment obligations. The levels of cash flow risks are classified into phases based on the degree of pressure, and methods of risk management and reporting are set out for each phase, while guidelines are formulated and reviewed as necessary. Market liquidity risk is the risk associated with losses due to the subsidiary’s inability to conduct market transactions, in particular due to an inability to unwind its market position at a given time, or due to the subsidiary being forced to complete transactions under unfavorable market conditions, due to market turmoil or other factors. To manage market liquidity risk, the subsidiary works to understand market liquidity conditions that pertain to the types of products it handles. The subsidiary formulates and revises guidelines on abasis, as necessary. To manage liquidity risk and ensure a robust liquidity buffer, the subsidiary carries out stress tests regularly. The subsidiary estimates potential cash outflow and determines the required buffer, if the liquidity stress scenario would happen. The liquidity buffer consists of highly liquid assets, such as cash and government bonds, which can be immediately converted to cash even in a liquidity crisis. The aforementioned liquidity risk management is carried out by the risk management division. The division periodically reports risk management conditions to the banking subsidiary’s Board of Directors and Executive Committee. In addition, the banking subsidiary’s internal audit division conducts regular audits.
product-by-product
Maturity analysis
The following table summarizes Sony’s financial liabilities as of April 1, 2020, March 31, 2021 and 2022.
Yen in millions | ||||||||||||||||||||||||||||||||
April 1, 2020 | ||||||||||||||||||||||||||||||||
Carrying amount | Total | Within 1 year | 1 year to 2 years | 2 years to 3 years | 3 years to 4 years | 4 years to 5 years | 5+ years | |||||||||||||||||||||||||
Deposits from customers in the banking business *1 | 2,440,783 | 2,440,783 | 2,347,387 | 44,351 | 20,295 | 10,504 | 3,247 | 14,999 | ||||||||||||||||||||||||
Bonds | 376,800 | 382,982 | 732 | 100,635 | 129,915 | 15,363 | 40,326 | 96,011 | ||||||||||||||||||||||||
Borrowings | 1,078,961 | 1,079,685 | 849,930 | 56,657 | 98,480 | 64,663 | 3,510 | 6,445 | ||||||||||||||||||||||||
Loan commitments | — | 34,306 | 34,306 | — | — | — | — | — | ||||||||||||||||||||||||
Derivative liabilities *2 | 35,866 | 35,600 | 19,454 | 4,654 | 2,468 | 1,761 | 1,295 | 5,968 | ||||||||||||||||||||||||
Guarantee deposits received | 47,064 | 47,064 | 36,698 | 328 | 1 | 15 | — | 10,022 | ||||||||||||||||||||||||
Redeemable noncontrolling interests | 7,767 | 9,539 | — | 5,680 | 1,461 | — | 2,398 | — | ||||||||||||||||||||||||
Yen in millions | ||||||||||||||||||||||||||
April 1, 2020 | ||||||||||||||||||||||||||
Carrying amount | Total | Within 1 year | 1 year to 2 years | 2 years to 3 years | 3 years to 4 years | 4 years to 5 years | ||||||||||||||||||||
Lease liabilities | 406,237 | 461,237 | 82,176 | 72,810 | 58,191 | 42,574 | 31,994 | |||||||||||||||||||
5 years to 6 years | 6 years to 7 years | 7 years to 8 years | 8 years to 9 years | 9 years to 10 years | 10+ years | |||||||||||||||||||||
| 28,481 | 26,625 | 24,530 | 21,962 | 18,575 | 53,319 | |||||||||||||||||||||
| *1 | Demand deposits are included in the “Within 1 year” category. |
| *2 | Breakdown of net settlements and gross settlements in the derivative liabilities are presented below. |
F-49
SONY GROUP CORPORATION AND CONSOLIDATED SUBSIDIARIES
Yen in millions | ||||||||||||||||||||||||||||
April 1, 2020 | ||||||||||||||||||||||||||||
Total | Within 1 year | 1 year to 2 years | 2 years to 3 years | 3 years to 4 years | 4 years to 5 years | 5+ years | ||||||||||||||||||||||
Derivative contracts | ||||||||||||||||||||||||||||
—Net settled | ||||||||||||||||||||||||||||
Paid | 32,574 | 17,928 | 3,159 | 2,463 | 1,761 | 1,295 | 5,968 | |||||||||||||||||||||
Derivative contracts | ||||||||||||||||||||||||||||
—Gross settled | ||||||||||||||||||||||||||||
Received | 46,608 | 27,071 | 17,539 | 1,998 | — | — | — | |||||||||||||||||||||
Paid | 49,634 | 28,597 | 19,034 | 2,003 | — | — | — | |||||||||||||||||||||
Yen in millions | ||||||||||||||||||||||||||||||||
March 31, 2021 | ||||||||||||||||||||||||||||||||
Carrying amount | Total | Within 1 year | 1 year to 2 years | 2 years to 3 years | 3 years to 4 years | 4 years to 5 years | 5+ years | |||||||||||||||||||||||||
Deposits from customers in the banking business *1 | 2,773,884 | 2,773,884 | 2,682,156 | 36,586 | 19,643 | 3,135 | 3,159 | 29,205 | ||||||||||||||||||||||||
Bonds | 330,229 | 333,902 | 100,629 | 51,573 | 25,363 | 40,326 | 20,303 | 95,708 | ||||||||||||||||||||||||
Borrowings | 1,728,537 | 1,742,736 | 1,232,687 | 54,699 | 69,691 | 148,361 | 6,866 | 230,432 | ||||||||||||||||||||||||
Loan commitments | — | 37,322 | 37,322 | — | — | — | — | — | ||||||||||||||||||||||||
Derivative liabilities *2 | 40,354 | 41,415 | 29,660 | 3,260 | 2,103 | 1,289 | 847 | 4,256 | ||||||||||||||||||||||||
Guarantee deposits received | 31,811 | 31,811 | 21,279 | 365 | 21 | 26 | 275 | 9,845 | ||||||||||||||||||||||||
Redeemable noncontrolling interests | 8,179 | 10,225 | 5,307 | 872 | — | 1,628 | 2,418 | — | ||||||||||||||||||||||||
Yen in millions | ||||||||||||||||||||||||||
March 31, 2021 | ||||||||||||||||||||||||||
Carrying amount | Total | Within 1 year | 1 year to 2 years | 2 years to 3 years | 3 years to 4 years | 4 years to 5 years | ||||||||||||||||||||
Lease liabilities | 402,023 | 444,725 | 84,050 | 68,993 | 57,683 | 39,359 | 31,797 | |||||||||||||||||||
5 years to 6 years | 6 years to 7 years | 7 years to 8 years | 8 years to 9 years | 9 years to 10 years | 10+ years | |||||||||||||||||||||
| 28,937 | 26,606 | 23,977 | 20,461 | 17,510 | 45,352 | |||||||||||||||||||||
| *1 | Demand deposits are included in the “Within 1 year” category. |
| *2 | Breakdown of net settlements and gross settlements in the derivative liabilities are presented below. |
Yen in millions | ||||||||||||||||||||||||||||
March 31, 2021 | ||||||||||||||||||||||||||||
Total | Within 1 year | 1 year to 2 years | 2 years to 3 years | 3 years to 4 years | 4 years to 5 years | 5+ years | ||||||||||||||||||||||
Derivative contracts | ||||||||||||||||||||||||||||
—Net settled | ||||||||||||||||||||||||||||
Paid | 41,415 | 29,660 | 3,260 | 2,103 | 1,289 | 847 | 4,256 | |||||||||||||||||||||
Derivative contracts | ||||||||||||||||||||||||||||
—Gross settled | ||||||||||||||||||||||||||||
Received | — | — | — | — | — | — | — | |||||||||||||||||||||
Paid | — | — | — | — | — | — | — | |||||||||||||||||||||
F-50
SONY GROUP CORPORATION AND CONSOLIDATED SUBSIDIARIES
Yen in millions | ||||||||||||||||||||||||||||||||
March 31, 2022 | ||||||||||||||||||||||||||||||||
Carrying amount | Total | Within 1 year | 1 year to 2 years | 2 years to 3 years | 3 years to 4 years | 4 years to 5 years | 5+ years | |||||||||||||||||||||||||
Deposits from customers in the banking business *1 | 3,004,215 | 3,004,215 | 2,886,361 | 48,676 | 15,860 | 3,038 | 1,186 | 49,094 | ||||||||||||||||||||||||
Bonds | 216,103 | 218,676 | 36,976 | 25,363 | 40,326 | 20,303 | 35,243 | 60,465 | ||||||||||||||||||||||||
Borrowings | 2,670,156 | 2,687,135 | 2,053,340 | 58,767 | 76,434 | 115,460 | 23,813 | 359,321 | ||||||||||||||||||||||||
Loan commitments | — | 33,587 | 33,587 | — | — | — | — | — | ||||||||||||||||||||||||
Derivative liabilities *2 | 72,120 | 72,118 | 66,017 | 688 | 718 | 753 | 721 | 3,221 | ||||||||||||||||||||||||
Guarantee deposits received | 39,296 | 39,296 | 28,872 | 345 | 27 | 8 | 8 | 10,036 | ||||||||||||||||||||||||
Redeemable noncontrolling interests | 34,995 | 37,046 | 2,435 | 19,927 | 9,046 | 2,381 | — | 3,257 | ||||||||||||||||||||||||
Yen in millions | ||||||||||||||||||||||||||
March 31, 2022 | ||||||||||||||||||||||||||
Carrying amount | Total | Within 1 year | 1 year to 2 years | 2 years to 3 years | 3 years to 4 years | 4 years to 5 years | ||||||||||||||||||||
Lease liabilities | 465,349 | 511,883 | 81,421 | 69,791 | 59,214 | 45,063 | 37,363 | |||||||||||||||||||
5 years to 6 years | 6 years to 7 years | 7 years to 8 years | 8 years to 9 years | 9 years to 10 years | 10+ years | |||||||||||||||||||||
| 35,841 | 32,369 | 30,593 | 27,864 | 19,913 | 72,451 | |||||||||||||||||||||
| *1 | Demand deposits are included in the “Within 1 year” category. |
| *2 | Breakdown of net settlements and gross settlements in the derivative liabilities are presented below. |
Yen in millions | ||||||||||||||||||||||||||||
March 31, 2022 | ||||||||||||||||||||||||||||
Total | Within 1 year | 1 year to 2 years | 2 years to 3 years | 3 years to 4 years | 4 years to 5 years | 5+ years | ||||||||||||||||||||||
Derivative contracts | ||||||||||||||||||||||||||||
—Net settled | ||||||||||||||||||||||||||||
Paid | 72,118 | 66,017 | 688 | 718 | 753 | 721 | 3,221 | |||||||||||||||||||||
Derivative contracts | ||||||||||||||||||||||||||||
—Gross settled | ||||||||||||||||||||||||||||
Received | — | — | — | — | — | — | — | |||||||||||||||||||||
Paid | — | — | — | — | — | — | — | |||||||||||||||||||||
(5) | Foreign exchange risk |
For foreign exchange risk inherent in the insurance business, which is included in the Financial Services segment, refer to Note 13. For foreign exchange risk inherent in the banking business, which is included in the Financial Services segment, refer to (7) Market risks for subsidiary in the banking business.
Risk management policy and exposure
Costs and prices of products and services in transactions denominated in foreign currencies are affected by currency exchange rate fluctuation, which may have adverse impacts on Sony’s business, operating results, and financial condition. Sony seeks to reduce its exposure to foreign exchange risk mainly by using derivatives such as currency forward contracts or investing in securities denominated in
the
same currency.F-51
SONY GROUP CORPORATION AND CONSOLIDATED SUBSIDIARIES
| (i) | Foreign exchange risk exposure |
The net amount of Sony’s exposure to foreign exchange risk mainly includes the following. Foreign exchange risk exposures that are mitigated by the use of derivatives are excluded.
Yen in millions | ||||||||||||
April 1 | March 31 | |||||||||||
2020 | 2021 | 2022 | ||||||||||
U.S. dollar | (4,533 | ) | 5,813 | (6,384 | ) | |||||||
Euro | 286 | 1,877 | (22,713 | ) | ||||||||
| * | Net exposures resulting in a liability are presented as negative and net exposures resulting in an asset are presented as positive. |
Sensitivity analysis
The table below shows the effects on the income before income taxes regarding the financial instruments denominated in foreign currencies held by Sony as of April 1, 2020, March 31, 2021 and 2022 if the Japanese yen had strengthened by 10% against the U.S. dollar or euro. If the Japanese yen had weakened by 10% against the U.S. dollar or euro, there would be an opposite impact on income before income taxes in the same amount. This analysis was performed based on the assumption that all other variables stay the same.
Yen in millions | ||||||||||||
April 1 | March 31 | |||||||||||
2020 | 2021 | 2022 | ||||||||||
U.S. dollar | 453 | (581 | ) | 638 | ||||||||
Euro | (29 | ) | (188 | ) | 2,271 | |||||||
(6) | Credit risk |
Risk management policy and exposure
Sony is exposed to credit risk in relation to its customers with outstanding trade receivables and the financial institutions who are the counterparties of derivative instruments that Sony holds to hedge the foreign exchange risk related to such trade receivables.
In order to manage risks inherent in trade receivables, Sony assesses management conditions and creditworthiness of prospective customers and sets credit limits before commencement of business in accordance with Sony’s internal rules regarding credit management. After commencement of business, in accordance with Sony’s internal rules regarding receivable management, Sony seeks to promptly identify and mitigate the risk of uncollectible receivables due to deterioration in the financial conditions of customers by managing payment due dates and outstanding balances by customer, consistently reviewing the status of transactions, payment history, and trends in the outstanding balance of customers, and actively monitoring their management and business conditions. Sony makes judgments about the creditworthiness of customers based on past collection experience, the current conditions, forecasts of future economic conditions and ongoing credit risk evaluations when calculating the loss allowances for the expected credit losses from trade receivables.
In addition, the credit risk inherent in derivative transactions is considered low since Sony enters into derivative transactions only with financial institutions with high creditworthiness or central clearing house counterparties, and such derivative transactions are collateralized.
The Financial Services segment formulates Fundamental Principles for Risk Management and manages risks depending on its subsidiaries’ size, characteristics and business. Risk Management Guidelines in the Financial Services segment establish a detailed framework for risk management, and each of the subsidiaries in the Financial Services segment has developed a framework for risk management on its own depending on the characteristics of financial assets, including issuer credit risk on debt securities, counterparty risks, credit screenings, the management of credit information, credit ratings, the setting of guarantees or collateral and handling of problem assets on abasis. Relevant departments of subsidiaries in the Financial Services segment periodically report risk management conditions to their Boards of Directors and their Executive Committees.
case-by-case
F-52
SONY GROUP CORPORATION AND CONSOLIDATED SUBSIDIARIES
Risk exposure analysis
| (a) | Changes in the loss allowances |
Trade and other receivables, and contract assets including
non-current
other receivables in the Pictures segmentYen in millions | ||||||||
Lifetime expected credit losses | ||||||||
Fiscal year ended March 31 | ||||||||
202 1 | 202 2 | |||||||
Balance at beginning of the fiscal year | 27,108 | 30,066 | ||||||
Changes due to financial assets recognized at beginning of the fiscal year: | ||||||||
— Financial assets that have been derecognized | (2,151 | ) | (935 | ) | ||||
New financial assets originated or purchased | 6,673 | 5,998 | ||||||
Write-offs | (5,682 | ) | (9,501 | ) | ||||
Changes in models/risk parameters | 4,066 | 4,269 | ||||||
Foreign exchange and other movements | 52 | 1,444 | ||||||
Balance at end of the fiscal year | 30,066 | 31,341 | ||||||
Debt Securities | ||||||||
Yen in millions | ||||||||
12-month expected credit losses * | ||||||||
Fiscal year ended March 31 | ||||||||
202 1 | 202 2 | |||||||
Balance at beginning of the fiscal year | 41 | 29 | ||||||
Changes due to financial assets recognized at beginning of the fiscal year: | ||||||||
— Financial assets that have been derecognized | (11 | ) | (6 | ) | ||||
New financial assets originated or purchased | 12 | 44 | ||||||
Changes in models/risk parameters | (14 | ) | (14 | ) | ||||
Foreign exchange and other movements | 1 | — | ||||||
Balance at end of the fiscal year | 29 | 53 | ||||||
| * | For all debt securities, Sony considers that the credit risk has not increased significantly since initial recognition, and therefore the loss allowance is measured at an amount equal to 12-months of expected credit losses. |
Substantially all of the loss allowances for debt securities are for debt securities measured at fair value through other comprehensive income as of April 1, 2020, March 31, 2021 and 2022.
F-53
SONY GROUP CORPORATION AND CONSOLIDATED SUBSIDIARIES
Loans
Yen in millions | ||||||||||||
12-month expected credit losses | Lifetime expected credit losses | Total | ||||||||||
Balance as of April 1, 2020 | 126 | 936 | 1,062 | |||||||||
Changes due to financial assets recognized as of April 1, 2020: | ||||||||||||
— Transfer to lifetime expected credit losses | (1 | ) | 1 | — | ||||||||
— Transfer to 12-month expected credit losses | 97 | (97 | ) | — | ||||||||
— Financial assets that have been derecognized | (30 | ) | (121 | ) | (151 | ) | ||||||
New financial assets originated or purchased | 27 | 21 | 48 | |||||||||
Changes in models/risk parameters | (98 | ) | 208 | 110 | ||||||||
Foreign exchange and other movements | 1 | (2 | ) | (1 | ) | |||||||
Balance as of March 31, 2021 | 122 | 946 | 1,068 | |||||||||
Changes due to financial assets recognized as of March 31, 2021: | ||||||||||||
— Transfer to lifetime expected credit losses | (1 | ) | 1 | — | ||||||||
— Transfer to 12-month expected credit losses | 103 | (103 | ) | — | ||||||||
— Financial assets that have been derecognized | (59 | ) | (97 | ) | (156 | ) | ||||||
New financial assets originated or purchased | 33 | 17 | 50 | |||||||||
Changes in models/risk parameters | (34 | ) | 163 | 129 | ||||||||
Foreign exchange and other movements | — | — | — | |||||||||
Balance as of March 31, 2022 | 164 | 927 | 1,091 | |||||||||
Loans that are credit-impaired as of April 1, 2020, March 31, 2021 and 2022 were not significant.
| (b) | Description of collateral held as security and other credit enhancements |
Sony assesses creditworthiness of each customer on an individual project basis. When it is determined to extend credit to a customer, the amount of collateral to be obtained will be based on the credit assessment for the customer by management. Collateral held as security includes, but is not limited to the following:
| • | Floating charges on all assets and businesses of the customer |
| • | Specific or related guarantees |
| • | Debt guarantees from customers and loan agreements with favorable and unfavorable covenant terms |
The carrying amount of the financial assets, without taking into account any collateral held or credit enhancements, represents Sony’s maximum exposure to credit risk on these assets. For maximum exposure to credit risk of securities to which impairment requirements in IFRS 9 “Financial Instruments” (“IFRS 9”) are not applied without taking into account any collateral held or other credit enhancements, refer to Note 5.
In the Financial Services segment, housing loans have sufficient collateral, which results in no significant loss allowance being recognized. In addition, certain securities received as collateral for short-term lending transactions are permitted to be sold or repledged. The fair value of the securities which were not sold or repledged as collateral was 373,274 million yen and 530,589 million yen as of March 31, 2021 and 2022, respectively. None of the securities were sold or repledged as collateral as of March 31, 2021 or 2022. The securities are not recognized in the consolidated statements of financial position until being sold or repledged as collateral.
F-54
SONY GROUP CORPORATION AND CONSOLIDATED SUBSIDIARIES
| (c) | Credit risk exposure by risk rating grades |
Credit risk exposure by risk rating grades as of April 1, 2020, March 31, 2021 and 2022, is as follows:
Trade and other receivables, and contract assets including
non-current
other receivables in the Pictures segmentYen in millions | ||||||||||||
April 1 | March 31 | |||||||||||
2020 | 2021 | 2022 | ||||||||||
Outstanding receivables by overview period of overdue (Gross carrying amount) | ||||||||||||
Not past due or due within 30 days | 1,223,507 | 1,388,742 | 1,732,371 | |||||||||
Due over 30 to 90 days | 48,007 | 40,046 | 52,895 | |||||||||
Due over 90 days | 61,782 | 56,946 | 45,269 | |||||||||
Total | 1,333,296 | 1,485,734 | 1,830,535 | |||||||||
Debt securities
Debt securities held in the Financial Services segment are substantially all composed of investment grade debt securities, and, as a financial instrument subject to IFRS 9 impairment requirements,
12-month
expected losses are recorded.The following table shows an analysis of the gross carrying amount for debt securities measured at amortized cost or at fair value through other comprehensive income based on a credit rating system in the Financial Services segment, which is primarily a composite of external credit ratings as of April 1, 2020, March 31, 2021 and 2022.
Yen in millions | ||||||||||||
April 1 | March 31 | |||||||||||
2020 | 2021 | 2022 | ||||||||||
Debt securities by credit ratings (Gross carrying amount) | ||||||||||||
AAA | 233,334 | 282,551 | 488,275 | |||||||||
AA | 1,540,380 | 2,024,890 | 2,431,758 | |||||||||
A | 7,930,999 | 8,259,282 | 8,560,523 | |||||||||
BBB | 19,171 | 17,961 | 12,948 | |||||||||
Other | 7,628 | 11,017 | 32,422 | |||||||||
Total | 9,731,512 | 10,595,701 | 11,525,926 | |||||||||
Loans
Loans held in the banking business in the Financial Services segment are regularly reassessed by the credit ratings of debtors, and as a financial instrument subject to IFRS 9 impairment requirements,
12-month
or lifetime expected credit losses are recorded depending on whether or not the credit risk has increased significantly since initial recognition or not.F-
55SONY GROUP CORPORATION AND CONSOLIDATED SUBSIDIARIES
The following table shows an analysis of the gross carrying amount for loans measured at amortized cost based on credit ratings by debtors in the banking business in the Financial Services segment as of April 1, 2020, March 31, 2021 and 2022.
Yen in millions | ||||||||||||||||||||||||||||
April 1, 2020 | ||||||||||||||||||||||||||||
Normal* | Other than Normal | Total | ||||||||||||||||||||||||||
12-month expected credit losses | Lifetime expected credit losses | Sub total | 12-month expected credit losses | Lifetime expected credit losses | Sub total | |||||||||||||||||||||||
Loans | ||||||||||||||||||||||||||||
Housing loans | 1,916,086 | 205 | 1,916,291 | 1,163 | 2,250 | 3,413 | 1,919,704 | |||||||||||||||||||||
Other | 43,440 | 666 | 44,106 | 1 | 118 | 119 | 44,225 | |||||||||||||||||||||
Total | 1,959,526 | 871 | 1,960,397 | 1,164 | 2,368 | 3,532 | 1,963,929 | |||||||||||||||||||||
Yen in millions | ||||||||||||||||||||||||||||
March 31, 2021 | ||||||||||||||||||||||||||||
Normal* | Other than Normal | Total | ||||||||||||||||||||||||||
12-month expected credit losses | Lifetime expected credit losses | Sub total | 12-month expected credit losses | Lifetime expected credit losses | Sub total | |||||||||||||||||||||||
Loans | ||||||||||||||||||||||||||||
Housing loans | 2,337,703 | 128 | 2,337,831 | 1,115 | 4,279 | 5,394 | 2,343,225 | |||||||||||||||||||||
Other | 34,114 | 486 | 34,600 | 2 | 76 | 78 | 34,678 | |||||||||||||||||||||
Total | 2,371,817 | 614 | 2,372,431 | 1,117 | 4,355 | 5,472 | 2,377,903 | |||||||||||||||||||||
Yen in millions | ||||||||||||||||||||||||||||
March 31, 2022 | ||||||||||||||||||||||||||||
Normal* | Other than Normal | Total | ||||||||||||||||||||||||||
12-month expected credit losses | Lifetime expected credit losses | Sub total | 12-month expected credit losses | Lifetime expected credit losses | Sub total | |||||||||||||||||||||||
Loans | ||||||||||||||||||||||||||||
Housing loans | 2,747,406 | 156 | 2,747,562 | 2,532 | 3,423 | 5,955 | 2,753,517 | |||||||||||||||||||||
Other | 24,522 | 282 | 24,804 | 11 | 85 | 96 | 24,900 | |||||||||||||||||||||
Total | 2,771,928 | 438 | 2,772,366 | 2,543 | 3,508 | 6,051 | 2,778,417 | |||||||||||||||||||||
| * | Normal is defined as borrowers who have strong results and no particular problems with their financial position. |
| (d) | Credit risk for debt securities designated to be measured at fair value through profit or loss |
The credit risk exposures for debt securities designated to be measured at fair value through profit or loss were 247,289 million yen, 295,314 million yen, and 267,169 million yen as of April 1, 2020, March 31, 2021 and 2022, respectively. The change in the fair value attributable to the changes in credit risk
was a decrease of
5,045 million yen for the fiscal year ended March 31, 2021 and
an increase of
1,425 million yen for the fiscal year ended March 31, 2022. The cumulative changes are 5,645 million yen, 601 million yen and 2,026 million yen as of April 1, 2020, March 31, 2021 and 2022, respectively.
(7) | Market risks for a subsidiary in the banking business |
By formulating and conforming with market risk management policies, a subsidiary in the banking business manages the risk of loss for when the value of assets and liabilities (including
off-balance-sheet
items), and income from assets and liabilities could be adversely affected by changes in various market risk factors, such as interest rates, exchange rates and stock prices. Market risk management policies specify details such as risk management methods and procedures. ALM and risk management policies are determined by the subsidiary’sF
-56
SONY GROUP CORPORATION AND CONSOLIDATED SUBSIDIARIES
Board of Directors. Based on these policies, an ALM committee and a risk management committee typically meet once each month to understand and confirm actual conditions and deliberate future measures and risk conditions. On a daily basis, the risk management division maintains an overall understanding of interest, exchange rates and duration of financial assets and liabilities, and monitors Value at Risk (“VaR”), which quantifies the maximum expected loss which could occur during a given holding period and at a given probability, and interest rate sensitivity analysis, and confirms regulatory compliance. The subsidiary also conducts interest rate swaps and other derivative transactions to hedge against interest and exchange rate fluctuation risks. In the measurement of VaR, the historical method (time period: 250 days, confidence level: 99.0%) is used, and interest rate risk, exchange rate risk, and price risk are measured as the amount of market risk. The total market risk volume as of March 31, 2021 and 2022 was 13,215 million yen and 8,230 million yen, respectively. VaR employs statistical methods to estimate the maximum loss that could occur in a defined period of time in the future based on market fluctuation data for a defined period of time in the past; therefore, VaR may not capture the risk in situations in which the market environment undergoes drastic changes that are unpredictable under normal circumstances.
(8) | Effect of IBOR reform |
Due to the reform and replacement of benchmark interest rates such as the London Interbank Offered Rate (“LIBOR”), the use of other interbank offered rates (“IBORs”) has become a priority for global regulators. The use of panel-based LIBOR ceased as of December 2021, except for the use of certain U.S. dollar (“USD”) LIBORs. The
1-,
3-,
and 6-months panel-based USD LIBOR settings are expected to be abolished and lose their representativeness at the end of June 2023. The overnight and 12 months USD LIBOR settings will permanently cease immediately after June 2023. As of March 31, 2022, the banking subsidiary is party to contracts that reference USD LIBOR.As mentioned above, the JPY and GBP IBORs have been abolished on December 31, 2021 and replaced by alternative interest rates such as the Tokyo Overnight Average rate (“TONA”) and the Sterling Overnight Index Average (“SONIA”). Currently, the Secured Overnight Financing Rate (“SOFR”) is gradually replacing USD LIBOR as a reference rate. There remains key differences between USD LIBOR and SOFR. USD LIBOR is a “term rate,” which means that it is published for a specific borrowing period (such as three months or six months) and is “forward-looking,” because it is published at the beginning of the borrowing period. On the other hand, SOFR, TONA and SONIA are currently “backward-looking” rates, based on overnight rates from actual transactions, and are published at the end of the overnight borrowing period. Furthermore, LIBOR includes a credit spread over the risk-free rate, while SOFR, TONA and SONIA currently do not include such a spread. To transition existing contracts and agreements that reference USD LIBOR to SOFR, adjustments for term differences and credit differences need to be applied to SOFR, to enable the two benchmark rates to be economically equivalent on transition.
As of March 31, 2022, the Alternative Reference Rates Committee (“ARRC”), a working group for a transition from USD LIBOR to a more robust reference rate, recommends SOFR instead of LIBOR. However, some market participants are calling for the use of credit sensitive rates (“CSRs”) that include a credit spread, and these rates might be used in addition to SOFR.
In 2021 the banking subsidiary established a LIBOR transition project plan. This transition project is considering changes to systems, business processes, risk management and valuation models, as well as managing any related tax and accounting implications. As of March 31, 2022, changes to systems, business processes, risk management and valuation models are largely complete, but some contractual changes, such as securities and derivatives transactions that reference USD LIBOR, have not yet been implemented. Therefore, there is a risk that Sony will not be able to make the necessary contractual changes before June 2023, when the 1-, 3-, and
6-months
panel-based USD LIBOR are abolished. In addition, CSRs, rather than SOFR, might be used as an alternative interest rate, which would require the implementation of system changes in a short period of time. To avoid the above risks, Sony closely monitors the progress of necessary contractual changes with its counter parties. Sony is also flexible in responding to systemic issues through collaboration among project members and other departments.Sony Group Corporation has a loan contract and interest swap agreement, related to the loan contract, aiming to manage certain borrowing costs, both of which reference USD LIBOR, which expire after 2023. Sony is currently in discussion with the counterparties on which alternative interest rate would be referenced in the contractual periods after the current benchmark rates are no longer available.
F-57
SONY GROUP CORPORATION AND CONSOLIDATED SUBSIDIARIES
The following table contains details of all of the financial instruments that Sony Group Corporation and the banking subsidiary hold at March 31, 2022 which reference USD LIBOR and SOFR and have not yet transitioned to SOFR or an alternative interest rate benchmark:
Yen in millions | ||||||||
March 31, 2022 | ||||||||
Carrying Value | Of which have yet to transition to an alternative benchmark interest rate | |||||||
Debt securities | ||||||||
Financial assets required to be measured at FVOCI | 25,142 | 22,954 | ||||||
Financial assets required to be measured at AC | 244,388 | 209,059 | ||||||
Long-term debt | (146,778 | ) | (146,778 | ) | ||||
Derivatives* | 20,178 | 19,948 | ||||||
Total | 142,930 | 105,183 | ||||||
| * | Derivatives are presented on a net basis. |
7. | Inventories |
Inventories are comprised of the following:
Yen in millions | ||||||||||||
April 1 | March 31 | |||||||||||
2020 | 2021 | 2022 | ||||||||||
Finished products | 322,103 | 398,474 | 533,612 | |||||||||
Work in process | 142,935 | 133,560 | 163,206 | |||||||||
Raw materials, purchased components and supplies | 94,741 | 104,634 | 177,189 | |||||||||
Inventories | 559,779 | 636,668 | 874,007 | |||||||||
For the fiscal years ended March 31, 2021 and 2022, the write-downs of inventories were 73,594 million yen and 80,546 million yen, respectively.
For the fiscal years ended March 31, 2021 and 2022, the amounts of inventories expensed and included in cost of sales were 2,057,248 million yen and 2,495,769 million yen, respectively. Included within these amounts for the fiscal years ended March 31, 2021 and 2022 were employee benefits expenses of 269,428 million yen and 282,765 million yen, respectively, and depreciation and amortization expenses of 192,760 million yen and 201,860 million yen, respectively. Other cost of sales mainly consists of material costs, subcontractor costs and other professional service fees.
8. | Investments in associates and joint ventures |
There are no associates or joint ventures that are individually material to Sony.
The carrying amounts of investments in associates and joint ventures that are not individually material to Sony, as of April 1, 2020, March 31, 2021 and 2022 are as follows:
Yen in millions | ||||||||||||
April 1 | March 31 | |||||||||||
2020 | 2021 | 2022 | ||||||||||
Investments accounted for using the equity method | ||||||||||||
Associates | 181,795 | 198,539 | 235,671 | |||||||||
Joint ventures | 22,496 | 26,547 | 32,842 | |||||||||
Total | 204,291 | 225,086 | 268,513 | |||||||||
F-58
SONY GROUP CORPORATION AND CONSOLIDATED SUBSIDIARIES
Sony’s share of comprehensive income, profit or loss and other comprehensive income, of associates and joint ventures that are not individually material to Sony for the fiscal years ended March 31, 2021 and 2022 are as follows:
Yen in millions | ||||||||
Fiscal year ended March 31 | ||||||||
2021 | 2022 | |||||||
Share of profit or loss | ||||||||
Associates | 14,086 | 21,920 | ||||||
Joint ventures | (2,535 | ) | 1,726 | |||||
Total | 11,551 | 23,646 | ||||||
Share of other comprehensive income | ||||||||
Associates | 884 | 2,077 | ||||||
Joint ventures | 1 | 1 | ||||||
Total | 885 | 2,078 | ||||||
Share of comprehensive income | ||||||||
Associates | 14,970 | 23,997 | ||||||
Joint ventures | (2,534 | ) | 1,727 | |||||
Total | 12,436 | 25,724 | ||||||
F-59
SONY GROUP CORPORATION AND CONSOLIDATED SUBSIDIARIES
9. | Property, plant and equipment |
The changes in property, plant and equipment for the fiscal years ended March 31, 2021 and 2022 are as follows:
Yen in millions | ||||||||||||||||||||
Land | Buildings | Machinery and equipment | Construction in progress | Total | ||||||||||||||||
| Balance as of April 1, 2020: | ||||||||||||||||||||
Cost | 77,716 | 731,440 | 1,844,088 | 78,811 | 2,732,055 | |||||||||||||||
Accumulated depreciation and impairment losses | — | (475,344 | ) | (1,337,056 | ) | (2,457 | ) | (1,814,857 | ) | |||||||||||
Carrying amount | 77,716 | 256,096 | 507,032 | 76,354 | 917,198 | |||||||||||||||
| Changes in carrying amount: | ||||||||||||||||||||
Additions | — | 22,464 | 91,873 | 187,003 | 301,340 | |||||||||||||||
Acquisitions through business combinations | — | 47 | 50 | — | 97 | |||||||||||||||
Reclassifications | 340 | 12,568 | 146,025 | (159,774 | ) | (841 | ) | |||||||||||||
Disposals or classified as held for sale *1 | (2,484 | ) | (1,599 | ) | (3,140 | ) | (779 | ) | (8,002 | ) | ||||||||||
Depreciation *2 | — | (24,405 | ) | (189,568 | ) | — | (213,973 | ) | ||||||||||||
Impairment losses | (37 | ) | (1,063 | ) | (2,866 | ) | (2,203 | ) | (6,169 | ) | ||||||||||
Translation adjustment | 505 | 2,572 | 2,756 | 736 | 6,569 | |||||||||||||||
Other | — | (2,721 | ) | (2,348 | ) | (609 | ) | (5,678 | ) | |||||||||||
Total changes | (1,676 | ) | 7,863 | 42,782 | 24,374 | 73,343 | ||||||||||||||
| Balance as of March 31, 2021: | ||||||||||||||||||||
Cost | 76,077 | 755,115 | 1,864,034 | 102,310 | 2,797,536 | |||||||||||||||
Accumulated depreciation and impairment losses | (37 | ) | (491,156 | ) | (1,314,220 | ) | (1,582 | ) | (1,806,995 | ) | ||||||||||
Carrying amount | 76,040 | 263,959 | 549,814 | 100,728 | 990,541 | |||||||||||||||
| Changes in carrying amount: | ||||||||||||||||||||
Additions | 2,461 | 25,434 | 91,189 | 229,094 | 348,178 | |||||||||||||||
Acquisitions through business combinations | — | 1,946 | 1,437 | — | 3,383 | |||||||||||||||
Reclassifications | 24 | 48,600 | 134,660 | (185,979 | ) | (2,695 | ) | |||||||||||||
Disposals or classified as held for sale *1 | (1,628 | ) | (2,248 | ) | (4,690 | ) | (158 | ) | (8,724 | ) | ||||||||||
Depreciation *2 | — | (29,906 | ) | (205,920 | ) | — | (235,826 | ) | ||||||||||||
Impairment losses | — | (235 | ) | (579 | ) | (74 | ) | (888 | ) | |||||||||||
Translation adjustment | 1,226 | 9,640 | 7,032 | 1,036 | 18,934 | |||||||||||||||
Other | — | 282 | 22 | 6 | 310 | |||||||||||||||
Total changes | 2,083 | 53,513 | 23,151 | 43,925 | 122,672 | |||||||||||||||
| Balance as of March 31, 2022: | ||||||||||||||||||||
Cost | 78,160 | 832,785 | 1,953,985 | 145,940 | 3,010,870 | |||||||||||||||
| Accumulated depreciation and impairment losses | (37 | ) | (515,313 | ) | (1,381,020 | ) | (1,287 | ) | (1,897,657 | ) | ||||||||||
Carrying amount | 78,123 | 317,472 | 572,965 | 144,653 | 1,113,213 | |||||||||||||||
| *1 | An asset or disposal group for which the cash flows are expected to arise principally from sale rather than continuing use is classified to current asset as an asset held for sale. |
| *2 | Depreciation expenses are allocated to the cost of inventory and are recognized in cost of sales as inventory is sold, or are directly recognized in selling, general and administrative expenses and research and development expenditures in the consolidated statements of income, depending on the use of the asset. |
F-60
SONY GROUP CORPORATION AND CONSOLIDATED SUBSIDIARIES
10. | Leases |
Sony leases communication and commercial equipment, plant, office space, warehouses, employees’ residential facilities and other assets.
(1) | Right-of-use |
Right-of-use
Yen in millions | ||||||||||||||||
Land | Buildings | Machinery and equipment | Total | |||||||||||||
Balance as of April 1, 2020: | ||||||||||||||||
Carrying amount | 16,581 | 338,426 | 18,275 | 373,282 | ||||||||||||
Changes in the carrying amount | ||||||||||||||||
Increase due to new lease agreements and remeasurement of lease liabilities | 1,657 | 61,887 | 5,299 | 68,843 | ||||||||||||
Decrease due to termination of lease agreements and remeasurement of lease liabilities | (0 | ) | (2,255 | ) | (268 | ) | (2,523 | ) | ||||||||
Depreciation | (1,043 | ) | (70,049 | ) | (8,330 | ) | (79,422 | ) | ||||||||
Other | (1,801 | ) | (659 | ) | 314 | (2,146 | ) | |||||||||
Net changes | (1,187 | ) | (11,076 | ) | (2,985 | ) | (15,248 | ) | ||||||||
Balance as of March 31, 2021: | ||||||||||||||||
Carrying amount | 15,394 | 327,350 | 15,290 | 358,034 | ||||||||||||
Changes in the carrying amount | ||||||||||||||||
Increase due to new lease agreements and remeasurement of lease liabilities | 2,908 | 104,456 | 12,816 | 120,180 | ||||||||||||
Decrease due to termination of lease agreements and remeasurement of lease liabilities | (159 | ) | (5,685 | ) | (356 | ) | (6,200 | ) | ||||||||
Depreciation | (1,140 | ) | (72,944 | ) | (7,700 | ) | (81,784 | ) | ||||||||
Other | 797 | 22,091 | 312 | 23,200 | ||||||||||||
Net changes | 2,406 | 47,918 | 5,072 | 55,396 | ||||||||||||
Balance as of March 31, 2022: | ||||||||||||||||
Carrying amount | 17,800 | 375,268 | 20,362 | 413,430 | ||||||||||||
(2) | Income, expenses, and cash flows (except for depreciation) arising from lease contracts as a lessee and lessor are as follows: |
Yen in millions | ||||||||
Fiscal year ended March 31 | ||||||||
2021 | 2022 | |||||||
Interest expenses on lease liabilities | 8,292 | 8,223 | ||||||
Expenses related to short-term leases accounted for applying an exemption | 17,805 | 19,764 | ||||||
Income from subleases | (2,256 | ) | (2,256 | ) | ||||
Net cash outflows for leases | 81,399 | 83,546 | ||||||
Refer to Note 6 for the maturity analysis of Sony’s financial liabilities including lease liabilities.
F-61
SONY GROUP CORPORATION AND CONSOLIDATED SUBSIDIARIES
11. | Goodwill and intangible assets |
(1) | Goodwill |
The changes in goodwill for the fiscal years ended March 31, 2021 and 2022 are as follows:
Yen in millions | ||||||||
Fiscal year ended March 31 | ||||||||
2021 | 2022 | |||||||
Balance at beginning of the fiscal year | ||||||||
Cost | 1,035,320 | 1,073,178 | ||||||
Accumulated impairments | (344,391 | ) | (347,069 | ) | ||||
Carrying amount | 690,929 | 726,109 | ||||||
Increase (decrease) due to: | ||||||||
Acquisitions | 15,679 | 197,644 | ||||||
Disposals or classified as held for sale * | (2,486 | ) | (40,201 | ) | ||||
Impairments | — | — | ||||||
Translation adjustments | 21,987 | 69,343 | ||||||
Other | — | — | ||||||
Balance at end of the fiscal year | ||||||||
Cost | 1,073,178 | 1,312,615 | ||||||
Accumulated impairments | (347,069 | ) | (359,720 | ) | ||||
Carrying amount | 726,109 | 952,895 | ||||||
| * | Disposals or classified as held for sale for the fiscal year ended March 31, 2022 relate mainly to the transfer of certain operations of Game Show Network, LLC, a wholly-owned subsidiary in the Pictures segment. Refer to Note 31 for thedetails of the transfer. |
The carrying amounts of goodwill by segment as of April 1, 2020, March 31, 2021 and 2022 are as follows:
Yen in millions | ||||||||||||
April 1 | March 31 | |||||||||||
2020 | 2021 | 2022 | ||||||||||
Game & Network Services *1 | 170,974 | 172,360 | 200,206 | |||||||||
Music *2 | 391,325 | 408,424 | 539,055 | |||||||||
Pictures *3 | 103,626 | 120,083 | 187,658 | |||||||||
Electronics Products & Solutions | 11,354 | 11,533 | 11,949 | |||||||||
Imaging & Sensing Solutions | 2,816 | 2,875 | 3,193 | |||||||||
Financial Services | 10,834 | 10,834 | 10,834 | |||||||||
All Other | — | — | — | |||||||||
Total | 690,929 | 726,109 | 952,895 | |||||||||
| *1 | Game & Network Services |
All of the goodwill shown in the G&NS line of the table above relates to the PlayStation
®
business. Intangible assets with indefinite useful lives related to the PlayStation®
business have carrying amounts of 57,397 million yen, 57,449 million yen and 57,217 million yen, as of April 1, 2020 and March 31, 2021 and 2022, respectively, which are included in “Other intangible assets.” Intangible assets with indefinite useful lives include the trademark for PlayStation®
,which is assessed to have an indefinite useful life as the trademark for PlayStation
®
is utilized as the core trademark for Sony’s products and services throughout the G&NS segment and Sony expects to continue using the trademark in the foreseeable future as well. The recoverable amount of the CGU is determined by the value in use. The value in use is calculated byF-62
SONY GROUP CORPORATION AND CONSOLIDATED SUBSIDIARIES
discounting the estimated future cash flows including a terminal value. The estimated future cash flows are prepared based on the MRP. A terminal value after the final year of the total forecasted period is determined by utilizing a perpetual growth rate. The growth rate and the pre-tax discount
rate we
re 1.5% and 9.8% as of April 1, 2020, 1.5% and 8.7% as of March 31, 2021, and 1.5% and 9.6% as of March 31, 2022, respectively.| *2 | Music |
Goodwill shown in the Music line of the table above is primarily allocated to the worldwide recorded music and the worldwide music publishing CGUs excluding operations in Japan.
Goodwill related to the worldwide recorded music CGU has carrying amounts of 128,918 million yen, 136,572 million and 235,746 million yen, as of April 1, 2020 and March 31, 2021 and 2022, respectively. The recoverable amount of the CGU is determined by the value in use. The value in use is calculated by discounting the estimated future cash flows including a terminal value. The estimated future cash flows are prepared based on the MRP. A terminal value after the final year of the . The growth rate and the
total
forecasted periodis determined by utilizing a perpetual growth rate
pre-tax
discount ratewe
re 1.0% and 9.2% as of April 1, 2020, 1.0% and 9.3% as of March 31, 2021, and 1.0% and 8.9% as of March 31, 2022, respectively.Goodwill related to the music publishing CGU has carrying amounts of 238,684 million yen, 248,130 million yen and 270,116 million yen, as of April 1, 2020, March 31, 2021 and 2022, respectively. The recoverable amount of the CGU is determined by the value in use. The value in use is calculated by discounting the estimated future cash flows including a terminal value. The estimated future cash flows are prepared based on the MRP. A terminal value after the final year of the . The growth rate and the
total
forecasted periodis determined by utilizing a perpetual growth rate
pre-tax
discount ratewe
re 2.5% and 8.4% as of April 1, 2020, 2.5% and 8.2% as of March 31, 2021, and 2.5% and 8.5% as of March 31, 2022, respectively.| *3 | Pictures |
Goodwill shown in the Pictures line of the table above is primarily allocated to the United States television network and the animation distribution CGUs.
Goodwill related to the United States television network CGU has carrying amounts of
54,156 million yen, 55,092 million yen and 20,347 million yen, as of April 1, 2020, March 31, 2021 and 2022, respectively. The recoverable amount of the CGU is determined by the value in use. The value in use is calculated by discounting the estimated future cash flows including a terminal value. The estimated future cash flows are prepared based on the MRP, with earnings in years beyond the MRP based on a steady growth rate. A terminal value is based on an earnings multiple applied to the final year of the total forecasted period. The growth rate beyond the MRP period and the pre-tax discount rate were
1.0% and 15.9% as of April 1, 2020, 1.0% and 14.7% as of March 31, 2021, and(
5.0
%
and 13.1% as of March 31, 2022, respectively.)
Goodwill related to the animation distribution CGU has a carrying amount of
102,590 million yen, as of March 31, 2022. The recoverable amount of the CGU is determined by the value in use. The value in use is calculated by discounting the estimated future cash flows including a terminal value. The estimated future cash flows are prepared based on the MRP, with revenues in years beyond the MRP based on declining growth rates. A terminal value is based on a revenue multiple applied to the final year of the total forecasted period. The growth rates beyond the MRP period were
5.0% to 15.0%,and the pre-tax discount rate was
13.5%as of March 31, 2022. The carrying amounts of the CGU as of April 1, 2020 and March 31, 2021 have not been presented as these amounts were not material.
The value in use calculation uses key assumptions such as the
pre-tax
discount rate, perpetual growth rate, competitive and regulatory environment, and technology trends. For each assumption, historical experience, external information, competitors and industry trends are taken into account. Sony does not expect the recoverable amounts to be lower than the carrying amounts even when the growth rate andpre-tax
discount rate that are used in the evaluation of the recoverable amounts change within a reasonably predictable range.F-63
SONY GROUP CORPORATION AND CONSOLIDATED SUBSIDIARIES
(2) | Content assets |
The changes in content assets for the fiscal years ended March 31, 2021 and 2022 are as follows:
Yen in millions | ||||||||||||||||||||||||||||
Film costs | Broadcasting rights | Music catalogs | Artist contracts | Music distribution rights | Other | Content assets Total | ||||||||||||||||||||||
Balance as of April 1, 2020: | ||||||||||||||||||||||||||||
Cost | 2,712,996 | 265,517 | 628,184 | 25,847 | 31,218 | 10,118 | 3,673,880 | |||||||||||||||||||||
Accumulated amortization and impairment losses | (2,315,662 | ) | (202,966 | ) | (140,705 | ) | (13,099 | ) | (5,592 | ) | (3,212 | ) | (2,681,236 | ) | ||||||||||||||
Carrying amount | 397,334 | 62,551 | 487,479 | 12,748 | 25,626 | 6,906 | 992,644 | |||||||||||||||||||||
Changes in carrying amount: | ||||||||||||||||||||||||||||
Additions | 211,521 | 61,446 | 61,106 | 31 | 451 | 6,985 | 341,540 | |||||||||||||||||||||
Acquisitions through business combinations | — | 1,912 | 235 | — | — | — | 2,147 | |||||||||||||||||||||
Disposals or classified as held for sale | (5,182 | ) | (2,797 | ) | — | — | — | — | (7,979 | ) | ||||||||||||||||||
Amortization | (211,359 | ) | (57,053 | ) | (20,211 | ) | (511 | ) | (1,247 | ) | (2,858 | ) | (293,239 | ) | ||||||||||||||
Impairment losses | (4,408 | ) | (1,782 | ) | — | — | — | (1,990 | ) | (8,180 | ) | |||||||||||||||||
Translation adjustment | 6,569 | 356 | 28,143 | 209 | 181 | 156 | 35,614 | |||||||||||||||||||||
Other | — | — | — | — | — | — | — | |||||||||||||||||||||
Total changes | (2,859 | ) | 2,082 | 69,273 | (271 | ) | (615 | ) | 2,293 | 69,903 | ||||||||||||||||||
�� | ||||||||||||||||||||||||||||
Balance as of March 31, 2021: | ||||||||||||||||||||||||||||
Cost | 2,909,102 | 304,036 | 724,513 | 26,709 | 32,019 | 14,178 | 4,010,557 | |||||||||||||||||||||
Accumulated amortization and impairment losses | (2,514,627 | ) | (239,403 | ) | (167,761 | ) | (14,232 | ) | (7,008 | ) | (4,979 | ) | (2,948,010 | ) | ||||||||||||||
Carrying amount | 394,475 | 64,633 | 556,752 | 12,477 | 25,011 | 9,199 | 1,062,547 | |||||||||||||||||||||
Changes in carrying amount: | ||||||||||||||||||||||||||||
Additions | 313,648 | 75,841 | 87,350 | 2,209 | — | 20,997 | 500,045 | |||||||||||||||||||||
Acquisitions through business combinations | 11,724 | 32,124 | 28,194 | — | 9,760 | 10,797 | 92,599 | |||||||||||||||||||||
Disposals or classified as held for sale | (932 | ) | (4,747 | ) | — | — | — | — | (5,679 | ) | ||||||||||||||||||
Amortization | (294,350 | ) | (70,514 | ) | (25,182 | ) | (604 | ) | (1,648 | ) | (8,602 | ) | (400,900 | ) | ||||||||||||||
Impairment losses | (13,870 | ) | (738 | ) | — | — | — | — | (14,608 | ) | ||||||||||||||||||
Translation adjustment | 42,782 | 4,619 | 57,676 | 1,161 | 938 | 866 | 108,042 | |||||||||||||||||||||
Other | — | — | — | — | — | — | — | |||||||||||||||||||||
Total changes | 59,002 | 36,585 | 148,038 | 2,766 | 9,050 | 24,058 | 279,499 | |||||||||||||||||||||
Balance as of March 31, 2022: | ||||||||||||||||||||||||||||
Cost | 3,549,934 | 395,045 | 914,418 | 30,278 | 43,219 | 46,086 | 4,978,980 | |||||||||||||||||||||
Accumulated amortization and impairment losses | (3,096,457 | ) | (293,827 | ) | (209,628 | ) | (15,035 | ) | (9,158 | ) | (12,829 | ) | (3,636,934 | ) | ||||||||||||||
Carrying amount | 453,477 | 101,218 | 704,790 | 15,243 | 34,061 | 33,257 | 1,342,046 | |||||||||||||||||||||
The additions in Film costs include the cost of films internally produced and acquired from third party projects. Film costs acquired from third party projects are not a significant portion of Film costs recorded by Sony. The additions in Broadcasting rights, Music catalogs, Artist contracts and Music distribution rights mainly represent acquisitions through contracts with third parties.
F-64
SONY GROUP CORPORATION AND CONSOLIDATED SUBSIDIARIES
(3) | Other intangible assets |
The changes in other intangible assets for the fiscal years ended March 31, 2021 and 2022 are as follows:
Yen in millions | ||||||||||||||||||||||||||||
Patent rights, know-how and license agreements | Customer relationships | Trademarks | Software | Television carriage contracts | Other | Total | ||||||||||||||||||||||
Balance as of April 1, 2020: | ||||||||||||||||||||||||||||
Cost | 197,891 | 38,842 | 23,150 | 749,598 | 56,270 | 169,202 | 1,234,953 | |||||||||||||||||||||
Accumulated amortization and impairment losses | (181,529 | ) | (35,024 | ) | (5,576 | ) | (518,314 | ) | (24,104 | ) | (92,906 | ) | (857,453 | ) | ||||||||||||||
Carrying amount | 16,362 | 3,818 | 17,574 | 231,284 | 32,166 | 76,296 | 377,500 | |||||||||||||||||||||
Changes in carrying amount: | ||||||||||||||||||||||||||||
Additions | 8,210 | 53 | 9 | 85,562 | — | 4,203 | 98,037 | |||||||||||||||||||||
Acquisitions through business combinations | 16 | 1,693 | 358 | 191 | 156 | 1,500 | 3,914 | |||||||||||||||||||||
Internal development | — | — | — | 17,255 | — | — | 17,255 | |||||||||||||||||||||
Disposals or classified as held for sale | (81 | ) | — | (1 | ) | (5,018 | ) | (202 | ) | (253 | ) | (5,555 | ) | |||||||||||||||
Amortization | (5,851 | ) | (1,130 | ) | (550 | ) | (78,364 | ) | (3,273 | ) | (4,300 | ) | (93,468 | ) | ||||||||||||||
Impairment losses | (97 | ) | — | — | (6,401 | ) | — | (499 | ) | (6,997 | ) | |||||||||||||||||
Translation adjustment | (14 | ) | 286 | 483 | 752 | (24 | ) | 884 | 2,367 | |||||||||||||||||||
Other | (759 | ) | (1 | ) | (20 | ) | (926 | ) | (233 | ) | (59 | ) | (1,998 | ) | ||||||||||||||
Total changes | 1,424 | 901 | 279 | 13,051 | (3,576 | ) | 1,476 | 13,555 | ||||||||||||||||||||
Balance as of March 31, 2021: | ||||||||||||||||||||||||||||
Cost | 218,192 | 41,494 | 24,250 | 827,210 | 55,752 | 148,729 | 1,315,627 | |||||||||||||||||||||
Accumulated amortization and impairment losses | (200,406 | ) | (36,775 | ) | (6,397 | ) | (582,875 | ) | (27,162 | ) | (70,957 | ) | (924,572 | ) | ||||||||||||||
Carrying amount | 17,786 | 4,719 | 17,853 | 244,335 | 28,590 | 77,772 | 391,055 | |||||||||||||||||||||
Changes in carrying amount: | ||||||||||||||||||||||||||||
Additions | 4,668 | 639 | 158 | 93,642 | — | 3,538 | 102,645 | |||||||||||||||||||||
Acquisitions through business combinations | 2,488 | 19,121 | 7,076 | 6,895 | — | 8,132 | 43,712 | |||||||||||||||||||||
Internal development | — | — | — | 15,681 | — | — | 15,681 | |||||||||||||||||||||
Disposals or classified as held for sale | (49 | ) | (565 | ) | (550 | ) | (2,599 | ) | — | (107 | ) | (3,870 | ) | |||||||||||||||
Amortization | (5,576 | ) | (4,975 | ) | (1,875 | ) | (87,113 | ) | (3,361 | ) | (6,904 | ) | (109,804 | ) | ||||||||||||||
Impairment losses | (6 | ) | — | (313 | ) | (3,218 | ) | — | (202 | ) | (3,739 | ) | ||||||||||||||||
Translation adjustment | 216 | 2,146 | 2,280 | 5,534 | 2,829 | 1,577 | 14,582 | |||||||||||||||||||||
Other | 140 | — | 1 | 819 | — | (1,119 | ) | (159 | ) | |||||||||||||||||||
Total changes | 1,881 | 16,366 | 6,777 | 29,641 | (532 | ) | 4,915 | 59,048 | ||||||||||||||||||||
Balance as of March 31, 2022: | ||||||||||||||||||||||||||||
Cost | 213,649 | 58,427 | 32,683 | 952,153 | 61,939 | 155,479 | 1,474,330 | |||||||||||||||||||||
Accumulated amortization and impairment losse s | (193,982 | ) | (37,342 | ) | (8,053 | ) | (678,177 | ) | (33,881 | ) | (72,792 | ) | (1,024,227 | ) | ||||||||||||||
Carrying amount | 19,667 | 21,085 | 24,630 | 273,976 | 28,058 | 82,687 | 450,103 | |||||||||||||||||||||
12. | Impairment of non-financial assets |
There were 0material impairment losses for the fiscal years ended March, 2021 and 2022. Refer to Note 34 for the details of impairment of goodwill at the date of transition to IFRS.
F-65
SONY GROUP CORPORATION AND CONSOLIDATED SUBSIDIARIES
13. | Insurance-related accounts |
(1) | Assets, liabilities, revenues and expenses included in the insurance business |
Insurance policies
Life insurance policies that subsidiaries in the Financial Services segment underwrite, most of which are categorized as long-duration contracts, mainly consist of whole life, term life and accident and health, variable annuities and variable life insurance contracts. The life insurance revenues for the fiscal years ended March 31, 2021 and 2022 were 913,361 million yen and 943,092 million yen, respectively. Property and casualty insurance policies that a subsidiary in the Financial Services segment underwrites are primarily automotive insurance contracts, which are categorized as short-duration contracts. The
non-life
insurance revenues for the fiscal years ended March 31, 2021 and 2022 were 123,574 million yen and 132,908 million yen, respectively.The insurance contract liability in which an insured event has not occurred or a surrender option has not been exercised at the reporting date is classified as
non-current.
However, if either the insured event has occurred or the surrender option has been exercised, Sony would no longer have the right to defer payment of these amounts. Since the insurance contract liability would be due to be settled within twelve months after the reporting period, it is classified as current.Deferred insurance acquisition costs
As of April 1, 2020, March 31, 2021 and 2022, the balances of deferred insurance acquisition costs of
non-traditional
life insurance contracts were 179,894 million yen, 220,254 million yen and 261,475 million yen, respectively.Future insurance policy benefits
Liabilities for future insurance policy benefits, except the portion of liabilities for minimum guarantee benefits described below, which mainly relate to individual life insurance policies, are established in amounts adequate to meet the estimated future obligations of policies in force. These liabilities, which require significant management judgment and estimates, are computed by the net level premium method based upon the assumptions as to future investment yield, morbidity, mortality rates, lapse rates and other factors. Future insurance policy benefits are computed using interest rates ranging from 0.5% to 4.5% and are based on factors such as market conditions and expected investment returns. Morbidity, mortality rates and lapse rates used as assumptions for all policies are based on either the subsidiary’s own experience or various actuarial tables. Generally these assumptions are locked in throughout the life of the contract upon the issuance of new insurance contracts, although significant changes in experience or assumptions may require Sony to provide for expected future losses.
Liabilities for future insurance policy benefits include the liabilities for the minimum guarantee benefits of variable annuities and variable life insurance contracts. The details regarding the minimum guarantee benefits are presented in “Minimum guarantee benefit for variable annuities and variable life insurance contracts” below. Sony measures certain of these liabilities for future insurance policy benefits at fair value. Refer to (4).
Policyholders’ account in the life insurance business
Policyholders’ account in the life insurance business represents an accumulation of account deposits plus credited interest less withdrawals, expenses and mortality charges. Policyholders’ account in the life insurance business includes universal life insurance and investment contracts. Investment contracts are defined by the previous accounting practices in accordance with the provisions of IFRS 4. Universal life insurance includes interest sensitive whole life contracts and variable life insurance contracts. The credited rates associated with interest sensitive whole life contracts range from 1.7% to 2.0%. For variable life insurance contracts, policy values are expressed in terms of investment units. Each unit is linked to an asset portfolio. The value of a unit increases or decreases based on the value of the linked asset portfolio. Investment contracts mainly include single payment endowment contracts, single payment educational endowment contracts, individual variable annuities and policies after the start of annuity payments. The credited rates associated with investment contracts, except for individual variable annuities, range from 0.01% to 6.3%. For individual variable annuities, policy values are expressed in terms of investment units. Each unit is linked to an asset portfolio. The value of a unit increases or decreases based on the value of the linked asset portfolio. The liabilities for policyholders’ account in the life
F-66
SONY GROUP CORPORATION AND CONSOLIDATED SUBSIDIARIES
insurance business includes the liabilities related to the variable annuities and variable life insurance contracts with minimum guarantee benefits. Sony measures certain of these liabilities for policyholders’ account in the life insurance business at fair value. Refer to Note (4).
Policyholders’ account in the life insurance business is comprised of the following:
Yen in millions | ||||||||||||
April 1 | March 31 | |||||||||||
2020 | 2021 | 2022 | ||||||||||
Universal life insurance | 2,611,577 | 3,067,791 | 3,278,148 | |||||||||
Investment contracts | 883,429 | 1,101,614 | 1,393,257 | |||||||||
Other | 145,004 | 159,489 | 119,890 | |||||||||
Total | 3,640,010 | 4,328,894 | 4,791,295 | |||||||||
Minimum guarantee benefit for variable annuities and variable life insurance contracts
Regarding variable annuities and variable life insurance contracts, minimum guarantee benefits (minimum death benefit, minimum accumulation benefit, etc.) are provided, and Sony bears the risk of fulfilling the minimum guarantee benefits prescribed in the contracts to policyholders. The fair value measurement is applied to the liability for variable annuity contracts with minimum guarantee benefits. Refer to Note (4). Excluding the portion of the liability measured at fair value, the liability for the minimum guarantee benefits is calculated using current best-estimate assumptions and is based on the ratio of the present value of expected total excess payments divided by the present value of expected total assessments over the life of the contract. Mortality rates, lapse rates, discount rates and investment yield are used as significant assumptions for this calculation. The policyholders’ account value, net amount at risk, liability for the minimum guarantee benefit, and average attained age as of April 1, 2020, March 31, 2021 and 2022 are as follows:
Yen in millions | ||||||||||||
April 1, 2020 | ||||||||||||
Variable annuities | Variable life insurance contracts | Total | ||||||||||
Policyholders’ account value | 464,093 | 1,096,935 | 1,561,028 | |||||||||
Net amount at risk | 71,685 | 4,564,214 | 4,635,899 | |||||||||
Liability for minimum guarantee benefit | 64,045 | 79,860 | 143,905 | |||||||||
Age | ||||||||
April 1, 2020 | ||||||||
Variable annuities | Variable life insurance contracts | |||||||
Average attained age | 60 | 45 | ||||||
Yen in millions | ||||||||||||
March 31, 2021 | ||||||||||||
Variable annuities | Variable life insurance contracts | Total | ||||||||||
Policyholders’ account value | 490,152 | 1,486,001 | 1,976,153 | |||||||||
Net amount at risk | 50,861 | 5,074,637 | 5,125,498 | |||||||||
Liability for minimum guarantee benefit | 42,309 | 58,246 | 100,555 | |||||||||
Age | ||||||||
March 31, 2021 | ||||||||
Variable annuities | Variable life insurance contracts | |||||||
Average attained age | 61 | 45 | ||||||
F-67
SONY GROUP CORPORATION AND CONSOLIDATED SUBSIDIARIES
Yen in millions | ||||||||||||
March 31, 2022 | ||||||||||||
Variable annuities | Variable life insurance contracts | Total | ||||||||||
Policyholders’ account value | 467,924 | 1,686,488 | 2,154,412 | |||||||||
Net amount at risk | 58,961 | 6,361,770 | 6,420,731 | |||||||||
Liability for minimum guarantee benefit | 37,382 | 63,392 | 100,774 | |||||||||
Age | ||||||||
March 31, 2022 | ||||||||
Variable annuities | Variable life insurance contracts | |||||||
Average attained age | 63 | 45 | ||||||
Shadow liability adequacy test in the life insurance business
When holding financial assets that are measured at fair value through other comprehensive income and correspond to insurance contract liabilities, shadow accounting is applied to evaluate insurance-related accounts as if the financial assets were sold as of the end of reporting period and valuation gains or losses were realized for the purpose of reducing the accounting mismatches between the insurance contract liabilities and the financial assets. Sony performs a shadow liability adequacy test on life insurance contracts quarterly.
Mortality rates, morbidity rates, lapse rates and discount rates are used as significant assumptions for this shadow liability adequacy test.
As a result of the shadow liability adequacy test, deferred insurance acquisition costs decreased by 386,528 million yen and future insurance policy benefits increased by 268,748 million yen through other comprehensive income as of April 1, 2020. Since the net amounts of future insurance policy benefits minus deferred insurance acquisition costs were recorded at a sufficient level, the decrease of deferred insurance acquisition costs and the increase of future insurance policy benefits were not recorded as of March 31, 2021 and 2022.
F-68
SONY GROUP CORPORATION AND CONSOLIDATED SUBSIDIARIES
(2) | Changes in insurance contract liabilities and deferred insurance acquisition costs |
Changes in insurance contract liabilities
The changes in insurance contract liabilities are as follows:
Yen in millions | ||||||||||||
Future insurance policy benefits and other | Policyholders’ account in the life insurance business | Total | ||||||||||
Balance as of April 1, 2020 | 6,646,656 | 3,640,010 | 10,286,666 | |||||||||
Current portion *1 | 127,079 | — | 127,079 | |||||||||
Non-current portion | 6,519,577 | 3,640,010 | 10,159,587 | |||||||||
Net premiums | 786,916 | 319,240 | 1,106,156 | |||||||||
Insurance liabilities released | (465,997 | ) | (195,202 | ) | (661,199 | ) | ||||||
Unwind of discount and actuarial items *2 | 157,379 | 465,769 | 623,148 | |||||||||
Changes in valuation of expected future benefits | (69,332 | ) | (6,401 | ) | (75,733 | ) | ||||||
Shadow accounting adjustments | (258,953 | ) | (3,954 | ) | (262,907 | ) | ||||||
Other | (68,340 | ) | 90,575 | 22,235 | ||||||||
Currency exchange rate fluctuations | 21,121 | 18,857 | 39,978 | |||||||||
Balance as of March 31, 2021 | 6,749,450 | 4,328,894 | 11,078,344 | |||||||||
Current portion *1 | 134,865 | — | 134,865 | |||||||||
Non-current portion | 6,614,585 | 4,328,894 | 10,943,479 | |||||||||
Net premiums | 813,856 | 468,299 | 1,282,155 | |||||||||
Insurance liabilities released | (539,586 | ) | (251,169 | ) | (790,755 | ) | ||||||
Unwind of discount and actuarial items *2 | 149,869 | 201,797 | 351,666 | |||||||||
Changes in valuation of expected future benefits | (11,144 | ) | 946 | (10,198 | ) | |||||||
Shadow accounting adjustments | (15,692 | ) | (3,169 | ) | (18,861 | ) | ||||||
Other | (65,198 | ) | 29,328 | (35,870 | ) | |||||||
Currency exchange rate fluctuations | 110,485 | 16,369 | 126,854 | |||||||||
Balance as of March 31, 2022 | 7,192,040 | 4,791,295 | 11,983,335 | |||||||||
Current portion *1 | 153,006 | — | 153,006 | |||||||||
Non-current portion | 7,039,034 | 4,791,295 | 11,830,329 | |||||||||
| *1 | The current portion of future insurance policy benefits and other is included in other current liabilities in the consolidated statements of financial position. |
| *2 | Mainly includes interests credited to reserves, expenses and mortality charges. |
F-69
SONY GROUP CORPORATION AND CONSOLIDATED SUBSIDIARIES
Changes in deferred insurance acquisition costs
The changes in deferred insurance acquisition costs are as follows:
Yen in millions | ||||||||
Fiscal year ended March 31 | ||||||||
2021 | 2022 | |||||||
Balance at beginning of the fiscal year | 194,116 | 631,231 | ||||||
Current portion* | 6,212 | 7,245 | ||||||
Non-current portion | 187,904 | 623,986 | ||||||
New deferred insurance acquisition costs | 96,638 | 109,320 | ||||||
Amortization amount for current period | (44,738 | ) | (69,237 | ) | ||||
Shadow accounting adjustments | 383,731 | 4,505 | ||||||
Currency exchange rate fluctuations | 1,484 | 8,017 | ||||||
Balance at end of the fiscal year | 631,231 | 683,836 | ||||||
Current portion* | 7,245 | 7,310 | ||||||
Non-current portion | 623,986 | 676,526 | ||||||
| * | The current portion of deferred insurance acquisition costs is included in other current assets in the consolidated statements of financial position. |
(3) | Significant assumptions regarding insurance contracts |
Significant assumptions
The significant assumptions and the ranges used to measure the insurance contract liabilities as of April 1, 2020, March 31, 2021 and 2022 are as follows:
April 1 | Fiscal year ended March 31 | |||||||||||
2020 | 2021 | 2022 | ||||||||||
Discount rate | (0.061% ) - 6.25% | (0.046% ) - 6.25% | (0.075% ) - 6.25% | |||||||||
Other significant assumptions are mortality rates and lapse rates.
Impact from changes made to assumptions
Yen in millions | ||||||||||||
April 1 | Fiscal year ended March 31 | |||||||||||
2020 | 2021 | 2022 | ||||||||||
Impact on gains (losses) | (11,064 | ) | 31,076 | 6,643 | ||||||||
Changes in economic assumptions | (14,048 | ) | 25,704 | 7,091 | ||||||||
Changes in non-economic assumptions | 2,984 | 5,372 | (448 | ) | ||||||||
Impact on capital | (465,869 | ) | 477,642 | 18,087 | ||||||||
Changes in economic assumptions | (472,171 | ) | 467,478 | 16,874 | ||||||||
Changes in non-economic assumptions | 6,302 | 10,164 | 1,213 | |||||||||
Economic assumptions including discount rates and
non-economic
assumptions including mortality rates and morbidity rates, lapse rates, and operating expense rates are developed based on best estimates by product as of each cutoff date. Best-estimate assumptions are developed to reflect past and current experiences as well as expected experiences in the future. Expected future changes in assumptions should be reflected only when they are supported by sufficient rationales. Except for a deteriorating trend in mortality rates and morbidity rates, no other expected future changes are assumed in the best-estimate assumptions applied.(4) | Insurance-related accounts measured at fair value |
In determining the fair value of future insurance policy benefits and policyholders’ account in the life insurance business to which Sony measures at fair value, Sony uses the present value of future expected cash
F-70
SONY GROUP CORPORATION AND CONSOLIDATED SUBSIDIARIES
flows based on mortality rates, lapse rates, discount rates, investment yield and various actuarial assumptions. These are classified within Level 3 of the fair value hierarchy since Sony primarily uses unobservable inputs in its valuation.
The fair value of future insurance policy benefits and policyholders’ account in the life insurance business as of April 1, 2020, March 31, 2021 and 2022 is as follows:
Yen in millions | ||||||||||||
Fair value | Presentation in the consolidated statements of financial position | |||||||||||
Future insurance policy benefits and other | Policyholders’ account in the life insurance business | |||||||||||
April 1, 2020 | 532,191 | 64,045 | 468,146 | |||||||||
March 31, 2021 | 536,189 | 42,309 | 493,880 | |||||||||
March 31, 2022 | 507,699 | 37,382 | 470,317 | |||||||||
The valuation techniques, significant unobservable inputs, and the ranges used to measure the fair value of the future insurance policy benefits and policyholders’ account in the life insurance business as of April 1, 2020, March 31, 2021 and 2022 are as follows:
Valuation techniques | Significant unobservable inputs | Range | ||||||
April 1, 2020 | March 31, 2021 | March 31, 2022 | ||||||
Present value of future expected cash flows | Credit spread* | 64.4bp | 37.9bp | 47.5bp | ||||
| Mortality rates | 0.004%-44.865% | 0.004%-44.865% | 0.003% - 35.693% | |||||
| Lapse rates | 1.000%-7.500% | 1.000%-7.500% | 0% - 7.500% | |||||
* bp = basis point
The decrease (increase) in fair value is the result of higher (lower) credit spreads, mortality rates or lapse rates. The fair value of the future insurance policy benefits and policyholders’ account in the life insurance business measured at fair value would not change significantly, even if one or more of the significant unobservable inputs are changed to reflect reasonably possible alternative assumptions.
The changes in fair value of future insurance policy benefits and policyholders’ account in the life insurance business measured at fair value for the fiscal years ended March 31, 2021 and 2022 are as follows:
Yen in millions | ||||||||
Fiscal year ended March 31 | ||||||||
2021 | 2022 | |||||||
Balance at beginning of the fiscal year | 532,191 | 536,189 | ||||||
Total (gains) losses *1 : | ||||||||
Included in net income *2 | 16,475 | 830 | ||||||
Included in other comprehensive income *3 | 3,120 | (797 | ) | |||||
Issuances | 1,996 | — | ||||||
Settlements | (17,593 | ) | (28,523 | ) | ||||
Balance at end of the fiscal year | 536,189 | 507,699 | ||||||
Changes in unrealized gains (losses) relating to future insurance policy benefits and policyholders’ account in the life insurance business still held as of reporting date included in net income *2 | (29,205 | ) | (13,638 | ) | ||||
| *1 | Gains presented as negative and losses presented as positive. |
| *2 | Included in financial services revenue and financial services expense in the consolidated statements of income. |
| *3 | Included in insurance contract valuation adjustments in the consolidated statements of comprehensive income. |
F-71
SONY GROUP CORPORATION AND CONSOLIDATED SUBSIDIARIES
(5) | Insurance and market risks |
Risk management policy and exposure
The life insurance subsidiary manages various market-related risks in the following manner:
(a) | Insurance risk management |
Insurance risk
With respect to insurance underwriting risk, based on the level of policy reserves and capital levels, the life insurance subsidiary manages the insurance portfolio appropriately, such as setting policy limits for each type of insurance as necessary. In addition, underwriting standards, reinsurance standards, reinsurance company selection standards, and standards for revising and abolishing each product are clearly defined as internal rules and are regularly reviewed.
Concentration of insurance risk
The insurance contract portfolio does not have excessive concentration risk.
(b) | Market risk management |
Interest rate risk management
Interest rate risk is managed by the risk management division based on the policies for interest rate risk management that specify details such as risk management methods and procedures. Based on ALM policies that are determined through such methods as deliberation by the life insurance subsidiary’s Executive Committee, the subsidiary determines and confirms actual risk conditions with its Board of Directors. As part of the ALM management, the life insurance subsidiary invests in financial assets that match the characteristics of the insurance contract obligations, and thereby reduces interest rate risk as much as possible. Through the purchase and sale of financial assets included in their portfolio, the interest rate sensitivity (duration) of financial assets and insurance contract obligations is matched as much as possible so that they ensure sufficient cash flow to settle insurance claims as they come due.
Exchange rate risk
Exchange rate risk is managed by the risk management division based on the policies for exchange rate risk management that specify details such as risk management methods and procedures. The division periodically reports such information to the life insurance subsidiary’s Board of Directors and Executive Committee.
Equity market price fluctuation risk
Equity market price fluctuation risk is managed by the risk management division based on the policies for equity market price fluctuation risk management that specify details such as risk management methods and procedures. The division periodically reports such information to the life insurance subsidiary’s Board of Directors and Executive Committee.
Derivative transactions
Derivative transactions are managed by the risk management division based on the policies for derivative transactions that specify details such as risk management methods and procedures. The division periodically reports such information to the life insurance subsidiary’s Board of Directors and Executive Committee.
Sensitivity analysis
Market risk
For the purpose of pursuing a stable and sustainable increase of corporate value, in the life insurance business Sony uses Market Consistent Embedded Value (“MCEV”), which is an indicator used to support the analysis of the value of a life insurance business and is compliant with the European Insurance CFO Forum Market Consistent Embedded Value Principles
©
(“MCEV Principles”). MCEV is also used for sensitivity analysis of market risk and insurance risk.F-72
SONY GROUP CORPORATION AND CONSOLIDATED SUBSIDIARIES
MCEV represents the present value of the current and future distributable earnings to shareholders generated from assets allocated to the covered business after sufficient allowance for the aggregate risks in the covered business. MCEV consists of the adjusted net worth and the value of the existing business. Adjusted net worth is the amount of assets allocated to the covered business as of the valuation date and is calculated as the amount of its market value in excess of statutory policy reserves and other liabilities. The value of the existing business consists of the present value of certainty-equivalent profit, the time value of options and guarantees, frictional costs and the cost of
non-hedgeable
risks. The main assumptions, including mortality rates, morbidity rates, lapse and surrender rates, and operating expense rates, were developed based on best estimates by product. The Board of Directors of the life insurance subsidiary has confirmed that, with the exception of certain noncompliance items, the MCEV presented below has been produced following the methodology set out in the MCEV Principles. The main noncompliance item referred to above is the reference rate, which is used in the calculations and has been defined as the government bond nominal spot rate curve rather than the swap rate curve as stipulated in the MCEV Principles.MCEV is not an estimate of “fair value” as it does not include the value of new businesses to be sold in the future and does not include the
non-life
insurance business, such as the property and casualty insurance business and the banking business. The calculation of MCEV is based on numerous assumptions with respect to economic conditions, operating conditions, taxes and other matters, many of which are beyond Sony’s control. In general, deviations between projection assumptions and actual experience in the future are to be expected and such deviations may materially impact the value calculated.The tables below show the sensitivities of changing the underlying assumptions of MCEV as of April 1, 2020, March 31, 2021 and 2022.
April 1, 2020 | ||||||||||||||
Assumption | Changes in assumptions, etc. | Yen in millions | Rate of change | |||||||||||
MCEV | Change in amount | |||||||||||||
Base | No change | 1,713,544 | — | — | ||||||||||
Interest rates* | 50bp decrease | 1,675,351 | (38,193 | ) | (2.23% | ) | ||||||||
| 50bp increase | 1,723,260 | 9,716 | 0.57% | |||||||||||
Stock/Real estate market value | 10% decrease | 1,687,104 | (26,439 | ) | (1.54% | ) | ||||||||
Maintenance expenses | 10% decrease | 1,742,146 | 28,603 | 1.67% | ||||||||||
Lapse and surrender rate | 10% decrease | 1,661,415 | (52,128 | ) | (3.04% | ) | ||||||||
Mortality rates (death protection) | 5% decrease | 1,781,851 | 68,308 | 3.99% | ||||||||||
Mortality rates (third sector /annuity products) | 5% decrease | 1,697,478 | (16,066 | ) | (0.94% | ) | ||||||||
Morbidity rates | 5% decrease | 1,786,439 | 72,895 | 4.25% | ||||||||||
Foreign exchange rates | 10% appreciation of the Yen | 1,684,219 | (29,324 | ) | (1.71% | ) | ||||||||
* bp = basis point
March 31, 2021 | ||||||||||||||
Assumption | Changes in assumptions, etc. | Yen in millions | Rate of change | |||||||||||
MCEV | Change in amount | |||||||||||||
Base | No change | 1,966,570 | — | — | ||||||||||
Interest rates* | 50bp decrease | 1,972,839 | 6,269 | 0.32% | ||||||||||
| 50bp increase | 1,936,227 | (30,343 | ) | (1.54% | ) | |||||||||
Stock/Real estate market value | 10% decrease | 1,942,875 | (23,695 | ) | (1.20% | ) | ||||||||
Maintenance expenses | 10% decrease | 1,994,729 | 28,158 | 1.43% | ||||||||||
Lapse and surrender rate | 10% decrease | 1,965,268 | (1,302 | ) | (0.07% | ) | ||||||||
Mortality rates (death protection) | 5% decrease | 2,032,004 | 65,434 | 3.33% | ||||||||||
Mortality rates (third sector /annuity products) | 5% decrease | 1,952,436 | (14,134 | ) | (0.72% | ) | ||||||||
Morbidity rates | 5% decrease | 2,038,626 | 72,055 | 3.66% | ||||||||||
Foreign exchange rates | 10% appreciation of the Yen | 1,941,841 | (24,729 | ) | (1.26% | ) | ||||||||
* bp = basis point
F-7
3
SONY GROUP CORPORATION AND CONSOLIDATED SUBSIDIARIES
March 31, 2022 | ||||||||||||||
Assumption | Changes in assumptions, etc. | Yen in millions | Rate of change | |||||||||||
MCEV | Change in amount | |||||||||||||
Base | No change | 2,066,357 | — | — | ||||||||||
Interest rates* | 50bp decrease | 2,107,521 | 41,164 | 1.99% | ||||||||||
| 50bp increase | 2,004,841 | (61,516 | ) | (2.98% | ) | |||||||||
Stock/Real estate market value | 10% decrease | 2,049,089 | (17,268 | ) | (0.84% | ) | ||||||||
Maintenance expenses | 10% decrease | 2,097,153 | 30,796 | 1.49% | ||||||||||
Lapse and surrender rate | 10% decrease | 2,083,260 | 16,903 | 0.82% | ||||||||||
Mortality rates (death protection) | 5% decrease | 2,136,304 | 69,948 | 3.39% | ||||||||||
Mortality rates (third sector /annuity products) | 5% decrease | 2,052,870 | (13,487 | ) | (0.65% | ) | ||||||||
Morbidity rates | 5% decrease | 2,136,413 | 70,057 | 3.39% | ||||||||||
Foreign exchange rates | 10% appreciation of the Yen | 2,051,249 | (15,108 | ) | (0.73% | ) | ||||||||
* bp = basis point
Liquidity risk
(a) | Risk management policy and exposure |
In line with liquidity risk management policies, the accounting division of each insurance subsidiary prepares and updates cash flow plans in a timely manner based on the reports from departments and manages cash flows, and the risk management division of each insurance subsidiary manages the liquidity risk. The accounting division and risk management division periodically or as needed report such information to each insurance subsidiary’s Board of Directors and Executive Committee.
(b) | Maturity analysis |
The following table summarizes the estimated timing of the remaining undiscounted net cash flows from insurance contract liabilities and the contractual timing of the remaining undiscounted cash flows arising from securities held by the insurance subsidiaries as of April 1, 2020, March 31, 2021 and 2022. The cash flows of insurance liabilities are based on assumptions regarding morbidity rates, mortality rates, and lapse rates, which are consistent with the estimates used for the carrying amounts.
Yen in millions | ||||||||||||||||||||||||||||||||
April 1, 2020 | ||||||||||||||||||||||||||||||||
Total | Indefinite Terms | Within 1 year | 1 to 2 years | 2 to 3 years | 3 to 4 years | 4 to 5 years | More than 5 years | |||||||||||||||||||||||||
Insurance contract liabilities | 17,292,920 | — | 58,958 | 79,164 | 136,924 | 178,881 | 223,072 | 16,615,921 | ||||||||||||||||||||||||
Securities held by insurance subsidiaries | 15,459,087 | 1,005,229 | 645,257 | 188,889 | 187,273 | 238,590 | 352,546 | 12,841,303 | ||||||||||||||||||||||||
Yen in millions | ||||||||||||||||||||||||||||||||
March 31, 2021 | ||||||||||||||||||||||||||||||||
Total | Indefinite Terms | Within 1 year | 1 to 2 years | 2 to 3 years | 3 to 4 years | 4 to 5 years | More than 5 years | |||||||||||||||||||||||||
Insurance contract liabilities | 22,097,488 | — | 127,728 | 148,972 | 189,784 | 224,574 | 262,433 | 21,143,997 | ||||||||||||||||||||||||
Securities held by insurance subsidiaries | 17,014,630 | 1,584,670 | 670,402 | 198,858 | 245,184 | 342,846 | 328,947 | 13,643,723 | ||||||||||||||||||||||||
Yen in millions | ||||||||||||||||||||||||||||||||
March 31, 2022 | ||||||||||||||||||||||||||||||||
Total | Indefinite Terms | Within 1 year | 1 to 2 years | 2 to 3 years | 3 to 4 years | 4 to 5 years | More than 5 years | |||||||||||||||||||||||||
Insurance contract liabilities | 25,561,549 | — | 165,028 | 155,586 | 198,370 | 234,987 | 263,679 | 24,543,899 | ||||||||||||||||||||||||
Securities held by insurance subsidiaries | 18,536,483 | 2,008,071 | 656,948 | 223,111 | 348,527 | 335,791 | 311,466 | 14,652,569 | ||||||||||||||||||||||||
F-74
SONY GROUP CORPORATION AND CONSOLIDATED SUBSIDIARIES
Since the total of the above estimated amounts is the amount before discounting, it exceeds the amount of insurance contract liabilities and securities which is included in investments and advances in the Financial Services segment shown in the consolidated statements of financial position.
14. | Short-term borrowings and long-term debt |
Short-term borrowings and long-term debt are comprised of the following:
April 1, 2020 | ||||||||||||
Book value (Yen in millions) | Weighted average interest rate | Due | ||||||||||
Short-term borrowings | 824,045 | 0.74 | % | |||||||||
Long-term debt | ||||||||||||
Long-term loans | 254,916 | 0.26 | % | 2020-2030 | ||||||||
Unsecured bonds | 259,441 | 0.29 | % | 2020-2029 | ||||||||
Unsecured zero coupon convertible bonds | 117,359 | — | % | 2022 | ||||||||
Lease liabilities | 406,237 | 2.48 | % | |||||||||
| 1,037,953 | ||||||||||||
Less — Portion due within one year | 98,923 | |||||||||||
| 939,030 | ||||||||||||
March 31, 2021 | ||||||||||||
Book value (Yen in millions) | Weighted average interest rate | Due | ||||||||||
Short-term borrowings | 1,201,747 | 0.14 | % | |||||||||
Long-term debt | ||||||||||||
Long-term loans | 526,790 | 0.62 | % | 2021-2030 | ||||||||
Unsecured bonds | 289,491 | 0.28 | % | 2021-2029 | ||||||||
Unsecured zero coupon convertible bonds | 40,738 | — | % | 2022 | ||||||||
Lease liabilities | 402,023 | 2.12 | % | |||||||||
| 1,259,042 | ||||||||||||
Less — Portion due within one year | 205,406 | |||||||||||
| 1,053,636 | ||||||||||||
March 31, 2022 | ||||||||||||
Book value (Yen in millions) | Weighted average interest rate | Due | ||||||||||
Short-term borrowings | 1,976,553 | 0.18 | % | |||||||||
Long-term debt | ||||||||||||
Long-term loans | 693,603 | 0.70 | % | 2022-2056 | ||||||||
Unsecured bonds | 189,608 | 0.25 | % | 2022-2029 | ||||||||
Unsecured zero coupon convertible bonds | 26,495 | — | % | 2022 | ||||||||
Lease liabilities | 465,349 | 2.10 | % | |||||||||
| 1,375,055 | ||||||||||||
Less — Portion due within one year | 171,409 | |||||||||||
| 1,203,646 | ||||||||||||
Certain subsidiaries in the Financial Services segment pledged assets as collateral for short-term borrowings and long-term debt and the pledged assets are comprised of the following:
Yen in millions | ||||||||||||
April 1 | March 31 | |||||||||||
2020 | 2021 | 2022 | ||||||||||
Securities | 740,331 | 1,036,855 | 1,490,663 | |||||||||
Housing loans in the banking business | 374,314 | 553,722 | 782,175 | |||||||||
F-7
5
SONY GROUP CORPORATION AND CONSOLIDATED SUBSIDIARIES
In addition to the above, certain subsidiaries in the Financial Services segment pledged securities forlending transactions and the pledged securities are as follows:
securities-for-securities
Yen in millions | ||||||||||||
April 1 | March 31 | |||||||||||
2020 | 2021 | 2022 | ||||||||||
Securities | — | 361,278 | 521,912 | |||||||||
Furthermore, pledged securities of certain subsidiaries in the Financial Services segment as collateral for cash settlements, variation margins of futures markets and certain other purposes are as follows:
Yen in millions | ||||||||||||
April 1 | March 31 | |||||||||||
2020 | 2021 | 2022 | ||||||||||
Securities | 14,672 | 17,355 | 21,271 | |||||||||
On July 21, 2015, Sony issued 120,000 million yen of 130% Callable Unsecured Zero Coupon Convertible Bonds due on September 28, 2022 (the “Zero Coupon Convertible Bonds”). The bondholders are entitled to convert the Zero Coupon Convertible Bonds into shares of common stock from September 1, 2015 to September 28, 2022. The initial conversion price was 5,008 yen per share. The conversion price is subject to anti-dilution provisions, where the conversion price is adjusted in certain cases such as the issuance or disposal of the shares of Sony Group Corporation’s common stock at below market price, stock splits, bonus issues of shares, and dividends in excess of 25 yen per common share per fiscal year. In addition, an early redemption is triggered upon the occurrence of certain corporate events including a merger or corporate split, and the completion of a takeover bid resulting in the delisting of the shares of common stock of Sony Group Corporation. The conversion price is reduced for a certain period prior to the early redemption date, which is determined by a formula that is based on time to maturity and Sony’s common stock price, in order to compensate bondholders for the time value up to the original maturity date. The reduced conversion price ranges from 3,526.5 yen to 5,008 yen per share. The conversion price has been adjusted to 4,952.8 yen per common share since June 10, 2022 because the payment of the total annual dividend per common share for the fiscal year ended March 31, 2022 was 65 yen, which is in excess of 25 yen. At the early redemption date, the remaining Zero Coupon Convertible Bonds would be redeemed at 100% of the principal amount. The conversion right is bifurcated from the host contract and classified as equity.
Sony has the option to redeem all of the Zero Coupon Convertible Bonds outstanding at 100% of the principal amount on or after July 21, 2020, if the closing price per share of Sony Group Corporation’s common stock on the Tokyo Stock Exchange is 130% or more of the conversion price of the Zero Coupon Convertible Bonds applicable on each trading day for 20 consecutive trading days. As the option is considered closely related to the host contract, Sony does not bifurcate the option from the host contract.
There are no significant adverse debt covenants under the Zero Coupon Convertible Bonds.
There are no significant adverse debt covenants or cross-default provisions related to the other short-term borrowings and long-term debt.
15. | Derivative instruments and hedging activities |
Sony has certain financial instruments including financial assets and liabilities acquired in the normal course of business. Such financial instruments are exposed to market risk arising from the changes in foreign currency exchange rates and interest rates. In applying a consistent risk management strategy for the purpose of reducing such risk, Sony uses derivative financial instruments, which include foreign exchange forward contracts, swap agreements, currency option contracts, and interest rate swap agreements (including interest rate and currency swap agreements). Certain other derivative financial instruments are entered into in the Financial Services segment for ALM purposes. These instruments are executed with creditworthy financial institutions, and virtually all foreign currency contracts are denominated in U.S. dollars, euros and other currencies of major countries. Other than derivatives utilized in the Financial Services segment for ALM, Sony does not use derivative financial instruments for trading or speculative purposes. These derivative transactions utilized for ALM in the Financial Services segment are executed within certain limits in accordance with an internal risk management policy.
F-76
SONY GROUP CORPORATION AND CONSOLIDATED SUBSIDIARIES
A description of the purpose and classification of the derivative financial instruments held by Sony is as follows:
Foreign exchange forward contracts, swap agreements and currency option contracts
Foreign exchange forward contracts, swap agreements and purchased and written foreign currency option contracts are utilized primarily to limit the exposure affected by changes in foreign currency exchange rates on cash flows generated or anticipated by Sony’s transactions and accounts receivable and payable denominated in foreign currencies. The majority of written foreign currency option contracts are a part of range forward contract arrangements and expire in the same month with the corresponding purchased foreign currency option contracts.
Sony also entered into foreign exchange forward contracts and foreign exchange range forward contracts which effectively fixed the cash flows from certain forecasted purchase and sale transactions denominated in foreign currencies for the fiscal years ended March 31, 2021 and 2022. The ineffective portions of the hedging relationships were not significant. Accordingly, these derivatives have been designated as cash flow hedges.
Foreign exchange forward contracts and foreign currency option contracts that do not qualify as hedges are measured at fair value with changes in value recognized in financial income and financial expenses.
Foreign exchange forward contracts, foreign currency option contracts and swap agreements held by certain subsidiaries in the Financial Services segment are measured at fair value with changes in value recognized in financial services revenue.
Interest rate swap agreements (including interest rate and currency swap agreements)
Interest rate swap agreements are utilized primarily to lower funding costs, to diversify sources of funding and to limit Sony’s exposure associated with underlying borrowings and debt securities resulting from adverse fluctuations in interest rates, foreign currency exchange rates and changes in fair values. Interest rate swap agreements entered into in the Financial Services segment are used for reducing the risk arising from the changes in the fair value of fixed rate debt securities.
Certain subsidiaries in the Financial Services segment have interest rate swap agreements as part of their ALM, which are measured at fair value with changes in value recognized in financial services revenue.
Any other interest rate swap agreements that do not qualify as hedges, which are used for reducing the risk arising from changes of variable rate debt, are measured at fair value with changes in value recognized in financial income and financial expenses.
Other agreements
Certain subsidiaries in the Financial Services segment have equity future contracts, equity swap agreements, bond future contracts, commodity future contracts, interest rate swaption agreements, other currency contracts and hybrid financial instruments as part of their ALM, which arewith changes in value recognized in financial services revenue. The hybrid financial instruments, disclosed in Note 5 as debt securities, contained embedded derivatives that are not required to be bifurcated because the entire instruments are measured at fair value.
marked-to-market
F-7
7
SONY GROUP CORPORATION AND CONSOLIDATED SUBSIDIARIES
The estimated fair values of Sony’s outstanding derivative instruments are summarized as follows:
Yen in millions | ||||||||||||||||||||||||
April 1, 2020 | March 31, 2021 | March 31, 2022 | ||||||||||||||||||||||
Asset derivatives | Liability derivatives | Asset derivatives | Liability derivatives | Asset derivatives | Liability derivatives | |||||||||||||||||||
Interest rate contracts | ||||||||||||||||||||||||
Interest rate swap agreements | 1,604 | 17,621 | 12,788 | 14,757 | 26,795 | 6,455 | ||||||||||||||||||
Interest rate swaptions agreements | — | 58 | — | 205 | — | 1,075 | ||||||||||||||||||
Foreign exchange contracts | ||||||||||||||||||||||||
Foreign exchange forward contracts | 10,023 | 6,822 | 7,820 | 13,241 | 14,687 | 34,284 | ||||||||||||||||||
Swap agreements | 6,020 | 7,027 | 4,912 | 4,422 | 11,897 | 925 | ||||||||||||||||||
Currency option contracts purchased | 7 | — | 15 | — | 42 | — | ||||||||||||||||||
Currency option contracts written | — | 5 | — | 1,790 | — | 172 | ||||||||||||||||||
Other currency contracts | 5,453 | 2,482 | 2,944 | 780 | 3,578 | 1,201 | ||||||||||||||||||
Equity contracts | ||||||||||||||||||||||||
Equity future contracts | 605 | 1,476 | 240 | 986 | — | 11,903 | ||||||||||||||||||
Equity swap agreements | 18,280 | — | — | 4,171 | — | 16,105 | ||||||||||||||||||
Option contracts purchased | 4,081 | — | 10,177 | — | 4,024 | — | ||||||||||||||||||
Other | ||||||||||||||||||||||||
Other contracts | 391 | 375 | 17 | 2 | — | — | ||||||||||||||||||
Total derivatives | 46,464 | 35,866 | 38,913 | 40,354 | 61,023 | 72,120 | ||||||||||||||||||
The estimated fair values and maturity analysis for notional amounts of Sony’s outstanding derivative instruments which are designated as hedging instruments are summarized as follows:
Yen in millions | ||||||||||||||||||||||||
April 1, 2020 | ||||||||||||||||||||||||
Notional amounts | Fair Value | |||||||||||||||||||||||
Within 1 Year | Over 1 Year | Total | Asset derivatives | Liability derivatives | Balance sheet location | |||||||||||||||||||
| Cash flow hedging relationships | ||||||||||||||||||||||||
| Foreign exchange forward contracts | 173,398 | — | 173,398 | 1,799 | — | Current assets: Other financial assets | | |||||||||||||||||
| Average rate (JPY/USD) | 108.9 | — | ||||||||||||||||||||||
Yen in millions | ||||||||||||||||||||||||
March 31, 2021 | ||||||||||||||||||||||||
Notional amounts | Fair Value | |||||||||||||||||||||||
Within 1 Year | Over 1 Year | Total | Asset derivatives | Liability derivatives | Balance sheet location | |||||||||||||||||||
| Cash flow hedging relationships | ||||||||||||||||||||||||
| Foreign exchange forward contracts | 100,177 | — | 100,177 | — | 4,221 | Current liabilities: Otherliabilities | | |||||||||||||||||
| Average rate (JPY/USD) | 106.0 | — | ||||||||||||||||||||||
| Currency option bought contracts | 32,754 | — | 32,754 | 8 | — | Current assets: Other financial assets | | |||||||||||||||||
| Average rate (JPY/USD) | 103.0 | — | ||||||||||||||||||||||
| Currency option sold contracts | 33,390 | — | 33,390 | — | 1,779 | | Current liabilities: Other financial liabilities | | ||||||||||||||||
| Average rate (JPY/USD) | 105.0 | — | ||||||||||||||||||||||
| Interest rate swap agreements | — | 132,852 | 132,852 | 10,438 | — | Non-current assets:Other financial assets | | |||||||||||||||||
Average rate | — | 1.5 | % | |||||||||||||||||||||
F-78
SONY GROUP CORPORATION AND CONSOLIDATED SUBSIDIARIES
Yen in millions | ||||||||||||||||||||||||
March 31, 2022 | ||||||||||||||||||||||||
Notional amounts | Fair Value | |||||||||||||||||||||||
Within 1 Year | Over 1 Year | Total | Asset derivatives | Liability derivatives | Balance sheet location | |||||||||||||||||||
| Cash flow hedging relationships | ||||||||||||||||||||||||
| Foreign exchange forward contracts | 138,135 | — | 138,135 | — | 7,618 | Current liabilities: Other financial liabilities | | |||||||||||||||||
| Average rate (JPY/USD) | 115.3 | — | ||||||||||||||||||||||
| Currency option bought contracts | 4,830 | — | 4,830 | 28 | — | Current assets :Other financial assets | | |||||||||||||||||
| Average rate (JPY/USD) | 115.0 | — | ||||||||||||||||||||||
| Currency option sold contracts | 4,975 | — | 4,975 | — | 161 | | Current liabilities: Other financial liabilities | | ||||||||||||||||
| Average rate (JPY/USD) | 118.5 | — | ||||||||||||||||||||||
| Interest rate swap agreements | — | 146,778 | 146,778 | 17,987 | — | | Non-current Other | | ||||||||||||||||
Average rate | — | 1.5 | % | |||||||||||||||||||||
Changes in the fair value of hedging instruments related to cash flow hedges are recorded in accumulated other comprehensive income for the fiscal years ended March 31, 2021 and 2022.
Yen in millions | ||||||||||||
Foreign exchange contracts | Interest rate contracts | Total | ||||||||||
Balance as of April 1, 2020 | 1,248 | — | 1,248 | |||||||||
Changes in fair value of hedging instruments recognized in other comprehensive income | (2,672 | ) | 10,153 | 7,481 | ||||||||
Reclassification adjustments to profit (loss) for the year *1 ,2 | (5,119 | ) | (2,109 | ) | (7,228 | ) | ||||||
Deferred tax | 2,261 | (2,463 | ) | (202 | ) | |||||||
Balance as of March 31, 2021 | (4,282 | ) | 5,581 | 1,299 | ||||||||
Changes in fair value of hedging instruments recognized in other comprehensive income | (14,645 | ) | 6,942 | (7,703 | ) | |||||||
Reclassification adjustments to profit (loss) for the year *1,2 | 12,886 | 1,643 | 14,529 | |||||||||
Deferred tax | 538 | (2,629 | ) | (2,091 | ) | |||||||
Balance as of March 31, 2022 | (5,503 | ) | 11,537 | 6,034 | ||||||||
| *1 | In the consolidated statements of income, the amount reclassified to profit (loss) is included in sales for hedges of foreign exchange contracts and in financial expenses for hedges of interest rate contracts. |
| *2 | For the fiscal years ended March 31, 2021 and 2022, hedge ineffectiveness recognized in profit or loss was not material. |
F-7
9
SONY GROUP CORPORATION AND CONSOLIDATED SUBSIDIARIES
16. | Offsetting of financial assets and financial liabilities |
Tables below show the gross amounts of financial assets and liabilities, amounts offset, and net amounts presented in the consolidated statements of financial position, as well as the financial assets and liabilities that are subject to enforceable master netting agreements or similar agreements, as of April 1, 2020, March 31, 2021 and 2022.
Yen in millions | ||||||||||||||||||||||||
April 1, 2020 | ||||||||||||||||||||||||
Gross amounts recognized financial assets and financial liabilities | Amounts offset in the consolidated statements of financial position | Net amounts presented in the consolidated statements of financial position | Amounts not offset in the consolidated statements of financial position | |||||||||||||||||||||
Financial instruments | Cash collateral | Net amounts | ||||||||||||||||||||||
Derivative assets *1 | 38,281 | — | 38,281 | 12,614 | 20,545 | 5,122 | ||||||||||||||||||
Trade receivables | 15,833 | 3,497 | 12,336 | 6,743 | — | 5,593 | ||||||||||||||||||
Total assets | 54,114 | 3,497 | 50,617 | 19,357 | 20,545 | 10,715 | ||||||||||||||||||
Derivative liabilities *1 | 31,896 | — | 31,896 | 7,086 | 23,873 | 937 | ||||||||||||||||||
Trade payables | 30,749 | 3,497 | 27,252 | 6,743 | — | 20,509 | ||||||||||||||||||
Short-term borrowings *2 | 567,194 | — | 567,194 | 564,874 | — | 2,320 | ||||||||||||||||||
Total liabilities | 629,839 | 3,497 | 626,342 | 578,703 | 23,873 | 23,766 | ||||||||||||||||||
Yen in millions | ||||||||||||||||||||||||
March 31, 2021 | ||||||||||||||||||||||||
Gross amounts recognized financial assets and financial liabilities | Amounts offset in the consolidated statements of financial position | Net amounts presented in the consolidated statements of financial position | Gross amounts not offset in the consolidated statements of financial position | |||||||||||||||||||||
Financial instruments | Cash collateral | Net amounts | ||||||||||||||||||||||
Derivative assets *1 | 15,159 | — | 15,159 | 10,666 | 2,008 | 2,485 | ||||||||||||||||||
Trade receivables | 9,944 | 2,704 | 7,240 | — | — | 7,240 | ||||||||||||||||||
Total assets | 25,103 | 2,704 | 22,399 | 10,666 | 2,008 | 9,725 | ||||||||||||||||||
Derivative liabilities *1 | 38,966 | — | 38,966 | 11,052 | 16,225 | 11,689 | ||||||||||||||||||
Trade payables | 27,003 | 2,704 | 24,299 | — | — | 24,299 | ||||||||||||||||||
Short-term borrowings *2 | 917,792 | — | 917,792 | 911,881 | — | 5,911 | ||||||||||||||||||
Total liabilities | 983,761 | 2,704 | 981,057 | 922,933 | 16,225 | 41,899 | ||||||||||||||||||
Yen in millions | ||||||||||||||||||||||||
March 31, 2022 | ||||||||||||||||||||||||
Gross amounts recognized financial assets and financial liabilities | Amounts offset in the consolidated statements of financial position | Net amounts presented in the consolidated statements of financial position | Gross amounts not offset in the consolidated statements of financial position | |||||||||||||||||||||
Financial instruments | Cash collateral | Net amounts | ||||||||||||||||||||||
Derivative assets *1 | 37,847 | — | 37,847 | 24,504 | 10,782 | 2,561 | ||||||||||||||||||
Trade receivables | 30,370 | 26,739 | 3,631 | — | — | 3,631 | ||||||||||||||||||
Total assets | 68,217 | 26,739 | 41,478 | 24,504 | 10,782 | 6,192 | ||||||||||||||||||
Derivative liabilities *1 | 72,004 | — | 72,004 | 33,514 | 29,530 | 8,960 | ||||||||||||||||||
Trade payables | 60,056 | 26,739 | 33,317 | — | — | 33,317 | ||||||||||||||||||
Short-term borrowings *2 | 1,272,040 | — | 1,272,040 | 1,269,188 | — | 2,852 | ||||||||||||||||||
Total liabilities | 1,404,100 | 26,739 | 1,377,361 | 1,302,702 | 29,530 | 45,129 | ||||||||||||||||||
F-
80
SONY GROUP CORPORATION AND CONSOLIDATED SUBSIDIARIES
| *1 | Certain subsidiaries have entered into master netting agreements or other similar agreements, which are mainly International Swaps and Derivatives Association (ISDA) Master Agreements. An ISDA Master Agreement is an agreement between two counterparties that may have multiple derivative contracts with each other, and such ISDA Master Agreement may provide for the net settlement of all or a specified group of these derivative contracts, through a single payment, in a single currency, in the event of a default on or affecting any one derivative contract, or a termination event affecting all or a specified group of derivative contracts. Master nettingagreements create a right of set off, but the master netting agreements do not automaticallyprovide for such set off. |
| *2 | Short-term borrowings relate to repurchase agreements. |
17. | Employee benefits |
(1) | Defined benefit and severance plans |
Upon terminating employment, employees of Sony Group Corporation and its subsidiaries in Japan are entitled, under most circumstances, to
lump-sum
indemnities or pension payments as described below. Sony Group Corporation and certain of its subsidiaries’ pension plans utilize a point-based plan under which a point is added every year reflecting the individual employee’s performance over that year. Under the point-based plan, the amount of payment is determined based on the sum of cumulative points from past services and interest points earned on the cumulative points regardless of whether or not the employee is voluntarily retiring.Under the plans, in general, the defined benefits cover 65% of the indemnities under existing regulations to employees. The remaining indemnities are covered by severance payments by the companies. The pension benefits are payable at the option of the retiring employee either in a
lump-sum
amount or monthly pension payments. Contributions to the plans are funded through several financial institutions in accordance with the applicable laws and regulations.From April 1, 2012, Sony Group Corporation and substantially all of its subsidiaries in Japan have modified existing defined benefit pension plans such that life annuities will no longer accrue additional service benefits, with those participants instead accruing fixed-term annuities. The defined benefit pension plans were closed to new participants and a defined contribution plan was also introduced.
From October 1, 2019, Sony Group Corporation and substantially all of its subsidiaries in Japan have amended their defined benefit pension plans and have implemented defined contribution plans for all employees other than those employees that had retired before the amendments.
In addition, several of Sony’s foreign subsidiaries have defined benefit pension plans or severance indemnity plans, which cover substantially all of their employees. Under such plans, the related cost of benefits is currently funded or accrued. Benefits awarded under these plans are based primarily on the current rate of pay and length of service.
F-
81
SONY GROUP CORPORATION AND CONSOLIDATED SUBSIDIARIES
Net defined benefit liability (asset) recognized in the consolidated statements of financial position
Amounts recognized in the consolidated statements of financial position are as follows:
Yen in millions | ||||||||||||||||||||||||
Japanese plans | Foreign plans | |||||||||||||||||||||||
April 1 | March 31 | April 1 | March 31 | |||||||||||||||||||||
2020 | 2021 | 2022 | 2020 | 2021 | 2022 | |||||||||||||||||||
Present value of defined benefit obligations | 658,863 | 640,061 | 614,763 | 357,096 | 371,239 | 277,903 | ||||||||||||||||||
Fair value of plan assets | (437,206 | ) | (476,411 | ) | (474,933 | ) | (277,719 | ) | (288,394 | ) | (198,791 | ) | ||||||||||||
The impact of minimum funding requirement and asset ceiling | 1,898 | 3,990 | 4,870 | 14,241 | 13,156 | 2,491 | ||||||||||||||||||
Net amount | 223,555 | 167,640 | 144,700 | 93,618 | 96,001 | 81,603 | ||||||||||||||||||
Amount recognized in the consolidated statements of financial position | ||||||||||||||||||||||||
Net defined benefit asset | (1,493 | ) | (1,757 | ) | (21,057 | ) | (9,818 | ) | (714 | ) | (6,544 | ) | ||||||||||||
Net defined benefit liability | 225,048 | 169,397 | 165,757 | 103,436 | 96,715 | 88,147 | ||||||||||||||||||
Net amount | 223,555 | 167,640 | 144,700 | 93,618 | 96,001 | 81,603 | ||||||||||||||||||
Present value of defined benefit obligations
The changes in the defined benefit obligations for the fiscal years ended March 31, 2021 and 2022 are as follows:
Yen in millions | ||||||||||||||||
Japanese plans | Foreign plans | |||||||||||||||
Fiscal year ended March 31 | Fiscal year ended March 31 | |||||||||||||||
2021 | 2022 | 2021 | 2022 | |||||||||||||
Beginning balance of the fiscal year | 658,863 | 640,061 | 357,096 | 371,239 | ||||||||||||
Current service cost | 12,763 | 12,868 | 2,605 | 2,424 | ||||||||||||
Past service cost | — | 4 | 157 | (34 | ) | |||||||||||
Interest cost | 3,684 | 3,751 | 6,410 | 5,117 | ||||||||||||
Remeasurements: | ||||||||||||||||
Change in demographic assumptions | 3,091 | (536 | ) | (1,568 | ) | 630 | ||||||||||
Change in financial assumptions | (2,820 | ) | (8,594 | ) | 10,694 | (16,789 | ) | |||||||||
Other | — | (95 | ) | 2,002 | (91 | ) | ||||||||||
Translation adjustments | — | — | 26,669 | 19,372 | ||||||||||||
Plan participants’ contributions | — | — | 258 | 333 | ||||||||||||
Benefits paid | (35,563 | ) | (32,909 | ) | (24,075 | ) | (38,923 | ) | ||||||||
Curtailments and settlements | — | — | (9,009 | ) | (65,375 | ) | ||||||||||
Other | 43 | 213 | — | — | ||||||||||||
Ending balance of the fiscal year | 640,061 | 614,763 | 371,239 | 277,903 | ||||||||||||
| * | Curtailments and settlements of the foreign plans for the fiscal year ended March 31, 2022 relate mainly to the termination of the defined benefit pension plan at certain U.S. subsidiaries. |
F-8
2
SONY GROUP CORPORATION AND CONSOLIDATED SUBSIDIARIES
The weighted average duration of defined benefit obligations for the fiscal years ended March 31, 2021 and 2022 is as follows:
Japanese plans | Foreign plans | |||||||||||||||
March 31 | March 31 | |||||||||||||||
2021 | 2022 | 2021 | 2022 | |||||||||||||
Weighted average duration of defined benefit obligations | 11.9 years | 11.5 years | 11.8 years | 15.7 years | ||||||||||||
The significant actuarial assumptions used to determine the present value of defined benefit obligations as of April 1, 2020 and March 31, 2021 and 2022 are as follows:
Japanese plans | Foreign plans | |||||||||||||||||||||||
April 1 | March 31 | April 1 | March 31 | |||||||||||||||||||||
2020 | 2021 | 2022 | 2020 | 2021 | 2022 | |||||||||||||||||||
Discount rate | 0.6 | % | 0.6 | % | 0.7 | % | 2.1 | % | 1.4 | % | 2.5 | % | ||||||||||||
The sensitivities of the defined benefit obligations to changes in the significant weighted-average actuarial assumptions are as follows:
Yen in millions | ||||||||||||||||||||||||
Japanese plans | Foreign plans | |||||||||||||||||||||||
April 1 | March 31 | April 1 | March 31 | |||||||||||||||||||||
Change in assumptions | 2020 | 2021 | 2022 | 2020 | 2021 | 2022 | ||||||||||||||||||
Discount rate | ||||||||||||||||||||||||
0.25% decrease | 20,722 | 19,965 | 18,069 | 10,619 | 11,281 | 11,055 | ||||||||||||||||||
0.25% increase | (18,277 | ) | (16,825 | ) | (15,372 | ) | (9,914 | ) | (10,431 | ) | (10,439 | ) | ||||||||||||
The sensitivity analyses are calculated using the same method used to determine the defined benefit liability recognized in the consolidated statements of financial position while holding all other assumptions consistent.
Fair value of plan assets
Sony’s pension investment policy recognizes the expected growth and the variability risk associated with the long-term nature of pension liabilities, the returns and risks of diversification across asset classes, and the correlation among assets. The asset allocations are designed to maximize returns consistent with levels of liquidity and investment risk that are considered prudent and reasonable. While the pension investment policy gives appropriate consideration to recent market performance and historical returns, the investment assumptions utilized by Sony are designed to achieve a long-term return consistent with the long-term nature of the corresponding pension liabilities.
The investment objectives of Sony’s plan assets are designed to generate returns that will enable the plans to meet their future obligations. The precise amount for which these obligations will be settled depends on future events, including the retirement dates and life expectancy of the plans’ participants. The obligations are estimated using actuarial assumptions, based on current economic conditions and other pertinent factors. Sony’s investment strategy balances the requirement to generate returns, using potentially higher yielding assets such as equity securities, with the need to control risk in the portfolio with less volatile assets, such as fixed-income securities. Risks include, among others, inflation, volatility in equity values and changes in interest rates that could negatively impact the funding level of the plans, thereby increasing their dependence on contributions from Sony. To mitigate any potential concentration risk of plan assets, thorough consideration is given to balancing the portfolio among industry sectors and geographies, taking into account interest rate sensitivity, dependence on economic growth, currency and other factors that affect investment returns. The target allocations as of March 31, 2022, are, as a result of Sony’s asset liability management, 16% (2020: 17%, 2021: 20%) of equity securities, 52% (2020: 54%, 2021: 51%) of fixed income securities and 32% (2020: 29%, 2021: 29%) of other investments for the pension plans of Sony Group Corporation and most of its subsidiaries in Japan, and, on a weighted average basis, 1% (2020: 14%, 2021: 7%) of equity securities, 22% (2020: 63%, 2021: 32%) of fixed income securities and 77% (2020: 23%, 2021: 61%) of other investments for the pension plans of foreign subsidiaries.
F-8
3
SONY GROUP CORPORATION AND CONSOLIDATED SUBSIDIARIES
The changes in the plan assets for the fiscal years ended March 31, 2021 and 2022 are as follows:
Yen in millions | ||||||||||||||||
Japanese plans | Foreign plans | |||||||||||||||
Fiscal year ended March 31 | Fiscal year ended March 31 | |||||||||||||||
2021 | 2022 | 2021 | 2022 | |||||||||||||
Beginning balance of the fiscal year | 437,206 | 476,411 | 277,719 | 288,394 | ||||||||||||
Interest income | 2,623 | 3,026 | 5,118 | 3,955 | ||||||||||||
Remeasurements: | ||||||||||||||||
Return on plan assets excluding interest income | 56,913 | 17,617 | (28,024 | ) | (10,121 | ) | ||||||||||
Translation adjustments | — | — | 24,158 | 13,880 | ||||||||||||
Employer contribution | 2,333 | 2,476 | 37,880 | 4,573 | ||||||||||||
Plan participants’ contributions | — | — | 258 | 333 | ||||||||||||
Benefits paid | (22,664 | ) | (24,597 | ) | (22,488 | ) | (37,545 | ) | ||||||||
Refunds from the plans | — | — | — | (5,005 | ) | |||||||||||
Curtailments and settlements | — | — | (6,227 | ) | (59,673 | ) | ||||||||||
Ending balance of the fiscal year | 476,411 | 474,933 | 288,394 | 198,791 | ||||||||||||
| * | Curtailments and settlements of the foreign plans for the fiscal year ended March 31, 2022 relate mainly to the termination of the defined benefit pension plan at certain U.S. subsidiaries. |
Sony makes contributions to its defined benefit pension plans as deemed appropriate by management after considering the fair value of plan assets, expected return on plan assets and the present value of defined benefit obligations. Sony expects to contribute approximately 6 billion yen to the Japanese plans and approximately 4 billion yen to the foreign plans during the fiscal year ending March 31, 2023.
The fair values of the assets held by Japanese and foreign plans are as follows:
Yen in millions | ||||||||||||
Japanese plans | ||||||||||||
April 1 2020 | Market price in active market | |||||||||||
Asset class | Quoted | Unquoted | ||||||||||
Cash and cash equivalents | 13,349 | 13,349 | — | |||||||||
Equity securities *1 | 24,715 | 21,377 | 3,338 | |||||||||
Fixed income: | ||||||||||||
Government bonds *2 | 7,833 | 1,087 | 6,746 | |||||||||
Corporate bonds *3 | 3,952 | 20 | 3,932 | |||||||||
Commingled funds *4 | 303,030 | — | 303,030 | |||||||||
| Private equity | 35,866 | — | 35,866 | |||||||||
| Hedge funds | 48,461 | — | 48,461 | |||||||||
Total | 437,206 | 35,833 | 401,373 | |||||||||
F-8
4
SONY GROUP CORPORATION AND CONSOLIDATED SUBSIDIARIES
Yen in millions | ||||||||||||
Japanese plans | ||||||||||||
March 31 2021 | Market price in active market | |||||||||||
Asset class | Quoted | Unquoted | ||||||||||
Cash and cash equivalents | 44,317 | 44,317 | — | |||||||||
Equity securities *1 | 32,269 | 28,288 | 3,981 | |||||||||
Fixed income: | ||||||||||||
Government bonds *2 | 9,820 | 1,149 | 8,671 | |||||||||
Corporate bonds *3 | 3,635 | 19 | 3,616 | |||||||||
Commingled funds *4 | 295,963 | — | 295,963 | |||||||||
Private equity | 43,023 | — | 43,023 | |||||||||
| Hedge funds | 47,384 | — | 47,384 | |||||||||
Total | 476,411 | 73,773 | 402,638 | |||||||||
Yen in millions | ||||||||||||
Japanese plans | ||||||||||||
March 31 2022 | Market price in active market | |||||||||||
Asset class | Quoted | Unquoted | ||||||||||
Cash and cash equivalents | 13,843 | 13,843 | — | |||||||||
Equity securities *1 | 31,660 | 28,175 | 3,485 | |||||||||
Fixed income: | ||||||||||||
Government bonds *2 | 10,005 | 1,122 | 8,883 | |||||||||
Corporate bonds *3 | 4,222 | 31 | 4,191 | |||||||||
Commingled funds *4 | 316,319 | — | 316,319 | |||||||||
Private equity | 49,777 | — | 49,777 | |||||||||
| Hedge funds | 49,107 | — | 49,107 | |||||||||
Total | 474,933 | 43,171 | 431,762 | |||||||||
| *1 | Represents primarily Japanese equity securities. |
| *2 | Includes approximately |
| *3 | Includes debt securities issued by Japanese and foreign corporation and government related agencies. |
| *4 | Commingled funds represent pooled institutional investments, including primarily investment trusts. |
Yen in millions | ||||||||||||
Foreign plans | ||||||||||||
April 1 2020 | Market price in active market | |||||||||||
Asset class | Quoted | Unquoted | ||||||||||
Cash and cash equivalents | 3,940 | 3,940 | — | |||||||||
Equity securities *1 | 17,591 | 16,973 | 618 | |||||||||
Fixed income: | ||||||||||||
Government bonds *2 | 93,826 | — | 93,826 | |||||||||
Corporate bonds *3 | 32,080 | — | 32,080 | |||||||||
Asset-backed securities | 1,320 | — | 1,320 | |||||||||
Insurance contracts *4 | 16,722 | — | 16,722 | |||||||||
Commingled funds *5 | 78,972 | — | 78,972 | |||||||||
| Real estate and other | 33,268 | — | 33,268 | |||||||||
Total | 277,719 | 20,913 | 256,806 | |||||||||
F-85
SONY GROUP CORPORATION AND CONSOLIDATED SUBSIDIARIES
Yen in millions | ||||||||||||
Foreign plans | ||||||||||||
March 31 2021 | Market price in active market | |||||||||||
Asset class | Quoted | Unquoted | ||||||||||
Cash and cash equivalents | 2,642 | 2,642 | — | |||||||||
Equity securities *1 | 11,349 | 10,631 | 718 | |||||||||
Fixed income: | ||||||||||||
Government bonds *2 | 18,843 | — | 18,843 | |||||||||
Corporate bonds *3 | 59,071 | — | 59,071 | |||||||||
Asset-backed securities | 120 | — | 120 | |||||||||
Insurance contracts *4 | 129,491 | — | 129,491 | |||||||||
Commingled funds *5 | 63,118 | — | 63,118 | |||||||||
Real estate and other | 3,760 | — | 3,760 | |||||||||
Total | 288,394 | 13,273 | 275,121 | |||||||||
Yen in millions | ||||||||||||
Foreign plans | ||||||||||||
March 31 2022 | Market price in active market | |||||||||||
Asset class | Quoted | Unquoted | ||||||||||
Cash and cash equivalents | 2,350 | 2,350 | — | |||||||||
Equity securities *1 | 61 | 61 | — | |||||||||
Fixed income: | ||||||||||||
Government bonds *2 | 19,141 | — | 19,141 | |||||||||
Corporate bonds *3 | 23,546 | — | 23,546 | |||||||||
Asset-backed securities | 63 | — | 63 | |||||||||
Insurance contracts *4 | 129,084 | 432 | 128,652 | |||||||||
Commingled funds *5 | 22,316 | — | 22,316 | |||||||||
Real estate and other | 2,230 | 8 | 2,222 | |||||||||
Total | 198,791 | 2,851 | 195,940 | |||||||||
| *1 | Includes primarily foreign equity securities. |
| *2 | Includes primarily foreign government debt securities. |
| *3 | Includes primarily foreign corporate debt securities. |
| *4 | Represents annuity contracts with or without profit sharing and bulk insurance contracts. |
| *5 | Commingled funds represent pooled institutional investments, including primarily investment trusts. |
F-8
6
SONY GROUP CORPORATION AND CONSOLIDATED SUBSIDIARIES
The impact of minimum funding requirement and asset ceiling
The impact of minimum funding requirement and asset ceiling for the fiscal years ended March 31, 2021 and 2022 is as follows:
Yen in millions | ||||||||||||||||
Japanese plans | Foreign plans | |||||||||||||||
Fiscal year ended March 31 | Fiscal year ended March 31 | |||||||||||||||
2021 | 2022 | 2021 | 2022 | |||||||||||||
Beginning balance of the fiscal year | 1,898 | 3,990 | 14,241 | 13,156 | ||||||||||||
Interest income | 11 | 25 | 271 | 187 | ||||||||||||
Remeasurements: | ||||||||||||||||
Change in asset ceiling excluding interest income | 2,081 | 855 | (2,447 | ) | (11,018 | ) | ||||||||||
Translation adjustments | — | — | 1,091 | 166 | ||||||||||||
Ending balance of the fiscal year | 3,990 | 4,870 | 13,156 | 2,491 | ||||||||||||
(2) | Defined contribution plans |
Total defined contribution expenses for the fiscal years ended March 31, 2021 and 2022 are as follows:
Yen in millions | ||||||||
Fiscal year ended March 31 | ||||||||
2021 | 2022 | |||||||
Japanese plans | 10,992 | 11,137 | ||||||
Foreign plans | 9,639 | 11,154 | ||||||
(3) | Employee benefits expenses |
Employee benefits expenses included in cost of sales, selling, general and administrative, and financial services expenses in the consolidated statements of income for the fiscal years ended March 31, 2021 and 2022 are as follows:
Yen in millions | ||||||||
Fiscal year ended March 31 | ||||||||
2021 | 2022 | |||||||
Total employee benefits expenses | 1,187,119 | 1,253,148 | ||||||
Employee benefits expenses include salaries, bonuses, stock-based compensation, social security, welfare and expenses relating to post-employment benefits.
18. | Participation and residual liabilities in the Pictures segment |
The changes in participation and residual liabilities for the fiscal year ended March 31, 2022 are as follows:
Yen in millions | ||||
Fiscal year ended March 31 | ||||
2022 | ||||
Balance at beginning of the fiscal year | 277,970 | |||
Current portion | 161,433 | |||
Non-current portion | 116,537 | |||
Additional participation and residual liabilities | 254,916 | |||
Amounts paid during the year | (159,836 | ) | ||
Translation adjustment | 37,225 | |||
Balance at end of the fiscal year | 410,275 | |||
Current portion | 190,162 | |||
Non-current portion | 220,113 | |||
F-87
SONY GROUP CORPORATION AND CONSOLIDATED SUBSIDIARIES
There were no material changes driven from discounting or unpaid amounts reversed during the year.
19. | Other assets and other liabilities |
(1) | Other assets |
Components of other assets as of April 1, 2020, March 31, 2021 and 2022 are as follows:
Yen in millions | ||||||||||||
April 1 | March 31 | |||||||||||
2020 | 2021 | 2022 | ||||||||||
Advance payments and prepaid expenses | 237,643 | 300,237 | 384,299 | |||||||||
Income taxes receivable and other taxes receivable | 186,718 | 118,914 | 169,580 | |||||||||
Other | 185,408 | 184,548 | 208,241 | |||||||||
Total | 609,769 | 603,699 | 762,120 | |||||||||
Current assets | 441,974 | 396,210 | 473,070 | |||||||||
Non-current assets | 167,795 | 207,489 | 289,050 | |||||||||
(2) | Other liabilities |
Components of other liabilities as of April 1, 2020, March 31, 2021 and 2022 are as follows:
Yen in millions | ||||||||||||
April 1 | March 31 | |||||||||||
2020 | 2021 | 2022 | ||||||||||
Contract liabilities | 271,286 | 294,911 | 366,227 | |||||||||
Accrued short-term employee benefits | 245,054 | 321,553 | 347,023 | |||||||||
Refund liabilities | 168,739 | 186,875 | 197,791 | |||||||||
Accrued expenses | 222,028 | 192,396 | 177,404 | |||||||||
Taxes payable other than income taxes | 128,037 | 133,672 | 163,316 | |||||||||
Future insurance policy benefits and other | 127,079 | 134,865 | 153,006 | |||||||||
Product warranties | 31,807 | 32,851 | 28,606 | |||||||||
Other | 157,234 | 163,426 | 161,596 | |||||||||
Total | 1,351,264 | 1,460,549 | 1,594,969 | |||||||||
Current liabilities | 1,263,944 | 1,367,527 | 1,488,488 | |||||||||
Non-current liabilities | 87,320 | 93,022 | 106,481 | |||||||||
The changes in product warranties for the fiscal year ended March 31, 2022 are as follows:
Yen in millions | ||||
Fiscal year ended March 31 | ||||
2022 | ||||
Balance at beginning of the fiscal year | 32,851 | |||
Additional product warranties | 27,810 | |||
Amounts used during the year | (23,432 | ) | ||
Unused amounts reversed during the year | (10,659 | ) | ||
Translation adjustment | 2,036 | |||
Balance at end of the fiscal year | 28,606 | |||
F-88
SONY GROUP CORPORATION AND CONSOLIDATED SUBSIDIARIES
20. | Stockholders’ equity |
(1) | Common stock |
The number of shares of common stock authorized as of March 31, 2021 and 2022 was 3,600,000,000. All of the shares of common stock of Sony Group Corporation are issued with no par value, and the issued stock was fully paid.
Changes in the number of shares of common stock issued and outstanding during the fiscal years ended March 31, 2021 and 2022 have resulted from the following:
Number of shares | ||||||||
Fiscal year ended March 31 | ||||||||
2021 | 2022 | |||||||
Balance at beginning of the fiscal year | 1,261,058,781 | 1,261,058,781 | ||||||
Issuance of new shares | — | 23,000 | ||||||
Balance at end of the fiscal year | 1,261,058,781 | 1,261,081,781 | ||||||
As of April 1, 2020, March 31, 2021 and 2022, the number of shares of treasury stock, which was included in the balance of common stock shares issued above, were 40,898,841 shares, 21,831,206 shares and 24,078,136 shares, respectively.
Sony Group Corporation may purchase its own shares at any time by a resolution of the Board of Directors up to the retained earnings available for dividends to shareholders, in accordance with the Companies Act of Japan.
Although Sony Group Corporation approved on August 4, 2020 by resolution of the Board of Directors the setting of parameters for the repurchase of shares of its own common stock pursuant to the Companies Act of Japan and Sony Group Corporation’s Articles of Incorporation, no common stock was acquired based on these parameters by March 31, 2021.
Sony Group Corporation’s Board of Directors resolved and approved the setting of parameters for the repurchase of shares of its own common stock pursuant to the Companies Act of Japan and Sony Group Corporation’s Articles of Incorporation at the meeting of the Board of Directors held on April 28, 2021. Under the above resolution, Sony Group Corporation repurchased
7,400,600 shares of its common stock for an amount of 88,281 million yen by March 31, 2022.
(2) | Additional paid-in capital |
Additional
paid-in
capital consists of surplus that is derived from equity transactions and not recorded in common stock, and its primary component is capital reserves. The Companies Act of Japan provides that no less than 50% of thepaid-in
amount or proceeds of issuance of shares shall be incorporated in common stock, and that the remaining shall be incorporated in capital reserves. Capital reserves may be incorporated in common stock upon approval of the General Meeting of Shareholders.(3) | Retained earnings |
Retained earnings consist of legal reserves and accumulated earnings. The Companies Act of Japan provides that earnings in an amount equal to 10% of cash dividends from retained earnings shall be appropriated as a capital reserve or a legal reserve on the date of distribution of retained earnings until an aggregated amount of capital reserve and legal reserve equals 25% of common stock. Legal reserves may be used upon approval of the General Meeting of Shareholders.
Dividends whose record date falls in the fiscal year ended March 31, 2022 and whose effective date falls in the fiscal year ending March 31, 2023 are as follows:
(Resolution) | Type of shares | Total amount of dividends (Yen in millions) | Source of dividends | Dividends per share (Yen) | Record date | Effective date | ||||||||||||||||||
Board of Directors’ meeting held on May 10, 2022 | Common stock | 43,295 | Retained earnings | 35.00 | March 31, 2022 | June 3, 2022 | ||||||||||||||||||
F-8
9
SONY GROUP CORPORATION AND CONSOLIDATED SUBSIDIARIES
(4) | Other comprehensive income |
Changes in accumulated other comprehensive income, net of tax, by component for the fiscal years ended March 31, 2021 and 2022 are as follows:
Yen in millions | ||||||||||||||||||||
Balance at April 1, 2020 | Other comprehensive income attributable to Sony Group Corporation’s stockholders | Transfer to retained earnings | Transactions with noncontrolling interests shareholders and other | Balance at March 31, 2021 | ||||||||||||||||
Changes in equity instruments measured at fair value through other comprehensive income | (8,882 | ) | 144,544 | 6,085 | (2,125 | ) | 139,622 | |||||||||||||
Changes in debt instruments measured at fair value through other comprehensive income | 985,234 | (179,251 | ) | — | 458,754 | 1,264,737 | ||||||||||||||
Cash flow hedges | 1,248 | 51 | — | — | 1,299 | |||||||||||||||
Remeasurement of defined benefit pension plans | — | 11,555 | (11,555 | ) | — | — | ||||||||||||||
Exchange differences on translating foreign operations | — | 113,771 | — | 130 | 113,901 | |||||||||||||||
Insurance contract valuation adjustments | 1,973 | (2,537 | ) | — | 476 | (88 | ) | |||||||||||||
Share of other comprehensive income of investments accounted for using the equity method | (97 | ) | 885 | (2 | ) | — | 786 | |||||||||||||
Total | 979,476 | 89,018 | (5,472 | ) | 457,235 | 1,520,257 | ||||||||||||||
Yen in millions | ||||||||||||||||||||
Balance at April 1, 2021 | Other comprehensive income attributable to Sony Group Corporation’s stockholders | Transfer to retained earnings | Transactions with noncontrolling interests shareholders and other | Balance at March 31, 2022 | ||||||||||||||||
Changes in equity instruments measured at fair value through other comprehensive income | 139,622 | (106,426 | ) | (5,784 | ) | — | 27,412 | |||||||||||||
Changes in debt instruments measured at fair value through other comprehensive income | 1,264,737 | (416,904 | ) | — | — | 847,833 | ||||||||||||||
Cash flow hedges | 1,299 | 4,735 | — | — | 6,034 | |||||||||||||||
Remeasurement of defined benefit pension plans | — | 33,641 | (33,641 | ) | — | — | ||||||||||||||
Exchange differences on translating foreign operations | 113,901 | 223,777 | — | — | 337,678 | |||||||||||||||
Insurance contract valuation adjustments | (88 | ) | 599 | — | — | 511 | ||||||||||||||
Share of other comprehensive income of investments accounted for using the equity method | 786 | 2,078 | — | — | 2,864 | |||||||||||||||
Total | 1,520,257 | (258,500 | ) | (39,425 | ) | — | 1,222,332 | |||||||||||||
F-
90
SONY GROUP CORPORATION AND CONSOLIDATED SUBSIDIARIES
Each component of other comprehensive income and the related tax effect including noncontrolling interests for the fiscal years ended March 31, 2021 and 2022 are as follows:
Yen in millions | ||||||||
Fiscal year ended March 31 | ||||||||
Comprehensive income components | 2021 | 2022 | ||||||
Items that will not be reclassified to profit or loss | ||||||||
Changes in equity instruments measured at fair value through other comprehensive income | ||||||||
Amount incurred during the year | 191,122 | (139,511 | ) | |||||
Total before tax | 191,122 | (139,511 | ) | |||||
Tax expense or (benefit) | (46,382 | ) | 33,085 | |||||
Net of tax | 144,740 | (106,426 | ) | |||||
Remeasurement of defined benefit pension plans | ||||||||
Amount incurred during the year | 17,856 | 43,134 | ||||||
Total before tax | 17,856 | 43,134 | ||||||
Tax expense or (benefit) | (6,301 | ) | (9,493 | ) | ||||
Net of tax | 11,555 | 33,641 | ||||||
Share of other comprehensive income of investments accounted for using the equity method | ||||||||
Amount incurred during the year | 98 | 869 | ||||||
Total before tax | 98 | 869 | ||||||
Tax expense or (benefit) | (11 | ) | (292 | ) | ||||
Net of tax | 87 | 577 | ||||||
Total | 156,382 | (72,208 | ) | |||||
Items that may be reclassified subsequently to profit or loss | ||||||||
Changes in debt instruments measured at fair value through other comprehensive income | ||||||||
Amount incurred during the year | (285,504 | ) | (572,692 | ) | ||||
Reclassification to profit or loss | (98 | ) | (6,408 | ) | ||||
Total before tax | (285,602 | ) | (579,100 | ) | ||||
Tax expense or (benefit) | 80,053 | 162,196 | ||||||
Net of tax | (205,549 | ) | (416,904 | ) | ||||
Cash flow hedges | ||||||||
Amount incurred during the year | 7,481 | (7,703 | ) | |||||
Reclassification to profit or loss | (7,228 | ) | 14,529 | |||||
Total before tax | 253 | 6,826 | ||||||
Tax expense or (benefit) | (202 | ) | (2,091 | ) | ||||
Net of tax | 51 | 4,735 | ||||||
Insurance contract valuation adjustments | ||||||||
Amount incurred during the year | (3,081 | ) | 807 | |||||
Reclassification to profit or loss | (39 | ) | (10 | ) | ||||
Total before tax | (3,120 | ) | 797 | |||||
Tax expense or (benefit) | — | (198 | ) | |||||
Net of tax | (3,120 | ) | 599 | |||||
Exchange differences on translating foreign operations | ||||||||
Amount incurred during the year | 115,304 | 227,017 | ||||||
Reclassification to profit or loss | 17 | (742 | )�� | |||||
Total before tax | 115,321 | 226,275 | ||||||
Tax expense or (benefit) | — | — | ||||||
Net of tax | 115,321 | 226,275 | ||||||
F-
91
SONY GROUP CORPORATION AND CONSOLIDATED SUBSIDIARIES
Yen in millions | ||||||||
Fiscal year ended March 31 | ||||||||
Comprehensive income components | 2021 | 2022 | ||||||
Share of other comprehensive income of investments accounted for using the equity method | ||||||||
Amount incurred during the year | 798 | 1,501 | ||||||
Reclassification to profit or loss | — | — | ||||||
Total before tax | 798 | 1,501 | ||||||
Tax expense or (benefit) | — | — | ||||||
Net of tax | 798 | 1,501 | ||||||
Total | (92,499 | ) | (183,794 | ) | ||||
Total other comprehensive income | 63,883 | (256,002 | ) | |||||
(5) | Equity transactions with noncontrolling interests shareholders |
During the fiscal year ended March 31, 2021, Sony Group Corporation acquired all the common shares and the related stock acquisition rights not held by Sony Group Corporation of SFGI, a consolidated subsidiary of Sony Group Corporation, and SFGI became a wholly-owned subsidiary of Sony Group Corporation. Consideration for this acquisition was 396,698 million yen. The net difference between the consideration, the decrease in the carrying amount of the noncontrolling interests of 1,046,380 million yen and the increase in accumulated other comprehensive income of 457,072 million yen was recognized as an increase to additional
paid-in
capital of 192,610 million yen. On October 1, 2021, SFGI changed its company name from SFH.21. | Stock-based compensation plans |
The stock-based compensation expense for the fiscal years ended March 31, 2021 and 2022 was 8,892 million yen and 11,105 million yen, respectively.
Sony Group Corporation has a stock-based compensation incentive plan for the corporate executive officers and employees of Sony Group Corporation, and the directors,
other
officers and employees of its subsidiaries in the form of a stock option plan. The stock acquisition rights granted under the stock option plan generally have three-year vesting schedules and are exercisable up to 10 years from the date of grant. Sony Group Corporation either issues new shares of common stock or reissues existing treasury stock upon the exercise of these rights.F-9
2
SONY GROUP CORPORATION AND CONSOLIDATED SUBSIDIARIES
The weighted-average fair value per share at the date of grant of stock acquisition rights granted during the fiscal years ended March 31, 2021 and 2022 was 2,207 yen and 2,994 yen, respectively. The fair value of stock acquisition rights granted on the date of grant and used to recognize compensation expense for the fiscal years ended March 31, 2021 and 2022 was estimated using the Black-Scholes option-pricing model with the following weighted-average assumptions:
Fiscal year ended March 31 | ||||||||
2021 | 2022 | |||||||
Weighted-average assumptions | ||||||||
Share price at the grant date | 9,202 | yen | 14,361 | yen | ||||
Risk-free interest rate | 0.17 | % | 0.60 | % | ||||
Expected lives | 5.41 | years | 5.33 | years | ||||
Expected volatility* | 26.97 | % | 22.47 | % | ||||
Expected dividends | 0.34 | % | 0.29 | % | ||||
| * | Expected volatility was based on the historical volatilities of Sony Group Corporation’s common stock over the expected life of the stock acquisition rights. |
A summary of the activities regarding the stock option plan during the fiscal years ended March 31, 2021 and 2022 is as follows:
Fiscal year ended March 31 | ||||||||||||||||
2021 | 2022 | |||||||||||||||
Number of shares | Weighted- average exercise price | Number of shares | Weighted- average exercise price | |||||||||||||
Yen | Yen | |||||||||||||||
Outstanding at beginning of the fiscal year | 12,876,700 | 4,982 | 14,022,400 | 6,653 | ||||||||||||
Granted | 4,534,600 | 9,221 | 4,876,400 | 14,188 | ||||||||||||
Exercised | 3,178,300 | 3,911 | 1,944,900 | 5,313 | ||||||||||||
Forfeited or expired | 210,600 | 6,280 | 409,600 | 9,484 | ||||||||||||
Outstanding at end of the fiscal year | 14,022,400 | 6,653 | 16,544,300 | 9,397 | ||||||||||||
Exercisable at end of the fiscal year | 5,800,700 | 4,535 | 7,044,700 | 5,883 | ||||||||||||
The weighted-average stock price at the time when the stock acquisition rights were exercised during the fiscal years ended March 31, 2021 and 2022 was 9,311 yen and 12,627 yen, respectively.
F-9
3
SONY GROUP CORPORATION AND CONSOLIDATED SUBSIDIARIES
A summary of unexercised stock acquisition rights as of March 31, 2021 and 2022 is as follows:
Series | Date of grant | Exercise term | Exercise price | Outstanding at end of the fiscal year (shares) | ||||||||||||
2021 | 2022 | |||||||||||||||
| 22 nd | November 22, 2011 | November 22, 2012 to November 21, 2021 | ¥ | 1,523 | 24,700 | — | ||||||||||
| 23 rd | November 22, 2011 | November 22, 2012 to November 21, 2021 | $ | 19.44 | 77,500 | — | ||||||||||
| 24 th | December 4, 2012 | December 4, 2013 to December 3, 2022 | ¥ | 932 | 24,000 | 14,700 | ||||||||||
| 25 th | December 4, 2012 | December 4, 2013 to December 3, 2022 | $ | 11.23 | 102,600 | 77,900 | ||||||||||
| 26 th | November 20, 2013 | November 20, 2014 to November 19, 2023 | ¥ | 2,007 | 88,500 | 47,000 | ||||||||||
| 27 th | November 20, 2013 | November 20, 2014 to November 19, 2023 | $ | 20.01 | 140,900 | 127,300 | ||||||||||
| 28 th | November 20, 2014 | November 20, 2015 to November 19, 2024 | ¥ | 2,410.5 | 243,700 | 190,900 | ||||||||||
| 29 th | November 20, 2014 | November 20, 2015 to November 19, 2024 | $ | 20.67 | 167,300 | 154,100 | ||||||||||
| 30 th | November 19, 2015 | November 19, 2016 to November 18, 2025 | ¥ | 3,404 | 323,900 | 252,600 | ||||||||||
| 31 st | November 19, 2015 | November 19, 2016 to November 18, 2025 | $ | 27.51 | 218,800 | 170,800 | ||||||||||
| 32 nd | November 22, 2016 | November 22, 2017 to November 21, 2026 | ¥ | 3,364 | 672,100 | 516,300 | ||||||||||
| 33 rd | November 22, 2016 | November 22, 2017 to November 21, 2026 | $ | 31.06 | 446,200 | 367,900 | ||||||||||
| 34 th | November 21, 2017 | November 21, 2018 to November 20, 2027 | ¥ | 5,231 | 872,800 | 572,500 | ||||||||||
| 35 th | November 21, 2017 | November 21, 2018 to November 20, 2027 | $ | 45.73 | 787,200 | 676,400 | ||||||||||
| 36 th | February 28, 2018 | February 28, 2019 to February 27, 2028 | ¥ | 5,442 | 5,800 | 4,500 | ||||||||||
| 37 th | February 28, 2018 | February 28, 2019 to February 27, 2028 | $ | 50.39 | 15,000 | 15,000 | ||||||||||
| 38 th | November 20, 2018 | November 20, 2019 to November 19, 2028 | ¥ | 6,440 | 1,290,600 | 977,800 | ||||||||||
| 39 th | November 20, 2018 | November 20, 2019 to November 19, 2028 | $ | 56.22 | 987,300 | 826,800 | ||||||||||
| 40 th | November 20, 2019 | November 20, 2020 to November 19, 2029 | ¥ | 6,705 | 1,645,300 | 1,389,700 | ||||||||||
| 41 st | November 20, 2019 | November 20, 2020 to November 19, 2029 | $ | 60.99 | 1,393,400 | 1,190,800 | ||||||||||
| 42 nd | April 17, 2020 | April 17, 2021 to April 16, 2030 | $ | 63.75 | 20,000 | 13,300 | ||||||||||
| 43 rd | November 18, 2020 | November 18, 2021 to November 17, 2030 | ¥ | 9,237 | 2,252,000 | 2,193,000 | ||||||||||
| 44 th | November 18, 2020 | November 18, 2021 to November 17, 2030 | $ | 87.48 | 2,222,800 | 1,974,800 | ||||||||||
| 45 th | November 18, 2021 | November 18, 2022 to November 17, 2031 | ¥ | 14,350 | — | 2,399,100 | ||||||||||
| 46 th | November 18, 2021 | November 18, 2022 to November 17, 2031 | $ | 124.90 | — | 2,391,100 | ||||||||||
F-9
4
SONY GROUP CORPORATION AND CONSOLIDATED SUBSIDIARIES
22. | Revenue |
(1) | Contract balances |
Receivables from contracts with customers, contract assets and contract liabilities are comprised of the following:
Yen in millions | ||||||||||||
April 1 | March 31 | |||||||||||
2020 | 2021 | 2022 | ||||||||||
Receivables from contracts with customers *1 | 1,127,622 | 1,177,027 | 1,382,377 | |||||||||
Contract assets *2 | 13,985 | 12,204 | 16,785 | |||||||||
Contract liabilities *3 | 271,286 | 294,911 | 366,227 | |||||||||
| *1 | Receivables from contracts with customers are included in the consolidated statements of financial position as “Trade and other receivables, and contract assets” and “Other financial assets,” non-current. |
| *2 | Contract assets are included in the consolidated statements of financial position as “Trade and other receivables, and contract assets” and “Other non-current assets.” |
| *3 | Contract liabilities are included in the consolidated statements of financial position as “Other current liabilities” and “Other non-current liabilities.” |
Contract liabilities principally relate to customer advances received prior to performance. Revenues of 216,931 million yen and 231,274 million yen were recognized during the fiscal years ended March 31, 2021 and 2022, which were included in the balance of contract liabilities as of April 1, 2020 and March 31, 2021. Revenues of 76,405 million yen and 78,149 million yen were recognized during the fiscal years ended March 31, 2021 and 2022, respectively, from performance obligations satisfied prior to April 1, 2020 and April 1, 2021, respectively.
(2) | Performance obligations |
Remaining (unsatisfied or partially unsatisfied) performance obligations represent future revenues not yet recorded for firm orders that have not yet been performed. Sony applies practical expedients to exclude contracts with an expected original duration of one year or less. The following table shows the summary of the transaction prices allocated to remaining performance obligations that are unsatisfied as of March 31, 2021 and 2022, respectively, of which more than half are expected to be recognized within one year and substantially all within three years. The amount of the transaction price related to variable consideration is included only to the extent that it is highly probable that a significant reversal in the amount of cumulative revenue to be recognized will not occur.
Yen in millions | ||||||||
March 31 | ||||||||
2021 | 2022 | |||||||
Pictures — Motion Pictures and Television Productions *1 | 644,569 | 705,974 | ||||||
Pictures — Media Networks | 20,346 | 17,568 | ||||||
Music *2 | 57,904 | 127,530 | ||||||
| Others | 47,211 | 57,948 | ||||||
| *1 | For Motion Pictures and Television Productions in the Pictures segment, Sony has included all contracts regardless of duration. |
| *2 | The amount included in the Music segment primarily consists of minimum royalty guarantees or fixed fees in contracts related to license revenue for ongoing access to an evolving library of content. |
F-9
5
SONY GROUP CORPORATION AND CONSOLIDATED SUBSIDIARIES
(3) | Contract costs |
Contract costs are comprised as follows:
Yen in millions | ||||||||||||
April 1 | March 31 | |||||||||||
2020 | 2021 | 2022 | ||||||||||
Incremental costs of obtaining a contract | 7,464 | 8,348 | 7,336 | |||||||||
Sony applies practical expedients to recognize the incremental costs of obtaining a contract as an expense if the amortization period of the asset that otherwise would have been recognized is one year or less. The amortization of 7,271 million yen and 6,917 million yen was recognized during the fiscal years ended March 31, 2021 and 2022, respectively. The incremental costs of obtaining a contract are primarily recognized in the EP&S segment for the internet-related service business and amortized to expense over the contract period.
(4) | Disaggregation of revenue |
For the breakdown of sales and financial services revenue by segments, product categories and geographies, refer to Note 4.
23. | Supplemental consolidated statements of income information |
(1) | Other operating (income) expense, net |
Sony records transactions in other operating (income) expense, net due to either the nature of the transaction or in consideration of factors including the relationship to Sony’s core operations.
Other operating (income) expense, net is comprised of the following:
Yen in millions | ||||||||
Fiscal year ended March 31 | ||||||||
2021 | 2022 | |||||||
Gain on transfer of GSN Games shares *1 | — | (70,020 | ) | |||||
(Gain) loss on purchase/sale of interests in subsidiaries and associates, net | (18,868 | ) | (4,593 | ) | ||||
(Gain) loss on sale, disposal or impairment of assets, net *2 | 32,122 | 8,316 | ||||||
Other | 996 | 803 | ||||||
| 14,250 | (65,494 | ) | ||||||
| *1 | Refer to Note 31. |
| *2 | Refer to Notes 9 and 11. |
(2) | Research and development expenditures |
Research and development expenditures recognized as an expense for the fiscal years ended March 31, 2021 and 2022 were 545,357 million yen and 618,368 million yen, respectively.
(3) | Advertising costs |
Advertising costs included in selling, general and administrative expenses for the fiscal years ended March 31, 2021 and 2022 were 261,391 million yen and 347,709 million yen, respectively.
(4) | Shipping and handling costs |
Shipping and handling costs for finished goods included in selling, general and administrative expenses for the fiscal years ended March 31, 2021 and 2022 were 82,708 million yen and 70,858 million yen, respectively, which included the internal transportation costs of finished goods.
F-9
6
SONY GROUP CORPORATION AND CONSOLIDATED SUBSIDIARIES
24. | Financial income and expense |
Financial income
Yen in millions | ||||||||
Fiscal year ended March 31 | ||||||||
2021 | 2022 | |||||||
Interest income | ||||||||
Financial assets measured at AC | 7,610 | 6,996 | ||||||
Dividends | ||||||||
Financial assets measured at FVOCI | 1,566 | 2,792 | ||||||
Gain on revaluation of equity instruments | ||||||||
Financial assets measured at FVPL *1 | 61,259 | — | ||||||
Other | 13,357 | 9,516 | ||||||
Total | 83,792 | 19,304 | ||||||
Financial expenses
Yen in millions | ||||||||
Fiscal year ended March 31 | ||||||||
2021 | 2022 | |||||||
Interest expense | ||||||||
Financial liabilities measured at AC | 5,916 | 6,377 | ||||||
Other | 8,292 | 8,223 | ||||||
Foreign exchange loss, net *2 | 16,191 | 1,612 | ||||||
Loss on revaluation of equity instruments | ||||||||
Financial assets measured at FVPL *1 | — | 66,177 | ||||||
Other | 10,683 | 21,751 | ||||||
Total | 41,082 | 104,140 | ||||||
| *1 | Shares of Spotify Technology S.A. (“Spotify”) held by Sony are classified as equity securities required to be measured at fair value through profit or loss. The revaluation of the Spotify shares owned as of March 31, 2021 and March 31, 2022 resulted in an unrealized gain, net of costs to be paid to Sony’s artists and distributed labels, of 51,310 million yen (480 million U.S. dollars) andan unrealized loss, net of a decrease in costs to be paid to Sony’s artists and distributed labels, of 45,017 million yen (395 million U.S. dollars), respectively. |
| *2 | Foreign exchange loss, net includes gains or losses from foreign exchange contracts. |
25. | Income taxes |
Income (loss) before income taxes and the provision for current and deferred income taxes attributable to such income are as follows:
Yen in millions | ||||||||
Fiscal year ended March 31 | ||||||||
2021 | 2022 | |||||||
Income (loss) before income taxes: | 997,965 | 1,117,503 | ||||||
Income tax expenses | ||||||||
Current | 156,592 | 238,602 | ||||||
Deferred | (202,523 | ) | (9,505 | ) | ||||
Total income tax expense | (45,931 | ) | 229,097 | |||||
F-9
7
SONY GROUP CORPORATION AND CONSOLIDATED SUBSIDIARIES
The impact of the changes in tax rates for the fiscal years ended March 31, 2021 and 2022 resulted in deferred tax benefits of 722 million yen and 2,136 million yen, respectively.
The impact of the write-down or reversal of a previous write-down
of the
deferred tax assets for the fiscal years ended March 31, 2021 and 2022 resulted in deferred tax benefits of 287,590 million yen and 33,415 million yen, respectively.A reconciliation of the differences between the Japanese statutory tax rate and the effective tax rate is as follows:
Fiscal year ended March 31 | ||||||||
2021 | 2022 | |||||||
Statutory tax rate | 31.5 | % | 31.5 | % | ||||
Non-deductible expenses | 0.2 | 0.2 | ||||||
Income tax credits | (1.4 | ) | (1.9 | ) | ||||
Change in statutory tax rate | (0.1 | ) | (0.2 | ) | ||||
Change in unrecognized tax assets (other than the reversal of a previous write-down of the deferred tax assets below) | (5.5 | ) | (3.7 | ) | ||||
Reversal of a previous write-down of the deferred tax assets of the consolidated tax filing group in the United States | (6.6 | ) | — | |||||
Reversal of a previous write-down of the deferred tax assets relating to the national tax of Sony Group Corporation and its national tax filing group in Japan | (21.5 | ) | — | |||||
Change in deferred tax liabilities on undistributed earnings of foreign subsidiaries and corporate joint ventures | 0.7 | 1.0 | ||||||
Lower tax rate applied to life and non-life insurance business in Japan | (0.5 | ) | (0.4 | ) | ||||
Foreign income tax differential | (4.4 | ) | (5.5 | ) | ||||
Adjustments to tax reserves | (0.4 | ) | 0.8 | |||||
Controlled Foreign Company taxation in Japan | 3.0 | (1.8 | ) | |||||
Other | 0.4 | 0.5 | ||||||
Effective income tax rate | -4.6 | % | 20.5 | % | ||||
Sony recognizes deferred tax assets, which include temporary differences, net operating losses and tax credits, to the extent that it is probable that taxable profit will be available against which the assets can be utilized. The realization of deferred tax assets is dependent upon the generation of future taxable income in the relevant tax jurisdiction.
During the fiscal year ended March 31, 2021, Sony assessed the recoverability of deferred tax assets, and reversed a previous write-down
of the
deferred tax assets for general business tax credits and foreign tax credits of the consolidated tax filing group in the United States.Despite the spread of
COVID-19,
as a result of the acquisition of SFGI in the three months ended September 30, 2020, the taxable income of Sony Group Corporation and its national tax filing group in Japan has increased and is expected to be stable going forward. Based on an assessment of the available evidence, in particular recent profit history and forecasted profitability, in the three months ended September 30, 2020, Sony reversed a previous write-down of a significant portion of the deferred tax assets of the consolidated tax filing group in Japan, primarily for temporary differences and certain net operating losses. As a result, Sony recorded a tax benefit of 214,346 million yen in the three months ended September 30, 2020. On October 1, 2021, SFGI changed its company name from SFH. Remaining deferred tax assets in Japan, primarily foreign tax credits, are continuously not recognized due to restrictions on the use of such assets and their relatively short remaining carryforward periods.F-9
8
SONY GROUP CORPORATION AND CONSOLIDATED SUBSIDIARIES
The schedules of deferred tax assets and liabilities by major cause of their occurrence are as follows:
Yen in millions | ||||||||||||||||||||||||||||
Fiscal year ended March 31, 2021 | ||||||||||||||||||||||||||||
Beginning balance | Recognized in profit or loss | Recognized in other comprehensive income | Changes accompanying business combination | Recognized directly in equity | Other* | Ending balance | ||||||||||||||||||||||
Deferred tax assets: | ||||||||||||||||||||||||||||
Operating loss carryforwards for tax purposes | 34,308 | 50,453 | — | — | — | 1,409 | 86,170 | |||||||||||||||||||||
Defined benefit liabilities | 33,601 | 34,373 | (6,301 | ) | — | — | 753 | 62,426 | ||||||||||||||||||||
Amortization including content assets | 64,465 | (20,432 | ) | — | — | — | 218 | 44,251 | ||||||||||||||||||||
Lease liabilities | 99,360 | (9,413 | ) | — | — | — | 871 | 90,818 | ||||||||||||||||||||
Warranty reserves and accrued expenses | 51,811 | 76,032 | — | — | — | 1,806 | 129,649 | |||||||||||||||||||||
Inventories | 2,929 | 26,549 | — | — | — | 236 | 29,714 | |||||||||||||||||||||
Depreciation | 15,973 | 23,787 | — | — | — | 471 | 40,231 | |||||||||||||||||||||
Tax credit carryforwards | 16,120 | 31,944 | — | — | — | 251 | 48,315 | |||||||||||||||||||||
Loss allowances | 8,505 | (1,391 | ) | — | — | — | 51 | 7,165 | ||||||||||||||||||||
Impairment of investments | 1,506 | 5,441 | — | — | — | (147 | ) | 6,800 | ||||||||||||||||||||
Deferred revenue | 24,420 | (326 | ) | — | — | — | 408 | 24,502 | ||||||||||||||||||||
Other | 95,874 | 53,236 | 2,261 | — | 1,478 | (607 | ) | 152,242 | ||||||||||||||||||||
Total deferred tax assets | 448,872 | 270,253 | (4,040 | ) | — | 1,478 | 5,720 | 722,283 | ||||||||||||||||||||
Deferred tax liabilities: | ||||||||||||||||||||||||||||
Insurance acquisition costs | (54,312 | ) | (14,978 | ) | (107,445 | ) | — | — | (10 | ) | (176,745 | ) | ||||||||||||||||
Insurance contract liabilities | (77,359 | ) | (89 | ) | (73,614 | ) | — | — | 1 | (151,061 | ) | |||||||||||||||||
Non-current other receivables in the Pictures segment | (26,214 | ) | 17,984 | — | — | — | 336 | (7,894 | ) | |||||||||||||||||||
Right-of-use | (96,978 | ) | 13,149 | — | — | — | (899 | ) | (84,728 | ) | ||||||||||||||||||
Equity securities measured at FVOCI | (4,916 | ) | 2,296 | (46,382 | ) | — | — | (2,009 | ) | (51,011 | ) | |||||||||||||||||
Equity securities measured at FVPL | (36,160 | ) | (53,736 | ) | — | — | — | 2,178 | (87,718 | ) | ||||||||||||||||||
Debt securities measured at FVOCI | (766,567 | ) | (459 | ) | 261,112 | — | — | — | (505,914 | ) | ||||||||||||||||||
Intangible assets acquired through stock exchange offerings | (23,949 | ) | — | — | — | — | — | (23,949 | ) | |||||||||||||||||||
Intangible assets derived from EMI Music Publishing acquisition | (89,909 | ) | 1,556 | — | — | — | (5,128 | ) | (93,481 | ) | ||||||||||||||||||
Undistributed earnings of foreign subsidiaries and corporate joint ventures | (24,498 | ) | (12,740 | ) | — | — | — | (1,928 | ) | (39,166 | ) | |||||||||||||||||
Investment in M3 | (38,303 | ) | (3,044 | ) | — | — | — | — | (41,347 | ) | ||||||||||||||||||
Other | (40,530 | ) | (17,669 | ) | (11 | ) | (224 | ) | 357 | (2,110 | ) | (60,187 | ) | |||||||||||||||
Total deferred tax liabilities | (1,279,695 | ) | (67,730 | ) | 33,660 | (224 | ) | 357 | (9,569 | ) | (1,323,201 | ) | ||||||||||||||||
| * | Other mainly consists of exchange differences on translating foreign operations. |
F-9
9
SONY GROUP CORPORATION AND CONSOLIDATED SUBSIDIARIES
Yen in millions | ||||||||||||||||||||||||||||
Fiscal year ended March 31, 2022 | ||||||||||||||||||||||||||||
Beginning balance | Recognized in profit or loss | Recognized in other comprehensive income | Changes accompanying business combination | Recognized directly in equity | Other* | Ending balance | ||||||||||||||||||||||
Deferred tax assets: | ||||||||||||||||||||||||||||
Operating loss carryforwards for tax purposes | 86,170 | (16,573 | ) | — | — | — | 1,490 | 71,087 | ||||||||||||||||||||
Defined benefit liabilities | 62,426 | 20,721 | (9,493 | ) | — | 1,640 | (2,729 | ) | 72,565 | |||||||||||||||||||
Amortization including content assets | 44,251 | (20,323 | ) | — | — | — | 2,831 | 26,759 | ||||||||||||||||||||
Lease liabilities | 90,818 | 5,091 | — | 1,244 | — | (1,053 | ) | 96,100 | ||||||||||||||||||||
Warranty reserves and accrued expenses | 129,649 | 8,389 | — | 134 | — | 3,172 | 141,344 | |||||||||||||||||||||
Inventories | 29,714 | (547 | ) | — | — | — | 379 | 29,546 | ||||||||||||||||||||
Depreciation | 40,231 | 2,539 | — | 161 | — | 258 | 43,189 | |||||||||||||||||||||
Tax credit carryforwards | 48,315 | (12,007 | ) | — | — | — | 2,576 | 38,884 | ||||||||||||||||||||
Loss allowances | 7,165 | 98 | — | 2 | — | 483 | 7,748 | |||||||||||||||||||||
Impairment of investments | 6,800 | 3,418 | — | — | — | (402 | ) | 9,816 | ||||||||||||||||||||
Deferred revenue | 24,502 | 3,779 | — | — | — | 2,904 | 31,185 | |||||||||||||||||||||
Other | 152,242 | (32,131 | ) | (538 | ) | 13,304 | (125 | ) | 7,842 | 140,594 | ||||||||||||||||||
Total deferred tax assets | 722,283 | (37,546 | ) | (10,031 | ) | 14,845 | 1,515 | 17,751 | 708,817 | |||||||||||||||||||
Deferred tax liabilities: | ||||||||||||||||||||||||||||
Insurance acquisition costs | (176,745 | ) | (13,182 | ) | (1,261 | ) | — | — | (286 | ) | (191,474 | ) | ||||||||||||||||
Insurance contract liabilities | (151,061 | ) | (10,796 | ) | (5,480 | ) | — | — | — | (167,337 | ) | |||||||||||||||||
Non-current other receivables in the Picturessegment | (7,894 | ) | 8,009 | — | — | — | (115 | ) | — | |||||||||||||||||||
Right-of-use | (84,728 | ) | 25,955 | — | (1,245 | ) | — | 452 | (59,566 | ) | ||||||||||||||||||
Equity securities measured at FVOCI | (51,011 | ) | 1,841 | 33,085 | — | — | 116 | (15,969 | ) | |||||||||||||||||||
Equity securities measured at FVPL | (87,718 | ) | 36,915 | — | — | — | (2,336 | ) | (53,139 | ) | ||||||||||||||||||
Debt securities measured at FVOCI | (505,914 | ) | 9,822 | 168,937 | — | — | (204 | ) | (327,359 | ) | ||||||||||||||||||
Intangible assets acquired through stock exchange offerings | (23,949 | ) | — | — | — | — | — | (23,949 | ) | |||||||||||||||||||
Intangible assets derived from EMI Music Publishing acquisition | (93,481 | ) | (1,209 | ) | — | — | — | (6,904 | ) | (101,594 | ) | |||||||||||||||||
Undistributed earnings of foreign subsidiaries and corporate joint ventures | (39,166 | ) | (15,031 | ) | — | — | — | (1,834 | ) | (56,031 | ) | |||||||||||||||||
Investment in M3 | (41,347 | ) | (1,345 | ) | — | — | — | — | (42,692 | ) | ||||||||||||||||||
Other | (60,187 | ) | 6,072 | (292 | ) | (15,230 | ) | 765 | 1,262 | (67,610 | ) | |||||||||||||||||
Total deferred tax liabilities | (1,323,201 | 47,051 | 194,989 | (16,475 | 765 | (9,849 | (1,106,720 | |||||||||||||||||||||
* Other mainly consists of exchange differences on translating foreign operations.
As of April 1, 2020, March 31, 2021 and 2022, based on the assessment of recoverability of deferred tax assets, Sony continued not to recognize the deferred tax assets at some entities in Japan, Sony Mobile Communications
AB
in Sweden, Sony Europe B.V. in the United Kingdom, certain subsidiaries in Brazil, and certain subsidiaries in other tax jurisdictions.F-
100
SONY GROUP CORPORATION AND CONSOLIDATED SUBSIDIARIES
As of March 31, 2022, the deductible temporary differences for which no deferred tax assets are recognized aggregated to
26,600
million yen on a tax basis
(
million yen as of April 1, 2020 and
44,032
million yen as of March 31, 2021). The amount of the deductible temporary differences is computed using an average tax rate of approximately 21% (an average of approximately 27% as of April 1, 2020 and approximately 11% as of March 31, 2021).
As of March 31, 2022, Sony had operating loss carryforwards and the amount for which no deferred tax asset is recognized aggregated to
195,091
million yen on a tax basis
(312,499 million yen
as of April 1, 2020 and
217,624 million yen as of March 31, 2021). The operating loss carryforwards consist of the following amounts and expiration periods:
55,197million yen with an expiration period of 1 year to 5 years,
34,207 million yen with an expiration period of 6 years to 10 years,
4,181 million yen with an expiration period of 11 years to 15 years, 505 million yen with an expiration period of over 15 years and 101,001 million yen with no expiration period. The operating loss carryforwards with no expiration date as of April 1, 2020 and March 31, 2021 were
82,106 million yen and 89,420 million yen, respectively. There were no significant changes in the operating loss carryforwards for all expiration periods incurred and expired in each fiscal year. The amount of the operating loss carryforwards is computed using an average tax rate of approximately 14% (an average of approximately 28% as of April 1, 2020 and approximately 13% as of March 31, 2021). As of
March 31, 2022, the amount of tax credit carryforwards for which no deferred tax asset is recognized aggregated
to 19,066 million yen (78,914 million yen as of April 1, 2020 and
15,369 million yenas of March 31, 2021). Except for the amount
with no expiration period, which was 1,803 million yen as of March 31, 2022, the major portion of the tax credit carryforwards expire within 5 years. The amount of tax credit carryforwards with no expiration date as of April 1, 2020 and March 31, 2021 was 694 million yen and 974 million yen, respectively.As of April 1, 2020, March 31, 2021 and 2022, deferred income taxes have not been provided on taxable temporary differences for undistributed earnings of certain foreign subsidiaries and corporate joint ventures amounting to 365,925 million yen and which are not expected to be remitted in the foreseeable future. The tax basis of these undistributed earnings was approximately 5,855 million yen. In addition, deferred income taxes have not been provided on the taxable temporary differences in subsidiaries, including a gain of
61,544million yen on a subsidiary’s sale of stock arising from the issuance of common stock of Sony Music Entertainment (Japan) Inc. in a public offering to third parties in November 1991 and the remeasurement gain on 116,939 million yen for the pre-owned equity interest in EMI Music Publishing acquired in November 2018. Sony does not anticipate any significant tax consequences on the possible future disposition of these investments based on its tax planning strategies.
In addition, the deductible temporary differences arising from the translation adjustments for the foreign operations for which deferred tax assets are not recognized as of March 31, 2021 and March 31, 2022 amounted to 50,110 million yen and 92,252 million yen, respectively. The taxable temporary differences arising from the translation adjustments for the foreign operations for which deferred tax liabilities are not recognized as of March 31, 2021 and March 31, 2022 amounted to 164,011
million yen and
429,930 million yen, respectively.
F-101
SONY GROUP CORPORATION AND CONSOLIDATED SUBSIDIARIES
26. | Reconciliation of the differences between basic and diluted EPS |
Reconciliation of the differences between basic and diluted EPS for the fiscal years ended March 31, 2021 and 2022 is as follows:
Yen in millions | ||||||||
Fiscal year ended March 31 | ||||||||
2021 | 2022 | |||||||
Net income attributable to Sony Group Corporation’s stockholders | 1,029,610 | 882,178 | ||||||
Adjustment amount to net income attributable to Sony Group Corporation’s stockholders for diluted EPS computation | ||||||||
Zero Coupon Convertible Bonds | 385 | 163 | ||||||
Net income attributable to Sony Group Corporation’s stockholders for diluted EPS computation | 1,029,995 | 882,341 | ||||||
Thousands of shares | ||||||||
Weighted-average shares outstanding for basic EPS computation | 1,230,480 | 1,239,299 | ||||||
Effect of dilutive securities: | ||||||||
Stock acquisition rights | 4,474 | 5,470 | ||||||
Zero Coupon Convertible Bonds | 15,392 | 6,491 | ||||||
Weighted-average shares for diluted EPS computation | 1,250,346 | 1,251,260 | ||||||
Yen | ||||||||
Basic EPS | 836.75 | 711.84 | ||||||
Diluted EPS | 823.77 | 705.16 | ||||||
Potential shares of common stock which were excluded from the computation of diluted EPS for the fiscal years ended March 31, 2021 and 2022 were 4,475 thousand shares and 4,790 thousand shares, respectively. The potential shares related to stock acquisition rights were excluded as anti-dilutive for the fiscal years ended March 31, 2021 and 2022 when the exercise price for those shares was in excess of the average market value of Sony Group Corporation’s common stock for the fiscal year.
27. | Supplemental cash flow information |
(1) | Classification of cash flows in Financial Services segment |
Sony classifies the cash flows from changes in assets and liabilities associated with
the
insurance business and banking business, such as investments and advances, deposits from customers, policyholders’ account and borrowings/debt, as cash flows from operating activities in the consolidated statements of cash flows.(2) | Classification of cash flows of content assets |
Sony classifies the cash flows from the additions and disposals of content assets as cash flows from operating activities in the consolidated statements of cash flows because the additions and disposals of content assets are derived from the principal revenue-producing activities of Sony.
F-102
SONY GROUP CORPORATION AND CONSOLIDATED SUBSIDIARIES
(3) | Interest and dividends |
Yen in millions | ||||||||
Fiscal year ended March 31 | ||||||||
2021 | 2022 | |||||||
Interest received | ||||||||
Financial services revenue | 198,310 | 208,170 | ||||||
Financial income | 8,409 | 6,988 | ||||||
Dividends received | ||||||||
Financial services revenue | 19,299 | 27,075 | ||||||
Financial income | 1,559 | 2,800 | ||||||
Interest paid | ||||||||
Financial services expenses | 9,659 | 6,607 | ||||||
Financial expenses | 8,172 | 8,843 | ||||||
The above are items presented in the consolidated statements of income, which include cash flows for interest and dividends.
Sony classifies the cash flows from interest and dividends of the above as cash flows from operating activities in the consolidated statements of cash flows.
(4) | Non-cash investing and financing activities |
There was an increase in ROU assets as a result of entering into lease contracts and the conversion of convertible bonds during the fiscal years ended March 31, 2021 and 2022. Refer to (5) Reconciliation of liabilities arising from financing activities for more details.
In addition, during the fiscal year ended March 31, 2022, a portion of the consideration received as a result of transferring of certain operations of Game Show Network, LLC was in the form of stock. Refer to Note 31 for more details.
(5) | Reconciliation of liabilities arising from financing activities |
Yen in millions | ||||||||
Short-term borrowings | Long-term debt | |||||||
Balance as of April 1, 2020 | 66,631 | 817,919 | ||||||
Net cash flows from financing activities | (18,334 | ) | 147,017 | |||||
Acquisitions through business combinations | — | 59 | ||||||
Non-cash items: | ||||||||
Conversion of convertible bonds | — | (78,342 | ) | |||||
Obtaining assets by entering into lease contracts | — | 56,247 | ||||||
Translation adjustment | 106 | 15,514 | ||||||
Other | 4,134 | 10,630 | ||||||
Total changes | (14,094 | ) | 151,125 | |||||
Balance as of March 31, 2021 | 52,537 | 969,044 | ||||||
Net cash flows from financing activities | 408 | (163,104 | ) | |||||
Acquisitions through business combinations | — | 8,346 | ||||||
Non-cash items: | ||||||||
Conversion of convertible bonds | — | (14,597 | ) | |||||
Obtaining assets by entering into lease contracts | — | 121,937 | ||||||
Translation adjustment | 1,659 | 35,652 | ||||||
Other | 1,487 | (6,045 | ) | |||||
Total changes | 3,554 | (17,811 | ) | |||||
Balance as of March 31, 2022 | 56,091 | 951,233 | ||||||
The amount of short-term borrowings and long-term debt associated with the insurance business and banking business operations, which are classified as cash flows from operating activities in the consolidated statements of cash flows, is excluded from the amount
above
.F-103
SONY GROUP CORPORATION AND CONSOLIDATED SUBSIDIARIES
(6) | Components of cash and cash equivalents |
Yen in millions | ||||||||||||
April 1 | March 31 | |||||||||||
2020 | 2021 | 2022 | ||||||||||
Cash and demand deposits | 1,034,265 | 902,036 | 1,824,912 | |||||||||
Time deposits with original maturities of three months or less | 369,428 | 635,848 | 72,270 | |||||||||
Money market funds | 108,830 | 249,098 | 71,554 | |||||||||
Call loans | — | — | 80,900 | |||||||||
Total | 1,512,523 | 1,786,982 | 2,049,636 | |||||||||
Cash and demand deposits, time deposits with original maturities of three months or less and call loans are classified as financial assets required to be measured at amortized cost, whose carrying amounts approximate their fair values mainly due to their short-term nature. Money market funds are short-term and highly liquid investments with insignificant risk of changes in value. Money market funds are classified as financial assets required to be measured at fair value through profit or loss and classified within Level 1 of the fair value hierarchy.
28. | Structured entities |
Sony has, from time to time, entered into various arrangements with structured entities.
(1) | Consolidated structured entities |
Sony consolidates investment funds as structured entities in the Financial Services segment. The investment funds are designed so that voting or similar rights are not the dominant factor in deciding who controls thes entities, but it is determined that Sony has control over these structured entities. Sony has not provided and does not intend to provide any significant financial or other support to any of the consolidated structured entities without contractual obligations to the investment funds. The assets and liabilities of structured entities that are consolidated in the Financial Services segment are limited in their intended use by contractual arrangements. As of April 1, 2020, March 31, 2021 and 2022, the total assets of these structured entities are 542,777 million yen, 616,578 million yen, and 628,297 million yen, respectively.
e
Sony also consolidates several structured entities in the Music and Pictures segment. Sony has not provided and does not intend to provide any significant financial or other support to these structured entities without contractual obligation. The total assets and liabilities for these structured entities were insignificant to Sony’s financial position.
(2) | Unconsolidated structured entities |
Certain
trade
receivable sales programs also involve structured entities. These structured entities are all special purpose entities associated with the sponsor banks. Based on a qualitative assessment, Sony does not consolidate these entities as Sony does not have the power to direct the activities, an obligation to absorb losses, or the right to receive the residual returns of these structured entities. Sony’s maximum exposure to losses from these structured entities is considered insignificant.
The subsidiary in the Financial Services segment enters into securitization transactions for certain housing loans, involving unconsolidated structured entities. Sony derecognizes a financial asset when the contractual right to receive the cash flows from the financial asset is transferred, or when Sony retains the contractual right to receive the cash flows from the financial asset, but assumes a contractual obligation to pay the cash flows without reinvestment or material delay to other recipients in an arrangement, and substantially all the risks and rewards of ownership of the financial asset are transferred to another entity. Since the above securitization transactions do not meet the requirements for derecognition of financial assets, such transferred assets are not derecognized. Sony recorded
182,417 million yen of transferred assets that do not meet the requirement for derecognition of financial assets included in investments and advances in the Financial Services segment as of March 31, 2022. The liabilities recorded from these securitization transactions were
183,886 million yen and are included in current portion of long-term debt and long-term debt. The liabilities will be settled when the payment for the transferred assets is executed and until this time, Sony is unable to utilize the transferred assets. The
F-104
SONY GROUP CORPORATION AND CONSOLIDATED SUBSIDIARIES
transferee of the transferred assets has recourse only to the transferred asset, and as of March 31, 2022, the fair value of the transferred assets and the associated liabilities are 187,555 million yen and 186,702 million yen, respectively.
In addition to the above, in the Financial Services segment, Sony makes investments in structured entities. Sony’s investments in such structured entities include securitized products, foreign corporate bonds and other investments. The following tables present the carrying amount of the investments of unconsolidated structured entities, the presentation in the consolidated statements of financial position, and the maximum exposure to loss associated with these investments as of April 1, 2020, March 31, 2021 and 2022. Maximum exposure to loss does not reflect Sony’s estimate of the actual losses that could result from adverse changes, nor does it reflect the economic hedges Sony enters into to reduce its exposure. The risks associated with structured entities in which Sony is involved are limited to the amount recorded in the consolidated statements of financial position and the amount
of
commitments.Yen in millions | ||||||||||||||||
April 1, 2020 | ||||||||||||||||
Presentation in the consolidated statements of financial position | Maximum exposure to loss | |||||||||||||||
Investments and advances in the Financial Services segment (Current assets) | Investments and advances in the Financial Services segment (Non-current assets) | Other financial assets (Current assets) | ||||||||||||||
Securitized products | — | 224,232 | — | 224,232 | ||||||||||||
Foreign corporate bonds *1 | 41,452 | 41,036 | — | 82,488 | ||||||||||||
Other investments *2 | — | 135,743 | 21,000 | 164,955 | ||||||||||||
Total | 41,452 | 401,011 | 21,000 | 471,675 | ||||||||||||
Yen in millions | ||||||||||||||||
March 31, 2021 | ||||||||||||||||
Presentation in the consolidated statements of financial position | ||||||||||||||||
Investments and advances in the Financial Services segment (Current assets) | Investments and advances in the Financial Services segment (Non-current assets) | Other financial assets (Current assets) | Maximum exposure to loss | |||||||||||||
Securitized products | — | 270,920 | — | 270,920 | ||||||||||||
Foreign corporate bonds *1 | 49,011 | 31,026 | — | 80,037 | ||||||||||||
Other investments *2 | — | 224,765 | 21,000 | 266,825 | ||||||||||||
Total | 49,011 | 526,711 | 21,000 | 617,782 | ||||||||||||
Yen in millions | ||||||||||||||||
March 31, 2022 | ||||||||||||||||
Presentation in the consolidated statements of financial position | ||||||||||||||||
Investments and advances in the Financial segment (Current assets) | Investments and advances in the Financial Services segment (Non-current assets) | Other financial assets (Current assets) | Maximum exposure to loss | |||||||||||||
Securitized products | — | 356,862 | — | 356,862 | ||||||||||||
Foreign corporate bonds *1 | 28,412 | 168,167 | — | 196,579 | ||||||||||||
Other investments *2 | 2 | 247,394 | 24,697 | 286,662 | ||||||||||||
Total | 28,414 | 772,423 | 24,697 | 840,103 | ||||||||||||
| *1 | Foreign corporate bonds include repackaged bonds. |
| *2 | Other investments include investment funds. |
F-10
5
SONY GROUP CORPORATION AND CONSOLIDATED SUBSIDIARIES
29. | Subsidiaries |
(1) | Major consolidated subsidiaries |
The following table sets forth the major consolidated subsidiaries owned, directly or indirectly, by Sony Group Corporation.
Name of company | Country of incorporation /residence | (As of March 31, 2022) Percentage owned | ||
| Sony Interactive Entertainment Inc. | Japan | 100.0 | ||
| Sony Music Entertainment (Japan) Inc. | Japan | 100.0 | ||
| Sony Corporation | Japan | 100.0 | ||
| Sony Global Manufacturing & Operations Corporation | Japan | 100.0 | ||
| Sony Semiconductor Solutions Corporation | Japan | 100.0 | ||
| Sony Semiconductor Manufacturing Corporation | Japan | 100.0 | ||
| Sony Network Communications Inc. | Japan | 100.0 | ||
| Sony Marketing Inc. | Japan | 100.0 | ||
| Sony Storage Media Solutions Corporation | Japan | 100.0 | ||
| Sony Financial Group Inc. | Japan | 100.0 | ||
| Sony Life Insurance Co., Ltd. | Japan | 100.0 | ||
| Sony Bank Inc. | Japan | 100.0 | ||
| Sony Assurance Inc. | Japan | 100.0 | ||
| Sony Corporation of America | U.S.A. | 100.0 | ||
| Sony Interactive Entertainment LLC | U.S.A. | 100.0 | ||
| Sony Music Entertainment | U.S.A. | 100.0 | ||
| Sony Music Publishing LLC | U.S.A. | 100.0 | ||
| Sony Pictures Entertainment Inc. | U.S.A. | 100.0 | ||
| Sony Electronics Inc. | U.S.A. | 100.0 | ||
| Sony Europe B.V. | U.K. | 100.0 | ||
| Sony Interactive Entertainment Europe Ltd. | U.K. | 100.0 | ||
| Sony Global Treasury Services Plc | U.K. | 100.0 | ||
| Sony Overseas Holding B.V. | Netherlands | 100.0 | ||
| Sony (China) Limited | China | 100.0 | ||
| Sony EMCS (Malaysia) Sdn. Bhd. | Malaysia | 100.0 | ||
| Sony Electronics (Singapore) Pte. Ltd. | Singapore | 100.0 |
(2) | Subsidiaries with material noncontrolling interests |
SFGI had noncontrolling interests that were material to Sony as of April 1, 2020. Sony acquired all of the common shares and the related stock acquisition rights of SFGI and increased its ownership from 65.1% to 100% in the fiscal year ended March 31, 2021. Accordingly, the summarized financial information relating to SFGI is shown only for April 1, 2020. The summarized financial information shows amounts before elimination of intercompany transactions. On October 1, 2021, SFGI changed its company name from SFH.
F-10
6
SONY GROUP CORPORATION AND CONSOLIDATED SUBSIDIARIES
Sony Financial Group Inc. and its consolidated subsidiaries
Yen in millions | ||||
April 1, 2020 | ||||
Shareholding ratio of noncontrolling interests | 34.9 | % | ||
Cumulative amount of noncontrolling interests | 1,074,469 | |||
Yen in millions | ||||
April 1, 2020 | ||||
Current assets | 1,124,209 | |||
Non-current assets | 16,809,378 | |||
Current liabilities | 3,406,291 | |||
Non-current liabilities | 11,470,701 | |||
30. | Acquisitions |
(1) | Ellation Holdings, Inc. acquisition |
On August 9, 2021, Sony Pictures Entertainment Inc. (“SPE”), a wholly-owned subsidiary of Sony, through Funimation Global Group, LLC (“Funimation”), acquired 100% of the equity interest in Ellation Holdings, Inc. (“Ellation”), a subsidiary of AT&T Inc., which operates the anime business “Crunchyroll”. Funimation is a joint venture between SPE and Aniplex Inc., a subsidiary of Sony Music Entertainment (Japan) Inc. The consideration for the acquisition of 135,938 million yen (1,237 million U.S. dollars) was paid in cash. As a result of the acquisition, Ellation has become a wholly-owned subsidiary of
Sony. On February 24, 2022, Funimation changed its company name to Crunchyroll, LLC.
Crunchyroll is aservice, connecting anime and manga fans across more than 200 countries and territories. Crunchyroll provides services including subscriptionadvertising-basedmobile games, manga, events, merchandise and distribution. The acquisition has brought together two animation distribution brands, Funimation and Crunchyroll, allowing Sony to expand
direct-to-consumer
video-on-demand,
video-on-demand,
fan-centric
offerings. The global unification and integration of the two brands and services under the Crunchyroll brand started in March 2022.As a result of the acquisition, Sony consolidated Ellation by using the acquisition method of accounting and recorded the fair value of the identifiable assets acquired, liabilities assumed and residual goodwill of Ellation. The following table summarizes the final fair values assigned to the assets and liabilities of Ellation that were recorded in the Pictures segment. The measurement period adjustments were not material.
Yen in millions | ||||
Cash and cash equivalents | 8,379 | |||
Trade and other receivables, and contract assets | 3,714 | |||
Inventories | 3,295 | |||
Right-of-use | 4,962 | |||
Goodwill | 81,250 | |||
Content assets | 36,266 | |||
Other intangible assets | 35,697 | |||
Other | 2,512 | |||
Total assets | 176,075 | |||
Trade and other payables | 17,365 | |||
Other current liabilities | 7,723 | |||
Long-term debt | 4,386 | |||
Deferred tax liabilities | 9,408 | |||
Other | 659 | |||
Total liabilities | 39,541 | |||
F-107
SONY GROUP CORPORATION AND CONSOLIDATED SUBSIDIARIES
Content assets and other intangible assets mainly consist of license agreements and customer relationships. Goodwill represents unidentifiable intangible assets, such as future growth from new revenue streams and synergies with existing Sony assets and businesses, and is calculated as the excess of the purchase price over the estimated fair value of the tangible and intangible assets acquired and is not deductible for tax purposes. The goodwill recorded in connection with the acquisition is included in the Pictures segment.
Revenue and net income attributable to Ellation since the date of acquisition included in Sony’s consolidated statements of income and pro forma results of operations have not been presented because the effect of the acquisition was not material.
(2) | Other acquisitions |
During the fiscal year ended March 31, 2021, Sony completed other acquisitions for total consideration of 18,258 million yen which was paid for primarily in cash and there was 0 material contingent consideration subject to future change. As a result of these acquisitions, Sony recorded 15,679 million yen of goodwill and 6,061 million yen of intangible assets.
During the fiscal year ended March 31, 2022, Sony completed other acquisitions for total consideration of 175,878 million yen which was paid for primarily in cash and there was 0 material contingent consideration subject to future change. As a result of these acquisitions, Sony recorded 116,394 million yen of goodwill and 64,348 million yen of intangible assets.
No significant amounts have been allocated to
in-process
research and development and all of the entities described above have been consolidated into Sony’s results of operations since their respective acquisition dates. Other information including pro forma results of operations has not been presented because the effects of other acquisitions, individually and in aggregate, were not material.31. | Divestiture |
Transfer of certain operations of Game Show Network, LLC
On December 6, 2021, Sony completed the transfer of GSN Games, a division of Game Show Network, LLC, a wholly-owned subsidiary in the Pictures segment, to Scopely, Inc. (“Scopely”). The consideration for the transaction was 115,054 million yen (1,011 million U.S. dollars), of which Sony received 58,131 million yen (511 million U.S. dollars) in cash and 56,923 million yen (500 million U.S. dollars) in preferred stock of Scopely.
This preferred stock is measured at fair value as an equity instrument and subsequent changes in the fair value will be recognized in other comprehensive income. As a result of the completion of this transfer, Sony recognized a gain of 70,020 million yen (615 million U.S. dollars) within other operating (income) expense, net in the consolidated statements of income for the fiscal year ended March 31, 2022.
F-10
8
SONY GROUP CORPORATION AND CONSOLIDATED SUBSIDIARIES
32. | Related party transactions |
(1) | Account balances and transactions with associates and joint ventures accounted for under the equity method |
Account balances and transactions with associates and joint ventures accounted for under the equity method are as follows:
Yen in millions | ||||||||||||
April 1 | March 31 | |||||||||||
2020 | 2021 | 2022 | ||||||||||
Trade and other accounts receivable | ||||||||||||
Associates | 6,236 | 6,875 | 9,587 | |||||||||
Joint ventures | 7,383 | 1,953 | 5,143 | |||||||||
Total | 13,619 | 8,828 | 14,730 | |||||||||
| Other current assets | ||||||||||||
Associates | 9,757 | 16,097 | 7,042 | |||||||||
Joint ventures | — | — | — | |||||||||
Total | 9,757 | 16,097 | 7,042 | |||||||||
| Accounts payable, trade | ||||||||||||
Associates | 1,437 | 1,356 | 1,219 | |||||||||
Joint ventures | 60 | 53 | 157 | |||||||||
Total | 1,497 | 1,409 | 1,376 | |||||||||
| Short-term borrowings | ||||||||||||
Associates | — | 2,847 | 2,131 | |||||||||
Joint ventures | 31,557 | 18,520 | 20,132 | |||||||||
Total | 31,557 | 21,367 | 22,263 | |||||||||
| Lease liabilities and other | ||||||||||||
Associates | 36,957 | 50,748 | 64,552 | |||||||||
| Joint ventures | — | — | — | |||||||||
Total | 36,957 | 50,748 | 64,552 | |||||||||
| Accounts payable for property, plant and equipment | ||||||||||||
Associates | 68 | 1,566 | 7,189 | |||||||||
Joint ventures | — | — | — | |||||||||
Total | 68 | 1,566 | 7,189 | |||||||||
F-10
9
SONY GROUP CORPORATION AND CONSOLIDATED SUBSIDIARIES
Yen in millions | ||||||||
Fiscal year ended March 31 | ||||||||
2021 | 2022 | |||||||
| Sales | ||||||||
Associates | 15,087 | 20,385 | ||||||
Joint ventures | 17,985 | 27,374 | ||||||
Total | 33,072 | 47,759 | ||||||
| Purchases | ||||||||
Associates | 3,083 | 3,271 | ||||||
Joint ventures | 1 | 785 | ||||||
Total | 3,084 | 4,056 | ||||||
| Lease payments and other | ||||||||
Associates | 8,028 | 11,180 | ||||||
Joint ventures | — | — | ||||||
Total | 8,028 | 11,180 | ||||||
| Payments for property, plant and equipment | ||||||||
| Associates | 1,272 | 12,052 | ||||||
| Joint ventures | — | — | ||||||
| Total | 1,272 | 12,052 | ||||||
Sony has agreements with shareholders of associates to make cash investments in the associates in the future. The investment commitments as of March 31, 2022, amounted to 39,231 million yen.
(2) | Compensation for key management personnel |
Compensation for key management personnel for the fiscal years ended March 31, 2021 and 2022 is presented as follows:
Yen in millions | ||||||||
Fiscal year ended March 31 | ||||||||
2021 | 2022 | |||||||
Short-term employee benefits | 1,202 | 1,480 | ||||||
Stock-based compensation | 2,329 | 1,597 | ||||||
Total | 3,531 | 3,077 | ||||||
Compensation for key management personnel is the remuneration for Directors (including outside Directors) and Corporate executive officers of Sony Group Corporation.
33. | Purchase commitments, contingent liabilities and other |
(1) | Loan commitments |
Subsidiaries in the Financial Services segment have lines of credit in accordance with loan agreements with their customers. As of April 1, 2020 and March 31, 2021 and 2022, the total unused portion of the lines of credit extended under these contracts was 34,306 million yen, 37,322 million yen and 33,587 million yen,
respectively.
F-110
SONY GROUP CORPORATION AND CONSOLIDATED SUBSIDIARIES
(2) | Purchase commitments |
Purchase commitments as of April 1, 2020 and March 31, 2021 and 2022 amounted to 680,739 million yen, 629,474 million yen and 1,000,833 million yen, respectively. The amount of these purchase commitments covers the purchase consideration for property, plant and equipment, intangible assets, other goods and other services. The major components of these commitments are as follows:
Certain subsidiaries in the Pictures segment have entered into agreements with creative talent for the development and production of motion pictures and television programming as well as agreements with third parties to acquire completed motion pictures, or certain rights therein, and to acquire the rights to broadcast certain live action sporting events. These agreements cover various periods, mainly within three years from the end of each period. As of April 1, 2020 and March 31, 2021 and 2022, these subsidiaries were committed to make payments under such contracts of 126,917 million yen, 105,921 million yen and 101,284 million yen, respectively.
Certain
subsidiaries in the Music segment have entered into contracts with recording artists, songwriters and companies for the future production, distribution and/or licensing of music products. These contracts cover various periods, mainly within
five yearsfrom the end of each period. As of April
1,
2020and March
31,
2021and
2022, these subsidiaries were committed to make payments of
128,678 million yen,
149,021 million yen and
153,920 million yen, respectively, under such contracts.
Certain subsidiaries in the G&NS segment have entered into long-term contracts for the development, distribution and publishing of game software. These contracts cover various periods, mainly within seven years from the end of each period. As of April 1, 2020 and March 31, 2021 and 2022, these subsidiaries were committed to make payments of 29,243 million yen, 32,959 million yen and 34,842 million yen, respectively, under such contracts.
In addition to the above, Sony has entered into purchase contracts for property, plant and equipment and intangible assets. As of April 1, 2020 and March 31, 2021 and 2022, Sony has committed to make payments of 199,145 million yen, 135,297 million yen and 246,263 million yen, respectively, under such contracts.
Sony has entered into purchase contracts for materials. As of April 1, 2020 and March 31, 2021 and 2022, Sony has committed to make payments of 115,670 million yen, 96,589 million yen and 265,518 million yen, respectively, under such contracts.
(3) | Litigation |
Sony Group Corporation and certain of its subsidiaries are defendants or otherwise involved in pending legal and regulatory proceedings. However, based upon the information currently available, Sony believes that the outcome from such legal and regulatory proceedings would not have a material impact on Sony’s results of operations and financial position.
(4) | Guarantees |
Sony has issued guarantees that contingently require payments to guaranteed parties if certain specified events or conditions occur. The maximum potential amount of future payments under these guarantees as of April 1, 2020 and March 31, 2021 and 2022 amounted to 2,214 million yen, 529 million yen and 501 million yen, respectively.
34. | First-time adoption |
Sony has adopted IFRS from the first quarter of the fiscal year ended March 31, 2022. The latest consolidated financial statements under U.S. GAAP were prepared for the fiscal year ended March 31, 2021, and the date of transition to IFRS was April 1, 2020
.
F-111
SONY GROUP CORPORATION AND CONSOLIDATED SUBSIDIARIES
(1) | Exemption under IFRS 1 |
IFRS 1 requires that a company adopting IFRS for the first-time (“first-time adopters”) shall apply IFRS retrospectively. However, IFRS 1 provides certain exemptions that allow first-time adopters to choose not to apply certain standards retrospectively. Sony has adopted the following exemptions:
Business combinations
First-time adopters may choose not to apply IFRS 3 “Business Combinations” (“IFRS 3”) retrospectively to business combinations that occurred before the date of transition to IFRS. Sony has applied this exemption and chosen not to apply IFRS 3 retrospectively to business combinations that occurred before the date of transition to IFRS. Therefore, the carrying amounts of goodwill generated in business combinations that occurred prior to the date of transition to IFRS were based on the carrying amounts determined under U.S. GAAP at the date of transition to IFRS.
Sony performed an impairment test on goodwill at the date of transition to IFRS regardless of whether there were any indications that the goodwill may be impaired, refer to Note 3 I. Significant accounting policies (10).
Exchange differences on translating foreign operations
First-time adopters may choose to deem the cumulative exchange differences on translating foreign operations as zero at the date of transition to IFRS. Sony has chosen to apply this exemption and deemed all cumulative exchange differences on translating foreign operations as zero at the date of transition to IFRS.
Designation of financial instruments recognized before the date of transition to IFRS
First-time adopters may designate an investment in an equity instrument as an investment recognized at fair value through other comprehensive income in accordance with IFRS 9 “Financial Instruments” based on the facts and circumstances that existed at the date of transition to IFRS. Sony has applied this exemption and designated some equity instruments at fair value in other comprehensive income at the date of transition to IFRS.
Recognition of ROU assets and lease liabilities
When first-time adopters recognize ROU assets and lease liabilities as a lessee, they are permitted to measure ROU assets and lease liabilities at the date of transition to IFRS. Sony measured all lease liabilities at the date of transition to IFRS at the present value of the remaining lease payments, discounted using Sony’s incremental borrowing rate at the date of transition to IFRS. Sony recognized ROU assets equal to the amount of lease liabilities at the date of transition to IFRS.
(2) | Mandatory exception under IFRS 1 |
IFRS 1 prohibits the retrospective application of IFRS concerning “estimates,”
“non-controlling
interests,” “classification and measurement of financial instruments” and other items. Sony applied these items prospectively from the date of transition to IFRS.(3) | Reconciliation |
The reconciliations required to be disclosed in the first IFRS financial statements are described in the reconciliations as below. “Reclassification” includes items that do not affect retained earnings and comprehensive income, while “Recognition and measurement differences” includes items that affect retained earnings and comprehensive income.
F-11
2
SONY GROUP CORPORATION AND CONSOLIDATED SUBSIDIARIES
Reconciliation of equity at the date of transition to IFRS (April 1, 2020)
Accounts under U.S. GAAP | Yen in millions | Accounts under IFRS | ||||||||||||||||||
U.S. GAAP* | Reclassification | Recognition and measurement differences | IFRS | Note | ||||||||||||||||
ASSETS | ASSETS | |||||||||||||||||||
Current assets: | Current assets: | |||||||||||||||||||
| Cash and cash equivalents | 1,512,357 | — | 166 | 1,512,523 | Cash and cash equivalents | |||||||||||||||
| Marketable securities | 1,847,772 | (1,847,772 | ) | — | — | a | ||||||||||||||
| — | 327,092 | — | 327,092 | a,f | Investments and advances in the Financial Services segment | |||||||||||||||
| Notes and accounts receivable, trade and contract assets | 1,028,793 | (1,028,793 | ) | — | — | b | ||||||||||||||
| — | 1,195,228 | (894 | ) | 1,194,334 | b,c | Trade and other receivables, and contract assets | ||||||||||||||
| Allowance for credit losses | (26,153 | ) | 26,153 | — | — | b | ||||||||||||||
| Inventories | 558,452 | — | 1,327 | 559,779 | Inventories | |||||||||||||||
| Other receivables | 188,076 | (188,076 | ) | — | — | c | ||||||||||||||
| — | 135,265 | 217 | 135,482 | d | Other financial assets | |||||||||||||||
| Prepaid expenses and other current assets | 594,009 | (153,473 | ) | 1,438 | 441,974 | d | Other current assets | |||||||||||||
Total current assets | 5,703,306 | (1,534,376 | ) | 2,254 | 4,171,184 | Total current assets | ||||||||||||||
Non-current assets: | ||||||||||||||||||||
Film costs | 458,853 | (458,853 | ) | — | — | e | ||||||||||||||
Investments and advances: | ||||||||||||||||||||
| Affiliated companies | 207,922 | (608 | ) | (3,023) | 204,291 | Investments accounted for using the equity method | ||||||||||||||
| Securities investments and other | 12,526,990 | (12,526,990 | ) | — | — | f | ||||||||||||||
| Allowance for credit losses | (6,341 | ) | 6,341 | — | — | |||||||||||||||
| — | 13,906,535 | 2,445,750 | 16,352,285 | a,f,D | Investments and advances in the Financial Services segment | |||||||||||||||
Property, plant and equipment: | ||||||||||||||||||||
| Land | 81,482 | (81,482 | ) | — | — | |||||||||||||||
| Buildings | 659,556 | (659,556 | ) | — | — | |||||||||||||||
| Machinery and equipment | 1,725,720 | (1,725,720 | ) | — | — | |||||||||||||||
| Construction in progress | 76,391 | (76,391 | ) | — | — | |||||||||||||||
| Less — Accumulated depreciation | 1,634,505 | (1,634,505 | ) | — | — | |||||||||||||||
| — | 921,513 | (4,315 | ) | 917,198 | Property, plant and equipment | |||||||||||||||
Other assets: | ||||||||||||||||||||
| Operating lease right-of-use | 359,510 | (359,510 | ) | — | — | g | ||||||||||||||
| Finance lease right-of-use | 33,100 | (33,100 | ) | — | — | g | ||||||||||||||
| — | 376,998 | (3,716 | ) | 373,282 | g | Right-of-use | ||||||||||||||
| Intangibles, net | 906,310 | (906,310 | ) | — | — | e | ||||||||||||||
| Goodwill | 783,888 | — | (92,959 | ) | 690,929 | C | Goodwill | |||||||||||||
| — | 991,611 | 1,033 | 992,644 | e | Content assets | |||||||||||||||
| — | 373,552 | 3,948 | 377,500 | e | Other intangible assets | |||||||||||||||
| Deferred insurance acquisition costs | 600,901 | — | (412,997 | ) | 187,904 | E | Deferred insurance acquisition costs | |||||||||||||
| Deferred income taxes | 210,417 | 87 | (171 | ) | 210,333 | Deferred tax assets | ||||||||||||||
| — | 298,469 | 23,252 | 321,721 | f,h,D | Other financial assets | |||||||||||||||
| Other | 339,284 | (154,853 | ) | (16,636 | ) | 167,795 | h,B | Other non-current assets | ||||||||||||
| 17,329,478 | 1,526,238 | 1,940,166 | 20,795,882 | Total non-current assets | ||||||||||||||||
Total assets | 23,032,784 | (8,138 | ) | 1,942,420 | 24,967,066 | Total assets | ||||||||||||||
F-11
3
SONY GROUP CORPORATION AND CONSOLIDATED SUBSIDIARIES
Accounts under U.S. GAAP | Yen in millions | Accounts under IFRS | ||||||||||||||||||
U.S. GAAP* | Reclassification | Recognition and measurement differences | IFRS | Note | ||||||||||||||||
LIABILITIES | LIABILITIES | |||||||||||||||||||
Current liabilities: | Current liabilities: | |||||||||||||||||||
| Short-term borrowings | 810,176 | 13,869 | — | 824,045 | Short-term borrowings | |||||||||||||||
| Current portion of long-term debt | 29,807 | 69,116 | — | 98,923 | i | Current portion of long-term debt | ||||||||||||||
| Current portion of long-term operating lease liabilities | 68,942 | (68,942 | ) | — | — | i | ||||||||||||||
| Notes and accounts payable, trade | 380,810 | (380,810 | ) | — | — | j | ||||||||||||||
| — | 1,340,573 | (30,037 | ) | 1,310,536 | j,k,m | Trade and other payables | ||||||||||||||
| Accounts payable, other and accrued expenses | 1,630,197 | (1,630,197 | ) | — | — | k | ||||||||||||||
| Deposits from customers in the banking business | 2,440,783 | (93,396 | ) | — | 2,347,387 | l | Deposits from customers in the banking business | |||||||||||||
| Accrued income and other taxes | 145,996 | (60,650 | ) | — | 85,346 | Income taxes payables | ||||||||||||||
| — | 163,007 | — | 163,007 | k | Participation and residual liabilities in the Pictures segment | |||||||||||||||
| — | 56,152 | — | 56,152 | k,m | Other financial liabilities | |||||||||||||||
| Other | 733,732 | 527,859 | 2,353 | 1,263,944 | k,m | Other current liabilities | ||||||||||||||
| Total current liabilities | 6,240,443 | (63,419 | ) | (27,684 | ) | 6,149,340 | Total current liabilities | |||||||||||||
Non-current liabilities: | ||||||||||||||||||||
| Long-term debt | 634,966 | 305,871 | (1,807 | ) | 939,030 | i | Long-term debt | |||||||||||||
| Long-term operating lease liabilities | 314,836 | (314,836 | ) | — | — | i | ||||||||||||||
| Accrued pension and severance costs | 324,655 | 4,355 | 611 | 329,621 | B | Defined benefit liabilities | ||||||||||||||
| Deferred income taxes | 548,034 | 87 | 493,035 | 1,041,156 | F | Deferred tax liabilities | ||||||||||||||
| Future insurance policy benefits and other | 6,246,047 | — | 273,530 | 6,519,577 | E | Future insurance policy benefits and other | ||||||||||||||
| Policyholders’ account in the life insurance business | 3,642,271 | — | (2,261 | ) | 3,640,010 | E | Policyholders’ account in the life insurance business | |||||||||||||
| — | 122,706 | (3,004 | ) | 119,702 | n | Participation and residual liabilities in the Pictures segment | ||||||||||||||
| — | 146,834 | — | 146,834 | l,n,o | Other financial liabilities | |||||||||||||||
| Other | 289,285 | (201,969 | ) | 4 | 87,320 | n | Other non-current liabilities | |||||||||||||
| 12,000,094 | 63,048 | 760,108 | 12,823,250 | Total non-current liabilities | ||||||||||||||||
Total liabilities | 18,240,537 | (371 | ) | 732,424 | 18,972,590 | Total liabilities | ||||||||||||||
Redeemable noncontrolling interest | 7,767 | (7,767 | ) | — | — | o | ||||||||||||||
EQUITY | EQUITY | |||||||||||||||||||
Sony Group Corporation’s stockholders’ equity: | Sony Group Corporation’s stockholders’ equity: | |||||||||||||||||||
| Common stock | 880,214 | — | — | 880,214 | Common stock | |||||||||||||||
| Additional paid-in capital | 1,289,719 | — | 7,835 | 1,297,554 | Additional paid-in capital | |||||||||||||||
| Retained earnings | 2,765,187 | — | (815,490 | ) | 1,949,697 | G | Retained earnings | |||||||||||||
| Accumulated other comprehensive income | (580,980 | ) | — | 1,560,456 | 979,476 | A,B,D E,F | Accumulated other comprehensive income | |||||||||||||
| Treasury stock, at cost | (232,503 | ) | — | — | (232,503 | ) | Treasury stock, at cost | |||||||||||||
| 4,121,637 | — | 752,801 | 4,874,438 | Equity attributable to Sony Group Corporation’s stockholders | ||||||||||||||||
| Noncontrolling interests | 662,843 | — | 457,195 | 1,120,038 | F | Noncontrolling interests | ||||||||||||||
Total equity | 4,784,480 | — | 1,209,996 | 5,994,476 | Total equity | |||||||||||||||
Total liabilities and equity | 23,032,784 | (8,138 | ) | 1,942,420 | 24,967,066 | Total liabilities and equity | ||||||||||||||
| * | “U.S. GAAP” represents the consolidated financial statements under U.S. GAAP for the fiscal year ended March 31, 2020, adjusted for the adoption of the Accounting Standards Updates issued by the Financial Accounting Standards Board effective as of April 1, 2020. |
F-11
4
SONY GROUP CORPORATION AND CONSOLIDATED SUBSIDIARIES
Reconciliation of equity as of March 31, 2021
Accounts under U.S. GAAP | Yen in millions | Accounts under IFRS | ||||||||||||||||||
U.S. GAAP | Reclassification | Recognition and measurement differences | IFRS | Note | ||||||||||||||||
ASSETS | ASSETS | |||||||||||||||||||
Current assets: | Current assets: | |||||||||||||||||||
| Cash and cash equivalents | 1,786,982 | — | — | 1,786,982 | Cash and cash equivalents | |||||||||||||||
| Marketable securities | 2,902,438 | (2,902,438 | ) | — | — | a,p | ||||||||||||||
| — | 412,016 | (34 | ) | 411,982 | a,f | Investments and advances in the Financial Services segment | ||||||||||||||
| Notes and accounts receivable, trade and contract assets | 1,099,300 | (1,099,300 | ) | — | — | b | ||||||||||||||
| — | 1,366,991 | (1,498 | ) | 1,365,493 | b,c | Trade and other receivables, and contract assets | ||||||||||||||
| Allowance for credit losses | (29,406 | ) | 29,406 | — | — | b | ||||||||||||||
| Inventories | 637,391 | — | (723 | ) | 636,668 | Inventories | ||||||||||||||
| Other receivables | 283,499 | (283,499 | ) | — | — | c | ||||||||||||||
| — | 117,522 | 160 | 117,682 | d | Other financial assets | |||||||||||||||
| Prepaid expenses and other current assets | 538,540 | (141,517 | ) | (813 | ) | 396,210 | d | Other current assets | ||||||||||||
Total current assets | 7,218,744 | (2,500,819 | ) | (2,908 | ) | 4,715,017 | Total current assets | |||||||||||||
Non-current assets: | ||||||||||||||||||||
Film costs | 459,426 | (459,426 | ) | — | — | e | ||||||||||||||
Investments and advances: | ||||||||||||||||||||
| Affiliated companies | 226,218 | (1,132 | ) | — | 225,086 | Investments accounted for using the equity method | ||||||||||||||
| Securities investments and other | 14,046,196 | (14,046,196 | ) | — | — | f | ||||||||||||||
| Allowance for credit losses | (8,419 | ) | 8,419 | — | — | |||||||||||||||
| — | 15,639,456 | 1,657,090 | 17,296,546 | a,f,D | Investments and advances in the Financial Services segment | |||||||||||||||
Property, plant and equipment: | ||||||||||||||||||||
| Land | 79,557 | (79,557 | ) | — | — | |||||||||||||||
| Buildings | 683,249 | (683,249 | ) | — | — | |||||||||||||||
| Machinery and equipment | 1,748,961 | (1,748,961 | ) | — | — | |||||||||||||||
| Construction in progress | 100,728 | (100,728 | ) | — | — | |||||||||||||||
| Less — Accumulated depreciation | 1,627,061 | (1,627,061 | ) | — | — | |||||||||||||||
| — | 994,676 | (4,135 | ) | 990,541 | Property, plant and equipment | |||||||||||||||
Other assets: | ||||||||||||||||||||
| Operating lease right-of-use | 337,322 | (337,322 | ) | — | — | g | ||||||||||||||
| Finance lease right-of-use | 39,772 | (39,772 | ) | — | — | g | ||||||||||||||
| — | 365,641 | (7,607 | ) | 358,034 | g | Right-of-use | ||||||||||||||
| Intangibles, net | 996,305 | (996,305 | ) | — | — | e | ||||||||||||||
| Goodwill | 827,149 | (398 | ) | (100,642 | ) | 726,109 | C | Goodwill | ||||||||||||
| — | 1,062,865 | (318 | ) | 1,062,547 | e | Content assets | ||||||||||||||
| — | 392,862 | (1,807 | ) | 391,055 | e | Other intangible assets | ||||||||||||||
| Deferred insurance acquisition costs | 657,420 | — | (33,434 | ) | 623,986 | E | Deferred insurance acquisition costs | |||||||||||||
| Deferred income taxes | 207,470 | (2,649 | ) | 10,848 | 215,669 | Deferred tax assets | ||||||||||||||
| — | 663,105 | 32,659 | 695,764 | f,h,D | Other financial assets | |||||||||||||||
| Other | 361,803 | (137,916 | ) | (16,398 | ) | 207,489 | h,B | Other non-current assets | ||||||||||||
| 19,136,096 | 2,120,474 | 1,536,256 | 22,792,826 | Total non-current assets | ||||||||||||||||
Total assets | 26,354,840 | (380,345 | ) | 1,533,348 | 27,507,843 | Total assets | ||||||||||||||
F-11
5
SONY GROUP CORPORATION
AND
CONSOLIDATED SUBSIDIARIESAccounts under U.S. GAAP | Yen in millions | Accounts under IFRS | ||||||||||||||||||
U.S. GAAP | Reclassification | Recognition and measurement differences | IFRS | Note | ||||||||||||||||
LIABILITIES | LIABILITIES | |||||||||||||||||||
Current liabilities: | Current liabilities: | |||||||||||||||||||
| Short-term borrowings | 1,187,868 | 13,879 | — | 1,201,747 | Short-term borrowings | |||||||||||||||
| Current portion of long-term debt | 131,699 | 73,582 | 125 | 205,406 | i | Current portion of long-term debt | ||||||||||||||
| Current portion of long-term operating lease liabilities | 73,362 | (73,362 | ) | — | — | i | ||||||||||||||
| Notes and accounts payable, trade | 599,569 | (599,569 | ) | — | — | j | ||||||||||||||
| — | 1,632,952 | (36,389 | ) | 1,596,563 | j,k,m | Trade and other payables | ||||||||||||||
| Accounts payable, other and accrued expenses | 1,756,833 | (1,756,833 | ) | — | — | k | ||||||||||||||
| Deposits from customers in the banking business | 2,773,885 | (91,729 | ) | — | 2,682,156 | l | Deposits from customers in the banking business | |||||||||||||
| Accrued income and other taxes | 165,406 | (82,594 | ) | 1,619 | 84,431 | Income taxes payables | ||||||||||||||
| — | 164,005 | (2,572 | ) | 161,433 | k | Participation and residual liabilities in the Pictures segment | ||||||||||||||
| — | 54,341 | — | 54,341 | k,m,o | Other financial liabilities | |||||||||||||||
| Other | 1,126,802 | 234,441 | 6,284 | 1,367,527 | k,m,p | Other current liabilities | ||||||||||||||
| Total current liabilities | 7,815,424 | (430,887 | ) | (30,933 | ) | 7,353,604 | Total current liabilities | |||||||||||||
Non-current liabilities: | ||||||||||||||||||||
| Long-term debt | 773,294 | 281,086 | (744 | ) | 1,053,636 | i | Long-term debt | |||||||||||||
| Long-term operating lease liabilities | 290,259 | (290,259 | ) | — | — | i | ||||||||||||||
| Accrued pension and severance costs | 254,103 | 12,364 | 755 | 267,222 | B | Defined benefit liabilities | ||||||||||||||
| Deferred income taxes | 366,761 | (2,649 | ) | 452,475 | 816,587 | F | Deferred tax liabilities | |||||||||||||
| Future insurance policy benefits and other | 6,599,977 | — | 14,608 | 6,614,585 | E | Future insurance policy benefits and other | ||||||||||||||
| Policyholders’ account in the life insurance business | 4,331,065 | — | (2,171 | ) | 4,328,894 | E | Policyholders’ account in the life insurance business | |||||||||||||
| — | 120,712 | (4,175 | ) | 116,537 | n | Participation and residual liabilities in the Pictures segment | ||||||||||||||
| — | 139,417 | — | 139,417 | l,n,o | Other financial liabilities | |||||||||||||||
| Other | 294,302 | (201,551 | ) | 271 | 93,022 | n | Other non-current liabilities | |||||||||||||
| 12,909,761 | 59,120 | 461,019 | 13,429,900 | Total non-current liabilities | ||||||||||||||||
Total liabilities | 20,725,185 | (371,767 | ) | 430,086 | 20,783,504 | Total liabilities | ||||||||||||||
Redeemable noncontrolling interest | 8,179 | (8,179 | ) | — | — | o | ||||||||||||||
EQUITY | EQUITY | |||||||||||||||||||
Sony Group Corporation’s stockholders’ equity: | Sony Group Corporation’s stockholders’ equity: | |||||||||||||||||||
| Common stock | 880,214 | — | — | 880,214 | Common stock | |||||||||||||||
| Additional paid-in capital | 1,486,721 | — | 2,876 | 1,489,597 | Additional paid-in capital | |||||||||||||||
| Retained earnings | 3,857,152 | — | (942,649 | ) | 2,914,503 | G | Retained earnings | |||||||||||||
| Accumulated other comprehensive income | (524,020 | ) | — | 2,044,277 | 1,520,257 | A,B,C D,E,F | Accumulated other comprehensive income | |||||||||||||
| Treasury stock, at cost | (124,228 | ) | — | — | (124,228 | ) | Treasury stock, at cost | |||||||||||||
| 5,575,839 | — | 1,104,504 | 6,680,343 | Equity attributable to Sony Group Corporation’s stockholders | ||||||||||||||||
| Noncontrolling interests | 45,637 | (399 | ) | (1,242 | ) | 43,996 | Noncontrolling interests | |||||||||||||
Total equity | 5,621,476 | (399 | ) | 1,103,262 | 6,724,339 | Total equity | ||||||||||||||
Total liabilities and equity | 26,354,840 | (380,345 | ) | 1,533,348 | 27,507,843 | Total liabilities and equity | ||||||||||||||
F-11
6
SONY GROUP CORPORATION AND CONSOLIDATED SUBSIDIARIES
Reconciliation of profit or loss for the fiscal year ended March 31, 2021
Accounts under U.S. GAAP | Yen in millions | Accounts under IFRS | ||||||||||||||||||
U.S. GAAP | Reclassification | Recognition and measurement differences | IFRS | Note | ||||||||||||||||
Sales and operating revenue: | Sales and financial services revenue: | |||||||||||||||||||
| Net sales | 7,252,766 | 79,293 | 1,611 | 7,333,670 | q | Sales | ||||||||||||||
| Financial services revenue | 1,661,520 | 13,512 | (10,041 | ) | 1,664,991 | r,D | Financial services revenue | |||||||||||||
| Other operating revenue | 85,074 | (85,074 | ) | — | — | q | ||||||||||||||
| 8,999,360 | 7,731 | (8,430 | ) | 8,998,661 | Total sales and financial services revenue | |||||||||||||||
Costs and expenses: | Costs and expenses: | |||||||||||||||||||
| Cost of sales | 5,072,596 | (3,850 | ) | (2,867 | ) | 5,065,879 | B | Cost of sales | ||||||||||||
| Selling, general and administrative | 1,469,955 | 61 | 3,138 | 1,473,154 | B | Selling, general and administrative | ||||||||||||||
| Financial services expenses | 1,488,963 | 12,503 | 208 | 1,501,674 | r,D | Financial services expenses | ||||||||||||||
| Other operating expense, net | 7,468 | (720 | ) | 7,502 | 14,250 | C | Other operating (income) expense, net | |||||||||||||
| 8,038,982 | 7,994 | 7,981 | 8,054,957 | Total costs and expenses | ||||||||||||||||
Equity in net income of affiliated companies | 11,487 | — | 64 | 11,551 | D | Share of profit (loss) of investments accounted for using the equity method | ||||||||||||||
Operating income | 971,865 | (263 | ) | (16,347 | ) | 955,255 | Operating income | |||||||||||||
Other income: | ||||||||||||||||||||
| Interest and dividends | 10,457 | (10,457 | ) | — | — | |||||||||||||||
| Gain on equity securities, net | 247,026 | (247,026 | ) | — | — | |||||||||||||||
| Other | 6,752 | (6,752 | ) | — | — | |||||||||||||||
| — | 264,692 | (180,900 | ) | 83,792 | s,D | Financial income | ||||||||||||||
Other expenses: | ||||||||||||||||||||
| Interest expenses | 12,185 | (12,185 | ) | — | — | |||||||||||||||
| Foreign exchange loss, net | 16,056 | (16,056 | ) | — | — | |||||||||||||||
| Net periodic benefit costs other than service cost | 8,811 | (8,811 | ) | — | — | |||||||||||||||
| Other | 6,678 | (6,678 | ) | — | — | |||||||||||||||
| — | 43,924 | (2,842 | ) | 41,082 | s,B | Financial expenses | ||||||||||||||
Income before income taxes | 1,192,370 | — | (194,405 | ) | 997,965 | H | Income before income taxes | |||||||||||||
Income taxes | 995 | — | (46,926 | ) | (45,931 | ) | I | Income taxes | ||||||||||||
Net income | 1,191,375 | — | (147,479 | ) | 1,043,896 | Net income | ||||||||||||||
Net income attributable to | ||||||||||||||||||||
| Net income attributable to Sony Group Corporation’s stockholders | 1,171,776 | — | (142,166 | ) | 1,029,610 | Sony Group Corporation’s stockholders | ||||||||||||||
| Net income attributable to noncontrolling interests | 19,599 | — | (5,313 | ) | 14,286 | Noncontrolling interests | ||||||||||||||
F-11
7
SONY GROUP CORPORATION AND CONSOLIDATED SUBSIDIARIES
Reconciliation of comprehensive income for the fiscal year ended March
31, 2021
Accounts under U.S. GAAP | Yen in millions | Accounts under IFRS | ||||||||||||||||||
U.S. GAAP | Reclassification | Recognition and measurement differences | IFRS | Note | ||||||||||||||||
Net income | 1,191,375 | — | (147,479 | ) | 1,043,896 | Net income | ||||||||||||||
Other comprehensive income, net of tax — | Other comprehensive income, net of tax — | |||||||||||||||||||
Items that will not be reclassified to profit or loss | ||||||||||||||||||||
| — | — | 144,740 | 144,740 | D | Changes in equity instruments measured at fair value through other comprehensive income | |||||||||||||||
| Pension liability adjustment | 12,965 | — | (1,410 | ) | 11,555 | Remeasurement of defined benefit pension plans | ||||||||||||||
| — | — | 87 | 87 | Share of other comprehensive income of investments accounted for using the equity method | ||||||||||||||||
Items that may be reclassified subsequently to profit or loss | ||||||||||||||||||||
| Unrealized losses on securities | (102,492 | ) | — | (103,057 | ) | (205,549 | ) | D,E,F | Changes in debt instruments measured at fair value through other comprehensive income | |||||||||||
| Unrealized gains on derivative instruments | 1,513 | — | (1,462 | ) | 51 | Cash flow hedges | ||||||||||||||
| Debt valuation adjustments | (3,120 | ) | — | — | (3,120 | ) | Insurance contract valuation adjustments | |||||||||||||
| Foreign currency translation adjustments | 106,826 | (798 | ) | 9,293 | 115,321 | Exchange differences on translating foreign operations | ||||||||||||||
| — | 798 | — | 798 | Share of other comprehensive income of investments accounted for using the equity method | ||||||||||||||||
| 15,692 | — | 48,191 | 63,883 | Total other comprehensive income, net of tax | ||||||||||||||||
Total comprehensive income | 1,207,067 | — | (99,288 | ) | 1,107,779 | Comprehensive income | ||||||||||||||
Comprehensive income attributable to | ||||||||||||||||||||
| Comprehensive income attributable to Sony Group Corporation’s stockholders | 1,198,836 | — | (80,208 | ) | 1,118,628 | Sony Group Corporation’s stockholders | ||||||||||||||
| Comprehensive income attributable to noncontrolling interests | 8,231 | — | (19,080 | ) | (10,849 | ) | Noncontrolling interests | |||||||||||||
(4) | Notes to reconciliation |
Reclassifications
| a. | “Marketable securities,” which were separately presented under U.S. GAAP, have been reclassified into “Investments and advances in the Financial Services segment” as current assets under IFRS. Investments held for variable annuities and variable life insurance contracts in the life insurance business, which were included |
F-11
8
SONY GROUP CORPORATION AND CONSOLIDATED SUBSIDIARIES
in “Marketable securities” under U.S. GAAP, have been reclassified into “Investments and advances in the Financial Services segment” as current assets or non-current assets under IFRS, after considering thecurrent/non-current distinction based on the purpose of the investments related to the insurance liabilities in accordance with paragraph 66 of IAS 1 “Presentation of Financial Statements” (“IAS 1”). |
| b. | “Notes and accounts receivable, trade and contract assets” and “Allowance for credit losses,” which were separately presented under U.S. GAAP, have been reclassified into “Trade and other receivables, and contract assets” under IFRS. |
| c. | “Other receivables,” which were separately presented under U.S. GAAP, have been reclassified into “Trade and other receivables, and contract assets” under IFRS. |
| d. | “Other financial assets,” which were included in “Prepaid expenses and other current assets” under U.S. GAAP, are separately presented under IFRS. |
| e. | “Film costs,” which were presented separately, and music catalogs, artist contracts, music distribution rights and other content assets, which were included in “Intangibles, net” under U.S. GAAP are collectively reclassified and presented as “Content assets” under IFRS. “Intangibles, net” other than those reclassified and presented as “Content assets” have been reclassified into “Other intangible assets” under IFRS. |
| f. | “Securities investments and other,” which were separately presented under U.S. GAAP, have been reclassified into “Investments and advances in the Financial Services segment” as non-current assets for the amounts related to the Financial Services segment and “Other financial assets” asnon-current assets for the amounts related to all segments excluding the Financial Services segment under IFRS. Housing loans in the banking business, which were included in “Securities investments and other” under U.S. GAAP, have been reclassified into “Investments and advances in the Financial Services segment” as current assets ornon-current assets under IFRS after considering thecurrent/non-current distinction based on the terms of the contract in accordance with paragraph 66 of IAS 1. |
| g. | “Operating lease right-of-use right-of-use “Right-of-use |
| h. | “Other financial assets,” which were included in “Other” in other assets under U.S. GAAP, are separately presented under IFRS. |
| i. | “Current portion of long-term operating lease liabilities” and “Long-term operating lease liabilities,” which were separately presented under U.S. GAAP, have been reclassified into “Current portion of long-term debt” and “Long-term debt,” respectively under IFRS. |
| j. | “Notes and accounts payable, trade,” which were separately presented under U.S. GAAP, have been reclassified into “Trade and other payables” under IFRS. |
| k. | “Accounts payable, other and accrued expenses,” which were separately presented under U.S. GAAP, have been reclassified into either “Trade and other payables,” “Participation and residual liabilities in the Pictures segment,” “Other financial liabilities” or “Other current liabilities” under IFRS. |
| l. | “Deposits from customers in the banking business,” which were separately presented under U.S. GAAP, have been reclassified into “Other financial liabilities” of non-current liabilities under IFRS, after considering thecurrent/non-current distinction based on the terms of the contract in accordance with paragraph 69 of IAS 1. |
| m. | “Trade and other payables” and “Other financial liabilities,” which were included in current liabilities “Other” under U.S. GAAP, are separately presented under IFRS. |
| n. | “Participation and residual liabilities in the Pictures segment” and “Other financial liabilities,” which were included in “Other” in other than current liabilities under U.S. GAAP, are separately presented under IFRS. |
| o. | “Redeemable noncontrolling interest,” which was separately presented under U.S. GAAP, has been reclassified into “Other financial liabilities” under IFRS. |
| p. | Under U.S. GAAP, securities received as collateral other than cash in lending transactions are accounted for as “Marketable securities” and also as “Other current liabilities” representing Sony’s obligation to return the collateral, which was 373,274 million yen as of March 31, 2021. Under IFRS, the securities received as collateral other than cash shall be recognized in the consolidated statements of financial position if they are sold or the transferor defaults. None of the securities was recognized in the consolidated statements of financial position as of March 31, 2021. |
F-11
9
SONY GROUP CORPORATION AND CONSOLIDATED SUBSIDIARIES
| q. | “Other operating revenue,” which was separately presented under U.S. GAAP, has been reclassified into “Sales” under IFRS. |
| r. | Under IFRS, “Financial services revenue” and “Financial services expenses” have increased by the same amount due to the gross up of revenue and expenses related to service transactions, based on the presentation requirements. |
| s. | Under IFRS, “Financial income” and “Financial expenses” have been presented separately, based on the presentation requirements. |
Recognition and measurement differences
A. Exchange differences on translating foreign operations
Under IFRS 1, first-time adopters may choose to deem the cumulative exchange differences on translating foreign operations as zero at the date of transition to IFRS. Sony has chosen to apply this exemption and transferred all cumulative exchange differences on translating foreign operations into retained earnings at the date of transition to IFRS.
The impact of this change is as follows:
Yen in millions | ||||||||
April 1, 2020 | March 31, 2021 | |||||||
(Consolidated Statements of Financial Position) | ||||||||
Accumulated other comprehensive income | (509,872 | ) | (510,091 | ) | ||||
Adjustment to retained earnings | (509,872 | ) | (510,091 | ) | ||||
B. Post-employment benefits
Under U.S. GAAP, past service costs and actuarial gains and losses are deferred in accumulated other comprehensive income, and subsequently reclassified to profit or loss over a certain period of time in the future.
Under IFRS, past service costs are expensed as incurred. Adjustments due to remeasurements of the net defined benefit liabilities or assets, such as actuarial gains and losses, are recognized in other comprehensive income when incurred and immediately transferred to retained earnings and are not reclassified to profit or loss in a subsequent period.
In addition, if the fair value of plan assets is in excess of the present value of defined benefit obligations, the amount of any asset to be recognized is limited to the present value of any economic benefits available in the form of refunds from the plan or reductions in the future contributions to the plan.
The impact of this change before considering the tax effect is as follows:
Yen in millions | ||||||||
April 1, 2020 | March 31, 2021 | |||||||
(Consolidated Statements of Financial Position) | ||||||||
Other non-current assets | (16,829 | ) | (17,083 | ) | ||||
Defined benefit liabilities | 30 | (62 | ) | |||||
Accumulated other comprehensive income | (300,385 | ) | (277,379 | ) | ||||
Adjustment to retained earnings | (317,184 | ) | (294,524 | ) | ||||
Yen in millions | ||||||||
Fiscal year ended March 31, 2021 | ||||||||
(Consolidated Statements of Income) | ||||||||
Cost of sales | (2,193 | ) | ||||||
Selling, general and administrative | (244 | ) | ||||||
Financial expenses | 9,476 | |||||||
Increase (decrease) in adjustment to income before income taxes | 7,039 | |||||||
F-1
20
SONY GROUP CORPORATION AND CONSOLIDATED SUBSIDIARIES
C. Impairment of goodwill
The level at which goodwill is tested for impairment differs between U.S. GAAP and IFRS. Under U.S. GAAP, goodwill is tested for impairment at the reporting unit level. Reporting units are Sony’s operating segments or one level below the operating segments. The identification of reporting units is dependent on the level at which discrete financial information is available and regularly reviewed by the segment manager. Under IFRS, goodwill is tested for impairment at the level of the CGU or group of CGUs, which represent the lowest level at which goodwill is monitored for internal management purposes, which may be a lower level of grouping than a reporting unit under U.S. GAAP. A CGU is the smallest identifiable group of assets that generates cash inflows that are largely independent of the cash inflows from other assets or group of assets.
Upon the transition to IFRS, Sony assessed its reporting units to determine if such reporting units should be further divided into several CGUs under IFRS. As a result, Sony determined that certain CGUs should be grouped at a lower level than a reporting unit under U.S. GAAP. In addition, Sony performed an impairment test for goodwill at the date of transition to IFRS regardless of whether there were any indications that the goodwill may be impaired based on conditions at the date of transition to IFRS. In performing the impairment test, Sony used the goodwill balance under U.S. GAAP attributed to each CGU or group of CGUs based on the history of acquisitions of the businesses. Under U.S. GAAP, when a business within a reporting unit was disposed of (including when classified as held for sale), goodwill was allocated to the remaining business and the disposed business based on relative fair value, and only the goodwill allocated to the disposed business was written off. Under IFRS, since certain disposed businesses represented individual CGUs or a group of CGUs, at the time of disposition, all the goodwill that was recognized for such businesses would have been written off. The assessment resulted in impairments related to CGUs or groups of CGUs of businesses that Sony disposed of prior to the date of transition to IFRS. In addition, the assessment resulted in impairments related to CGUs or groups of CGUs of businesses that existed at the date of transition to IFRS where the recoverable amount was lower than the carrying amount.
As a result, at the date of transition to IFRS, goodwill decreased by 96,817 million yen, and retained earnings decreased by the same amount. The impact of this change was primarily in the I&SS and Pictures segments and is discussed below.
In the I&SS segment, at the date of transition to IFRS, Sony recognized 43,376 million yen of impairment losses in retained earnings, which includes the impairment loss related to the goodwill allocated to CGUs or groups of CGUs of businesses that Sony disposed of prior to the date of transition to IFRS as well as the Internet of Things (“IoT”)-related business, which existed at the date of transition to IFRS. The recoverable amount of the
IoT-related
business was determined by the value in use and apre-tax
discount rate of 9.8% was used in the measurement.In the Pictures segment, at the date of transition to IFRS, Sony recognized 48,749 million yen of impairment losses in retained earnings, which includes the impairment loss related to the goodwill allocated to CGUs or groups of CGUs of businesses that Sony disposed of prior to the date of transition to IFRS as well as the United States television network CGU, which existed at the date of transition to IFRS. The recoverable amount of the United States television network CGU was determined by the value in use and a
pre-tax
discount rate of 15.9% was used in the measurement.The impact of this change is as follows:
Yen in millions | ||||||||
April 1, 2020 | March 31, 2021 | |||||||
(Consolidated Statements of Financial Position) | ||||||||
Goodwill | (96,817 | ) | (100,727 | ) | ||||
Accumulated other comprehensive income | — | 2,942 | ||||||
Adjustment to retained earnings | (96,817 | ) | (97,785 | ) | ||||
Yen in millions | ||||||||
Fiscal year ended March 31, 2021 | ||||||||
(Consolidated Statements of Income) | ||||||||
Other operating (income) expense, net | (968 | ) | ||||||
Increase (decrease) in adjustment to income before income taxes | (968 | ) | ||||||
F-1
21
SONY GROUP CORPORATION AND CONSOLIDATED SUBSIDIARIES
D. Equity instruments and debt instruments
Under U.S. GAAP, equity securities are recognized at fair value and subsequent changes in fair value are recognized in profit or loss. Equity securities that do not have readily determinable fair values are measured at cost minus impairment, if any, plus or minus changes resulting from observable price changes in orderly transactions for the identical or a similar investment of the same issuer.
Additionally, under U.S. GAAP, debt securities that areprimarily in the life insurance business, are carried at amortized cost.
held-to-maturity,
Under IFRS, equity instruments are recognized at fair value and subsequent changes in fair value are recognized in profit or loss. However, for investments in equity instruments which are not held for trading, Sony may make an irrevocable election at initial recognition to present subsequent changes in fair value of the investments in other comprehensive income. Such financial assets are measured at fair value and subsequent changes in the fair value are recognized in other comprehensive income.
Additionally, under IFRS, debt instruments, which are primarily in the life insurance business, are classified as financial assets measured at fair value through other comprehensive income if the debt instruments are held within a business model whose objective is achieved by both collecting contractual cash flows and selling the financial assets and the contractual terms of the financial assets give rise on specified dates to cash flows that are solely payments of principal and interest on the principal amount outstanding. Changes in the fair value of the financial assets after initial recognition, except for impairment gains or losses and foreign exchange gains or losses, are recognized in other comprehensive income.
The impact of this change before considering the tax effect is as follows:
Yen in millions | ||||||||
April 1, 2020 | March 31, 2021 | |||||||
(Consolidated Statements of Financial Position) | ||||||||
Other financial assets (non-current) | 22,110 | 31,627 | ||||||
Investments and advances in the Financial Services segment (non-current) | 2,439,946 | 1,649,660 | ||||||
Accumulated other comprehensive income | (2,424,510 | ) | (1,840,980 | ) | ||||
Adjustment to retained earnings | 37,546 | (159,693 | ) | |||||
Yen in millions | ||||||||
Fiscal year ended March 31, 2021 | ||||||||
(Consolidated Statements of Income) | ||||||||
Financial services revenue | (12,547 | ) | ||||||
Financial services expenses | (854 | ) | ||||||
Share of profit (loss) of investments accounted for using the equity method | (30 | ) | ||||||
Financial income | (178,677 | ) | ||||||
Increase (decrease) in adjustment to income before income taxes | (192,108 | ) | ||||||
E. Insurance-related accounts
In accordance with Sony’s first-time adoption of IFRS 4 at the date of transition to IFRS, insurance contracts are recognized and measured based on the same accounting principles previously applied under U.S. GAAP. Under IFRS, the amount of insurance-related accounts was affected by shadow accounting in the life insurance business as a result of the increase in financial instruments to be measured at fair value through other comprehensive income. This change is mainly because the shadow liability adequacy test indicated that the insurance liabilities were not recorded at a sufficient level at the date of transition to IFRS.
F-12
2
SONY GROUP CORPORATION AND CONSOLIDATED SUBSIDIARIES
The impact of this change before considering the tax effect is as follows:
Yen in millions | ||||||||
April 1, 2020 | March 31, 2021 | |||||||
(Consolidated Statements of Financial Position) | ||||||||
Deferred insurance acquisition costs | (412,997 | ) | (33,434 | ) | ||||
Future insurance policy benefits and other | (273,530 | ) | (14,609 | ) | ||||
Policyholders’ account in the life insurance business | 2,261 | 2,170 | ||||||
Accumulated other comprehensive income | 684,266 | 45,873 | ||||||
F. Impact of changes in the measurement method of debt instruments in the life insurance business on deferred tax liabilities and noncontrolling interests
In connection with “D. Equity instruments and debt instruments” and “E. Insurance-related accounts,” accumulated other comprehensive income is affected due to the change in the measurement method of debt instruments in the life insurance business and the change in the amount of insurance-related accounts as a result of the application of shadow accounting.
The impact of this change on deferred tax liabilities and noncontrolling interests is as follows:
Yen in millions | ||||||||
April 1, 2020 | March 31, 2021 | |||||||
(Consolidated Statements of Financial Position) | ||||||||
Deferred tax liabilities | (489,839 | ) | (452,189 | ) | ||||
Noncontrolling interests | (440,099 | ) | — | |||||
Accumulated other comprehensive income | 929,938 | 452,189 | ||||||
G. Retained earnings
The main items causing the differences in retained earnings are as follows:
Yen in millions | ||||||||
April 1, 2020 | March 31, 2021 | |||||||
Retained earnings under U.S. GAAP | 2,765,187 | 3,857,152 | ||||||
1 Exchange differences on translating foreign operations *A | (509,872 | ) | (510,091 | ) | ||||
2 Post-employment benefits *B | (317,184 | ) | (294,524 | ) | ||||
3 Impairment of goodwill *C | (96,817 | ) | (97,785 | ) | ||||
4 Equity instruments and debt instruments *D | 37,546 | (159,693 | ) | |||||
5 Other | 6,616 | 13,249 | ||||||
Tax effect of adjustments | 64,221 | 106,195 | ||||||
Total | (815,490 | ) | (942,649 | ) | ||||
Retained earnings under IFRS | 1,949,697 | 2,914,503 | ||||||
H. Income before income taxes
The main items causing the differences in income before income taxes are as follows:
Yen in millions | ||||||
Fiscal year ended March 31, 2021 | ||||||
Income before income taxes under U.S. GAAP | 1,192,370 | |||||
1 Post-employment benefits *B | 7,039 | |||||
2 Impairment of goodwill *C | (968 | ) | ||||
3 Equity instruments and debt instruments *D | (192,108 | ) | ||||
4 Other | (8,368 | ) | ||||
Total | (194,405 | ) | ||||
Income before income taxes under IFRS | 997,965 | |||||
F-12
3
SONY GROUP CORPORATION AND CONSOLIDATED SUBSIDIARIES
I. Income taxes
Due to the adoption of IFRS, income taxes have been adjusted by recording the tax effects on various IFRS adjustments recognized and measured, and other IFRS tax effects.
(5) Reconciliation of consolidated statements of cash flows
The main items causing the differences in the consolidated statements of cash flows are as follows:
Yen in millions | ||||||||||||
Fiscal year ended March 31, 2021 | ||||||||||||
Cash flows from operating activities | Cash flows from investing activities | Cash flows from financing activities | ||||||||||
Consolidated statements of cash flows under U.S. GAAP | 1,350,150 | (1,781,516 | ) | 666,967 | ||||||||
1. Principal payments for operating lease liabilities *1 | 72,098 | — | (72,098 | ) | ||||||||
2. Additions and disposals of content assets *2 | (34,751 | ) | 34,751 | — | ||||||||
3. Changes in assets and liabilities in the Financial Services segment *3 | ||||||||||||
(1) Investments and advances in the Financial Services segment | (1,181,744 | ) | 1,181,744 | — | ||||||||
(2) Deposits from customers in the banking business | 332,987 | — | (332,987 | ) | ||||||||
(3) Borrowings in the life insurance business and the banking business | 463,783 | — | (463,783 | ) | ||||||||
(4) Future insurance policy benefits and other and policyholders’ account in the life insurance business | 134,299 | — | (134,299 | ) | ||||||||
4. Other | 3,395 | 1,111 | (2,333 | ) | ||||||||
Total | (209,933 | ) | 1,217,606 | (1,005,500 | ) | |||||||
Consolidated statements of cash flows under IFRS | 1,140,217 | (563,910 | ) | (338,533 | ) | |||||||
| *1 | P rincipal payments for operating lease liabilities |
Under U.S. GAAP, lessees classify leases as either operating leases or finance leases, and the principal payments for the operating lease liabilities are classified as cash flows from operating activities in the consolidated statements of cash flows. Under IFRS, the distinction between operating leases and finance leases no longer exists for lessees, and all of the principal payments for lease liabilities are classified as cash flows from financing activities in the consolidated statements of cash flows.
| *2 | Additions and disposals of content assets |
Under U.S. GAAP, Sony classified the cash flows from the additions and disposals of film costs as cash flows from operating activities, and classified the cash flows from the additions and disposals of music catalogs, artist contracts, music distribution rights and other content assets as cash flows from investing activities in the consolidated statements of cash flows based on the nature of such transactions as additions and disposals of intangible assets. Under IFRS, Sony defines these intangible assets as content assets, and classifies the cash flows from the additions and disposals of content assets as cash flows from operating activities in the consolidated statements of cash flows except for additions and disposals of content assets from business combinations or business divestitures, because the additions and disposals of content assets are derived from the principal revenue-producing activities of Sony.
| *3 | Changes in assets and liabilities in the Financial Services segment |
Under U.S. GAAP, Sony classified cash flows from changes in investments and advances in the Financial Services segment and repurchase agreements in the Financial Services segment, deposits from customers in the banking business and policyholders’ account in the life insurance business according to the nature of these transactions in the consolidated statements of cash flows. Under IFRS, Sony classifies cash flows from these transactions as cash flows from operating activities in the consolidated statements of cash flows as these transactions are viewed as integral to the principal revenue-producing activities of Sony.
F-12
4
SONY GROUP CORPORATION AND CONSOLIDATED SUBSIDIARIES
35. | Subsequent event |
Setting of parameters for repurchase of shares of its own common stock
Sony Group Corporation approved the setting of the following parameters for repurchase of its own common stock pursuant to the Companies Act of Japan and Sony Group Corporation’s Articles of Incorporation at the meeting of its Board of Directors held on May 10, 2022:
1. Total number of shares for repurchase: 25 million shares (maximum)
2. Total purchase price for repurchase of shares: 200 billion yen (maximum)
3. Period of repurchase: May 11, 2022 to May 10, 2023
F-12
5