
The statement of operations and supplemental statement of operations provided in this supplemental information package present funds from operations (FFO), adjusted funds from operations (AFFO), net operating income (NOI), EBITDAre and Adjusted EBITDA, which are REIT industry financial measures that are not calculated in accordance with accounting principles generally accepted in the United States. Please see page 23 for a definition of these supplemental performance measures. Please see the supplemental statement of operations reconciliation for a reconciliation of certain captions in the supplemental statement of operations reported in this supplemental information package to the statement of operations as reported in the Company’s filings with the SEC on Form 10-Q.
(in thousands except for per share amounts)
| As of | As of | |||||||
| June 30, 2019 | September 30, 2018 | |||||||
| (unaudited) | ||||||||
| ASSETS | ||||||||
| Real Estate Investments: | ||||||||
| Land | $ | 236,497 | $ | 224,719 | ||||
| Buildings and Improvements | 1,603,423 | 1,494,859 | ||||||
| Total Real Estate Investments | 1,839,920 | 1,719,578 | ||||||
| Accumulated Depreciation | (238,757 | ) | (207,065 | ) | ||||
| Real Estate Investments | 1,601,163 | 1,512,513 | ||||||
| Cash and Cash Equivalents | 13,631 | 9,324 | ||||||
| Securities Available for Sale at Fair Value | 171,040 | 154,921 | ||||||
| Tenant and Other Receivables | 662 | 1,249 | ||||||
| Deferred Rent Receivable | 10,762 | 9,656 | ||||||
| Prepaid Expenses | 7,375 | 6,190 | ||||||
| Intangible Assets, net of Accumulated Amortization of $15,195 and $13,700, respectively | 14,981 | 14,590 | ||||||
| Capitalized Lease Costs, net of Accumulated Amortization of $3,254 and $3,271, respectively | 5,682 | 5,232 | ||||||
| Financing Costs, net of Accumulated Amortization of $1,277 and $995, respectively | 219 | 500 | ||||||
| Other Assets | 9,668 | 4,203 | ||||||
| TOTAL ASSETS | $ | 1,835,183 | $ | 1,718,378 | ||||
| LIABILITIES AND SHAREHOLDERS’ EQUITY | ||||||||
| Liabilities: | ||||||||
| Fixed Rate Mortgage Notes Payable, net of Unamortized DebtIssuance Costs | $ | 734,095 | $ | 711,546 | ||||
| Loans Payable | 126,187 | 186,609 | ||||||
| Accounts Payable and Accrued Expenses | 3,775 | 5,891 | ||||||
| Other Liabilities | 17,354 | 16,426 | ||||||
| Total Liabilities | 881,411 | 920,472 | ||||||
| COMMITMENTS AND CONTINGENCIES | ||||||||
| Shareholders’ Equity: | ||||||||
| 6.125% Series C Cumulative Redeemable Preferred Stock, $0.01 Par Value Per Share: 16,400 Shares Authorized as of June 30, 2019 and September 30, 2018; 12,506 and 11,488 Shares Issued and Outstanding as of June 30, 2019 and September 30, 2018, respectively | 312,660 | 287,200 | ||||||
| Common Stock, $0.01 Par Value Per Share: 188,040 Shares Authorized as of June 30, 2019 and September 30, 2018; 95,155 and 81,503 Shares Issued and Outstanding as of June 30, 2019 and September 30, 2018, respectively | 952 | 815 | ||||||
| Excess Stock, $0.01 Par Value Per Share: 200,000 Shares Authorized as of June 30, 2019 and September 30, 2018; No Shares Issued or Outstanding as of June 30, 2019 and September 30, 2018 | -0- | -0- | ||||||
| Additional Paid-In Capital | 640,160 | 534,635 | ||||||
| Accumulated Other Comprehensive Loss | -0- | (24,744 | ) | |||||
| Undistributed Income | -0- | -0- | ||||||
| Total Shareholders’ Equity | 953,772 | 797,906 | ||||||
| TOTAL LIABILITIES & SHAREHOLDERS’ EQUITY | $ | 1,835,183 | $ | 1,718,378 | ||||
 | THIRD QUARTER FISCAL YEAR 2019 SUPPLEMENTAL INFORMATION | 3 |
Consolidated Statements of Income (Loss)
(unaudited) (in thousands)
For The Three Months Ended | For The Nine Months Ended | |||||||||||||||
| 6/30/2019 | 6/30/2018 | 6/30/2019 | 6/30/2018 | |||||||||||||
| INCOME: | ||||||||||||||||
| Rental Revenue | $ | 33,127 | $ | 29,256 | $ | 98,678 | $ | 85,559 | ||||||||
| Reimbursement Revenue | 6,345 | 5,480 | 19,247 | 17,002 | ||||||||||||
| Lease Termination Income | -0- | -0- | -0- | 210 | ||||||||||||
| TOTAL INCOME | 39,472 | 34,736 | 117,925 | 102,771 | ||||||||||||
| EXPENSES: | ||||||||||||||||
| Real Estate Taxes | 5,092 | 4,488 | 15,144 | 13,593 | ||||||||||||
| Operating Expenses | 1,649 | 1,459 | 5,186 | 4,371 | ||||||||||||
| General & Administrative Expenses | 2,351 | 1,888 | 6,420 | 6,053 | ||||||||||||
| Depreciation | 10,833 | 9,162 | 32,067 | 26,504 | ||||||||||||
| Amortization of Capitalized Lease Costs and Intangible Assets | 721 | 614 | 2,144 | 1,741 | ||||||||||||
| TOTAL EXPENSES | 20,646 | 17,611 | 60,961 | 52,262 | ||||||||||||
| OTHER INCOME (EXPENSE): | ||||||||||||||||
| Dividend Income | 3,686 | 3,628 | 11,569 | 9,380 | ||||||||||||
| Gain on Sale of Securities Transactions | -0- | -0- | -0- | 111 | ||||||||||||
| Unrealized Holding Gains (Losses) Arising During the Periods | (11,609 | ) | -0- | (38,668 | ) | -0- | ||||||||||
| Interest Expense, including Amortization of Financing Costs | (9,275 | ) | (8,279 | ) | (27,879 | ) | (23,640 | ) | ||||||||
| TOTAL OTHER INCOME (EXPENSE) | (17,198 | ) | (4,651 | ) | (54,978 | ) | (14,149 | ) | ||||||||
| INCOME FROM OPERATIONS | 1,628 | 12,474 | 1,986 | 36,360 | ||||||||||||
| Gain on Sale of Real Estate Investments | -0- | 2,097 | -0- | 7,486 | ||||||||||||
| NET INCOME | 1,628 | 14,571 | 1,986 | 43,846 | ||||||||||||
| Less: Preferred Dividends | 4,749 | 4,248 | 13,650 | 12,813 | ||||||||||||
| NET INCOME (LOSS) ATTRIBUTABLE TO COMMON SHAREHOLDERS | $ | (3,121 | ) | $ | 10,323 | $ | (11,664 | ) | $ | 31,033 | ||||||
| | THIRD QUARTER FISCAL YEAR 2019 SUPPLEMENTAL INFORMATION | 4 |
FFO, AFFO, EBITDAreand Adjusted EBITDA Reconciliations
(unaudited) (in thousands)
| For The Three Months Ended | For The Nine Months Ended | |||||||||||||||
| FFO, AFFO | 6/30/2019 | 6/30/2018 | 6/30/2019 | 6/30/2018 | ||||||||||||
| Net Income (Loss) Attributable to Common Shareholders(1) | $ | (3,121 | ) | $ | 10,323 | $ | (11,664 | ) | $ | 31,033 | ||||||
| Plus: Unrealized Holding Losses Arising During the Periods(2) | 11,609 | -0- | 38,668 | -0- | ||||||||||||
| Plus: Depreciation Expense (excluding Corporate Office Capitalized Costs) | 10,665 | 9,123 | 31,692 | 26,386 | ||||||||||||
| Plus: Amortization of Intangible Assets | 490 | 417 | 1,495 | 1,158 | ||||||||||||
| Plus: Amortization of Capitalized Lease Costs | 256 | 222 | 726 | 660 | ||||||||||||
| Less: Gain on Sale of Real Estate Investments | -0- | (2,097 | ) | -0- | (7,486 | ) | ||||||||||
| FFO Attributable to Common Shareholders(3) | 19,899 | 17,988 | 60,917 | 51,751 | ||||||||||||
| Plus: Depreciation of Corporate Office Capitalized Costs | 168 | 39 | 376 | 118 | ||||||||||||
| Plus: Stock Compensation Expense | 231 | 97 | 574 | 339 | ||||||||||||
| Plus: Amortization of Financing Costs | 319 | 315 | 956 | 911 | ||||||||||||
| Less: Gain on Sale of Securities Transactions | -0- | -0- | -0- | (111 | ) | |||||||||||
| Less: Lease Termination Income | -0- | -0- | -0- | (210 | ) | |||||||||||
| Less: Recurring Capital Expenditures | (702 | ) | (490 | ) | (1,888 | ) | (774 | ) | ||||||||
| Less: Effect of Non-cash U.S. GAAP Straight-line Rent Adjustment | (527 | ) | (601 | ) | (1,352 | ) | (1,357 | ) | ||||||||
| AFFO Attributable to Common Shareholders | $ | 19,388 | $ | 17,348 | $ | 59,583 | $ | 50,667 | ||||||||
| For The Three Months Ended | For The Nine Months Ended | |||||||||||||||
| EBITDAre, Adjusted EBITDA | 6/30/2019 | 6/30/2018 | 6/30/2019 | 6/30/2018 | ||||||||||||
| Net Income (Loss) Attributable to Common Shareholders(1) | $ | (3,121 | ) | $ | 10,323 | $ | (11,664 | ) | $ | 31,033 | ||||||
| Plus: Preferred Dividends | 4,749 | 4,248 | 13,650 | 12,813 | ||||||||||||
| Plus: Interest Expense, including Amortization of Financing Costs | 9,275 | 8,279 | 27,879 | 23,640 | ||||||||||||
| Plus: Depreciation and Amortization | 11,554 | 9,776 | 34,211 | 28,245 | ||||||||||||
| Less: Gain on Sale of Real Estate Investments | -0- | (2,097 | ) | -0- | (7,486 | ) | ||||||||||
| EBITDAre | 22,457 | 30,529 | 64,076 | 88,245 | ||||||||||||
| Plus: Net Amortization of Acquired Above and Below Market Lease Revenue | 26 | 26 | 77 | 77 | ||||||||||||
| Plus: Unrealized Holding Losses Arising During the Periods | 11,609 | -0- | 38,668 | -0- | ||||||||||||
| Less: Gain on Sale of Securities Transactions | -0- | -0- | -0- | (111 | ) | |||||||||||
| Adjusted EBITDA | $ | 34,092 | $ | 30,555 | $ | 102,821 | $ | 88,211 | ||||||||
| (1) | Effective October 1, 2018 we adopted ASU 2016-01. This new accounting standard requires unrealized gains or losses on our securities investments to flow through our income statement. Periods shown here prior to October 1, 2018 do not include the effect of this accounting change and therefore Net Income (Loss) Attributable to Common Shareholders between these periods are not comparable. |
| (2) | Unrealized Holding Gains or Losses Arising During the Periods, if any, were previously reported as an adjustment to Core Funds From Operations (Core FFO). |
| (3) | In conjunction with the adoption of the FFO White Paper - 2018 Restatement, for all periods presented, we have elected to exclude unrealized gains and losses from our investments in marketable equity securities from our FFO calculation. Prior to the adoption of the FFO White Paper – 2018 Restatement, we utilized Core FFO, which we defined as FFO, excluding Unrealized Holding Gains or Losses Arising During the Periods. |
| | THIRD QUARTER FISCAL YEAR 2019 SUPPLEMENTAL INFORMATION | 5 |
(unaudited) (in thousands)
| For The Three Months Ended | For The Nine Months Ended | |||||||||||||||
| Net Operating Income | 6/30/2019 | 6/30/2018 | 6/30/2019 | 6/30/2018 | ||||||||||||
| Net Income (Loss) Attributable to Common Shareholders(1) | $ | (3,121 | ) | $ | 10,323 | $ | (11,664 | ) | $ | 31,033 | ||||||
| Plus: Preferred Dividends | 4,749 | 4,248 | 13,650 | 12,813 | ||||||||||||
| Plus: General & Administrative Expenses | 2,351 | 1,888 | 6,420 | 6,053 | ||||||||||||
| Plus: Depreciation | 10,833 | 9,162 | 32,067 | 26,504 | ||||||||||||
| Plus: Amortization of Capitalized Lease Costs and Intangible Assets | 721 | 614 | 2,144 | 1,741 | ||||||||||||
| Plus: Interest Expense, including Amortization of Financing Costs | 9,275 | 8,279 | 27,879 | 23,640 | ||||||||||||
| Plus: Unrealized Holding Losses Arising During the Periods | 11,609 | -0- | 38,668 | -0- | ||||||||||||
| Less: Dividend Income | (3,686 | ) | (3,628 | ) | (11,569 | ) | (9,380 | ) | ||||||||
| Less: Gain on Sale of Securities Transactions | -0- | -0- | -0- | (111 | ) | |||||||||||
| Less: Gain on Sale of Real Estate Investments | -0- | (2,097 | ) | -0- | (7,486 | ) | ||||||||||
| Less: Lease Termination Income | -0- | -0- | -0- | (210 | ) | |||||||||||
| Net Operating Income – NOI | $ | 32,731 | $ | 28,789 | $ | 97,595 | $ | 84,597 | ||||||||
| For The Three Months Ended | For The Nine Months Ended | |||||||||||||||
| Components of Net Operating Income Consists of: | 6/30/2019 | 6/30/2018 | 6/30/2019 | 6/30/2018 | ||||||||||||
| Revenues: | ||||||||||||||||
| Rental Revenue | $ | 33,127 | $ | 29,256 | $ | 98,678 | $ | 85,559 | ||||||||
| Reimbursement Revenue | 6,345 | 5,480 | 19,247 | 17,002 | ||||||||||||
| Total Rental and Reimbursement Revenue | 39,472 | 34,736 | 117,925 | 102,561 | ||||||||||||
| Expenses: | ||||||||||||||||
| Real Estate Taxes | 5,092 | 4,488 | 15,144 | 13,593 | ||||||||||||
| Operating Expenses | 1,649 | 1,459 | 5,186 | 4,371 | ||||||||||||
| Total Real Estate Taxes and Operating Expenses | 6,741 | 5,947 | 20,330 | 17,964 | ||||||||||||
| Net Operating Income – NOI | $ | 32,731 | $ | 28,789 | $ | 97,595 | $ | 84,597 | ||||||||
| (1) | Effective October 1, 2018 we adopted ASU 2016-01. This new accounting standard requires unrealized gains or losses on our securities investments to flow through our income statement. Periods shown here prior to October 1, 2018 do not include the effect of this accounting change and therefore Net Income (Loss) Attributable to Common Shareholders between these periods are not comparable. |
| | THIRD QUARTER FISCAL YEAR 2019 SUPPLEMENTAL INFORMATION | 6 |
(unaudited) (in thousands except for per share amounts)
| For The | For The | |||||||||||||||||||||||
| Three Months Ended | Nine Months Ended | |||||||||||||||||||||||
| 6/30/2019 | 6/30/2018 | Change (%) | 6/30/2019 | 6/30/2018 | Change (%) | |||||||||||||||||||
| Weighted Average Common Shares Outstanding | ||||||||||||||||||||||||
| Basic | 94,399 | 79,414 | 18.9 | % | 92,619 | 77,921 | 18.9 | % | ||||||||||||||||
| Diluted | 94,493 | 79,572 | 18.8 | % | 92,719 | 78,099 | 18.7 | % | ||||||||||||||||
| Net Income (Loss) Attributable to Common Shareholders(1) | $ | (3,121 | ) | $ | 10,323 | (130.2 | )% | $ | (11,664 | ) | $ | 31,033 | (137.6 | )% | ||||||||||
| Basic | $ | (0.03 | ) | $ | 0.13 | (123.1 | )% | $ | (0.13 | ) | $ | 0.40 | (132.5 | )% | ||||||||||
| Diluted | (0.03 | ) | 0.13 | (123.1 | )% | (0.13 | ) | 0.40 | (132.5 | )% | ||||||||||||||
| Net Operating Income – NOI | $ | 32,731 | $ | 28,789 | 13.7 | % | $ | 97,595 | $ | 84,597 | 15.4 | % | ||||||||||||
| Basic | $ | 0.35 | $ | 0.36 | (2.8 | )% | $ | 1.05 | $ | 1.09 | (3.7 | )% | ||||||||||||
| Diluted | 0.35 | 0.36 | (2.8 | )% | 1.05 | 1.08 | (2.8 | )% | ||||||||||||||||
| Funds From Operations – FFO(2) | $ | 19,899 | $ | 17,988 | 10.6 | % | $ | 60,917 | $ | 51,751 | 17.7 | % | ||||||||||||
| Basic | $ | 0.21 | $ | 0.23 | (8.7 | )% | $ | 0.66 | $ | 0.66 | 0.0 | % | ||||||||||||
| Diluted | 0.21 | 0.23 | (8.7 | )% | 0.66 | 0.66 | 0.0 | % | ||||||||||||||||
| Adjusted Funds From Operations – AFFO | $ | 19,388 | $ | 17,348 | 11.8 | % | $ | 59,583 | $ | 50,667 | 17.6 | % | ||||||||||||
| Basic | $ | 0.21 | $ | 0.22 | (4.5 | )% | $ | 0.64 | $ | 0.65 | (1.5 | )% | ||||||||||||
| Diluted | 0.21 | 0.22 | (4.5 | )% | 0.64 | 0.65 | (1.5 | )% | ||||||||||||||||
| Dividends Declared per Common Share | $ | 0.17 | $ | 0.17 | $ | 0.51 | $ | 0.51 | ||||||||||||||||
| Dividend/AFFO Payout Ratio | 81.0 | % | 77.3 | % | 79.7 | % | 78.5 | % | ||||||||||||||||
| (1) | Effective October 1, 2018 we adopted ASU 2016-01. This new accounting standard requires unrealized gains or losses on our securities investments to flow through our income statement. Periods shown here prior to October 1, 2018 do not include the effect of this accounting change and therefore Net Income (Loss) Attributable to Common Shareholders between these periods are not comparable. |
| (2) | In conjunction with the adoption of the FFO White Paper - 2018 Restatement, for all periods presented, we have elected to exclude unrealized gains and losses from our investments in marketable equity securities from our FFO calculation. Prior to the adoption of the FFO White Paper – 2018 Restatement, we utilized Core FFO, which we defined as FFO, excluding Unrealized Holding Gains or Losses Arising During the Periods. |
| | THIRD QUARTER FISCAL YEAR 2019 SUPPLEMENTAL INFORMATION | 7 |
(unaudited) (in thousands except for square feet)
For The Three Months Ended | ||||||||||||||||||||
| 6/30/2019 | 6/30/2018 | Change | Change % | |||||||||||||||||
| Total Square Feet / Total Properties | 21,802,835 / 113 | 20,534,513 / 109 | 1,268,322 | 6.2 | % | |||||||||||||||
| Occupancy Percentage at End of Period | 98.9 | % | 99.6 | % | (70) bps | (0.7 | )% | |||||||||||||
| Same Property Square Feet / Number of Same Properties | 19,363,781 / 105 | |||||||||||||||||||
| Same Property Occupancy Percentage at End of Period | 98.8 | % | 99.6 | % | (80) bps | (0.8 | )% | |||||||||||||
| Same Property Net Operating Income (NOI) (GAAP) | $ | 27,388 | $ | 27,594 | $ | (206 | ) | (0.7 | )% | |||||||||||
| Reversal of Effect of Non-cash U.S. GAAP Straight-line Rent Adjustment | (371 | ) | (532 | ) | 161 | |||||||||||||||
| Same Property NOI (Cash) | $ | 27,017 | $ | 27,062 | $ | (45 | ) | (0.2 | )% | |||||||||||
Same Property Statistics include all properties owned during the entire periods presented with the exclusion of properties expanded during the periods presented. Historically, there have been many properties expanded in our portfolio and these expansions have resulted in very favorable economic returns. This factor should be taken into account when analyzing our Same Property results.
The 70 basis point decrease in Same Property NOI (GAAP) and the 20 basis point decrease in Same Property NOI (Cash) are primarily due to the 80 basis point decrease in Same Property Occupancy, partially offset by increased rent.
Reconciliation of Same Property NOI to Total NOI
(unaudited) (in thousands)
For The Three Months Ended | ||||||||||||||||
| 6/30/2019 | 6/30/2018 | Change | Change % | |||||||||||||
| Same Property NOI (GAAP) | $ | 27,388 | $ | 27,594 | $ | (206 | ) | (0.7 | )% | |||||||
| NOI of properties purchased subsequent to March 31, 2018 (two properties purchased during fiscal 2019 and four properties purchased during fiscal 2018) | 4,436 | 522 | ||||||||||||||
| NOI of properties expanded subsequent to March 31, 2018 (one property expanded during fiscal 2019 and one property expanded during 2018) | 907 | 612 | ||||||||||||||
| NOI of properties sold subsequent to March 31, 2018 (two properties sold during the 3rd quarter of fiscal 2018) | -0- | 61 | ||||||||||||||
| Total NOI | $ | 32,731 | $ | 28,789 | $ | 3,942 | 13.7 | % | ||||||||
| | THIRD QUARTER FISCAL YEAR 2019 SUPPLEMENTAL INFORMATION | 8 |
Same Property Statistics
(unaudited) (in thousands except for square feet)
For The Nine Months Ended | ||||||||||||||||||||
| 6/30/2019 | 6/30/2018 | Change | Change % | |||||||||||||||||
| Total Square Feet / Total Properties | 21,802,835 / 113 | 20,534,513 / 109 | 1,268,322 | 6.2 | % | |||||||||||||||
| Occupancy Percentage at End of Period | 98.9 | % | 99.6 | % | (70) bps | (0.7 | )% | |||||||||||||
| Same Property Square Feet / Number of Same Properties | 17,782,512 / 101 | |||||||||||||||||||
| Same Property Occupancy Percentage at End of Period | 98.7 | % | 99.5 | % | (80) bps | (0.8 | )% | |||||||||||||
| Same Property Net Operating Income (NOI) (GAAP) | $ | 76,033 | $ | 76,797 | $ | (764 | ) | (1.0 | )% | |||||||||||
| Reversal of Effect of Non-cash U.S. GAAP Straight-line Rent Adjustment | (850 | ) | (1,134 | ) | 284 | |||||||||||||||
| Same Property NOI (Cash) | $ | 75,183 | $ | 75,663 | $ | (480 | ) | (0.6 | )% | |||||||||||
Same Property Statistics include all properties owned during the entire periods presented with the exclusion of properties expanded during the periods presented. Historically, there have been many properties expanded in our portfolio and these expansions have resulted in very favorable economic returns. This factor should be taken into account when analyzing our Same Property results.
The 100 basis point decrease in Same Property NOI (GAAP) and the 60 basis point decrease in Same Property NOI (Cash) are primarily due to the 80 basis point decrease in Same Property Occupancy, partially offset by increased rent.
Reconciliation of Same Property NOI to Total NOI
(unaudited) (in thousands)
For The Nine Months Ended | ||||||||||||||||
| 6/30/2019 | 6/30/2018 | Change | Change % | |||||||||||||
| Same Property NOI (GAAP) | $ | 76,033 | $ | 76,797 | $ | (764 | ) | (1.0 | )% | |||||||
| NOI of properties purchased subsequent to September 30, 2017 (two properties purchased during fiscal 2019 and seven properties purchased during fiscal 2018) | 17,988 | 4,109 | ||||||||||||||
| NOI of properties expanded subsequent to September 30, 2017 (one property expanded during fiscal 2019 and two properties expanded during 2018) | 3,574 | 3,085 | ||||||||||||||
| NOI of properties sold subsequent to September 30, 2017 (four properties sold during fiscal 2018) | -0- | 606 | ||||||||||||||
| Total NOI | $ | 97,595 | $ | 84,597 | $ | 12,998 | 15.4 | % | ||||||||
| | THIRD QUARTER FISCAL YEAR 2019 SUPPLEMENTAL INFORMATION | 9 |
Consolidated Statements of Cash Flows
(unaudited) (in thousands)
| For The | ||||||||
| Nine Months Ended | ||||||||
| 6/30/2019 | 6/30/2018 | |||||||
| CASH FLOWS FROM OPERATING ACTIVITIES | ||||||||
| Net Income | $ | 1,986 | $ | 43,846 | ||||
| Noncash Items Included in Net Income: | ||||||||
| Depreciation & Amortization | 35,167 | 29,156 | ||||||
| Deferred Straight Line Rent | (1,352 | ) | (1,357 | ) | ||||
| Stock Compensation Expense | 574 | 339 | ||||||
| Unrealized Holding (Gains) Losses Arising During the Periods | 38,668 | -0- | ||||||
| Gain on Sale of Securities Transactions | -0- | (111 | ) | |||||
| Gain on Sale of Real Estate Investments | -0- | (7,486 | ) | |||||
| Changes in: | ||||||||
| Tenant & Other Receivables | 664 | 1,775 | ||||||
| Prepaid Expenses | (1,185 | ) | (1,637 | ) | ||||
| Other Assets & Capitalized Lease Costs | 173 | (2,174 | ) | |||||
| Accounts Payable, Accrued Expenses & Other Liabilities | 709 | 743 | ||||||
| NET CASH PROVIDED BY OPERATING ACTIVITIES | 75,404 | 63,094 | ||||||
| CASH FLOWS FROM INVESTING ACTIVITIES | ||||||||
| Purchase of Real Estate & Intangible Assets | (113,406 | ) | (174,919 | ) | ||||
| Capital Improvements | (11,594 | ) | (4,542 | ) | ||||
| Proceeds from Sale of Real Estate Investments | -0- | 22,083 | ||||||
| Return of Deposits on Real Estate | 200 | 450 | ||||||
| Deposits Paid on Acquisitions of Real Estate | (6,400 | ) | (700 | ) | ||||
| Proceeds from Sale of Securities Available for Sale | -0- | 2,620 | ||||||
| Purchase of Securities Available for Sale | (54,787 | ) | (61,278 | ) | ||||
| NET CASH USED IN INVESTING ACTIVITIES | (185,987 | ) | (216,286 | ) | ||||
| CASH FLOWS FROM FINANCING ACTIVITIES | ||||||||
| Net Draws (Repayments) on Loans Payable | (60,422 | ) | 37,701 | |||||
| Proceeds from Fixed Rate Mortgage Notes Payable | 72,500 | 105,600 | ||||||
| Principal Payments on Fixed Rate Mortgage Notes Payable | (50,180 | ) | (39,444 | ) | ||||
| Financing Costs Paid on Debt | (444 | ) | (1,066 | ) | ||||
| Proceeds from the Exercise of Stock Options | 567 | 570 | ||||||
| Proceeds from Underwritten Public Offering of Common Stock, net of offering costs | 132,338 | -0- | ||||||
| Proceeds from At-The-Market 6.125% Series C Preferred Stock, net of offering costs | 24,049 | 30,992 | ||||||
| Proceeds from Issuance of Common Stock in the DRIP, net of Dividend Reinvestments | 44,618 | 58,429 | ||||||
| Preferred Dividends Paid | (13,520 | ) | (12,549 | ) | ||||
| Common Dividends Paid, net of Reinvestments | (34,616 | ) | (30,375 | ) | ||||
| NET CASH PROVIDED BY FINANCING ACTIVITIES | 114,890 | 149,858 | ||||||
| NET INCREASE (DECREASE) IN CASH AND CASH EQUIVALENTS | 4,307 | (3,334 | ) | |||||
| CASH AND CASH EQUIVALENTS - BEGINNING OF PERIOD | 9,324 | 10,226 | ||||||
| CASH AND CASH EQUIVALENTS - END OF PERIOD | $ | 13,631 | $ | 6,892 | ||||
| | THIRD QUARTER FISCAL YEAR 2019 SUPPLEMENTAL INFORMATION | 10 |
Capital Structure and Leverage Ratios
(unaudited) (in thousands except for per share amounts)
| As of | As of | As of | ||||||||||
| 6/30/2019 | 6/30/2018 | 9/30/2018 | ||||||||||
| Fixed Rate Mortgage Notes Payable, net of Unamortized Debt Issuance Costs | $ | 734,095 | $ | 657,083 | $ | 711,546 | ||||||
| Loans Payable | 126,187 | 157,793 | 186,609 | |||||||||
| Total Debt | 860,282 | 814,876 | 898,155 | |||||||||
| 6.125% Series C Cumulative Redeemable Preferred Stock | 312,660 | 277,487 | 287,200 | |||||||||
| Common Stock, Paid-In-Capital & Other | 641,112 | 511,427 | 510,706 | |||||||||
| Total Shareholders’ Equity | 953,772 | 788,914 | 797,906 | |||||||||
| Total Book Capitalization | 1,814,054 | 1,603,790 | 1,696,061 | |||||||||
| Accumulated Depreciation | 238,757 | 197,434 | 207,065 | |||||||||
| Total Undepreciated Book Capitalization | $ | 2,052,811 | $ | 1,801,224 | $ | 1,903,126 | ||||||
| Shares Outstanding | 95,155 | 80,137 | 81,503 | |||||||||
| Market Price Per Share | $ | 13.55 | $ | 16.53 | $ | 16.72 | ||||||
| Equity Market Capitalization | $ | 1,289,350 | $ | 1,324,665 | $ | 1,362,732 | ||||||
| Total Debt | 860,282 | 814,876 | 898,155 | |||||||||
| Total Preferred Stock | 312,660 | 277,487 | 287,200 | |||||||||
| Total Market Capitalization | $ | 2,462,292 | $ | 2,417,028 | $ | 2,548,087 | ||||||
| Total Debt | $ | 860,282 | $ | 814,876 | $ | 898,155 | ||||||
| less: Cash and Cash Equivalents | 13,631 | 6,892 | 9,324 | |||||||||
| Net Debt | $ | 846,651 | $ | 807,984 | $ | 888,831 | ||||||
| less: Securities Available for Sale at Fair Value (Securities) | 171,040 | 167,594 | 154,921 | |||||||||
| Net Debt Less Securities | $ | 675,611 | $ | 640,390 | $ | 733,910 | ||||||
| Net Debt / Total Undepreciated Book Capitalization | 41.2 | % | 44.9 | % | 46.7 | % | ||||||
| Net Debt / Total Market Capitalization | 34.4 | % | 33.4 | % | 34.9 | % | ||||||
| Net Debt Plus Preferred Stock / Total Market Capitalization | 47.1 | % | 44.9 | % | 46.2 | % | ||||||
| Net Debt Less Securities / Total Undepreciated Book Capitalization | 32.9 | % | 35.6 | % | 38.6 | % | ||||||
| Net Debt Less Securities / Total Market Capitalization | 27.4 | % | 26.5 | % | 28.8 | % | ||||||
| Net Debt Less Securities Plus Preferred Stock / Total Market Capitalization | 40.1 | % | 38.0 | % | 40.1 | % | ||||||
| Weighted Average Interest Rate on Fixed Rate Debt | 4.03 | % | 4.11 | % | 4.07 | % | ||||||
| Weighted Average Term on Fixed Rate Debt | 11.5 yrs. | 11.5 yrs. | 11.7 yrs. | |||||||||
| Weighted Average Lease Term | 7.8 yrs. | 7.8 yrs. | 8.1 yrs. | |||||||||
| | THIRD QUARTER FISCAL YEAR 2019 SUPPLEMENTAL INFORMATION | 11 |
Capital Structure and Leverage Ratios
(unaudited) (in thousands)
| For the Three Months Ended | For the Nine Months Ended | Fiscal Year Ended | ||||||||||||||||||
| 6/30/2019 | 6/30/2018 | 6/30/2019 | 6/30/2018 | 9/30/2018 | ||||||||||||||||
| Net Income (Loss) Attributable to Common Shareholders | $ | (3,121 | ) | $ | 10,323 | $ | (11,664 | ) | $ | 31,033 | $ | 38,815 | ||||||||
| Plus: Preferred Dividends | 4,749 | 4,248 | 13,650 | 12,813 | 17,191 | |||||||||||||||
| Plus: Interest Expense, including Amortization of Financing Costs | 9,275 | 8,279 | 27,879 | 23,640 | 32,350 | |||||||||||||||
| Plus: Depreciation and Amortization | 11,554 | 9,776 | 34,211 | 28,245 | 38,567 | |||||||||||||||
| Less: Gain on Sale of Real Estate Investments | -0- | (2,097 | ) | -0- | (7,486 | ) | (7,486 | ) | ||||||||||||
| EBITDAre | 22,457 | 30,529 | 64,076 | 88,245 | 119,437 | |||||||||||||||
| Plus: Net Amortization of Acquired Above and Below Market Lease Revenue | 26 | 26 | 77 | 77 | 103 | |||||||||||||||
| Plus: Unrealized Holding Losses Arising During the Periods | 11,609 | -0- | 38,668 | -0- | -0- | |||||||||||||||
| Less: Gain on Sale of Securities Transactions | -0- | -0- | -0- | (111 | ) | (111 | ) | |||||||||||||
| Adjusted EBITDA | $ | 34,092 | $ | 30,555 | $ | 102,821 | $ | 88,211 | $ | 119,429 | ||||||||||
| Interest Expense, including Amortization of Financing Costs | $ | 9,275 | $ | 8,279 | $ | 27,879 | $ | 23,640 | $ | 32,350 | ||||||||||
| Preferred Dividends | 4,749 | 4,248 | 13,650 | 12,813 | 17,191 | |||||||||||||||
| Total Fixed Charges | $ | 14,024 | $ | 12,527 | $ | 41,529 | $ | 36,453 | $ | 49,541 | ||||||||||
| Interest Coverage | 3.7 x | 3.7 x | 3.7 x | 3.7 x | 3.7 x | |||||||||||||||
| Fixed Charge Coverage | 2.4 x | 2.4 x | 2.5 x | 2.4 x | 2.4 x | |||||||||||||||
| Net Debt | $ | 846,651 | $ | 807,984 | $ | 846,651 | $ | 807,984 | $ | 888,831 | ||||||||||
| Net Debt Less Securities | 675,611 | 640,390 | 675,611 | 640,390 | 733,910 | |||||||||||||||
| Total Preferred Stock | 312,660 | 277,487 | 312,660 | 277,487 | 287,200 | |||||||||||||||
| Annualized Adjusted EBITDA | 136,368 | 122,220 | 137,095 | 117,615 | 119,429 | |||||||||||||||
| Net Debt / Adjusted EBITDA | 6.2 x | 6.6 x | 6.2 x | 6.9 x | 7.4 x | |||||||||||||||
| Net Debt Less Securities / Adjusted EBITDA | 5.0 x | 5.2 x | 4.9 x | 5.4 x | 6.1 x | |||||||||||||||
| Net Debt + Preferred Stock / Adjusted EBITDA | 8.5 x | 8.9 x | 8.5 x | 9.2 x | 9.8 x | |||||||||||||||
| Net Debt Less Securities + Preferred Stock / Adjusted EBITDA | 7.2 x | 7.5 x | 7.2 x | 7.8 x | 8.5 x | |||||||||||||||
| | THIRD QUARTER FISCAL YEAR 2019 SUPPLEMENTAL INFORMATION | 12 |
(unaudited) (In thousands)

| Loans | % of | ||||||||||||||||||
| Fiscal Year Ended | Mortgages | Payable | Total | Total | |||||||||||||||
| 2019 | $ | 13,045 | $ | 16,187 | (B) | $ | 29,232 | 3.4 | % | ||||||||||
| 2020 | 52,074 | 110,000 | (C) | 162,074 | 18.7 | % | |||||||||||||
| 2021 | 53,925 | -0- | 53,925 | 6.2 | % | ||||||||||||||
| 2022 | 76,022 | -0- | 76,022 | 8.8 | % | ||||||||||||||
| 2023 | 54,683 | -0- | 54,683 | 6.3 | % | ||||||||||||||
| Thereafter | 492,338 | -0- | 492,338 | 56.6 | % | ||||||||||||||
| Total as of 6/30/2019 | (A) | $ | 742,087 | $ | 126,187 | $ | 868,274 | 100.0 | % | ||||||||||
| Weighted Average Interest Rate | 4.03 | % | 3.96 | % | 4.02 | % | |||||||||||||
| Weighted Average Term | 11.5 yrs. | 1.1 yrs. | 10.0 yrs. | ||||||||||||||||
| (A) | Mortgages does not include unamortized debt issuance costs of $7,992. | |
| (B) | Represents margin debt which is due upon demand. | |
| (C) | Represents the amount drawn down on a line of credit that has a one year extension option, which is not reflected above. |
| | THIRD QUARTER FISCAL YEAR 2019 SUPPLEMENTAL INFORMATION | 13 |
Securities Portfolio Historic Performance (Fiscal Year)
(unaudited)
| Fiscal Year | Securities Portfolio Cost(A) | Securities Available for Sale(A) | Dividend Income | Net Realized Gain on Sale of Securities | Change in Unrealized Gain/(Loss)(B) | Total Return | Total Return % | |||||||||||||||||||||
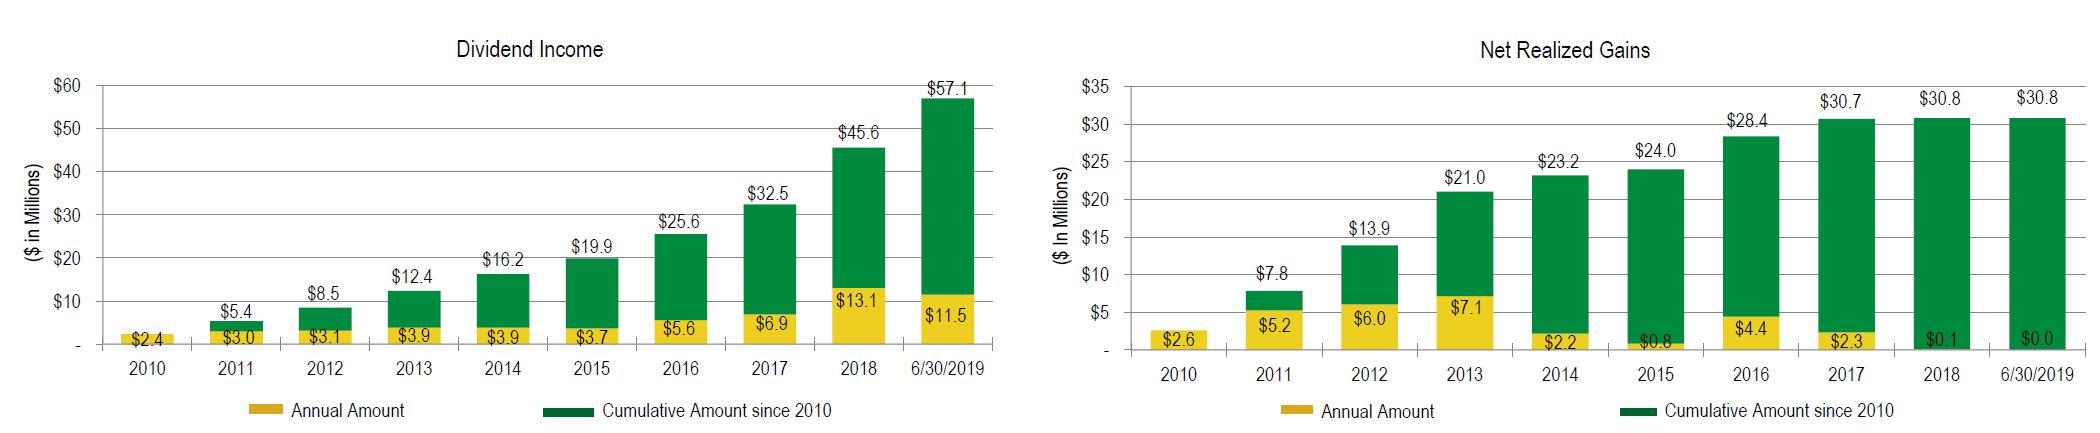
| 2010 | $ | 24,027,834 | $ | 27,824,665 | $ | 2,387,757 | $ | 2,609,149 | $ | 6,319,226 | $ | 11,316,132 | 47.10 | % | ||||||||||||||
| 2011 | 32,401,668 | 42,517,725 | 2,981,534 | 5,238,203 | (7,747,894 | ) | 471,843 | 1.46 | % | |||||||||||||||||||
| 2012 | 41,896,896 | 44,265,059 | 3,144,837 | 6,044,065 | 3,015,774 | 12,204,676 | 29.13 | % | ||||||||||||||||||||
| 2013 | 56,301,236 | 61,685,173 | 3,861,374 | 7,133,252 | (3,394,669 | ) | 7,599,957 | 13.50 | % | |||||||||||||||||||
| 2014 | 43,462,472 | 45,451,740 | 3,863,136 | 2,166,766 | (1,867,912 | ) | 4,161,990 | 9.58 | % | |||||||||||||||||||
| 2015 | 59,190,047 | 59,311,403 | 3,707,498 | 805,513 | (5,562,959 | ) | (1,049,948 | ) | (1.77 | )% | ||||||||||||||||||
| 2016 | 59,982,840 | 54,541,237 | 5,607,403 | 4,398,599 | 18,383,870 | 28,389,872 | 47.33 | % | ||||||||||||||||||||
| 2017 | 60,662,627 | 73,604,894 | 6,919,973 | 2,311,714 | (6,371,702 | ) | 2,859,985 | 4.71 | % | |||||||||||||||||||
| 2018 | 117,194,205 | 123,764,770 | 13,099,316 | 111,387 | (31,315,144 | ) | (18,104,441 | ) | (15.45 | )% | ||||||||||||||||||
| As of 6/30/19 | 179,665,124 | 154,920,545 | 11,508,582 | -0- | (38,667,665 | ) | (27,159,083 | ) | (15.12 | )% | ||||||||||||||||||
| Total | $ | 57,081,410 | $ | 30,818,648 | $ | (67,209,075 | ) | $ | 20,690,983 | Avg. 12.05 | % | |||||||||||||||||
| (A) | Fiscal Year beginning balance | |
| (B) | Fiscal Year end balance |
| | THIRD QUARTER FISCAL YEAR 2019 SUPPLEMENTAL INFORMATION | 14 |
Securities Portfolio Historic Performance (Fiscal Year)
(unaudited)
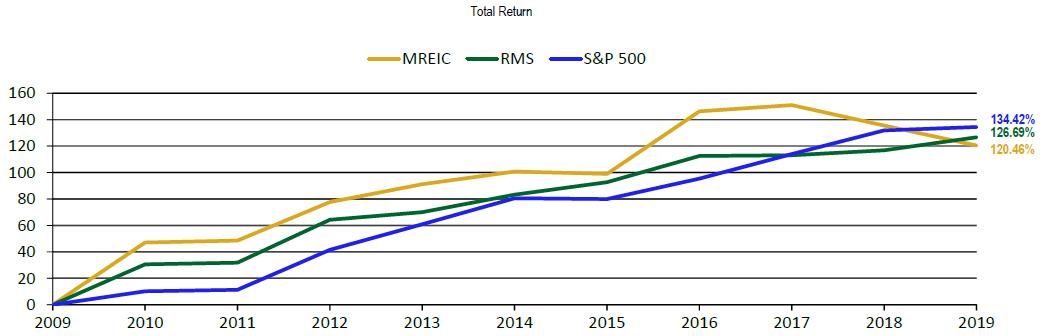
| FISCAL YEAR | MREIC REIT Portfolio (%) | MSCI REIT Index (RMS)(%) | S&P 500 Index | MREIC vs. MSCI REIT Index (RMS) ∆ in BPS | MREIC vs. S&P 500 Index ∆ in BPS | |||||||||||||||
| 2010 | 47.10 | 30.54 | 10.16 | 1656 | 3694 | |||||||||||||||
| 2011 | 1.46 | 1.26 | 1.14 | 20 | 32 | |||||||||||||||
| 2012 | 29.13 | 32.44 | 30.20 | (331 | ) | (107 | ) | |||||||||||||
| 2013 | 13.50 | 5.75 | 19.34 | 775 | (584 | ) | ||||||||||||||
| 2014 | 9.58 | 13.26 | 19.73 | (368 | ) | (1015 | ) | |||||||||||||
| 2015 | (1.77 | ) | 9.47 | (0.61 | ) | (1124 | ) | (116 | ) | |||||||||||
| 2016 | 47.33 | 19.83 | 15.43 | 2750 | 3190 | |||||||||||||||
| 2017 | 4.71 | 0.54 | 18.61 | 417 | (1390 | ) | ||||||||||||||
| 2018 | (15.45 | ) | 3.74 | 17.91 | (1919 | ) | (3336 | ) | ||||||||||||
| As of 6/30/19 | (15.12 | ) | 9.86 | 2.51 | (2498 | ) | (1763 | ) | ||||||||||||
| Average | 12.05 | 12.67 | 13.44 | (62 | ) | (140 | ) | |||||||||||||
Source: S&P Global Market Intelligence
| | THIRD QUARTER FISCAL YEAR 2019 SUPPLEMENTAL INFORMATION | 15 |
(unaudited)
| Occupied | % of | % of Total | Rent Per | |||||||||||||||||||||||||||||||||||||
| Tenant | Property Count | Square Footage | Square Footage | Occupied sf | Annual Rent | Ann. Rent | sf Occup. | Undepreciated Cost | Mortgage Balance | |||||||||||||||||||||||||||||||
| FedEx Ground Package System, Inc. | 45 | 8,920,293 | 8,920,293 | 40.9 | % | $ | 71,950,000 | 53.6 | % | $ | 8.07 | $ | 1,019,136,977 | $ | 457,795,896 | |||||||||||||||||||||||||
| FedEx Corporation | 15 | 1,095,096 | 1,095,096 | 5.0 | % | 6,719,000 | 5.0 | % | 6.14 | 95,795,334 | 13,149,632 | |||||||||||||||||||||||||||||
| FedEx Trade Networks, Inc. | 1 | 449,900 | 449,900 | 2.1 | % | 1,389,000 | 1.0 | % | 3.09 | 15,246,877 | 4,420,741 | |||||||||||||||||||||||||||||
| Total FedEx | 61 | 10,465,289 | 10,465,289 | 48.0 | % | 80,058,000 | 59.6 | % | 7.65 | 1,130,179,188 | 475,366,269 | |||||||||||||||||||||||||||||
| Milwaukee Electric Tool Corporation | 1 | 861,889 | 861,889 | 4.0 | % | 3,054,000 | 2.3 | % | 3.54 | 36,914,917 | 20,374,512 | |||||||||||||||||||||||||||||
| Shaw Industries, Inc. | 1 | 831,764 | 831,764 | 3.8 | % | 3,495,000 | 2.6 | % | 4.20 | 56,025,945 | 30,788,426 | |||||||||||||||||||||||||||||
| ULTA, Inc. | 1 | 671,354 | 671,354 | 3.1 | % | 2,729,000 | 2.0 | % | 4.06 | 37,512,071 | 19,129,908 | |||||||||||||||||||||||||||||
| Amazon.com Services, Inc. (Amazon.com, Inc.) | 2 | 662,942 | 662,942 | 3.0 | % | 3,927,000 | 2.9 | % | 5.92 | 62,931,258 | 36,474,699 | |||||||||||||||||||||||||||||
| Jim Beam Brands Company (Beam Suntory) | 1 | 599,840 | 599,840 | 2.8 | % | 2,071,000 | 1.5 | % | 3.45 | 28,000,000 | 15,918,028 | |||||||||||||||||||||||||||||
| International Paper Company | 2 | 578,472 | 578,472 | 2.7 | % | 2,615,000 | 1.9 | % | 4.52 | 37,024,609 | 19,642,149 | |||||||||||||||||||||||||||||
| TreeHouse Private Brands, Inc. | 1 | 558,600 | 558,600 | 2.6 | % | 2,226,000 | 1.7 | % | 3.98 | 26,807,852 | 14,754,183 | |||||||||||||||||||||||||||||
| B. Braun Medical Inc. | 1 | 399,440 | 399,440 | 1.8 | % | 2,138,000 | 1.6 | % | 5.35 | 30,008,069 | 18,469,060 | |||||||||||||||||||||||||||||
| UGN, Inc. | 1 | 387,000 | 387,000 | 1.8 | % | 2,076,000 | 1.5 | % | 5.36 | 21,576,756 | 6,753,023 | |||||||||||||||||||||||||||||
| CBOCS Distribution, Inc. (Cracker Barrel) | 1 | 381,240 | 381,240 | 1.7 | % | 1,461,000 | 1.1 | % | 3.83 | 14,215,126 | -0- | |||||||||||||||||||||||||||||
| Best Buy Warehousing Logistics, Inc. | 1 | 368,060 | 368,060 | 1.7 | % | 1,693,000 | 1.3 | % | 4.60 | 19,600,000 | 8,838,337 | |||||||||||||||||||||||||||||
| Coca-Cola | 2 | 323,358 | 323,358 | 1.5 | % | 1,709,000 | 1.3 | % | 5.29 | 20,504,069 | 3,748,880 | |||||||||||||||||||||||||||||
| Autoneum North America, Inc. | (E) | 1 | 315,560 | 315,560 | 1.4 | % | 1,717,000 | 1.3 | % | 5.44 | 21,040,395 | 13,882,991 | ||||||||||||||||||||||||||||
| Science Applications International Corporation | 1 | 302,400 | 302,400 | 1.4 | % | 1,655,000 | 1.2 | % | 5.47 | 13,829,273 | -0- | |||||||||||||||||||||||||||||
| Bunzl USA Holdings, Inc. | 2 | 268,778 | 268,778 | 1.2 | % | 1,487,000 | 1.1 | % | 5.53 | 18,731,674 | 11,730,337 | |||||||||||||||||||||||||||||
| Woodstream Corporation | (A) | 1 | 256,000 | 256,000 | 1.2 | % | 920,000 | 0.7 | % | 3.59 | 8,935,160 | -0- | ||||||||||||||||||||||||||||
| Anda Pharmaceuticals, Inc. | 1 | 234,660 | 234,660 | 1.1 | % | 1,210,000 | 0.9 | % | 5.16 | 14,550,000 | 7,089,238 | |||||||||||||||||||||||||||||
| United Technologies Corporation | 2 | 223,150 | 223,150 | 1.0 | % | 1,543,000 | 1.1 | % | 6.91 | 23,000,735 | 5,836,756 | |||||||||||||||||||||||||||||
| Mickey Thompson Performance Tires and Wheels (Cooper Tire) | 1 | 219,765 | 219,765 | 1.0 | % | 1,511,000 | 1.1 | % | 6.88 | 18,934,065 | 11,647,817 | |||||||||||||||||||||||||||||
| Rinnai America Corporation | 1 | 218,120 | 218,120 | 1.0 | % | 840,000 | 0.6 | % | 3.85 | 15,061,573 | -0- | |||||||||||||||||||||||||||||
| Anheuser-Busch, Inc. | 1 | 184,800 | 184,800 | 0.8 | % | 832,000 | 0.6 | % | 4.50 | 12,697,848 | -0- | |||||||||||||||||||||||||||||
| Carlisle Tire & Wheel Company | 1 | 179,280 | 179,280 | 0.8 | % | 761,000 | 0.6 | % | 4.24 | 7,232,986 | -0- | |||||||||||||||||||||||||||||
| NF&M International, Inc. | (B) | 1 | 174,802 | 174,802 | 0.8 | % | 837,000 | 0.6 | % | 4.79 | 5,408,790 | -0- | ||||||||||||||||||||||||||||
| Home Depot USA, Inc. | 1 | 171,200 | 171,200 | 0.8 | % | 1,007,000 | 0.7 | % | 5.88 | 11,303,317 | -0- | |||||||||||||||||||||||||||||
| Victory Packaging, L.P. | 1 | 148,000 | 148,000 | 0.7 | % | 508,000 | 0.4 | % | 3.43 | 5,455,379 | -0- | |||||||||||||||||||||||||||||
| Challenger Lifts, Inc. (Snap-On Inc.) | 1 | 137,500 | 137,500 | 0.6 | % | 845,000 | 0.6 | % | 6.15 | 11,304,000 | 6,223,698 | |||||||||||||||||||||||||||||
| Altec Industries, Inc. | (A) | 1 | 126,880 | 126,880 | 0.6 | % | 374,000 | 0.3 | % | 2.95 | 4,428,488 | -0- | ||||||||||||||||||||||||||||
| General Electric Company | 1 | 125,860 | 125,860 | 0.6 | % | 1,328,000 | 1.0 | % | 10.55 | 19,964,283 | 10,608,104 | |||||||||||||||||||||||||||||
| Keurig Dr Pepper | 2 | 110,080 | 110,080 | 0.5 | % | 748,000 | 0.6 | % | 6.80 | 10,498,031 | 1,585,930 | |||||||||||||||||||||||||||||
| Style Crest, Inc. | 1 | 106,507 | 106,507 | 0.5 | % | 392,000 | 0.3 | % | 3.68 | 7,246,325 | -0- | |||||||||||||||||||||||||||||
| Pittsburgh Glass Works, LLC | 1 | 102,135 | 102,135 | 0.5 | % | 447,000 | 0.3 | % | 4.38 | 4,245,913 | -0- | |||||||||||||||||||||||||||||
| Dakota Bodies, LLC | 1 | 96,687 | 96,687 | 0.4 | % | 407,000 | 0.3 | % | 4.21 | 7,410,296 | -0- | |||||||||||||||||||||||||||||
| National Oilwell Varco, Inc. | 1 | 91,295 | 91,295 | 0.4 | % | 759,000 | 0.6 | % | 8.31 | 8,163,278 | 1,772,641 | |||||||||||||||||||||||||||||
| Joseph T. Ryerson and Son, Inc. | 1 | 89,052 | 89,052 | 0.4 | % | 513,000 | 0.4 | % | 5.76 | 6,977,442 | -0- | |||||||||||||||||||||||||||||
| CHEP USA, Inc. | 1 | 83,000 | 83,000 | 0.4 | % | 503,000 | 0.4 | % | 6.06 | 7,463,672 | -0- | |||||||||||||||||||||||||||||
| Sherwin-Williams Company | 2 | 78,887 | 78,887 | 0.4 | % | 647,000 | 0.5 | % | 8.20 | 7,244,128 | -0- | |||||||||||||||||||||||||||||
| RGH Enterprises, Inc. (Cardinal Health) | 1 | 75,000 | 75,000 | 0.3 | % | 613,000 | 0.5 | % | 8.17 | 5,525,600 | -0- | |||||||||||||||||||||||||||||
| Tampa Bay Grand Prix | 1 | 68,385 | 68,385 | 0.3 | % | 302,000 | 0.2 | % | 4.42 | 5,677,982 | -0- | |||||||||||||||||||||||||||||
| Various Tenants at Retail Shopping Center | 1 | 64,220 | 62,440 | 0.3 | % | 778,000 | 0.6 | % | 12.46 | 3,129,208 | -0- | |||||||||||||||||||||||||||||
| SOFIVE, Inc. | 1 | 60,400 | 60,400 | 0.3 | % | 623,000 | 0.5 | % | 10.31 | 5,296,752 | 1,452,067 | |||||||||||||||||||||||||||||
| Kellogg Sales Company | 1 | 54,812 | 54,812 | 0.3 | % | 329,000 | 0.2 | % | 6.00 | 3,494,108 | -0- | |||||||||||||||||||||||||||||
| Siemens Real Estate | 1 | 51,130 | 51,130 | 0.2 | % | 461,000 | 0.3 | % | 9.02 | 4,452,425 | -0- | |||||||||||||||||||||||||||||
| Foundation Building Materials, LLC | 1 | 36,270 | 36,270 | 0.1 | % | 176,000 | 0.1 | % | 4.85 | 2,543,770 | -0- | |||||||||||||||||||||||||||||
| Graybar Electric Company | 1 | 26,340 | 26,340 | 0.1 | % | 112,000 | 0.1 | % | 4.25 | 2,311,207 | -0- | |||||||||||||||||||||||||||||
| Vacant | (B) | 3 | 232,632 | -0- | 0.0 | % | -0- | 0.0 | % | -0- | 15,050,744 | -0- | ||||||||||||||||||||||||||||
| Total as of 6/30/19 | 113 | 21,802,835 | 21,568,423 | 98.9 | % | $ | 134,437,000 | 100.0 | % | $ | 6.23 | $ | 1,839,908,707 | (C) | $ | 742,087,053 | ||||||||||||||||||||||||
| Acquisitions Subsequent to 6/30/19 | ||||||||||||||||||||||||||||||||||||||||
| Toyota Tsusho America, Inc. | 1 | 350,000 | 350,000 | 1.6 | % | 1,707,000 | 1.3 | % | 4.88 | |||||||||||||||||||||||||||||||
| Pro Forma Total with Acquisitions Subsequent to 6/30/19 | 114 | 22,152,835 | 21,918,423 | 98.9 | % | $ | 136,144,000 | 100.0 | % | $ | 6.21 | |||||||||||||||||||||||||||||
| Leasing Activity Subsequent to 6/30/19 | ||||||||||||||||||||||||||||||||||||||||
| Amazon.com Services, Inc. (Amazon.com, Inc.) | (D) | - | - | 91,776 | 0.4 | % | 789,000 | 0.6 | % | 8.60 | ||||||||||||||||||||||||||||||
| Autoneum North America, Inc. | (E) | - | 98,045 | 98,045 | 0.4 | % | 490,000 | 0.4 | % | 5.00 | ||||||||||||||||||||||||||||||
| Pro Forma Total | 114 | 22,250,880 | 22,108,244 | 99.4 | % | $ | 137,423,000 | 100.0 | % | $ | 6.22 | |||||||||||||||||||||||||||||
| (A) | Woodstream Corporation and Altec Industries, Inc. are located at one property and, therefore, are counted as one property in the Property Count Total. | |
| (B) | NF&M International is located in a 255,658 square foot industrial park in Monaca (Pittsburgh), PA, of which 80,856 square feet is vacant. This industrial park is counted as one property in the Property Count Total. Other than two properties indicated in footnotes (A) and (B) and one retail property, all other properties are single-tenant. | |
| (C) | Does not include unamortized debt issuance costs of $7,991,734. | |
| (D) | Effective July 1, 2019, we leased our previously vacant 91,776 square foot facility located in Hanahan (Charleston), SC for ten years to Amazon.com Services, Inc. | |
| (E) | Property located in Aiken (Augusta, GA), SC leased to Autoneum North America, Inc. has a separate 98,045 square foot structure that was not in service. Effective July 1, 2019 this structure was placed in service. |
| | THIRD QUARTER FISCAL YEAR 2019 SUPPLEMENTAL INFORMATION | 16 |
(unaudited)
| Occupied | % of | % of Total | Rent Per | |||||||||||||||||||||||||||||||||
| State | Property Count | Square Footage | Square Footage | Total sf | Annual Rent | Ann. Rent | sf Occup. | Undepreciated Cost | Mortgage Balance | |||||||||||||||||||||||||||
| Florida | 13 | 2,211,583 | 2,211,583 | 10.1 | % | $ | 15,730,000 | 11.8 | % | $ | 7.11 | $ | 227,011,120 | $ | 91,504,907 | |||||||||||||||||||||
| Texas | 10 | 1,781,967 | 1,781,967 | 8.2 | % | 13,777,000 | 10.2 | % | 7.73 | 182,357,395 | 73,725,696 | |||||||||||||||||||||||||
| Ohio | 9 | 1,705,506 | 1,705,506 | 7.8 | % | 9,960,000 | 7.4 | % | 5.84 | 119,522,777 | 38,265,461 | |||||||||||||||||||||||||
| Georgia | 6 | 1,639,696 | 1,639,696 | 7.5 | % | 10,507,000 | 7.8 | % | 6.41 | 166,193,037 | 86,430,790 | |||||||||||||||||||||||||
| Kentucky | 3 | 1,295,940 | 1,295,940 | 5.9 | % | 5,142,000 | 3.8 | % | 3.97 | 66,111,852 | 36,895,908 | |||||||||||||||||||||||||
| South Carolina | 6 | 1,273,676 | 1,181,900 | 5.8 | % | 8,988,000 | 6.7 | % | 7.60 | 127,675,307 | 55,999,081 | |||||||||||||||||||||||||
| Mississippi | 4 | 1,158,889 | 1,158,889 | 5.3 | % | 4,496,000 | 3.3 | % | 3.88 | 55,676,815 | 27,463,750 | |||||||||||||||||||||||||
| Indiana | 2 | 999,176 | 999,176 | 4.6 | % | 4,446,000 | 3.3 | % | 4.45 | 63,016,154 | 28,833,319 | |||||||||||||||||||||||||
| Illinois | 9 | 958,045 | 958,045 | 4.4 | % | 6,150,000 | 4.6 | % | 6.42 | 82,698,574 | 8,110,757 | |||||||||||||||||||||||||
| North Carolina | 4 | 939,706 | 939,706 | 4.3 | % | 5,674,000 | 4.2 | % | 6.04 | 85,789,646 | 40,787,637 | |||||||||||||||||||||||||
| Tennessee | 3 | 891,777 | 891,777 | 4.1 | % | 3,169,000 | 2.4 | % | 3.55 | 34,804,540 | 4,420,741 | |||||||||||||||||||||||||
| Michigan | 4 | 833,054 | 833,054 | 3.8 | % | 5,575,000 | 4.1 | % | 6.69 | 73,371,243 | 24,457,837 | |||||||||||||||||||||||||
| Kansas | 4 | 813,043 | 813,043 | 3.7 | % | 4,656,000 | 3.5 | % | 5.73 | 60,943,937 | 28,333,243 | |||||||||||||||||||||||||
| Missouri | 4 | 740,119 | 740,119 | 3.4 | % | 2,906,000 | 2.2 | % | 3.93 | 35,023,092 | 6,501,338 | |||||||||||||||||||||||||
| Oklahoma | 4 | 614,941 | 614,941 | 2.8 | % | 3,943,000 | 2.9 | % | 6.41 | 54,939,874 | 28,249,720 | |||||||||||||||||||||||||
| New York | 3 | 518,565 | 518,565 | 2.4 | % | 3,897,000 | 2.9 | % | 7.51 | 51,580,123 | 20,393,256 | |||||||||||||||||||||||||
| Pennsylvania | 3 | 504,040 | 423,184 | 2.3 | % | 2,816,000 | 2.1 | % | 6.65 | 36,901,865 | 13,558,836 | |||||||||||||||||||||||||
| New Jersey | 3 | 471,765 | 469,985 | 2.2 | % | 6,729,000 | 5.0 | % | 14.32 | 92,413,582 | 54,888,090 | |||||||||||||||||||||||||
| Alabama | 2 | 451,595 | 451,595 | 2.1 | % | 2,630,000 | 2.0 | % | 5.82 | 39,714,135 | 18,262,955 | |||||||||||||||||||||||||
| Virginia | 5 | 407,265 | 347,265 | 1.9 | % | 2,128,000 | 1.6 | % | 6.13 | 34,828,682 | 4,029,220 | |||||||||||||||||||||||||
| Colorado | 2 | 295,227 | 295,227 | 1.4 | % | 2,441,000 | 1.8 | % | 8.27 | 35,683,647 | 16,041,539 | |||||||||||||||||||||||||
| Arizona | 1 | 283,358 | 283,358 | 1.3 | % | 1,377,000 | 1.0 | % | 4.86 | 16,824,226 | 3,094,463 | |||||||||||||||||||||||||
| Wisconsin | 2 | 238,666 | 238,666 | 1.1 | % | 1,295,000 | 1.0 | % | 5.43 | 16,342,720 | 2,394,877 | |||||||||||||||||||||||||
| Washington | 1 | 210,445 | 210,445 | 1.0 | % | 1,962,000 | 1.5 | % | 9.32 | 30,320,686 | 16,919,687 | |||||||||||||||||||||||||
| Louisiana | 1 | 175,315 | 175,315 | 0.8 | % | 1,265,000 | 0.9 | % | 7.22 | 18,425,875 | 10,604,763 | |||||||||||||||||||||||||
| Maryland | 1 | 148,881 | 148,881 | 0.7 | % | 1,455,000 | 1.1 | % | 9.77 | 14,512,355 | -0- | |||||||||||||||||||||||||
| Nebraska | 1 | 89,115 | 89,115 | 0.4 | % | 446,000 | 0.3 | % | 5.00 | 5,963,626 | -0- | |||||||||||||||||||||||||
| Minnesota | 1 | 60,398 | 60,398 | 0.3 | % | 372,000 | 0.3 | % | 6.16 | 5,223,944 | 1,919,182 | |||||||||||||||||||||||||
| Connecticut | 1 | 54,812 | 54,812 | 0.3 | % | 329,000 | 0.2 | % | 6.00 | 3,494,108 | -0- | |||||||||||||||||||||||||
| Iowa | 1 | 36,270 | 36,270 | 0.1 | % | 176,000 | 0.1 | % | 4.85 | 2,543,770 | -0- | |||||||||||||||||||||||||
| Total as of 6/30/2019 | 113 | 21,802,835 | 21,568,423 | 100.0 | % | $ | 134,437,000 | 100.0 | % | $ | 6.23 | $ | 1,839,908,707 | (A) | $ | 742,087,053 | ||||||||||||||||||||
| Acquisitions Subsequent to 6/30/19 | ||||||||||||||||||||||||||||||||||||
| Indiana | 1 | 350,000 | 350,000 | 1.6 | % | 1,707,000 | 1.3 | % | 4.88 | |||||||||||||||||||||||||||
| Pro Forma Total with Acquisitions Subsequent to 6/30/19 | 114 | 22,152,835 | 21,918,423 | 100.0 | % | $ | 136,144,000 | 100.0 | % | $ | 6.21 | |||||||||||||||||||||||||
| Leasing Activity Subsequent to 6/30/19 | ||||||||||||||||||||||||||||||||||||
| South Carolina (B) (C) | - | 98,045 | 189,821 | 0.9 | % | 1,279,000 | 0.9 | % | 6.74 | |||||||||||||||||||||||||||
| Pro Forma Total | 114 | 22,250,880 | 22,108,244 | 100.0 | % | $ | 137,423,000 | 100.0 | % | $ | 6.22 | |||||||||||||||||||||||||
| (A) | Does not include unamortized debt issuance costs of $7,991,734. | |
| (B) | Effective July 1, 2019, we leased our previously vacant 91,776 square foot facility located in Hanahan (Charleston), SC for ten years to Amazon.com Services, Inc. | |
| (C) | Property located in Aiken (Augusta, GA), SC leased to Autoneum North America, Inc. has a separate 98,045 square foot structure that was not in service. Effective July 1, 2019 this structure was placed in service. |
| | THIRD QUARTER FISCAL YEAR 2019 SUPPLEMENTAL INFORMATION | 17 |
(unaudited)
| Fiscal Year | Property Count | Square Footage | % of Total Sf | Annual Rent | % of Total Ann. Rent | Rent Per sf Occup. | Lease Exp Term in Years | Undepreciated Cost | Mortgage Balance | ||||||||||||||||||||||||||||||
| 2019 | 1 | 104,981 | 0.5 | % | $ | 966,000 | 0.7 | % | $ | 9.20 | 0.2 | $ | 10,960,823 | $ | -0- | ||||||||||||||||||||||||
| 2020 | 4 | 320,737 | 1.5 | % | 1,750,000 | 1.3 | % | 5.46 | 1.0 | 22,786,614 | -0- | ||||||||||||||||||||||||||||
| 2021 | (A) | 10 | 1,206,723 | 5.5 | % | 5,516,000 | 4.1 | % | 4.57 | 1.9 | 69,745,496 | 7,318,493 | |||||||||||||||||||||||||||
| 2022 | 7 | 1,138,320 | 5.2 | % | 6,463,000 | 4.8 | % | 5.68 | 2.7 | 76,109,324 | 23,512,968 | ||||||||||||||||||||||||||||
| 2023 | (A) | 13 | 1,668,804 | 7.7 | % | 9,522,000 | 7.1 | % | 5.71 | 4.0 | 117,164,155 | 19,909,876 | |||||||||||||||||||||||||||
| 2024 | 13 | 1,887,034 | 8.7 | % | 11,710,000 | 8.7 | % | 6.21 | 4.9 | 136,146,354 | 25,443,250 | ||||||||||||||||||||||||||||
| 2025 | (A) | 9 | 2,433,130 | 11.2 | % | 12,281,000 | 9.1 | % | 5.05 | 5.9 | 161,968,477 | 69,633,329 | |||||||||||||||||||||||||||
| 2026 | 8 | 1,078,913 | 4.8 | % | 8,347,000 | 6.2 | % | 7.74 | 6.9 | 112,764,634 | 33,072,577 | ||||||||||||||||||||||||||||
| 2027 | 11 | 2,304,616 | 10.6 | % | 12,612,000 | 9.4 | % | 5.47 | 8.1 | 179,811,191 | 69,262,322 | ||||||||||||||||||||||||||||
| 2028 | 11 | 2,571,915 | 11.8 | % | 13,902,000 | 10.3 | % | 5.41 | 8.8 | 182,406,703 | 67,186,833 | ||||||||||||||||||||||||||||
| 2029 | 6 | 1,297,858 | 6.0 | % | 7,224,000 | 5.4 | % | 5.57 | 9.7 | 104,370,087 | 47,678,526 | ||||||||||||||||||||||||||||
| 2030 | 4 | 873,032 | 4.0 | % | 6,962,000 | 5.2 | % | 7.97 | 10.8 | 101,658,472 | 53,441,070 | ||||||||||||||||||||||||||||
| 2031 | 3 | 963,269 | 4.4 | % | 7,135,000 | 5.3 | % | 7.41 | 11.8 | 104,610,700 | 62,092,481 | ||||||||||||||||||||||||||||
| 2032 | 7 | 2,071,983 | 9.5 | % | 18,480,000 | 13.8 | % | 8.92 | 12.8 | 286,037,611 | 174,894,215 | ||||||||||||||||||||||||||||
| 2033 | 2 | 639,068 | 2.9 | % | 6,487,000 | 4.8 | % | 10.15 | 13.8 | 106,803,506 | 67,133,907 | ||||||||||||||||||||||||||||
| 2034 | 2 | 945,600 | 4.3 | % | 4,302,000 | 3.2 | % | 4.55 | 14.5 | 48,384,608 | 21,507,206 | ||||||||||||||||||||||||||||
| Various tenants at retail shopping center | 1 | 64,220 | 0.3 | % | 778,000 | 0.6 | % | 12.46 | -0- | 3,129,208 | -0- | ||||||||||||||||||||||||||||
| Vacant | (A) | 3 | 232,632 | 1.1 | % | -0- | 0.0 | % | -0- | -0- | 15,050,744 | -0- | |||||||||||||||||||||||||||
| Total as of 6/30/19 | 113 | 21,802,835 | 100.0 | % | $ | 134,437,000 | 100.0 | % | $ | 6.23 | 7.8 | $ | 1,839,908,707 | (B) | $ | 742,087,053 | |||||||||||||||||||||||
| Acquisitions Subsequent to 6/30/19 | |||||||||||||||||||||||||||||||||||||||
| 2029 | 1 | 350,000 | 1.6 | % | 1,707,000 | 1.3 | % | 4.88 | 10.0 | ||||||||||||||||||||||||||||||
| Pro Forma Total with Acquisitions Subsequent to 6/30/19 | 114 | 22,152,835 | 100.0 | % | $ | 136,144,000 | 100.0 | % | $ | 6.21 | 7.8 | ||||||||||||||||||||||||||||
| Leasing Activity Subsequent to 6/30/19 | |||||||||||||||||||||||||||||||||||||||
| 2020 | (C) | - | 98,045 | 0.4 | % | 490,000 | 0.4 | % | 5.00 | 1.0 | |||||||||||||||||||||||||||||
| 2029 | (D) | - | - | - | 789,000 | 0.6 | % | 8.60 | 10.0 | ||||||||||||||||||||||||||||||
| Pro Forma Total | 114 | 22,250,880 | 100.0 | % | $ | 137,423,000 | 100.0 | % | $ | 6.22 | 7.8 | ||||||||||||||||||||||||||||
| (A) | Included in 2021 is Woodstream Corporation and included in 2023 is Altec Industries which both occupy one property. Included in 2025 is NF&M International, which occupies 174,802 square feet of a 255,658 square foot Industrial Park. The remaining 80,856 square feet is included in Vacant. Each of these properties are counted as one property in the Property Count Total. Other than these properties and one retail property, all other properties are single-tenant. | |
| (B) | Does not include unamortized debt issuance costs of $7,991,734. | |
| (C) | Property located in Aiken (Augusta, GA), SC leased to Autoneum North America, Inc. has a separate 98,045 square foot structure that was not in service. Effective July 1, 2019 this structure was placed in service. | |
| (D) | Effective July 1, 2019, we leased our previously vacant 91,776 square foot facility located in Hanahan (Charleston), SC for ten years to Amazon.com Services, Inc. |
| | THIRD QUARTER FISCAL YEAR 2019 SUPPLEMENTAL INFORMATION | 18 |
Recent Acquisitions During Fiscal 2019
(unaudited)
| Date of | Square | Annual | Rent Per | Lease | Purchase | Initial Mortgage | ||||||||||||||||||||||||
| No | Tenant | City (MSA) | State | Acquisition | Footage | Rent | sf Occup. | Expiration | Price | Balance | ||||||||||||||||||||
| 1 | FedEx Ground Package System, Inc. | Trenton | NJ | 10/19/18 | 347,145 | $ | 5,328,000 | $ | 15.35 | 6/30/2032 | $ | 85,248,352 | $ | 55,000,000 | ||||||||||||||||
| 2 | FedEx Ground Package System, Inc. | Savannah | GA | 11/30/18 | 126,520 | 1,755,000 | 13.87 | 10/31/2028 | 27,832,780 | 17,500,000 | ||||||||||||||||||||
| Total as of 6/30/19 | 473,665 | $ | 7,083,000 | $ | 14.95 | $ | 113,081,132 | $ | 72,500,000 | |||||||||||||||||||||
| Acquisitions Subsequent to 6/30/19 | ||||||||||||||||||||||||||||||
| 1 | Toyota Tsusho America, Inc. | Lafayette | IN | 7/26/19 | 350,000 | 1,707,000 | 4.88 | 6/30/2029 | 25,536,000 | 17,000,000 | ||||||||||||||||||||
| Pro Forma Total with Acquisitions Subsequent to 6/30/19 | 823,665 | $ | 8,790,000 | $ | 10.67 | $ | 138,617,132 | $ | 89,500,000 | |||||||||||||||||||||
| | THIRD QUARTER FISCAL YEAR 2019 SUPPLEMENTAL INFORMATION | 19 |
(unaudited)
| No | Tenant | City (MSA) | State | Fiscal Year Acquisition | Occup. | Square Footage | Annual Rent | Rent Per sf Occup. | Lease Exp. Term in Years | Undepreciated Cost | Mortgage Balance | ||||||||||||||||||||||||||||
| 1 | Milwaukee Electric Tool Corporation | Olive Branch (Memphis, TN) | MS | 2013 | 100.0 | % | 861,889 | $ | 3,054,000 | $ | 3.54 | 9.1 | $ | 36,914,917 | $ | 20,374,512 | |||||||||||||||||||||||
| 2 | Shaw Industries, Inc. | Savannah | GA | 2018 | 100.0 | % | 831,764 | 3,495,000 | 4.20 | 8.3 | 56,025,945 | 30,788,426 | |||||||||||||||||||||||||||
| 3 | ULTA, Inc. | Greenwood (Indianapolis) | IN | 2015 | 100.0 | % | 671,354 | 2,729,000 | 4.06 | 6.1 | 37,512,071 | 19,129,908 | |||||||||||||||||||||||||||
| 4 | Jim Beam Brands Company (Beam Suntory) | Frankfort (Lexington) | KY | 2015 | 100.0 | % | 599,840 | 2,071,000 | 3.45 | 5.6 | 28,000,000 | 15,918,028 | |||||||||||||||||||||||||||
| 5 | TreeHouse Private Brands, Inc. | Buckner (Louisville) | KY | 2014 | 100.0 | % | 558,600 | 2,226,000 | 3.98 | 14.3 | 26,807,852 | 14,754,183 | |||||||||||||||||||||||||||
| 6 | FedEx Trade Networks, Inc. | Memphis | TN | 2010 | 100.0 | % | 449,900 | 1,389,000 | 3.09 | 9.9 | 15,246,877 | 4,420,741 | |||||||||||||||||||||||||||
| 7 | B. Braun Medical Inc. | Daytona Beach | FL | 2018 | 100.0 | % | 399,440 | 2,138,000 | 5.35 | 8.8 | 30,008,069 | 18,469,060 | |||||||||||||||||||||||||||
| 8 | UGN, Inc. | Monroe (Cincinnati) | OH | 2015 | 100.0 | % | 387,000 | 2,076,000 | 5.36 | 14.7 | 21,576,756 | 6,753,023 | |||||||||||||||||||||||||||
| 9 | Woodstream Corporation | St. Joseph | MO | 2001 | 100.0 | % | 256,000 | 920,000 | 3.59 | 2.3 | 8,935,160 | -0- | |||||||||||||||||||||||||||
| Altec Industries, Inc. | St. Joseph | MO | 2001 | 100.0 | % | 126,880 | 374,000 | 2.95 | 3.7 | 4,428,488 | -0- | ||||||||||||||||||||||||||||
| 10 | CBOCS Distribution, Inc. (Cracker Barrel) | Lebanon (Nashville) | TN | 2011 | 100.0 | % | 381,240 | 1,461,000 | 3.83 | 5.0 | 14,215,126 | -0- | |||||||||||||||||||||||||||
| 11 | FedEx Ground Package System, Inc. | Braselton (Atlanta) | GA | 2018 | 100.0 | % | 373,750 | 3,783,000 | 10.12 | 13.7 | 60,227,126 | 38,396,318 | |||||||||||||||||||||||||||
| 12 | Best Buy Warehousing Logistics, Inc. | Streetsboro (Cleveland) | OH | 2012 | 100.0 | % | 368,060 | 1,693,000 | 4.60 | 2.6 | 19,600,000 | 8,838,337 | |||||||||||||||||||||||||||
| 13 | Amazon.com Services, Inc. (Amazon.com, Inc.) | Mobile | AL | 2018 | 100.0 | % | 362,942 | 2,025,000 | 5.58 | 9.4 | 33,052,316 | 18,063,719 | |||||||||||||||||||||||||||
| 14 | FedEx Ground Package System, Inc. | Concord (Charlotte) | NC | 2017 | 100.0 | % | 354,482 | 2,537,000 | 7.16 | 12.9 | 40,043,145 | 23,839,465 | |||||||||||||||||||||||||||
| 15 | FedEx Ground Package System, Inc. | Mesquite (Dallas) | TX | 2017 | 100.0 | % | 351,874 | 3,199,000 | 9.09 | 12.8 | 49,880,493 | 29,616,283 | |||||||||||||||||||||||||||
| 16 | FedEx Ground Package System, Inc. | Trenton | NJ | 2019 | 100.0 | % | 347,145 | 5,328,000 | 15.35 | 13.0 | 83,987,622 | 53,436,023 | |||||||||||||||||||||||||||
| 17 | FedEx Ground Package System, Inc. | Walker (Grand Rapids) | MI | 2017 | 100.0 | % | 343,483 | 2,103,000 | 6.12 | 12.6 | 31,654,987 | 18,645,080 | |||||||||||||||||||||||||||
| 18 | FedEx Ground Package System, Inc. | Hamburg (Buffalo) | NY | 2017 | 100.0 | % | 338,584 | 2,318,000 | 6.85 | 11.8 | 35,093,700 | 20,393,256 | |||||||||||||||||||||||||||
| 19 | FedEx Ground Package System, Inc. | Concord (Charlotte) | NC | 2016 | 100.0 | % | 330,717 | 2,237,000 | 6.76 | 6.1 | 33,044,797 | 16,948,172 | |||||||||||||||||||||||||||
| 20 | FedEx Ground Package System, Inc. | Indianapolis | IN | 2014 | 100.0 | % | 327,822 | 1,717,000 | 5.24 | 8.3 | 25,504,083 | �� | 9,703,411 | ||||||||||||||||||||||||||
| 21 | Autoneum North America, Inc. | (C) | Aiken (Augusta, GA) | SC | 2017 | 100.0 | % | 315,560 | 1,717,000 | 5.44 | 12.8 | 21,040,395 | 13,882,991 | ||||||||||||||||||||||||||
| 22 | FedEx Ground Package System, Inc. | Olathe (Kansas City) | KS | 2016 | 100.0 | % | 313,763 | 2,204,000 | 7.02 | 11.9 | 31,737,000 | 19,062,960 | |||||||||||||||||||||||||||
| 23 | FedEx Ground Package System, Inc. | Davenport (Orlando) | FL | 2016 | 100.0 | % | 310,922 | 2,613,000 | 8.40 | 11.8 | 37,780,000 | 22,636,264 | |||||||||||||||||||||||||||
| 24 | FedEx Ground Package System, Inc. | Ft. Worth (Dallas) | TX | 2015 | 100.0 | % | 304,608 | 2,379,000 | 7.81 | 10.8 | 35,300,832 | 19,699,804 | |||||||||||||||||||||||||||
| 25 | Science Applications International Corporation | Hanahan (Charleston) | SC | 2005 | 100.0 | % | 302,400 | 1,655,000 | 5.47 | 4.3 | 13,829,273 | -0- | |||||||||||||||||||||||||||
| 26 | Amazon.com Services, Inc. (Amazon.com, Inc.) | Oklahoma City | OK | 2018 | 100.0 | % | 300,000 | 1,902,000 | 6.34 | 8.3 | 29,878,942 | 18,410,981 | |||||||||||||||||||||||||||
| 27 | International Paper Company | Kenton | OH | 2017 | 100.0 | % | 298,472 | 1,256,000 | 4.21 | 8.2 | 18,730,500 | 11,026,284 | |||||||||||||||||||||||||||
| 28 | FedEx Ground Package System, Inc. | Jacksonville | FL | 2015 | 100.0 | % | 297,579 | 1,998,000 | 6.71 | 10.5 | 30,740,202 | 15,369,513 | |||||||||||||||||||||||||||
| 29 | Western Container Corp. (Coca-Cola) | Tolleson (Phoenix) | AZ | 2003 | 100.0 | % | 283,358 | 1,377,000 | 4.86 | 7.8 | 16,824,226 | 3,094,463 | |||||||||||||||||||||||||||
| 30 | International Paper Company | Edwardsville (Kansas City) | KS | 2014 | 100.0 | % | 280,000 | 1,359,000 | 4.85 | 4.2 | 18,294,108 | 8,615,865 | |||||||||||||||||||||||||||
| 31 | FedEx Ground Package System, Inc. | Charleston | SC | 2018 | 100.0 | % | 265,318 | 2,704,000 | 10.19 | 14.0 | 46,576,380 | 28,737,589 | |||||||||||||||||||||||||||
| 32 | NF&M International, Inc. | Monaca (Pittsburgh) | PA | 1988 | 68.4 | % | 255,658 | 837,000 | 4.79 | 5.5 | 7,910,666 | -0- | |||||||||||||||||||||||||||
| 33 | FedEx Ground Package System, Inc. | Orion | MI | 2007 | 100.0 | % | 245,633 | 1,908,000 | 7.77 | 4.0 | 22,890,124 | -0- | |||||||||||||||||||||||||||
| 34 | FedEx Ground Package System, Inc. | Homestead (Miami) | FL | 2017 | 100.0 | % | 237,756 | 2,282,000 | 9.60 | 12.8 | 37,911,556 | 22,324,736 | |||||||||||||||||||||||||||
| 35 | Anda Pharmaceuticals, Inc. | Olive Branch (Memphis, TN) | MS | 2012 | 100.0 | % | 234,660 | 1,210,000 | 5.16 | 3.1 | 14,550,000 | 7,089,238 | |||||||||||||||||||||||||||
| 36 | FedEx Ground Package System, Inc. | Colorado Springs | CO | 2016 | 100.0 | % | 225,362 | 1,832,000 | 8.13 | 6.6 | 29,320,066 | 15,890,468 | |||||||||||||||||||||||||||
| 37 | Mickey Thompson Performance Tires and Wheels (Cooper Tire) | Stow | OH | 2017 | 100.0 | % | 219,765 | 1,511,000 | 6.88 | 8.2 | 18,934,065 | 11,647,817 | |||||||||||||||||||||||||||
| 38 | Rinnai America Corporation | Griffin (Atlanta) | GA | 2006 | 100.0 | % | 218,120 | 840,000 | 3.85 | 1.5 | 15,061,573 | -0- | |||||||||||||||||||||||||||
| 39 | FedEx Ground Package System, Inc. | Ft. Myers | FL | 2017 | 100.0 | % | 213,672 | 1,418,000 | 6.64 | 8.2 | 21,663,635 | 12,705,334 | |||||||||||||||||||||||||||
| 40 | FedEx Ground Package System, Inc. | Burlington (Seattle/Everett) | WA | 2016 | 100.0 | % | 210,445 | 1,962,000 | 9.32 | 11.2 | 30,320,686 | 16,919,687 | |||||||||||||||||||||||||||
| 41 | FedEx Ground Package System, Inc. | Sauget (St. Louis, MO) | IL | 2015 | 100.0 | % | 198,773 | 1,036,000 | 5.21 | 9.9 | 15,204,950 | 8,110,757 | |||||||||||||||||||||||||||
| 42 | Anheuser-Busch, Inc. | Granite City (St. Louis, MO) | IL | 2001 | 100.0 | % | 184,800 | 832,000 | 4.50 | 2.4 | 12,697,848 | -0- | |||||||||||||||||||||||||||
| 43 | Carrier Enterprise, LLC (United Technologies) | Carrollton (Dallas) | TX | 2010 | 100.0 | % | 184,317 | 1,178,000 | 6.39 | 4.6 | 17,900,735 | 5,836,756 | |||||||||||||||||||||||||||
| 44 | FedEx Ground Package System, Inc. | Spring (Houston) | TX | 2014 | 100.0 | % | 181,176 | 1,581,000 | 8.73 | 5.3 | 19,316,604 | 7,448,730 | |||||||||||||||||||||||||||
| 45 | Carlisle Tire & Wheel Company | Edwardsville (Kansas City) | KS | 2003 | 100.0 | % | 179,280 | 761,000 | 4.24 | 4.1 | 7,232,986 | -0- | |||||||||||||||||||||||||||
| 46 | FedEx Ground Package System, Inc. | Ft. Mill (Charlotte, NC) | SC | 2010 | 100.0 | % | 176,939 | 1,598,000 | 9.03 | 9.2 | 17,063,643 | 228,870 | |||||||||||||||||||||||||||
| 47 | FedEx Ground Package System, Inc. | Covington (New Orleans) | LA | 2016 | 100.0 | % | 175,315 | 1,265,000 | 7.22 | 6.0 | 18,425,875 | 10,604,763 | |||||||||||||||||||||||||||
| 48 | FedEx Ground Package System, Inc. | Livonia (Detroit) | MI | 2013 | 100.0 | % | 172,005 | 1,194,000 | 6.94 | 2.8 | 13,879,697 | 5,812,752 | |||||||||||||||||||||||||||
| 49 | Home Depot USA, Inc. | Montgomery (Chicago) | IL | 2004 | 100.0 | % | 171,200 | 1,007,000 | 5.88 | 1.0 | 11,303,317 | -0- | |||||||||||||||||||||||||||
| 50 | FedEx Ground Package System, Inc. | Tampa | FL | 2004 | 100.0 | % | 170,779 | 1,624,000 | 9.51 | 7.1 | 19,701,575 | -0- | |||||||||||||||||||||||||||
| | THIRD QUARTER FISCAL YEAR 2019 SUPPLEMENTAL INFORMATION | 20 |
Property Table
(unaudited)
| No | Tenant | City (MSA) | State | Fiscal Year Acquisition | Occup. | Square Footage | Annual Rent | Rent Per sf Occup. | Lease Exp. Term in Years | Undepreciated Cost | Mortgage Balance | ||||||||||||||||||||||||||||
| 51 | FedEx Ground Package System, Inc. | Edinburg | TX | 2011 | 100.0 | % | 164,207 | $ | 1,097,000 | $ | 6.68 | 7.3 | $ | 12,039,014 | $ | -0- | |||||||||||||||||||||||
| 52 | FedEx Ground Package System, Inc. | Lindale (Tyler) | TX | 2015 | 100.0 | % | 163,378 | 725,000 | 4.44 | 5.0 | 9,965,550 | 5,342,835 | |||||||||||||||||||||||||||
| 53 | Bunzl Distribution Midcentral, Inc. | Kansas City | MO | 2015 | 100.0 | % | 158,417 | 758,000 | 4.78 | 2.3 | 10,003,235 | 6,501,338 | |||||||||||||||||||||||||||
| 54 | FedEx Ground Package System, Inc. | Oklahoma City | OK | 2012 | 100.0 | % | 158,340 | 1,048,000 | 6.62 | 6.0 | 12,584,462 | 3,023,810 | |||||||||||||||||||||||||||
| 55 | FedEx Ground Package System, Inc. | Waco | TX | 2012 | 100.0 | % | 150,710 | 1,078,000 | 7.15 | 6.2 | 12,551,368 | 4,008,648 | |||||||||||||||||||||||||||
| 56 | FedEx Ground Package System, Inc. | Beltsville (Washington, DC) | MD | 2001 | 100.0 | % | 148,881 | 1,455,000 | 9.77 | 9.1 | 14,512,355 | -0- | |||||||||||||||||||||||||||
| 57 | Victory Packaging, L.P. | Fayetteville | NC | 1997 | 100.0 | % | 148,000 | 508,000 | 3.43 | 1.7 | 5,455,379 | -0- | |||||||||||||||||||||||||||
| 58 | FedEx Ground Package System, Inc. | El Paso | TX | 2006 | 100.0 | % | 144,149 | 1,345,000 | 9.33 | 4.3 | 12,431,192 | -0- | |||||||||||||||||||||||||||
| 59 | FedEx Ground Package System, Inc. | Cocoa | FL | 2008 | 100.0 | % | 144,138 | 1,112,000 | 7.71 | 5.3 | 14,127,449 | -0- | |||||||||||||||||||||||||||
| 60 | FedEx Ground Package System, Inc. | Cudahy (Milwaukee) | WI | 2001 | 100.0 | % | 139,564 | 827,000 | 5.93 | 8.0 | 9,772,720 | -0- | |||||||||||||||||||||||||||
| 61 | Challenger Lifts, Inc. (Snap-On Inc.) | Louisville | KY | 2016 | 100.0 | % | 137,500 | 845,000 | 6.15 | 6.9 | 11,304,000 | 6,223,698 | |||||||||||||||||||||||||||
| 62 | FedEx Ground Package System, Inc. | Richfield (Cleveland) | OH | 2006 | 100.0 | % | 131,152 | 1,493,000 | 11.38 | 5.3 | 16,447,178 | -0- | |||||||||||||||||||||||||||
| 63 | FedEx Ground Package System, Inc. | Savannah | GA | 2019 | 100.0 | % | 126,520 | 1,755,000 | 13.87 | 9.3 | 27,531,560 | 17,083,310 | |||||||||||||||||||||||||||
| 64 | General Electric Company | Imperial (Pittsburgh) | PA | 2016 | 100.0 | % | 125,860 | 1,328,000 | 10.55 | 6.5 | 19,964,283 | 10,608,104 | |||||||||||||||||||||||||||
| 65 | FedEx Ground Package System, Inc. | Wheeling (Chicago) | IL | 2003 | 100.0 | % | 123,000 | 1,272,000 | 10.34 | 7.9 | 18,992,949 | -0- | |||||||||||||||||||||||||||
| 66 | FedEx Ground Package System, Inc. | Altoona | PA | 2014 | 100.0 | % | 122,522 | 651,000 | 5.31 | 4.2 | 9,026,916 | 2,950,732 | |||||||||||||||||||||||||||
| 67 | FedEx Corporation | Charleston | SC | 2018 | 100.0 | % | 121,683 | 1,314,000 | 10.80 | 13.2 | 21,519,412 | 13,149,632 | |||||||||||||||||||||||||||
| 68 | FedEx Corporation | Mechanicsville (Richmond) | VA | 2001 | 100.0 | % | 112,799 | 541,000 | 4.80 | 3.8 | 7,806,645 | -0- | |||||||||||||||||||||||||||
| 69 | FedEx Corporation | Orlando | FL | 2008 | 100.0 | % | 110,638 | 666,000 | 6.02 | 8.4 | 8,774,524 | -0- | |||||||||||||||||||||||||||
| 70 | Bunzl Distribution Oklahoma, Inc. | Oklahoma City | OK | 2017 | 100.0 | % | 110,361 | 729,000 | 6.61 | 5.2 | 8,728,439 | 5,228,999 | |||||||||||||||||||||||||||
| 71 | Style Crest, Inc. | Winston-Salem | NC | 2002 | 100.0 | % | 106,507 | 392,000 | 3.68 | 1.8 | 7,246,325 | -0- | |||||||||||||||||||||||||||
| 72 | FedEx Ground Package System, Inc. | Cheektowaga (Buffalo) | NY | 2000 | 100.0 | % | 104,981 | 966,000 | 9.20 | 0.2 | 10,960,823 | -0- | |||||||||||||||||||||||||||
| 73 | FedEx Ground Package System, Inc. | West Chester Twp. (Cincinnati) | OH | 1999 | 100.0 | % | 103,818 | 548,000 | 5.28 | 4.2 | 5,733,686 | -0- | |||||||||||||||||||||||||||
| 74 | FedEx Ground Package System, Inc. | Roanoke | VA | 2013 | 100.0 | % | 103,402 | 755,000 | 7.30 | 3.8 | 10,200,000 | 4,029,220 | |||||||||||||||||||||||||||
| 75 | Pittsburgh Glass Works, LLC | O’ Fallon (St. Louis) | MO | 1994 | 100.0 | % | 102,135 | 447,000 | 4.38 | 2.0 | 4,245,913 | -0- | |||||||||||||||||||||||||||
| 76 | FedEx Ground Package System, Inc. | Green Bay | WI | 2013 | 100.0 | % | 99,102 | 468,000 | 4.72 | 3.9 | 6,570,000 | 2,394,877 | |||||||||||||||||||||||||||
| 77 | Dakota Bodies, LLC | Liberty (Kansas City) | MO | 1998 | 100.0 | % | 96,687 | 407,000 | 4.21 | 6.8 | 7,410,296 | -0- | |||||||||||||||||||||||||||
| 78 | FedEx Corporation | Jacksonville | FL | 1999 | 100.0 | % | 95,883 | 535,000 | 5.58 | 9.9 | 6,584,384 | -0- | |||||||||||||||||||||||||||
| 79 | FedEx Corporation | Tampa | FL | 2006 | 100.0 | % | 95,662 | 603,000 | 6.30 | 8.4 | 7,865,007 | -0- | |||||||||||||||||||||||||||
| 80 | Vacant | (B) | Hanahan (Charleston) | SC | 2005 | 0.00 | % | 91,776 | -0- | na | na | 7,646,203 | -0- | ||||||||||||||||||||||||||
| 81 | National Oilwell Varco, Inc. | Houston | TX | 2010 | 100.0 | % | 91,295 | 759,000 | 8.31 | 3.3 | 8,163,278 | 1,772,641 | |||||||||||||||||||||||||||
| 82 | FedEx Corporation | Omaha | NE | 1999 | 100.0 | % | 89,115 | 446,000 | 5.00 | 4.3 | 5,963,626 | -0- | |||||||||||||||||||||||||||
| 83 | Joseph T. Ryerson and Son, Inc. | Elgin (Chicago) | IL | 2002 | 100.0 | % | 89,052 | 513,000 | 5.76 | 5.6 | 6,977,442 | -0- | |||||||||||||||||||||||||||
| 84 | FedEx Ground Package System, Inc. | Huntsville | AL | 2005 | 100.0 | % | 88,653 | 605,000 | 6.82 | 7.1 | 6,661,819 | 199,237 | |||||||||||||||||||||||||||
| 85 | CHEP USA, Inc. | Roanoke | VA | 2007 | 100.0 | % | 83,000 | 503,000 | 6.06 | 5.7 | 7,463,672 | -0- | |||||||||||||||||||||||||||
| 86 | FedEx Corporation | Bedford Heights (Cleveland) | OH | 2007 | 100.0 | % | 82,269 | 438,000 | 5.32 | 9.2 | 7,298,167 | -0- | |||||||||||||||||||||||||||
| 87 | RGH Enterprises, Inc. (Cardinal Health) | Halfmoon (Albany) | NY | 2012 | 100.0 | % | 75,000 | 613,000 | 8.17 | 2.4 | 5,525,600 | -0- | |||||||||||||||||||||||||||
| 88 | FedEx Corporation | Schaumburg (Chicago) | IL | 1997 | 100.0 | % | 73,500 | 478,000 | 6.50 | 7.8 | 5,177,940 | -0- | |||||||||||||||||||||||||||
| 89 | FedEx Corporation | Romulus (Detroit) | MI | 1998 | 100.0 | % | 71,933 | 370,000 | 5.14 | 1.9 | 4,946,435 | -0- | |||||||||||||||||||||||||||
| 90 | FedEx Ground Package System, Inc. | Denver | CO | 2005 | 100.0 | % | 69,865 | 609,000 | 8.72 | 6.3 | 6,363,581 | 151,071 | |||||||||||||||||||||||||||
| 91 | Tampa Bay Grand Prix | Tampa | FL | 2005 | 100.0 | % | 68,385 | 302,000 | 4.42 | 1.3 | 5,677,982 | -0- | |||||||||||||||||||||||||||
| 92 | Sherwin-Williams Company | Rockford | IL | 2011 | 100.0 | % | 66,387 | 485,000 | 7.31 | 4.5 | 5,551,227 | -0- | |||||||||||||||||||||||||||
| 93 | Various Tenants at Retail Shopping Center | Somerset | NJ | 1970 | 97.0 | % | 64,220 | 778,000 | 12.46 | na | 3,129,208 | -0- | |||||||||||||||||||||||||||
| 94 | Keurig Dr Pepper | Cincinnati | OH | 2015 | 100.0 | % | 63,840 | 484,000 | 7.58 | 10.3 | 6,750,000 | -0- | |||||||||||||||||||||||||||
| 95 | FedEx Corporation | Chattanooga | TN | 2007 | 100.0 | % | 60,637 | 319,000 | 5.26 | 3.3 | 5,342,537 | -0- | |||||||||||||||||||||||||||
| 96 | SOFIVE, Inc. | Carlstadt (New York, NY) | NJ | 2001 | 100.0 | % | 60,400 | 623,000 | 10.31 | 10.6 | 5,296,752 | 1,452,067 | |||||||||||||||||||||||||||
| 97 | FedEx Ground Package System, Inc. | Stewartville (Rochester) | MN | 2013 | 100.0 | % | 60,398 | 372,000 | 6.16 | 3.9 | 5,223,944 | 1,919,182 | |||||||||||||||||||||||||||
| 98 | Vacant | Richmond | VA | 2004 | 0.00 | % | 60,000 | -0- | na | na | 4,902,664 | -0- | |||||||||||||||||||||||||||
| 99 | FedEx Ground Package System, Inc. | Augusta | GA | 2005 | 100.0 | % | 59,358 | 513,000 | 8.64 | 2.0 | 5,363,305 | 162,737 | |||||||||||||||||||||||||||
| 100 | Kellogg Sales Company | Newington (Hartford) | CT | 2001 | 100.0 | % | 54,812 | 329,000 | 6.00 | 0.7 | 3,494,108 | -0- | |||||||||||||||||||||||||||
| | THIRD QUARTER FISCAL YEAR 2019 SUPPLEMENTAL INFORMATION | 21 |
Property Table
(unaudited)
| No | Tenant | City (MSA) | State | Fiscal Year Acquisition | Occup. | Square Footage | Annual Rent | Rent Per sf Occup. | Lease Exp. Term in Years | Undepreciated Cost | Mortgage Balance | |||||||||||||||||||||||||||
| 101 | Siemens Real Estate | Lebanon (Cincinnati) | OH | 2012 | 100.0 | % | 51,130 | $ | 461,000 | $ | 9.02 | 4.8 | $ | 4,452,425 | $ | -0- | ||||||||||||||||||||||
| 102 | FedEx Corporation | Charlottesville | VA | 1999 | 100.0 | % | 48,064 | 329,000 | 6.85 | 8.2 | 4,455,701 | -0- | ||||||||||||||||||||||||||
| 103 | FedEx Ground Package System, Inc. | Corpus Christi | TX | 2012 | 100.0 | % | 46,253 | 436,000 | 9.43 | 2.2 | 4,808,329 | -0- | ||||||||||||||||||||||||||
| 104 | Keurig Dr Pepper | Tulsa | OK | 2014 | 100.0 | % | 46,240 | 264,000 | 5.71 | 4.7 | 3,748,031 | 1,585,930 | ||||||||||||||||||||||||||
| 105 | Heartland Coca-Cola Bottling Company, LLC (Coca-Cola) | Topeka | KS | 2009 | 100.0 | % | 40,000 | 332,000 | 8.30 | 2.3 | 3,679,843 | 654,418 | ||||||||||||||||||||||||||
| 106 | Collins Aerospace Systems (United Technologies) | Rockford | IL | 2015 | 100.0 | % | 38,833 | 365,000 | 9.40 | 8.0 | 5,100,000 | -0- | ||||||||||||||||||||||||||
| 107 | Foundation Building Materials, LLC | Urbandale (Des Moines) | IA | 1994 | 100.0 | % | 36,270 | 176,000 | 4.85 | 8.5 | 2,543,770 | -0- | ||||||||||||||||||||||||||
| 108 | FedEx Corporation | Richland (Jackson) | MS | 1994 | 100.0 | % | 36,000 | 120,000 | 3.33 | 4.8 | 1,900,691 | -0- | ||||||||||||||||||||||||||
| 109 | FedEx Corporation | Punta Gorda | FL | 2007 | 100.0 | % | 34,624 | 284,000 | 8.20 | 8.0 | 4,133,510 | -0- | ||||||||||||||||||||||||||
| 110 | FedEx Corporation | Lakeland | FL | 2006 | 100.0 | % | 32,105 | 155,000 | 4.83 | 8.4 | 2,043,226 | -0- | ||||||||||||||||||||||||||
| 111 | FedEx Corporation | Augusta | GA | 2006 | 100.0 | % | 30,184 | 121,000 | 4.01 | 3.4 | 1,983,529 | -0- | ||||||||||||||||||||||||||
| 112 | Graybar Electric Company | Ridgeland (Jackson) | MS | 1993 | 100.0 | % | 26,340 | 112,000 | 4.25 | 1.1 | 2,311,207 | -0- | ||||||||||||||||||||||||||
| 113 | Sherwin-Williams Company | Burr Ridge (Chicago) | IL | 1997 | 100.0 | % | 12,500 | 162,000 | 12.96 | 2.3 | 1,692,902 | -0- | ||||||||||||||||||||||||||
| Total as of 6/30/19 | 98.9 | % | 21,802,835 | $ | 134,437,000 | $ | 6.23 | 7.8 | $ | 1,839,908,707 | (A) | $ | 742,087,053 | |||||||||||||||||||||||||
| Acquisitions Subsequent to 6/30/19 | ||||||||||||||||||||||||||||||||||||||
| 114 | Toyota Tsusho America, Inc. | Lafayette | IN | 2019 | 100.0 | % | 350,000 | 1,707,000 | 4.88 | 10.0 | ||||||||||||||||||||||||||||
| Pro Forma Total with Acquisitions Subsequent to 6/30/19 | 98.9 | % | 22,152,835 | $ | 136,144,000 | $ | 6.21 | 7.8 | ||||||||||||||||||||||||||||||
| Leasing Activity Subsequent to 6/30/19 | ||||||||||||||||||||||||||||||||||||||
| Amazon.com Services, Inc. (Amazon.com, Inc.) | (B) | Hanahan (Charleston) | SC | 2005 | 100.0 | % | - | 789,000 | 8.60 | 10.0 | ||||||||||||||||||||||||||||
| Autoneum North America, Inc. | (C) | Aiken (Augusta, GA) | SC | 2017 | 100.0 | % | 98,045 | 490,000 | 5.00 | 1.0 | ||||||||||||||||||||||||||||
| Pro Forma Total | 99.4 | % | 22,250,880 | $ | 137,423,000 | $ | 6.22 | 7.8 | ||||||||||||||||||||||||||||||
| (A) | Does not include unamortized debt issuance costs of $7,991,734. | |
| (B) | Effective July 1, 2019, we leased our previously vacant 91,776 square foot facility located in Hanahan (Charleston), SC for ten years to Amazon.com Services, Inc. | |
| (C) | Property located in Aiken (Augusta, GA), SC leased to Autoneum North America, Inc. has a separate 98,045 square foot structure that was not in service. Effective July 1, 2019 this structure was placed in service. |
| | THIRD QUARTER FISCAL YEAR 2019 SUPPLEMENTAL INFORMATION | 22 |
Investors and analysts following the real estate industry utilize funds from operations (“FFO”), adjusted funds from operations (“AFFO”), net operating income (“NOI”), Same Property NOI (GAAP), Same Property NOI (Cash), and earnings before interest, taxes, depreciation and amortization for real estate, (“EBITDAre”) & (“Adjusted EBITDA”) variously defined, as supplemental performance measures. While we believe net income available to common stockholders, as defined by accounting principles generally accepted in the United States of America (U.S. GAAP), is the most appropriate measure, we consider NOI, Same Property NOI (GAAP), Same Property NOI (Cash), EBITDAre, Adjusted EBITDA, FFO and AFFO, given their wide use by and relevance to investors and analysts, appropriate supplemental performance measures. FFO, reflecting the assumption that real estate asset values rise or fall with market conditions, principally adjusts for the effects of U.S. GAAP depreciation and amortization of real estate assets. NOI provides a measure of rental operations, and does not factor in depreciation and amortization and non-property specific expenses such as interest expense and general and administrative expenses. EBITDAre and Adjusted EBITDA provides a tool to further evaluate the ability to incur and service debt and to fund dividends and other cash needs. AFFO provides a supplemental tool to evaluate our performance. In addition, NOI, Same Property NOI (GAAP), Same Property NOI (Cash), EBITDAre, Adjusted EBITDA, FFO and AFFO are commonly used in various ratios, pricing multiples, yields and returns and valuation of calculations used to measure financial position, performance and value. As used herein, we calculate the following non-U.S. GAAP measures as follows:
| ● | FFO, as defined by The National Association of Real Estate Investment Trusts (NAREIT), represents net income attributable to common shareholders, as defined by accounting principles generally accepted in the United States of America (U.S. GAAP), excluding extraordinary items, as defined under U.S. GAAP, gains or losses from sales of previously depreciated real estate assets, impairment charges related to depreciable real estate assets, plus certain non-cash items such as real estate asset depreciation and amortization. Included in the NAREIT FFO White Paper - 2018 Restatement, is an option pertaining to assets incidental to our main business in the calculation of NAREIT FFO to make an election to include or exclude mark-to-market changes in the value recognized on these marketable equity securities. In conjunction with the adoption of the FFO White Paper - 2018 Restatement, for all periods presented, we have elected to exclude unrealized gains and losses from our investments in marketable equity securities from our FFO calculation. Prior to the adoption of the FFO White Paper – 2018 Restatement, we utilized Core FFO, which we defined as FFO, excluding Unrealized Holding Gains or Losses Arising During the Periods. NAREIT created FFO as a non-GAAP supplemental measure of REIT operating performance. | |
| ● | AFFOis calculated as FFO, excluding lease termination income, net gain or loss on sale of securities transactions, stock based compensation expense, depreciation of corporate office tenant improvements, amortization of deferred financing costs, effect of non-cash U.S. GAAP straight-line rent adjustments and less recurring capital expenditures. Recurring capital expenditures are defined as all capital expenditures that are recurring in nature, excluding capital expenditures related to expansions at our current locations or capital expenditures that are incurred in conjunction with obtaining a new lease or a lease renewal. | |
| ● | NOIfrom property operations is calculated as net income attributable to common shareholders, as defined by U.S. GAAP, plus preferred dividends, general & administrative expenses, depreciation, amortization of capitalized lease costs & intangible assets and interest expense, including amortization of financing costs, unrealized holding (gains) or losses arising during the periods, less dividend income, gain on sale of securities transactions, gain on sale of real estate investments, and lease termination income. The components of NOI consist of recurring rental and reimbursement revenue, less real estate taxes and operating expenses, such as insurance, utilities, and repairs and maintenance. | |
| ● | Same Property NOI (GAAP)is calculated as the NOI of all properties owned during the entire periods presented with the exclusion of any properties expanded during the periods presented. | |
| ● | Same Property NOI (Cash)is calculated as the Same Property NOI (GAAP) adjusted to exclude the effect of non-cash U.S. GAAP straight-line rent adjustment for the properties included in the Same Property NOI (GAAP) calculation. | |
| ● | EBITDAre, as defined by NAREIT, is net income attributable to common shareholders, as defined by U.S. GAAP, plus preferred dividends, interest expense, including amortization of financing costs, depreciation and amortization, and plus losses (minus gains) on sales of real estate investments. | |
| ● | Adjusted EBITDA is calculated as EBITDAreplus net amortization of acquired above and below market lease revenue, unrealized holding (gains) or losses arising during the periods and less gains on sale of securities transactions. |
FFO, AFFO, NOI, Same Property NOI (GAAP), Same Property NOI (Cash), EBITDAre and Adjusted EBITDA,do not represent cash generated from operating activities in accordance with U.S. GAAP and are not necessarily indicative of cash available to fund cash needs, including the repayment of principal on debt and payment of dividends and distributions. FFO, AFFO, NOI, Same Property NOI (GAAP), Same Property NOI (Cash), EBITDAre and Adjusted EBITDA should not be considered as substitutes for net income applicable to common shareholders (calculated in accordance with U.S. GAAP) as a measure of results of operations or cash flows (calculated in accordance with U.S. GAAP) as a measure of liquidity. FFO, AFFO, NOI, Same Property NOI (GAAP), Same Property NOI (Cash), EBITDAre and Adjusted EBITDA, as currently calculated by us, may not be comparable to similarly titled, but variously calculated, measures of other REITs.
| | THIRD QUARTER FISCAL YEAR 2019 SUPPLEMENTAL INFORMATION | 23 |
| FOR IMMEDIATE RELEASE | August 1, 2019 | |
| Contact: Susan Jordan | ||
| 732-577-9996 |
MONMOUTH REAL ESTATE REPORTS RESULTS FOR
THE THIRD QUARTER ENDED JUNE 30, 2019
FREEHOLD, NJ, August 1, 2019........ Monmouth Real Estate Investment Corporation (NYSE:MNR) reported Net Loss Attributable to Common Shareholders of $3.1 million or $0.03 per diluted share for the three months ended June 30, 2019 as compared to Net Income Attributable to Common Shareholders of $10.3 million or $0.13 per diluted share for the three months ended June 30, 2018, representing a decrease of $0.16 per share. The large decrease in our net income this quarter was primarily due to the implementation of a new accounting rule requiring that unrealized gains and losses resulting from our securities investments be reflected on our income statement. During the third quarter of fiscal year 2019, we recognized $11.6 million of unrealized losses or $0.12 per diluted share. Prior to the adoption of the rule, unrealized gains and losses were reflected as a change in our shareholders’ equity. During the third quarter of fiscal year 2018, we reported realized gains of $2.1 million or $0.03 per diluted share from the sale of real estate. Excluding all non-cash unrealized losses and realized gains, our Net Income Attributable to Common Shareholders for the three months ended June 30, 2019 would have been $8.5 million or $0.09 per diluted share as compared to $8.2 million or $0.10 per diluted share for the three months ended June 30, 2018, representing a per share decrease of 10%. Funds from Operations (FFO), which excludes unrealized gains or losses from our securities portfolio, for the three months ended June 30, 2019 were $19.9 million or $0.21 per diluted share versus $18.0 million or $0.23 per diluted share for the three months ended June 30, 2018, representing a decrease in FFO per share of 8.7%. Adjusted Funds from Operations (AFFO), which also excludes unrealized and realized gains or losses from our securities portfolio, for the three months ended June 30, 2019 were $19.4 million or $0.21 per diluted share versus $17.3 million or $0.22 per diluted share for the three months ended June 30, 2018, representing a decrease in AFFO per share of 4.5%. These decreases in FFO and AFFO per share were attributable to the impact of our October equity offering of 9.2 million shares combined with additional share issuances pursuant to our DRIP/SIP program, as well as a 70-basis point reduction in our portfolio occupancy rate compared to a year ago.
A summary of significant financial information for the three and nine months ended June 30, 2019 and 2018 (in thousands, except per share amounts) is as follows:
Three Months Ended June 30, | ||||||||
| 2019 | 2018 | |||||||
| Rental Revenue | $ | 33,127 | $ | 29,256 | ||||
| Reimbursement Revenue | $ | 6,345 | $ | 5,480 | ||||
| Net Operating Income (NOI) (1) | $ | 32,731 | $ | 28,789 | ||||
| Total Expenses | $ | 20,646 | $ | 17,611 | ||||
| Dividend Income | $ | 3,686 | $ | 3,628 | ||||
| Gain on Sale of Securities Transactions | $ | -0- | $ | -0- | ||||
| Unrealized Holding Gains (Losses) Arising During the Periods | $ | (11,609 | ) | $ | -0- | |||
| Gain on Sale of Real Estate Investments | $ | -0- | $ | 2,097 | ||||
| Net Income | $ | 1,628 | $ | 14,571 | ||||
| Net Income (Loss) Attributable to Common Shareholders | $ | (3,121 | ) | $ | 10,323 | |||
| Net Income (Loss)Attributable to Common Shareholders Per Diluted Common Share | $ | (0.03 | ) | $ | 0.13 | |||
| FFO (1) | $ | 19,899 | $ | 17,988 | ||||
| FFO per Diluted Common Share (1) | $ | 0.21 | $ | 0.23 | ||||
| AFFO (1) | $ | 19,388 | $ | 17,348 | ||||
| AFFO per Diluted Common Share (1) | $ | 0.21 | $ | 0.22 | ||||
| Dividends Declared per Common Share | $ | 0.17 | $ | 0.17 | ||||
| Weighted Avg. Diluted Common Shares Outstanding | 94,493 | 79,572 | ||||||
Nine Months Ended June 30, | ||||||||
| 2019 | 2018 | |||||||
| Rental Revenue | $ | 98,678 | $ | 85,559 | ||||
| Reimbursement Revenue | $ | 19,247 | $ | 17,002 | ||||
| Lease Termination Income | $ | -0- | $ | 210 | ||||
| Net Operating Income (NOI) (1) | $ | 97,595 | $ | 84,597 | ||||
| Total Expenses | $ | 60,961 | $ | 52,262 | ||||
| Dividend Income | $ | 11,569 | $ | 9,380 | ||||
| Gain on Sale of Securities Transactions | $ | -0- | $ | 111 | ||||
| Unrealized Holding Gains (Losses) Arising During the Periods | $ | (38,668 | ) | $ | -0- | |||
| Gain on Sale of Real Estate Investments | $ | -0- | $ | 7,486 | ||||
| Net Income | $ | 1,986 | $ | 43,846 | ||||
| Net Income (Loss) Attributable to Common Shareholders | $ | (11,664 | ) | $ | 31,033 | |||
| Net Income (Loss) Attributable to Common Shareholders Per Diluted Common Share | $ | (0.13 | ) | $ | 0.40 | |||
| FFO (1) | $ | 60,917 | $ | 51,751 | ||||
| FFO per Diluted Common Share (1) | $ | 0.66 | $ | 0.66 | ||||
| AFFO (1) | $ | 59,583 | $ | 50,667 | ||||
| AFFO per Diluted Common Share (1) | $ | 0.64 | $ | 0.65 | ||||
| Dividends Declared per Common Share | $ | 0.51 | $ | 0.51 | ||||
| Weighted Avg. Diluted Common Shares Outstanding | 92,719 | 78,099 | ||||||
| | THIRD QUARTER FISCAL YEAR 2019 SUPPLEMENTAL INFORMATION | 24 |
A summary of significant balance sheet information as of June 30, 2019 and September 30, 2018 (in thousands) is as follows:
| June 30, 2019 | September 30, 2018 | |||||||
| Real Estate Investments | $ | 1,601,163 | $ | 1,512,513 | ||||
| Securities Available for Sale at Fair Value | $ | 171,040 | $ | 154,921 | ||||
| Total Assets | $ | 1,835,183 | $ | 1,718,378 | ||||
| Fixed Rate Mortgage Notes Payable, net of Unamortized Debt Issuance Costs | $ | 734,095 | $ | 711,546 | ||||
| Loans Payable | $ | 126,187 | $ | 186,609 | ||||
| Total Shareholders’ Equity | $ | 953,772 | $ | 797,906 | ||||
Michael P. Landy, President and CEO, commented on the results for the third quarter of fiscal 2019,
“Our FFO per share decreased by $0.02 or 8.7% and our AFFO per share decreased by $0.01 or 4.5% from the prior year quarter. This decrease was primarily attributable to the timing impact of equity issuance over the past year as well as a 70-basis point reduction in our overall occupancy rate to 98.9% versus the prior year period. Going forward, we expect our recent $25.5 million acquisition leased to Toyota for ten years, our 50-basis point increase in our overall occupancy rate since the quarter end, which was primarily the result of a new 10-year lease with Amazon, as well as our substantial $219.2 million acquisition pipeline to positively contribute to our per share earnings in the ensuing quarters.”
“We are pleased to report continued growth across multiple fronts. During the quarter we:
| ● | Increased our Gross Revenue by 12% over the prior year period to $43.2 million; | |
| ● | Increased our Net Operating income by 14% over the prior year period to $32.7 million; | |
| ● | Increased our gross leasable area (GLA) by 6% over the prior year period to 21.8 million square feet; | |
| ● | Renewed seven and re-leased two of the eleven leases scheduled to expire in Fiscal 2019. These seven lease renewals, along with two properties that were re-tenanted, comprising 1.3 million square feet resulted in a 3.9% weighted-average increase in GAAP rent, and have a weighted-average lease term of 7.4 years; | |
| ● | Maintained a high occupancy rate of 98.9% throughout the quarter; | |
| ● | Increased our overall occupancy rate by 50-basis points to 99.4%, effective July 1, 2019, with the execution of a ten-year lease agreement to Amazon for our 92,000 square foot facility located in Charleston, SC; | |
| ● | Maintained our weighted average lease maturity at 7.8 years over the prior year period; | |
| ● | Increased our annualized average base rent per occupied square foot by 6% to $6.23 from the prior year quarter; | |
| ● | Reduced our weighted average interest rate on our fixed-rate debt by 8 bps to 4.03% over the prior year period; | |
| ● | Maintained our weighted average debt maturity on our fixed-rate debt at 11.5 years; | |
| ● | Reduced our Net Debt to Adjusted EBITDA to 6.2x from 6.4x in the prior quarter; | |
| ● | Raised $16.8 million (including dividend reinvestments of $4.4 million) from our Dividend Reinvestment and Stock Purchase Plan, representing a 27% participation rate; | |
| ● | Raised $12.8 million in net proceeds from our Preferred Stock At-The-Market Sales Program as well as an additional $6.6 million in net proceeds subsequent to the quarter end; and | |
| ● | Subsequent to the quarter end, acquired one brand new Class A property leased for ten-years to Toyota comprising 350,000 square feet, for a cost of $25.5 million.” |
“Our $219.2 million acquisition pipeline currently contains four new build-to-suit properties comprising 1.5 million total square feet. These properties have a weighted-average lease term of 14.5 years, with FedEx representing 50% of the 1.5 million square feet and Amazon representing 40%. In keeping with our business model, these projects are all leased to investment grade tenants. Subsequent to the quarter end, we acquired a brand new 350,000 square foot industrial building for $25.5 million, leased for 10 years to Toyota in Lafayette, IN. Thus far in fiscal 2019, we have acquired three buildings comprising 824,000 square feet for a total purchase price of $138.6 million.”
“Our GAAP leasing spreads this year are up 3.9%, driven by seven lease renewals and two re-tenanted properties, resulting in 7.4 years of weighted-average lease term. At quarter end, our overall weighted-average lease maturity was 7.8 years and our weighted-average debt maturity was 11.5 years. Our Net Debt to Adjusted EBITDA has improved steadily as anticipated and is now at 6.2x which we view as modest leverage given our well-laddered debt and lease maturities. With approximately 80% of our rental revenue derived from investment grade tenants, we expect our portfolio to continue to deliver a very reliable, long-term income stream for our shareholders. Our recent acquisition coupled with our increased occupancy, both of which occurred subsequent to quarter end, combined with our build-to-suit acquisition pipeline, should result in per share earnings accretion going forward.”
Monmouth Real Estate Investment Corporation will host its Third Quarter FY 2019 Financial Results Webcast and Conference Call on Friday, August 2, 2019 at 10:00 a.m. Eastern Time. Senior management will discuss the results, current market conditions and future outlook.
Our Third Quarter FY 2019 financial results being released herein will be available on our website atwww.mreic.reit in the Investor Relations section, under Filings and Reports.
To participate in theWebcast, select the3Q2019 Webcast and Earnings Call “Link to Webcast” on the homepage of our website atwww.mreic.reit, in the Highlights section, which is located towards the bottom of the homepage. Interested parties can also participate viaconference call by calling toll free 1-877-510-5852 (domestically) or 1-412-902-4138 (internationally).
| | THIRD QUARTER FISCAL YEAR 2019 SUPPLEMENTAL INFORMATION | 25 |
The replay of the conference call will be available at 12:00 p.m. Eastern Time on Friday, August 2, 2019. It will be available until November 15, 2019, and can be accessed by dialing toll free 1-877-344-7529 (domestically) and 1-412-317-0088 (internationally) and entering the passcode 10131764. A transcript of the call and the webcast replay will be available at our website on the Investor Relations homepage,www.mreic.reit.
Monmouth Real Estate Investment Corporation, founded in 1968, is one of the oldest public equity REITs in the world. We specialize in single tenant, net-leased industrial properties, subject to long-term leases, primarily to investment-grade tenants. Monmouth Real Estate is a fully integrated and self-managed real estate company, whose property portfolio consists of 114 properties containing a total of approximately 22.3 million rentable square feet, geographically diversified across 30 states. In addition, we own a portfolio of REIT securities.
Certain statements included in this press release which are not historical facts may be deemed forward-looking statements within the meaning of the Private Securities Litigation Reform Act of 1995. Any such forward-looking statements are based on our current expectations and involve various risks and uncertainties. Although we believe the expectations reflected in any forward-looking statements are based on reasonable assumptions, we can provide no assurance those expectations will be achieved. The risks and uncertainties that could cause actual results or events to differ materially from expectations are contained in our annual report on Form 10-K and described from time to time in our other filings with the SEC. We undertake no obligation to publicly update or revise any forward-looking statements whether as a result of new information, future events, or otherwise.
Notes:
(1) Non-U.S. GAAP Information: FFO, as defined by the National Association of Real Estate Investment Trusts (NAREIT), represents net income attributable to common shareholders, as defined by accounting principles generally accepted in the United States of America (U.S. GAAP), excluding extraordinary items, as defined under U.S. GAAP, gains or losses from sales of previously depreciated real estate assets, impairment charges related to depreciable real estate assets, plus certain non-cash items such as real estate asset depreciation and amortization. Included in the NAREIT FFO White Paper - 2018 Restatement, is an option pertaining to assets incidental to our main business in the calculation of NAREIT FFO to make an election to include or exclude mark-to-market changes in the value recognized on these marketable equity securities. In conjunction with the adoption of the FFO White Paper - 2018 Restatement, for all periods presented, we have elected to exclude unrealized gains and losses from our investments in marketable equity securities from our FFO calculation. Prior to the adoption of the FFO White Paper – 2018 Restatement, we utilized Core Funds From Operations (Core FFO), which we defined as FFO, excluding Unrealized Holding Gains or Losses Arising During the Periods. NAREIT created FFO as a non-GAAP supplemental measure of REIT operating performance. We define Adjusted Funds From Operations (AFFO) as FFO, excluding stock based compensation expense, depreciation of corporate office tenant improvements, amortization of deferred financing costs, lease termination income, net gain or loss on sale of securities transactions, effect of non-cash U.S. GAAP straight-line rent adjustments and subtracting recurring capital expenditures. We define recurring capital expenditures as all capital expenditures that are recurring in nature, excluding capital expenditures related to expansions at our current locations or capital expenditures that are incurred in conjunction with obtaining a new lease or a lease renewal. We believe that, as widely recognized measures of performance used by other REITs, FFO and AFFO may be considered by investors as supplemental measures to compare our operating performance to those of other REITs. FFO and AFFO exclude historical cost depreciation as an expense and may facilitate the comparison of REITs which have a different cost basis. However, other REITs may use different methodologies to calculate FFO and AFFO and, accordingly, our FFO and AFFO may not be comparable to all other REITs. The items excluded from FFO and AFFO are significant components in understanding our financial performance.
FFO and AFFO are non-GAAP performance measures and (i) do not represent Cash Flow from Operations as defined by U.S. GAAP; (ii) should not be considered as an alternative to Net Income or Net Income Attributable to Common Shareholders as a measure of operating performance or to Cash Flows from Operating, Investing and Financing Activities; and (iii) are not an alternative to Cash Flows from Operating, Investing and Financing Activities as a measure of liquidity. FFO and AFFO, as calculated by us, may not be comparable to similarly titled measures reported by other REITs.
The following is a reconciliation of the Company’s U.S. GAAP Net Income (Loss) Attributable to Common Shareholders to the Company’s FFO and AFFO for the three and nine months ended June 30, 2019 and 2018 (in thousands):
| Three Months Ended | Nine Months Ended | |||||||||||||||
| 6/30/2019 | 6/30/2018 | 6/30/2019 | 6/30/2018 | |||||||||||||
| Net Income (Loss) Attributable to Common Shareholders (1) | $ | (3,121 | ) | $ | 10,323 | $ | (11,664 | ) | $ | 31,033 | ||||||
| Plus: Unrealized Holding Losses Arising During the Periods (2) | 11,609 | -0- | 38,668 | -0- | ||||||||||||
| Plus: Depreciation Expense (excluding Corporate Office Capitalized Costs) | 10,665 | 9,123 | 31,692 | 26,386 | ||||||||||||
| Plus: Amortization of Intangible Assets | 490 | 417 | 1,495 | 1,158 | ||||||||||||
| Plus: Amortization of Capitalized Lease Costs | 256 | 222 | 726 | 660 | ||||||||||||
| Less: Gain on Sale of Real Estate Investments | -0- | (2,097 | ) | -0- | (7,486 | ) | ||||||||||
| FFO Attributable to Common Shareholders | 19,899 | 17,988 | 60,917 | 51,751 | ||||||||||||
| Plus: Depreciation of Corporate Office Capitalized Costs | 168 | 39 | 376 | 118 | ||||||||||||
| Plus: Stock Compensation Expense | 231 | 97 | 574 | 339 | ||||||||||||
| Plus: Amortization of Financing Costs | 319 | 315 | 956 | 911 | ||||||||||||
| Less: Gain on Sale of Securities Transactions | -0- | -0- | -0- | (111 | ) | |||||||||||
| Less: Lease Termination Income | -0- | -0- | -0- | (210 | ) | |||||||||||
| Less: Recurring Capital Expenditures | (702 | ) | (490 | ) | (1,888 | ) | (774 | ) | ||||||||
| Less: Effect of Non-cash U.S. GAAP Straight-line Rent Adjustment | (527 | ) | (601 | ) | (1,352 | ) | (1,357 | ) | ||||||||
| AFFO Attributable to Common Shareholders | $ | 19,388 | $ | 17,348 | $ | 59,583 | $ | 50,667 | ||||||||
| (1) | Effective October 1, 2018 we adopted ASU 2016-01. This new accounting standard requires unrealized gains or losses on our securities investments to flow through our income statement. Periods shown here prior to October 1, 2018 do not include the effect of this accounting change and therefore Net Income (Loss) Attributable to Common Shareholders between these periods are not comparable. | |
| (2) | Unrealized Holding Gains or Losses Arising During the Periods, if any, were previously reported as an adjustment to Core FFO. |
The following are the Cash Flows provided (used) by Operating, Investing and Financing Activities for the nine months ended June 30, 2019 and 2018 (in thousands):
| Nine Months Ended | ||||||||
| 6/30/2019 | 6/30/2018 | |||||||
| Operating Activities | $ | 75,404 | $ | 63,094 | ||||
| Investing Activities | (185,987 | ) | (216,286 | ) | ||||
| Financing Activities | 114,890 | 149,858 | ||||||
# # # # #
| | THIRD QUARTER FISCAL YEAR 2019 SUPPLEMENTAL INFORMATION | 26 |