EXHIBIT 15.1
Exhibit 15.1 contains the excerpts of TOTAL S.A.'s 2018 Registration Document that are incorporated by reference into this Annual Report on Form 20- F..(1)
(1) Where information has been deleted from TOTAL S.A.'s 2018 Registration Document, such deletion is indicated in this exhibit with a notation that such information has been redacted.
CONTENTS
[REDACTED SECTION: CERTAIN TEXT HAS BEEN REDACTED.]
1
PRESENTATION OF THE GROUP -
INTEGRATED REPORT
1.1 Presentation of the Group and its governance
1.1.1 A major energy player underpinned by stable governance
1.1.1.1 4th largest international oil and gas major with consolidated sales of $209,363 million in 2018
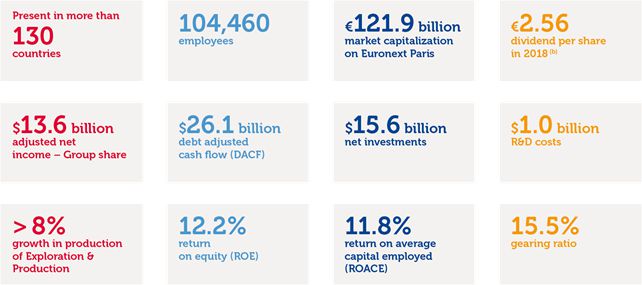
TOTAL, a producer of oil and gas for nearly a century with a presence in more than 130 countries on 5 continents, is a major energy player (1) that produces and markets fuels, natural gas and low-carbon electricity.
The Group’s activities include the exploration and production of oil and gas, refining, petrochemicals and the distribution of energy in various forms to the end customer. More than 104,000 employees are committed to contributing to supply to as many people as possible, a more affordable, more available and cleaner energy.
Energy, an essential resource, accompanies the development of society. In view of the major challenges of today’s world, energy producers have a key role to play.
Thanks to the support provided by its governance and a diverse shareholder base, the Group is able to support its collective ambition to become the responsible energy major.
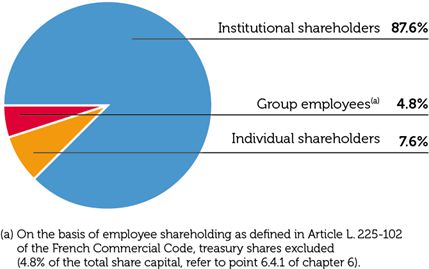
1.1.1.2 A diverse shareholder base
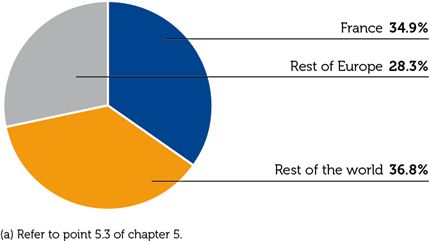
The shareholder base of TOTAL S.A. is diverse and spread throughout the world. It comprises institutional investors, individual shareholders and employee shareholders committed to the Company project. For more information, refer to point 6.4 of chapter 6.
Shareholding structure by shareholder type
Estimates below are as of December 31, 2018, excluding treasury shares, based on the survey of identifiable holders of bearer shares conducted on that date.
Shareholding structure by area
Estimates below are as of December 31, 2018, excluding treasury shares, based on the survey of identifiable holders of bearer shares conducted on that date.

The number of individual and institutional shareholders of TOTAL S.A. is estimated at approximately 450,000.
(1) TOTAL S.A., a French limited liability company (société anonyme), currently constitutes with all the Group’s companies the world’s fourth largest publicly traded integrated oil and gas group based on market capitalization (in dollars) as of December 31, 2018.
1.1.1.3 A Board of Directors that is fully committed and able to determine the Company’s strategic orientations
As of March 13, 2019

(a) Excluding the director representing the employee shareholders and the director representing employees, in accordance with the recommendations of the AFEP-MEDEF Code (point 8.3). For more information, refer to point 4.1.1.4 of chapter 4.
(b) Excluding the director representing employees, in accordance with Article L. 225-27-1 of the French Commercial Code.
The Board of Directors determines the strategic orientations of TOTAL and supervises their implementation. It approves investment and divestment operations when they concern amounts that exceed 3% of the Group’s equity and examines all matters related to the proper running of the Company. It monitors the management of both financial and non-financial matters and ensures the quality of information provided to shareholders and to financial markets.
The Board of Directors relies on the work of four Committees that it has constituted: the Audit Committee, the Governance and Ethics Committee, the Compensation Committee and the Strategy & CSR Committee.
Composed as of March 13, 2019, of 12 directors, including 9 independent members, the Board of Directors reflects diversity and complementarity of experience, expertise, nationalities and cultures necessary to take account of the interests of all the Group’s shareholders and stakeholders.
Since December 2015, Mr. Patrick Pouyanné has held the position of Chairman and Chief Executive Officer of TOTAL S.A. His term of office having been renewed at the General Shareholders’ Meeting on June 1, 2018 for a three-year period, the Board of Directors has reappointed Mr. Pouyanné as Chairman and Chief Executive Officer for an equal period to that of his mandate as a director. The decision to uphold the combined functions of Chairman of the Board of Directors and Chief Executive Officer was made following work undertaken by the Governance and Ethics Committee, in the interest of the Company and in compliance with the traditions of the Group. The Board of Directors deemed that the unified Management Form was most appropriate to the Group’s organization, modus operandi and business, and to the specificities of the oil and gas sector. In its decision, the Board in particular noted the advantage of having unified management in strategic negotiations with States and the Group’s partners. The Board of Directors regularly examines whether maintaining the unified Management Form remains appropriate.
Attentive to the concerns of investors and stakeholders, the Board of Directors pays specific attention to the balance of power within the Group. Consequently, every year, the Board examines desirable changes to its composition to ensure it is maintaining a high level of independence and the full involvement of the directors in the work of the Board and of the Committees. It was also for these reasons that the Board of Directors, at its meeting on December 16, 2015, amended the provisions of its Rules of Procedure to provide for the appointment of a Lead Independent Director in case of the combination of the positions of Chairman of the Board of Directors and Chief Executive Officer. The Lead Independent Director’s duties, resources and rights are described in the Rules of Procedure of the Board of Directors. Aside from these duties, the Chairman and Chief Executive Officer and the Lead Independent Director strive to maintain permanent contact on any important matter concerning the running of the Company.
Since 2016, the Lead Independent Director has organized executive sessions with the independent directors so that they may discuss the Group’s strategic challenges and working practices. The directors are also in regular contact with the members of the Group’s management team, whether members of the Executive Committee during Board Meetings or operational managers during Group site visits. These interactions between directors and managers enable the directors to gain a practical understanding of the Group’s activities.
The balance of power within the Company’s bodies is thereby ensured by a stable and structured governance.
Overview of the Board of Directors
Appendix 3 of the AFEP-MEDEF Code
Personal information | Experience | Position on the Board | Participation in Board Committees | |||||||
Age | Gender | Nationality | Number | Number of directorships held at listed corporations (a) | Independence | Initial date of appointment | Term of office expires | Length of service on the Board | ||
Patrick Pouyanné Chairman and Chief Executive Officer | 55 | M |
| 127,617 | 1 | 2015 | 2021 | 4 | ✔ | |
Patrick Artus | 67 | M |
| 1,000 | 2 | ✔ | 2009 | 2021 | 10 | ✔ |
Patricia Barbizet Lead Independent Director | 63 | F |
| 1,050 | 4 | ✔ | 2008 | 2020 | 11 | ✔ |
Marie-Christine Coisne-Roquette | 62 | F |
| 4,472 | 1 | ✔ | 2011 | 2020 | 8 | ✔ |
Mark Cutifani | 60 | M |
| 2,000 | 1 | ✔ | 2017 | 2020 | 2 | ✔ |
Maria van der Hoeven | 69 | F |
| 1,000 | 2 | ✔ | 2016 | 2019 | 3 | ✔ |
Anne-Marie Idrac | 67 | F |
| 1,250 | 4 | ✔ | 2012 | 2021 | 7 | ✔ |
Gérard Lamarche | 57 | M |
| 3,064 | 4 | ✔ | 2012 | 2019 | 7 | ✔ |
Jean Lemierre | 68 | M |
| 1,042 | 1 | ✔ | 2016 | 2019 | 3 | ✔ |
Renata Perycz Director representing employee shareholders | 55 | F |
| 549 | 0 | n/a | 2016 | 2019 | 3 | ✔ |
Christine Renaud Director representing employees | 50 | F |
| 200 | 0 | n/a | 2017 | 2020 | 2 | ✔ |
Carlos Tavares | 60 | M |
| 1,000 | 2 | ✔ | 2017 | 2020 | 2 | ✔ |
(a) Number of directorships held by the director at listed companies outside his or her group, including foreign companies, assessed in accordance with the recommendations of the AFEP-MEDEF Code, point 18 (refer to point 4.1.1.3 of chapter 4).
Overview of the Committees
As of March 13, 2019
Audit Committee | Governance and | Compensation | Strategy & CSR |
4 members | 4 members | 5 members | 6 members |
100% independent | 100% independent | 100% independent (a) | 80% independent (a) |
Marie-Christine Coisne-Roquette* | Patricia Barbizet* | Gérard Lamarche* | Patrick Pouyanné* |
Patrick Artus | Mark Cutifani | Patricia Barbizet | Patrick Artus |
Maria van der Hoeven | Anne-Marie Idrac | Marie-Christine Coisne-Roquette | Patricia Barbizet |
Gérard Lamarche | Jean Lemierre | Renata Perycz (b) | Anne-Marie Idrac |
Carlos Tavares | Jean Lemierre | ||
Christine Renaud (c) |
(a) Excluding the director representing employee shareholders and the director representing employees, in accordance with the recommendations of the AFEP-MEDEF Code (point 8.3).
(b) Director representing employee shareholders.
(c) Director representing employees.
* Chairperson of the Committee.
Activities of the Board of Directors and of the Committees in 2018

The duties and work of the Board of Directors and of its Committees are described in point 4.1.2 of chapter 4.
1.1.2 The Group in a few figures
1.1.2.1 2018 key figures
As of December 31, 2018 (a)
(a) For a definition of the various performance indicators, refer to the Glossary and to Note 3 to the Consolidated Financial Statements (point 8.7 of chapter 8).
(b) Subject to approval by the Shareholders’ Meeting on May 29, 2019.
1.1.2.2 Key figures by segment
Exploration & Production
Hydrocarbon production
2018 | 2017 | 2016 | |
Combined production (kboe/d) | 2,775 | 2,566 | 2,452 |
Oil (including bitumen) (kb/d) | 1,378 | 1,167 | 1,088 |
Gas (including Condensates and associated NGL) (kboe/d) | 1,397 | 1,399 | 1,364 |
2018 | 2017 | 2016 | |
Combined production (kboe/d) | 2,775 | 2,566 | 2,452 |
Liquids (kb/d) | 1,566 | 1,346 | 1,271 |
Gas (Mcf/d) | 6,599 | 6,662 | 6,447 |
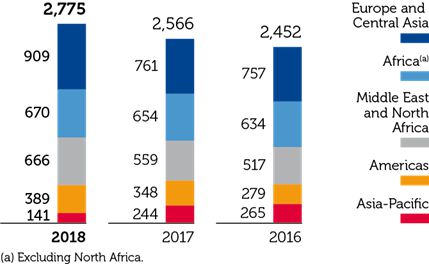
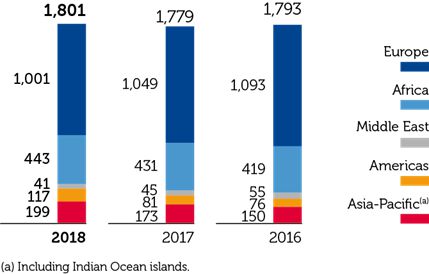
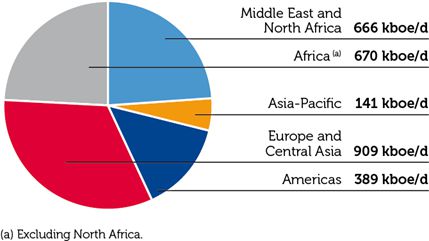
Hydrocarbon production by geographic area (kboe/d)
Hydrocarbon proved reserves (a)
2018 | 2017 | 2016 | |
Hydrocarbon reserves (Mboe) | 12,050 | 11,475 | 11,518 |
Oil (including bitumen) (Mb) | 5,203 | 4,615 | 4,543 |
Gas (including Condensates and associated NGL) (Mboe) | 6,847 | 6,860 | 6,975 |
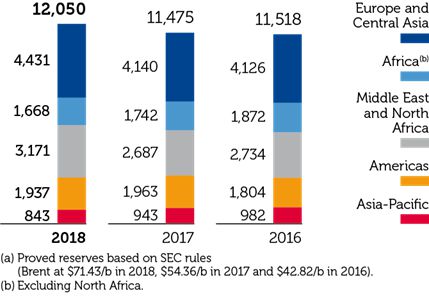
(a) Proved reserves based on SEC rules (Brent at $71.43/b in 2018, $54.36/b in 2017 and $42.82/b in 2016).
2018 | 2017 | 2016 | |
Hydrocarbon reserves (Mboe) | 12,050 | 11,475 | 11,518 |
Liquids (Mb) | 6,049 | 5,450 | 5,414 |
Gas (Mcf) | 32,325 | 32,506 | 32,984 |
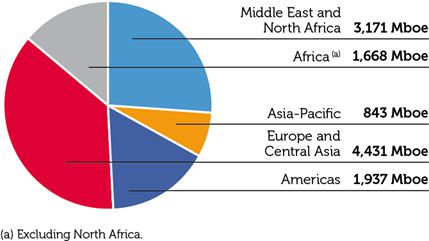
Hydrocarbon proved reserves (a) by geographic areas (Mboe)
Gas, Renewables & Power
Managed LNG volumes (Mt) | 2018 | 2017 | 2016 |
Managed LNG volumes | 21.8 | 15.6 | 12.9 |
Installed power capacities by gas or renewables (a) (GW) | 2018 | 2017 | 2016 |
Installed power capacities by gas or renewables | 2.7 | 0.9 | 0.8 |
(a) Group share.
Refining & Chemicals and Marketing & Services
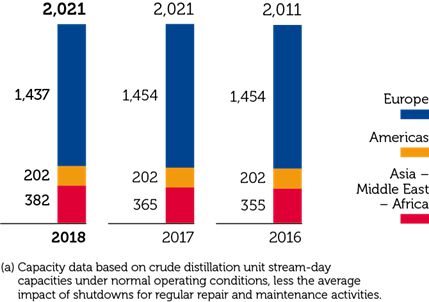
Crude oil refining capacity (a) (kb/d)
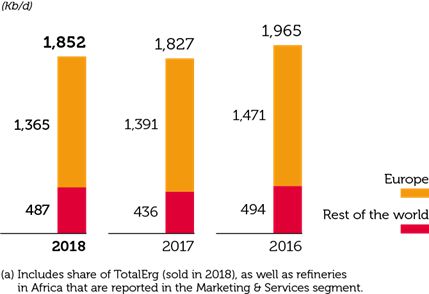
Refinery throughput (a) (kb/d)
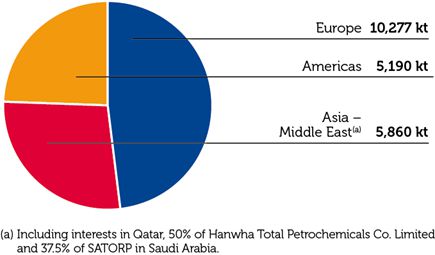
Petrochemicals production capacity by geographic area as of December 31, 2018
Petroleum product sales (kb/d)
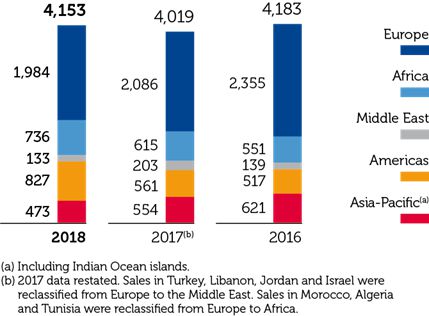
Marketing & Services petroleum product sales by geographic area (kb/d)
1.1.2.3 Workforce
Employees by segment (a)
Workforce as of December 31, 2018: 104,460.
Employees by region (a)
Workforce as of December 31, 2018: 104,460.
1.2 An ambition that goes hand in hand with sustainable growth: "become the responsible energy major"
1.2.1 A collective ambition to meet the challenges facing the energy sector
TOTAL is an integrated energy group and one of the world’s largest. Through its international presence and its activities, TOTAL’s goal is to make its development a vehicle of progress that benefits as many people as possible.
The United Nations, which adopted in 2015 the 17 Sustainable Development Goals (SDGs) originally aimed for States, have called upon corporations’ contribution to collectively find solutions to sustainable development challenges. TOTAL has committed since 2016 to contributing to the SDGs and has endorsed the United Nations’ recommendations (1) and worked on better identifying the scope of its contribution to the SDGs.
Through its activities, the Group is concerned by all of the SDGs. However, TOTAL has identified certain SDGs as those on which it can have the most significant contribution, such as decent work and human rights, climate change and access to energy.
Access to energy is a source of progress and the condition for economic and social development as well as for the improvement of the standard of living of people around the world. In most countries, and in the developing countries in particular, access to low-cost energy is thus a priority.
The Group’s vocation is to produce the energy that the world needs, and will need in the future, and to make it accessible to as many people as possible. This is a real challenge; close to one billion individuals (2) still have no access to electricity.
This vocation is to be accomplished in a responsible manner and by working to make an effective contribution to the climate change challenge, in particular.
Meeting the energy needs of a growing global population, providing tangible solutions to contribute limiting global warming, adapting to new patterns of energy production and consumption and changes to the expectations of customers and stakeholders constitute the challenges that a major energy player like TOTAL can help to tackle.
To meet these challenges, TOTAL’s ambition is to become the responsible energy major by contributing to supply to as many people as possible a more affordable, more available and cleaner energy:
-more affordable - as low-cost energy is essential to favor the economic development of billions of people who seek to improve their living conditions;
-more available - as people expect energy to be continuously available and accessible on a daily basis;
-cleaner - as the Group aims to both reduce the environmental footprint and the CO2 emissions of its operations, and to actively contribute to finding solutions to limit the impact of climate change, particularly by providing its customers with a mix of energy products whose carbon intensity is expected to decrease regularly.
1.2.2 A clear strategy for sustainable growth
To fulfill this ambition, TOTAL implements a clear strategy that is based on four main priorities and that integrates the challenges of climate change:
-drive profitable and sustainable growth in Exploration & Production activities, with priority given to the production of gas in particular of liquefied natural gas (the fossil fuel that emits the least amount of carbon dioxide) and constant concern on producing at a competitive cost by ensuring strict investment discipline;
-further develop the competitiveness of the large integrated refining and petrochemical platforms and expand sustainable biofuels and recycling activities;
-increase the distribution of petroleum products, particularly in high-growing regions, and offer innovative solutions and services that meet the needs of customers above and beyond the supply of petroleum products; and
(1) According to SDG Compass: Understanding the SDGs, defining priorities, setting goals, integrating, reporting and communicating.
(2) Source: Energy Access Outlook 2018 published by the International Energy Agency (IEA).
-expand along the full gas value chain by unlocking access to new markets and boost profitable growth in the low carbon electricity businesses, from production based on gas and renewable energies to electricity and gas distribution to end customers.
In addition, TOTAL intends to promote a better use of natural resources by supporting the circular economy, and implement a program of actions, particularly in the following areas: waste management, new ranges of polymers, solarization of service stations, improved efficiency energy and purchasing.
1.3 Advantages that allow the Group to stand out in a changing energy world
To become the responsible energy major and to help provide specific solutions to major challenges that are to come over the next decades, TOTAL can rely on several advantages: its strong identity and values, the know-how of employees committed to better energy, its integrated business model and its geographic presence.
1.3.1 A long-standing energy player that draws on its strong identity
Energy is rooted in TOTAL’s history.
A producer of oil and gas for almost a century, the Group’s history started in 1924 with the creation of Compagnie française des Pétroles (CFP), which began its oil production activities in the Middle East at this time. Over the years, the Group has diversified its activities and opened sites around the world by positioning itself in the gas, refining and petrochemical segments and the distribution of petroleum products, solar power, sustainable biofuels and electricity.
1.3.1.1 Key dates in the Group’s history
1920 | Creation in Brussels by an Antwerp-based group of bankers and investors of Compagnie Financière belge des Pétroles, known as PetroFina |
1924 | Creation of Compagnie française des Pétroles (CFP) by Raymond Poincaré, French Prime Minister |
1927 | Initial discovery of the Kirkuk field in Iraq; the field’s reserves are considerable |
1933 | Commissioning of the Gonfreville refinery in Normandy (France) with an annual capacity of 900,000 t of crude oil |
1939 | Discovery in France of the Saint Marcet gas field by Centre de recherches de pétrole du Midi Creation of Régie Autonome des Pétroles (RAP), which later became the Elf Group |
1941 | Creation of Société nationale des pétroles d’Aquitaine (SNPA) |
1945 | Creation of Bureau de recherches de pétroles (BRP) |
1947 | Creation of Compagnie française de Distribution des Pétroles en Afrique |
1951 | Discovery of the Lacq gas field (France) by SNPA |
1954 | Launch of the TOTAL brand by CFP |
1956 | Discovery of the Edjeleh, Hassi R’Mel (gas) and Hassi Messaoud (oil) fields in the Algerian Sahara |
1960 | Construction of the Gonfreville steam cracker (France) to respond to the growing demand for plastic |
1961 | Discovery of the first offshore fields in Gabon; the Anguille field was the first one found |
1965 | TOTAL acquires Desmarais Frères, an important player in the distribution market |
1966 | Creation of Entreprise de recherches et d’activités pétrolières (ERAP) following the merger of BRP and RAP |
1967 | Launch of the ELF brand |
1970 | Elf takes control of Antar |
1971 | The Ekofisk field in the North Sea starts production Creation of GIE ATO, a joint-venture between SNPA and TOTAL in the chemicals industry |
1974 | Hutchinson-Mapa joins the Group |
1976 | Creation of Société nationale Elf Aquitaine (SNEA) following the merger of ERAP and SNPA |
1980 | Creation of Chloé Chimie, a joint-venture between Elf Aquitaine, CFP and Rhône Poulenc |
1982 | Drilling by CFP of the first deep-offshore well in the Mediterranean Sea |
1983 | Birth of the company Atochem, an SNEA subsidiary, following the merger of ATO Chimie, Chloé Chimie and a part of Péchiney Ugine Kuhlmann Opening of the first self-service station in France |
1985 | CFP becomes Total-CFP and then TOTAL in 1991 |
1994 | Disposal by the French state of its majority stake in the capital of Elf Aquitaine |
1996 | Disposal by the French state of its remaining stake in the capital of Elf Aquitaine |
2000 | Following the incorporation of Fina in 1999, TOTAL acquires Elf Aquitaine. The new Group is called TotalFinaElf and is the world’s 4th largest oil major |
2001 | The Girassol field on Block 17 in Angola starts production |
2003 | TotalFinaElf changes its name to TOTAL |
2006 | Spin-off of Arkema |
2011 | Investment in the solar energy segment with the acquisition of 60% of the US company, SunPower |
2016 | Acquisition of Saft Groupe, a battery manufacturer, and of Belgian company Lampiris, a supplier of green electricity and natural gas |
2017 | Announcement of the acquisition of Mærsk Oil & Gas A/S in a share and debt transaction Announcement of the acquisition of Engie’s LNG business |
2018 | Acquisition of Direct Énergie, electricity producer and distributor |
1.3.1.2 Five strong values at the heart of the Group
Safety, Respect for Each Other, Pioneer Spirit, Stand Together and Performance-Minded represent, just as its history, the part of TOTAL’s identity shared by all employees. These values guide the daily actions and relations of the Group with its stakeholders.
"These values describe and unite us. They are the levers on which we rely to achieve our ambition of becoming the responsible energy major."
Patrick Pouyanné, Chairman and Chief Executive Officer
These five strong values also require all of TOTAL’s employees to act in an exemplary manner in priority in the following areas: safety, security, health, environment, integrity in all of its forms (particularly, the prevention of corruption, fraud and anti-competitive practices) and human rights.
It is through strict adherence to these values and to this course of action that the Group intends to build strong and sustainable growth for itself and for all of its stakeholders, and thereby deliver on its commitment to better energy.
1.3.2 Employees committed to better energy
As of December 31, 2018

1.3.2.1 Employee diversity, a competitive edge
The Group is an image of its employees: diverse. The diversity of talents within TOTAL is crucial to its competitiveness, innovative capacity and attractiveness.
With over 150 nationalities represented, a presence in over 130 countries, and more than 650 business-related competencies, the Group is a global player. Women make up 35.1% of the workforce and 27.7% of managers. A wide range of opinions and backgrounds enable innovative solutions and new opportunities to arise.
Such diversity is an essential asset for the Group. The capacity of the Group’s employees to mobilize themselves and act in an entrepreneurial spirit is vital. It enables ambitious projects to be completed and offers everyone the opportunity to give meaning to their work and grow professionally.
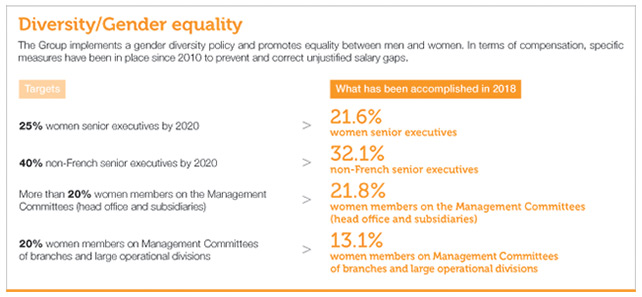
Diversity is embodied, in particular, by the presence of 21.8% women members on the Management Committees (head office and subsidiaries), 52% international members on the subsidiaries’ Management Committees and 24% international members on the head office Management Committees. In order to strengthen the representation of women in governing bodies, the Executive Committee set a goal in late 2018 to reach 20% of women members of Management Commitees of branches and large operational divisions. This reality attests to the Group’s desire to strengthen diversity in all its forms as a vector of innovation and progress. The Diversity policy is promoted by the Diversity Council, which is chaired by a member of the Group’s Executive Committee.
"Women and men are at the heart of our collective project. Our employees - in all corners of the planet and thanks to their individual commitment - are the energy that drives our Group forward. This diversity is an invaluable asset that makes it possible to accomplish ambitious projects."
Namita Shah, President, People & Social Responsibility
1.3.2.2 Employee commitment is essential to the success of the Company project
The Group addresses its challenges thanks to the commitment of its employees. It is for this reason that the Group strives to ensure that the most demanding safety, ethics and integrity, management and social performance practices are implemented wherever it operates. The aim of this process is to create the conditions that enable everyone to fulfill his or her potential and TOTAL to pursue its development.
TOTAL has adopted a proactive approach by subscribing to the principles of numerous national and international agreements that fight against all forms of discrimination and by striving to ensure the safety and security of its employees and the respect of their fundamental rights. The Group has a long-standing commitment to promoting equal opportunity and diversity, which constitute, for everyone, a source of development where only expertise and talent count. In 2018, the Group decided to sign the Global Business and Disability Network Charter of the International Labour Organization (ILO) and is gradually implementing these principles in its subsidiaries.
The Group is also committed to social dialogue, which is one of the vectors used to modernize companies. Among the numerous stakeholders with which TOTAL maintains regular dialogue, the Group’s employees and their representatives have a privileged position and role.
This approach is illustrated by several commitments made by the Group, such as its adhesion on December 21, 2017, to the Global Deal initiative, alongside some 60 partners, states, trade unions, companies and international organizations. This international multi-party initiative aims at fighting against inequalities, encouraging social dialogue and promoting fairer globalization. It states that social dialogue, collective bargaining and trade-union freedom play an essential role in the fulfillment of the Sustainable Development Goals (SDGs 8, 10 and 17) of the United Nations. Similarly, the signing of a global agreement with the trade union federation IndustriALL in 2015 guarantees for the Group’s employees a high level of commitment to social matters in countries where the Group operates. The goal is to maintain the partnership and renegotiate this agreement for 2019 and beyond. The Group had 316 active agreements (including 190 in France) with employee representatives in place at the end of 2018.
TOTAL encourages a managerial policy that favors commitment, accountability and performance evaluation and is built on promoting functional and geographic mobility and training to ensure each person’s skills development and employability (76% of employees within the scope of the WHRS (1) took at least one on site training course in 2018).
The technical and commercial know-how of employees and their ability to manage large projects underpin the Group’s operational excellence and are essential for the Group’s development. It is thanks to the recognized expertise of its employees that TOTAL is able to form partnerships of trust with the world’s main producing and consuming nations in the most demanding areas, such as deep offshore, liquefied natural gas (LNG), low carbon energy, refining and petrochemicals, which are also areas in which the Group has developed some of the most high-performance platforms. It is for this reason that all employees, regardless of their function, are encouraged to build on their expertise and competencies by accessing a wide range of trainings.
In order to improve the Group’s social performance, the expectations of employees are regularly listened to and discussed. Examples include the Total Survey, which compiles the views and suggestions for improvement of tens of thousands of employees every two years. Initiatives that have allowed employees to participate in building the "One Total" Company project since 2016 are initiated.
This approach testifies to the Group’s desire to entrench a continuous improvement process that benefits everyone. For more information, refer to point 5.3 of chapter 5.
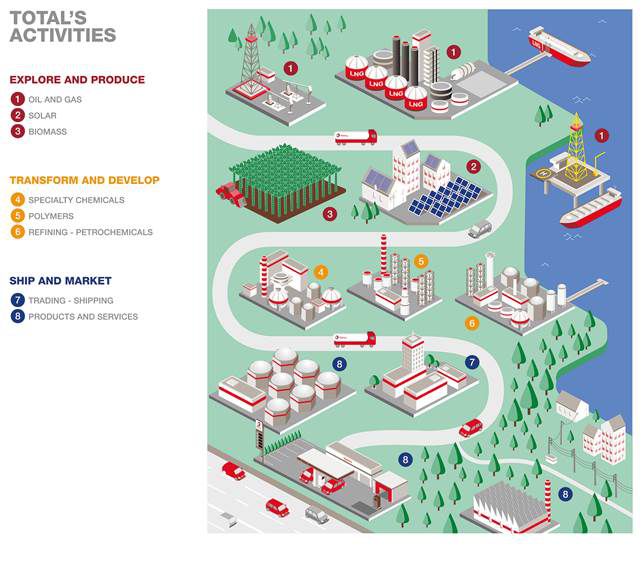
1.3.3 The strength of the Group’s integrated business model
1.3.3.1 A resilient integrated business model
Oil and gas are commodities that are traded on markets that are known for their volatility. To manage this constraint as well as possible, TOTAL opted for an integrated business model with activities throughout the oil and gas value chain. It extends from exploration and production, refining, liquefaction, petrochemicals and trading to, finally, the distribution of products to the end customer.
This business model enables the Company to benefit from synergies between different activities and from price volatility. It also enables the Company to manage the bottom of the cycle better and capture margin when the market improves. Thanks to an integrated business model, the Group’s Upstream activities, which are more dependent on the price of oil, can complement its Downstream activities, which - at the bottom of the cycle - enable the Group to benefit from added value untapped by the Upstream part of the business.
"It is thanks to the effectiveness of our integrated business model for the oil chain that we were able to withstand high oil price volatility. And it is the same model that we apply to gas and renewable energies, both intended for the generation of electricity."
Patrick Pouyanné, Chairman and Chief Executive Officer
(1) The Worldwide Human Resources Survey (WHRS) is an annual survey which comprises approximately 211 indicators. Refer to point 5.11.2 of chapter 5.
1.3.3.2 A relevant, integrated business model under development on the gas-renewables-electricity chain
In the coming years, according to the IEA, the growth in demand for electricity is expected to outstrip global demand for energy. In light of the digitization of the economy, the mobility revolution, and decentralized generation, many products and services are going to be "electrified" while, at the same time, a growing share of the world’s population will benefit from access to electricity.
To fulfill its ambition, the Group intends to apply this integrated business model to the electricity chain, from the production of low carbon energy to the generation of electricity.
Preference will be given to three main priorities:
-integration on the gas chain from production to liquefaction and distribution;
-the generation of electricity using gas or renewable energies and its storage; and
-the trading and the sale of gas or electricity as the producer, or not.
1.3.4 Geographic presence: key to the Group’s future growth
It is thanks to its pioneer spirit and sense of solidarity that TOTAL has become a worldwide oil and gas major and that it has forged partnerships of trust with its host countries. Remaining loyal to these principles means being continuously open to forming new alliances, key to the Group’s development, and creating new opportunities in the energy sector despite geopolitical uncertainty.
It is thanks to a strong and lasting geographic presence that the Group will be able to meet its goal of becoming a recognized partner in the sustainable economic and social development of the communities and regions in which it operates for the creation of shared value.
1.3.4.1 From one history to one ambition
The Group is present in over 130 countries and on five continents. There are three geographic regions in particular that represent the historical foundations of TOTAL’s strategy and today stand out thanks to the quality of the on-site teams and solid partnerships forged over time:
-Europe: The core of the Group’s knowledge. Europe is home to the Group’s decision-making center; it is the hub of its research and innovation work and constitutes a strong industrial base;
-Middle East: the Group began its production activities in this region and is recognized in the Middle East as a partner of choice among producing nations and their national oil companies. The aim of the Group is to develop its activities in all business lines in this region, even when geopolitical tension rises;
-Africa: TOTAL is the largest integrated major notably thanks to the volume of hydrocarbon production and the number of Group-branded service stations on the African continent (1). TOTAL generates electricity from renewable sources. The Group intends to remain the continent’s partner of choice and to contribute to its economic and social development through the creation of shared value.
Today, new regions which are vital for the Group have appeared, particularly the Americas, which represent a strong growth opportunity for all of the Group’s businesses, Asia, in order to benefit from this market’s high rate of growth, and Russia, where TOTAL is working on major industrial projects and maintains a special and long-term relationship with local industrial players.
(1) Source: Company data.
1.3.4.2 Managing geopolitical uncertainty
The world is confronted by political and geopolitical uncertainty characterized by tension connected to conflict and war in countries such as Syria, Iraq, Yemen and Libya. It is exacerbated by international terrorism.
In this context, TOTAL intends to develop its activities by putting its competencies to the benefit of each of the countries where it operates, by complying with applicable laws and international economic sanctions where imposed. The Group also ensures that the capital invested in the most sensitive countries remains at a level limiting its exposure in each of them.
This is the approach TOTAL intends to pursue and which was materialized following its decision to carry on investing in Russia while complying with the economic sanctions imposed by the United States and Europe, or by its decision to stop its operational activities in Iran following the re-imposition of U.S. secondary sanctions (refer to point 3.1.9.1 of chapter 3). The Group, if necessary, stops its activities in countries that become too risky (such as Yemen and Syria).
Loyalty to its partners, particularly during such kind of situations, is also a strong characteristic of the Group.
TOTAL’s activities, wherever they are, are carried out in strict adherence to applicable laws and the Group’s Code of Conduct and within the framework of compliance and risk management procedures.
By continuing to invest and to supply energy, the Group helps to maintain conditions that favor the economic development of these regions.
For more information on risk factors, internal control and risk management procedures and reasonable vigilance measures implemented by the Group, refer to points 3.1, 3.3 and 3.5 of chapter 3.
"During these troubled times, our industry can and must be a stabilizing factor."
Patrick Pouyanné, Chairman and Chief Executive Officer
1.3.4.3 A local socio-economic development partner
Safety, integrity, respect for human rights, and societal and environmental responsibility are principles and values that form part of the Group’s operating processes. If TOTAL is able to build and develop partnerships throughout the world, it is also because it has incorporated a local value creation process into its development model. This process is systematic, professional and a major competitive advantage.
Based on dialogue with the local population and public and private players, this process is used to identify development priorities and create synergies. The Group intends to apply this approach over the long term to ensure that its major projects create shared prosperity.
Beyond the societal initiatives that are directly related to the Group’s industrial and commercial activities, TOTAL is commited to general interest measures in the countries where it operates. In the face of growing inequality and environmental challenges, the Group intends to strengthen its public interest initiatives and has implemented a new civic commitment policy in line with its history, its values and its businesses. It wishes to act in a way that ensures the vitality and sustainability of the territories in which the Group is present by favouring actions that benefit young people first.
In order for its corporate citizenship initiatives to have a greater impact, four areas of focus have been defined as part of the Total Foundation program driven by the Fondation d’entreprise Total in France and supported by the Group:
-road safety: committed to safer mobility;
-forests and climate: committed to a more beneficial environment for humans;
-education and integration of young people: committed to empowering young people in socially vulnerable situations; and
-dialogue on cultures and heritage: committed to cultural openness and appreciation of heritage.
Since the end of 2018, the Group has launched Action!, the Group’s Employee Volunteering Program, through which TOTAL gives its employees the time and means to get involved and contribute to the development of the areas where the Group is present. It thus allows employees, on a voluntary basis, the possibility to support, up to three days per year during their working time, or outside of it, local solidarity projects within the scope of the Total Foundation program.
1.5 Strong commitments that benefit sustainable growth
1.5.1 Committed R&D
-$986 million invested in 2018 -4,288 employees dedicated to R&D in 2018 -18 R&D centers around the world -1,000 agreements with partners -over 200 patent applications filed in 2018 |
The Group relies on a dynamic R&D policy to conduct and develop its activities. The portfolio of programs is divided into five priority areas: safety, operational efficiency, new services and products including smart electricity grids, an energy mix focused on low-carbon energies and digital technology.
The portfolio includes transverse programs developed at all the R&D centers and programs specific to the various businesses. For example, the purpose of the CCUS (carbon capture, usage and storage) transverse program is to enable the Group to become a major player in this area and throughout the value chain so that it can contribute to the reduction in global CO2 emissions and prepare new business opportunities.
The Group is committed to optimizing R&D resources in terms of human talent, infrastructure and regional centers of excellence, and to working with selected partners that bring specific, high-level skills to every project.
For more information, refer to point 2.6 of chapter 2.
1.5.2 A targeted investment policy
- $12.5 billion in organic investments (1) in 2018 -$8.3 billion in targeted acquisitions in 2018, including $4.5 billion in resource acquisitions -$5.2 billion in asset disposals in 2018 |
Since the fall in oil prices in 2014, the Group continues to select its investments very carefully, in line with its strategy. These investments are dedicated to:
-the development of new upstream and downstream facilities in order to benefit from a favorable cost environment;
-the adding of attractive resources to the portfolio through the exploration or acquisition of resources that have already been discovered, thereby benefiting from favorable market conditions;
-strong growth in its low-carbon activities in the gas and electricity sectors; and
-the growth of its Marketing & Services business in buoyant markets.
The Group also strives to continuously improve its portfolio by selling its least strategic assets.
For more information, refer to point 2.5 of chapter 2.
1.5.3 A continuous improvement dynamic
TOTAL commited in 2016 to contributing to the Sustainable Development Goals (SDG) adopted by the United Nations. Given the nature of the Group’s businesses and its geographic presence, TOTAL is concerned by all the SDGs. However, the Group has identified the most significant SDGs for its activities in order to focus its efforts on the segments in which it is able to make a direct contribution. TOTAL therefore considers the SDGs an opportunity to better measure and assess its contribution to society as a whole. The Group manages its activities and assesses its performance on the basis of the three sustainable development pillars, namely financial results (Profit), value creation for stakeholders (People) and preservation of ecosystems (Planet) (refer also to chapter 5).
1.5.3.1 Commitments and indicators of progress
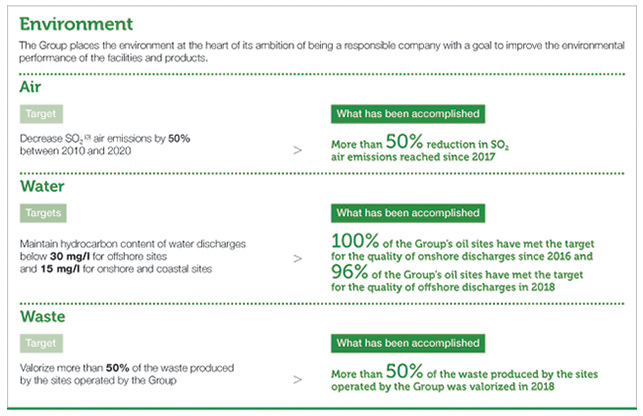
Safety, health, climate, the environment and also shared development, in every country where the Group is present, TOTAL steers its operations with the aim of working in a sustainable, active and positive manner. The Group was one of the first in the industry to publish measurable improvement targets in these areas.
(1) Organic investments = net investments excluding acquisitions, divestments and other operations with non-controlling interests.
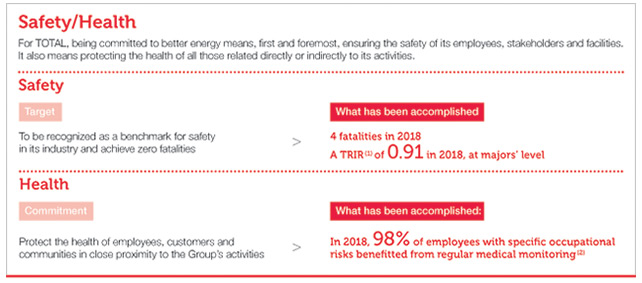

(1) TRIR (Total Recordable Injury Rate): number of recorded injuries per million hours worked.
(2) Data provided by WHRS.
(3) SO2: sulfur dioxide produced by the combustion of fossil energies.
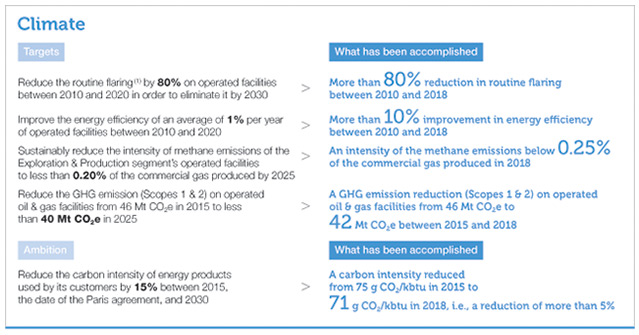

(1) Routine flaring, as defined by the working group of the Global Gas Flaring Reduction program within the framework of the World Bank’s Zero Routine Flaring initiative.
(2) Sites located in an IUCN I to IV or Ramsar convention protected area.
(3) Natural sites included on the UNESCO World Heritage List of December 31, 2017.
1.5.3.2 Support for global initiatives
Aside from complying with national regulations in force in every country where the Group operates, TOTAL reiterates each year, since 2002, its support for the United Nations Global Compact, of which it is one of the companies recognized as LEAD. The Group also made a commitment to respect the UN Guiding Principles for Business and Human Rights following their adoption in 2011.
The challenges posed by climate change require a collective effort. The Group has played an active role in various international initiatives that involve the private and the public sectors to bring about notably:
-carbon pricing (the World Bank’s Carbon Pricing Leadership Coalition, Caring for Climate - United Nations Global Compact, Paying for Carbon call: TOTAL and five other industry leaders);
-the end of routine flaring of associated gas (the World Bank’s Zero Routine Flaring by 2030 initiative);
-control over methane emissions (Oil & Gas Methane Partnership of the Climate and Clean Air Coalition, the Oil & Gas Climate Initiative in cooperation with UN Environment and EDF, etc.); and
-greater transparency: support of the recommendations from the G20 Financial Stability Board Task Force on Climate-related Financial Disclosures (TCFD).
TOTAL also actively supports collaborative and multi-stakeholder initiatives in areas in which the coordinated involvement of governments, companies and civil society is key to global progress, particularly:
-financial transparency: the Group has adhered to the Extractive Industries Transparency Initiative (EITI) since its launch in 2002;
-the fight against corruption: TOTAL joined the Partnering Against Corruption Initiative (PACI) in 2016 and the Chairman and Chief Executive Officer now sits on the Board of PACI ("PACI Vanguard");
-the challenge of security and respect for human rights by being a member of the Voluntary Principles on Security and Human Rights (VPSHR) since 2012;
-diversity: TOTAL signed in 2010 the "Women’s Empowerment Principles - Equality Means Business" set out by the United Nations Global Compact, and in 2018 it signed the pledge for diversity as part of the European Roundtable of Industrialists;
-biodiversity: TOTAL joined in 2018 the Act4Nature initiative and made commitments to protect biodiversity;
-the circular economy: TOTAL is a founding member of the Alliance to End Plastic Waste, launched in 2019, which brings together companies in the plastics and consumer goods value chain to provide solutions for the disposal of plastic waste in the environment, especially in oceans, and to promote their recycling in a circular economy;
-better access to energy for populations of emerging countries through a partnership with SE4All;
-the reduction of inequalities through the development of social dialogue to favor more inclusive economic growth: TOTAL was one of the first French companies to adhere to the Global Deal initiative at the end of 2017.
1.6 An organizational structure to support the Group’s ambition
1.6.1 TOTAL S.A., parent company of the Group and its subsidiaries
TOTAL S.A. is the Group’s parent company. It acts as a holding company and drives the Group’s strategy.
The Group’s operations are conducted through subsidiaries that are directly or indirectly owned by TOTAL S.A. and through stakes in joint-ventures which are not necessarily controlled by TOTAL. TOTAL S.A. has two secondary establishments in France, located in Lacq and Pau. It also has branch offices in the United Arab Emirates and Oman.
Corporate name: TOTAL S.A. Head office: 2, place Jean Millier, La Défense 6, 92400 Courbevoie, France Registered in the French trade registry in Nanterre under no. 542 051 180 RCS LEI (Legal Entity Identifier): 529900S21EQ1BO4ESM68 EC Registration Number: FR 59 542 051 180 Term of the Company: extended for 99 years from March 22, 2000 Fiscal year: from January 1 to December 31 of each year APE Code (NAF): 7010Z |
The scope of consolidation of TOTAL S.A. as of December 31, 2018, consisted of 1,191 companies, of which 1,046 fully consolidated companies or companies whose assets are jointly controlled and 145 equity affiliates. The principles of consolidation are described in Note 1.1 to the Consolidated Financial Statements and the list of companies included in the scope of consolidation can be found in Note 18 to the Consolidated Financial Statements (refer to point 8.7 of chapter 8).
[REDACTED SECTION: CERTAIN TEXT HAS BEEN REDACTED.]
Interests in listed companies
TOTAL holds stakes in a limited number of companies that issue financial instruments in France or abroad or whose financial instruments are listed in France or abroad. These companies are mainly the Group’s financing vehicles (Total Capital, Total Capital International, Total Capital Canada Ltd) or the operational subsidiaries in its business segments, in particular in Africa, such as Total Gabon (1).
TOTAL also holds a majority stake in SunPower (55.66% on December 31, 2018), an American company listed on NASDAQ, and minority interests in other companies, including PAO Novatek (19.4% on December 31, 2018), a Russian company listed on the Moscow Interbank Currency Exchange and the London Stock Exchange.
(1) Total Gabon is a company under Gabonese law which is listed on Euronext Paris and owned by TOTAL (58.28%), the Republic of Gabon (25%) and the public (16.72%).
The changes in the composition of the Group during fiscal year 2018 are explained in Note 2 of the Consolidated Financial Statements (refer to point 8.7 of chapter 8). In 2018, TOTAL S.A., the Group’s parent company, acquired 100% of the shares of Direct Énergie SA, following a takeover bid following an initial acquisition, 100% of the shares of Pont-sur-Sambre Power SAS and 100% of the shares of Toul Power SAS.
TOTAL S.A. has not taken any other stake in companies with their registered office in France representing more than one-twentieth, one-tenth, one-fifth, one-third or one-half of the capital of these companies or has not obtained control of such companies.
1.6.2 An operational structure
On an operational level, the Group’s businesses are organized in business segments, which receive assistance from the corporate functional divisions.
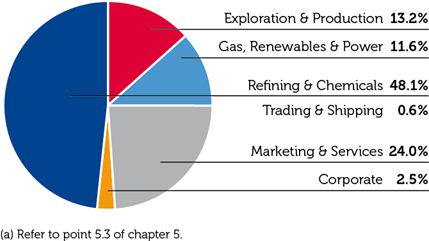
As of December 31, 2018, the Group’s organization was centered around four business segments, i.e., Exploration & Production, Gas, Renewables & Power, Refining & Chemicals and Marketing & Services:
-the Exploration & Production segment encompasses the Group’s exploration and production activities in more than 50 countries. The Group produces oil and gas in approximately 30 countries;
-the Gas, Renewables & Power segment spearheads the Group’s ambition in low-carbon energies. It comprises gas activities that are conducted downstream of the production process and concerns natural gas, liquefied natural gas (LNG) and liquefied petroleum gas (LPG), as well as power generation, gas and power trading and marketing. It also develops the Group’s renewable energy activities (excluding biotechnologies) and the power storage. Energy efficiency activities are represented through a dedicated Innovation & Energy Efficiency division;
-the Refining & Chemicals segment is a large industrial segment that encompasses refining and petrochemical activities and Hutchinson’s operations. It also includes oil Trading & Shipping activities;
-the Marketing & Services segment includes worldwide supply and marketing activities in the oil products and services field.
In order to improve efficiency, reduce costs and create value within the Group, a specific branch, Total Global Services (TGS), pools the various segments’ support services (Accounting, Purchasing, Information Systems, Training, Human Resources Administration and Facilities Management). The entities that make up TGS operate as service companies for internal clients across the business segments and Holding.
Finally, the various Corporate entities are mainly grouped into two divisions:
-the People & Social Responsibility division consists of: the Human Resources division, the Health, Safety and Environment division, which combines HSE departments across the different segments to establish a strong, unified environmental and safety model, the Security division, and the Civil Society Engagement Division;
-the Strategy-Innovation division is made of: the Strategy & Climate division (responsible notably for ensuring that climate is incorporated in the strategy), the Public Affairs division, the Audit & Internal Control division, the Research & Development division (which coordinates all of the Group’s R&D activities and notably transversal programs), the Technology Experts division and the Digital division.
Organization chart as of January 1, 2018

Organization chart as of January 1, 2019

New reporting structure as of January 1, 2019
The Group is pursuing its strategy for profitable growth along the integrated gas and low-carbon electricity chains. Effective 2019, the Group will report the new Integrated Gas, Renewables & Power (iGRP) segment which combines the Gas, Renewables & Power segment with the upstream gas and LNG activities currently reported within the Exploration & Production segment.
2
BUSINESS OVERVIEW
FOR FISCAL YEAR 2018
2.1 Exploration & Production segment
The Exploration & Production (E&P) segment encompasses the Group’s oil and gas exploration and production activities in more than 50 countries.

[REDACTED SECTION: CERTAIN TEXT HAS BEEN REDACTED.]
Price realizations (a) | 2018 | 2017 | 2016 |
Average liquids price ($/b) | 64.2 | 50.2 | 40.3 |
Average gas price ($/Mbtu) | 4.78 | 4.08 | 3.56 |
(a) Consolidated subsidiaries, excluding fixed margins.
(1) Based on a Brent crude price of 71.43 $/b (reference price in 2018), according to the rules established by the Securities and Exchange Commission (refer to point 2.1.3 of this chapter).
(2) Organic investments = net investments, excluding acquisitions, divestments and other operations with non-controlling interests (refer to point 2.5.1 of this chapter).
[REDACTED SECTION: CERTAIN TEXT HAS BEEN REDACTED.]
Production
Hydrocarbon production | 2018 | 2017 | 2016 |
Combined production (kboe/d) | 2,775 | 2,566 | 2,452 |
Oil (including bitumen) (kb/d) | 1,378 | 1,167 | 1,088 |
Gas (including Condensates and associated NGL) (kboe/d) | 1,397 | 1,399 | 1,364 |
Hydrocarbon production | 2018 | 2017 | 2016 |
Combined production (kboe/d) | 2,775 | 2,566 | 2,452 |
Liquids (kb/d) | 1,566 | 1,346 | 1,271 |
Gas (Mcf/d) | 6,599 | 6,662 | 6,447 |
In 2018, hydrocarbon production was 2,775 kboe/d, an increase of more than 8% compared to last year, due to:
-+9% for start-ups and ramp-ups on new projects, notably Yamal LNG, Moho Nord, Fort Hills, Kashagan, Kaombo Norte and Ichthys;
-+3% portfolio effect. The addition of Mærsk Oil, Al Shaheen in Qatar, Waha in Libya, Lapa and Iara in Brazil, as well as the acquisition of an additional 0.5% of Novatek, were partially offset by the expiration of the Mahakam permit at the end of 2017 and the sales of Visund in Norway and Rabi in Gabon;
--4% for natural field declines and PSC price effect.
Proved reserves
As of December 31, | 2018 | 2017 | 2016 |
Hydrocarbon reserves (Mboe) | 12,050 | 11,475 | 11,518 |
Oil (including bitumen) (Mb) | 5,203 | 4,615 | 4,543 |
Gas (including Condensates and associated NGL) (Mboe) | 6,847 | 6,860 | 6,975 |
As of December 31, | 2018 | 2017 | 2016 |
Hydrocarbon reserves (Mboe) | 12,050 | 11,475 | 11,518 |
Liquids (Mb) | 6,049 | 5,450 | 5,414 |
Gas (Bcf) | 32,325 | 32,506 | 32,984 |
Proved reserves based on SEC rules (Brent at $71.43/b in 2018) were 12,050 Mboe at December 31, 2018. The proved reserve replacement rate (1), based on SEC rules (Brent at $71.43/b in 2018), was 157% in 2018 and 117% over three years.
[REDACTED SECTION: CERTAIN TEXT HAS BEEN REDACTED.]
(1) Change in reserves excluding production: (revisions + discoveries, extensions + acquisitions - divestments)/production for the period.
[REDACTED SECTION: CERTAIN TEXT HAS BEEN REDACTED.]
2.1.1 Presentation of the segment
Exploration & Production (E&P)’s mission is to discover and develop oil and gas fields in order to meet a growing energy demand driven by non-OECD countries. Safety is a core value for that mission.
In an environment marked by the strong volatility of hydrocarbon prices, E&P’s strategy is to develop an oil and gas production model that is resilient (i.e., able to withstand a long period of low oil and gas prices), profitable and sustainable.
The deployment of the strategy is based on three main levers:
-increase profitability: E&P strives to maximize the value of its assets through operational excellence and to ensure strict investment discipline by being selective in the sanctioning of new projects. In addition, E&P continues to restructure or sell the least efficient assets in its portfolio;
-develop operational excellence: in order to ensure its resilience, E&P continues to reduce costs, improve the efficiency of its facilities and start up projects on time and within budget. E&P also seeks to minimize the environmental impact of its activities; and
-renew reserves, through exploration as well as by accessing already discovered resources, building on E&P’s competitive advantages in terms of geographical spread and technical skills.
E&P put 10 major projects into production in 2018. Thanks to a significant decrease of its capital investments, which peaked in 2013, E&P restored some flexibility that enabled it to take some opportunities, with, in particular, in 2018 the acquisition of assets in Brazil, Libya and the United States, the extension of assets in Abu Dhabi and the acquisition of Mærsk Olie og Gas A/S, (Mærsk Oil), which has assets in ten countries, and to launch new projects, taking advantage of the lower costs in the current environment.
For the period 2018-2020, E&P has already launched, or plans to launch, numerous projects with a potential aggregate output in excess of 700 kboe/d.
All these actions are expected to increase production by an average of 6-7% per year for the period 2017-2020, in line with the production growth target of 5% per year on average between 2017 and 2022.
In order to take account of issues related to climate change in its strategy, E&P is focusing its oil investments on low break-even projects, developing the production of gas, integrating a CO2 price in its investment decisions and developing expertise in technologies for carbon capture, use and storage.
2.1.2 Exploration and development
TOTAL evaluates exploration opportunities based on a variety of geological, technical, political, economic (including tax and contractual terms) environmental and societal factors.
The exploration strategy deployed since 2015 aims to prioritize the most promising drill targets with a view to creating value. The Group plans balanced exploration investments:
-50% for emerging basins, where the presence of hydrocarbons is already proven;
-35% for exploration in mature hydrocarbon plays; and
-15% for high-potential frontier basins.
In 2018, exploration expenditure by all E&P subsidiaries was $1.2 billion, mainly in the United States, Guyana, the United Kingdom, Norway, Myanmar, French Guiana, Mexico, South Africa, Azerbaijan and Nigeria compared to $1.2 billion in 2017 and $1.4 billion in 2016.
Organic investments (1) by all E&P subsidiaries were $9.2 billion(2) in 2018, compared to $11.3 billion (2) in 2017 and $14.5 billion in 2016, and were mainly in Australia, Norway, Angola, the United Kingdom, the Republic of Congo, the United Arab Emirates, Brazil, Nigeria, Canada, the United States, Iraq, Italy and Uganda.
2.1.3 Reserves
The definitions used for proved, proved developed and proved undeveloped oil and gas reserves are in accordance with the United States Securities & Exchange Commission (SEC) Rule 4-10 of Regulation S-X as amended by the SEC Modernization of Oil and Gas Reporting release issued on December 31, 2008. Proved reserves are estimated using geological and engineering data to determine with reasonable certainty whether the crude oil or natural gas in known reservoirs is economically producible under existing regulatory, economic and operating conditions.
TOTAL’s oil and gas reserves are consolidated annually, taking into account, among other factors, levels of production, field reassessments, additional reserves from discoveries and extensions, disposal and acquisitions of reserves and other economic factors.
Unless otherwise indicated, any reference to TOTAL’s proved reserves, proved developed reserves, proved undeveloped reserves and production reflects the Group’s entire share of such reserves or such production. TOTAL’s worldwide proved reserves include the proved reserves of its consolidated entities as well as its proportionate share of the proved reserves of equity affiliates. The reserves estimation process involves making subjective judgments. Consequently, estimates of reserves are not exact measurements and are subject to revision under well-established control procedures.
(1) For Exploration & Production, organic investments include exploration investments, net development investments and net financial investments (excluding acquisitions).
(2) Excluding the Group’s Gas activities.
The reserves booking process requires, among other actions:
-that an internal peer review of technical evaluations is carried out to ensure that the SEC definitions and guidance are followed; and
-that management makes the necessary funding commitments to their development prior to booking.
For further information concerning the reserves and their evaluation process, refer to points 9.1 and 9.2 of chapter 9.
2.1.3.1 Proved reserves for 2018, 2017 and 2016
In accordance with the amended Rule 4-10 of Regulation S-X, proved reserves at December 31 are calculated using a 12-month average price determined as the unweighted arithmetic average of the first-day-of-the-month price for each month of the relevant year, unless prices are defined by contractual arrangements, excluding escalations based upon future conditions. The average reference prices for Brent crude for 2018, 2017 and 2016 were, respectively, $71.43/b, $54.36/b and $42.82/b.
As of December 31, 2018, TOTAL’s combined proved reserves of oil and gas were 12,050 Mboe (70% of which were proved developed reserves). Liquids (crude oil, condensates, natural gas liquids and bitumen) represented approximately 50% of these reserves and natural gas 50%. These reserves were located in Europe and Central Asia (mainly in Kazakhstan, Norway, The United Kingdom and Russia), Africa (mainly in Angola, Nigeria and the Republic of Congo), the Americas (mainly in Argentina, Brazil, Canada, the United States and Venezuela), the Middle East and North Africa (mainly in the United Arab Emirates, Qatar, and Yemen), and Asia-Pacific (mainly in Australia).
Gas and associated products (condensates and natural gas liquids) represented approximatively 57% of the reserves whilst crude oil and bitumen the remaining 43%.
Discoveries of new fields and extensions of existing fields added 1,421 Mboe to TOTAL’s proved reserves during the three years 2016, 2017 and 2018 before deducting production and sales of reserves and adding any reserves acquired during this period. The net level of reserve revisions during this 3-year period is +1,383 Mboe, which was mainly due to the overall positive revisions in field behaviors and to the net impact of the changes in hydrocarbon prices in 2016 (decrease), in 2017 (increase) and in 2018 (increase) that led either to a reserves decrease or increase resulting from shorter or longer producing life of certain producing fields and from partial debooking or rebooking of proved undeveloped reserves due to economic reasons, partially offset by reserves increase or decrease on fields with producing sharing or risked service contracts.
As of December 31, 2017, TOTAL’s combined proved reserves of oil and gas were 11,475 Mboe (61% of which were proved developed reserves) compared to 11,518 Mboe (58% of which were proved developed reserves) as of December 31, 2016.
2.1.3.2 Reserve sensitivity to oil and gas prices
Changes in the price used as a reference for the proved reserves estimation result in non-proportionate inverse changes in proved reserves associated with production sharing and risked service contracts (which together represent approximately 18% of TOTAL’s reserves as of December 31, 2018). Under such contracts, TOTAL is entitled to a portion of the production, the sale of which is meant to cover expenses incurred by the Group. The more the oil prices decrease, the more the number of barrels necessary to cover the same amount of expenses. Moreover, the number of barrels economically producible under these contracts may vary according to criteria such as cumulative production, the rate of return on investment or the income-cumulative expenses ratio. This increase in reserves is partly offset by a reduction of the duration over which fields are economically producible. However, the effect of a reduction of the duration of production is usually inferior to the impact of the drop in prices in production sharing contracts or risked service contracts. As a result, lower prices usually lead to an increase in TOTAL’s reserves, and vice versa. In Canada, a decrease in the reference price per barrel leads to a decrease in the volume of royalties and, therefore, an increase of the reserves.
Finally, for any type of contract, a significant decrease in the reference price of petroleum products that negatively impacts projects’ profitability may lead to a reduction of proved reserves, and vice versa.
2.1.4 Production
The average daily production of liquids and natural gas was 2,775 kboe/d in 2018 compared to 2,566 kboe/d in 2017 and 2,452 kboe/d in 2016. Liquids represented approximately 56% and natural gas approximately 44% of TOTAL’s overall production in 2018.
Gas and associated products (condensates and natural gas liquids) represented approximately 50% of TOTAL’s overall production in 2018, whilst crude oil and bitumen the remaining 50%.
The tables on the following pages set forth TOTAL’s annual and average daily production of liquids and natural gas by geographic area and for each of the last three fiscal years.
Consistent with industry practice, TOTAL often holds a percentage interest in its fields rather than a 100% interest, with the balance being held by joint-venture partners (which may include other international oil companies, state-owned oil companies or government entities). The Group’s entities may frequently act as an operator (the party responsible for technical production) on the acreage in which it holds an interest. For further information, refer to the table on producing assets by geographical zone in point 2.1.8 of this chapter.
The Trading & Shipping division of TOTAL’s Refining & Chemicals segment marketed in 2018, as in 2017 and 2016, substantially all of the liquids production from TOTAL’s Exploration & Production segment(refer to table regarding Trading’s crude oil sales and supply and petroleum products sales in point 2.3.2.1 of this chapter).
2.1.5 Delivery commitments
The majority of TOTAL’s natural gas production is sold under long-term contracts. However, most of its North American and United Kingdom production, and part of its production from Denmark, the Netherlands, Norway and Russia, is sold on the spot market.
The long-term contracts under which TOTAL sells its natural gas usually provide for a price related to, among other factors, average crude oil and other petroleum product prices, as well as, in some cases, a cost-of-living index. Though the price of natural gas tends to fluctuate in line with crude oil prices, a slight delay may occur before changes in crude oil prices are reflected in long-term natural gas prices.
Some of TOTAL’s long-term contracts, such as in Bolivia, Nigeria, Norway, Thailand and Qatar, specify the delivery of quantities of natural gas that may or may not be fixed and determinable. Such delivery commitments vary substantially, both in duration and scope, from contract to contract throughout the world. For example, in some cases, contracts require delivery of natural gas on an as-needed basis, and, in other cases, contracts call for the delivery of varied amounts of natural gas over different periods of time. Nevertheless, TOTAL estimates the fixed and determinable quantity of gas to be delivered over the period 2019-2021 to be
4,751 Bcf. The Group expects to satisfy most of these obligations through the production of its proved reserves of natural gas, with, if needed, additional sourcing from spot market purchases (refer to points 9.1 and 9.2 of chapter 9).
2.1.6 Contractual framework of activities
Licenses, permits and contracts governing the Group entities’ ownership of oil and gas interests have terms that vary from country to country and are generally granted by or entered into with a government entity or a state-owned company or sometimes with private owners. These agreements usually take the form of concessions or production sharing contracts.
In the framework of oil concession agreements, the oil company (or consortium) owns the assets and the facilities and is entitled to the entire production. In exchange, the operating risks, costs and investments are the oil company’s or the consortium’s responsibility and it agrees to remit to the relevant host country, usually the owner of the subsoil resources, a production-based royalty, income tax, and possibly other taxes that may apply under local tax legislation.
The production sharing contract ("PSC") involves a more complex legal framework than the concession agreement: it defines the terms and conditions of production sharing and sets the rules governing the cooperation between the company (the contractor) or consortium (the contracting group) in possession of the license and the host country, which is generally represented by a state-owned company. The latter can thus be involved in operating decisions, cost accounting and production allocation. The contractor (or contractor group) undertakes the execution and financing, at its own risk, of all exploration, development or operational activities. In exchange, it is entitled to a portion of the production, known as "cost oil", the sale of which is intended to cover its incurred expenses (capital and operating costs). The balance of production, known as "profit oil", is then shared in varying proportions, between the contractor (or the contracting group), on the one hand, and the host country or state-owned company, on the other hand.
Today, concession agreements and PSCs can coexist, sometimes in the same country. Even though there are other contractual models, TOTAL’s license portfolio is comprised mainly of concession agreements.
On most licenses, the partners and authorities of the host country, often assisted by international accounting firms, perform joint-venture and PSC cost audits and ensure the observance of contractual obligations.
In some countries, TOTAL has also signed contracts called "risked service contracts", which are similar to PSCs. However, the profit oil is replaced by a defined or determinable cash monetary remuneration, agreed by contract, which depends notably on field performance parameters such as the amount of barrels produced.
Oil and gas exploration and production activities are subject to authorization granted by public authorities (licenses), which are granted for specific and limited periods of time and include an obligation to relinquish a large portion, or the entire portion in case of failure, of the area covered by the license at the end of the exploration period.
TOTAL pays taxes on income generated from its oil and gas production and sales activities under its concessions, PSCs and risked service contracts, as provided for by local regulations. In addition, depending on the country, TOTAL’s production and sales activities may be subject to a number of other taxes, fees and withholdings, including special petroleum taxes and fees. The taxes imposed on oil and gas production and sales activities are generally substantially higher than those imposed on other industrial or commercial businesses.
2.1.7 Production by geographical zone
The following table sets forth the Group’s annual liquids and natural gas production by geographical zone in 2018.
2018 | 2017 | 2016 | |||||||
Liquids Mb (a) | Natural gas Bcf (b)(c) | Total Mboe | Liquids Mb (a) | Natural gas Bcf (b)(c) | Total Mboe | Liquids Mb (a) | Natural gas Bcf (b)(c) | Total Mboe | |
Europe and Central Asia | 122 | 1,131 | 332 | 98 | 976 | 278 | 91 | 1,002 | 277 |
Denmark | 9 | 36 | 15 | - | - | - | - | - | - |
Italy | < 1 | - | < 1 | - | - | - | - | - | - |
Kazakhstan | 20 | 26 | 26 | 11 | 19 | 15 | 1 | 2 | 1 |
Norway | 38 | 211 | 77 | 46 | 234 | 88 | 44 | 226 | 86 |
Netherlands | - | 36 | 7 | - | 41 | 7 | - | 52 | 9 |
United Kingdom | 28 | 206 | 65 | 15 | 201 | 52 | 18 | 218 | 58 |
Russia | 27 | 616 | 142 | 26 | 481 | 116 | 28 | 504 | 123 |
Africa (excl. North Africa) | 187 | 287 | 245 | 183 | 277 | 239 | 186 | 227 | 232 |
Angola | 68 | 48 | 77 | 73 | 47 | 83 | 84 | 25 | 89 |
Republic of the Congo | 47 | 12 | 50 | 36 | 12 | 38 | 31 | 11 | 33 |
Gabon | 13 | 4 | 14 | 19 | 5 | 20 | 20 | 5 | 21 |
Nigeria | 59 | 223 | 104 | 55 | 213 | 98 | 51 | 186 | 89 |
Middle East and North Africa | 190 | 294 | 243 | 153 | 282 | 204 | 137 | 291 | 189 |
Algeria | 11 | 34 | 17 | 1 | 21 | 5 | 2 | 33 | 8 |
United Arab Emirates | 102 | 21 | 105 | 102 | 24 | 107 | 102 | 25 | 107 |
Iraq | 7 | 1 | 7 | 6 | - | 6 | 6 | < 1 | 7 |
Libya | 22 | 3 | 23 | 11 | - | 11 | 5 | - | 5 |
Oman | 9 | 25 | 14 | 9 | 23 | 13 | 10 | 23 | 14 |
Qatar | 39 | 210 | 77 | 24 | 214 | 62 | 11 | 210 | 49 |
Americas | 67 | 423 | 142 | 48 | 442 | 127 | 40 | 346 | 102 |
Argentina | 3 | 147 | 29 | 2 | 141 | 27 | 3 | 143 | 29 |
Bolivia | 2 | 74 | 15 | 2 | 79 | 17 | 1 | 59 | 12 |
Brazil | 7 | - | 7 | < 1 | - | < 1 | - | - | - |
Canada | 35 | - | 35 | 22 | - | 22 | 12 | - | 12 |
Colombia | < 1 | - | < 1 | < 1 | - | < 1 | - | - | - |
United States | 12 | 176 | 44 | 11 | 192 | 45 | 11 | 111 | 31 |
Venezuela | 8 | 26 | 12 | 11 | 30 | 16 | 12 | 33 | 17 |
Asia-Pacific | 6 | 273 | 51 | 10 | 455 | 89 | 11 | 494 | 97 |
Australia | 1 | 66 | 12 | - | 41 | 7 | - | 33 | 6 |
Brunei | 2 | 26 | 7 | 1 | 32 | 8 | 1 | 29 | 7 |
China | - | 32 | 6 | < 1 | 29 | 5 | - | 19 | 4 |
Indonesia | - | 5 | 1 | 6 | 190 | 41 | 7 | 240 | 51 |
Myanmar | - | 49 | 6 | - | 55 | 7 | - | 60 | 8 |
Thailand | 3 | 95 | 19 | 3 | 108 | 21 | 3 | 112 | 22 |
TOTAL PRODUCTION | 572 | 2,408 | 1,013 | 492 | 2,432 | 937 | 465 | 2,360 | 897 |
INCLUDING SHARE OF EQUITY AFFILIATES | 90 | 832 | 245 | 103 | 700 | 232 | 91 | 694 | 220 |
Angola | 2 | 30 | 7 | 2 | 29 | 7 | - | 7 | 2 |
United Arab Emirates | 15 | 16 | 18 | 42 | 19 | 46 | 42 | 19 | 45 |
Oman | 9 | 25 | 13 | 8 | 23 | 13 | 9 | 23 | 13 |
Qatar | 30 | 143 | 58 | 16 | 144 | 42 | 2 | 139 | 28 |
Russia | 26 | 616 | 141 | 24 | 483 | 112 | 25 | 503 | 120 |
Venezuela | 8 | 2 | 8 | 11 | 2 | 12 | 12 | 3 | 12 |
(a) Liquids consist of crude oil, bitumen, condensates and natural gas liquids (NGL).
(b) Including fuel gas (166 Bcf in 2018, 173 Bcf in 2017 and 163 Bcf in 2016).
(c) Gas conversion ratio: 1 boe = 1 b of crude oil = 5,460 cf of gas in 2018 (5,461 cf in 2017 and 5,460 cf in 2016).
The following table sets forth the Group’s average daily liquids and natural gas production by geographical zone in 2018.
2018 | 2017 | 2016 | |||||||
Liquids kb/d (a) | Natural gas Mcf/d (b)(c) | Total kboe/d | Liquids kb/d (a) | Natural gas Mcf/d (b)(c) | Total kboe/d | Liquids kb/d (a) | Natural gas Mcf/d (b)(c) | Total kboe/d | |
Europe and Central Asia | 334 | 3,099 | 909 | 265 | 2,674 | 761 | 249 | 2,737 | 757 |
Denmark | 25 | 99 | 42 | - | - | - | - | - | - |
Italy | < 1 | - | < 1 | - | - | - | - | - | - |
Kazakhstan | 56 | 70 | 70 | 31 | 53 | 42 | 3 | 6 | 4 |
Norway | 104 | 577 | 211 | 121 | 640 | 239 | 121 | 618 | 235 |
Netherlands | - | 98 | 18 | - | 112 | 20 | - | 141 | 25 |
United Kingdom | 75 | 566 | 179 | 42 | 551 | 142 | 49 | 595 | 158 |
Russia | 74 | 1,689 | 389 | 71 | 1,318 | 318 | 76 | 1,377 | 335 |
Africa (excl. North Africa) | 513 | 786 | 670 | 502 | 759 | 654 | 509 | 621 | 634 |
Angola | 186 | 132 | 211 | 204 | 130 | 229 | 230 | 68 | 243 |
Republic of the Congo | 130 | 32 | 136 | 98 | 32 | 104 | 84 | 29 | 90 |
Gabon | 36 | 12 | 39 | 51 | 14 | 54 | 55 | 15 | 58 |
Nigeria | 161 | 610 | 284 | 149 | 583 | 267 | 140 | 509 | 243 |
Middle East and North Africa | 520 | 805 | 666 | 419 | 771 | 559 | 373 | 795 | 517 |
Algeria | 30 | 94 | 47 | 4 | 58 | 15 | 6 | 90 | 23 |
United Arab Emirates | 276 | 57 | 288 | 278 | 63 | 290 | 279 | 67 | 291 |
Iraq | 18 | 1 | 19 | 15 | 1 | 16 | 17 | 1 | 18 |
Libya | 62 | 9 | 63 | 31 | - | 31 | 14 | - | 14 |
Oman | 26 | 67 | 38 | 25 | 64 | 37 | 26 | 62 | 37 |
Qatar | 108 | 577 | 211 | 66 | 585 | 170 | 31 | 575 | 134 |
Americas | 183 | 1,161 | 389 | 132 | 1,212 | 348 | 109 | 944 | 279 |
Argentina | 7 | 402 | 79 | 6 | 388 | 76 | 8 | 391 | 78 |
Bolivia | 5 | 204 | 42 | 5 | 216 | 46 | 4 | 160 | 34 |
Brazil | 18 | 1 | 19 | < 1 | - | < 1 | - | - | - |
Canada | 95 | - | 95 | 59 | - | 59 | 34 | - | 34 |
Colombia | 1 | - | 1 | < 1 | - | < 1 | - | - | - |
United States | 35 | 483 | 119 | 31 | 527 | 123 | 31 | 304 | 86 |
Venezuela | 22 | 71 | 34 | 31 | 81 | 44 | 32 | 89 | 47 |
Asia-Pacific | 16 | 748 | 141 | 28 | 1,247 | 244 | 31 | 1,350 | 265 |
Australia | 3 | 181 | 34 | - | 114 | 19 | - | 91 | 16 |
Brunei | 5 | 72 | 19 | 3 | 87 | 21 | 3 | 78 | 18 |
China | - | 88 | 16 | < 1 | 80 | 15 | - | 53 | 10 |
Indonesia | - | 14 | 3 | 16 | 519 | 112 | 19 | 657 | 140 |
Myanmar | - | 133 | 17 | - | 151 | 19 | - | 165 | 21 |
Thaïland | 8 | 260 | 52 | 9 | 296 | 58 | 9 | 306 | 60 |
TOTAL PRODUCTION | 1,566 | 6,599 | 2,775 | 1,346 | 6,663 | 2,566 | 1,271 | 6,447 | 2,452 |
INCLUDING SHARE OF EQUITY AFFILIATES | 247 | 2,281 | 671 | 284 | 1,914 | 639 | 247 | 1,894 | 600 |
Angola | 4 | 81 | 20 | 5 | 80 | 20 | 1 | 20 | 5 |
United Arab Emirates | 41 | 45 | 49 | 115 | 53 | 125 | 114 | 51 | 123 |
Oman | 24 | 67 | 37 | 23 | 64 | 35 | 24 | 62 | 36 |
Qatar | 85 | 395 | 157 | 43 | 395 | 114 | 7 | 379 | 76 |
Russia | 71 | 1,689 | 385 | 67 | 1,317 | 313 | 69 | 1,375 | 327 |
Venezuela | 22 | 4 | 23 | 31 | 5 | 32 | 32 | 7 | 33 |
(a) Liquids consist of crude oil, bitumen, condensates and natural gas liquids (NGL).
(b) Including fuel gas (454 Mcf/d in 2018, 473 Mcf/d in 2017 and 448 Mcf/d in 2016).
(c) Gas conversion ratio: 1 boe = 1 b of crude oil = 5,460 cf of gas in 2018 (5,461 cf in 2017 and 5,460 cf in 2016).
2.1.8 Producing assets by geographical zone
The table below sets forth, as of December 31, 2018 (a) and by geographical zone, TOTAL’s producing assets, the year in which TOTAL’s activities started, the Group’s interest in each asset (Group share in %) and whether TOTAL is operator of the asset.
Europe and Central Asia | |
Denmark (2018) | Operated: Danish Underground Consortium (DUC) zone (31.20%), comprising the Dan/Halfdan, Gorm and Tyra fields, and all their satellites. |
Kazakhstan (1992) | Operated: Dunga (60.00%) Non-operated: Kashagan (16.81%) |
Norway (1965) | Operated: Atla (40.00%), Skirne (40.00%) Non-operated: Åsgard (7.68%), Ekofisk (39.90%), Eldfisk (39.90%), Embla (39.90%), Flyndre (6.26%), Gimle (4.90%), Heimdal (16.76%), Islay (5.51%) (b), Kristin (6.00%), Kvitebjørn (5.00%), Mikkel (7.65%), Oseberg (14.70%), Oseberg East (14.70%), Oseberg South (14.70%), Snøhvit (18.40%), Troll (3.69%), Tune (10.00%), Tyrihans (23.15%) |
Netherlands (1964) | Operated: F6a oil (65.68%), J3a (30.00%), K1a (40.10%), K3b (56.16%), K4a (50.00%), K4b/K5a (36.31%), K5b (50.00%), K6 (56.16%), L1a (60.00%), L1d (60.00%), L1e (55.66%), L1f (55.66%), L4a (55.66%) Non-operated: E16a (16.92%), E17a/E17b (14.10%), J3b/J6 (25.00%), K9ab-A (22.46%), Q16a (6.49%) |
United Kingdom (1962) | Operated: Alwyn North (100.00%), Dunbar (100.00%), Ellon (100.00%), Forvie North (100.00%), Grant (100.00%), Jura (100.00%), Nuggets (100.00%), Elgin-Franklin (46.17%), West Franklin (46.17%), Glenelg (58.73%), Islay (94.49%) (b), Laggan Tormore (60.00%), Edradour and Glenlivet (60.00%), Dumbarton, Balloch and Lochranza (100.00%), Gryphon (86.50%), Maclure (38.19%), South Gryphon (89.88%), Tullich (100.00%), Flyndre (65.94%) Non-operated: Bruce (1.00%), Markham unitized field (7.35%), Golden Eagle, Peregrine and Solitaire (31.56%), Scott (5.16%), Telford (2.36%), Harding (30.00%) |
Russia (1991) | Non-operated: Kharyaga (20.00%), Termokarstovoye (49.00%) (c), Yamal LNG (20.02%) (d), several fields through the participation in PAO Novatek (19.40%) |
Africa (excl. North Africa) | |
Angola (1953) | Operated: Girassol, Dalia, Pazflor, CLOV (Block 17) (40.00%), Kaombo (Block 32) (30.00%) Non-operated: Cabinda Block 0 (10.00%), Kuito, BBLT, Tombua-Landana (Block 14) (20.00%) (e), Lianzi (Block 14K) (10.00%) (e), Angola LNG (13.60%) |
Gabon (1928) | Operated: Anguille Marine (100.00%), Anguille Nord Est (100.00%), Baliste (100.00%), Baudroie Marine (100.00%), Baudroie Nord Marine (100.00%), Grand Anguille Marine (100.00%), Lopez Nord (100.00%), Mérou Sardine Sud (100.00%), N’Tchengue (100.00%), Port Gentil Océan (100.00%), Torpille (100.00%), Torpille Nord Est (100.00%) Non-operated: Barbier (65.28%), Girelle (65.28%), Gonelle (65.28%), Grondin (65.28%), Hylia Marine (37.50%), Mandaros (65.28%), Pageau (65.28%) |
Nigeria (1962) | Operated: OML 58 (40.00%), OML 99 Amenam-Kpono (30.40%), OML 100 (40.00%), OML 102 (40.00%), OML 130 (24.00%) Non-operated: Shell Petroleum Development Company (SPDC 10.00%), OML 118 - Bonga (12.50%), OML 138 (20.00%), Nigeria LNG (15.00%) |
The Republic of the Congo (1968) | Operated: Kombi-Likalala-Libondo (65.00%), Moho Bilondo (53.50%), Moho Nord (53.50%), Nkossa (53.50%), Sendji (55.25%), Yanga (55.25%) Non-operated: Lianzi (26.75%), Loango (42.50%), Zatchi (29.75%) |
(a) The Group’s interest in the local entity is approximately 100% in all cases except for Total Gabon (58.28%), Total E&P Congo (85.00%) and certain entities in Abu Dhabi and Oman (see notes b through m below).
(b) The Islay field extends partially into Norway. Total E&P UK holds a 94.49% stake and Total E&P Norge 5.51%.
(c) TOTAL’s interest in the joint-venture ZAO Terneftegas with PAO Novatek.
(d) TOTAL’s interest in the joint-venture OAO Yamal LNG with PAO Novatek, China National Oil & Gas Exploration and Development (CNODC), a subsidiary of China National Petroleum Corporation (CNPC), and Silk Road Fund.
(e) Stake in the company Angola Block 14 BV (TOTAL 50.01%).
Middle East and North Africa | |
Algeria (1952) | Non-operated: TFT II (26.40%), Timimoun (37.75%), 404a & 208 (12.25%) |
U.A.E. (1939) | Operated: Abu Al Bukhoosh (100.00%) Non-operated: ADNOC Onshore (10.00%), ADNOC Offshore: Umm Shaif/Nasr (20.00%), Lower Zakum (5.00%), ADNOC Gas Processing (15.00%), ADNOC LNG (5.00%) |
Iraq (1920) | Non-operated: Halfaya (22.5%) (f), Sarsang (18.00%) |
Libya (1959) | Non-operated: zones 15, 16 & 32 (75.00%) (g), zones 129 & 130 (30.00%) (g), zones 130 & 131 (24.00%) (g), zones 70 & 87 (75.00%) (g), Waha (16.33%) |
Oman (1937) | Non-operated: various onshore fields (Block 6) (4.00%) (h), Mukhaizna field (Block 53) (2.00%) (i) |
Qatar (1936) | Operated: Al Khalij (40.00%) Non-operated: North Field-Block NF Dolphin (24.50%), North Field-Qatargas 1 Upstream (20.00%), North Field-Qatargas 1 Downstream (10.00%), North Field-Qatargas 2 Train 5 (16.70%), Al Shaheen (30.00%) |
Americas | |
Argentina (1978) | Operated: Aguada Pichana Este - Mulichinco (27.27%), Aguada Pichana Este - Vaca Muerta (41.00%), Aguada San Roque (24.71%), Rincon La Ceniza (45.00%), Aries (37.50%), Cañadon Alfa Complex (37.50%), Carina (37.50%), Hidra (37.50%), Kaus (37.50%), Vega Pleyade (37.50%) Non-operated: Aguada Pichana Oeste (25%), Aguada de Castro (25%), Sierra Chata (2.51%) |
Bolivia (1995) | Operated: Incahuasi (50.00%) Non-operated: San Alberto (15.00%), San Antonio (15.00%), Itaú (41.00%) |
Brazil (1999) | Operated: Lapa (35.00%) (j) Non-operated: Libra (20.00%), Iara (22.50%) |
Canada (1999) | Non-operated: Surmont (50.00%), Fort Hills (24.58%) |
Colombia (2006) | Non-operated: Niscota (71.43%) |
United States (1957) | Operated: several assets in the Barnett Shale area (90.92% in average) Non-operated: several assets in the Utica Shale area (25.00%) (k), Chinook (33.33%), Tahiti (17.00%), Jack (25.00%) |
Venezuela (1980) | Non-operated: PetroCedeño (30.32%), Yucal Placer (69.50%) |
Asia-Pacific | |
Australia (2005) | Non-operated: several assets in UJV GLNG (27.50%) (l), Ichthys (26.00%) (m) |
Brunei (1986) | Operated: Maharaja Lela Jamalulalam (37.50%) Non-operated: Block CA 1- Unit (4.64%) |
China (2006) | Non-operated: South Sulige (49.00%) |
Indonesia (1968) | Non-operated: Block Sebuku (15.00%) |
Myanmar (1992) | Operated: Blocks M5/M6 (Yadana, Sein, Badamyar) (31.24%) |
Thailand (1990) | Non-operated: Bongkot (33.33%) |
(f) TOTAL’s interest in the joint-venture.
(g) TOTAL’s stake in the foreign consortium.
(h) TOTAL’s indirect stake (4.00%) in the concession through its 10.00% stake in Private Oil Holdings Oman Ltd. TOTAL also has a direct interest (5.54%) in the Oman LNG facility (trains 1 and 2), and an indirect participation (2.04%) through OLNG in Qalhat LNG (train 3).
(i) TOTAL’s direct interest in Block 53.
(j) TOTAL signed in December 2018 an agreement to acquire an additional 10% stake in the Lapa project in Brésil. The transaction, which remains subject to the approval of the Brazilian authorities, increases TOTAL’s interest in this asset from 35% to 45%
(k) TOTAL’s interest in the joint-venture with Chesapeake.
(l) TOTAL’s interest in the unincorporated joint-venture.
(m) TOTAL disposed in December 2018 of a 4% interest in the Ichthys project in Australia, thus reducing its interest in the asset from 30% to 26%.
2.1.9 Activities by geographical zone
The information below describes the Group’s main exploration and production activities presented by geographical zone (1), without detailing all of the assets held by TOTAL. In each zone, the countries are presented in decreasing order of production. The capacities referred to herein are expressed on a 100% basis, regardless of the Group’s stake in the asset(2).
2.1.9.1 Europe and Central Asia
In 2018, TOTAL’s production in the zone of Europe and Central Asia was 909 kboe/d, representing 33% of the Group’s total production, compared to 761 kboe/d in 2017 and 757 kboe/d in 2016. The two main producing countries in this zone in 2018 were Russia and Norway.
In Russia, where the largest percentage of TOTAL’s proved reserves are located (21% as of December 31, 2018), the Group’s production was 389 kboe/d in 2018, compared to 318 kboe/d in 2017 and 335 kboe/d in 2016. This production comes from TOTAL’s stake in PAO Novatek (3), as well as from the Termokarstovoye (4) and Kharyaga fields (20%) and, since the end of 2017, the Yamal LNG project (20%). Since 2015, Russia has been the leading country to the Group’s production.
TOTAL participates in the Yamal LNG project. In 2013, the company OAO Yamal LNG (5) launched this project aimed at developing the onshore field of South Tambey (gas and condensates) located on the Yamal Peninsula, and at building a three-train gas liquefaction plant with a total LNG capacity of 16.5 Mt/y. The Yamal LNG project’s financing was finalized in 2016 in compliance with applicable regulations. At the end of 2017, the Yamal LNG plant started production with the first shipment aboard "Christophe de Margerie". The second liquefaction train of the Yamal plant, with a capacity of 5.5 Mt/y, produced its first shipment of LNG in August 2018. The third liquefaction train started production in November 2018, more than one year ahead of the schedule planned when the project was launched. A fourth liquefaction train at small capacity (0.9 Mt/y), using PAO Novatek proprietary technology, is under construction.
In May 2018, TOTAL signed an agreement with Novatek to acquire a stake in Arctic LNG 2, the giant new LNG project led by Novatek. The agreement provides for the acquisition by TOTAL of a direct 10% interest in the project, which could be increased to 15% under certain conditions. The interest acquisition is effective further to the signing of the final contracts beginning of March 2019. Located on the Gydan Peninsula, facing Yamal, Arctic LNG 2 will have a production capacity of 19.8 Mt/y, and will use the hydrocarbon resources from the giant Utrenneye onshore gas and condensate field. The project will use the new gravity-based structures technology, with the installation of three gravity-based structures in Ob Bay that will host the three liquefaction trains of 6.6 Mt/y capacity each. It should benefit from possible synergies with the Yamal LNG project. The agreement also enables TOTAL to acquire a direct stake of between 10% and 15% in all future Novatek LNG projects on the Yamal and Gydan peninsulas.
In September 2018, TOTAL increased its stake from 18.9% to 19.4% of Novatek’s share capital, which is the maximum set forth in the initial 2011 agreement.
For further information on international economic sanctions applicable in Russia, refer to point 3.1.9 of chapter 3.
In Norway, the Group’s production was 211 kboe/d in 2018, compared to 239 kboe/d in 2017 and 235 kboe/d in 2016. This production comes from a multitude of fields, notably Ekofisk (39.9%), Sn-hvit (18.4%) and Troll (3.69%). TOTAL has equity stakes in 66 production licenses on the Norwegian maritime continental shelf, 14 of which it operates. The Group also holds an 18.4% stake in the gas liquefaction plant of Sn-hvit (capacity of 4.2 Mt/y). This plant, located in the Barents Sea, is supplied with production from the Sn-hvit and Albatross gas fields.
As part of the continual improvement of its North Sea portfolio, the Group has made a number of acquisitions and sales:
-the acquisition of an 8.44% interest in the Johan Sverdrup field, further to the acquisition of Mærsk Oil in March 2018;
-the announcement of the acquisition of a 12.35% interest of the Teesside terminal on Ekofisk in June 2018, increasing TOTAL’s interest from 32.87% to 45.22%;
-the finalization of the disposal of its interest in Polarled and Nyhamna in the Norwegian Sea zone in October 2018;
-the disposal of a 51% interest with the operatorship in the Martin Linge field, and of a 40% interest of the Garantiana discovery in the Greater Hild zone in March 2018;
-the finalization of the disposal of an interest with the operator’s role in the Trell (40%), Trine (64%), Rind (62.13%) and Alve Nord (100%) discoveries in the Heimdal and Haltenbanken areas, in November 2018;
-the disposal of a 7.7% interest in the Visund field in January 2018 and of a 57% interest in the Victoria discovery in January 2019; and
-the disposal of 7.65% interest in the Mikkel field in the Haltenbanken area, approved by the authority in December 2018, and closed in 2019.
In the United Kingdom, the Group’s production in 2018 was 179 kboe/d, compared with 142 kboe/d in 2017 and 158 kboe/d in 2016. This increase was driven in particular by the assets held in the Quad 9 and 15 areas of the eastern North Sea and Quad 30 in the Central Graben, integrated following the finalization of the acquisition of Mærsk Oil in March 2018.
-In the Alwyn area (100%), production from the Alwyn and Dunbar fields represents 45% of this area. The rest of the production comes from satellites linked to these fields. The drilling of an infill well in Alwyn is in progress.
-In the Central Graben, TOTAL holds stakes (46.17%, operator) in the Elgin, Franklin and West Franklin fields and (58.73%, operator) in the Glenelg field. The West Franklin Phase II project was completed in 2016. The Elgin redevelopment project includes the drilling of five wells. Four wells have been completed since 2016 and the fifth is in progress. Elsewhere, the drilling of a new infill well in Elgin is also in progess. In the Quad 30 area, the Group holds a stake in the Flyndre field (65.94%). The Culzean field (49.99%, operator) is under development and is expected to come into production in 2019. TOTAL announced a discovery on the Glengorm prospect (25%), close to existing infrastructures operated by TOTAL, in January 2019.
-In the West of Shetland area, TOTAL hold stakes (60%, operator) in the producing fields Laggan and Tormore, and Edradour and Glenlivet. In September 2018, the Group announced a discovery of gas in the Glendronach prospect, which is under appraisal. The total capacity of the Shetland gas treatment plant is 90 kboe/d.
(1) The geographical zones are as follows: Europe and Central Asia; Africa (excluding North Africa); Middle East and North Africa; Americas; and Asia-Pacific.
(2) For information on asset impairments, refer to Note 3 to the Group’s Consolidated Financial Statements (point 8.7 of chapter 8).
(3) A Russian company listed on the Moscow and London stock exchanges and in which the Group held an interest of 19.4% as of December 31, 2018.
(4) The development and production license of Termokarstovoye onshore gas and condensates field is held by ZAO Terneftegas, a joint-venture between Novatek and TOTAL (49%).
(5) OAO Yamal LNG is held by PAO Novatek, Total E&P Yamal (20.02%), China National Oil & Gas Exploration and Development (CNODC), a subsidiary of China National Petroleum Corporation (CNPC), and Silk Road Fund.
-In the Quad 9 area in the eastern North Sea, the Group holds stakes and the role of operator in the Gryphon (86.5%), Maclure (38.19%), South Gryphon (89.88%) and Tullich (100%) fields. In the Quad 15 area, the Group holds a 100% stake in the Dumbarton, Balloch, and Lochranza fields.
In 2018, TOTAL maintained its interests in the PEDL 273, 305 and 316 shale gas exploration and production licenses (20%), after sales of interests in various licenses and leases in 2017.
In November 2018, the Group disposed of 42.25% interests in the Bruce field retaining 1% and its entire interest in Keith field (25%).
In Kazakhstan, the Group’s production was 70 kboe/d in 2018, compared with 42 kboe/d in 2017 and 4 kboe/d in 2016. This comes mainly from the Kashagan field operated by the North Caspian Operating Company (NCOC) in the North Caspian license (16.81%). The production of the first phase of the Kashagan field and of the corresponding plant started in 2016, and the ramp-up of the production is underway in order to reach the planned capacity of 370 kb/d. Following the finalization of the acquisition of Mærsk Oil in March 2018, the Group holds an interest in the Dunga field (60%, operator).
In Denmark, TOTAL is present through its 31.2% stake with an operator’s role in the assets operated by the Danish Underground Consortium (DUC), following the finalization of the acquisition of Mærsk Oil in March 2018. In September 2018, TOTAL also signed an agreement to acquire the entire capital of Chevron Denmark Inc. This acquisition, which is expected to be closed in 2019, will increase the Groupe’s interest in DUC to 43.2%. In 2018, the Group’s production was 42 kboe/d. The 100%-operated production comes from two main DUC assets: the Dan/Halfdan and Gorm/Tyra fields. The Tyra field facilities constitute the main gas treatment hub in Denmark. The Tyra field must be redeveloped due to subsidence problems, and is expected to restart in 2022.
In the Netherlands, the Group’s production was 18 kboe/d in 2018 compared to 20 kboe/d in 2017 and 25 kboe/d in 2016. This decrease is due to natural field decline. In 2018, TOTAL holds interests in 22 offshore production licenses, including 18 that it operates. In 2017, production on platforms L7 and F15 stopped and the platforms will be dismantled.
In Italy, TOTAL holds stakes in the Tempa Rossa field (50%, operator) located on the Gorgoglione concession (Basilicate region), as well as three exploration licenses. Construction works and commissioning activities are finalized and the start of production is expected in 2019 subject to the Basilicata region’s authorities authorization.
In Azerbaijan, TOTAL signed an agreement in 2016 establishing the contractual and commercial conditions for a first phase of production of the Absheron gas and condensate field (50%), which is located in the Caspian Sea and was discovered by TOTAL in 2011. The production capacity of this high pressure field is expected to be 35 kboe/d and the gas produced will supply Azerbaijan’s domestic market. Drilling operations started in February 2018 and the main facilities construction contracts were awarded in July and October 2018. The role of operator was transferred to the joint TOTAL and SOCAR company (JOCAP) in August 2018.
In Bulgaria, where TOTAL has been present since 2012, the Group drilled the Polshkov deep offshore exploration well in 2016 on the Han Asparuh Block (40%, operator), with a surface area of 14,220 km², 100 km offshore in the Black Sea, which revealed the presence of oil. The second and third wells drilled in 2017 and 2018 accordingly were expensed in 2018.
In Greece, TOTAL (50%, operator) and its partners have held the exploration license for the offshore Block 2 in the Ionian Sea since March 2018. TOTAL undertook geological and seismic analysis, after which the Group will decide to continue or not the works on this license. Elsewhere, TOTAL (40%, operator) and its partners were chosen to explore two offshore blocks south-west of Crete. The license is expected to be attributed definitively in 2019.
Rest of the Europe and Central Asia area
TOTAL also holds interests (33.35%) in an exploration license without activity in Tajikistan. In October 2018, the Group signed a cooperation agreement in Uzbekistan with the state-owned company UzbekNefteGas to appraise the exploration potential of six blocks in the north-east of the country.
2.1.9.2 Africa (excluding North Africa)
In 2018, TOTAL’s production in the Africa zone (1) was 670 kboe/d, representing 24% of the Group’s total production, compared with 654 kboe/d in 2017 and 634 kboe/d in 2016. The two main producing countries in this zone in 2018 were Nigeria and Angola.
In Nigeria, the Group’s production, primarily offshore, was 284 kboe/d in 2018 compared to 267 kboe/d in 2017 and 243 kboe/d in 2016. This increase in production comes from additional opportunities for gas exports to Nigeria LNG Ltd (NLNG) and from the development of Ofon phase 2 (OML 102).
TOTAL operates five production licenses (OML) on the 33 leases in which the Group has interests (including one exploration licenses).
TOTAL has offshore operations (production was 183 kboe/d in 2018) notably on the following leases:
-on OML 130 (24%, operator), the production from the Egina field started in December 2018. At plateau, the Egina field is expected to produce 200 kboe/d. The Preowei field development plan was filed with partners and authorities in 2018;
-on OML 139 (18%), the plan to develop the Owowo discovery, made in 2012, is under study. This discovery is near the OML 138 license (20%), where the Usan field is in production;
-on OML 102 (40%, operator), the drilling of the 23 additional wells (Ofon, phase 2) was completed in 2018;
-on OML 99 (40%, operator), the engineering studies for the development of the Ikike have been completed and the tender process for the construction is in progress; and
-on OML 118 (12.5%) the tender phase of the Bonga South West Aparo project (10% unitized) has been launched in February 2019.
TOTAL also has onshore operations (production was 102 kboe/d in 2018), notably:
-on OML 58 (40%, operator), as part of the joint-venture with the Nigerian National Petroleum Corporation (NNPC). It has been supplying gas to NLNG and on the domestic Nigerian market since 2016; and
-in relation to the SPDC joint-venture (10%), which holds 20 production licenses (of which 17 are located onshore), the 2018 production was 58 kboe/d (of which 54 kboe/d was onshore). The sale process of OML 25 is underway. TOTAL has obtained an extension of 16 licences for a 20-year period.
TOTAL is also developing LNG activities with a 15% stake in NLNG, which owns a liquefaction plant with a 22 Mt/y total capacity. The tender process for the engineering works for the construction of about 7 Mt/y of additional capacity started in mid-2018.
(1) Excluding North Africa, which is reported in the zone of the Middle East and North Africa.
In Angola, where TOTAL is the leading oil operator in the country (1), the Group’s production was 211 kboe/d in 2018 compared to 229 kboe/d in 2017 and 243 kboe/d in 2016. It comes from Blocks 17, 14, 0 and 32:
-deep offshore Block 17 (40%, operator), TOTAL’s main asset in Angola, is composed of four major producing hubs: Girassol, Dalia, Pazflor and CLOV. In 2018, TOTAL and its partners decided to launch three brownfield projects: Zinia Phase 2, Clov Phase 2 and Dalia Phase 3. These projects are satellite developments of the Pazflor, CLOV and Dalia FPSOs, and are expected to start up production in 2020 and 2021;
-on the ultra deep offshore Block 32 (30%, operator), production of the Kaombo project started in July 2018 with the start-up of the Kaombo Norte FPSO (capacity of 115 kb/d). The start-up of the second Kaombo Sul FPSO, with the same capacity, is expected in 2019. The discoveries in the central and northern parts of the Block (outside Kaombo) offer additional potential and are currently being assessed;
-on Block 14 (20%) (2), production comes from the Tombua-Landana and Kuito fields as well as the BBLT project, comprising the Benguela, Belize, Lobito and Tomboco fields;
-Block 14K (36.75%) is the offshore unitization area between Angola (Block 14) and the Republic of the Congo (Haute Mer license). TOTAL’s interest in the Lianzi field is held at 10% through Angola Block 14 BV and 26.75% through Total E&P Congo;
-on Block 0 (10%), the second phase of the Mafumeira field development project started production in 2017;
-on Block 48 (50%, operator), TOTAL obtained the licence in 2018. The first phase of this program is expected to last for two years with the drilling of one exploration well; and
-TOTAL is also operator of the blocks 25 and 40 (35% and 40% respectively) in the offshore Kwanza basin. Exploration works did not enabled to confirm the basin’s potential.
TOTAL is also developing its LNG activities through the Angola LNG project (13.6%), which includes a gas liquefaction plant with a total capacity of 5.2 Mt/y near Soyo, supplied by gas associated with production from Blocks 0, 14, 15, 17, 18 and 32. LNG production resumed in 2016. Following work to increase the reliability of the facilities, the plant has been capable of processing all of the gas supplied since 2017.
In the Republic of the Congo, the Group’s production, through its subsidiary Total E&P Congo (3), was 136 kboe/d in 2018 compared to 104 kboe/d in 2017 and 90 kboe/d in 2016.
-Two major assets are in production on the Moho Bilondo license: the Moho Bilondo field (53.5%, operator), of which phase 1b came into production in 2015, and the Moho Nord field, which reached its production plateau at the end of 2017. The Moho Nord field has been producing more than its capacity of 100 kboe/d since the start of 2018 due to the strong productivity of the wells.
-Block 14K (36.75%) is the offshore unitization area between Angola (Block 14) and the Republic of the Congo (Haute Mer license). TOTAL’s interest in the Lianzi field is held at 10% through Angola Block 14 BV and 26.75% through Total E&P Congo.
-Total E&P Congo is operator of Djéno (63%), the sole oil terminal in the country.
-At the end of 2016, Total E&P Congo returned its interests in the Tchibouela, Tchendo, Tchibeli and Litanzi fields (65%) to the Republic of the Congo, as the licenses have expired.
In the Democratic Republic of Congo, after the seismic delineation works, TOTAL notified in January 2019 the authorities its withdrawal from Block III.
In Gabon, the Group’s production was 39 kboe/d in 2018 compared to 54 kboe/d in 2017 and 58 kboe/d in 2016. In September 2018, TOTAL finalized the sale of a residual interest of 32.9% in the Rabi-Kounga onshore field, thereby completing a strategic shift of its activities to offshore Nord, following the sale in 2017 of interests in certain onshore and offshore fields representing production of 13 kboe/d.
The Group’s activities in Gabon are exclusively carried out by Total Gabon (4). Total Gabon wholly owns and operates the Anguille and Torpille sector offshore fields, the Mandji Island sector onshore fields and the Cap Lopez oil terminal. In November 2018, Total Gabon launched a drilling campaign on Torpille, as part of the first phase of the redevelopment of the field.
In Uganda, TOTAL is present in the Lake Albert project, a major project for the Group, via a stake in licenses EA-1, EA-1A, EA-2 and EA-3 (Kingfisher). TOTAL is the operator of licenses EA-1 and EA-1A. In January 2017, TOTAL signed an agreement to acquire 21.57% of the 33.33% interest held by Tullow in the licenses. TOTAL will take over operatorship from Tullow of the northern portion of license EA-2, enabling significant efficiency gains and synergies for the development of the northern part of the project (known as Tilenga). China National Offshore Oil Corporation (CNOOC) has exercised its pre-emption right on 50% of the interest acquired. The agreement remains subject to approval by the Ugandan authorities. Following the finalization of the transaction, TOTAL is expected to own a 44.1% stake in the Lake Albert project. The State of Uganda retains the right to take a stake of 15% in the four licences (when the final investment decision is made). The exercise of this right would reduce TOTAL’s interest to 37.5%.
The tender process for the front end engineering and design (FEED) work for the upstream part of the project was launched in 2018 and the construction contract for surface installations is expected to be awarded in 2019. Similarly, drilling work was the subject of competitive bidding in 2018 and award of the contracts is expected in 2019. The pipeline engineering works were finalized at the end of 2017, and the calls for tender for the construction of the facilities are in progress.
In Mauritania, TOTAL strengthened its exploration position through the signature of four new deep offshore licenses (Blocks C7 and C18 in 2017 and Blocks C15 and C31 in 2018). These licenses added to TOTAL’s portfolio, which already contained Block C9 since 2012.
In Senegal, TOTAL signed two agreements to explore the country’s deep offshore potential in 2017 through the acquisition of the deep offshore Block Rufisque and a technical evaluation contract of ultra deep offshore ultra deep offshore.
In Kenya, TOTAL holds 45% of the offshore licenses L11A, L11B and L12 and 25% of the onshore licenses 10BA, 10BB and 13T where oil discoveries have been made.
In South Africa, TOTAL has entered several agreements to step up its exploration efforts in the country, and the drilling of an exploration well started in December 2018 in the offshore11B/12B exploration license (45%, operated), located on the southern coast. In February 2019, TOTAL announced a gas condensate discovery on the Brulpadda prospect.
Rest of the zone of Africa
TOTAL also holds interests in exploration licenses in Côte d’Ivoire, and in Namibia. In Guinea, TOTAL and the Office National des Pétroles de Guinée (ONAP) signed a study agreement in 2017 for deep and very deep offshore zones.
(1) Company data.
(2) Stake held by the company Angola Block 14 BV (TOTAL 50.01%).
(3) Total E&P Congo is owned by TOTAL (85%) and Qatar Petroleum (15%).
(4) Total Gabon is a company under Gabonese law, the shares of which are listed on Euronext Paris and owned by TOTAL (58.28%), the Republic of Gabon (25%) and the public (16.72%).
2.1.9.3 Middle East and North Africa
In 2018, TOTAL’s production in the zone of the Middle East and North Africa was 666 kboe/d, representing 24% of the Group’s total production, compared to 559 kboe/d in 2017 and 517 kboe/d in 2016. The two main producing countries in this zone in 2018 were the United Arab Emirates and Qatar.
In the United Arab Emirates, the Group’s production was 288 kboe/d in 2018 compared to 290 kboe/d in 2017 and 291 kboe/d in 2016.
Since March 2018, the Group holds a 20% interest in the Umm Shaif/Nasr offshore concession and a 5% stake in the Lower Zakum offshore concession, for a period of 40 years operated by ADNOC Offshore, which follows the previous Abu Dhabi Marine Areas Ltd (ADMA) offshore concession.
In November 2018, TOTAL and the state-owned Abu Dhabi National Oil Company (ADNOC) signed a concession agreement to launch an exploration program for unconventional gas in the Diyab prospection zone.
In 2015, the Group had also renewed its 10% interest in the Abu Dhabi Company for Onshore Petroleum Operations Ltd concession (ADCO, renamed ADNOC Onshore in 2017) for 40 years. This concession covers the 15 main onshore fields of Abu Dhabi.
TOTAL holds 100% and is the operator of the Abu Al Bukoosh offshore field, for which the contract was extended for 3 years in March 2018.
TOTAL also holds a 15% stake in Abu Dhabi Gas Industries (GASCO, renamed ADNOC Gas Processing in 2017), which produces NGL (natural gas liquids) and condensates from the associated gas produced by ADNOC Onshore. In addition, TOTAL holds 5% of the Abu Dhabi Gas Liquefaction Company (ADGAS, renamed ADNOC LNG in 2017), which processes the associated gas produced by ADNOC Offshore in order to produce LNG, NGL and condensates, and 5% of National Gas Shipping Company (NGSCO), which owns eight LNG tankers and exports the LNG produced by ADNOC LNG.
TOTAL holds a 24.5% stake in Dolphin Energy Ltd. that sells gas from Qatar to the United Arab Emirates. The operations of Dolphin Energy were not impacted by the evolution of the diplomatic relations between the United Arab Emirates and Qatar.
In Qatar, the Group’s production was 211 kboe/d in 2018 compared to 170 kboe/d in 2017 and 134 kboe/d in 2016.
Since 2017 TOTAL holds a 30% stake in the Al Shaheen oil field concession located 80 km offshore to the north of Ras Laffan for a period of 25 years. The Al Shaheen field is operated by the North Oil Company, held by TOTAL (30%) and Qatar Petroleum (70%).
TOTAL also holds a stake in the Al Khalij offshore field (40%, operator).
In addition, the Group participates in the production, processing and exporting of gas from the North Field through its stakes in the Qatargas 1 and Qatargas 2 LNG plants:
-Qatargas 1: TOTAL holds a 20% interest in the North Field-Qatargas 1 Upstream field and a 10% interest in the LNG plant (three trains with a total capacity of 10 Mt/y); and
-Qatargas 2: the Group holds a 16.7% stake in train 5, which has an LNG production capacity of 8 Mt/y.
TOTAL offtakes part of the LNG produced in accordance with the 2006 contracts which provides for the purchase of 5.2 Mt/y of LNG by the Group.
TOTAL holds a 24.5% stake in Dolphin Energy Ltd. that sells gas from the Dolphin Block in Qatar to the United Arab Emirates and Oman.
In Libya, the Group’s production was 63 kboe/d in 2018 compared to 31 kboe/d in 2017 and 14 kboe/d in 2016. This production comes from the Al Jurf fields located on offshore areas 15, 16 and 32 (75%(1)) and from the El Sharara fields located on onshore areas 129-130 (30% (1)) and 130-131 (24%(1)). On these areas, production was shut-down in July and December 2018 for security reasons. The Mabruk fields, located on onshore areas 70 and 87 (75%(1)) have been shut-down since the end of 2014.
Additionally, in March 2018, TOTAL acquired Marathon Oil Libya Limited, which holds a 16.33% stake in the Waha Concessions.
In Algeria, the Group’s production was 47 kboe/d in 2018, compared to 15 kboe/d in 2017 and 23 kboe/d in 2016. Production in 2016 and 2017 came exclusively from the fields in the TFT zone (Tin Fouyé Tabankort, 35%), while production in 2018 also includes the Timimoun field (37.75%) and the fields in the Berkine Basin (404a and 208, 12.25%). Production on the Timimoun gas field started in March 2018.
Under the terms of the Global Agreement signed in 2017, two new concession contracts and the corresponding contracts for the sale of gas were signed for TFT II (26.4%) in June 2018, and for TFT SUD (49%) in October 2018. A concession contract and a gas marketing contract for Timimoun were also signed at the end of 2017, subsituting those dated July 2002.
The finalization of the acquisition of Mærsk Oil in March 2018 allowed for the incorporation of the 404a and 208 Blocks oil assets in the Berkine Basin.
In December 2018, TOTAL was awarded two authorizations to conduct exploration works on two offshore prospective areas, with operatorship for one of them.
In Oman, the Group’s production was 38 kboe/d in 2018 compared to 37 kboe/d in 2017 and 2016. TOTAL participates in the production of oil principally in Block 6 (4%)(2). In December 2018, TOTAL has signed a sale agreement for its interest in Block 53 (2%), finalization is expected in 2019. The Group also produces LNG through its investments in the Oman LNG (5.54%)/Qalhat LNG (2.04%) (3) liquefaction complex, with an overall capacity of 10.5 Mt/y. In May 2018, TOTAL signed an MOU with the Oman government to develop onshore natural gas resources, on Block 6 in the Greater Barik area.
In Iraq, the Group’s production was 19 kboe/d in 2018 compared to 16 kboe/d in 2017 and 18 kboe/d in 2016. TOTAL holds a 22.5% stake in the risked service contract for the Halfaya field, located in Missan province. Following development studies in 2016, the decision to develop phase 3 of the project to increase production to 400 kb/d was taken in 2017. The new facilities started up at the end of 2018.
Following the finalization of the acquisition of Mærsk Oil in March 2018, TOTAL holds an 18% interest in the Sarsang field in Iraqi Kurdistan.
In Yemen, there has been no Group production since 2016. Due to the security conditions in the vicinity of Balhaf, Yemen LNG, in which the Group holds a stake of 39.62%, stopped its commercial production and export of LNG in April 2015, when Yemen LNG declared force majeure to its various stakeholders. The plant is in a preservation mode.
TOTAL holds various stakes in four onshore exploration licenses, for which a situation of force majeure has been declared. In addition, TOTAL signed an agreement to sell its interest in Block 5 (Marib Basin, Jannah license, 15%) in 2018. This agreement remains subject to the authorities’ approval.
(1) TOTAL’s stake in the foreign consortium.
(2) TOTAL holds an indirect 4% stake in Petroleum Development Oman LLC, operator of Block 6, via its 10% stake in Private Oil Holdings Oman Ltd.
(3) TOTAL’s indirect stake via Oman LNG’s stake in Qalhat LNG.
In Iran, following the withdrawal of the United States from the Joint Comprehensive Plan of Action on May 8, 2018, TOTAL withdrew from the project SP11 of the giant South Pars gas field and finalized its withdrawal on October 29, 2018, before the re-imposition of US secondary sanctions on the oil industry as of November 5, 2018. TOTAL was the operator and had a 50.1% interest alongside the Chinese state-owned company CNPC (30%) and Petropars (19.9%); a wholly-owned subsidiary of National Iranian Oil Company (NIOC). TOTAL ceased all operational activity in Iran before November 4, 2018. For information on international economic sanctions concerning Iran, refer to point 3.1.9 of chapter 3.
In Syria, TOTAL has had no production and no activity since December 2011. The Group has a 100% stake in the Deir Ez Zor license, which was operated by the joint-venture company DEZPC, in which TOTAL and the state-owned company SPC each have a 50% share. Additionally, TOTAL is holder of the Tabiyeh contract which came into effect in 2009. For information on international economic sanctions concerning Syria, refer to point 3.1.9 of chapter 3.
In Lebanon, TOTAL entered two exploration Blocks 4 and 9 (40%, operator) located offshore Lebanon in February 2018.
Rest of the zone of the Middle East and North Africa
TOTAL also holds interests in exploration licenses in Cyprus and Egypt.
2.1.9.4 Americas
In 2018, TOTAL’s production in the zone of the Americas was 389 kboe/d, representing 14% of the Group’s total production, compared to 348 kboe/d in 2017 and 279 kboe/d in 2016. The two main producing countries in this zone in 2018 were the United States and Canada.
In the United States, the Group’s production was 119 kboe/d in 2018 compared to 123 kboe/d in 2017 and 86 kboe/d in 2016.
In the Gulf of Mexico, TOTAL holds interests in the Tahiti (17%) and Chinook (33.33%) deep offshore fields, and, thanks to the acquisition of Mærsk Oil in March 2018, in the Jack (25%) field. The Tahiti Vertical Expansion (TVEX) project, launched in 2016, started production in June 2018, enabling the field to maintain a level of production of about 100 kboe/d. Since the end of 2014, the Jack field has been sending its production to a semi-submersible platform shared with the Saint-Malo and Julia fields.
In January 2018, TOTAL acquired 12.5% of the Anchor discovery, when it took over Samson Offshore Anchor LLC. As part of the process to wind up Cobalt International Energy in April 2018, TOTAL increased its stake in the North Platte and Anchor deep offshore discoveries by 20%. TOTAL now holds 60% of North Platte, which it now operates, and 32.5% of Anchor. FEED development activities on Anchor commenced in 2018.
The Group has also launched the appraisal program of the Ballymore discovery, announced in January 2018, in which it holds a 40% interest.
In its Barnett shale gas assets (90.92%), TOTAL has stabilized the level of operated production through a program of works in 2017 and 2018.
TOTAL also has an interest of 25% in a Chesapeake-operated asset that produces shale gas operated by Chesapeake in the Utica Basin (on an acreage mainly located in Ohio). TOTAL has not taken part in any drilling during the last three years.
In Canada, the Group’s production increased to 95 kboe/d in 2018 compared to 59 kboe/d in 2017 and 34 kboe/d in 2016. This increase is due:
-to the start-up in January 2018 and the rapid ramp-up during the year of production of the Fort Hills oil sands mining extraction project. In the fourth quarter of 2018, the project reached levels close to its plateau of 180 kboe/d. Following several interest disposals in 2015 and 2017, TOTAL now holds a 24.58% stake in Fort Hills; and
-to the strong operational performance of the Surmont SAGD (1) oil sands project, in which TOTAL holds a 50% stake.
In September 2018, TOTAL sold its 38.25% stake in the Joslyn project, which was suspended in 2014.
In Argentina, TOTAL operated approximately 30%(2) of the country’s gas production in 2018. The Group’s production was 79 kboe/d in 2018, compared to 76 kboe/d in 2017 and 78 kboe/d in 2016:
-in Tierra del Fuego, on the CMA-1 concession, TOTAL operates the Ara and Cañadon Alfa Complex onshore fields and the Hidra, Carina and Aries offshore fields (37.5%). In 2016, TOTAL started production on the Vega Pleyade offshore gas and condensates field (37.5%, operator), which has a production capacity of 350 Mcf/d; and
-in the Neuquén onshore Basin, the Group holds interests in 10 licenses and operates 6 of them, including Aguada Pichana Este and San Roque, where production has already started. Three shale gas and oil pilot projects were launched: the first on the Aguada Pichana Block, where production started mid-2015 in order to produce gas; the second on the Rincón la Ceniza Block, located on the gas and condensate portion of Vaca Muerta (45%, operator), where production started in 2016; and the third on the Aguada San Roque Block (24.71%, operator), which was launched in 2017 to produce oil.
Following the good results of the Aguada Pichana pilot project and a reduction in drilling costs, the first phase of development of the giant Vaca Muerta shale play was launched in 2017 in the eastern part of the Block. In this project, all the partners of Aguada Pichana, Total Austral S.A. (27.27%, operator), YPF S.A. (27.27%), Wintershall Energia S.A. (27.27%) and Panamerican Energy LLC (18.18%) have signed an agreement to split the Block in two. This agreement has enabled TOTAL to remain the operator of the Aguada Pichana Este Block, with 27.27% of the conventional part (Mulichinco), and 41% of the Unconventional part (Vaca Muerta), and to adjust its interest in the Aguada Pichana Oeste, which is now non-operated, to 25%.
A second development phase was launched on the Aguada Pichana Este - Vaca Muerta Block in July 2018. It should allow the production plateau to reach 500 Mcf/d, which corresponds to the capacity of the existing plant.
On the Aguada Pichana Oeste Block, TOTAL (25%) is taking part in the pilot, which came into production in 2017.
The wells of the first pilot on San Roque have been in production since July 2018 and the drilling of a second series of wells started in July 2018.
The initial results of the pilot development on the Rincón la Ceniza Block are encouraging at this stage. The delineation well drilled in 2016 on the La Escalonada Block in order to test the oil portion of the formation has also demonstrated good productivity.
In Bolivia, the Group’s production, mainly gas, was 42 kboe/d in 2018 compared to 46 kboe/d in 2017 and 34 kboe/d in 2016. TOTAL is present on six licenses. Five of them have fields in production: San Alberto (15%), San Antonio (15%), Block XX Tarija Oeste (41%), and Aquio and Ipati (50%, operator), where the Incahuasi gas field started production in August 2016.
(1) Steam Assisted Gravity Drainage: production by injection of recycled water vapor.
(2) Source: Department of Federal Planning, Public Investment and Services, Energy Secretariat.
On the Aquio and Ipati Blocks of the Incahuasi field, the decision was taken to connect the ICS-3 well in 2017, and the increase of the plant’s capacity to 390 Mcf/d was approved in June 2018.
An exploration well is expected to be drilled on the Azero exploration license (50%) in 2019.
In Venezuela, the Group’s production was 34 kboe/d in 2018 compared to 44 kboe/d in 2017 and 47 kboe/d in 2016. It comes from the Group’s interests in PetroCedeño (30.32%) and Yucal Placer (69.5%). The development of the extra heavy oil field of PetroCedeño continues (26 wells were drilled in 2018, compared to 49 in 2017 and 39 in 2016), as well as the debottlenecking project for the water separation and treatment facilities. For information on international economic sanctions concerning Venezuela, refer to point 3.1.9 of chapter 3.
In Brazil, the Group’s production totaled 19 kboe/d in 2018, which was the Group’s first full year of production in the country. The production comes from the Libra (20%) field, where the part in production was renamed Mero in 2017, and the Lapa (35%, operator) and Iara (22.5%) fields. The Mero field is located in the Santos Basin in very deep waters (2,000 m), approximately 170 km off the coast of Rio de Janeiro. At year-end 2018, 15 wells had been drilled and the production started in 2017 with the FPSO Pioneiro de Libra (50 kb/d capacity) designed to carry out the long-term production tests necessary for optimizing future development phases. The first development phase (17 wells connected to an FPSO with a capacity of 150 kb/d) also started in 2017.
In 2017, TOTAL and Petrobras signed definitive contracts in relation to a package of assets in Brazil contemplated by their strategic alliance agreed in 2016. As part of this strategic alliance, in January 2018, TOTAL acquired a 22.5% interest in the concession Iara, located in Block BM-S-11A, which is currently under development, as well as a 35% interest and the operatorship in the Lapa field concession area, located in Block BM-S-9A, which started up in 2016. TOTAL holds a 35% interest in Lapa field. TOTAL is expected to increase to 45% following the finalization of the acquisition of an additional interest of 10%, which is subject to approval by the relevant Brazilian authorities. The agreements provide for the strengthening of technical cooperation between the two companies, in particular by the joint assessment of the exploration potential of promising areas in Brazil and by the development of new technologies, in particular in deep offshore. On Iara, the declaration of the commerciality of two developments has been made, one for the development of the two Berbigao and Sururu-West fields, and the other for the development of the Atapu field. On the Sururu field, a six-month production test has been completed and the drilling of an appraisal well has revealed the highest oil column in the pre-salt in Brazil (530 m).
The acquisition of Mærsk Oil in March 2018 allowed for the incorporation of new assets in TOTAL’s portfolio in Brazil: Wahoo (28.6%) and Itaipu (40%) respectively on the BMC-30 and BMC-32 Blocks in the Campos Basin.
In addition, the Group holds 17 exploration licenses located in the Barreirinhas, Ceará, Espirito Santo, Foz do Amazonas and Pelotas basins.
In Colombia, TOTAL started production on the Niscota field (71.4%) in 2017. The commerciality of the development of the field was declared In November 2018. The Group’s production totaled 1 kboe/d in 2018.
In Mexico, TOTAL was awarded exploration licenses in 2016 on three blocks in offshore Mexico, following the country’s first competitive deep water bid round. Located in the Perdido Basin, Block 2 (50%, operator) covers an area of 2,977 km² at depths of between 2,300 and 3,600 meters. TOTAL also holds stakes in Blocks 1 (33.33%) and 3 (33.33%), located in the Salina Basin, and in Block 15 (60%, operator). In March 2018, TOTAL obtained three exploration blocks in the shallow waters of the Campeche Basin: Block 32 (50%), Block 33 (50%, operator) and Block 34 (42.5%).
In Guyana, TOTAL finalized in 2018 the acquisition of a 35% stake in the Canje Block, 25% of the Kanuku Block and 25% of the Orinduik Block, as part of the exploration of the prolific offshore Guyana Basin. The acquisition of these interests has been approved by the authorities.
Rest of the Americas zone
At the end of 2018, TOTAL disposed of its interests in the Aruba exploration license. The Group holds an interest in the Guyane Maritime license in French Guiana (100%, operator), on which plug and abandonmet operations of the negative exploration well GMES-6 are in progress.
2.1.9.5 Asia-Pacific
In 2018, TOTAL’s production in the zone of Asia-Pacific was 141 kboe/d, representing 5% of the Group’s overall production, compared to 244 kboe/d in 2017 and 265 kboe/d in 2016. The two main producing countries in this zone in 2018 were Thailand and Australia.
In Thailand, the Group’s production was 52 kboe/d in 2018 compared to 58 kboe/d in 2017 and 60 kboe/d in 2016. This production comes from the Bongkot offshore gas and condensate field (33.33%). The Thai state-owned company PTT purchases all of the natural gas and condensate production. New platforms were installed in 2018 to maintain the production plateau.
In Australia, the Group’s production was 34 kboe/d in 2018 compared to 19 kboe/d in 2017 and 16 kboe/d in 2016. It comes from Gladstone LNG (GLNG) (27.5%) and Ichthys LNG, project for which the start of the offshore production began in July 2018 and the first export of LNG occured in October 2018. The Ichthys LNG project involves the development of a gas and condensate field located in the Browse Basin. This development includes a platform for the production, processing and export of gas, an FPSO for processing and exporting the condensate, an 889 km gas pipeline and an onshore liquefaction plant in Darwin. When running at full capacity, the two trains of the gas liquefaction plant will supply 8.9 Mt/y of LNG, 100,000 barrels of condensates per day and 1.65 Mt/y of LPG. The LNG has already been sold, mainly on the Asian market, under long-term contracts. TOTAL disposed in December 2018 of a 4% interest in the Ichthys LNG project in Australia, thus reducing TOTAL’s interest in the asset from 30% to 26%.
GLNG is an integrated production, transportation and liquefaction project from the Fairview, Roma, Scotia and Arcadia fields with a capacity of 7.8 Mt/y located on Curtis Island, Queensland. The plant’s two trains are in production.
In Brunei, the Group’s production was 19 kboe/d in 2018 compared to 21 kboe/d in 2017 and 18 kboe/d in 2016. It comes from the Maharaja Lela Jamalulalam condensate gas field on Block B (37.5%, operator) and from the unitized Gumusut-Kakap field, of which the part in Brunei is located on Block CA1 (86.9%, operator). The signing of the unitization agreements in July 2018 gives TOTAL access to 4.64% of the Gumusut-Kakap field, which started in 2012 and produced 155 kboe/d of oil in 2018. The gas from the Maharaja Lela Jamalulalam field is delivered to the Brunei LNG liquefaction plant.
On the CA1 deep offshore exploration Block (86.9%, operator), the exploration license was extended for two years in October 2018.
In Myanmar, the Group’s production was 17 kboe/d in 2018 compared to 19 kboe/d in 2017 and 21 kboe/d in 2016.
The Yadana field (31.24%, operator), located on the offshore Blocks M5 and M6, primarily produces gas for delivery to PTT for use in Thai power plants. The Yadana field also supplies the domestic market via an offshore pipeline built and operated by MOGE, a Myanmar state-owned company. In 2017, TOTAL started production on the Badamyar field, a satellite of the Yadana field. This project is expected to make it possible to extend production on this gas field, which is 8 Bcf/y, beyond 2020.
In 2015, the Group entered exploration license A6 (40%) located in the deep offshore area west of Myanmar, where a gas discovery has been made. A delineation well drilled in 2018 has produced encouraging results. These discoveries are currently being assessed.
In 2015, TOTAL signed a production sharing contract on the deep offshore YWB Block (100%, operator). The 2016 2D seismic survey was followed by a 3D seismic survey in 2018.
In China, the Group’s production was 16 kboe/d in 2018 compared to 15 kboe/d in 2017 and 10 kboe/d in 2016. This production comes from the South Sulige Block (49%) in the Ordos Basin of Inner Mongolia, where the drilling of tight gas development wells is ongoing.
In 2017, TOTAL signed a production sharing contract on the Taiyang exploration Block (49%, operator), located in both Chinese and Taiwanese waters in the China Sea. A 2D seismic survey was carried out in 2018.
In Indonesia, Group production was 3 kboe/d in 2018, compared with 112 kboe/d in 2017 and 140 kboe/d in 2016, given the expiry of the Mahakam license and the transfer of the corresponding activities to Pertamina (operator) on January 1, 2018. The Group still holds an interest in the Sebuku license (15%), production from the Ruby gas field is routed by pipeline for processing and separation at the Senipah terminal.
In Papua New Guinea, the Group owns a stake in Block PRL-15 (40.1%, operator since 2015). The State of Papua New Guinea retains the right to take a stake in the license (when the final investment decision is made) at a level of 22.5%. In this case, TOTAL’s stake would be reduced to 31.1%. Block PRL-15 includes the two discoveries Elk and Antelope. The delineation program of these discoveries was completed in 2017 and the results of the wells drilled confirmed the resource levels of the fields. Development studies continued in 2018.
TOTAL holds interests in the PPL339 (35%), PPL589 (100%) and PPL576 (100%) exploration licenses. The interpretation of the multi-client seismic survey performed in late 2016 on PPL576 revealed some promising prospects.
TOTAL and its partners signed on November 2018 a Memorandum of Understanding with the Independent State of Papua New Guinea defining the key terms of the Gas Agreement for the Papua LNG Project. The proposed Gas agreement is expected to be finalized in the first half of 2019.
Rest of the Asia-Pacific zone
TOTAL also holds interests in exploration licenses in Malaysia and the Philippines. In Cambodia, TOTAL is working to implement an agreement entered into in 2009 with the Cambodian government for the exploration of Block 3 located in an area of the Gulf of Thailand disputed by the governments of Cambodia and Thailand. This agreement remains subject to the establishment by both countries of an appropriate contractual framework. In Sri Lanka, in 2016 TOTAL signed an agreement to proceed with surveys on the offshore JS-5 and JS-6 Blocks off the east coast.
2.1.10 Oil and gas acreage
As of December 31 (in thousands of acres) | 2018 | ||
Undeveloped acreage (a) | Developed acreage | ||
Europe and Central Asia (excl. Russia) | Gross | 19,649 | 923 |
Net | 7,450 | 221 | |
Russia | Gross | 3,733 | 619 |
Net | 685 | 127 | |
Africa (excl. North Africa) | Gross | 77,537 | 718 |
Net | 55,174 | 198 | |
Middle East and North Africa | Gross | 31,406 | 3,037 |
Net | 6,068 | 427 | |
Americas | Gross | 24,595 | 1,102 |
Net | 13,355 | 509 | |
Asia-Pacific | Gross | 42,332 | 668 |
Net | 24,566 | 204 | |
TOTAL | GROSS | 199,252 | 7,067 |
NET (b) | 107,298 | 1,686 | |
(a) Undeveloped acreage includes leases and concessions.
(b) Net acreage equals the sum of the Group’s equity stakes in gross acreage.
2.1.11 Productive wells
As of December 31 (number of wells) | 2018 | ||
Gross productive wells | Net productive wells (a) | ||
Europe and Central Asia (excl. Russia) | Oil | 767 | 261 |
Gas | 314 | 98 | |
Russia | Oil | 337 | 65 |
Gas | 627 | 113 | |
Africa (excl. North Africa) | Oil | 1,533 | 429 |
Gas | 75 | 14 | |
Middle East and North Africa | Oil | 11,189 | 711 |
Gas | 190 | 40 | |
Americas | Oil | 1,066 | 352 |
Gas | 3,528 | 2,052 | |
Asia-Pacific | Oil | 8 | 7 |
Gas | 2,289 | 743 | |
TOTAL | OIL | 14,900 | 1,825 |
GAS | 7,023 | 3,060 | |
(a) Net wells equal the sum of the Group’s equity stakes in gross wells.
2.1.12 Net productive and dry wells drilled
As of December 31 (number of wells) | 2018 | 2017 | 2016 | ||||||
Net productive wells drilled (a) (b) | Net dry wells drilled (a) (c) | Net total wells drilled (a) (c) | Net productive wells drilled (a) (b) | Net dry wells drilled (a) (c) | Net total wells drilled (a) (c) | Net productive wells drilled (a) (b) | Net dry wells drilled (a) (c) | Net total wells drilled (a) (c) | |
Exploration | |||||||||
Europe and Central Asia (excl. Russia) | 0.9 | 0.8 | 1.7 | 0.1 | 1.8 | 1.9 | 1.1 | 1.0 | 2.1 |
Russia | - | - | - | - | - | - | - | - | - |
Africa (excl. North Africa) | 0.1 | 1.0 | 1.1 | 0.2 | 0.5 | 0.8 | 0.7 | - | 0.7 |
Middle East and North Africa | 0.5 | - | 0.5 | 0.6 | 0.5 | 1.1 | 0.8 | - | 0.8 |
Americas | 0.5 | 1.6 | 2.1 | 1.3 | 0.5 | 1.7 | 2.1 | 0.8 | 2.9 |
Asia-Pacific | 0.8 | - | 0.8 | 1.2 | 0.7 | 1.9 | 1.6 | - | 1.6 |
TOTAL | 2.8 | 3.4 | 6.2 | 3.4 | 4.0 | 7.4 | 6.3 | 1.8 | 8.1 |
Development | |||||||||
Europe and Central Asia (excl. Russia) | 10.1 | - | 10.1 | 8.8 | - | 8.8 | 13.6 | 0.5 | 14.1 |
Russia | 13.4 | - | 13.4 | 21.5 | - | 21.5 | 18.7 | - | 18.7 |
Africa (excl. North Africa) | 13.0 | 0.1 | 13.1 | 14.4 | - | 14.4 | 14.6 | - | 14.6 |
Middle East and North Africa | 68.8 | - | 68.8 | 82.0 | - | 82.0 | 49.3 | 1.1 | 50.4 |
Americas | 38.8 | 0.3 | 39.1 | 29.2 | 0.5 | 29.7 | 35.4 | - | 35.4 |
Asia-Pacific | 116.3 | - | 116.3 | 132.4 | - | 132.4 | 151.0 | - | 151.0 |
TOTAL | 260.4 | 0.4 | 260.8 | 288.3 | 0.5 | 288.8 | 282.6 | 1.6 | 284.2 |
TOTAL | 263.2 | 3.8 | 267.0 | 291.7 | 4.5 | 296.2 | 288.9 | 3.4 | 292.3 |
(a) Net wells equal the sum of the Group’s equity stakes in gross wells.
(b) Includes certain exploratory wells that were abandoned, but which would have been capable of producing oil in sufficient quantities to justify completion.
(c) For information: service wells and stratigraphic wells are not reported in this table.
2.1.13 Wells in the process of being drilled (including wells temporarily suspended)
As of December 31 (number of wells) | 2018 | |
Gross | Net (a) | |
Exploration | ||
Europe and Central Asia (excl. Russia) | - | - |
Russia | - | - |
Africa (excl. North Africa) | 2 | 0.5 |
Middle East and North Africa | 1 | 0.4 |
Americas | 3 | 2.0 |
Asia-Pacific | - | - |
TOTAL | 6 | 2.9 |
Other wells (b) | ||
Europe and Central Asia (excl. Russia) | 138 | 71.4 |
Russia | 26 | 3.9 |
Africa (excl. North Africa) | 65 | 13.7 |
Middle East and North Africa | 180 | 26.2 |
Americas | 50 | 21.3 |
Asia-Pacific | 579 | 137.7 |
TOTAL | 1,038 | 274.2 |
TOTAL | 1,044 | 277.1 |
(a) Net wells equal the sum of the Group’s equity stakes in gross wells. Includes wells for which surface facilities permitting production have not yet been constructed. Such wells are also reported in the table "Number of net productive and dry wells drilled", above, for the year in which they were drilled.
(b) Other wells are developments wells, service wells, stratigraphic wells and extension wells.
2.1.14 Interests in pipelines
The table below shows the main interests held by Group entities (1) in pipelines on December 31, 2018.
Pipeline(s) | Origin | Destination | (%) interest | Operator | Liquids | Gas |
Europe and Central Asia | ||||||
Azerbaijan | ||||||
BTC | Baku (Azerbaijan) | Ceyhan (Turkey, Mediterranean) | 5.00 | X | ||
Norway | ||||||
Frostpipe (inhibited) | Lille-Frigg, Froy | Oseberg | 36.25 | X | ||
Heimdal to Brae Condensate Line | Heimdal | Brae | 16.76 | X | ||
Kvitebjorn Pipeline | Kvitebjorn | Mongstad | 5.00 | X | ||
Norpipe Oil | Ekofisk Treatment center | Teesside (United Kingdom) | 45.22 | X | ||
Oseberg Transport System | Oseberg, Brage and Veslefrikk | Sture | 12.98 | X | ||
Troll Oil Pipeline I and II | Troll B and C | Vestprosess (Mongstad refinery) | 3.71 | X | ||
Vestprosess | Kollsnes (Area E) | Vestprosess (Mongstad refinery) | 5.00 | X | ||
Netherlands | ||||||
Nogat Pipeline | F3-FB | Den Helder | 5.00 | X | ||
WGT K13-Den Helder | K13A | Den Helder | 4.66 | X | ||
WGT K13-Extension | Markham | K13 (via K4/K5) | 23.00 | X | ||
United Kingdom | ||||||
Alwyn Liquid Export Line | Alwyn North | Cormorant | 100.00 | X | X | |
Bruce Liquid Export Line | Bruce | Forties (Unity) | 1.00 | X | ||
Graben Area Export Line (GAEL) Northern Spur | ETAP | Forties (Unity) | 9.58 | X | ||
Graben Area Export Line (GAEL) Southern Spur | Elgin-Franklin | ETAP | 32.09 | X | ||
Ninian Pipeline System | Ninian | Sullom Voe | 16.36 | X | ||
Shearwater Elgin Area Line (SEAL) | Elgin-Franklin, Shearwater | Bacton | 25.73 | X | ||
SEAL to Interconnector Link (SILK) | Bacton | Interconnector | 54.66 | X | X | |
Africa (excl. North Africa) | ||||||
Gabon | ||||||
Mandji Pipes | Mandji fields | Cap Lopez Terminal | 100.00 (a) | X | X | |
Nigeria | ||||||
O.U.R | Obite | Rumuji | 40.00 | X | X | |
NOPL | Rumuji | Owaza | 40.00 | X | X | |
Middle East and North Africa | ||||||
Qatar | ||||||
Dolphin | North Field (Qatar) | Taweelah-Fujairah-Al Ain | ||||
(United Arab Emirates) | 24.50 | X | ||||
Americas | ||||||
Argentina | ||||||
TGM | Neuquén (TGN) / Porto alegre (Brazil) | Paso de Los Libres (Brazil border) | 32.68 | X | ||
Brazil | ||||||
TBG | Bolivia-Brazil border | Porto Alegre via São Paulo | 9.67 | X | ||
TSB | Argentina-Brazil border (TGM)/ Porto Alegre | Uruguyana (Brazil) Canoas | 25.00 | X | ||
Asia-Pacific | ||||||
Australia | ||||||
GLNG | Fairview, Roma, Scotia, Arcadia | GLNG (Curtis Island) | 27.50 | X | ||
Myanmar | ||||||
Yadana | Yadana field | Ban-I Tong (Thai border) | 31.24 | X | X |
(a) 100% interest held by Total Gabon. The Group holds an interest of 58.28% in Total Gabon.
(1) Excluding equity affiliates, except for the Yadana and Dolphin pipelines.
2.2 Gas, Renewables & Power segment
The Gas, Renewables & Power segment carries the Group’s ambition in low carbon activities through the development of downstream gas and low carbon electricity as well as the energy efficiency businesses.
The segment employs an integrated business model along the full gas and power value chain. The LNG business is growing in particular following the acquisition of the LNG business of Engie in 2018. The number of customers grows as well strongly, notably in B2C, following the acquisition of Direct Énergie in 2018 and Lampiris in 2016.
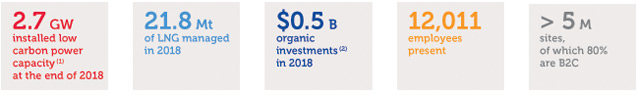
[REDACTED SECTION: CERTAIN TEXT HAS BEEN REDACTED.]
TOTAL integrates the climate change in its strategy and anticipates the new trends on the energy market. Thus, the Group strengthens its development in the natural gas value chain and intends to develop profitable activities in low-carbon electricity.
The activities of TOTAL in the gas business contribute to the growth of the Group by ensuring market outlets for its current and future natural gas production. In addition to its activities in liquefied natural gas (LNG) (refer to point 2.1.8 in this chapter), TOTAL is also present in the trading of natural gas and liquefied petroleum gas (LPG).
TOTAL is present along the entire electricity value chain, from the production of low carbon electricity to marketing activities. TOTAL’s activities in electricity production rely on its subsidiaries Direct Énergie, Quadran, Total Solar and its shareholdings in SunPower and Total Eren. TOTAL is also involved in electricity storage (Saft Groupe), as well as in services to reduce the energy consumption of its customers and the environmental footprint, in particular through its Greenflex subsidiary or through projects to capture, store or use CO2.
As part of its strategy aiming to develop low carbon activities, several major acquisitions were made in 2018. In July 2018, the finalization of the acquisition of Engie’s LNG business enabled TOTAL to consolidate its position as a leading actor in LNG. This acquisition strengthens TOTAL’s positions in the production of LNG, increases the number of long-term purchase and sales agreements, and its regasification capacities, in particular in Europe, and adds a fleet of LNG tankers, thereby offering more flexibility to its portfolio.
TOTAL also signed an agreement with KKR-Energas for the acquisition of two combined-cycle natural gas power plants in France. In September 2018, TOTAL finalized the acquisition of Direct Énergie (France’s top alternative energy supplier (4)) and its subsidiary Quadran (developer and owner of renewables assets), thereby speeding up its strategy to integrate the gas-electricity chain in Europe. In December 2018, TOTAL and EPH also signed an agreement allowing TOTAL, subject to authorisation by the competent authorities, to acquire in 2020 two gas power turbines in France.
(1) In Group’s equity stake.
(2) Organic investments = net investments, excluding acquisitions, divestments and other operations with non-controlling interests (refer to point 2.5.1 of this chapter).
[REDACTED SECTION: CERTAIN TEXT HAS BEEN REDACTED.]
(4) Source: Company data.
2.2.1 LNG
A pioneer in the LNG industry, TOTAL is today one of the world’s leading players (1) in the sector and has solid and diversified positions both in the upstream and downstream of the LNG chain. LNG development is a key element of the strategy of the Group, which is strengthening its positions in most major production regions and main markets.
2.2.1.1 LNG production
Through its interests in liquefaction plants in Angola, Australia, Egypt, the United Arab Emirates, Nigeria, Norway, Oman, Qatar, Russia and Yemen (2), the Group sells LNG across markets worldwide. In 2018, the share of LNG production was 11.1 Mt, compared to 11.2 Mt in 2017 and 11 Mt in 2016. In 2018, the Ichthys (Australia) and Yamal LNG (Russia) plants started producing LNG. The growth of LNG production sold by TOTAL over the coming years is expected to be ensured by the Group’s liquefaction projects under construction (in the United States and Russia), or by projects currently under study (Papua New Guinea, Nigeria, Russia, Oman, Mexico and the United States (3)).
Thereby, in March 2019, Total has signed the definitive agreement with PAO Novatek (4) for the acquisition of a direct 10% interest in Arctic LNG 2. Furthermore, a Memorandum of Understanding (MOU) signed with the government of Oman is expected to enable the Group to develop a regional hub for the delivery of an LNG bunker service to ships, using the natural gas resources from Block 6. Finally, TOTAL has signed an MOU with Sempra Energy for the development of projects for the export of North American LNG, including the expansion of Cameron LNG in Louisiana and the Energia Costa Azul project in Baja California, Mexico.
2.2.1.2 Long-term Group LNG sales and purchases
TOTAL acquires long-term LNG volumes mainly from liquefaction projects in which the Group holds an interest (Egyptian LNG in Egypt, Ichthys in Australia, Qatargas 2 in Qatar, Nigeria LNG in Nigeria, Sn-hvit in Norway, Yamal LNG in Russia and Yemen LNG in Yemen). Furthermore, TOTAL also acquired long-term LNG volumes from American projects in which the Group has no equity (Sabine Pass, Corpus Christi, Cove Point). These volumes support the expansion of the Group’s worldwide LNG portfolio. Since 2009, a growing portion of the long-term volume purchased by the Group that was initially intended for delivery to North American and European markets has been diverted to Asian markets, benefitting from a better price environment.
New LNG sources arising from, among others, the acquisition of Engie’s LNG assets in the United States (Cameron LNG) are expected to ensure the growth of the Group’s LNG portfolio. The Group is developing new LNG markets by launching projects of Floating Storage and Regasification Units (FSRU) for the import of LNG, for example in Myanmar or Côte d’Ivoire, in addition to the two FSRUs already in operation following the acquisition of Engie’s LNG activities.
TOTAL holds several significant contracts for the long-term sale of LNG in Chile, China, South Korea, Spain, the United States, Indonesia, Japan, Panama, the Dominican Republic, Singapore and Taiwan.
2.2.1.3 LNG shipping
As part of its LNG shipping activities, TOTAL uses a fleet of 15 LNG vessels, 12 of which come from the acquisition of Engie’s LNG portfolio. In addition to the fleet, TOTAL may also charter extra vessels on a spot and short-term basis to meet trading needs.
2.2.1.4 LNG trading
The Group’s activities are developing in LNG trading through major sale and purchase contracts and are reinforced by the acquisition of Engie’s portfolio of LNG activities. In 2018, these LNG trading activities represented a volume of 17,1 Mt compared with 7.6 Mt in 2017 and 5.1 Mt in 2016.
The portfolio focuses, in particular, on Asian markets (China, South Korea, India, Indonesia, Japan and Taiwan) and is made up of spot and long-term contracts that enable TOTAL to supply gas to its main customers worldwide, while keeping sufficient flexibility to seize market opportunities.
In 2018, the trading teams were located in London, Paris, Houston and Singapore.
In 2018, TOTAL bought 173 shipments under long-term contracts from Algeria, Australia, Egypt, the United States, Nigeria, Norway, Qatar and Russia and 97 spot or medium-term shipments, compared with 59 and 49 in 2017, and 51 and 19 in 2016 respectively. Deliveries from Yemen LNG have been halted since 2015.
2.2.1.5 LNG regasification
TOTAL has entered agreements that provide a long-term access to LNG regasification capacity worldwide, through existing assets or projects under development in Europe (Belgium, France and the United Kingdom), the Americas (the United States, Panama and Mexico), Asia (India and Myanmar) and Africa (Côte d’Ivoire). TOTAL also charters two FSRUs.
In 2018, TOTAL has an LNG regasification capacity in the range of 27 Bcm/y, of which 20 Bcm/y comes from the acquisition of Engie’s LNG activities.
In France, TOTAL holds a 27.5% interest in Fosmax LNG. The terminal received 65 vessels in 2018, compared with 55 in 2017 and 54 in 2016.
In October 2018, TOTAL sold its 9.99% stake in the Dunkerque LNG terminal, with a capacity of 13 Bcm/y.
In the United Kingdom, through its equity interest in the Qatargas 2 project, TOTAL holds an 8.35% stake in the South Hook LNG regasification terminal, with a total capacity of 21 Bcm/y.
In the United States, in 2004, TOTAL has reserved a regasification capacity of approximately 10 Bcm/y in the Sabine Pass terminal (Louisiana) for a 20-year period until 2029. In 2012, TOTAL and Sabine Pass Liquefaction (SPL) signed agreements allowing TOTAL’s reserved regasification capacity to gradually be transferred by TOTAL to SPL in return for a payment.
In India, TOTAL disposed of its 26% stake in the Hazira terminal in January 2019. The terminal received 67 vessels in 2018, compared with 44 in 2017 and 61 in 2016. Furthermore, in October 2018, TOTAL and Adani Group signed an agreement to develop several LNG regasification terminals, including Dhamra LNG on the east coast of India, and to develop the marketing of LNG in India. Thus, TOTAL relies on a recognized local partner to break into the Indian market.
In Myanmar, a consortium led by TOTAL has been tasked with the responsibility of developing an integrated project, including an FSRU LNG regasification terminal at Kanbauk, a 1,230 MW production plant and the supply of electricity as far as Yangon, which is expected to start up in 2023.
(1) Publicly available information: upstream and downstream LNG portfolios in 2018.
(2) The Yemen LNG plant has been halted since 2015. For more information, refer to point 2.1.8 of this chapter.
(3) TOTAL holds since 2017 an interest in Tellurian Inc. which is listed on the NASDAQ, (18.38% on December 31, 2018).
(4) A Russian company listed on the Moscow and London stock exchanges and in which the Group held an interest of 19.4% as of December 31, 2018.
In Côte d’Ivoire, a consortium led by TOTAL (34%, operator) has been assigned responsibility for developing and operating an FSRU-type LNG regasification terminal in Abidjan, which is expected to start up in 2021.
2.2.2 Trading and transport (excluding LNG)
2.2.2.1 Trading excluding LNG
Following the sale in 2015 of its subsidiary Total Coal South Africa, the Group ceased its coal production activities. Moreover, in 2016, the Group stopped its coal sales and trading activities.
A) LPG
In 2018, TOTAL traded and sold nearly 5.2 Mt of LPG (propane and butane) worldwide, compared to 4.9 Mt in 2017 and 5.3 Mt in 2016. Nearly 30% of these quantities came from fields or refineries operated by the Group. This trading activity was conducted by means of seven long-term chartered vessels. In 2018, 255 journeys were necessary for transporting the negotiated quantities, including 156 journeys carried out by TOTAL’s long-term chartered vessels and 99 journeys by spot-chartered vessels.
B) Petcoke and sulfur
TOTAL sells petcoke coming from the Port Arthur refinery in the United States and the Jubail refinery in Saudi Arabia. Petcoke is sold to cement producers and electricity producers mainly in India, as well as in Mexico, Brazil, other Latin American countries and Turkey. 2.2 Mt of petcoke were sold on the international market in 2018, compared to 2.1 Mt in 2017 and 1.9 Mt in 2016.
TOTAL also sells sulfur, mainly from the production of its refineries. In 2018, 1.4 Mt was sold, compared with 0.9 Mt in 2017 and 0.7 Mt in 2016.
C) Natural gas and electricity
TOTAL is pursuing gas and electricity trading operations in Europe and North America in order to sell the Group’s production and to supply the marketing subsidiaries and other entities of the Group.
In Europe, TOTAL sold 46.4 Bcm of natural gas in 2018, compared with 33.3 Bcm in 2017 and 32.9 Bcm in 2016 (1). The Group also traded 65.4 TWh of electricity in 2018, compared to 70.2 TWh in 2017 and 49.1 TWh in 2016, mainly from external sources.
In North America, TOTAL sold 13.7 Bcm of natural gas in 2018 from its own production or from external resources, compared to 12.1 Bcm in 2017 and 10.1 Bcm in 2016.
2.2.2.2 Transport of natural gas
The Group holds interests in gas pipelines (refer to point 2.1.14 of this chapter) located in Brazil and Argentina.
2.2.3 Low carbon electricity production
In the second half of 2018, TOTAL accelerated its strategy to integrate the gas-electricity chain in Europe and to develop low-carbon electricity by acquiring Direct Énergie and two combined-cycle natural gas power plants in France from KKR-Energas. Consequently, TOTAL has the capacity to produce 2.7 GW of low-carbon electricity from gas and renewables (in Group share) worldwide.
2.2.3.1 Electricity production from natural gas
The construction of a portfolio of combined-cycle gas power plants in Europe is part of the strategy to integrate the gas and electricity value chain, from production to marketing, and compliments well the sources of production of intermittent renewable electricity. Furthermore, the flexible production of these power plants enables the Group to optimize its customers’ electricity supply costs.
In France and Belgium, TOTAL owns four combined-cycle natural gas (CCGT) power plants. The global installed capacity is 1.6 GW. TOTAL holds a 60% stake in project to build a fifth 0.4 GW CCGT power plant in Landivisiau, France. The agreement signed in December 2018 with EPH will bring to TOTAL portfolio two additional gas power turbines (0.8 GW) from 2020, subject to authorisation by the competent authorities.
In Abu Dhabi, the Taweelah A1 gas power plant, which is owned by the Gulf Total Tractebel Power Company (TOTAL, 20%), combines electricity generation and water desalination. The plant has a net power generation capacity of 1.6 GW and a water desalination capacity of 385,000 m³ per day. The plant’s production is sold to Abu Dhabi Water and Electricity Company (ADWEC) as part of a long-term agreement.
In Brazil, TOTAL and Petrobras pursue the study of new business opportunities in the natural gas.
2.2.3.2 Electricity production from renewables
As part of its development in low-carbon electricity, TOTAL relies on its Quadran and Total Solar subsidiaries and its shareholdings in SunPower and Total Eren.
A) SunPower
TOTAL has held, since 2011, a majority interest in SunPower (55.66% as of December 31, 2018), an American company listed on NASDAQ and based in California.
Since 2017, SunPower has focused its activities on two segments: on the one hand, the design, production and international sale of very high-efficiency solar cells and panels, and, on the other hand, the sale of photovoltaic systems, that increasingly include storage, in the United States. SunPower had a capacity to produce Inter-digitated Back Contact (IBC) cells of almost 1.2 GW/y at the end of 2018. The cells are then assembled into solar panels in plants located mainly in France and Mexico. To enlarge its commercial offering, SunPower has marketed, since 2016, a new range of panels to target the most competitive market sectors while continuing to hold a technological edge over its competitors. SunPower is finalizing the development of its future highly efficient technology, which significantly reduces costs, and has launched its industrial deployment.
SunPower markets its panels worldwide for applications ranging from residential and commercial roof tiles to solar power plants.
(1) The data for the 2017 and 2016 financial years have been restated to include the supply of the marketing subsidiaries.
In 2018, the worldwide photovoltaic market remained dynamic, with estimated growth of 14% (compared with 30% in 2017) of newly installed capacities (1). SunPower installed more than 1.5 GW in 2018, compared to 1.4 GW in 2017 and 1.3 GW in 2016.
In the American market, SunPower is one of the leading players on the residential, industrial and commercial markets, and is driving the development of smart energy offerings (a combination of photovoltaic solar power, storage and other services).
As part of its recentering strategy, SunPower sold, in June 2018, its stake in 8point3 Energy Partners to an investment fund in the energy sector. In 2018, SunPower also sold its inverters activity and its last solar farm projects that were under development, mainly in the Americas.
In October 2018, SunPower acquired certain assets of SolarWorld Americas, in particular the Hillsboro plant in Oregon, thereby strengthening its position in the production of solar panels in the United States. In September 2018, the American government exempted the IBC technology of the customs tariffs imposed by the American authorities on imports of cells and panels in January 2018.
B) Quadran
In 2018, TOTAL maintained its policy of investing in low-carbon businesses with the acquisition of Direct Énergie, which owns Quadran. This company enables the Group to speed up its development in solar and wind power, biogas and in hydroelectricity in France.
This acquisition adds 0.7 GW gross installed capacity (in 100%). At the end of 2018, Quadran operates a portfolio of 213 onshore wind, solar, hydroelectric and biogas assets in France, and develops a series of renewable electricity projects that have reached different stages of maturity.
C) Total Eren
In December 2017, TOTAL acquired a 23% interest in Eren Renewable Energy, which has since been renamed Total Eren. TOTAL will be able to take control of Total Eren after a period of five years. Through its partnerships with local developers, Total Eren today manages numerous energy projects in countries and regions where renewable energies represent an economically viable response to a growing demand for energy, such as Asia-Pacific, Africa and Latin America.
Total Eren has a diversified set of assets in renewable energies (wind, solar and hydraulic), representing a gross installed capacity of about 1.3 GW (in 100%) in operation or under construction around the world.
D) Total Solar
Total Solar, which is 100% owned by the Group, contributes to the development of activities in solar power, with a focus on two market segments:
-decentralized photovoltaic systems aimed at industrial or commercial customers (B2B) entering into private PPAs (power purchase agreements); and
-ground-mounted solar power plants in targeted geographical areas: Europe, the Middle East, Japan and South Africa.
2.2.4 Natural gas and electricity marketing
With a customer portfolio in excess of 5 million sites delivered and 133 TWh, TOTAL is now targeting 15% market share in France and Belgium within 5 years in the residential segment.
In France, TOTAL operates in the natural gas and electricity markets for industrial and commercial customers through its Total Énergie Gaz and, Direct Énergie since 2018, marketing subsidiaries, whose global gas sales totaled 1.8 Bcm in 2018, compared with 1.9 Bcm in 2017 and 2.2 Bcm in 2016. TOTAL also operates on the domestic market through its subsidiary Total Spring (previously known as Lampiris France) and Direct Énergie. The sales of Total Spring and Direct Énergie in the residential segment (electricity and gas) totaled 17.9 TWh in 2018, compared with 3.8 TWh in 2017.
In the United Kingdom, TOTAL sells natural gas and electricity in the industrial and commercial segment through its subsidiary Total Gas & Power Ltd. In 2018, the volume of gas sales totaled 4.2 Bcm, compared with 4.3 Bcm in 2017 and 4.0 Bcm in 2016. Electricity sales were nearly 10.1 TWh in 2018, compared to 9.1 TWh in 2017 and 7.4 TWh in 2016.
In Germany, Total Energie Gas GmbH, a marketing subsidiary of TOTAL, marketed 1.2 Bcm of gas in 2018 to industrial and commercial customers, compared to 1.2 Bcm in 2017 and 0.9 Bcm in 2016. Electricity sales were 0.5 TWh in 2018, compared with 0.3 TWh in 2017.
In the Netherlands, TOTAL operates in the natural gas and electricity markets for industrial and commercial customers through its subsidiary Total Gas & Power Nederland B.V. The volumes delivered in 2018 were 0.4 Bcm of gas and 0.4 TWh of electricity, compared with 0.3 Bcm and 0.2 TWh in 2017.
In Belgium, TOTAL operates on the natural gas and electricity supply markets through its subsidiaries Lampiris and Direct Énergie. The Lampiris and Poweo by Direct Énergie brands are present in the residential segment, while Total Gas & Power Belgium operates in the industrial and commercial segments. In 2018, the volumes of gas delivered amounted to almost 0.8 Bcm, compared with 0.7 Bcm in 2017, while electricity sales totaled almost 3.7 TWh, compared with 3.7 TWh in 2017.
In Spain, TOTAL Gas y Electricidad España markets electricity to the industrial and commercial segments since January 2018. In 2018, the volume of electricity sales reached 0.1 TWh. The Group sold its 35% stake in Cepsa Gas Comercializadora in 2017.
In Argentina, the subsidiary Total Gas Marketing Cono Sur is in charge of marketing the gas produced by Total Austral, the Group’s production subsidiary, as well as marketing the gas produced by third parties. In 2018, the volume of gas sales reached 4.3 Bcm, compared to 4.2 Bcm in 2017 and 4.0 Bcm in 2016.
The Group holds stakes in the marketing companies that are associated with the LNG regasification terminals located at Altamira in Mexico and Hazira in India. In early 2019, TOTAL closed the sale of its stake in the regasification company in India that also owned the marketing activity.
2.2.5 Energy storage
Energy storage is a major challenge for the future of power grids and a vital accompaniment to renewable energies, which are intermittent by nature. Large-scale electricity storage is essential to promote the growth of renewables and enable them to make up a significant share of the electricity mix.
The acquisition of 100% of the shares of Saft Groupe S.A. ("Saft"), completed in August 2016 following a successful voluntary takeover bid, fully aligned with TOTAL’s goal to develop in low-carbon businesses.
(1) Source: BNEF.
Saft is a French company that celebrated its 100th anniversary in 2018 and specializes in the design, manufacture and marketing of high technology batteries for industry.
Saft develops batteries based on nickel, lithium-ion and primary lithium technologies. The company is active in transport, telecommunications, industrial infrastructures, civil and military electronics, space, defense and energy storage. Building on the strength of its technological know-how, and through its energy storage activities, Saft is well placed to benefit from the growth in renewable energies beyond its current activities, by offering massive storage capacities, combined with renewable electricity, which is intermittent by nature. This is one of Saft’s main sources of growth.
As part of a European alliance, Saft and its partners launched, in 2018, an R&D program that aims to develop the future generations of lithium-ion batteries (Gen 3A and Gen 3B), and then the solid electrolyte lithium battery technology. As of year-end 2018, Saft is present in 18 countries worldwide (historically in Europe and the United States) and has over 4,300 employees. Saft is achieving growth in emerging countries, in particular in Asia, South America and Russia, and has 14 production sites and approximately 30 sales offices. In 2018, Saft’s turnover amounted to $788 million.
2.2.6 Innovation and energy efficiency
2.2.6.1 Energy efficiency services
The energy efficiency services market is experiencing strong growth, which is expected to accelerate in the coming years. In this context, the Group is investing in this market, with the aim of helping customers optimize their consumption and emissions, in particular by choosing between the best energy sources.
In 2017, the Group finalized the acquisition of GreenFlex, a French company founded in 2009 with over 700 customers. GreenFlex employs around 400 people and recorded sales of €410 million at year-end 2018, compared to €359 million at year-end 2017.
This acquisition is fully aligned with the Group’s strategy for growth in the energy performance sector, in priority in major European countries.
2.2.6.2 Total Energy Ventures
Total Energy Ventures (TEV) invests in the initial development phases of companies that offer technologies or economic models of strategic interest to TOTAL. These areas of interest include renewable energies, digital energy, energy storage and mobility services. Whereas historically TEV invested predominantly in Europe and the United States, the company started investing in 2018 in China. In particular, TEV signed an agreement with NIO Capital to cooperate and invest in the mobility segment.
TEV also launched its investment platform dedicated to emerging markets, and in particular to companies developing business models for access to energy for people who are not connected to the grid. Initially, this activity will be focused on Africa.
2.2.6.3 Carbon capture, use and storage
In order to promote a new industry in the field of carbon capture, utilization and storage (CCUS), the Group is examining the possibility of developing new businesses to enable its industrial, domestic or electricity producing customers to capture, store, utilize or neutralize their CO2 emissions.
TOTAL considers CCUS to be one of the key drivers to tackle the challenge of the climate change and is particularly interested in the development of new business and industrial models associated with this value chain.
In this area, the Group intends to participate directly or indirectly (via the OGCI fund in particular) in large-scale pilot projects. TOTAL thus launched, in 2017, studies with Equinor and Royal Dutch Shell for developing the transport and storage aspects of the first industrial commercial project in the world for the capture, transport and storage of CO2, with a capacity of 1.5 Mt of CO2/y. The project aims to store the emissions from two industrial sites near Oslo, Norway, and will also be able to collect emissions from other emitters. TOTAL also supports the feasibility studies conducted by the OGCI fund, with 5 other partners, on a project located in Teesside (United Kingdom). This project combines gas based power generation with capture of the related CO2, the collection of the CO2 emissions from neighboring industries, its offshore storage and its possible recovery in other uses.
2.2.6.4 Access to energy
First launched in 2011 in four pilot countries, TOTAL’s solar solutions for access to energy were distributed in 40 countries by 2018. By the end of 2018, 2.7 million lamps and solar kits had been sold, improving the day-to-day lives of nearly 12 million people. The distribution channels used are both TOTAL’s traditional networks (service stations) and "last mile" networks built with local partners to bring these solutions to isolated areas. Reseller networks are set up and economic programs developed with the support of external partners to recruit and train young solar resellers.
In addition, in 2018, around 10 incubation projects were launched with start-ups in the nano-grid, mini-grid, recycling and Wi-Fi terminals segments. More than 20 business partnerships were also deployed in the field, with organizations ranging from NGOs and development agencies, to professional customers (distributors, major TOTAL accounts, etc.) and international organizations.
2.3 Refining & Chemicals segment
Refining & Chemicals is a large industrial segment that encompasses refining, base petrochemicals (olefins and aromatics), polymer derivatives (polyethylene, polypropylene, polystyrene and hydrocarbon resins), the transformation of biomass and the transformation of elastomers (Hutchinson). This segment also includes the activities of Trading & Shipping.
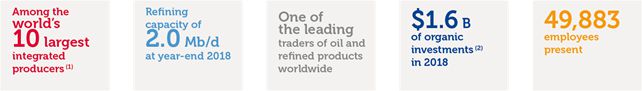
Refinery throughput (a)
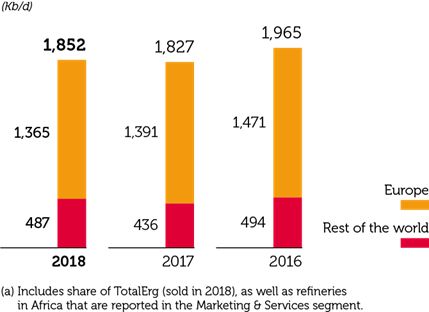
Refinery throughput was stable in 2018 compared to 2017. Lower throughput in Europe linked to planned maintenance, notably at Antwerp during the second quarter, was offset by higher throughput outside Europe.
[REDACTED SECTION: CERTAIN TEXT HAS BEEN REDACTED.]
(1) Based on publicly available information, production capacities at year-end 2017.
(2) Organic investments = net investments, excluding acquisitions, divestments and other operations with non-controlling interests (refer to point 2.5.1 of this chapter).
[REDACTED SECTION: CERTAIN TEXT HAS BEEN REDACTED.]
2.3.1 Refining & Chemicals
Refining & Chemicals includes refining, base petrochemicals (olefins and aromatics), polymer derivatives (polyethylene, polypropylene, polystyrene and hydrocarbon resins), biomass conversion and elastomer processing (Hutchinson). The electroplating chemistry (Atotech) and adhesives (Bostik) activities were sold in 2017 and 2015, respectively. The volume of its Refining & Chemicals activities places TOTAL among the top 10 integrated producers worldwide (1).
The strategy of Refining & Chemicals integrates a constant requirement for safety, a core value of the Group, and the priority given to the management of its environmental footprint. In a context of rising worldwide demand for oil and petrochemicals driven by non-OECD countries and the entry of new capacities into the market, the strategy involves:
-improving competitiveness of refining and petrochemicals activities by making optimal use of industrial means of production and concentrating investments on large integrated platforms;
-developing petrochemicals in the United States and the Middle East by exploiting the proximity of cost-effective oil and gas resources in order to supply growing markets, in particular Asia; and
-innovating in low carbon activities by developing biofuels, biopolymers and plastics recycling solutions as well as materials contributing to the energy efficiency of the Group’s customers, in particular in the automotive market.
2.3.1.1 Refining and petrochemicals
TOTAL’s refining capacity was 2,021 kb/d as of December 31, 2018, same as at year-end 2017 and compared to 2,011 kb/d at year-end 2016. The Refining & Chemicals segment managed a capacity of 1,993 kb/d at year-end 2018, or 99% of the Group’s total capacity.
TOTAL has equity stakes in 18 refineries (including nine operated by companies of the Group), located in Europe, the Middle East, the United States, Asia and Africa (2).
The petrochemicals businesses are located mainly in Europe, the United States, Qatar, South Korea and Saudi Arabia. Most of these sites are either adjacent to or connected by pipelines to Group refineries. As a result, TOTAL’s petrochemical operations are integrated within its refining operations, thereby maximizing synergies.
Between 2011 and 2016, the Group reduced its production capacities in Europe by 20%, thereby fully meeting the target it had set for 2017. Since then, the major investment project launched in 2013 on the Antwerp platform in Belgium has been completed, with the aim of improving the site’s conversion rate and increasing the flexibility of the steam crackers. The project to transform the La Mède refinery into a biorefinery continues.
A) Activities by geographical area
a) Europe
TOTAL is the second largest refiner and petrochemist in Western Europe (3).
Western Europe accounts for 71% of the Group’s refining capacity, i.e., 1,437 kb/d at year-end 2018, compared with 1,454 kb/d at year-end 2017 and year-end 2016.
The Group operates eight refineries in Western Europe (one in Antwerp, Belgium, five in France in Donges, Feyzin, Gonfreville, Grandpuits and La Mède, one in Immingham, United Kingdom, and one in Leuna, Germany) and owns a 55% stake in the Vlissingen refinery (Zeeland) in the Netherlands. In the first quarter of 2018, the Group sold its stake in TotalErg, which held a stake in the Trecate refinery in Italy.
The Group’s main petrochemical sites in Europe are located in Belgium, in Antwerp (steam crackers, aromatics, polyethylene) and Feluy (polyolefins, polystyrene), and in France, in Carling (polyethylene, polystyrene, polypropylene compounds), Feyzin (steam cracker, aromatics), Gonfreville (steam crackers, aromatics, styrene, polyolefins, polystyrene) and Lavéra (steam cracker, aromatics, polypropylene). Europe accounts for 48% of the Group’s petrochemicals capacity, i.e., 10,277 kt at year-end 2018, compared to 10,293 kt at year-end 2017 and 10,383 kt at year-end 2016.
-In France, the Group continues to improve its operational efficiency in a context of stagnation in the consumption of petroleum products in Europe.
In 2018, TOTAL continued the significant modernization plan announced in 2015 for its refining facilities in France, in particular at La Mède, with an investment decision made in 2015 for around €275 million to transform the site and in particular create the first biorefinery in France. The first step of this investment took place at the end of 2016 when the processing of crude oil ended. The industrial transformation of La Mède will contribute to respond to the growing demand for biofuels in Europe as from the first half of 2019. Other activities, such as a logistics and storage platform, a solar energy farm and a training center were developed on the site since 2017, in addition to an AdBlue (4) production plant, which started up in August 2018.
In Donges, the €400 million investment project for the construction of intermediate feedstock desulfurization units and hydrogen production units is under study. This program requires the re-routing of the railroad track that currently crosses the refinery. A three-party memorandum of intent to fund this re-routing work between the French State, local authorities and TOTAL was signed at the end of 2015.
In petrochemicals, the Group reconfigured the Carling platform in Lorraine. Since the shutdown of the steam cracking activity in 2015, new hydrocarbon resins and compound polypropylene production units have been in activity.
-In Germany, TOTAL operates the Leuna refinery (100%), where a new benzene extraction unit (approximately 60 kt/y) started up late 2017. In 2015, the Group completed the sale of its stake in the Schwedt refinery (16.7%) and acquired a majority stake in Polyblend, a manufacturer of polyolefin compounds that are mainly used in the automotive industry.
-In Belgium, the Group finalized a major project in 2017 to modernize its Antwerp platform, with:
-new conversion units in response to the shift in demand towards lighter petroleum products with a very low sulfur content, and
-a new unit to convert part of the combustible gases recovered from the refining process into raw materials for the petrochemical units.
In addition, the Group has developed a project to enable greater flexibility on one of the steam-cracking units and has thus been processing ethane since 2017.
-In the United Kingdom, TOTAL decreased the capacity of the Lindsey refinery by half in 2016, reducing it to 5.5 Mt/y. The investment plan also focuses on improving the conversion ratio, adapting logistics and simplifying the refinery’s organization, thereby lowering the site’s break-even point.
(1) Based on publicly available information, refining and petrochemicals production capacities at year-end 2017.
(2) Earnings related to certain refining assets in Africa and to the TotalErg joint-venture, sold during the first quarter of 2018, which held a stake in the Trecate refinery in Italy, are included in the results of the Marketing & Services segment.
(3) Based on publicly available information, 2017 refining capacities.
(4) Fuel additive intended for road transport and designed to lower nitrogen oxide (NOX) compound emissions.
b) North America
The Group’s main sites in North America are located in Texas, at Port Arthur (refinery, steam cracker), Bayport (polyethylene), La Porte (polypropylene) and in Louisiana, at Carville (styrene, polystyrene).
At Port Arthur, TOTAL holds at the same site a 100% interest in a 178 kb/d capacity refinery and a 40% stake in BASF Total Petrochemicals (BTP), which has a condensate splitter and a steam cracker. The Group continues to work on strengthening the synergies between these two plants. The BTP cracker can produce more than 1 Mt/y of ethylene, of which more than 85% on ethane, propane and butane, which are produced in abundance locally.
At La Porte, TOTAL operates a large polypropylene plant, with a capacity of 1.2 Mt/y.
At Carville, TOTAL operates a styrene plant with a capacity of 1.2 Mt/y, in a 50% joint-venture with SABIC and a polystyrene unit with a capacity of 700 kt/y, which is 100% owned.
Finally, in partnership with Borealis and Nova Chemicals, TOTAL started construction in 2017 of a new ethane cracker with an ethylene production capacity of 1 Mt/y on the Port Arthur site for an investment of $1.7 billion. The partners in the joint-venture (TOTAL, 50%) decided in September 2018 to develop a new polyethylene unit downstream of the cracker, in addition to the capacities of the Bayport site which TOTAL contributed to the joint-venture. This integrated development is expected to more than double the site’s polyethylene capacity to 1.1 Mt/y and to thus maximize synergies with the existing assets at Port Arthur and Bayport.
c) Asia, the Middle East and Africa
TOTAL is continuing to expand in growth areas and is developing sites in countries with favorable access to raw materials. The Group has first-rate platforms in these markets, which are ideally positioned for growth.
In Saudi Arabia, TOTAL has a 37.5% stake in SATORP (Saudi Aramco Total Refining and Petrochemical Company), which operates the Jubail refinery. It has been fully operational since mid-2014. This refinery, situated close to Saudi Arabia’s heavy crude oil fields, increased its capacity by 10% to 440 kb/d following the debottlenecking in early 2018 during its first major shutdown. The refinery’s configuration enables it to process these heavy crudes and sell fuels and other light products that meet very strict specifications and are mainly intended for export. The refinery is also integrated with petrochemical units: an 800 kt/y paraxylene unit, a 200 kt/y propylene unit, and a 140 kt/y benzene unit. In addition, TOTAL and Saudi Aramco signed in October 2018 an agreement to jointly develop the engineering studies for the construction of a petrochemicals complex adjacent to the refinery. This gigantic project will include a mixed-load steam cracker (50% ethane and refinery gas) with a capacity of 1.5 Mt/y and polyethylene units.
In China, TOTAL holds a 22.4% stake in WEPEC, a company that operates a refinery located in Dalian. The sale of this stake to one of the Chinese partners of the joint-venture is in the process of being finalized. During the first quarter of 2019, the Group sold its polystyrene activity in China, which notably included two plants in Foshan (Guangdong province) and Ningbo (Zheijiang province) in the Shanghai region, each with a capacity of 200 kt/y.
In South Korea, TOTAL has a 50% stake in Hanwha Total Petrochemicals Co., Ltd. (HTC), which operates a petrochemical complex in Daesan (condensate splitter, steam cracker, styrene, paraxylene, polyolefins). Following the launch in 2014 of new aromatics (paraxylene and benzene) and polymer units (EVA2), HTC continued to expand its activities and the steam cracker now has an ethylene production capacity of 1.1 Mt/y and a styrene production capacity of 1.1 Mt/y. The EVA2 and ARO2 units were debottlenecked in 2016 and 2017 respectively. In addition, investments totaling $750 million were decided in 2017 to increase the ethylene production capacity by 30% and the polyethylene production capacity by more than 50%. At the end of 2018, the decision was taken to make an additional investment of $500 million to increase the polypropylene production capacity by nearly 60% by 2020 to reach 1.1 Mt/y, and to increase its ethylene production capacity by 10% to reach 1.5 Mt/y.
In Qatar, the Group holds interests (1) in two ethane-based steam crackers (Qapco, Ras Laffan Olefin Cracker-RLOC) and four polyethylene lines operated by Qapco in Messaied, including the Qatofin linear low-density polyethylene plant with a capacity of 550 kt/y and a Qapco 300 kt/y low-density polyethylene line which started up in 2012.
TOTAL holds a 10% stake in the Ras Laffan condensate refinery, the capacity of which increased to 300 kb/d following completion of the project to double the refinery’s capacity; the new facilities were commissioned in late 2016.
In the United Arab Emirates, in November 2018, TOTAL sold a 33.3% stake that it held in ADNOC Fertilizers, which operates a plant producing 2 Mt/y of urea in Ruwais.
In Algeria, in October 2018, the Group signed a shareholders’ agreement with Sonatrach to create the joint-venture (Sonatrach 51% and TOTAL 49%) to implement a joint petrochemicals project in Arzew, in western Algeria. This project includes the construction of a propane dehydrogenation plant and a polypropylene production unit with a capacity of 550 kt/y. The joint-venture was incorporated in January 2019.
In Africa, the Group also holds interests in four refineries (South Africa, Cameroon, Côte d’Ivoire, Senegal) after the sale of its interest in the refinery in Gabon in 2016. Refining & Chemicals provides technical assistance for two of these refineries: the Natref refinery with a capacity of 109 kb/d in South Africa and the SIR refinery with a capacity of 80 kb/d in Côte d’Ivoire.
(1) TOTAL shareholdings: Qapco (20%); Qatofin (49%); RLOC (22.5%).
B) Crude oil refining capacity
The table below sets forth TOTAL’s crude oil refining capacity (a):
As of December 31 (kb/d) | 2018 | 2017 | 2016 |
Nine refineries operated by Group companies | |||
Normandy-Gonfreville (100%) | 253 | 253 | 253 |
Provence-La Mède (100%) | - (b) | - (b) | - (b) |
Donges (100%) | 219 | 219 | 219 |
Feyzin (100%) | 109 | 109 | 109 |
Grandpuits (100%) | 101 | 101 | 101 |
Antwerp (100%) | 338 | 338 | 338 |
Leuna (100%) | 227 | 227 | 227 |
Lindsey-Immingham (100%) | 109 | 109 | 109 |
Port Arthur (100%) and BTP (40%) (c) | 202 | 202 | 202 |
SUBTOTAL | 1,558 | 1,558 | 1,558 |
Other refineries in which the Group has equity stakes (d) | 463 | 463 | 453 |
TOTAL | 2,021 | 2,021 | 2,011 |
(a) Capacity data based on crude distillation unit stream-day capacities under normal operating conditions, less the average impact of shutdowns for regular repair and maintenance activities.
(b) Crude oil processing stopped indefinitely at the end of 2016.
(c) The condensate splitter held by the joint-venture between TOTAL (40%) and BASF (60%) located in Port Arthur refinery has been taken into account since end 2015.
(d) TOTAL’s share as of December 31, 2018 in the nine refineries in which it has equity stakes ranging from 7% to 55% (one each in the Netherlands, China, South Korea, Qatar, Saudi Arabia and four in Africa). TOTAL sold, in December 2016, its stake in the SOGARA refinery in Gabon. In 2017, TOTAL also sold a portion of its interests in the SIR refinery in Côte d’Ivoire and SAR refinery in Senegal. In 2018, the Group sold its stake in TotalErg, which held a stake in the Trecate refinery in Italy.
C) Refined products
The table below sets forth by product category TOTAL’s net share (a) of refined quantities produced at the Group’s refineries:
(kb/d) | 2018 | 2017 | 2016 |
Gasoline | 291 | 283 | 324 |
Aviation fuel (b) | 210 | 196 | 182 |
Diesel and heating oils | 732 | 726 | 795 |
Heavy fuels | 99 | 115 | 140 |
Other products | 461 | 438 | 430 |
TOTAL | 1,793 | 1,758 | 1,871 |
(a) For refineries not 100% owned by TOTAL, the production shown is TOTAL’s equity share in the site’s overall production.
(b) Avgas, jet fuel and kerosene.
D) Utilization rate
The table below sets forth the average utilization rates of the Group’s refineries:
2018 | 2017 | 2016 | |
On crude and other feedstock (a) (b) | 92% | 91% | 87% |
On crude (a) (c) | 88% | 88% | 85% |
(a) Including equity share of refineries in which the Group has a stake.
(b) Crude + crackers’ feedstock/distillation capacity at the beginning of the year.
(c) Crude/distillation capacity at the beginning of the year.
E) Petrochemicals: breakdown of TOTAL’s main production capacities
As of December 31 (in kt) | 2018 | 2017 | 2016 | |||
Europe | North America | Asia and Middle East (a) | Worldwide | Worldwide | Worldwide | |
Olefins (b) | 4,296 | 1,555 | 1,579 | 7,430 | 7,378 | 7,468 |
Aromatics (c) | 2,874 | 1,512 | 2,581 | 6,967 | 6,909 | 6,844 |
Polyethylene | 1,120 | 223 | 792 | 2,135 | 2,357 | 2,338 |
Polypropylene | 1,350 | 1,200 | 400 | 2,950 | 2,950 | 2,950 |
Polystyrene | 637 | 700 | 408 | 1,745 | 1,745 | 1,745 |
Other (d) | - | - | 100 | 100 | 63 | 63 |
TOTAL | 10,277 | 5,190 | 5,860 | 21,327 | 21,401 | 21,407 |
(a) Including interests in Qatar, 50% of Hanwha Total Petrochemicals Co. Ltd. and 37.5% of SATORP in Saudi Arabia.
(b) Ethylene + propylene + butadiene.
(c) Including monomer styrene.
(d) Mainly monoethylene glycol (MEG), polylactic acid polymer (PLA) and cyclohexane.
F) Developing new avenues for the production of fuels and polymers
TOTAL is exploring new ways to monetize carbon resources, conventional or otherwise (natural gas, biomass, waste). These projects are part of the Group’s commitment to building a diversified energy mix generating lower CO2 emissions.
Regarding biomass development, TOTAL is pursuing several industrial and exploratory projects. The scope of these developments is broad since they entail defining access to the resource (nature, sustainability, location, supply method, transport), the nature of the molecules and target markets (fuels, petrochemicals, specialty chemicals) and the most appropriate, efficient and environmentally friendly conversion processes.
a) Biomass to fuels
In Europe, TOTAL produces biofuels, notably hydrotreated vegetable oils (HVO) for incorporation into diesel, and ether produced from ethanol and isobutene (ETBE) for incorporation into gasoline.
As part of the La Mède refinery transformation program announced in 2015, the Group will build the first biorefinery in France. Operations are expected to restart in the first half of 2019 with a view to reaching a production capacity of almost 500 kt/y of biofuel, mainly high-quality biodiesel (HVO), but also biojet and petrochemical bio-feedstocks.
TOTAL continued extensive research activity in 2018, which targeted the emergence of new biofuel solutions. The BioTFuel consortium’s construction of a pilot demonstration unit on the Dunkerque (France) site led to the commencement in 2017 of a gasification test program for synthesis of biomass into fungible, sulfur-free fuels.
b) Biomass to polymers
TOTAL is actively involved in developing activities associated with the conversion of biomass to polymers. The main area of focus is developing drop-in solutions for direct substitutions, by incorporating biomass into the Group’s existing units, for example HVO or other hydrotreated vegetable oil co-products in a naphtha cracker, and developing the production of new molecules such as polylactic acid polymer (PLA) from sugar. In 2017, the Group thus set up a joint-venture with Corbion for the production and marketing of PLA from a site in Thailand containing existing lactide units and PLA units, which started production in December 2018 and have a production capacity of 75 kt/y.
c) Biotechnologies and the conversion of biomass
TOTAL is exploring a number of opportunities for developing biomass and has launched numerous collaborative R&D projects for the development of bio-sourced molecules with various academic partners (the Joint BioEnergy Institute, United States, the University of Wageningen, Netherlands and the Toulouse White Biotechnology consortium, France) or through its Novogy subsidiary (Massachusetts, United States). In addition, TOTAL holds an interest in Amyris Inc. (1), an American company listed on NASDAQ.
On its R&D platform in Solaize (France), TOTAL develops new biocomponents derived from the transformation of the biomass by using a methodology based on predictive modeling and chemical transformation into high added-value biomolecules.
In the longer term, the Group is also studying the potential for developing a cost-effective phototrophic process for producing biofuels through bioengineering of microalgae and microalgae cultivation methods. It has several European partners in this field (CEA, Wageningen).
d) Plastics recycling and circular economy
TOTAL is commited to developing recycling and end of life solutions for plastics.
In France, TOTAL, Saint-Gobain, Citeo and Syndifrais founded a partnership to develop an industrial polystyrene recycling value chain by 2020 which aims to incorporate the polystyrene gathered and sorted in the Group’s plastics production units in Carling and Feluy.
In February 2019, TOTAL acquired French company Synova, a leader in manufacturing high-performance recycled polypropylene for the automotive sector, and which current production capacity in 20 kt/y of polypropylene produced from recycled plastic material gathered from wastes and industrial scraps.
TOTAL is also a founding member of the Alliance to End Plastic Waste, created in January 2019 to eliminate plastic waste in the environment, especially in the oceans. Created in January 2019, this international alliance has received commitments of over $1 billion from the nearly 30 members to date to develop and bring to scale solutions that will minimize and manage plastic waste and promote solutions for used plastics by helping to enable a circular economy.
(1) 13.00% on December 31, 2018.
2.3.1.2 Elastomer processing (Hutchinson)
Hutchinson actively contributes to the mobility of the future by addressing its customers’ needs (automotive, aerospace and major industries - defense, rail, energy) in order to offer a greater level of safety, comfort and energy performance, as well as more responsible solutions.
The company draws on wide-ranging expertise and employs its know-how from the custom design of materials to the integration of connected solutions: structural sealing solutions, precision sealing, management of fluids, materials and structures, anti-vibration systems and transmission systems.
To serve its customers, Hutchinson had 87 production sites across the world (of which 55 are located in Europe and 18 in North America) and approximately 37,000 employees at December 31, 2018.
2.3.2 Trading & Shipping
The activities of Trading & Shipping are focused primarily on serving the Group’s needs, and notably include:
-selling and marketing the Group’s crude oil production;
-providing a supply of crude oil for the Group’s refineries;
-importing and exporting the appropriate petroleum products for the Group’s refineries to be able to adjust their production to the needs of local markets;
-chartering appropriate ships for these activities; and
-trading on various derivatives markets.
In addition, with its acquired expertise, Trading & Shipping is able to extend its scope beyond the aforementioned activities.
Trading & Shipping conducts its activities worldwide through various wholly-owned subsidiaries established on strategically important oil markets in Europe, Asia and North America.
2.3.2.1 Trading
Oil prices progressively strengthened until October 2018 with backwardation (1) structures on most oil indices, before declining in the last quarter of the year. TOTAL is one of the world’s largest traders of crude oil and petroleum products on the basis of volumes traded (2). The table below presents Trading’s worldwide crude oil sales and supply sources and petroleum products sales for each of the past three years. Trading of physical volumes of crude oil and petroleum products amounted to 6.6 Mb/d in 2018, compared to 6.1 Mb/d in 2017 and to 5.6 Mb/d in 2016.
Trading’s crude oil sales and supply and petroleum products sales (a)
(kb/d) | 2018 | 2017 | 2016 |
Group’s worldwide liquids production | 1,566 | 1,346 | 1,271 |
Purchased from Exploration & Production | 1,167 | 1,120 | 1,078 |
Purchased from external suppliers | 3,193 (b) | 2,870 | 2,444 |
TOTAL OF TRADING’S CRUDE SUPPLY | 4,360 | 3,990 | 3,522 |
Sales to Refining & Chemicals and Marketing & Services segments | 1,480 | 1,527 | 1,590 |
Sales to external customers | 2,880 | 2,463 | 1,932 |
TOTAL OF TRADING’S CRUDE SALES | 4,360 | 3,990 | 3,522 |
PETROLEUM PRODUCTS SALES BY TRADING | 2,286 | 2,154 | 2,105 |
(a) Including condensates.
(b) Including inventory variations.
Trading operates extensively on physical and derivatives markets, both organized and over the counter. In connection with its Trading activities, TOTAL, like most other oil companies, uses derivative energy instruments (futures, forwards, swaps and options) in order to adjust its exposure to fluctuations in the price of crude oil and petroleum products. These transactions are entered into with a wide variety of counterparties.
For additional information concerning derivatives transactions by Trading & Shipping, see Note 16 (Financial instruments related to commodity contracts) to the Consolidated Financial Statements (refer to point 8.7 of chapter 8).
All of TOTAL’s Trading activities are subject to strict internal controls and trading limits.
2.3.2.2 Shipping
The transportation of crude oil and petroleum products necessary for the activities of the Group is coordinated by Shipping. These requirements are fulfilled through the balanced use of spot and time-charter markets. Additional transport capacity can also be used to transport third-party cargo. Shipping maintains a rigorous safety policy, mainly through a strict selection of chartered vessels.
In 2018, Shipping chartered approximately 3,000 voyages (slightly higher than 2017 and 2016) to transport 143 Mt of crude oil and petroleum products, compared to 133 Mt in 2017 and 131 Mt in 2016. On December 31, 2018, the mid-term and long-term chartered fleet amounted to 56 vessels (including 8 LPG vessels), compared to 59 in 2017 and in 2016. Shipping only charters vessels satisfying the best international standards and the average age of the fleet is approximately six years.
As part of its Shipping activity, the Group, like other oil companies and ship owners, uses freight rate derivative contracts to adjust its exposure to market fluctuations.
(1) Backwardation is the price structure where the prompt price of an index is higher than the future price.
(2) Company data.
2.4 Marketing & Services segment
The Marketing & Services segment includes worldwide supply and marketing activities of oil products and services.
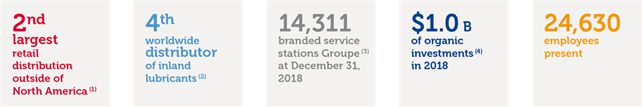
Petroleum products sales (a)
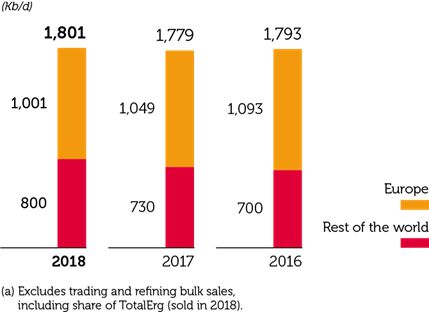
Petroleum product sales increased by 1% in 2018 compared to 2017. The sale of TotalErg in Italy was offset by higher sales in the rest of the world.
[REDACTED SECTION: CERTAIN TEXT HAS BEEN REDACTED.]
(1) Source IHS, number of service stations for TOTAL, BP, Chevron, Exxon and Shell.
(2) Source IHS.
(3) TOTAL, Total Access, Elf, Elan and AS24, including service stations owned by third parties.
(4) Organic investments = net investments, excluding acquisitions, divestments and other operations with non-controlling interests (refer to point 2.5.1 of this chapter).
[REDACTED SECTION: CERTAIN TEXT HAS BEEN REDACTED.]
2.4.1 Presentation of the segment
The Marketing & Services (M&S) business segment is dedicated to the development of TOTAL’s petroleum products distribution activities and related services throughout the world.
Present in more than 130 countries, M&S conveys TOTAL’s brand image to its customers, both individual and professional. TOTAL’s ambition is to be a leading brand recognized for its proximity to its customers and the value that it brings to each of them. M&S achieves this ambition by creating solutions aimed at performance, energy efficiency, mobility, new energies for mobility (1) and digital transformation. It promotes the brand awareness through significant advertising campaigns and a strong presence on the ground, with more than 14,000 service stations around the world. To best meet its customers’ current and future needs, M&S continues its efforts in R&D in order to design and develop new products, in particular for the engine technologies of the future.
M&S pursues a proactive, primarily organic development strategy focused on large growing markets. In 2018, organic investments were approximately $1 billion, stable compared to 2017, and focused mainly on retail activity. M&S continues to consolidate its market share in key Western European markets (2), where it has reached critical mass and is one of the main distributors of petroleum products. M&S continues to develop its activities in Africa, where it is the market leader (3).
M&S is implementing a dynamic portfolio management strategy. In 2018, it continued to make targeted acquisitions and enter targeted partnerships in order to support the development of its activities on growth and promising markets. After acquisitions in the Philippines and Vietnam in 2016, M&S continues to grow in the largest Asian markets, with the signature in 2018 of a major partnership with an Indian conglomerate, with an objective to build over time a retail network of 1,500 service stations in India. In February 2019, Saudi Aramco and TOTAL signed a joint venture agreement to develop a network of fuel and retail services in Saudi Arabia. Following the acquisition of a network in the Dominican Republic in 2016, it is pursuing its growth in the Americas zone, in countries such as Brazil and Mexico, respectively the largest and second-largest petroleum products distribution markets (4) in Latin America, and on the natural gas vehicles market in the United States. In 2018, TOTAL also launched a fuel retail network with the national company in Angola.
In January 2018, M&S exited the fuel distribution and commercial sales businesses in Italy by selling its interest in the TotalErg joint-venture, while maintaining its lubricants activities in the country. M&S finalized the sale of its mature LPG distribution assets in Italy, Belgium, Luxembourg and Germany in 2017. It also sold in 2017 its stake in Société du Pipeline Méditerranée Rhône (SPMR), which operates a network of petroleum product pipelines in the South of France.
M&S’s three main business areas are:
-Retail, with a network of more than 14,000 Group-branded service stations (5). The Group is refocusing on its key markets in Western Europe and continues to develop in Africa, where it is present in almost 40 countries, as well as in major growing markets in Asia and the Americas. It sells high-performance fuels and petroleum products and new energies for mobility (NGV, hydrogen, electric charging for vehicles). M&S proposes a fuel cards offer that provides fuel payment solutions and vehicle fleet management services to businesses of all sizes. M&S is developing partnerships with leading brands in restauration and convenience stores, and new services built on digital innovations to capture and retain new customers. It is also pursuing its growth in the car wash market through its TOTAL WASH brand. These offers support customers in their mobility by providing them with all of the products and services they need at "One Stop Shop" service stations. The Group also addresses the road freight transport sector through the specialized AS24 network in Europe;
-the production and sale of lubricants, a sector that accounts for a significant share of M&S’s adjusted net operating income. TOTAL intends to maintain the growth dynamic of its position by strengthening in particular the growth of its premium products with higher unit margins. M&S is pursuing its commercial and technological partnerships with car manufacturers. Investments in R&D enable the Group to supply high-quality premium lubricants to its customers worldwide. TOTAL has 43 production sites (blending plants); and
-the distribution of products and services for professional markets. Based on the diversity of its product ranges and its worldwide logistics network deployed in proximity to its customers, TOTAL is a partner of choice and a local supplier of products (mainly bulk fuels, aviation fuel, special fluids, LPG, bitumens, heavy fuels and marine bunkers), in particular for major multinational industrial groups. The Group also offers solutions that help its customers to manage all their energy needs with new digital platforms such as the management of on-site facilities and the reduction of their environmental footprint.
As part of its business, M&S owns stakes through its subsidiaries in four refineries in Africa, following the sale of its minority interest in a refinery in Gabon in 2016. Following the sale of its interest in the TotalErg joint-venture in early 2018, M&S has exited Italian refining.
(1) Electro-mobility, natural gas vehicle (NGV), hydrogen, LNG bunker.
(2) France, Germany, Belgium, Luxembourg and the Netherlands.
(3) Publicly available information, based on the number of Group-branded service stations in Africa in 2017.
(4) Source IHS 2018.
(5) This figure takes into account close to 500 stations licensed under the TOTAL brand in Turkey and excludes more than 2,500 TOTAL service stations sold in Italy at the start of 2018.
2.4.2 Sales of petroleum products
The following table presents M&S petroleum products sales (a) by geographical area:
(kb/d) | 2018 | 2017 | 2016 |
Europe | 1,001 | 1,049 | 1,093 |
France | 517 | 519 | 541 |
Europe, excluding France | 484 | 530 | 552 |
Africa | 443 | 431 | 419 |
Middle East | 41 | 45 | 55 |
Asia Pacific (b) | 199 | 173 | 150 |
Americas | 117 | 81 | 76 |
(a) In addition to M&S’s petroleum product sales, the Group’s sales also include international trading (1,777 kb/d in 2018, 1,659 kb/d in 2017 and 1,690 kb/d in 2016) and bulk refining sales (575 kb/d in 2018, 581 kb/d in 2017 and 700 kb/d in 2016).
(b) Including Indian Ocean islands.
2.4.3 Service stations
The table below presents the geographical distribution of the Group’s branded (a) service stations:
As of December 31 | 2018 | 2017 | 2016 |
Europe (b) | 5,625 | 8,194 | 8,309 |
of which France | 3,490 | 3,548 | 3,593 |
of which TotalErg | 0 | 2,519 | 2,585 |
Africa | 4,449 | 4,377 | 4,167 |
Middle East | 877 | 821 | 809 |
Asia-Pacific (c) | 1,951 | 1,864 | 1,790 |
Americas | 561 | 555 | 585 |
AS24 network (dedicated to heavy-duty vehicles) | 848 | 819 | 801 |
TOTAL | 14,311 | 16,630 | 16,461 |
(a) TOTAL, Total Access, Elf, Elan and AS24. Including service stations owned by third-parties.
(b) Excluding AS24 network.
(c) Including Indian Ocean islands.
2.4.4 Activities by geographical area
The information below describes Marketing & Services’ (M&S) principal activities presented by geographical zone and main business areas.
2.4.4.1 Europe
A) Retail
M&S is responding to changing markets in Western Europe by developing an innovative and diversified line of products and services with the objective to maintain its market shares. The network is made up of almost 6,500 Group-branded service stations (1), mainly divided among its key markets, which are France, Belgium, the Netherlands, Luxembourg and Germany, where M&S reached an average market share of 16% in 2018.
-In France, the dense retail network of almost 3,500 stations includes over 1,600 TOTAL-branded service stations, nearly 690 Total Access-branded stations (service stations combining low prices and high-quality fuels) and nearly 1,100 Elan-branded stations (located in rural areas), of which 560 are expected to be rebranded as TOTAL stations by the end of 2019. The Group is diversifying its offering of new energies for mobility by extending the roll-out of electric charging points and NGV stations. In 2018, it took over G2Mobility, one of France’s leading suppliers of charging solutions for electric vehicles for public authorities and on professional markets (2). In addition, TOTAL launched the roll-out of its NGV offering, which should be available in nearly 100 TOTAL-branded and AS24-branded stations by 2022.
The Group-branded service stations enjoy close relationships with their local customers, meeting their everyday needs with a multi-service, multi-product offering developed through services in restaurants, convenience stores and car washes provided by leading brands such as Bonjour and TOTAL WASH, as well as partnerships tailored to local requirements.
TOTAL has interests in 28 depots in France, 7 of which are operated by Group companies. In 2017, TOTAL acquired a stake in the share capital of Dépôt Rouen Petit-Couronne (DRPC).
(1) Including the AS24 network and after the sale of the network of TotalErg service stations in Italy.
(2) Company data based on the number of installed charging points in France for public authorities.
-In Germany, TOTAL is the country’s third-largest operator (1) with nearly 1,200 Group-branded service stations at the end of 2018.
-In Belgium, TOTAL is the country’s top operator (1) with nearly 530 Group-branded service stations.
-In the Netherlands, TOTAL made successful bids in 2018 during the annual auctions for three new highway stations, including one of the largest stations in the country.
In 2016, TOTAL also finalized the sale of its network of 450 service stations in Turkey, which will continue to use the TOTAL brand under the terms of a brand licensing agreement (today, there are 500 TOTAL-branded stations). TOTAL is maintaining its lubricants activities in the country.
TOTAL is rolling out a dedicated offering for the growing freight transport sector. The AS24 brand has a network of over 800 service stations aimed at heavy-duty vehicle customers in 28 European countries. AS24 seeks continued growth, primarily in the Mediterranean basin and Eastern Europe and through its toll payment card service which covers nearly 20 countries. AS24 is also addressing the future needs of the freight transport sector by diversifying its offering with the gradual introduction of NGV to its network in France and certain other European countries and new digital services.
In addition, the acquisition in 2017 of PitPoint B.V., which specializes in the distribution of new energies for mobility (NGV, hydrogen, electric charging points), enables the Group to pursue the development of its low-carbon activities in Europe. This company has a network of around 100 NGV stations in the Netherlands, Germany and Belgium.
TOTAL is also a major player in the European market for fuel payment cards with nearly 3.5 million cards, enabling companies of all sizes to improve fuel cost management and access an ever-increasing number of services. TOTAL is expanding its fuel card offering for professional customers, with an electric charging service across Europe and new digital applications. The acquisition of the French start-up WayKonect enables the Group to reinforce its company vehicle fleet management services by integrating a series of tools combining digital data processing solutions, an application for drivers and an on-board box.
B) Lubricants
TOTAL continues its development in Europe, where it relies mainly on its lubricants production sites in Rouen (France) and Ertvelde (Belgium). During the course of 2018, the European production system was completed by a new lubricants production plant in Russia.
In addition, TOTAL resumed in 2017 the distribution of its lubricants in Portugal. In Italy, the Group is reinforcing its position following the purchase from Erg of its shares in the lubricants business previously operated by TotalErg.
C) Professional markets and other specialties
In Europe, TOTAL produces and markets specialty products and relies on its industrial facilities to produce special fluids (Oudalle in France) and bitumen (Brunsbüttel in Germany).
TOTAL promotes in France a wide range of fuels and services to 135,000 vehicle fleet managers. Fuel sales (heavy fuels, domestic fuels, etc.) reach nearly one million customers.
2.4.4.2 Africa
A) Retail
TOTAL is the leading marketer of petroleum products in Africa, with a 17% share of the retail market in 2018 (2). It is pursuing a strategy of profitable growth aiming at outpacing market expansion.
In the Africa zone, the retail network in 2018 was made up of up to 4,500 Group-branded service stations in nearly 40 countries. The Group has major retail networks in South Africa, Nigeria, Egypt and Morocco. In 2018, TOTAL also launched in Angola a fuel retail network with the national company Sonangol.
In order to achieve its goal of gaining market share in all of the countries where it is present in Africa, and in addition to its organic growth strategy, TOTAL acquires independent petroleum networks in certain countries. The Group finalized in 2017 the purchase of assets in Kenya, Uganda and Tanzania, enabling it to strengthen its supply and logistics activities in East Africa and boost the growth of the retail network with nearly 100 additional service stations, notably in Tanzania.
M&S is diversifying its offering at service stations and is deploying a range of products and new services in food services, stores and car wash. To this end, the Group is developing partnerships, particularly with African start-ups, in order to introduce new electronic payment solutions capable of improving customer experience at the point of sale.
B) Lubricants
TOTAL is the leading distributor (2) of lubricants on the African continent and continues its growth strategy. M&S relies in particular on its lubricant production plants in Nigeria, Egypt and South Africa. A new production site is under construction in Algeria. In Tanzania, TOTAL acquired a lubricants production plant and the associated commercial activities will enable it to grow in the country and in neighboring countries.
C) Professional markets and other specialties
TOTAL is a leading partner, notably for mining customers in Africa, by delivering complete supply chain and management solutions for fuels. TOTAL is also developing innovative, low-carbon energy solutions as part of hybrid offerings by incorporating solar energy into its existing portfolio of products and services.
M&S also offers a diverse range of products and services aimed at professionals in Africa. Industrial customers receive support from TOTAL for the maintenance of on-site facilities with a lubricants in-service analysis solution, for example. In mining, construction and agriculture, it offers its Optimizer digital platform, which enables customers to cut their costs through better control of their energy consumption using the data sent from sensors installed on their facilities and equipment.
2.4.4.3 Asia-Pacific - Middle East
M&S markets its products and services in more than 20 countries in this zone.
A) Retail
TOTAL has more than 2,000 Group-branded service stations over the Asia-Pacific - Middle East zone at year-end 2018, with service station networks in Cambodia, China, Indonesia, Jordan, Lebanon, Pakistan and the Philippines. The Group is also a significant player in the Pacific islands.
While pursuing its growth in Pakistan, the Philippines and China, TOTAL continues to grow on the major markets by joining forces with an Indian conglomerate to build a retail network of 1,500 service stations over 10 years in India. The two companies are aiming, in particular, to grow on the country’s main roads, such as highways and inter-city connections.
In February 2019, Saudi Aramco and Total signed a Joint Venture Agreement to develop a network of fuel and retail services in Saudi Arabia. The two companies have also signed an agreement to acquire two companies, thereby jointly acquiring their existing network of 270 service stations and their fuel tanker fleet. Saudi Aramco and Total plan to modernize this network and build high-quality service stations at selected locations. This operation is subject to prior approval of the competent administrative authorities.
(1) Source: IHS 2017.
(2) Company data.
TOTAL is also pursuing its growth in the zone by offering TOTAL EXCELLIUM premium fuels, which are now available in China, Fiji, New Caledonia, Pakistan and the Philippines.
B) Lubricants
The lubricants business is contributing to M&S’s expansion in Asia. The lubricants blending capacity in this zone is spread over 11 production sites, and in particular the plants in Singapore, Tianjin and Dubai. M&S proposes a premium product and services offering through its network of service centers. It is also developing partnerships with leading Asian car manufacturers, other industries and major actors in online commerce in order to grow its sales and develop new services.
C) Professional markets and other specialties
TOTAL has signed several partnership agreements with industrial customers, enabling it to expand its operations on a number of markets, such as mining and construction, in several countries in the zone. The Group now supplies lubricants to one of the world’s leading mining industry service providers on more than 20 mining sites mostly in Australia, Indonesia and Mongolia. In 2018, TOTAL also signed a preferred supplier agreement with a Chinese partner that is a world major company in construction and public works, in order to extend their partnership, which currently focuses on Africa, to a worldwide scale.
In specialty products, TOTAL confirmed its position as number two (1) on the LPG market in Vietnam. In India, TOTAL also conducts LPG activities, including a network of service stations providing LPG fuels.
2.4.4.4 Americas
In retail, the Group operates on several Caribbean islands and has at year-end 2018 more than 550 Group-branded service stations.
At the end of 2018, TOTAL entered the fuel distribution sector in Brazil, Latin America’s largest petroleum products distribution market (2), by acquiring from a Brazilian company a network of 280 service stations, along with its petroleum products distribution, resale and import activities. M&S is already present in Brazil in lubricants.
In 2018, TOTAL also expanded in new energies for mobility by acquiring a 25% stake in the American NASDAQ-listed company Clean Energy Fuels Corp., which is a leading supplier of natural gas fuel in North America. TOTAL is now a reference shareholder in this company.
Benefitting from the reform and liberalization of the Mexican energy market, TOTAL entered into a partnership in 2017 with a local service station group and will gradually switch a network of nearly 250 service stations in Mexico over to the TOTAL brand. At the end of 2018, the Group had 90 TOTAL-branded service stations in the country.
The Group acquired, in January 2016, a 70% stake in the fuel marketing leader in the Dominican Republic, which operates a network of 130 service stations, commercial sales and lubricants activities. Furthermore, TOTAL sold its network of 92 stations and its general commercial activities in Haiti in 2018, as well as its network of almost 20 service stations in Costa Rica in 2017.
In lubricants and other specialty products, TOTAL is pursuing its strategy of growth across the region, mainly in lubricants, aviation fuel and special fluids. To strengthen its special fluids business, the Group has built a production plant in Bayport, Texas, which has been operational since early 2016.
2.4.5 Products and services development
The Group develops technologically advanced products, some of which are formulated for use in motor sports competition before being generally released on the market, and continues its technical partnerships. The Group is notably associated with the PSA group, with which a cooperation agreement was renewed in late 2016 relating to R&D, business relations with the three PSA brands (Peugeot, Citroën, DS) and automobile racing. In 2018, TOTAL continued to supply DS Performance with lubricants specifically developed for the Formula E (3) championship. In addition, in 2018, TOTAL became the official supplier of fuels to various endurance championships (4), including the Le Mans 24 Hours, for the next five years. These partnerships demonstrate TOTAL’s technical excellence in the formulation of fuels and lubricants under extreme conditions, subject to requirements to reduce fuel consumption, for the engines of the future.
In order to respond to developments in world markets and prepare for tomorrow’s growth opportunities, TOTAL develops products and services in collaboration with its customers that optimize their energy consumption, such as the products under the Total Ecosolutions label, which include TOTAL EXCELLIUM fuels and Fuel Economy lubricants. These solutions include a diversified range of energy supplies (fuels, gas, solar and wood pellets) as well as consumption auditing, monitoring and management services, particularly through innovative digital platforms for industrial customers, such as the Optimizer solution, developed for customers in mining, construction and public works and agriculture.
Overall, TOTAL is accelerating its digital innovation strategy in order to develop new offerings for its customers and improve operational efficiency. In Europe, after having developed a digital solution with a car-sharing company that allows drivers to pay for their fuel directly from a connected car, TOTAL has launched its TOTAL eWallet mobile payment solution, which is available for professional customers in Germany and being launched in Belgium. In Africa, TOTAL is continuing to develop new electronic payment solutions that will enable it to extend its money transfer and smartphone payment services. In addition, the Total Services mobile application has been launched in 47 countries. Using a centralized digital tool, close to 6 million customers in 13 countries can receive personalized offers from the Group.
(1) Company data.
(2) Source IHS 2018.
(3) Formula E: motor racing championship using single-seater electrically-powered cars.
(4) As of 2018, official supplier of fuel for the FIA World Endurance Championship, together with the 24 Hours of Le Mans, the European Le Mans Series and the Asian Le Mans Series.
The Group is also continuing to carry out research of and launch IoT (1) applications for logistics, maintenance and security. Transporter customers can now use a new service to geolocalize their trailers. In addition, TOTAL offers online domestic heating oil orders in France via the fioulmarket.fr web site, as well as its online platform Bitume Online for fixed-price bitumen purchases aimed at its professional customers.
For the longer term, TOTAL intends to expand into alternatives to traditional fuels and has comprehensive commercial offerings in this area.
-Natural gas for land transportation: As of today, TOTAL has more than 350 stations (2) supplying NGV to individual and professional customers in Asia, Africa and Europe, a decrease following the streamlining of the network of NGV stations in Pakistan. Following the takeover of PitPoint B.V. in 2017, TOTAL started deploying new NGV stations in Europe in its TOTAL-branded and AS24-branded network. The Group intends to accelerate the development of this network to quickly establish coverage that meets its customers’ expectations, and will initially target the freight transportation segment on its key European markets (Germany, Belgium, France, Luxembourg, the Netherlands). TOTAL is also positioned on the American NGV market following the acquisition of a 25% stake in Clean Energy Fuels Corp., which is a leading supplier of natural gas fuel in North America. Clean Energy Fuels Corp. has launched an innovative leasing program that is expected to place thousands of new heavy-duty vehicles powered by natural gas on the road. This program enables freight operators to acquire trucks equipped with a cleaner natural gas engine at no extra cost compared with diesel engines.
-Electro-mobility: TOTAL has more than 100 service stations equipped with charging points in Germany, Benelux and France at year-end 2018. The equipment of stations with higher power charging points on major roads will continue in the coming years, with the aim of covering the Group’s key European markets with a network of charging points every 150 km. A total of nearly 300 stations should be equipped with more than 1,000 charging points by 2022. The Group offers greater access for its customers to other operators’ networks of charging points through specific partnerships. The acquisition of G2Mobility will enable the Group to also offer more efficient charging solutions to its individual and professional customers.
-Hydrogen: TOTAL continues to rollout hydrogen stations under the H2 Mobility Germany joint-venture. This partnership was created in 2015 with Air Liquide, Daimler, Linde, OMV and Shell, to build a network that could reach 400 hydrogen stations in Germany. The joint-venture aims to create an initial network of around 100 stations by 2019, a third of which will be TOTAL stations. In 2018, TOTAL’s hydrogen stations represented nearly one third of the around 50 stations rolled out by H2 Mobility Germany.
-Natural gas for shipping: In order to meet the new emission standards for marine fuels that will come into effect in 2020, TOTAL is supporting its customers through this transition with its subsidiary Total Marine Fuel Global Solution, which offers a diversified range of marine fuels and associated services. The Group is expanding its product portfolio with marine bunker fuels, which have a sulfur content of 0.5%, and LNG bunker. To promote the establishment of LNG as a marine fuel, TOTAL signed in 2017 its first partnership agreements in Europe and Asia notably with the shipping companies CMA CGM and Brittany Ferries. The Group is also reinforcing its logistics systems to meet the needs of its customers in the major supply centers in Amsterdam-Rotterdam-Antwerp, Singapore and Oman. In particular, TOTAL and Pavilion Energy have signed an agreement in order to jointly develop an LNG supply chain in the port of Singapore. This agreement provides for the long-term joint chartering of a new-generation bunker vessel that the partner will bring into service in 2020.
(1) Internet of Things: connected objects.
(2) Including PitPoint B.V. NGV stations and excluding NGV stations in Italy. Hosted or operated stations.
2.5 Investments
2.5.1 Major investments over the 2016-2018 period (1)
Gross investments (a) (M$) | 2018 | 2017 | 2016 |
Exploration & Production | 15,282 | 12,802 | 16,085 |
Gas, Renewables & Power | 3,539 | 797 | 1,221 |
Refining & Chemicals | 1,781 | 1,734 | 1,861 |
Marketing & Services | 1,458 | 1,457 | 1,245 |
Corporate | 125 | 106 | 118 |
TOTAL | 22,185 | 16,896 | 20,530 |
Net investments (b) (M$) | 2018 | 2017 | 2016 |
Exploration & Production | 10,330 | 10,886 | 13,895 |
Gas, Renewables & Power | 3,230 | 726 | 1,162 |
Refining & Chemicals | 862 | (1,086) | 1,773 |
Marketing & Services | 1,030 | 1,044 | 821 |
Corporate | 116 | 66 | 106 |
TOTAL | 15,568 | 11,636 | 17,757 |
(M$) | 2018 | 2017 | 2016 |
Acquisitions | 7,692 | 1,476 | 2,033 |
including resource acquisitions (c) | 4,493 | 714 | 780 |
Divestments | 5,172 | 4,239 | 1,864 |
Other operations with non-controlling interests | (622) | (4) | (104) |
Organic investments (d) (M$) | 2018 | 2017 | 2016 |
Exploration & Production | 9,186 | 11,310 | 14,464 |
Gas, Renewables & Power | 511 | 353 | 270 |
Refining & Chemicals | 1,604 | 1,625 | 1,642 |
Marketing & Services | 1,010 | 1,019 | 1,003 |
Corporate | 115 | 88 | 105 |
TOTAL | 12,426 | 14,395 | 17,484 |
(a) Including acquisitions and increases in non-current loans. The main acquisitions for the 2016-2018 period are detailed in Note 2 of the Consolidated Financial Statements (point 8.7 of chapter 8).
(b) Net investments = gross investments - divestments - repayment of non-current loans - other operations with non-controlling interests. The main divestments for the 2016-2018 period are detailed in Note 7 of the Consolidated Financial Statements (point 8.7 of chapter 8).
(c) Resource acquisitions = acquisition of a participating interest in an oil and gas mining property by way of an assignment of rights and obligations in the corresponding permit or license and related contracts, with a view to producing the recoverable oil and gas.
(d) Organic investments = net investments excluding acquisitions, divestments and other operations with non-controlling interests.
In the Exploration & Production segment, most of the organic investments were dedicated to the development of new hydrocarbon production facilities, the maintenance of existing facilities as well as exploration activities. Development investments related in particular to the 10 major projects that started up in 2018 (Fort Hills in Canada, Vaca Muerta in Argentina, Timimoun in Algeria, Yamal LNG trains 2 & 3 in Russia, Kaombo Norte in Angola, Ichthys LNG trains 1 & 2 in Australia, Halfaya 3 in Iraq, and Egina in Nigeria), and the other major projects under construction, for which an investment decision has been taken or that are expected to start in the years to come (Tempa Rossa in Italy, Iara 1 & 2 and Libra 1 in Brazil, Kaombo South in Angola, Culzean in the United Kingdom, Johan Sverdrup 1 & 2 in Norway, Yamal LNG train 4 in Russia, Absheron in Azerbaijan and Zinia 2 in Angola).
In the Gas, Renewables & Power segment, organic investments were made mainly in the development of the project for three trains for Cameron LNG in the United States, which entered the Group’s scope following the acquisition of Engie’s upstream LNG business, as well as the projects to build solar power plants, managed by Total Solar and the industrial activities of Saft Groupe and SunPower.
In the Refining & Chemicals segment, organic investments were made, on the one hand, in the safety and maintenance of facilities, and, on the other hand, in projects aimed at improving the competitiveness of plants. In 2018, the Group continued the transformation of the French refinery at La Mède into a biorefinery. In addition, significant investments were approved, with the development of petrochemical activities in Texas (United States) as part of a joint-venture with Borealis and Nova, and a project to increase the capacity of the Daesan integrated platform in South Korea.
(1) Following the reorganization of the Group, which has been fully effective since January 1, 2017, the 2016 data has been restated on this basis.
In the Marketing & Services segment, organic investments in 2018 mainly concerned retail networks in growing regions in Africa and Asia, logistics and specialty products production and storage facilities.
The Group’s acquisitions in 2018 amounted to $8.3 billion, of which $4.5 billion in resource acquisitions, compared to $1.5 billion in 2017 and $2 billion in 2016.
The Group took advantage of favorable market prices to extend its Exploration & Production portfolio by finalizing in 2018, on the one hand, the acquisition of interests held by Petrobras in the Iara and Lapa concessions in Brazil under the terms of a strategic alliance between the two groups, and, on the other hand, the acquisition, as part of a transaction of equity and debt, of Mærsk Olie og Gas A/S, which has a portfolio located mainly in OECD countries. In addition, TOTAL strengthened its presence in the Gulf of Mexico with the finalization of the acquisition of interests in the North Platte and Anchor offshore discoveries in the United States. Finally, TOTAL consolidated its presence in the Middle East with the acquisition of interests in the two new offshore concessions in Abu Dhabi and in the Waha concessions in Libya.
As part of its integrated gas strategy, the Group finalized the acquisition of Engie’s upstream LNG business, thus becoming the world’s second LNG actor (1). This acquisition is expected to fully benefit from the strong growth of the LNG market. In keeping with its strategy to develop a profitable low-carbon electricity activity, TOTAL finalized the acquisition of Direct Énergie and of two gas power plants from KKR-Energas. In the Marketing & Services segment, TOTAL accelerated its growth in new energies for mobility with the acquisition of 25% of the share capital of the Clean Energy Fuels Corp. (2) in the United States and of G2Mobility in France. In the lubricants business, the Group strengthened its position in Italy by finalizing in January 2018 the purchase of Erg’s 51% stake in the TotalErg joint-venture, which has been terminated.
TOTAL pursued the dynamic management of its portfolio and finalized divestments amounting to a total of $5.2 billion in 2018. In particular, the Group sold its interests in the Martin Linge and Visund fields in Norway, and in the Joslyn oil sands project. It also disposed of 1.47% of its stake in the Fort Hills oil sands mining extraction project in Canada and of 4% of the Ichthys LNG project in Australia. In the Marketing & Services segment, TOTAL sold its interests in the distribution, refining and LPG activities of TotalErg in Italy and its fuel distribution activities in Haiti.
Net investments were thus $15.6 billion in 2018 compared to $11.6 billion in 2017 and $17.8 billion in 2016.
2.5.2 Major planned investments
The Group anticipates that its net investments will be between $15 billion and $16 billion in 2019, in line with its investment targets of between $15 billion and $17 billion per year for the period 2018-2020, a range ensuring the profitable future growth for the Group.
Investments in the Exploration & Production segment are expected to mainly be in the major ongoing development projects: Iara 1 and 2 and Libra 1 in Brazil, Kaombo South in Angola, Culzean in the United Kingdom, Johan Sverdrup 1 & 2 in Norway, Yamal LNG train 4 in Russia, Absheron in Azerbaijan and Zinia 2 in Angola. The Group expects to launch by 2020 more than 20 major projects. A portion of the investments is expected to be allocated to assets already in production, in particular for maintenance capital expenditures and in-fill wells.
In the Refining & Chemicals segment, and in line with its growth strategy in petrochemicals, the Group expects to continue its investments to develop its petrochemicals activities in Texas in the United States, as part of a joint-venture with Borealis and Nova, and increase of its petrochemicals capacities on the Daesan integrated platform in South Korea. In addition, the Group has launched a major project in cooperation with Saudi Aramco in Saudi Arabia, and announced the signature of a shareholders’ agreement with Sonatrach to build a petrochemicals complex in Arzew, Algeria. A significant portion of the segment’s investment budget will also be allocated to safety and maintenance of the Group’s facilities.
In the Marketing & Services segment, investments are expected to be allocated in particular to the service station network, logistics, and production and storage facilities of specialty products, particularly lubricants. Most of the segment’s investment budget will be allocated to growing regions, notably Africa, the Middle East and Asia.
The Group expects to continue investing to grow its Gas, Renewables & Power businesses, as well as in R&D. The Group has notably signed an agreement with EPH to acquire as from January1, 2020 the two gas power plants from Uniper France’s portfolio which represent a capacity of 828 MW, in line with TOTAL’s low-carbon electricity strategy.
2.5.3 Financing mechanisms
TOTAL self-finances most of its investments with cash flow from operating activities and may occasionally access the bond market when financial market conditions are favorable. Investments for joint-ventures between TOTAL and external partners may be financed through specific project financing.
As part of certain project financing arrangements, TOTAL S.A. has provided guarantees. These guarantees ("Guarantees given on borrowings") as well as other information on the Group’s off-balance sheet commitments and contractual obligations appear in Note 13 to the Consolidated Financial Statements (point 8.7 of chapter 8). The Group believes that neither these guarantees nor the other off-balance sheet commitments of TOTAL S.A. or of any other Group company have, or could reasonably have in the future, a material effect on the Group’s financial position, income and expenses, liquidity, investments or financial resources.
(1) Based on quantities managed. Public data.
(2) A company listed on the NASDAQ, 25% owned on December 31, 2018.
2.6 Research & Development
In 2018, the Group invested $986 million in R&D, compared to $912 million in 2017 and $1,050 million in 2016. There were 4,288 people dedicated to R&D activities in 2018 compared to 4,132 in 2017 and 4,939 in 2016 (1).
TOTAL’s global investment to prepare the future of its oil and gas and low-carbon electricity activities was approximately $1.1 billion. This includes the entire R&D effort, as well as developments in the fields of digital technology, technology and the investments funded by Total Energy Ventures.
To achieve the Group’s ambition to become the responsible energy major, TOTAL R&D engages its employees in programs in five priority areas that aim to address both the specific challenges in these segments and the Group’s transverse issues:
-safety in the broadest sense, including the safety of facilities, the sustainable development of the Group’s activities, control of its environmental footprint and societal impacts as well as the eco-design of products;
-operational efficiency, in terms of cost reductions, increased productivity and, ultimately, competitive advantage, in both the discovery and operation of energy resources and the integrity and performance of the Group’s industrial units in terms of availability, industrial energy efficiency and the competitive performance;
-new services and products, including smart electricity grids, energy management solutions for customers, mobility solutions, the development of specific polymers, innovative and competitive multi-functional materials, or new fluids for electric and hybrid vehicles;
-an energy mix based on low-carbon energies combining gas and LNG (liquefied natural gas) technologies, sun and wind power, hybrid energy management systems, as well as battery technologies, CO2 capture, use and storage (CCUS) technologies, bioproducts, such as biofuels and biopolymers, and recycling; and
-digital technology, in the broadest sense, including high-performance computing and blockchain technologies, data sciences, the Internet of Things (IoT), robotics and artificial intelligence applied to the Group’s activities.
The Group is investing in the preparation of its future in open innovation by calling on its talents, its research infrastructures, its pilot sites and its international research centers, as well as on start-ups and top-level academic partners. Consequently, the Group has 18 R&D centers worldwide and approximately 1,000 agreements with its partners.
Additionally, the Group implements an active industrial property policy to protect its innovations, and to maximize their use and technological differentiation. In 2018, the Group filed more than 200 patent applications.
2.6.1 Transverse programs
In addition to a specific program dedicated to strategic anticipation, seven transverse programs cover new and strategic sectors, or share knowledge and infrastructures in the following areas:
-Health, Safety and Environment (HSE), with, for example, the development of the TADI (Transverse Anomaly Detection Infrastructure) platform that reproduces gas leak scenarios, ranging from crisis management to environmental surveillance. More than 20 acoustic or optical detection techniques were tested in various campaigns in 2018, providing an open innovation platform for potential suppliers and for discussions with other industrial companies to select the best available technologies for the detection and quantification of gas leaks, and of methane in particular;
-CO2 capture, use and storage (CCUS), such as the large-scale Northern Lights research project in Norway, in which the Group is involved alongside Shell and Equinor. The first phase of the project relates to a storage capacity of approximately 1.5 Mt/y. TOTAL also participates in two CCU innovation centers in Canada with start-ups, looking into new technologies for the capture of CO2 and the conversion of CO2 into intermediate products for chemicals and materials. TOTAL has also joined three demonstration centers for the storage of CO2 for geomechanical studies and studies of the control of CO2 injection;
-energy efficiency, with, for example, the installation of the first DIESTA cooling tower in a refinery to cool a distillate. This technology was initially designed to cool and condense propane for LNG cold generators;
-gas, with, for example, an initiative that aims to map out the different emerging technologies and to compare them with baselines in terms of their carbon footprint, energy efficiency and economic performance. This initiative is also being deployed for the conversion of natural gas into high-added value molecules, such as olefins (ethylene and propylene). The first material balances produced by the partnership with GTC Technology, a leading American actor in petrochemicals process engineering on an international scale, are in line with the Group’s expectations;
-digital technology, with the development of new digital seismic imaging methods, artificial intelligence algorithms to optimize the detection of hydrocarbons on surface water and refining processes, and a digital simulator of the tribological phenomena in lubricants;
-analysis and measurements, with, for example, the bases of a methodology combining physico-chemical and olfactometric analysis with digital methods in the Group’s partnership with Alès Mines. This methodology is of particular interest to the improvement of the olfactory quality of materials, and of polymers and composites in particular, and provides for greater responsiveness in the event of odorous episodes in the vicinity of the Group’s industrial sites;
-understanding of process and product performance, with, for example, the control of crude/water emulsions using an approach based on modeling in collaboration with ETH Zürich.
The anticipation program is carried out by forward-looking projects that aim to assess the impact on the Group’s businesses of new technologies, such as nanotechnology, robotics or the mobility of the future.
(1) Figures for 2016 concerning the Group’s R&D investments and emplo--yees were not restated following the sale of Atotech (finalized in January 2017).
2.6.2 Business segment-specific programs
2.6.2.1 Exploration-Production segment
All of the R&D projects aim to combine environmental performance, improved safety and economic viability of operations. A major asset for R&D lies in the remarkable high-performance computing capabilities of the Pangea supercomputer developed by the Group.
The goal of the teams in the Frontier Exploration program is to identify geological concepts that will enable the potential of proved basins to be reassessed and new potential basins for oil and gas exploration to be envisaged.
Remote detection, airborne multiphysical acquisition systems for the real-time imaging of steep margins, new-generation algorithms… From the acquisition to the processing of data, the Earth Imaging program innovates along the complete geophysical exploration chain to produce high-added value 3D ultrasound images of the subsoil more quickly and at a reduced cost.
The actions of the Field Reservoir program focus on our understanding of the physico-chemical phenomena in reservoirs, from pores to fields, and on the integration of all the available data. The development of a new generation of reservoir modeling tools, the continual improvement of reservoir simulation tools and the development of low-cost enhanced recovery techniques are the key themes of this program.
The Wells program aims to achieve the dual objectives of maximizing the safety and operational efficiency of wells, thereby increasing their profitability. This program, which provides real-time access to data from well bottoms (during drilling) and from wells (in production), is essential.
The main goals of the Deep Offshore & Next Generation Facilities program consist of further cutting technical costs with completely underwater development solutions, developing breakthrough technologies to economically explore and develop assets at depths of more than 3,000 meters, and designing disruptive operating modes offering higher profitability, without compromising safety.
Finally, the emphasis of the Unconventional program is on fundamental research (multi-scale characterization of source rock and the origins and expulsion of hydrocarbons) and on technical innovations to optimize recovery. These efforts converge to guide exploration towards the most promising geological strata and to provide the technological keys to their profitable and responsible use.
2.6.2.2 Gas, Renewables & Power segment
Today, the R&D activities concentrate on the testing and qualification of solar panels and on photovoltaic electricity management systems.
In 2018, TOTAL’s private laboratory, located on the premises of the Institut Photovoltaïque d’Île-de-France (IPVF) on the Paris-Saclay cluster, was commissioned with a 1,000 m² clean room environment. This leading-edge technological platform covers a large part of the solar value chain, from the manufacture of solar cells and modules, to the qualification and testing of technologies and systems under real-life conditions. Its missions are to support the Group’s subsidiaries and to work on the development of competitive cells and modules, in partnership with the IPVF in particular.
SunPower is pursuing its research, development and innovation efforts to improve the performance of photovoltaic cells and modules, while also cutting costs. Once its feasibility had been demonstrated, the NGT (New Generation Technology) of photovoltaic cells was integrated on a first production line. The module assembly technology has also been transferred.
In addition, 2018 saw the ramp-up of work on smart electricity grids, focusing on two key themes:
-the control and optimization of hybrid sites that combine several energy sources and are used to store energy, and to control electric loads in order to supply energy that is safer, more affordable and cleaner in terms of CO2 emissions;
-the launch of the Energy Management Platform (EMP) project, a transverse center of excellence in the processing, acquisition (IoT) and presentation of data (user experience), and in data science and artificial intelligence. The EMP is cooperating closely with Digital and IT on some ten projects for different Group entities.
Finally, in the realm of electricity storage, Saft Group and its European partners have launched a program for the research, development and industrialization of new generations of solid electrolyte lithium-ion (Li-ion) batteries that are more efficient, cheaper and intrinsically safer than current Li-ion batteries. R&D investments focus on electrochemistry, new materials and improving production processes and battery management systems and software. This program targets every market segment, from electro-mobility (electric cars and buses, the railroads, maritime and aviation sectors) and energy storage, to specialized industries.
2.6.2.3 Refining & Chemicals segment
A) Refining & Chemicals (excluding Hutchinson)
The mission of R&D is to contribute to the technological differentiation of the Refining & Chemicals activities by developing and implementing new and more efficient solutions to create value. It opens the way to the industrialization of knowledge, processes and technologies.
R&D places special emphasis on the three major challenges facing Refining & Chemicals: limiting the environmental footprint; achieving excellence in processes and operations; and developing innovative products, in particular biosourced products.
Research is focused on the integrity, availability and improved energy efficiency of refining and petrochemicals facilities. As a result, advanced modeling of feedstocks and processes is used to optimize processing from the monthly supply of the platforms to the real-time monitoring of the facilities’ constraints. Research conducted on catalysts and their selection is helping to increase performance, improve stability and extend their service life at a lower cost.
In order to contribute to the limitation of the carbon footprint, R&D is looking into new processes, such as in the area of electro-catalysis and biosourced raw materials. It studies the catalytic solutions of the future, paving the way for nanocatalysis.
It designs the technologies that will be used to develop new and more efficient products containing recycled materials (polystyrene in particular), while retaining all the applicative properties of the end product. Additionally, R&D draws on its knowledge of metallocenes and bimodality to develop different types of mass consumption polymers that have exceptional properties allowing them to replace heavier materials and compete with technical polymers.
Finally, Refining & Chemicals’ R&D is developing technologies enabling more efficient use of biosourced molecules. The aim is to produce higher added-value chemical compounds, whether through biotechnologies or thermochemical processes. In this area, the studies focus on the processes to convert plant oils, sugar or lignocellulose in order to produce sustainable bioplastics and biofuels as well as to extend the range of feedstocks that can be used in
existing facilities. R&D is also particularly mindful of issues related to blends and product quality raised by the use of biomolecules.
B) Elastomer processing (Hutchinson)
R&D is an important factor in innovation and differentiation for Hutchinson, which is present along the entire value chain, from designing custom materials (e.g., rubber, thermoplastics, composites) to incorporating connected solutions and objects (e.g., complex solutions, mechatronics, hardware, software, systems, IoT, big data, etc.).
With a corporate research and innovation center, more than 25 technical centers and a number of university partnerships worldwide, Hutchinson is equipped to rise to the challenge of contributing to a safer, more comfortable, and more responsible mobility of the future.
Weight reduction, increased energy efficiency, improved diagnostic and control functionality and greater acoustic and vibratory comfort are common preoccupations across all of Hutchinson’s markets (e.g., automotive, aerospace, defense, railways). Hutchinson designs innovative solutions that put its customers ahead of the game, and transposes those solutions between markets, adopting a cross-fertilization approach.
2.6.2.4 Marketing & Services segment
The Marketing & Services segment’s R&D remains focused, on the one hand, on the optimization of the competitive advantage of products on the consumer and professional markets, and, on the other, on the acquisition of skills in artificial intelligence (digital simulation, molecular modeling, data science) in order to respond to market demands more quickly.
One of R&D’s main missions is the design and development of Premium fuels and lubricants offering customer benefits based on the reduction of the environmental footprint, improved energy efficiency and the greater durability of products and equipment. By way of example, the development of a new detergent for fuels selected by a world-leading partner has entered the first pilot production phase. Likewise, a new additive to improve the performance of cold road diesel is now in industrial production.
The formulation of Fuel Economy lubricants is a short- and medium-priority for all segments (automotive, marine and industry). The R&D teams are pursuing their efforts to incorporate specific new components developed with partners, such as fluid lubricating bases or polymers with a targeted rheological profile. The Fuel Economy program also includes engines for heavy goods vehicles and stationary engines. TOTAL is taking an active part in the multi-partner FALCON (Flexible & Aerodynamic truck for Low CONsumption) project led by Volvo. Regarding marine lubricants, the method developed by the Group to quantify the efficiency of lubricants in neutralizing acid combustion gases has been recognized and rewarded by the ASTM standardization organization.
The R&D teams are working on the design of ranges of lubricants adapted to natural gas, in particular in liquefied form, for long-distance heavy goods vehicles and maritime transport.
The Electric Vehicles Fluids program resulted in the launch of a pioneering range of fluids for electric and hybrid vehicles. These products, which are the fruit of major efforts made by the Group’s R&D teams, were developed specially to meet the cooling and lubrication needs of the different components of these new drive systems, so that they can work under optimal conditions.
In the field of special fluids, the Group’s research center in India has developed an aqueous anti-friction sludge for drilling.
In the realm of road binders, the first industrial and commercial successes have confirmed a new process to prepare chemical bitumen-polymer mixtures with a reduced environmental footprint. The I-Street innovation project led by Eiffage, in a consortium with TOTAL and other partners, won the Ademe’s Route du Futur call for projects. TOTAL is also part of the GLOBE program, which is aiming to create a logistical solution for bitumen granules that stretches from the refinery to the point of use.
The Biolab biocomponents laboratory, inaugurated in 2016 and common to the Marketing & Services and Refining & Chemicals segments, acquired a new skill in biofermentation in the summer of 2018. On the one hand, a process for the synthesis of renewable components has been patented, and, on the other, the first trials of renewable multi-functional lubricants revealed some promising performances.
In 2018, Marketing & Services R&D intensified its open innovation projects and entered new partnerships in France and abroad (such as the partnership with the University of Aachen, Germany). It also received more than 1,000 visitors to present its technological innovations to partners, customers, prospects and stakeholders.
2.7 Property, plant and equipment
The companies of the Group have freehold and leasehold interests in over 130 countries throughout the world. Operations in properties, oil and gas fields or any other industrial, commercial or administrative facility, as well as the production capacities and utilization rates of these facilities, are described in this chapter for each business segment (Exploration & Production, Gas, Renewables & Power, Refining & Chemicals and Marketing & Services).
A summary of the Group’s property, plant and equipment and their main related expenses (depreciation and impairment) is included in Note 7.2 to the Consolidated Financial Statements (point 8.7 of chapter 8).
Minimum royalties from finance lease agreements regarding properties, service stations, vessels and other equipment are presented in Note 13.2 to the Consolidated Financial Statements (point 8.7 of chapter 8).
Information about the objectives of the Company’s environmental policy, in particular those related to the Group’s industrial sites or facilities, is presented in chapter 5.
3
RisKs AND contrOL
3.1 Risk Factors
The Group conducts its activities in an ever-changing environment and is exposed to risks that, if they were to occur, could have a material adverse effect on its business, financial condition, including its operating income and cash flow, reputation or outlook.
The Group employs a continuous process of identifying and analyzing risks in order to determine those that could prevent it from achieving its objectives. This chapter presents the significant risks to which the Group believes it is exposed as of the date of this Registration Document. However, as of such date, the Group may not be aware of, or may be underestimating the potential consequences of, other risks that could, or other risks may not have been considered by the Group as being likely to have a material adverse impact on the Group, its business, financial condition, including its operating income and cash flow, reputation or outlook.
The main internal control and risk management procedures, in particular those relating to the preparation and processing of accounting and financial information, are described in point 3.3 of this chapter.
3.1.1 Risks related to market environment and other financial risks
The financial performance of TOTAL is sensitive to a number of market environment related factors, the most significant being hydrocarbon prices, refining margins and exchange rates.
Generally, a decline in hydrocarbon prices has a negative effect on the Group’s results due to a decrease in revenues from oil and gas production. Conversely, a rise in hydrocarbon prices increases the Group’s results.
In 2018, at first, oil prices increased to reach their highest point in October above $80 per barrel, supported by supply tensions and geopolitics. Prices then decreased to below $60 per barrel by the end of the year, mainly driven by record production in the United States. In December, OPEC and Russia announced a production cut to mitigate the price drop. The oil and natural gas markets remain highly volatile.
For the fiscal year 2019, according to the scenarios retained below, the Group estimates that an increase of $10 per barrel in the average liquids price would increase annual adjusted net operating income (1) by approximately $2.7 billion and annual cash flow from operations by approximately $3.2 billion. Conversely, a decrease of $10 per barrel in the average liquids price would decrease annual adjusted net operating income by approximately $2.7 billion and annual cash flow from operations by approximately $3.2 billion.
The impact of changes in crude oil and gas prices on downstream operations depends upon the speed at which the prices of finished products adjust to reflect these changes. The Group estimates that a decrease in its European Refining Margin Indicator ("ERMI") of $10 per ton would decrease annual adjusted net operating income by approximately $0.5 billion and annual cash flow from operations by approximately $0.6 billion. Conversely, an increase in its ERMI of $10 per ton would increase annual adjusted net operating income by approximately $0.5 billion and annual cash flow from operations by approximately $0.6 billion.
All of the Group’s activities are, for various reasons and to varying degrees, sensitive to fluctuations in the dollar/euro exchange rate. The Group estimates that a decrease of $0.10 per euro (strengthening of the dollar versus the euro) would increase annual adjusted net operating income by approximately $0.1 billion and have a limited impact on annual cash flow from operations. Conversely, an increase of $0.10 per euro (weakening of the dollar versus the euro) would decrease adjusted net operating income by approximately $0.1 billion and have a limited impact on annual cash flow from operations.
Sensitivities 2019 (a) | Scenario retained | Change | Estimated impact on adjusted net operating income | Estimated impact on cash flow from operations |
Dollar | 1.2 $/€ | +/-0.1 $ per € | -/+0.1 B$ | ~ 0 B$ |
Average liquids price | 60 $/b (b) | +/-10 $/b | +/-2.7 B$ | +/-3.2 B$ |
European Refining Margin Indicator (ERMI) | 35 $/t | +/-10 $/t | +/-0.5 B$ | +/-0.6 B$ |
(a) Sensitivities revised once per year upon publication of the previous year’s fourth quarter results. Indicated sensitivities are approximate and based upon TOTAL’s current view of its 2019 portfolio. Results may differ significantly from the estimates implied by the application of these sensitivities. The impact of the $/€ sensitivity on adjusted net operating income is attributable essentially to Refining & Chemicals.
(b) Brent environment at 60 $/b.
In addition to the adverse effect on the Group’s revenues, margins and profitability, a prolonged period of low oil and natural gas prices could lead the Group to review its projects and the evaluation of its assets and oil and natural gas reserves.
Prices for oil and natural gas may fluctuate widely due to many factors over which TOTAL has no control. These factors include:
-variations in global and regional supply of and demand for energy;
-global and regional economic and political developments in natural resource-producing regions, particularly in the Middle East, Africa and South America, as well as in Russia;
-the ability of the OPEC and other producing nations to influence global production levels and prices;
-prices of unconventional energies as well as evolving approaches for developing oil sands and shale oil, which may affect the Group’s realized prices, notably under its long-term gas sales contracts and asset valuations, particularly in North America;
-cost and availability of new technologies;
-regulations and governmental actions;
-global economic and financial market conditions;
(1) Adjusted results are defined as income at replacement cost, excluding special items and the impact of fair value changes.
-the security situation in certain regions, the magnitude of international terrorist threats, wars or other conflicts;
-changes in demographics, notably population growth rates, and consumer preferences; and
-adverse weather conditions that can disrupt supplies or interrupt operations of the Group’s facilities.
Prolonged periods of low oil and natural gas prices may reduce the economic viability of projects in production or in development and reduce the Group’s liquidity, thereby decreasing its ability to finance capital expenditures and/or causing it to cancel or postpone investment projects.
If TOTAL were unable to finance its investment projects, the Group’s opportunities for future revenues and profitability growth would be reduced, which could materially negatively impact the Group’s financial condition, including its operating income and cash flow.
Prolonged periods of low oil and natural gas prices may reduce the Group’s reported reserves and cause the Group to revise the price assumptions upon which asset impairment tests are based, which could have a significant adverse effect on the Group’s results in the period in which it occurs. For additional information on impairments recognized on the Group’s assets, refer to Note 3 to the Consolidated Financial Statements (point 8.7 of chapter 8).
Conversely, in a high oil and gas price environment, the Group can experience significant increases in cost and government take, and, under some production-sharing contracts, the Group’s production rights could be reduced. Higher prices can also reduce demand for the Group’s products.
The Group’s results from its Refining & Chemicals and Marketing & Services segments are primarily dependent upon the supply and demand for petroleum products and the associated margins on sales of these products, with the impact of changes in oil and gas prices on results on these segments being dependent upon the speed at which the prices of petroleum products adjust to reflect movements in oil and gas prices. In 2018, the positive effects of higher oil and gas prices on the Group’s results have been greater than the decrease of the results of the Refining & Chemicals segment. The Group’s refining margins remain highly volatile.
The activities of Trading & Shipping (oil, gas and power trading and shipping activities) are particularly sensitive to market risk and more specifically to price risk as a consequence of the volatility of oil and gas prices, to liquidity risk (inability to buy or sell cargoes at market prices) and to counterparty risk (when a counterparty does not fulfill its contractual obligations). The Group uses various energy derivative instruments and freight-rate instruments to reduce its exposure to price fluctuations of crude oil, petroleum products, natural gas, power and freight-rates. Although TOTAL believes it has established appropriate risk management procedures, large market fluctuations may adversely affect the Group’s activities and financial condition, including its operating income and cash flow.
[REDACTED SECTION: CERTAIN TEXT HAS BEEN REDACTED.]
TOTAL is exposed to other financial risks related to its financing and cash management activities.
The Group is exposed to changes in interest rates and foreign exchange rates. Even though the Group generally seeks to minimize the currency exposure of each entity with regards to its functional currency (primarily the dollar, the euro, the pound sterling and the Norwegian krone), the Group’s financial condition, including its operating income and cash flow, could be impacted by a significant change in the value of these currencies.
In addition, as TOTAL mostly turns to financial markets for its external financing, its financial condition and operations could be materially impacted if access to those markets were to become more difficult.
For further information on financial risks, refer to Notes 15 and 16 to the Consolidated Financial Statements (point 8.7 of chapter 8).
3.1.2 Industrial and environmental risks and risks related to climate issues
TOTAL is exposed to risks related to the safety and security of its operations.
The Group’s activities involve a wide range of operational risks, such as explosions, fires, accidents, equipment failures, leakage of toxic products, emissions or discharges into the air, water or soil, that can potentially cause death or injury, or impact natural resources and ecosystems.
The industrial event that could have the most significant impact is a major industrial accident, e.g., blow out, explosion, fire, leakage of highly toxic products or massive leakage, resulting in death or injury and/or accidental pollution on a large-scale or at an environmentally sensitive site.
Acts of terrorism or malicious acts against employees, plants, sites, pipelines and transportation or computer systems of the Group’s or its contractors could also disrupt the Group’s business activities and could cause harm or damage to people, property and the environment and could have a material adverse effect on the Group’s financial condition.
Certain activities of the Group face additional specific risks. TOTAL’s Exploration & Production activities are exposed to risks related to the physical characteristics of oil and gas fields, particularly during drilling operations, which can cause blow outs, explosions, fires or other damage, in particular to the environment, and lead to a disruption of the Group’s operations or reduce its production. In addition to the risks of explosions and fires, the activities of the Gas, Renewables & Power (1), Refining & Chemicals and Marketing & Services business segments entail risks related to the overall life cycle of the products manufactured, as well as the materials used. With regard to transportation, the likelihood of an operational accident depends not only on the hazardous nature of the products transported, but also on the volumes involved and the sensitivity of the regions through which they are transported (quality of infrastructure, population density, environment).
(1) Integrated Gas, Renewables & Power, as from January 1, 2019 (refer to point 2.2 of chapter 2).
Total’s workforce and the public are exposed to risks inherent to the Group’s operations, which could lead to legal proceedings against the Group’s entities and legal representatives, notably in cases of death, injury and property and environmental damage. Such proceedings could also damage the Group’s reputation. In addition, like most industrial groups, TOTAL is concerned by declarations of occupational illnesses.
To manage the operational risks to which it is exposed, the Group has adopted a preventive and remedial approach by putting in place centralized HSE (health, safety and environment) and security management systems that seek to take all necessary measures to reduce the related risks (refer to points 5.4 and 5.5 of chapter 5). In addition, the Group maintains third-party liability insurance coverage for all its subsidiaries. TOTAL also has insurance to protect against the risk of damage to Group property and/or business interruption at its main refining and petrochemical sites. TOTAL’s insurance and risk management policies are described in point 3.4 of this chapter. However, the Group is not insured against all potential risks. In certain cases, such as a major environmental disaster, TOTAL’s liability may exceed the maximum coverage provided by its third-party liability insurance. The Group cannot guarantee that it will not suffer any uninsured loss and there can be no guarantee, particularly in the event of a major environmental disaster or industrial accident, that such loss would not have a material adverse effect on the Group’s financial condition, including its operating income and cash flow, and its reputation.
Crisis management systems are necessary to effectively respond to emergencies, avoid potential disruptions to the Group’s business and operations and minimize impacts on third parties or the environment.
The Group has crisis management plans in place to deal with emergencies (refer to point 5.5 of chapter 5). However, these plans cannot exclude the risk that the Group’s business and operations may be severely disrupted in a crisis situation or ensure the absence of impacts on third parties or the environment. TOTAL has also implemented business continuity plans to continue or resume operations following a shutdown or incident. An inability for the Group to resume its activities in a timely manner could prolong the impact of any disruption and thus could have a material adverse effect on its financial condition, including its operating income and cash flow.
TOTAL is subject to increasingly stringent environmental, health and safety laws and regulations in numerous countries and may incur material related compliance costs.
The Group’s activities are subject to numerous laws and regulations pertaining to the environment, health and safety. In most countries where the Group operates, particularly in Europe and the United States, sites and products are subject to increasingly stringent laws governing the protection of the environment (water, air, soil, noise, protection of nature, waste management and impact assessments, etc.), health (occupational safety and chemical product risk, etc.) and the safety of personnel and residents. Product quality and consumer protection are also subject to increasingly strict regulations. The Group’s entities ensure that their products meet applicable specifications and abide by all applicable consumer protection laws. Failure to do so could lead to personal injury, property damage, environmental harm and loss of customers, which could negatively impact the Group’s financial condition, including its operating income and cash flow, and its reputation.
TOTAL incurs and will continue to incur substantial expenditures to comply with increasingly complex laws and regulations aimed at protecting health, safety and the environment. Such expenditures could have a material adverse effect on the Group’s financial condition.
The introduction of new laws and regulations could compel the Group to curtail, modify or cease certain operations or implement temporary shutdowns of sites, which could diminish productivity and have a material adverse impact on its financial condition.
Moreover, pursuant to applicable regulations, most of the Group’s activities will require, at site closure, decommissioning followed by environmental remediation after operations are discontinued. Costs related to such activities may materially exceed the Group’s provisions and adversely impact its operating incomes. With regard to the definitive shutdown of activities, the Group’s environmental contingencies and asset retirement obligations are addressed in the "Asset retirement obligations" and "Provisions for environmental contingencies" sections of the Group’s consolidated balance sheet (refer to Note 12 to the Consolidated Financial Statements, point 8.7 of chapter 8). Future expenditures related to asset retirement obligations are accounted for in accordance with the accounting principles described in the same Note.
Laws and regulations related to climate change as well as growing concern of stakeholders may adversely affect the Group’s business and financial condition.
Firstly, there is a risk incurred by rapidly changing modes of energy production in favor of a lower-carbon energy mix that allows for a more limited share of fossil fuel. This could impact the Group’s business model, profitability, financial situation and shareholder value.
The growing concern of certain stakeholders with regards to climate change could also have an impact on certain external financing of the Group’s projects or influence certain investors involved in the oil and gas sector.
Moreover, regulations may change and require the Group to reduce, change or cease certain operations, and subject it to additional obligations with regards to the compliance of its facilities. This could have a negative effect on its activities and its financial situation, including operating income and cash flow. Regulations designed to gradually limit fossil fuel use may, depending on the GHG emission limits and time horizons set, negatively and significantly affect the development of projects, as well as the economic value of certain of the Group’s assets. In Europe, for example, the Group’s industrial facilities are part of the CO2 emissions quotas market (EU-ETS), and the financial risk incurred by purchasing these quotas on the market could increase due to the reform of the system that was approved in 2018. This emission quotas market is in its third phase. The Group estimates that about 25% of emissions subjected to EU-ETS are not covered by free quotas in the period 2013-2020 (phase 3) and to 30% or more from 2021 to 2030 (phase 4). At the end of 2018, the price of these quotas was about €20/t, and the Group expects this price to be higher than €30/t in phase 4.
Internal studies conducted by TOTAL have shown that a long-term CO2 price of $40/t (1) applied worldwide would have a negative impact of around 5% on the discounted present value of the Group’s assets (upstream and downstream). [REDACTED SECTION: CERTAIN TEXT HAS BEEN REDACTED.]
(1) As from 2021 or the current price in a given country.
Finally, the Company and several of its subsidiaries have received claims issued by public entities in certain countries in view of financing the protective measures to be implemented in order to limit the consequences of climate change. The Group is subject to the risk of judicial actions in this area.
The physical effects of climate change may adversely affect the Group’s business.
TOTAL’s businesses operate in various regions, where the potential physical impacts of climate change, including changes in weather patterns, are highly uncertain and may adversely impact the Group’s operating income.
Climate change potentially has multiple effects that could harm the Group’s operations. The increasing scarcity of water resources may negatively affect the Group’s operations in some regions of the world, high sea levels may harm certain coastal activities, and the multiplication of extreme weather events may damage offshore and onshore facilities. These climate risk factors are continually assessed in the risk management and prevention plans.
The Group believes that it is impossible to guarantee that the contingencies or liabilities related to the matters mentioned in this point 3.1.2 would not have a material adverse impact on its business, financial condition, including its operating income and cash flow, reputation, prospects or shareholder value, if such risks were to occur.
3.1.3 Risks related to critical IT systems security
Disruption to or breaches of TOTAL’s critical IT services or information security systems could adversely affect the Group’s activities.
The Group’s activities depend heavily on the reliability and security of its information technology (IT) systems. The Group’s IT systems, some of which are managed by third parties, are susceptible to being compromised, damaged, disrupted or shutdown due to failures during the process of upgrading or replacing software, databases or components, power or network outages, hardware failures, cyber-attacks (viruses, computer intrusions), user errors or natural disasters. The cyber threat is constantly evolving. Attacks are becoming more sophisticated with regularly renewed techniques while the digital transformation amplifies exposure to these cyber threats. The adoption of new technologies, such as the Internet of things (IoT) or the migration to the cloud, as well as the evolution of architectures for increasingly interconnected systems, are all areas where cyber security is a very important issue. The Group and its service providers may not be able to prevent third parties from breaking into the Group’s IT systems, disrupting business operations or communications infrastructure through denial-of-service attacks, or gaining access to confidential or sensitive information held in the system. The Group, like many companies, has been and expects to continue to be the target of attempted cybersecurity attacks. While the Group has not experienced any such attack that has had a material impact on its business, the Group cannot guarantee that its security measures will be sufficient to prevent a material disruption, breach or compromise in the future.
As a result, the Group’s activities and assets could sustain serious damage, services to clients could be interrupted, material intellectual property could be divulged and, in some cases, personal injury, property damage, environmental harm and regulatory violations could occur, potentially having a material adverse effect on the Group’s financial condition, including its operating income and cash flow.
3.1.4 Risks related to the development of major projects and reserves
The Group’s production growth and profitability depend on the delivery of its major development projects.
Growth of production and profitability of the Group rely heavily on the successful execution of its major development projects that are increasingly complex and capital-intensive. These major projects may face a number of difficulties, including, in particular, those related to:
-economic or political risks, including threats specific to a certain country or region, such as terrorism, social unrest or other conflicts (refer to point 3.1.6 of this chapter);
-negotiations with partners, governments, local communities, suppliers, customers and other third parties;
-obtaining project financing;
-controlling capital and operating costs;
-earning an adequate return in a low oil and/or gas price environment;
-respecting project schedules; and
-the timely issuance or renewal of permits and licenses by public agencies.
Poor delivery of any major project that underpins production or production growth could adversely affect the Group’s financial condition, including its operating income and cash flow.
The Group’s long-term profitability depends on cost-effective discovery, acquisition and development of economically viable new reserves; if the Group is unsuccessful, its financial condition, including its operating income and cash flow, could be materially affected.
A large portion of the Group’s revenues and operating results are derived from the sale of oil and gas that the Group extracts from underground reserves developed as part of its Exploration & Production activities. The development of oil and gas fields, the construction of facilities and the drilling of production or injection wells is capital intensive and requires advanced technology. Due to constantly changing market conditions and environmental challenges, cost projections can be uncertain. For Exploration & Production activities to continue to be profitable, the Group needs to replace its reserves with new proved reserves (likely to be developed and produced in an economically viable manner).
In addition, a number of factors may undermine TOTAL’s ability to discover, acquire and develop new reserves, which are inherently uncertain, including:
-the geological nature of oil and gas fields, notably unexpected drilling conditions, including pressure or unexpected heterogeneities in geological formations;
-the risk of dry holes or failure to find expected commercial quantities of hydrocarbons;
-equipment failures, fires, blow-outs or accidents;
-shortages or delays in the availability or delivery of appropriate equipment;
-the Group’s inability to develop or implement new technologies that enable access to previously inaccessible fields;
-the Group’s inability to anticipate market changes in a timely manner;
-adverse weather conditions;
-the inability of the Group’s partners to execute or finance projects in which the Group holds an interest or to meet their contractual obligations;
-the inability of service companies to deliver contracted services on time and on budget;
-compliance with both anticipated and unanticipated governmental requirements, including U.S. and EU regulations that may give a competitive advantage to companies not subject to such regulations;
-economic or political risks, including threats specific to a certain country or region, such as terrorism, social unrest or other conflicts (refer to point 3.1.6 of this chapter);
-competition from oil and gas companies for the acquisition and development of assets and licenses (refer to point 3.1.7 of this chapter);
-increased taxes and royalties, including retroactive claims and changes in regulations and tax reassessments; and
-disputes related to property titles.
These factors could lead to cost overruns and/or could impair the Group’s ability to complete a development project or make production economical. Some of these factors may also affect the Group’s projects and facilities further down the oil and gas chain.
If TOTAL fails to develop new reserves cost-effectively and in sufficient quantities, the Group’s financial condition, including its operating income and cash flow, could be materially affected.
The Group’s oil and gas reserves data are estimates only and subsequent upward or downward adjustments are possible. If actual production from such reserves proves to be lower than current estimates indicate, the Group’s financial condition, including its operating income and cash flow, could be impacted.
The Group’s proved reserves figures are estimates prepared in accordance with SEC rules. Proved reserves are those reserves which, by analysis of geoscience and engineering data, can be estimated with reasonable certainty to be economically recoverable - from a given date forward, from known reservoirs and under existing economic conditions, operating methods and government regulations - prior to the time at which contracts providing the right to operate expire, unless evidence indicates that renewal is reasonably certain, regardless of whether deterministic or probabilistic methods are used for the estimation. Reserves are estimated by teams of qualified, experienced and trained geoscientists and petroleum, gas and project engineers, who rigorously review and analyze in detail all available geoscience and engineering data (for example, seismic data, electrical logs, cores, fluids, pressures, flow rates and facilities parameters). This process involves making subjective judgments, including with respect to the estimate of hydrocarbons initially in place, initial production rates and recovery efficiency, based on available geological, technical and economic data. Consequently, estimates of reserves are not exact measurements and are subject to revision.
A variety of factors that are beyond the Group’s control could cause such estimates to be adjusted downward in the future, or cause the Group’s actual production to be lower than its currently reported proved reserves indicate. Such factors include:
-a prolonged period of low prices of oil or gas, making reserves no longer economically viable to exploit and therefore not classifiable as proved;
-an increase in the price of oil or gas, which may reduce the reserves to which the Group is entitled under production sharing and risked service contracts and other contractual terms;
-changes in tax rules and other regulations that make reserves no longer economically viable to exploit, or disputes related to property titles; and
-the actual production performance of the Group’s deposits.
The Group’s reserves estimates may therefore require substantial downward revisions should its subjective judgments prove not to have been conservative enough based on the available geoscience and engineering data, or the Group’s assumptions regarding factors or variables that are beyond its control prove to be incorrect over time. Any downward adjustment could indicate lower future production amounts, which could adversely affect the Group’s financial condition, including its operating income and cash flow.
3.1.5 Risks related to equity affiliates and management of assets operated by third parties
Many of the Group’s projects are conducted by equity affiliates or are operated by third parties. For these projects, the Group’s degree of control, as well as its ability to identify and manage risks, may be reduced.
A significant number of the Group’s projects are conducted by equity affiliates (1) or operated by third parties. In cases where the Group’s company is not the operator, such company may have limited influence over, and control of, the behavior, performance and costs of the partnership, its ability to manage risks may be limited and it may, nevertheless, be prosecuted by regulators or claimants in the event of an incident.
Additionally, the partners of the Group may not be able to meet their financial or other obligations to the projects, which may threaten the viability of a given project. These partners may also not have the financial capacity to fully indemnify the Group or third parties in the event of an incident.
With respect to joint-ventures, contractual terms generally provide that the operator, whether an entity of the Group or a third party, assumes full liability for damages caused by its gross negligence or willful misconduct.
(1) For additional information, refer to Note 8 to the Consolidated Financial Statements (point 8.7 of chapter 8).
In the absence of the operator’s gross negligence or willful misconduct, other liabilities are generally borne by the joint-venture and the cost thereof is assumed by the partners of the joint-venture in proportion to their respective ownership interests.
With respect to third-party providers of goods and services, the amount and nature of the liability assumed by the third party depends on the context and may be limited by contract. Contracts may also contain obligations to indemnify TOTAL or for TOTAL to indemnify partners or third parties.
3.1.6 Risks related to political or economic factors
TOTAL has significant production and reserves located in politically, economically and socially unstable areas, where the risk that the Group’s operations may be materially affected is relatively high.
A significant portion of TOTAL’s oil and gas production and reserves is located in countries that are not part of the Organisation for Economic Co-operation and Development (OECD). In recent years, a number of these countries have experienced varying degrees of one or more of the following: economic or political instability, civil war, violent conflict, social unrest, actions of terrorist groups and the application of international economic sanctions. Any of these conditions alone or in combination could disrupt the Group’s operations in any of these regions, causing substantial declines in production or revisions to reserves estimates.
In Africa (excluding North Africa), which represented 24% of the Group’s 2018 combined liquids and gas production, certain of the countries in which the Group has production have recently suffered from some of these conditions, including Nigeria, which is one of the main contributing countries to the Group’s production of hydrocarbons (refer to point 2.1.9 of chapter 2).
The Middle East and North Africa zone, which represented 24% of the Group’s 2018 combined liquids and gas production, has in recent years suffered increased political instability in connection with violent conflict and social unrest, particularly in Libya and Syria, where the European Union (EU) and the U.S. have enacted economic sanctions prohibiting TOTAL from producing oil and gas since 2011. In Yemen, the deterioration of security conditions in the vicinity of the Balhaf site caused the company Yemen LNG, in which the Group holds a stake of 39.62%, to stop its commercial production and export of LNG and to declare force majeure to its various stakeholders in 2015. The plant has been put in preservation mode. In Iran, TOTAL signed in July 2017 a 20-year contract with the National Iranian Oil Company (NIOC) relating to the development and production of phase 11 (SP11) of the giant South Pars gas field. Following the withdrawal of the United States from the Joint Comprehensive Plan of Action on May 8, 2018, TOTAL withdrew from this project and finalized its withdrawal on October 29, 2018, prior to the re-imposition of US secondary sanctions on the oil industry as of November 5, 2018. TOTAL was the operator and had a 50.1% interest alongside the Chinese state-owned company CNPC (30%) and Petropars (19.9%); a wholly-owned subsidiary of NIOC. TOTAL ceased all operational activity in Iran before November 4, 2018.
In South America, which represented 6% of the Group’s 2018 combined liquids and gas production, certain of the countries in which TOTAL has production have recently suffered from political or economic instability, including Argentina, Brazil and Venezuela.
Since July 2014, international economic sanctions have been adopted against certain Russian individuals and entities, including various entities operating in the financial, energy and defense sectors. As of December 31, 2018, TOTAL held 21% of its proved reserves in Russia, from which the Group had 14% of its combined oil and gas production in 2018.
For additional information concerning international economic sanctions applicable notably to Cuba, Iran, Russia, Syria and Venezuela, refer to point 3.1.9.1 of this chapter.
Furthermore, in addition to current production, TOTAL is also exploring for and developing, or is participating in the exploration and/or development of, new reserves in other regions of the world that are historically characterized by political, social or economic instability.
The occurrence and magnitude of incidents related to economic, social or political instability are unpredictable. It is possible that they could have a material adverse impact on the Group’s production and operations in the future and/or cause certain investors to reduce their holdings of TOTAL’s securities.
TOTAL, like other major international energy companies, has a geographically diverse portfolio of reserves and operational sites, which allows it to conduct its business and financial affairs so as to reduce its exposure to political and economic risks. However, there can be no assurance that such events will not have negative consequences on the Group.
Intervention by host country authorities can adversely affect the Group’s activities and its operating incomes.
TOTAL has significant exploration and production activities, and in some cases refining, marketing or chemicals operations, in countries whose governmental and regulatory framework is subject to unexpected change and where the enforcement of contractual rights is uncertain. The legal framework of TOTAL’s exploration and production activities, established through concessions, licenses, permits and contracts granted by or entered into with a government entity, a state-owned company or private owners, is subject to risks of renegotiation that, in certain cases, can reduce or challenge the protections offered by the initial legal framework and/or the economic benefit to TOTAL.
In addition, the Group’s exploration and production activities in such countries are often undertaken in conjunction with state-owned entities, for example as part of a joint-venture in which the state has a significant degree of control. In recent years, in various regions globally, TOTAL has observed governments and state-owned enterprises impose more stringent conditions on companies pursuing exploration and production activities in their respective countries, increasing the costs and uncertainties of the Group’s business operations. TOTAL expects this trend to continue.
Potential increasing intervention by governments in such countries can take a wide variety of forms, including:
-the award or denial of exploration and production interests;
-the imposition of specific drilling obligations;
-price and/or production quota controls and export limits;
-nationalization or expropriation of assets;
-unilateral cancellation or modification of license or contract rights;
-increases in taxes and royalties, including retroactive claims and changes in regulations and tax reassessments;
-the renegotiation of contracts;
-the imposition of increased local content requirements;
-payment delays; and
-currency exchange restrictions or currency devaluation.
If a host government were to intervene in one of these forms in a country where TOTAL has substantial operations, including exploration, the Group could incur material costs or the Group’s production or asset value could decrease, which could potentially have a material adverse effect on its financial condition, including its operating income and cash flow.
For example, the Nigerian government has been contemplating new legislation to govern the petroleum industry which, if passed into law, could have an impact on the existing and future activities of the Group in that country through increased taxes and/or operating costs and could affect financial returns from projects in that country.
3.1.7 Risks related to competition and lack of innovation
The Group operates in a highly competitive environment. Its competitiveness could be adversely impacted if the Group’s level of innovation lagged behind its competitors.
TOTAL’s main competitors are comprised of national (companies directly or indirectly controlled by a state) and international oil companies. The evolution of the energy sector has opened the door to new competitors and increased market price volatility.
TOTAL is subject to competition in the acquisition of assets and licenses for the exploration and production of oil and natural gas as well as for the sale of manufactured products based on crude and refined oil. In the gas sector, major producers increasingly compete in the downstream value chain with established distribution companies. Increased competitive pressure could have a significant negative effect on the prices, margins and market shares of the Group’s companies.
The pursuit of unconventional gas development, particularly in the United States, has contributed to falling hydrocarbon market prices and a marked difference between spot and long-term contract prices. The competitiveness of long-term contracts indexed to oil prices could be affected if this discrepancy persists and if it should prove difficult to invoke price revision clauses.
The Group’s activities are carried out in a constantly changing environment with new products and technologies continuously emerging. The Group may not be able to anticipate these changes, identify and integrate technological developments in order to maintain its competitiveness, maintain a high level of performance and operational excellence, and best meet the needs and demands of its customers. The Group’s innovation policy requires significant investment, notably in R&D, of which the expected impact cannot be guaranteed.
In the field of R&D, the multiplication of research partnerships, in particular in related technical fields, may make it difficult for the Group to track technical information exchanged with research partners and monitor related contractual restrictions (e.g., confidentiality, limited use). New and increasingly complex digital technologies as well as the multiplication of partnerships are all likely to increase contamination risks, which could, as a result, limit TOTAL’s ability to exploit innovations.
3.1.8 Ethical misconduct and non-compliance risks
Ethical misconduct or non-compliance of the Group or its employees with applicable laws could expose TOTAL to criminal and civil penalties and be damaging to TOTAL’s reputation and shareholder value.
The Group’s Code of Conduct, which applies to all of its employees, defines TOTAL’s commitment to ethical standards, business integrity, human rights and compliance with applicable legal requirements. TOTAL maintains a "zero tolerance" principle for fraud of any kind, particularly bribery, corruption and influence peddling. Non-compliance with laws and regulations as well as ethical or human rights misconduct by TOTAL, its employees or a third-party acting on its behalf could expose TOTAL and/or its employees to investigations, criminal and civil sanctions and to additional penalties (such as debarment from public procurement). Further measures could, depending on applicable legislation (notably, the U.S. Foreign Corrupt Practices Act, the UK Bribery Act, the French law n° 2016-1691 dated December 9, 2016 relating to transparency, the fight against corruption and modernization of the economy or the Regulation (EU) 2016/679 with regard to the protection of personal data), be imposed by competent authorities, such as the review and reinforcement of the compliance program under the supervision of an independent third party. Any of the above could be damaging to the financial condition, shareholder value or reputation of the Group.
Generally, entities of the Group could potentially be subject to administrative, judicial or arbitration proceedings that could have a material adverse impact on the Group’s financial condition and reputation (refer to point 3.2 of this chapter).
3.1.9 Countries targeted by economic sanctions
TOTAL has activities in certain countries targeted by economic sanctions. If the Group’s activities are not conducted in accordance with applicable laws and regulations, TOTAL could face penalties.
Economic sanctions or other restrictive measures could target countries, such as Cuba, Iran, and Syria and/or target actors or economic sectors, such as in Russia or in Venezuela.
U.S. and European restrictions relevant to the Group and certain disclosure concerning the Group’s limited activities or presence in certain targeted countries are outlined in points 3.1.9.1 and 3.1.9.2, respectively.
3.1.9.1 U.S. and European legal restrictions
TOTAL closely monitors applicable international economic sanctions regimes, including those adopted by the United States and the European Union ("EU") (collectively, "Sanctions Regimes"), changes to such regimes and possible impacts on the Group’s activities. TOTAL takes steps to ensure compliance with applicable Sanctions Regimes and believes that its current activities in targeted countries do not infringe the applicable Sanctions Regimes. However, the Group cannot assure that current or future regulations related to Sanctions Regimes will not have a negative impact on its business, financial condition or reputation. A violation by the Group of applicable Sanctions Regimes could result in criminal, civil and/or material financial penalties.
A) Restrictions against Cuba
U.S. sanctions against Cuba prohibit any person subject to the jurisdiction of the United States (1) from engaging, directly or indirectly, in any activities or dealings related to Cuba, without government authorization. Therefore, the use of the U.S. dollar is prohibited for almost all transactions related to Cuba. Furthermore, it is prohibited to export and reexport to Cuba all goods subject to the Export Administration Regulations (2) without a license and with exceptions (for example, certain medical equipment), as well as to import all goods of Cuban origin into the United States. Cuba is not subject to European economic sanctions.
TOTAL has had an interest in a liquefied petroleum gas (LPG) cylinder filing plant in Cuba since 1997 and continues the development of its activities regarding lubricants, fluids and greases in Cuba.
B) Restrictions against Iran
Several countries and international organizations, including the United States and the EU, maintain Sanctions Regimes of varying degrees targeting Iran.
On July 14, 2015, the EU, China, France, Russia, the United Kingdom, the United States and Germany reached an agreement with Iran, known as the Joint Comprehensive Plan of Action (the "JCPOA"), regarding limits on Iran’s nuclear activities and relief under certain U.S., EU and UN economic sanctions regarding Iran. On January 16, 2016, the International Atomic Energy Agency ("IAEA") confirmed that Iran had met its initial nuclear compliance commitments under the JCPOA. Therefore, as from that date, UN economic sanctions, most U.S. secondary sanctions (i.e., those covering non-U.S. persons (3) and for activities outside U.S. jurisdiction) and most EU economic sanctions were suspended (4).
Following the withdrawal of the United States from the JCPOA in May 2018, U.S. secondary sanctions concerning the oil industry were re-imposed as of November 5, 2018.
In July 2017, TOTAL signed a contract for a period of 20 years with the National Iranian Oil Company ("NIOC") relating to the development and production of phase 11 (SP11) (5) of the giant South Pars gas field. Following the withdrawal of the United States from the JCPOA, TOTAL withdrew from this project and finalized its withdrawal on October 29, 2018, prior to the re-imposition of U.S. secondary sanctions on the oil industry as of November 5, 2018. TOTAL ceased all operational activity in Iran before November 4, 2018.
Furthermore, certain U.S. states have adopted regulations with respect to Iran requiring, in certain conditions, state pension funds and other state-owned institutional investors to divest securities in any company that has or had business operations in Iran and state public contracts not to be awarded to such companies. Certain U.S. state regulators have adopted similar initiatives relating to investments by insurance companies. TOTAL believes the impact of these regulations to be limited due to the Group’s decision to withdraw from Iran. Nevertheless, TOTAL continues to closely monitor these measures, which are generally still in effect following the withdrawal of the United States from the JCPOA.
With respect to the Group’s activities conducted under the sanctions framework that was in place prior to the entry into force of the JCPOA, the U.S. Department of State made a determination on September 30, 2010 that certain historical activities would not be deemed sanctionable and that, so long as TOTAL acted in accordance with its commitments related to this determination, it would not be regarded as a company of concern for its past Iran-related activities. TOTAL’s historical activities in Iran have been conducted in compliance with these Sanctions Regimes. Since 2011, TOTAL has had no production in Iran.
Refer to point 3.1.9.2 below for information concerning Section 13(r) of the Securities Exchange Act of 1934, as amended, pertaining to activities of the Group related to Iran.
C) Restrictions against Russia
Since July 2014, various Sanctions Regimes have been adopted against Russia, including prohibitions to deal with certain Russian individuals and entities or restrictions on financings, as well as restrictions on investments and exports to Russia.
The economic sanctions adopted by the EU since 2014 do not materially affect TOTAL’s activities in Russia. TOTAL has been formally authorized by the French government, which is the competent authority for granting authorization under the EU sanctions regime, to continue all its activities in Russia on the Kharyaga and Termokarstovoye fields and the Yamal LNG and the Arctic 2 LNG projects.
The United States adopted various economic sanctions, some of which target PAO Novatek (6) ("Novatek"), and the entities in which Novatek (individually or with other similarly targeted persons or entities) owns an interest of at least 50%, including OAO Yamal LNG (7) ("Yamal LNG"),Terneftegas (8) and OOO Arctic 2 LNG (9). These sanctions prohibit, in particular, U.S. persons from all transactions in, providing financing for, and other dealings in debt issued by these entities after July 16, 2014 of longer than 90 days maturity (reduced to 60 days as from the end of November 2017). The use of the U.S. dollar is therefore prohibited for these types of financings, including Yamal LNG. The Yamal LNG project’s financing was finalized in successive steps in 2016 in compliance with applicable regulations. The financing of the Arctic LNG 2 project is under discussion.
In addition, the U.S. Department of Commerce has imposed restrictions on exports and reexports of certain goods to Russia under the regulation related to the U.S. export control with respect to certain oil projects, which do not materially impact TOTAL’s current activities in Russia.
In August 2017, the United States adopted the Countering America’s Adversaries Through Sanctions Act ("CAATSA"). This law provides for, in particular, the possibility to impose secondary sanctions against a non-U.S. person who (i) invests in certain types of crude oil projects; (ii) carries out a significant transaction with a sanctioned Russian individual or entity; (iii) carries out a significant transaction with an individual/entity party to or acting on behalf of Russian economic intelligence or defense sectors; (iv) carries out a direct and significant investment (beyond certain amounts), which contributes to the development of Russian export pipelines or (v) sells, leases or provides goods, services, technologies or information that could directly and in a significant manner facilitate the maintenance or expansion of the construction, modernization or repair of energy export pipelines by Russia. This law also, on the one hand, reduced the maturity periods of debts restricting the financing of certain entities and, on the other hand, extended, as from January 29, 2018, the prohibition applicable to certain entities to export goods and services outside of Russia in support of exploration or production projects of oil in deep water, beyond the Arctic offshore, or concerning shale formations (shale oil).
On April 6, 2018, the American Department of Treasury’s Office of Foreign Assets Control (OFAC) for the first time designated and registered certain Russian oligarchs and political figures, as well as several entities owned by them, on the list of Specially Designated Nationals and Blocked Persons List. Non-U.S. persons may now be sanctioned under secondary sanctions for having carried out significant transactions with the designated persons.
TOTAL continues its activities in Russia in compliance with applicable sanctions regimes.
(1) Cuban Assets Control Regulations (CACR), 31 CFR Part. 515.
(2) Export Administration Regulations (EAR) § 734.3.
(3) "U.S. person" means any U.S. citizen and permanent resident alien wherever he/she is in the world, entity organized under the laws of the United States or any jurisdiction within the United States, including foreign branches, or any person or entity located in the United States.
(4) Certain U.S. and EU human rights-related and terrorism-related sanctions remain in force.
(5) TOTAL was an operator of the SP11 project and held 50.1% alongside the national Chinese company China National Petroleum Corporation ("CNPC") (30%) and Petropars (19.9%), a 100% owned subsidiary of NIOC.
(6) A Russian company listed on the Moscow and London stock exchanges and in which the Group held an interest of 19.4% as of December 31, 2018.
(7) A company jointly owned by PAO Novatek, Total E&P Yamal (20.02%), China National Oil and Gas Exploration Development Corporation - CNODC, a subsidiary of CNPC and Silk Road Fund.
(8) A company jointly owned by PAO Novatek and Total Termokarstovoye BV (49%).
(9) A company wholly-owned owned by PAO Novatek as of December 31, 2018.
As of December 31, 2018, TOTAL held 21% of its proved reserves in Russia, where the Group had 14% of its combined oil and gas production in 2018.
D) Restrictions against Syria
The EU adopted measures in 2011 regarding trade with and investment in Syria that are applicable to European persons and to entities constituted under the laws of an EU Member State, including, notably, a prohibition on the purchase, import or transportation from Syria of crude oil and petroleum products. The United States also has adopted comprehensive measures that broadly prohibit trade and investment in and with Syria. Since 2011, the Group ceased its activities that contributed to oil and gas production in Syria and has not purchased hydrocarbons from Syria since that time (refer to point 3.1.9.2).
E) Restrictions against Venezuela
Since 2014, different Sanctions Regimes were adopted relating to Venezuela, including prohibitions to deal with certain Venezuelan individuals and entities, as well as restrictions on financings.
In August 2017, the United States adopted economic sanctions relating to the Government of Venezuela as well as certain state-owned or controlled entities (collectively, the "Government of Venezuela"), including Petroleos de Venezuela, S.A. ("PdVSA") as well as entities in which PdVSA (individually or with other similarly targeted persons or entities collectively) owns an interest of at least 50% (which includes Petrocedeño S.A., a company in which the Group held an interest of 30.32% as of December 31, 2018). These sanctions prohibit all U.S. persons (1) from transacting in, providing financing for or otherwise dealing in debt issued by PdVSA as from August 25, 2017 of longer than 90 days maturity. The use of the U.S. dollar is therefore prohibited for these types of financings, including with Petrocedeño S.A.
Since November 13, 2017, Venezuela has also been subject to European sanctions, which mainly provide for the freezing of assets of certain individuals and entities, a military embargo as well as restrictions on the exportation of certain goods.
In May 2018, the United States adopted a new round of sanctions against the Government of Venezuela, prohibiting all U.S. persons from transacting in (i) the purchase of debts owed to the Government of Venezuelan and (ii) the sale, transfer, assignment, or pledging as collateral by the Government of Venezuelan of any equity interest in any entity in which the Government of Venezuela has a 50% or greater ownership interest.
On January 28, 2019, pursuant to Executive Order 13850, American Department of Treasury’s Office of Foreign Assets Control (OFAC) designated and registered PdVSA on the list of Specially Designated Nationals and Blocked Persons List, as well as any entities in which PdVSA owns an interest of at least 50%, including Petrocedeño S.A.
To date, TOTAL has organised the management of its interest to ensure compliance with applicable sanctions.
3.1.9.2 Information concerning certain limited activities in Iran and Syria
Information concerning TOTAL’s activities related to Iran that took place in 2018 provided in this section is disclosed according to Section 13(r) of the Securities Exchange Act of 1934, as amended ("U.S. Exchange Act").
In addition, information for 2018 is provided concerning the payments made by Group affiliates to, or additional cash flow that operations of Group affiliates generate for, the government of any country identified by the United States as a state sponsor of terrorism (currently, Iran, North Korea, Syria and Sudan) (2) or any entity controlled by those governments.
TOTAL believes that these activities are not sanctionable, including for activities previously disclosed. For more information on certain U.S. and EU restrictions relevant to TOTAL in these jurisdictions, refer to point 3.1.9.1 of this chapter.
A) Iran
The Group’s operational activities related to Iran were stopped in 2018 following the withdrawal of the United States from the JCPOA in May 2018 and prior to the re-imposition of U.S. secondary sanctions on the oil industry as of November 5, 2018.
Statements in this section concerning affiliates intending or expecting to continue activities described below are subject to such activities continuing to be permissible under applicable international economic sanctions regimes.
a) Exploration & Production
Following the suspension of certain international economic sanctions against Iran on January 16, 2016, the Group commenced various business development activities in Iran. Total E&P South Pars S.A.S. ("TEPSP") (a wholly-owned affiliate), CNPC International Ltd. ("CNPCI") (a wholly-owned affiliate of China National Petroleum Company) and Petropars Ltd. ("Petropars") (a wholly-owned affiliate of NIOC) signed a 20-year risked service contract in July 2017, (the "Risked Service Contract") for the development and production of phase 11 of the South Pars gas field ("SP11").TEPSP (50.1%) was the operator and a partner of the project alongside CNPCI (30%) and Petropars (19.9%). These companies entered into a joint operating agreement in July 2017 (the "JOA") concerning, among other things, the governance of their obligations under the Risked Service Contract and the designation of TEPSP as the project’s operator.
In 2018, TEPSP continued conducting petroleum operations on behalf of the above-mentioned consortium in accordance with the terms and conditions of the Risked Service Contract and the JOA. In particular, TEPSP: (i) held several meetings with the Iranian authorities, NIOC and other Iranian state owned/controlled entities; (ii) launched tenders for award of service contracts for the purposes of the SP11 project; (iii) negotiated various agreements (such as service and/or supply agreements and bank service agreements); and (iv) performed other activities under the Risked Service Contract and the JOA.
In 2018, TEPSP completed the technical studies, which were started in November 2016, in accordance with the technical services agreement (the "TSA") between NIOC and TEPSP, acting on behalf of the consortium.
(1) "U.S. person" means any U.S. citizen and permanent resident alien wherever he/she is in the world, entity organized under the laws of the United States or any jurisdiction within the United States, including foreign branches, or any person or entity located in the United States.
(2) In North Korea, other than fees related to trademarks and designs paid in 2018, TOTAL is not present. In this country. In Sudan, other than the payment of fees related to trademarks, the Group is not aware of any of its activities in 2018 having resulted in payments to, or additional cash flow for, the government of that country.
However, as a result of the withdrawal of the U.S. from the JCPOA in May 2018, TOTAL ceased all of its activities related to the SP11 project and finalized its withdrawal from the SP11 project on October 29, 2018, at which time it transferred its participating interest and operatorship of the project to CNPCI.
The MOU entered into between TOTAL and NIOC in January 2016 to assess potential developments in Iran (including South Azadegan) was amended to include North Azadegan and to extend its duration. NIOC provided TOTAL in 2017 with technical data on the Azadegan oil field so that it could assess potential development of this field. Representatives of TOTAL held technical meetings in 2017 with representatives of NIOC and its affiliated companies and carried out a technical review of the Azadegan (South & North) oil field as well as the Iran LNG Project (a project contemplating a 10 Mt/y LNG production facility at Tombak Port on Iran’s Persian Gulf coast), the results of which were partially disclosed to NIOC and relevant affiliated companies. In addition, TOTAL signed an MOU in 2017 with an international company to evaluate jointly the Azadegan oil field opportunity with NIOC. This international company decided in February 2018 to withdraw from this technical cooperation and a MOU termination agreement was formally executed with TOTAL on May 16, 2018. Technical studies were pursued by TOTAL until March 2018 on the Azadegan area with regular contacts with NIOC. All work and contacts with NIOC on this subject ceased at the end of March 2018.
During 2018, in connection with the activities under the aforementioned Risked Service Contract and MOUs, and to discuss other new opportunities, representatives of TOTAL attended meetings with the Iranian oil and gas ministry and several Iranian companies with ties to the government of Iran. In connection with travel to Iran in 2018 by certain employees of the Group, TOTAL made payments to Iranian authorities for visas, airport services, exit fees and similar travel-related charges. In addition, representatives of TOTAL had meetings in France with the Iranian ambassador.
Neither revenues nor profits were recognized from any of the aforementioned activities under the aforementioned Risked Service Contract and MOUs in 2018.
Maersk Oil studied two potential projects with NIOC, prior to the acquisition of Maersk Oil by TOTAL in March 2018. These studies ceased after a meeting with NIOC representatives in May 2018.
The Tehran branch office of TEPSP, opened in 2017 for the purposes of the SP11 project, ceased all operational activities prior to November 1, 2018 and will be closed and de-registered in 2019. Since November 2018, Total Iran BV maintains a local representative office in Tehran with a few employees, solely for non-operational functions. Concerning payments to Iranian entities in 2018, Total Iran BV and Elf Petroleum Iran collectively made payments of approximately IRR 31.7 billion (approximately $300,000 (1)) to the Iranian administration for taxes and social security contributions concerning the personnel of the aforementioned representative office and residual obligations related to various prior risked service contracts. In 2019, similar types of payments are to be made in connection with maintaining the representative office in Tehran, albeit in lower amounts. None of these payments has been or is expected to be executed in U.S. dollars.
Furthermore, Total E&P UK Limited ("TEP UK"), a wholly-owned affiliate, holds a 1% interest in a joint venture for the Bruce field in the United Kingdom with Serica Energy (UK) Limited ("Serica") (98%, operator) and BP Exploration Operating Company Limited ("BP") (1%), following the completion of the sale of 42.25% of TEP UK’s interests in the Bruce field on November 30, 2018 pursuant to a sale and purchase agreement dated August 2, 2018 between TEP UK and Serica. Upon the closing of the transaction on November 30, 2018, all other prior joint venture partners also sold their interests in the Bruce field to Serica (BP sold 36% retaining a 1% interest; BHP Billiton Petroleum Great Britain Limited ("BHP") sold their full 16% interest and Marubeni Oil & Gas (U.K.) Limited (("Marubeni") sold their full 3.75%).
The Bruce field joint venture is party to an agreement (the "Bruce Rhum Agreement") governing certain transportation, processing and operation services provided to another joint venture at the Rhum field in the UK, co-owned by Serica (50%, operator) and the Iranian Oil Company UK Ltd ("IOC"), a subsidiary of NIOC (50%). Under the terms of the Bruce Rhum Agreement, the Rhum field owners pay a proportion of the operating costs of the Bruce field facilities calculated on a gas throughput basis. IOC’s share of costs incurred under the Bruce Rhum Agreement have been paid to TEP UK in 2018 by Naftiran Intertrade Company Limited ("NICO"), the trading branch of the National Iranian Oil Company ("NIOC"). NIOC is the parent company of IOC and an Iranian government owned corporation. In 2018, based upon TEP UK’s 1% interest in the Bruce field and income from the net cash flow sharing arrangement with Serica, gross revenue to TEP UK from IOC’s share of the Rhum field resulting from the Bruce Rhum Agreement was approximately £8 million. This sum was used to offset operating costs on the Bruce field and as such, generated no net profit to TEP UK. This arrangement is expected to continue in 2019.
In 2018, TEP UK acted as agent for BHP and Marubeni, which faced difficulty securing banking arrangements allowing them to accept payments from IOC, and, thus, received payments from IOC in relation to BHP and Marubeni’s share of income from the Bruce Rhum Agreement under the terms of an agency agreement entered into in June 2018 between BHP, Marubeni and TEP UK (the "Agency Agreement"). Payments made from IOC to BHP and Marubeni in 2018 related to the periods prior to the completion of their divestment to Serica in November 2018. Total payment received on behalf of BHP and Marubeni by TEP UK under this arrangement in 2018 was approximately £7 million. This amount relates to income due to BHP and Marubeni under the Bruce Rhum Agreement for 2017 and 2018. TEP UK transferred all income received under the Agency Agreement to BHP and Marubeni and provided the service on a no profit, no loss basis. The Agency Agreement is expected to be terminated upon receipt of all payments relating to the period up to November 30, 2018.
Prior to the re-imposition of U.S. secondary sanctions on the oil industry as of November 5, 2018, TEP UK liaised directly with IOC concerning its interest in the Bruce Rhum Agreement and it received payments directly for services provided to IOC under the Bruce Rhum Agreement. In October 2018, the U.S. Treasury Department’s Office of Foreign Asset Control ("OFAC") granted a new conditional license to BP and Serica authorizing the provision of services to the Rhum field, following the reinstatement of U.S. secondary sanctions. The principal condition of the OFAC license is that the Iranian government’s shareholding in IOC is transferred into a trust in order that Iran may not derive any benefit from the Rhum field or exercise any control while the U.S. secondary sanctions are in place. A Jersey based trust has been put in place with the trustee holding IOC’s shares in the Rhum field. IOC’s interest is now managed by a new independent management company established by the trust and referred to as the "Rhum Management Company" ("RMC") and where necessary TEP UK liaises, and expects to continue doing so in 2019, with RMC in relation to the Bruce Rhum Agreement.
TEP UK is also party to an agreement with Serica whereby TEP UK uses reasonable endeavors to evacuate Rhum NGL from the St Fergus Terminal (the "Rhum NGL Agreement"). TEP UK provides this service - subject to Serica having title to all of the Rhum NGL to be evacuated and Serica having a valid license from OFAC for the activity - on a cost basis, but for which TEP UK charges a monthly handling fee that generates an income of approximately £35,000 per annum relating to IOC’s 50% stake in the Rhum field. After costs, TEP UK realizes little profit from this arrangement.TEP UK expects to continue this activity in 2019.
(1) Converted using the average exchange rate for fiscal year 2018, as published by Bloomberg.
Following the acquisition of Maersk Oil in 2018, the undeveloped Yeoman discovery is now wholly owned by the Group, under license P2158 granted to Maersk Oil North Sea UK Limited, recently renamed Total E&P North Sea UK Limited ("TEPNSUK"). Yeoman is situated adjacent to the Pardis discovery in which IOC held an interest, which it sold in October 2018. Prior to this divestment, non-legally binding technical and commercial discussions had taken place between TEPNSUK, IOC and the UK Government’s Oil and Gas Authority during the first half of 2018 regarding a potential joint development of Yeoman and Pardis but no contractual arrangements were implemented in connection with such discussions. Also prior to this divestement, other discussions had taken place between TEPNSUK and IOC on an informal basis regarding a potential farm-in to Pardis by Maersk Oil.
Lastly, TOTAL S.A. paid approximately €8,000 to Iranian authorities related to various patents (1) in 2018. Similar payments are expected to be made in 2019 for such patents.
b) Other business segments
In 2018, TOTAL S.A. paid fees of approximately €1,500 to Iranian authorities related to the maintenance and protection of trademarks and designs in Iran. Similar payments are expected to be made in 2019.
Trading & Shipping
Following the suspension of applicable EU and U.S. economic sanctions in 2016, the Group commenced the purchase of Iranian hydrocarbons through its wholly-owned affiliate TOTSA TOTAL OIL TRADING SA ("TOTSA"). In 2018, the Group continued its trading activities with Iran via TOTSA, which purchased approximately 18 Mb of Iranian crude oil for nearly €1 billion pursuant to term contracts. It is not possible to estimate the gross revenue and net profit related to these purchases because the totality of this crude oil was used to supply the Group’s refineries. In addition, in 2018, approximately 1 Mb of petroleum products were sold to entities with ties to the government of Iran. These activities generated gross revenue of nearly €43 million and a net profit of approximately €1 million. The Group ceased these activities in June 2018.
Gas, Renewables & Power
Saft Groupe S.A. ("Saft"), a wholly-owned affiliate, in 2018 sold signaling and backup battery systems for metros and railways as well as products for the utilities and oil and gas sectors to companies in Iran, including some having direct or indirect ties with the Iranian government. In 2018, this activity generated gross revenue of approximately €2.5 million and net profit of approximately €0.3 million. Saft ceased this activity in 2018. Saft also attended the Iran Oil Show in 2018, where it discussed business opportunities with Iranian customers, including those with direct or indirect ties with the Iranian government. Saft ceased this activity in 2018.
Total Eren, a company in which Total Eren Holding holds an interest of 68.76% (TOTAL S.A. owns 33.86% of Total Eren Holding), had preliminary discussions during January to March 2018 for possible investments in renewable energy projects in Iran, including meetings with ministries of the Iranian government. These discussions and meetings ceased as of March 2018 and neither revenues nor profits were recognized from this activity in 2018.
Refining & Chemicals
As of May 2018, Hutchinson SA and its affiliates no longer accepted orders from Iranian companies and ceased all activities, in general, with Iran and all Iranian companies prior to August 6, 2018.
Le Joint Français, a wholly-owned affiliate of Hutchinson SA, sold vehicular O-ring seals in 2018 to Iran Khodro, a company in which the government of Iran holds a 20% interest and which is supervised by Iran’s Industrial Management Organization. This activity generated gross revenue of approximately €54,056 and net profit of approximately €8,108.
Paulstra S.N.C., a wholly-owned affiliate of Hutchinson SA, obtained in 2017 an order from Iran Khodro to sell vehicular anti-vibration systems over a 5-year period. This activity did not generate any gross revenue or net profit in 2018 because Paulstra did not delivery any product to Iran Khodro. The order was terminated in 2018. Paulstra S.N.C. also sold oil seals in 2018 to Iran Khodro. This activity generated gross revenue of approximately €1,078,887 and net profit of approximately €161,833.
Catelsa Caceres, a wholly-owned affiliate of Hutchinson Iberia, itself wholly-owned by Hutchinson SA, sold sealing products to Iran Khodro in 2018. This activity generated gross revenue of approximately €1,449 and net profit of approximately €217.
Hutchinson GMBH, a wholly-owned affiliate of Hutchinson SA, sold hoses for automotive vehicles to Iran Khodro in 2018. This activity generated gross revenue for approximately €257,400 and net profit of approximately €38,610. The last shipments from Hutchinson and its affiliates to Iran Khodro were in August 2018 and last payments were made in October 2018.
Hanwha Total Petrochemicals ("HTC"), a joint venture in which Total Holdings UK Limited (a wholly-owned affiliate) holds a 50% interest and Hanwha General Chemicals holds a 50% interest, purchased approximately 17 Mb of condensates from NIOC for approximately KRW 1,310 billion (approximately $1.2 billion) from January to July 2018, then HTC stopped purchasing from NIOC. These condensates are used as raw material for certain of HTC’s steam crackers. HTC also chartered fifteen tankers of condensates with National Iranian Tanker Company (NITC), a subsidiary of NIOC, for approximately KRW 24 billion (approximately $22.3 million). In November 2018, South Korea was granted a significant reduction exemption waiver (the "SRE waiver") allowing it to import Iranian condensate from NIOC for six months. For 2019, based on the SRE waiver, HTC is reviewing the feasibility to resume purchases from NIOC.
Total Research & Technology Feluy ("TRTF", a wholly-owned affiliate), Total Marketing & Services ("TMS", a wholly-owned affiliate), and Total Raffinage Chimie ("TRC") paid in 2018 fees totaling approximately €1,000 to Iranian authorities related to various patents. Similar payments are expected to be made by TRTF and TRC in 2019. TMS abandoned its patent rights in Iran in 2018, thus no payments are expected by TMS in 2019.
Marketing & Services
Until December 2012, at which time it sold its entire interest, the Group held a 50% interest in the lubricants retail company Beh Tam (formerly Beh Total) along with Behran Oil (50%), a company controlled by entities with ties to the government of Iran. As part of the sale of the Group’s interest in Beh Tam, TOTAL S.A. agreed to license the trademark "Total" to Beh Tam for an initial 3-year period (renewed for an additional 3 year period) for the sale by Beh Tam of lubricants to domestic consumers in Iran. Royalty payments for 2014 were received by TOTAL S.A. during the first semester of 2018 in the amount of approximately €730,000. There remain outstanding royalty payments for 2015 through 2017 in favor of TOTAL S.A. This licensing agreement was terminated in 2018. In addition, representatives of Total Oil Asia-Pacific Pte Ltd, a wholly-owned affiliate, visited Behran Oil beginning 2018 regarding the potential purchase of 50% of the share capital of Beh Tam. Discussions on this matter ended following the announcement of the re-imposition of U.S. secondary sanctions on the oil industry.
(1) Section 560.509 of the U.S. Iranian Transactions and Sanctions Regulations provides an authorization for certain transactions in connection with patent, trademark, copyright or other intellectual property protection in the United States or Iran, including payments for such services and payments to persons in Iran directly connected to intellectual property rights, and TOTAL believes that the activities related to the industrial property rights described in this point 3.1.9.2 are consistent with that authorization.
Total Marketing Middle East FZE, a wholly-owned affiliate, sold lubricants to Beh Tam in 2018. The sale in 2018 of approximately 43 t of lubricants and special fluids generated gross revenue of approximately AED 500,000 (approximately $136,000) and net profit of approximately AED 260,000 (approximately $71,000) (1). The company stopped all transactions with this customer as of August 2018.
Total Marketing France ("TMF"), a company wholly-owned by TMS, provided in 2018 fuel payment cards to the Iranian embassy and delegation to UNESCO in France for use in the Group’s service stations. In 2018, these activities generated gross revenue of approximately €32,000 and net profit of approximately €5,000. The company expects to continue this activity in 2019.
TMF also sold jet fuel in 2018 to Iran Air as part of its airplane refueling activities in France. The sale of approximately 260 cubic meters of jet fuel generated gross revenue of approximately €130,000 and net profit of approximately €570. The company stopped all transactions with this customer prior to November 5, 2018.
Total Belgium, a wholly-owned affiliate, provided in 2018 fuel payment cards to the Iranian embassy in Brussels (Belgium) for use in the Group’s service stations. In 2018, these activities generated gross revenue of approximately €11,000 and net profit of approximately €4,000. The company expects to continue this activity in 2019.
B) Syria
Since early December 2011, TOTAL has ceased its activities that contribute to oil and gas production in Syria and maintains a local office solely for non-operational functions. In late 2014, the Group initiated a downsizing of its Damascus office and reduced its staff to a few employees. In 2018, TOTAL paid approximately €84,000 to the Syrian government as contributions for social security in relation to the aforementioned personnel.
In addition, the Group paid fees related to various industrial property rights (patents, trademarks and designs) in 2018.
3.2 Legal and arbitration proceedings
There are no governmental, legal or arbitration proceedings, including any proceeding of which the Company is aware that are pending or threatened against the Company, that could have, or could have had during the last 12 months, a material impact on the Group’s financial situation or profitability.
Described below are the main administrative, legal and arbitration proceedings in which the Company and the other entities of the Group are involved.
Alitalia
In the Marketing & Services segment, a civil proceeding was initiated in Italy, in 2013, against TOTAL S.A. and its subsidiary Total Aviazione Italia Srl before the competent Italian civil court. The plaintiff claims against TOTAL S.A., its subsidiary and other third parties, damages that it estimates to be nearly €908 million. This proceeding follows practices that had been condemned by the Italian competition authority in 2006. The parties have exchanged preliminary findings and a request for an expert opinion has been approved by the court. The existence and the assessment of the alleged damages in this procedure involving multiple defendants remain contested.
FERC
The Office of Enforcement of the U.S. Federal Energy Regulatory Commission (FERC) began in 2015 an investigation in connection with the natural gas trading activities in the United States of Total Gas & Power North America, Inc. (TGPNA), a U.S. subsidiary of the Group. The investigation covered transactions made by TGPNA between June 2009 and June 2012 on the natural gas market. TGPNA received a Notice of Alleged Violations from FERC on September 21, 2015. On April 28, 2016, FERC issued an order to show cause to TGPNA and two of its former employees, and to TOTAL S.A. and Total Gas & Power Ltd., regarding the same facts. TGPNA contests the claims brought against it. A class action, launched to seek damages from these three companies, was dismissed by a judgment of the U.S. District court of New York issued on March 15, 2017. The Court of Appeal upheld this judgment on May 4, 2018.
Grande Paroisse
On September 21, 2001, an explosion occurred at the industrial site of Grande Paroisse (a former subsidiary of Atofina which became a subsidiary of Elf Aquitaine Fertilisants on December 31, 2004). The explosion caused the death of 31 people, including 21 workers at the site, injured many others and caused significant damage on the site and to property in the city of Toulouse.
After many years, the investigating magistrate brought charges against Grande Paroisse and the former Plant Manager before the Toulouse Criminal Court. On November 19, 2009, this tribunal acquitted both the former Plant Manager and Grande Paroisse due to the lack of reliable evidence for the explosion. The Court declared Grande Paroisse civilly liable for the damages caused by the explosion to the victims in its capacity as custodian and operator of the plant.
On September 24, 2012, the Court of Appeal of Toulouse convicted Grande Paroisse and the former Plant Manager.
On January 13, 2015, the French Supreme Court (Cour de cassation) fully quashed the decision of September 24, 2012. The case was referred back to the Court of Appeal of Paris, which, on October 31, 2017, convicted Grande Paroisse and the former Plant Manager. Both have decided to appeal this decision before the French Supreme Court (Cour de cassation).
A compensation mechanism for victims was set up immediately following the explosion. €2.3 billion was paid for the compensation of claims and related expenses amounts. A €10 million reserve remains booked in the Group’s Consolidated Financial Statements as of December 31, 2018.
Iran
In 2003, the Securities and Exchange Commission (SEC) followed by the Department of Justice (DoJ) issued a formal order directing an investigation against TOTAL, and other oil companies, for alleged violations of the Foreign Corrupt Practices Act (FCPA) and the Company’s accounting obligations in connection with the pursuit of business in Iran in the 1990s.
(1) Converted using the average exchange rate for fiscal year 2018, as published by Bloomberg.
In late May 2013, and after several years of discussions, TOTAL reached settlements with the U.S. authorities (a Deferred Prosecution Agreement with the DoJ and a Cease and Desist Order with the SEC). These settlements, which put an end to these investigations, were concluded without admission of guilt and in exchange for TOTAL respecting a number of obligations, including the payment of a fine and civil compensation for an aggregate amount of $398.2 million. By virtue of these settlements, TOTAL also accepted the appointment of an independent compliance monitor to review the Group’s compliance program and to recommend possible improvements.
In July 2016, the monitor submitted his third and final report, in which he certified that TOTAL had devised and implemented an appropriate compliance program. As a result of this certification, the U.S. authorities, after having reviewed the monitor’s report, concluded that TOTAL had fulfilled all of its obligations, thus bringing an end to the monitoring process. As a result, a Court in the State of Virginia granted a motion to dismiss on November 9, 2016, thereby terminating the procedure directed at the Company, which can no longer be pursued in the United States for these same facts.
With respect to the same facts, TOTAL was placed under formal investigation in France in 2012. In October 2014, the investigating magistrate decided to refer the case to trial. Pursuant to a judgment issued on December 21, 2018, the Paris Criminal Court convicted TOTAL of corruption of foreign official and ordered the Company to pay a €500,000 fine. Given the specific circumstances of this case, which has been already judged in the U.S. and in which none of the individuals can defend themselves, TOTAL did not want to pursue the case. This decision is thus definitive.
Italy
As part of an investigation led by the Public Prosecutor of the Potenza Court in 2007, Total Italia and also certain Group employees were the subjects of an investigation related to alleged irregularities in connection with the purchase of lands and the award of calls for tenders in relation to the preparation and development of an oil field located in the south of Italy.
Pursuant to a judgment issued on April 4, 2016, the Potenza Criminal Court found four employees to be guilty of corruption, with two of these employees also being found guilty of misappropriation in connection with the purchase of land. The procedure with respect to Total Italia was sent back to the public prosecutor due to the imprecision of the terms of prosecution. The four employees decided to challenge the judgment before the Court of Appeal.
Pursuant to a definitive judgment issued on February 20, 2018 the Court of Appeal of Potenza recorded the termination of the proceedings directed towards the four employees prosecuted for corruption because of the expiration of the statute of limitation.
Pursuant to a judgment issued on July 17, 2018, the Court of Appeal of Potenza acquitted two of the Group’s employees prosecuted for misappropriation. The public prosecutor and a civil party (plaintiff) have decided to appeal this decision.
3.3 Internal control and risk management procedures
The following information was prepared with the support of several functional divisions of the Company, and in particular the Audit & Internal Control, Legal and Finance Divisions. It was examined by the Audit Committee, then approved by the Board of Directors.
3.3.1 Fundamental elements of the internal control and risk management systems
The Group is structured around its business segments, to which the Group’s operational entities report. The business segments’ management are responsible, within their area of responsibility, for ensuring that operations are carried out in accordance with the strategic objectives defined by the Board of Directors and General Management. The functional divisions at the Holding level help General Management define norms and standards, oversee their application and monitor activities. They also lend their expertise to the operational divisions.
The Group’s internal control and risk management systems are structured around a three-level organization - Holding level, business segments, operational entities - where each level is directly involved and accountable in line with the level of delegation determined by General Management.
General Management constantly strives to maintain an efficient internal control system, based on the framework of the Committee of Sponsoring Organizations of the Treadway Commission (COSO). In this framework, internal control is a process intended to provide reasonable assurance that the objectives related to operations, reporting and compliance with applicable laws and regulations are achieved. As for any internal control system, it cannot provide an absolute guarantee that all risks are completely controlled or eliminated.
The COSO framework is considered equivalent to the reference framework of the French Financial Markets Authority (Autorité des marchés financiers). The Group has also chosen to rely on this framework as part of its obligations under the Sarbanes-Oxley Act. The Group’s internal control and risk management systems are therefore based on the five components of this framework: control environment, risk assessment, control activities, monitoring, and information and communication.
The Group’s risk management system draws on the main international standards (COSO Enterprise Risk Management integrated framework, ISO 31000: 2018 - Risk management) as well as on French standards (Reference framework of the French Financial Markets Authority). The internal Risk Management, Internal Control and Audit Charter forms the common framework on which the Group relies to ensure control of its activities.
The Group’s internal control and risk management systems cover the processes of the fully consolidated entities. Regarding acquisitions, the Group’s control environment is implemented in the acquired entities after a critical analysis of their own systems.
The principles of control fit into the framework of the rules of corporate governance. In particular, these rules task the Board of Directors’ Audit Committee with monitoring the efficiency of the internal control and risk management systems, and of the internal audit performed to assess the risk management systems at all levels of the organization and make recommendations for their improvement. The Audit Committee also monitors the process of producing accounting and financial information, in order to guarantee its integrity.
Approximately 400 employees monitor the internal control systems within the Group. The assessment of the internal control and risk management system is mainly overseen by the Audit & Internal Control Division.
3.3.2 Control environment
Integrity and ethics - Framework
TOTAL’s control environment is based primarily on its Code of Conduct, which spells out the Group’s values, two of which are core values: Safety and Respect for Each Other, the latter being reflected in the areas of integrity (fraud and corruption), respect for human rights as well as environment and health. The principles of the Code of Conduct are set forth in a number of guides, such as the Business Integrity Guide and the Human Rights Guide. These documents are distributed to employees and are available on the intranet. They also set out the rules of individual behavior expected of all employees in the countries where the Group is present. Similarly, a Financial Code of Ethics sets forth the obligations applicable to the Chairman and Chief Executive Officer, the Chief Financial Officer, the Vice President of the Corporate Accounting Division and the financial and accounting officers of the principal Group activities.
As a priority of General Management, the Group deploys an integrity policy and compliance programs, in particular for the prevention of corruption, fraud and competition law infringement. These programs include reporting and control actions (review and audit missions). Ethical assessments are also conducted (refer to point 5.7 of chapter 5). In these areas, the Group relies on the Compliance network, the Ethics officers’ network and the Ethics Committee, the role of which is to listen and provide assistance.
TOTAL has a framework of Group standards that is completed by a series of practical recommendations and feedback. Like the Group’s organization, this framework has a three-level structure: a Group level, frameworks for each business segment, and a specific framework for each significant operational entity.
Governance, authorities and responsibilities
The Board of Directors, with the support of its Committees, ensures that the internal control functions are operating properly. The Audit Committee ensures that General Management implements internal control and risk management procedures based on the risks identified, such that the Group’s objectives are achieved.
General Management ensures that the organizational structure and reporting lines plan, execute, control and periodically assess the Group’s activities. It regularly reviews the relevance of the organizational structures so as to be able to adapt them quickly to changes in the activities and in the environment in which they are carried out.
The business segments and operational entities’ General management are responsible for the internal control and risk management system within their scope of responsibility.
The Group has also defined central responsibilities that cover the three lines of internal control: (1) operational management, which is responsible for implementing internal control, (2) support functions (such as Finance, Legal, Human Resources, etc.), which prescribe the internal control systems, verify their implementation and effectiveness and assist operational employees, and (3) internal auditors who, through their internal control reports, provide recommendations to improve the effectiveness of the system.
An accountability system is defined and formalized at all levels of the organization, through organization notes, organization charts, appointment notes, job descriptions and delegations of powers. Each business segment has established, in accordance with the Group’s instructions, clear rules applicable to its own scope.
The Group’s Audit & Internal Control Division pursues a continual process aimed at strengthening the assessment of the role and involvement of all employees in terms of internal control. Training initiatives tailored to the various stakeholders involved in the internal control process are regularly launched within the Group.
Control activities and assessment
Any activity, process or management system may be the subject of an internal audit conducted by Group Audit, in accordance with the international internal audit framework of internal audits and its Code of Conduct. The Group’s Audit & Internal Control Division also conducts joint audits with third parties and provides assistance (advice, analysis, input regarding methodology). The audit plan, which is based on an analysis of the risks and risk management systems, is submitted annually to the Executive Committee and the Audit Committee. The Group’s Audit & Internal Control Division employs 75 people and conducted about 150 internal audit missions in 2018.
The Group regularly examines and assesses the design and effectiveness of the key operational, financial and information technology controls related to internal control over financial reporting, in compliance with the Sarbanes-Oxley Act. In 2018, this assessment was performed with the assistance of the Group’s main entities and Audit & Internal Control Division. The system covers:
-the most significant entities, which assess the key operational controls of their significant processes and respond to a Group questionnaire for assessing the internal control framework; and
-other less significant entities, which respond only to the Group questionnaire for assessing the internal control system.
These two categories of entities, which include the central functions of the business segments and the corporate, account for approximately 80% and 10%, respectively, of the financial aggregates in the Group’s Consolidated Financial Statements.
Direct Énergie, Quadran and Global LNG, entities acquired in 2018, are excluded from the scope of the assessment and conclusion on the effectiveness of internal control over financial reporting. These three entities represented respectively 1.34%, 0.50% and 2.15% of the Group’s consolidated balance sheet as of December 31, 2018 and 0.34%, 0.04% and 0.07% of the Group’s 2018 consolidated sales.
The statutory auditors also review the internal controls that they deem necessary as part of their certification of the financial statements. Pursuant to American regulations, they reviewed in 2018 the implementation of the Group’s internal control framework and the design and effectiveness of key internal controls in its main entities regarding financial reporting. Based on their review, the statutory auditors stated that they had no remarks on the information presented on internal control and risk management procedures.
The reports on the work performed by the Group Audit and statutory auditors are periodically summarized and presented to the Audit Committee and, thereby, to the Board of Directors. The Senior Vice President, Audit & Internal Control attended all Audit Committee meetings held in 2018. The Audit Committee also meets with the statutory auditors at least once a year without any Company representatives present.
If areas of improvement are identified by these internal audits and operational controls, then corrective action plans are drawn up and shared with operational management, who, along with the Group’s Audit & Internal Control Division, monitor their implementation closely.
Based on the internal reviews, General Management has reasonable assurance of the effectiveness of the Group’s internal control.
3.3.3 Risk assessment and management
3.3.3.1 General principles
To implement its strategy, General Management ensures that clear and precise objectives are defined at the various levels of the organization with regard to operations, reporting and compliance.
Operational objectives focus on the definition and efficient use of human, financial and technical resources. In particular, they are defined during the budgetary processes and in the long-term plan, and are regularly monitored as part of the self-assessment process.
The monitoring of operational objectives (financial and non-financial) helps in decision-making and monitoring the performance of activities at each level of the organization.
The Group implements a risk-management system that is an essential factor in the deployment of its strategy, based on responsible risk-taking.
This system relies on a continuous process of identifying and analyzing risks in order to determine those that could prevent the achievment of TOTAL’s goals.
The Executive Committee, with the assistance of the Group Risk Management Committee (GRMC), is responsible for identifying and analyzing internal and external risks that could impact the achievement of the Group’s objectives. The main responsibilities of the GRMC include ensuring that the Group has a map of the risks to which it is exposed and that suitable risk management systems are in place. The GRMC’s work focuses on continuously improving risk awareness and the risk management systems.
Risk mapping, which has been carried out since the 2000s, is a dynamic process that has taken shape over the years. The Group’s risk map feeds the audit plan, which is based on an analysis of the risks and the risk management systems, and the work of the GRMC.
The GRMC relies on the work carried out by the business segments and functional divisions, which concurrently establish their own risk mapping. The business segments are responsible for defining and implementing a risk management policy suited to their specific activities. However, the handling of certain transverse risks is more closely coordinated by the respective functional divisions.
Regarding commitments, General Management exercises operational control over TOTAL’s activities through the Executive Committee’s approval of investments and expenses that exceed defined thresholds. The Risk Committee (CORISK) is tasked with reviewing these projects in advance, and in particular, with verifying the analysis of the various associated risks.
3.3.3.2 Implementation of the organizational framework
The Group Risk Management Committee (GRMC)
The GRMC is chaired by a member of the Executive Committee, the Group’s Chief Financial Officer, and includes the Senior Vice Presidents of the corporate functions, together with the chief administrative officers or chief financial officers of the business segments. The Group’s Chief Financial Officer attends all meetings of the Board of Directors’ Audit Committee, thus strengthening the link between the GRMC and the Audit Committee.
The GRMC meets six times a year. At each meeting, the participants share any potential risks they have identified and presentations are given on one or more risk-related topics, during which the members of the GRMC are invited to cast a critical eye over the subject, question the work done and, if applicable, provide additional information or clarification in order to enhance the understanding of the risk and improve the risk management systems. The GRMC can request that actions be taken.
The work of the GRMC is led by the Audit & Internal Control Division, which assists contributors in preparing the presentations and acts as the committee’s secretary. In this capacity, the Audit & Internal Control Division reports regularly on the work of the GRMC to the Executive Committee, and once a year to the Audit Committee in the presence of the Group’s Chief Financial Officer who chairs the GRMC.
The Risk Committee (CORISK)
The Risk Committee is chaired by a member of the Executive Committee (Senior Vice President of Strategy & Innovation or Chief Financial Officer). It is made up of representatives from the corporate Strategy & Climate, Finance, Legal, Insurance and HSE divisions.
The Risk Committee meets on the same schedule as the Executive Committee. Any project submitted to the Executive Committee (and therefore giving rise to a financial commitment that exceeds certain thresholds) is first presented to the Risk Committee by the relevant operational division.
Following the review by the Risk Committee of the risks associated with the project submitted, the Strategy & Climate Division sends the Executive Committee a memorandum stating its opinion in light of the Risk Committee’s comments.
The Audit & Internal Control Division
The Risk Team of the Audit & Internal Control Division is responsible for producing and continuously updating the Group’s risk map. To this end, it uses all of the risk-mapping work carried out across the Group, in the business segments and in the functional divisions, the results of all audits and internal control activities, the action plans resulting from this work and the monitoring of their implementation, structured feedback, benchmarks and other external information sources, regular interviews with the Group’s executive officers, and all information gathered during GRMC meetings and the preparation for these meetings.
The Audit & Internal Control Division reports regularly on its work related to the Group’s risk map to the Executive Committee, which are presented annually to the Audit Committee.
3.3.3.3 Systems in place
Risk management systems are implemented in the operational and financial fields as well as in information systems and protection of intellectual assets. Specific systems are deployed to prevent risks related to ethics and non-compliance. The main risk management systems covering health, safety, industrial security, the environment and the prevention of corruption are presented in the statement of non-financial performance (chapter 5).
Financial risks
The management and conditions of use of financial instruments are governed by strict rules that are defined by the Group’s General Management, and which provide for centralization by the Treasury Division of liquidity, interest and exchange rate positions, management of financial instruments and access to capital markets. The Group’s financing policy consists of incurring long-term debt at a floating rate or at a fixed rate, depending on the Group’s general corporate needs, and interest rates. Debt is incurred mainly in dollars or euros.
The Group’s cash balances, which mainly consist of dollars and euros, are managed to maintain liquidity based on daily interest rates in the given currency. Maximum amounts are set for transactions exceeding one month, with placements not to exceed 12 months. TOTAL S.A. also has committed credit facilities granted by international banks. These credit facilities, along with the Group’s net cash position, allow it to continually maintain a high level of liquidity in accordance with targets set by General Management.
In terms of counterparty risk in financial transactions, the Group adheres to a cautious policy, and only makes commitments with institutions featuring a high degree of financial soundness, as based on a multi-criteria analysis. An overall credit limit is set for each authorized financial counterparty and allocated among the subsidiaries and the Group’s central treasury entities according to their needs. In addition, to reduce market value risk on its commitments, the Treasury Division has entered into margin call contracts with its counterparties. In addition, since December 21, 2018, pursuant to Regulation (EU) No. 648/2012 on OTC derivatives, central counterparties and trade repositories (EMIR), some of the interest rate swaps entered into by the Group are now being centrally cleared.
The Group seeks to minimize its currency exposure, on the one hand, by financing its long-term assets in the functional currency of the entity to which they belong and, on the other hand, by systematically hedging the currency exposure generated by commercial activity. These risks are managed centrally by the Treasury Division, which operates within a set of limits defined by General Management.
The policy for managing risks related to financing and cash management activities, as well as the Group’s currency exposure and interest rate risks, are described in detail in Note 15 to the Consolidated Financial Statements (point 8.7 of chapter 8).
Risks related to information systems
In order to maintain information systems that are appropriate to the organization’s needs and limit the risks associated with information systems and their data, TOTAL’s IT Division has developed and distributed governance and security rules that describe the recommended infrastructure, organization and procedures. These rules are implemented across the Group under the responsibility of the various business segments. To address cyber threats, the Group conducts specific risk analyses permitting to define and put in place appropriate security controls concerning information systems.
The Group has also developed control activities at various levels of the organization relating to areas where information systems cover all or part of the processes. Information Technology General Controls aim to guarantee that information systems function and are available as required, and that data integrity and confidentiality are also ensured and changes controlled.
Information Technology Automated Controls aim to ensure the integrity and confidentiality of data generated or supported by business applications, particularly those that impact financial flows.
The outsourcing of some components of the Group’s IT infrastructure to service providers poses specific risks and requires the selection and development of additional controls of the completeness, accuracy and validity of the information supplied and received from such service providers. Accordingly, to ensure continuous improvement, the Group assesses whether suitable controls are implemented by the service providers concerned and identifies the controls necessary within its own organization to maintain these risks at an acceptable level.
Furthermore, faced with rising legal and security-related risks, the Group deploys policies to retain documents and to protect personal data and the security of its information assets. The Group has also employed an Operational Security Center to detect and analyze IT system security events.
Ethical misconduct and non-compliance risks
Fraud prevention
The Group deploys an anti-fraud and fraud-prevention program and has implemented a range of procedures and programs that help to prevent and detect different types of fraud. This effort is supported by the business principles and values of individual behavior described in the Group’s Code of Conduct and other standards applied by the Group’s business segments.
The Group has issued a directive for handling incidents of fraud that has been widely distributed to employees, and has created an alert system that employees can use to report acts including those that may constitute fraud.
An anti-fraud compliance program has been deployed since 2015, including e-learning modules for all Group employees, a Guide to the "Prevention and the fight against fraud", a map of the risks of fraud in the Group, a guide to the types of risk of fraud that includes descriptions of the main risks and was published in 2016, and campaigns to raise awareness of the major risks of fraud, launched at the end of 2016 and 2018. This program is deployed by the network of fraud risk coordinators in the business segments and operational entities. The role of coordinator is usually performed by the Compliance Officer. Fraud risk analyses are also carried out in the subsidiaries.
For information on prevention of corruption, refer to point 5.8.1 of chapter 5.
Prevention of competition law infringement
A Group policy aimed at ensuring compliance with, and preventing infringement of, competition law has been in place since 2014 and is a follow-up to the various measures previously implemented by the business segments. Its deployment is based, in particular, on management and staff involvement, training courses that include an e-learning module, and an appropriate organization.
Prevention of conflicts of interest and market abuse
To prevent conflicts of interest, each of the Group’s senior executives completes an annual statement declaring any conflicts of interest to which they may be subject. By completing this declaration, each senior executive also agrees to report to their supervisor any conflict of interest that he or she has had, or of which he or she is aware in performing his or her duties. An internal rule named "Conflicts of Interests" reminds all employees of their obligation to report to their supervisor any situation that might give rise to a conflict of interests.
The Group implements a policy to prevent market abuse linked to trading on the financial markets that is based, in particular, on internal ethics rules that are updated on a regular basis and distributed. In addition, the Group’s senior executives and certain employees, in light of their positions, are asked to refrain from carrying out any transactions, including hedging transactions, on TOTAL shares or ADRs and in collective investment plans (FCPE) invested primarily in TOTAL shares (as well as derivatives related to such shares) on the day on which the Company discloses its periodic results publications (quarterly, interim and annual), as well as during the 30 calendar-day period preceding such date. An annual campaign specifies the applicable blackout periods.
Prevention of risks of non-compliance with international economic sanctions regimes
The Group’s activities in relation to sanctioned countries (refer to point 3.1.9 of this chapter) are subject to an analysis of compliance with the various applicable economic sanctions regimes. With respect to Iran and until the withdrawal of the Group’s business operations from this country on October 29, 2018, a specific compliance program was put in place. In-depth investigations, carried out by specialized service providers, were conducted on the Group’s stakeholders in Iran, in order to identify possible links with companies or persons listed under international sanctions (Specially Designated
Nationals and Blocked Persons Lists, List of Frozen Assets of the EU and the UN, etc.). U.S. persons (1) were also excluded from any transactions related to Iran. An Iran compliance coordinator, appointed in 2016, liaised with the compliance teams of the relevant business segments and the Holding in order to ensure compliance of the Group’s activities with applicable laws and regulations.
Risks related to the protection of intellectual assets
To mitigate the risks of third parties infringing its intellectual property and the leak of know-how, TOTAL protects its rights under research partnership agreements negotiated by the Group’s intellectual property specialists, the terms and conditions of which are consistent with the Group’s industrial and commercial strategy. The Group has a policy of filing and maintaining patents, it monitors technological developments in terms of freedom of use, and it takes, when necessary, all appropriate measures to ensure the protection of its rights.
In addition, since some of its employees have access to confidential documents while performing their duties, TOTAL has adopted internal rules concerning the management of confidential information. The Group’s intellectual property specialists also carry out awareness-raising activities with Group employees, so that they are better informed about restrictions that may apply to the use of information and data.
3.3.4 Main characteristics of the internal control and risk management procedures relating to the preparation and processing of accounting and financial information
Accounting and financial internal control covers the processes that produce accounting and financial data, and mainly the financial statements processes and the processes to produce and publish accounting and financial information. The internal control system aims to:
-conserve the Group’s assets;
-comply with accounting regulations, and properly apply standards and methods to the production of financial information; and
-guarantee the reliability of accounting and financial information by controlling the production of accounting and financial information and its consistency with the information used to produce the control panels at every appropriate level of the organization.
At Group level, the Finance Division, which includes the Accounting Division, the Budget & Financial Control Division and the Tax Division, is responsible for the production and processing of accounting and financial information. The scope of the internal control procedures relating to the production and processing of financial and accounting information includes the parent company (TOTAL S.A.), and all fully consolidated entities or entities whose assets are under joint control.
Refer to point 4.1.2.3 of chapter 4 for a description of the role and the missions of the Audit Committee. These missions are defined by Directive 2014/56/EU and regulation (EU) n° 537/2014 pertaining to the legal control of accounts.
3.3.4.1 Production of accounting and financial information
Organization of the Financial and Information Systems function
Dedicated teams implement the accounting and financial processes in the areas of consolidation, tax, budget and management control, financing, cash positions and information systems. The entities, business segments and General Management are respectively responsible for accounting activities.
The Accounting Division, which is part of the Finance Division, is responsible for drawing up the Consolidated Financial Statements and manages the Group’s network of accounting teams.
The tax function, made up of a network of tax experts in the Holding, the business segments and the entities, monitors changes in local and international rules. It oversees the implementation of the Group’s tax policy.
Management control contributes to the reinforcement of the internal control system at every level of the organization. The network of management controllers in the entities and the business segments is supervised by the Budget & Financial Control Division. This department also produces the monthly control panel, the budget and the long-term plan for the Group.
The Treasury Division implements the financial policy, and in particular the processing and centralization of cash flows, the debt and liquidity investment policy and the coverage of currency exposure and interest rate risks.
The Information Systems Division makes decisions on the choice of software suited to the Group’s accounting and financial requirements. These information systems are subject to works to reinforce the task separation system and to improve the control of access rights. Tools are available to make sure that access rights comply with the Group’s rules in this area.
Consolidated Financial Statements process
The Accounting Division, which reports to the Finance Division, prepares the Group’s quarterly Consolidated Financial Statements according to IFRS standards, on the basis of the consolidated reporting packages prepared by the entities concerned. The Consolidated Financial Statements are examined by the Audit Committee, then approved by the Board of Directors.
The main factors in the preparation of the Consolidated Financial Statements are as follows:
-the processes feeding the individual accounts used to prepare the reporting packages for consolidation purposes are subject to validation, authorization and booking rules;
-the consistency and reliability of the accounting and control data are validated for each consolidated entity and at each appropriate level of the organization;
-a consolidation tool, supervised by the Accounting Division, is used by each consolidated entity and the Group. It guarantees the consistency and reliability of the data at each appropriate level of the organization;
-a consolidation reporting package from each entity concerned is sent directly to the Accounting Division. It is used to optimize the transmission and the completeness of the information;
-a corpus of accounting rules and methods is formally defined. Its application is compulsory for all the consolidated entities in order to provide uniform and reliable financial information. This framework is built according to IFRS accounting standards. The Accounting Division centrally distributes this framework through regular and formal communication with the business segment managers, formal procedures and a Financial Reporting Manual that is regularly updated. In particular, it specifies the procedures
(1) "U.S. person" means any U.S. citizen and permanent resident alien wherever he/she is in the world, entity organized under the laws of the United States or any jurisdiction within the United States, including foreign branches, or any person or entity located in the United States.
for the booking, identification and valuation of off-balance sheet commitments;
-new accounting standards under preparation and changes to the existing framework are monitored in order to assess and anticipate their impacts on the Consolidated Financial Statements;
-an accounts plan used by all the consolidated entities is formally set forth in the Financial Reporting Manual, specifying the content of each account and the procedures for the preparation of the reporting packages for consolidation purposes;
-the account closing process is supervised and is based mainly on the formalization of economic assumptions, judgments and estimates, treatment of complex accounting transactions and compliance with established timetables announced through Group instructions disclosed to each entity;
-in particular, the process applicable to the preparation of the accounts of the acquired entities are reviewed and, where appropriate, amended to integrate them into those applicable to the preparation of the Consolidated Financial Statements. Furthermore, the booking in the accounts of the purchase price allocation of each of these entities is based on assumptions, estimates and judgments in line with the Group’s business model;
-off-balance sheet commitments, which are valued according to the Financial Reporting Manual are reported on a quarterly basis to the Audit Committee.
Processing of accounting and financial information
Internal control of accounting information is mainly focused around the following areas:
-a monthly financial report is formalized by Group and business segment control panels. This report and the Consolidated Financial Statements use the same framework and standards. In addition, the quarterly closing schedule is the same for preparing the Consolidated Financial Statements and financial reporting;
-a detailed analysis of differences as part of the quarterly reconciliation between the Consolidated Financial Statements and financial reporting is supervised by the Accounting and Budget & Financial Control Divisions, which are part of the Finance Division;
-a detailed analysis of differences between actual amounts and the yearly budget established on a monthly basis is conducted at each level of the organization. The various monthly indicators are used to continually and uniformly monitor the performances of each of the entities, business segments and of the Group, and to make sure that they are in keeping with the objectives;
-an annual reconciliation between the parent company financial statements and the financial statements based on IFRS standards is performed by entity;
-periodic controls are designed to ensure the reliability of accounting information and mainly concern the processes for preparing aggregated financial items;
-a regular process for the signature of representation letters is deployed at each level of the organization;
-an annual control system of the accounts of equity affiliates based on a questionnaire completed by each entity concerned. This system is integrated into the Group’s internal control framework; and
-the Disclosure Committee (CCIP) ensures the respect of the procedures in place.
Other significant financial information is produced according to strict internal control procedures.
Proved oil and gas reserves are evaluated annually by the relevant entities. They are reviewed by the Reserves Committees, approved by Exploration & Production’s general management and then validated by the Group’s General Management. They are also presented to the Audit Committee each year.
The internal control process related to estimating reserves is formalized in a special procedure described in detail in point 2.1.3 of chapter 2. The reserves evaluation and the related internal control processes are audited periodically.
The strategic outlook published by the Group is prepared, in particular, according to the long-term plans drawn up at the business segment and Group levels, and on the work carried out at each relevant level of the organization. The Board of Directors reviews the strategic outlook each year.
3.3.4.2 Publication of accounting and financial information
Significant information about the Group is published externally according to formal internal procedures. These procedures aim to guarantee the quality and fair presentation of the information intended for the financial markets, and its timely publication.
The Disclosure Committee (CCIP), chaired by the Chief Financial Officer, ensures, in particular, the respect of these procedures. It meets before TOTAL’s financial results press releases, strategic presentations and annual reports are submitted to the Audit Committee and the Board of Directors.
A calendar of the publication of financial information is published and made available to investors on the Group’s web site (refer to point 6.6 of chapter 6). With the help of the Legal Division, Investor Relations ensures that all publications are made on time and in accordance with the principle of equal access to information between shareholders.
Assessment of the system for the internal control of accounting and financial information
The Group’s General Management is responsible for implementing and assessing the internal control system for financial and accounting disclosure. In this context, the implementation of the Group’s internal control framework, based on the various components of the COSO framework, is assessed internally at regular intervals within the Group’s main entities.
Pursuant to the requirements introduced by Section 302 of the Sarbanes-Oxley Act, the Chairman and Chief Executive Officer and the Chief Financial Officer of the Company have conducted, with the assistance of members of certain divisions of the Group (in particular Legal, Audit & Internal Control and Corporate Communications), an evaluation of the effectiveness of the internal disclosure controls and procedures, over the period covered by the annual report on Form 20-F. For fiscal year 2018, the Chairman and Chief Executive Officer and the Chief Financial Officer concluded that the disclosure controls and procedures were effective.
In addition, a specific process is in place for reporting any information related to the Group’s accounting procedures, internal control and auditing. This process is available to any shareholder, employee or third party.
[REDACTED SECTION: CERTAIN TEXT HAS BEEN REDACTED.]
3.4 Insurance and risk management
3.4.1 Organization
TOTAL has its own reinsurance company, Omnium Reinsurance Company (ORC). ORC is integrated within the Group’s insurance management and is used as a centralized global operations tool for covering the Group companies’ insurable risks. It allows the Group’s worldwide insurance program to be implemented in compliance with the specific requirements of local regulations applicable in the countries where the Group operates.
Some countries may require the purchase of insurance from a local insurance company. If the local insurer agrees to cover the subsidiary of the Group in compliance with its worldwide insurance program, ORC negotiates a retrocession of the covered risks from the local insurer. As a result, ORC enters into reinsurance contracts with the subsidiaries’ local insurance companies, which transfer most of the risk to ORC.
At the same time, ORC negotiates a reinsurance program at the Group level with oil industry mutual insurance companies and commercial reinsurance markets. ORC allows the Group to better manage price variations in the insurance market by taking on a greater or lesser amount of risk corresponding to the price trends in the insurance market.
In 2018, the net amount of risk retained by ORC after reinsurance was, on the one hand, a maximum of $100 million per onshore or offshore third-party liability insurance claim and, on the other hand, $125 million per property damage and/or business interruption insurance claim. Accordingly, in the event of any loss giving rise to an aggregate insurance claim, the effect on ORC would be limited to its maximum retention of $225 million per occurrence.
3.4.2 Risk and insurance management policy
In this context, the Group risk and insurance management policy is to work with the relevant internal department of each subsidiary to:
-define scenarios of major disaster risks (estimated maximum loss);
-assess the potential financial impact on the Group should a catastrophic event occur;
-help implement measures to limit the probability that a catastrophic event occurs and the financial consequences if such event should occur; and
-manage the level of financial risk from such events to be either covered internally by the Group or transferred to the insurance market.
3.4.3 Insurance policy
The Group has worldwide property insurance and third-party liability coverage for all its subsidiaries. These programs are contracted with first-class insurers (or reinsurers and oil and gas industry mutual insurance companies through ORC).
The amounts insured depend on the financial risks defined in the disaster scenarios and the coverage terms offered by the market (available capacities and price conditions).
More specifically for:
-third-party liability: because the maximum financial risk cannot be evaluated by a systematic approach, the amounts insured are based on market conditions and oil and gas industry practice. In 2018, the Group’s third-party liability insurance for any third-party liability (including potential accidental environmental liabilities) was capped at $900 million (onshore) and $850 million (offshore). In addition, the Group adopts, where appropriate, the necessary means to manage the compensation of victims in the event of an industrial accident for which it is liable; and
-property damage and business interruption: the amounts insured vary by sector and by site and are based on the estimated cost and scenarios of reconstruction under maximum loss situations and on insurance market conditions. The Group subscribed for business interruption coverage in 2018 for its main refining and petrochemical sites.
For example, for the Group’s highest risks (its North Sea platforms and main refineries or petrochemical plants), in 2018 the insurance limit for the Group’s share of the installations was approximately $2 billion for the Refining & Chemicals segment and approximately $2.25 billion for the Exploration & Production segment.
Deductibles for property damage and third-party liability fluctuate between €0.1 and €10 million depending on the level of risk and liability, and are borne by the relevant subsidiaries. For business interruption, coverage is triggered 60 days after the occurrence giving rise to the interruption. In addition, the main refineries and petrochemical plants bear a combined retention for property damage and business interruption of $75 million per insurance claim.
Other insurance contracts are bought by the Group in addition to property damage and third-party liability coverage, mainly in connection with car fleets, credit insurance and employee benefits. These risks are mostly underwritten by outside insurance companies.
The above-described policy is provided as an example of a situation as of a given date and cannot be considered as representative of future conditions. The Group’s insurance policy may be changed at any time depending on market conditions, specific circumstances and General Management’s assessment of the risks incurred and the adequacy of their coverage.
TOTAL believes that its insurance coverage is in line with industry practice and sufficient to cover normal risks in its operations. However, the Group is not insured against all potential risks. In the event of a major environmental disaster, for example, TOTAL’s liability may exceed the maximum coverage provided by its third-party liability insurance. The loss TOTAL could suffer in the event of such disaster would depend on all the facts and circumstances of the event and would be subject to a whole range of uncertainties, including legal uncertainty as to the scope of liability for consequential damages, which may include economic damage not directly connected to the disaster. The Group cannot guarantee that it will not suffer any uninsured loss, and there can be no guarantee, particularly in the event of a major environmental disaster or industrial accident, that such loss would not have a material adverse effect on the Group.
3.5 Vigilance Plan
3.5.1 Introduction
3.5.1.1 Background and Group commitments
In accordance with Article L. 225-102-4 of the French Commercial Code, the vigilance plan (hereafter referred to as the "Vigilance Plan") aims to set out the reasonable measures of vigilance put in place within the Group in order to identify the risks and prevent severe impacts on human rights and fundamental freedoms, human health and safety and the environment resulting from the activities of the Company and those of the companies it controls as defined in point II of Article L. 233-16 of the French Commercial Code, directly or indirectly, as well as the activities of subcontractors or suppliers with which it has an established commercial relationship, where such activities are linked to this relationship.
TOTAL operates in over 130 countries in a variety of complex economic and socio-cultural contexts and in business areas that are likely to present risks that fall within the scope of the Vigilance Plan.
The One Total company project, which embodies the Group’s ambition to become the responsible energy major, is based specifically on Safety and Respect for Each Other, the two core values central to the Group’s collective principles. In addition to complying with applicable legislation in each country where the Group operates which most often aims at preventing severe impacts in the scope of Article L. 225-102-4 of the French Commercial Code, TOTAL relies on structured frameworks and stringent risk management systems for the conduct of its operations.
The Vigilance Plan and its implementation are part of a dynamic process aimed at continual improvement of the Group’s practices with regard to the issues identified within each of the areas concerned.
3.5.1.2 Method and preparation of the Vigilance Plan
The Vigilance Plan covers the activities (hereafter referred to as the "Activities") of TOTAL S.A. and its fully consolidated subsidiaries as defined in II of Article L. 233-16 of the French Commercial Code (hereafter referred to as the "Subsidiaries"). Certain companies, such as Hutchinson, Saft Groupe and SunPower, have set up risk management and severe impact prevention measures specific to their organizations and activities; those measures related to Article L. 225-102-4 of the French Commercial Code are specified in the Group’s Vigilance Plan. In addition, for newly acquired companies, reasonable vigilance measures are intended to be implemented progressively during the integration phase of these companies into the Group systems. They do not therefore fall within the scope of the Vigilance Plan for 2018.
The Vigilance Plan also covers the activities of suppliers of goods and services with which TOTAL S.A. and its Subsidiaries have an established commercial relationship, where such activities are associated with that relationship (hereafter referred to as the "Suppliers"). In accordance with legal provisions, suppliers with which the Group does not have an established commercial relationship do not fall within the scope of the Plan.
The Vigilance Plan sets out the rules and measures which, as part of risk management systems, enable the Group to identify and prevent actual or potential severe impacts related to its Activities and to mitigate their effects thereof, as the case may be. It does not guarantee that the risks identified will not materialize. It reflects the responsible purchasing principles applicable to relationships with Suppliers, but is not aimed at replacing the measures in place at those Suppliers.
Finally, the Vigilance Plan covers the risks set forth under Article L. 225-102-4 of the French Commercial Code.
3.5.1.3 Dialogue with stakeholders
TOTAL sets up dialogue procedures with its stakeholders at every level of its organization.
In accordance with the Group’s framework on societal matters, stakeholders are identified, mapped and prioritized according to their levels of expectations and involvement. This mapping is kept up to date. A structured dialogue with the stakeholders is established and maintained, initially at local level but also at the central level.
At the local level, TOTAL has deployed since 2006 its internal Stakeholder Relationship Management (SRM+) methodology. This approach aims to list the main stakeholders of each Subsidiary and site (depots, refineries, etc.), to categorize them, to schedule consultation meetings to better understand their expectations, concerns and opinions. This approach then permits to define action plans to manage the impacts of activities and to take into account local development needs in order to build a long-term trusting relationship. This mechanism is used to explain the Group’s Activities to communities and other stakeholders, and to pay particular attention to potentially vulnerable local populations. It has been integrated in almost all the Subsidiaries. The system is supplemented by a network of mediators with local communities, deployed within the Exploration & Production segment to maintain a constructive dialogue with neighboring communities.
At the central level, the relevant departments of the Holding also ensure that dialogue is maintained with the Group’s stakeholders. For example, in 2018 upon publication of the Information Document on Human Rights, the Human Rights Department of the Civil Society Engagement Division consulted certain of its stakeholders on the risk map published in the 2017 Vigilance Plan. This consultation led to the conclusion that the mapping could thus be maintained.
Among these numerous stakeholders, TOTAL maintains regular dialogue with the Group’s employees and their representatives who have a privileged position and role.
3.5.2 Severe impact risk mapping
The mapping work presented below was carried out using the Group’s existing risk management tools. This work was supplemented with regard to Suppliers by a mapping of the risks related to procurement, by category of goods and services, on the basis of questionnaires completed by the managers of each purchasing category.
3.5.2.1 Human rights and fundamental freedoms
The risks of severe impacts on human rights and fundamental freedoms have been identified in accordance with the criteria set out in the UN Guiding Principles Reporting Framework, namely the scale, scope and remediability of the impact.
This identification work was carried out in 2016 in consultation with internal and external stakeholders. The process included in particular workshops with representatives of key functions within the Group and Subsidiaries operating in sensitive contexts or situations particularly exposed to risks related to human rights and fundamental freedoms, and a series of interviews with independent third parties (GoodCorporation, International Alert and Collaborative Learning Project).
As a result, the following risks of severe negative impacts on human rights and fundamental freedoms were identified:
-forced labor, which corresponds to any work or service which people are forced to do against their will, under threat of punishment; as well as child labor, which is prohibited for any person aged under 15, or under 18 for all types of work deemed hazardous in accordance with International Labour Organization standards;
-discrimination, characterized by unfair or unfavorable treatment of people, particularly due to their origin, sex, age, disability, sexual and gender orientation, or membership of a political or religious group, trade union or minority;
-non-compliance with fair and safe working conditions, such as for example the absence of employment contracts, excessive working hours or lack of decent compensation;
-restriction of access to land by neighboring local communities, resulting from the Group having, for some of its projects, temporary or permanent access to the land that might result in the physical and/or economic displacement and relocation of these groups;
-impacts on the right to health of local communities, such as noise and dust emissions and other impacts generated by the Activities that might have consequences for the health of local communities, their means of subsistence and their access to vital services such as drinking water, for example; and
-the risk of disproportionate use of force, when intervention by government security forces or private security companies might be necessary to protect the Group’s staff and facilities.
3.5.2.2 Safety, health and environment
The Group defines the risk of a severe impact on safety, health or the environment as the probability of TOTAL’s Activities having a direct and significant impact on the health or safety of employees of Group companies, employees of external contractors (1) and third parties, or on sensitive natural environments (2). This risk can materialize gradually or suddenly.
TOTAL has developed safety, health and environment risk assessment procedures and tools applicable to operate its Activities, such as analyses performed regularly at various levels (Group, activities and/or industrial sites):
-prior to investment decisions in industrial projects of the Group, acquisition and divestment decisions;
-during operations;
-prior to releasing new substances on the market.
These analyses have highlighted the following risks of severe impacts:
-the risks to the safety of people and to the environment resulting from a major industrial accident (on an offshore site, onshore site or during the transport of products). These risks are, for example, an explosion, fire or leakage, resulting in death or injury and/or accidental pollution on a large scale or at an environmentally sensitive site;
-the risks to the safety of people and to the environment related to the physical characteristics of oil and gas fields, particularly during drilling operations, which can cause blow outs, explosions, fires or other damages;
-the risks to the safety of people and to the environment related to the overall life cycle of the products manufactured, and to the substances and raw materials used; and
-the risks associated with transportation, for which the likelihood of an operational accident depends not only on the hazardous nature of the products handled, but also on the volumes, the length of the journey and the sensitivity of the regions through which they are transported (quality of infrastructure, population density, environment).
Climate change is a global risk for the planet and results from various human actions such as energy production and consumption. As an energy producer, TOTAL seeks to reduce its direct greenhouse gas emissions resulting from its operated Activities. In addition, TOTAL implements a strategy to tackle climate change challenges and reports on this in details, notably in its statement of non-financial performance (refer to point 5.6 of chapter 5), in accordance with Article L. 225-102-1 of the French Commercial Code.
3.5.3 Action Principles
The Group has frameworks that set out the Action principles to be followed in order to respect the Group’s values and prevent severe impacts on human rights and fundamental freedoms, human health and safety and the environment (the "Action Principles"). When the legal provisions applicable to the Activities provide less protection than the Group’s Action Principles, TOTAL strives under all circumstances to give precedence to the latter, while seeking to ensure that it does not infringe any applicable mandatory public policy.
(1) Refer to the definition in point 5.4.1 of chapter 5.
(2) Sensitive natural environments include, in particular, remarkable or highly vulnerable natural areas, such as the Arctic, and/or areas covered by regulatory protection (integral nature reserves, central park areas, biotope orders in France, etc.), as well as areas covered by significant regulatory protection such as Protected Area Categories I to IV as defined by the International Union for Conservation of Nature (IUCN).
3.5.3.1 Code of Conduct
TOTAL’s Vigilance Plan is based primarily on the Group’s Code of Conduct (1), which specifies the Group’s values, including the two core values of Safety and Respect for the Other, particularly declining in the areas of respect for human rights, the environment and the health and safety of persons.
The Code particularly sets forth the Group’s compliance with the following international standards:
-the principles of the Universal Declaration of Human Rights;
-the United Nations Guiding Principles on Business & Human Rights;
-the principles set out in the International Labour Organization’s fundamental conventions;
-the principles of the United Nations Global Compact;
-the OECD Guidelines for Multinational Enterprises; and
-the Voluntary Principles on Security and Human Rights.
The Code of Conduct, which can be consulted on the Group’s website, is aimed at all employees and external stakeholders (host countries, local communities, customers, suppliers, industrial and commercial partners and shareholders). It was updated in December 2018.
3.5.3.2 Safety Health Environment Quality Charter
The Group ensures that it complies with strict safety, security, health and environment standards in the performance of its Activities. The Safety Health Environment Quality Charter sets out the principles that apply to the conduct of its operations in all of the countries where it operates.
As such, the Group’s Subsidiaries (2) implement a framework incorporating occupational health and safety, security, societal commitment and environment as well as associated management systems (Management And Expectations Standards Towards Robust Operations, MAESTRO).
With regard to safety at work, the Golden Rules, which were established on the basis of feedback and restructured in 2017 into a set of "dos and don’ts", apply to all Group entities, employees and Suppliers on site. Each individual must ensure that they are adopted, strictly followed and monitored on the ground. Each individual is also authorized to use his or her "Stop Card" and stop any work under way in particular in the case of non-compliance with any of these rules.
3.5.3.3 Fundamental Principles of Purchasing
The relationship between the Group and its Suppliers is based on adherence to the principles set forth in the Code of Conduct and in the Fundamental Principles of Purchasing (3).
The Fundamental Principles of Purchasing specify the commitments that TOTAL expects from its suppliers in the following areas: respect for human rights at work, health protection, safety and security, preservation of the environment, prevention of corruption and conflicts of interest and fraud, respect for competition law, as well as the promotion of economic and social development.
The requirements specified by this document must be communicated to Suppliers and be included in or transposed into agreements. These principles are available for consultation by all suppliers in both French and English on TOTAL’s website.
3.5.3.4 Internal control framework
At the Group, business segment and Subsidiary level, internal controls are based on specific procedures for organization, delegation of responsibilities and staff awareness and training, based on the framework of the Committee of Sponsoring Organizations of the Treadway Commission (COSO).
TOTAL has a Group reference framework that is supplemented by a series of practical recommendations and feedback. Like the Group’s organization, this framework has a three-level structure: a Group level, with the REFLEX Group framework and the technical framework set out by the Group Technology Committee, frameworks for each business segment, and a specific framework for each significant operational entity.
3.5.4 Organization
The Group’s organization is structured around three main levels: Corporate, business segments and operational entities. The Action Principles are driven by the Executive Committee. The People and Social Responsibility Division headed by a member of the Executive Committee coordinates the Group’s action in the area of Human Resources, health - safety - environment (HSE), security and societal commitments. Purchases of goods and services are under the authority of an entity in the Total Global Services Branch which also reports to the Executive Committee member responsible for this division. This organization aims to support operational managers in the implementation of the Action Principles. Each level is involved in and accountable for identifying and implementing the reasonable vigilance measures deemed appropriate.
3.5.4.1 Ethics Committee
The Ethics Committee is a central structure representing all of the Group’s business segments. All its members are Group employees who collectively have good knowledge of its activities and have demonstrated the independence and impartiality necessary for carrying out their duties.
The Ethics Committee is the guarantor of compliance with the Code of Conduct and ensures its proper implementation. It is assisted in its work by the relevant departments, as well as by a network of local Ethics Officers. The Chairperson of the Ethics Committee reports to the Chairman and Chief Executive Officer of TOTAL. The Chairperson submits an annual report to the Executive Committee and the Governance and Ethics Committee of the Board of Directors.
Employees and stakeholders can refer any breach of the Code of Conduct to the Ethics Committee at any time, in accordance with the procedure described in point 3.5.7. The members of the Ethics Committee are subject to a confidentiality obligation.
3.5.4.2 Human Rights Committee and Department
The Human Rights Committee is made up of representatives from different departments (safety, purchasing and societal commitment in particular) and business segments. It meets several times a year and coordinates actions relating to human rights and fundamental freedoms led by the various business segments and Subsidiaries, in line with the Human Rights roadmap approved by the Executive Committee.
(1) SunPower, a company listed on the NASDAQ in the United States and in which TOTAL has a majority interest, has a Code of professional conduct specific to the company that sets forth its values and the ethical principles with which all employees, as well as suppliers and partners, must comply. It covers subjects relating to compliance, integrity and protection of the company’s assets, as well as certain issues relating to human rights, fundamental freedoms, human health and safety and environment.
(2) Hutchinson and SunPower have developed HSE management systems specific to their activities and organization (for example, The Environmental Health Safety & Quality Management System).
(3) Saft Groupe and SunPower have defined fundamental principles of purchasing specific to their activities (for example, SunPower Supplier Sustainability Guidelines).
The Human Rights Department, within the Civil Society Engagement Division, supports the Group’s operational managers with its expertise in implementing the Action Principles relating to human rights and fundamental freedoms.
3.5.4.3 Occupational Health, Safety and Environment Division
Since 2016, a single HSE Division combines the Group’s Occupational Health, Safety and Environment functions. Its role is to implement a strong and unified HSE model.
Within the division, the HSE Departments of the Exploration & Production, Gas, Renewables & Power, Refining & Chemicals and Marketing & Services segments are in particular responsible for supporting the implementation of the Group’s HSE policy. Specific expert units set up in 2016 cover the following areas: major risks, human and organizational factors, environmental and societal issues, transportation and storage, crisis management and pollution prevention, standards and legislation, audits and feedback.
3.5.4.4 Procurement
Since January 1, 2017, a dedicated subsidiary, Total Global Procurement centralizes management of a large part of the Group’s goods and services purchasing (1), whether for categories of products or services specific to one business activity or categories shared between several business activities. In the Subsidiaries, purchasers implement framework agreements as well as manage local procurement.
A Responsible Purchasing Committee meets at least once a year and brings together the Management Committee of Total Global Procurement and the Civil Society Engagement (including the Human Rights Department), HSE and Legal Divisions as well as the Ethics Committee in order to monitor implementation of the Group’s Responsible Purchasing roadmap. The roadmap sets out the strategic direction of the Responsible Purchasing working group.
Furthermore, the Vetting department of Trading & Shipping defines and applies the selection criteria for the tankers and barges used to transport the Group’s liquid petroleum or chemical products and gas products, in order to ascertain their technical qualities relative to the best international standards, the crews’ experience and the quality of the ship owners’ technical management.
3.5.5 Assessment procedures
The Group has set up procedures for assessing its Subsidiaries and Suppliers, particularly in conjunction with independent bodies, which help identify and prevent risks of severe impacts on human rights and fundamental freedoms, human health and safety.
3.5.5.1 Procedures for assessing Subsidiaries
HSE assessments
The Audit and Feedback Unit within the central HSE Division is a key component of HSE governance. It steers the internal control mechanisms intended to verify compliance with the Group’s HSE requirements.
This mechanism is organized around a self-assessment to be carried out by the Subsidiaries at least every two years and an assessment every three to five years conducted by the Audit unit and feedback based on an audit protocol. The objective is to identify potential gaps in the application of the rules by the Subsidiairies and to enable them to define and implement improvement actions.
This unit is also in charge of analysis of major incidents and management of feedback.
Additionally, the Management Committee of each of the Group’s business segments performs monitoring of its major risk analyses and of the progress of the associated action plans.
Lastly, the HSE Division steers the measurement and reporting work relating to greenhouse gas emissions resulting from the Activities. These direct greenhouse gas measurements (Scope 1) are published in section 3.5.9.2 of this Chapter.
Assessments regarding human rights and fundamental freedoms
Since 2002, the Group has engaged GoodCorporation, a company specialized in ethical assessments, to verify the proper application of the principles set out in the Code of Conduct at the Subsidiary level. These assessments include criteria relating to human rights and fundamental freedoms, and corruption. As part of the process, a selection of employees and external stakeholders of the Subsidiary are questioned to understand how their Activities are perceived locally. Following the assessment, the Subsidiary in question defines and implements an action plan and a monitoring procedure.
Furthermore, TOTAL works with the Danish Institute for Human Rights (DIHR), an independent national body for the defense and promotion of human rights and fundamental freedoms, which assesses the impact on human rights and fundamental freedoms of the Group’s activities in sensitive contexts.
In some cases, the Group works with independent experts such as CDA, a company specialized in preventing and managing conflict between businesses and local communities. The reports by CDA are published online on its website.
Lastly, an annual self-assessment questionnaire enables each of the Group’s Subsidiaries and operational entities to measure and evaluate the level of implementation of their societal governance on the field. Actions involving dialogue, impact management and the contribution to socioeconomic and cultural development are recorded and analyzed.
3.5.5.2 Procedures for assessing Suppliers
The Supplier qualification process was harmonized at Group level in 2017 by Total Global Procurement. A new internal framework was published in 2018. In particular, it was used to set up a new IT qualification tool to be deployed progressively within the Group which also will serve as a consolidated database. The framework covers human rights, environment, health and safety.
Depending on the results of a risk analysis carried out by Suppliers, a detailed assessment is performed. It includes questionnaires addressing the aforementioned issues and, if needed, an action plan, a technical inspection of the site by employees or an audit of working conditions carried out by a specialist service provider with which a framework agreement was signed in 2016. Crude oil and petroleum product purchasing by Trading & Shipping, gas and electricity purchasing by the subsidiary Total Gas & Power Ltd, and the purchases made by the Subsidiaries Hutchinson, Saft Groupe and SunPower are subject to Supplier qualification processes specific to their organizations.
This qualification process may be completed if needed by specific organizations, such as the unit put in place in the Group as from September 2018 for the selection of palm oil suppliers. This unit aims to ensure that palm oil purchases are made on the basis of sustainability certifications such as the ISCC EU certification.
(1) With the exception of purchases made by the Subsidiaries Hutchinson, Saft Groupe and SunPower. Total Global Procurement made purchases from over 100,000 suppliers worldwide in 2018.
This type of certification incorporates criteria relating to carbon footprint, anti-deforestation, good use of land and respect for human rights. In addition to this mandatory certification, suppliers must have signed the Fundamental principles of purchasing and be members of the Roundtable on Sustainable Palm Oil (RSPO).
As regards the chartering of tankers and barges, any operation that involves tankers or barges calling at a terminal operated by a Group Subsidiary, carrying shipments that belong to the Group or chartered by TOTAL must be approved in advance by the Vetting department. Responses are given on the basis of technical data and independently of any commercial considerations. The audits conducted with ship owners also permit the assessment of the quality of the technical management systems implemented by the operators, crew selection and training, as well as the support provided to vessels.
Through the annual inspections performed by inspectors representing the Group, TOTAL is actively involved in sharing inspection reports with other international oil and gas companies through the SIRE (ship inspection report) Program set up by the OCIMF (Oil Companies International Marine Forum), thus contributing to the continuous improvement of petroleum shipping safety.
3.5.6 Awareness and training actions
3.5.6.1 Awareness and training of Group employees
The Group has put in place a variety of communication and information channels enabling all employees of TOTAL S.A. and its Subsidiaries to have access to the Action Principles defined by the Group in relation to human rights and fundamental freedoms, health, safety and the environment.
The Code of Conduct is distributed to all employees and can be consulted on the Group’s website. All new employees must confirm that they are familiar with it.
Events such as the annual Business Ethics Day are used to raise awareness among employees of TOTAL S.A. and its Subsidiaries. Practical guides are available on the Group’s intranet, such as the Human Rights Guide and the Guide to dealing with religious questions within the Group, to help Group employees apply the commitments provided for in the Code of Conduct in each individual cases.
The HSE Division organizes the Group’s World Safety Day, which aims to bring teams on board and raise awareness of ways to put the HSE Action Principles into practice. The Group’s employees implement its safety culture on a day-to-day basis through "Safety Moments" at the beginning of meetings or before hazardous operations, consisting of a short discussion to reiterate the key safety messages and align participants with mutual commitments.
Training courses, incorporating on-line educational programs as well as technical training tailored to the various business segments, are offered to all Group employees.
Dedicated human rights and fundamental freedoms training programs have been set up for senior executives, site directors and the employees most exposed to these issues. Awareness-raising sessions on these subjects are organised regularly for employees, as is the case at the time of ethical assessments of Subsidiaries. In the field of procurement, training modules explaining the Group’s ethical commitments and the Fundamental Principles of Purchasing have also been developed for the Group’s purchasers.
Similarly, training programs in the fields of health, safety and environment have been rolled out within the Group reflecting different perspectives: general, by type of activities or by subject areas. For example, the following general training actions exist depending on the level of responsibility and experience in the Group: HSE Leadership for Group senior executives, HSE training for managers, and Safety Pass training for new recruits.
3.5.6.2 Awareness and training of Suppliers
The Fundamental Principles of Purchasing are brought to the attention of Suppliers as of their registration in the Supplier database.
Training initiatives are also undertaken with the Group’s Suppliers, such as the responsible security training given to safety service providers’ personnel, and the Safety Contract Owners program, which brings together more than 650 suppliers at the Group level.
3.5.6.3 Information on product risks
All of the chemical and petroleum products marketed by the Group are covered by a safety data sheet prepared in accordance with applicable regulations. The packaged products are labelled accordingly.
Each safety data sheet provides comprehensive information on the substances or mixtures usable in the regulatory framework of managing chemicals in the workplace. It enables users to identify the risks linked to handling such products, particularly regarding safety and the environment, in order to implement any measures necessary to protect people and the environment.
Safety data sheets are available to carriers of dangerous goods, emergency services, poison control centers, as well as professional and industrial customers. Consumers are informed of the risks and precautions of use through product labelling.
3.5.7 Whistleblowing mechanisms
To support employees on a day-to-day basis, the Group encourages a climate of dialogue and trust that enables individuals to express their opinions and concerns. Employees can thus go to their line manager, an HR or other manager, their Compliance Officer or their Ethics Officer.
The Group’s employees and Suppliers, as well as any other external stakeholder, can contact the Ethics Committee to ask questions or report any incident where there is a risk of non-compliance with the Code of Conduct using the generic email address (ethics@total.com). The system is supplemented by specific whistleblowing mechanisms implemented at certain subsidiaries (SunPower, Hutchinson).
The Group’s Suppliers can also contact the internal supplier mediator using a generic email address (mediation.fournisseurs@total.com). The mediator is available to Suppliers and purchasers, and restores dialogue to find solutions when measures taken with the usual contact have been unsuccessful.
Grievance handling procedures are also in place within the Group in order to receive and facilitate the resolution of concerns and grievances of local communities that may be affected by its Activities.
As regards HSE, an on-call system has been set upto alert the directors of the business segments and of the Group as quickly as possible in the case of a major incident. Depending on the incident, a crisis management and monitoring process is pt in place (refer to point 3.3.3.1).
3.5.8 Monitoring procedures
To ensure the continuous updating of the Vigilance Plan, TOTAL relies on existing monitoring procedures and tools relating to human rights, safety, health and environment made available to the Subsidiaries.
Thus, the system of internal reporting and of indicators for monitoring implementation of the actions undertaken in the Group in these areas is based:
-for social indicators (including, in particular, health), on a guide entitled "Corporate Social Reporting Protocol and Methodology";
-for industrial safety indicators, on a Group rule concerning event and statistical reporting; a feedback analysis process identifies, in particular, events for which a structured analysis report is required in order to learn lessons in terms of design and operation; and
-for environmental indicators, on a Group reporting procedure, together with activity-specific instructions.
Consolidated objectives are defined for each key indicator and reviewed annually. The business segments apply these indicators as appropriate to their area of responsibility, analyze the results and set out a plan.
All of the procedures enable regular monitoring of actions and areas for improvement to be implemented in the area of human rights, safety, health and environment. The Group Performance Management Committee (refer to point 4.1.5.2 of chapter 4) is involved in this approach. In particular, it is responsible for examining, analyzing and steering the Group’s HSE, financial and operational results on a quarterly basis.
In addition, the committee responsible for monitoring the CSR Global Agreement signed by TOTAL in 2015, known as the "FAIR Committee", meets every year in the presence of representatives who are members of trade unions affiliated to the IndustriALL Global Union (refer to points 5.3.3.3 and 5.10.3 of Chapter 5) and appointed by this federation to monitor and implement the agreement. It identifies good practice and areas for improvement in the fields of safety, health, human rights and fundamental freedoms.
Additionally, the Group publishes a Human Rights information document that describes the Group’s Activities’ major impacts on human rights and fundamental freedoms and the remedial measures taken. In 2016, TOTAL became the first company in the oil industry to have published this document in accordance with the UN Guiding Principles Reporting Framework. It is available on the Group’s website and was updated in 2018.
Since 2015, TOTAL also publishes a report to assess the progress made in the implementation of the Voluntary Principles on Security and Human Rights. The information set out in the report is based on annual reporting organized by the Security Division that brings together the results of the risk and compliance analyses for each subsidiary operating in a sensitive context.
Lastly, in September 2018 TOTAL published the third edition of its "Integrating climate in our strategy" brochure dedicated to the consideration of climate issues and detailing the Group’s lines of action in this area.
3.5.9 Report on implementation of the Vigilance Plan (1)
3.5.9.1 Human rights and fundamental freedoms
TOTAL’s human rights approach is based on written commitments. It is supported by a dedicated organization, and embedded through an awareness-raising and training program, as well as evaluation and follow-up mechanisms aiming at measuring the effectiveness of the Group’s actions.
A) Human rights in the workplace
The prohibition of forced and child labor, non-discrimination, just and favorable conditions of work, as well as safety all form part of the principles set out in TOTAL’s Code of Conduct and Human Rights Guide.
TOTAL’s commitment to human rights in the workplace is demonstrated, in particular, by the signature of various agreements, such as the one concluded with IndustriALL Global Union (2) in 2015. In particular, this agreement covers the promotion of human rights in the workplace, diversity, the participation of employees and their representatives in social dialogue and the recognition of health and safety at work as absolute priorities in the Group’s activities and global supply chain.
In its activities
TOTAL cares about the working conditions of its employees which are governed by the Group’s Human Resources policy (refer to point 5.3 of chapter 5).
Safety is one of the Group’s core values. Over the last few years, the Group has continued to develop occupational health and safety standards focusing on the right to enjoy fair and adequate living and working conditions (refer to point 3.5.9.2 of this chapter).
TOTAL is committed to promoting diversity and endeavors to combat all forms of discrimination (origin, gender, sexual orientation, handicap, age, membership in a union or a political or religious organization, etc.). The Diversity Council, which is chaired by a member of the Executive Committee, illustrates this commitment.
In 2017, TOTAL published a "Practical guide to dealing with religious questions within the Group" in order to provide practical solutions to the questions raised by the Group’s employees and managers worldwide. It draws on the experiences of the business segments in various countries and encourages dialog, respect and listening as a way to find solutions suited to the local context. Many internal and external experts helped draft this document, including representatives of various religious communities. This guide has been translated into nine languages.
(1) Refer to point 5.11 of chapter 5 concerning the reporting ‘s scope and medology concerning information provided in point 3.5.9 of this chapter. Since the identification of risks and the prevention of severe impacts on human rights, human health and safety and the environment overlap partially with certain risks covered in the non-financial performance statement (refer to chapter 5), TOTAL has chosen to report on the implementation of its Vigilance Plan by incorporating certain aspects of its non-financial performance statement although it includes risks of varying degrees.
(2) International union federation representing more than 50 million employees in the energy, mining, manufacturing and industrial sectors in 140 countries.
In addition to the Group’s reporting and internal control system, the working conditions of TOTAL’s employees are evaluated by GoodCorporation, an independent third party, as part of the ethical assessments of the Group’s entities.
In the Group’s value chain
The Fundamental Principles of Purchasing (FPP) set out the commitments expected from suppliers in various domains, including human rights in the workplace and safety. A Group directive reaffirms the obligation to annex the FPP or to transpose them in the selection process as well as in the contracts concluded with suppliers of goods or services.
The prevention of forced and child labor in the supply chain is a critical point of attention identified in the 2017-2018 human rights roadmap endorsed by the Executive Committee. TOTAL has therefore developed a new methodology for selecting its suppliers which takes account the risks of human rights violations, in particular forced and child labor. In September 2016, TOTAL also entered into a partnership with a third-party service provider in charge of evaluating suppliers’ practices with regard to fundamental rights in the workplace (refer to point 3.5.9.5 of this chapter).
Finally, the working conditions of the employees of service stations’ dealers are evaluated by GoodCorporation, an independent third party, as part of the ethical assessments conducted in the Group entities. Between 2016 and 2017, a baseline study of 22 affiliates in the Marketing & Services segment across different continents was also conducted. One of the main recommendations identified is to improve service station dealers’ awareness of the Group’s Code of Conduct principles and of the fundamental Conventions of the International Labor Organization. In response, Marketing & Services is developing educational tools, which should be promoted in 2019 to this business segment’s entities.
B) Human rights and local communities
TOTAL’s operational activities may have impacts on the rights of local communities, in particular when TOTAL obtains temporary or permanent access to their land for Group’s projects that may involve the physical and/or economic displacement of these populations. Noise and dust emissions and other potential impacts may also have consequences on the livelihood of neighboring communities. Consequently, the access to land of local communities and their right to health and an adequate standard of living are two salient issues for TOTAL.
In accordance with internationally recognized human rights standards, TOTAL requires the Group entities to maintain a regular dialogue with their stakeholders and make sure that their activities have no negative consequences on local communities or, if these cannot be avoided, that they limit, mitigate and remedy them. The solutions proposed in response to the expectations of local communities are coordinated by the societal teams that work in close collaboration with the legal, safety and environmental teams. The Group’s approach to this topic is described in the section on societal issues of the non-financial performance Statement in point 5.9 of chapter 5.
C) Respect for human rights in security-related activities
In certain situations, intervention by government security forces or private security providers might be necessary to protect TOTAL staff and assets. In order to prevent any misuse of force, TOTAL asks Group employees, private security providers and government security forces to implement the Voluntary Principles on Security and Human Rights (VPSHR) issued by States, NGOs and Extractive Companies.
TOTAL has been a member of this initiative since 2012. Within this framework, the Group publishes an annual report setting out the challenges, lessons learned and good practices in relation to security and human rights and, if applicable, reports any incidents associated with the Group’s activities. This report is available at sustainable-performance.total.com.
Self-assessment and risk analysis tools have been developed and are deployed, in particular, in the entities located in high risk countries and conflict zones.
When government security forces are deployed to ensure the protection of the Group’s staff and assets, the Group entities maintain an ongoing dialogue with the representatives of national or regional authorities in order to raise their awareness on the need to respect the VPSHR and encourage them to sign memorandums of understanding that comply with these principles.
TOTAL regularly organizes training sessions and awareness-raising activities on the risk of misuse of force, and more generally on the VPSHR, for its staff, private security providers and government security forces. In 2018, TOTAL partnered with other Extractive Companies and the Myanmar Center for Responsible Business to organize two VPSHR awareness workshops for government officials, private security providers and NGO in Myanmar.
3.5.9.2 Personal health and safety
TOTAL places safety at the heart of its ambition to be a responsible company. The measures and indicators used to manage the Group’s activities are based on this fundamental value, in accordance with the strictest standards, particularly relating to health.
A) Preventing occupational accidents
The Group’s personal safety policy covers three main areas: preventing occupational accidents, preventing transport accidents, and preventing accidents linked to technological risks, such as fires and explosions. It relates to all employees of Group subsidiaries, employees of external contractors working on these entities’ sites as well as employees of transport companies under long-term contracts. The safety results are monitored with the same vigilance for all.
Indicators defined according to an internal procedure measure the main results. In addition to its aim of zero fatalities in the exercise of its activities, the Group has set the target of continuously reducing the TRIR (1) and, for 2018, of keeping it below 0.9 for all personnel (Group and External Contractors).
(1) TRIR: Total Recordable Injury Rate.
Safety indicators | 2018 | 2017 | 2016 |
TRIR (a): number of recorded injuries per million hours worked - All Personnel | 0.91 | 0.88 | 0.91 |
Group company employees | 0.82 | 0.89 | 0.83 |
External contractors employees (b) | 1.01 | 0.88 | 0.99 |
LTIR (c): number of lost time injuries per million hours worked - All Personnel | 0.59 | 0.58 | 0.51 |
SIR (d): average number of days lost per lost time injury | 26 | 28 (e) | 30 (e) |
Number of occupational fatalities | 4 | 1 | 1 |
(a) TRIR: Total Recordable Injury Rate.
(b) As defined in point 5.11.4 of chapter 5.
(c) LTIR: Lost Time Injury Rate.
(d) SIR: Severity Injury Rate.
(e) Excluding Saft Groupe.
The Group’s safety efforts over more than 10 years have resulted in a significant improvement in the TRIR and LTIR. Performance has stabilized since 2016, mainly due to acquisitions and disposals of assets or subsidiaries. The gradual implementation of the One MAESTRO framework aims to strengthen the Group’s safety culture and create a new drive to improve safety results. Despite the measures put in place, in 2018 three accidents resulted in the death of four employees working for external contractors: one during road transport in Ethiopia, one during a handling operation in the Republic of the Congo, and two during an operation to recommission a fuel storage tank in Egypt.
Generally, an analysis is launched in response to any type of accident whatsoever. The method and scope of the analysis depend on the actual or potential severity of the event. Consequently, a near miss with a high severity potential is treated as a severe accident, and its analysis is considered an essential factor of progress. Depending on its relevance to the other Group entities, it triggers a safety alert and the distribution of a feedback form, depending on the circumstances.
Regarding occupational safety, since 2010, the basic rules to be scrupulously followed by all personnel, employees and contractors alike, in all of the Group’s businesses worldwide, are described in the document "Safety at Work: TOTAL’s Twelve Golden Rules", which has been widely circulated within the Group.
The aim of the Golden Rules is to set out simple, easy-to-remember rules that cover a large number of occupational accidents. In addition, further rules can be found in the One MAESTRO HSE framework, the business segment frameworks and the subsidiary frameworks.
According to the Group’s internal statistics, in more than 44% of severe incidents or near misses with high severity potential in the workplace, at least one of the Golden Rules had not been followed. The proper application of these Golden Rules, and more generally of all occupational safety procedures, is verified through site visits and internal audits. The Stop Card system, which was set up in 2015, also enables any employee of the Group or an external contractor to intervene if any of the Golden Rules is not being followed. In addition, in 2016, the HSE department created a unit bringing together the reference persons on high-risk operations (work at height, lifting, high-pressure cleaning, excavations, etc.) in order to consolidate in-house knowledge and relations with contractors.
The reporting of anomalies and near misses (approximately 600,000 per year) is strongly encouraged on a daily basis and is permanently monitored. The ability of each employee to identify anomalies or dangerous situations is one of the measures of the employees’ involvement and vigilance in accident prevention and reflects the safety culture within the Group. In 2016, the Group HSE Department also created a unit aimed at providing support for sites to improve their safety culture upon their request.
Regarding road transport, for many years the Group has been monitoring the number of severe road accidents involving its employees and those of external contractors. The actions taken have reduced the number of severe accidents between 2016 and 2018 by 33%. Work began in new areas in 2018, particularly relating to the use of new technologies in accident prevention (defining a new standard for the light vehicles used, driver fatigue detection) and the assessment of the driver support and assistance systems offered by manufacturers (automatic emergency braking, lane keeping assist, lane change assist, etc.).
Number of severe road accidents (a) | 2018 | 2017 | 2016 |
Light vehicles and public transport (b) | 7 | 11 | 9 |
Heavy goods vehicles (b) | 23 | 26 | 36 |
(a) Overturned vehicle or other accident resulting in the injury of a crew member (declared incident).
(b) Vehicles on long-term contract with the Group ( > 6 months).
With regard to technological risks (also known as "major" industrial risks), the risk analysis and prevention actions are described in point 3.5.9.3.B of this chapter.
Whatever the nature of the accident, prevention actions rely on all employees abiding by the Group’s safety policies. These are disseminated through training courses aimed at the various groups of employees (new arrivals, managers, senior executives, etc.).
As TOTAL’s core value, Safety has been a component of the Group’s employee compensation policy since 2011. A portion of the variable compensation received by employees, as well as by senior executives and the Chairman and Chief Executive Officer, depends on the achievement of HSE targets (refer to point 4.3.2 of chapter 4 and point 5.3.1 of chapter 5).
With regard to security, the Group has put in place means to analyze threats and assess risks in order to take preventive measures to limit its exposure to security risks in the countries where it operates.
B) Preventing occupational health risks through improved assessment
With regard to prevention of occupational health risks, the Group implements a policy that defines the risk assessment methodology to be applied by all Group entities and subsidiaries. The associated Group directive stipulates that the assessment includes chemical, physical, biological, ergonomic and psychosocial risks, and that it must result in the design and roll-out of an action plan. In addition, it requires that each Group entity sets out a formal medical monitoring procedure taking into account the requirements under local law (frequency, type of examination, etc.) and the level of exposure of its personnel to the various risks.
To complement this program, the Group has set up an employee health observatory. The aim is to monitor the health of a sample of employees in order to identify the emergence of certain illnesses and, if applicable, suggest appropriate preventive measures. The data is gathered anonymously during medical examinations and covers approximately 12% of Group employees worldwide.
The Group also has a Medical Advisory Committee that meets regularly to discuss key health issues relating to the Group’s activities. It decides whether there is a need for additional health protection strategies to be implemented. It consists of external scientific experts and also brings together the Group’s senior executives and stakeholders concerned by these issues.
In terms of prevention, the Group has decided to make psychosocial risk prevention a priority commitment. In 2018, the Group identified four areas of progress worldwide:
-a minimum level of awareness and training for all;
-a system for measuring stress and the quality of the social climate, facilitating the production of action plans;
-a system for listening to and supporting employees in difficult situations;
-coordination of actions and monitoring of indicators.
A Quality of Life at Work and Health working group was set up in September 2018 to coordinate and ensure the effectiveness of all of the actions taken. Led by the Group Human Resources division, all of TOTAL’s business segments are represented, particularly the international medical department. Its first task is to create and roll out a Worldwide Psychosocial Risk (PSR) Prevention program that addresses the four areas for progress.
Regarding the priority commitment to training, a fully updated PSR pack aimed at entity managers, prevention contributors and managers was finalized in 2018. Approved by international experts, it has now been translated into 11 languages and is the core material for training on this subject. The pack consists of two guides: a methodological guide for entity managers and anyone with a role in PSR prevention, and a practical guide for managers to raise awareness of the importance of the quality of life at work as a key factor in preventing PSRs. It also aims to support them in the day-to-day management of their teams in the event of difficulties, risky situations and crisis situations.
On a broader level, TOTAL is helping to promote individual and collective health programs in the countries where it operates, including vaccination campaigns and screening programs for certain diseases (AIDS, cancer, malaria, etc.) for employees, their families and local communities. Action is also taken regularly to raise awareness of lifestyle risks (anti-smoking and anti-drinking campaigns, etc.).
The Group has put in place the following indicators to monitor the performance of its program:
Health indicators (WHRS scope) | 2018 | 2017 | 2016 |
Percentage of employees with specific occupational risks benefiting from regular medical monitoring (a) | 98% | 98% | 99% |
Number of occupational illnesses recorded in the year (in accordance with local regulations) | 154 | 143 | 108 |
(a) As an exception to the reporting principles described in section 5.11 of chapter 5, the 2018 rate does not include a company that did not report its data in time for the 2018 WHRS.
Reporting on occupational illnesses covers only the Group’s personnel (WHRS scope) and illnesses reported according to the regulations applicable in the country of operation of each entity.
Musculoskeletal disorders, the main cause of occupational illnesses in the Group, represented 69% of all recorded illnesses in 2018, against 68% in 2017. Therefore, in addition to ergonomic risk assessments and the gradual training of personnel on its sites, the annual Group Industrial Hygiene Day in December 2017 was on the theme of Ergonomics and Musculoskeletal disorders.
The annual Group Industrial Hygiene day held in September 2018 was dedicated to asbestos and refractory ceramic fibers.
C) Minimizing the risks throughout the life cycle of products to prevent consumer health and safety risks
Unless certain precautions are taken, some of the products marketed by TOTAL pose potential risks to the health and safety of consumers. The Group therefore aims to meet its obligations with regard to information and prevention in order to minimize the risks throughout the life cycle of its products.
TOTAL’s health and products directive sets out the minimum requirements to be observed by the Group’s entities and subsidiaries for marketing the Group’s products worldwide in order to reduce potential risks to consumer health and the environment. TOTAL identifies and assesses the risks inherent to its products and their use. The material safety data sheets (MSDS) that accompany the products marketed by the Group (in at least one of the languages used in the country) as well as product labels are two key sources of information. All new products comply with the regulatory requirements in the countries and markets for which they are intended.
3.5.9.3 Environment
TOTAL places the environment at the heart of its ambition of being a responsible company. In light of the specific nature of its activities, the Group’s operations pose risks for which TOTAL develops structured management systems.
Environmental indicators have been monitored for many years in order to constantly adapt the Group’s environmental protection measures, which are presented in this section.
A) General policy and environmental targets
TOTAL considers the respect for the environment to be a priority. All employees, at every level, must do their utmost to protect the environment as they go about their work. TOTAL strives to control its energy consumption, its emissions in natural environments (water, air, soil), its residual waste production, its use of natural resources and its impact on biodiversity. With regards to the environment, TOTAL takes a constructive approach that is based on transparency and dialogue when communicating with its stakeholders and third parties.
To this end, the HSE division and the HSE departments within the Group’s entities seek to ensure both applicable local regulations and internal requirements resulting from the Safety Health Environment Quality Charter and the Group’s additional commitments are respected. Group steering bodies, led by the HSE division, are tasked with:
-monitoring TOTAL’s environmental performance, which is reviewed annually by the Executive Committee, for which multi-annual improvement targets are set;
-handling, in conjunction with the business segments, the various environment-related subjects of which they are in charge; and
-promoting the internal standards to be applied by the Group’s operational entities.
The Group’s environmental targets (a): -decrease SO2 air emissions by 50% between 2010 and 2020; -maintain hydrocarbon content of water discharges below 30 mg/l for offshore sites and below 15 mg/l for onshore and coastal sites; -valorize more than 50% of the waste produced by the sites operated by the Group. Moreover, the Group is committed to: -systematically develop biodiversity action plans for production sites located in protected areas (1); -not conducting oil and gas exploration or production operations in the area of natural sites listed on the UNESCO World Heritage List (2); -not conducting exploration in oil fields under sea ice in the Arctic. (a) For climate, refer to point 3.5.9.4.D of this chapter. What has been accomplished: -more than 50% reduction in SO2 air emissions reached since 2017; -100% of the Group’s oil sites have met the target for the quality of onshore discharges since 2016 and 96% of the Group’s oil sites have met the target for the quality of offshore discharges in 2018; -more than 50% of the waste produced by the sites operated by the Group was valorized in 2018; -5 biodiversity action plans deployed or in preparation in 2018; -no oil and gas exploration or production activity in the area of natural sites listed on the UNESCO World Heritage List (2); -no exploration activity in oil fields under sea ice in the Arctic. |
The Group’s internal requirements state that the environmental management systems of its operated sites that are important for the environment (3) must be ISO 14001 certified within two years of start-up of operations or acquisition: 100% of these 71 sites were in conformity in 2018. Beyond these internal requirements, at the end of 2018, a total of 264 sites operated by the Group were ISO 14001 certified. In 2018, the Moho Nord site (Republic of the Congo) has been ISO 14001 certified.
All investment, divestment or acquisition projects which are submitted to the Executive Committee for approval are assessed and reviewed with regards to their risks and impact, particularly environmental, before the final investment decision is made.
TOTAL seeks to ensure that all employees share its environmental protection requirements. Employees receive training in the required skills. TOTAL also raises employee awareness through internal communication campaigns (e.g., in-house magazines, intranet, posters).
B) Preventing incident risks
To prevent incident risks and, in particular, major industrial events, TOTAL carries out periodic risk assessments and implements adapted risk-management policies and measures.
The Group has management structures and systems that present similar requirements and expectations across all the entities. TOTAL strives to minimize the potential impacts of its operations on people, the environment and property through a major technological risk management policy. This management draws on a shared approach in all segments that includes, on the one hand, risk identification and analysis, and on the other hand, the management of these risks.
This structured approach applies to all of the Group’s operated businesses exposed to these risks. In addition to its drilling and pipeline transport operations, the Group has at the end of 2018 195 sites and operating zones exposed to major technological risks, which could cause harm or damage to people, property and the environment, corresponding to:
-all the offshore and onshore operating activities in Exploration & Production; and
-the Seveso classified industrial sites (upper and lower threshold) and their equivalents outside the EU (excluding Exploration & Production).
This approach first sets out an analysis of the risks related to the Group’s industrial operations, on each site, based on incident scenarios for which the probability of occurrence and the severity of the consequences are assessed.
Second, based on these parameters, a prioritization matrix is used to determine whether further measures are needed in addition to compliance with the Group’s standards and local regulations. These mainly include preventive measures but can also include mitigation measures.
The management of major technological risks also hinges on:
-staff training and raising awareness;
-a coherent event reporting and indicators system;
-systematic, structured serious event analysis, particularly to learn lessons in terms of design and operation;
-regularly tested contingency plans and measures.
In terms of monitoring indicators, the Group reports the number of Tier 1 and Tier 2 events as defined by the API and the IOGP. The Group set itself a loss of primary containment target of under 100 (Tier 1 and Tier 2) in 2018.
The target is slightly exceeded due to the inclusion of new entities in the reporting scope. In addition to the 103 Tier 1 and Tier 2 operational events indicated in the table below, the Group recorded four Tier 1 events and one Tier 2 event due to sabotage or theft in 2018.
Loss of primary containment (a) | 2018 | 2017 (b) | 2016 (b) |
Loss of primary containment (Tier 1) | 30 | 28 | 38 |
Loss of primary containment (Tier 2) | 73 | 75 | 101 |
Loss of primary containment (Tier 1 and Tier 2) | 103 | 103 | 139 |
(a) Tier 1 and Tier 2: indicator of the number of loss of primary containment events, with more or less significant consequences, as defined by the API 754 (for downstream) and IOGP 456 (for upstream) standards. Excluding acts of sabotage and theft.
(b) Excluding TEP Barnett in 2016 and 2017.
In accordance with industry best practices, TOTAL also monitors accidental liquid hydrocarbon spills of more than one barrel. Spills that exceed a predetermined severity threshold (in terms of volume spilled, toxicity of the product in question or sensitivity of the natural environment affected) are reviewed on a monthly basis and annual statistics are sent to the Group Performance Management Committee. All large spills are followed by corrective actions aimed at returning the environment to an acceptable state as quickly as possible. Due to their unpredictable nature, there is no quantitative target for accidental hydrocarbon spills. Nevertheless, changes in the number of spills are observed and analyzed.
(1) Sites located in an IUCN I to IV or Ramsar convention protected area.
(2) Natural sites included on the UNESCO World Heritage List of December 31, 2017.
(3) Sites that emit more than 30kt CO2e per year.
Accidental hydrocarbon spills (a) | 2018 | 2017 (b) | 2016 |
Number of hydrocarbon spills | 74 | 62 | 73 |
Total volume of hydrocarbon spills (thousands of m³) | 0.3 | 0.5 | 0.9 |
(a) Accidental spills with an environmental impact and of more than one barrel.
(b) In 2017, the indicator perimeter was updated to exclude spills due to sabotage by a third party.
In order to manage a major accidental spill efficiently, the Group implemented a global crisis management system that is primarily based on a dedicated organization and a crisis management center at the head office to enable the management of two simultaneous crises. As part of this process, TOTAL regularly trains in crisis management on the basis of risk scenarios identified through analyses.
In particular, the Group has response plans and procedures in place in the event of a hydrocarbon leak or spill. For accidental spills that reach the water surface, oil spill contingency plans are regularly reviewed and tested during exercises. These plans are specific to each company or site and are adapted to their structure, activities and environment while complying with Group recommendations.
Oil spill preparedness | 2018 | 2017 | 2016 |
Number of sites whose risk analysis identified at least one risk of major accidental pollution to surface water (a) | 126 | 126 | 143 |
Proportion of those sites with an operational oil spill contingency plan | 99% | 91% | 99% |
Proportion of those sites that have performed at least one oil spill response exercise during the year | 86% (b) | 95% | 89% |
(a) The variation of the number of sites between 2016 and 2018 is due to perimeter variation.
(b) Decrease in 2018 compared to 2017 corresponds mainly to two subsidiaries where equipment was being refurbished in 2018.
In the event of accidental pollution, the Group companies can call on in-house human and material resources (Fast Oil Spill Team, FOST) and benefit from assistance agreements with the main third-party organizations specialized in the management of hydrocarbon spills.
Since 2014, subsea capping and subsea containment equipment that can be transported by air has been strategically positioned at different points of the world (South Africa, Brazil, Norway and Singapore) in order to provide solutions that are readily available in the event of oil or gas eruptions in deep offshore drilling operations. From these locations, the equipment can benefit TOTAL’s operations worldwide. This equipment was developed by a group of nine oil companies, including TOTAL, and is managed by Oil Spill Response Ltd (OSRL), a cooperative dedicated to the response to marine pollution by hydrocarbons. TOTAL has also designed and developed its own capping system ("Subsea Emergency Response System") to stop potential eruptions in drilling or production operations as quickly as possible. Since 2015, equipment has been installed in Angola, then the Republic of the Congo, potentially covering the entire Gulf of Guinea region.
For its sea and river shipment requirements, TOTAL only charters ships and barges that meet the highest international standards. The Group has an internal policy that lays down the process and criteria by which ships and barges are selected (known as vetting). These criteria are based, in particular, on the regulations, best practice and recommendations of the OCIMF (1) and, in Europe, on the European Barge Inspection Scheme (EBIS). Tankers and barges are vetted by a single centralized Group entity. The average age of the Group Shipping division’s time-chartered fleet is approximately six years.
With regard to operated marine terminals, the Group got involved in an initiative that seeks to systematically record their physical characteristics and store this data in a global database that forms part of the Marine Terminal Information System (MTIS) of the OCIMF. At the end of 2018, 95% of coastal marine terminals and 50% of offshore terminals had submitted their characteristics, thereby making it easier to assess the compatibility of ships with the ports of call. Additionally, since 2018, large TOTAL terminals have used the Marine Terminal Management Self Assessment (MTMSA), the framework recommended by the industry for the self-assessment of terminals and the continuous improvement of the safety of product transfers. A training course on ship/shore interface management (SSSCL - Ship Shore Safety Check List) and cargo transfer operations, developed by the Group in 2016, had completed by operators of 80% of operated-terminals by the end of 2018.
C) Limiting the environmental footprint
Wherever TOTAL conducts its business, it makes sure that it complies with applicable laws and regulations, which the Group complements with specific requirements and commitments when necessary. TOTAL implements an active policy of avoiding, reducing, managing and monitoring the environmental footprint of its operations. As part of this policy, emissions are identified and quantified by environment (water, air and soil) so that appropriate measures can be taken to better control them.
Water, air
The Group’s operations generate emissions into the atmosphere from combustion plants and the various conversion processes and discharges into wastewater. In addition to complying with applicable legislation, the Group’s companies actively pursue a policy aimed at reducing emissions. After analyses have been conducted and when necessary, the sites introduce various reduction systems that include organizational measures (such as using predictive models to control peaks in sulfur dioxide (SO2) emissions based on weather forecast data and the improvement of combustion processes management, etc.) and technical measures (wastewater treatment plants, using low-NOX burners and electrostatic scrubbers, etc.).
For new facilities developed by the Group, impact assessments are systematically carried out on these emissions and, if necessary, actions are taken to limit their impact.
In 2010, SO2 emissions were 99 kt. The Group set itself the target of not exceeding 49.5 kt by 2020; it has met this target since 2017.
Chronic emissions into the atmosphere (a) | 2018 | 2017 | 2016 |
SO2 emissions (kt) | 48 | 47 | 52 |
NOx emissions (kt) | 66 | 69 | 76 |
(a) Refer to point 5.11 of chapter 5 for the scope of reporting.
SO2 emissions that are likely to cause acid rain are regularly checked and reduced.
(1) OCIMF (Oil Companies International Marine Forum): An industry forum including the leading worldwide oil companies. This organization manages, in particular, the Ship Inspection Report (SIRE) Programme, which holds and provides access to tanker and river barge inspection reports (Barge inspection Questionnaire - BIQ).
NOX emissions, which are mainly concentrated in the Exploration & Production, are primarily located offshore and far away from the coast. Their impact on air quality is therefore considered to be minor.
Discharged water quality
In 2018, with regards to discharges to aquatic environments, all of the operated sites met the onshore discharge quality target set to restrict the impact on receiving environments.
2018 | 2017 | 2016 | |
Hydrocarbon content of offshore water discharges (in mg/l) | 14.1 | 17.7 | 17.2 |
% of sites that meet the target for the quality of offshore discharges (30 mg/l) | 96% (a) | 100% (a) | 100% (a) |
Hydrocarbon content of onshore water discharges (in mg/l) | 1.8 | 2.4 | 3.1 |
% of sites that meet the target for the quality of onshore discharges (15 mg/l) | 100% | 100% | 100% |
(a) Alwynn site (United Kingdom) excluded, as its produced water discharges only occur during the maintenance periods of the water reinjection system and are subject to a specific regulatory authorization.
In 2018, the percentage of sites conforming to the targets for quality of offshore discharges decreased due to a site acquired as part of the Mærsk Oil acquisition that exceeds the targets of the Group. The water discharge from this site is minor in terms of volume and represents less than 3% of the Group’s global offshore discharge.
The improvement in the quality of onshore water discharges in 2018 is linked to a better performance of the waste water treatment plants at Anvers, Donges and Normandie Refineries and to the expiry of the Mahakam license in Indonesia.
Soil
The risks of soil pollution related to TOTAL’s operations come mainly from accidental spills (refer to point 3.5.9.3.B of this chapter) and waste storage (refer to point 3.5.9.3.E of this chapter).
The Group’s approach to preventing and managing these types of pollution is based on four key principles:
-preventing leaks, by implementing, as far as possible, industry best practices in engineering, operations and transport;
-carrying out maintenance at appropriate frequency to minimize the risk of leaks;
-overall monitoring of the environment to identify any soil and groundwater pollution; and
-managing any pollution from previous activities by means of containment and reduction or elimination operations.
In addition, a Group directive defines the following minimum requirements:
-systematic identification of each site’s environmental and health impacts related to possible soil and groundwater contamination;
-assessment of soil and groundwater contamination based on various factors (extent of pollution inside or outside the site’s boundaries, nature and concentrations of pollutants, presence of a vector that could allow the pollution to migrate, use of the land and groundwater in and around the site); and
-management of health or environmental impacts identified based on the use of the site (current or future, if any) and the risk acceptability criteria recommended by the World Health Organization (WHO) and the Group.
Lastly, decommissioned Group facilities operated by Group entities or affiliates (i.e., chemical plants, service stations, mud pits or lagoons resulting from hydrocarbon extraction operations, wasteland on the site of decommissioned refinery units, etc.) impact the landscape and may, despite all the precautions taken, be sources of chronic or accidental pollution. TOTAL created a policy of evaluation, treatment of environmental risks related to soil and groundwater and remediation of its sites at the end of their activity. In agreement with the authorities, the aim is to allow new operations to be set up once the future use of the land has been determined. Remediation operations are conducted by specialized entities created by the Group. At the end of 2018, 123 industrial sites that were no longer in operation (excluding service stations) were in the process of remediation.
Sustainable use of resources
Fresh water
The Group’s activities, mainly those of Refining & Chemicals, and to a lesser extent those of the Exploration & Production, Gas, Renewables & Power segments, may potentially have an impact on, as well as be dependent of, water resources. This is especially true when an activity is located in a water resources sensitive environment.
Fully aware of these challenges, TOTAL implements the following water risk management actions:
1. monitor water withdrawals to identify priority sensitive sites and then carry out a risk assessment;
2. improve the water resources management depending on identified needs, by adapting the priority sites’ environmental management system.
In order to identify the priority facilities, TOTAL records the withdrawal and discharge of water on all of its sites and assesses these volumes on the basis of the current and future water stress indicators of the WRI (1) Aqueduct tool (currently 9.7% (2) of fresh water withdrawals take place in a global water stress area).
In addition, TOTAL assesses water resources risk levels of priority facilities which are those that withdraw more than 500,000 m³ per year and are located in areas potentially exposed to water resource risks, using the Local Water Tool (LWT) for Oil & Gas from the Global Environmental Management Initiative (GEMI). This tool also helps to guide the actions taken to mitigate any risks in order to make optimal use of water resources on these sites.
Globally, the sites operated by the Group are not particularly exposed to water risk. By the end of 2018, out of the 24 priority sites identified, the level of water risk was assessed on 16 priority Group sites (11 Refining & Chemicals, 3 Exploration & Production, 2 Gas, Renewables & Power). Following this assessment, two sites were identified as being at risk and were reported to the CDP. This analysis process is expected to be extended to other current priority sites, including eight additional sites that have been identified.
In 2018, the Group answered the CDP Water survey for the 2017 period and was graded A-. The main indicator used in this reporting is aggregated withdrawal.
Water-related indicator (a) | 2018 | 2017 | 2016 |
Fresh water withdrawals excluding cooling water and rain water (million m³) | 116 | 116 | 123 |
(a) Refer to point 5.11 of chapter 5 for the scope of reporting.
Soil
TOTAL uses the ground surface that it needs to safely conduct its industrial operations and, in 2018, did not make extensive use of ground surfaces that could substantially conflict with various natural ecosystems or agriculture.
(1) World Resources Institute.
(2) According to CDP Water 2018 definition.
In 2018, the Group introduced a specific selection process concerning palm oil suppliers to ensure all palm oil purchases for the La Mède facility will be certified sustainable in accordance with European Union criteria (ISCC EU certification) and are conducted with a limited number of suppliers.
D) Not to harm biodiversity and ecosystems during projects and operations
TOTAL’s activities may potentially be located in sensitive natural environments.
The Group is fully aware of this challenge and takes biodiversity and ecosystems into account during its projects and operations. In July 2018, and within the framework of the Act4Nature initiative, the Group made 16 biodiversity commitments to make this policy more tangible. The 16 commitments are described in the biodiversity brochure available on the website sustainable-performance.total.com. There are 10 general commitments common to all of the signatory companies and an additional 6 commitments specific to TOTAL, some of which existed before the initiative. These differentiate the Group from its competitors.
3.5.9.4 Climate
TOTAL’s ambition is to become the responsible energy major. The Group is committed to contributing to the United Nations Sustainable Development Goals, particularly with regards to those subjects that are connected to climate change and the development of more available and cleaner energy for as many people as possible.
In order to make an effective contribution to the climate change issue, TOTAL relies on an organization and structured governance framework to make sure climate-related challenges are fully integrated into the Group’s strategy. Consequently, the Group has a robust strategy and implements a structured risk management system.
In line with the multiple situations encountered in the field, and while supporting the Group’s governance bodies, the Strategy and Climate division shapes the Group’s approach to climate change while working with the operational divisions of the Group’s business segments. By monitoring indicators, progress can be measured and the Group’s actions can be adjusted.
A) Governance
TOTAL has an organization and structured governance framework to make sure climate-related challenges are fully integrated into the Group’s strategy. Since September 2016, its organization includes a Strategy-Innovation corporate division, which includes the Strategy & Climate division as well as the Gas, Renewables & Power business segment, whose President is a member of the Executive Committee.
Oversight by the Board of Directors
TOTAL’s Board of Directors ensures that climate-related issues are incorporated into the Group’s strategy and examines climate change risks and opportunities during the annual strategic outlook review of the Group’s business segments.
To carry out its work, the Board of Directors relies on its Strategic & CSR Committee, whose rules of procedure were changed in September 2017 then in July 2018 in order to broaden its missions in the realm of CSR and in questions relating to the inclusion of climate-related issues in the Group’s strategy.
Aware of the importance of climate-change challenges faced by the Group, the Board of Directors decided, in 2016, to introduce changes to the variable compensation of the Chairman and Chief Executive Officer to take better account of the achievements of Corporate Social Responsibility (CSR) and the Group’s HSE targets. For fiscal year 2018, the importance given to these criteria rose further: CSR performance is assessed by considering the extent to which climate issues are included in the Group’s strategy, the Group’s reputation in the domain of Corporate Social Responsibility as well as the policy concerning all aspects of diversity.
The Board of Directors meeting of March 13, 2019 decided to change the criteria for the determination of the variable portion of the Chairman and Chief Executive Officer’s compensation for the year 2019. Among others, a quantifiable criteria related to the evolution of GHG emissions (Scopes 1 & 2) on operated oil & gas facilities (refer to chapter 4, section 4.3.2 for details).
Role of management
TOTAL’s Chairman and Chief Executive Officer, in compliance with the long-term strategic direction set by the Board of Directors, implements the strategy of the Group and its business segments while making sure climate change challenges are taken into account. He relies on the President, Group Strategy-Innovation, who is a member of the Executive Committee, to whom the Senior Vice President Strategy & Climate, and the Senior Vice President Climate report (refer to the Group organization chart in chapter 1). The Senior Vice President Climate chairs the Climate-Energy steering Committee, which mainly includes representatives of Strategy and HSE management from the various business segments. The mission of this Committee consists of structuring the Group’s approach to the climate.
B) Strategy
Identification of climate-related risks and opportunities
The identification of climate-related risks forms an integral part of the analysis of investment projects. The impact of these risks is also examined for the Group asset portfolio as a whole. These risks are presented in detail in point 3.1.2 of this chapter.
In order to ensure the viability of its projects and long-term strategy in light of the challenges raised by climate change, the Group integrates, into the financial evaluation of investments presented to the Executive Committee, either a long-term CO2 price of $30 to $40 per ton (depending on the price of crude), or the actual price of CO2 in a given country if higher.
TOTAL has five major levers to integrate climate in its strategy.
1) Improving energy efficiency
Optimizing the energy consumption of its operated facilities is TOTAL’s first lever to reduce emissions. The Group therefore aims to improve the energy efficiency of its operated facilities by an average of 1% per year over the 2010-2020 period, at a time when exploration is becoming increasingly complex. This indicator is described in point 3.5.9.4.D of this chapter.
TOTAL uses appropriate architectures and equipment and introduces technological innovations. For example, on offshore production barges, offshore platforms and onshore facilities, heat recovery systems at gas turbine exhausts have been implemented thereby avoiding the need for furnaces or boiler systems.
2) Growing in natural gas
To respond responsibly to the strong rise in demand for electricity, TOTAL remains committed to gas, whose CO2 emissions are half those of coal when used to generate electricity (1).
The Group wishes to be present throughout the whole gas chain, from production to end customer. Significant operations have taken place in the upstream and the downstream to make this possible. Upstream, TOTAL has acquired a stake in the giant Yamal LNG project in the north of Russia. The Group has also acquired the LNG assets of Engie. These two complementary portfolios allow for the management of a volume of nearly 40 Mt of LNG as from 2020. Downstream, the Group has made strategic acquisitions, such as Direct Énergie and Lampiris, gas and electricity suppliers on the French and Belgian markets, and has developed Total Spring, which was launched in 2017 on the French market.
(1) Source: International Reference Centre for the Life Cycle of Products, Processes and Services; Life cycle assessment of greenhouse gas emissions associated with natural gas and coal in different geographical contexts, October 2016.
Finally, TOTAL has committed itself to gas fuel for transport by acquiring a 25% stake in Clean Energy Fuels Corp., one of the leading distributors of gas fuel for HGVs in the United States, and by signing a contract with CMA-CGM, the first shipping company to equip its transcontinental container ships with LNG-powered engines.
Strengthening the position of gas in the energy mix must however be accompanied by a greater focus on control of methane emissions. To preserve the advantage that gas offers in terms of GHG emissions compared to coal for electricity generation, it is necessary to strictly reduce the methane emissions associated with the production and transportation of gas. In 2018, TOTAL’s methane emissions are kept below 0.25% of the commercial gas produced (1). TOTAL’s target is to sustainably reduce the intensity of its methane emissions of its operated facilities in the Exploration & Production segment to less than 0.20% of commercial gas produced by 2025.
The Group has been a member since 2014 of the partnership between governments and industrial companies for the improvement of tools to measure and control methane emissions set up by the Climate and Clean Air Coalition and promoted by UN Environment and the non-profit organization Environmental Defense Fund. The Group also took several actions as part of the Oil & Gas Climate Initiative and signed the guiding principles on the reduction of methane emissions on the gas value chain (2).
3) Developing a profitable low-carbon electricity business
TOTAL is developing along the whole of the low-carbon electricity value chain, from electricity generation, storage and sale to the end customer. As demand for electricity is expected to grow strongly in the coming decades, TOTAL intends to become a major player in this segment. To meet this target, TOTAL plans to invest $1.5 to $2 billion per year. In 2018, the Group completed the acquisition of Direct Énergie, a French electricity supplier, for nearly €2 billion. With regards to the generation of electricity, TOTAL aims at holding a production capacity of 10 GW of low-carbon electricity by 2023. In 2018, TOTAL acquired four combined-cycle natural gas power plants in France with a global capacity of 1.6 GW. Refer to chapter 2 for further information on recent acquisitions.
4) Developing sustainable biofuels
A pioneer in biofuels for more than 20 years, TOTAL is now one of Europe’s major actors with 2.4 Mt (3) blended sustainable biofuels in 2018 for a worldwide distribution of 3.2 Mt.
Furthermore, TOTAL produced 0.1 Mt of sustainable biofuels in its refineries in 2018. Production at La Mède factory is scheduled to start in 2019. It has a capacity of 0.5 Mt per year of hydrotreated vegetable oil (HVO) based on sustainable certified charges, the Group intends to reach a market share of over 10% in Europe. Biofuels that are currently available are mainly made with vegetable oil and sugar.
For more than 10 years, TOTAL’s R&D teams have developed technologies that have broadened the range of usable resources, while also meeting the need for sustainability. The consortium BioTFuel is working on, for example, the development of lignocellulose (plant waste).
5) Investing in carbon sink businesses
Carbon storage is key to achieving carbon neutrality in the second half of the 21st century. TOTAL is focusing, on the one hand, on developing CCUS and, on the other, on preserving and restoring the capacity of ecosystems to act as carbon sinks. CCUS is vital for several industries, especially those that emit massive amounts of CO2 due to the nature of their business (cement, steel, etc.). TOTAL allocates significant resources to this area by dedicating up to 10% of the Group’s R&D budget to it. Several projects have made substantial progress in recent months. Northern Lights (Norway) is a project in which the Group participates alongside Equinor and Shell. TOTAL is also a partner of the Clean Gas Project (UK), together with the OGCI’s investment fund and a few companies of the sector (4).
TOTAL announced in February 2019 the creation of an entity dedicated to investments in natural carbon sinks, composed of experts in environment and agronomy, with an investment budget $100 million per year from 2020 onwards. Furthermore, actions of preservation and restoration of the forest are currently conducted (refer to point 5.9 of chapter 5 where presented the Total Foundation program carried mainly by the Fondation d’entreprise Total).
Sector initiatives and international framework
TOTAL is also in various sector initiatives on the main challenges raised by climate change. Indeed, tackling climate change requires cooperation between all actors, from both public and private sectors.
Thus, in 2014, TOTAL decided to join the call of the UN Global Compact, which encourages companies to consider a CO2 price internally and publicly support the importance of such a price via regulation mechanisms suited to the local context. In particular, TOTAL advocates the emergence of a balanced, progressive international agreement that prevents the distortion of competition between industries or regions of the world. Drawing attention to future constraints on GHG emissions is crucial to changing the energy mix. TOTAL therefore encourages the setting of a worldwide price for each ton of carbon emitted, while ensuring fair treatment of "sectors exposed to carbon leakage" (as defined by the EU). In addition, TOTAL is working with the World Bank as part of the Carbon Pricing Leadership Coalition (CPLC). In June 2017, TOTAL became a founder member of the Climate Leadership Council, an initiative that calls for the introduction of a "carbon dividend", namely, a redistribution mechanism that would tax the biggest fossil fuel consumers (a population’s wealthiest citizens) in order to pay a dividend to the entire population.
In 2014, TOTAL was actively involved in launching and developing the Oil & Gas Climate Initiative (OGCI), a global industry partnership. At year-end 2018, this initiative involved 13 major international energy players. Its purpose is to share experiences, advance technological solutions and catalyze meaningful action in order to assist the evolution of the energy mix in a manner that takes into account climate change issues. Launched in 2017, the OGCI Climate Investments fund, which has access to over $1 billion over 10 years, invests in technology that significantly cuts emissions. The fund’s initial investments notably are: a large-scale industrial CO2 capture and storage project (Clean Gas Project); a solution that reduces the carbon footprint of cement by using CO2 instead of water to set concrete (Solidia Technologies); a high-efficiency opposed-piston engine that reduces GHG emissions (Achates Power) and a technology that incorporates CO2 as a raw material in the production of polyols used in polyurethanes, which are plastics that have multiple uses (Econic Technologies).
(1) Refer to the OGCI methodology for methane intensity calculation: http://oilandgasclimateinitiative.com/blog/methodological-note-for-ogci-methane-intensity-target-and -ambition.
(2) "Guiding Principles on Reducing Methane Emissions across the Natural Gas Value Chain".
(3) Physical volume of biofuels in equivalent ethanol and esters according to the rules defined by the European RED Directive, excluding volumes sold to third parties via trading.
(4) BP, ENI, Equinor, Occidental Petroleum and Shell.
The Group also plays a role in various international initiatives that involve the private and the public sectors to bring about (non-exhaustive list):
-carbon pricing within Caring for Climate - United Nations Global Compact, and the Paying for Carbon call;
-the end of routine flaring of gas associated to oil production within the World Bank’s Zero Routine Flaring by 2030 initiative;
-greater transparency, while taking into account the recommendations of the G20 Financial Stability Board on climate, and of the Task Force on Climate-related Financial Disclosures (TCFD);
-the development of new state-of-the-art energy companies, since 2017 within the Breakthrough Energy Coalition (BEC), a group of investors created by Bill Gates in 2015, and since 2016 within the Breakthrough Energy Ventures, a $1 billion fund created in 2016 by the BEC.
C) Targets and metrics to measure climate-related risks
TOTAL has set itself targets and introduced a number of indicators to coordinate its performance.
The Group’s climate targets: -an 80% reduction of routine flaring (1) on operated facilities between 2010 and 2020 in order to eliminate it by 2030; -an average 1% improvement per year in the energy efficiency of operated facilities between 2010 and 2020; -a sustainable reduction in the intensity of the methane emissions of the Exploration & Production segment’s operated facilities to less than 0.20% of gas produced for sale, by 2025; -a GHG emission reduction (Scopes 1 & 2) on operated oil & gas facilities of 46 Mt CO2e in 2015 to less than 40 Mt CO2e in 2025. What has been accomplished: -more than 80% reduction in routine flaring between 2010 and 2018; -more than 10% improvement in energy efficiency between 2010 and 2018; -an intensity of the methane emissions below 0.25% of the commercial gas produced in 2018; -a GHG emission reduction (Scopes 1 & 2) on operated oil & gas facilities from 46 Mt CO2e to 42 Mt CO2e between 2015 and 2018. |
Indicators related to climate change
2018 | 2017 | 2016 | 2015 | ||
SCOPE 1 Direct greenhouse-gas emissions (operated scope) | Mt CO2e | 40 | 38 | 41 | 42 |
Breakdown by segment | |||||
Exploration & Production | Mt CO2e | 18 | 17 | 19 | 19 |
Gas, Renewables & Power | Mt CO2e | 2 | 0 | 0 | - |
Refining & Chemicals | Mt CO2e | 21 | 21 | 22 | 22 |
Marketing & Services | Mt CO2e | < 1 | < 1 | < 1 | < 1 |
SCOPE 1 Direct greenhouse-gas emissions based on the Group’s equity interest | Mt CO2e | 54 | 50 | 51 | 50 |
SCOPE 2 Indirect emissions attributable to energy consumption by sites | Mt CO2e | 4 | 4 | 4 | 4 |
GHG emissions (Scopes 1 & 2) on operated oil & gas facilities | Mt CO2e | 42 | 41 | 45 | 46 |
Net primary energy consumption (operated scope) | TWh | 143 (a) | 142 | 150 | 153 |
Group energy efficiency indicator | Base 100 in 2010 | 88.4 | 85.7 | 91.0 | 90.8 |
Daily volume of all flared gas (Exploration & Production operated scope) (including safety flaring, routine flaring and non-routine flaring) | Mm3/d | 6.5 | 5.4 | 7.1 | 7.2 |
Of which routine flaring | Mm3/d | 1.1 | 1.0 | 1.7 (b) | 2.3 (c) |
(a) Excluding primary energy consumption of Direct Énergie gas power plants.
(b) Estimated Volume at end 2016 based on new definition of Routine Flaring published in June 2016 by the Working Group Global Gas Flaring Reduction.
(c) Volumes estimated upon historical data.
All this data as well as the related risks are also reported to the CDP once a year, and TOTAL’s response to the CDP Climate Change questionnaire is posted on the Group’s website (sustainable-performance.total.com). For its 2018 reporting regarding 2017 activities, the Group received an A-.
Flaring
Reducing routine flaring has been a long-standing target of the Group, which designs its new projects without resorting to it. In addition, TOTAL is committed to putting an end to routine flaring of its operated facilities by 2030. An 80% reduction target was set for 2020 compared to 2010, in other words, an average of 1.5 Mm3/d. This target has been met since 2017.
Furthermore, as part of the Global Gas Flaring Reduction program, TOTAL has worked alongside the World Bank for over 10 years to help producing countries and industrial players control flaring of gas associated to oil production.
The increase in flaring linked to oil production in 2018 is due to acquisition and startup of new sites.
(1) Routine flaring, as defined by the working group of the Global Gas Flaring Reduction program within the framework of the World Bank’s Zero Routine Flaring initiative.
Energy efficiency
One of the Group’s performance targets is to better control energy consumption. Since the beginning of 2013, a Group directive has defined the requirements to be met at operated sites using more than 50,000 tons of oil equivalent per year of primary energy (approximately 40 sites). At end 2018, all the concerned sites reported compliance or had taken steps to comply with this directive. The aim is to ensure that 100% sites using more than 50,000 tons of oil equivalent per year by the end of 2020 have an Energy Management System auditable, such as the ISO 50001 on energy management (1). A certain number of sites that use less energy have, voluntarily, taken measures to become ISO 50001 certified.
Energy efficiency is a key factor for the improvement of economic, environmental and industrial performance. Since 2013, the Group has used a Group Energy Efficiency Index (GEEI) to assess its performance in this area. It consists of a combination of energy intensity ratios (ratio of net primary energy consumption to the level of activity) per business.
The Group’s target for the 2010-2020 period is to improve the energy efficiency of its operated facilities by an average of 1% per year. By design, the base value of the GEEI was defined as 100 in 2010 and the target is to reach 90.4 in 2020. This target has been met since 2017.
Through the "Total Ecosolutions" program, the Group is developing innovative products and services that perform above market standards on the environmental front. At year-end 2018, 97 products and services bore the "Total Ecosolutions" label. The CO2 eq emissions avoided throughout the life cycle by the use of "Total Ecosolutions" products and services, compared to the use of benchmark products on the market and for an equivalent level of service, are measured annually based on sales volumes. This represented 1.75 Mt CO2e in 2018.
GHG emissions
The Group has reduced by 25% the GHG emissions produced by its operated activities since 2010. This reduction was reached thanks to notably reducing flaring and improving energy efficiency.
In February 2019, TOTAL announced a target to decrease the GHG emissions (Scopes 1 & 2) on its operated oil & gas facilities to less than 40 Mt O2e in 2025.
3.5.9.5 Contractors and suppliers
TOTAL’s activities generate hundreds of thousands of direct and indirect jobs worldwide. Present in more than 130 countries, the Group currently works with a network of more than 100,000 suppliers of goods and services worldwide. In 2018, the Group’s purchases of goods and services (excluding petroleum products and vessel chartering by Trading & Shipping) represented approximately $29 billion (2) worldwide. The allocation of expenditures on the Group level is approximately 32% for goods (products, materials, etc.) and approximately 68% for services (in particular consulting services, work with supply of materials, transport, etc.).
TOTAL’s success as a responsible company is played out all along its value chain, and the Group is convinced of the importance of working with suppliers that respect human rights and take care of their employees. The Group expects its suppliers to adhere to principles equivalent to those in its own Code of Conduct, as set out in the Fundamental Principles of Purchasing directive. To this end, the Group wanted the management of its supplier relations to be coordinated by the dedicated cross-functional "Total Global Procurement" entity, which is tasked, in particular, with delivering Purchasing services and assisting the Group’s entities and sites, mainly in Exploration & Production, Refining & Petrochemicals, Marketing & Services and Gas, Renewables & Power. This approach is complemented by employee training programs and actions to raise awareness amongst the Group’s partners, customers and suppliers. Its success is also based on TOTAL’s involvement in international initiatives or collaborative approaches specific to the energy sector that promote the emergence of good practices.
A) The Group’s responsible procurement policy
The Group ensures that contractual conditions are negotiated in an equitable manner with its suppliers. The Code of Conduct restates this requirement and the three essential principles that guide TOTAL’s relations with its suppliers: dialogue, professionalism and the fulfillment of commitments.
These principles are also set forth in the Fundamental Principles of Purchasing, launched in 2010, that specify the commitments that TOTAL expects its employees and suppliers to adhere to in the following areas: respect for human rights at work, the protection of health, safety and security, preservation of the environment, prevention of corruption, and conflicts of interest and the fight against fraud, respect for competition law, as well as the promotion of economic and social development. These principles were drawn up in keeping with the fundamental principles defined in particular in the United Nations Universal Declaration of Human Rights, the conventions of the International Labor Organization, the United Nations Global Compact and the OECD Guidelines for Multinational Enterprises.
Furthermore, a Sustainable Procurement road map defines TOTAL’s guidelines in this area. A Sustainable Procurement Committee regularly brings together the Management Committee of Total Global Procurement and the Civil Society Engagement (including the Human Rights Department), HSE and Legal divisions as well as the Ethics Committee. It is tasked with monitoring the implementation of the Group’s Sustainable Procurement road map.
Employee awareness-raising actions and training
TOTAL has set up a number of channels of communication to raise employee awareness of the risks and issues related to its supply chain. Training modules explaining the Group’s ethical commitments and the Fundamental Principles of Purchasing have been developed for and made available to Group procurement representatives. In 2018, 196 procurement representatives were trained on respect of human rights and working conditions by suppliers, and 250 on anti-corruption rules.
The Group provides its procurement representatives with supporting materials, such as the "Sustainable Purchasing Awareness Cards" that recap human rights at work and identify the purchaser practices that must alert them. A set of communication tools intended to help procurement representatives to enter discussions on the Fundamental Principles of Purchasing was also distributed within Total Global Procurement. The materials used in the annual performance review have been revised to include a section on human rights.
In June 2018, the International Procurement Days brought together the 170 procurement representatives present in 41 countries. The Fundamental Principles of Purchasing were distributed during the event and the internal supplier qualification and audit processes were presented.
With respect to the development of good practices in business relations, TOTAL also launched an initiative to raise its employees’ awareness of mediation as an alternative method for resolving disputes. Since 2013, a training day run by professional mediators to raise awareness of mediation has been organized in French and English. In 2017, an open day for employees of the Group, lawyers and suppliers, enabled participants to learn about the benefits of mediation. A brochure designed to increase awareness of the mediation process is available to all Group employees. In addition, an email address is available on the Group website (under "Suppliers"). The Group’s suppliers can contact the internal supplier mediator using a generic email address (mediation.fournisseurs@total.com). The internal mediator is tasked with facilitating relations between the Group and its French and international suppliers. The general purchasing terms and conditions also mention the possibility of recourse to mdiation.
(1) The ISO 50001 standard accompanies the implementation in companies of an energy management system that allows a better use of energy.
(2) $25 billion excluding Hutchinson, SunPower and Saft Group.
B) Extension of the Group’s policy to the supply chain
TOTAL expects its suppliers to:
-adhere to the Fundamental Principles of Purchasing and ensure that they are adhered to in their activities;
-accept to be audited according to these principles;
-remain attentive to the everyday working conditions of their employees and their suppliers’ employees;
-ensure that their own suppliers and subcontractors adhere to these Fundamental Principles of Purchasing;
-refer to the Group Ethics Committee when in doubt or in the event of any malfunction.
The rules set out in these Principles must be included or transposed into the agreements concluded with suppliers. To this end, these Principles are available for consultation by all suppliers in both French and English on TOTAL’s website (under "Suppliers").
The supplier qualification process
The supplier qualification process was harmonized at Group level in 2017 by Total Global Procurement. A new internal framework was published in 2018. A new computerized qualification tool will gradually be rolled out starting in 2019, with a planned scope of 107 countries thus far.
It will be used to automate and document the supplier qualification process, which unfolds in four stages:
1. confirmation of interest;
2. a risk pre-analysis to decide whether an in-depth analysis of each criterion is necessary (HSE, anti-corruption, societal, financial, technical);
3. determination of the qualification status;
4. monitoring and renewal of qualification. Qualifications are valid for three years.
The supplier assessment process
Simultaneously, the Group has set up a supplier assessment process to identify and prevent risks of severe impacts on human rights and fundamental freedoms, human health and safety. Thus, since 2016, the Group started conducting campaigns to audit working conditions amongst its suppliers. These audits are conducted by a specialized service provider, with which TOTAL signed a framework contract in 2016.
Since 2017, the Group has been rolling-out specific training for Group purchasers to evaluate suppliers with respect to human rights.
Moreover, in September 2018, TOTAL, BP, Equinor and Shell announced their intention to develop a common collaborative approach to assess the respect of human rights by their suppliers. The partner companies are convinced of the importance of working with suppliers that respect human rights, on the one hand, and take good care of their employees, on the other. The goal of this common approach is to encourage the improvement of working conditions in the supply chain of the companies involved. This initiative addresses the United Nations SDG N° 8: "to promote sustained, inclusive and sustainable economic growth, full and productive employment and decent work for all".
Supplier awareness-raising actions
The deployment of the anti-corruption policy in purchasing continued in 2017 with awareness-raising sessions for strategic suppliers at the Suppliers Day. This event gathered more than 100 suppliers that are considered to be strategic in view of their contribution to Group operations. In addition to numerous initiatives taken in previous years, in 2018 approximately 229 suppliers underwent an anti-corruption analysis through the issuing of specific questionnaires, completed, in some cases, by external inspections.
Every year, one of the departments of the IPO (TOTAL IPO in Shanghai, China) organizes a compliance day and invites one of its approved suppliers. It can explain the actions it takes regarding anti-corruption compliance, the concrete problems encountered and how it deals with them. The discussions, based on case studies and topical issues, are enlightening for all. In 2018, this event was held in December (refer also to point 5.8.1 of chapter 5).
Finally, pursuant to Rule 13p-1 of the Securities Exchange Act of 1934, as amended, which implemented certain provisions of the Dodd-Frank Wall Street Reform and Consumer Protection Act of 2010, TOTAL has submitted since 2014 to the SEC an annual document relating to "conflict minerals" (1) sourced from the Democratic Republic of the Congo or an adjoining country. The document indicates whether, during the preceding calendar year, any such minerals were necessary to the functionality or production of a product manufactured (or contracted to be manufactured) by the TOTAL S.A. or one of its affiliates had. The main objective of the rule’s obligation to publish this information is to prevent the direct or indirect funding of armed groups in central Africa. For more information, refer to TOTAL’s most recent publication available at: sustainable-performance.total.com or www.sec.gov.
C) The Group’s responsible procurement commitments
Since 2010, TOTAL is a signatory to the French Economy and Finances Ministry’s Sustainable Supplier Relations Charter, which aims to allow more sustainable and balanced relations between customers and suppliers.
Worldwide, a CSR global agreement monitoring Committee (known as the "FAIR Committee") meets every year in the presence of representatives who are members of trade unions affiliated with the IndustriALL Global Union and appointed by this federation to monitor and implement the agreement. It identifies good practice and areas for improvement. In application of the areas for improvement defined by this Committee, the programs mentioned earlier have already been set up: Suppliers Day, International Procurement Day and trainings in human rights for purchasers.
Since 2018, TOTAL has been a member of the United Nations Global Compact platform on Decent Work in Global Supply Chains, and, in this capacity, takes part in various workshops that aim to help the member companies of the Global Compact to make progress in this area. In December 2018, the Group committed to pursuing its efforts in terms of decent work and respecting human rights in its supply chain by signing the "Six Commitments" of the United Nations Global Compact.
The Group’s buyers also take part in international working groups on responsible procurement. TOTAL is an active member of IPIECA’s Supply Chain Working Group. Building on the workshops held since 2015, TOTAL continued to participate in the Operationalization of the UN Guiding Principles work organized by the IPIECA, aimed at both oil and gas companies and engineering, procurement and construction (EPC) contractors.
Finally, the Group pays special attention to the disabled and protected employment sectors. In France, the Group’s purchases from this sector enabled the achievement of an indirect employment rate of nearly 1% in 2018. TOTAL is a member of the Pas@Pas association and provides its buyers with an online directory that can be used to identify potential suppliers and service providers (disabled or protected employment sectors) by geographical area and by category (refer to point 5.3.5.3 in chapter 5).
(1) Rule 13p-1 defines "conflict minerals" as follows (irrespective of their geographical origin): columbite-tantalite (coltan), cassiterite, gold, wolframite as well as their derivatives, which are limited to tantalum, tin and tungsten.
4
REPORT ON CORPORATE GOVERNANCE
The information set out in this chapter forms the Board of Directors’ report on corporate governance, produced pursuant to Article L. 225-37 of the French Commercial Code. This report has been prepared on the basis of the deliberations of the Board of Directors, and with the assistance of several of the Company’s corporate functional divisions, including in particular the Legal, Finance and People & Social Responsibility Departments. After the sections relevant to their respective duties were reviewed by the Governance and Ethics Committee and the Compensation Committee, the report was approved by the Board of Directors.
4.1 Administration and management bodies
4.1.1 Composition of the Board of Directors
As of March 13, 2019
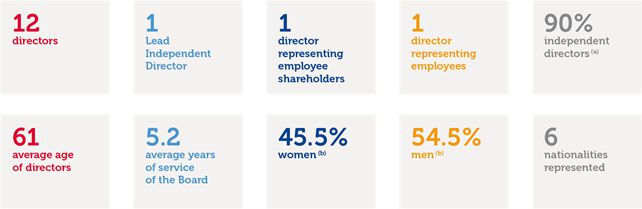
(a) Excluding the director representing employee shareholders and the director representing employees, in accordance with the recommendations of the AFEP-MEDEF Code (point 8.3). For more information, refer to point 4.1.1.4 of this chapter.
(b) Excluding the director representing employees, in accordance with Article L. 225-27-1 of the French Commercial Code.
The Company is administered by a Board of Directors whose members include a director representing employee shareholders elected on the proposal of the shareholders specified in Article L. 225-102 of the French Commercial Code, in accordance with the provisions of Article L. 225-23 of the French Commercial Code (hereafter referred to as the "director representing employee shareholders") and a director representing employees appointed by the Central Works Council (replaced since December 2018 by the Central Social and Economic Committee) of UES Amont - Global Services - Holding in accordance with the provisions of Article L. 225-27-1 of the French Commercial Code and the Company’s bylaws.
Mr. Patrick Pouyanné is the Chairman and Chief Executive Officer of TOTAL S.A. He has served as Chairman of the Board of Directors since December 19, 2015, the date on which the functions of Chairman of the Board of Directors and Chief Executive Officer of TOTAL S.A. were combined (refer to point 4.1.5.1 of this chapter).
Ms. Patricia Barbizet has served as Lead Independent Director since December 19, 2015. Her duties are specified in the Rules of Procedure of the Board of Directors (refer to point 4.1.2.1 of this chapter).
Directors are appointed for a three-year period (Article 11 of the Company’s bylaws). The terms of office of the members of the Board are staggered to space more evenly the renewal of appointments and to ensure the continuity of the work of the Board of Directors and its Committees, in accordance with the recommendations of the AFEP-MEDEF Code, which the Company refers to. The profiles, experience and expertise of the directors are detailed in the biographies below.
Overview of the Board of Directors
Appendix 3 of the AFEP-MEDEF Code
Personal information | Experience | Position on the Board | Participation in Board Committees | |||||||
Age | Gender | Nationality | Number | Number of directorships held at listed corporations (a) | Independence | Initial date of appointment | Term of office expires | Length of service on the Board | ||
Patrick Pouyanné Chairman and Chief Executive Officer | 55 | M |
| 127,617 | 1 | 2015 | 2021 | 4 | ✔ | |
Patrick Artus | 67 | M |
| 1,000 | 2 | ✔ | 2009 | 2021 | 10 | ✔ |
Patricia Barbizet Lead Independent Director | 63 | F |
| 1,050 | 4 | ✔ | 2008 | 2020 | 11 | ✔ |
Marie-Christine Coisne-Roquette | 62 | F |
| 4,472 | 1 | ✔ | 2011 | 2020 | 8 | ✔ |
Mark Cutifani | 60 | M |
| 2,000 | 1 | ✔ | 2017 | 2020 | 2 | ✔ |
Maria van der Hoeven | 69 | F |
| 1,000 | 2 | ✔ | 2016 | 2019 | 3 | ✔ |
Anne-Marie Idrac | 67 | F |
| 1,250 | 4 | ✔ | 2012 | 2021 | 7 | ✔ |
Gérard Lamarche | 57 | M |
| 3,064 | 4 | ✔ | 2012 | 2019 | 7 | ✔ |
Jean Lemierre | 68 | M |
| 1,042 | 1 | ✔ | 2016 | 2019 | 3 | ✔ |
Renata Perycz Director representing employee shareholders | 55 | F |
| 549 | 0 | n/a | 2016 | 2019 | 3 | ✔ |
Christine Renaud Director representing employees | 50 | F |
| 200 | 0 | n/a | 2017 | 2020 | 2 | ✔ |
Carlos Tavares | 60 | M |
| 1,000 | 2 | ✔ | 2017 | 2020 | 2 | ✔ |
(a) Number of directorships held by the director at listed companies outside his or her group, including foreign companies, assessed in accordance with the recommendations of the AFEP-MEDEF Code, point 18 (refer to point 4.1.1.3 of this chapter).
Overview of the Committees
As of March 13, 2019
Audit Committee | Governance and Ethics Committee | Compensation Committee | Strategy & CSR Committee | |||
4 members Marie-Christine Coisne-Roquette* Patrick Artus Maria van der Hoeven Gérard Lamarche | 4 members Patricia Barbizet* Mark Cutifani Anne-Marie Idrac Jean Lemierre | 5 members Gérard Lamarche* Patricia Barbizet Marie-Christine Coisne-Roquette Renata Perycz (b) Carlos Tavares | 6 members Patrick Pouyanné* Patrick Artus Patricia Barbizet Anne-Marie Idrac Jean Lemierre Christine Renaud (c) |
(a) Excluding the director representing employee shareholders and the director representing employees, in accordance with the recommendations of the AFEP-MEDEF Code (point 8.3).
(b) Director representing employee shareholders.
(c) Director representing employees.
* Chairperson of the Committee.
Changes to the composition of the Board of Directors and the Committees
Appendix 3 of the AFEP-MEDEF Code - Changes that have occurred within the membership of the Board of Directors and Committees during the financial year
Situation as of March 13, 2019 | Departure | Appointment | Renewal | |||
Board of Directors | - | - | Mr. Patrick Pouyanné OSM of 06/01/2018 |
| ||
- | - | Mr. Patrick Artus (a) OSM of 06/01/2018 |
| |||
- | - | Ms. Anne-Marie Idrac (a) OSM of 06/01/2018 |
| |||
Mr. Gérard Lamarche (a) OSM of 05/29/2019 |
| Ms. Lise Croteau (a) OSM of 05/29/2019 (b) |
| Ms. Maria van der Hoeven (a) OSM of 05/29/2019 (b) |
| |
Ms. Renata Perycz (c) OSM of 05/29/2019 |
| Director representing employee shareholders OSM of 05/29/2019 (d) | Mr. Jean Lemierre (a) OSM of 05/29/2019 (b) |
| ||
Audit Committee | - | - | - | |||
Governance and Ethics Committee | - | Mr. Mark Cutifani (a) 06/01/2018 |
| - | ||
Compensation Committee | - | Mr. Carlos Tavares (a) 06/01/2018 |
| - | ||
Strategy & CSR Committee | - | Ms. Christine Renaud (e) 06/01/2018 |
| - |
(a) Independent director.
(b) Subject to approval of the resolutions at the Shareholders’ Meeting on May 29, 2019.
(c) Director representing employee shareholders.
(d) For the appointment of the director representing employee shareholders proposed to the Shareholders’ Meeting of May 29, 2019, refer to point 4.1.1.7 of this chapter.
(e) Director representing employees.
OSM: Ordinary Shareholders’ Meeting.
4.1.1.1 Profile, experience and expertise of the directors (Information as of December 31, 2018) (1)
| PATRICK POUYANNÉ | |
Chairman and Chief Executive Officer of TOTAL S.A.* Chairman of the Strategy & CSR Committee Biography & Professional Experience A graduate of École Polytechnique and a Chief Engineer of France’s Corps des Mines, Mr. Pouyanné held, between 1989 and 1996, various administrative positions in the Ministry of Industry and other cabinet positions (technical advisor to the Prime Minister - Édouard Balladur - in the fields of the Environment and Industry from 1993 to 1995, Chief of staff for the Minister for Information and Aerospace Technologies - François Fillon - from 1995 to 1996). In January 1997, he joined TOTAL’s Exploration & Production division, first as Chief Administrative Officer in Angola, before becoming Group representative in Qatar and President of the Exploration and Production subsidiary in that country in 1999. In August 2002, he was appointed President, Finance, Economy and IT for Exploration & Production. In January 2006, he became Senior Vice President, Strategy, Business Development and R&D in Exploration & Production and was appointed a member of the Group’s Management Committee in May 2006. In March 2011, Mr. Pouyanné was appointed Deputy General Manager, Chemicals, and Deputy General Manager, Petrochemicals. In January 2012, he became President, Refining & Chemicals and a member of the Group’s Executive Committee. On October 22, 2014, he became Chief Executive Officer of TOTAL S.A. and Chairman of the Group’s Executive Committee. On May 29, 2015, he was appointed by the Annual Shareholders’ Meeting as director of TOTAL S.A. for a three-year term. The Board of Directors of TOTAL appointed him as Chairman of the Board of Directors as of December 19, 2015. Mr. Pouyanné thus became the Chairman and Chief Executive Officer of TOTAL S.A. Following the renewal of Mr. Pouyanné’s directorship at the Shareholders’ Meeting on June 1, 2018 for a three-year period, the Board of Directors renewed Mr. Pouyanné’s term of office as Chairman and Chief Executive Officer for a period equal to that of his directorship. Mr. Pouyanné is also the Chairman of the Association United Way - L’Alliance since June 2018, having accepted this office as TOTAL S.A.’s Chairman and Chief Executive Officer. Main function: Chairman and Chief Executive Officer of TOTAL S.A.* | ||
Born on June 24, 1963 (French) Director of TOTAL S.A. since the Ordinary Shareholders’ Meeting of May 29, 2015 Date last reappointed: Ordinary Shareholders’ Meeting of June 1, 2018 Expiry date of term of office: 2021 Ordinary Shareholders’ Meeting Number of TOTAL shares held: 127,617 |

(1) Including information pursuant to Article L. 225-37-4 of the French Commercial Code and item 14.1 of Annex I of EC Regulation No. 809/2004 of April 29, 2004.
* For information relating to directorships, the companies marked with an asterisk are listed companies.
Business address: TOTAL S.A. 2 place Jean Millier, La Défense 6, 92400 Courbevoie France | Directorships and functions held at any company during the 2018 fiscal year Within the TOTAL Group -Chairman and Chief Executive Officer of TOTAL S.A.* and Chairman of the Strategy & CSR Committee Outside the TOTAL Group -Director of Cap Gemini S.E.* (since May 10, 2017) and member of the Strategy and Investments Committee (since September 1, 2017) Directorships that have expired in the previous five years -Chairman and Director of Total Refining & Chemicals until 2014 -Chairman and Director of Total Petrochemicals & Refining S.A./NV until 2014 |
| PATRICK ARTUS | |
Independent director Member of the Audit Committee Member of the Strategy & CSR Committee Biography & Professional Experience A graduate of École Polytechnique, École Nationale de la Statistique et de l’Administration Économique (ENSAE) and the Institut d’Études Politiques de Paris, Mr. Artus began his career at INSEE (the French National Institute for Statistics and Economic Studies) where his work included economic forecasting and modeling. He then worked at the Economics Department of the OECD (1980), later becoming the Head of Research at the ENSAE from 1982 to 1985. He was scientific advisor at the Research Department of the Banque de France, before joining the Natixis Group as the head of the Research Department, and has been a member of its Executive Committee since May 2013. He is an associate professor at the Paris School of Economics. He is also a member of the Cercle des Économistes. Main function: Head of the Research Department and member of the Executive Committee of Natixis* Directorships and functions held at any company during the 2018 fiscal year Within the Natixis group -Head of the Research Department and member of the Executive Committee of Natixis* Outside the Natixis group -Director of TOTAL S.A.* and member of the Audit Committee and the Strategy & CSR Committee -Director of IPSOS* Directorships that have expired in the previous five years None | ||
Born on October 14, 1951 (French) Director of TOTAL S.A. since the Ordinary Shareholders’ Meeting of May 15, 2009 Date last reappointed: Ordinary Shareholders’ Meeting of June 1, 2018 Expiry date of term of office: 2021 Ordinary Shareholders’ Meeting Number of TOTAL shares held: 1,000 (as of 12/31/2018) Business address: Natixis 47 quai d’Austerlitz 75013 Paris - France |

| PATRICIA BARBIZET | |
Independent director - Lead Independent Director Chairwoman of the Governance and Ethics Committee Member of the Compensation Committee Member of the Strategy & CSR Committee Biography & Professional Experience A graduate of École Supérieure de Commerce de Paris (ESCP-Europe) in 1976, Patricia Barbizet started her career in the Treasury division of Renault Véhicules Industriels, and then as CFO of Renault Crédit International. In 1989, she joined the group of François Pinault as CFO, and was CEO of Artémis, the Pinault family’s investment company, between 1992 and 2018. She was also CEO and Chairwoman of Christie’s from 2014 to 2016. Patricia Barbizet was Vice Chairwoman of the Board of Directors of Kering and Vice Chairwoman of Christie’s plc. She has been a member of the Board of Directors of TOTAL S.A. since 2008, and was a director of Bouygues, Air France-KLM and PSA Peugeot-Citroën. She chaired the Investment Committee of the Fonds Stratégique d’Investissement (FSI) from 2008 to 2013. Main function: Chairwoman of Temaris et Associés SAS since October 2018 Directorships and functions held at any company during the 2018 fiscal year Within the Artémis group -Director of Artémis until July 2018 -Chief Executive Officer of Artémis until January 2018 -Deputy Chairwoman of Christie’s International plc until January 2018 -Director and Vice Chairwoman of the Board of Directors of Kering S.A.* until December 2018 -General Manager (non-executive) and member of the Supervisory Board of Financière Pinault until January 2018 -Permanent representative of Artémis, member of the Board of Directors of Agefi until January 2018 -Permanent representative of Artémis, member of the Board of Directors of Sebdo le Point until January 2018 | ||
Born on April 17, 1955 (French) Director of TOTAL S.A. since the Ordinary Shareholders’ Meeting of May 16, 2008 Date last reappointed: Ordinary Shareholders’ Meeting of May 26, 2017 Expiry date of term of office: 2020 Ordinary Shareholders’ Meeting Number of TOTAL shares held: 1,050 (as of 12/31/2018) Business address: Temaris 40 rue François 1er, 75008 Paris - France |

-Member of the Management Board of Société Civile du Vignoble de Château Latour until January 2018 -Director of Yves Saint Laurent until November 2018 -Amministratore & Amministratore Delagato of Palazzo Grassi until January 2018 -Member of the Supervisory Board of Ponant until January 2018 -Representative of Artémis, member of the Supervisory Board of Collection Pinault Paris until January 2018 Outside the Artémis group -Chairwoman of Temaris et Associés SAS since October 2018 -Director of TOTAL S.A.*, Lead Independent Director, Chairwoman of the Governance and Ethics Committee, member of the Compensation Committee and member of the Strategy & CSR Committee -Director of Groupe Fnac Darty* -Director of Axa* since April 2018 -Director of Pernod Ricard* since November 2018 Directorships that have expired in the previous five years -Chairwoman and CEO of Christie’s International plc until December 2016 -Member of the supervisory board of Peugeot S.A.* until April 2016 -Director of Société Nouvelle du Théâtre Marigny until November 2015 |
| MARIE-CHRISTINE COISNE-ROQUETTE | |
Independent director Chairwoman of the Audit Committee Member of the Compensation Committee Biography & Professional Experience Ms. Coisne-Roquette has a Bachelor’s Degree in English. A lawyer by training, with a French Master’s in law and a Specialized Law Certificate from the New York bar, she started her career as an attorney in 1981 at the Paris and New York bars, as an associate of Cabinet Sonier & Associés in Paris. In 1984, she became a member of the Board of Directors of Colam Entreprendre, a family holding company that she joined full time in 1988. As Chairwoman of the Board of Colam Entreprendre and the Sonepar Supervisory Board, she consolidated family ownership, reorganized the Group structures and reinforced the shareholders’ Group to sustain its growth strategy. Chairwoman and Chief Executive Officer of Sonepar as of 2002, Marie-Christine Coisne-Roquette became Chairwoman of Sonepar S.A.S. in 2016. At the same time, she heads Colam Entreprendre as its Chairwoman and Chief Executive Officer. Formerly a member of the Young Presidents’ Organization (YPO), she served the MEDEF (France’s main employers’ association) as Executive Committee member for 13 years and was Chairwoman of its Tax Commission from 2005 to 2013. She was a member of the Economic, Social and Environmental Council from 2013 and 2015 and is currently a Director of TOTAL S.A. Main function: Chairwoman of Sonepar S.A.S Directorships and functions held at any company during the 2018 fiscal year Within the Sonepar group -Chairwoman of Sonepar S.A.S. -Chairwoman of the Corporate Board of Sonepar S.A.S. -Chairwoman and Chief Executive Officer of Colam Entreprendre -Legal representative of Sonepar S.A.S., Chairperson of Sonepar International -Legal representative of Sonepar S.A.S., director of Sonepar France S.A.S. -Legal representative of Sonepar S.A.S., co-manager of Sonedis (société civile) until October 29, 2018 -Permanent representative of Colam Entreprendre, co-manager of Sonedis (société civile) until October 29, 2018 -Permanent representative of Colam Entreprendre, director of SO.VE.MAR.CO Europe (S.A.) -Chief Executive Officer of Sonepack S.A.S. -Permanent representative of Sonepar Belgium to the Board of Cebeo N.V. (Belgium) until February 2018 Outside the Sonepar group -Director of TOTAL S.A.*, Chairwoman of the Audit Committee and member of the Compensation Committee -Co-manager of Développement Mobilier & Industriel (société civile) -Managing Partner of Ker Coro (société civile immobilière) -Member of the Supervisory Board of Akuo Energy S.A.S. Directorships that have expired in the previous five years -Chairwoman of the Board of Directors of Sonepar S.A. until 2016 | ||
Born on November 4, 1956 (French) Director of TOTAL S.A. since the Ordinary Shareholders’ Meeting of May 13, 2011 Date last reappointed: Ordinary Shareholders’ Meeting of May 26, 2017 Expiry date of term of office: 2020 Ordinary Shareholders’ Meeting Number of TOTAL shares held: 4,472 (as of 12/31/2018) Business address: Sonepar 25 rue d’Astorg 75008 Paris - France |

| MARK CUTIFANI | |
Independent director Member of the Governance and Ethics Committee Biography & Professional Experience Mr. Cutifani was appointed director and Chief Executive of Anglo American plc on April 3, 2013. He is a member of the Board’s Sustainability Committee and chairs the Group Management Committee. Mr. Cutifani has 42 years of experience in the mining industry in various parts of the world, covering a broad range of products. Mark Cutifani is a non-executive director of Anglo American Platinum Limited, Chairman of Anglo American South Africa and Chairman of De Beers plc. He previously held the post of Chief Executive Officer of AngloGold Ashanti Limited. Before joining AngloGold Ashanti, Mr. Cutifani was COO responsible for global nickel business of Vale. Prior to that, he held various management roles at Normandy Group, Sons of Gwalia, Western Mining Corporation, Kalgoorlie Consolidated Gold Mines and CRA (Rio Tinto). Mr. Cutifani has a degree in Mining Engineering (with honors) from the University of Wollongong in Australia. He is a Fellow of the Royal Academy of Engineering, the Australasian Institute of Mining and Metallurgy and the Institute of Materials, Minerals and Mining in the United Kingdom. Mr. Cutifani received an honorary doctorate from the University of Wollongong in Australia in 2013 and an honorary doctorate from Laurentian University in Canada in 2016. Main function: Chief Executive of Anglo American plc.* Directorships and functions held at any company during the 2018 fiscal year Within the Anglo American group -Director and Chief Executive of Anglo American plc.* -Non-executive director of Anglo American Platinum Limited -Chairman of Anglo American South Africa -Chairman of De Beers plc. Outside the Anglo American group -Director of TOTAL S.A.* and, since June 1, 2018, member of the Governance and Ethics Committee Directorships that have expired in the previous five years -Chief Executive Officer of AngloGold Ashanti Limited | ||
Born on May 2, 1958 (Australian) Director of TOTAL S.A. since the Ordinary Shareholders’ Meeting of May 26, 2017 Expiry date of term of office: 2020 Ordinary Shareholders’ Meeting Number of TOTAL shares held: 2,000 (as of 12/31/2018) Business address: Anglo American plc Group, 20 Carlton House Terrace, London, SWY5AN United Kingdom |

| MARIA VAN DER HOEVEN | |
Independent director Member of the Audit Committee Biography & Professional Experience Ms. van der Hoeven trained as a teacher, becoming a professor in economic sciences and administration then a school counselor. She was then Executive Director of the Administrative Center for vocational training for adults in Maastricht for seven years and then Director of the Limbourg Technology Center. She was a member of the Dutch Parliament, served as Minister of Education, Culture and Science from 2002 to 2007, and was Minister of Economic Affairs of the Netherlands from 2007 to 2010. Ms. van der Hoeven then served as Executive Director of the International Energy Agency (IEA) from September 2011 to August 2015. During this period, she contributed to increasing the number of members of the Agency and emphasized the close link between climate and energy policy. In September 2015, Ms. van der Hoeven joined the Board of Trustees of Rocky Mountain Institute (USA) and in the spring of 2016, became a member of the supervisory board of Innogy SE (Germany). Since October 2016, Ms. van der Hoeven has been Vice Chairwoman of the High-level Panel of the European Decarbonisation Pathways Initiative within the European Commission. Main function: Independent director Directorships and functions held at any company during the 2018 fiscal year -Director of TOTAL S.A.* and member of the Audit Committee -Member of the Supervisory Board of Innogy SE* -Member of the Board of Trustees of Rocky Mountain Institute (USA) Directorships that have expired in the previous five years -Member of the Supervisory Board of RWE AG (Germany) | ||
Born on September 13, 1949 (Dutch) Director of TOTAL S.A. since the Ordinary Shareholders’ Meeting of May 24, 2016 Expiry date of term of office: Ordinary Shareholders’ Meeting of May 29, 2019 Number of TOTAL shares held: 1,000 (as of 12/31/2018) Business address: Pommardlaan 17 6213GV Maastricht Netherlands |

| ANNE-MARIE IDRAC | |
Independent Director Member of the Governance and Ethics Committee Member of the Strategy & CSR Committee Biography & Professional Experience A graduate of Institut d’Études Politiques de Paris and formerly a student at École Nationale d’Administration (ENA -1974), Ms. Idrac began her career holding various positions as a senior civil servant at the Ministry of Infrastructure (Ministère de l’Équipement) in the fields of environment, housing, urban planning and transportation. She served as Executive Director of the public institution in charge of the development of Cergy-Pontoise (Établissement public d’Aménagement de Cergy-Pontoise) from 1990 to 1993 and Director of land transport from 1993 to 1995. Ms. Idrac was State Secretary for Transport from May 1995 to June 1997, elected member of Parliament for Yvelines from 1997 to 2002, regional councilor for Île-de-France from 1998 to 2002 and State Secretary for Foreign Trade from March 2008 to November 2010. She also served as Chairwoman and Chief Executive Officer of RATP from 2002 to 2006 and then as Chairwoman of SNCF from 2006 to 2008. Main function: Independent Director Directorships and functions held at any company during the 2018 fiscal year -Director of TOTAL S.A.*, member of the Governance and Ethics Committee and member of the Strategy & CSR Committee -Director of Air France-KLM* and Chairwoman of the Sustainable Development and Compliance Committee -Director of Bouygues*, Chairwoman of the CSR Committee and member of the Audit Committee -Director of Saint Gobain* and Chairwoman of the Nominations and Compensation Committee Directorships that have expired in the previous five years -Chairwoman of the Supervisory Board of Toulouse-Blagnac Airport until May 2018 -Member of the Supervisory Board of Vallourec until 2015 -Director of Mediobanca S.p.A. (Italy) until 2014 | ||
Born on July 27, 1951 (French) Director of TOTAL S.A. since the Ordinary Shareholders’ Meeting of May 11, 2012 Date last reappointed: Ordinary Shareholders’ Meeting of June 1, 2018 Expiry date of term of office: 2021 Ordinary Shareholders’ Meeting Number of TOTAL shares held: 1,250 (as of 12/31/2018) Business address: 9 place Vauban 75007 Paris France |

| GÉRARD LAMARCHE | |
Independent director Chairman of the Compensation Committee Member of the Audit Committee Biography & Professional Experience Mr. Lamarche graduated in economic science from Louvain-La-Neuve University and is also a graduate of INSEAD business school (Advanced Management Program for Suez Group Executives). He also attended the Global Leadership Series training course at the Wharton International Forum in 1998-99. He started his career at Deloitte Haskins & Sells in Belgium in 1983, before becoming a consultant in mergers and acquisitions in the Netherlands in 1987. In 1988, Mr. Lamarche joined Société Générale de Belgique as an investment manager. He was promoted to the position of management controller in 1989 before becoming a consultant in strategic operations from 1992 to 1995. He joined Compagnie Financière de Suez as a Project Manager for the Chairman and Secretary of the Executive Committee (1995-1997), before being appointed as the acting Managing Director in charge of Planning, Management Control and Accounts. In 2000, Mr. Lamarche moved to NALCO (the American subsidiary of the Suez group and the world leader in the treatment of industrial water) as Director and Chief Executive Officer. He was appointed Chief Financial Officer of the Suez group in 2003. In April 2011, Mr. Lamarche became a director on the Board of Directors of Groupe Bruxelles Lambert (GBL). He has been the Deputy Managing Director since January 2012. Mr. Lamarche is currently a director of LafargeHolcim Ltd (Switzerland), TOTAL S.A., SGS S.A. (Switzerland) and Umicore (Belgium). Main function: Deputy Managing Director of Groupe Bruxelles Lambert* Directorships and functions held at any company during the 2018 fiscal year Within Groupe Bruxelles Lambert -Deputy Managing Director of Groupe Bruxelles Lambert* Within holdings of Groupe Bruxelles Lambert -Director of TOTAL S.A.*, Chairman of the Compensation Committee and member of the Audit Committee -Director and member of the Audit Committee of LafargeHolcim Ltd* -Director of SGS S.A.* -Director of Umicore* Directorships that have expired in the previous five years -Director of Lafarge* until 2016 -Director and Chairman of the Audit Committee of Legrand* until 2016 -Non-voting member (censeur) of Engie S.A.* until 2015 | ||
Born on July 15, 1961 (Belgian) Director of TOTAL S.A. since January 12, 2012 Date last reappointed: Ordinary Shareholders’ Meeting of May 24, 2016 Expiry date of term of office: Ordinary Shareholders’ Meeting of May 29, 2019 Number of TOTAL shares held: 3,064 (as of 12/31/2018) Business address: Groupe Bruxelles Lambert 24, avenue Marnix 1000 Brussels Belgium |

| JEAN LEMIERRE | |
Independent director Member of the Governance and Ethics Committee Member of the Strategy & CSR Committee Biography & Professional Experience Mr. Lemierre is a graduate of the Institut d’Études Politiques de Paris and the École Nationale d’Administration; he also has a law degree. Mr. Lemierre held various positions at the French tax authority, including as Head of the Fiscal Legislation Department and Director-General of Taxes. He was then appointed as Cabinet Director at the French Ministry of Economy and Finance before becoming Director of the French Treasury in October 1995. Between 2000 and 2008, he was President of the European Bank for Reconstruction and Development (EBRD). He became an advisor to the Chairman of BNP Paribas in 2008 and has been Chairman of BNP Paribas since December 1, 2014. During his career, Mr. Lemierre has also been a member of the European Monetary Committee (1995-1998), Chairman of the European Union Economic and Financial Committee (1999-2000) and Chairman of the Paris Club (1999-2000). He then became a member of the International Advisory Council of China Investment Corporation (CIC) and the International Advisory Council of China Development Bank (CDB). He is currently Chairman of the Centre d’Études Prospectives et d’Informations Internationales (CEPII) and a member of the Institute of International Finance (IIF). Main function: Chairman of the Board of Directors of BNP Paribas* Directorships and functions held at any company during the 2018 fiscal year Within the BNP Paribas group -Chairman of the Board of Directors of BNP Paribas* -Director of TEB Holding AS Outside the BNP Paribas group -Director of TOTAL S.A.*, member of the Governance and Ethics Committee and member of the Strategy & CSR Committee -Chairman of Centre d’Études Prospectives et d’Informations Internationales (CEPII) -Member of the Institute of International Finance (IIF) -Member of the International Advisory Board of Orange* -Member of the International Advisory Council of China Development Bank* (CDB) -Member of the International Advisory Council of China Investment Corporation (CIC) -Member of the International Advisory Panel (IAP) of the Monetary Authority of Singapore (MAS) Directorships that have expired in the previous five years -Director of Bank Gospodarki Zywnosciowej (BGZ) (Poland) until 2014 | ||
Born on June 6, 1950 (French) Director of TOTAL S.A. since the Ordinary Shareholders’ Meeting of May 24, 2016 Expiry date of term of office: Ordinary Shareholders’ Meeting of May 29, 2019 Number of TOTAL shares held: 1,042 (as of 12/31/2018) Business address: BNP Paribas 3 rue d’Antin 75002 Paris France |

| RENATA PERYCZ | |
Director representing employee shareholders Member of the Compensation Committee Biography & Professional Experience Ms. Perycz is a graduate of the University of Warsaw, the École des Hautes Etudes Commerciales (HEC) and the SGH Warsaw School of Economics. Ms. Perycz entered the Group in 1993 as a logistics and sales manager for Total Polska. In 2000, she became a supplies and logistics manager before becoming head of the subsidiary’s Purchasing Department in 2003. In 2007, she became Director of Human Resources and Purchasing at Total Polska. Since 2013, Ms. Perycz has been the subsidiary’s Human Resources and Internal Communications director. She has also been an elected member, representing unit-holders, of the Supervisory Board of FCPE Total Actionnariat International Capitalisation since 2012. Main function: Human Resources and Internal Communications Director of Total Polska Directorships and functions held at any company during the 2018 fiscal year -Director representing employee shareholders of TOTAL S.A.* and member of the Compensation Committee Directorships that have expired in the previous five years None | ||
Born on November 5, 1963 (Polish) Director of TOTAL S.A. since the Ordinary Shareholders’ Meeting of May 24, 2016 Expiry date of term of office: Ordinary Shareholders’ Meeting of May 29, 2019 Number of TOTAL shares held: 549 Number of Total Actionnariat International Capitalisation collective investment fund units held: 1,573.8958 Number of Total International Capital collective investment fund units held: 6.4581 (as of 12/31/2018) Business address: Total Polska Sp. Z o.o. Al. Jana Pawla II 80, 00-175 Warsaw - Poland |

| CHRISTINE RENAUD | |
Director representing employees Member of the Strategy & CSR Committee Biography & Professional Experience A graduate of the Institut Universitaire de Technologie en Chimie at Poitiers University, Ms. Renaud began her career with the Group in 1990 as an analytical development technician for Sanofi (Ambarès site) and then the Groupement de Recherches de Lacq (GRL). In 2004, she joined the organic analysis laboratory at the Pôle d’Études et de Recherches de Lacq (PERL), before helping to set up a new research laboratory. During her time at GRL, Ms. Renaud was elected as a member of the Works Committee before holding office as a union representative and member of the Group’s European Committee from 2004 to 2011. At the end of 2011, Ms. Renaud was elected as Secretary of the Group’s European Committee. Her term of office was renewed in 2013 until April 5, 2017. At its meeting of March 30, 2017, the UES Amont Central Works Council - Global Services - Holding appointed Ms. Renaud as director representing employees on the Board of Directors of TOTAL S.A. as of May 26, 2017, for a period of three years expiring following the 2020 Shareholders’ Meeting of TOTAL S.A. Since March 1, 2018, Ms. Renaud has served as communications officer at the Centre Technique et Scientifique Jean Féger. Main function: TOTAL S.A.* employee Directorships and functions held at any company during the 2018 fiscal year -Director representing employees of TOTAL S.A.* and, since June 1, 2018, member of the Strategy & CSR Committee Directorships that have expired in the previous five years None | ||
Born on May 7, 1968 (French) Director representing employees of TOTAL S.A. since the Ordinary Shareholders’ Meeting of May 26, 2017 Expiry date of term of office: 2020 Ordinary Shareholders’ Meeting Number of TOTAL shares held: 200 Number of Total Actionnariat France collective investment fund units held: 1,471 (as of 12/31/2018) Business address: TOTAL S.A. 2 place Jean Millier, La Défense 6, 92400 Courbevoie France |

| CARLOS TAVARES | |
Independent director Member of the Compensation Committee Biography & Professional Experience A graduate of the École Centrale de Paris, Mr. Carlos Tavares held various positions of responsibility within the Renault group between 1981 and 2004 before joining the Nissan group. Having been Executive Vice President, Chairman of the Management Committee Americas and President of Nissan North America, he was then Group Chief Operating Officer of the Renault Group from 2011 to 2013. He joined the Managing Board of Peugeot S.A. on January 1, 2014, and was appointed Chairman of the Managing Board on March 31, 2014. Main function: Chairman of the Managing Board of Peugeot S.A.* Directorships and functions held at any company during the 2018 fiscal year Within the Peugeot group -Chairman of the Managing Board of Peugeot S.A.* -Director of Banque PSA Finance -Chairman of the Board of Directors of PSA Automobiles S.A.* -Chairman of the Supervisory Board of Opel Automobiles GmbH Outside the Peugeot group -Director of TOTAL S.A.* and, since June 1, 2018, member of the Compensation Committee -Director of AIRBUS Group* Directorships that have expired in the previous five years -Director of PCMA Holding B.V. -Director of Faurecia* until October 2018 | ||
Born on August 14, 1958 (Portuguese) Director of TOTAL S.A. since the Ordinary Shareholders’ Meeting of May 26, 2017 Expiry date of term of office: 2020 Ordinary Shareholders’ Meeting Number of TOTAL shares held: 1,000 (as of 12/31/2018) Business address: Peugeot S.A. 7 rue Henri Ste Claire Deville, 92500 Rueil-Malmaison France |

Directorships of TOTAL S.A. expired in 2018
None.
4.1.1.2 Absence of conflicts of interest or convictions
The Board of Directors’ Rules of Procedure stipulate the specific rules for preventing conflicts of interest applicable to directors in the following terms (refer to point 4.1.2.1 of this chapter for the full version of the Rules of Procedure):
"2.5. Duty of Loyalty Directors must not take advantage of their office or duties to gain, for themselves or a third party, any monetary or non-monetary benefit. They must notify the Chairman of the Board of Directors and the Lead Independent Director, if one has been appointed, of any existing or potential conflict of interest with the Company or any Group company, and they must refrain from participating in the vote relating to the corresponding resolution as well as from participating in any debate preceding such vote. Directors must inform the Board of Directors of their participation in any transaction that directly involves the Company, or any Group company, before such transaction is finalized. Directors must not assume personal responsibilities in companies or businesses having activities in competition with those of the Company or any Group company without first having informed the Board of Directors. Directors undertake not to seek or accept from the Company, or from companies directly or indirectly connected to the Company, any advantages liable to be considered as being of a nature that may compromise their independence." "7.2 Duties of the Lead Independent Director 5. Prevention of conflicts of interest Within the Governance and Ethics Committee, the Lead Independent Director organizes the performance of due diligence in order to identify and analyze potential conflicts of interest within the Board of Directors. He informs the Chairman and Chief Executive Officer of any conflicts of interest identified as a result and reports to the Board of Directors on these activities. Pursuant to the obligation to declare conflicts of interest set out in Article 2.5 of these Rules, any director affected by an existing or potential conflict of interest must inform the Chairman and Chief Executive Officer and the Lead Independent Director." |
The Lead Independent Director has performed due diligence in order to identify and analyze potential conflicts of interest. He brought to the attention of the Chairman and Chief Executive Officer the potential conflicts of interest that had been identified. In this regard, the Lead Independent Director was consulted in July 2018 by a director about a potential conflict of interest that could arise due to that director’s possible participation in a Committee of an energy-related entity in an Asian country. Due to the absence of a conflict of interest, this director then decided to respond to the offer to chair this Committee. The Lead Independent director was also consulted in October 2018 by the director concerning that director’s potential participation to a strategic committee of a fund manager. He was answered positively.
On the basis of the work carried out, the Board of Directors noted the absence of potential conflicts of interest between the directors’ duties with respect to the Company and their private interests.
To the Company’s knowledge, there is no family relationship among the members of the Board of Directors of TOTAL S.A.; there is no arrangement or agreement with the major shareholders, customers or suppliers under which a director was selected, and there is no service agreement that binds a director to TOTAL S.A. or to any of its subsidiaries and provides for special benefits under the terms thereof.
The current members of the Company’s Board of Directors have informed the Company that they have not been charged with, convicted or subject to any incrimination, conviction or sanction pronounced by a judicial or administrative authority or a professional body, have not been associated with bankruptcy, sequestration, receivership or court-ordered liquidation proceedings, and have not been convicted of fraud, prohibited from managing a company or disqualified as stipulated in item 14.1 of Annex I of EC Regulation 809/2004 of April 29, 2004, over the last five years.
4.1.1.3 Plurality of directorships held by directors
The number of directorships held by the directors at listed companies outside their group, including foreign companies, was assessed as of December 31, 2018, in accordance with the recommendations of the AFEP-MEDEF Code (point 18) which states that "an executive officer should not hold more than two other directorships in listed corporations, including foreign corporations, outside of his or her group. [This] limit […] does not apply to directorships held by an executive officer in subsidiaries and holdings, held alone or together with others, of companies whose main activity is to acquire and manage such holdings. […] A director should not hold more than four other directorships in listed corporations, including foreign corporations outside of the group."
Summary of other directorships held by members of the Board of Directors
As of December 31, 2018 | Number of directorships held at listed companies (a) | Compliance with the criteria of the AFEP-MEDEF Code |
Patrick Pouyanné | 1 | ✔ |
Patrick Artus | 2 | ✔ |
Patricia Barbizet | 4 | ✔ |
Marie-Christine Coisne-Roquette | 1 | ✔ |
Mark Cutifani | 1 | ✔ |
Maria van der Hoeven | 2 | ✔ |
Anne-Marie Idrac | 4 | ✔ |
Gérard Lamarche | 4 | ✔ |
Jean Lemierre | 1 | ✔ |
Renata Perycz (b) | 0 | ✔ |
Christine Renaud (c) | 0 | ✔ |
Carlos Tavares | 2 | ✔ |
(a) In accordance with the criteria of the AFEP-MEDEF Code.
(b) Director representing employee shareholders.
(c) Director representing employees.
4.1.1.4 Directors independence
At its meeting on February 6, 2019, the Board of Directors, on the proposal of the Governance and Ethics Committee, reviewed the independence of the Company’s directors as of December 31, 2018. At this Committee’s proposal, the Board considered that, pursuant to the AFEP-MEDEF Code to which the Company refers to, a director is independent when "he or she has no relationship of any kind whatsoever with the corporation, its group or its management that may interfere the exercise of his or her freedom of judgment".
For each director, this assessment was based on the independence criteria set forth in point 8.5 of the AFEP-MEDEF Code, revised in June 2018, and as described below.
Criterion 1: Employee corporate officer during the previous five years "Not to be or not to have been during the course of the previous five years: -an employee or executive officer of the company; -an employee, executive officer or director of a company consolidated within the corporation; -an employee, executive officer or director of the company’s parent company or a company consolidated within this parent company." Criterion 2: Cross-directorships "Not to be an executive officer of a company in which the company holds a directorship, directly or indirectly, or in which an employee appointed as such or an executive officer of the Corporation (currently in office or having held such office within the last five years) holds a directorship." Criterion 3: Significant business relationships "Not to be a customer, supplier, commercial banker, investment banker or consultant: -that is significant to the corporation or its group; -or for which the corporation or its group represents a significant portion of its activity. The evaluation of the significance or otherwise of the relationship with the company or its group must be debated by the Board and the quantitative and qualitative criteria that led to this evaluation (continuity, economic dependence, exclusivity, etc.) must be explicitly stated in the report on corporate governance." Criterion 4: Family ties "Not to be related by close family ties to a company officer." Criterion 5: Auditor "Not to have been an auditor of the corporation within the previous 5 years." Criterion 6: Period of office exceeding 12 years "Not to have been a director of the corporation for more than 12 years. Loss of the status of independent director occurs on the date of this 12 years is reached." Criterion 7: Status of non-executive officer "A non-executive officer cannot be considered independent if he or she receives variable compensation in cash or in the form of shares or any compensation linked to the performance of the corporation or group." Criterion 8: Status of the major shareholder "Directors representing major shareholders of the corporation or its parent company may be considered independent, provided these shareholders do not take part in the control of the corporation. Nevertheless, beyond a 10% threshold in capital or voting rights, the Board, upon a report from the nominations Committee, should systematically review the qualification of a director as independent in the light of the make-up of the corporation’s capital and the existence of a potential conflict of interest. |
It was confirmed, regarding the independence of Mses. Barbizet, Coisne-Roquette, van der Hoeven and Idrac and Messrs. Artus, Cutifani, Lamarche, Lemierre and Tavares that the independence analyses carried out previously remained relevant.
In particular, the following was noted as of the date of December 31, 2018.
-The level of activity between Group companies and companies of BNP Paribas, of which Mr. Lemierre is Chairman of the Board of Directors, did not represent a material part of the financial institution’s overall business (the level of activity of the Group companies with BNP Paribas is less than 0.1% of this bank’s net banking income (1)), nor a material part of the total amount of external financing of the Group’s activities (less than 5%). The Board noted the absence of economic dependence and exclusivity in the activities between the two groups. It thus concluded that Mr. Lemierre could be deemed to be an independent director.
-The level of activity between Group companies and companies of the Natixis group, of which Mr. Artus is a member of the Executive Committee, did not represent a material part of this group’s overall business (the level of activity of the Group companies with Natixis is less than 0.2% of this bank’s net banking income (1)), nor a material part of the total amount of external financing of the Group’s activities (less than 5%). The Board noted the absence of economic dependence and exclusivity in the activities between the two groups. It thus concluded that Mr. Artus could be deemed to be an independent director.
-Regarding Peugeot S.A., of which Mr. Tavares is Chairman of the Managing Board, on the one hand, the Group’s sales to Peugeot S.A. in 2018 (i.e., €519 million) represented 0.29% of the Group’s 2018 consolidated sales ($209 billion, i.e., €177 billion) and, on the other hand, the amount of the Group’s purchases from Peugeot S.A. in 2018 (i.e., €50.9 million) represented 0.23% of the total amount of purchases made by the Group in 2018 (i.e. €22 billion). The portion of the Group’s business with Peugeot S.A. cannot be considered material. Moreover, for Peugeot S.A., on the one hand, the amount of Peugeot’s purchases from the Group in 2018 (i.e., €519 million) represented 1.3% of the total amount of Peugeot S.A.’s purchases in 2018 (i.e., €38.8 billion) and, on the other hand, the amount of Peugeot S.A.’s sales in 2018 to the Group (i.e., €50,9 million) represented 0.08% of Peugeot S.A.’s consolidated sales in 2017 (i.e., €65.2 billion). The portion of Peugeot S.A.’s business with the Group cannot be considered material for Peugeot S.A. The Board noted the absence of economic dependence and exclusivity in the activities between the two groups. It thus concluded that Mr. Tavares could be deemed to be an independent director.
(1) 2018 net banking income.
-Regarding Anglo American plc, of which Mr. Cutifani is Chief Executive, on the one hand, the Group’s sales to Anglo American plc in 2018 (i.e., $345 million) represented 0.16% of the Group’s consolidated sales in 2018 (i.e., $209 billion) and, on the other hand, the amount of the Group’s purchases from Anglo American plc in 2018 was immaterial. The portion of the Group’s business with Anglo American plc cannot be considered material for the Group. Moreover, for Anglo American plc, on the one hand the amount of Anglo American plc’s purchases in 2018 from the Group (i.e., $345 million) represented 3.2% of the total amount of Anglo American plc’s purchases in 2018 (i.e., $10.8 billion) and, on the other hand, the amount of Anglo American plc’s sales in 2018 to the Group was immaterial. The portion of Anglo American plc’s business with the Group cannot be considered material for Anglo American plc. The Board noted the absence of economic dependence and exclusivity in the activities between the two groups. It thus concluded that Mr. Cutifani could be deemed to be an independent director.
-The level of activity between Group companies and companies of the Sonepar group, of which Ms. Coisne-Roquette is Chairwoman, did not represent a material part of the overall business of the Sonepar group; the purchases made by Group companies from the Sonepar group totaled €1.4 million in 2018, i.e., 0.01% of the total amount of purchases made by the Group in 2018 (€22 billion). The Board noted the absence of economic dependence and exclusivity in the activities between the two groups. It thus concluded that Ms. Coisne-Roquette could be deemed to be an independent director.
-The level of activity between Group companies and companies of the Artémis group, of which Ms. Barbizet was a Chief Executive Officer until January 2018, did not represent a material part of the overall business of the Artémis group (the purchases made by Group companies from the Artémis group were not material), nor a material part of the Group’s purchases in 2018 (close to 0%). The Board noted the absence of economic dependence and exclusivity in the activities between the two groups. It thus concluded that Ms. Barbizet could be deemed to be an independent director.
-The level of the holding of stock in TOTAL S.A. by Groupe Bruxelles Lambert, of which Mr. Lamarche is Deputy Managing Director, which was less than 1% of the share capital as of December 31, 2018, was not material and did not call into question Mr. Lamarche’s independence.
Accordingly, following the Governance and Ethics Committee’s proposal, Mses. Barbizet, Coisne-Roquette, van der Hoeven and Idrac and Messrs. Artus, Cutifani, Lamarche, Lemierre and Tavares were considered independent directors.
The percentage of independent directors on the Board based on its composition as of December 31, 2018, was 90% (1).
The rate of independence of the Board of Directors is higher than the rate of independence recommended by the AFEP-MEDEF Code, which specifies that at least half of the members of the Board in widely-held companies with no controlling shareholders must be independent.
Summary of the independence of the members of the Board of Directors
Appendix 3 of the AFEP-MEDEF Code - Independence of Directors
As of December 31, 2018
Criteria (a) | Patrick Pouyanné | Patrick Artus | Patricia Barbizet | Marie-Christine Coisne-Roquette | Mark Cutifani | Maria van der Hoeven | Anne-Marie Idrac | Gérard Lamarche | Jean Lemierre | Renata Perycz (b) | Christine Renaud (c) | Carlos Tavares |
Criterion 1: Employee corporate officer within the past 5 years | X | ✔ | ✔ | ✔ | ✔ | ✔ | ✔ | ✔ | ✔ | n/a | n/a | ✔ |
Criterion 2: Cross-directorships | ✔ | ✔ | ✔ | ✔ | ✔ | ✔ | ✔ | ✔ | ✔ | n/a | n/a | ✔ |
Criterion 3: Significant business relationships | ✔ | ✔ | ✔ | ✔ | ✔ | ✔ | ✔ | ✔ | ✔ | n/a | n/a | ✔ |
Criterion 4: Family ties | ✔ | ✔ | ✔ | ✔ | ✔ | ✔ | ✔ | ✔ | ✔ | n/a | n/a | ✔ |
Criterion 5: Auditor | ✔ | ✔ | ✔ | ✔ | ✔ | ✔ | ✔ | ✔ | ✔ | n/a | n/a | ✔ |
Criterion 6: Period of office exceeding 12 years | ✔ | ✔ | ✔ | ✔ | ✔ | ✔ | ✔ | ✔ | ✔ | n/a | n/a | ✔ |
Criterion 7: Status of non-executive director | n/a | n/a | n/a | n/a | n/a | n/a | n/a | n/a | n/a | n/a | n/a | n/a |
Criterion 8: Status of major shareholder | ✔ | ✔ | ✔ | ✔ | ✔ | ✔ | ✔ | ✔ | ✔ | n/a | n/a | ✔ |
Compliance with the independence criteria of the AFEP- MEDEF Code | X | ✔ | ✔ | ✔ | ✔ | ✔ | ✔ | ✔ | ✔ | n/a (d) | n/a (d) | ✔ |
(a) In this table, ✔ signifies that a criterion for independence is satisfied and X signifies that a criterion for independence is not satisfied.
(b) Director representing employee shareholders.
(c) Director representing employees.
(d) Excluding the director representing employee shareholders and the director representing employees, in accordance with the recommendations of the AFEP-MEDEF Code (point 8.3).
(1) Excluding the director representing employee shareholders and the director representing employees, in accordance with the recommendations of the AFEP-MEDEF Code (point 8.3).
4.1.1.5 Diversity policy of the Board of Directors
The Board of Directors places a great deal of importance on its composition and the composition of its Committees. In particular, it relies on the work of the Governance and Ethics Committee, which reviews annually and proposes, as circumstances may require, desirable changes to the composition of the Board of Directors and Committees based on the Group’s strategy.
The Governance and Ethics Committee conducts its work within the framework of a formal procedure so as to ensure that the directors’ areas of expertise are complementary and that their profiles are diverse, to maintain an overall proportion of independent members that is appropriate to the Company’s governance structure and shareholder base, to allow for a balanced representation of women and men on the Board, as well as to promote an appropriate representation of directors of different nationalities.
As part of an effort that began several years ago, the composition of the Board of Directors has changed significantly since 2010 to achieve better gender balance and an openness to more international profiles.
Based on its composition as of March 13, 2019, the 12 members of the Board of Directors include 6 male directors and 6 female directors, with 6 nationalities represented.
In accordance with Article L. 225-27-1 of the French Commercial Code, the director representing employees is not taken into account for the application of the provisions relating to the gender balance of the Board. Therefore, the proportion of women on the Board was 45.5% as of December 31, 2018 (5 women out of 11 directors).
The 40% threshold of directors from each gender required by Article L. 225-18-1 of the French Commercial Code was reached as of December 31, 2018.
4.1.1.6 Training of directors and knowledge of the Company
Directors may ask to receive training in the specifics of the Company, its businesses and its business sector, as well as any training that may help them perform their duties as directors.
In addition, the director representing employees receives in-house training time at the Company and/or economics training offered by an outside body chosen by the director, after the Board Secretary has accepted the body and the training program. This training time, which was initially set at 20 hours per year, has been increased to 60 hours per year by decision of the Board of Directors at its meeting of July 26, 2017.
Since 2013, the Board of Directors has met each year at a Group site. Having been to the CSTJF (Centre scientifique et technique Jean Féger) in Pau, France, the Antwerp platform in Belgium, the Bu Hasa field in Abu Dhabi and the Laggan project site in the North Sea in the United Kingdom, the Board of Directors visited in 2018 the Yamal LNG site in Northern Russia at the time of the Board meeting held in Russia on October 25, 2018.
Several directors also had an opportunity to visit other Group sites in 2018. Mses. van der Hoeven, Perycz and Renaud visited the Umm Shaif offshore field (Abu Dhabi) in September 2018. Mses. Barbizet and Idrac visited the deepwater operational center in Lagos, the FPSO of the AKPO offshore field and the LNG plant on Bonny Island (Nigeria) in December 2018.
These site visits by the Board of Directors and its members are opportunities to meet with the Group’s employees, partners and leading figures in the energy sector.
The directors also have regular contact with Group management, including members of the Executive Committee at Board meetings and operational managers during visits to the Group’s sites. These interactions between directors and managers help the directors better understand the Group’s activities in a practical way.
4.1.1.7 Renewal of directorships and appointments proposed to the Shareholders’ Meeting of May 29, 2019
The terms of office of directors Ms. Maria van der Hoeven and Messrs. Gérard Lamarche and Jean Lemierre, as well as the term of office of Ms. Renata Perycz, director representing employee shareholders, will expire at the Annual Ordinary Shareholders’ Meeting of May 29, 2019.
Renewal of directorships
At its meeting on March 13, 2019, the Board of Directors, on the proposal of the Governance and Ethics Committee, decided to submit to the Annual Shareholders’ Meeting of May 29, 2019, the renewal of the directorships of Ms. Maria van der Hoeven and Mr. Jean Lemierre for a three-year term to expire at the end of the Annual Shareholders’ Meeting to be held in 2022 to approve the 2021 financial statements.
Ms. Maria van der Hoeven will continue to offer the Group her knowledge of the energy sector.
Mr. Jean Lemierre will continue to offer the Group his expertise in banking and finance matters, as well as his experience in international relations.
Appointment of Ms. Lise Croteau as a director
At the meeting of March 13, 2019, the Board of Directors decided, on the proposal of the Governance and Ethics Committee, to propose to the same Shareholders’ Meeting the appointment of Ms. Lise Croteau as a director for a three-year term to expire at the end of the Shareholders’ Meeting to be held in 2022 to approve the 2021 financial statements.
Ms. Lise Croteau, of Canadian nationality, will bring in particular to the Board her knowledge of the electricity and renewable energies field as well as of financial field. After analysis based on the independence criteria set forth in point 8.5 of the AFEP-MEDEF Code, the Board noted that Mrs. Croteau could be considered as independent.
Appointment of the director representing employee shareholders
As the term of office of Ms. Perycz, director representing employee shareholders, will expire at the Annual Ordinary Shareholders’ Meeting of May 29, 2019, the Board of Directors, at its meeting on March 13, 2019, and on the proposal of the Governance and Ethics Committee, decided to submit to the Annual Shareholders’ Meeting of May 29, 2019, the resolutions regarding the appointment of the new director representing employee shareholders.
In accordance with Article 11 of the Company’s bylaws, the Annual Shareholders’ Meeting of May 29, 2019, will be asked to appoint the director representing employee shareholders from among the following candidates:
-Ms. Valérie Della Puppa Tibi, member of the Supervisory Board of the "Total Actionnariat France" collective investment fund (FCPE), designated as a candidate for the position of director representing employee shareholders by the Supervisory Board of the "Total Actionnariat France" FCPE (89.2 million shares of the Company held as of December 31, 2018) as well as by the Supervisory Board of the "Total France Capital +" FCPE (which held 5.7 million shares of the Company as of December 31, 2018).
-Ms. Renata Perycz, member of the "Total Actionnariat International Capitalisation" FCPE, designated as a candidate for the position of director representing employee shareholders by the Supervisory Board of the "Total Actionnariat International Capitalisation" FCPE (which held 26.1 million shares of the Company as of December 31, 2018) as well as by the Supervisory Board of the FCPE "Total International Capital" (which held 2.6 million shares of the Company as of December 31, 2018).
-Mr. Oliver Wernecke, elected as a candidate for the position of director representing employee shareholders, by the shareholders who have individual voting rights and together holding 2.77 million shares of the Company as of December 31, 2018.
In accordance with Article 11 of the Company’s bylaws, in order to be appointed as director representing employee shareholders, the candidate must receive a majority of the votes of the shareholders present and represented at the Shareholders’ Meeting. Since only one seat is to be filled, only the candidate who receives the highest number of votes (and at least a majority of the votes) cast by the shareholders present and represented will be appointed as director representing employee shareholders and will serve on the Board of Directors for the three-year term stipulated in the bylaws.
The Board of Directors, at its meeting on March 13, 2019, and on the proposal of the Governance and Ethics Committee, decided, in accordance with Article 11 paragraph 20 of the bylaws, to approve the resolution proposing the appointment of Ms. Valérie Della Puppa Tibi as director representing employee shareholders.
The Board of Directors, that had chosen to approve in 2016 the candidate elected by the Total Actionnariat International Capitalisation fund (employees of international subsidiaries) to diversify the origin of the employees represented on the Board of Directors after the Shareholders’ Meeting appointed on four occasions from 2004 to 2013 a representative of the Total Actionnariat France fund (French employees), this time decided to approve the application of the representative of the Total Actionnariat France fund taking into account, on the one hand, that it is the fund representing the largest number of employee shareholders and, on the other hand, the ongoing evolution of French legislation, which will lead to the appointment of a second director representing the employees in the Board to be appointed by the European Committee of the Group.
At the end of the Shareholders’ Meeting of May 29, 2019, if the proposed resolutions were approved, the Board of Directors would comprise 12 members (as previously). The proportion of Directors of each sex would be greater than 40% in accordance with the provisions of Article L. 225-18-1 of the French Commercial Code (1).
4.1.2 Practices of the Board of Directors
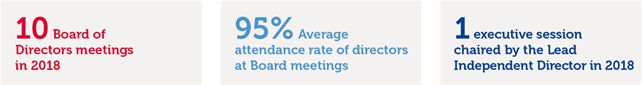
4.1.2.1 Working procedures of the Board of Directors
The working procedures of the Board of Directors are set out in its Rules of Procedure, which specify the mission of the Board of Directors and the rules related to the organization of its work. The Board’s Rules of Procedure also specify the obligations of each director, as well as the role and powers of the Chairman and the Chief Executive Officer.
Mr. Charles Paris de Bollardière has served as Secretary of the Board of Directors since his appointment by the Board of Directors on September 15, 2009.
Since November 4, 2014, the date of the first appointment of the director representing employees on the Board of Directors, a member of the Central Works Council (replaced since December 2018 by the Central Social and Economic Committee) attends Board meetings in an advisory capacity, pursuant to Article L. 2312-75 of the French Labor Code.
The Rules of Procedure of the Board of Directors are reviewed on a regular basis in order to adapt them to changes in governance rules and practices. In 2014, changes were made to include, in particular, new provisions relating to information of the Board of Directors in the event of new directorships being assumed by the directors or changes in existing directorships, together with a reminder of the obligations of confidentiality inherent to the work of the Board. In December 2015, changes were made to provide for the appointment of a Lead Independent Director in the event of the combination of the functions of Chairman of the Board and Chief Executive Officer and to define his or her duties. In July 2018, changes were made in response to the new demands pertaining to social and environmental responsibility further to the revision of the AFEP-MEDEF Code in June 2018.
The text of the latest unabridged version of the Rules of Procedure of the Board of Directors, as approved by the Board of Directors at its meeting on July 25, 2018, is provided below. It is also available on the Company’s website under "Our Group/Our identity/Our governance".
The Board of Directors of TOTAL S.A (2) approved the following Rules of Procedure. 1. ROLE OF THE BOARD OF DIRECTORS The Board of Directors is a collegial body that determines the strategic direction of the Company and supervises the implementation of this vision. With the exception of the powers and authority expressly reserved for shareholders and within the limits of the Company’s legal purpose, the Board may address any issue related to the Company’s operation and make any decision concerning the matters falling within its purview. Within this framework, the Board’s duties and responsibilities include, but are not limited to, the following: -appointing the executive directors (3) and supervising the handling of their responsibilities; -striving to promote creation of long-term value by the Company by taking into account the social and environmental challenges of its activities; -defining the Company’s strategic orientations and, more generally, that of the Group; -regularly reviewing, in relation with such strategic orientations, opportunities and risks such as financial, legal, operational, social and environmental risks as well as measures taken as a result; -being informed of market developments, the competitive environment and the main challenges facing the Company, including with regard to social and environmental responsibility; -approving investments or divestments being considered by the Group that exceed 3% of shareholders’ equity as well as any significant transaction outside the announced strategy of the Company; -reviewing information on significant events related to the Company’s operations, in particular for investments and divestments involving amounts exceeding 1% of shareholders’ equity; |
(1) Excluding the director representing employees, in accordance with Article L. 225-27-1 of the French Commercial Code.
(2) TOTAL S.A. is referred to in these Rules of Procedure as the "Company" and collectively with all its direct and indirect subsidiaries as the "Group".
(3) The term "executive director" refers to the Chairman and Chief Executive Officer, if the Chairman of the Board of Directors is also responsible for the management of the Company; the Chairman of the Board of Directors and the Chief Executive Officer, if the two roles are carried out separately; and, where applicable, any Deputy Chief Executive Officers or Chief Operating Officers, depending on the organisational structure adopted by the Board of Directors.
-ensuring that its composition as well as that of the Committees it establishes are balanced in terms of diversity (nationality, age, gender, skills and professional experience); -conducting any audits and investigations it deems appropriate. In particular, the Board, with the assistance of the Committees it has established, ensures that: -authority has been properly defined and that the various corporate bodies of the Company make proper use of their powers and responsibilities, -no individual is authorized to commit to pay or to make payments, on behalf of the Company, without proper supervision and control, -a system for preventing and detecting corruption and influence peddling is in place, -a non-discrimination and diversity policy within the Company and its Group exists and is implemented, -the internal control function operates properly and the statutory auditors are able to perform their mission satisfactorily, and -the Committees duly perform their responsibilities; -ensuring the quality of the information provided to shareholders and financial markets through the financial accounts that it closes and the reports that it publishes, as well as when major transactions are completed; -convening and setting the agenda for Shareholders’ Meetings or meetings of bond holders; -preparing on an annual basis the list of directors it deems to be independent according to criteria set by the Code of Corporate Governance to which the Company refers; and -appointing a Lead Independent Director under the conditions set out in article 7, when the Chairman of the Board of Directors is also the Chief Executive Officer pursuant to a decision by the Board of Directors. 2. OBLIGATIONS OF THE DIRECTORS OF TOTAL S.A. Before accepting a directorship, all candidates receive a copy of TOTAL S.A.’s bylaws and these rules of procedure. They must ensure that they have broad knowledge of the general and particular obligations related to their duty, especially the laws and regulations governing directorships in French limited liability companies (sociétés anonymes) whose shares are listed in one or several regulated markets. They must also ensure that they are familiar with the guidelines set out in the Corporate Governance Code to which the Company refers. Accepting a directorship creates an obligation to comply with applicable regulations relating in particular to the functioning of the Board of Directors, and with the ethical Rules of Professional Conduct for directors as described in the Corporate Governance Code to which the Company refers. It also creates an obligation to comply with these rules of procedure and to uphold the Group’s values as described in its Code of Conduct. When directors participate in and vote at meetings of the Board of Directors, they are required to represent all of the Company’s shareholders and to act in the interest of the Company as a whole. 2.1 Independence of judgment Directors undertake to maintain, in all circumstances, the independence of their analysis, judgment, decision-making and actions as well as not to be unduly influenced, directly or indirectly, by other directors, particular groups of shareholders, creditors, suppliers or, more generally, any third party. 2.2 Other directorships or functions Directors must keep the Board of Directors informed of any position they hold on the management team, Board of Directors or Supervisory Board of any other company, whether French or foreign, listed or unlisted. This includes any positions as a non-voting member (censeur) of a board. To this end, directors expressly undertake to promptly notify the Chairman of the Board of Directors, and the Lead Independent Director if one has been appointed, of any changes to the positions held, for any reason, whether appointment, resignation, termination or non-renewal. 2.3 Participation in the board’s work Directors undertake to devote the amount of time required to duly consider the information they are given and otherwise prepare for meetings of the Board of Directors and of the Committees of the Board of Directors on which they sit. They may request from the executive directors any additional information they deem necessary or useful to their duties. If they consider it necessary, they may request training on the Company’s specificities, businesses and industry sector, its challenges in terms of social and environmental responsibility as well as any other training that may be of use to the effective exercise of their duties as directors. Unless unable, in which case the Chairman of the Board shall be provided advance notice, directors are to attend all meetings of the Board of Directors, meetings of Committees of the Board of Directors on which they serve and Shareholders’ Meetings. The Chairman of the Board ensures that directors receive all relevant information concerning the Company, including that of a negative nature, particularly analyst reports, press releases and the most important media articles. 2.4 Confidentiality Directors and any other person who attends all or part of any meeting of the Board of Directors or its Committees, are under the strict obligation not to disclose any details of the proceedings. All documents reviewed at meetings of the Board of Directors, as well as information conveyed prior to or during the meetings, are strictly confidential. With respect to all non-public information acquired during the exercise of their functions, directors are bound by professional secrecy not to divulge such information to employees of the Group or to outside parties. This obligation goes beyond the mere duty of discretion provided for by law. Directors must not use confidential information obtained prior to or during meetings for their own personal benefit or for the benefit of anyone else, for whatever reason. They must take all necessary steps to ensure that the information remains confidential. Confidentiality and privacy are lifted when such information is made publicly available by the Company. 2.5 Duty of loyalty Directors must not take advantage of their office or duties to gain, for themselves or a third party, any monetary or non-monetary benefit. They must notify the Chairman of the Board of Directors and the Lead Independent Director, if one has been appointed, of any existing or potential conflict of interest with the Company or any Group company, and they must refrain from participating in the vote relating to the corresponding resolution as well as from participating in any debates preceding such vote. Directors must inform the Board of Directors of their participation in any transaction that directly involves the Company, or any Group company, before such transaction is finalized. Directors must not assume personal responsibilities in companies or businesses having activities in competition with those of the Company or any Group company without first having informed the Board of Directors. Directors undertake not to seek or accept from the Company, or from companies directly or indirectly connected to the Company, any advantages liable to be considered as being of a nature that may compromise their independence. |
2.6 Duty of expression Directors undertake to clearly express their opposition if they deem a decision being considered by the Board of Directors is contrary to the Company’s corporate interest and they must endeavor to convince the Board of Directors of the pertinence of their position. 2.7 Transactions in the company’s securities and stock exchange rules While in office, directors are required to hold the minimum number of registered shares of the Company as set by the bylaws. Generally speaking, directors must act with the highest degree of prudence and vigilance when completing any personal transaction involving the financial instruments of the Company, its subsidiaries or affiliates that are listed or that issue listed financial instruments. To that end, directors must comply with the following requirements: 1. Any shares or ADRs of TOTAL S.A. or its listed subsidiaries are to be held in registered form, either with the Company or its agent, or as administered registered shares with a French broker (or North American broker for ADRs), whose contact details are communicated by the director to the Secretary of the Board of Directors. 2. Directors shall refrain from directly or indirectly engaging in (or recommending engagement in) transactions involving the financial instruments (shares, ADRs or any other securities related to such financial instruments) of the Company or its listed subsidiaries, or any listed financial instruments for which the director has insider information. Insider information is specific information that has not yet been made public and that directly or indirectly concerns one or more issuers of financial instruments or one or more financial instruments and which, if it were made public, could have a significant impact on the price of the financial instruments concerned or on the price of financial instruments related to them. 3. Any transaction in the Company’s financial instruments (shares, ADRs or related financial instruments) is strictly prohibited during the thirty calendar days preceding the publication by the Company of its periodic results (quarterly, half-year or annual) as well as on the day of any such announcement. 4. Moreover, directors shall comply, where applicable, with the provisions of Article L. 225-197-1 of the French Commercial Code, which stipulates that free shares may not be sold: -during the ten trading days preceding and the three trading days following the date on which the Consolidated Financial Statements or, failing that, the annual financial statements, are made public; and -during the period from the date on which the Company’s corporate bodies become aware of information that, if it were made public, could have a significant impact on the Company’s share price, until ten trading days after such information is made public. 5. Directors are prohibited from carrying out transactions on any financial instruments related to the Company’s share (Paris option market (MONEP), warrants, exchangeable bonds, etc.), and from buying on margin or short selling such financial instruments. 6. Directors are also prohibited from hedging the shares of the Company and any financial instruments related to them, and in particular: -Company shares that they hold; and, where applicable, - Company share subscription or purchase options, - rights to Company shares that may be awarded free of charge, and - Company shares obtained from the exercise of options or granted free of charge. 7. Directors must make all necessary arrangements to declare, pursuant to the form and timeframe provided by applicable law, to the French securities regulator (Autorité des marchés financiers), as well as to the Secretary of the Board of Directors, any transaction involving the Company’s securities conducted by themselves or by any other person to whom they are closely related. 3. FUNCTIONING OF THE BOARD OF DIRECTORS 3.1 Board meetings The Board of Directors meets at least four times a year and whenever circumstances require. Prior to each Board meeting, the directors receive the agenda and, whenever possible, all other materials necessary to consider for the session. Directors may be represented by another director at a meeting of the Board, provided that no director holds more than one proxy at any single meeting. Whenever authorized by law, directors are considered present for quorum and majority purposes who attend Board meetings through video conferencing or other audiovisual means that are compliant with the technical requirements set by applicable regulations. 3.2 Directors’ fees The Board of Directors allocates annual directors’ fees within the total amount authorized by the Annual Shareholders’ Meeting. Compensation includes a fixed portion and a variable portion that takes into account each directors’ actual participation in the work of the Board of Directors and its Committees together with, if applicable, the duties of the Lead Independent Director. The Chief Executive Officer or, if the functions are combined, the Chairman and Chief Executive Officer, does not receive any director’s fees for his participation in the work of the Board and its Committees. 3.3 Secretary of the Board of Directors The Board of Directors, based on the recommendation of its Chairman, appoints a Secretary of the Board who assists the Chairman in organizing the Board’s activities, and particularly in preparing the annual work program and the schedule of Board meetings. The Secretary drafts the minutes of Board meetings, which are then submitted to the Board for approval. The Secretary is authorized to dispatch Board meeting minutes and to certify copies and excerpts of the minutes. The Secretary is responsible for all procedures pertaining to the functioning of the Board of Directors. These procedures are reviewed periodically by the Board. All Board members may ask the Secretary for information or assistance. 3.4 Evaluation of the functioning of the Board of Directors The Board evaluates its functioning at regular intervals not exceeding three years. The evaluation is carried out under the supervision of the Lead Independent Director, if one has been appointed, or under the supervision of the Governance and Ethics Committee, with the assistance of an outside consultant. The Board of Directors also conducts an annual review of its practices. |
4. ROLE AND AUTHORITY OF THE CHAIRMAN The Chairman represents the Board of Directors and, except under exceptional circumstances, has sole authority to act and speak on behalf of the Board of Directors. The Chairman organizes and oversees the work of the Board of Directors and ensures that the Company’s corporate bodies operate effectively and in compliance with good governance principles. The Chairman coordinates the work of the Board of Directors and its Committees. The Chairman establishes the agenda for each Board meeting, including items suggested by the Chief Executive Officer. The Chairman ensures that directors receive, in a timely manner and in a clear and appropriate format, the information they need to effectively carry out their duties. In liaison with the Group’s General Management, the Chairman is responsible for maintaining relations between the Board of Directors and the Company’s shareholders. The Chairman monitors the quality of information disclosed by the Company. In close cooperation with the Group’s General Management, the Chairman may represent the Company in high-level discussions with government authorities and major partners, both at a national and international level. The Chairman is regularly informed by the Chief Executive Officer of significant events and situations relating to the Group, particularly with regard to strategy, organization, monthly financial reporting, major investment and divestment projects and key financial transactions. The Chairman may ask the Chief Executive Officer or other senior executives of the Company, provided that the Chief Executive Officer is informed, to supply any information that may help the Board or its Committees to carry out their duties. The Chairman may meet with the statutory auditors in order to prepare the work of the Board of Directors and the Audit Committee. Every year, the Chairman presents a report to the Annual Shareholders’ Meeting describing the preparation and organisation of the Board of Directors’ work, any limits set by the Board of Directors concerning the powers of the Chief Executive Officer, and the internal control procedures implemented by the Company. To this end, the Chairman obtains the necessary information from the Chief Executive Officer. 5. AUTHORITY OF THE CHIEF EXECUTIVE OFFICER The Chief Executive Officer is responsible for the Company’s overall management. He represents the Company in its relationships with third parties and chairs the Executive Committee. The Chief Executive Officer is vested with the broadest powers to act on behalf of the Company in all circumstances, subject to the powers that are, by law, restricted to the Board of Directors and to the Annual Shareholders’ Meeting, as well as to the Company’s corporate governance rules and in particular these rules of procedure of the Board of Directors. The Chief Executive Officer is responsible for presenting the Group’s results and prospects to shareholders and the financial community on a regular basis. At each meeting of the Board of Directors, the Chief Executive Officer presents an overview of significant Group events. 6. BOARD COMMITTEES The Board of Directors approved the creation of: -an Audit Committee; -a Governance and Ethics Committee; -a Compensation Committee; and -a Strategy & CSR Committee. The roles and composition of each Committee are set forth in their respective rules of procedure, which have been approved by the Board of Directors. The Committees perform their duties under the authority and for the benefit of the Board of Directors. Each Committee reports on its activities to the Board of Directors. 7. LEAD INDEPENDENT DIRECTOR 7.1 Appointment of the Lead Independent Director When the functions of the Chairman of the Board and Chief Executive Officer are combined, the Board of Directors appoints a Lead Independent Director, on the recommendation of the Governance and Ethics Committee, among the directors considered to be independent by the Board of Directors. The appointed Lead Independent Director holds this position while in office as director, unless otherwise decided by the Board of Directors, which may choose to terminate his duties at any time. If for any reason the director is no longer deemed to be independent, his or her position as Lead Independent Director will be terminated. The Lead Independent Director, if one is appointed, chairs the Governance and Ethics Committee. 7.2 Duties of the Lead Independent Director The Lead Independent Director’s duties include: 1. Convening meetings of the Board of Directors - Meeting Agenda The Lead Independent Director may request that the Chairman and Chief Executive Officer call a meeting of the Board of Directors to discuss a given agenda. He may request that the Chairman and Chief Executive Officer include additional items on the agenda of any meeting of the Board of Directors. 2. Participation in the work of the Committees If not a member of the Compensation Committee, the Lead Independent Director is invited to attend meetings and participates in the work of the Compensation Committee relating to the annual review of the executive directors’ performance and recommendations regarding their compensation. 3. Acting as Chairperson of Board of Directors’ meetings When the Chairman and Chief Executive Officer is unable to attend all or part of a meeting of the Board of Directors, the Lead Independent Director chairs the meeting. In particular, he or she chairs those Board meetings the proceedings of which relate to the evaluation of the performance of the executive directors and the determination of their compensation, which take place in their absence. 4. Evaluation of the functioning of the Board of Directors The Lead Independent Director manages the evaluation process relating to the functioning of the Board of Directors and reports on this evaluation to the Board of Directors. 5. Prevention of conflicts of interest Within the Governance and Ethics Committee, the Lead Independent Director organizes the performance of due diligence in order to identify and analyze potential conflicts of interest within the Board of Directors. He informs the Chairman and Chief Executive Officer of any conflicts of interest identified as a result and reports to the Board of Directors on these activities. Pursuant to the obligation to declare conflicts of interest set out in Article 2.5 of these Rules, any director affected by an existing or potential conflict of interest must inform the Chairman and Chief Executive Officer and the Lead Independent Director. |
6. Monitoring of the satisfactory functioning of the Board and compliance with the Rules of Procedure The Lead Independent Director ensures compliance with the rules of the Corporate Governance Code to which TOTAL S.A. refers and with the Rules of Procedure of the Board of Directors. He or she may make any suggestions or recommendations that he deems appropriate to this end. He or she ensures that the directors are in a position to carry out their tasks under optimal conditions and that they have sufficient information to perform their duties. With the agreement of the Governance and Ethics Committee, the Lead Independent Director may hold meetings of the directors who do not hold executive or salaried positions on the Board of Directors. He reports to the Board of Directors on the conclusions of such meetings. 7. Relationships with Shareholders The Chairman and Chief Executive Officer and the Lead Independent Director are the shareholders’ dedicated contacts on issues that fall within the remit of the Board. When a shareholder approaches the Chairman and Chief Executive Officer in relation to such issues, they may seek the opinion of the Lead Independent Director before responding appropriately to the shareholder’s request. When the Lead Independent Director is approached by a shareholder in relation to such issues, he or she must inform the Chairman and Chief Executive Officer, providing his or her opinion, so that the Chairman and Chief Executive Officer may respond appropriately to the request. The Chairman and Chief Executive Officer must inform the Lead Independent Director of the response given. With the consent of the Chairman of the Board of Directors, the Lead Independent Director may represent the Board of Directors at meetings with the shareholders of the Company on matters of corporate governance. 7.3 Resources, conditions of office and activity report The Chairman and Chief Executive Officer must regularly update the Lead Independent Director on the Company’s activities. The Lead Independent Director has access to all of the documents and information necessary for the performance of his or her duties. The Lead Independent Director may consult the Secretary of the Board and use the latter’s services in the performance of his or her duties. Under the conditions set out in Article 3.2 of these Rules and those established by the Board of Directors, the Lead Independent Director may receive additional director’s fees for the duties entrusted to him or her. The Lead Independent Director must report annually to the Board of Directors on the performance of his or her duties. During Annual General Meetings, the Chairman and Chief Executive Officer may invite the Lead Independent Director to report on his or her activities. |
4.1.2.2 Activity of the Board of Directors in 2018
Directors are in principle summoned to Board meetings by letter sent the week preceding the meetings. Whenever possible, documents to be considered for decisions to be made at Board meetings are sent with the notice of meetings. The minutes of the previous meeting are expressly approved at the following Board meeting.
In 2018, the Board of Directors held 10 meetings. The global attendance rate for the directors was 95%. The Audit Committee held 7 meetings, with an attendance rate of 100%; the Compensation Committee met twice, with 100% attendance; the Governance and Ethics Committee held 3 meetings, with 91.7% attendance; and the Strategy & CSR Committee met 3 times, with 100% attendance.
A table summarizing individual attendance at the Board of Directors and Committee meetings is provided below.
Directors’ attendance at Board and Committees meetings in 2018
Directors | Board of Directors | Audit Committee | Compensation Committee | Governance and Ethics Committee | Strategy & CSR Committee | |||||
Attendance rate | Number of meetings | Attendance rate | Number of meetings | Attendance rate | Number of meetings | Attendance rate | Number of meetings | Attendance rate | Number of meetings | |
Patrick Pouyanné, Chairman and Chief Executive Officer | 100% | 10/10 | - | - | - | - | - | - | 100% | 3/3 |
Patrick Artus | 100% | 10/10 | 100% | 7/7 | - | - | - | - | 100% | 3/3 |
Patricia Barbizet, Lead Independent Director | 100% | 10/10 | - | - | 100% | 2/2 | 100% | 3/3 | 100% | 3/3 |
Marie-Christine Coisne-Roquette | 100% | 10/10 | 100% | 7/7 | 100% | 2/2 | - | - | - | 3 (f) |
Mark Cutifani | 90% | 9/10 | - | - | - | - | 0% | 0/1 (c) | - | 2 (f) |
Maria van der Hoeven | 100% | 10/10 | 100% | 7/7 | - | - | - | - | - | 3 (f) |
Anne-Marie Idrac | 90% | 9/10 | - | - | - | - | 100% | 3/3 | 100% | 3/3 |
Gérard Lamarche | 100% | 10/10 | 100% | 7/7 | 100% | 2/2 | - | - | - | 3 (f) |
Jean Lemierre | 90% | 9/10 | - | - | - | - | 100% | 3/3 | 100% | 3/3 |
Renata Perycz (a) | 100% | 10/10 | - | - | 100% | 2/2 | - | - | 100% | 3 (f) |
Christine Renaud (b) | 100% | 10/10 | - | - | - | - | - | - | 100% | 3/3 (e) |
Carlos Tavares | 70% | 7/10 | - | - | - | - (c) | - | - | - | - (f) |
Attendance rate | 95% | 100% | 100% | 91.7% | 100% (d) | |||||
(a) Director representing employee shareholders.
(b) Director representing employees.
(c) Member of the Committee since June 1, 2018 - no meeting beyond this date in 2018.
(d) Excluding voluntary participation.
(e) Member of the Committee since June 1, 2018. Including one voluntary participation.
(f) Voluntary participation (director not a member of the Strategy & CSR Committee).
The Board meetings included, but were not limited to, a review of the following subjects:
February 7
-examination of the project to invest in the Umm Shaif/Nasr and Lower Zakum offshore concessions in the United Arab Emirates and authorization to issue corresponding guarantees;
-approval of the contribution by AP M-ller - Mærsk A/S to TOTAL S.A. of 100% of the share capital and voting rights of Mærsk Oil & Gas A/S - decision to increase the share capital - authorization to issue guarantees within the framework of this acquisition;
-presentation of the shareholder return policy;
-presentation to the Board of the work of the Audit Committee at its meeting on February 5, 2018;
-closing of the 2017 accounts (Consolidated Financial Statements, parent company accounts) after the Audit Committee’s report and work performed by the statutory auditors;
-draft allocation of the result of TOTAL S.A., setting of the dividend, ex-dividend and payment dates, option for the payment of the balance of the dividend in shares;
-main financial communication messages;
-presentation to the Board of the work of the Governance and Ethics Committee at its meeting on February 7, 2018;
-report of the Lead Independent Director on her mandate;
-discussion on the Board of Directors’ practices based on a formal self-assessment carried out in the form of a detailed questionnaire answered by each director, the process of which was conducted by the Lead Independent Director; suggestion of areas for improvement;
-review of the directorships: proposal for nomination and renewal of the directorships - composition of the Board’s Committees;
-assessment of the independence of the directors;
-allocation of directors’ fees for fiscal year 2017;
-market abuse regulations - blackout periods;
-information on transactions on the Company’s securities by the Chairman and Chief Executive Officer;
-information on the Directors and Officers liability insurance taken out by the Company;
-review of the draft report on corporate governance, drawn up in application of Article L. 225-37 of the French Commercial Code;
-presentation to the Board of the work of the Compensation Committee at its meeting on February 7, 2018;
-the Chairman and Chief Executive Officer’s compensation (in his absence);
-commitments made by the Company to the Chairman and Chief Executive Officer;
-examination of the conditions of implementation of performance shares grant plan in 2018;
-examination of certain points in the management report;
-approval of the Board of Directors’ report to the Shareholders’ Meeting regarding purchases and sales of shares of the Company pursuant to Article L. 225-211 of the French Commercial Code;
-information on the amount of the share capital of TOTAL S.A.;
-information about the results of the option to receive the payment of the second interim dividend for fiscal year 2017 in shares;
-renewal of the authorization to issue bonds;
-renewal of the authorization to issue security, commitments and guarantees;
-information on share buybacks; and
-declarations of crossing of thresholds in the Company’s share capital or voting rights.
March 14
-report on the acquisition of Mærsk Oil;
-presentation to the Board of the work of the Audit Committee at its meeting on March 12, 2018;
-presentation to the Board of the work of the Governance and Ethics Committee at its meeting on March 13, 2018;
-review of the directorships: proposal for nomination and renewal of the directorships;
-examination of the proposal by the Governance and Ethics Committee to maintain the combined positions of Chairman of the Board of Directors and Chief Executive Officer; proposal to renew the directorship of the Chairman of the Board of Directors and Chief Executive Officer, subject to the renewal of Mr. Pouyanné’s directorship by the Shareholders’ Meeting of June 1, 2018 (in the absence of the Chairman and Chief Executive Officer);
-composition of the Board’s Committees;
-presentation to the Board of the work of the Compensation Committee at its meeting on March 14, 2018;
-confirmation of the granting of performance shares under the terms of the 2015 plan, following examination of the fulfillment of the applicable performance conditions;
-compensation policy for the Chairman and Chief Executive Officer for fiscal year 2018;
-granting of performance shares to the Chairman and Chief Executive Officer and other beneficiaries;
-presentation to the Board of the work of the Strategy & CSR Committee at its meeting on March 14, 2018;
-approval of the Group’s financial policy;
-preparation for the Annual Shareholders’ Meeting; setting of the agenda for the Shareholders’ Meeting; approval of the various chapters of the Registration Document forming the management report within the meaning of the French Commercial Code, of the report on corporate governance and of the special reports on Company share options and the granting of performance shares; approval of the report of the Board of Directors and the text of the draft resolutions put to the Shareholders’ Meeting;
-press releases;
-setting the schedule related to the dividend (interim dividends and balance) for fiscal year 2019;
-distribution of the third interim dividend for the 2017 fiscal year and setting of the new share issue price for this interim dividend;
-information to the Board of Directors regarding the setting of the subscription period and price for shares of the Company for the 2018 share capital increase reserved for employees; and
-information on Company share buybacks.
April 17
-approval in principle of the project to acquire a controlling block in Direct Énergie, before submitting a public offer for the shares in Direct Énergie, listed on Euronext Paris, to the French Financial Markets Authority (Autorité des marchés financiers); and
-press release pertaining to this transaction.
April 25
-presentation to the Board of the work of the Strategy & CSR Committee at its meeting on March 14, 2018;
-presentation of the Group’s risk map and, in particular, presentation of the cybersecurity risk;
-statutory and Consolidated Financial Statements, results for the first quarter of 2018 after the Audit Committee’s report and work performed by the statutory auditors;
-presentation to the Board of the work of the Audit Committee at its meeting on April 23, 2018;
-setting of a first interim dividend on the dividend for fiscal year 2018;
-preparation for the Annual Shareholders’ Meeting; request for the addition of a draft resolution to the agenda of the Shareholders’ Meeting proposed by the Central Works Council;
-information and decisions pertaining to the 2018 share capital increase reserved for employees; supplementary report by the Board of Directors on the share capital increase reserved for employees;
-information about the results of the option to receive the payment of the third interim dividend for fiscal year 2017 in shares;
-information on Company share buybacks;
-authorization to issue guarantees; and
-declarations of crossing of thresholds in the Company’s share capital or voting rights.
June 1 - pre-Shareholders’ Meeting
-preparation for and organization of the Annual Shareholders’ Meeting: responses to the written questions submitted by shareholders;
-setting of the share issue price for the payment of the balance of the 2017 dividend, subject to the approval of the third resolution by the Shareholders’ Meeting on June 1, 2018; and
-authorization to issue guarantees.
June 1 - post-Shareholders’ Meeting
-appointment of the Chairman and Chief Executive Officer and form of management;
-determination of the compensation of the Chairman and Chief Executive Officer by application of the compensation policy of the Chairman and Chief Executive Officer for 2018, as adopted by the Board of Directors on March 14, 2018, and approved by the Shareholders’ Meeting on June 1, 2018 (twelfth resolution);
-confirmation of all the provisions of the commitments made by the Company in favor of the Chairman and Chief Executive Officer, as described in the compensation policy for the Chairman and Chief Executive Officer for 2018, adopted by the Board of Directors on March 14, 2018, and approved by the Shareholders’ Meeting on June 1, 2018 (twelfth resolution);
-reimbursement of the expenses incurred by the Directors and the Chairman and Chief Executive Officer; and
-renewal of the authorization to issue securities, commitments and guarantees, of the authorization to issue bonds and of the authorization to issue guarantees for certain financial transactions; delegation of powers to buy back Company shares; delegation of powers to increase the share capital.
July 25
-information on the project to acquire Direct Énergie;
-information on the acquisition of 25% of the capital of Clean Energy Fuels Corp.;
-presentation of the strategic perspectives of the Refining & Chemicals segment, including safety and energy efficiency aspects, the improvement of operational performance and the control of investments;
-statutory and Consolidated Financial Statements, results for the second quarter 2018 and the first half of 2018 after the Audit Committee’s report and work performed by the statutory auditors;
-presentation to the Board of the work of the Audit Committee at its meetings on June 12 and July 23, 2018;
-setting of a second interim dividend on the dividend for fiscal year 2018;
-presentation to the Board of the work of the Governance and Ethics Committee at its meeting on July 25, 2018;
-information on the Shareholders’ Meeting on June 1, 2018, and results of the votes;
-information on the revision of the AFEP-MEDEF Code and changes to the rules of procedure of the Board of Directors, of the Audit Committee, of the Governance and Ethics Committee, of the Compensation Committee and of the Strategy & CSR Committee;
-information about the results of the option to receive the payment of the dividend for fiscal year 2017 in shares;
-information on bond issues;
-declarations of crossing of thresholds in the Company’s share capital; and
-information on Company share buybacks.
September 19
-presentation to the Board of the report of the Strategy & CSR Committee at its meeting on September 19, 2018;
-strategic perspectives of Exploration & Production activities with a presentation of safety indicators and environmental objectives;
-presentation of the Group’s five-year plan;
-information to be presented to investors in September 2018 in New York on the strategy and the perspectives of the Group;
-the Company’s strategic directions (Article L. 2323-10 of the French Labor Code);
-share capital increase reserved for employees (Total Capital 2019) and grant of free shares as a deferred contribution in this framework;
-distribution of the first interim dividend for the 2018 fiscal year and setting of the issue price of new shares for the option to receive the interim dividend in shares; and
-information on bond issues.
October 25 (in Moscow)
-presentation to the Board of the work of the Strategy & CSR Committee at its meeting on September 19, 2018;
-presentation of the results of the public offer to acquire Direct Énergie;
-strategic perspectives of the Marketing & Services segment;
-presentation of the Company’s equal opportunity and salary equality policy and comparative status of overall employment and training conditions for women and men in the company;
-Consolidated Financial Statements, results for the third quarter of 2018 after the Audit Committee’s report and work performed by the statutory auditors;
-presentation to the Board of the work of the Audit Committee at its meetings on October 9 and 23, 2018;
-setting a third interim dividend to be paid on the dividend for fiscal year 2018;
-information on bond issues;
-information about the results of the option to receive the payment of the first interim dividend for fiscal year 2018 in shares;
-authorization to issue guarantee;
-declarations of crossing of thresholds in the Company’s share capital; and
-information on the situation of the legal proceedings (Iran - South Pars 2&3).
December 12
-presentation of the project to invest in the Arctic LNG 2 project;
-presentation of the project to sell off a 4% stake in the Ichtys project in Australia;
-presentation of the Strategy & CSR Committee report of December 12, 2018;
-presentation of the Group’s 2019 budget;
-Board of Directors’ response to the Central Works Council’s opinion on the Company’s strategic directions;
-distribution of the second interim dividend for the 2018 fiscal year and setting of the issue price of new shares;
-reduction of the Company’s capital through the cancellation of treasury shares;
-agreements and commitments concluded and authorized in the preceding periods, the execution of which continued during the 2018 fiscal year;
-information on bond issues; and
-authorization to issue guarantees.
4.1.2.3 Committees of the Board of Directors
The Audit Committee
Composition
As of March 13, 2019 | Independence | Years of service of the Board | Expiry of director’s term of office |
Marie-Christine Coisne-Roquette* | ✔ | 8 | 2020 |
Patrick Artus | ✔ | 10 | 2021 |
Maria van der Hoeven | ✔ | 3 | 2019 |
Gérard Lamarche | ✔ | 7 | 2019 |
* Chairperson of the Committee. |
As of March 13, 2019, the Committee is made up of four members, with a 100% rate of independence.
The careers of the Committee members confirm their possession of acknowledged expertise in the financial, accounting or audit fields (refer to point 4.1.1.1 above). Ms. Coisne-Roquette was appointed "financial expert" of the Committee by the Board at its meeting of December 16, 2015.
Duties
The rules of procedure of the Audit Committee define the Committee’s duties as well as its working procedures. After having been modified on February 8, 2017, in order to adapt the missions of the Committee to the European audit reform, the Committee’s rules of procedure were last modified on July 25, 2018, in order to take account of the new social and environmental responsibility requirements, further to the revision of the AFEP-MEDEF Code in June 2018. The text of the unabridged version of the rules of procedure approved by the Board of Directors on July 25, 2018, is available on TOTAL’s website under "Our Group/Our identity/Our Governance".
Notwithstanding the duties of the Board of Directors, the Audit Committee is tasked with the following missions in particular :
Regarding the statutory auditors :
-making a recommendation to the Board of Directors on the statutory auditors put before the Annual Shareholders’ Meeting for designation or renewal, following their selection procedure organized by General Management and enforcing the applicable regulations ;
-monitoring the statutory auditors in the performance of their missions and, in particular, examining the additional report drawn up by the statutory auditors for the Committee, while taking account of the observations and conclusions of the High Council of statutory auditors (Haut Conseil du Commissariat aux comptes) further to the inspection of the auditors in question in application of the legal provisions, where appropriate ;
-ensuring that the statutory auditors meet the conditions of independence as defined by the regulations, and analyzing the risks to their independence and the measures taken to mitigate these risks ; to this end, examining all the fees paid by the Group to the statutory auditors, including for services other than the certification of the financial statements, and making sure that the rules applying to the maximum length of the term of the statutory auditors and the obligation to alternate are obeyed ; and
-approving the delivery by the statutory auditors of services other than those relating to the certification of the financial statements, in accordance with the applicable regulations.
Regarding accounting and financial information :
-following the process to produce financial information and, where appropriate, formulating recommendations to guarantee its integrity, where appropriate ;
-monitoring the implementation and the proper workings of a disclosures Committee in the Company, and reviewing its conclusions ;
-examining the assumptions used to prepare the financial statements, assessing the validity of the methods used to handle significant transactions and examining the parent company financial statements and annual, half-yearly, and quarterly Consolidated Financial Statements prior to their examination by the Board of Directors, after regularly monitoring the financial situation, cash position and off-balance sheet commitments ;
-guaranteeing the appropriateness and the permanence of the accounting policies and principles chosen to prepare the statutory and Consolidated Financial Statements of the Company ;
-examining the scope of the consolidated companies and, where appropriate, the reasons why companies are not included ;
-examining the process to validate the proved reserves of the companies included in the scope of consolidation ; and
-reviewing, if requested by the Board of Directors, major transactions contemplated by the Company.
Regarding internal control and risk management procedures :
-monitoring the efficiency of the internal control and risk management systems, and of internal audits, in particular with regard to the procedures relating to the production and processing of accounting, financial and non-financial information, without compromising its independence, and in this respect :
-checking that these systems exist and are deployed, and that actions are taken to correct any identified weaknesses or anomalies,
-examining, based in particular on the risk maps developed by the Company, the exposure to risks, such as financial risks (including significant off-balance sheet commitments), legal risks, operational risks, social and environmental risks, as well as measures taken as a result,
-annually examining the reports on the work of the Group Risk Management Committee (formerly named Group Risk Committee) and the major issues for the Group,
-examining the annual work program of the internal auditors and being regularly informed of their work,
-reviewing significant litigation at least once a year,
-overseeing the implementation of the Group’s Financial Code of Ethics,
-proposing to the Board of Directors, for implementation, a procedure for complaints or concerns of employees, shareholders and others, related to accounting, internal control or auditing matters, and monitoring the implementation of this procedure, and
-where appropriate, examining important operations in which a conflict of interests could have arisen.
The Audit Committee reports to the Board of Directors on the performance of its duties. It also reports on the results of the statutory auditors’ mission concerning the certification of the financial statements, on how this mission contributed to the integrity of the accounting and financial information and its role in this process. It shall inform the Board of Directors without delay of any difficulties encountered.
Organization of activities
The Committee meets at least seven times each year : each quarter to review in particular the statutory financial statements of the Company, and the annual and quarterly Consolidated Financial Statements, and at least on three other occasions to review matters not directly related to the review of the quarterly financial statements.
At each Committee meeting where the quarterly financial statements are reviewed, the Chief Financial Officer presents the Consolidated Financial Statements and the statutory financial statements of the Company, as well as the Group’s financial position and, in particular, its liquidity, cash flow and debt situation. A memo describing risk exposure and off-balance sheet commitments is communicated to the Committee. This review of the financial statements includes a presentation by the statutory auditors underscoring the key points observed.
As part of monitoring the efficiency of the internal control and risk management systems, as well as internal audits with regard to the procedures relating to the production and processing of accounting, financial and non-financial information, the Committee is informed of the work program of the Corporate Internal Control and Audit Department and its organization, on which it may issue an opinion. The Committee also receives a summary of the internal audit reports, which is presented at each Committee meeting where the quarterly financial statements are reviewed. The risk management processes implemented within the Group, as well as updates to them, are presented regularly to the Committee.
The Committee may meet with the Chairman and Chief Executive Officer or, if the functions are separate, the Chairman of the Board of Directors, the Chief Executive Officer as well as, if applicable, any Deputy Chief Executive Officer of the Company. It may perform inspections and consult with managers of operating or non-operating department, as may be useful in performing its duties. The Chairman of the Committee gives prior notice of such meeting to the Chairman and Chief Executive Officer or, if the functions of Chairman of the Board of Directors and Chief Executive Officer are separate, both the Chairman of the Board of Directors and the Chief Executive Officer. In particular, the Committee is authorized to consult with those involved in preparing or auditing the financial statements (Chief Financial Officer and principal Finance Department managers, Audit Department, Legal Department) by asking the Company’s Chief Financial Officer to call them to a meeting.
The Committee consults with the statutory auditors regularly, including at least once a year without any Company representative present. If it is informed of a substantial irregularity, it recommends to the Board of Directors all appropriate action.
If it considers that it is necessary for the accomplishment of its mission, the Committee can ask the Board of Directors for resources to receive assistance or conduct external studies on subjects within its competence. If the Committee calls on external consulting services, it makes sure that they are objective.
Work of the Audit Committee
In 2018, the Audit Committee met seven times, with an attendance rate of 100%. The Chairman and Chief Executive Officer did not attend any of the meetings of the Audit Committee.
The Audit Committee’s work mainly focused on the following areas :
February 5
-review of the Consolidated Financial Statements and statutory financial statements of TOTAL S.A. as parent company for the fourth quarter of 2017 and the 2017 fiscal year. Presentation by the statutory auditors of their work performed in accordance with French and American professional audit standards ;
-review of the Group’s financial position ;
-update on unvalued guarantees given by TOTAL S.A. ;
-update on the Sarbanes-Oxley process : self-assessment carried out by the Group and audit of the internal control related to financial reporting by the statutory auditors as part of the SOX 404 process ;
-presentation of the "Risks and control" chapter of the Registration Document : risk factors, legal proceedings, internal control and risk management procedures ;
-general presentation of the Group’s insurance policy : coverage for 2018 against property damage, business interruption and civil liability, update on coverage against damage resulting from a cyberattack ; presentation of D&O (Directors & Officers) insurance and update on main claims ; and
-update on the 2017 internal audit and 2018 work schedule.
March 12
-presentation of the chapter of the Registration Document containing social, environmental and societal information ;
-presentation of the duty of vigilance and the vigilance plan ;
-evaluation of hydrocarbon reserves at the end of the 2017 fiscal year ;
-presentation of the report on the payments made to governments ; and
-presentation of the statutory auditors’ report in accordance with the European audit reform.
April 23
-review of the Consolidated Financial Statements and statutory financial statements of TOTAL S.A. for the first quarter of 2018, with a presentation by the statutory auditors of a summary of their limited review ;
-presentation of the Group’s financial position at the end of the quarter ;
-update on the internal audits conducted in the first quarter of 2018 and the 2018 health, safety and environment audit plan ;
-presentation of actions taken to implement the corruption prevention aspects of the French law n° 2016-1691 dated December 9, 2016, relating to transparency, the fight against corruption and modernization of the economy ;
-presentation of the 2018 health, safety and environment audit plan and review of the fiscal year 2017 ;
-review of the internal audit ; and
-presentation of the Group risk map : focus on the risk of cyber crime and example of intrusion test.
June 12
-presentation of the Refining & Chemicals risk map ;
-presentation by the Group Risk Management Committee on the main issues covered in the last year ;
-presentation of the significant Exploration & Production subsidiaries ; and
-presentation of the duties of the Consolidation Department regarding accounting standards as well as the organization of this function within the Group ; presentation of the options chosen to implement the IFRS 16 standard and description of how the consolidation scope is monitored as well as the associated control tests.
July 23
-changes to the rules of procedure of the Audit Committee further to the revision of the AFEP-MEDEF Code in June 2018 ;
-review of the Consolidated Financial Statements and statutory financial statements of TOTAL S.A. as parent company for the second quarter of 2018 as well as those for the first half of 2018. Presentation by the statutory auditors of a summary of their limited review ;
-presentation of the Group’s financial position at the end of the second quarter of 2018 ;
-update on the internal audits conducted in the second quarter of 2018 ; and
-presentation of the Marketing & Services risk map.
October 9
-audit of the accounts as of December 31, 2018 : statutory auditors’ analysis of the main transverse risks to be addressed as important points in their audit plan for the closing of the 2018 accounts ;
-review of significant litigation and status update on the main pending proceedings involving the Group ;
-presentation of the Group’s fiscal position ; and
-presentation of the statutory auditors’ fees and the new non-audit services policy.
October 23
-interview of the members of the Audit Committee with the statutory auditors in the absence of Group employees. Review of the Consolidated Financial Statements and statutory financial statements of TOTAL S.A. as parent company for the third quarter of 2018 as well as those for the first nine months of 2018. Presentation by the statutory auditors of a summary of their limited review ;
-presentation of the Group’s financial position at the end of the quarter ;
-update on the internal audits conducted in the third quarter of 2018 ;
-information on compliance by relevant employees with the provisions of the Financial Code of Ethics ; and
-presentation of the architecture of the accounting information systems.
At each meeting related to the quarterly financial statements, the Committee reviewed the Group’s financial position in terms of liquidity, cash flow and debt, as well as its significant risks and off-balance sheet commitments. The Audit Committee was periodically informed of the risk management processes implemented within the Group as well as the work carried out by the Audit & Internal Control division, which was presented at each Committee meeting where the quarterly financial statements were reviewed.
The Audit Committee reviewed the financial statements no later than two days before they were reviewed by the Board of Directors, a sufficient amount of time as set out in the recommendations of the AFEP-MEDEF Code.
The statutory auditors attended all Audit Committee meetings held in 2018.
The Chief Financial Officer, the Deputy Chief Financial Officer, the Vice President Accounting, the Senior Vice President Audit & Internal Control division as well as the Treasurer attended all Audit Committee meetings, related to their area.
The Chairman of the Committee reported to the Board of Directors on the Committee’s work.
The Governance and Ethics Committee
Composition
As of March 13, 2019 | Independence | Years of service of the Board | Expiry of director’s term of office |
Patricia Barbizet* | ✔ | 11 | 2020 |
Mark Cutifani | ✔ | 2 | 2020 |
Anne-Marie Idrac | ✔ | 7 | 2021 |
Jean Lemierre | ✔ | 3 | 2019 |
* Chairperson of the Committee. |
As of March 13, 2019, the Governance and Ethics Committee is made up of four members, with a 100% rate of independence.
Duties
The rules of procedure of the Governance and Ethics Committee define the Committee’s duties as well as its working procedures. They were modified in order to extend the duties of the Committee to matters regarding compliance as well as the prevention and the detection of corruption and influence peddling. The text of the unabridged version of the rules of procedure approved by the Board of Directors on July 25, 2018, is available on TOTAL’s website under "Our Group/Our identity/Our Governance".
The Governance and Ethics Committee is focused on :
-recommending to the Board of Directors persons that are qualified to be appointed as directors, so as to guarantee the scope of coverage of the directors’ competencies and the diversity of their profiles ;
-recommending to the Board of Directors the persons that are qualified to be appointed as executive directors ;
-preparing the Company’s corporate governance rules and supervising their implementation ;
-ensuring compliance with ethics rules and examining any questions related to ethics and situations of conflicting interests ; and
-reviewing matters regarding compliance as well as the prevention and detection of corruption and influence peddling.
Its duties include :
-presenting recommendations to the Board of Directors for its membership and the membership of its Committees, and the qualification in terms of independence of each candidate for Directors’ positions on the Board of Directors ;
-proposing annually to the Board of Directors the list of directors who may be considered as "independent directors" ;
-examining, for the parts within its remit, reports to be sent by the Board of Directors to the shareholders ;
-assisting the Board of Directors in the selection of the organisation of the governance of the Company as well as the selection and evaluation of the executive directors and examining the preparation of their possible successors including establishing a succession plan, including cases of unforeseeable absence ;
-recommending to the Board of Directors the persons that are qualified to be appointed as directors ;
-recommending to the Board of Directors the persons that are qualified to be appointed as members of a Committee of the Board of Directors ;
-proposing methods for the Board of Directors to evaluate its performance, and in particular preparing means of regular self-assessment of the workings of the Board of Directors, and the possible assessment thereof by an external consultant ;
-proposing to the Board of Directors the terms and conditions for allocating directors’ fees and the conditions under which expenses incurred by the directors are reimbursed ;
-developing and recommending to the Board of Directors the corporate governance principles applicable to the Company ;
-preparing recommendations requested at any time by the Board of Directors or the General Management of the Company regarding appointments or governance ;
-examining the conformity of the Company’s governance practices with the recommendations of the Code of Corporate Governance to which the Company refers ;
-supervising and monitoring the implementation of the approach of the Company with regard to ethics, compliance, prevention and detection of corruption and influence peddling and, in this respect, ensuring that the necessary procedures are in place, including those for updating the Group’s Code of Conduct and that this Code is disseminated and applied ;
-examining any questions related to ethics and potential situations of conflicting interests ;
-examining changes in the duties of the Board of Directors.
Work of the Governance and Ethics Committee
In 2018, the Governance and Ethics Committee held three meetings, with 91.7% attendance. Its work mainly focused on the following areas :
February 7
-report of the Lead Independent Director on her mandate ;
-discussion on the functioning of the Board of Directors ;
-proposal to the Board of Directors regarding the terms of office of three directors the renewal of which was put to the Annual Shareholders’ Meeting of June 1, 2018 ;
-proposal to the Board of Directors regarding the renewal of the directorship of the Chairman and the Chief Executive Officer ;
-proposals to the Board of Directors regarding the assessment of the independence of the directors based on the independence criteria specified in the AFEP-MEDEF Code and after reviewing the level of activity between the Group and companies in which directors serve ;
-proposals to the Board of Directors regarding the composition of the Committees ;
-allocating of directors’ fees to directors and Committee members ;
-update on the Market Abuse regulations (Regulation (EU) n° 596/2014 of April 16, 2014, which came into force on July 3, 2016) and the applicable blackout periods ; and
-information update on transactions on the Company’s securities by executive directors.
March 13
-proposal to the Board of Directors regarding the terms of office of three directors the renewal of which was put to the Annual Shareholders’ Meeting of June 1, 2018 ;
-proposal to the Board of Directors regarding a unified Management Form, subject to the renewal of the directorship of Mr. Patrick Pouyanné by the Shareholders’ Meeting in June 1, 2018 ;
-proposals to the Board of Directors regarding the composition of the Committees ; and
-examination of the parts of the report on corporate governance within its remit.
July 25
-presentation of the Group’s Ethics and Compliance policy ; 2017 review of ethics and compliance activities ; 2018 ethics road map ; 2018 anti-corruption compliance road map ;
-presentation of forthcoming changes in the composition of the Board of Directors in view of the directorships that come to expire at the Shareholders’ Meeting of May 29, 2019 ;
-review of the Shareholders’ Meeting of June 1, 2018 ; and
-proposal to the Board of Directors regarding the modifications of the rules of procedure of the Board of Directors and its Committees in order to notably take into account the AFEP-MEDEF Code revised in June 2018.
The Compensation Committee
Composition
As of March 13, 2019 | Independence | Years of service of the Board | Expiry of director’s term of office |
Gérard Lamarche* | ✔ | 7 | 2019 |
Patricia Barbizet | ✔ | 11 | 2020 |
Marie-Christine Coisne-Roquette | ✔ | 8 | 2020 |
Renata Perycz (a) | n/a (b) | 3 | 2019 |
Carlos Tavares | ✔ | 2 | 2020 |
(a) Director representing employee shareholders. (b) In accordance with the recommendations of the AFEP-MEDEF Code (point 8.3). * Chairperson of the Committee. | |||
As of March 13, 2019, the Compensation Committee is made up of five members, with a 100% rate of independence (1).
(1) Excluding the director representing employee shareholders, in accordance with the recommendations of the AFEP-MEDEF Code (point 8.3).
Duties
The rules of procedure of the Compensation Committee define the Committee’s duties as well as its working procedures. They were modified on July 25, 2018, in order to take account of the new social and environmental responsibility requirements, further to the revision of the AFEP-MEDEF Code in June 2018. The text of the unabridged version of the rules of procedure approved by the Board of Directors on July 25, 2018, is available on TOTAL’s website under "Our Group/Our identity/Our Governance".
The Committee is focused on :
-examining the executive compensation policies implemented by the Group and the compensation of members of the Executive Committee ;
-evaluating the performance and recommending the compensation of each executive director ; and
-preparing reports which the Company must present in these areas.
The Committee’s duties include :
-examining the main objectives proposed by the Company’s General Management regarding compensation of the Group’s executive officers, including stock option and restricted share grant plans as well as equity-based plans, and advising on this subject ;
-presenting recommendations and proposals to the Board of Directors concerning :
-compensation, pension and life insurance plans, in-kind benefits and other compensation (including severance benefits) for the executive directors of the Company ; in particular, the Committee proposes compensation structures that take into account the Company’s strategic orientations, objectives and earnings, market practices as well as one or more criteria related to social and environmental responsibility,
-stock option and restricted share grants, particularly grants of restricted shares to the executive directors ;
-examining the compensation of the members of the Executive Committee, including stock option and restricted share grant plans as well as equity-based plans, pension and insurance plans and in-kind benefits ;
-preparing and presenting reports in accordance with these rules of procedure ;
-examining, for the parts within its remit, reports to be sent by the Board of Directors or its Chairman to the shareholders ;
-preparing recommendations requested at any time by the Chairman of the Board of Directors or the General Management of the Company regarding compensation ; and
-at the request of the Chairman of the Board, examining all draft reports of the Company regarding compensation of the executive officers or any other matters within its competence.
Work of the Compensation Committee
In 2018, the Compensation Committee held two meetings, with 100% attendance. The Chairman and Chief Executive Officer does not attend the Committee’s deliberations regarding his own situation.
Its work mainly focused on the following areas :
February 7
-determination of the variable portion of the compensation to be paid to the Chairman and Chief Executive Officer for his performance in fiscal year 2017 ;
-proposed compensation for the Chairman and Chief Executive Officer (fixed and variable portion for fiscal year 2017) ;
-examination of the commitments made by the Company to the Chairman and Chief Executive Officer ;
-examining sections within its remit of the report on corporate governance to shareholders ;
-proposal of principles and criteria to determine the components of the compensation of the Chairman and Chief Executive Officer for 2018 ;
-review of compliance with the restrictions on share transfers by the Chairman and Chief Executive Officer ; and
-review of the possibility and implementation conditions of a performance share and/or stock option plan in 2018.
March 14
-confirmation of the acquisition rate of performance shares under the 2015 plan ;
-proposal of the principles and criteria used to determine the components of the compensation of the Chairman and Chief Executive Officer for 2018, in light of the guidance given by the Board at its meeting of February 7, 2018 ;
-proposals regarding the 2018 performance share plan ; proposal regarding the grant of performance shares to the Chairman and Chief Executive Officer ; and
-examining sections within its remit of the report on corporate governance to shareholders.
The Strategy & CSR Committee
Composition
As of March 13, 2019 | Independence | Years of service of the Board | Expiry of director’s term of office |
Patrick Pouyanné* | 4 | 2021 | |
Patrick Artus | ✔ | 10 | 2021 |
Patricia Barbizet | ✔ | 11 | 2020 |
Anne-Marie Idrac | ✔ | 7 | 2021 |
Jean Lemierre | ✔ | 3 | 2019 |
Christine Renaud (a) | n/a (b) | 2 | 2020 |
(a) Director representing employees. (b) In accordance with the recommendations of the AFEP-MEDEF Code (point 8.3). * Chairperson of the Committee. | |||
As of March 13, 2019, the Strategy & CSR Committee is made up of six members, including four independent directors.
Duties
The rules of procedure of the Strategy & CSR Committee define the Committee’s duties as well as its working procedures. They were last modified on July 25, 2018, in order to take account of the new social and environmental responsibility requirements, further to the revision of the AFEP-MEDEF Code in June 2018. The text of the unabridged version of the rules of procedure approved by the Board of Directors on July 25, 2018, is available on TOTAL’s website under "Our Group/Our identity/Our Governance".
To allow the Board of Directors of TOTAL S.A. to ensure the Group’s development, the Strategy & CSR Committee’s duties include :
-examining the Group’s overall strategy proposed by the Company’s Chief Executive Officer ;
-examining the Group’s corporate social and environmental responsibility (CSR) issues and, in particular, issues relating to the incorporation of the Climate challenge in the Group’s strategy ;
-examining operations that are of particular strategic importance ;
-reviewing the competitive environment, the main challenges the Group faces, including with regard to social and environmental responsibility, as well as the resulting medium and long-term outlook for the Group.
Work of the Strategy & CSR Committee
In 2018, the Strategy & CSR Committee held three meetings, with 100% attendance. Its work mainly focused on the following areas :
March 14
-analysis of the strategy of one of the Group’s major competitors ;
-comparison of major oil companies’ 2017 results ; and
-presentation of the Group’s ESG performance.
September 19
-strategic directions of the Gas, Renewables & Power segment ; and
-the Group’s "Climate" ambition.
December 12
-presentation of the climate strategy ; review of worldwide climate-related litigation and financing of the oil and gas projects.
4.1.3 Report of the Lead Independent Director on her mandate
During the Board meeting of February 6, 2019, Ms. Barbizet presented a report on her mandate as Lead Independent Director. The Lead Independent Director indicated that she exercised her duties during the 2018 fiscal year as follows :
- Contact with the Chairman and Chief Executive Officer :
The Lead Independent Director has been a privileged interlocutor of the Chairman and Chief Executive Officer with respect to significant matters concerning the Group’s business and preparing meetings of the Board of Directors. The Lead Independent Director thus met the Chairman and Chief Executive Officer very regularly, on a monthly basis, and before each meeting of the Board of Directors.
- Assessment of the Board of Directors’ practices :
The Lead Independent Director conducted the assessment of the Board of Directors’ practices.
- Avoidance of conflicts of interest :
The Lead Independent Director has performed due diligence in order to identify and analyze potential conflicts of interest. She brought to the attention of the Chairman and Chief Executive Officer the potential conflicts of interest that had been identified. The Lead Independent Director was consulted in July 2018 by a director about a potential conflict of interest arising due to that director’s possible participation in Committee of an energy-related entity in an Asian country. Due to the absence of a conflict of interest, this director then decided to respond to the offer to chair this Committee. The Lead Independent Director was also consulted in October 2018 by the director concerning that director’s potential participation to a strategic committee of a fund manager. He was answered positively.
- Monitoring of the Board’s practices :
The Lead Independent Director held a meeting of the independent directors on December 12, 2018. At the meeting, the discussions related in particular to increasing the senior executives’ knowledge of the Group, with a particular view to the succession plans, and to analyzing the impact of disruptive scenarios on the Group’s situation.
- Relationships with shareholders :
The Chairman and Chief Executive Officer and the Lead Independent Director are the privileged points of contacts for shareholders concerning matters under the Board’s responsibility. In accordance with the provisions of the rules of procedure of the Board, when the Chairman and Chief Executive Officer is solicited in this area, he may consult the Lead Independent Director before responding.
When the Lead Independent Director is solicited in this area, she informs the Chairman and Chief Executive Officer and gives her opinion, so that the Chairman and Chief Executive Officer can give appropriate response to the request. The Chairman and Chief Executive Officer informs the Lead Independent Director of the response.
In addition, the Lead Independent Director participated on June 28, 2018 with the Chairman and Chief Executive Officer in a meeting with a large shareholder of the Company. He also participated with the Chairman and Chief Executive Officer in another conference call on December 10, 2018 with another large shareholder of the Company. The terms discussed during these two meetings included the functioning of the Board of Directors, the exercise by the Lead Director of the missions entrusted to her by the Board, the way in which the Board manages the risks facing the Company as well as the compensation of the Chairman and Chief Executive Officer.
The Lead Independent Director presented to the shareholders her report on the her mandate during the Shareholders’ Meeting on June 1st, 2018.
- Visits to Group sites by the Directors :
Ms. Barbizet took part, with other directors, in the following visits to Group sites :
-Yamal LNG plant (October 26, 2018) ;
-Akpo field and Bonny LNG plant in Nigeria (December 18, 2018).
These site visits provided the opportunity for the directors concerned to meet Group executives and partners as well as leading figures in the energy sector.
4.1.4 Evaluation of the functioning of the Board of Directors
Once a year, the Board of Directors discusses its functioning. It also conducts a formal assessment of its own functioning at regular intervals of up to three years. The evaluation is carried out under the supervision of the Lead Independent Director, if one has been appointed, or under the supervision of the Governance and Ethics Committee, with the assistance of an outside consultant. When a Lead Independent Director is appointed, he or she oversees this evaluation process and reports on it to the Board of Directors.
At its meeting of March 13, 2019, the Board of Directors discussed its functioning. Ms. Barbizet, Lead Independent Director, managed this evaluation process in January and February 2019 on the basis of a formal assessment carried out with the help of an outside consultant, in the form of a detailed questionnaire. The responses given by the directors were then presented to the Governance and Ethics Committee to be reviewed and summarized. This summary was then discussed by the Board of Directors. This process made it possible to confirm the quality of each director’s contribution to the work of the Board and its Committees.
This formal evaluation showed a positive opinion of the functioning of the Board of Directors and the Committees. In particular, it was noted that the suggestions for improvement made by the directors in recent years had generally been taken into account. During the Board of Directors’ meetings, some of which were held at certain of the Group’s sites, special attention was paid at the start of each meeting to the review of the main points to be examined by the Board (financial statements, large-scale investment and divestment projects, etc.).
Furthermore, the main suggestions for improving the Board made by the directors during their January 2016, January 2017 and January 2018 self-assessments have been implemented :
-monitoring risks at Board level : an annual presentation of the Group’s risk map is now on the Board’s agenda. Presentations were given at the Board meetings of April 26, 2016, April 26, 2017 and April 25, 2018 ;
-changes to the composition of the Board : the Governance and Ethics Committee’s proposals to the Board of Directors met the expectations of the Board members, particularly with the addition of the experience of two Chief executive officers of leading companies, who joined the Board following the Shareholders’ Meeting of May 26, 2017 ;
-independent directors’ meeting : now held at least once a year at the initiative of the Lead Independent Director. Meetings took place on December 21, 2016, December 12, 2017, and December 12, 2018 ;
-secure platform to access the Board’s documents : the platform was put in place as of September 21, 2016, for Board meetings and as of April 24, 2017, for Audit Committee meetings, with the establishment of a directors’ manual in June 2018 ;
-succession plan for the executive directors : the succession plan for executive directors was reviewed at the meeting of the Governance and Ethics Committee of February 8, 2017 and February 7, 2018.
The assessment conducted in January and February 2019 highlighted the directors’ satisfaction with the functioning of the Board of Directors, both in terms of form and substance, and, in particular, concerning freedom of expression, the quality of dialog, the collegiality of decision-making as well as the relevance of subjects addressed. The directors particularly appreciated the pace and agenda of meetings, the quality of the exchanges during lunches before the meetings and during the visits to Group sites organized for them, as well as the quality of relations with the Lead Independent Director.
The Board of Directors made the following suggestions that could further improve its functioning :
-consider alternative disruptive scenarios within the framework of the strategic consideration ;
-rease opportunities to meet the Group’s executive officers; and
-prepare the succession plan for key positions among the Board of Directors.
4.1.5 General Management
4.1.5.1 Unified Management Form
Combination of the management positions
At its meeting on December 16, 2015, the Board of Directors decided to reunify the positions of Chairman and Chief Executive Officer of TOTAL S.A. as of December 19, 2015. As a result, since that date, Mr. Pouyanné has held the position of Chairman and Chief Executive Officer of TOTAL S.A.
Following the death of TOTAL’s former Chairman and Chief Executive Officer, Mr. De Margerie, the Board of Directors decided, at its meeting on October 22, 2014, to separate the functions of Chairman and Chief Executive Officer in order to best ensure the transition of the General Management. The Board of Directors therefore appointed Mr. Pouyanné as Chief Executive Officer for a term of office expiring following the Annual Shareholders’ Meeting called in 2017 to approve the 2016 financial statements (1), and Mr. Desmarest as Chairman of the Board of Directors for a term of office expiring on December 18, 2015, in accordance with the age limit set out in the bylaws. It was announced that, on that date, the functions of Chairman and Chief Executive Officer of TOTAL S.A. would be combined.
At the Ordinary Shareholders’ Meeting of June 1, 2018, Mr. Pouyanné’s directorship was renewed for a period of three years, i.e., until the end of the Shareholders’ Meeting in 2021 that will approve the accounts of fiscal year 2020. On the proposal of the Governance and Ethics Committee, approved by the meeting of the Board of Directors of March 14, 2018, the latter met after the Shareholders’ Meeting and unanimously decided to renew Mr. Pouyanné’s term of office as the Chairman and Chief Executive Officer for the duration of his directorship.
At the meeting of the Board of Directors of March 14, 2018, the Lead Independent Director notably reiterated that the proposal to continue to combine the positions of Chairman of the Board of Directors and Chief Executive Officer was made further to work done by the Governance and Ethics Committee in the interests of the Company. In this regard, the unified Management Form was deemed to be most appropriate to the Group’s organization, modus operandi and business, and to the specific features of the oil and gas sectors, particularly in light of the advantage for the Group of having a unified management in strategic negotiations with States and the Group’s partners.
(1) The meeting of the Board of Directors of December 16, 2015, decided to extend the term of this office to the end of the Annual Shareholders’ Meeting of June 1, 2018, date of expiry of the preceding term of office of Mr. Pouyanné as director.
The Lead Independent Director also reiterated that the Group’s governance structure ensures a balanced distribution of powers. To this end, at its meeting on December 16, 2015, the Board amended the provisions of its Rules of Procedure to provide for the appointment of a Lead Independent Director in the event of the combination of the positions of Chairman of the Board of Directors and Chief Executive Officer. The Lead Independent Director’s duties, resources and rights are described in the Rules of Procedure of the Board of Directors.
The balance of powers within the Company’s bodies is also ensured by the composition of the Board of Directors and that of its four Committees, particularly given the high proportion of members who are independent directors. It is further ensured by the directors’ full involvement in the work of the Board and the Committees, and by their diverse profiles, skills and expertises.
In addition, the Board’s Rules of Procedure provide that investments and divestments considered by the Group exceeding 3% of equity, as well as any significant transactions not included in the announced Company strategy, must be approved by the Board, which is also informed of any significant events related to the Company’s operations, particularly investments and divestments in amounts exceeding 1% of equity.
Finally, the Company’s bylaws offer the necessary guarantees to ensure compliance with best governance practices under a unified Management Form. In particular, they stipulate that a Board meeting may be convened by any means, including verbally, and at short notice in case of urgency, by the Chairman or by a third of its members, at any time and as often as required to ensure the best interests of the Company.
Lead Independent Director
At its meeting on December 16, 2015, the Board of Directors appointed Ms. Barbizet as Lead Independent Director as of December 19, 2015. Pursuant to the provisions of the Rules of Procedure of the Board of Directors, she therefore chairs the Governance and Ethics Committee.
The duties of the Lead Independent Director are described in detail in the Rules of Procedure of the Board of Directors, the full version of which is provided in point 4.1.2.1 of this chapter.
4.1.5.2 Executive Committee and Group Performance Management Committee
The Executive Committee
The Executive Committee, under the responsibility of the Chairman and Chief Executive Officer, is the decision-making body of the Group.
It implements the strategy formulated by the Board of Directors and authorizes related investments, subject to the approval of the Board of Directors for investments exceeding 3% of the Group’s equity, as well as any significant transactions not included in the announced company strategy, or notification of the Board for investments exceeding 1% of equity.
In 2018, the Executive Committee met at least twice a month, except in August when it met once.
As of December 31, 2018, the members of Executive Committee were as follows :
-Patrick Pouyanné, Chairman and Chief Executive Officer and President of the Executive Committee ;
-Arnaud Breuillac, President, Exploration & Production ;
-Patrick de La Chevardière, Chief Financial Officer ;
-Momar Nguer, President, Marketing & Services ;
-Bernard Pinatel, President, Refining & Chemicals ;
-Philippe Sauquet, President, Gas, Renewables & Power, and President, Group Strategy-Innovation ; and
-Namita Shah, President, People & Social Responsibility.
The current members of the Executive Committee have informed the Company that they have not been charged with, convicted or subject to any incrimination, conviction or sanction pronounced by a judicial or administrative authority or a professional body, have not been associated with bankruptcy, sequestration, receivership or court-ordered liquidation proceedings, and have not been convicted of fraud, prohibited from managing a company or disqualified as stipulated in item 14.1 of Annex I of EC Regulation 809/2004 of April 29, 2004, over the last five years.
Profile, experience and expertise of the members of the Executive Committee (information as of December 31, 2018)
| PATRICK POUYANNÉ | |
Chairman and Chief Executive Officer of TOTAL S.A. Chairman of the Strategy & CSR Committee Biography & Professional Experience A graduate of École Polytechnique and a Chief Engineer of France’s Corps des Mines, Mr. Pouyanné held, between 1989 and 1996, various administrative positions in the Ministry of Industry and other cabinet positions (technical advisor to the Prime Minister - Édouard Balladur - in the fields of the Environment and Industry from 1993 to 1995, Chief of staff for the Minister for Information and Aerospace Technologies - François Fillon - from 1995 to 1996). In January 1997, he joined TOTAL’s Exploration & Production division, first as Chief Administrative Officer in Angola, before becoming Group representative in Qatar and President of the Exploration and Production subsidiary in that country in 1999. In August 2002, he was appointed President, Finance, Economy and IT for Exploration & Production. In January 2006, he became Senior Vice President, Strategy, Business Development and R&D in Exploration & Production and was appointed a member of the Group’s Management Committee in May 2006. In March 2011, Mr. Pouyanné was appointed Deputy General Manager, Chemicals, and Deputy General Manager, Petrochemicals. In January 2012, he became President, Refining & Chemicals and a member of the Group’s Executive Committee. On October 22, 2014, he became Chief Executive Officer of TOTAL S.A. and Chairman of the Group’s Executive Committee. On May 29, 2015, he was appointed by the Annual Shareholders’ Meeting as director of TOTAL S.A. for a three-year term. The Board of Directors of TOTAL appointed him as Chairman of the Board of Directors as of December 19, 2015. Mr. Pouyanné thus became the Chairman and Chief Executive Officer of TOTAL S.A. Following the renewal of Mr. Pouyanné’s directorship at the Shareholders’ Meeting on June 1, 2018 for a three-year period, the Board of Directors renewed Mr. Pouyanné’s term of office as Chairman and Chief Executive Officer for a period equal to that of his directorship. Mr. Pouyanné is also the Chairman of the Association United Way - L’Alliance since June 2018, having accepted this office as TOTAL S.A.’s Chairman and Chief Executive Officer. Main function : Chairman and Chief Executive Officer of TOTAL S.A. | ||
Born on June 24, 1963 (French) Director of TOTAL S.A. since the Ordinary Shareholders’ Meeting of May 29, 2015 Business address: TOTAL S.A. 2 place Jean Millier, La Défense 6, 92400 Courbevoie France |
Directorships and functions held at any company during the 2018 fiscal year Within the TOTAL Group -Chairman and Chief Executive Officer of TOTAL S.A.* and Chairman of the Strategy & CSR Committee Outside the TOTAL Group -Director of Cap Gemini S.E.* (since May 10, 2017) and member of the Strategy and Investments Committee (since September 1, 2017) Directorships that have expired in the previous five years -Chairman and Director of Total Refining & Chemicals until 2014 -Chairman and Director of Total Petrochemicals & Refining S.A./NV until 2014 |
| ARNAUD BREUILLAC | |
Member of the TOTAL Executive Committee Biography & Professional Experience A graduate of the École Centrale de Lyon, Arnaud Breuillac joined TOTAL in 1982. He occupied various positions in Exploration & Production in France, Abu Dhabi, the United Kingdom, Indonesia and Angola, and in Refining management in France. Between 2004 and 2006, he was the Iran director in the Middle East division. In December 2006, he became a member of the Management Committee of the Exploration & Production segment, as the director of the Continental Europe and Central Asia area. In July 2010, he became the Middle East director in the Exploration & Production segment, and joined the Management Committee in January 2011. On January 1, 2014, Arnaud Breuillac was appointed President of TOTAL’s Exploration & Production segment, and he has been a member of the Group’s Executive Committee since October 1, 2014. Main function: President of TOTAL S.A.’s Exploration & Production segment Directorships and functions held at any company during the 2018 fiscal year Within the TOTAL Group - Member of the TOTAL Executive Committee Outside the TOTAL Group None Directorships that have expired in the previous five years None | ||
Born on July 2, 1958 (French) Member of TOTAL S.A.’s Executive Committee since October 1, 2014 Business address: TOTAL S.A. 2 place Jean Millier, La Défense 6, 92400 Courbevoie France |
| PATRICK DE LA CHEVARDIÈRE | |
Member of the TOTAL Executive Committee Biography & Professional Experience Patrick de La Chevardière was born in March 1957. He is a graduate of the École Centrale de Paris and a former student of the École des hautes études commerciales (HEC). He joined TOTAL in 1982, where he worked as a drilling engineer in the Exploration & Production segment until 1989. He then joined the Financial Division as a business manager and became the director of the Operations and Subsidiaries department in 1995. In 2000, he was appointed Asia director in the Refining and Marketing division, then Deputy Chief Financial Officer of TOTAL in September 2003, and he became a member of the Management Committee in January 2005. Patrick de La Chevardière has also been a member of the Executive Committee since June 2008. Main function: Chief Financial Officer of TOTAL S.A. Directorships and functions held at any company during the 2018 fiscal year Within the TOTAL Group -Member of the TOTAL Executive Committee -Chairman and member of the Governance committee of Elf Aquitaine -Director of Total Capital -Chairman and Chief Executive Officer of Total Capital International Outside the TOTAL Group None Directorships that have expired in the previous five years -Chairman of Total Nucléaire until 2017 -Chairman and Chief Executive Officer of Elf Aquitaine until 2016 -Member of the Board of Directors of Socap International Ltd until 2015 -Member of the Board of Directors of Total International Limited until 2015 | ||
Born on March 1, 1957 (French) Member of TOTAL S.A.’s Executive Committee since June 2008 Business address: TOTAL S.A. 2 place Jean Millier, La Défense 6, 92400 Courbevoie France |

| MOMAR NGUER | |
Member of the TOTAL Executive Committee Biography & Professional Experience 62 year-old Momar Nguer is a graduate of ESSEC. He started his career in 1982 in the financial department of Hewlett Packard France, before joining the Downstream activity of the TOTAL Group in 1984. He became the Sales Director of Total Senegal in 1985. In 1991, he became the manager of TOTAL Network and Consumers in Africa. He then took charge of the General Management of the Marketing subsidiaries of Total Cameroon, in 1995, then Total Kenya, in 1997. In 2000, he was appointed director of East Africa and the Indian Ocean in TOTAL’s Refining & Marketing segment. From 2007 to 2011, Momar Nguer was the Group’s Aviation Managing Director. In December 2011, he became the Africa - Middle East director of TOTAL’s Marketing & Services segment. He joined the Group Performance Management Committee in January 2012 and was appointed Chairman of the Diversity Council on August 1, 2015. On April 15, 2016, he became President, Refining & Chemicals and a member of the TOTAL Group’s Executive Committee. Main function: President of TOTAL S.A.’s Marketing & Services segment Directorships and functions held at any company during the 2018 fiscal year Within the TOTAL Group -Member of the TOTAL Executive Committee -Chairman and Chief Executive Officer of Total Marketing & Services -Member of the Board of Directors of Clean Energy Fuels Corp. Outside the TOTAL Group -Member of the Board of Directors of CFAO -Member of the Board of Directors of Africa Radio Directorships that have expired in the previous five years -Chairman & Chief Executive Officer of Total Outre-Mer until 2016 -Chairman & Chief Executive Officer de Total Africa SA until 2016 -Chairman of Total Réunion until 2016 -Director of Sofocop until 2016 -Director of Total Cameroun until 2016 -Director of Total Cote d’Ivoire until 2016 -Director of Total Liban until 2016 -Director of Total Maroc until 2016 -Director of Total Sénégal until 2016 -Chairman of Board of Directors de Total Nigeria until 2016 -Chairman of Board of Directors de Total (Africa) ltd until 2016 -Chairman of Board of Directors de Total Kenya Plc until 2016 -Chairman of Board of Directors de Total Petroleum Ghana Ltd until 2016 -Chairman of Board of Directors de Total South Africa Ltd until 2016 -Chairman of Board of Directors de Total Oil Turkyie until 2016 | ||
Born on July 8, 1956 (French and Senegalese) Member of TOTAL S.A.’s Executive Committee since April 15, 2016 Business address: TOTAL S.A. 2 place Jean Millier, La Défense 6, 92400 Courbevoie France |

| BERNARD PINATEL | |
Member of the TOTAL Executive Committee Biography & Professional Experience Bernard Pinatel is a graduate of the École Polytechnique and the Institut d’Études Politiques (IEP) de Paris, and has an MBA from the Institut Européen d’Administration des Affaires (INSEAD). He is also a statistician-economist (École Nationale de la Statistique et de l’Administration Économique - ENSAE). He started his career at Booz Allen & Hamilton, before joining the TOTAL group in 1991, where he occupied various operational positions in the production plants and head offices of different subsidiaries, including Hutchinson and Coates Lorilleux. He became the CEO France, and then the CEO Europe of Bostik between 2000 and 2006, and the Chairman and Chief Executive Officer of Cray Valley, from 2006 to 2009. In 2010, he became the Chairman and Chief Executive Officer of Bostik. At TOTAL, he became a member of the Group’s Management Committee in 2011 and was member of the Management Committee of Refining & Chemicals from 2011 to 2014. When Arkema took over Bostik in February 2015, he was nominated as a member of the Executive Committee of Arkema, responsible for the High-Performance Materials activity. He joined the TOTAL Group on September 1, 2016, and was appointed President of the Refining & Chemicals segment and a member of the Group Executive Committee. Main function: President of TOTAL S.A.’s Refining & Chemicals segment Directorships and functions held at any company during the 2018 fiscal year Within the TOTAL Group -Member of the TOTAL Executive Committee -Chairman and Chief Executive Officer of Total Refining & Chemicals -Chairman, Delegate Director of Total Country Services Belgium -Chairman and Delegate Director of Total Chemicals & Refining SA/NV | ||
Born on June 5, 1962 (French) Member of TOTAL S.A.’s Executive Committee since September 1, 2016 Business address: TOTAL S.A. 2 place Jean Millier, La Défense 6, 92400 Courbevoie France |

Outside the TOTAL Group None Directorships that have expired in the previous five years - Chairman and Chief Executive Officer of Bostik SA |
| PHILIPPE SAUQUET | |
Member of the TOTAL Executive Committee Biography & Professional Experience Philippe Sauquet is a graduate of l’École Polytechnique, l’École Nationale des Ponts et Chaussées and of the University of California, Berkeley, United States. He started his career in 1981 as a civil engineer at the French Ministry of Infrastructure, then at the French Ministry of the Economy and Finance. He joined the Orkem Group in 1988 as the sales manager of the Acrylic Materials division. He joined TOTAL in 1990 as Vice President, Anti-Corrosion Paints, before being nominated Chemicals Strategy Vice President. In 1997, he joined Gas & Power, where he was successively Vice President, Americas, Vice President, International, Senior Vice President, Strategy and Renewable Energies, Senior Vice President, Trading & Marketing, Gas & Power, based in London. On July 1, 2012, he was appointed President of Gas & Power, and became a member of the Group’s Management Committee at the same time. On October 29, 2014, he took charge of the Refining & Chemicals segment and joined the Group Executive Committee. On April 15, 2016, he also became interim President of New Energies. On September 1, 2016, he was appointed President of the newly created Gas, Renewables & Power segment. Philippe Sauquet is also the President of Group Strategy-Innovation and a member of the Group Executive Committee. Main function: President, Gas, Renewables & Power, and President, TOTAL S.A. Group Strategy-Innovation. Directorships and functions held at any company during the 2018 fiscal year Within the TOTAL Group -Member of the TOTAL Executive Committee Outside the TOTAL Group -Director of IFPEN Directorships that have expired in the previous five years None | ||
Born on September 20, 1957 (French) Member of TOTAL S.A.’s Executive Committee since September 1, 2016 Business address: TOTAL S.A. 2 place Jean Millier, La Défense 6, 92400 Courbevoie France |

| NAMITA SHAH | |
Member of the TOTAL Executive Committee Biography & Professional Experience Namita Shah is a graduate of Delhi University, New Delhi and has a postgraduate degree in Law from the New York University School of Law, USA. She began her career as an Associate Attorney at Shearman & Sterling, a New York law firm, where she spent eight years providing advice and supervising transactions including those involving financings of pipeline and power plant companies. She joined TOTAL in 2002 as a Legal Counsel in the E&P mergers and acquisitions team. In 2008, she joined the New Business team where she was responsible for business development in Australia and Malaysia. She held this position until 2011 when she moved to Yangon as General Manager, Total E&P, Myanmar. On July 1, 2014, she was appointed Senior Vice President, Corporate Affairs, Exploration & Production. On September 1st, 2016, she was appointed President People & Social Responsibility and member of the Executive Committee. Main function: President of People & Social Responsibility at TOTAL S.A. Directorships and functions held at any company during the 2018 fiscal year Within the TOTAL Group -Member of the TOTAL Executive Committee Outside the TOTAL Group None Directorships that have expired in the previous five years None | ||
Born on August 21, 1968 (French) Member of TOTAL S.A.’s Executive Committee since September 1, 2016 Business address: TOTAL S.A. 2 place Jean Millier, La Défense 6, 92400 Courbevoie France |

The Group Performance Management Committee
The mission of the Group Performance Management Committee is to examine, analyze and monitor the HSE, financial and operational results of the Group. It is chaired by the Chairman and Chief Executive Officer and meets monthly.
In addition to the members of the Executive Committee, this Committee is made up of the heads of the Group’s main business units, as well as a limited number of Senior Vice Presidents of functions at the Group and business segments levels.
Balanced representation of women and men and diversity results in the 10% of positions at TOTAL S.A. with the highest responsibilities (Article L. 225-37-4, 6° of the French Commercial Code)
TOTAL is committed to respecting the principle of equal treatment for women and men; it promotes this fundamental principle and ensures that it is correctly applied. Equal treatment for women and men is promoted in the Group through a global policy of gender diversity, goals set by General Management, a Human Resources process that takes the issue of gender into consideration, agreements in favor of a better work-life balance (such as the agreement on remote working in France) and awareness-raising and training actions.
In terms of TOTAL S.A., the Group’s commitment in favor of diversity took shape in 2016 with the arrival of the President of the People & Social Responsibility division to the Group’s Executive Committee (7 people). With regard to diversity in the 10% of the highest management positions of the Company, the proportion of women equals 15%. At Group level, which is the most relevant perimeter considering TOTAL’s activities, this proportion equals 21% (1).
For further information, refer to point 5.3.3 of chapter 5.
4.1.6 Shares held by the administration and management bodies
As of December 31, 2018, based on statements by the concerned persons and the share register listing registered shares, all of the members of the Board of Directors and the Group’s executive officers (2) held less than 0.5% of the share capital:
-members of the Board of Directors (3): 144,244 shares and 11,982.73 units of the collective investment fund ("FCPE") invested in TOTAL shares;
-Chairman and Chief Executive Officer: 127,617 shares and 8,931.37 units of the FCPE invested in TOTAL shares;
-members of the Executive Committee (4): 429,674 shares and 42,822.23 units of the collective investment fund ("FCPE") invested in TOTAL shares;
-executive officers (2): 678,534 shares and 75,514.57 units of the collective investment fund ("FCPE") invested in TOTAL shares.
By decision of the Board of Directors:
-Executive directors are required to hold a number of TOTAL shares equal in value to two years of the fixed portion of their annual compensation; and
-members of the Executive Committee are required to hold a number of TOTAL shares equal in value to two years of the fixed portion of their annual compensation. These shares must be acquired within three years of their appointment to the Executive Committee.
The number of TOTAL shares to be considered is comprised of TOTAL shares and units of the FCPE invested in TOTAL shares.
(1) Proportion calculated on the basis of 95,327 employees.
(2) The Group’s executive officers include the members of the Executive Committee, the four Senior Vice Presidents of the central Group functions who are members of the Group Performance Management Committee (HSE, Strategy & Climate, Communications, Legal), the Deputy Chief Financial Officer and the Treasurer.
(3) Including the Chairman and Chief Executive Officer, the director representing employee shareholders and the director representing employees.
(4) Excluding the Chairman and Chief Executive Officer.
Summary of transactions in the Company’s securities (Article L. 621-18-2 of the French Monetary and Financial Code)
The following table presents transactions, of which the Company has been informed, in the Company’s shares or related financial instruments carried out in 2018 by the individuals referred to in paragraphs a), b) (1) and c) of Article L. 621-18-2 of the French Monetary and Financial Code:
2018 | Acquisition | Subscription | Transfer | Exchange | Exercise of options | |
Patrick Pouyanné (a) | TOTAL shares | 38,880.00 | 3,665.00 | (21,400.00) | - | 21,400.00 |
Units in FCPE and other related financial instruments (b) | 363.49 | 1.98 | - | - | - | |
Patrick Artus (a) | TOTAL shares | - | - | - | - | - |
Units in FCPE and other related financial instruments (b) | - | - | - | - | - | |
Patricia Barbizet (a) | TOTAL shares | - | - | - | - | - |
Units in FCPE and other related financial instruments (b) | - | - | - | - | - | |
Marie-Christine Coisne-Roquette (a) | TOTAL shares | 161.00 | - | - | - | - |
Units in FCPE and other related financial instruments (b) | - | - | - | - | - | |
Mark Cutifani (a) | TOTAL shares | - | - | - | - | - |
Units in FCPE and other related financial instruments (b) | - | - | - | - | - | |
Maria van der Hoeven (a) | TOTAL shares | - | - | - | - | - |
Units in FCPE and other related financial instruments (b) | - | - | - | - | - | |
Anne-Marie Idrac (a) | TOTAL shares | - | - | (99.00) | - | - |
Units in FCPE and other related financial instruments (b) | - | - | - | - | - | |
Gérard Lamarche (a) | TOTAL shares | 107.00 | - | - | - | - |
Units in FCPE and other related financial instruments (b) | - | - | - | - | - | |
Jean Lemierre (a) | TOTAL shares | 14.00 | - | - | - | - |
Units in FCPE and other related financial instruments (b) | - | - | - | - | - | |
Renata Perycz (a) | TOTAL shares | 150.00 | - | - | - | - |
Units in FCPE and other related financial instruments (b) | 81.99 | - | - | - | - | |
Carlos Tavares (a) | TOTAL shares | - | - | - | - | - |
Units in FCPE and other related financial instruments (b) | - | - | - | - | - | |
Christine Renaud (a) | TOTAL shares | - | - | - | - | - |
Units in FCPE and other related financial instruments (b) | 176.80 | - | (392.00) | - | - | |
Arnaud Breuillac (a) | TOTAL shares | 18,860.00 | 1,348.00 | (6,100.00) | - | 17,300.00 |
Units in FCPE and other related financial instruments (b) | 301.11 | 2,950.40 | (8,511.27) | - | - | |
Patrick de La Chevardière (a) | TOTAL shares | 26,240.00 | - | (37,000.00) | - | 52,900.00 |
Units in FCPE and other related financial instruments (b) | 108.34 | 12,439.04 | (11,736.04) | - | - | |
Momar Nguer (a) | TOTAL shares | 7,790.00 | 429.00 | (5,712.00) | - | - |
Units in FCPE and other related financial instruments (b) | 409.02 | 7,091.96 | - | - | ||
Bernard Pinatel (a) | TOTAL shares | - | 897.00 | - | - | 2,550.00 |
Units in FCPE and other related financial instruments (b) | 52.69 | 2,850.55 | (1,729.97) | - | - | |
Philippe Sauquet (a) | TOTAL shares | 18,860.00 | - | (12,500.00) | - | 12,500.00 |
Units in FCPE and other related financial instruments (b) | 653.67 | 3,080.99 | (4,964.89) | - | - | |
Namita Shah (a) | TOTAL shares | 4,920.00 | 281.00 | - | - | 1,350.00 |
Units in FCPE and other related financial instruments (b) | 410.10 | 6,475.45 | (1,029.60) | - | - | |
(a) Including related parties within the meaning of the provisions of Article R. 621-43-1 of the French Monetary and Financial Code.
(b) FCPE primarily invested in TOTAL shares.
(1) The individuals referred to in paragraph b) of Article L. 621-18-2 of the French Monetary and Financial Code include the members of the Executive Committee.
4.2 Statement regarding corporate governance
For many years, TOTAL has taken an active approach to corporate governance and at its meeting on November 4, 2008, the Board of Directors decided to refer to the AFEP-MEDEF Code of Corporate Governance for publicly traded companies (available on the AFEP and MEDEF websites).
The AFEP-MEDEF Code was revised in June 2013 to introduce new changes regarding, in particular, a consultation procedure in which shareholders can express an opinion on the individual compensation of the executive directors (say on pay), as well as the establishment of a High Committee for corporate governance, an independent structure in charge of monitoring the implementation of the Code. It was also revised in November 2015 to introduce the principle of consultation of the Annual Shareholders’ Meeting in case of the sale of at least one half of the Company’s assets and to bring the Code in line with new laws regarding supplementary pensions of executive directors. The Code was also revised in November 2016 in order to clarify and complete certain recommendations, in particular on the independence of directors, CSR and the compensation of the executive directors. Finally, the AFEP-MEDEF Code was revised in June 2018, in particular in order to take increased account of corporate social and environmental responsibility. It also contains more stringent requirements in the realms of non-discrimination and diversity.
Pursuant to Article L. 225-37-4 of the French Commercial Code, the following table sets forth the sole recommendation made in the AFEP-MEDEF Code that the Company has opted not to follow as well as the reasons for such decision.
Recommendations not followed Supplementary pension plan (point 24.6.2 of the Code) Supplementary pension schemes with defined benefits must be subject to the condition that the beneficiary must be a director or employee of the company when claiming his or her pension rights pursuant to the applicable rules. Explanation - Practice followed by TOTAL It appeared justified not to deprive the relevant beneficiaries of the benefit of the pension commitments made by the Company in the particular cases of the disability or departure of a beneficiary over 55 years of age at the initiative of the Group. In addition, it should be noted that the supplementary pension plan set up by the Company was declared to URSSAF in 2004, in accordance with Articles L. 137-11 and R. 137-16 of the French Social Security Code. |
In recent years, the Company’s practices have evolved in two areas concerning the recommendations made in the AFEP-MEDEF Code.
First, a meeting of directors not attended by the executive directors has been held annually since 2017. The recommendation made in the AFEP-MEDEF Code (point 10.3) stating that "It is recommended that a meeting not attended by the executive officers be organized each year" is thus followed.
Second, concerning the recommendation made in the AFEP-MEDEF Code concerning the composition of the Compensation Committee that one "employee director should be a member", the Board of Directors approved on February 8, 2017, the proposal of the Governance and Ethics Committee to appoint Ms. Renata Perycz as a member of the Compensation Committee as of the Shareholder Meeting of May 26, 2017. Ms. Perycz, thanks to the nature of her salaried duties in the Group, brings in particular to the Compensation Committee her experience in Human Resources.
4.3 Compensation for the administration and management bodies
4.3.1 Board members’ compensation
Aggregate amount of directors’ fees
The conditions applicable to Board members’ compensation are defined by the Board of Directors on the proposal of the Governance and Ethics Committee, subject to the aggregate maximum amount of directors’ fees authorized by the Annual Shareholders’ Meeting of May 17, 2013, and set at €1.4 million per fiscal year.
In 2018, the aggregate amount of directors’ fees due to the members of the Board of Directors (12 directors on December 31, 2018) was €1.4 million.
Rules for allocating directors’ fees
The directors’ fees for fiscal year 2018 are allocated according to a formula comprised of fixed compensation and variable compensation based on fixed amounts per meeting, which makes it possible to take into account each director’s actual attendance at the meetings of the Board of Directors and its Committees, subject to the conditions below:
-a fixed annual portion of €20,000 per director (1);
-a fixed annual portion (1) of €30,000 for the Chairman of the Audit Committee (2);
-a fixed annual portion (1) of €25,000 for the Audit Committee members (2);
-a fixed annual portion (1) of €25,000 for the Chairman of the Governance and Ethics Committee and for the Chairman of the Compensation Committee (2);
-an additional fixed annual portion (1) of €30,000 for the Lead Independent Director (beyond amounts above);
-an amount of €7,500 per director for each Board of Directors’ meeting actually attended (in view of the additional workload of the Board);
-an amount of €3,500 per director for each Governance and Ethics Committee, Compensation Committee or Strategy and CSR Committee meeting actually attended;
(1) Calculated on a pro rata basis, in the event of change in the course of the year.
(2) To be substituted to the €20,000 fixed annual portion per director. In case of accumulation of the functions of director and/or Audit Committee member and/or Chairman of a Committee (Audit, Governance and Ethics, Compensation), the difference between the fixed annual portion per director and the fixed annual portion of the other functions is added.
-an amount of €7,000 per director for each Audit Committee meeting actually attended; and
-a premium of €4,000 for travel from outside France to attend a Board of Directors’ or Committee meeting.
The Chairman and Chief Executive Officer does not receive directors’ fees for his work on the Board and Committees of TOTAL S.A.
The total amount paid to each director is determined after taking into consideration the director’s actual presence at each Board of Directors’ or Committee meeting and, if appropriate, after prorating the amount set for each director such that the overall amount paid remains within the maximum limit set by the Shareholders’ Meeting. Directors’ fees for each fiscal year are paid following a decision by the Board of Directors, on the proposal of the Governance and Ethics Committee, at the beginning of the following fiscal year.
The director representing employee shareholders and the director representing employees receive directors’ fees according to the same terms and conditions as any other director.
In view of the number of Board and Committee meetings held in fiscal year 2018, the above allocation rules produced an amount of €1,610,000, which is higher than the cap voted by the Shareholders’ Meeting of May 17, 2013. Consequently, this amount was prorated, in application of the decision of the Board of Directors’ decision of February 9, 2012, so that the amount paid to the directors was at most equal to the amount of €1.4 million authorized by the Shareholders’ Meeting.
The table below presents the total compensation and including in-kind benefits due and paid during the previous two fiscal years to each executive and non-executive director in duties during the fiscal year.
Ms. Christine Renaud, the director representing employees since May 26, 2017, participates in the internal defined contribution pension plan applicable to all TOTAL S.A. employees, known as RECOSUP (Régime collectif et obligatoire de retraite supplémentaire à cotisations définies), governed by Article L. 242-1 of the French Social Security Code. The Company’s commitment is limited to its share of the contribution paid to the insurance company that manages the plan. For fiscal year 2018, this pension plan represented a booked expense to TOTAL S.A. in favor of Ms. Renaud of €647.
During the past two years, the directors currently in office have not received any compensation or in-kind benefits from TOTAL S.A. or from its controlled companies other than those mentioned in the table below.
Moreover, there is no service contract between a director and TOTAL S.A. or any of its controlled companies that provides for the grant of benefits under such a contract.
Table of directors’ fees and other compensation due and paid to the executive and non-executive directors (AMF position-recommendation No. 2009-16 - AMF Table No. 3)
Gross amount (€) | Fiscal year 2017 | Fiscal year 2018 | |||
Amounts due | Amounts paid | Amounts due | Amounts paid | ||
Patrick Pouyanné | Directors’ fees | - | - | - | - |
Other compensation | (a) | (a) | (a) | (a) | |
Patrick Artus | Directors’ fees | 128,000 | 121,000 | 138,696 | 128,000 |
Other compensation | - | - | - | - | |
Patricia Barbizet | Directors’ fees | 128,534 | 109,500 | 137,391 | 128,534 |
Other compensation | - | - | - | - | |
Marie-Christine Coisne-Roquette | Directors’ fees | 154,000 | 146,500 | 149,130 | 154,000 |
Other compensation | - | - | - | - | |
Mark Cutifani | Directors’ fees (b) | 53,500 | - | 106,522 | 53,500 |
Other compensation | - | - | - | - | |
Maria van der Hoeven | Directors’ fees | 148,500 | 43,576 | 194,348 | 148,500 |
Other compensation | - | - | - | - | |
Anne-Marie Idrac | Directors’ fees | 91,500 | 84,000 | 94,348 | 91,500 |
Other compensation | - | - | - | - | |
Gérard Lamarche | Directors’ fees | 181,000 | 150,000 | 201,304 | 181,000 |
Other compensation | - | - | - | - | |
Jean Lemierre | Directors’ fees | 88,000 | 32,076 | 94,348 | 88,000 |
Other compensation | - | - | - | - | |
Renata Perycz | Directors’ fees | 120,000 | 48,576 | 129,130 | 120,000 |
Other compensation | 57,946 | 57,946 | 60,681 | 60,681 | |
Christine Renaud | Directors’ fees (c) | 53,000 | - | 91,739 | 53,000 |
Other compensation | 60,789 | 60,789 | 63,471 | 63,471 | |
Carlos Tavares | Directors’ fees (b) | 42,000 | - | 63,043 | 42,000 |
Other compensation | - | - | - | - | |
TOTAL (d) | 1,306,769 | 853,963 | 1,524,151 | 1,312,186 | |
(a) For detailed information concerning compensation, refer to the summary tables presented in point 4.2.3 of this chapter.
(b) Director since May 26, 2017.
(c) Director representing employees since May 26, 2017. Ms. Renaud chose to pay, for the entire term of her directorship, all her directors’ fees to her trade union membership organizations.
(d) In 2018, the directors who left the Board of Directors following the Shareholders’ Meeting on May 26, 2017, received the amounts shown below for the fiscal year 2017: Mr. Desmarais, Jr. and Ms. Kux respectively received amounts of €17,000 and €39,500 in directors’ fees; Mr. Blanc, director representing employees, received an amount of €31,500 in directors’ fees, and an amount of €77,997 for the exercise of his salaried duties in the Group.
4.3.2 Chairman and Chief Executive Officer’s compensation
4.3.2.1 Compensation of Mr. Patrick Pouyanné for fiscal year 2018
This report by the Board of Directors, on the proposal of the Compensation Committee, and in application of Article L. 225-37-3 of the French Commercial Code, presents the total compensation and benefits of all kinds, paid to the Chairman and Chief Executive Officer in the fiscal year 2018 (1). It makes the distinction between the fixed, variable and extraordinary components of the total compensation and benefits, as well as the criteria used to calculate them or the circumstances due to which they were attributed. This report also mentions all the commitments of all kinds made by the Company in favor of the Chairman and Chief Executive Officer corresponding to the components of compensation, indemnities or benefits due or likely to be due upon acceptance, termination or change in duties or after the discharge thereof, in particular pension commitments and other annuities.
The payment to the Chairman and Chief Executive Officer of the variable component for fiscal year 2018 is conditional on the approval of the Ordinary Shareholders’ Meeting on May 29, 2019, of the compensation components of the Chairman and Chief Executive Officer, under the conditions stipulated in Articles L. 225-37-2, L. 225-100, and R. 225-29-1 of the French Commercial Code (decree No. 2017-340 of March 16, 2017, applicable since March 18, 2017).
The Ordinary Shareholders’ Meeting on May 29, 2019 will be called on to approve the fixed and variable components of the total compensation and the benefits of any kind paid or attributed to the Chairman and Chief Executive Officer for the fiscal year 2018, in application of Article L. 225-100 of the French Commercial Code.
(1) Including attributions in the form of stock, securities or rights giving accès to the company’s share capital or rights to the attribution of securities of the Company or of the companies mentioned in Articles L. 228-13 and L. 228-93 of the French commercial Code.
Table of the compensation of the Chairman and Chief Executive Officer (AMF position-recommendation No. 2009-16 - AMF Table No. 2)
(in €) | Fiscal year 2017 | Fiscal year 2018 | ||
Amount due for the fiscal year | Amount paid during the fiscal year (a) | Amount due for the fiscal year | Amount paid during the fiscal year (a) | |
Patrick Pouyanné | ||||
Chairman and Chief Executive Officer | ||||
Fixed compensation | 1,400,000 | 1,400,000 | 1,400,000 | 1,400,000 |
Annual variable compensation | 2,400,300 | 2,339,400 | 1,725,900 | 2,400,300 |
Multi-year variable compensation | - | - | - | - |
Extraordinary compensation | - | - | - | - |
Directors’ fees | - | - | - | - |
In-kind benefits (b) | 67,976 | 67,976 | 69,232 | 69,232 |
TOTAL | 3,868,276 | 3,807,376 | 3,195,132 | 3,869,532 |
(a) Variable portion paid for the prior fiscal year.
(b) Company car and the life insurance and health care plans paid for by the Company.
Summary of the compensation, options and shares granted to the Chairman and Chief Executive Officer (AMF position-recommendation No. 2009-16 - AMF Table No. 1)
(in €, except the number of shares) | Fiscal year 2017 | Fiscal year 2018 |
Patrick Pouyanné | ||
Chairman and Chief Executive Officer | ||
Compensation due for the fiscal year (details in AMF Table No. 2 above) | 3,868,276 | 3,195,132 |
Valuation of multi-year variable compensation paid during the fiscal year | - | - |
Accounting valuation of the options granted during the fiscal year | - | - |
Accounting valuation of the performance shares granted during the fiscal year (a) | 2,134,200 | 2,607,840 |
Number of performance shares granted during the fiscal year | 60,000 | 72,000 |
TOTAL | 6,002,476 | 5,802,972 |
Note: The valuations of the options and performance shares correspond to a valuation performed in accordance with IFRS 2 (see Note 9 to the Consolidated Financial Statements) and not to any compensation actually received during the fiscal year. Entitlement to performance shares is subject to the fulfillment of performance conditions assessed over a three-year period.
(a) For detailed information, refer to AMF Table No. 6 below. The valuation of the shares was calculated on the grant date (see Note 9 to the Consolidated Financial Statements).
AMF position-recommendation No. 2009-16 - AMF table No. 11
Executive directors | Employment contract | Supplementary pension plan | Payments or benefits due or likely to be due upon termination or change in duties | Benefits related to a non-compete agreement |
Patrick Pouyanné Chairman and Chief Executive Officer Start of term of office: December 19, 2015 End of term of office: Shareholders’ Meeting of 2021 to approve the financial statements for fiscal year 2020 | NO | YES Internal supplementary defined benefit pension plan (a) and defined contribution pension plan known as RECOSUP | YES (a) Severance benefit and retirement benefit | NO |
(a) Payment subject to a performance condition under the terms approved by the Board of Directors on March 14, 2018. Details of these commitments are provided below. The retirement benefit cannot be combined with the severance benefit.
Summary table of the components of the 2018 compensation for Mr. Patrick Pouyanné, Chairman and Chief Executive Officer of TOTAL S.A.
Components of compensation | Amount or accounting valuation submitted for vote | Presentation | ||
Components of total compensation paid or granted for fiscal year 2018 | ||||
Fixed compensation | €1,400,000 | The fixed compensation due to Mr. Pouyanné for his duties as Chairman and Chief Executive Officer for fiscal year 2018 was €1,400,000 (unchanged from fiscal year 2017). | ||
Annual variable compensation | €1,725,900 | The variable portion of Mr. Pouyanné’s compensation for his duties as Chairman and Chief Executive Officer for fiscal year 2018 has been set at €1,725,900, corresponding to 123.28% (of a maximum of 180%) of his fixed annual compensation based on results of the economic parameters and the evaluation of his personal contribution. At its meeting on March 13, 2019, the Board of Directors reviewed the level of achievement of the economic parameters based on the quantifiable targets set by the Board of Directors at its meeting on March 14, 2018. The Board of Directors also assessed the Chairman and Chief Executive Officer’s personal contribution on the basis of the four target criteria set during its meeting on March 14, 2018, to qualitatively assess his management. Annual variable compensation due for fiscal year 2018 (expressed as a percentage of the base salary) | ||
Maximum percentage | Percentage allocated | |||
Economic parameters (quantifiable targets) | 140% | 83.28% | ||
- Safety | 20% | 15.68% | ||
- TRIR | 12% | 11.80% | ||
- FIR, comparative | 4% | 0% | ||
- Evolution of the number of Tier 1 + Tier 2 incidents | 4% | 3.88% | ||
- Return on equity (ROE) | 30% | 27.6% | ||
- Net-debt-to-equity ratio (1) | 40% | 40% | ||
- Adjusted net income (ANI), comparative | 50% | 0% | ||
Personal contribution (qualitative criteria) | 40% | 40% | ||
- Steering of the strategy and successful strategic negotiations with producing countries - achievement of production and reserve targets | 15% | 15% | ||
- Performance and outlook with respect to Downstream activities (Refining & Chemicals/Marketing & Services) - The Group’s gas-electricity-renewables growth strategy | 10% | 10% | ||
- Corporate Social Responsibility (CSR) performance | 15% | 15% | ||
TOTAL | 180% | 123.28% | ||
The Board of Directors assessed achievement of the targets set for the economic parameters as follows: -The safety criterion was assessed for a maximum of 20% of the base salary through (i) the achievement of the annual TRIR (Total Recordable Injury Rate) target, (ii) the number of accidental deaths per million hours worked, FIR (Fatality Incident Rate) compared to those of the four large competitor oil companies (ExxonMobil, Royal Dutch Shell, BP and Chevron), as well as (iii) through change in the Tier 1 + Tier 2 indicator (2). These three sub-criteria were assessed based on the elements set out in the 2018 compensation policy for the Chairman and Chief Executive Officer, as approved by the Shareholders’ Meeting of June 1, 2018, and providing that: -the maximum weighting of the TRIR criterion is 12% of the base salary. The maximum weighting is reached if the TRIR is less than 0.9; the weighting of the criterion is zero if the TRIR is greater than or equal to 1.5. The interpolations are linear between these points of reference, -the maximum weighting of the FIR criterion is 4% of the base salary. The maximum weighting is reached if the FIR is the best of the majors’ panel ; it is zero if the FIR is the worst of the panel. The interpolations are linear between these points of reference, -the maximum weighting of the Tier 1 + Tier 2 criterion is 4% of the base salary. The maximum weighting is reached if the number of incidents is less than 100, it is zero if the number of incidents is greater than 200. The interpolations are linear between these points of reference. | ||||
(1) Net debt/shareholders’ equity + net debt before IFRS 16 impact.
(2) Tier 1 and Tier 2: indicator of the number of loss of primary containment events, with more or less significant consequences, as defined by the API 754 (for downstream) and IOGP 456 (for upstream) standards. Excluding acts of sabotage and theft.
Components of compensation | Amount or accounting valuation submitted for vote | Presentation |
Concerning the 2018 fiscal year, the following elements were noted: -the TRIR was 0.91, which is above the target of 0.9. The result of this criterion was thus set at 11.80%; -the FIR rate is 0.88, the last of the majors’ panel. The result of this criterion was thus fixed at 0%; -the number of Tier 1 + Tier 2 incidents was 103, which is above the target of 100. The result of this criterion was set at 3.88%. The result of the criterion related to the safety performance was thus set at 15.68%. -The return on equity (ROE) criterion (1), was assessed for a maximum of 30% of the base salary, based on the elements set out in the 2018 compensation policy of the Chairman and Chief Executive Officer, as approved by the Shareholders’ Meeting of June 1, 2018, and providing that: -the maximum weighting of the criterion is reached if the ROE is greater than or equal to 13%, -the weighting of the criterion is zero if the ROE is less than or equal to 6%, -the weighting of the criterion is at 50% of the maximum, i.e., 15%, for an ROE of 8%, -the interpolations are linear between these three points of reference. The Board of Directors noted that the ROE for fiscal year 2018 was 12.2%, i.e., higher than the target announced by the Group to the shareholders but below the limit of 13% corresponding to the maximum weighting. The result of this criterion was thus set at 27.6%. -The net-debt-to-equity ratio criterion (net debt/shareholders’ equity + net debt before IFRS 16 impact), was assessed for a maximum of 40% of the base salary, based on the elements set out in the compensation policy of the Chairman and Chief Executive Officer for 2018, as approved by the Shareholders’ Meeting of June 1, 2018 and providing that: -the maximum weighting of the criterion is reached for a net debt-to-equity ratio equal to or less than 20%, -the weighting of the criterion is zero for a net-debt-to-equity ratio equal to or greater than 30%, -the interpolations are linear between these two points of reference. The Board of Directors noted that the net-debt-to-equity ratio at 2018 year-end was 15.5%, i.e., below 20%. The target to maintain a net-debt-to-equity ratio below 20% being fully reached, the result of this criterion was set to its maximum at 40%. -The criterion related to the change in the Group’s adjusted net income (ANI) was assessed by comparison with those of the four large oil companies on the basis of estimates calculated by a group of leading financial analysts (2), based on the elements set out in the compensation policy of the Chairman and Chief Executive Officer for 2018, as approved by the Shareholders’ Meeting of June 1, 2018 and providing that: -the comparison is made on the average three-year progress of the ANI (a sliding three-year average of the ANI for each of the four companies in the panel applies, and the arithmetical average of these four averages is then calculated and compared with the changes in TOTAL’s ANI), -if the Group does better than the value observed for the panel, plus 12%, the weighting of the criterion is equal to the maximum of 50% of the base salary, -the weighting of the criterion is 60% of this maximum if the performance of the Group is identical to that of the panel, -the weighting of the criterion is zero if the performance of the Group is identical to that of the panel, minus 12%, -the interpolations are linear between these points of reference. The Board of Directors noted with regret that, whereas the income of the Group reached a higher level in 2018 with the price of oil at $71/b compared to 2014 with the price of oil at $99/b, this criterion presents an anomalous result: due to their very strong counter-performance in 2016 and 2017, two companies of the panel saw a strong growth of their relative performance in 2018 compared to 2017 in view of the evolution of the price of crude oil. As a result, the Group’s performance was below than that of the panel minus 12% and the result of this criterion was 0%. |
(1) The Group evaluates ROE as the ratio of adjusted consolidated net income to average adjusted shareholders’ equity between the beginning and the end of the period. Adjusted shareholders’ equity for fiscal year 2018 is calculated after payment of a dividend of €2.56 per share, subject to approval by the Shareholders’ Meeting on May 29, 2019. The ROE was 10.15% in 2017.
(2) Adjusted results are defined as income at replacement cost, excluding non-recurring items and the impact of fair value changes. The annual ANI of each peer used for the calculation is determined by taking the average of the ANIs published by a panel of six financial analysts: UBS, Crédit Suisse, Barclays, Bank of America Merrill Lynch, JP Morgan and Deutsche Bank. If any of these analysts is unable to publish the results of one or more peers for a given year, it will be replaced, for the year and for the peer(s) in question, in the order listed, by an analyst included in the following additional list: Jefferies, HSBC, Société Générale, Goldman Sachs and Citi. The ANIs used will be set according to these analysts’ last publications two business days after the publication of the press release announcing the "fourth quarter and annual results" of the last peer.
Components of compensation | Amount or accounting valuation submitted for vote | Presentation |
Regarding the Chairman and Chief Executive Officer’s personal contribution, the Board of Directors determined that the targets set were largely achieved in fiscal year 2018, particularly those related to: -Steering of the strategy and successful strategic negotiations with producing countries, and achievement of production and reserve targets, for a maximum of 15%: The Board of Directors has set the result of this criterion at its maximum because of the success in the Group’s strategic negotiations with the producing countries and the achievement of the production and reserve objectives. The Board noted in particular: -the finalization by Petrobras and TOTAL of the transfer of participation of the Lapa and Iara concessions in Brazil, -the finalization of the acquisition and integration of Mærsk Oil, -the extension of two offshore concessions in the United Arab Emirates in partnership with ADNOC, -the start of Kaombo Norte in Angola, the start of Egina in Nigeria, the gas discovery at Glendronach in the United Kingdom, -the start of the 3rd Yamal LNG train, the departure of the first Ichthys LNG cargo ship in Australia, -the discovery of Ballymore in the deep waters of Mexico. The Board of Directors also noted an increase in hydrocarbon production in 2018 of 8.17% compared to 2017 and the rate of renewal of reserves recorded at December 31, 2018 which is established (with an average price passing from $54.36/b in 2017 to $71.43/b in 2018) to + 157%. -Performance and outlook with respect to Downstream activities (Refining & Chemicals/Marketing & Services) and the Group’s gas-electricity-renewables growth strategy for a maximum of 10%: The Board of Directors set the result of this criterion to its maximum, i.e., 10% because of the success in development of the activities. The Board noted in particular: -the launch of the construction of the steam cracker in Port Arthur, -the opening of the first Total service station in Mexico in the framework of the agreement signed with Gasored, -the acquisition of Grupo Zema in Brazil, -the finalization of the acquisition of Engie’s LNG business, -the acquisition of Direct Énergie, -the association of TOTAL and Saudi Aramco to build a petrochemical complex in Jubail, -the association of TOTAL and Adani Group to develop a multi-energy offer in India, -the association of TOTAL and Sonatrach to launch studies for a petrochemical project in Algeria, -the start of the biosourced and recyclable plastic plant in Thailand. -CSR performance, notably taking into account the climate into the Group’s Strategy, the Group’s reputation in the domain of Corporate Social Responsibility as well as the policy concerning all aspects of diversity, for a maximum of 15%: The Board of Directors has set the result of this criterion at its maximum i.e. 15% because of the success in the actions realized in 2018 in the following fields: -Concerning the Group’s reputation in the field of societal policy: - the recognition of TOTAL as a Lead Company of the United Nations Global Compact, - TOTAL’s membership as a founding member of the UNGC Ocean Platform, - the Group’s commitment, in partnership with BP, Equinor and Shell, to adopt a collaborative approach to suppliers’ assessments of respect for human rights, - the revision of the Group Code of Conduct, - the Group’s commitment to the Total Foundation program supported by the Fondation d’entreprise, with significant partnerships and the launch of Action! Global Solidarity Program which allows all Group employees to take up to three days on working time for the benefit of associations. -Regarding non-financial rating agencies: - maintaining TOTAL in the Dow Jones Sustainability Indexes - DJSI World and Europe indices, - maintaining TOTAL in the FTSE4Good index ("footsie for good") - London Stock Exchange, - the retention of TOTAL’s A rating with the MSCI non-financial rating agency (on a scale from AAA to C). |
Components of compensation | Amount or accounting valuation submitted for vote | Presentation |
- the retention of the B-rating of TOTAL with the non-financial rating agency ISS-oekom (on a scale from A + to D-) and its "Prime" status (value recommended to socially responsible investors), - TOTAL’s ranking in the Corporate Human Rights Benchmark (9th in the extractive sector - 4th Oil & Gas company, behind ENI, Shell and BP). -Taking climate into account in the Group’s strategy: - the announcement of an ambition to reduce the carbon intensity of energy products used by its customers by 15% by 2030, - the announcement of a target to reduce methane emissions with an intensity of less than 0.20 in 2025, - the continued development on the integrated low carbon electricity chain: acquisition of Direct Énergie in France and Clean Energy Fuels Corp. in the United States, and of 4 natural gas combined cycle plants (CCGT). -Diversity policy: - TOTAL’s ranking in the top 10 of the Corporate Women Directors International Report (CWDI) in terms of diversity, - the commitment of the Group in the fight against sexism STOPE ("Stop au sexisme dit Ordinaire dans l’Entreprise"), - the achievement of the objectives set at the end of 2010 regarding the percentage of women and internationals individuals on the Management Committees, - the development of mentoring for women, - the Group’s support for the professional integration of young people: - alternates: Plan France "5,000 alternating" corresponding to 5% of the French workforce per year and spread over the 2016-2018 period; - 3% of hirings in 2018 are hiring from disadvantaged areas, - 1st year of High School internships: 50% of internships for High School (first year) in the Paris region are dedicated to disadvantaged young people, - creation and implementation of a learning path in partnership with "Create Your Future" and "United Way - L’Alliance". - the Group’s action in the area of disability, particularly with the signing of the ILO’s Corporate & Disability Charter and the launch of the Group’s International Disability initiative (roll-out to 40 first voluntary subsidiaries). Being that all the objectives were considered as largely met by the Board, the personal contribution of the Chairman and Chief Executive Officer was thus determined at its maximum, i.e., 40% of the fixed compensation. | ||
Multi-year or deferred variable compensation | n/a | The Board of Directors has not granted any multi-year or deferred variable compensation. |
Extraordinary compensation | n/a | The Board of Directors has not granted any extraordinary compensation. |
Directors’ fees | n/a | Mr. Pouyanné does not receive directors’ fees for his duties at TOTAL S.A. or at the companies it controls. |
Stock options, performance shares (and all other forms of long-term compensation) | €2,607,840 (1) (accounting valuation) | On March 14, 2018, Mr. Pouyanné was granted 72,000 existing shares of the Company (corresponding to 0.0028% of the share capital (2)) pursuant to the authorization of the Company’s Combined Shareholders’ Meeting of May 24, 2016 (twenty-fourth resolution) subject to the conditions set out below. These shares were granted under a broader share plan approved by the Board of Directors on March 14, 2018, relating to 0.24% of the share capital in favor of more than 10,000 beneficiaries. The definitive grant of all the shares is subject to the beneficiary’s continued presence within the Group during the vesting period and to performance conditions as described below. The definitive number of shares granted will be based on the comparative TSR (Total Shareholder Return) and the annual variation in net cash flow per share for fiscal years 2018 to 2020, applied as follows: -the Company will be ranked against its peers (ExxonMobil, Royal Dutch Shell, BP and Chevron) each year during the three vesting years (2018, 2019 and 2020), based on the TSR criterion of the last quarter of the year in question, the dividend being considered reinvested based on the closing price on the ex-dividend date. -the Company will be ranked each year against its peers (ExxonMobil, Royal Dutch Shell, BP and Chevron) during the three vesting years (2018, 2019 and 2020) using the annual variation in net cash flow per share criterion expressed in dollar. |
(1) The valuation of the shares was calculated on the grant date (see Note 9 to the Consolidated Financial Statements).
(2) Based on a share capital made up of 2,536,236,019 shares on the grant date.
Components of compensation | Amount or accounting valuation submitted for vote | Presentation |
Based on the ranking, a grant rate will be determined for each year: 1st: 180% of the grant; 2nd: 130% of the grant; 3rd: 80% of the grant; 4th and 5th: 0%. For each of the criteria, the average of the three grant rates obtained (for each of the three fiscal years for which the performance conditions are assessed) will be rounded to the nearest 0.1 whole percent (0.05% being rounded to 0.1%) and capped at 100%. Each criterion will have a weight of 50% in the definitive grant rate. The definitive grant rate will be rounded to the nearest 0.1 whole percent (0.05% being rounded to 0.1%). The number of shares definitively granted, after confirmation of the performance conditions, will be rounded to the nearest whole number of shares in case of a fractional lot. In application of Article L. 225-197-1 of the French Commercial Code, Mr. Pouyanné will, until the end of his term, be required to retain in the form of registered shares, 50% of the gains on the granted shares net of tax and national insurance contributions related to the shares granted in 2018. When Mr. Pouyanné holds (1) a volume of shares representing five times the fixed portion of his gross annual compensation, this percentage will be equal to 10%. If this condition is no longer met, the above-mentioned 50% holding requirement will again apply. In addition, the Board of Directors has noted that, pursuant to the Board’s Rules of Procedure applicable to all directors, the Chairman and Chief Executive Officer is not allowed to hedge the shares of the Company or any related financial instruments and has taken note of Mr. Pouyanné’s commitment to abstain from such hedging operations with regard to the performance shares granted. The grant of performance shares to Mr. Pouyanné is subject to the same requirements applicable to the other beneficiaries of the performance share plan as approved by the Board at its meeting on March 14, 2018. In particular, these provisions stipulate that the shares definitively granted at the end of the three-year vesting period will, after confirmation of fulfillment of the presence and performance conditions, be automatically recorded as pure registered shares on the start date of the two-year holding period and will remain non-transferable and unavailable until the end of the holding period. | ||
Payment for assuming a position | n/a | Mr. Pouyanné was not granted any payment for assuming his position. |
Components of total compensation paid or granted for fiscal year 2018 subject to a vote by the Annual Shareholders’ Meeting as per the procedure regarding regulated agreements and undertakings | ||
Valuation of in-kind benefits | €69,232 (accounting valuation) | The Chairman and Chief Executive Officer is entitled to a company vehicle. He is covered by the following life insurance plans provided by various life insurance companies: -An "incapacity, disability, life insurance" plan applicable to all employees, partly paid for by the Company, that provides for two options in case of death of a married employee: either the payment of a lump sum equal to 5 times the annual compensation up to 16 times the PASS, corresponding to a maximum of €3,241,920 in 2019, plus an additional amount if there is a dependent child or children, or the payment of a lump sum equal to three times the annual compensation up to 16 times the PASS, plus a survivor’s pension and education allowance; -A second "disability and life insurance" plan, fully paid by the Company, applicable to executive officers and senior executives whose annual gross compensation is more than 16 times the PASS. This contract, signed on October 17, 2002, amended on January 28 and December 16, 2015, guarantees the beneficiary the payment of a lump sum, in case of death, equal to two years of compensation (defined as the gross annual fixed reference compensation (base France), which corresponds to 12 times the monthly gross fixed compensation paid during the month prior to death or sick leave, to which is added the highest amount in absolute value of the variable portion received during one of the five previous years of activity), which is increased to three years in case of accidental death and, in case of accidental permanent disability, a lump sum proportional to the degree of disability. Death benefits are increased by 15% for each dependent child. Payments due under this contract are made after the deduction of any amount paid under the above-mentioned plan applicable to all employees. The Chairman and Chief Executive Officer also benefits from the health care plan applicable to all employees. |
(1) In the form of shares or units of mutual funds invested in shares of the Company.
Components of compensation | Amount or accounting valuation submitted for vote | Presentation |
Severance benefit | None | The Chairman and Chief Executive Officer is entitled to a benefit equal to two years of his gross compensation in the event of a forced departure related to a change of control or strategy. The calculation is based on the gross compensation (fixed and variable) of the 12 months preceding the date of termination or non-renewal of his term of office. The severance benefit will only be paid in the event of a forced departure related to a change of control or strategy. It will not be due in case of gross negligence or willful misconduct or if the Chairman and Chief Executive Officer leaves the Company of his own volition, accepts new responsibilities within the Group or may claim full retirement benefits within a short time period. These undertakings were subject to the procedure for regulated agreements, as provided for by Article L. 225-38 of the French Commercial Code. They were approved by the Annual Shareholders’ Meeting held on June 1, 2018. Pursuant to the provisions of Article L. 225-42-1 of the French Commercial Code, receipt of this severance benefit is contingent upon a performance-related condition applicable to the beneficiary, which is deemed to be fulfilled if at least two of the following criteria are met: -the average ROE (return on equity) for the three years preceding the year in which the Chairman and Chief Executive Officer leaves is at least 10%; -the average net-debt-to-equity ratio for the three years preceding the year in which the Chairman and Chief Executive Officer leaves is less than or equal to 30%; and -growth in TOTAL’s oil and gas production is greater than or equal to the average growth rate of four oil companies (ExxonMobil, Royal Dutch Shell, BP and Chevron) during the three years preceding the year in which the Chairman and Chief Executive Officer leaves. |
Retirement benefit | None | The Chairman and Chief Executive Officer is entitled to a retirement benefit equal to those available to eligible members of the Group under the French National Collective Bargaining Agreement for the Petroleum Industry. This benefit is equal to 25% of the fixed and variable annual compensation received during the 12 months preceding retirement. Pursuant to the provisions of Article L. 225-42-1 of the French Commercial Code, receipt of this retirement benefit is contingent upon a performance-related condition applicable to the beneficiary, which is deemed to be fulfilled if at least two of the following criteria are met: -the average ROE (return on equity) for the three years preceding the year in which the Chairman and Chief Executive Officer retires is at least 10%; -the average net-debt-to-equity ratio for the three years preceding the year in which the Chairman and Chief Executive Officer retires is less than or equal to 30%; -growth in TOTAL’s oil and gas production is greater than or equal to the average growth rate of four oil companies (ExxonMobil, Royal Dutch Shell, BP and Chevron) during the three years preceding the year in which the Chairman and Chief Executive Officer retires. The retirement benefit cannot be combined with the severance benefit described above. |
Non-compete compensation | n/a | Mr. Pouyanné has not received any non-compete compensation. |
Supplementary pension plan | None | Pursuant to applicable legislation, the Chairman and Chief Executive Officer is eligible for the basic French Social Security pension and for pension benefits under the ARRCO and AGIRC supplementary pension plans. He also participates in the internal defined contribution pension plan applicable to all TOTAL S.A. employees, known as RECOSUP (Régime collectif et obligatoire de retraite supplémentaire à cotisations définies), covered by Article L. 242-1 of the French Social Security Code. The Company’s commitment is limited to its share of the contribution paid to the insurance company that manages the plan. For fiscal year 2018, this pension plan represented a booked expense to TOTAL S.A. in favor of the Chairman and Chief Executive Officer of €2,384. The Chairman and Chief Executive Officer also participates in a supplementary defined benefit pension plan, covered by Article L. 137-11 of the French Social Security Code, set up and financed by the Company and approved by the Board of Directors on March 13, 2001, for which management is outsourced to two insurance companies effective January 1, 2012. This plan applies to all TOTAL S.A. employees whose compensation exceeds eight times the annual ceiling for calculating French Social Security contributions (PASS), set at €39,732 for 2018 (i.e., €317,856), and above which there is no conventional pension plan. |
Components of compensation | Amount or accounting valuation submitted for vote | Presentation |
To be eligible for this supplementary pension plan, participants must have served for at least five years, be at least 60 years old and exercised his or her rights to retirement from the French Social Security. The benefits under this plan are subject to a presence condition under which the beneficiary must still be employed at the time of retirement. However, the presence condition does not apply if a beneficiary aged 55 or older leaves the Company at the Company’s initiative or in case of disability. The length of service acquired by Mr. Pouyanné as a result of his previous salaried duties held at the Group since January 1, 1997, has been maintained for the benefit of this plan. The compensation taken into account to calculate the supplementary pension is the average gross annual compensation (fixed and variable portion) over the last three years. This pension plan provides a pension for its beneficiaries equal to 1.8% of the portion of the compensation falling between 8 and 40 times the PASS and 1% for the portion of the compensation falling between 40 and 60 times the PASS, multiplied by the number of years of service up to a maximum of 20 years. The sum of the annual supplementary pension plan benefits and other pension plan benefits (other than those set up individually and on a voluntary basis) may not exceed 45% of the average gross compensation (fixed and variable portion) over the last three years. In the event that this percentage is exceeded, the supplementary pension is reduced accordingly. The amount of the supplementary pension determined in this way is indexed to the ARRCO pension point. The supplementary pension includes a clause whereby 60% of the amount will be paid to beneficiaries in the event of death after retirement. To ensure that the acquisition of additional pension rights under this defined-benefit pension plan is subject to performance conditions to be defined pursuant to the provisions of Article L. 225-42-1 of the French Commercial Code amended by law No. 2015-990 of August 6, 2015, at the meeting on December 16, 2015, the Board of Directors noted the existence of the Chief Executive Officer’s pension rights under the above-mentioned pension plan, immediately before his appointment as Chairman, for the period from January 1, 1997, to December 18, 2015. The conditional rights granted for the period from January 1, 1997, to December 18, 2015 (inclusive), acquired without performance condition, correspond to a replacement rate equal to 34.14% for the portion of the base compensation falling between 8 and 40 times the PASS and a replacement rate of 18.96% for the portion of the base compensation falling between 40 and 60 times the PASS. The conditional rights granted for the period from December 19, 2015, to December 31, 2016, are subject to the performance condition described below and correspond to a replacement rate equal to 1.86% for the portion of the base compensation falling between 8 and 40 times the PASS and a replacement rate equal to 1.04% for the portion of the base compensation falling between 40 and 60 times the PASS. These undertakings regarding the supplementary pension plan were subject to the procedure for regulated agreements, as per Article L. 225-38 of the French Commercial Code, and they were approved by the Company’s Annual Shareholders’ Meeting on May 24, 2016. Pursuant to the provisions of Article L. 225-42-1 of the French Commercial Code, the acquisition of these conditional rights for the period from December 19, 2015, to December 31, 2016, was submitted by the Board of Directors meeting on December 16, 2015, to a condition related to the beneficiary’s performance, to be considered as fulfilled if the variable portion of the Chairman and Chief Executive Officer’s compensation paid in 2017 for fiscal year 2016 reached 100% of the base salary due for fiscal year 2016. In the event the variable portion had not reached 100% of his base salary, the rights would have been on a pro rata basis. On February 8, 2017, the meeting of the Board of Directors noted that the specified performance condition was fully met and therefore confirmed the acquisition by Mr. Pouyanné of additional pension rights for the period from December 19, 2015, to December 31, 2016. In addition, the Board noted that Mr. Pouyanné can no longer acquire additional pension rights under this plan given the rules for determining pension rights set out in the plan and the 20 years of service of Mr. Pouyanné as of December 31, 2016. The conditional rights granted to Mr. Patrick Pouyanné for the period from January 1, 1997, to December 31, 2016 (inclusive), are now equal to a reference rate of 36% for the portion of the base compensation falling between 8 and 40 times the PASS and 20% for the portion of the base compensation falling between 40 and 60 times the PASS. |
Components of compensation | Amount or accounting valuation submitted for vote | Presentation |
Based on Mr. Pouyanné’s seniority at the Company, capped at 20 years on December 31, 2016, the commitments made by TOTAL S.A. to the Chairman and Chief Executive Officer in terms of supplementary defined benefits and similar pension plans represented, at December 31, 2018, a gross annual retirement pension estimated at €616,641. It corresponds to 19.73% of Mr. Pouyanné’s gross annual compensation consisting of the annual fixed portion for 2018 (i.e., €1,400,000) and the variable portion to be paid in 2019 for fiscal year 2018 (1) (i.e., €1,725,900). Nearly the full amount of TOTAL S.A.’s commitments under these supplementary and similar retirement plans (including the retirement benefit) is outsourced for all beneficiaries to insurance companies and the non-outsourced balance is evaluated annually and adjusted through a provision in the accounts. The amount of these commitments as of December 31, 2018, is €18.0 million for the Chairman and Chief Executive Officer (€18.0 million for the Chairman and Chief Executive Officer and the executive and non-executive directors covered by these plans). These amounts represent the gross value of TOTAL S.A.’s commitments to these beneficiaries based on the estimated gross annual pensions as of December 31, 2018 as well as the statistical life expectancy of the beneficiaries. The total amount of all the pension plans in which Mr. Pouyanné participates represents, at December 31, 2018, a gross annual pension estimated at €719,002, corresponding to 23.00% of Mr. Pouyanné’s gross annual compensation defined above (annual fixed portion for 2018 and variable portion to be paid in 2019 for fiscal year 2018). In line with the principles for determining the compensation of executive directors as set out in the AFEP-MEDEF Code which the Company uses as a reference, the Board of Directors took into account the benefit accruing from participation in the pension plans when determining the Chairman and Chief Executive Officer’s compensation. | ||
Approval by the Shareholders’ Meeting | - | The commitments made to the Chairman and Chief Executive Officer regarding the pension and insurance plans, the retirement benefit and the severance benefit (in the event of forced departure related to a change of control or strategy) were authorized by the Board of Directors on March 14, 2018, and approved by the Shareholders’ Meeting on June 1, 2018. |
Draft resolution prepared by the Board of Directors in accordance with Article L. 225-100 of the French Commercial Code submitted to the Ordinary Shareholders’ Meeting of May 29, 2019
Approval of the fixed and variable components of the total compensation and the in-kind benefits paid or granted to the Chairman and Chief Executive Officer for the fiscal year ended December 31, 2018 Voting under the conditions of quorum and majority required for Ordinary Shareholders’ Meetings and in accordance with the provisions of Article L. 225-100 of the French Commercial Code, the shareholders approve the fixed and variable components of the total compensation and in-kind benefits paid or granted to the Chairman and Chief Executive Officer for the fiscal year ended December 31, 2018, as presented in the report on corporate governance, covered by Article L. 225-37 of the French Commercial Code and in the 2018 Registration Document (chapter 4, point 4.3.2.1). |
(1) Subject to approval by the Ordinary Shareholders’ Meeting on May 29, 2019.
Compensation due to the Chairman and Chief Executive Officer for the last three fiscal years

4.3.2.2 Principles and criteria for the determination, breakdown and allocation of the fixed, variable and extraordinary components of the total compensation (including in-kind benefits) attributable to the Chairman and Chief Executive Officer (Article L. 225-37-2 of the French Commercial Code)
This report, issued by the Board of Directors further to a proposal by the Compensation Committee, in accordance with the provisions of Article L. 225-37-2 of the French Commercial Code, describes the principles and criteria for the determination, breakdown and allocation of the fixed, variable and extraordinary components of the total compensation (including in-kind benefits) attributable to the Chairman and Chief Executive Officer as a result of his duties.
At its meeting on March 14, 2018, and on the proposal of the Compensation Committee, the Board of Directors decided that the amount of the fixed component of the compensation of the Chairman and Chief Executive Officer, the maximum percentage of the variable part of his compensation, as well as the annual number of performance shares attributed to the Chairman and Chief Executive Officer will not be changed throughout his term of office as Chairman and Chief Executive Officer, in other words, until the General Shareholders’ Meeting held in 2021 to approve the accounts of fiscal year ending December 31, 2020.
The compensation policy for the Chairman and Chief Executive Officer was approved by the Board of Directors, on the proposal of the Compensation Committee, at its meeting on March 13, 2019, on this basis. It remained based on the general principles for determining the compensation of the executive directors described below.
The payment to the Chairman and Chief Executive Officer of the variable compensation and of extraordinary components of the compensation due for fiscal year 2019 is subject to approval by the Ordinary Shareholders’ Meeting of May 29, 2020 of the compensation components of the Chairman and Chief Executive Officer in conditions provided for by Articles L. 225-37-2, L. 225-100 and R. 225-29-1 of French Commercial Code (Decree n° 2017-340 of March 16, 2017 entered into force on March 18, 2017).
The Ordinary General Shareholders’ Meeting of May 29, 2020 will be called on to approve the fixed, variable and extraordinary components of the total compensation and the benefits of any kind paid or attributed to the Chairman and Chief Executive Officer for fiscal year 2019 in application of Article L. 225-100 of French Commercial Code.
General principles for determining the compensation of the executive directors
The general principles for determining the compensation and other benefits granted to the executive directors of TOTAL S.A. are as follows.
-Compensation as well as benefits for the executive directors are set by the Board of Directors on the proposal of the Compensation Committee. Such compensation must be reasonable and fair. Compensation for the executive directors is based on the market, the work performed, the results obtained and the responsibilities assumed.
-Compensation for the executive directors includes a fixed portion and a variable portion. Only highly specific circumstances may warrant the award of extraordinary compensation (for example, due to their importance for the corporation, the involvement they demand and the difficulties they present). Justified reasons for the payment of this extraordinary compensation must be given, and the realisation of the event that gave rise to the payment must be explained.
-The fixed portion is reviewed with a periodicity that cannot be below two years.
-The amount of the variable portion is reviewed each year and may not exceed a stated percentage of the fixed portion. Variable compensation is determined based on pre-defined quantifiable and qualitative criteria that are periodically reviewed by the Board of Directors. Quantifiable criteria are limited in number, objective, measurable and adapted to the Company’s strategy.
-The variable portion rewards short-term performance and the progress made toward paving the way for medium-term development. It is determined in a manner consistent with the annual performance review of the executive directors and the Company’s medium-term strategy.
-The Board of Directors monitors the change in the fixed and variable portions of the executive directors’ compensation over several years in light of the Company’s performance.
-There is no specific pension plan for the executive directors. They are eligible for retirement benefits and pension plans available to certain employee categories in the Group under conditions determined by the Board.
-In line with the principles for determining the compensation of executive directors as set out in the AFEP-MEDEF Code which the Company uses as a reference, the Board of Directors takes into account the benefit accruing from participation in the pension plans when determining the compensation policy of the executive directors.
-Stock options and performance shares are designed to align the interests of the executive directors with those of the shareholders over the long term.
The grant of options and performance shares to the executive directors is reviewed in light of all the components of compensation of the person in question. No discount is applied when stock options are granted.
The exercise of options and the definitive grant of performance shares to which the executive directors are entitled are subject to conditions of presence in the Company and performance that must be met over several years. The departure of executive directors from the Group results in the inapplicability of share options and the rights to the definitive attribution of performance shares. Under exceptional circumstances, the Board of Directors can decide to maintain the share options and the rights to the definitive attribution of performance shares after the executive beneficiary’s departure, if the decision of the Board of Directors is specially justified and taken in the Company’s interest.
The Board of Directors determines the rules related to holding a portion of the shares resulting from the exercise of options as well as the performance shares definitively granted, which apply to the executive directors until the end of their term of office.
The executive directors cannot be granted stock options or performance shares when they leave office.
-After three years in office, the executive directors are required to hold at least the number of Company shares set by the Board.
-The components of compensation of the executive directors are made public after the Board of Directors’ meeting at which they are approved.
-The executive directors do not take part in any discussions or deliberations of the corporate bodies regarding items on the agenda of Board of Directors’ meetings related to the assessment of their performance or the determination of the components of their compensation.
-When a new executive director is nominated, the Board of Directors decides on his or her compensation as well as benefits, further to a proposal by the Compensation Committee, and in accordance with the above general principles for determining the compensation of the executive directors. Exceptional compensation or specific benefits when taking office are forbidden, unless the Board of Directors decides otherwise for particular reasons, in the Company’s interest and within the limits of the exceptional circumstances.
Compensation policy for the Chairman and Chief Executive Officer for fiscal year 2019
Base salary of the Chairman and Chief Executive Officer (fixed compensation)
The Board of Directors decided to maintain Mr. Patrick Pouyanné’s annual base salary (fixed compensation) for his duties as Chairman and Chief Executive Officer for fiscal year 2019 at €1,400,000 (the same as the fixed portion due for fiscal year 2018).
The level of the Chairman and Chief Executive Officer’s fixed compensation was set based on the responsibilities assumed and the compensation levels applied for executive directors of comparable companies (particularly CAC 40 companies).
Annual variable portion of the Chairman and Chief Executive Officer’s compensation
The Board of Directors also decided to maintain the maximum amount of the variable portion that could be paid to the Chairman and Chief Executive Officer for fiscal year 2019 at 180% of his base salary (the same percentage as in fiscal year 2018). This ceiling was set based on the level applied by a benchmark sample of companies operating in the energy sectors.
As in 2018, the formula for calculating the variable portion of the Chairman and Chief Executive Officer’s compensation for fiscal year 2019 uses economic parameters that refer to quantifiable targets reflecting the Group’s performance as well as the Chairman and Chief Executive Officer’s personal contribution allowing a qualitative assessment of his management.
The criteria applicable to the determination of the variable portion of the Chairman and Chief Executive Officer were set by the Board of Directors at its meeting of December 15, 2015, when Mr. Patrick Pouyanné, Chief Executive Officer since October 22, 2014, was appointed Chairman of the Board of Directors. In September 2016, a new organization within the Group was set up with the objectives of strengthening the Group’s resilience, reducing its sensitivity to the volatility of the price of oil on the integrated oil chain, and ensuring its development in the integrated gas chain, in renewable energies as well as in low-carbon electricity.
The Board of Directors has noted with satisfaction the remarkable success of the Group in achieving the objectives previously set, the Group’s strategy has evolved since 2015. In accordance with the principles relating to compensation policy of the executive director, the Board considers it appropriate to align the criteria of determination of the variable portion of the Chairman and Chief Executive Officer with the key criteria of this strategy, which is promoted to shareholders.
Thus, although the ROE and the net-debt-to-capital ratio are among the key objectives announced to shareholders. The strategy presented since 2015 rightly focuses on the pre-dividend organic cash breakeven with a target set since 2017 at a level below $30/b.
The Board retains the pre-dividend organic cash breakeven, which is essential in the management of the Company and which summarizes simultaneously all the discipline of the Group in connection with its cost reduction program, the choice of its investments and the policy of management of the Group’s portfolio.
The Board also considers it desirable to maintain a comparative criterion (to ensure a certain continuity in the structure of the compensation policy) and therefore to take into account the comparative ROACE of the majors since the Group has announced that it aims to be the most profitable among the majors.
Finally, taking into account the climate change-related challenges, the Board decides to introduce a quantitative criterion on the reduction of greenhouse gas emissions of the Group’s operated oil & gas facilities, given the stated objective of reducing them from 46 Mt CO2e in 2015 to less than 40 Mt CO2e in 2025.
Annual variable compensation due for fiscal year 2019 (expressed as a percentage of the base salary)
Maximum percentage | |||
Economic parameters (quantifiable targets): | 140% | ||
- HSE | 30% | ||
a) Safety | 20% | ||
- TRIR | 8% | ||
- FIR, comparative | 4% | ||
- Evolution of the number of Tier 1 + Tier 2 incidents | 8% | ||
b) Evolution of greenhouse gas (GHG) emissions | 10% | ||
- Return on equity (ROE) | 30% | ||
- Net-debt-to-capital ratio | 30% | ||
- Pre-dividend organic cash breakeven | 30% | ||
- Return on average capital employed (ROACE), comparative | 20% | ||
Personal contribution (qualitative criteria): | 40% | ||
- steering of the strategy and successful strategic negotiations with producing countries - achievement of production and reserve targets | 15% | ||
- performance and outlook with respect to Downstream activities (Refining & Chemicals/Marketing & Services) - the Group’s gas-electricity-renewables growth strategy | 10% | ||
- Corporate Social Responsibility (CSR) performance | 15% | ||
TOTAL | 180% | ||
The parameters used include:
-change in safety, for up to 20% of the base salary, assessed through the achievement of an annual TRIR (Total Recordable Injury Rate) target and the number of accidental deaths per million hours worked, FIR (Fatality Incident Rate) compared to those of four large competitor oil companies (ExxonMobil, Royal Dutch Shell, BP and Chevron), as well as through changes in the Tier 1 + Tier 2 indicator (1):
-the maximum weighting of the TRIR criterion is 8% of the base salary. The maximum weighting will be reached if the TRIR is below 0.85; the weighting of the criterion will be zero if the TRIR is above or equal to 1.4. The interpolations are linear between these points of reference;
-the maximum weighting of the FIR criterion is 4% of the base salary. The maximum weighting will be reached if the FIR is the best of the panel of the majors. It will be zero if the FIR is the worst of the panel. The interpolations are linear between these two points and depend on the ranking;
-the maximum weighting of the changes in the number of Tier 1 + Tier 2 incidents is 8% of the base salary. The maximum weighting will be reached if the number of Tier 1 + Tier 2 incidents equals 100 or below. The weighting of the parameter will be zero if the number of Tier 1 + Tier 2 incidents is equal to or higher than 180. The interpolations are linear between these two points of reference.
-change in GHG emission reduction on operated oil & gas facilities, assessed through the achievement of a GHG (Scope 1 and Scope 2) reduction emission target from 46 Mt CO2e in 2015 to 40 Mt CO2e in 2025, corresponding to a reduction of 600 kt CO2e/y, i.e. a target of 43.6 Mt CO2e for 2019. The maximum weighting of the GHG criterion is 10% of the base salary:
-the maximum weighting of the criterion is reached, i.e. 10% of the base salary, if the GHG Scopes 1 and 2 emission on the operated oil & gas facilities are below 43.6 Mt CO2e in 2019;
-the weighting of the criterion is zero if the emissions remain stable or increase compared to 2015 (46 Mt CO2e);
-the interpolations are linear between these points of reference.
-the return on equity (ROE) as published by the Group on the basis of its balance sheet and consolidated statement of income assessed as follows. The maximum weighting of the ROE criterion will be 30% of the base salary:
-the maximum weighting of the criterion is reached, i.e. 30% of the base salary, if the ROE is higher than or equal to 13%;
-the weighting of the criterion is zero if the ROE is lower than or equal to 6%;
-the weighting of the criterion is 50% of the maximum, i.e. 15% of the base salary, if the ROE is 8%;
-the interpolations are linear between these three points of reference.
-the net-debt-to-capital ratio as published by the Group on the basis of its balance sheet and consolidated statement of income, assessed as follows. The maximum weighting of the net-debt-to-capital ratio criterion is 30% of the base salary:
-the maximum weighting of the criterion, i.e. 30% of the base salary, is reached for a net-debt-to-capital ratio equal to or below 20%;
-the weighting of the criterion is zero if the net-debt-to-capital ratio is equal or above 30%;
-the interpolations are linear between these two points of reference.
-the pre-dividend organic cash breakeven, assessed as follows. The maximum weighting of this criterion is 30% of the base salary. The pre-dividend organic cash breakeven is defined as the Brent price for which the operating cash flow before working capital changes (2) (MBA) covers the organic investments (3). The ability of the Group to resist to the variations of the Brent barrel price is measured by this parameter:
-the maximum weighting of the criterion is reached, i.e. 30% of the base salary, if the breakeven is below or equal to 30 $/b;
-the weighting of the criterion is zero if the breakeven is above or equal to 40 $/b;
-the interpolations are linear between these two points of reference.
-the return on average capital employed (ROACE), by comparison, assessed as follows. The maximum weighting of the ROACE criterion will be 20% of the base salary. TOTAL’s ROACE, as published from the consolidated balance sheet and the income statement, will be compared to the ROACE average
(1) Tier 1 and Tier 2: indicator of the number of loss of primary containment events, with more or less significant consequences, as defined by the API 754 (for downstream) and IOGP 456 (for upstream) standards. Excluding acts of sabotage and theft.
(2) The operating cash flow before working capital changes is defined as cash flow from operating activities before changes in capital at replacement cost.
(3) Organic investments: net investments excluding acquisitions, asset sales and other operations with non-controlling interests.
of each of the four peers (ExxonMobil, Royal Dutch Shell, BP and Chevron). The ROACE is equal to the net adjusted operating income (1) divided by the average of the capital employed (at replacement costs, net of deferred income tax and non-current liabilities) of the start and end of the fiscal year.
-the maximum weighting of the criterion is reached, i.e. 20% of the base salary, if TOTAL’s ROACE is above 2% or more compared to the average of the 4 peers’ ROACE;
-the weighting of the criterion is zero if the TOTAL’s ROACE is under 2% or more compared to the average of the peers’ ROACE;
-the interpolations are linear between these two points of reference.
The Chairman and Chief Executive Officer’s personal contribution, which may represent up to 40% of the base salary, is evaluated based on the following criteria:
-steering of the strategy and successful strategic negotiations with producing countries, and achievement of production and reserve targets, for up to 15%;
-performance and outlook with respect to Downstream activities (Refining & Chemicals/Marketing & Services) and the Group’s gas-electricity-renewables growth strategy, for up to 10%;
-CSR performance, notably taking into account climate issues in the Group’s Strategy, the Group’s reputation in the domain of Corporate Social Responsibility, as well as the policy concerning all aspects of diversity, for up to 15%.
In the event of a significant change in the Group affecting the calculation of the economic perimeters for the Group (change in accounting standard, significant patrimonial transaction approved by the Board of Directors…), the Board may calculate the parameters mutatis mutandis, i.e., excluding exogenous extraordinary elements.
Furthermore, the Board of Directors reserves the right to exercise its discretionary powers regarding the determination of the compensation of the Chairman and Chief Executive Officer, pursuant to Articles L. 225-47, paragraph 1 and L. 225-53, paragraph 3 of the French Commercial Code, and according to Articles L. 225-37-2 and L. 225-100 of the French Commercial Code, in the event of particular circumstances that could justify that the Board of Directors adjusts, exceptionally and both on the upside and the downside, one or more of the criteria that make up his compensation to ensure that the results of the application of the criteria described above reflect both the performance of the Chairman and Chief Executive Officer and the performance of the Group either in absolute terms or relative to the four peers of the Group, for the economic criteria measured in comparison with these four peers.
This adjustment will be made to the variable compensation of the Chairman and Chief Executive Officer by the Board of Directors on the proposal of the Compensation Committee, within the limit of the variable compensation cap of 180% of the fixed compensation, after the Board of Directors duly motivated its decision.
Components of long-term compensation
The granting of performance shares to the Chairman and Chief Executive Officer is structured over a five-year period: a three-year vesting period, followed by a two-year holding period. The definitive grant of shares is subject to a presence condition and performance conditions assessed at the end of the three-year vesting period.
Performance shares are granted to the Chairman and Chief Executive Officer each year as part of plans that are not specific to him and concern more than 10,000 employees, a large majority of which are non-executive employees.
It should be noted that at its meeting on March 14, 2018, the Board of Directors decided to grant 72,000 performance shares to the Chairman and Chief Executive Officer under the 2018 plan. The 2018 plan approved by the Board of Directors in March 2018 granted a 7% higher volume of performance shares compared with the 2017 plan. More than 10,640 employees were concerned by this plan, over 97% of whom are non-senior executives. The Board of Directors adopts this proactive policy in an effort to strengthen the sense of belonging to the Group of the beneficiaries of performance shares, to involve them more closely in its performance and encourage their investment in the Company’s share capital.
The compensation policy proposed for fiscal year 2019 thus includes the granting of performance shares.
In this context, on the proposal of the Compensation Committee, the Board of Directors decided at its meeting on March 13, 2019, to grant 72,000 performance shares to the Chairman and Chief Executive Officer (the same number of shares as in 2018), as part of a 2019 plan that is not specific to him. The definitive granting of performance shares is subject to a presence condition and performance conditions assessed at the end of the three-year vesting period.
The definitive number of granted shares will be based on the TSR (Total Shareholder Return), the annual variation of the net cash flow by share in dollars, as well as the pre-dividend organic cash breakeven, for fiscal years 2019, 2020 and 2021, applied as follows:
-For 1/3 of the shares, the Company will be ranked against its peers (ExxonMobil, Royal Dutch Shell, BP and Chevron) each year during the three vesting years (2019, 2020 and 2021) based on the TSR criterion of the last quarter of the year in question, the dividend being considered reinvested based on the closing price on the ex-dividend date.
-For 1/3 of the shares, the Company will be ranked each year against its peers (ExxonMobil, Royal Dutch Shell, BP and Chevron) during the three vesting years (2019, 2020 and 2021) using the annual variation in net cash flow per share criterion expressed in dollar.
Based on the ranking, a grant rate will be determined for each year for these two first criteria: 1st: 180% of the grant; 2nd: 130% of the grant; 3rd: 80% of the grant; 4th and 5th: 0%.
-For 1/3 of the shares, the pre-dividend organic cash breakeven criterion will be assessed during the three vesting years (2019, 2020 and 2021) as follows. The pre-dividend organic cash breakeven is defined as the Brent price for which the operating cash flow before working capital changes covers the organic investments. The ability of the Group to resist to the variations of the Brent barrel price is measured by this parameter.
-the maximum grant rate will be reached if the breakeven is less than or equal to $30/b,
-the grant rate will be zero if the breakeven is greater than or equal to $40/b,
-the interpolations will be linear between these two points of reference.
A grant rate will be determined for each year.
For each of the three criteria, the average of the three grant rates obtained (for each of the three fiscal years for which the performance conditions are assessed) will be rounded to the nearest 0.1 whole percent (0.05% being rounded to 0.1%) and capped at 100%.
Each criterion will have a weight of 1/3 in the definitive grant rate. The definitive grant rate will be rounded to the nearest 0.1 whole percent (0.05% being rounded to 0.1%). The number of shares definitively granted, after confirmation of the performance conditions, will be rounded up to the nearest whole number of shares in case of a fractional share.
Following the three-year acquisition period, shares that have been definitively granted could not be disposed of before the end of a two-year holding period.
Stock options may be granted to the Chairman and Chief Executive Officer.
(1) Adjustments items include special items, the inventory effect and the impact for change for fair value.
(2) The operating cash flow before working capital changes is defined as cash flow from operating activities before changes in capital at replacement cost.
(3) Organic investments: net investments excluding acquisitions, asset sales and other operations with non-controlling interests.
Commitments made by the Company to the Chairman and Chief Executive Officer
The Board of Directors decided on March 14, 2018, on the Compensation Committee’s proposal, to maintain unchanged the commitments made to the Chairman and Chief Executive Officer regarding the pension plans, the retirement benefit and the severance benefit to be paid in the event of forced departure related to a change of control or strategy, as well as the life insurance and health care benefits presented below. They were approved by the Board of Directors on March 14, 2018, and by the Annual Shareholders’ Meeting on June 1, 2018, in accordance with the provisions of Article L. 225-42-1 of the French Commercial Code.
It should be noted that Mr. Pouyanné already benefited from all these provisions when he was an employee of the Company, except for the commitment to pay severance benefits in the event of forced departure related to a change of control or strategy. It should also be noted that Mr. Pouyanné, who joined the Group on January 1, 1997, ended the employment contract that he previously had with TOTAL S.A. through his resignation at the time of his appointment as Chief Executive Officer on October 22, 2014.
- Pension plans
Pursuant to applicable legislation, the Chairman and Chief Executive Officer is eligible for the basic French Social Security pension and for pension benefits under the ARRCO and AGIRC supplementary pension plans.
He also participates in the internal defined contribution pension plan applicable to all TOTAL S.A. employees, known as RECOSUP (Régime collectif et obligatoire de retraite supplémentaire à cotisations définies), covered by Article L. 242-1 of the French Social Security Code. The Company’s commitment is limited to its share of the contribution paid to the insurance company that manages the plan. For fiscal year 2018, this pension plan represented a booked expense to TOTAL S.A. in favor of the Chairman and Chief Executive Officer of €2,384.
The Chairman and Chief Executive Officer also participates in a supplementary defined benefit pension plan, covered by Article L. 137-11 of the French Social Security Code, set up and financed by the Company and approved by the Board of Directors on March 13, 2001, for which management is outsourced to two insurance companies effective January 1, 2012. This plan applies to all TOTAL S.A. employees whose compensation exceeds eight times the annual ceiling for calculating French Social Security contributions (PASS), set at €39,732 for 2018 (i.e., €317,856), and above which there is no conventional pension plan.
To be eligible for this supplementary pension plan, participants must have served for at least five years, be at least 60 years old and exercised his or her rights to retirement from the French Social Security. The benefits under this plan are subject to a presence condition under which the beneficiary must still be employed at the time of retirement. However, the presence condition does not apply if a beneficiary aged 55 or older leaves the Company at the Company’s initiative or in case of disability.
The length of service acquired by Mr. Pouyanné as a result of his previous salaried duties held at the Group since January 1, 1997, has been maintained for the benefit of this plan.
The compensation taken into account to calculate the supplementary pension is the average gross annual compensation (fixed and variable portion) over the last three years. The amount paid under this plan is equal to 1.8% of the compensation falling between 8 and 40 times the PASS and 1% for the portion of the compensation falling between 40 and 60 times this ceiling, multiplied by the number of years of service up to a maximum of 20 years, subject to the performance condition set out below applicable to the Chairman and Chief Executive Officer.
The sum of the annual supplementary pension plan benefits and other pension plan benefits (other than those set up individually and on a voluntary basis) may not exceed 45% of the average gross compensation (fixed and variable portion) over the last three years. In the event that this percentage is exceeded, the supplementary pension is reduced accordingly. The amount of the supplementary pension determined in this way is indexed to the ARRCO pension point.
The supplementary pension includes a clause whereby 60% of the amount will be paid to beneficiaries in the event of death after retirement.
To ensure that the acquisition of additional pension rights under this defined-benefit pension plan is subject to performance conditions to be defined pursuant to the provisions of Article L. 225-42-1 of the French Commercial Code amended by law No. 2015-990 of August 6, 2015, the Board of Directors noted the existence of the Chief Executive Officer’s pension rights under the above-mentioned pension plan, immediately before his appointment as Chairman, for the period from January 1, 1997, to December 18, 2015.
The conditional rights granted for the period from January 1, 1997, to December 18, 2015 (inclusive), acquired without performance conditions, correspond to a replacement rate equal to 34.14% for the portion of the base compensation falling between 8 and 40 times the PASS and a replacement rate of 18.96% for the portion of the base compensation falling between 40 and 60 times the PASS.
The conditional rights granted for the period from December 19, 2015, to December 31, 2016, are subject to the performance condition described below and correspond to a replacement rate equal to 1.86% for the portion of the base compensation falling between 8 and 40 times the PASS and a replacement rate equal to 1.04% for the portion of the base compensation falling between 40 and 60 times the PASS.
These undertakings regarding the supplementary pension plan were subject to the procedure for regulated agreements, as per Article L. 225-38 of the French Commercial Code, and they were approved by the Company’s Annual Shareholders’ Meeting on May 24, 2016.
Pursuant to the provisions of Article L. 225-42-1 of the French Commercial Code, the acquisition of these supplementary pension rights under the terms of the pension plan for the period from December 19, 2015, to December 31, 2016, was submitted by the Board of Directors meeting on December 16, 2015, to a condition related to the beneficiary’s performance, to be considered as fulfilled if the variable portion of the Chairman and Chief Executive Officer’s compensation paid in 2017 for fiscal year 2016 reached 100% of the base salary due for fiscal year 2016. In the event the variable portion had not reached 100% of his base salary, the rights would have been awarded on a pro rata basis.
On February 8, 2017, the Board of Directors noted that the specified performance condition was fully met and therefore confirmed the acquisition by Mr. Pouyanné of additional pension rights for the period from December 19, 2015, to December 31, 2016.
In addition, the Board noted that Mr. Pouyanné is no longer able to acquire additional pension rights under this plan given the rules for determining pension rights set out in the plan and Mr. Pouyanné’s 20 years of service as of December 31, 2016.
The conditional rights granted to Mr. Patrick Pouyanné for the period from January 1, 1997, to December 31, 2016 (inclusive), are now equal to a reference rate of 36% for the portion of the base compensation falling between 8 and 40 times the PASS and 20% for the portion of the base compensation falling between 40 and 60 times the PASS.
Based on Mr. Pouyanné’s seniority at the Company, capped at 20 years on December 31, 2016, the commitments made by TOTAL S.A. to the Chairman and Chief Executive Officer in terms of supplementary defined benefits and similar pension plans represented, at December 31, 2018, a gross annual retirement pension estimated
at €616,641. It corresponds to 19.73% of Mr. Pouyanné’s gross annual compensation consisting of the annual fixed portion for 2018 (i.e., €1,400,000) and the variable portion paid in 2019 (1) for fiscal year 2018 (i.e., €1,725,900).
Nearly the full amount of TOTAL S.A.’s commitments under these supplementary and similar retirement plans (including the retirement benefit) is outsourced for all beneficiaries to insurance companies and the non-outsourced balance is evaluated annually and adjusted through a provision in the accounts. The amount of these commitments as of December 31, 2018, is €18.0 million for the Chairman and Chief Executive Officer (€18.0 million for the Chairman and Chief Executive Officer and the executive and non-executive directors covered by these plans). These amounts represent the gross value of TOTAL S.A.’s commitments to these beneficiaries based on the estimated gross annual pensions as of December 31, 2018 as well as the statistical life expectancy of the beneficiaries.
The total amount of all the pension plans in which Mr. Pouyanné participates represents, at December 31, 2018, a gross annual pension estimated at €719,002, corresponding to 23.00% of Mr. Pouyanné’s gross annual compensation defined above (annual fixed portion for 2018 and variable portion paid in 2019 for fiscal year 2018).
- Retirement benefit
The Chairman and Chief Executive Officer is entitled to a retirement benefit equal to those available to eligible members of the Group under the French National Collective Bargaining Agreement for the Petroleum Industry. This benefit is equal to 25% of the fixed and variable annual compensation received during the 12 months preceding retirement.
Pursuant to the provisions of Article L. 225-42-1 of the French Commercial Code, receipt of this retirement benefit is contingent upon a performance-related condition applicable to the beneficiary, which is deemed to be fulfilled if at least two of the following criteria are met:
-the average ROE (return on equity) for the three years preceding the year in which the Chairman and Chief Executive Officer retires is at least 10%;
-the average net-debt-to-equity ratio for the three years preceding the year in which the Chairman and Chief Executive Officer retires is less than or equal to 30%; and
-growth in TOTAL’s oil and gas production is greater than or equal to the average growth rate of four oil companies (ExxonMobil, Royal Dutch Shell, BP and Chevron) during the three years preceding the year in which the Chairman and Chief Executive Officer retires.
The retirement benefit cannot be combined with the severance benefit described below.
- Severance benefit
The Chairman and Chief Executive Officer is entitled to a benefit equal to two years of his gross compensation in the event of a forced departure related to a change of control or strategy. The calculation is based on the gross compensation (fixed and variable) of the 12 months preceding the date of termination or non-renewal of his term of office.
The severance benefit will only be paid in the event of a forced departure related to a change of control or strategy. It will not be due in case of gross negligence or willful misconduct or if the Chairman and Chief Executive Officer leaves the Company of his own volition, accepts new responsibilities within the Group or may claim full retirement benefits within a short time period.
Pursuant to the provisions of Article L. 225-42-1 of the French Commercial Code, receipt of this severance benefit is contingent upon a performance-related condition applicable to the beneficiary, which is deemed to be fulfilled if at least two of the following criteria are met:
-the average ROE (return on equity) for the three years preceding the year in which the Chairman and Chief Executive Officer leaves is at least 10%;
-the average net-debt-to-equity ratio for the three years preceding the year in which the Chairman and Chief Executive Officer leaves is less than or equal to 30%; and
-growth in TOTAL’s oil and gas production is greater than or equal to the average growth rate of four oil companies (ExxonMobil, Royal Dutch Shell, BP and Chevron) during the three years preceding the year in which the Chairman and Chief Executive Officer leaves.
- Life insurance and health care plans
The Chairman and Chief Executive Officer is covered by the following life insurance plans provided by various life insurance companies:
-an "incapacity, disability, life insurance" plan applicable to all employees, partly paid for by the Company, that provides for two options in case of death of a married employee: either the payment of a lump sum equal to five times the annual compensation up to 16 times the PASS, corresponding to a maximum of €3,241,920 in 2019, plus an additional amount if there is a dependent child or children, or the payment of a lump sum equal to three times the annual compensation up to 16 times the PASS, plus a survivor’s pension and education allowance;
-a second "disability and life insurance" plan, fully paid by the Company, applicable to executive officers and senior executives whose annual gross compensation is more than 16 times the PASS. This contract, signed on October 17, 2002, amended on January 28 and December 16, 2015, guarantees the beneficiary the payment of a lump sum, in case of death, equal to two years of compensation (defined as the gross annual fixed reference compensation (base France), which corresponds to 12 times the monthly gross fixed compensation paid during the month prior to death or sick leave, to which is added the highest amount in absolute value of the variable portion received during one of the five previous years of activity), which is increased to three years in case of accidental death and, in case of accidental permanent disability, a lump sum proportional to the degree of disability. Death benefits are increased by 15% for each dependent child.
Payments due under this contract are made after the deduction of any amount paid under the above-mentioned plan applicable to all employees.
The Chairman and Chief Executive Officer also has the use of a company car and is covered by the health care plan available to all employees.
(1) Subject to approval by the Ordinary Shareholders’ Meeting on May 29, 2019.
Draft resolution prepared by the Board of Directors in accordance with Article L. 225-37-2 of the French Commercial Code submitted to the Ordinary Shareholders’ Meeting of May 29, 2019
Approval of the principles and criteria for the determination, breakdown and allocation of the fixed, variable and extraordinary components of the total compensation (including in-kind benefits) attributable to the Chairman and Chief Executive Officer Voting under the conditions of quorum and majority required for Ordinary Shareholders’ Meetings and in accordance with Article L. 225-37-2 of the French Commercial Code, the shareholders approve the principles and criteria for the determination, breakdown and allocation of the fixed, variable and extraordinary components of the total compensation (including in-kind benefits) attributable to the Chairman and Chief Executive Officer, as presented in the report on corporate governance, covered by Article L. 225-37 of the French Commercial Code and in the 2018 Registration Document (chapter 4, point 4.3.2.2). |
4.3.3 Executive officers’ compensation
The Group’s executive officers include the members of the Executive Committee, the four Senior Vice Presidents of the central Group functions who are members of the Group Performance Management Committee (HSE, Strategy & Climate, Communications, Legal), the Deputy Chief Financial Officer and the Treasurer.
As of December 31, 2018, the list of the Group’s executive officers was as follows (13 people, the same number as at December 31, 2017):
-Patrick Pouyanné, Chairman and Chief Executive Officer and President of the Executive Committee;
-Arnaud Breuillac, President, Exploration & Production, member of the Executive Committee;
-Patrick de La Chevardière, Chief Financial Officer, member of the Executive Committee;
-Momar Nguer, President, Marketing & Services, member of the Executive Committee;
-Bernard Pinatel, President, Refining & Chemicals, member of the Executive Committee;
-Philippe Sauquet, President, Gas, Renewables & Power, and President, Group Strategy-Innovation, member of the Executive Committee;
-Namita Shah, President, People & Social Responsibility, member of the Executive Committee;
-Xavier Bontemps, Senior Vice President Health, Safety Environment;
-Ladislas Paszkiewicz, Senior Vice President Strategy & Climate;
-Jacques-Emmanuel Saulnier, Senior Vice President Communication;
-Aurélien Hamelle, Senior Vice President Legal;
-Jean-Pierre Sbraire, Deputy Chief Financial Officer; and
-Antoine Larenaudie, Treasurer.
In 2018, the aggregate amount paid directly or indirectly by the Group’s French and foreign companies as compensation to the Group’s executive officers in office as of December 31, 2018 (13 people, the same number as at December 31, 2017) was €14.86 million (compared to €13.66 million in 2017), including €11.70 million paid to the members of the Executive Committee (seven people). The variable component (based on economic, HSE performance and personal contribution criteria) represented 51.20% of this global amount of €14.86 million.
4.3.4 Stock option and free share grants
4.3.4.1 General policy
In addition to its employee shareholding development policy, TOTAL S.A. has implemented a policy to involve employees and senior executives in the Group’s future performance which entails granting free performance shares each year. TOTAL S.A. may also grant stock options, although no plan has been put in place since September 14, 2011. These shares are granted under selective plans based on a review of individual performance at the time of each grant.
The stock option and free share plans offered by TOTAL S.A. concern only TOTAL shares and no free shares of the Group’s listed subsidiaries or options on them are granted by TOTAL S.A.
All grants are approved by the Board of Directors, on the proposal of the Compensation Committee. For each plan, the Compensation Committee recommends a list of beneficiaries, the conditions as well as the number of options or shares granted to each beneficiary. The Board of Directors then gives final approval for this list and the grant conditions.
- Grant of free performance shares
Grants of free performance shares under selective plans become definitive only at the end of a three-year vesting period, subject to the fulfillment of applicable presence and performance conditions. At the end of the vesting period, and provided that the conditions are met, the TOTAL shares are definitively granted to the beneficiaries, who must then hold them for at least two years (holding period). The presence condition applies to all shares.
For beneficiaries employed by a non-French company on the grant date, the vesting period for free shares may be increased to four years, in which case there is no mandatory holding period. Since 2011, all shares granted to senior executives have been subject to performance conditions.
- Stock options
Stock options have a term of eight years, with a strike price set at the average of the closing TOTAL share prices on Euronext Paris during the 20 trading days preceding the grant date, without any discount. Exercise of the options granted between 2007 and 2011 was subject to a presence condition and performance conditions, notably related to the Group’s return on equity (ROE), which vary depending on the plan and category of beneficiary.
All options granted in 2011 were subject to performance conditions. For options that could be granted pursuant to the authorization given by the Extraordinary Shareholders’ Meeting of May 24, 2016 (twenty-fifth resolution), the performance conditions will be assessed over a minimum period of three consecutive fiscal years. For earlier option plans, and subject to applicable presence and performance conditions being met, options may be exercised only at the end of an initial two-year period and the shares resulting from the exercise may only be disposed of at the end of a second two-year period.
In addition, for the 2007 to 2011 option plans, the shares resulting from the exercise of options by beneficiaries employed by a non-French company on the grant date may be disposed of or converted to bearer form at the end of the first two-year vesting period.
4.3.4.2 Follow-up of grants to the executive directors
Stock options
No stock options have been granted since September 14, 2011. Until that date, the Company’s executive directors in office at the time of the decision were granted stock options as part of broader grant plans approved by the Board of Directors for certain Group employees and senior executives. The options granted to the executive directors were subject to the same requirements applicable to the other beneficiaries of the grant plans.
For the options granted between 2007 and 2011, the Board of Directors made the exercise of the options granted to the executive directors in office contingent upon a presence condition and performance conditions based on the Group’s ROE and ROACE. The grant rate of the performance-related options under the 2009, 2010 and 2011 plans was 100%, compared to 60% for the 2008 plan.
All the options granted to Mr. Pouyanné outstanding at December 31, 2018, represent 0.000379% of the Company’s share capital (1) on that date.
Stock options granted in 2018 to each executive director by the issuer and by any Group company
(AMF position-recommendation No. 2009-16 - AMF Table No. 4)
Executive directors | Plan No. and date | Type of options (purchase or subscription) | Valuation of options (€) (a) | Number of options granted during the fiscal year | Strike price | Exercise period |
Patrick Pouyanné | - | - | - | - | - | - |
(a) According to the method used for the Consolidated Financial Statements.
Stock options exercised in fiscal year 2018 by each executive director (AMF position-recommendation No. 2009-16 - AMF Table No. 5)
Plan No. and date | Number of options exercised during the fiscal year | Strike price | |
Patrick Pouyanné | 2010 Plan - 09/14/2010 | 9,000 | €38.20 |
2011 Plan - 09/14/2011 | 12,400 | €33.00 |
Grant of free performance shares
Mr. Pouyanné is granted performance shares as part of the broader grant plans approved by the Board of Directors for certain Group employees. The performance shares granted to him are subject to the same requirements applicable to the other beneficiaries of the grant plans.
Summary tables
Free shares granted to each director (a) in fiscal year 2018 by the issuer and by any Group company (AMF position-recommendation No. 2009-16 - AMF Table No. 6)
Executive and non-executive directors | Plan No. and date | Number of shares granted during the fiscal year | Valuation of the shares (€) (b) | Acquisition date | Date of transferability | Performance conditions |
Patrick Pouyanné | 2018 Plan 03/14/2018 | 72,000 | 2,607,840 | 03/15/2021 | 03/16/2023 | The performance conditions are based for: - 50% of the performance shares granted, on the Company’s ranking against its peers (c) completed each year during the three vesting years (2018, 2019 and 2020) based on the TSR criterion of the last quarter of the year in question, the dividend being considered reinvested based on the closing price on the ex-dividend date; and - 50% of the performance shares granted, on the Company’s ranking against its peers (c) completed each year during the three years of vesting (2018, 2019 and 2020) using the annual variation in net cash flow per share expressed in dollars criterion. |
Renata Perycz | 2018 Plan 03/14/2018 | 280 | 10,141.60 | 03/15/2021 | 03/16/2023 | |
Christine Renaud | 2018 Plan 03/14/2018 | - | - | 03/15/2021 | 03/16/2023 | |
TOTAL | 72,280 | 2,617,981.60 |
(a) List of executive and non-executive directors who had this status during fiscal year 2018.
(b) The valuation of the shares was calculated on the grant date according to the method used for the Consolidated Financial Statements.
(c) ExxonMobil, Royal Dutch Shell, BP and Chevron.
(1) Based on share capital divided into 2,640,602,007 shares.
Free shares that have become transferable for each director (a) (AMF position-recommendation No. 2009-16 - AMF Table No. 7)
Executive and non-executive directors | Plan No. and date | Number of shares that became transferable during the fiscal year | Vesting conditions |
Patrick Pouyanné | 2015 Plan | 38,880 | The performance conditions are based for: -40% of the performance shares granted, on the Group’s average return on equity (ROE) and return on average capital employed (ROACE) during the three years of vesting (2015, 2016 and 2017); and -60% of the performance shares granted, on the variation of the 3-year average adjusted net income (ANI) of TOTAL, as published by the Group, compared to its peers (b) during the three years of vesting (2015, 2016 and 2017). |
Renata Perycz | 2015 Plan | 150 | The first 150 shares are granted without performance conditions. Above this threshold, the performance conditions are based for: -40% of the performance shares granted, on the Group’s return on equity (ROE) during the three years of vesting (2015, 2016 and 2017); and -60% of the performance shares granted, on the variation of the 3-year average adjusted net income (ANI) of TOTAL, as published by the Group, compared to its peers (b) during the three years of vesting (2015, 2016 and 2017). |
Christine Renaud | 2015 Plan | - |
(a) List of executive and non-executive directors who had this status during fiscal year 2018.
(b) ExxonMobil, Royal Dutch Shell and Chevron.
4.3.4.3 Follow-up of TOTAL stock option plans as of December 31, 2018
Breakdown of TOTAL stock option grants by category of beneficiary
The breakdown of TOTAL stock options granted by category of beneficiary (executive officers, other senior executives and other employees) for each of the plans in effect during fiscal year 2018 is as follows:
Number of beneficiaries | Number of notified options | Percentage | Average number of options per beneficiary | ||
2010 Plan (a): Subscription options Decision of the Board of Directors of September 14, 2010 Strike price: €38.20; discount: 0.0% | Executive officers (b) | 25 | 1,348,100 | 28.2% | 53,924 |
Senior executives | 282 | 2,047,600 | 42.8% | 7,261 | |
Other employees | 1,790 | 1,392,720 | 29.0% | 778 | |
TOTAL | 2,097 | 4,788,420 | 100% | 2,283 | |
2011 Plan (a): Subscription options Decision of the Board of Directors of September 14, 2011 Strike price: €33.00; discount: 0.0% | Executive officers (b) | 29 | 846,600 | 55.7% | 29,193 |
Senior executives | 177 | 672,240 | 44.3% | 3,798 | |
Other employees | - | - | - | - | |
TOTAL | 206 | 1,518,840 | 100% | 7,373 |
(a) The grant rate of performance-related options was 100% for the 2009, 2010 and 2011 plans.
(b) Members of the Executive Committee and the Management Committee and the Treasurer, as of the date of the Board meeting granting the TOTAL share subscription options.
For the 2010 share subscription options plan, only a portion of the TOTAL share subscription options granted to beneficiaries of more than 3,000 share subscription options was subject to a performance condition. For the 2011 share subscription options plan, the granting of all the options was subject to a performance condition.
Since September 14, 2011, the Board of Directors has not granted any share subscription or purchase options.
Breakdown of TOTAL stock option plans
History of stock option grants - Information on stock options (AMF position-recommendation No. 2009-16 - AMF Table No. 8)
2010 Plan | 2011 Plan | Total | |
Type of options | Subscription options | Subscription options | |
Date of the Shareholders’ Meeting | 05/21/2010 | 05/21/2010 | |
Date of the Board meeting/grant date (a) | 09/14/2010 | 09/14/2011 | |
Total number of options granted by the Board of Directors, including to: | 4,788,420 | 1,518,840 | 6,307,260 |
Executive and non-executive directors (b) | 40,000 | 30,400 | 70,400 |
- P. Pouyanné | 40,000 | 30,400 | 70,400 |
- C. Renaud | n/a | n/a | n/a |
- R. Perycz | n/a | n/a | n/a |
Date as of which the options may be exercised: | 09/15/2012 | 09/15/2013 | |
Expiry date | 09/14/2018 | 09/14/2019 | |
Strike price (€) (c) | 38.20 | 33.00 | |
Cumulative number of options exercised as of December 31, 2018 | 4,618,084 | 1,249,210 | 5,867,294 |
Cumulative number of options canceled as of December 31, 2018 | 170,336 | 4,400 | 174,736 |
Number of options: | |||
- Outstanding as of January 1, 2018 | 1,950,372 | 490,568 | 2,440,940 |
- Granted in 2018 | - | - | - |
- Canceled in 2018 (d) | 79,139 | - | 79,139 |
- Exercised in 2018 | 1,871,233 | 225,338 | 2,096,571 |
OUTSTANDING AS OF DECEMBER 31, 2018 | - | 265,230 | 265,230 |
(a) The grant date is the date of the Board meeting granting the options.
(b) List of executive and non-executive directors who had this status during fiscal year 2018. Ms. Perycz is a TOTAL Polska sp. Z.o.o. employee and a TOTAL S.A. director representing employee shareholders since May 24, 2016. Ms. Renaud is a TOTAL S.A. employee and a TOTAL S.A. director representing employees since May 26, 2017.
(c) The strike price is the average closing price of TOTAL’s share on Euronext Paris during the 20 trading days preceding the option grant date, without any discount.
(d) The 79,139 share subscription options canceled in 2018 correspond to unexercised options before the expiration date of the 2010 plan that had expired on September 14, 2018.
If all the stock options outstanding at December 31, 2018, were exercised, the corresponding shares would represent 0.01% (1) of the Company’s share capital on that date.
Stock options granted to the 10 employees (other than executive or non-executive directors) receiving the largest number of options/Stock options exercised by the ten employees (other than executive or non-executive directors) exercising the largest number of options (AMF position-recommendation No. 2009-16 - AMF Table No. 9)
Total number of options granted/exercised | Weighted average strike price (€) | 2010 Plan 09/14/2010 | 2011 Plan 09/14/2011 | |
Options granted in fiscal year 2018 by TOTAL S.A. and its affiliates (a) to each of the 10 employees of TOTAL S.A. and its affiliates (other than executive or non-executive directors) receiving the largest number of options (aggregate - not individual information) | - | - | - | - |
Options held on TOTAL S.A. and its affiliates (a) and exercised in fiscal year 2018 by the 10 employees of TOTAL S.A. and its affiliates (other than executive or non-executive directors at the date of the exercises) who purchased or subscribed for the largest number of shares (aggregate - not individual information) | 222,800 | 37.42 | 189,200 | 33,600 |
(a) Pursuant to the conditions of Article L. 225-180 of the French Commercial Code.
(1) Based on share capital divided into 2,640,602,007 shares.
4.3.4.4 Follow-up of TOTAL free share grants as of December 31, 2018
Breakdown of TOTAL performance share grants by category of beneficiary
The following table gives a breakdown of TOTAL performance share grants by category of beneficiary (executive officers, other senior executives and other employees):
Number of beneficiaries | Number of notified shares | Percentage | Average number of shares per beneficiary | ||
2014 Plan (a) | Executive officers (b) | 32 | 421,200 | 9.4% | 13,163 |
Senior executives | 281 | 975,300 | 21.7% | 3,471 | |
Other employees | 9,624 | 3,089,800 | 68.9% | 321 | |
TOTAL | 9,937 | 4,486,300 | 100% | 451 | |
2015 Plan (a) | Executive officers (d) | 13 | 264,600 | 5.6% | 20,354 |
Senior executives | 290 | 1,132,750 | 23.8% | 3,906 | |
Other employees | 10,012 | 3,364,585 | 70.6% | 336 | |
TOTAL | 10,315 | 4,761,935 | 100% | 462 | |
2016 Plan | Executive officers (d) | 12 | 269,900 | 4.8% | 22,492 |
Senior executives | 279 | 1,322,300 | 23.4% | 4,739 | |
Other employees (c) | 10,028 | 4,047,200 | 71.8% | 404 | |
TOTAL | 10,319 | 5,639,400 | 100% | 547 | |
2017 Plan | Executive officers (d) | 12 | 266,500 | 4.7% | 22,208 |
Senior executives | 277 | 1,321,200 | 23.3% | 4,770 | |
Other employees (c) | 10,288 | 4,092,249 | 72.0% | 398 | |
TOTAL | 10,577 | 5,679,949 | 100% | 537 | |
2018 Plan | Executive officers (d) | 13 | 301,000 | 5.0% | 23,154 |
Senior executives | 288 | 1,443,900 | 23.7% | 5,014 | |
Other employees (c) | 10,344 | 4,338,245 | 71.3% | 419 | |
TOTAL | 10,645 | 6,083,145 | 100% | 571 |
(a) For the 2014 plan, the share acquisition rate related to the ROE performance condition only was 38%. For the 2015 plan, the share acquisition rate related to a comparison of ROE and ANI was 81% for the executive director and 82% for the other beneficiaries.
(b) Members of the Executive Committee and the Management Committee and the Treasurer, as of the date of the Board meeting granting the performance shares.
(c) Ms. Perycz, an employee of Total Polska sp. Z.o.o. and a TOTAL S.A. director representing employee shareholders since May 24, 2016, was granted 160 shares under the 2016 plan, 260 shares under the 2017 plan and 280 shares under the 2018 plan. Ms. Renaud, an employee of TOTAL S.A. and a TOTAL S.A. director representing employee shareholders since May 26, 2017, was not granted any shares under the 2017 plan or the 2018 plan.
(d) Group’s executive officers as of the date of the Board meeting granting the performance shares. The Group’s executive officers as of this date included the members of the Executive Committee (excluding the Chairman and Chief Executive Officer), the four Senior Vice Presidents of the central Group functions who are members of the Group Performance Management Committee (HSE, Strategy & Climate, Communications, Legal), the Deputy Chief Financial Officer, under the 2018 plan only, and the Treasurer.
The performance shares, which were previously bought back by the Company on the market, are definitively granted to their beneficiaries at the end of a three-year vesting period from the grant date.
The definitive grant of performance shares is subject to a presence condition and performance conditions.
For the 2018 plan, the applicable performance conditions are the following:
-for 50% of the performance shares granted, the Company will be ranked against its peers (1) each year during the three vesting years (2018, 2019 and 2020) based on the TSR criterion of the last quarter of the year in question, the dividend being considered reinvested based on the closing price on the ex-dividend date; and
-for 50% of the performance shares granted, the Company will be ranked each year against its peers (1) during the three years of vesting (2018, 2019 and 2020) using the annual variation in net cash flow per share expressed in dollars criterion.
In addition, shares that have been definitively granted cannot be disposed of before the end of a mandatory two-year holding period.
(1) ExxonMobil, Royal Dutch Shell, BP and Chevron.
Breakdown of TOTAL performance share plans
History of TOTAL performance share grants - Information on performance shares granted (AMF position-recommendation No. 2009-16 - AMF Table No. 10)
2014 Plan | 2015 Plan | 2016 Plan | 2017 Plan | 2018 Plan | |
Date of the Shareholders’ Meeting | 05/16/2014 | 05/16/2014 | 05/24/2016 | 05/24/2016 | 05/24/2016 |
Date of Board meeting/grant date | 07/29/2014 | 07/28/2015 | 07/27/2016 | 07/26/2017 | 03/14/2018 |
Closing price on grant date | €52.220 | €43.215 | €42.685 | €43.220 | €47.030 |
Average purchase price per share paid by the Company | €48.320 | €45.150 | €46.010 | €47.350 | n/a |
Total number of performance shares granted, including to: | 4,486,300 | 4,761,935 | 5,639,400 | 5,679,949 | 6,083,145 |
Executive and non-executive directors (a) | 25,000 | 48,000 | 60,160 | 60,260 | 72,280 |
- P. Pouyanné | 25,000 (b) | 48,000 | 60,000 | 60,000 | 72,000 |
- R. Perycz (c) | n/a | n/a | 160 | 260 | 280 |
- C. Renaud (d) | n/a | n/a | n/a | - | - |
Start of the vesting period | 07/29/2014 | 07/28/2015 | 07/27/2016 | 07/26/2017 | 03/14/2018 |
Definitive grant date, subject to the conditions set (end of the vesting period) | 07/30/2017 | 07/29/2018 | 07/28/2019 | 07/27/2020 | 03/15/2021 |
Disposal possible from (end of the holding period) | 07/30/2019 | 07/29/2020 | 07/29/2021 | 07/28/2022 | 03/16/2023 |
Number of free shares granted: | |||||
- Outstanding as of January 1, 2018 | - | 4,697,305 | 5,607,100 | 5,679,039 | - |
- Notified in 2018 | - | - | - | - | 6,083,145 |
- Canceled in 2018 | - | (621,568) | (61,840) | (26,640) | (12,350) |
- Definitively granted in 2018 (e) | - | (4,075,737) | (2,040) | (1,480) | - |
OUTSTANDING AS OF DECEMBER 31, 2018 | - | - | 5,543,220 | 5,650,919 | 6,070,795 |
(a) List of executive and non-executive directors who had this status during fiscal year 2018.
(b) Shares granted in respect of his previous salaried duties.
(c) Ms. Perycz, a TOTAL Polska sp. Z.o.o. employee and a TOTAL S.A. director representing employee shareholders since May 24, 2016.
(d) Ms. Renaud, a TOTAL S.A. employee and a TOTAL S.A. director representing employees since May 26, 2017.
(e) Definitive grants completed during fiscal year 2018, including early grants following the death of the beneficiaries of shares for the respective plan.
If all the performance shares outstanding at December 31, 2018, were definitively granted, they would represent 0.65% (1) of the Company’s share capital on that date.
Performance shares granted to the 10 employees (other than executive and non-executive directors) receiving the largest number of performance shares
Number of performance shares notified/definitively granted | Date of the award | Date of the final award (end of the vesting period) | Date of transferability (end of the holding period) | |
Free performance share grants approved by the Board of Directors at its meeting on March 14, 2018, to the ten employees of TOTAL S.A. and its affiliates (other than executive or non-executive directors at the date of the exercises) who purchased or subscribed for the largest number of shares (a) | 236,500 | 03/14/2018 | 03/15/2021 | 03/16/2023 |
Performance shares definitively granted in fiscal year 2018 to the 10 employees of TOTAL S.A. and its affiliates (other than executive and non-executive directors on the date of the decision) receiving the largest number of performance shares | 136,530 | 07/28/2015 | 07/29/2018 | 07/29/2020 |
(a) These shares will be definitively granted to their beneficiaries at the end of a three-year vesting period, i.e., on March 15, 2021, subject to two performance conditions being met. The free shares that have been definitively granted cannot be disposed of before the end of a two-year holding period, i.e., March 16, 2023.
(1) Based on share capital divided into 2,640,602,007 shares.
4.4 Additional information about corporate governance
4.4.1 Regulated agreements and undertakings and related-party transactions
Regulated agreements and undertakings
[REDACTED SECTION: CERTAIN TEXT HAS BEEN REDACTED.]
In addition, to TOTAL’s knowledge there exists no agreement, other than the agreements related to its ordinary course of business and signed under normal conditions, engaged, directly or through an intermediary, between, on the one hand, any director or shareholder holding more than 10% of TOTAL S.A.’s voting rights and, on the other hand, a company of which TOTAL S.A. directly or indirectly owns more than half the capital.
Related-party transactions
Details of transactions with related parties as specified by the regulations adopted under EC regulation 1606/2002, entered into by the Group companies during fiscal years 2016, 2017 or 2018, are provided in Note 8 to the Consolidated Financial Statements (refer to point 8.7 of chapter 8).
These transactions primarily concern equity affiliates and non-consolidated companies.
4.4.2 Delegations of authority and powers granted to the Board of Directors with respect to share capital increases and authorization for share cancellation
Table compiled in accordance with Article L. 225-37-4 3° of the French Commercial Code summarizing the use of delegations of authority and powers granted to the Board of Directors with respect to share capital increases as of December 31, 2018
Type | Cap on par value, or number of shares or expressed as % of share capital | Use in 2018, | Available balance as of | Date of | Expiry date | |
Maximum cap | Debt securities | €10 Bn in securities | - | €10 Bn | June 1, 2018 | August 1, 2020 |
Nominal share | An overall cap of €2.5 Bn (i.e., a maximum of 1,000 million shares issued with a pre-emptive subscription right), from which can be deducted: | 18 million | €2.455 Bn | June 1, 2018 | August 1, 2020 | |
1/ a specific cap of €625 million, i.e., a maximum of 250 million shares for issuances without a pre-emptive subscription right (with potential use of a greenshoe), including in compensation with securities contributed within the scope of a public exchange offer, provided that they meet the requirements of Article L. 225-148 of the French Commercial Code, from which can be deducted: | - | €625 million | June 1, 2018 | August 1, 2020 | ||
1a/ a sub-cap of €625 million with a view to issuing, through an offer as set forth in Article L. 411-2 II of the French Monetary and Financial Code (b), shares and securities resulting in a share capital increase, without a shareholders’ pre-emptive subscription right | - | €625 million | June 1, 2018 | August 1, 2020 | ||
1b/ a sub-cap of €625 million through in-kind contributions when the provisions of Article L. 225-148 of the French Commercial Code are not applicable | - | €625 million | June 1, 2018 (17th resolution) | August 1, 2020 | ||
2/ a specific cap of 1.5% of the share capital on the date of the Board (c) decision for share capital increases reserved for employees participating in a Company savings plan | 18 million | 21.6 million shares | June 1, 2018 | August 1, 2020 | ||
0.75% of share capital (c) on the date of the Board decision to grant options | - | 19.8 million shares | May 24, 2016 | July 24, 2019 | ||
Free shares granted to Group employees and to executive directors | 1% of share capital (c) on the date of the Board decision to grant the shares | - | 26.4 million shares | June 1, 2018 | August 1, 2021 |
(a) The number of new shares authorized under the 13th resolution of the ESM held on June 1, 2018, cannot exceed 1,000 million shares. Pursuant to the 18th resolution of the ESM held on June 1, 2018, the Board of Directors decided on September 19, 2018, to proceed with a share capital increase reserved for Group employees in 2019 (see Note(c) below). As a result, the available balance under this authorization amounts to 982,000,000 new shares as of December 31, 2018.
(b) And the offers set out in Article 1, Paragraph 4, a) and b) of Regulation (EU) No. 2017/1129 of the European Parliament and of the Council of June 14, 2017, on the prospectus to be published when securities are offered to the public or admitted to trading on a regulated market.
(c) Based on share capital as of December 31, 2018, divided into 2,640,602,007 shares.
(d) The number of new shares authorized under the 18th resolution of the June 1, 2018, ESM may not exceed 1.5% of the share capital on the date when the Board of Directors decides to use the delegation. The meeting of the Board of Directors of September 19, 2018, decided to proceed with a share capital increase in 2019 with a cap of 18,000,000 shares (subscription to the shares under this operation is planned for the second quarter of 2019, subject to the decision of the Chairman and Chief Executive Officer). As a result, the available balance under this authorization was 21,609,030 new shares as of December 31, 2018.
Authorization to cancel shares of the Company
Pursuant to the terms of the 13th resolution of the Shareholders’ Meeting held on May 26, 2017, the Board of Directors is authorized to cancel shares of the Company up to a maximum of 10% of the share capital of the Company existing as of the date of the operation within a 24-month period. This authorization is effective until the Shareholders’ Meeting held to approve the financial statements for the year ending December 31, 2021.
On December 12, 2018, the Board of Directors, pursuant to this authorization, canceled 44,590,699 shares representing 1.66% of the share capital on that date. This cancellation, combined with the cancellation of 100,331,268 TOTAL shares on December 16, 2016, brings the number of TOTAL shares canceled in the last 24 months to 144,921,967.
Based on 2,640,602,007 shares outstanding on December 31, 2018, the Company could, taking into account the shares canceled on December 12, 2018, cancel 219,469,501 further shares, before reaching the cancellation threshold of 10% of share capital canceled over a 24-month period.
4.4.3 Provisions of the bylaws governing shareholders’ participation in General Meetings
4.4.3.1 Calling of shareholders to Shareholders’ Meetings
Shareholders’ Meetings are convened and conducted under the conditions provided for by law.
The Ordinary Shareholders’ Meeting is called to take any decisions that do not modify the Company’s bylaws. It is held at least once a year within six months of the closing date of each fiscal year to approve the financial statements of that year. It may only deliberate, at its first meeting, if the shareholders present, represented or participating by remote voting hold at least one fifth of the shares that confer voting rights. No quorum is required at its second meeting. Ordinary Shareholders’ Meeting decisions are made with the majority of votes of shareholders present, represented or participating by remote voting.
Only the Extraordinary Shareholders’ Meeting is authorized to modify the bylaws. It may not, however, increase shareholders’ commitments. It may only deliberate, at its first meeting, if the shareholders present, represented or participating by remote voting hold at least one quarter, and, at the second meeting, one fifth, of the shares that confer voting rights. Decisions of Extraordinary Shareholders’ Meeting are made with a two thirds majority of votes of shareholders present, represented or participating by remote voting.
One or several shareholders holding a certain percentage of the Company’s share capital (calculated using a decreasing scale based on the share capital) may ask for items or draft resolutions to be added to the agenda of a Shareholders’ Meeting under the forms, terms and deadlines set forth by the French Commercial Code. Requests to add items or draft resolutions to the agenda must be sent no later than 20 days after the publication of the notice of meeting that the Company must publish in the French official journal of legal notices (Bulletin des annonces légales obligatoires, BALO). Any request to add an item to the agenda must be justified. Any request to add a draft resolution must be accompanied by the draft resolution text and brief summary of the grounds for this request. Requests made by shareholders must be accompanied by a proof of their share ownership as well as their ownership of the portion of capital as required by the regulations. Review of the item or draft resolution filed pursuant to regulatory conditions is subject to those making the request providing a new attestation justifying the shares being recorded in a book-entry form in the same accounts on the second business day preceding the date of the meeting.
The Central Social and Economic Committee (formerly the Central Works Council) may also request the addition of draft resolutions to the meeting agendas under the forms, terms and deadlines set by the French Labor Code. In particular, requests to add draft resolutions must be sent within 10 business days following the date on which the notice of meeting was published.
4.4.3.2 Admission of shareholders to Shareholders’ Meetings
Participation in any form in Shareholders’ Meetings is subject to registration of participating shares, either in the registered account maintained by the Company (or its securities agent) or recorded in bearer form in a securities account maintained by a financial intermediary. Proof of this registration is obtained under a certificate of participation (attestation de participation) delivered to the shareholder. Registration of the shares must be effective no later than midnight (Paris time) on the second business day preceding the date of the Shareholders’ Meeting. If, after having received such a certificate, shares are sold or transferred prior to this record date, the certificate of participation will be canceled and the votes sent by mail or proxies granted to the Company for such shares will be canceled accordingly. If shares are sold or transferred after this record date, the certificate of participation will remain valid and votes cast or proxies granted will be taken into account.
4.4.4 Information about factors likely to have an impact in the event of a public takeover or exchange offer
In accordance with Article L. 225-37-5 of the French Commercial Code, information relating to factors likely to have an impact in the event of a public offering is provided below.
-Structure of the share capital
The structure of the Company’s share capital as well as the interests that the Company is aware of pursuant to Articles L. 233-7 and L. 233-12 of the French Commercial Code are presented in points 6.4.1 to 6.4.3 in chapter 6.
-Restrictions on the exercise of voting rights and transfers of shares provided in the bylaws - Clauses of the agreements of which the Company has been informed in accordance with Article L. 233-11 of the French Commercial Code
The provisions of the bylaws relating to shareholders’ voting rights are mentioned in point 7.2.4 of chapter 7. The Company has not been informed of any clauses as specified in paragraph 2 of Article L. 225-37-4 of the French Commercial Code.
-Holders of securities conferring special control rights
Article 18 of the bylaws stipulates that double voting rights are granted to all the shares held in the name of the same shareholder for at least two years. Subject to this condition, there are no securities conferring special control rights as specified in paragraph 4 of Article L. 225-37-5 of the French Commercial Code.
-Control mechanisms specified in an employee shareholding system
The rules relating to the exercise of voting rights within the Company collective investment funds are presented in point 6.4.2 of this chapter 6.
-Shareholder agreements of which the Company is aware and that could restrict share transfers and the exercise of voting rights
The Company is not aware of any agreements between shareholders as specified in paragraph 6 of Article L. 225-37-5 of the French Commercial Code which could result in restrictions on the transfer of shares and exercise of the voting rights of the Company.
-Rules applicable to the appointment and replacement of members of the Company’s Board of Directors and amendment of the bylaws
No provision of the bylaws or agreement made between the Company and a third party contains a specific provision relating to the appointment and/or replacement of the Company’s directors that is likely to have an impact in the event of a public offering.
-Powers of the Board of Directors in the event of a public offering
The delegations of authority or authorizations granted by the Shareholders’ Meeting that are currently in effect limit the powers of the Board of Directors during public offering on the Company’s shares. Such delegation expire during a public offering.
-Agreements to which the Company is party and which are altered or terminated in the event of a change of control of the Company - Agreements providing for the payment of compensation to members of the Board of Directors or employees in the event of their resignation or dismissal without real and serious cause or if their employment were to be terminated as a result of a public offering
Although a number of agreements made by the Company contain a change in control clause, the Company believes that there are no agreements as specified in paragraph 9 of Article L. 225-37-5 of the French Commercial Code. The Company also believes that there are no agreements as specified in paragraph 10 of Article L. 225-37-5 of the French Commercial Code. For commitments made for the Chairman and Chief Executive Officer in the event of a forced departure owing to a change of control or strategy, refer to point 4.2.2 of this chapter.
4.4.5 Statutory auditors
4.4.5.1 Auditor’s term of office
Statutory auditors
ERNST & YOUNG Audit
1/2, place des Saisons, 92400 Courbevoie-Paris-La Défense, Cedex 1
Appointed: May 14, 2004. Appointment renewed on May 24, 2016, for a 6-fiscal year term.
Céline Eydieu-Boutté, Yvon Salaün
KPMG S.A.
Tour EQHO, 2 avenue Gambetta, CS 60055, 92066 Paris-La Défense Cedex
Appointed: May 13, 1998. Appointment renewed on May 24, 2016, for a 6-fiscal year term.
Jacques-François Lethu, Éric Jacquet
Alternate auditors
Cabinet Auditex
1/2, place des Saisons, 92400 Courbevoie-Paris-La Défense, Cedex 1
Appointed: May 21, 2010.
Appointment renewed on May 24, 2016, for a 6-fiscal year term.
KPMG Audit IS
Tour EQHO, 2 avenue Gambetta, CS 60055, 92066 Paris-La Défense Cedex
Appointed: May 21, 2010.
Appointment renewed on May 24, 2016, for a 6-fiscal year term.
French law provides that the statutory and alternate auditors are appointed for renewable 6-fiscal year terms. The terms of office of the statutory auditors and of the alternate auditors will expire at the end of the Shareholders’ Meeting called in 2022 to approve the financial statements for fiscal year 2021.
4.4.5.2 Fees received by the statutory auditors (including members of their networks)
ERNST & YOUNG Audit | KPMG S.A. | |||||||
Amount in M$ | Amount in M$ | |||||||
(excluding VAT) | % | (excluding VAT) | % | |||||
2017 | 2018 | 2017 | 2018 | 2017 | 2018 | 2017 | 2018 | |
Audit | ||||||||
Statutory auditors. certification. examination of the parent company and consolidated accounts | 22.3 | 26.3 | 74.5 | 77.3 | 17.7 | 20.8 | 76.3 | 76.7 |
TOTAL S.A. | 3.3 | 3.5 | 10.9 | 10.3 | 3.3 | 3.5 | 14.2 | 12.9 |
Fully Consolidated subsidiaries | 19.0 | 22.8 | 63.6 | 67.0 | 14.4 | 17.3 | 62.1 | 63.8 |
Other work and services directly related to the mission of the statutory auditors | 2.8 | 3.2 | 9.3 | 9.4 | 3.8 | 4.2 | 16.4 | 15.5 |
TOTAL S.A. | 0.9 | 0.2 | 3.1 | 0.6 | 0.7 | 0.7 | 3.0 | 2.6 |
Fully Consolidated subsidiaries | 1.9 | 3.0 | 6.2 | 8.8 | 3.1 | 3.5 | 13.4 | 12.9 |
SUBTOTAL | 25.1 | 29.5 | 83.8 | 86.7 | 21.5 | 25.0 | 92.7 | 92.2 |
Other services provided by the networks to fully Consolidated subsidiaries | ||||||||
Legal. tax. labor law | 4.2 | 3.9 | 13.9 | 11.5 | 1.5 | 1.9 | 6.5 | 7.0 |
Other | 0.7 | 0.6 | 2.3 | 1.8 | 0.2 | 0.2 | 0.9 | 0.8 |
SUBTOTAL | 4.9 | 4.5 | 16.2 | 13.3 | 1.7 | 2.1 | 7.3 | 7.8 |
TOTAL | 30.0 | 34.0 | 100 | 100 | 23.2 | 27.1 | 100 | 100 |
5
NON-FINANCIAL PERFORMANCE
Chapter 5 of this Registration Document constitutes the consolidated statement of non-financial performance as per Article L. 225-102-1 of the French Commercial Code, and discloses how the Company and the entities included in the scope of consolidation, in accordance with Article L. 233-16 of the French Commercial Code, take into account the social and environmental consequences of their activities, as well as the effects of those activities with regard to respect for human rights and fighting corruption and tax evasion.
Pursuant to the above mentioned Article L. 225-102-1, this statement also includes information about the impact on climate change of the Company’s activity and the use of the goods and services that it produces, its societal commitments in order to promote sustainable development, the circular economy, the collective agreements in place within the Company and their impacts on the Company’s economic performance as well as on employees’ working conditions, the actions aimed at fighting discrimination and promoting diversity, and the measures taken in favor of people with disabilities (1).
This statement of non-financial performance was prepared with the assistance of several of the Company’s corporate functional divisions, in particular the Legal, Finance, Audit & Internal Control and People & Social Responsibility Divisions. The statement was reviewed by the Audit Committee and was thereafter approved by the Board of Directors.
The data presented in the statement of non-financial performance are provided on a current-scope basis. The reporting scopes and method concerning the information in this chapter are presented in point 5.11 of this chapter.
(1) The Group has not made any specific societal commitments in order to prevent food waste and food poverty or to promote animal welfare and responsible, fair and sustainable food, as these are not significant challenges with respect to the nature of the Group’s activities.
5.1 Introduction
An ambition for the Company: to become the responsible energy major
TOTAL is present in more than 130 countries. The nature of its activities and its geographical footprint in complex environments place the Group at the junction of a range of society’s concerns relating to people, the environment or business ethics. Faced with these challenges, TOTAL’s ambition is to become the responsible energy major by contributing to supply to as many people as possible a more affordable, more available, and cleaner energy.
This ambition is embodied by the One Total Company project, which unites the various activities of the Group, its entities and all of its employees around a Company’s evolution process with the aim to supply energy to an ever-growing population, taking into account the challenges of climate change and new energy production and consumption patterns. This ambition is based on the values restated and shared by all, (Safety, Respect for Each Other, Pioneer Spirit, Stand Together and Performance-Minded). These values guide the Group’s actions.
TOTAL’s Code of Conduct sets forth the principles to be applied during day-to-day operations. It states the Group’s commitments and expectations of each of its stakeholders and serves as a reference for employees and any other person working on behalf of the Group.
The Company adheres to the United Nations Global Compact and the responsible development strategy of the Group is based, in particular, on taking into account the United Nations’ Sustainable Development Goals (SDGs) in its operations. As such, TOTAL intends to conduct its activities according to the following principles of:
-ensuring the safety and security of people and the integrity of its facilities;
-limiting its environmental footprint;
-taking into account climate change challenges into its strategy;
-incorporating the challenges of sustainable development in the management of its activities;
-promoting equal opportunities and fostering gender and cultural diversity among its personnel;
-respecting human rights and business ethics;
-increasing its local foothold through stakeholders dialogue with the objective of creating shared value.
The Group employs a continuous risk identification process. These risk mappings enable the Group to develop sector policies according to the desired level of control. The Group also manages its activities through internal management systems implemented at the different levels of the company (headquarters, subsidiaries and sites). Within this framework, the Group performs regular assessments, following different modalities, of the risks and impacts of its activities in the areas of industrial safety, security, the environment, workers and local residents’ protection, and business ethics. These assessments are generally carried out:
-prior to investment decisions in the Group’s industrial projects (safety and security studies, impact assessments, particularly environmental and societal), acquisition and divestiture;
-during operations;
-prior to placing new substances on the market (toxicological and ecotoxicological studies, life cycle analyses).
These assessments incorporate the regulatory requirements of the countries where the Group operates and generally accepted professional practices. In addition, internal control systems are structured and regularly adjusted to align with the specific features of certain areas and the corporate strategic orientations set by the Board of Directors and General Management.
As part of its statement of non-financial performance, TOTAL has thus identified the main challenges linked to its activities. These are listed in the introduction to the sections relating to social information, health, safety, the environment, climate, human rights, the fight against corruption and tax evasion, its societal approach and contractors and suppliers relationships. |
For its reporting, TOTAL refers to the GRI (Global Reporting Initiative) and to the TCFD (Task Force on Climate-related Financial Disclosures) recommendations on climate. It also relates to the IPIECA guidance for environmental and societal issues. Detailed information on these reporting guidelines is available on the Group’s website (sustainable-performance.total.com).
TOTAL also monitors its stakeholders’ perception of its CSR (Corporate Social Responsibility) performance. The Group intends to organize its action through a lasting approach of dialogue and transparency vis-à-vis its stakeholders.
In terms of non-financial rating, TOTAL has been included continuously in the FTSE4Good index (London Stock Exchange) since 2001 and in the Dow Jones Sustainability World Index (DJSI World - New York Stock Exchange) since 2004. TOTAL has been listed on DJSI Europe every year since 2005, except in 2015. TOTAL is also in second place in the ranking produced in November 2018 by the CDP in its publication "Beyond the cycle - Which oil and gas companies are ready for the low-carbon transition?" In addition, 2018 saw the confirmation of the Gold status of the three TOTAL commercial entities listed on the EcoVadis platform vis-à-vis their customers.
In 2018, TOTAL was recognized as a "LEAD Company" by the Global Compact for its commitment to environmental and societal responsibility, amongst thirty other companies worldwide.
The Global Compact appointed TOTAL’s Chairman and Chief Executive Officer as an SDG Pioneer in 2017 in recognition of the commitments made by the Group for driving partnerships and investing in low carbon energies.
A Group committed to contributing to the United Nations’ Sustainable Development Goals
The United Nations, which adopted in 2015 the 17 Sustainable Development Goals (SDGs) originally aimed for States, have called upon corporations’ contribution to collectively find solutions to sustainable development challenges.
Energy being central to human and economic development, TOTAL has committed since 2016 to contributing to the SDGs. The Group has become involved in a sectoral approach through its active work within IPIECA to help produce a common framework setting out what contribution the oil and gas industry can make to the SDGs. Furthermore, TOTAL has integrated the United Nations’ recommendations (1) to better identify the scope of its contribution to the SDGs.
Through its activities, the Group is concerned by all of the SDGs. However, TOTAL has identified the following SDGs as those on which it can have a more direct influence.
People | SDG 8: by providing a solid social base for its employees and promoting decent working conditions in its supply chain | |
SDG 3: by ensuring the safety of its employees and stakeholders and the health of all people linked to its activities | ||
SDG 4: by supporting the evolution of existing jobs through training and employees’ skills enhancement | ||
SDG 5: by strengthening its commitment to diversity, particularly through policies to promote women within the Company | ||
Environment | SDG 12: by reducing its environmental footprint and increasing its involvement in the circular economy | |
SDG 14 and 15: by committing to protect biodiversity through its operations and corporate citizenship policy | ||
Climate | SDG 13: by incorporating the challenges of climate change into its strategy | |
SDG 7: by developing a portfolio of low carbon activities and an affordable energy offering to as many people as possible | ||
SDG 9: by investing in reliable, modern, responsible industrial sites, as well as in research and development | ||
Ethics & Societal | SDG 16: by contributing to the promotion of human rights, transparency and the fight against corruption | |
SDG 10: by contributing to the development and progress of the territories in which the Group operates | ||
Collective action | SDG 17: by encouraging a collective approach to find solutions to the global sustainable growth challenges |
The Group’s contributions to each SDG are illustrated below in the form of icons. They can also be found on the Group’s website sustainable-perfrmance.total.com.
5.2 Business model
The business model implemented by the Company and all of the entities included in the scope of consolidation in accordance with Article L. 233-16 of the French Commercial Code is set forth in the integrated report (refer to chapter 1) and in the business overview (points 2.1 to 2.4 of chapter 2).
(1) According to SDG Compass: Understanding the SDGs, Defining priorities, Setting goals, Integrating, Reporting and Communicating.
5.3 Social challenges
TOTAL’s ambition is to become the responsible energy major. Thus, in order to help provide specific solutions to the major challenges emerging over the coming decades, TOTAL relies on the know-how and commitment of over 104,000 employees around the world.
In this context, the Group has identified its main challenges to developing Human Resources: -attracting and developing talents by identifying and enhancing each person’s abilities, based on the principle of non-discrimination and equal opportunity; -maintaining employees’ long-term employability by facilitating skills acquisition in order to keep up with the development of job sectors and technologies; -ensuring a high level of commitment based on respect for each other, health and well-being at work. |
To address its challenges, TOTAL relies on the Group Human Resources division, which forms part of People & Social Responsibility division, whose President is a member of the Executive Committee. In particular, the Group Human Resources division has the role of defining the Human Resources strategy and policies of the Group in accordance with the business challenges and the One Total Company project.
In line with the multiple situations encountered in the field, it coordinates the promotion and roll-out of the new policies to support the various Human Resources departments in the Group’s business segments. The Group’s indicators were reviewed in 2018 with a view to improving the implementation of Human Resources policies and obtaining more detailed knowledge of specific local requirements, and are monitored in order to enhance the Group’s Human Resources activities.
5.3.1 Attracting and developing talents
Attracting and developing the talents that the Group needs is one of the key factors in the implementation of the Company project. TOTAL’s tools for dealing with these challenges include appropriate management of employees joining and leaving the Group, a responsible compensation policy for employees, and on increasing employee shareholding. |
5.3.1.1 Appropriate management of the Group’s workforce
Group employees
As of December 31, 2018, the Group had 140,460 employees belonging to 326 employing companies and subsidiaries located in 103 countries. At year-end 2018, the countries with the most employees were in descending order France, Poland, the United States, Mexico, Belgium, Germany and China.
The tables below present the breakdown of employees by business segment, region and age bracket, as well as the breakdown of managers or equivalent (≥ 300 Hay points (1)). The breakdown by gender and nationality is given in point 5.3.3.1 of this chapter.
Group registered headcount as of December 31, | 2018 | 2017 | 2016 |
Total number of employees | 104,460 | 98,277 | 102,168 |
Breakdown by business segment | |||
Exploration & Production segment | 13.2% | 14.3% | 14.6% |
Gas, Renewables & Power segment | 11.6% | 11.8% | 12.7% |
Refining & Chemicals segment | 48.7% | 49.8% | 50.4% |
Refining & Chemicals | 48.1% | 49.1% | 49.8% |
Trading & Shipping | 0.6% | 0.7% | 0.6% |
Marketing & Services segment | 24.0% | 21.6% | 20.4% |
Corporate | 2.5% | 2.5% | 1.9% |
Breakdown by region | |||
France metropolitan | 34.5% | 32.1% | 31.1% |
French overseas departments and territories | 0.4% | 0.4% | 0.4% |
Rest of Europe | 28.3% | 26.1% | 25.2% |
Africa | 9.4% | 10.1% | 9.9% |
North America | 6.7% | 7.1% | 7.1% |
Latin America | 11.8% | 12.5% | 11.8% |
Asia | 7.9% | 10.5% | 13.4% |
Middle East | 0.9% | 1.0% | 1.0% |
Oceania | 0.1% | 0.2% | 0.1% |
(1) The Hay method is a unique reference framework used to classify and assess jobs level.
Group registered headcount as of December 31, | 2018 | 2017 | 2016 |
Breakdown by age bracket | |||
< 25 years | 6.6% | 6.9% | 7.0% |
25 to 34 years | 26.0% | 26.4% | 27.8% |
35 to 44 years | 29.5% | 29.9% | 29.3% |
45 to 54 years | 24.1% | 23.5% | 22.7% |
> 55 years | 13.8% | 13.3% | 13.2% |
The increase in the number of employees between 2017 and 2018 is 6.3% (6,183 employees). This is mainly due to the scope variation (addition of the 3,268 employees of Argedis included in the consolidation scope and integration of nearly 4,000 employees following the acquisitions of notably Mærsk Oil and Direct Énergie) as well as an increase of hirings.
Breakdown of managers or equivalent as of December 31, | 2018 | 2017 | 2016 |
Total number of managers | 30,340 | 28,369 | 29,243 |
The table below presents the breakdown by business segment of the Group employees present (1).
Breakdown by business segment of the Group employees present as of December 31, | 2018 | 2017 | 2016 |
Exploration & Production segment | 12,801 | 13,023 | 13,975 |
Gas, Renewables & Power segment | 12,011 | 11,492 | 12,841 |
Refining & Chemicals segment | 49,883 | 47,985 | 50,442 |
Refining & Chemicals | 49,231 | 47,350 | 49,838 |
Trading & Shipping | 652 | 635 | 604 |
Marketing & Services segment | 24,630 | 20,932 | 20,402 |
Corporate | 2,512 | 2,433 | 1,951 |
TOTAL’s workforce movements
Since the end of 2014, the oil & gas industry has experienced an economic downturn related in particular to the significant fall in oil prices. In this difficult environment, TOTAL decided to protect its workforce while limiting recruitment. In light of a more favorable economic environment, which nonetheless remains subject to the oil price volatility, hiring resumed in 2018 and increased by 11.2% compared to 2017. This represents a total of 13,506 employees hired with permanent contract within the consolidated scope.
TOTAL implements a proactive policy of recruiting young people at the start of their career, regardless of their job sector or background. The Group gives them the opportunity to forge a variety of career paths through tailored, continuous training programs designed to improve long-term employability. This enables TOTAL to adapt to structural and job sector changes.
In addition, TOTAL hires more experienced profiles for more specific positions, while offering them long-term career prospects within the Group.
As of December 31, | 2018 | 2017 | 2016 |
Total number hired on permanent contracts | 13,506 | 12,141 | 10,940 |
Women | 39.5% | 38.6% | 36.9% |
Men | 60.5% | 61.4% | 63.1% |
French | 15.1% | 9.7% | 6.6% |
Other nationalities | 84.9% | 90.3% | 93.4% |
The regions that hired the most employees were Latin America (36.7%), mainly in Brazil and Mexico (taking into account the high turnover rate in these countries), Europe excluding France (21.8%), France (15.7%) and North America (10.7%).
In 2018, the consolidated Group companies hired 11,650 employees on fixed-term contracts, compared with 5,287 in 2017. This increase results from a scope variation due to the integration in 2018 in the consolidation scope of Argedis, which business has a significant seasonality (service stations) and which involves hiring on temporary contracts.
As of December 31, | 2018 | 2017 | 2016 |
Total number of departures (a) | 12,458 | 13,111 | 11,058 |
Deaths | 110 | 90 | 90 |
Resignations | 8,259 | 7,379 | 5,868 |
Negotiated departures, Dismissals | 3,923 | 5,492 | 4,958 |
Ruptures conventionnelles (specific negotiated departures in France) | 166 | 150 | 142 |
Total departures/total employees | 11.9% | 13.3% | 10.8% |
(a) Excluding retirements, transfers, early retirements, voluntary departures and expiration of fixed-term contracts.
5.3.1.2 A responsible compensation policy
The Group’s compensation policy applies to all companies in which TOTAL S.A. holds the majority of voting rights. The aim of this policy is to ensure external competitiveness and internal fairness, reinforce the link to individual performance, increase employee share ownership and implement the Group’s Corporate Social Responsibility commitments.
A large majority of employees benefit from laws that guarantee a minimum wage, and, whenever this is not the case, the Group’s policy ensures that compensation is above the minimum wage observed locally. Regular benchmarking is used to assess compensation based on the external market and the entity’s competitive environment. Each entity’s positioning relative to its reference market is assessed by the Human Resources Department of each business segment, which monitors evolutions in payroll, turnover and consistency with the market.
Fair treatment is ensured within the Group through the widespread implementation of a management job level evaluation (JL ≥ 10) (2) using the Hay method which associates a salary range with each job level. Performance of the Group’s employees (attainment of set targets, skills assessment, overall evaluation of job performance) is evaluated during an annual individual review and formalized in accordance with principles common to the entire Group.
(1) Employees present as defined in point 5.11.2 of this chapter.
(2) Job level of the position according to the Hay method. JL10 corresponds to junior manager (cadre débutant) ( ≥ 300 Hay points).
The compensation structure of the Group’s employees is based on the following components, depending on the country:
-a base salary, which is subject to individual and/or general salary-raise campaigns each year. The merit-based salary-raise campaigns are intended to compensate employees’ individual performance according to the targets set during the annual individual review, including at least one HSE (Health, Safety, Environment) target; and
-an individual variable compensation starting at a certain level of responsibility, which is intended to compensate individual performance (quantitative and qualitative attainment of previously set targets) and the employee’s contribution to collective performance evaluated among others according to HSE targets set for each business segment, which represent up to 10% of the variable portion. In 2018, 86.7% of the Group’s entities (WHRS scope) included HSE criteria in the variable compensation.
Complementary collective variable compensation programs are implemented in some countries, such as France, via incentives and profit-sharing that also incorporates HSE criteria. According to the agreement signed for 2018-2020 applicable to the oil and petrochemicals (1) (scope of about 17,700 employees in 2018) sector in France, the amount available for employee incentive is determined based on:
-financial parameters (the Group’s return on equity as an absolute value and compared to four peers (2)),
-the attainment of safety targets (injury rate and accidental deaths in the oil and petrochemicals sector in France),
-criteria assessed at the level of the entity to which the employees belong, relating to employee commitment to priority areas identified by the Total Foundation program, which is driven mainly by the Fondation d’entreprise Total in France,
-criteria relating to the performance of the entity in question (production, sales volumes, gross margins, operating costs, etc.).
The Group also offers pension and employee benefit programs (health and death) meeting the needs of the subsidiaries and the Group’s standards. These programs, which supplement those that may be provided for by local regulations, allow each employee to:
-benefit, in case of illness, from coverage that is at least equal to the median amount for the national industrial market;
-save or accumulate income substitution benefits for retirement;
-arrange for the protection of family members in case of the employee’s death via insurance that provides for the payment of a benefit recommended to equal two years’ gross salary.
These programs are reviewed on a regular basis and adjusted when necessary.
5.3.1.3 A proactive policy to increase employee shareholding and employee savings
Employee shareholding, one of the pillars of the Group’s Human Resources policy, is extended via three main mechanisms: the grant of performance shares, share capital increases reserved for employees, and employee savings. In this way, TOTAL wishes to encourage employee shareholding, strengthen their sense of belonging to the Group and give them a stake in the Group’s performance by allowing them to benefit from their involvement.
Each year since 2005, TOTAL has granted performance shares to many of its employees (approximately 10,000 each year since 2009). The definitive granting of these shares depends on the fulfillment of performance conditions assessed at the end of a vesting period extended to three years in 2013 (refer to point 4.3.4 of chapter 4). The 2018 plan approved by the Board of Directors of TOTAL S.A. in March 2018 granted a 7% higher volume of performance shares compared with the 2017 plan. Over 40% of plan beneficiaries had not received performance shares the previous year. More than 10,000 employees were concerned by this plan, over 97% of whom are non-senior executives.
TOTAL also invites employees of companies more than 50% owned in terms of voting rights, and subscribing to the Shareholder Group Savings Plan (PEG-A) created in 1999 for this purpose, to subscribe to share capital increases reserved for employees. Previously offered every two years, share capital increases reserved for employees now take place annually. As a result, more than 60% of the Group’s employees are shareholders. Depending on the offerings chosen and the employees’ location, these operations are completed either through Company Savings Plans (3) (FCPE) or by subscribing directly for shares or for American Depositary Receipts (ADRs) in the United States.
Pursuant to the authorization given by the Annual Shareholders’ Meeting of June 1, 2018, the Board of Directors of TOTAL S.A. approved, at its meeting on September 19, 2018, the principle of a share capital increase reserved for employees to be completed in 2019. This operation will concern approximately 100 countries. As in 2018, two offerings are proposed: a traditional scheme with a 20% discount and a leveraged scheme in all countries where permitted by law. Employees will receive a matching contribution of five free shares for the first five shares subscribed. The shares subscribed will give holders current dividend rights. The subscription period will close in mid-May 2019.
The previous operation took place in 2018. Over 40,000 employees in 94 countries took part in this share capital increase, which resulted in the subscription of 9,174,817 shares at a price of €37.20 per share.
Employee savings are also developed via the TOTAL Group Savings Plan (PEGT) and the Complementary Company Savings Plan (PEC), both open to employees of the Group’s French companies that have subscribed to the plans under the agreements signed in 2002 and 2004 and their amendments. These plans allow investments in a wide range of mutual funds, including the Total Actionnariat France fund that is invested in TOTAL shares.
A Collective Retirement Savings Plan (PERCO) is open to employees of the Group’s French companies covered by the 2004 Group agreement on provisions for retirement savings. Other saving plans and PERCO are open in some French companies covered by specific agreements. Employees can make discretionary contributions in the framework of these various plans, which the Group’s companies may supplement under certain conditions through a matching contribution. The Group’s companies in France made gross matching contributions that totaled €70.8 million in 2018.
(1) i.e., the following companies in France: TOTAL S.A., Elf Exploration Production, Total Exploration Production France, Total Marketing Services, Total Marketing France, Total Additifs et Carburants Spéciaux, Total Lubrifiants, Total Fluides, Total Raffinage-Chimie, Total Petrochemicals France, Total Raffinage France, Total Global Information Technology Services, Total Global Financial Services, Total Global Procurement, Total Global Human Resources Services, Total Learning Solutions, Total Facilities Management Services and Total Consulting.
(2) ExxonMobil, Royal Dutch Shell, BP and Chevron.
(3) Total Actionnariat France, Total France Capital+, Total Actionnariat International Capitalisation, Total International Capital.
5.3.2 Maintaining employees’ long-term employability
Maintaining employees’ long-term employability is another key factor in the successful implementation of the Company project. In order to manage this risk, the Group operates a tailored training policy focused on two areas: facilitating skills acquisition in order to keep up with the development of job sectors and technologies, and contributing to maintaining employees’ long-term employability. |
The technical and commercial know-how of employees and their ability to manage large projects underpin the Group’s operational excellence and are essential for the Group’s development. TOTAL therefore offers tailored, continuous training programs aimed at enhancing employees’ skills and employability. These training courses form part of an approach based on improving skills and supporting careers, including for employees moving between business segments and/or geographical region.
The Group’s policy in the field of training hinges on five major areas:
-sharing TOTAL’s corporate values, particularly with respect to HSE, ethics, leadership, innovation and digital technology;
-supporting the development of existing activities and creating new ones in order to achieve the Group’s ambitions;
-increasing key skills in all business areas to maintain a high level of operating performance;
-promoting employees’ integration and career development through Group induction and training on management and personal development; and
-supporting the policy of mobility and diversity within the Group through language and intercultural training.
The Group’s training efforts remained strong in 2018, with 75% of employees having attended at least one site training during the year. In 2018, there were 234,174 days of on site training, for a total budget around €157 million.
For remote training, there were 30,128 people trained.
Average number of training days/year per employee (a) (excluding "Companion" apprenticeships) | 2018 (b) | WHRS 2017 | WHRS 2016 |
On site training | 2.8 | 3.0 | 3.2 |
Remote training | 0.5 | 0.5 | 0.4 |
Group average | 3.3 | 3.5 | 3.6 |
Average number of days/year of training per employee (a) (on site and remote training, excluding "Companion" apprenticeships) | |||
By segment | |||
Exploration & Production segment | 5.6 | 6.5 | 7.1 |
Gas, Renewables & Power segment | 1.9 | 2.8 | 2.8 |
Refining & Chemicals segment | 2.6 | 2.7 | 2.9 |
Refining & Chemicals | 2.6 | 2.7 | 2.9 |
Trading & Shipping | 1.7 | 2.3 | 1.9 |
Marketing & Services segment | 3.4 | 3.3 | 2.7 |
Corporate | 5.8 | 3.4 | 3.7 |
By region | |||
Africa | 4.8 | 5.3 | 5.8 |
North America | 4.0 | 4.1 | 3.9 |
Latin America | 3.5 | 2.8 | 3.0 |
Asia Pacific | 4.2 | 4.4 | 4.3 |
Europe | 2.7 | 3.1 | 3.0 |
Middle East | 5.7 | 6.4 | 5.4 |
Oceania | 3.6 | 0.5 | 0.5 |
French overseas departments and territories | 0.8 | 2.7 | 1.8 |
Breakdown by type of training given (on site training, excluding "Companion" apprenticeships and remote training) | |||
Technical | 35% | 36% | 38% |
Health, Safety, Environment, Quality (HSEQ) | 29% | 28% | 23% |
Language | 7% | 7% | 8% |
Other (management, personal development, intercultural, etc.) | 29% | 28% | 31% |
(a) This number is calculated using the number of training hours, where 7.6 hours equal one day.
(b) As an exception to the reporting principles described in section 5.11 of this chapter, the 2018 training reporting scope was established on the basis of a constant perimeter compared to 2017 and covers the results of 127 companies representing a total workforce of 83,514 employees. The column on 2018 training results also includes the specific situation of 2 companies that did not report their data in time in the training report and that were estimated based on the 2017 achievements.
In addition, TOTAL has a technical training center, Oléum, which combines technical expertise and life-size technical learning platforms. The center operates on two sites in France (in Dunkerque and La Mède), offering trainees a life-size Seveso environment and providing technical training in operations, maintenance, inspection, safety and more. Oléum welcomes interns from all sectors of activity of the Group worldwide, as well as partners and external customers. In 2018, a platform was introduced enabling the delivery of the certified Basic Offshore Safety Induction and Emergency Training course. This certification is mandatory for all personnel working on offshore platforms.
5.3.3 Ensuring a high level of commitment based on respect for each other, health and well-being at work
To ensure a high level of commitment from its employees, the Group promotes Human Resources development based on respect for each other, health and well-being at work. TOTAL’s approach is based on a number of levers. In addition to the organization of work and social dialogue, TOTAL aims to promote equal opportunities and diversity. It intends to ban all discrimination related to origin, gender, sexual orientation or identity, disability, age or affiliation with a political, labor or religious organization. |
5.3.3.1 Promoting equal treatment of employees and banning discrimination
Present in more than 130 countries, diversity is an integral part of the Group’s DNA. Openness to the world, its cultures and differences is a significant feature of TOTAL and is a key success factor. The Group has long been involved in promoting equal opportunities and diversity, and strives to promote an environment conducive to the expression and development of all employees’ potential.
The diversity of its employees and management is crucial to the Group’s competitiveness, innovative capacity and attractiveness. TOTAL works to develop its employees’ skills and careers while prohibiting any discrimination related to origin, gender, sexual orientation or identity, disability, age or affiliation with a political, labor or religious organization.
This policy is supported at the highest level and promoted by the Diversity Council, which is chaired by a member of the Group’s Executive Committee.
Each entity is responsible for creating a suitable work environment so that they offer all employees the same career opportunities and can benefit from all of the skills and diverse approaches they bring.
Promoting equal opportunity and diversity is part of a policy and has long been monitored. TOTAL was one of the pioneering Groups with regard to diversity. It has prioritized two key components of diversity: gender diversity and internationalization, aiming to offer women and men of all nationalities the same career opportunities up to the highest levels of management. TOTAL has set itself targets to this end.
In addition to the components of gender diversity and internationalization, disability forms an integral part of the Group’s diversity policy. Previously mainly deployed and coordinated in France, the disability policy was rolled out internationally in October 2018 through the signing of the International Labour Organization (ILO) Global Business and Disability Network Charter. In September 2018, TOTAL renewed its commitment to diversity, equal opportunities and economic and social performance by signing the new Diversity Charter introduced by the "Les entreprises pour la cité" network in France. By signing this new charter, TOTAL has reaffirmed its aim to be a responsible employer. The Group was one of the 33 founding signatories of the charter when it was launched in 2004. In November 2018, within the European Round Table of Industrialists (ERT) framework, TOTAL signed a pledge through which the signatories hope to strengthen the European movement to promote Diversity and Inclusion.
Equal treatment for women and men
TOTAL is committed to respecting the principle of equal treatment for women and men and promotes this fundamental principle and ensures that it is correctly applied. Equal treatment for women and men is promoted in the Group through a global policy of gender diversity, targets set by General Management, Human Resources processes that take the issue of gender into consideration, agreements in favor of a better work-life balance (such as the agreement on remote working in France) and awareness-raising and training actions.
TOTAL’s commitment spans from recruitment to the end of a career. It guarantees equal treatment for women and for men in the process for identifying high-potential employees and appointing executives. In terms of compensation, specific measures have been set in place since 2010 to prevent and compensate for unjustified salary gaps.
The Group’s target for 2020 is:
-women represent 25% of senior executives (they were approximately 5% in 2004 and are 21.6% in 2018);
-women represent more than 20% of Management Committees members (head office and subsidiaries) (they are 21.8% in 2018).
In order to increase the representation of women in Management Committees, at the end of 2018 the Executive Committee set a new target of 20% women members of Management Committees of branches and large operational divisions.
In terms of TOTAL S.A., TOTAL’s commitment took shape in 2016 with the arrival of the President of the People & Social Responsibility division to the Group’s Executive Committee (7 people). With regard to diversity in the 10% of the highest management of the Company positions, the proportion of women equals 15%. At Group level, which is the most relevant perimeter considering TOTAL’s activities, this proportion equals 21% (1).
(1) Proportion calculated on the basis of 95,327 employees.
TOTAL aims to hire women in proportions that reflect the percentages of qualifications awarded by the higher education establishments in its business segments. The Group strives to promote the same proportion of women and men with equivalent qualifications and experience within the overall population eligible for a specific promotion.
To encourage young women to choose to study technical subjects, TOTAL has been a partner of the "Elles bougent" organization in France since 2011, and served as honorary Chairman in 2015. Some 130 female engineers regularly inform high-school girls about careers in science. Throughout the Group, female engineers and technicians from all cultures are encouraged to give talks to high-school girls and female students to illustrate women’s contribution to the fields of science and technology.
Diversity is also promoted through action to change mentalities, and awareness, training and communication events are held regularly. Internal training courses such as "Managing your career as a woman" and "Managing diversity" are also available.
Through its mentoring activities and development workshops, the TWICE (Total Women’s Initiative for Communication and Exchange) network also helps to develop the gender diversity policy. It aims to promote the progression of women within the Group, particularly to management roles, and help women further their careers. Created in 2006, it is currently in place in France and abroad (35 local networks) and has over 3,200 members. Since 2010, nearly 610 women have benefitted from the network’s mentoring program, in France and internationally, and which helps them to better anticipate the key phases of their careers.
The signing of agreements, international charters and commitments relating to diversity is emblematic of the Group’s conviction at the very highest level of decision-making.
Thus, in 2010, TOTAL signed the "Women’s Empowerment Principles - Equality Means Business" set out in the United Nations Global Compact, and its commitment to equal opportunities and the equal treatment of women and men is regularly embodied in agreements that address the issue of diversity, such as the global agreement signed in 2015 with IndustriALL, or the Global Deal to which TOTAL has adhered more recently in 2017.
In 2016, TOTAL, along with 20 other oil and gas companies, got involved at the World Economic Forum by signing "Closing the Gender Gap - a Call to Action". This joint declaration is based on seven action principles (leadership; expectations and goal setting; Science, Technology, Engineering and Mathematics (STEM) program; clear responsibilities; recruitment, retention and promotion policies; inclusive corporate culture; and work environment and work-life balance) and two decisive drivers: more diverse recruitment and greater openness of technical and management roles to women.
In the same vein, the Chairman and Chief Executive Officer chaired the 15th edition of the Entretiens de Royaumont discussion forum at the end of 2018, on the subject of "Being a woman".
% of women | 2018 | 2017 | 2016 |
Permanent contract recruitment | 39.5% | 38.6% | 36.9% |
Management (JL ≥ 10) (a) recruitment | 31.9% | 31.9% | 29.7% |
Employees | 35.1% | 33.3% | 32.4% |
Managers (JL ≥ 10) (a) | 27.7% | 26.3% | 25.5% |
Senior executives | 21.6% | 21.1% | 19.9% |
(a) Job Level of the position according to the Hay method. JL10 corresponds to junior manager (cadre débutant) (≥ 300 Hay points).
% of men | 2018 | 2017 | 2016 |
Employees | 64.9% | 66.7% | 67.6% |
Permanent contract recruitment | 60.5% | 61.4% | 63.1% |
Internationalization of management
With employees representing over 150 nationalities, TOTAL enjoys broad cultural diversity and believes that it is important to promote this at all levels of its activities. In 2018, 84.9% of employees hired by the Group and 58.9% of managers hired were non-French nationals. In 2018, the integration in the consolidation scope of companies mainly present in France (such as Argedis, Direct Énergie and GreenFlex for instance) is partly responsible for the more representation of French people in hires and Group employees.
The Group has set a target of having local managers representing 50% to 75% of the subsidiaries’ Management Committee members by 2020 (they represented 52% in 2018 compared to 54% in 2017) and non-French nationals representing 40% of senior executives (having represented approximately 19% in 2004 and are 32.1% in 2018).
Several measures have been put in place to internationalize the management population, including career paths to internationalize careers, increasing the number of foreign postings for employees of all nationalities (approximately 4,000 employees representing more than 100 nationalities are posted in more than 100 countries), and integration and personal development training organized by large regional hubs (for example, Houston, Johannesburg and Singapore).
% of employees of non-French nationality | 2018 | 2017 | 2016 |
Permanent contract recruitment | 84.9% | 90.3% | 93.4% |
Management (JL ≥ 10) recruitment (a) | 58.9% | 68.0% | 75.3% |
Employees | 66.2% | 68.2% | 69.0% |
Managers (JL ≥ 10) (a) | 56.6% | 58.1% | 58.8% |
Senior executives | 32.1% | 28.9% | 28.2% |
% of employees of French nationality | 2018 | 2017 | 2016 |
Employees | 33.8% | 31.8% | 31.0% |
Permanent contract recruitment | 15.1% | 9.7% | 6.6% |
(a) Job Level of the position according to the Hay method. JL10 corresponds to junior manager (cadre débutant) (≥ 300 Hay points).
The inclusion of the teams from Mærsk Oil, the acquisition of which was finalized in March 2018, explains the increase in international employees on local Management Committees and senior executives of non-French nationality.
Measures promoting the employment and integration of people with disabilities
The integration and job retention of people with disabilities are covered by specific measures incorporated into the Group’s diversity policy.
In France, for over 20 years, TOTAL has implemented its policy to promote the employment of people with disabilities by signing agreements with employee representatives. Three framework agreements signed for three years (2016-2018) with the French representative unions and approved by the government (DIRECCTE 92) set out the commitments of the Group’s French companies with regard to occupational integration of people with disabilities. The average Group employment rate of people with disabilities in France (direct and indirect employment) was 5.19% in 2017 (1) (compared to 5.16% in 2016 and 4.99% in 2015). These agreements will be renegotiated in 2019.
(1) The percentage for 2018 is not available at the date of publication of this Registration Document.
The agreements in force are based on three major priorities:
-professional support throughout the employee’s career;
-an integration and professional training plan;
-the development of agreements and partnerships with the disabled and protected employment sectors (ESAT and EA).
TOTAL promotes recruitment of people with disabilities as well as indirect employment by purchasing from the protected employment sector as part of its responsible procurement. At the same time, the Group takes various types of action:
-internally: integration, professional training, support and job retention, communication, awareness actions and sessions organized for managers and all the teams, as well as for Human Resources managers;
-externally: information and advertising aimed at students, cooperation with recruitment agencies, attendance at specialized forums, partnerships with schools and universities.
TOTAL’s Disability Program is a structure within the Diversity department of the Group’s Human Resources division. It is responsible for leading the disability policy and relies on a network of expert contacts within the establishments.
Internationally, the Group’s actions to support employees with disabilities took on a new dimension at the end of 2018, with the ambition of going beyond the legal requirements in all of the countries where it operates. This aim was embodied by the signing of the International Labour Organization (ILO) Global Business and Disability Network Charter in October 2018. To date, 40 subsidiaries have voluntarily signed up to the scheme and have set goals for the next two years on the basis of the five principles identified as priorities by the Group: respect and promotion of rights, policy and practice of non-discrimination, accessibility, job retention and confidentiality. The first stage of implementation took place in December 2018, on International Day of Persons with Disabilities, giving the participating subsidiaries the opportunity to share internal best practices and learn from the ILO network and other companies’ experiences.
In addition, TOTAL supports organizations such as the Association Total Solidarité Handicap (ATSH), which was formed in 1975 by employees with children with disabilities. ATSH provides discreet, confidential moral and financial support, helps with paperwork and practical assistance to current and retired employees of the Group and their dependents in France who are affected by disability. It currently has over 350 members, a third of whom received help from the association in 2018.
Commitment to promote the professional integration of young people
TOTAL is committed to promoting the professional integration of young people, thus increasing their employability. It believes that for maximum impact, this issue must be tackled as early as possible in the education system, and has therefore put in place targeted actions tailored to the specific context of the countries where they are implemented.
In France, TOTAL’s target is to have 50% of secondary education internships offered to disadvantaged youths. Since 2018, this has been implemented in the Paris region.
TOTAL recruited nearly 5,000 interns in France over the 2016-2018 period, corresponding to 5% of the workforce in France. As of 2019, the Group is committed to continuing with the scheme in the long term. In addition, indicators reflecting TOTAL’s priority commitments in relation to gender diversity, disability and the professional integration of disadvantaged youths will be set up to improve monitoring.
In Africa, the Young Graduate Program run by the Marketing & Services segment offers graduates below the age of 25 an 18-month work placement. The program is split into two phases consisting of work experience at a subsidiary in the young person’s home country followed by an assignment in another country. Since the program was launched in 2014, over 350 young people have taken this opportunity to improve their employability. The Young Graduate Program aims to reach the milestone of 500 graduates registered by 2020.
Volontariat International en Entreprise (VIE) is an international internship program that offers young graduates aged between 18 and 28, from France or other European Economic Area member states, professional internship within an affiliate and abroad for a maximum of 24 months. The program has been in operation within the Group since 2002, and over 1,700 young people have benefited from it to date.
Other anti-discrimination measures
Large-scale initiatives aimed at raising employees’ awareness of diversity are organized on a regular basis.
In October 2018, the Diversity Council, chaired by a member of the Executive Committee, met in Paris. A year-end 2017 review was performed and areas for action were identified to ensure that the goals set for 2020 are achieved, particularly in terms of the appointment, recruitment, feminization and internationalization of the Group’s senior executives.
The Group signed the LGBT (lesbian, gay, bisexual and transgender) Charter in 2014. Prepared by the "L’Autre Cercle" association, it establishes a framework for combating discrimination related to sexual orientation or identity in the workplace in France.
TOTAL has written a practical guide to religion in the Group to offer concrete answers to employees’ questions about religion in the workplace and to promote tolerance of everyone’s beliefs, while respecting differences at the same time. The guide, which was posted on the Group’s intranet site in March 2017, offers the keys to understanding different beliefs, so that everyone can better comprehend them in their everyday activities.
5.3.3.2 Measures to meet the specific requirements of the organization of work
The Group’s activities are varied and, depending on the segments, require the implementation of specific regimes for the organization of work, such as the "shift" regime (1) and the "rotational" regime (2). Most shift workers are employed in the Refining & Chemicals, Marketing & Services and Gas, Renewables & Power segments, while the rotational regime mainly concerns the Exploration & Production segment.
The average work week is determined in accordance with applicable local law and limits set by International Labour Organization (ILO) conventions. Excluding specific regimes, it is less than 40 hours in most subsidiaries located in Europe, Japan and Qatar. It is 40 hours in most subsidiaries located in Asian, African and North American countries. It is above 40 hours, without exceeding 48 hours, in subsidiaries located in Latin America (mainly Argentina, Brazil, Mexico), a few countries in Asia (Cambodia, India, Philippines) and Africa (mainly South Africa, Equatorial Guinea and Morocco).
The challenges involved in the organization of work are many and varied depending on the regions of the world where the Group operates, and the applicable local law. The Group entities put in place measures to meet the specific requirements of the organization of work and promote, where possible, a good work-life balance. For example, remote working has been in place in France since 2012.
(1) For employees providing a continual activity with relays between teams to maintain production (two or three 8-hour shifts), for example in plants or refineries.
(2) For employees working at a location (town or worksite) far from their place of residence with alternating periods of work and rest.
As of December 31, 2018, the number of remote workers in France (WHRS scope) was 1,371, 34.5% of whom were men (representing 473 men), compared to 952 in 2017 and 746 in 2016.
WHRS 2018 | WHRS 2017 | WHRS 2016 | |
% of companies offering the option of remote working | 25.8% | 24.1% | 18.5% |
% of employees involved in remote working of those given the option | 5.0% | 4.1% | 3.4% |
In addition, as part of a global approach to preventing and managing employee absenteeism, the sickness absenteeism rate is one of the indicators monitored under the WHRS:
WHRS 2018 | WHRS 2017 | WHRS 2016 | |
Sickness absenteeism rate | 3.0% | 2.4% | 2.4% |
The sickness absenteeism rate evolves notably due to the integration of new companies in the consolidated scope.
5.3.3.3 Promoting social dialogue
Social dialogue is one of the pillars of the Company project. It includes all types of negotiations, consultations or exchanges of information between the Group entities, the employees and their representatives about economic and social issues and related to the life of the company. The subjects covered by dialogue with employees vary from company to company, but some are shared throughout, such as health and safety, work time, compensation, training and equal opportunity.
The Group strives to maintain this dialogue at both a local level and at the head offices or centrally, as well as through its membership of bodies and the signing of agreements.
Among the numerous stakeholders with which TOTAL maintains regular dialogue, the Group’s employees and their representatives have a privileged position and role, particularly in discussions with the management teams. In countries where employee representation is not required by law (for example in Myanmar and Brunei), the Group companies strive to set up such representation. There are therefore employee representatives in the majority of Group companies, most of whom are elected.
At European level, the European Committee enables the provision of information and discussions about the Group’s strategy and social, economic and financial situation, as well as on matters relating to sustainable development, environmental and societal responsibility, and safety. It examines any significant proposed organizational change concerning at least two companies in two European countries, to express its opinion, in addition to the procedures initiated before the national representative bodies. A new agreement was reached in July 2017 that contains some innovative measures allowing for better dialogue with the members of the European Committee (field safety visits and learning expeditions to discuss the Group’s strategy directly on site).
Globally, social dialogue is embodied through the signing of various agreements. In 2015, TOTAL signed an agreement with the worldwide trade union federation, IndustriALL Global Union, which represents 50 million employees in 140 countries. Under this agreement, the Group made a commitment to maintain minimum Corporate Social Responsibility (CSR) standards and guarantees worldwide for subsidiaries in which it has more than a 50% stake (occupational health and safety, human rights in the workplace, enhancement of the dialogue with employees, life insurance, professional equality, societal responsibility and assistance with organizational changes). In addition, the Group ensures that the principles of the agreement on health, safety and human rights are disclosed to and promoted among its service providers and suppliers. The implementation of this agreement is monitored annually with representatives who are members of trade unions affiliated with the IndustriALL Global Union and appointed by this federation. Two follow-up meetings were therefore held in July 2017 and 2018 to assess the implementation of the agreement and identify areas for improvement and actions to be taken. The aim is to maintain the partnership and renegotiate the agreement for 2019 and beyond.
In December 2017, TOTAL also joined the worldwide Global Deal initiative, a multi-stakeholder partnership that aims to incite governments, companies, unions and other organizations to make concrete commitments to favoring dialogue with employees. The Global Deal promotes the idea that effective social dialogue can contribute to decent work and quality jobs and, as a consequence, to more equality and inclusive growth from which workers, companies and civil society benefit.
As a company that listens to the people who work for it, TOTAL continues to build on its Company project, One Total, through a participative approach that engages employees. This approach was illustrated in 2016 by the involvement of employees in a reflection of the Group’s ambitions and values. This was followed in 2018 by the One Total, Be Simple collaborative campaign focusing on employees’ day-to-day lives, with simplification having been identified as the key area in which progress must be made in order to achieve the Group’s ambition. Employees were able to express their opinions on the theme of simplification, share ideas for solutions and discuss the issues with each other through a dedicated collaborative platform.
In addition, every two year, TOTAL carries out an internal survey (Total Survey) among its employees to gather their views and expectations with regard to their work situation and perception of the Company, locally and as a Group. The results of the last survey conducted in 2017 among 70,000 employees in 124 countries demonstrated that employees have a commitment rate of 78% and that 85% of them are proud to work for TOTAL.
WHRS 2018 | WHRS 2017 | WHRS 2016 | |
% of companies with employee representation | 80.5% | 78.9% | 78.5% |
% of employees covered by collective agreements | 71.5% | 73.1% | 68.9% |
Number of active agreements signed with employee representatives worldwide | 316 | 256 | 330 |
of which in France (a) | 190 | 160 | 245 |
(a) Some agreements cover several companies at once (for example, agreements in the Social and Economic Units -Unités Économiques et Sociales- or agreements in groups of companies).
The number of employees covered by collective agreements has increased in 2018: they were 62,628 in 2017 and 66,822 in 2018 within the WHRS scope.
5.4 Personal health and safety challenges
TOTAL places safety at the heart of its ambition to be a responsible company. The measures and indicators used to manage the Group’s activities are based on this fundamental value, in accordance with the strictest standards, particularly relating to health.
Given the specific nature of its activities, the Group’s operations give rise to occupational health and safety risks for its employees and the personnel of external contractors. In addition, some of the products marketed by TOTAL pose potential risks to the health and safety of consumers. The Group therefore aims to meet its obligations with regards to information and prevention in order to minimize the risks throughout the life cycle of its products.
The Group has therefore identified its main personal health and safety challenges: -preventing occupational accidents; -preventing occupational health risks through improved assessment; -minimizing the risks throughout the life cycle of products to prevent consumer health and safety risks. |
To address its challenges, TOTAL relies on the HSE division, which forms part of the People & Social Responsibility division, whose President is a member of the Executive Committee.
In line with the multiple situations encountered in the field, the HSE division coordinates the promotion and implementation of new policies to support the various HSE departments of the Group’s entities and subsidiaries to enable them to prevent or mitigate risks. Indicators are monitored so that the Group’s actions in relation to personal health and safety can be continuously adapted.
TOTAL conducts its operations on the basis of its Safety Health Environment Quality Charter (available at total.com). It forms the common foundation for the Group’s management frameworks, and sets out the basic principles applicable to safety, security, health, the environment, quality and societal commitment. This Charter is implemented at several levels within the Group through its management systems. Group directives and rules define the minimum requirements expected in these areas. General specifications, guides and manuals are the documents used to implement these directives and rules. The Group’s framework is available to all employees.
Since 2013, the Group’s business segments have increased their efforts regarding the frameworks of the HSE management systems in order to provide greater overall Group-wide consistency, while at the same time respecting the businesses’ specific characteristics. The One MAESTRO (Management and Expectations Standards Toward Robust Operations) reference framework, which focuses on HSE issues and is common to all of the business segments, has been gradually rolled out since 2018. This reference framework stipulates that HSE audits must be carried out every three to five years on all assets, activities and sites operated by the Group’s entities and subsidiaries (1), which must also perform a self-assessment at least every two years. The Group’s HSE audit protocol is based on this framework and contains all of the requirements of ISO 14001:2015 and ISO 45001:2018. The audit protocol is applied in full during self-assessments and according to a risk-based approach during audits.
The Group’s entities and subsidiaries holding an interest in non-operated assets endeavor to promote the Group HSE requirements and best practices and to adopt similar requirements by the operator. This promotion process can be exercised during board meetings, technical assistance contracts or through audits when they are part of the shareholdes’ agreements.
5.4.1 Preventing occupational accidents
The Group’s personal safety policy covers three main areas: preventing occupational accidents, preventing transport accidents, and preventing accidents linked to technological risks, such as fires and explosions. It relates to all employees of Group subsidiaries, employees of external contractors working on these entities’ sites as well as employees of transport companies under long-term contracts. The safety results are monitored with the same vigilance for all.
Indicators defined according to an internal procedure measure the main results. In addition to its aim of zero fatalities in the exercise of its activities, the Group has set the target of continuously reducing the TRIR (2) and, for 2018, of keeping it below 0.9 for all personnel (Group and External Contractors).
(1) Excluding Hutchinson and SunPower, which have their own reference frameworks. Hutchinson also has its own audit protocol.
(2) TRIR: Total Recordable Injury Rate.
Safety indicators | 2018 | 2017 | 2016 |
TRIR (a): number of recorded injuries per million hours worked - All Personnel | 0.91 | 0.88 | 0.91 |
Group company employees | 0.82 | 0.89 | 0.83 |
External contractors employees (b) | 1.01 | 0.88 | 0.99 |
LTIR (c): number of lost time injuries per million hours worked - All Personnel | 0.59 | 0.58 | 0.51 |
SIR (d): average number of days lost per lost time injury | 26 | 28 (e) | 30 (e) |
Number of occupational fatalities | 4 | 1 | 1 |
(a) TRIR: Total Recordable Injury Rate.
(b) As defined in point 5.11.4 of this chapter.
(c) LTIR: Lost Time Injury Rate.
(d) SIR: Severity Injury Rate.
(e) Excluding Saft Groupe.
The Group’s safety efforts over more than 10 years have resulted in a significant improvement in the TRIR and LTIR. Performance has stabilized since 2016, mainly due to acquisitions and disposals of assets or subsidiaries. The gradual implementation of the One MAESTRO framework aims to strengthen the Group’s safety culture and create a new drive to improve safety results. Despite the measures put in place, in 2018 three accidents resulted in the death of four employees working for external contractors: one during road transport in Ethiopia, one during a handling operation in the Republic of the Congo, and two during an operation to recommission a fuel storage tank in Egypt.
Generally, an analysis is launched in response to any type of accident whatsoever. The method and scope of the analysis depend on the actual or potential severity of the event. Consequently, a near miss with a high severity potential is treated as a severe accident, and its analysis is considered an essential factor of progress. Depending on its relevance to the other Group entities, it triggers a safety alert and the distribution of a feedback form, depending on the circumstances.
Regarding occupational safety, since 2010, the basic rules to be scrupulously followed by all personnel, employees and contractors alike, in all of the Group’s businesses worldwide, are described in the document "Safety at Work: TOTAL’s Twelve Golden Rules", which has been widely circulated within the Group.
The aim of the Golden Rules is to set out simple, easy-to-remember rules that cover a large number of occupational accidents. In addition, further rules can be found in the One MAESTRO HSE framework, the business segment frameworks and the subsidiary frameworks.
According to the Group’s internal statistics, in more than 44% of severe incidents or near misses with high severity potential in the workplace, at least one of the Golden Rules had not been followed. The proper application of these Golden Rules, and more generally of all occupational safety procedures, is verified through site visits and internal audits. The Stop Card system, which was set up in 2015, also enables any employee of the Group or an external contractor to intervene if any of the Golden Rules is not being followed. In addition, in 2016, the HSE department created a unit bringing together the reference persons on high-risk operations (work at height, lifting, high-pressure cleaning, excavations, etc.) in order to consolidate in-house knowledge and relations with contractors.
The reporting of anomalies and near misses (approximately 600,000 per year) is strongly encouraged on a daily basis and is permanently monitored. The ability of each employee to identify anomalies or dangerous situations is one of the measures of the employees’ involvement and vigilance in accident prevention and reflects the safety culture within the Group. In 2016, the Group HSE Department also created a unit aimed at providing support for sites to improve their safety culture upon their request.
Regarding road transport, for many years the Group has been monitoring the number of severe road accidents involving its employees and those of external contractors. The actions taken have reduced the number of severe accidents between 2016 and 2018 by 33%. Work began in new areas in 2018, particularly relating to the use of new technologies in accident prevention (defining a new standard for the light vehicles used, driver fatigue detection) and the assessment of the driver support and assistance systems offered by manufacturers (automatic emergency braking, lane keeping assist, lane change assist, etc.).
Number of severe road accidents (a) | 2018 | 2017 | 2016 |
Light vehicles and public transport (b) | 7 | 11 | 9 |
Heavy goods vehicles (b) | 23 | 26 | 36 |
(a) Overturned vehicle or other accident resulting in the injury of a crew member (declared incident).
(b) Vehicles on long-term contract with the Group (> 6 months).
With regard to air transport, a carrier selection process exists to limit the risks relating to travel by Group and external contractor’s employees, if their journey is organized by the Group. This process is based on data provided by recognized international bodies: the International Civil Aviation Organization (ICAO), the IATA Operational Safety Audit (IOSA), the International Association of Oil and Gas Producers (IOGP), and civil aviation authority recommendations. Airlines that do not have a rating from an international body are assessed by an independent body commissioned by the Group.
With regard to technological risks (also known as "major" industrial risks), the risk analysis and prevention actions are described in point 5.5.2 of this chapter.
Whatever the nature of the accident, prevention actions rely on all employees abiding by the Group’s safety policies. These are disseminated through training courses aimed at the various groups of employees (new arrivals, managers, senior executives, etc.), including:
-Safety Pass: These safety induction courses were started on January 1st, 2018, for new arrivals at the Group. Various courses exist depending on the position held, and cover the Company’s major risks, the risks linked to the activities on site as well as those linked to the workplace. The theoretical content is supplemented by practical "life-saving" training sessions;
-HSE for Managers aimed at operational or functional managers who are currently or will in the future be responsible within one of the Group’s entities. Sessions are offered on all of the continents where TOTAL operates. Seven sessions were held in 2018 with 305 managers participating;
-HSE Leadership for Group Senior Executives focused on safety leadership. Its objective is to give senior executives the tools to communicate and develop a safety culture within their organization. This course is currently being updated, and a pilot session in the new format will be held in early 2019. The target is for all senior executives to have taken the new module within three years.
As TOTAL’s core value, Safety has been a component of the Group’s employee compensation policy since 2011. A portion of the variable compensation received by employees, as well as by senior executives and the Chairman and Chief Executive Officer, depends on the achievement of HSE targets (refer to point 4.3.2 of chapter 4 and point 5.3.1 of this chapter).
With regard to security, the Group has put in place means to analyze threats and assess risks in order to take preventive measures to limit its exposure to security risks in the countries where it operates.
5.4.2 Preventing occupational health risks through improved assessment

With regard to prevention of occupational health risks, the Group implements a policy that defines the risk assessment methodology to be applied by all Group entities and subsidiaries. The associated Group directive stipulates that the assessment includes chemical, physical, biological, ergonomic and psychosocial risks, and that it must result in the design and roll-out of an action plan. In addition, it requires that each Group entity sets out a formal medical monitoring procedure taking into account the requirements under local law (frequency, type of examination, etc.) and the level of exposure of its personnel to the various risks.
To complement this program, the Group has set up an employee health observatory. The aim is to monitor the health of a sample of employees in order to identify the emergence of certain illnesses and, if applicable, suggest appropriate preventive measures. The data is gathered anonymously during medical examinations and covers approximately 12% of Group employees worldwide.
The Group also has a Medical Advisory Committee that meets regularly to discuss key health issues relating to the Group’s activities. It decides whether there is a need for additional health protection strategies to be implemented. It consists of external scientific experts and also brings together the Group’s senior executives and stakeholders concerned by these issues.
In terms of prevention, the Group has decided to make psychosocial risk prevention a priority commitment. In 2018, the Group identified four areas of progress worldwide:
-a minimum level of awareness and training for all;
-a system for measuring stress and the quality of the social climate, facilitating the production of action plans;
-a system for listening to and supporting employees in difficult situations;
-coordination of actions and monitoring of indicators.
A Quality of Life at Work and Health working group was set up in September 2018 to coordinate and ensure the effectiveness of all of the actions taken. Led by the Group Human Resources division, all of TOTAL’s business segments are represented, particularly the international medical department. Its first task is to create and roll out a Worldwide Psychosocial Risk (PSR) Prevention program that addresses the four areas for progress.
Regarding the priority commitment to training, a fully updated PSR pack aimed at entity managers, prevention contributors and managers was finalized in 2018. Approved by international experts, it has now been translated into 11 languages and is the core material for training on this subject. The pack consists of two guides: a methodological guide for entity managers and anyone with a role in PSR prevention, and a practical guide for managers to raise awareness of the importance of the quality of life at work as a key factor in preventing PSRs. It also aims to support them in the day-to-day management of their teams in the event of difficulties, risky situations and crisis situations.
On a broader level, TOTAL is helping to promote individual and collective health programs in the countries where it operates, including vaccination campaigns and screening programs for certain diseases (AIDS, cancer, malaria, etc.) for employees, their families and local communities. Action is also taken regularly to raise awareness of lifestyle risks (anti-smoking and anti-drinking campaigns, etc.).
The Group has put in place the following indicators to monitor the performance of its program:
Health indicators (WHRS scope) | 2018 | 2017 | 2016 |
Percentage of employees with specific occupational risks benefiting from regular medical monitoring (a) | 98% | 98% | 99% |
Number of occupational illnesses recorded in the year (in accordance with local regulations) | 154 | 143 | 108 |
(a) As an exception to the reporting principles described in section 5.11 of this chapter, the 2018 rate does not include a company that did not report its data in time for the 2018 WHRS.
Reporting on occupational illnesses covers only the Group’s personnel (WHRS scope) and illnesses reported according to the regulations applicable in the country of operation of each entity.
Musculoskeletal disorders, the main cause of occupational illnesses in the Group, represented 69% of all recorded illnesses in 2018, against 68% in 2017. Therefore, in addition to ergonomic risk assessments and the gradual training of personnel on its sites, the annual Group Industrial Hygiene Day in December 2017 was on the theme of Ergonomics and Musculoskeletal disorders.
The annual Group Industrial Hygiene day held in September 2018 was dedicated to asbestos and refractory ceramic fibers.
5.4.3 Minimizing the risks throughout the life cycle of products to prevent consumer health and safety risks
Unless certain precautions are taken, some of the products marketed by TOTAL pose potential consumer health and safety risks; the Group therefore aims to meet its obligations with regard to information and prevention in order to minimize the risks throughout its products’ life cycle.
TOTAL’s health and products directive sets out the minimum requirements to be observed by the Group’s entities and subsidiaries for marketing the Group’s products worldwide in order to reduce potential risks to consumer health and the environment. TOTAL identifies and assesses the risks inherent to its products and their use. The material safety data sheets (MSDS) that accompany the products marketed by the Group (in at least one of the languages used in the country) as well as product labels are two key sources of information. All new products comply with the regulatory requirements in the countries and markets for which they are intended.
5.5 Environmental challenges
TOTAL places the environment at the heart of its ambition of being a responsible company. In light of the specific nature of its activities, the Group’s operations pose risks for which TOTAL develops structured management systems.
The Group has therefore identified its main environmental challenges: -preventing incident risks connected to major industrial events; -limiting its environmental footprint by managing energy consumption, emissions in natural environments (water, air, soil) and use of natural resources; -not to harm biodiversity and ecosystems during projects and operations especially when situated in sensitive natural environments; -limiting its production of residual waste by supporting the circular economy. |
To address its challenges, TOTAL relies on the HSE division, which is part of the People & Social Responsibility division, whose President is a member of the Executive Committee. In particular, the HSE division is tasked with defining the HSE strategy and policies of the Group in line with the business challenges and the One Total Company project.
The HSE division manages in an integrated manner the environmental, security, health and societal challenges associated with the Group’s operations. It coordinates the implementation of the Group’s Health, Safety, Environment and Quality charter, which incorporates these challenges, by defining and monitoring the implementation of the One MAESTRO reference framework. This reference framework is described in detail in point 5.4 of this chapter.
Environmental indicators have been monitored for many years in order to constantly adapt the Group’s environmental protection measures, which are presented in this section.
5.5.1 General policy and environmental targets
TOTAL considers respect for the environment to be a priority. All employees, at every level, must do their utmost to protect the environment as they go about their work. TOTAL strives to control its energy consumption, its emissions in natural environments (water, air, soil), its residual waste production, its use of natural resources and its impact on biodiversity. With regards to the environment, TOTAL takes a constructive approach that is based on transparency and dialogue when communicating with its stakeholders and third parties.
To this end, the HSE division and the HSE departments within the Group’s entities seek to ensure both applicable local regulations and internal requirements resulting from the Safety Health Environment Quality Charter and the Group’s additional commitments are respected. Group steering bodies, led by the HSE division, are tasked with:
-monitoring TOTAL’s environmental performance, which is reviewed annually by the Executive Committee, for which multi-annual improvement targets are set;
-handling, in conjunction with the business segments, the various environment-related subjects of which they are in charge; and
-promoting the internal standards to be applied by the Group’s operational entities.
The Group’s environmental targets (a): -decrease SO2 air emissions by 50% between 2010 and 2020; -maintain hydrocarbon content of water discharges below 30 mg/l for offshore sites and below 15 mg/l for onshore and coastal sites; -valorize more than 50% of the waste produced by the sites operated by the Group. Moreover, the Group is committed to: -systematically develop biodiversity action plans for production sites located in protected areas (1); -not conducting oil and gas exploration or production operations in the area of natural sites listed on the UNESCO World Heritage List (2); -not conducting exploration in oil fields under sea ice in the Arctic. What has been accomplished: -more than 50% reduction in SO2 air emissions since reached 2017; -100% of the Group’s oil sites have met the target for the quality of onshore discharges since 2016 and 96% of the Group’s oil sites have met the target for the quality of offshore discharges in 2018; -more than 50% of the waste produced by the sites operated by the Group was valorized in 2018; -5 biodiversity action plans deployed or in preparation in 2018; -no oil and gas exploration or production activity in the area of natural sites listed on the UNESCO World Heritage List (2); -no exploration activity in oil fields under sea ice in the Arctic. |
(a) For the climate change targets, refer to point 5.6 of this chapter.
The Group’s internal requirements state that the environmental management systems of its operated sites that are important for the environment (3) must be ISO 14001 certified within two years of start-up of operations or acquisition: 100% of these 71 sites were in conformity in 2018. Beyond these internal requirements, at the end of 2018, a total of 264 sites operated by the Group were ISO 14001 certified. In 2018, the Moho Nord site (Republic of the Congo) has been ISO 14001 certified.
All investment, divestment or acquisition projects which are submitted to the Executive Committee for approval are assessed and reviewed with regards to their risks and impact, particularly environmental, before the final investment decision is made.
TOTAL seeks to ensure that all employees share its environmental protection requirements. Employees receive training in the required skills. TOTAL also raises employee awareness through internal communication campaigns (e.g., in-house magazines, intranet, posters).
5.5.2 Preventing incident risks

To prevent incident risks and, in particular, major industrial events, TOTAL carries out periodic risk assessments and implements adapted risk-management policies and measures.
The Group has management structures and systems that present similar requirements and expectations across all the entities. TOTAL strives to minimize the potential impacts of its operations on people, the environment and property through a major technological risk management policy. This management draws on a shared approach in all segments that includes, on the one hand, risk identification and analysis, and on the other hand, the management of these risks.
This structured approach applies to all of the Group’s operated businesses exposed to these risks. In addition to its drilling and pipeline transport operations, the Group has at the end of 2018 195 sites and operating zones exposed to major technological risks, which could cause harm or damage to people, property and the environment, corresponding to:
-all the offshore and onshore operating activities in Exploration & Production; and
-the Seveso classified industrial sites (upper and lower threshold) and their equivalents outside the EU (excluding Exploration & Production).
This approach first sets out an analysis of the risks related to the Group’s industrial operations, on each site, based on incident scenarios for which the probability of occurrence and the severity of the consequences are assessed.
Second, based on these parameters, a prioritization matrix is used to determine whether further measures are needed in addition to compliance with the Group’s standards and local regulations. These mainly include preventive measures but can also include mitigation measures.
The management of major technological risks also hinges on:
-staff training and raising awareness;
-a coherent event reporting and indicators system;
-systematic, structured serious event analysis, particularly to learn lessons in terms of design and operation;
-regularly tested contingency plans and measures.
In terms of monitoring indicators, the Group reports the number of Tier 1 and Tier 2 events as defined by the API and the IOGP. The Group set itself a loss of primary containment target of under 100 (Tier 1 and Tier 2) in 2018.
(1) Sites located in an IUCN I to IV or Ramsar convention protected area.
(2) Natural sites included on the UNESCO World Heritage List of December 31, 2017.
(3) Sites that emit more than 30kt CO2e per year.
The target is slightly exceeded due to the inclusion of new entities in the reporting scope. In addition to the 103 Tier 1 and Tier 2 operational events indicated in the table below, the Group recorded four Tier 1 events and one Tier 2 event due to sabotage or theft in 2018.
Loss of primary containment (a) | 2018 | 2017 (b) | 2016 (b) |
Loss of primary containment (Tier 1) | 30 | 28 | 38 |
Loss of primary containment (Tier 2) | 73 | 75 | 101 |
Loss of primary containment (Tier 1 and Tier 2) | 103 | 103 | 139 |
(a) Tier 1 and Tier 2: indicator of the number of loss of primary containment events, with more or less significant consequences, as defined by the API 754 (for downstream) and IOGP 456 (for upstream) standards. Excluding acts of sabotage and theft.
(b) Excluding TEP Barnett in 2016 and 2017.
In accordance with industry best practices, TOTAL also monitors accidental liquid hydrocarbon spills of more than one barrel. Spills that exceed a predetermined severity threshold (in terms of volume spilled, toxicity of the product in question or sensitivity of the natural environment affected) are reviewed on a monthly basis and annual statistics are sent to the Group Performance Management Committee. All large spills are followed by corrective actions aimed at returning the environment to an acceptable state as quickly as possible. Due to their unpredictable nature, there is no quantitative target for accidental hydrocarbon spills. Nevertheless, changes in the number of spills are observed and analyzed.
Accidental hydrocarbon spills (a) | 2018 | 2017 (b) | 2016 |
Number of hydrocarbon spills | 74 | 62 | 73 |
Total volume of hydrocarbon spills (thousands of m³) | 0.3 | 0.5 | 0.9 |
(a) Accidental spills with an environmental impact and of more than one barrel.
(b) In 2017, the indicator perimeter was updated to exclude spills due to sabotage by a third party.
In order to manage a major accidental spill efficiently, the Group implemented a global crisis management system that is primarily based on a dedicated organization and a crisis management center at the head office to enable the management of two simultaneous crises. As part of this process, TOTAL regularly trains in crisis management on the basis of risk scenarios identified through analyses.
In particular, the Group has response plans and procedures in place in the event of a hydrocarbon leak or spill. For accidental spills that reach the water surface, oil spill contingency plans are regularly reviewed and tested during exercises. These plans are specific to each company or site and are adapted to their structure, activities and environment while complying with Group recommendations.
Oil spill preparedness | 2018 | 2017 | 2016 |
Number of sites whose risk analysis identified at least one risk of major accidental pollution to surface water (a) | 126 | 126 | 143 |
Proportion of those sites with an operational oil spill contingency plan | 99% | 91% | 99% |
Proportion of those sites that have performed at least one oil spill response exercise during the year | 86% (b) | 95% | 89% |
(a) The variation of the number of sites between 2016 and 2018 is due to perimeter variation.
(b) Decrease in 2018 compared to 2017 corresponds mainly to two subsidiaries where equipment was being refurbished in 2018.
In the event of accidental pollution, the Group companies can call on in-house human and material resources (Fast Oil Spill Team, FOST) and benefit from assistance agreements with the main third-party organizations specialized in the management of hydrocarbon spills.
Since 2014, subsea capping and subsea containment equipment that can be transported by air has been strategically positioned at different points of the world (South Africa, Brazil, Norway and Singapore) in order to provide solutions that are readily available in the event of oil or gas eruptions in deep offshore drilling operations. From these locations, the equipment can benefit TOTAL’s operations worldwide. This equipment was developed by a group of nine oil companies, including TOTAL, and is managed by Oil Spill Response Ltd (OSRL), a cooperative dedicated to the response to marine pollution by hydrocarbons. TOTAL has also designed and developed its own capping system ("Subsea Emergency Response System") to stop potential eruptions in drilling or production operations as quickly as possible. Since 2015, equipment has been installed in Angola, then the Republic of the Congo, potentially covering the entire Gulf of Guinea region.
For its sea and river shipment requirements, TOTAL only charters ships and barges that meet the highest international standards. The Group has an internal policy that lays down the process and criteria by which ships and barges are selected (known as vetting). These criteria are based, in particular, on the regulations, best practice and recommendations of the OCIMF (1) and, in Europe, on the European Barge Inspection Scheme (EBIS). Tankers and barges are vetted by a single centralized Group entity. The average age of the Group Shipping division’s time-chartered fleet is approximately six years.
With regard to operated marine terminals, the Group got involved in an initiative that seeks to systematically record their physical characteristics and store this data in a global database that forms part of the Marine Terminal Information System (MTIS) of the OCIMF. At the end of 2018, 95% of coastal marine terminals and 50% of offshore terminals had submitted their characteristics, thereby making it easier to assess the compatibility of ships with the ports of call. Additionally, since 2018, large TOTAL terminals have used the Marine Terminal Management Self Assessment (MTMSA), the framework recommended by the industry for the self-assessment of terminals and the continuous improvement of the safety of product transfers. A training course on ship/shore interface management (SSSCL - Ship Shore Safety Check List) and cargo transfer operations, developed by the Group in 2016, had completed by operators of 80% of operated-terminals by the end of 2018.
(1) OCIMF (Oil Companies International Marine Forum): An industry forum including the leading worldwide oil companies. This organization manages, in particular, the Ship Inspection Report (SIRE) Programme, which holds and provides access to tanker and river barge inspection reports (Barge inspection Questionnaire - BIQ).
5.5.3 Limiting the environmental footprint
Wherever TOTAL conducts its business, it makes sure that it complies with applicable laws and regulations, which the Group complements with specific requirements and commitments when necessary. TOTAL implements an active policy of avoiding, reducing, managing and monitoring the environmental footprint of its operations. As part of this policy, emissions are identified and quantified by environment (water, air and soil) so that appropriate measures can be taken to better control them.
Water, air
The Group’s operations generate emissions into the atmosphere from combustion plants and the various conversion processes and discharges into wastewater. In addition to complying with applicable legislation, the Group’s companies actively pursue a policy aimed at reducing emissions. After analyses have been conducted and when necessary, the sites introduce various reduction systems that include organizational measures (such as using predictive models to control peaks in sulfur dioxide (SO2) emissions based on weather forecast data and the improvement of combustion processes management, etc.) and technical measures (wastewater treatment plants, using low-NOX burners and electrostatic scrubbers, etc.).
For new facilities developed by the Group, impact assessments are systematically carried out on these emissions and, if necessary, actions are taken to limit their impact.
In 2010, SO2 emissions were 99 kt. The Group set itself the target of not exceeding 49.5 kt by 2020; it has met this target since 2017.
Chronic emissions into the atmosphere (a) | 2018 | 2017 | 2016 |
SO2 emissions (kt) | 48 | 47 | 52 |
NOX emissions (kt) | 69 | 68 | 76 |
(a) Refer to point 5.1 of this chapter for the scope of reporting.
SO2 emissions that are likely to cause acid rain are regularly checked and reduced.
NOX emissions, which are mainly concentrated in the Exploration & Production, are primarily located offshore and far away from the coast. Their impact on air quality is therefore considered to be minor.
Discharged water quality
In 2018, with regards to discharges to aquatic environments, all of the operated sites met the onshore discharge quality target set to restrict the impact on receiving environments.
2018 | 2017 | 2016 | |
Hydrocarbon content of offshore water discharges (in mg/l) | 14.1 | 17.7 | 17.2 |
% of sites that meet the target for the quality of offshore discharges (30 mg/l) | 96% (a) | 100% (a) | 100% (a) |
Hydrocarbon content of onshore water discharges (in mg/l) | 1.8 | 2.4 | 3.1 |
% of sites that meet the target for the quality of onshore discharges (15 mg/l) | 100% | 100% | 100% |
(a) Alwynn site (United Kingdom) excluded, as its produced water discharges only occur during the maintenance periods of the water reinjection system and are subject to a specific regulatory authorization.
In 2018, the percentage of sites conforming to the targets for quality of offshore discharges decreased due to a site, aquired as part of the Mærsk Oil acquisition that exceed the target of the Group. The water discharge from this site is minor in terms of volume and represents less than 3% of the Group’s global offshore discharge.
The improvement in the quality of onshore water discharges in 2018 is linked to a better performance of the waste water treatment plants at Anvers, Donges and Normandie Refineries and to the expiry of the Mahakam license in Indonesia.
Soil
The risks of soil pollution related to TOTAL’s operations come mainly from accidental spills (refer to point 5.5.2 of this chapter) and waste storage (refer to point 5.5.5 of this chapter).
The Group’s approach to preventing and managing these types of pollution is based on four key principles:
-preventing leaks, by implementing, as far as possible, industry best practices in engineering, operations and transport;
-carrying out maintenance at appropriate frequency to minimize the risk of leaks;
-overall monitoring of the environment to identify any soil and groundwater pollution; and
-managing any pollution from previous activities by means of containment and reduction or elimination operations.
In addition, a Group directive defines the following minimum requirements:
-systematic identification of each site’s environmental and health impacts related to possible soil and groundwater contamination;
-assessment of soil and groundwater contamination based on various factors (extent of pollution inside or outside the site’s boundaries, nature and concentrations of pollutants, presence of a vector that could allow the pollution to migrate, use of the land and groundwater in and around the site); and
-management of health or environmental impacts identified based on the use of the site (current or future, if any) and the risk acceptability criteria recommended by the World Health Organization (WHO) and the Group.
Lastly, decommissioned Group facilities operated by Group entities or affiliates (i.e., chemical plants, service stations, mud pits or lagoons resulting from hydrocarbon extraction operations, wasteland on the site of decommissioned refinery units, etc.) impact the landscape and may, despite all the precautions taken, be sources of chronic or accidental pollution. TOTAL created a policy of evaluation, treatment of environmental risks related to soil and groundwater and remediation of its sites at the end of their activity. In agreement with the authorities, the aim is to allow new operations to be set up once the future use of the land has been determined. Remediation operations are conducted by specialized entities created by the Group. At the end of 2018, 123 industrial sites that were no longer in operation (excluding service stations) were in the process of remediation.
The Group’s provisions for the protection of the environment and site remediation are detailed in Note 12 to the Consolidated Financial Statements (point 8.7 of chapter 8).
Sustainable use of resources
Fresh water
The Group’s activities, mainly those of Refining & Chemicals, and to a lesser extent those of the Exploration & Production, Gas, Renewables & Power segments, may potentially have an impact on, as well as be dependent of, water resources. This is especially true when an activity is located in a water resources sensitive environment.
Fully aware of these challenges, TOTAL implements the following water risk management actions:
1. monitor water withdrawals to identify priority sensitive sites and then carry out a risk assessment;
2. improve the water resources management depending on identified needs, by adapting the priority sites’ environmental management system.
In order to identify the priority facilities, TOTAL records the withdrawal and discharge of water on all of its sites and assesses these volumes on the basis of the current and future water stress indicators of the WRI (1) Aqueduct tool (currently 9.7% (2) of fresh water withdrawals take place in a global water stress area).
In addition, TOTAL assesses water resources risk levels of priority facilities which are those that withdraw more than 500,000 m³ per year and are located in areas potentially exposed to water resource risks, using the Local Water Tool (LWT) for Oil & Gas from the Global Environmental Management Initiative (GEMI). This tool also helps to guide the actions taken to mitigate any risks in order to make optimal use of water resources on these sites.
Globally, the sites operated by the Group are not particularly exposed to water risk. By the end of 2018, out of the 24 priority sites identified, the level of water risk was assessed on 16 priority Group sites (11 Refining & Chemicals, 3 Exploration & Production, 2 Gas, Renewables & Power). Following this assessment, two sites were identified as being at risk and were reported to the CDP. This analysis process is expected to be extended to other current priority sites, including eight additional sites that have been identified.
In 2018, the Group answered the CDP Water survey for the 2017 period and was graded A-. The main indicator used in this reporting is aggregated withdrawal.
Water-related indicator (a) | 2018 | 2017 | 2016 |
Fresh water withdrawals excluding cooling water (million m³) | 116 | 116 | 123 |
(a) Refer to point 5.1 of this chapter for the scope of reporting.
Soil
TOTAL uses the ground surface that it needs to safely conduct its industrial operations and, in 2018, did not make extensive use of ground surfaces that could substantially conflict with various natural ecosystems or agriculture.
In 2018, the Group introduced a specific selection process concerning palm oil suppliers to ensure all palm oil purchases for the La Mède facility will be certified sustainable in accordance with European Union criteria (ISCC EU certification) and are conducted with a limited number of suppliers. This certification imposes criteria of sustainability and traceability of the oils (carbon footprint, non-deforestation, proper soil use, respect for Human Rights) used specifically for sustainable biofuels. Those criteria apply to the entire production and distribution chain of the sustainable biofuels and are regularly updated. To be certified, sustainable biofuels must lead to a GHG emissions reduction from well to wheel of minimum 50% compared to fossil fuels. As at December 31, 2018, supplies of palm oil to La Mède had not yet begun.
5.5.4 Not to harm biodiversity and ecosystems during projects and operations
TOTAL’s activities may potentially be located in sensitive natural environments.
The Group is fully aware of this challenge and takes biodiversity and ecosystems into account during its projects and operations. In July 2018, and within the framework of the Act4Nature initiative, the Group made 16 biodiversity commitments to make this policy more tangible. The 16 commitments are described in the biodiversity brochure available on the website sustainable-performance.total.com. There are 10 general commitments common to all of the signatory companies and an additional 6 commitments specific to TOTAL, some of which existed before the initiative. These differentiate the Group from its competitors.
The commitments are currently being implemented. A review of the actions that have already been performed is provided below.
TOTAL commitments | Achievements |
Commitment No. 1 The Group extended its commitment not to engage in oil and gas exploration or extraction operations at natural sites included on the UNESCO World Heritage List of December 31, 2017. | This commitment is respected. In the Democratic Republic of the Congo, where TOTAL made the commitment not to carry out any exploration activity in the Virunga National Park, partly located in Block III of the Graben Albertine. TOTAL is no longer present in this license since January 2019. |
Commitment No. 2 TOTAL does not conduct any oil exploration activities in oil fields under sea ice in the Arctic. | The Group publishes on its website sustainable-performance.total.com, a list of its licenses in the Arctic. No exploration activities have been conducted in the oil fields under sea ice in the Arctic. |
(1) World Resources Institute.
(2) According to CDP Water 2018 definition.
Commitment No. 3 TOTAL develops biodiversity action plans for operated production sites located in the most sensitive protected areas. | A biodiversity action plan has been developed for operated production sites located in the most sensitive protected areas, corresponding to the UICN I to IV or Ramsar categories. Consequently, the biodiversity action plan developed in 2015 for Djeno in the Republic of the Congo is still being implemented, particularly with regards to the ecosystem services of Lagune de la Loubie. Other action plans shall be implemented in the short term in Italy (Tempa Rossa project) or the medium term, for example, in Uganda (Tilenga project), Tanzania (EACOP project) and Papua New Guinea (Papua LNG project). |
Commitment No. 4 TOTAL commits to implement, as part of Total Foundation, a global program for the preservation of forests, mangroves and wetlands. | For more information on the preservation and restoration of forests, refer to point 5.9.3 of this chapter, which presents the Total Foundation program, for which the Fondation d’entreprise Total in France is primarily responsible. |
Commitment No. 5 TOTAL develops innovative tools and methods for the analysis and modeling of biodiversity data collected as part of its baseline studies and promotes their sharing with the scientific community. | In order to share the data collected by the Group during its baseline studies, a cooperation program with Oxford University (Long Term Ecology Laboratory), in partnership with Equinor, was launched in 2018 to develop a marine biodiversity sensitivity screening tool called LEFT Marine (Local Ecological Footprint Tool); this tool shall be made available to the public so that it can be used by third parties. |
Commitment No. 6 TOTAL promotes employee awareness of biodiversity issues through actions that promote biodiversity at its office buildings. | In order to raise awareness of biodiversity among employees, the Group’s environmental communication plan comprises a series of actions that are aimed at employees at its head-office, office and sites, and across all segments. In 2018, a brochure on the subject of biodiversity, which presented the new Act4Nature commitments and the Group’s biodiversity actions, was released and explained through a biodiversity MOOC (massive open on-ine course) on the Group’s intranet. |
5.5.5 Promoting a better use of natural resources by supporting the circular economy

Between 2017 and 2020, TOTAL is rolling out a range of actions that form part of the circular economy and are based on five commitments to different areas of the circular economy: -limit the production of waste and favor its valorization, -develop polymers that contain up to 50% recycled plastic, -install solar panels on 5,000 service stations, -improve by an average of 1% per year the energy efficiency of the Group’s operated industrial facilities, -incorporate a criterion dedicated to the circular economy into the Company’s purchases. What has been accomplished: -with regards to the valorization of waste, the target has been met, -conclusive industrial tests have been carried out on the three main types of polymer (polyethylene, polypropylene and polystyrene), -by the end of 2018, solar panels had been installed on 880 service stations, -for information on energy efficiency, refer to points 5.6.2 and 5.6.4 of this chapter. |
With regards to food waste and food poverty, the Group’s activities pertaining to food distribution are minor and are therefore not directly affected by these issues.
Waste prevention and management
Regarding waste in particular, a Group directive lays down a number of minimum waste-management requirements, which limit the potential risks associated with the improper management of waste. Waste management is carried out in four basic stages: waste identification (technical and regulatory); waste storage (soil protection and discharge management); waste traceability, from production through to disposal (e.g., notes, logs, statements); and waste treatment, with technical and regulatory knowledge of the relevant processes, under the site’s responsibility.
The Group’s companies are also focused on controlling the waste produced on all of the operated sites, at every stage in their operations. This approach is based on the following four principles, listed in decreasing order of priority:
-reducing waste at source by designing products and processes that generate as little waste as possible, as well as minimizing the quantity of waste produced by the Group’s operations;
-reusing products for a similar purpose in order to prevent them from becoming waste;
-recycling residual waste; and
-recovering energy, wherever possible, from non-recycled products.
TOTAL deploys programs on its operated sites to valorize (sorting and energy valorization) the majority of the Group’s waste. In 2018, the Group processed 573 kt of waste (all modes of management combined). In the end, the Group’s target of recovering more than 50% of its waste is achieved:
Waste treatment processes | 2018 | 2017 | 2016 |
Recycling and/or valorization (a) | 57% | 59% | 58% |
Landfill | 18% | 13% | 18% |
Others (incineration, biotreatment, etc.) | 25% | 28% | 24% |
(a) The valorization percentages of 2017 and 2018 exclude excavated soil in the scope of Port Arthur Ethan Cracker project. It was exceptional non-hazardous waste associated with the construction of a new installation which was used as soil cover in a landfill. 2017 data was restated to take into account this new calculation mode. Refer to point 5.1 of this chapter for the scope of reporting.
Since 2017, all the Refining & Chemicals segment’s plastic production sites worldwide are participating in the CleanSweep® program, which aims to achieve zero loss of plastic pellets in handling operations. CleanSweep® is an international program that aims to avoid losses of plastic pellets during handling operations by the players in the plastics industry, so that they are not disseminated into the aquatic environment.
At end of 2018, the program has been deployed at all polymer sites in the Refining & Chemicals segment.
The Group is also committed to develop solutions to help end plastic waste in the environment, especially in oceans, within the Alliance to End Plastic Waste of which TOTAL is a founding member.
5.6 Climate change-related challenges
TOTAL’s ambition is to become the responsible energy major. The Group is committed to contributing to the United Nations Sustainable Development Goals, particularly with regards to those subjects that are connected to climate change and the development of more available and cleaner energy for as many people as possible.
The Group has therefore identified its main climate change challenges: -reduce the greenhouse gas emissions of its operated oil & gas activities including methane emissions; -implement a strategy allowing to reduce the carbon intensity of the energy products used by its customers; -identify and support technologies and initiatives that helps respond to the challenge of climate change. |
In order to make an effective contribution to the climate change issue, TOTAL relies on an organization and structured governance framework to make sure climate-related challenges are fully integrated into the Group’s strategy. Consequently, the Group has a robust strategy and implements a structured risk management system.
In line with the multiple situations encountered in the field, and while supporting the Group’s governance bodies, the Strategy and Climate division shapes the Group’s approach to climate change while working with the operational divisions of the Group’s business segments. By monitoring indicators, progress can be measured and the Group’s actions can be adjusted.
5.6.1 Governance
TOTAL has an organization and structured governance framework to make sure climate-related challenges are fully integrated into the Group’s strategy. Since September 2016, its organization includes a Strategy-Innovation corporate division, which includes the Strategy & Climate division as well as the Gas, Renewables & Power business segment, whose President is a member of the Executive Committee.
Oversight by the Board of Directors
TOTAL’s Board of Directors ensures that climate-related issues are incorporated into the Group’s strategy and examines climate change risks and opportunities during the annual strategic outlook review of the Group’s business segments.
To carry out its work, the Board of Directors relies on its Strategic & CSR Committee, whose rules of procedure were changed in September 2017 then in July 2018 in order to broaden its missions in the realm of CSR and in questions relating to the inclusion of climate-related issues in the Group’s strategy.
Aware of the importance of climate change challenges faced by the Group, the Board of Directors decided, in 2016, to introduce changes to the variable compensation of the Chairman and Chief Executive Officer to take better account of the achievements of Corporate Social Responsibility (CSR) and the Group’s HSE targets. For fiscal year 2018, the importance given to these criteria rose further: CSR performance is assessed by considering the extent to which climate issues are included in the Group’s strategy, the Group’s reputation in the domain of Corporate Social Responsibility as well as the policy concerning all aspects of diversity.
The Board of Directors meeting of March 13, 2019 decided to change the criteria for the determination of the variable portion of the Chairman and Chief Executive Officer’s compensation for the year 2019. Among others, a quantifiable criteria related to the evolution of GHG emissions (Scopes 1 & 2) on operated oil & gas facilities (refer to chapter 4, section 4.3.2 for details).
Role of management
TOTAL’s Chairman and Chief Executive Officer, in compliance with the long-term strategic direction set by the Board of Directors, implements the strategy of the Group and its business segments while making sure climate change challenges are taken into account. He relies on the President, Group Strategy-Innovation, who is a member of the Executive Committee, to whom the Senior Vice President Strategy & Climate, and the Senior Vice President Climate report (refer to the Group organization chart in chapter 1). The Senior Vice President Climate chairs the Climate-Energy steering Committee, which mainly includes representatives of Strategy and HSE management from the various business segments. The mission of this Committee consists of structuring the Group’s approach to the climate, and in particular to:
-propose GHG emission reduction targets for the Group’s operated oil & gas facilities;
-propose a strategy to reduce the carbon intensity of the energy products used by the Group’s customers;
-monitor the existing or emerging CO2 markets; and
-drive new-technology initiatives and projects that can reduce CO2 emissions (energy efficiency, CO2 capture and storage, for example).
5.6.2 Strategy
Identification of climate-related risks and opportunities
The risks and opportunities related to climate change are analyzed according to different timescales: short term (until 2020), medium term (until 2030) and long term (beyond 2030).
The identification of climate-related risks forms an integral part of the analysis of investment projects. The impact of these risks is also examined for the Group asset portfolio as a whole. These risks are presented in detail in point 3.1.2 of chapter 3.
Climate change also provides TOTAL with opportunities. In the coming decades, demand for electricity will grow faster than the global demand for energy, and the contribution of renewables and gas to the production of electricity shall therefore play an essential role in the fight against climate change. Electricity alone will not be sufficient to meet all needs, particularly those connected to transport. Gas and sustainable biofuels will be attractive and credible alternatives to conventional fuels and the Group intends to develop them.
Certain sectors, particularly the cement industry and the steel sector, could struggle to reduce their GHG emissions. They will therefore require CO2 capture, use and storage technology (CCUS). Consequently, the Group intends to step up the development of CCUS to respond to these new needs.
Helping customers to reduce their energy consumption and environmental impact also offers opportunities and forms part of a trend that will be accelerated by digital technology. TOTAL intends to innovate in order to provide them with new product and service offers that will support their energy options and their usages. The promotion of hybrid solutions combining hydrocarbons and renewables is part of this approach. Similarly, services can be offered to optimize energy for industrial sites. The Group aims to develop this approach for industrial and mobility applications.
Impact of climate-related risks and opportunities
Climate change is at the heart of the Company’s strategic vision. TOTAL positions itself on high-growth low-carbon markets and intends to offer customers an energy mix with a carbon intensity that shall gradually decrease. To accompany these changes, TOTAL has introduced a carbon intensity indicator for the energy products used by its customers. This indicator is described in point 5.6.4 of this chapter.
TOTAL has five major levers to structure its approach.
1) Improving energy efficiency
Optimizing the energy consumption of its operated facilities is TOTAL’s first lever to reduce emissions. The Group therefore aims to improve the energy efficiency of its operated facilities by an average of 1% per year over the 2010-2020 period, at a time when exploration is becoming increasingly complex. This indicator is described in point 5.6.4 of this chapter.
TOTAL uses appropriate architectures and equipment and introduces technological innovations. For example, on offshore production barges, offshore platforms and onshore facilities, heat recovery systems at gas turbine exhausts have been implemented thereby avoiding the need for furnaces or boiler systems.
TOTAL also offers customers an energy efficiency consultancy service so that they can optimize their own energy consumption and reduce their GHG emissions. The recent acquisition of GreenFlex forms part of this initiative. By providing consultancy (strategic and operational), data intelligence (digital platforms) and financing services, GreenFlex helps companies and regions improve their energy and environmental performance. The Company’s areas of expertise are varied and include, for example, the improvement and management of the energy performance of buildings, equipment, utilities and processes, sustainable mobility, flexible electricity consumption, renewables and positive-energy buildings. More than 700 companies have already been supported by GreenFlex.
Finally, in 2017, TOTAL signed an agreement with Fondation GoodPlanet, chaired by Yann Arthus-Bertrand, for the implementation of a program to neutralize the carbon emissions from air travel by Group employees over a 10-year period. This project is expected to avoid the emission of 50,000 t of CO2 into the atmosphere per year. It will entail the creation and operation of 8,400 biodigesters in India.
2) Growing in natural gas
To respond responsibly to the strong rise in demand for electricity, TOTAL remains committed to gas, whose CO2 emissions are half those of coal when used to generate electricity (1).
The Group wishes to be present throughout the whole gas chain, from production to end customer. Significant operations have taken place in the upstream and the downstream to make this possible. Upstream, TOTAL has acquired a stake in the giant Yamal LNG project in the north of Russia. The Group has also acquired the LNG assets of Engie. These two complementary portfolios allow for the management of a volume of nearly 40 Mt of LNG as from 2020. Downstream, the Group has made strategic acquisitions, such as Direct Énergie and Lampiris, gas and electricity suppliers on the French and Belgian markets, and has developed Total Spring, which was launched in 2017 on the French market.
Finally, TOTAL has committed itself to gas fuel for transport by acquiring a 25% stake in Clean Energy Fuels Corp., one of the leading distributors of gas fuel for HGVs in the United States, and by signing a contract with CMA-CGM, the first shipping company to equip its transcontinental container ships with LNG-powered engines.
Strengthening the position of gas in the energy mix must however be accompanied by a greater focus on control of methane emissions. To preserve the advantage that gas offers in terms of GHG emissions compared to coal for electricity generation, it is necessary to strictly reduce the methane emissions associated with the production and transportation of gas. In 2018, TOTAL’s methane emissions are kept below 0.25% of the commercial gas produced (2). TOTAL’s target is to sustainably reduce the intensity of its methane emissions of its operated facilities in the Exploration & Production segment to less than 0.20% of commercial gas produced by 2025.
The Group has been a member since 2014 of the partnership between governments and industrial companies for the improvement of tools to measure and control methane emissions set up by the Climate and Clean Air Coalition and promoted by UN Environment and the non-profit organization Environmental Defense Fund. The Group also took several actions as part of the Oil & Gas Climate Initiative and signed the guiding principles on the reduction of methane emissions on the gas value chain (3).
3) Developing a profitable low-carbon electricity business
TOTAL is developing along the whole of the low-carbon electricity value chain, from electricity generation, storage and sale to the end customer. As demand for electricity is expected to grow strongly in the coming decades, TOTAL intends to become a major player in this segment. To meet this target, TOTAL plans to invest $1.5 to $2 billion per year. In 2018, the Group completed the acquisition of Direct Énergie, a French electricity supplier, for nearly €2 billion. With regards to the generation of electricity, TOTAL aims at holding a production capacity of 10 GW of low-carbon electricity by 2023. In 2018, TOTAL acquired four combined-cycle natural gas power plants in France with a global capacity of 1.6 GW. Refer to chapter 2 for further information on recent acquisitions.
4) Developing sustainable biofuels
A pioneer in biofuels for more than 20 years, TOTAL is now one of Europe’s major actors with 2.4 Mt blended sustainable biofuels (4) in 2018 for a worldwide distribution of 3.2 Mt.
Furthermore, TOTAL produced 0.1 Mt of sustainable biofuels in its refineries in 2018. Production at La Mède factory, scheduled to start in 2019, with a capacity of 0.5 Mt per year of hydrotreated vegetable oil (HVO) based on sustainable certified charges. The Group intends to reach a market share of over 10% in Europe in HVO production. Biofuels that are currently available are mainly made with vegetable oil and sugar.
For more than 10 years, TOTAL’s R&D teams have developed technologies that have broadened the range of usable resources, while also meeting the need for sustainability. The consortium BioTFuel is working on, for example, the development of lignocellulose (plant waste).
5) Investing in carbon sink businesses
Carbon storage is key to achieving carbon neutrality in the second half of the 21st century. TOTAL is focusing, on the one hand, on developing CCUS and, on the other, on preserving and restoring the capacity of ecosystems to act as carbon sinks. CCUS is vital for several industries, especially those that emit massive amounts of CO2 due to the nature of their business (cement, steel, etc.). TOTAL allocates significant resources to this area by dedicating up to 10% of the Group’s R&D budget to it. Several projects have made substantial progress in recent months. Northern Lights (Norway) is a project in which the Group participates alongside Equinor and Shell. TOTAL is also a partner of the Clean Gas Project (UK), together with the OGCI’s investment fund and a few companies of the sector (5).
TOTAL announced in February 2019 the creation of an entity dedicated to investments in natural carbon sinks, composed of experts in environment and agronomy, with an investment budget $100 million per year from 2020 onwards. Furthermore, actions of preservation and restoration of the forest are currently conducted (refer to point 5.9 of this chapter which presents the Total Foundation program carried mainly by the Fondation d’entreprise Total).
Sector initiatives and international framework
TOTAL is also committed to various sector initiatives on the main challenges raised by climate change. Indeed, tackling climate change requires cooperation between all actors, from both public and private sectors.
Thus, TOTAL joined, in 2014, the call of the UN Global Compact, which encourages companies to consider a CO2 price internally and publicly support the importance of such a price via regulation mechanisms suited to the local context. In particular, TOTAL advocates the emergence of a balanced, progressive international agreement that prevents the distortion of competition between industries or regions of the world. Drawing attention to future constraints on GHG emissions is crucial to changing the energy mix. TOTAL therefore encourages the setting of a worldwide price for each ton of carbon emitted, while ensuring fair treatment of "sectors exposed to carbon leakage" (as defined by the EU). In addition, TOTAL is working with the World Bank as part of the Carbon Pricing Leadership Coalition (CPLC). In June 2017, TOTAL became a founding member of the Climate Leadership Council, an initiative that calls for the introduction of a "carbon dividend", namely a redistribution mechanism that would tax the biggest fossil fuel consumers (the population’s wealthiest citizens) in order to pay a dividend to the entire population.
(1) Source: International Reference Centre for the Life Cycle of Products, Processes and Services; Life cycle assessment of greenhouse gas emissions associated with natural gas and coal in different geographical contexts, October 2016.
(2) Refer to the OGCI methodology for methane intensity calculation: http://oilandgasclimateinitiative.com/blog/methodological-note-for-ogci-methane-intensity-target-and-ambition.
(3) "Guiding Principles on Reducing Methane Emissions across the Natural Gas Value Chain".
(4) Physical volume of biofuels in equivalent ethanol and esters according to the rules defined by the European RED Directive, excluding volumes sold to third parties via trading.
(5) BP, ENI, Equinor, Occidental Petroleum and Shell.
In 2014, TOTAL was actively involved in launching and developing the Oil & Gas Climate Initiative (OGCI), a global industry partnership. At year-end 2018, this initiative involved 13 major international energy players. Its purpose is to develop solutions for a sustainable low emissions future. Launched in 2017, the OGCI Climate Investments fund, which has access to over $1 billion over 10 years, invests in technology that significantly cuts emissions. The fund’s initial investments notably are: a large-scale industrial CO2 capture and storage project (Clean Gas Project); a solution that reduces the carbon footprint of cement by using CO2 instead of water to set concrete (Solidia Technologies); a high-efficiency opposed-piston engine that reduces GHG emissions (Achates Power) and a technology that incorporates CO2 as a raw material in the production of polyols used in polyurethanes, which are plastics that have multiple uses (Econic Technologies).
The Group also plays a role in various international initiatives that involve the private and the public sectors to bring about (non-exhaustive list):
-carbon pricing within Caring for Climate - United Nations Global Compact, and the Paying for Carbon call;
-the end of routine flaring of gas associated to oil production within the World Bank’s Zero Routine Flaring by 2030 initiative;
-greater transparency, while taking into account the recommendations of the G20 Financial Stability Board on climate, and of the Task Force on Climate-related Financial Disclosures (TCFD); and
-the development of new state-of-the-art energy companies, since 2017 within the Breakthrough Energy Coalition (BEC), a group of investors created by Bill Gates in 2015, and since 2016 within the Breakthrough Energy Ventures, a $1 billion fund created in 2016 by the BEC.
TOTAL also actively participates in the debate on climate issues, thanks especially to its long-term partnerships with university chairs, such as the Climate Economics Chair at Paris-Dauphine University, the climate change research program of Massachusetts Institute of Technology (MIT) (1), and Toulouse School of Economics. Lastly, TOTAL offers training and makes presentations at several universities, thereby taking part in the debate.
Resilience of the organization’s strategy
In order to ensure the viability of its projects and long-term strategy in light of the challenges raised by climate change, the Group integrates, into the financial evaluation of investments presented to the Executive Committee, either a long-term CO2 price of $30 to $40 per ton (depending on the price of crude), or the actual price of CO2 in a given country if higher.
Regulations designed to gradually limit fossil fuel use may, depending on the GHG emission limits and time horizons set, negatively and significantly affect the development of projects, as well as the economic value of certain of the Group’s assets.
The Group performs sensitivity tests to assess the ability of its asset portfolio to withstand an increase in the price per ton of CO2. These studies show that a long-term CO2 price of $40/t (2) applied worldwide would have a negative impact of around 5% on the discounted present value of the Group’s assets (upstream and downstream). [REDACTED SECTION: CERTAIN TEXT HAS BEEN REDACTED.]
As part of the annual preparation of its long-term plan, TOTAL makes long-term energy demand forecasts (oil, gas and electricity). The Group presented in February 2019 these forecasts (Total Energy Outlook), available on total.com.
5.6.3 Risk management

Processes to identify and assess risks related to climate change
Climate-related risks form part of the major risks that are identified and analyzed by the Group Risk Management Committee. The latter therefore has a map of the climate-related risks to which the Group is exposed.
In addition, the Risk Committee (CORISK) assesses investment projects, risks and corresponding climate-related issues (flaring, GHG emissions, sensitivity to CO2 prices) before they are presented to the Executive Committee.
Processes to manage risks related to climate change
In its decision-making process, the risks and associated climate issues are assessed prior to the presentation of the projects to the Executive Committee. if the level of risk requires it, they are subject to mitigation measures.
With regard to risks related to climate issues, TOTAL, in accordance with its Safety Health Environment Quality Charter, is committed to managing its energy consumption and develops processes to improve its energy performance and that of its customers.
The Group also ensures that it assesses the vulnerability of its facilities to climate hazards so that the consequences do not affect the integrity of the facilities, or the safety of people. More generally, natural hazards (climate-related risks as well as seismic, tsunami, soil strength and other risks) are taken into account in the construction of industrial facilities, which are designed to withstand both normal and extreme conditions. The Group carries out a systematic assessment of the possible repercussions of climate change on its future projects. These analyses include a review by type of risk (e.g., sea level, storms, temperature, permafrost) and take into account the lifespan of the projects and their capacity to gradually adapt. These internal studies have not identified any facilities that cannot withstand the consequences of climate change known today.
Integration of climate-related risks into global risk management
The risks related to climate issues are fully integrated in TOTAL’s global risk management processes.
The Audit Committee takes part in the annual review of the results of the climatic and environmental reporting process. In addition, these results are audited by an independent third party.
(1) The Joint Program on the Science and Policy of Global Change.
(2) 40$/t as from 2021 for all countries, or the current price in a given country if it is higher than 40$/t.
5.6.4 Targets and metrics to measure climate-related risks and opportunities
TOTAL has set itself targets and introduced a number of indicators to coordinate its performance.
The Group’s climate targets: -an 80% reduction of routine flaring (1) on operated facilities between 2010 and 2020 in order to eliminate it by 2030, -an average 1% improvement per year in the energy efficiency of operated facilities between 2010 and 2020, -a sustainable reduction in the intensity of the methane emissions of the Exploration & Production segment’s operated facilities to less than 0.20% of the commercial gas produced, by 2025. -a GHG emission reduction (Scopes 1 & 2) on operated oil & gas facilities of 46 Mt CO2e in 2015 to less than 40 Mt CO2e in 2025. What has been accomplished: -more than 80% reduction in routine flaring between 2010 and 2018; -more than 10% improvement in energy efficiency between 2010 and 2018; -an intensity of the methane emissions below 0.25% of the commercial gas produced in 2018; -a GHG emission reduction (Scopes 1 & 2) on operated oil & gas facilities from 46 Mt CO2e to 42 Mt CO2e between 2015 and 2018. |
The Group also intends to reduce the carbon intensity of energy products used by its customers by 15% between 2015, the date of the Paris Agreement, and 2030. This carbon intensity was reduced from 75 g CO2/kBtu in 2015 to 71 g CO2/kBtu in 2018, a reduction of more than 5%.
Indicators related to climate change (a)
2018 | 2017 | 2016 | 2015 | |||
SCOPE 1 | Direct greenhouse-gas emissions (operated scope) | Mt CO2e | 40 | 38 | 41 | 42 |
Breakdown by segment | ||||||
Exploration & Production | Mt CO2e | 18 | 17 | 19 | 19 | |
Gas, Renewables & Power | Mt CO2e | 2 | 0 | 0 | - | |
Refining & Chemicals | Mt CO2e | 21 | 21 | 22 | 22 | |
Marketing & Services | Mt CO2e | < 1 | < 1 | < 1 | < 1 | |
SCOPE 1 | Direct greenhouse-gas emissions based on the Group’s equity interest | Mt CO2e | 54 | 50 | 51 | 50 |
SCOPE 2 | Indirect emissions attributable to energy consumption by sites | Mt CO2e | 4 | 4 | 4 | 4 |
GHG emissions (Scopes 1 & 2) on operated oil & gas facilities | Mt CO2e | 42 | 41 | 45 | 46 | |
SCOPE 3 (b) | Other indirect emissions - Use by customers of products sold for end use | Mt CO2e | 400 | 400 | 420 | 410 |
Net primary energy consumption (operated scope) | TWh | 143 (c) | 142 | 150 | 153 | |
Group energy efficiency indicator | Base 100 in 2010 | 88.4 | 85.7 | 91.0 | 90.8 | |
Daily volume of all flared gas (Exploration & Production operated scope) (including safety flaring, routine flaring and non-routine flaring) | Mm3/d | 6.5 | 5.4 | 7.1 | 7.2 | |
Of which routine flaring | Mm3/d | 1.1 | 1.0 | 1.7 (d) | 2.3 (e) | |
Carbon intensity of energy products used by customers of the Group | g CO2e /kBtu | 71 | 73 | 74 | 75 (f) | |
(a) Refer to point 5.11 of this chapter for the scope on reporting.
(b) The Group usually follows the oil industry reporting guidelines published by IPIECA which are conform to the GHG Protocol methodologies. In this document, only item 11 of scope 3 (use of sold products), which is the most significant, is reported. Emissions for this item are calculated based on sales of finished products for which the next stage is end use, in other words combustion of the products to obtain energy. A stoichiometric emission factor is applied to these sales (oxidation of molecules to carbon dioxide) to obtain an emission volume.
(c) Excluding primary energy consumption of Direct Énergie gas power plants.
(d) Estimated volume at end 2016 based on new definition of Routine Flaring published in June 2016 by the Working Group Global Gas Flaring Reduction.
(e) Volumes estimated upon historical data.
(f) Indicator developed in 2018, with 2015 as the baseline year.
(1) Routine flaring, as defined by the working group of the Global Gas Flaring Reduction program within the framework of the World Bank’s Zero Routine Flaring initiative.
All this data as well as the related risks are also reported to the CDP once a year, and TOTAL’s response to the CDP Climate Change questionnaire is posted on the Group’s website (sustainable-performance.total.com). For its 2018 reporting regarding 2017 activities, the Group received an A-.
Flaring
Reducing routine flaring has been a long-standing target of the Group, which designs its new projects without resorting to it. In addition, TOTAL is committed to putting an end to routine flaring of its operated facilities by 2030. An 80% reduction target was set for 2020 compared to 2010, in other words, an average of 1.5 Mm3/d. This target has been met since 2017.
Furthermore, as part of the Global Gas Flaring Reduction program, TOTAL has worked alongside the World Bank for over 10 years to help producing countries and industrial players control flaring of gas associated to oil production.
The increase in flaring linked to oil production in 2018 is due to acquisition and startup of new sites.
Energy efficiency
One of the Group’s performance targets is to better control energy consumption. Since the beginning of 2013, a Group directive has defined the requirements to be met at operated sites using more than 50,000 tons of oil equivalent per year of primary energy (approximately 40 sites). At end 2018, all the concerned sites reported compliance or had taken steps to comply with this directive. The aim is to ensure that 100% sites using more than 50,000 tons of oil equivalent per year by the end of 2020 have an auditable energy management system, such as the ISO 50001 on energy management(1). A certain number of sites that use less than 50,000 tons of oil equivalent per year have, voluntarily, taken measures to become ISO 50001 certified.
Energy efficiency is a key factor for the improvement of economic, environmental and industrial performance. Since 2013, the Group has used a Group Energy Efficiency Index (GEEI) to assess its performance in this area. It consists of a combination of energy intensity ratios (ratio of net primary energy consumption to the level of activity) per business.
The Group’s target for the 2010-2020 period is to improve the energy efficiency of its operated facilities by an average of 1% per year. By design, the base value of the GEEI was defined as 100 in 2010 and the target is to reach 90.4 in 2020. This target has been met since 2017.
Through the "Total Ecosolutions" program, the Group is developing innovative products and services that perform above market standards on the environmental front. At year-end 2018, 97 products and services bore the "Total Ecosolutions" label. The CO2e emissions avoided throughout the life cycle by the use of "Total Ecosolutions" products and services, compared to the use of benchmark products on the market and for an equivalent level of service, are measured annually based on sales volumes. This represented 1.75 Mt CO2e in 2018.
GHG emissions
The Group has reduced by 25% the GHG emissions produced by its operated activities since 2010. This reduction was reached thanks to notably reducing flaring and improving energy efficiency.
In February 2019, TOTAL announced a target to reduce GHG emissions (Scopes 1 & 2) on its operated oil & gas facilities from 46 Mt CO2e to less than 40 Mt CO2e in 2025.
Carbon intensity indicator of the products used by its customers
TOTAL wishes to fully address the issue regarding the emissions of energy products used by its customers and therefore decided to report all of the emissions associated with these products in the form of a carbon intensity indicator.
This indicator measures the average GHG emissions of these products, from production in TOTAL facilities to end use by customers. This indicator takes into account:
-for the numerator:
-the emissions connected to the production and conversion of energy products used by its customers on the basis of the Group’s average emission rates,
-the emissions connected to the use of energy products used by the customers. For each product, stoichiometric emission factors (2) are applied to these sales to obtain an emission volume. Non-fuel use products (bitumen, lubricants, plastics, etc.) are not taken into account,
-negative emissions stored thanks to CCUS and natural carbon sinks;
-for the denominator: the quantity of energy sold, knowing that electricity is placed on an equal footing with fossil fuels by taking into account the average capacity factor and average efficiency ratio.
The Group intends to reduce its carbon intensity by 15% between 2015, the date of the Paris agreement, and 2030. This undertaking represents a responsible contribution by TOTAL to the Paris agreement targets and it also enables the Group to fulfill its mission to supply to as many people as possible a more affordable, more available and cleaner energy.
Additional work on this method, whose main principles have already been established, is currently taking place. This work will improve the accuracy of the method used to calcuate the method’s various components.
5.6.5 TCFD correspondence table
In June 2017, the TCFD (3) of the G20’s Financial Stability Board published its final recommendations on information pertaining to climate to be released by companies. These recommendations include additional details for certain sectors, such as energy.
TOTAL publicly announced its support for the TCFD and its recommendations during the summer of 2017, while noting that it is up to companies to define the information about climate-related risks and opportunities that are significant, which, consequently, are expected to be disclosed in financial filings, and the additional information that they choose to report on a voluntary basis. TOTAL also believes that the quantification of impacts of different scenarios may not be relevant to investors as assumptions made by different companies may strongly diverge. The Group considers that companies have a major role to play in shaping how these issues evolve and that the modalities of the application of scenarios and the use of metrics should be further studied.
(1) The ISO 50001 standard accompanies the implementation in companies of an energy management system that allows a better use of energy.
(2) The emission factors used are taken from a technical note from the CDP: Guidance methodology for estimation of scope 3 category 11 emissions for oil and gas companies.
(3) Task Force on Climate-related Financial Disclosures.
TOTAL continued discussions by taking part in the Oil & Gas Preparer Forum set up by the TCFD in the autumn of 2017; this work resulted in the publication, in July 2018, of best practices on the disclosure of climate-related information and on the implementation of TCFD recommendations by the four companies that are members of the Forum (1).
Thematic area | Recommended TCFD disclosures | Source of information in TOTAL’s reporting |
Governance | ||
Disclose the organization’s governance around climate-related risks and opportunities. | a) Describe the board’s oversight of climate-related risks and opportunities. | RD 2018 - 5.6.1 CR p. 10 CDP C1.1 |
b) Describe management’s role in assessing and managing climate-related risks and opportunities. | RD 2018 - 5.6.1 CR p. 5-9 CDP C1.2 | |
Strategy | ||
Disclose the actual and potential impacts of climate-related risks and opportunities on the organization’s businesses, strategy, and financial planning where such information is material. | a) Describe the climate-related risks and opportunities the organization has identified over the short, medium, and long term. | RD 2018 - 5.6.2 CDP C2 |
b) Describe the impact of climate-related risks and opportunities on the organization’s businesses, strategy, and financial planning. | RD 2018 - 5.6.2 CDP C2.5, C2.6 | |
c) Describe the resilience of the organization’s strategy, taking into consideration different climate-related scenarios, including a 2°C or lower scenario. | RD 2018 - 5.6.2 CR p. 30 | |
Risk Management | ||
Disclose how the organization identifies, assesses, and manages climate-related risks. | a) Describe the organization’s processes for identifying and assessing climate-related risks. | RD 2018 - 5.6.3 CDP CC2.2 |
b) Describe the organization’s processes for managing climate-related risks. | RD 2018 - 5.6.3 CDP C2.2d | |
c) Describe how processes for identifying, assessing, and managing climate-related risks are integrated into the organization’s overall risk management. | RD 2018 - 5.6.3 CDP C3.1 | |
Metrics & targets | ||
Disclose the metrics and targets used to assess and manage relevant climate-related risks and opportunities where such information is material. | a) Disclose the metrics used by the organization to assess climate-related risks and opportunities in line with its strategy and risk management process. | RD 2018 - 5.6.4 CR p. 52 CDP C6.5, C10 |
b) Disclose Scope 1, Scope 2, and, if appropriate, Scope 3 greenhouse gas (GHG) emissions, and the related risks. | RD 2018 - 5.6.4 CR p. 52 CDP C6.5, C10 | |
c) Describe the targets used by the organization to manage climate-related risks and opportunities and performance against targets. | RD 2018 - 5.6.4 CR p. 24-25, 42 CDP C4.1a,b |
Key: CR = TOTAL’s 2018 Climate Report CDP = TOTAL’s 2018 response to the CDP Climate Change questionnaire (available on total.com)
(1) Eni, Equinor, Shell and TOTAL, with the support of the WBCSD (World Business Council for Sustainable Development).
5.7 Actions in support of human rights
The main challenges associated with the Group activities and respect for human rights are identified using the methodology set out in the United Nations Guiding Principles Reporting Framework relating to the "salient issues" with regard to human rights, that is to say the human rights at risk of the most severe negative impact through the Company’s activities or business relationships.
This analysis, as well as the internal risk mapping activities, have led the Group to identify six risks subdivided across three key areas: -"Human rights in the workplace" of TOTAL’s employees as well as of the employees of its suppliers and other business partners: -forced labor and child labor, -discrimination, -just and favorable conditions of work and safety; -"human rights and local communities": -access to land, -the right to health and an adequate standard of living; -"respect for human rights in security-related activities": -the risk of misuse of force. |
In 2016, TOTAL published an initial Human Rights Briefing Paper, in line with the UN Guiding Principles Reporting Framework, making it the first company in the oil and gas industry to do so. An updated version of this document was published in 2018 (available at sustainable-performance.total.com).
The Forum of the United Nations on Business and Human Rights 2018 invited the Chairman and CEO to attend a panel of senior business leaders at the opening plenary session on November 26, 2018. This opportunity has allowed TOTAL to explain how the Group integrates respect for human rights into its operations and value chain and how it puts into practice reasonable diligence concerning human rights, as well as to remind the challenges that needs to be tackled.
TOTAL’s human rights approach is based on written commitments. It is supported by a dedicated organization, and embedded through an awareness-raising and training program, as well as evaluation and follow-up mechanisms aiming at measuring the effectiveness of the Group’s actions.
Written commitments
TOTAL is committed to respecting internationally recognized human rights wherever the Group operates, in particular the Universal Declaration of Human Rights, the Fundamental Conventions of the International Labor Organization, the UN Guiding Principles on Business and Human Rights and the Voluntary Principles on Security and Human Rights (VPSHR).
A dedicated organization
The Group’s Human Rights Department provides advice and support to employees and operational divisions and supervises efforts made to promote respect for human rights in close collaboration with the Ethics Committee. In particular, it runs a Human Rights Committee which coordinates the actions taken internally and externally by the various Group entities.
The Ethics Committee is a central and independent structure where sit representatives of all TOTAL’s business segments. Its key role is one of listener and support. Both employees and external stakeholders can refer matters to the Ethics Committee by email at ethics@total.com. The Committee ensures the confidentiality of the complaints, which can only be lifted with the agreement of the complainant.
The Human Rights Department and the Ethics Committee rely on a network of "ethics officers" in charge of promoting the values set out in the Code of Conduct among employees working in the Group’s subsidiaries and ensuring that the Group’s commitments are correctly implemented at the local level.
Awareness-raising and training
To ensure that employees understand the Group’s commitments, TOTAL raises their awareness via internal communication channels, such as its Ethics and Human Rights intranet websites or by means of events such as the annual Business Ethics Day. In 2018, the Business Ethics Day was held in December on the day of the 70th anniversary of the Universal Declaration of Human Rights.
Since 2011, the Group has issued and made available to its employees and other stakeholders a Human Rights Guide which comes as complement to the Group’s Code of Conduct. It aims to raise the Group’s employee’s awareness on issues relating to human rights in their industry and provides guidance as to the appropriate behavior to adopt in their activities and relationships with stakeholders.
TOTAL also organizes special trainings tailored to the challenges faced on the field by employees who are particularly exposed to such issues such as human rights training sessions for HSE experts and Community Liaison Officers (CLO) organized with the Danish Institute for Human Rights (DIHR) or sessions designed to raise awareness of the Group’s Ethics Officers. Actions intended to raise awareness of the Group’s external stakeholders, such as specific VPSHR trainings for the private security providers, are also organized.
Assessments
The practices of the Group’s entities and the risks to which they may be exposed are regularly evaluated when it comes to human rights issues. The Group works with independent third parties and qualified experts to conduct these assessments.
Since 2002, the British company GoodCorporation has assessed the policies and practices of more than 120 entities with regard to the principles and values enshrined in the Group’s Code of Conduct. During these evaluations, the working conditions in the Group’s activities and service stations are assessed, among other things. In 2018, seven entities were assessed. These evaluations help identify entities’ best practices, share them within the Group and highlight areas for improvement. The Group uses these evaluations as opportunities to encourage its employees to voice their concerns in a confidential manner and report behaviors contrary to the Code of Conduct. These evaluations confirm that the Code of Conduct is well known by the Group’s employees. TOTAL must nevertheless continue to raise awareness among its commercial and industrial partners, in particular with regard to respect for human rights at work. The supplier’s qualification and evaluation procedure which is being progressively deployed by Total Global Procurement, described in point 5.10 of this chapter, contributes to raise these partners’ awareness.
Stand-alone human rights impact assessments may also be conducted in addition to the environmental and societal impact assessments in high risk areas or conflict zones with the support of independent experts such as the Danish Institute for Human Rights, a Danish public non-profit organization. In 2017 and 2018, the Danish Institute for Human Rights conducted two human rights impact assessments of our projects in Papua New Guinea and Myanmar. In Papua New Guinea, the assessment focused on equal treatment between women and men, security and conflict. The recommendations included in particular awareness-raising of the relevant stakeholders to complaint mechanisms and the periodic measurement of their effectiveness; the organization of trainings on the Voluntary Principles on Security and Human Rights (VPSHR) for government security forces and private security providers. As a result of this study, steps have been taken by the entity to implement these recommendations. Other non-profit partner organizations, such as the CDA Corporate Engagement Project, also contribute to the evaluation of the societal impact of the Group’s activities or projects on nearby local communities. It includes interviews with local communities. CDA’s reports are available on their website.
The Group also assesses the practices of its suppliers, including the working conditions of their own employees (refer to point 5.10 of this chapter).
Follow-up
The Group’s approach is integrated within a Human rights roadmap endorsed by the Group’s Executive Committee at regular intervals. The 2017-2018 roadmap on human rights focuses on three main areas for improvement: integrating human rights considerations in business practices at local level; improving management awareness and accountability on human rights issues at all levels; improving evaluation processes of at risk entities, the tools available to them and their follow-up. It includes an action plan for relevant Grop’s division and business segments.
5.7.1 Human rights in the workplace
The prohibition of forced and child labor, non-discrimination, just and favorable conditions of work, as well as safety all form part of the principles set out in TOTAL’s Code of Conduct and Human Rights Guide.
TOTAL’s commitment to human rights in the workplace is demonstrated, in particular, by the signature of various agreements, such as the one concluded with IndustriALL Global Union (1) in 2015. In particular, this agreement covers the promotion of human rights in the workplace, diversity, the participation of employees and their representatives in social dialogue and the recognition of health and safety at work as absolute priorities in the Group’s activities and global supply chain.
In its activities
TOTAL cares about the working conditions of its employees which are governed by the Group’s Human Resources policy (refer to point 5.3 of this chapter).
Safety is one of the Group’s core values. Over the last few years, the Group has continued to develop occupational health and safety standards focusing on the right to enjoy fair and adequate living and working conditions (refer to point 5.4 of this chapter).
TOTAL is committed to promoting diversity and endeavors to combat all forms of discrimination (origin, gender, sexual orientation, handicap, age, membership in a union or a political or religious organization, etc.). The Diversity Council, which is chaired by a member of the Executive Committee, illustrates this commitment.
In 2017, TOTAL published a "Practical guide to dealing with religious questions within the Group" in order to provide practical solutions to the questions raised by the Group’s employees and managers worldwide. It draws on the experiences of the business segments in various countries and encourages dialog, respect and listening as a way to find solutions suited to the local context. Many internal and external experts helped draft this document, including representatives of various religious communities. This guide has been translated into nine languages.
In addition to the Group’s reporting and internal control system, the working conditions of TOTAL’s employees are evaluated by GoodCorporation, an independent third party, as part of the ethical assessments of the Group’s entities.
In the Group’s value chain
The Fundamental Principles of Purchasing (FPP) set out the commitments expected from suppliers in various domains, including human rights in the workplace and safety. A Group directive reaffirms the obligation to annex the FPP or to transpose them in the selection process as well as in the contracts concluded with suppliers of goods or services.
The prevention of forced and child labor in the supply chain is a critical point of attention identified in the 2017-2018 human rights roadmap endorsed by the Executive Committee. TOTAL has therefore developed a new methodology for selecting its suppliers which takes account the risks of human rights violations, in particular forced and child labor. In September 2016, TOTAL also entered into a partnership with a third-party service provider in charge of evaluating suppliers’ practices with regard to fundamental rights in the workplace (refer to point 5.10 of this chapter).
Finally, the working conditions of the employees of service stations’ dealers are evaluated by GoodCorporation, an independent third party, as part of the ethical assessments conducted in the Group entities. Between 2016 and 2017, a baseline study of 22 affiliates in the Marketing & Services segment across different continents was also conducted. One of the main recommendations identified is to improve service station dealers’ awareness of the Group’s Code of Conduct principles and of the fundamental Conventions of the International Labor Organization. In response, Marketing & Services is developing educational tools, which should be promoted in 2019 to this business segment’s entities.
(1) International union federation representing more than 50 million employees in the energy, mining, manufacturing and industrial sectors in 140 countries.
5.7.2 Human rights and local communities

TOTAL’s operational activities may have impacts on the rights of local communities, in particular when TOTAL obtains temporary or permanent access to their land for Group’s projects that may involve the physical and/or economic displacement of these populations. Noise and dust emissions and other potential impacts may also have consequences on the livelihood of neighboring communities. Consequently, the access to land of local communities and their right to health and an adequate standard of living are two salient issues for TOTAL.
In accordance with internationally recognized human rights standards, TOTAL requires the Group entities to maintain a regular dialogue with their stakeholders and make sure that their activities have no negative consequences on local communities or, if these cannot be avoided, that they limit, mitigate and remedy them. The solutions proposed in response to the expectations of local communities are coordinated by the societal teams that work in close collaboration with the legal, safety and environmental teams. The Group’s approach to this topic is described in the section on societal issues in point 5.9 of this chapter.
5.7.3 Respect for human rights in security-related activities
In certain situations, intervention by government security forces or private security providers might be necessary to protect TOTAL staff and assets. In order to prevent any misuse of force, TOTAL asks Group employees, private security providers and government security forces to implement the Voluntary Principles on Security and Human Rights (VPSHR) issued by States, NGOs and Extractive Companies.
TOTAL has been a member of this initiative since 2012. Within this framework, the Group publishes an annual report setting out the challenges, lessons learned and good practices in relation to security and human rights and, if applicable, reports any incidents associated with the Group’s activities. This report is available at sustainable-performance.total.com.
Self-assessment and risk analysis tools have been developed and are deployed, in particular, in the entities located in high risk countries and conflict zones.
When government security forces are deployed to ensure the protection of the Group’s staff and assets, the Group entities maintain an ongoing dialogue with the representatives of national or regional authorities in order to raise their awareness on the need to respect the VPSHR and encourage them to sign memorandums of understanding that comply with these principles.
TOTAL regularly organizes training sessions and awareness-raising activities on the risk of misuse of force, and more generally on the VPSHR, for its staff, private security providers and government security forces. In 2018, TOTAL partnered with other Extractive Companies and the Myanmar Center for Responsible Business to organize two VPSHR awareness workshops for government officials, private security providers andNGOs in Myanmar.
5.8 Fighting corruption and tax evasion
5.8.1 Fighting corruption
TOTAL is a major player in the energy sector, in which public authorities play a significant role and in which the amounts invested may be very high. TOTAL is present in more than 130 countries, some of which have a high perceived level of corruption according to the index drawn up by Transparency International. TOTAL is aware of the risk of corruption and applies a principle of zero tolerance. |
To prevent risks of corruption, TOTAL has implemented a robust, regularly updated anti-corruption compliance program that has been rolled out throughout the Group. The aim of this program is to promote a culture of compliance, transparency and dialog, components that are key in ensuring the sustainability of the Group’s operations and activities, as well as to meet legal requirements and, in particular, to comply with applicable anti-corruption laws, such as the U.S. Foreign Corrupt Practices Act, the UK Bribery Act or the French law on transparency, the fight against corruption and the modernization of the economy. Failure to comply with such legislation could expose the Group to a high financial and criminal risk, a risk to its reputation, as well as measures such as the review and reinforcement of the compliance program under the supervision of an independent third party.
The commitment of the entire Group and the efforts undertaken are unrelenting in order to ensure the sustainability and continuous improvement of the anti-corruption compliance program, which the U.S. authorities deemed to be appropriate in 2016, thus putting an end to the monitorship process that was introduced in 2013.
This program is drawn up by a dedicated organization acting at the corporate and business segment levels: the Legal Risks Management and Compliance department, headed by the Chief Compliance Officer, and the Branch Compliance Officers. They coordinate a network of nearly 390 Compliance Officers in charge of rolling out and running the program at the subsidiary level. This structured organization lies in close proximity to operational activities while having its own dedicated reporting line.
TOTAL’s anti-corruption compliance program is based primarily on the following seven pillars: management commitment or "tone at the top", risk assessment, adoption of internal standards, awareness raising and training of the employees, feedback of information, including the whistleblowing system, mechanisms for assessing and monitoring the implementation of the program, and imposition of disciplinary sanctions in the event of misconduct.
5.8.1.1 Management commitment
The constant high level of commitment by the General Management is reflected by the principle of zero tolerance for corruption that is set out in the Group’s Code of Conduct. Managers have a duty to lead by example and are responsible for promoting a culture of integrity and dialog. This commitment is expressed in regular statements made by the Chairman and Chief Executive Officer as well as through large-scale communications actions, such as the annual Business Ethics Day organized on the occasion of the UN’s International Anti-Corruption Day and Human Rights Day. This event was held for the fourth time in December 2018 and was devoted to the updated Code of Conduct which was published on the same day and presented by the Chairman and Chief Executive Officer in a video.
The commitment of the management bodies is also expressed externally by TOTAL joining anti-corruption initiatives and supporting collaborative and multipartite approaches. TOTAL joined the Partnering Against Corruption Initiative (PACI) (1) in 2016, thereby adhering to the PACI Principles for Countering Corruption. The Group’s commitment has been further reinforced by TOTAL’s Chairman and Chief Executive Officer joining the PACI Vanguard Board.
TOTAL is also a member of other initiatives that contribute to the global effort to fight against corruption, such as the UN Global Compact since 2002 or the Extractive Industries Transparency Initiative (EITI) (2) ever since it was launched in 2002. Furthermore, in October 2018, TOTAL’s Chairman and Chief Executive Officer took part in the International Anti-Corruption Conference, which is organized every two years by Transparency International.
5.8.1.2 Risk assessment
To ensure that the compliance program is adequate regarding the risks to which TOTAL is exposed, these must first be identified and assessed. Beyond the Group risk mapping, a risk mapping dedicated to the risks of corruption have been carried out at Group level and every Compliance Officer is responsible for establishing a mapping dedicated to the risks of corruption within their entities, with the aim of drawing up a suitable action plan. Employees are provided with tools that help them identify the risk of corruption, e.g., the Typological guide of corruption risks.
Specific rules have been adopted and incorporated within the Group referential in order to mitigate the identified risks.
5.8.1.3 Internal standards
As an essential element of the Group referential, the Code of Conduct sets out the behavior to be adopted, in particular with regard to the question of integrity. It prohibits corruption, including influence peddling, and advocates "zero tolerance" in this area.
The Code of Conduct is complemented by a regularly updated set of anti-corruption standards. The Anti-Corruption Compliance Directive, which was updated in 2016, recalls the main principles and organizes the roll-out of the anti-corruption program. It deals, among others,
(1) Launched in 2004 within the World Economic Forum, PACI now numbers approximately 90 major corporations and forms a platform for discussion that brings together business leaders and governmental and non-governmental organizations, allowing them to share their experiences and ideas and develop best practices.
(2) The EITI brings together representatives of the governments of the member countries as well as representatives of civil society and business in order to strengthen transparency and governance with regard to income from oil, gas and mineral resources.
with commitment, training and awareness raising, accounting and book-keeping, the assessment system and whistleblowing mechanisms. This directive is complemented by rules that deal with more specific subjects in order to prevent the various identified risks. These rules relate, among others, to the due diligence process, i.e., the analysis and assessment of third parties before entering into business relations with them. This analysis is performed according to criteria that differ depending on the risk level associated with the type of third party. These provisions are incorporated in the supplier and service provider qualification process, which was harmonized in 2017-2018 in connection with the gradual roll-out of a shared database within the Group.
Standards have been drawn up to deal with other high-risk areas, such as gifts and hospitalities, which have to be registered and approved by the line manager above given thresholds; conflicts of interest, which must be declared to the line manager; compliance programs implemented within joint-ventures; and human resources-related processes such as recruitment.
5.8.1.4 Awareness raising and training
Awareness raising actions are carried out towards all employees. The Group’s intranet contains a section on the fight against corruption which provides employees with various media, e.g., the internal standards or guides such as the booklet entitled Prevention and fight against corruption. Poster campaigns communicating the key messages in the risk areas are organized on a regular basis; the latest one was launched in mid-2018. An initial anti-corruption e-learning course was rolled out in 2011 in 12 languages, followed by a more in-depth e-learning module in 2015. This module is accessible to all employees and mandatory for the targeted personal (approximately 30,000 employees). New employees are also required to follow these e-learning courses.
More targeted training courses are also provided for the most highly exposed functions, whether by the corporate or segments Compliance teams or by the Compliance Officers in the subsidiaries. In-depth training is available to the Compliance Officers and a digital training program, intended more specifically for new Compliance Officers, was launched in early 2019.
5.8.1.5 Feedback of information
The feedback of information is ensured primarily through an annual reporting process. This is performed by the Compliance Officers, reviewed by their Branch Compliance Officer and sent to the Chief Compliance Officer. This reporting contributes to monitor the roll-out and implementation of the anti-corruption program, through figures on key elements of the program, for example the number of training courses or due diligences performed.
The consolidated data resulting from this reporting, which reflects the results of the implemented policies, is presented once a year to the Executive Committee and the Board of Directors via the Governance and Ethics Committee. This presentation provides an opportunity to report the results of the undertaken actions at the very highest level and to review the roadmap aligned with the identified areas of improvement.
In addition, TOTAL strives to develop a speak-up culture and asks its employees to report any situations that they consider to be contrary to the Code of Conduct. This culture is encouraged by regular communications that inform personnel about the various speak-up channels; employees, depending on the option they feel is most appropriate, can contact: their line manager, their human resources manager, their Compliance Officer or Ethics Officer, or the Group Ethics Committee. Both employees and third parties can refer to this Committee by writing to ethics@total.com. The Group will tolerate no retaliation measure toward anyone who submits a report in good faith and undertakes to respect conidentiality.
5.8.1.6 Assessment and monitoring
The anti-corruption program is monitored firstly by the line managers and the Compliance Officers who are in charge of ensuring the day-to-day implementation of the rules. Secondly, controls are performed by the Compliance function, in particular through assessment missions (referred to as compliance reviews) that are undertaken by a dedicated team within the Group’s Compliance department. Internal Control also performs annual tests, in particular by documentary checks, in order to verify the quality of the reporting performed by the Compliance Officers. Thirdly, Group Audit helps monitor the anti-corruption program through audits performed according to a framework that includes compliance topics or via more specific missions such as those relating to the Sarbanes-Oxley regulations.
5.8.1.7 Sanctions
In line with the principle of zero tolerance and in application of the Code of Conduct and the Anti-Corruption Directive, any infringement of the anti-corruption standards must give rise to disciplinary sanctions, up to dismissal. The Group’s resolve in this matter is recalled in communication media intended for employees as well as on the intranet. This resolve, which results from the management commitment, contributes, with the other pillars described above, to the robustness of the anti-corruption compliance program.
5.8.2 Fighting tax evasion

With a presence in more than 130 countries through 1,191 consolidated affiliates, TOTAL carries out its operations in a constantly changing environment and is subject to an increasingly complex set of tax regulations, which may be in conflict when combined or subject to varying interpretations, thus giving rise to potential tax risk. |
In this context, TOTAL has developed a responsible tax approach based on clear principles of action and rigorous governance rules as set out in its tax policy statement, which was released in 2014 and is available to the public at sustainable-performance.total.com.
"Tax policy: Tax payments of TOTAL represent a substantial part of our Group’s economic contribution to the countries in which we operate. TOTAL is mindful of its responsibility and is committed to paying its fair share of taxes to the host countries of its operations, in compliance with applicable laws and conventions and in accordance with our Code of Conduct. Our intercompany transactions are thus based on arm’s length terms and our tax strategy is aligned with our business strategy. The formation of affiliates worldwide is driven by business operations, as well as regulatory constraints and JV requirements. It is the Group’s long term commitment not to create affiliates in countries generally acknowledged as tax havens and to repatriate or liquidate existing affiliates, where feasible. Our tax policy’s prime focus is certainty and sustainability in the long term. We believe that the expected short term tax benefit derived from artificial or aggressive tax planning will often be outweighed by the reputational and future tax litigation risks inherent in such schemes. The Group takes a responsible approach to the management and control of taxation issues, relying on well-documented and controlled processes to manage risk and ensure compliance with tax disclosure and filing obligations. The management of tax risks is fully integrated in the Group’s global risk governance process. As part of this process, the Group VP Tax regularly reports to the Audit Committee and the Group Risk Committee on TOTAL’s global tax position, risk monitoring and associated improvement actions. We engage with a broad range of stakeholders, and especially with tax authorities, in a timely, transparent and professional manner which is the basis of a constructive and long term relationship. As a permanent member of the Extractive Industries Transparency Initiative (EITI) since its creation in 2002, Total fully supports initiatives for greater transparency and accountability. We encourage governments to ensure that the tax reporting obligations they will impose upon multinational groups are consistent, coordinated and proportionate. Total publishes in its Registration Document an annual report covering the payments made by the Group’s extractive affiliates to governments (1) and the full list of its consolidated entities, together with their countries of incorporation and of operations." |
Since 2017, the Group also files a country-by-country reporting to the Frenchtax authorities.
5.9 Societal challenges
TOTAL puts its societal responsibility at the heart of its activities, in keeping with its ambition to become the major in responsible energy and the principles formally set forth in its Code of Conduct and its Safety Health Environment Quality Charter.
While the Group’s activities may cause nuisances and have negative impacts on the living conditions of local communities and residents, they are also a source of opportunities through the socio-economic development that they fuel. In line with its socially responsible commitments, the Group intends to actively support local and global initiatives that contribute to more inclusive growth and global progress.
The Group has therefore identified its main societal challenges: -to manage societal challenges related to operations in a responsible manner; -to promote the economic development in the territories where it is present through employment; -to engage with citizenship initiatives. |
In an effort to offer practical responses to its societal challenges that are adapted to the multitude of realities it encounters in the field, the TOTAL HSE and Civil Society Engagement divisions support the Group entities in their Group societal initiatives.
5.9.1 Managing societal challenges related to operations in a responsible manner
The Group’s operational societal approach in the territories where it is present is based on a structured process that is implemented with the support of dedicated teams:
1) Analysis of the challenges and the societal context
Before an industrial project is developed by the Group, an initial pre-project survey is conducted to identify any potentially affected stakeholders and to describe and assess the main socio-economic and cultural issues in the impacted area. It is complemented by societal impact assessments that measure and analyze the societal impacts - actual and potential, positive and negative, direct and indirect, in the short, medium and long term, intentional or unintentional - of the project on the stakeholders. They cover areas such as the socio-cultural, economic and real estate context and ecosystem services. In 2018, Exploration & Production conducted seven assessments.
(1) Refer to point 9.3 of chapter 9.
The assessment of risks and issues by the risks Committee (CORISK), before an investment project is submitted to the Executive Committee, takes the societal aspects into consideration.
The internal standards require all the Group’s entities and subsidiaries to conduct and update, at least every five years, an assessment of their societal context in terms of the exposure of the entity or subsidiary and of the impact of its activities on its stakeholders, and in particular the sensitivity of the human, social, economic and cultural context, as well as the societal impacts (including human rights) of their operations and their presence.
2) Development of a societal strategy integrated with operations
Every entity pays close attention to local issues by defining short-term and long-term societal targets and its priority fields of action that take account of:
-the need to remain within the regulatory and contractual framework, as well as meeting the applicable international standards;
-the social, economic and environmental concerns and expectations of the stakeholders;
-the assessment of the societal context in terms of risks and impacts;
-The Group’s ambitious commitments to civil society.
These targets are built into a structured operational action plan, based on three pillars:
-dialogue and involvement of local stakeholders;
-avoiding and reducing the societal impacts of the Group’s activities;
-taking initiatives in favor of the local communities and residents.
3) Implementing and monitoring societal actions and projects
The societal approach is integrated within operations through the internal industrial health, safety, security, societal and environmental management system. Internal expectations regarding the management of stakeholders and local impacts are formally expressed in an internal Group rule that applies to all the operated entities. Guides, manuals and a community of practices are available on the Group intranet site to help the entities to implement their operational societal initiative.
The societal teams reporting to HSE departments and their correspondents with the Group entities oversee the fulfillment of these requirements. Societal aspects are included within the scope of the HSE audits that produce recommendations to reinforce the control of operations. In keeping with the strategic orientations defined by General Management, each entity and subsidiary conducts an annual self-diagnostic of the activities it operates. All the societal actions taken are listed in an annual internal reporting.
In addition to the global training covering all the HSE topics, specific training is delivered to managers and operational personnel in charge of societal matters, such as The basics of societal engineering (seven sessions in 2018, with 109 trainees, including 49 in Nigeria) or advanced and specific training modules in the operations of Exploration & Production (four sessions in 2018, with 32 trainees).
In an effort to structure its societal initiative, in 2006, TOTAL introduced the internal Stakeholder Relationship Management (SRM+) methodology that aims to facilitate the mapping out of the stakeholders and the societal issues related to the local context, and to commit to an action plan intended to build trusting relationships over time. SRM+ has been deployed in almost every subsidiary. The Group also developed MOST (Management Operational Societal Tool) for its Exploration & Production subsidiaries. This tool, which includes a geographical information system, can be used to manage relations with stakeholders, complaints about sites, as well as societal projects and the resulting specific actions (access to land, compensation, dialog) more efficiently.
5.9.1.1 Dialogue and involvement of local stakeholders
TOTAL takes initiatives to establish dialogue by listening to and involving stakeholders in order to develop constructive and transparent relations with them. For industrial projects developed by the Group, this information, consultation and dialogue process starts well before any decisions on investments.
In accordance with the Group’s framework, every Group entity and subsidiary is expected to dialogue regularly with its stakeholders about the assets, activities or sites that it operates, in order to better understand their concerns and expectations, to measure their satisfaction and to identify means of improving the entity’s societal policy.
On the basis of the map of local stakeholders, which is drawn up and regularly updated as part of the SRM+ methodology, the entities concerned are required to establish a dialogue process that is structured as follows:
-information on the entity’s activities that could have impacts and on the planned mitigation actions;
-listening to opinions, concerns, perceptions and expectations, public consultations;
-consideration of the concerns and expectations in the action plans deployed;
-feedback to the stakeholders on the actions taken and completed.
TOTAL acknowledges the specificities of indigenous and tribal peoples (as referred to in International Labor Organization’s Convention No. 169) and has developed a Charter of Principles and Guidelines Regarding Indigenous and Tribal Peoples to be followed with communities that are in contact with its subsidiaries. This charter encourages the use of experts in order to identify and understand these peoples’ expectations and specificities, consult with them and contribute to their socioeconomic development.
The approach to dialogue at Exploration & Production is managed in certain subsidiaries by mediators, called Community Liaison Officers (CLO), who liaise between the entity and the surrounding populations. Employed by TOTAL, they are from the local communities, speak their language and understands their customs, and they play a decisive role in reaching a mutual understanding. Special attention is paid to the most vulnerable populations. By way of example, in Papua New Guinea in 2018, the appointment of a woman from a Papua tribe residing close to Block PRL 15 as the CLO, helped to establish constructive dialog, with the involvement of women in this process.
Refining & Chemicals has set up structures for dialogue and exchanges with local stakeholders (such as the Community Advisory Panels in the United States or the special local commissions on some European platforms). In 2018, the Feyzin site celebrated the tenth anniversary of its residents’ Conference, which organizes quarterly exchanges with area residents, NGOs and the local authorities. Open days are also organized on the occasion of the inauguration of new facilities or of site anniversaries, for example at the Lindsay (United Kingdom), Port Arthur (United States), Carling (France) and Antwerp (Belgium) platforms. These events are ideal opportunities to maintain dialogue and build trusting relations.
5.9.1.2 Managing the societal impacts of the Group’s activities
Societal impact assessments conducted upstream of industrial projects developed by the Group help to identify the types of potential impacts of the activities on the communities and to set up specific and adapted local action plans to avoid, reduce or compensate for these impacts.
Avoid, reduce and compensate
The action plans usually cover the common topics presented below. The actions taken to minimize the impacts must be adapted to the local context, the stakeholders involved and the type of project. In every project, special attention is paid to listening to vulnerable populations (women, ethnic minorities, natives, etc.). The following examples illustrate some of the actions taken in 2018:
Impacts and nuisances for local communities and residents
-In Mauritania, in order to avoid accidents in fishing zones, Fishing Liaison Officers were assigned to the seismic line-laying boats in order to dialogue with fishermen during the seismic campaign of Block C7.
Impacts on access to land and water
-In Tanzania, where 4,000 hectares of land and 200 villages will be impacted to varying degrees by the 1,143 km pipeline project, a major program to involve the stakeholders is being deployed by a dedicated local team in order to facilitate access to information for the greatest number and to come up with differentiating solutions that take the concerns and problems of the various populations concerned into consideration (nomads, shepherds, traditional miners).
-In Papua New Guinea, where land law is customary, i.e., based on ancestral oral traditions, social mapping and identification of landowners has been carried out in the LNG PRL-15 project area in accordance with the petroleum developments law.
Impacts on socio-economic activities (economic losses) and employment
-In France, Carling and La Mède have taken action to enhance the attractiveness of the platforms (refer to chapter 5.9.2.2).
Impacts on cultural and religious practices and heritage
-In Lebanon, in the preliminary study phase of the Block 4 and Block 9 exploration project, an assessment of the underwater archeological potential was conducted.
Handling grievances from local communities
The Group framework provides for the implementation of operational procedures to handle grievances by providing local communities with a preferential, rapid and simple channel to voice their problems and grievances. The Group’s local entities handle these grievances in order to offer an appropriate response to anyone who feels that they have suffered damage as a result of the activity and to improve internal processes in order to reduce nuisances or impacts that may be caused by the activities.
At Exploration & Production, a set of tools is made available to the subsidiaries, including, in particular, a standard procedure designed to make it easier for local communities to access the grievances mechanisms. This standard procedure complies with the United Nations guiding principles on Business and Human Rights. By way of example, a campaign was organized in Senegal to inform fishermen in the coastal villages between Dakar and Joal about the ROP Block offshore seismic campaign. The existence and workings of the grievances management mechanism were explained to them. In Tanzania, access to this mechanism and contact with the project teams were made easier by installing visual materials, information noticeboards, letter boxes, a free telephone number and information offices were installed in the villages concerned.
Grievance management systems are in place on every ISO 14001-certified Refining & Chemicals platform. The local communities are extensively involved in the search for solutions to control the impacts of the Group’s activities.
At Marketing & Services, a guide intended to raise awareness of grievance management helps the subsidiaries and the operational sites to set up dedicated systems that are separate from the business grievances circuit.
5.9.1.3 Taking initiatives in favor of the local communities and residents
Built on constructive dialog, the involvement of stakeholders bears witness to the Group’s will to build trusting, long-term relations. The long-term future of societal projects is guaranteed by partnerships with local institutions and organizations. TOTAL cooperates directly with the local authorities in all its actions and collaborates with NGOs that have experience in the field.
First and foremost, the projects address the issues of local development and solidarity and favor cooperation and skills development.
At Exploration & Production, the following initiatives are just some examples of the approach adopted:
-In Papua New Guinea, the Societal Baseline Study and the Human Rights Impact Assessment (HRIA) highlighted the critical nature of health problems, especially among women for which maternal mortality rates are very high. A partnership with the government agency NVS (National Volunteer Service) resulted in the hiring of two social workers to help the populations in the villages close to Block PRL 15, who live under very precarious sanitary conditions. Members of the local communities are being trained to eventually replace the social workers as employees of the Gulf Province. Care centers are being set up, and in two years (2017 - 2018) more than 4,000 consultations have taken place.
-In Nigeria, TOTAL supported the Agric Farm Project dedicated to the communities neighboring OML 58 that conducts research and introduces new varieties of plants to improve the yield of local agricultural activities.
-Total Austral launched the first Expertos en Seguridad (safety experts) operation in Neuquén and Tierra del Fuego provinces, with the participation of five schools located close to the subsidiary’s operations in Añelo and Rio Grande. The Total’s Road Safety Cube road safety awareness-raising program for children was attended by 756 children aged between 8 and 12 in 18 educational workshops.
-TEP Congo inaugurated a community center for the populations living in Djeno, where the oil terminal operated by TOTAL is located. The center features sports facilities, a conference center and a library.
At Marketing & Services, TOTAL is pursuing its actions against energy insecurity in France notably for support and to help low-income households thermally renovate their homes. The Group works alongside the French government and other energy suppliers in the "Living Better" program, as well as the Coup de pouce économies d’énergie (energy saving boost) initiative launched in February 2017.
In 2018, Refining & Chemicals has concluded a number of partnerships with educational institutions. As for example, in France, SOBEGI (Lacq) which is involved in a partnership with La Cité scolaire de Mourenx which is based on constructive and diversified exchanges (e.g., on site intervention by SOBEGI employees to increase awareness in the field of circular economy among bachelors’ students; welcoming of students during three weeks on the industrial facilities; support for students and teachers in the Olympiades de la Chimie; organization of a competition of noses as part of the Year of Chemistry.
In the Gas, Renewables & Power branch, an entity is dedicated to the development of an access-to-energy offer based on clean and affordable solutions (refer to point 2.2.3 of chapter 2).
5.9.2 Fostering economic development through employment

The Group is building a global, integrated local development approach ("in-country value") that creates synergies among all the value-creating elements for host countries (employment, subcontracting, infrastructure, support for local industries, socioeconomic development projects, education, access to energy, etc.) by promoting the Group’s industrial know-how. TOTAL promotes actions that help to strengthen the capacity of individuals and local organizations to organize their development independently and durably, by favoring co-construction and partnerships with local players.
5.9.2.1 Developing an approach to create shared value
The Group is committed to creating jobs and using resources for its projects and operations (local citizens and local subcontractors), if it’s operational imperatives so permit. Human skills-building and local SME support programs complete this commitment, resulting not only in the development of local capacity, but also in the economic diversification of the territories where TOTAL operates.
To guarantee the coherence over time of each project’s action plans, their durability in the production phase and the optimization of the allocated resources, this long-term initiative forms part of a local industrial strategy that aims to maximize the impact on the host country measured in terms of new jobs. This strategy is applied to each of the Group’s major industrial projects with high local-content impacts, after first analyzing all the industrial and human capacities and the associated risks, resulting in a plan of specific actions. For example, an analysis of this kind was made in 2018 in Tanzania as part of the EACOP project.
These action plans help to structure technical resources, in particular through training, by strengthening human skills and supporting the economic development of areas of high employment by supporting local SMEs and recruiting local people. For example, in Nigeria, 77% of hours on the FPSO project for the Egina field were worked by local people.
5.9.2.2 Leveraging the reindustrialization of the Group’s platforms
In addition to the jobs generated by its activities, the Group, as a responsible company, supports SMEs, mainly in France, through its Total Développement Régional (TDR) subsidiary. TDR proposes various measures that contribute to creating and keeping jobs in the long term, such as financial support for the creation, development or takeover of SMEs in the form of loans, support for industrial redeployment with actors in local development, or support for exports and international development. Between 2016 and 2018, loans were granted to more than 500 SME projects, amounting to a total of more than €30 million, and support for more than 10,000 jobs.
Additionally, the Group is pursuing its projects for the future of the Carling, La Mède and Lacq platforms. The Voluntary Agreements for Economic and Social Development (CVDES) signed for Carling and La Mède set forth the Group’s commitments in terms of support for SMEs and industrial actions.
On the Carling industrial platform (France), following the shutdown of the second steam cracker in 2015, TOTAL is proceeding with this industrial redeployment without any job losses and in keeping with its contractual commitments to its customers and partner companies. In particular, the Group has set up a fund to support subcontractor companies. TOTAL has invested €190 million in order to develop new activities in the growing hydrocarbon resins (Cray Valley) and polymers markets.
TOTAL is also involved in developing a shared services offer on the platform to boost its appeal and support the arrival of new industrial actors.
-A first industrial project (SNF Coagulants, €19 million of investments and 25 direct jobs) was launched in 2017;
-In October 2018, Quaron, France’s leading chemicals distributor, confirmed its decision to open a new chemicals distribution and formulation site on the platform (20 industrial jobs in the long term);
-Two innovative biochemicals companies: Metabolic Explorer has confirmed its decision to invest (€48 million and 48 direct jobs); Afyren has finalized its funding plan (€50 million and 50 direct jobs) and intends to lift the technical conditions applying to its arrival on the platform.
In this way, TOTAL confirms its responsibility towards the employment areas in which the Group operates as well as its commitment to maintain a strong and lasting industrial presence in the Lorraine region.
Plan to convert the La Mède refinery (France) through an initial investment greater than €275 million is underway to create the first French biorefinery and an Adblue (1) production workshop, establish an 8 MW solar farm and set up a training center in partnership with the IFP Énergies nouvelles. This project will be completed without any lay-offs.
TDR is supporting the subcontractors and putting the Group’s commitments into action. In particular, as a qualified member of PIICTO (Platform for Industry and Innovation at Caban Tonkin), TDR organized PIICTO bio-industries working group, which is targeting the profile of new enterprises that could become part of the industrial fabric of the Etang de Berre. As a consequence, in 2018, the Aix-Marseille-Provence district authority issued a call for interest in an attempt to attract investors in the fields of the energy transition and energy efficiency, sustainable biofuels and bio-industries.
In October 2018, the Chinese group Quechen signed a building lease with the Marseille port authority for a 12-hectare plot of land in the heart of the PIICTO platform that will host a plant producing silica for "green tires" (an investment of €105 million and 130 direct jobs), representing a major Chinese investment in a new production plant in France.
In 2018, TDR also supported the industrial development of three local companies, with the creation of 94 new jobs.
On the Lacq platform in France, a TDR unit, hosted by Sobegi, the platform’s controller, is improving the platform’s marketing and research offer and examining third-party industrial projects that could join the platform. 2018 saw the launch of the new "The Lacq Advantage" platform offer, with a dedicated web site. A working group comprising the Pau-Béarn chamber of commerce and industry, the Chemparc public interest group, the Lacq-Orthez district authority, Sobegi and TDR is actively looking for investors in Europe and Asia, with the help of two expert consulting firms.
The examination of Fonroche’s industrial project to produce biogas on the Lacq platform has reached an advanced stage.
5.9.2.3 Supporting the creation of new businesses
Following the success of TOTAL’s first Startupper of the Year Challenge in 34 African countries in 2015, the 2018-2019 challenge has been extended to 55 countries worldwide and will support and reward young local entrepreneurs in 2019 who have launched a project or created a company in the last two years, irrespective of the segment of activity. The 13,100 projects, complete and compliant with the rules, submitted in the autumn of 2018 have been assessed according to three criteria: their innovative character, their social and societal impact and their feasibility and development potential.
A Grand Jury will then meet to select the six continental "Grand Winners" from the winners in each country. In keeping with the Group’s promise to develop women’s careers, the 2018-2019 challenge will award one "Female favorite" per country to support female entrepreneurs. This special prize will be awarded in addition to the other prizes.
Much more than an entrepreneurial contest, the 2018-2019 Startupper Challenge confirms TOTAL’s wish to support the socio-economic development of the countries worldwide where the Group is present. It contributes locally to the strengthening of the social fabric by helping the most innovative entrepreneurs to turn their projects into reality.
In parallel to this initiative, the Group’s segments and subsidiaries locally support entrepreneurship through partnerships.
5.9.3 Engaging in citizenship initiatives
TOTAL is also involved in the community through civic initiatives in all of its host regions. They extend and complete the actions taken as part of its economic activities.
5.9.3.1 The Total Foundation program
In the face of societal issues and today’s environmental challenges, TOTAL wishes to strengthen its public interest initiatives. This strong commitment is part of TOTAL’s ambition to become the responsible energy major. In 2017, the Group drew up a new citizenship commitment policy, aligned with its history, values and businesses, to intensify its impact. This policy is currently being deployed internationally to gradually include community support initiatives.
Against this backdrop, the Total Foundation program covers the actions of solidarity taken every day worldwide by the Group’s sites, subsidiaries and Fondation d’entreprise. The Total Foundation program is driven mainly by Fondation d’entreprise Total in France, whose accreditation was renewed at the end of 2017 for the five years from 2018 to 2022, with a budget of €125 million.
Through this program, the Group and the Fondation d’entreprise Total want to contribute to the development of the territories where the Group is present, alongside their partners. With a clear focus on young people, the program concentrates on four themes: road safety, forests and climate, youth inclusion and education, and cultural dialogue and heritage.
In 2018, the Group’s citizenship initiatives were gradually brought into line with these themes:
-Road safety: safer mobility by educating youth under the age of 25, training and raising the awareness of specific populations and supporting and encouraging the authorities to implement road safety policies.
For example, in 2018, the Fondation d’entreprise Total teamed up with the Michelin Company Foundation to launch the VIA road safety education program. With its innovative and interactive methodology, this program aims to raise awareness amongst 10 to 18-year-olds by inviting them to propose ways of identifying
(1) Fuel additive intended for road transport and designed to lower nitrogen oxide (NOX) compound emissions.
risks and changing behaviors. The program kicked off with three pilots in France, Cameroon and India. The Fondation d’entreprise Total is also a founding member of the United Nations Road Safety Trust Fund that aims to contribute to the achievement of target 3.6 of the United Nations SDGs: to halve the number of global deaths and injuries from road traffic accidents.
-Forests and climate: an environment more beneficial to humans through the natural storage of carbon by conserving and restoring forests, mangroves, wetlands and degraded soils, by improving biodiversity and the quality of life of local communities through the conservation and restoration of sensitive ecosystems, by raising awareness and training, especially young people, in environmental conservation.
For example, in 2018, three new partnerships were launched to conserve and protect sensitive ecosystems in France: one with the French State forestry agency ONF, to conserve France’s State-owned forests and protect them against natural risks, one with the agency for the protection of the coastline, to look for natural solutions to the effects of climate change on the coastline, and one with the Port-Cros national park, to restore Mediterranean forests destroyed by fires and manage fire-related risks. The Fondation d’entreprise Total also plans to become involved in a junior tranche of the Land Degradation Neutrality Fund, the world’s leading fund tasked with restoring soil or reducing soil degradation on a large scale. This fund was created in 2017 under the terms of the United Nations Convention to Combat Desertification (UNCCD) and Mirova, the Natixis management company dedicated to responsible investment.
-Youth education and inclusion: empowering socially at-risk young people, through actions in support of academic success and personal development, the development of training and professional integration programs, in particular in industry, and support for entrepreneurship.
For example, in 2018, to contribute to the empowerment of socially fragile young people and their professional integration, in France, the Fondation d’entreprise Total supported the development of Les Ecoles de production that enable young people to learn a trade using the "learning by doing" teaching method. It is supporting the United Way-l’Alliance’s "Défi Jeunesse" program that aims to create the conditions conducive to a professional future chosen for young people from priority districts. It is also pursuing its involvement with "Sport dans la Ville", whose "Job dans la Ville" project supports the training and professional integration of young people. Additionally, the Fondation d’entreprise Total continues to support "La Fondation La France s’engage", which allows for the development of innovative projects in the social and inclusive economy.
-Cultural dialogue and heritage: for cultural openness and the promotion of heritage through actions to conserve and hand over architectural and cultural heritage, to support contemporary creation by young people and access to culture and artistic and cultural education.
For example, in 2018, the Fondation d’entreprise Total renewed its three-year agreement with the Fondation du patrimoine to fund works to restore heritage that encourage the socio-professional integration of young people and local vitality. It also supports numerous initiatives in favor of artistic and cultural education that attempt to combat the mechanisms of social reproduction and to broaden the opportunities of the participants, including the Paris National Opera’s "Dix Mois d’École et d’Opéra" program and the Paris Philharmonic Orchestra’s "Démos" program. Additionally, it works to enhance the appeal of the areas where it is present and to promote contemporary creation in the regions, by supporting events such as Marseille Provence 2018.
5.9.3.2 The employee volunteering program
Since the end of 2018, the Group has launched Action!, the Group’s Employee Volunteering Program, through which TOTAL gives its employees the time and means to get involved and contribute to the development of the areas where the Group is present. It thus gives employees, on a voluntary basis, the possibility to support, up to three days per year during their working time, or outside of it, local solidarity projects within the scope of the Total Foundation Program.
5.10 Contractors and suppliers

TOTAL’s activities generate hundreds of thousands of direct and indirect jobs worldwide. Present in more than 130 countries, the Group currently works with a network of more than 100,000 suppliers of goods and services worldwide. In 2018, the Group’s purchases of goods and services (excluding petroleum products and vessel chartering by Trading & Shipping) represented approximately $29 billion (1) worldwide. The allocation of expenditures on the Group level is approximately 32% for goods (products, materials, etc.) and approximately 68% for services (in particular consulting services, work with supply of materials, transport, etc.).
Through their activities, the Group’s subcontractors and suppliers may face the same risks that the Group encounters in its own activities notably in terms of social, environmental, societal and corruption-related risks. The most prominent risks relate mainly to human rights in the workplace (forced labor and child labor, discrimination, fair and equitable working conditions and safety), health, security and safety, corruption, conflicts of interest, fraud and the environment. |
(1) $25 billion excluding Hutchinson, SunPower and Saft Group.
TOTAL’s success as a responsible company is played out all along its value chain, and the Group is convinced of the importance of working with suppliers that respect human rights and take care of their employees. The Group expects its suppliers to adhere to principles equivalent to those in its own Code of Conduct, as set out in the Fundamental Principles of Purchasing directive. To this end, the Group wanted the management of its supplier relations to be coordinated by the dedicated cross-functional "Total Global Procurement" entity, which is tasked, in particular, with delivering Purchasing services and assisting the Group’s entities and sites, mainly in Exploration & Production, Refining & Petrochemicals, Marketing & Services and Gas, Renewables & Power. This approach is complemented by employee training programs and actions to raise awareness amongst the Group’s partners, customers and suppliers. Its success is also based on TOTAL’s involvement in international initiatives or collaborative approaches specific to the energy sector that promote the emergence of good practices.
5.10.1 The Group’s responsible procurement policy

The Group ensures that contractual conditions are negotiated in an equitable manner with its suppliers. The Code of Conduct restates this requirement and the three essential principles that guide TOTAL’s relations with its suppliers: dialogue, professionalism and the fulfillment of commitments.
These principles are also set forth in the Fundamental Principles of Purchasing, launched in 2010, that specify the commitments that TOTAL expects its employees and suppliers to adhere to in the following areas: respect for human rights at work, the protection of health, safety and security, preservation of the environment, prevention of corruption, and conflicts of interest and the fight against fraud, respect for competition law, as well as the promotion of economic and social development. These principles were drawn up in keeping with the fundamental principles defined in particular in the United Nations Universal Declaration of Human Rights, the conventions of the International Labor Organization, the United Nations Global Compact and the OECD Guidelines for Multinational Enterprises.
Furthermore, a Sustainable Procurement road map defines TOTAL’s guidelines in this area. A Sustainable Procurement Committee regularly brings together the Management Committee of Total Global Procurement and the Civil Society Engagement (including the Human Rights Department), HSE and Legal divisions as well as the Ethics Committee. It is tasked with monitoring the implementation of the Group’s Sustainable Procurement road map.
Employee awareness-raising actions and training
TOTAL has set up a number of channels of communication to raise employee awareness of the risks and issues related to its supply chain. Training modules explaining the Group’s ethical commitments and the Fundamental Principles of Purchasing have been developed for and made available to Group procurement representatives. In 2018, 196 procurement representatives were trained on respect of human rights and working conditions by suppliers, and 250 on anti-corruption rules.
The Group provides its procurement representatives with supporting materials, such as the "Sustainable Purchasing Awareness Cards" that recap human rights at work and identify the purchaser practices that must alert them. A set of communication tools intended to help procurement representatives to enter discussions on the Fundamental Principles of Purchasing was also distributed within Total Global Procurement. The materials used in the annual performance review have been revised to include a section on human rights.
In June 2018, the International Procurement Days brought together the 170 procurement representatives present in 41 countries. The Fundamental Principles of Purchasing were distributed during the event and the internal supplier qualification and audit processes were presented.
With respect to the development of good practices in business relations, TOTAL also launched an initiative to raise its employees’ awareness of mediation as an alternative method for resolving disputes. Since 2013, a training day run by professional mediators to raise awareness of mediation has been organized in French and English. In 2017, an open day for employees of the Group, lawyers and suppliers, enabled participants to learn about the benefits of mediation. A brochure designed to increase awareness of the mediation process is available to all Group employees. In addition, an email address is available on the Group website (under "Suppliers"). The Group’s suppliers can contact the internal supplier mediator using a generic email address (mediation.fournisseurs@total.com). The internal mediator is tasked with facilitating relations between the Group and its French and international suppliers. The general purchasing terms and conditions also mention the possibility of recourseto mediation.
5.10.2 Extension of the Group’s policy to the supply chain

TOTAL expects its suppliers to:
-adhere to the Fundamental Principles of Purchasing and ensure that they are adhered to in their activities,
-accept to be audited according to these principles,
-remain attentive to the everyday working conditions of their employees and their suppliers’ employees,
-ensure that their own suppliers and subcontractors adhere to these Fundamental Principles of Purchasing,
-refer to the Group Ethics Committee when in doubt or in the event of any malfunction.
The rules set out in these Principles must be included or transposed into the agreements concluded with suppliers. To this end, these Principles are available for consultation by all suppliers in both French and English on TOTAL’s website (under "Suppliers").
The supplier qualification process
The supplier qualification process was harmonized at Group level in 2017 by Total Global Procurement. A new internal framework was published in 2018. A new computerized qualification tool will gradually be rolled out starting in 2019, with a planned scope of 107 countries thus far.
It will be used to automate and document the supplier qualification process, which unfolds in four stages:
1. confirmation of interest;
2. a risk pre-analysis to decide whether an in-depth analysis of each criterion is necessary (HSE, anti-corruption, societal, financial, technical);
3. determination of the qualification status;
4. monitoring and renewal of qualification. Qualifications are valid for three years.
The supplier assessment process
Simultaneously, the Group has set up a supplier assessment process to identify and prevent risks of severe impacts on human rights and fundamental freedoms, human health and safety. Thus, since 2016, the Group started conducting campaigns to audit working conditions amongst its suppliers. These audits are conducted by a specialized service provider, with which TOTAL signed a framework contract in 2016.
Since 2017, the Group has been rolling-out specific training for Group purchasers to evaluate suppliers with respect to human rights.
Moreover, in September 2018, TOTAL, BP, Equinor and Shell announced their intention to develop a common collaborative approach to assess the respect of human rights by their suppliers. The partner companies are convinced of the importance of working with suppliers that respect human rights, on the one hand, and take good care of their employees, on the other. The goal of this common approach is to encourage the improvement of working conditions in the supply chain of the companies involved. This initiative addresses the United Nations SDG N° 8: "to promote sustained, inclusive and sustainable economic growth, full and productive employment and decent work for all".
Supplier awareness-raising actions
The deployment of the anti-corruption policy in purchasing continued in 2017 with awareness-raising sessions for strategic suppliers at the Suppliers Day. This event gathered more than 100 suppliers that are considered to be strategic in view of their contribution to Group operations. In addition to numerous initiatives taken in previous years, in 2018 approximately 229 suppliers underwent an anti-corruption analysis through the issuing of specific questionnaires, completed, in some cases, by external inspections.
Every year, one of the departments of the IPO (TOTAL IPO in Shanghai, China) organizes a compliance day and invites one of its approved suppliers. It can explain the actions it takes regarding anti-corruption compliance, the concrete problems encountered and how it deals with them. The discussions, based on case studies and topical issues, are enlightening for all. In 2018, this event was held in December (refer also to point 5.8.1 of this chapter).
Finally, pursuant to Rule 13p-1 of the Securities Exchange Act of 1934, as amended, which implemented certain provisions of the Dodd-Frank Wall Street Reform and Consumer Protection Act of 2010, TOTAL has submitted since 2014 to the SEC an annual document relating to "conflict minerals" (1) sourced from the Democratic Republic of the Congo or an adjoining country. The document indicates whether, during the preceding calendar year, any such minerals were necessary to the functionality or production of a product manufactured (or contracted to be manufactured) by the TOTAL S.A. or one of its affiliates had. The main objective of the rule’s obligation to publish this information is to prevent the direct or indirect funding of armed groups in central Africa. For more information, refer to TOTAL’s most recent publication available at: sustainable-performance.total.com or www.sec.gov.
5.10.3 The Group’s responsible procurement commitments

Since 2010, TOTAL is a signatory to the French Economy and Finances Ministry’s Sustainable Supplier Relations Charter, which aims to allow more sustainable and balanced relations between customers and suppliers.
Worldwide, a CSR global agreement monitoring Committee (known as the "FAIR Committee") meets every year in the presence of representatives who are members of trade unions affiliated with the IndustriALL Global Union and appointed by this federation to monitor and implement the agreement. It identifies good practice and areas for improvement. In application of the areas for improvement defined by this Committee, the programs mentioned earlier have already been set up: Suppliers Day, International Procurement Day and trainings in human rights for purchasers.
Since 2018, TOTAL has been a member of the United Nations Global Compact platform on Decent Work in Global Supply Chains, and, in this capacity, takes part in various workshops that aim to help the member companies of the Global Compact to make progress in this area. In December 2018, the Group committed to pursuing its efforts in terms of decent work and respecting human rights in its supply chain by signing the "Six Commitments" of the United Nations Global Compact.
The Group’s buyers also take part in international working groups on responsible procurement. TOTAL is an active member of IPIECA’s Supply Chain Working Group. Building on the workshops held since 2015, TOTAL continued to participate in the Operationalization of the UN Guiding Principles work organized by the IPIECA, aimed at both oil and gas companies and engineering, procurement and construction (EPC) contractors.
Finally, the Group pays special attention to the disabled and protected employment sectors. In France, the Group’s purchases from this sector enabled the achievement of an indirect employment rate of nearly 1% in 2018. TOTAL is a member of the Pas@Pas association and provides its buyers with an online directory that can be used to identify potential suppliers and service providers (disabled or protected employment sectors) by geographical area and by category (refer to poin 5.3.5.3 in this chapter).
(1) Rule 13p-1 defines "conflict minerals" as follows (irrespective of their geographical origin): columbite-tantalite (coltan), cassiterite, gold, wolframite as well as their derivatives, which are limited to tantalum, tin and tungsten.
5.10.4 Payment terms

The payment terms for invoices from suppliers and customers of TOTAL S.A. as of December 31, 2018, in application of the provisions of Article D. 441-4 of the French Commercial Code, are as follows:
As of December 31, 2018 (in M€) | SUPPLIERS Invoices received and outstanding at the closing date of the previous fiscal year | CUSTOMERS Invoices issued and outstanding at the closing date of the previous fiscal year | ||||||||||
0 days (provisional) | 1 to 30 days | 31 to 60 days | 61 to 90 days | 91 days or more | Total (1 day and more) | 0 days (provisional) | 1 to 30 days | 31 to 60 days | 61 to 90 days | 91 days or more | Total (1 day and more) | |
(A) Late payment brackets | ||||||||||||
Number of invoices affected | 3,847 | 1,737 | 189 | 12,253 | ||||||||
Total value of invoices affected (including tax) | 191 | 0 | 0 | 0 | 8 | 8 | 148 | 24 | 224 | 66 | 166 | 480 |
Percentage of the total value of purchases for the fiscal year (including tax) | 0.1% | |||||||||||
Percentage of sales for the fiscal year (including tax) | 8.1% | |||||||||||
(B) Invoices excluded from (A) relating to disputed or unrecorded liabilities and receivables | ||||||||||||
Number of invoices excluded | None | None | ||||||||||
Total value of invoices excluded | None | None | ||||||||||
(C) Reference payment terms used (contractual or legal - Article L. 441-6 or Article L. 443-1 of the French Commercial Code) | ||||||||||||
Payment terms used for late payment penalties | Legal payment terms | Legal payment terms | ||||||||||
5.11 Reporting scopes and method
5.11.1 Frameworks
The Group’s reporting is based:
-for social indicators, on a practical handbook titled "Corporate Social Reporting Protocol and Method";
-for safety indicators, on the Corporate Guidance on Event and Statistical Reporting;
-for environmental indicators, on a Group reporting procedure, together with segment-specific instructions.
These documents are available to all companies of the Group and can be consulted at Corporate headquarters, in the relevant departments.
5.11.2 Scopes
Social reporting is based on two surveys: the Global Workforce Analysis, and the complementary Worldwide Human Resources Survey. Two centralized tools (Sogreat and HR4U) facilitate performance of the above surveys.
-The Global Workforce Analysis is conducted once a year, on December 31, in all the controlled consolidated Group companies (refer to Note 18 of the Consolidated Financial Statements, chapter 8, point 8.7) having employees, i.e., 326 companies in 103 countries on December 31, 2018. This survey mainly covers worldwide workforces, hiring under permanent and fixed-term contracts (non-French equivalents of contrats à durée déterminée or indéterminée) as well as employee turnover at the worldwide level. This survey produces a breakdown of the workforce by gender, professional category (managers and other employees and non-French equivalents), age and nationality.
-The Worldwide Human Resources Survey (WHRS) is an annual survey which comprises 211 indicators in addition to those used in the Global Workforce Analysis. The indicators are selected in cooperation with the relevant counterparties and cover major components of the Group Human Resources policy, such as mobility, career management, training, work conditions, social dialogue, Code of Conduct deployment, human rights, health, compensation, retirement benefits and insurance. The survey covers a representative sample of the consolidated scope. The data published in this document are extracted from the most recent survey, carried out in December 2018 and January 2019; 128 companies in 54 countries, of which three new countries Sweden, Israel and Denmark, representing 89.5% of the consolidated Group workforce (93,473 employees) replied to the survey.
Reporting on environmental indicators or indicators related to climate change covers all activities, sites and industrial assets in which TOTAL S.A., or one of the companies it controls, is the operator, i.e., either operates or contractually manages the operations ("operated domain"). Compared to the scope of consolidation, this corresponds to fully consolidated companies, with some exceptions, as well as a number of non-fully consolidated entities (1) (2).
Greenhouse gas (GHG) emissions "based on the Group’s equity interest" are the only data which are published for the "equity interest" scope. This scope, which is different from the "operated domain", includes all the assets in which the consolidated entities have a financial interest or rights to production.
The list of environmental indicators or indicators related to climate change on which an entity must report is drawn up on the basis of the materiality thresholds for 2018. These thresholds were calibrated in order to report 99% of greenhouse gas emissions and 95% of the Group’s other emissions observed in 2017. Furthermore, no site accounting for more than 2% of an indicator excludes this indicator from their reports.
Safety reporting covers all employees of activities, working on sites and industrial assets for which TOTAL S.A. or a controlled company is the operator, i.e., either operates or contractually manages the operations ("operated domain"), as well as employees of contractors working there, and employees of transport companies under long-term contracts. Compared to the scope of consolidation, this corresponds to fully consolidated companies, with some exceptions, as well as a number of non-fully consolidated entities (1) (3).
Each site submits its safety reporting to the relevant operational entity. The data is then consolidated at the business level and every month at the Group level. In 2018, the Group safety reporting scope covered 456 million hours worked, equivalent to approximately 250,000 people.
Reporting on Voluntary Principles on Security and Human Rights (VPSHR) covers the Group entities and subsidiaries that are particularly exposed to the disproportionate use of force. It is based on an internal survey, whose results are consolidated by the Security division. In 2018, the VPSHR report covered approximately 100 entities.
In terms of safety, environmental and societal matters in the non-operated domain, Group entities and subsidiaries holding an interest in assets, activities or sites that they do not operate are expected to promote the requirements of the Group’s framework and to encourage the operator to adopt similar requirements.
Consolidation method
For the scopes defined above, the safety and social indicators are fully consolidated.
Regarding environmental indicators or indicators related to climate change, the materiality thresholds mentioned in point 5.11.2 allow for the consolidation of 99% of greenhouse gas emissions and 95% of other emissions from the Group’s operated domain, observed for fiscal year 2017. These thresholds are also applied to greenhouse gas emissions published on an equity interest basis, i.e., by consolidating the Group share of the emissions of all assets in which the Group has a financial interest or rights to production.
Changes in scope
Social indicators are calculated on the basis of the consolidated scope of the Group as of December 31, 2018. These social data are presented on the basis of the operational business segments identified in the 2018 Consolidated Financial Statements.
Regarding safety indicators and environmental indicators of point 5.5.2 of this chapter, acquisitions are taken into consideration as soon as possible, and at the latest on January 1 of the following year. The following main affiliates or activities, acquired in 2018, are not included in this reporting this year, but will be in 2019: Direct Énergie (with the exception of combined cycle gas power plants which have been integrated this year), Global LNG, new networks of service stations of Brazil and Mexico M&S affiliates. All facilities sold are taken into consideration up to the date of the sale.
For environmental indicators and indicators related to climate change (excluding indicators of point 5.5.2), acquisitions are taken into account as of January 1 of the current year to the extent possible or as of the next fiscal year. The following main affiliates or activities, acquired in 2018, are not included in the reporting of environmental or climate change indicators this year, but will be in 2019: Direct Énergie (with the exception of combined cycle gas power plants which have been integrated since this year), Global LNG, a new blending activity of the M&S affiliate Total Vostock, new networks of service stations of the M&S affiliates in Brazil and Mexico. Any facility sold before December 31 is excluded from the Group’s reporting scope for the current year.
5.11.3 Adopted principles
Indicator selection and relevance
The data published in the Registration Document are intended to inform stakeholders about the Group’s annual results in social and environmental responsibility. The environmental indicators include Group performance indicators referring to the IPIECA reporting guidelines, updated in 2015.
Methodological specificities
The methodology may be adjusted to in particular due to the diversity of TOTAL’s activities, the integration of newly acquired entities, lack of regulations or standardized international definitions, practical procedures for collecting data, or changes in methods.
Restatement of previous years’ published data, unless there is a specific statement, is now limited to changes of methodology.
Consolidation and internal control
The social, environmental, climate change-related and industrial safety data are consolidated and checked by each business unit and business segment, before being checked at Group level. Data pertaining to certain specific indicators are calculated directly by the business segments. These processes undergo regular internal audits.
[REDACTED SECTION: CERTAIN TEXT HAS BEEN REDACTED.]
(1) The reporting scope of safety, environmental and climate change indicators also includes the activities of nearly 200 controlled but not consolidated companies. It does not include Basf Total Petrochemicals LLC.
(2) The scope of the reporting of environmental or climate change related indicators also includes the Khuff and Nasr fields (United Arab Emirates) for which the Group is operator without having the right to production, but does not integrate Naphtachimie (Lavéra site), Appryl (Lavera site), fully consolidated. In addition, environmental or climate change indicators have been recalculated over the 2016-2018 period, to include data from the Zeeland refinery reintegrated into the operated domaine.
(3) The reporting scope of the safety indicators also includes sites not operated by the Group of non-fully consolidated companies: Hanwha Total Petrochemical co. Limited (Daesan and Dongguan Sites), Bayport Polymers LLC.
5.11.4 Details of certain indicators
Social definitions and indicators
Outside of France, "management staff" refers to any employee whose job level is the equivalent of 300 or more Hay points. Permanent contracts correspond to contrats à durée indéterminée (CDI) and fixed-term contracts to contrats à durée déterminée (CDD), according to the terminology used in the Group’s social reporting.
Employees present: employees present are employees on the payroll of the consolidated scope, less employees who are not present, i.e., persons who are under suspended contract (sabbatical, business development leave, etc.), absent on long-term sick leave (more than six months), assigned to a company outside the Group, etc.
Safety definitions and indicators
TRIR (Total Recordable Injury Rate): number of recorded injuries per million hours worked.
LTIR (Lost Time Injury Rate): number of lost time injuries per million hours worked.
SIR (Severity Injury Rate): average number of days lost per lost time injury.
Employees of external contractors: any employee of a contractor working at a Group-operated site or assigned by a transport company under a long-term contract.
Tier 1 and Tier 2: indicator of the number of loss of primary containment events, with more or less significant consequences, as defined by the API 754 (for downstream) and IOGP 456 (for upstream) standards.
Near miss: event which, under slightly different circumstances, could have resulted in an accident. The term "potential severity" is used for near misses.
Incidents and near misses are assessed in terms of actual or potential severity based on a scale that consists of six levels. Events with an actual or potential severity level of four or more are considered serious.
Environmental or climate change-related definitions and indicators
Non-routine flaring: flaring other than routine flaring and safety flaring occurring primarily during occasional and intermittent events.
Routine flaring: flaring during normal production operations conducted in the absence of sufficient facilities or adequate geological conditions permitting the reinjection, on-site utilization or commercialization of produced gas (as defined by the working group of the Global Gas Flaring Reduction program within the framework of the World Bank’s Zero Routine Flaring initiative). Routine flaring does not include safety flaring.
Safety flaring: flaring to ensure the safe performance of operations conducted at the production site (emergency shutdown, safety-related operations etc.).
Waste: the contaminated soil excavated and removed from active sites to be treated externally is counted a waste. Drilling debris, mining cuttings or soil polluted in inactive sites are not counted as waste.
Hydrocarbon spills: spills with a volume greater than 1 barrel (≈159 liters) are counted. These are accidental spills of which at least part of the volume spilled reaches the natural environment (including non-waterproof ground). Spills resulting from sabotage or malicious acts are included, unless specified otherwise. Spills that do not affect the environment are excluded.
Fresh water: water with salinity below 1.5 g/l.
GEEI (Group Energy Efficiency Index): a combination of energy intensity ratios (ratio of net primary energy consumption to the level of activity) per business reduced to base 100 in 2010 and consolidated with a weighting by each business’s net primary energy consumption for Exploration & Production and Refining & Chemicals segments (Hutchinson excluded).
GHG: the six gases of the Kyoto protocol, which are CO2, CH4, N2O, HFCs, PFCs and SF6, with their respective GWP (Global Warming Potential) as described in the 2007 IPCC report. HFCs, PFCs and SF6 are almost absent from the Group’s emissions or are considered as non-material, and are therefore no longer counted in 2018.
GHG based on the Group’s equity interest: GHGs emitted by the Group’s operated assets and non-operated assets in which the Group holds an equity share. In both cases, emissions are reported to that equity. Assets with GHG emissions of less than 40 ktCO2e/y on an equity basis are excluded. For non-operated assets, TOTAL relies on information provided by its partner operators. In cases where this information is not available, estimates are made based on past data, budget data or by pro rata with similar assets.
GHG scope 1 emissions: direct GHG emissions from sources located within the boundaries of a site coming under the operated domain or in which TOTAL holds a financial interest.
GHG scope 2 emissions: indirect emissions attributable to brought-in energy (electricity, heat, steam), excluding purchased industrial gases (H2).
GHG scope 3 emissions: other indirect emissions. The Group follows the oil & gas industry reporting guidelines published by IPIECA and which conform to the GHG Protocol methodologies. In this Registration Document, only item 11 of Scope 3 (use of sold products), which is the most significant, is reported. Emissions for this item are calculated based on sales of finished products for which the next stage is end use, in other words, combustion of the products to obtain energy. A stoichiometric emission factor is applied to these sales (oxidation of molecules to carbon dioxide) to obtain an emission volume.
Carbon intensity: This indicator measures the average GHG emissions of these products, from production in TOTAL facilities to end use by customers. This indicator takes into account:
-for the numerator:
-the emissions connected to the production and conversion of energy products used by the customers on the basis of the Group’s average emission rates,
-the emissions connected to the use of sold products. For each product, stoichiometric emission factors (1) are applied to these sales to obtain an emission volume. Non-fuel use products (bitumen, lubricants, plastics, etc.) are not taken into account,
-negative emissions stored thanks to CCUS and natural carbon sinks;
-for the denominator: the quantity of energy sold, knowing that electricity is placed on an equal footing with fossil fuels by taking into account the average capacity factor and average efficiency ratio.
Operated oil & gas facilities: Facilities operated in the Exploration & Production, Refining & Chemicals and Marketing & Services segments of the Group.
(1) The emission factors used are taken from a technical note from the CDP: Guidance methodology for estimation of scope 3 category 11 emissions for oil and gas companies.
Oil spill preparedness:
-an oil spill scenario is deemed "important" as soon as its consequences are on a small scale and with limited impacts on the environment (orders of magnitude of several hundred meters of shores impacted, and several tons of hydrocarbons);
-an oil spill preparedness plan is deemed operational if it describes the alert mechanisms, if it is based on pollution scenarios that stem from risk analyses and if it describes mitigation strategies that are adapted to each scenario, if it defines the technical and organizational means, internal and external, to be implemented and, lastly, if it mentions elements to be taken into account to implement a follow-up of the environmental impacts of the pollution; and
-oil spill preparedness exercise: only exercises conducted on the basis of one of the scenarios identified in the oil spill preparedness plan and which are played out until the stage of equipment deployment are included for this indicator.
[REDACTED SECTION: CERTAIN TEXT HAS BEEN REDACTED.]
6
TOTAL AND ITS SHAREHOLDERS
6.1 Listing details
6.1.1 Listing
Stock exchanges and markets
-Paris (Euronext Paris);
-Brussels (Euronext Brussels);
-London (London Stock Exchange); and
-New York (New York Stock Exchange).
Codes
ISIN | FR0000120271 |
Reuters | TOTF.PA |
Bloomberg | FP FP |
Mnemonic/Ticker | FP |
Inclusion and weighting in the main stock indices as of December 31, 2018
Indice | Weighting in the index | Ranking in the index |
CAC 40 | 11.1% | 1st |
Euro Stoxx 50 | 5.7% | 1st |
Stoxx Europe 50 | 3.7% | 5th |
DJ Global Titans | 1.3% | 31st |
Sources: Euronext, Stoxx and Bloomberg.
Inclusion in the ESG (Environment, Social, Governance) indices
DJSI World, DJSI Europe, FTSE4Good and Nasdaq Global Sustainability.
Market capitalization as of December 31, 2018 (1)
Market | Market capitalization | Closing price |
Euronext | €121.9 B | €46.18 |
NYSE | $137.8 B | $52.18 |
Market capitalization on Euronext Paris and in the Euro zone as of December 31, 2018
TOTAL S.A. is the second-largest capitalization on the Euronext Paris regulated market and is the third-largest market capitalization among the companies that make up the Euro Stoxx 50. The largest market capitalizations in the Euro zone are:
As of December 31, 2018 (a) (€B) |
|
Unilever NV | 134.7 |
LVMH | 130.4 |
TOTAL S.A. (b) | 121.9 |
AB InBev | 116.5 |
L’Oréal | 112.7 |
SAP SE | 106.8 |
(a) Source: Bloomberg for the market capitalizations in the Euro zone other than TOTAL S.A.
(b) Based on a share capital divided into 2,640,602,007 shares as of December 31, 2018 and on TOTAL closing share price on Euronext Paris (€46.18) at the same date.
Percentage of free float
As of December 31, 2018, the free float factor determined by Euronext Paris for calculating TOTAL S.A.’s weight in the CAC 40 was 95%. The free float factor determined by Stoxx for calculating TOTAL’s weight in the Euro Stoxx 50 was 100% (2).
Par value
€2.50.
[REDACTED SECTION: CERTAIN TEXT HAS BEEN REDACTED.]
(1) Based on a share capital divided into 2,640,602,007 shares as of December 31, 2018.
(2) Based on the last quarterly calculation available as of end of November 2018.
6.1.2 Share performance
6.1.2.1 Change in share prices between January 1 and December 31, 2018
The change in TOTAL share price in 2018, compared with that of the share prices of the major oil and gas companies listed in Europe and the United States, is shown in the following tables:
In Europe
(based on closing price in local currency) |
|
TOTAL (euro) | 0.3% |
Royal Dutch Shell A (euro) | -7.7% |
Royal Dutch Shell B (pound sterling) | -6.7% |
BP (pound sterling) | -5.1% |
ENI (euro) | -0.4% |
Source: Bloomberg.
In the United States (American Depositary Receipts prices for European companies)
(closing price in US$) |
|
TOTAL | -5.6% |
ExxonMobil | -18.5% |
Chevron | -13.1% |
Royal Dutch Shell A | -12.7% |
Royal Dutch Shell B | -12.2% |
BP | -9.8% |
ENI | -5.1% |
Source: Bloomberg.
6.1.2.2 Shareholder’s annual total return
€1,000 invested in TOTAL shares by an individual residing in France, assuming that the dividends are reinvested in TOTAL shares, would have generated the following returns as of December 31, 2018 (excluding tax and social withholding):
| Shareholder’s annual total return | Value as of December 31, 2018, of €1,000 invested | ||
Investment term | TOTAL | CAC 40 (b) | TOTAL | CAC 40 |
1 year | 5.44% | -8.14% | 1,054 | 919 |
5 years | 6.30% | 5.24% | 1,357 | 1,291 |
10 years | 7.59% | 7.75% | 2,078 | 2,110 |
15 years | 6.92% (a) | 5.46% | 2,727 | 2,219 |
(a) TOTAL s share prices, used for the calculation of the total return, take into account the adjustment made by Euronext Paris in 2006 following the detachment of Arkema’s share allocation rights.
(b) CAC 40 prices taken into account to calculate the total return include all dividends distributed by the companies that are in the index.
Sources: Euronext Paris, Bloomberg.
6.1.2.3 Market information summary
Share price over the 2014-2018 period (€) | 2014 | 2015 | 2016 | 2017 | 2018 |
Highest (during trading session) | 54.71 | 50.30 | 48.89 | 49.50 | 56.82 |
Lowest (during trading session) | 38.25 | 36.92 | 35.21 | 42.23 | 43.09 |
End of the year (closing) | 42.52 | 41.27 | 48.72 | 46.05 | 46.18 |
Average of the last 30 trading sessions (closing) | 44.32 | 43.57 | 46.22 | 47.00 | 47.96 |
Trading volume (average per session) (a) |
|
|
|
|
|
Euronext Paris | 5,519,597 | 7,412,179 | 6,508,817 | 5,380,909 | 6,199,835 |
NYSE (b) | 1,277,433 | 1,853,669 | 2,109,802 | 1,667,928 | 1,855,274 |
(a) Number of shares traded.
(b) Number of American Depositary Receipts ("ADR").
Sources: Euronext Paris, NYSE.
Change in TOTAL share price on Euronext Paris (2014-2018)

Base 100 as of 01/01/2014. Sources: Euronext Paris, Bloomberg.
Change in TOTAL ADR price on NYSE (2014-2018)
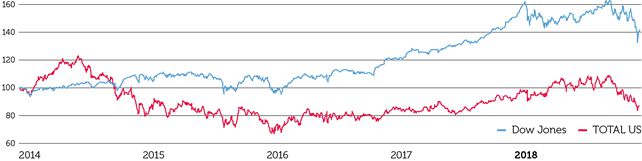
Base 100 as of 01/01/2014. Sources: NYSE, Bloomberg.
Change in TOTAL share price at closing on Euronext Paris (2017-2018) (€)
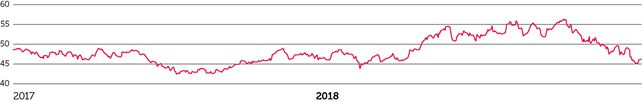
Source: Euronext Paris.
TOTAL average daily volumes traded on Euronext Paris (2017-2018) (in millions of shares)
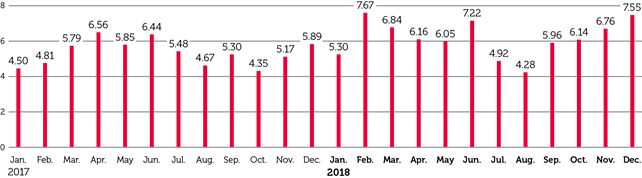
Source: Euronext Paris.
6.1.2.4 Arkema spin-off
Within the framework of the spin-off of Arkema’s chemical activities from the Group’s other chemical activities, TOTAL S.A.’s Annual Shareholders’ Meeting on May 12, 2006, approved TOTAL S.A.’s contribution to Arkema, under the regulation governing spin-offs, of all its interests in the businesses included under Arkema’s scope, as well as the allocation for each TOTAL share (prior to share division by 4) of an allotment right for Arkema shares, with ten allotment rights entitling the holder to one Arkema share. Additionally, since May 18, 2006, Arkema’s shares have been traded on Euronext Paris.
In accordance with the provisions of the notice prior to the sale of unclaimed shares ("Avis préalable à la mise en vente de titres non réclamés") published on August 3, 2006, in the French newspaper Les Échos, Arkema shares corresponding to allotment rights for fractional shares which were unclaimed as of August 3, 2008, were sold on Euronext Paris at an average price of €32.5721 per share. BNP Paribas Securities Services paid an indemnity to the financial intermediaries on remittance of corresponding allotment rights for Arkema shares.
Since March 1, 2019, the unclaimed amounts were transferred to the French Caisse des dépôts et consignations, where the holders are still able to claim them for a period of 20 years. Past this time limit, the amounts will permanently become the property of the French State.
6.2 Dividend
6.2.1 Dividend policy
6.2.1.1 Dividend payment policy
On October 28, 2010, TOTAL S.A.’s Board of Directors adopted a policy based on quarterly dividend payments starting in fiscal year 2011.
The decision of TOTAL S.A.’s subsidiaries to declare dividends is made by their relevant Shareholders’ Meetings and is subject to the provisions of applicable local laws and regulations. As of December 31, 2018, there is no restriction under such provisions that would materially restrict the distribution to TOTAL S.A. of the dividends declared by those subsidiaries.
6.2.1.2 Fiscal year 2018 and 2019 dividends
Dividends for the fiscal year 2018
TOTAL S.A. decided on the distribution and the payment of the following interim dividends with respect to fiscal year 2018:
-on September 19, 2018, the Board of Directors decided on the payment of the first interim dividend for fiscal year 2018 of €0.64 per share and set the issuance price of the new shares likely to be then issued at €52.95 per share, equal to the average Euronext Paris opening price of the shares for the 20 trading days preceding the Board of Directors meeting, reduced by the amount of the interim dividend, without a discount, and rounded up to the nearest cent. The ex-dividend date of this interim dividend was September 25, 2018, and the payment in cash or new shares was made on October 12, 2018;
-on December 12, 2018, the Board of Directors decided on the payment of the second interim dividend for fiscal year 2018 of €0.64 per share and set the issuance price of the new shares likely to be then issued at €48.27 per share, equal to the average Euronext Paris opening price of the shares for the 20 trading days preceding the Board of Directors meeting, reduced by the amount of the second interim dividend, without a discount and rounded up to the nearest cent. The ex-dividend date of this interim dividend was December 18, 2018, and the payment in cash or new shares was made on January 10, 2019.
On March 13, 2019, the Board of Directors decided on the payment of the third interim dividend for fiscal year 2018 of €0.64 per share and set the issuance price of the newly issued shares at €49.30 per share. The ex-dividend date will be March 19, 2019, and this interim dividend will be paid on April 5, 2019 in cash or in new shares of the Company.
In addition, after closing the 2018 statutory accounts, the Board of Directors decided on February 6, 2019, to propose to the Shareholders’ Meeting on May 29, 2019, an annual dividend of €2.56 per share for fiscal year 2018. Subject to the decision of the Shareholders’ Meeting and in light of the first three interim dividends decided by the Board of Directors, the final dividend for the fiscal year 2018 will be €0.64 per share, which is equal to the amount of the three interim dividends for the fiscal year 2018. The ex-dividend date of the final dividend will be June 11, 2019, and the payment date will be June 13, 2019. The Board of Directors also decided on February 6, 2019, to propose to this Meeting that the final 2018 dividend be paid exclusively in cash.
Dividends for the fiscal year 2019
Subject to the applicable legislative and regulatory provisions, as well as the pending approval by the Board of Directors and by the Shareholders’ Meeting to be held on May 29, 2019, the ex-date calendar for the interim dividends and the final dividend for the fiscal year 2019 is expected to be as follows:
| Ex-dividend date |
First interim dividend | September 27, 2019 |
Second interim dividend | January 6, 2020 |
Third interim dividend | March 30, 2020 |
Final dividend | June 29, 2020 |
The provisional ex-dividend dates above relate to the TOTAL shares admitted for trading on Euronext Paris.
Dividends for the last five fiscal years (1)
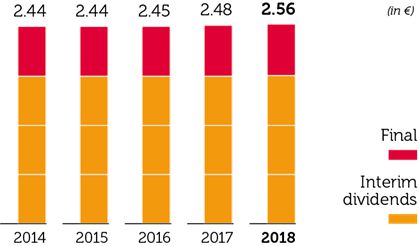
TOTAL’s pay-out ratio for the fiscal year 2018 was 60% (2). Changes in the pay-out ratio (3) over the past five fiscal years are as follows:
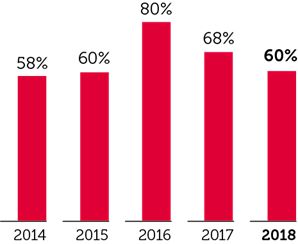
(1) Subject to approval at the Annual Shareholders’ Meeting on May 29, 2019. Since January 1, 2018, dividends received by individuals having their tax residence in France are subject to a 30% flat-rate on gross amount (i.e., 12.8% for income tax and 17.2% for social security contributions). However, with respect to income tax, taxpayers can opt for the taxation of their dividend income at the progressive scale with a 40% rebate.
(2) Based on adjusted fully diluted earnings per share of € 4.27 and a dividend of €2.56 per share pending approval at the Shareholders’ Meeting on May 29, 2019.
(3) Based on adjusted fully diluted earnings for the relevant year.
6.2.1.3 Shareholder return policy over the 2018-2020 period
The Board of Directors met on February 7, 2018 and reviewed the cash flow allocation, including the shareholder return policy, for the 2018-2020 period.
On this occasion, the Board of Directors approved a capital investment program of $15-17 billion per year, set an objective to maintain the net-debt-to-capital ratio (net debt/shareholders’ equity + net debt) below 20% with a grade A credit rating and also proposed the following measures:
1. Increasing the dividend by 10% over the 2018-2020 period
-distribution of the full-year 2017 dividend of €2.48 per share proposed to the Shareholders’ Meeting, corresponding to a final dividend of €0.62 per share and an increase of 1.2% compared to the full-year 2016 dividend (€2.45 per share);
-distribution of the 2018 interim dividends proposed to the Shareholders’ Meeting, increased by 3.2% to €0.64 per share, corresponding to a full-year 2018 dividend of €2.56 per share;
-full-year 2020 dividend target of €2.72 per share.
2. Buying back shares issued with no discount under the scrip dividend option
-maintain the scrip dividend option in response to certain shareholders’ preference, but with no discount on the issue price compared to the market price;
-buy back the shares issued in 2018 in order to cancel them, neutralizing the dilution related to the scrip dividend option;
-immediate buyback of the shares issued in January 2018 as part the scrip dividend option of the second 2017 interim dividend.
3. In addition to the buyback of shares issued as part of the scrip dividend, buyback program of up to $5 billion over the period 2018-2020
-the amount of buyback will be adjusted to the oil price over the period;
-shares bought back in 2018 (excluding shares issued as scrip dividend): 24,721,940, for an amount of $1.5 billion.
The Board of Directors met on February 6, 2019, confirmed the program announced in 2018 and proposed the following measures:
-given the strong financial position of the Group, non-renewal of the scrip dividend option beginning with the payment of the final 2018 dividend;
-distribution of the 2019 interim dividends of €0.66 per share, an increase of 3.1% compared to the 2018 interim dividends, with the intent to propose to the Shareholders’ Meeting a full-year 2019 dividend of €2.64, which will therefore be paid exclusively in cash;
-buyback of all shares issued in 2019 for the payment of the 2018 interim dividends;
-buyback of shares, in a $60/b Brent environment, for an amount of $1.5 billion for 2019 as part of the $5 billion buyback program over the period 2018-2020.
6.2.2 Dividend payment
BNP Paribas Securities Services manages the payment of the dividend, which is made through financial intermediaries using the Euroclear France direct payment system.
JP Morgan Chase Bank N.A. (4 New York Plaza, New York, NY 10005-1401, USA) manages the payment of dividends to holders of TOTAL ADR.
Dividend payment on stock certificates
TOTAL issued stock certificates (certificats représentatifs d’actions, CR Actions) as part of the public exchange offer for Total Petrochemicals & Refining SA/NV (formerly PetroFina) shares.
The CR Actions is a stock certificate provided for by French rules, issued by Euroclear France, intended to circulate exclusively outside of France, and which may not be held by French residents. The CR Actions is freely convertible from a physical certificate into a security registered on a custody account and vice-versa. However, in compliance with the Belgian law of December 14, 2005, on the dematerialization of securities in Belgium, CR Actions may only be issued in the form of a dematerialized certificate since January 1, 2008. In addition, ING Belgique is the bank handling the payment of all coupons detached from outstanding CR Actions.
No fees are applicable to the payment of coupons detached from CR Actions, except for any income or withholding taxes; the payment may be received on request at the following bank branches:
-ING Belgique, avenue Marnix 24, 1000 Brussels, Belgium;
-BNP Paribas Fortis, avenue des Arts 45, 1040 Brussels, Belgium; and
-KBC BANK N.V., avenue du Port 2, 1080 Brussels, Belgium.
6.2.3 Coupons
Fiscal year | Ex-dividend date | Payment date | Date of expiration | Type of coupon | Net amount (€) |
2012 | 09/24/2012 | 09/27/2012 | 09/27/2017 | Interim dividend | 0.57 |
| 12/17/2012 | 12/20/2012 | 12/20/2017 | Interim dividend | 0.59 |
| 03/18/2013 | 03/21/2013 | 03/21/2018 | Interim dividend | 0.59 |
| 06/24/2013 | 06/27/2013 | 06/27/2018 | Final dividend | 0.59 |
2013 | 09/24/2013 | 09/27/2013 | 09/27/2018 | Interim dividend | 0.59 |
| 12/16/2013 | 12/19/2013 | 12/19/2018 | Interim dividend | 0.59 |
| 03/24/2014 | 03/27/2014 | 03/27/2019 | Interim dividend | 0.59 |
| 06/02/2014 | 06/05/2014 | 06/05/2019 | Final dividend | 0.61 |
2014 | 09/23/2014 | 09/26/2014 | 09/26/2019 | Interim dividend | 0.61 |
| 12/15/2014 | 12/17/2014 | 12/17/2019 | Interim dividend | 0.61 |
| 03/23/2015 | 03/25/2015 | 03/25/2020 | Interim dividend | 0.61 |
| 06/08/2015 | 07/01/2015 | 07/01/2020 | Final dividend | 0.61 |
2015 | 09/28/2015 | 10/21/2015 | 10/21/2020 | Interim dividend | 0.61 |
| 12/21/2015 | 01/14/2016 | 01/14/2021 | Interim dividend | 0.61 |
| 03/21/2016 | 04/12/2016 | 04/12/2021 | Interim dividend | 0.61 |
| 06/06/2016 | 06/23/2016 | 06/23/2021 | Final dividend | 0.61 |
2016 | 09/27/2016 | 10/14/2016 | 10/14/2021 | Interim dividend | 0.61 |
| 12/21/2016 | 01/12/2017 | 01/12/2022 | Interim dividend | 0.61 |
| 03/20/2017 | 04/06/2017 | 04/06/2022 | Interim dividend | 0.61 |
| 06/05/2017 | 06/22/2017 | 06/22/2022 | Final dividend | 0.62 |
2017 | 09/25/2017 | 10/12/2017 | 10/12/2022 | Interim dividend | 0.62 |
| 12/19/2017 | 01/11/2018 | 01/11/2023 | Interim dividend | 0.62 |
| 03/19/2018 | 04/09/2018 | 04/09/2023 | Interim dividend | 0.62 |
| 06/11/2018 | 06/28/2018 | 06/28/2023 | Final dividend | 0.62 |
2018 (a) | 09/25/2018 | 10/12/2018 | 10/12/2023 | Interim dividend | 0.64 |
| 12/18/2018 | 01/10/2019 | 01/10/2024 | Interim dividend | 0.64 |
| 03/19/2019 | 04/05/2019 | 04/05/2024 | Interim dividend | 0.64 |
| 06/11/2019 | 06/13/2019 | 06/13/2024 | Final dividend | 0.64 |
(a) A resolution will be submitted to the Annual Shareholders’ Meeting on May 29, 2019, to pay a dividend of €2.56 per share for fiscal year 2018, including a final dividend of €0.64 per share, with an ex-dividend date on June 11, 2019, and a payment date set from June 13, 2019, exclusively in cash.
6.3 Share buybacks
The Annual Shareholders’ Meeting on June 1, 2018, after having considered the report from the Board of Directors, authorized the Board of Directors, with the possibility to sub-delegate such authority under the terms provided for by French law, pursuant to the provisions of Article L. 225-209 of the French Commercial Code, of Regulation (EU) N°596/2014 of April 16, 2014, on market abuse and of the General Regulation (règlement général) of the French Financial Markets Authority (Autorité des marchés financiers, AMF), to buy or sell shares of the Company within the framework of a share buyback program. The maximum purchase price was set at €80 per share and the number of shares acquired may not exceed 10% of the share capital. This authorization was granted for a period of 18 months and replaced the previous authorization granted by the Shareholders’ Meeting on May 26, 2017.
6.3.1 Share buybacks and cancellations in 2018
In 2018, TOTAL S.A. bought back 72,766,481 TOTAL shares on the market, i.e. 2.76% of the share capital as of December 31, 2018.
71,950,977 TOTAL shares were bought back for cancellation, including:
-47,229,037 shares in order to cancel the dilution related to the shares issued for payment (i) of the second and third interim dividends and the final dividend for the fiscal year ended December 31, 2017, as well as (ii) the first interim dividend for the fiscal year ended December 31, 2018; and
-24,721,940 shares for $1.5 billion (1), pursuant to the Board’s decision to buy back shares of the Company up to an amount of $5 billion over the 2018-2020 period.
815,504 TOTAL shares were bought back in order to cover the performance share plans approved by the Board of Directors on July 27, 2016, and July 26, 2017.
Finally, the Board of Directors, at a meeting held on December 12, 2018, decided, following the authorization of the Extraordinary Shareholders’ Meeting on May 26, 2017, to cancel 44,590,699 treasury shares including:
-28,445,840 shares issued, with no discount, in 2018 for payment of the second and third interim dividends, as well as the final dividend, for the fiscal year ended December 31, 2017; and
-16,144,859 shares bought back pursuant to the shareholder return policy, up to an amount of $5 billion over the 2018-2020 period.
Percentage of share capital bought back

6.3.2 Board of Directors’ report on share buybacks and sales
6.3.2.1 Share buybacks during fiscal year 2018
Following the Board of Directors’ decision on February 7, 2018, and pursuant to the authorizations granted by the Ordinary Shareholders’ Meetings of May 26, 2017, and June 1, 2018, the Company bought back 71,950,977 TOTAL shares, i.e. 2.72% of the share capital as of December 31, 2018, in order to cancel them, including:
-47,229,037 shares for a total amount of €2.4 billion, at an average unit price of €50.57, in order to cancel the dilution related to the shares issued for payment (i) of the second and third interim dividends and the final dividend for the fiscal year ended December 31, 2017, as well as (ii) the first interim dividend for the fiscal year ended December 31, 2018; and
-24,721,940 shares for a total amount of €1.2 billion, at an average unit price of €50.45, equivalent to $1.5 billion, at the average exchange rate for 2018, pursuant to the shareholder return policy, up to an amount of $5 billion over the 2018-2020 period.
In addition, also pursuant to the above-mentioned authorizations, in 2018 the Company bought back a total of 815,504 shares for a total amount of €41 million, at an average unit price of €50.31, in order to cover the performance share plans approved by the Board of Directors.
6.3.2.2 Cancellation of Company shares during fiscal years 2016, 2017 and 2018
On December 12, 2018, the Board of Directors, pursuant to the authorization granted by the Extraordinary Shareholders’ Meeting on May 26, 2017, in the thirteenth resolution to reduce, on one or more occasions, the Company’s share capital by canceling shares within the limits permitted by law, in accordance with the provisions of Articles L. 225-209 and L. 225-213 of the French Commercial Code, canceled 44,590,699 TOTAL shares bought back between February 9 and October 11, 2018, in order to cancel them. They represented 1.66% of the share capital on the date of the operation, including:
- 28,445,840 shares in order to cancel any dilution related to the shares issued, with no discount, for the payment of the second
(1) Or €1.2 billion at the average exchange rate for 2018.
and third interim dividends, as well as the final dividend, for the fiscal year ended December 31, 2017; and
-16,144,859 shares pursuant to the shareholder return policy, up to an amount of $5 billion over the 2018-2020 period.
TOTAL S.A. did not cancel any shares in the fiscal year 2017.
As regards fiscal year 2016, following the authorization granted by the Shareholders’ Meeting on May 11, 2012, the Board of Directors, after the purchase by the Company of 100,331,268 treasury shares, canceled the TOTAL shares purchased by the Company under the share buyback program, as authorized by the Shareholders’ Meeting on May 24, 2016.
6.3.2.3 Transfer of shares during fiscal year 2018
4,079,257 TOTAL shares were transferred during fiscal year 2018 following the final award of TOTAL shares under performance share plans.
6.3.2.4 Shares held in the name of the Company and its subsidiaries as of December 31, 2018
As of December 31, 2018, the Company held 32,473,281 shares (treasury shares) representing 1.23% of TOTAL S.A.’s share capital on that same date, including:
-27,360,278 to be canceled; and
-5,113,003 to cover the performance share plans.
In accordance with French law, these shares are deprived of voting rights and do not entitle holders to dividends.
In addition, for shares bought back in order to be allocated to Company or Group employees in line with the objectives referred to in Regulation (EU) No. 596/2014 of the European Parliament and of the Council of April 16, 2014, on market abuse, it should be noted that, when such shares are held to cover share purchase option plans that have expired or performance shares that have not been granted by the end of the vesting period, they may be held under the conditions regarding the holding by the Company of its own shares and used in accordance with the purposes specified for the buyback by the Company of its own shares.
6.3.2.5 Reallocation for other purposes during fiscal year 2018
Treasury shares held by the Company were not, during fiscal year 2018, reallocated for purposes other than those initially planned when they were purchased.
6.3.2.6 Conditions for the buyback and use of derivative products
The Company did not use any derivative products as part of the share buyback programs successively authorized by the Shareholders’ Meetings on May 26, 2017 and June 1, 2018. There was no open purchase or sale position as of December 31, 2018.
Transactions completed by the Company involving its treasury shares from January 1 to December 31, 2018
| Cumulative gross movements | |
Purchases | Sales/Transfers | |
Number of shares | 72,766,481 | 4,079,257 (a) |
Average transactions’ price (b) (€) | 50.52 | - |
Amount of transactions (€) | 3,676,419,886 (c) | - |
(a) Corresponding to final award of TOTAL shares under the performance share plans.
(b) Including brokerage fees (excluding tax).
(c) Including €385,727.53 of brokerage fees (excluding tax).
Treasury shares as of December 31, 2018
Percentage of share capital held by TOTAL S.A. | 1.23% |
Number of shares held in portfolio | 32,473,281(a) |
Nominal value of the portfolio (M€) | 81.2 (b) |
Book value of the portfolio (M€) | 1,589.23 |
Market value of the portfolio (M€) | 1,499.62 (c) |
(a) Including 5,044,817 shares held to cover the performance share plans and 68,186 shares to be awarded under new share purchase option plans or new performance share plans.
(b) Based on a TOTAL share par value of €2.50.
(c) Based on TOTAL closing share price of €46.18 on Euronext Paris on December 31, 2018.
6.3.3 2019-2020 share buyback program
6.3.3.1 Description of the share buyback program under Article 241-1 et seq. of the general regulation of the French Financial Markets Authority
The objectives of the share buyback program are as follows:
-reduce the Company’s capital through the cancellation of shares;
-honor the Company’s obligations related to securities convertible or exchangeable into Company shares;
-honor the Company’s obligations related to stock option programs or other share grants to the Company’s executive directors or to employees of the Company or a Group subsidiary; and
-stimulate the secondary market or the liquidity of the TOTAL share under a liquidity agreement.
6.3.3.2 Legal framework
Implementation of this share buyback program, which is covered by Articles L. 225-209 et seq. of the French Commercial Code, Article 241-1 et seq. of the General Regulation of the AMF) and the provisions of Regulation (EU) N°596/2014 on market abuse, is subject to approval by the TOTAL S.A. Annual Shareholders’ Meeting on May 29, 2019, under the fourth resolution that reads as follows:
"Upon presentation of the report by the Board of Directors and information appearing in the description of the program prepared pursuant to Articles 241-1 et seq. of the General Regulation (règlement général) of the French Financial Markets Authority (Autorité des marchés financiers, AMF), and voting under the conditions of quorum and majority required for Ordinary General Meetings, the shareholders hereby authorize the Board of Directors, with the possibility to sub-delegate such authority under the terms provided for by French law, pursuant to the provisions of Article L. 225-209 of the French Commercial Code and of Regulation (EU) N°596/2014 of April 16, 2014, on market abuse and of the General Regulation of the AMF, to buy or sell shares of the Company within the framework of a share buyback program. The purchase, sale or transfer of such shares may be transacted by any means on regulated markets, multilateral trading facilities or over the counter, including the purchase or sale by block-trades, in accordance with the regulations of the relevant market authorities. Such transactions may include the use of any financial derivative instrument traded on regulated markets, multilateral trading facilities or over the counter, and implementing option strategies. These transactions may be carried out at any time, in accordance with the applicable rules and regulations at the date of the operations under consideration, except during any public offering periods applying to the Company’s share capital. The maximum purchase price is set at €80 per share. In the case of a share capital increase by incorporation of reserves or free share grants and in the case of a stock-split or a reverse-stock-split, this maximum price shall be adjusted by applying the ratio of the number of shares outstanding before the transaction to the number of shares outstanding after the transaction. Pursuant to the provisions of Article L. 225-209 of the French Commercial Code, the maximum number of shares that may be bought back under this authorization may not exceed 10% of the total number of shares composing the capital as of the date on which this authorization is used. This limit of 10% is applicable to the share capital of the Company which may be adjusted from time to time as a result of transactions after the date of the present Meeting. Purchases made by the Company may under no circumstances result in the Company holding more than 10% of the share capital, either directly or indirectly through subsidiaries. As of December 31, 2018, out of the 2,640,602,007 shares outstanding, the Company held 32,473,281 shares directly. Under these circumstances, the maximum number of shares that the Company could buy back is 231,586,919 shares and the maximum amount that the Company may spend to acquire such shares is €18,526,953,520.00 (excluding acquisition fees). The purpose of this share buyback program is to reduce the number of outstanding shares of the Company or to allow it to fulfill its engagements in connection with: -convertible or exchangeable securities that may give holders rights to receive shares of the Company upon conversion or exchange; and/or -share purchase option plans, employee shareholding plans, Company Savings Plans or other share allocation programs for executive directors or employees of the Company or Group companies. The purpose of buybacks may also be the implementation of the market practice accepted by the French Financial Markets Authority (Autorité des marchés financiers), i.e., support the secondary market or the liquidity of TOTAL shares by an investment services provider by means of a liquidity agreement compliant with the deontology charter recognized by the French Financial Markets Authority (Autorité des marchés financiers). This program may also be used by the Company to trade in its own shares, either on or off the market, for any other purpose that is authorized under the applicable law or any other permitted market practice that may be authorized at the date of the operations under consideration. In case of transactions other than the above-mentioned intended purposes, the Company will inform its shareholders in a press release. According to the intended purposes, the treasury shares that are acquired by the Company through this program may, in particular, be: -canceled, up to the maximum legal limit of 10% of the total number of shares composing the capital on the date of the operation, per each 24-month period; -granted for no consideration to the employees and to the executive directors of the Company or of other companies of the Group; -delivered to the beneficiaries of the Company’s shares purchase options having exercised such options; -sold to employees, either directly or through the intermediary of Company savings funds; -delivered to the holders of securities that grant such rights to receive such shares, either through redemption, conversion, exchange, presentation of a warrant or in any other manner; and -used in any other way consistent with the purposes stated in this resolution. While they are bought back and held by the Company, such shares will be deprived of voting rights and dividend rights. This authorization is granted for an 18-month period from the date of this Meeting. It renders ineffective, up to the unused portion, any previous authorization having the same purpose. The Board of Directors is hereby granted full authority, with the right to sub-delegate such authority, to undertake all actions authorized by this resolution." |
6.3.3.3 Conditions
Maximum share capital to be purchased and maximum funds allocated to the transaction
The maximum number of shares that may be purchased under the authorization provided by the Annual Shareholders’ Meeting on June 1, 2018, may not exceed 10% of the total number of shares composing the capital, with this limit applying to an amount of the Company’s share capital that will be adjusted, if necessary, to include transactions affecting the share capital subsequent to this Meeting. Purchases made by the Company may under no circumstances result in the Company holding more than 10% of the share capital, either directly or indirectly through subsidiaries.
Before any share cancellation under the authorization granted by the Annual Shareholders’ Meeting on June 1, 2018, based on the number of shares outstanding as of December 31, 2018 (2,640,602,007 shares), and given the 32,473,281 shares held by the Company as of December 31, 2018, i.e., 1.23% of the share capital, the maximum number of shares that may be purchased would be 231,586,919, representing a theoretical maximum investment of €18,526,953,520 (excluding acquisition fees) based on the maximum purchase price of €80.
Conditions for buybacks
Such shares may be bought back by any means on regulated markets, multilateral trading facilities or over the counter, including through the purchase or sale of blocks of shares, under the conditions authorized by the relevant market authorities. These means include the use of any financial derivative instrument traded on a regulated market or over the counter and the implementation of option strategies, with the Company taking measures, however, to avoid increasing the volatility of its stock. The portion of the program carried out through the purchase of blocks of shares will not be subject to quota allocation, up to the limit set by this resolution. These transactions may be carried out at any time, in accordance with the applicable rules and regulations, except during any public offering periods applying to the Company’s share capital.
Duration and schedule of the share buyback program
In accordance with the fourth resolution, which will be submitted to the Annual Shareholders’ Meeting on May 29, 2019, the share buyback program may be implemented over an 18-month period following the date of this Meeting, i.e. until November 28, 2020.
Transactions carried out under the previous program
Transactions carried out under the previous program are listed in the special report of the Board of Directors on share buybacks (refer to point 6.3.2 of this chapter).
6.4 Shareholders
6.4.1 Major shareholders
6.4.1.1 Changes in major shareholders’ holdings
TOTAL S.A.’s major shareholders (1) as of December 31, 2018, 2017 and 2016 are as follows:
As of December 31 | 2018 | 2017 | 2016 | ||||
% of share capital | % of voting rights | % of theoretical voting rights (a) | % of share capital | % of voting rights | % of share capital | % of voting rights | |
BlackRock, Inc. (b) | 6.1 | 5.3 | 5.2 | 6.3 | 5.5 | 5.6 | 4.9 |
Group employees (c) | 4.8 | 8.4 | 8.3 | 5.0 | 8.8 | 4.8 | 8.6 |
of which FCPE Total Actionnariat France | 3.4 | 6.2 | 6.1 | 3.5 | 6.4 | 3.5 | 6.4 |
Other shareholders | 89.1 | 86.3 | 86.5 | 88.7 | 85.7 | 89.6 | 86.5 |
of which holders of ADRs (d) | 8.1 | 7.7 | 7.6 | 7.9 | 7.4 | 9.1 | 8.6 |
(a) Pursuant to Article 223-11 of the AMF General Regulation, the number of theoretical voting rights is calculated on the basis of all outstanding shares to which voting rights are attached, including treasury shares that are deprived of voting rights.
(b) Information taken from Schedule 13G/A filed by BlackRock, Inc. ("BlackRock") with the SEC on February 22, 2019, in which BlackRock declared a holding of 160,322,277 shares of the Company as of December 31, 2018 (i.e., 6.1% of the Company’s share capital). BlackRock stated that it has the exclusive right to dispose of its holding and of 145,945,842 voting rights (i.e., 5.3% of the Company’s voting rights). In addition, BlackRock stated that it does not have any joint voting rights or joint right to dispose of these shares.
(c) A director representing the employees and a director representing employee shareholders sit on the Board of Directors of TOTAL S.A. On the basis of the definition of employee shareholding set forth in Article L. 225-102 of the French Commercial Code. Amundi, the Holding company of Amundi Asset Management, which in turn manages the Total Actionnariat France collective investment fund (see below), filed a Schedule 13G/A with the SEC on February 21, 2019, declaring a holding of 204,860,269 shares of the Company as of December 31, 2018 (i.e., 7.8% of the Company’s share capital). Amundi stated that it does not have any exclusive voting rights or exclusive right to dispose of these shares and that it has joint voting rights on 45,556,546 of these shares (i.e., 1.6% of the Company’s share capital) and a joint right to dispose of all of these shares.
(d) Including all of the American Depositary Shares represented by ADR admitted to trading on the NYSE.
(1) Major shareholders are defined herein as shareholders whose interest exceeds 5% of the share capital or voting rights.
The percentage of the holdings of the major shareholders as of December 31, 2018 was calculated based on a share capital divided into 2,640,602,007 shares, representing 2,766,134,802 voting rights exercisable at Shareholders’ Meetings, or 2,798,608,083 theoretical voting rights including 32,473,281 voting rights attached to the 32,473,281 TOTAL shares held by TOTAL S.A. that are deprived of voting rights.
For fiscal years 2017 and 2016, the holdings of the major shareholders were calculated on the basis of respectively 2,528,989,616 shares to which 2,678,015,444 voting rights exercisable at Shareholders’ Meetings were attached as of December 31, 2017, and 2,430,365,862 shares to which 2,572,363,626 voting rights exercisable at Shareholders’ Meetings were attached as of December 31, 2016.
6.4.1.2 Holdings above the legal thresholds
In accordance with Article L. 233-13 of the French Commercial Code, to TOTAL’s knowledge, two known shareholders hold 5% or more of TOTAL’s share capital or voting rights at year-end 2018:
-the Total Actionnariat France collective investment fund held, as of December 31, 2018, 3.4% of the share capital representing 6.2% of the voting rights exercisable at Shareholders’ Meetings and 6.1% of the theoretical voting rights;
-BlackRock held, as of December 31, 2018, 6.1% of the share capital representing 5.3% of the voting rights exercisable at Shareholders’ Meetings and 5.2% of the theoretical voting rights.
6.4.1.3 Legal threshold notifications in fiscal year 2018
N° AMF disclosure | Date on which thresholds were crossed | Company | Number of shares | % share capital | % voting rights | Comments | Share capital | Number of voting rights |
218C1989 | 12/12/2018 | JP Morgan Chase & Co. | 138,085,347 | 5.23% | 4.98% | Crossed upward the 5% threshold in the Company’s voting rights | 2,640,602,007 | 2,770,811,788 |
218C2026 | 12/18/2018 | JP Morgan Chase & Co. | 50,231,045 | 1.90% | 1.81% | Crossed downward the 5% threshold in the Company’s voting rights | 2,640,602,007 | 2,770,811,788 |
6.4.1.4 Threshold notifications required by the bylaws
In addition to the legal obligation to inform the Company and the French Financial Markets Authority when the number of shares (or securities similar to shares or voting rights pursuant to Article L. 233-9 of the French Commercial Code) held represents more than 5%, 10%, 15%, 20%, 25%, 30%, one third, 50%, two thirds, 90% or 95% of the share capital or theoretical voting rights, such information being made at the latest on the close of the fourth trading day after the threshold is exceeded (Article L. 233-7 of the French Commercial Code and Article 223-14 of the AMF General Regulation), any individual or legal entity who directly or indirectly comes to hold a percentage of the share capital, voting rights or rights giving future access to the Company’s share capital that is equal to or greater than 1%, or a multiple of this percentage, is required to notify the Company, within 15 days of the date on which each of the above thresholds is exceeded, by registered mail with return receipt requested, and indicate the number of shares held.
In case the shares above these thresholds are not declared, any shares held in excess of the threshold that should have been declared will be deprived of voting rights at Shareholders’ Meetings if, at a Shareholders’ Meeting, the failure to make a declaration is acknowledged and if one or more shareholders holding collectively at least 3% of the Company’s share capital or voting rights so request at that Meeting.
Any individual or legal entity is also required to notify the Company in due form and within the time limits stated above when their direct or indirect holdings fall below each of the aforementioned thresholds.
Notifications must be sent to the Senior Vice President of Investor Relations in London (contact details in point 6.6.6 of this chapter).
6.4.1.5 Temporary transfer of securities
Pursuant to legal provisions, any legal entity or individual (with the exception of those described in paragraph IV-3 of Article L. 233-7 of the French Commercial Code) holding alone or in concert a number of shares representing more than two hundredth of the Company’s voting rights pursuant to one or more temporary transfers or similar operations as described in Article L. 225-126 of the aforementioned Code is required to notify the Company and the AMF of the number of shares temporarily owned no later than the second business day preceding the Shareholders’ Meeting at midnight (Paris time).
Notifications must be e-mailed to the Company at the following address: holding.df-declarationdeparticipation@total.com
If no notification is sent, any shares acquired under any of the above temporary transfer operations will be deprived of voting rights at the relevant Shareholders’ Meeting and at any Shareholders’ Meeting that may be held until such shares are transferred again or returned.
6.4.1.6 Shareholders’ agreements
TOTAL S.A. is not aware of any agreements among its shareholders.
6.4.2 Employee shareholding
Based on the definition of employee shareholding set forth in Article L. 225-102 of the French Commercial Code, the Group’s employees held 126,355,179 TOTAL shares, representing 4.8% of the Company’s share capital and 8.4% of the voting rights as of December 31, 2018. These shares, held directly or indirectly by the Group’s employees as of December 31, 2018, were as follows:
FCPE Total Actionnariat France | 89,235,952 |
FCPE Total Actionnariat International Capitalisation | 26,087,382 |
FCPE Total France Capital + | 5,711,832 |
FCPE Total International Capital | 2,551,062 |
Shares subscribed by employees in the U.S. | 794,587 |
Shares subscribed by employees in Italy and Germany | 466,220 |
TOTAL shares from the exercise of the Company’s stock options and held as registered shares within a Company Savings Plan | 1,508,144 |
TOTAL SHARES HELD BY EMPLOYEES | 126,355,179 |
The management of each of the Collective investment funds (FCPEs) mentioned above is controlled by a dedicated Supervisory Board, two thirds of its members representing holders of fund units and one third representing the Company. The Supervisory Board is responsible for reviewing the Collective investment fund’s management report and annual financial statements, as well as the financial, administrative and accounting management of the fund, exercising voting rights attached to portfolio securities, deciding contributions of securities in case of a public tender offer, deciding mergers, spin-offs or liquidations, and granting its approval prior to changes in the rules and procedures of the Collective investment fund in the conditions provided for by the rules and procedures.
These rules and procedures also stipulate a simple majority vote for decisions, except for decisions requiring a qualified majority vote of two-thirds plus one related to a change in a fund’s rules and procedures, its conversion or disposal.
For employees holding shares outside of the employee collective investment funds mentioned in the table above, voting rights are exercised individually.
The information regarding shares held by the administration and management bodies is set forth in point 4.1.6 of chapter 4.
6.4.3 Shareholding structure
Estimates below are as of December 31, 2018, excluding treasury shares, based on the survey of identifiable holders of bearer shares conducted on that date.
By shareholder type
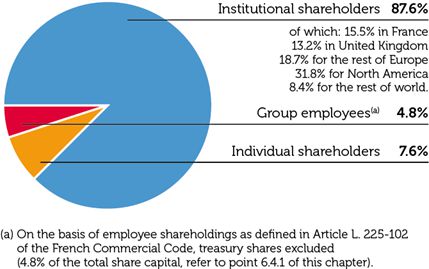
By area

The number of individual and institutional TOTAL shareholders is estimated at approximately 450,000.
6.6 Investor relations
6.6.1 Documents on display
Information and documents regarding TOTAL S.A., its bylaws and the Company’s Statutory and Consolidated Financial Statements for the year ended December 31, 2018, or previous fiscal years, may be consulted at its registered office pursuant to the legal and regulatory provisions in force, as well as on the Company website.
In addition, the French version of TOTAL S.A.’s Registration Documents (including the annual financial reports) and mid-year financial reports filed with the French Financial Markets Authority (Autorité des marchés financiers) for each of the past 10 financial years are available on its website total.com (under Investors/Publications and regulated information). The Group’s biannual presentations of its results and outlook, as well as the quarterly financial information, are also available on its website.
Furthermore, in order to meet its obligations related to the listing of its shares in the United States, the Company also files an annual report on Form 20-F, in English, with the SEC. This report is also available on the Cmpany website.
6.6.2 Relationships with institutional investors, financial analysts and individual shareholders
Members of the Group’s General Management and Investor Relations regularly meet with institutional investors and financial analysts in the leading financial centers throughout the world. In 2018, the Group organized more than 1,000 meetings.
Each year, two main presentations are given to the financial community: one in February following the publication of the results for the previous fiscal year, and one in September to present the Group’s outlook and objectives. A series of meetings is held after each of these presentations. In addition, each year the Chief Financial Officer hosts three conference calls to discuss results for the first, second and third quarters of the year.
The information presented and broadcast at these events is available on the Group’s website.
With a dedicated team, the Group maintains an active dialogue with shareholders in the field of Corporate Social Responsibility (CSR) and governance. Around 100 meetings covering these themes were organized in France and worldwide in 2018.
In addition, the Group has a team dedicated to relationships with individual shareholders. This department, which is ISO 9001 certified, offers a comprehensive communication package, featuring:
-a direct line, e-mail address, and postal address (refer to point 6.6.6 of this chapter);
-documentation and material provided for individual shareholders (e.g., the shareholders’ newsletter, individual shareholders pages available on the Company’s website, and a Total Investors mobile app for digital tablets and smartphones);
-shareholder meetings and investor fairs held in France and worldwide;
-the Shareholders’ Club, which organizes visits to industrial facilities, visits to natural sites and cultural events sponsored by the Total Foundation, and conferences about the Group;
-the Shareholders’ e-Advisory Committee, which expresses its views on the communication service as a whole.
This team also organizes the Annual Shareholders’ Meeting, which was held on June 1, 2018, at the Palais des Congrès in Paris and attended by nearly 3,000 people.
The documentation on relationships with individual shareholders is available on the Company’s website total.com (under Investors/ Individualshareholders).
6.6.3 Registered shareholding
TOTAL shares can be held in bearer form or registered form. In the latter case, shareholders are identified by TOTAL S.A., in its capacity as the issuer, or by its agent, BNP Paribas Securities Services, which is responsible for keeping the register of shareholders’ registered shares.
Registered shares
There are two forms of registration:
-administered registered shares: shares are registered with TOTAL through BNP Paribas Securities Services, but the holder’s financial intermediary continues to administer them (sales, purchases, coupons, etc.);
-pure registered shares: TOTAL holds and directly administers shares on behalf of the holder through BNP Paribas Securities Services (sales, purchases, coupons, Shareholders’ Meeting notices, etc.), so that the shareholder does not need to appoint a financial intermediary.
Main advantages of registered shares
The advantages of registered shares include:
-double voting rights if the shares are held continuously for more than two successive years (refer to point 7.2.4.1 of chapter 7);
-a number for all contacts with BNP Paribas Securities Services (a toll-free call within France from a landline): 0 800 117 000 or +33 1 40 14 80 61 (from outside France); from Monday to Friday (business days), from 8:45 a.m. to 6:00 p.m., GMT+1;
-registration as a recipient of all information published by the Group for its shareholders;
-the ability to join the TOTAL Shareholders’ Club by holding at least 50 shares.
The advantages of pure registered shares, in addition to those of administered registered shares, include:
-no custodial fees;
-easier placement of market orders (1) (phone, mail, fax, internet);
-brokerage fees of 0.20% (before tax) of the gross amount of the trade, with no minimum charge and up to €1,000 per trade;
-the option to view and manage shareholdings online and via the Planetshares app for digital tablets.
To convert TOTAL shares into pure registered shares, shareholders must fill out a form that can be obtained upon request from the Individual Shareholder Relations Department and send it to their financial intermediary.
6.6.4 2019 financial calendar
February 7 | Results of the fourth quarter and full year 2018, and Investors’ Day - London |
March 19 | Ex-dividend date for the 2018 third interim dividend |
April 26 | Results of the first quarter 2019 |
May 29 | 2019 Annual Shareholders’ Meeting in Paris |
June 11 | Ex-dividend date for the 2018 final dividend (a) |
July 25 | Results of the second quarter and first half 2019 |
September 24 | Investors’ Day (outlook and objectives) - New-York |
September 27 | Ex-dividend date for the 2019 first interim dividend (b) |
October 30 | Results of the third quarter and first nine months of 2019 |
(a) Subject to approval at the Annual Shareholders’ Meeting on May 29, 2019.
(b) Subject to the Board of Directors’ decision.
The full calendar including Shareholders’ Meetings and investor fairs is available on the Company’s website total.com (under Investors).
6.6.5 2020 financial calendar
January 6 | Ex-dividend date for the 2019 second interim dividend (a) |
March 30 | Ex-dividend date for the 2019 third interim dividend (a) |
May 29 | 2020 Annual Shareholders’ Meeting in Paris |
June 29 | Ex-dividend date for the 2019 final dividend (b) |
(a) Subject to the Board of Directors’ decision.
(b) Subject to approval at the Annual Shareholders’ Meeting on May 29, 2020.
6.6.6 Contacts
Mr. Brendan Warn, Senior Vice President, Investor Relations TOTAL S.A.
Total Finance Corporate Services
10 Upper Bank Street, Canary Wharf
London E14 5BF, United Kingdom
e-mail: ir@total.com
Phone: +44 (0)207 7197 962
Mr. Robert Hammond, Director of Investor Relations North America
TOTAL American Services Inc.
1201 Louisiana Street, Suite 1800
Houston, TX 77002, United States
e-mail: ir.tx@total.com
Phone: +1 (713) 483-5070
Mr. Laurent Toutain, Head of Individual Shareholder Relations
TOTAL S.A. Individual Shareholder Relations Department
Tour Coupole 2, place Jean Millier
92078 Paris-La Défense Cedex, France
e-mail: actionnaires@total.com
Phone (Monday to Friday from 9 a.m. to 12:30 p.m. and from 1:30 p.m. to 5:30 p.m., GMT+1):
-from France: 0 800 039 039 (toll-free number from a landline);
-from Belgium: 02 288 3309;
-from the United Kingdom: 020 7719 6084;
-from Germany: 30 2027 7700;
-from other countries: +33 1 47 44 24 02.
(1) Provided the subscriber has signed the market service agreement. Signing this agreement is free of charge.
7
GENERAL INFORMATION
7.1 Share capital
7.1.1 Share capital as of December 31, 2018
As of December 31, 2018, the share capital amounted to €6,601,505,017.50, consisting of 2,640,602,007 (1) ordinary shares, with a nominal value of €2.50 per share. All the shares issued have been fully paid up.
7.1.2 Features of the shares
There is a single category of shares. A double voting right is granted under certain conditions (refer to point 7.2.4.1 of this chapter) to every shareholder.
The shares are registered or in bearer form, at the shareholder’s discretion. The shares are in book-entry form and registered in an account.
7.1.3 Potential capital as of December 31, 2018
The potential share capital is made up of the existing share capital to which are added the new TOTAL shares that could be issued in the event of (i) the conversion or reimbursement in shares of all the rights giving access to the share capital, and (ii) the exercise of all the share subscription options.
As of December 31, 2018, the only existing financial instruments likely to result in the creation of new Total shares were the 265,230 Total share subscription options that may be exercised at this date. These options were awarded on September 14, 2011, under the plan decided by the Board of Directors.
The table below shows the theoretical evolution in the share capital of TOTAL S.A. in view of the maximum potential for the creation of shares by exercising the 265,230 share subscription options existing as of December 31, 2018.
As of December 31, 2018 | Number of shares | Share capital (%) |
Ordinary shares issued | 2,640,602,007 | 100 |
Shares likely to be created by the exercise of share subscription options | 265,230 | 0.01 |
Maximum total number of shares (potential capital) | 2,640,867,237 | 100.01 |
7.1.4 Share capital history since 2016
Transaction acknowledgment date | Shares created/ (canceled) (number of shares) | Type of transaction (share capital increase/reduction) | Nominal amount of the transaction (euros) | Issue/contribution premium per share (euros) | Share capital after the transaction (euros) | Shares composing the capital after the transaction (number of shares) |
Fiscal year 2016 |
|
|
|
|
|
|
January 14, 2016 | 1,469,606 | Increase - Exercise of share subscription options in fiscal year 2015 | 3,674,015.00 | n/a (a) | 6,100,144,707.50 | 2,440,057,883 |
January 14, 2016 | 13,945,709 | Increase - Payment of the 2015 second interim dividend | 34,864,272.50 | 37.27 | 6,135,008,980.00 | 2,454,003,592 |
April 12, 2016 | 24,752,821 | Increase - Payment of the 2015 third interim dividend | 61,882,052.50 | 33.74 | 6,196,891,032.50 | 2,478,756,413 |
June 23, 2016 | 24,372,848 | Increase - Payment of the 2015 final dividend | 60,932,120.00 | 35.76 | 6,257,823,152.50 | 2,503,129,261 |
October 14, 2016 | 25,329,951 | Increase - Payment of the 2016 first interim dividend | 63,324,877.50 | 35.50 | 6,321,148,030.00 | 2,528,459,212 |
December 15, 2016 | (100,331,268) | Reduction - Cancellation of treasury shares | (250,828,170.00) | n/a | 6,070,319,860.00 | 2,428,127,944 |
(a) The shares created result from the exercise of share subscription options in fiscal year 2015 under the 2008, 2009, 2010 and 2011 share subscription option plans. The issue premiums corresponding to the creation of these shares under the 2008, 2009, 2010 and 2011 plans respectively amount to €40.40, €37.40, €35.70 and €30.50.
(1) Based on the number of shares composing the share capital as of December 31, 2018 published by the Company in accordance with article 223-16 of the General Regulation of the French Financial Markets Authority.
Transaction acknowledgment date | Shares created/ (canceled) (number of shares) | Type of transaction (share capital increase/reduction) | Nominal amount of the transaction (euros) | Issue/contribution premium per share (euros) | Share capital after the transaction (euros) | Shares composing the capital after the transaction (number of shares) |
Fiscal year 2017 |
|
|
|
|
|
|
January 12, 2017 | 2,237,918 | Increase - Exercise of share subscription options in fiscal year 2016 | 5,594,795.00 | n/a (a) | 6,075,914,655.00 | 2,430,365,862 |
January 12, 2017 | 23,206,171 | Increase - Payment of the 2016 second interim dividend | 58,015,427.50 | 39.37 | 6,133,930,082.50 | 2,453,572,033 |
April 6, 2017 | 19,800,590 | Increase - Payment of the 2016 third interim dividend | 49,501,475.00 | 42.14 | 6,183,431,557.50 | 2,473,372,623 |
April 26, 2017 | 9,532,190 | Share capital increase reserved for employees | 23,830,475.00 | 35.60 (b) | 6,207,262,032.50 | 2,482,904,813 |
June 22, 2017 | 17,801,936 | Increase - Payment of the 2016 final dividend | 44,504,840.00 | 42.36 | 6,251,766,872.50 | 2,500,706,749 |
October 12, 2017 | 25,633,559 | Increase - Payment of the 2017 first interim dividend | 64,083,897.50 | 38.62 | 6,315,850,770.00 | 2,526,340,308 |
(a) The shares created result from the exercise of share subscription options in fiscal year 2016 under the 2008, 2009, 2010 and 2011 share subscription option plans.
(b) Only the 9,350,220 shares issued as a result of employee subscriptions as part of the share capital increase included an issue premium. The 181,970 shares created for the matching contribution, in the form of free shares pursuant to Article L. 3332-21 of the French Labor Code, did not include an issue premium.
Transaction acknowledgment date | Shares created/ (canceled) (number of shares) | Type of transaction (share capital increase/reduction) | Nominal amount of the transaction (euros) | Issue/contribution premium per share (euros) | Share capital after the transaction (euros) | Shares composing the capital after the transaction (number of shares) |
Fiscal years 2018 and 2019 |
|
|
|
|
|
|
January 11, 2018 | 2,649,308 | Increase - Exercise of share subscription options in fiscal year 2017 | 6,623,270.00 | n/a (a) | 6,322,474,040.00 | 2,528,989,616 |
January 11, 2018 | 7,087,904 | Increase - Payment of the 2017 second interim dividend | 17,719,760.00 | 44.05 | 6,340,193,800.00 | 2,536,077,520 |
March 8, 2018 | 97,522,593 | Increase - Consideration for the contribution of Mærsk Olie og Gas A/S shares | 243,806,482.50 | 40.70 | 6,584,000,282.50 | 2,633,600,113 |
April 9, 2018 | 15,559,601 | Increase - Payment of the 2017 third interim dividend | 38,899,002.50 | 43.20 | 6,622,899,285.00 | 2,649,159,714 |
May 3, 2018 | 9,354,889 | Share capital increase reserved for employees | 23,387,222.50 | 34.70 (b) | 6,646,286,507.50 | 2,658,514,603 |
June 28, 2018 | 5,798,335 | Increase - Payment of the 2017 final dividend | 14,495,837.50 | 49.53 | 6,660,782,345.00 | 2,664,312,938 |
October 12, 2018 | 18,783,197 | Increase - Payment of the 2018 first interim dividend | 46,957,992.50 | 50.45 | 6,707,740,337.50 | 2,683,096,135 |
December 12, 2018 | (44,590,699) | Reduction - Cancellation of treasury shares | (111,476,747.50) | n/a | 6,596,263,590.00 | 2,638,505,436 |
January 14, 2019 | 2,096,571 | Increase - Exercise of share subscription options in fiscal year 2018 | 5,241,427.50 | n/a (c) | 6,601,505,017.50 | 2,640,602,007 |
January 14, 2019 | 1,212,767 | Increase - Payment of the 2018 second interim dividend | 3,031,917.50 | 45.77 | 6,604,536,935.00 | 2,641,814,774 |
(a) The shares created result from the exercise of share subscription options in fiscal year 2017 under the 2009, 2010 and 2011 share subscription option plans.
(b) Only the 9,174,817 shares issued as a result of employee subscriptions as part of the share capital increase included an issue premium. The 180,072 shares created for the matching contribution, in the form of free shares pursuant to Article L. 3332-21 of the French Labor Code, did not include an issue premium.
(c) The shares created result from the exercise of share subscription options in fiscal year 2018 under the 2010 and 2011 share subscription option plans.
7.2 Articles of incorporation and bylaws; other information
7.2.1 General information concerning the Company
The Company’s name is TOTAL S.A.
TOTAL S.A. is a French limited liability company (société anonyme). The headquarters are located at 2, place Jean Millier, La Défense 6, 92400 Courbevoie, France. It is registered in the French trade registry in Nanterre under No. 542 051 180 RCS.
The Company’s term was extended for 99 years from March 22, 2000, to expire on March 22, 2099, unless dissolved prior to this date or extended.
Fiscal year: from January 1 to December 31 of each year.
LEI (Legal Entity Identifier): 529900S21EQ1BO4ESM68.
EC Registration Number: FR 59 542 051 180.
APE Code (NAF): 111Z until January 7, 2008; 7010Z since January 8, 2008.
The Company’s bylaws are on file with K.L. Associés, Notaries in Paris.
The telephone number is +33 (0)1 47 44 45 46 and its internet address is total.com.
7.2.2 Summary of the Company’s corporate purpose
The direct and indirect purpose of the Company is to search for and extract mining deposits in all countries, particularly hydrocarbons in all forms, and to perform industrial refining, processing and trading in said materials as well as their derivatives and by-products, as well as all activities relating to production and distribution of all forms of energy, as well as the chemicals sector in all of its forms and to the rubber and health sectors. The complete details of the Company’s corporate purpose are set forth in Article 3 of the bylaws.
7.2.3 Provisions of the bylaws governing the administration and management bodies
7.2.3.1 Election of directors and term of office
Directors are elected by the Shareholders’ Meeting for a 3-year term up to a maximum number of directors authorized by law (currently 18), subject to the legal provisions that allow the term to be extended until the next Ordinary Shareholders’ Meeting called to approve the financial statements for the previous fiscal year.
In addition, one director representing the employee shareholders is also elected by the Shareholders’ Meeting for a 3-year term from a list of at least two candidates pre-selected by the employee shareholders under the conditions provided for by the laws, regulations and bylaws in force. However, his or her term shall expire automatically once this Director is no longer an employee or a shareholder. The Board of Directors may meet and conduct valid deliberations until the date his or her replacement is named.
Furthermore, a director representing the employees is designated by the Company’s Central Works Council (1). Where the number of directors appointed by the Shareholders’ Meeting is greater than 12 (2), a second director representing the employees is designated by the Company’s European Works Council. In accordance with applicable legal provisions, the director elected by the Central Works Council must have held an employment contract with the Company or one of its direct or indirect subsidiaries, whose registered office is based in mainland France, for at least two years prior to appointment. The second director elected by the European Works Council must have held an employment contract with the Company or one of its direct or indirect subsidiaries for at least two years prior to appointment. The term of office for a director representing the employees is three years. However, the term of office ends following the Ordinary Shareholders’ Meeting called to approve the financial statements for the last fiscal year and held in the year during which the said director’s term of office expires.
7.2.3.2 Age limit of directors
On the closing date of each fiscal year, the number of individual directors over the age of 70 may not be greater than one third of the directors in office. If this percentage is exceeded, the oldest Board member is automatically considered to have resigned. The director permanent representative of a legal entity must be under 70 years old.
7.2.3.3 Age limit of the Chairman of the Board and the Chief Executive Officer
The duties of the Chairman of the Board automatically cease on his or her 70th birthday at the latest.
To hold this office, the Chief Executive Officer must be under the age of 67. When the age limit is reached during his or her duties, such duties automatically cease, and the Board of Directors elects a new Chief Executive Officer. However, his or her duties as Chief Executive Officer will continue until the date of the Board of Directors’ meeting aimed at electing his or her successor. Subject to the age limit specified above, the Chief Executive Officer can always be re-elected.
The age limits specified above are stipulated in the Company’s bylaws. They were approved by the Annual Shareholders’ Meeting held on May 16, 2014.
7.2.3.4 Minimum interest in the Company held by directors
Each director (other than the director representing the employee shareholders or the director representing the employees) must own at least 1,000 shares during his or her term of office. If, however, any director ceases to own the required number of shares, they may adjust their position subject to the conditions set by law. The director representing employee shareholders must hold, during his or her term of office, either individually or through a Company Savings Plan
(1) The Company’s Central Works Council was replaced by the Central Social and Economic Committee (CSEC) in December 2018.
(2) Neither the director representing employee shareholders, elected by the Annual Shareholders’ Meeting, nor the director(s) representing employees are taken into consideration when calculating the 12-member threshold, which is assessed on the date on which the employee director(s) is/are elected.
(Fonds Commun de Placement d’Entreprise, FCPE) governed by Article L. 214-165 of the French Monetary and Financial Code, at least one share or a number of units in said fund equivalent to at least one share. The director representing the employees is not bound to be a shareholder.
7.2.3.5 Majority rules for Board meetings
Decisions are adopted by a majority vote of the directors present or represented. In the event of a tie vote, the person chairing the meeting shall cast the deciding vote.
7.2.3.6 Rules of procedure and Committees of the Board of Directors
Refer to point 4.1.2 of chapter 4 of this Registration Document.
7.2.3.7 Form of management
Management of the Company is assumed either by the Chairman of the Board of Directors (who then holds the title of the Chairman and Chief Executive Officer), or by another person appointed by the Board of Directors with the title of Chief Executive Officer. It is the responsibility of the Board of Directors to choose between these two forms of management under the majority rules described above.
At its meeting on December 16, 2015, the Board of Directors decided to reunify the positions of Chairman and Chief Executive Officer of TOTAL S.A. as of December 19, 2015. Since that date, Mr. Pouyanné has held the position of Chairman and Chief Executive Officer of TOTAL S.A. As the Shareholders’ Meeting held on June 1, 2018 renewed Mr. Pouyanné as a director for a three-year period, the Board of Directors decided to renew Mr. Pouyanné in his positions as Chairman and Chief Executive Officer of TOTAL S.A. for the same period. For additional information on the governance structure, refer to point 4.1.5.1 in chapter 4.
7.2.4 Rights, privileges and restrictions attached to the shares
In addition to the right to vote, each share entitles the holder to a portion of the corporate assets, distributions of profits and liquidation dividend that is proportional to the number of shares issued, subject to the laws and regulations in force, as well as the bylaws.
With the exception of double voting rights, no privilege is attached to a specific class of shares or to a specific class of shareholders.
7.2.4.1 Double voting rights
Double voting rights, in relation to the portion of share capital they represent, are granted to all fully paid-up registered shares held continuously in the name of the same shareholder for at least two years (1) , and to additional registered shares allotted to a shareholder in connection with a share capital increase by capitalization of reserves, profits or premiums on the basis of the existing shares which entitle the shareholder to a double voting right.
7.2.4.2 Limitation of voting rights
Article 18 of the Company’s bylaws provides that at Shareholders’ Meetings, no shareholder may cast, by himself or through his agent, on the basis of the single voting rights attached to the shares he holds directly or indirectly and the shares for which he holds powers, more than 10% of the total number of voting rights attached to the Company’s shares. In the case of double voting rights, by himself or through his agent, this limit may be exceeded, taking only the resulting additional voting rights into account, provided that the total voting rights that he exercises do not exceed 20% of the total voting rights associated with the shares in the Company.
Additionally, Article 18 of the bylaws also provides that the limitation on voting rights no longer applies, absent any decision of the Shareholders’ Meeting, if an individual or a legal entity acting solely or together with one or more individuals or entities acquires at least two thirds of the Company’s shares following a public tender offer for all the Company’s shares. In that case, the Board of Directors acknowledges that the limitation no longer applies and carries out the necessary procedure to modify the Company’s bylaws accordingly.
Once acknowledged, the fact that the limitation no longer applies is final and applies to all Shareholders’ Meetings following the public tender offer under which the acquisition of at least two thirds of the overall number of shares of the Company was made possible, and not solely to the first meeting following that public tender offer.
Since in such circumstances the limitation no longer applies, such limitation on voting rights cannot prevent or delay any takeover of the Company, except in case of a public tender offer where the bidder does not acquire at least two thirds of the Company’s shares.
7.2.4.3 Fractional rights
Whenever it is necessary to own several shares in order to exercise a right, a number of shares less than the number required does not give the owners any right with respect to the Company; in such case, the shareholders are responsible for aggregating the required number of shares.
7.2.4.4 Statutory allocation of profits
The Company may distribute dividends under the conditions provided for by the French Commercial Code and the Company’s bylaws.
The net profit for the period is equal to the net income minus general expenses and other personnel expenses, all amortization and depreciation of the assets, as well as all provisions for commercial and industrial contingencies.
From this profit, minus prior losses, if any, the following items are deducted in the order indicated:
-5% to constitute the legal reserve fund, until said fund reaches 10% of the share capital;
-the amounts set by the Shareholders’ Meeting in order to fund reserves for which it determines the allocation or use; and
-the amounts that the Shareholders’ Meeting decides to retain.
The remainder is paid to the shareholders as dividends.
The Board of Directors may pay interim dividends.
The Shareholders’ Meeting held to approve the financial statements for the fiscal year may decide to grant shareholders an option, for all or part of the dividend or interim dividends, between payment of the dividend in cash or in shares.
(1) This term is not interrupted and the right acquired is retained in case of a conversion of bearer to bearer pursuant to intestate or testamentary succession, share of community property between spouses or donation to the spouse or relatives entitled to inherit (Article 18 § 6 of the bylaws).
The Shareholders’ Meeting may decide at any time, but only based on a proposal by the Board of Directors, to make a full or partial distribution of the amounts in the reserve accounts, either in cash or in Company shares.
Dividends that have not been claimed at the end of a 5-year period are forfeited to the French State.
7.2.5 Amending shareholders’ rights
Any amendment to the bylaws must be approved or authorized by the Shareholders’ Meeting voting with the quorum and majority required by the laws and regulations governing Extraordinary Shareholders’ Meetings.
7.2.6 Shareholders’ Meetings
Refer to point 4.4.3 in chapter 4 for the terms and conditions of the notice and admission to Shareholders’ Meetings.
7.2.7 Identification of the holders of bearer shares
In accordance with Article 9 of its bylaws, TOTAL S.A. is authorized, to the extent permitted under applicable law, to identify the holders of securities that grant immediate or future voting rights at the Company’s Shareholders’ Meetings.
7.2.8 Thresholds to be declared according to the bylaws
Any individual or entity who directly or indirectly acquires a percentage of the share capital, voting rights or rights giving future access to the share capital of the Company that is equal to or greater than 1%, or a multiple of this percentage, is required to notify the Company within 15 days as from the crossing of each threshold, by registered mail with return receipt requested, and declare the number of securities held.
In case the shares above these thresholds are not declared, as specified in the preceding paragraph, any shares held in excess of, the threshold that should have been declared will be deprived of voting rights at Shareholders’ Meetings if, at a Shareholders’ Meeting, the failure to make a declaration is acknowledged and if one or more shareholders holding collectively at least 3% of the Company’s share capital or voting rights so request at that meeting.
All individuals and entities are also required to notify the Company, in due form and within the time limits stated above, when their direct or indirect holdings fall below each of the thresholds mentioned in the first paragraph.
7.2.9 Changes in the share capital
The Company’s share capital may be changed only under the conditions stipulated by the legal and regulatory provisions in force. No provision of the bylaws, charter, or internal regulations provide for more stringent conditions than the law governing changes in the Company’s share capital.
The French Commercial Code stipulates that shareholders hold, in proportion to their number of shares, a preemptive subscription right to shares issued for cash to increase the share capital. The Extraordinary Shareholders’ Meeting can decide, under the conditions provided for by law, to remove this preemptive subscription right.
8
Consolidated Financial Statements
| [REDACTED SECTION: CERTAIN TEXT HAS BEEN REDACTED.] | ||
| 8.2 | Consolidated statement of income | 254 |
| 8.3 | Consolidated statement of comprehensive income | 255 |
| 8.4 | Consolidated balance sheet | 256 |
| 8.5 | Consolidated statement of cash flow | 257 |
| 8.6 | Consolidated statement of changes in shareholders’ equity | 258 |
| 8.7 | Notes to the Consolidated Financial Statements | 259 |
8.2 Consolidated statement of income
TOTAL
For the year ended December 31, (M$) (a) | 2018 | 2017 | 2016 | |
Sales | (Notes 3, 4, 5) | 209,363 | 171,493 | 149,743 |
Excise taxes | (Notes 3, 5) | (25,257) | (22,394) | (21,818) |
Revenues from sales | (Notes 3, 5) | 184,106 | 149,099 | 127,925 |
Purchases, net of inventory variation | (Note 5) | (125,816) | (99,411) | (83,377) |
Other operating expenses | (Note 5) | (27,484) | (24,966) | (24,302) |
Exploration costs | (Note 5) | (797) | (864) | (1,264) |
Depreciation, depletion and impairment of tangible assets and mineral interests | (Note 5) | (13,992) | (16,103) | (13,523) |
Other income | (Note 6) | 1,838 | 3,811 | 1,299 |
Other expense | (Note 6) | (1,273) | (1,034) | (1,027) |
Financial interest on debt | (1,933) | (1,396) | (1,108) | |
Financial income and expense from cash & cash equivalents | (188) | (138) | 4 | |
Cost of net debt | (Note 15) | (2,121) | (1,534) | (1,104) |
Other financial income | (Note 6) | 1,120 | 957 | 971 |
Other financial expense | (Note 6) | (685) | (642) | (636) |
Net income (loss) from equity affiliates | (Note 8) | 3,170 | 2,015 | 2,214 |
Income taxes | (Note 11) | (6,516) | (3,029) | (970) |
Consolidated net income | 11,550 | 8,299 | 6,206 | |
Group share | 11,446 | 8,631 | 6,196 | |
Non-controlling interests | 104 | (332) | 10 | |
Earnings per share ($) | 4.27 | 3.36 | 2.52 | |
Fully-diluted earnings per share ($) | 4.24 | 3.34 | 2.51 |
(a) Except for per share amounts.
8.3 Consolidated statement of comprehensive income
TOTAL
For the year ended December 31, (M$) | 2018 | 2017 | 2016 | |
Consolidated net income | 11,550 | 8,299 | 6,206 | |
Other comprehensive income | ||||
Actuarial gains and losses | (Note 10) | (12) | 823 | (371) |
Change in fair value of investments in equity instruments | (Note 15) | - | - | - |
Tax effect | 13 | (390) | 55 | |
Currency translation adjustment generated by the parent company | (Note 9) | (4,022) | 9,316 | (1,548) |
Items not potentially reclassifiable to profit and loss | (4,021) | 9,749 | (1,864) | |
Currency translation adjustment | (Note 9) | 1,113 | (2,578) | (1,098) |
Available for sale financial assets | (Note 8) | - | 7 | 4 |
Cash flow hedge | (Notes 15, 16) | 25 | 324 | 239 |
Variation of foreign currency basis spread | (Note 15) | (80) | - | - |
Share of other comprehensive income of equity affiliates, net amount | (Note 8) | (540) | (677) | 935 |
Other | (5) | - | 1 | |
Tax effect | 14 | (100) | (76) | |
Items potentially reclassifiable to profit and loss | 527 | (3,024) | 5 | |
Total other comprehensive income (net amount) | (3,494) | 6,725 | (1,859) | |
Comprehensive income | 8,056 | 15,024 | 4,347 | |
Group share | 8,021 | 15,312 | 4,336 | |
Non-controlling interests | (Note 9) | 35 | (288) | 11 |
8.4 Consolidated balance sheet
TOTAL
ASSETS
As of December 31, (M$) | 2018 | 2017 | 2016 | |
Non-current assets | ||||
Intangible assets, net | (Notes 4 & 7) | 28,922 | 14,587 | 15,362 |
Property, plant and equipment, net | (Notes 4 & 7) | 113,324 | 109,397 | 111,971 |
Equity affiliates: investments and loans | (Note 8) | 23,444 | 22,103 | 20,576 |
Other investments | (Note 8) | 1,421 | 1,727 | 1,133 |
Non-current financial assets | (Note 15) | 680 | 679 | 908 |
Deferred income taxes | (Note 11) | 6,663 | 5,206 | 4,368 |
Other non-current assets | (Note 6) | 2,509 | 3,984 | 4,143 |
Total non-current assets | 176,963 | 157,683 | 158,461 | |
Current assets | ||||
Inventories, net | (Note 5) | 14,880 | 16,520 | 15,247 |
Accounts receivable, net | (Note 5) | 17,270 | 14,893 | 12,213 |
Other current assets | (Note 5) | 14,724 | 14,210 | 14,835 |
Current financial assets | (Note 15) | 3,654 | 3,393 | 4,548 |
Cash and cash equivalents | (Note 15) | 27,907 | 33,185 | 24,597 |
Assets classified as held for sale | (Note 2) | 1,364 | 2,747 | 1,077 |
Total current assets | 79,799 | 84,948 | 72,517 | |
Total assets | 256,762 | 242,631 | 230,978 |
LIABILITIES & SHAREHOLDERS’ EQUITY
As of December 31, (M$) | 2018 | 2017 | 2016 | |
Shareholders’ equity | ||||
Common shares | 8,227 | 7,882 | 7,604 | |
Paid-in surplus and retained earnings | 120,569 | 112,040 | 105,547 | |
Currency translation adjustment | (11,313) | (7,908) | (13,871) | |
Treasury shares | (1,843) | (458) | (600) | |
Total shareholders’ equity - Group share | (Note 9) | 115,640 | 111,556 | 98,680 |
Non-controlling interests | 2,474 | 2,481 | 2,894 | |
Total shareholders’ equity | 118,114 | 114,037 | 101,574 | |
Non-current liabilities | ||||
Deferred income taxes | (Note 11) | 11,490 | 10,828 | 11,060 |
Employee benefits | (Note 10) | 3,363 | 3,735 | 3,746 |
Provisions and other non-current liabilities | (Note 12) | 21,432 | 15,986 | 16,846 |
Non-current financial debt | (Note 15) | 40,129 | 41,340 | 43,067 |
Total non-current liabilities | 76,414 | 71,889 | 74,719 | |
Current liabilities | ||||
Accounts payable | 26,134 | 26,479 | 23,227 | |
Other creditors and accrued liabilities | (Note 5) | 22,246 | 17,779 | 16,720 |
Current borrowings | (Note 15) | 13,306 | 11,096 | 13,920 |
Other current financial liabilities | (Note 15) | 478 | 245 | 327 |
Liabilities directly associated with the assets classified as held for sale | (Note 2) | 70 | 1,106 | 491 |
Total current liabilities | 62,234 | 56,705 | 54,685 | |
Total liabilities & shareholders’ equity | 256,762 | 242,631 | 230,978 |
8.5 Consolidated statement of cash flow
TOTAL
For the year ended December 31, (M$) | 2018 | 2017 | 2016 | |
CASH FLOW FROM OPERATING ACTIVITIES | ||||
Consolidated net income | 11,550 | 8,299 | 6,206 | |
Depreciation, depletion, amortization and impairment | (Note 5.3) | 14,584 | 16,611 | 14,423 |
Non-current liabilities, valuation allowances, and deferred taxes | (Note 5.5) | (887) | (384) | (1,559) |
(Gains) losses on disposals of assets | (930) | (2,598) | (263) | |
Undistributed affiliates’ equity earnings | (826) | 42 | (643) | |
(Increase) decrease in working capital | (Note 5.5) | 769 | 827 | (1,119) |
Other changes, net | 443 | (478) | (524) | |
Cash flow from operating activities | 24,703 | 22,319 | 16,521 | |
CASH FLOW USED IN INVESTING ACTIVITIES | ||||
Intangible assets and property, plant and equipment additions | (Note 7) | (17,080) | (13,767) | (18,106) |
Acquisitions of subsidiaries, net of cash acquired | (3,379) | (800) | (1,123) | |
Investments in equity affiliates and other securities | (1,108) | (1,368) | (180) | |
Increase in non-current loans | (618) | (961) | (1,121) | |
Total expenditures | (22,185) | (16,896) | (20,530) | |
Proceeds from disposals of intangible assets and property, plant and equipment | 3,716 | 1,036 | 1,462 | |
Proceeds from disposals of subsidiaries, net of cash sold | 12 | 2,909 | 270 | |
Proceeds from disposals of non-current investments | 1,444 | 294 | 132 | |
Repayment of non-current loans | 2,067 | 1,025 | 1,013 | |
Total divestments | 7,239 | 5,264 | 2,877 | |
Cash flow used in investing activities | (14,946) | (11,632) | (17,653) | |
CASH FLOW FROM FINANCING ACTIVITIES | ||||
Issuance (repayment) of shares: | ||||
- Parent company shareholders | 498 | 519 | 100 | |
- Treasury shares | (4,328) | - | - | |
Dividends paid: | ||||
- Parent company shareholders | (4,913) | (2,643) | (2,661) | |
- Non-controlling interests | (97) | (141) | (93) | |
Issuance of perpetual subordinated notes | (Note 9) | - | - | 4,711 |
Payments on perpetual subordinated notes | (Note 9) | (325) | (276) | (133) |
Other transactions with non-controlling interests | (622) | (4) | (104) | |
Net issuance (repayment) of non-current debt | (Note 15) | 649 | 2,277 | 3,576 |
Increase (decrease) in current borrowings | (3,990) | (7,175) | (3,260) | |
Increase (decrease) in current financial assets and liabilities | (797) | 1,903 | 1,396 | |
Cash flow from/(used in) financing activities | (13,925) | (5,540) | 3,532 | |
Net increase (decrease) in cash and cash equivalents | (4,168) | 5,147 | 2,400 | |
Effect of exchange rates | (1,110) | 3,441 | (1,072) | |
Cash and cash equivalents at the beginning of the period | 33,185 | 24,597 | 23,269 | |
Cash and cash equivalents at the end of the period | (Note 15) | 27,907 | 33,185 | 24,597 |
8.6 Consolidated statement of changes in shareholders’ equity
TOTAL
(M$) | Common shares issued | Paid-in surplus and retained earnings | Currency translation adjustment | Treasury shares | Shareholders’ equity - Group share | Non- controlling interests | Total shareolders’ equity | ||
Number | Amount | Number | Amount | ||||||
As of January 1, 2016 | 2,440,057,883 | 7,670 | 101,528 | (12,119) | (113,967,758) | (4,585) | 92,494 | 2,915 | 95,409 |
Net income 2016 | - | - | 6,196 | - | - | - | 6,196 | 10 | 6,206 |
Other comprehensive income | - | - | (108) | (1,752) | - | - | (1,860) | 1 | (1,859) |
Comprehensive income | - | - | 6,088 | (1,752) | - | - | 4,336 | 11 | 4,347 |
Dividend | - | - | (6,512) | - | - | - | (6,512) | (93) | (6,605) |
Issuance of common shares | 90,639,247 | 251 | 3,553 | - | - | - | 3,804 | - | 3,804 |
Purchase of treasury shares | - | - | - | - | - | - | - | - | - |
Sale of treasury shares (a) | - | - | (163) | - | 3,048,668 | 163 | - | - | - |
Share-based payments | - | - | 112 | - | - | - | 112 | - | 112 |
Share cancellation | (100,331,268) | (317) | (3,505) | - | 100,331,268 | 3,822 | - | - | - |
Issuance of perpetual subordinated notes | - | - | 4,711 | - | - | - | 4,711 | - | 4,711 |
Payments on perpetual subordinated notes | - | - | (203) | - | - | - | (203) | - | (203) |
Other operations with non-controlling interests | - | - | (98) | - | - | - | (98) | (43) | (141) |
Other items | - | - | 36 | - | - | - | 36 | 104 | 140 |
As of December 31, 2016 | 2,430,365,862 | 7,604 | 105,547 | (13,871) | (10,587,822) | (600) | 98,680 | 2,894 | 101,574 |
Net income 2017 | - | - | 8,631 | - | - | - | 8,631 | (332) | 8,299 |
Other comprehensive income | - | - | 718 | 5,963 | - | - | 6,681 | 44 | 6,725 |
Comprehensive income | - | - | 9,349 | 5,963 | - | - | 15,312 | (288) | 15,024 |
Dividend | - | - | (6,992) | - | - | - | (6,992) | (141) | (7,133) |
Issuance of common shares | 98,623,754 | 278 | 4,431 | - | - | - | 4,709 | - | 4,709 |
Purchase of treasury shares | - | - | - | - | - | - | - | - | - |
Sale of treasury shares (a) | - | - | (142) | - | 2,211,066 | 142 | - | - | - |
Share-based payments | - | - | 151 | - | - | - | 151 | - | 151 |
Share cancellation | - | - | - | - | - | - | - | - | - |
Issuance of perpetual subordinated notes | - | - | - | - | - | - | - | - | - |
Payments on perpetual subordinated notes | - | - | (302) | - | - | - | (302) | - | (302) |
Other operations with non-controlling interests | - | - | (8) | - | - | - | (8) | 4 | (4) |
Other items | - | - | 6 | - | - | - | 6 | 12 | 18 |
As of December 31, 2017 | 2,528,989,616 | 7,882 | 112,040 | (7,908) | (8,376,756) | (458) | 111,556 | 2,481 | 114,037 |
Net income 2018 | - | - | 11,446 | - | - | - | 11,446 | 104 | 11,550 |
Other comprehensive income | - | - | (20) | (3,405) | - | - | (3,425) | (69) | (3,494) |
Comprehensive income | - | - | 11,426 | (3,405) | - | - | 8,021 | 35 | 8,056 |
Dividend | - | - | (7,881) | - | - | - | (7,881) | (97) | (7,978) |
Issuance of common shares | 156,203,090 | 476 | 8,366 | - | - | - | 8,842 | - | 8,842 |
Purchase of treasury shares | - | - | - | - | (72,766,481) | (4,328) | (4,328) | - | (4,328) |
Sale of treasury shares (a) | - | - | (240) | - | 4,079,257 | 240 | - | - | - |
Share-based payments | - | - | 294 | - | - | - | 294 | - | 294 |
Share cancellation | (44,590,699) | (131) | (2,572) | - | 44,590,699 | 2,703 | - | - | - |
Issuance of perpetual subordinated notes | - | - | - | - | - | - | - | - | - |
Payments on perpetual subordinated notes | - | - | (315) | - | - | - | (315) | - | (315) |
Other operations with non-controlling interests | - | - | (517) | - | - | - | (517) | (99) | (616) |
Other items | - | - | (32) | - | - | - | (32) | 154 | 122 |
As of December 31, 2018 | 2,640,602,007 | 8,227 | 120,569 | (11,313) | (32,473,281) | (1,843) | 115,640 | 2,474 | 118,114 |
(a) Treasury shares related to the restricted stock grants.
Changes in equity are detailed in Note 9.
8.7 Notes to the Consolidated Financial Statements
On February 6, 2019, the Board of Directors established and authorized the publication of the Consolidated Financial Statements of TOTAL S.A. for the year ended December 31, 2018, which will be submitted for approval to the Shareholders’ Meeting to be held on May 29, 2019.
The Consolidated Financial Statements of TOTAL S.A. and its subsidiaries (the Group) are presented in U.S. dollars and have been prepared on the basis of IFRS (International Financial Reporting Standards) as adopted by the European Union and IFRS as issued by the IASB (International Accounting Standard Board) as of December 31, 2018.
The accounting principles applied for the Consolidated Financial Statements at December 31, 2018, were the same as those that were used for the financial statements at December 31, 2017, with the exception of those texts or amendments that must be applied for periods beginning January 1, 2018.
First-time application of IFRS 15 "Revenue from Contracts with Customers"
The Group applied IFRS 15 as of January 1, 2018, without restating comparative information from past periods.
The cumulative effect of the first application of the standard, recognized in equity as at January 1, 2018, is non-material.
This new standard did not lead to any substantial change in the accounting principles applied by the Group.
Main issues analysed by the Group in order to evaluate the impacts of the standard are related to take or pay, incoterms, excise duties, principal vs agent considerations and variable price adjustment clause.
First time application of IFRS 9 "Financial Instruments"
The Group applied IFRS 9 as of January 1, 2018 without restating comparative information from past periods. The cumulative effect of the first application of the standard, recognized in equity as at January 1, 2018, is non-material.
This new standard did not lead to any substantial change in the accounting principles applied by the Group.
This standard has three components: classification and measurement of financial instruments, impairment of financial assets, and hedging transactions except macro hedging.
The main changes induced by each component are the following:
-the application of the "Classification and valuation of financial instruments" component led the Group to create a new non-recyclable component in its comprehensive income to record, from January 1, 2018, changes in the fair value of investments in equity instruments previously classified as "Available-for-sale financial assets "under IAS 39.
Moreover the Group has reviewed the equity instruments classification as stated in Note 8.2 to the Consolidated Financial Statements;
-the application of the "Impairment of financial assets" component has changed the Group’s accounting for impairment losses for financial assets. IAS 39’s incurred loss approach has been replaced by a forward-looking expected credit loss (ECL) approach. For trade receivables, the Group assessed the expected losses based on loss rates historically recorded. This analyze had no significant impact for the Group on January 1, 2018;
-the application of the "Hedging transactions" component led the Group to retrospectively recognize in a separate component of the comprehensive income the variation of foreign currency basis spread identified in the hedging relationships qualifying as a fair value hedge.
The application of the provisions of IFRS 9 "Financial Instruments" has no significant effect on the Group’s balance sheet, income statement and consolidated equity as of December 31, 2018.
The preparation of financial statements in accordance with IFRS for the closing as of December 31, 2018 requires the Executive Management to make estimates, assumptions and judgments that affect the information reported in the Consolidated Financial Statements and the notes thereto.
These estimates, assumptions and judgments are based on historical experience and other factors believed to be reasonable at the date of preparation of the financial statements. They are reviewed on an on-going basis by management and therefore could be revised as circumstances change or as a result of new information.
Different estimates, assumptions and judgments could significantly affect the information reported, and actual results may differ from the amounts included in the Consolidated Financial Statements and the notes thereto.
The following summary provides further information about the key estimates, assumptions and judgments that are involved in preparing, the Consolidated Financial Statements and the notes thereto. It should be read in conjunction with the sections of the notes mentioned in the summary.
Estimation of hydrocarbon reserves
The estimation of oil and gas reserves is a key factor in the Successful Efforts method used by the Group to account for its oil and gas activities.
The Group’s oil and gas reserves are estimated by the Group’s petroleum engineers in accordance with industry standards and SEC (U.S. Securities and Exchange Commission) regulations.
Proved oil and gas reserves are those quantities of oil and gas, which, by analysis of geosciences and engineering data, can be determined with reasonable certainty to be recoverable (from a given date forward, from known reservoirs, and under existing economic conditions, operating methods, and government regulations), prior to the time at which contracts providing the rights to operate expire, unless evidence indicates that renewal is reasonably certain, regardless of whether deterministic or probabilistic methods are used for the estimation.
Proved oil and gas reserves are calculated using a 12-month average price determined as the unweighted arithmetic average of the first-day-of-the-month price for each month of the relevant year unless prices are defined by contractual arrangements, excluding escalations based upon future conditions. The Group reassesses its oil and gas reserves at least once a year on all its properties.
The Successful Efforts method and the mineral interests and property and equipment of exploration and production are presented in Note 7 "Intangible and tangible assets".
Impairment of assets
As part of the determination of the recoverable value of assets for impairment (IAS36), the estimates, assumptions and judgments mainly concern hydrocarbon prices scenarios, operating costs, production volumes and oil and gas proved reserves, refining margins and product marketing conditions (mainly petroleum, petrochemical and chemical products as well as solar industry products). The estimates and assumptions used by the Executive Management are determined in specialized internal departments in light of economic conditions and external expert analysis. The discount rate is reviewed annually.
Asset impairment and the method applied are described in Note 3 "Business segment information".
Employee benefits
The benefit obligations and plan assets can be subject to significant volatility due in part to changes in market values and actuarial assumptions. These assumptions vary between different pension plans and thus take into account local conditions. They are determined following a formal process involving expertise and Group internal judgments, in financial and actuarial terms, and also in consultation with actuaries and independent experts.
The assumptions for each plan are reviewed annually and adjusted if necessary to reflect changes from the experience and actuarial advice. The discount rate is reviewed quarterly.
Payroll, staff and employee benefits obligations and the method applied are described in Note 10 "Payroll, staff and employee benefits obligations".
Asset retirement obligations
Asset retirement obligations, which result from a legal or constructive obligation, are recognized based on a reasonable estimate in the period in which the obligation arises.
This estimate is based on information available in terms of costs and work program. It is regularly reviewed to take into account the changes in laws and regulations, the estimates of reserves and production, the analysis of site conditions and technologies.
The discount rate is reviewed annually.
Asset retirement obligations and the method used are described in Note 12 "Provisions and other non-current liabilities".
Income Taxes
A tax liability is recognized when a future payment, in application of a tax regulation, is considered probable and can be reasonably estimated. The exercise of judgment is required to assess the impact of new events on the amount of the liability.
Deferred tax assets are recognized in the accounts to the extent that their recovery is considered probable. The amount of these assets is determined based on taxable profits existing at the closing date and future taxable profits which estimation is inherently uncertain and subject to change over time. The exercise of judgment is required to assess the impact of new events on the value of these assets and including changes in estimates of future taxable profits and the deadlines for their use.
In addition, these tax positions may depend on interpretations of tax laws and regulations in the countries where the Group operates. These interpretations may have uncertain nature. Depending on the circumstances, they are final only after negotiations or resolution of disputes with authorities that can last several years.
Incomes taxes and the accounting methods are described in Note 11 "Income taxes".
Furthermore, when the accounting treatment of a specific transaction is not addressed by any accounting standard or interpretation, the management applies its judgment to define and apply accounting policies that provide information consistent with the general IFRS concepts: faithful representation, relevance and materiality.
1.1 Accounting policies
A) Principles of consolidation
Entities that are directly controlled by the parent company or indirectly controlled by other consolidated entities are fully consolidated.
Investments in joint ventures are consolidated under the equity method. The Group accounts for joint operations by recognizing its share of assets, liabilities, income and expenses.
Investments in associates, in which the Group has significant influence, are accounted for by the equity method. Significant influence is presumed when the Group holds, directly or indirectly (e.g., through subsidiaries), 20% or more of the voting rights. Companies in which ownership interest is less than 20%, but over which the Company is deemed to exercise significant influence, are also accounted for by the equity method.
All internal balances, transactions and income are eliminated.
B) Business combinations
Business combinations are accounted for using the acquisition method. This method requires the recognition of the acquired identifiable assets and assumed liabilities of the companies acquired by the Group at their fair value.
The value of the purchase price is finalized up to a maximum of one year from the acquisition date.
The acquirer shall recognize goodwill at the acquisition date, being the excess of:
-the consideration transferred, the amount of non-controlling interests and, in business combinations achieved in stages, the fair value at the acquisition date of the investment previously held in the acquired company;
-over the fair value at the acquisition date of acquired identifiable assets and assumed liabilities.
If the consideration transferred is lower than the fair value of acquired identifiable assets and assumed liabilities, an additional analysis is performed on the identification and valuation of the identifiable elements of the assets and liabilities. After having completed such additional analysis, any badwill is recorded as income.
Non-controlling interests are measured either at their proportionate share in the net assets of the acquired company or at fair value.
In transactions with non-controlling interests, the difference between the price paid (received) and the book value of non-controlling interests acquired (sold) is recognized directly in equity.
C) Foreign currency translation
The presentation currency of the Group’s Consolidated Financial Statements is the US dollar. However the functional currency of the parent company is the euro. The resulting currency translation adjustments are presented on the line "currency translation adjustment generated by the parent company" of the consolidated statement of comprehensive income, within "items not potentially reclassifiable to profit and loss". In the balance sheet, they are recorded in "currency translation adjustment".
The financial statements of subsidiaries are prepared in the currency that most clearly reflects their business environment. This is referred to as their functional currency.
Since 1st July 2018, Argentina is considered to be hyperinflationary. IAS 29 "Financial Reporting in Hyperinflationary Economies" is applicable to entities whose functional currency is the Argentine peso. The functional currency of the Argentine Exploration & Production subsidiary is the US dollar, therefore IAS 29 has no incidence on the Group accounts. Net asset of the other business segments is not significant.
(i) Monetary transactions
Transactions denominated in currencies other than the functional currency of the entity are translated at the exchange rate on the transaction date. At each balance sheet date, monetary assets and liabilities are translated at the closing rate and the resulting exchange differences are recognized in the statement of income.
(ii) Translation of financial statements
Assets and liabilities of entities denominated in currencies other than dollar are translated into dollar on the basis of the exchange rates at the end of the period. The income and cash flow statements are translated using the average exchange rates for the period. Foreign exchange differences resulting from such translations are either recorded in shareholders’ equity under "Currency translation adjustments" (for the Group share) or under "Non-controlling interests" (for the share of non-controlling interests) as deemed appropriate.
1.2 Significant accounting policies applicable in the future
The standards or interpretations published respectively by the International Accounting Standards Board (IASB) and the International Financial Reporting Standards Interpretations Committee (IFRS IC) which were not yet in effect at December 31, 2018, are as follows:
Standards adopted by the European Union at December 31, 2018
-IFRS 16 "Leases" applicable as of January 1, 2019. As regards the first application of this standard, the Group intends to:
-apply the simplified retrospective transition method, by accounting for the cumulative effect of the initial application of the standard at the date of first application, without restating the comparative periods;
-use the following simplification measures provided by the standard in the transitional provisions:
- not apply the standard to contracts that the Group had not previously identified as containing a lease under IAS 17 and IFRIC 4,
- not take into account leases whose term ends within 12 months of the date of first application;
-recognize each lease component of the lease as a separate lease, apart from non-lease components (services) of the lease.
The expected impact of the application of this standard on January 1, 2019 on the Group’s debt is between $5 and $6 billion.
-IFRIC 23 interpretation "uncertainty over income tax treatments" applicable as of January 1, 2019 which refers to any situation of uncertainty regarding the acceptability of a tax treatment on income tax. An analysis of these situations is underway within the Group to assess the impacts of applying this interpretation. The expected impacts are not significant.
2.1 Main acquisitions and divestments
In 2018, the main changes in the Group structure were as follows:
Exploration & Production
-On January 15, 2018, as part of the Strategic Alliance signed in March 2017, TOTAL announced the conclusion of transfer agreements from Petrobras to TOTAL:
- 35% of the rights, as well as the role of operator in the Lapa field,
- 22.5% of the rights of the Iara area.
The details of the acquisition are presented in Note 2.2 to the Consolidated Financial Statements.
-On March 1, 2018, TOTAL finalized the acquisition of Marathon Oil Libya Limited which holds a 16.33% stake in the Waha Concessions in Libya.
The details of the acquisition are presented in Note 2.2 to the Consolidated Financial Statements.
-On March 8, 2018, TOTAL announced the closing of the Maersk Oil acquisition signed on August 21, 2017. The integration of Maersk Oil, which holds a portfolio of high quality assets, largely complementary to those held by TOTAL, and mainly located in OECD countries, allows the Group to become the second largest operator in the North Sea.
The details of the acquisition are presented in Note 2.2 to the Consolidated Financial Statements.
-On March 15, 2018, TOTAL finalized the sale to Statoil of all of its interests in the Martin Linge field (51%) and the discovery of Garantiana (40%) on the Norwegian Continental Shelf.
-On March 18, 2018, TOTAL was granted participating interests in two Offshore Concessions on Umm Shaif & Nasr (20%) and Lower Zakum (5%) in Abu Dhabi.
-On April 11, 2018, TOTAL acquired several assets located in the Gulf of Mexico as part of the Cobalt International Energy Company’s bankruptcy auction sale.
Marketing & Services
-In January, 2018, the sale of the joint venture TotalErg (Erg 51%, TOTAL 49%) to the Italian company API was finalized.
-On November 22, 2018, TOTAL has entered into an agreement with Brazilian company Grupo Zema to acquire its fuel distribution company Zema Petróleo, its reseller and retailer arm Zema Diesel as well as its importation company Zema Importacao.
Gas, Renewables & Power
-On July 6, 2018, TOTAL acquired 73.04% of the share capital of Direct Énergie. Subsequent to a public tender offer launched in July 2018, TOTAL owns 100% of Direct Énergie shares.
The details of the acquisition are presented in Note 2.2 to the Consolidated Financial Statements.
-On July 13, 2018, TOTAL acquired Engie’s portfolio of upstream liquefied natural gas (LNG) assets.
The details of the acquisition are presented in Note 2.2 to the Consolidated Financial Statements.
-On September 26, 2018, TOTAL finalized the acquisition of two gas-fired combined cycle power plants (CCGT) in the North and East of France to KKR-Energas.
2.2 Major business combinations
Accounting policies In accordance with IFRS 3 "Business combinations", TOTAL is assessing the fair value of identifiable acquired assets, liabilities and contingent liabilities on the basis of available information. This assessment will be finalised within 12 months following the acquisition date. |
Exploration & Production
Transfer of rights in the Lapa and Iara concessions in Brazil
In January 2018 Petrobras transferred to TOTAL 35% of the rights of the Lapa field which was put in production in December 2016, with a 100,000 barrel per day capacity Floating Production, Storage and Offloading vessel (FPSO).
Petrobras also transferred to TOTAL 22.5% of the rights of the Iara area in which production tests were performed in 2018.
The acquisition cost amounts to $1,950 million.
In the balance sheet as of December 31, 2018, the fair value of identifiable acquired assets, liabilities and contingent liabilities amounts to $1,950 million.
The purchase price allocation is shown below:
(M$) | At the acquisition date |
Intangible assets | 1,054 |
Tangible assets | 1,509 |
Other assets and liabilities | (126) |
Net debt | (487) |
Fair value of consideration transferred | 1,950 |
Marathon Oil Libya Limited
On March 1, 2018, TOTAL finalized the acquisition of Marathon Oil Libya Limited which holds a 16.33% stake in the Waha Concessions in Libya. The acquisition cost amounts to $451 million.
In the balance sheet as of December 31, 2018, the fair value of identifiable acquired assets, liabilities and contingent liabilities amounts to $451 million.
The purchase price allocation is shown below:
(M$) | At the acquisition date |
Intangible assets | 485 |
Tangible assets | 11 |
Other assets and liabilities | (69) |
Net debt | 24 |
Fair value of consideration transferred | 451 |
Maersk Oil
On March 8, 2018, TOTAL finalized the acquisition of Maersk Oil, following the signature of the "Share Transfer Agreement" on August 21, 2017.
The Group acquired all the voting rights of Maersk Olie og Gas A/S (Maersk Oil), a wholly owned subsidiary of A.P. M-ller - Mærsk A/S (Maersk), for a purchase consideration of $5,741 million. This includes the fair value ($5,585 million) of 97,522,593 shares issued in exchange for all Maersk Oil shares, calculated using the market price of the Company’s shares of 46.11 euros on the Euronext Paris Stock Exchange at its opening of business on March 8, 2018, and the amount of price adjustments ($156 million) paid on closing.
In the balance sheet as of December 31, 2018, the fair value of identifiable acquired assets, liabilities and contingent liabilities amounts to $3,099 million.
The Group recognized a $2,642 million goodwill. It reflects the value of expected synergies. This goodwill was allocated to the Exploration & Production segment.
The purchase price allocation is shown below:
(M$) | At the acquisition date |
Goodwill | 2,642 |
Intangible assets | 4,166 |
Tangible assets | 3,983 |
Other assets and liabilities | (3,126) |
Including provision for site restitution | (2,003) |
Including deferred tax | (657) |
Net debt | (1,924) |
Fair value of consideration transferred | 5,741 |
Gas, Renewables & Power
Direct Énergie
On July 6, 2018, TOTAL acquired a 73.04% majority stake of the share capital of Direct Énergie.
Upon completion of the public tender offer launched in July 2018, the Group holds 100% of its share capital. The acquisition cost of this interest totals €1,956 million ($2,297 million).
The acquisition was carried out in two steps:
-in the first step TOTAL obtained control over Direct Énergie by the acquisition of 73.04% of its shares for an amount of €1,399 million ($1,640 million) and recorded a preliminary partial goodwill for an amount of €1,093 million ($1,282 million). This goodwill reflects the value created for TOTAL by the size increase in the gas and power value chain and its associated synergies. Being provisional this goodwill has not yet been allocated to a Cash-Generated Unit (CGU);
-in the second step TOTAL completed a transaction with the minority shareholders for an amount of €557 million.
The purchase price allocation is shown below:
(M$) | At the acquisition date |
Goodwill | 1,282 |
Intangible assets | 287 |
Tangible assets | 1,259 |
Other assets and liabilities | (14) |
Net debt | (1,042) |
Net assets attributable to non-controlling interests | (132) |
Fair value of consideration transferred | 1,640 |
Engie’s Upstream LNG Business
On July 13, 2018, the Group acquired 100% shares of Global LNG, a company which holds Engie’s portfolio of upstream liquefied natural gas (LNG) assets for a purchase price of $1,269 million, plus an additional purchase price of $550 million estimated at the acquisition date. TOTAL recorded a preliminary goodwill for an amount of $2,791 million. It reflects the value created for TOTAL of the size change and acquired flexibility in the GNL growing market. Being provisional this goodwill has not yet been allocated to a Cash-Generated Unit (CGU).
The purchase price allocation is shown below:
(M$) | At the acquisition date |
Goodwill | 2,791 |
Intangible assets | 7 |
Tangible assets | 163 |
Other assets and liabilities | (1,007) |
Net debt | (135) |
Fair value of consideration transferred | 1,819 |
2.3 Divestment projects
Accounting policies Pursuant to IFRS 5 "Non-current assets held for sale and discontinued operations", assets and liabilities of affiliates that are held for sale are presented separately on the face of the balance sheet. Depreciation of assets ceases from the date of classification in "Non-current assets held for sale". |
Exploration & Production
-On December 13, 2018, TOTAL announced the signing of an agreement to divest a 4% interest in the Ichthys liquefied natural gas (LNG) project in Australia to operating partner INPEX for an overall consideration of $1.6 billion. The transaction, which is subject to Australian regulatory approvals, will reduce Total’s interest in the asset to 26%. At December 31, 2018, the assets and liabilities have been respectively classified in the consolidated balance sheet in "assets classified as held for sale" for an amount of $1,077 million and "liabilities directly associated with the assets classified as held for sale" for an amount of $41 million. The assets concerned mainly include tangible assets.
Description of the business segments
Financial information by business segment is reported in accordance with the internal reporting system and shows internal segment information that is used to manage and measure the performance of TOTAL and which is reviewed by the main operational decision-making body of the Group, namely the Executive Committee.
The operational profit and assets are broken down by business segment prior to the consolidation and inter-segment adjustments.
Sales prices between business segments approximate market prices.
The organization of the Group’s activities is structured around the four followings segments:
-an Exploration & Production segment;
-a Gas, Renewables & Power segment including downstream Gas activities, New Energies activities (excluding biotechnologies) and Energy Efficiency division;
-a Refining & Chemicals segment constituting a major industrial hub comprising the activities of refining, petrochemicals and specialty chemicals. This segment also includes the activities of oil Supply, Trading and marine Shipping;
-a Marketing & Services segment including the global activities of supply and marketing in the field of petroleum products.
In addition the Corporate segment includes holdings operating and financial activities.
Certain figures for the year 2016 have been restated in order to reflect the new organization with four business segments implemented in 2017.
Definition of the indicators
(i) Operating income (measure used to evaluate operating performance)
Revenue from sales after deducting cost of goods sold and inventory variations, other operating expenses, exploration expenses and depreciation, depletion, and impairment of tangible assets and mineral interests.
Operating income excludes the amortization of intangible assets other than mineral interests, currency translation adjustments and gains or losses on the disposal of assets.
(ii) Net operating income (measure used to evaluate the return on capital employed)
Operating income after taking into account the amortization of intangible assets other than mineral interests, currency translation adjustments, gains or losses on the disposal of assets, as well as all other income and expenses related to capital employed (dividends from non-consolidated companies, equity in income of affiliates, capitalized interest expenses…), and after income taxes applicable to the above.
The only income and expense not included in net operating income but included in net income Group share are interest expenses related to net financial debt, after applicable income taxes (net cost of net debt) and non-controlling interests.
(iii) Adjusted income
Operating income, net operating income, or net income excluding the effect of adjustment items described below.
(iv) Capital employed
Non-current assets and working capital, at replacement cost, net of deferred income taxes and non-current liabilities.
(v) ROACE (Return On Average Capital Employed)
Ratio of adjusted net operating income to average capital employed between the beginning and the end of the period.
Performance indicators excluding the adjustment items, such as adjusted incomes and ROACE are meant to facilitate the analysis of the financial performance and the comparison of income between periods.
Adjustment items
Adjustment items include:
(i) Special items
Due to their unusual nature or particular significance, certain transactions qualified as "special items" are excluded from the business segment figures. In general, special items relate to transactions that are significant, infrequent or unusual. However, in certain instances, transactions such as restructuring costs or assets disposals, which are not considered to be representative of the normal course of business, may be qualified as special items although they may have occurred within prior years or are likely to occur again within the coming years.
(ii) The inventory valuation effect
The adjusted results of the Refining & Chemicals and Marketing & Services segments are presented according to the replacement cost method. This method is used to assess the segments’ performance and facilitate the comparability of the segments’ performance with those of its main competitors.
In the replacement cost method, which approximates the LIFO (Last-In, First-Out) method, the variation of inventory values in the statement of income is, depending on the nature of the inventory, determined using either the month-end prices differential between one period and another or the average prices of the period rather than the historical value. The inventory valuation effect is the difference between the results according to the FIFO (First-In, First-Out) and the replacement cost methods.
(iii) Effect of changes in fair value
The effect of changes in fair value presented as adjustment items reflects for some transactions differences between internal measure of performance used by TOTAL’s management and the accounting for these transactions under IFRS.
IFRS requires that trading inventories be recorded at their fair value using period end spot prices. In order to best reflect the management of economic exposure through derivative transactions, internal indicators used to measure performance include valuations of trading inventories based on forward prices.
Furthermore, TOTAL, in its trading activities, enters into storage contracts, which future effects are recorded at fair value in the Group’s internal economic performance. IFRS precludes recognition of this fair value effect.
A) Information by business segment
For the year ended December 31, 2018 (M$) | Exploration & Production | Gas, Renewables & Power | Refining & Chemicals | Marketing & Services | Corporate | Intercompany | Total |
Non-Group sales | 10,989 | 16,136 | 92,025 | 90,206 | 7 | - | 209,363 |
Intersegment sales | 31,173 | 1,889 | 35,462 | 979 | 64 | (69,567) | - |
Excise taxes | - | - | (3,359) | (21,898) | - | - | (25,257) |
Revenues from sales | 42,162 | 18,025 | 124,128 | 69,287 | 71 | (69,567) | 184,106 |
Operating expenses | (18,304) | (17,434) | (120,393) | (66,737) | (796) | 69,567 | (154,097) |
Depreciation, depletion and impairment of tangible assets and mineral interests | (11,288) | (731) | (1,222) | (709) | (42) | - | (13,992) |
Operating income | 12,570 | (140) | 2,513 | 1,841 | (767) | - | 16,017 |
Net income (loss) from equity affiliates and other items | 2,686 | 318 | 782 | 307 | 77 | - | 4,170 |
Tax on net operating income | (6,068) | (173) | (445) | (532) | 375 | - | (6,843) |
Net operating income | 9,188 | 5 | 2,850 | 1,616 | (315) | - | 13,344 |
Net cost of net debt | (1,794) | ||||||
Non-controlling interests | (104) | ||||||
Net income - Group share | 11,446 | ||||||
For the year ended December 31, 2018 (adjustments) (a) (M$) | Exploration & Production | Gas, Renewables & Power | Refining & Chemicals | Marketing & Services | Corporate | Intercompany | Total |
Non-Group sales | - | 56 | - | - | - | - | 56 |
Intersegment sales | - | - | - | - | - | - | - |
Excise taxes | - | - | - | - | - | - | - |
Revenues from sales | - | 56 | - | - | - | - | 56 |
Operating expenses | (199) | (237) | (616) | (45) | (9) | - | (1,106) |
Depreciation, depletion and impairment of tangible assets and mineral interests | (1,256) | (516) | (2) | - | - | - | (1,774) |
Operating income (b) | (1,455) | (697) | (618) | (45) | (9) | - | (2,824) |
Net income (loss) from equity affiliates and other items | (335) | (40) | (116) | (5) | - | - | (496) |
Tax on net operating income | 768 | (14) | 205 | 14 | - | - | 973 |
Net operating income (b) | (1,022) | (751) | (529) | (36) | (9) | - | (2,347) |
Net cost of net debt | (67) | ||||||
Non-controlling interests | 301 | ||||||
Net income - Group share | (2,113) | ||||||
(a) Adjustments include special items, inventory valuation effect and the effect of changes in fair value. | |||||||
(b) Of which inventory valuation effect | |||||||
On operating income | - | - | (589) | (6) | - | ||
On net operating income | - | - | (413) | (5) | - | ||
For the year ended December 31, 2018 (adjusted) (M$) | Exploration & Production | Gas, Renewables & Power | Refining & Chemicals | Marketing & Services | Corporate | Intercompany | Total |
Non-Group sales | 10,989 | 16,080 | 92,025 | 90,206 | 7 | - | 209,307 |
Intersegment sales | 31,173 | 1,889 | 35,462 | 979 | 64 | (69,567) | - |
Excise taxes | - | - | (3,359) | (21,898) | - | - | (25,257) |
Revenues from sales | 42,162 | 17,969 | 124,128 | 69,287 | 71 | (69,567) | 184,050 |
Operating expenses | (18,105) | (17,197) | (119,777) | (66,692) | (787) | 69,567 | (152,991) |
Depreciation, depletion and impairment of tangible assets and mineral interests | (10,032) | (215) | (1,220) | (709) | (42) | - | (12,218) |
Adjusted operating income | 14,025 | 557 | 3,131 | 1,886 | (758) | - | 18,841 |
Net income (loss) from equity affiliates and other items | 3,021 | 358 | 898 | 312 | 77 | - | 4,666 |
Tax on net operating income | (6,836) | (159) | (650) | (546) | 375 | - | (7,816) |
Adjusted net operating income | 10,210 | 756 | 3,379 | 1,652 | (306) | - | 15,691 |
Net cost of net debt | (1,727) | ||||||
Non-controlling interests | (405) | ||||||
Adjusted net income - Group share | 13,559 | ||||||
For the year ended December 31, 2018 (M$) | Exploration & Production | Gas, Renewables & Power | Refining & Chemicals | Marketing & Services | Corporate | Intercompany | Total |
Total expenditures | 15,282 | 3,539 | 1,781 | 1,458 | 125 | - | 22,185 |
Total divestments | 4,952 | 931 | 919 | 428 | 9 | - | 7,239 |
Cash flow from operating activities (*) | 19,803 | (670) | 4,308 | 2,759 | (1,497) | - | 24,703 |
Balance sheet as of December 31, 2018 | |||||||
Property, plant and equipment, intangible assets, net | 116,518 | 8,502 | 10,493 | 6,343 | 390 | - | 142,246 |
Investments & loans in equity affiliates | 17,201 | 1,902 | 3,910 | 431 | - | - | 23,444 |
Other non-current assets | 6,258 | 1,636 | 663 | 1,155 | 881 | - | 10,593 |
Working capital | 1,652 | 679 | 32 | 194 | (4,064) | - | (1,507) |
Provisions and other non-current liabilities | (27,780) | (3,550) | (3,615) | (1,465) | 125 | - | (36,285) |
Assets and liabilities classified as held for sale | 1,036 | 92 | 151 | - | - | - | 1,279 |
Capital Employed (balance sheet) | 114,885 | 9,261 | 11,634 | 6,658 | (2,668) | - | 139,770 |
Less inventory valuation effect | - | - | (1,035) | (216) | - | - | (1,251) |
Capital Employed (Business segment information) | 114,885 | 9,261 | 10,599 | 6,442 | (2,668) | - | 138,519 |
ROACE as a percentage | 9% | 11% | 31% | 25% | 12% | ||
(*) As of January 1st, 2018, for a better reflection of the operating performance of the segments, financial expenses were all transferred to the Corporate segment. 2017 and 2016 comparative information has been restated.
For the year ended December 31, 2017 (M$) | Exploration & Production | Gas, Renewables & Power | Refining & Chemicals | Marketing & Services | Corporate | Intercompany | Total |
Non-Group sales | 8,477 | 12,854 | 75,505 | 74,634 | 23 | - | 171,493 |
Intersegment sales | 22,837 | 1,180 | 26,844 | 857 | 374 | (52,092) | - |
Excise taxes | - | - | (3,008) | (19,386) | - | - | (22,394) |
Revenues from sales | 31,314 | 14,034 | 99,341 | 56,105 | 397 | (52,092) | 149,099 |
Operating expenses | (14,672) | (13,828) | (94,097) | (53,629) | (1,107) | 52,092 | (125,241) |
Depreciation, depletion and impairment of tangible assets and mineral interests | (13,850) | (482) | (1,074) | (657) | (40) | - | (16,103) |
Operating income | 2,792 | (276) | 4,170 | 1,819 | (750) | - | 7,755 |
Net income (loss) from equity affiliates and other items | 1,546 | 31 | 2,979 | 497 | 54 | - | 5,107 |
Tax on net operating income | (2,233) | (140) | (944) | (561) | 540 | - | (3,338) |
Net operating income | 2,105 | (385) | 6,205 | 1,755 | (156) | - | 9,524 |
Net cost of net debt | (1,225) | ||||||
Non-controlling interests | 332 | ||||||
Net income - Group share | 8,631 | ||||||
For the year ended December 31, 2017 (adjustments) (a) (M$) | Exploration & Production | Gas, Renewables & Power | Refining & Chemicals | Marketing & Services | Corporate | Intercompany | Total |
Non-Group sales | - | (20) | - | - | - | - | (20) |
Intersegment sales | - | - | - | - | - | - | - |
Excise taxes | - | - | - | - | - | - | - |
Revenues from sales | - | (20) | - | - | - | - | (20) |
Operating expenses | (119) | (389) | 167 | (11) | (64) | - | (416) |
Depreciation, depletion and impairment of tangible assets and mineral interests | (4,308) | (291) | (53) | (10) | - | - | (4,662) |
Operating income (b) | (4,427) | (700) | 114 | (21) | (64) | - | (5,098) |
Net income (loss) from equity affiliates and other items | (328) | (116) | 2,177 | 102 | - | - | 1,835 |
Tax on net operating income | 875 | (54) | 124 | (2) | (114) | - | 829 |
Net operating income (b) | (3,880) | (870) | 2,415 | 79 | (178) | - | (2,434) |
Net cost of net debt | (29) | ||||||
Non-controlling interests | 516 | ||||||
Net income - Group share | (1,947) | ||||||
(a) Adjustments include special items, inventory valuation effect and the effect of changes in fair value. | |||||||
(b) Of which inventory valuation effect | |||||||
On operating income | - | - | 344 | 13 | - | ||
On net operating income | - | - | 298 | (3) | - | ||
For the year ended December 31, 2017 (adjusted) (M$) | Exploration & Production | Gas, Renewables & Power | Refining & Chemicals | Marketing & Services | Corporate | Intercompany | Total |
Non-Group sales | 8,477 | 12,874 | 75,505 | 74,634 | 23 | - | 171,513 |
Intersegment sales | 22,837 | 1,180 | 26,844 | 857 | 374 | (52,092) | - |
Excise taxes | - | - | (3,008) | (19,386) | - | - | (22,394) |
Revenues from sales | 31,314 | 14,054 | 99,341 | 56,105 | 397 | (52,092) | 149,119 |
Operating expenses | (14,553) | (13,439) | (94,264) | (53,618) | (1,043) | 52,092 | (124,825) |
Depreciation, depletion and impairment of tangible assets and mineral interests | (9,542) | (191) | (1,021) | (647) | (40) | - | (11,441) |
Adjusted operating income | 7,219 | 424 | 4,056 | 1,840 | (686) | - | 12,853 |
Net income (loss) from equity affiliates and other items | 1,874 | 147 | 802 | 395 | 54 | - | 3,272 |
Tax on net operating income | (3,108) | (86) | (1,068) | (559) | 654 | - | (4,167) |
Adjusted net operating income | 5,985 | 485 | 3,790 | 1,676 | 22 | - | 11,958 |
Net cost of net debt | (1,196) | ||||||
Non-controlling interests | (184) | ||||||
Ajusted net income - Group share | 10,578 | ||||||
For the year ended December 31, 2017 (M$) | Exploration & Production | Gas, Renewables & Power | Refining & Chemicals | Marketing & Services | Corporate | Intercompany | Total |
Total expenditures | 12,802 | 797 | 1,734 | 1,457 | 106 | - | 16,896 |
Total divestments | 1,918 | 73 | 2,820 | 413 | 40 | - | 5,264 |
Cash flow from operating activities (*) | 12,821 | 1,055 | 7,411 | 2,221 | (1,189) | - | 22,319 |
Balance sheet as of December 31, 2017 | |||||||
Property, plant and equipment, intangible assets, net | 103,639 | 2,873 | 10,820 | 6,253 | 399 | - | 123,984 |
Investments & loans in equity affiliates | 16,820 | 835 | 4,010 | 438 | - | - | 22,103 |
Other non-current assets | 6,975 | 1,709 | 677 | 1,060 | 496 | - | 10,917 |
Working capital | 3,224 | 123 | 876 | 792 | (3,650) | - | 1,365 |
Provisions and other non-current liabilities | (24,212) | (848) | (3,839) | (1,544) | (106) | - | (30,549) |
Assets and liabilities classified as held for sale | 1,475 | - | - | 166 | - | - | 1,641 |
Capital Employed (balance sheet) | 107,921 | 4,692 | 12,544 | 7,165 | (2,861) | - | 129,461 |
Less inventory valuation effect | - | - | (1,499) | (236) | 1 | - | (1,734) |
Capital Employed (Business segment information) | 107,921 | 4,692 | 11,045 | 6,929 | (2,860) | - | 127,727 |
ROACE as a percentage | 6% | 10% | 33% | 26% | 9% | ||
(*) As of January 1st, 2018, for a better reflection of the operating performance of the segments, financial expenses were all transferred to the Corporate segment. 2017 and 2016 comparative information has been restated.
For the year ended December 31, 2016 (M$) | Exploration & Production | Gas, Renewables & Power | Refining & Chemicals | Marketing & Services | Corporate | Intercompany | Total |
Non-Group sales | 7,629 | 10,124 | 65,632 | 66,351 | 7 | - | 149,743 |
Intersegment sales | 17,759 | 1,009 | 21,467 | 744 | 307 | (41,286) | - |
Excise taxes | - | - | (3,544) | (18,274) | - | - | (21,818) |
Revenues from sales | 25,388 | 11,133 | 83,555 | 48,821 | 314 | (41,286) | 127,925 |
Operating expenses | (14,236) | (10,993) | (77,562) | (46,432) | (1,006) | 41,286 | (108,943) |
Depreciation, depletion and impairment of tangible assets and mineral interests | (11,583) | (301) | (1,002) | (600) | (37) | - | (13,523) |
Operating income | (431) | (161) | 4,991 | 1,789 | (729) | - | 5,459 |
Net income (loss) from equity affiliates and other items | 1,375 | 71 | 779 | 170 | 426 | - | 2,821 |
Tax on net operating income | 401 | (4) | (1,244) | (541) | 164 | - | (1,224) |
Net operating income | 1,345 | (94) | 4,526 | 1,418 | (139) | - | 7,056 |
Net cost of net debt | (850) | ||||||
Non-controlling interests | (10) | ||||||
Net income - Group share | 6,196 | ||||||
For the year ended December 31, 2016 (adjustments) (a) (M$) | Exploration & Production | Gas, Renewables & Power | Refining & Chemicals | Marketing & Services | Corporate | Intercompany | Total |
Non-Group sales | - | (231) | - | - | - | - | (231) |
Intersegment sales | - | - | - | - | - | - | - |
Excise taxes | - | - | - | - | - | - | - |
Revenues from sales | - | (231) | - | - | - | - | (231) |
Operating expenses | (691) | (79) | 625 | (136) | - | - | (281) |
Depreciation, depletion and impairment of tangible assets and mineral interests | (2,089) | (139) | - | (1) | - | - | (2,229) |
Operating income (b) | (2,780) | (449) | 625 | (137) | - | - | (2,741) |
Net income (loss) from equity affiliates and other items | (200) | (135) | (93) | (40) | (4) | - | (472) |
Tax on net operating income | 1,108 | 51 | (201) | 36 | 1 | - | 995 |
Net operating income (b) | (1,872) | (533) | 331 | (141) | (3) | - | (2,218) |
Net cost of net debt | (23) | ||||||
Non-controlling interests | 150 | ||||||
Net income - Group share | (2,091) | ||||||
(a) Adjustments include special items, inventory valuation effect and the effect of changes in fair value. | |||||||
(b) Of which inventory valuation effect | |||||||
On operating income | - | - | 695 | (43) | - | ||
On net operating income | - | - | 500 | (13) | - | ||
For the year ended December 31, 2016 (adjusted) (M$) | Exploration & Production | Gas, Renewables & Power | Refining & Chemicals | Marketing & Services | Corporate | Intercompany | Total |
Non-Group sales | 7,629 | 10,355 | 65,632 | 66,351 | 7 | - | 149,974 |
Intersegment sales | 17,759 | 1,009 | 21,467 | 744 | 307 | (41,286) | - |
Excise taxes | - | - | (3,544) | (18,274) | - | - | (21,818) |
Revenues from sales | 25,388 | 11,364 | 83,555 | 48,821 | 314 | (41,286) | 128,156 |
Operating expenses | (13,545) | (10,914) | (78,187) | (46,296) | (1,006) | 41,286 | (108,662) |
Depreciation, depletion and impairment of tangible assets and mineral interests | (9,494) | (162) | (1,002) | (599) | (37) | - | (11,294) |
Adjusted operating income | 2,349 | 288 | 4,366 | 1,926 | (729) | - | 8,200 |
Net income (loss) from equity affiliates and Other items | 1,575 | 206 | 872 | 210 | 430 | - | 3,293 |
Tax on net operating income | (707) | (55) | (1,043) | (577) | 163 | - | (2,219) |
Adjusted net operating income | 3,217 | 439 | 4,195 | 1,559 | (136) | - | 9,274 |
Net cost of net debt | (827) | ||||||
Non-controlling interests | (160) | ||||||
Adjusted net income - Group share | 8,287 | ||||||
For the year ended December 31, 2016 (M$) | Exploration & Production | Gas, Renewables & Power | Refining & Chemicals | Marketing & Services | Corporate | Intercompany | Total |
Total expenditures | 16,085 | 1,221 | 1,861 | 1,245 | 118 | - | 20,530 |
Total divestments | 2,187 | 166 | 88 | 424 | 12 | - | 2,877 |
Cash flow from operating activities (*) | 9,866 | 589 | 4,584 | 1,833 | (351) | - | 16,521 |
Balance sheet as of December 31, 2016 | |||||||
Property, plant and equipment, intangible assets, net | 109,617 | 2,834 | 9,293 | 5,225 | 364 | - | 127,333 |
Investments & loans in equity affiliates | 15,853 | 883 | 3,303 | 537 | - | - | 20,576 |
Other non-current assets | 6,835 | 1,222 | 568 | 962 | 57 | - | 9,644 |
Working capital | 1,451 | 869 | 2,641 | 701 | (3,314) | - | 2,348 |
Provisions and other non-current liabilities | (26,139) | (832) | (3,569) | (1,330) | 218 | - | (31,652) |
Assets and liabilities classified as held for sale | - | - | 446 | - | - | - | 446 |
Capital Employed (balance sheet) | 107,617 | 4,976 | 12,682 | 6,095 | (2,675) | - | 128,695 |
Less inventory valuation effect | - | - | (1,064) | (211) | 3 | - | (1,272) |
Capital Employed (Business segment information) | 107,617 | 4,976 | 11,618 | 5,884 | (2,672) | - | 127,423 |
ROACE as a percentage | 3% | 9% | 38% | 27% | 7% | ||
(*) As of January 1st, 2018, for a better reflection of the operating performance of the segments, financial expenses were all transferred to the Corporate segment. 2017 and 2016 comparative information has been restated.
B) Reconciliation of the information by business segment with Consolidated Financial Statements
The table below presents the impact of adjustment items on the consolidated statement of income:
For the year ended December 31, 2018 (M$) | Adjusted | Adjustments (a) | Consolidated statement of income |
Sales | 209,307 | 56 | 209,363 |
Excise taxes | (25,257) | - | (25,257) |
Revenues from sales | 184,050 | 56 | 184,106 |
Purchases, net of inventory variation | (125,134) | (682) | (125,816) |
Other operating expenses | (27,060) | (424) | (27,484) |
Exploration costs | (797) | - | (797) |
Depreciation, depletion and impairment of tangible assets and mineral interests | (12,218) | (1,774) | (13,992) |
Other income | 1,518 | 320 | 1,838 |
Other expense | (448) | (825) | (1,273) |
Financial interest on debt | (1,866) | (67) | (1,933) |
Financial income and expense from cash & cash equivalents | (188) | - | (188) |
Cost of net debt | (2,054) | (67) | (2,121) |
Other financial income | 1,120 | - | 1,120 |
Other financial expense | (685) | - | (685) |
Net income (loss) from equity affiliates | 3,161 | 9 | 3,170 |
Income taxes | (7,489) | 973 | (6,516) |
Consolidated net income | 13,964 | (2,414) | 11,550 |
Group share | 13,559 | (2,113) | 11,446 |
Non-controlling interests | 405 | (301) | 104 |
(a) Adjustments include special items, inventory valuation effect and the effect of changes in fair value.
For the year ended December 31, 2017 (M$) | Adjusted | Adjustments (a) | Consolidated statement of income |
Sales | 171,513 | (20) | 171,493 |
Excise taxes | (22,394) | - | (22,394) |
Revenues from sales | 149,119 | (20) | 149,099 |
Purchases, net of inventory variation | (99,534) | 123 | (99,411) |
Other operating expenses | (24,427) | (539) | (24,966) |
Exploration costs | (864) | - | (864) |
Depreciation, depletion and impairment of tangible assets and mineral interests | (11,441) | (4,662) | (16,103) |
Other income | 772 | 3,039 | 3,811 |
Other expense | (389) | (645) | (1,034) |
Financial interest on debt | (1,367) | (29) | (1,396) |
Financial income and expense from cash & cash equivalents | (138) | - | (138) |
Cost of net debt | (1,505) | (29) | (1,534) |
Other financial income | 957 | - | 957 |
Other financial expense | (642) | - | (642) |
Net income (loss) from equity affiliates | 2,574 | (559) | 2,015 |
Income taxes | (3,858) | 829 | (3,029) |
Consolidated net income | 10,762 | (2,463) | 8,299 |
Group share | 10,578 | (1,947) | 8,631 |
Non-controlling interests | 184 | (516) | (332) |
(a) Adjustments include special items, inventory valuation effect and the effect of changes in fair value.
For the year ended December 31, 2016 (M$) | Adjusted | Adjustments (a) | Consolidated statement of income |
Sales | 149,974 | (231) | 149,743 |
Excise taxes | (21,818) | - | (21,818) |
Revenues from sales | 128,156 | (231) | 127,925 |
Purchases, net of inventory variation | (83,916) | 539 | (83,377) |
Other operating expenses | (23,832) | (470) | (24,302) |
Exploration costs | (914) | (350) | (1,264) |
Depreciation, depletion and impairment of tangible assets and mineral interests | (11,294) | (2,229) | (13,523) |
Other income | 964 | 335 | 1,299 |
Other expense | (537) | (490) | (1,027) |
Financial interest on debt | (1,085) | (23) | (1,108) |
Financial income and expense from cash & cash equivalents | 4 | - | 4 |
Cost of net debt | (1,081) | (23) | (1,104) |
Other financial income | 971 | - | 971 |
Other financial expense | (636) | - | (636) |
Net income (loss) from equity affiliates | 2,531 | (317) | 2,214 |
Income taxes | (1,965) | 995 | (970) |
Consolidated net income | 8,447 | (2,241) | 6,206 |
Group share | 8,287 | (2,091) | 6,196 |
Non-controlling interests | 160 | (150) | 10 |
(a) Adjustments include special items, inventory valuation effect and the effect of changes in fair value.
C) Additional information on adjustment items
The main adjustment items for 2018 consist of the "Asset impairment charges" of the non-current assets amounting to $(1,774) million in operating income and $(1,595) million in net income Group share. Impairment testing methodology and asset impairment charges recorded during the year are detailed in the paragraph D of Note 3.
Adjustments to operating income
For the year ended December 31, 2018 (M$) | Exploration & Production | Gas, Renewables & Power | Refining & Chemicals | Marketing & Services | Corporate | Total |
Inventory valuation effect | - | - | (589) | (6) | - | (595) |
Effect of changes in fair value | - | 48 | - | - | - | 48 |
Restructuring charges | (67) | - | (3) | - | - | (70) |
Asset impairment charges | (1,256) | (516) | (2) | - | - | (1,774) |
Other items | (132) | (229) | (24) | (39) | (9) | (433) |
Total | (1,455) | (697) | (618) | (45) | (9) | (2,824) |
Adjustments to net income, Group share
For the year ended December 31, 2018 (M$) | Exploration & Production | Gas, Renewables & Power | Refining & Chemicals | Marketing & Services | Corporate | Total |
Inventory valuation effect | - | - | (414) | (6) | - | (420) |
Effect of changes in fair value | - | 38 | - | - | - | 38 |
Restructuring charges | (94) | (10) | (34) | - | - | (138) |
Asset impairment charges | (1,259) | (288) | (48) | - | - | (1,595) |
Gains (losses) on disposals of assets | (14) | (2) | - | - | - | (16) |
Other items | 288 | (148) | (34) | (47) | (41) | 18 |
Total | (1,079) | (410) | (530) | (53) | (41) | (2,113) |
Adjustments to operating income
For the year ended December 31, 2017 (M$) | Exploration & Production | Gas, Renewables & Power | Refining & Chemicals | Marketing & Services | Corporate | Total |
Inventory valuation effect | - | - | 344 | 13 | - | 357 |
Effect of changes in fair value | - | (20) | - | - | - | (20) |
Restructuring charges | (42) | - | (4) | (3) | - | (49) |
Asset impairment charges | (4,308) | (291) | (53) | (10) | - | (4,662) |
Other items | (77) | (389) | (173) | (21) | (64) | (724) |
Total | (4,427) | (700) | 114 | (21) | (64) | (5,098) |
Adjustments to net income, Group share
For the year ended December 31, 2017 (M$) | Exploration & Production | Gas, Renewables & Power | Refining & Chemicals | Marketing & Services | Corporate | Total |
Inventory valuation effect | - | - | 295 | (13) | - | 282 |
Effect of changes in fair value | - | (16) | - | - | - | (16) |
Restructuring charges | (11) | (11) | (42) | (2) | - | (66) |
Asset impairment charges | (3,583) | (238) | (53) | (10) | - | (3,884) |
Gains (losses) on disposals of assets | 188 | - | 2,139 | 125 | - | 2,452 |
Other items | (287) | (293) | 73 | (30) | (178) | (715) |
Total | (3,693) | (558) | 2,412 | 70 | (178) | (1,947) |
Adjustments to operating income
For the year ended December 31, 2016 (M$) | Exploration & Production | Gas, Renewables & Power | Refining & Chemicals | Marketing & Services | Corporate | Total |
Inventory valuation effect | - | - | 695 | (43) | - | 652 |
Effect of changes in fair value | - | (4) | - | - | - | (4) |
Restructuring charges | (19) | (18) | - | - | - | (37) |
Asset impairment charges | (2,089) | (139) | - | (1) | - | (2,229) |
Other items | (672) | (288) | (70) | (93) | - | (1,123) |
Total | (2,780) | (449) | 625 | (137) | - | (2,741) |
Adjustments to net income, Group share
For the year ended December 31, 2016 (M$) | Exploration & Production | Gas, Renewables & Power | Refining & Chemicals | Marketing & Services | Corporate | Total |
Inventory valuation effect | - | - | 498 | (19) | - | 479 |
Effect of changes in fair value | - | (3) | - | - | - | (3) |
Restructuring charges | (4) | (28) | - | - | - | (32) |
Asset impairment charges | (1,867) | (131) | (78) | (18) | (3) | (2,097) |
Gains (losses) on disposals of assets | 287 | 5 | - | (25) | - | 267 |
Other items | (293) | (237) | (91) | (84) | - | (705) |
Total | (1,877) | (394) | 329 | (146) | (3) | (2,091) |
D) Asset impairment
Accounting principles The recoverable amounts of intangible assets and property, plant and equipment are tested for impairment as soon as any indication of impairment exists. This test is performed at least annually for goodwill. The recoverable amount is the higher of the fair value (less costs to sell) or its value in use. Assets are grouped into cash-generating units (or CGUs) and tested. A CGU is a homogeneous set of assets that generates cash inflows that are largely independent of the cash inflows from other groups of assets. The value in use of a CGU is determined by reference to the discounted expected future cash flows of these assets, based upon Management’s expectation of future economic and operating conditions. When this value is less than the carrying amount of the CGU, an impairment loss is recorded. This loss is allocated first to goodwill with a corresponding amount in "Other expenses". Any further losses are then allocated to property, plant and mineral interests with a corresponding amount in "Depreciation, depletion and impairment of tangible assets and mineral interests" and to other intangible assets with a corresponding amount in "Other expenses". Impairment losses recognized in prior periods can be reversed up to the original carrying amount, had the impairment loss not been recognized. Impairment losses recognized for goodwill cannot be reversed. |
For the financial year 2018, asset impairments were recorded for an amount of $1,774 million in operating income and $1,595 million in net income, Group share. These impairments were qualified as adjustment items of the operating income and net income, Group share.
Impairments relate to certain cash-generating units (CGUs) for which indicators of impairment have been identified, due to changes in operating conditions or the economic environment of the activities concerned.
The principles applied are as follows:
-the future cash flows were determined using the assumptions included in the 2019 budget and in the long-term plan of the Group approved by the Group Executive Committee and the Board of Directors. These assumptions, including in particular future prices of products, operational costs, estimation of oil and gas reserves, future volumes produced and marketed, represent the best estimate of the Group management of all economic and technical conditions over the remaining life of the assets;
-the Group, notably relying on data on global energy demand from the "World Energy Outlook" issued by IEA since 2016 and on its own supply assessments, determines the oil & gas prices scenarios based on assumptions about the evolution of core indicators of the Upstream activity (demand for oil & gas products in different markets, investment forecasts, decline in production fields, changes in oil & gas reserves and supply by area and by nature of oil & gas products), of the Downstream activity (changes in refining capacity and demand for petroleum products) and by integrating challenges raised by the climate.
These price scenarios, first prepared within the Strategy and Climate Division, are also reviewed by the Group segments which bring their own expertise. They also integrate studies issued by international agencies, banks and independent consultants. They are then approved by the Executive Committee and the Board of Directors.
The IEA 2018 World Energy Outlook anticipates three scenarios (New Policies Scenario (NPS), Current Policies Scenario (CPS) and Sustainable Development Scenario (SDS)). Among these scenarios, the NPS (central scenario of the IEA) and the SDS are important references for the Group.
The NPS takes into account the measures already implemented by the countries in the energy field as well as the effects of the policies announced by the Governments (including the Nationally Determined Contributions - NDC - of the Paris Climate Agreement). The SDS takes into account the necessary measures to achieve the energy-related goals set in the "2030 Agenda for Sustainable Development" adopted in 2015 by the UN members.
The NPS sees a significant increase in oil and gas demand until 2025 and then a slower growth until 2040 (despite a significant penetration of electric vehicles and, above all, significant efficiency gains). The SDS sees a decline in demand in the first half of the 2020s for oil and a stabilization after 2030 for gas due to the substitution efforts and an accelerated diffusion of efficiency gains.
In this context, given the need for the industry to make very substantial investments to cope with the natural decline of the fields and meet the oil demand predicted by these scenarios over the next 20 years:
-The crude oil price level considered to determine the recoverable value of CGUs amounts to 60 dollars per barrel of Brent in 2019-2020. This price rises to reach 80 dollars in 2021 and inflates after 2024.
-For gas, the price level considered to determine the recoverable value of concerned CGUs for 2019 amounts to $5.5 per million BTU for the NBP price (Europe). It reaches $7 per million BTU in 2021, and will inflate after 2024;
-the future operational costs were determined by taking into account the existing technologies, the fluctuation of prices for petroleum services in line with market developments and the internal cost reduction programs effectively implemented;
-the future cash flows are estimated over a period consistent with the life of the assets of the CGUs. They are prepared post-tax and take into account specific risks related to the CGUs’ assets. They are discounted using a 7% post-tax discount rate, this rate being the weighted-average cost of capital estimated from historical market data. This rate was 7% in 2017 and 2016. The value in use calculated by discounting the above post-tax cash flows using a 7% post-tax discount rate is not materially different from the value in use calculated by discounting pre-tax cash flows using a pre-tax discount rate determined by an iterative computation from the post-tax value in use. These pre-tax discount rates generally ranged from 7% to 16% in 2018.
The CGUs of the Exploration & Production segment are defined as oil and gas fields or groups of oil and gas fields with industrial assets enabling the production, treatment and evacuation of the oil and gas. For the financial year 2018, impairments of assets were recognized over CGUs of the Exploration & Production segment for an impact of $1,256 million in operating income and $1,259 million in net income, Group share. Impairments recognized in 2018 relate to:
-Ichthys project in Australia for an amount of $549 million in operating income and $608 million in net income, Group share: TOTAL adapted the value of the assets in consequence of the divestiture amount of 4% of its interest in the project;
-other assets mainly located in Algeria, Colombia and Congo for an amount in the range of $600 million in operating income and in net income, Group share.
As for the sensitivites:
-a decrease by one point in the discount rate would have a positive impact of approximately $0.5 billion in operating income and $0.4 billion in net income, Group share;
-an increase by one point in the discount rate would have an additional negative impact of approximately $0.9 billion in operating income and approximately $0.7 billion in net income, Group share;
-a variation of -10% of the oil and gas prices over the duration of the plan would have an additional negative impact of approximately $2.7 billion in operating income and $2.2 billion in net income, Group share.
The most sensitive assets would be the assets already impaired in 2018 or before (impact of approximately $2.7 billion in operating income and $2.2 billion in net income, Group share), especially Ichthys in Australia and assets in Canada.
The CGUs of the Gas, Renewables & Power segment are subsidiaries or groups of subsidiaries organized by activity or geographical area. In financial year 2018, the Group recorded impairments on CGUs in the Gas, Renewables & Power segment for $516 million in operating income and $288 million in net income, Group share. These impairments relate to SunPower in the US due to the depressed economic environment of solar activity.
The CGUs of the Refining & Chemicals segment are defined as legal entities with operational activities for refining and petrochemicals activities. Future cash flows are based on the gross contribution margin (calculated on the basis of net sales after purchases of crude oil and refined products, the effect of inventory valuation and variable costs). The other activities of the segment are global divisions, each division gathering a set of businesses or homogeneous products for strategic, commercial and industrial plans. Future cash flows are determined from the specific margins of these activities, unrelated to the price of oil. No significant impairment has been recorded for the CGUs of the Refining & Chemicals segment in financial year 2018.
The CGUs of the Marketing & Services segment are subsidiaries or groups of subsidiaries organized by geographical area. No impairment has been recorded for the CGUs of the Marketing & Services segment in financial year 2018.
For financial year 2017, the Group recorded impairments in Exploration & Production, Gas, Renewables & Power, Refining & Chemicals and Marketing & Services segments for an amount of $4,662 million in operating income and $3,884 million in net income, Group share. These impairments were qualified as adjustments items of the operating income and net income, Group share.
In financial year 2016, the Group recognized impairments of assets in the Exploration & Production, Gas, Renewables & Power, Refining & Chemicals and Marketing & Services segments for an impact of $2,229 million in operating income and of $2,097 income and net income, Group share. These impairments were qualified as adjustment items of the operating income and net income, Group share.
No significant reversal of impairment was accounted for in respect of the financial years 2016, 2017 and 2018.
(M$) | France | Rest of Europe | North | Africa | Rest of the world | Total |
For the year ended December 31, 2018 | ||||||
Non-Group sales | 47,716 | 99,465 | 22,243 | 22,263 | 17,676 | 209,363 |
Property, plant and equipment, intangible assets, net | 12,561 | 25,262 | 18,903 | 43,359 | 42,161 | 142,246 |
Capital expenditures | 4,502 | 2,609 | 2,014 | 4,838 | 8,222 | 22,185 |
For the year ended December 31, 2017 | ||||||
Non-Group sales | 39,032 | 83,255 | 16,889 | 17,581 | 14,736 | 171,493 |
Property, plant and equipment, intangible assets, net | 6,397 | 18,260 | 18,469 | 42,849 | 38,009 | 123,984 |
Capital expenditures | 1,193 | 2,805 | 2,916 | 5,030 | 4,952 | 16,896 |
For the year ended December 31, 2016 | ||||||
Non-Group sales | 33,472 | 71,551 | 15,383 | 15,294 | 14,043 | 149,743 |
Property, plant and equipment, intangible assets, net | 5,361 | 20,647 | 19,154 | 45,032 | 37,139 | 127,333 |
Capital expenditures | 1,835 | 3,842 | 2,825 | 6,859 | 5,169 | 20,530 |
Items related to the statement of income
5.1 Net sales
Accounting policies IFRS 15 requires identification of the performance obligations for the transfer of goods and services in each contract with customers. Revenue is recognized upon satisfaction of the performance obligations for the amounts that reflect the consideration to which the Group expects to be entitled in exchange for those goods and services. Sales of goods Revenues from sales are recognized when the control has been transferred to the buyer and the amount can be reasonably measured. Revenues from sales of crude oil and natural gas are recorded upon transfer of title, according to the terms of the sales contracts. Revenues from the production of crude oil and natural gas properties, in which the Group has an interest with other producers, are recognized based on actual entitlement volumes sold over the period. Any difference between entitlement volumes and volumes sold, based on the Group net working interest, are recognized in the "Under-lifting" and "Over-lifting" accounts in the balance sheet and in operating expenses in the profit and loss. Quantities delivered that represent production royalties and taxes, when paid in cash, are included in oil and gas revenues, except for the United States and Canada. Certain transactions within the trading activities (contracts involving quantities that are purchased from third parties then resold to third parties) are shown at their net value in sales. Exchanges of crude oil and petroleum products within normal trading activities do not generate any income and therefore these flows are shown at their net value in both the statement of income and the balance sheet. Sales of services Revenues from services are recognized when the services have been rendered. Revenues from gas transport are recognized when services are rendered. These revenues are based on the quantities transported and measured according to procedures defined in each service contract. Shipping revenues and expenses from time-charter activities are recognized on a pro rata basis over a period that commences upon the unloading of the previous voyage and terminates upon the unloading of the current voyage. Shipping revenue recognition starts only when a charter has been agreed to by both the Group and the customer. Income related to the distribution of electricity and gas are not recognized in revenues because the Group acts as an agent in this transaction. The Group is not responsible for the delivery and does not set the price of the service, because it can only pass on to the customer the amounts invoiced to it by the distributors. Solar Farm Development Projects SunPower develops and sells solar farm projects. This activity generally contains a property component (land ownership or an interest in land rights). The revenue associated with the development of these projects is recognized when the project-entities and land rights are irrevocably sold. Revenues under contracts for construction of solar systems are recognized based on the progress of construction works, measured according to the percentage of costs incurred relative to total forecast costs. Excise taxes Excise taxes are rights or taxes which amount is calculated based on the quantity of oil and gas products put on the market. Excise taxes are determined by the states. They are paid directly to the customs and tax authorities and then invoiced to final customers by being included in the sales price. The analysis of the criteria set by IFRS 15 led the Group to determine that it was acting as principal in these transactions. Therefore sales include excise taxes collected by the Group within the course of its oil distribution operations. Excise taxes are deducted from sales in order to obtain the "Revenues from sales" indicator. |
5.2 Operating expenses and research and development
Accounting policies The Group applies IFRS 6 "Exploration for and Evaluation of Mineral Resources". Oil and gas exploration and production properties and assets are accounted for in accordance with the Successful Efforts method. Geological and geophysical costs, including seismic surveys for exploration purposes are expensed as incurred in exploration costs. Costs of dry wells and wells that have not found proved reserves are charged to expense in exploration costs. |
5.2.1 Operating expenses
For the year ended December 31, (M$) | 2018 | 2017 | 2016 |
Purchases, net of inventory variation (a) (b) | (125,816) | (99,411) | (83,377) |
Exploration costs | (797) | (864) | (1,264) |
Other operating expenses (c) | (27,484) | (24,966) | (24,302) |
of which non-current operating liabilities (allowances) reversals | 1,068 | 280 | 369 |
of which current operating liabilities (allowances) reversals | (202) | 66 | (58) |
Operating expenses | (154,097) | (125,241) | (108,943) |
(a) Includes taxes paid on oil and gas production in the Exploration & Production segment, amongst others royalties.
(b) The Group values under/over lifting at market value.
(c) Principally composed of production and administrative costs (see in particular the payroll costs as detailed in Note 10 to the Consolidated Financial Statements "Payroll, staff and employee benefits obligations").
5.2.2 Research and development costs
Accounting policies Research costs are charged to expense as incurred. Development expenses are capitalized when the criteria of IAS38 are met. |
Research and development costs incurred by the Group in 2018 and booked in operating expenses amount to $986 million ($912 million in 2017 and $1,050 million in 2016), corresponding to 0.47% of the sales.
The staff dedicated in 2018 to these research and development activities are estimated at 4,288 people (4,132 in 2017 and 4,939 in 2016).
5.3 Amortization, depreciation and impairment of tangible assets and mineral interests
The amortization, depreciation and impairment of tangible assets and mineral interests are detailed as follows:
For the year ended December 31, (M$) | 2018 | 2017 | 2016 |
Depreciation and impairment of tangible assets | (13,364) | (14,782) | (12,615) |
Amortization and impairment of mineral assets | (628) | (1,321) | (908) |
Total | (13,992) | (16,103) | (13,523) |
Items related to balance sheet
5.4 Working capital
5.4.1 Inventories
Accounting policies Inventories are measured in the Consolidated Financial Statements at the lower of historical cost or market value. Costs for petroleum and petrochemical products are determined according to the FIFO (First-In, First-Out) method or weighted-average cost method and other inventories are measured using the weighted-average cost method. In addition stocks held for trading are measured at fair value less costs of sale. Refining & Chemicals Petroleum product inventories are mainly comprised of crude oil and refined products. Refined products principally consist of gasoline, distillate and fuel produced by the Group’s refineries. The turnover of petroleum products does not exceed more than two months on average. Crude oil costs include raw material and receiving costs. Refining costs principally include crude oil costs, production costs (energy, labor, depreciation of producing assets) and an allocation of production overheads (taxes, maintenance, insurance, etc.). Costs of chemical product inventories consist of raw material costs, direct labor costs and an allocation of production overheads. Start-up costs, general administrative costs and financing costs are excluded from the costs of refined and chemicals products. Marketing & Services The costs of refined products include mainly raw materials costs, production costs (energy, labor, depreciation of producing assets) and an allocation of production overheads (taxes, maintenance, insurance, etc.). General administrative costs and financing costs are excluded from the cost price of refined products. Product inventories purchased from entities external to the Group are valued at their purchase cost plus primary costs of transport. |
Carbon dioxide emission rights In the absence of a current IFRS standard or interpretation on accounting for emission rights of carbon dioxide, the following principles are applied: -emission rights are managed as a cost of production and as such are recognized in inventories: -emission rights allocated for free are booked in inventories with a nil carrying amount, -purchased emission rights are booked at acquisition cost, -sales or annual restorations of emission rights consist of decreases in inventories recognized based on a weighted average cost, -if the carrying amount of inventories at closing date is higher than the market value, an impairment loss is recorded; -at each closing, a provision is recorded in order to materialize the obligation to surrender emission rights related to the emissions of the period. This provision is calculated based on estimated emissions of the period, valued at weighted average cost of the inventories at the end of the period. It is reversed when the emission rights are surrendered; -if emission rights to be surrendered at the end of the compliance period are higher than emission rights recorded in inventories, the shortage is accounted for as a liability at market value; -forward transactions are recognized at their fair market value in the balance sheet. Changes in the fair value of such forward transactions are recognized in the statement of income. Energy savings certificates In the absence of current IFRS standards or interpretations on accounting for energy savings certificates (ESC), the following principles are applied: -if the obligations linked to the sales of energy are greater than the number of ESC’s held then a liability is recorded. These liabilities are valued based on the price of the last transactions; -in the event that the number of ESC’s held exceeds the obligation at the balance sheet date this is accounted for as inventory. Otherwise a valuation allowance is recorded; -ESC inventories are valued at weighted average cost (acquisition cost for those ESC’s acquired or cost incurred for those ESC’s generated internally). If the carrying value of the inventory of certificates at the balance sheet date is higher than the market value, an impairment loss is recorded. |
As of December 31, 2018 (M$) | Gross value | Valuation allowance | Net value |
Crude oil and natural gas | 2,382 | (110) | 2,272 |
Refined products | 5,464 | (242) | 5,222 |
Chemicals products | 1,087 | (54) | 1,033 |
Trading inventories | 3,918 | - | 3,918 |
Other inventories | 3,372 | (937) | 2,435 |
Total | 16,223 | (1,343) | 14,880 |
As of December 31, 2017 (M$) | Gross value | Valuation allowance | Net value |
Crude oil and natural gas | 2,658 | - | 2,658 |
Refined products | 5,828 | (36) | 5,792 |
Chemicals products | 1,089 | (58) | 1,031 |
Trading inventories | 4,320 | - | 4,320 |
Other inventories | 3,632 | (913) | 2,719 |
Total | 17,527 | (1,007) | 16,520 |
As of December 31, 2016 (M$) | Gross value | Valuation allowance | Net value |
Crude oil and natural gas | 2,215 | (7) | 2,208 |
Refined products | 4,577 | (30) | 4,547 |
Chemicals products | 877 | (58) | 819 |
Trading inventories | 4,613 | - | 4,613 |
Other inventories | 3,936 | (876) | 3,060 |
Total | 16,218 | (971) | 15,247 |
Changes in the valuation allowance on inventories are as follows:
For the year ended December 31, (M$) | Valuation allowance as of January 1, | Increase (net) | Currency translation adjustment and other variations | Valuation allowance as of December 31, |
2018 | (1,007) | (359) | 23 | (1,343) |
2017 | (971) | 9 | (45) | (1,007) |
2016 | (1,068) | 41 | 56 | (971) |
5.4.2 Accounts receivable and other current assets
As of December 31, 2018 (M$) | Gross value | Valuation allowance | Net value |
Accounts receivable | 17,894 | (624) | 17,270 |
Recoverable taxes | 4,090 | - | 4,090 |
Other operating receivables | 10,306 | (573) | 9,733 |
Prepaid expenses | 837 | - | 837 |
Other current assets | 64 | - | 64 |
Other current assets | 15,297 | (573) | 14,724 |
As of December 31, 2017 (M$) | Gross value | Valuation allowance | Net value |
Accounts receivable | 15,469 | (576) | 14,893 |
Recoverable taxes | 4,029 | - | 4,029 |
Other operating receivables | 9,797 | (461) | 9,336 |
Prepaid expenses | 786 | - | 786 |
Other current assets | 59 | - | 59 |
Other current assets | 14,671 | (461) | 14,210 |
As of December 31, 2016 (M$) | Gross value | Valuation allowance | Net value |
Accounts receivable | 12,809 | (596) | 12,213 |
Recoverable taxes | 3,180 | - | 3,180 |
Other operating receivables | 10,618 | (400) | 10,218 |
Prepaid expenses | 1,399 | - | 1,399 |
Other current assets | 38 | - | 38 |
Other current assets | 15,235 | (400) | 14,835 |
Changes in the valuation allowance on "Accounts receivable" and "Other current assets" are as follows:
For the year ended December 31, (M$) | Valuation allowance as of January 1, | Increase (net) | Currency translation adjustment and other variations | Valuation allowance as of December 31, |
Accounts receivable | ||||
2018 | (576) | (62) | 14 | (624) |
2017 | (596) | 53 | (33) | (576) |
2016 | (544) | (17) | (35) | (596) |
Other current assets | ||||
2018 | (461) | (148) | 36 | (573) |
2017 | (400) | (58) | (3) | (461) |
2016 | (426) | 33 | (7) | (400) |
As of December 31, 2018, the net portion of the overdue receivables included in "Accounts receivable" and "Other current assets" was $3,767 million, of which $1,993 million was due in less than 90 days, $273 million was due between 90 days and 6 months, $450 million was due between 6 and 12 months and $1,051 million was due after 12 months.
As of December 31, 2017, the net portion of the overdue receivables included in "Accounts receivable" and "Other current assets" was $3,156 million, of which $1,682 million was due in less than 90 days, $235 million was due between 90 days and 6 months, $350 million was due between 6 and 12 months and $889 million was due after 12 months.
As of December 31, 2016, the net portion of the overdue receivables included in "Accounts receivable" and "Other current assets" was $3,525 million, of which $1,273 million was due in less than 90 days, $1,013 million was due between 90 days and 6 months, $538 million was due between 6 and 12 months and $701 million was due after 12 months.
5.4.3 Other creditors and accrued liabilities
As of December 31, (M$) | 2018 | 2017 | 2016 |
Accruals and deferred income | 546 | 419 | 424 |
Payable to States (including taxes and duties) | 6,861 | 5,786 | 5,455 |
Payroll | 1,553 | 1,439 | 1,225 |
Other operating liabilities | 13,286 | 10,135 | 9,616 |
Total | 22,246 | 17,779 | 16,720 |
As of December 31, 2018, the heading "Other operating liabilities" includes mainly the second quarterly interim dividend for the fiscal year 2018 for $1,911 million, which was paid in January 2019 and the third quarterly interim dividend for the fiscal year 2018 for $1,912 million, which will be paid in April 2019.
As of December 31, 2017, the heading "Other operating liabilities" included mainly the second quarterly interim dividend for the fiscal year 2017 for $1,883 million, which was paid in January 2018 and the third quarterly interim dividend for the fiscal year 2017 for $1,912 million, which was paid in April 2018.
As of December 31, 2016, the heading "Other operating liabilities" included mainly the second quarterly interim dividend for the fiscal year 2016 for $1,592 million, which was paid in January 2017 and the third quarterly interim dividend for the fiscal year 2016 for $1,593 million, which was paid in April 2017.
Items related to the cash flow statement
5.5 Cash flow from operating activities
Accounting policies The Consolidated Statement of Cash Flows prepared in currencies other than dollar has been translated into dollars using the exchange rate on the transaction date or the average exchange rate for the period. Currency translation differences arising from the translation of monetary assets and liabilities denominated in foreign currency into dollars using the closing exchange rates are shown in the Consolidated Statement of Cash Flows under "Effect of exchange rates". Therefore, the Consolidated Statement of Cash Flows will not agree with the figures derived from the consolidated balance sheet. |
The following table gives additional information on cash paid or received in the cash flow from operating activities:
Detail of interest, taxes and dividends
For the year ended December 31, (M$) | 2018 | 2017 | 2016 |
Interests paid | (1,818) | (1,305) | (1,028) |
Interests received | 164 | 82 | 90 |
Income tax paid (a) | (5,024) | (4,013) | (2,892) |
Dividends received | 2,456 | 2,219 | 1,702 |
(a) These amounts include taxes paid in kind under production-sharing contracts in Exploration & Production.
Detail of changes in working capital
For the year ended December 31, (M$) | 2018 | 2017 | 2016 |
Inventories | 1,430 | (476) | (2,475) |
Accounts receivable | (1,461) | (1,897) | (1,916) |
Other current assets | (364) | 1,274 | 185 |
Accounts payable | (822) | 2,339 | 2,546 |
Other creditors and accrued liabilities | 1,986 | (413) | 541 |
Net amount, Decrease (Increase) | 769 | 827 | (1,119) |
Detail of changes in provisions and deferred taxes
As of December 31, (M$) | 2018 | 2017 | 2016 |
Accruals | (432) | 3 | 382 |
Deferred taxes | (455) | (387) | (1,941) |
Total | (887) | (384) | (1,559) |
6.1 Other income and other expense
For the year ended December 31, (M$) | 2018 | 2017 | 2016 |
Gains on disposal of assets | 1,041 | 2,784 | 479 |
Foreign exchange gains | 252 | 785 | 548 |
Other | 545 | 242 | 272 |
Other income | 1,838 | 3,811 | 1,299 |
Losses on disposal of assets | (111) | (186) | (216) |
Foreign exchange losses | (444) | - | - |
Amortization of other intangible assets (excl. mineral interests) | (225) | (192) | (344) |
Other | (493) | (656) | (467) |
Other expense | (1,273) | (1,034) | (1,027) |
Other income
In 2018, gains on disposal of assets are mainly related to the sale of assets and interests in Norway, Canada and Gabon in the Exploration & Production segment, to the sale of Dunkerque LNG SAS and SunPower assets in the Gas Renewables & Power segment and the sale of TotalErg and Total Haiti in the Marketing & Services segment.
In 2017, gains on disposal of assets mainly related to the sale of Atotech in the Refining & Chemicals segment and to the sale of assets in Gabon in the Exploration & Production segment.
In 2016, gains on disposal of assets mainly related to sales of assets in United-Kingdom in the Exploration & Production segment.
Other expense
In 2018,the heading "Other" mainly consists of the restructuring charges in the Exploration & Production, Gas Renewables & Power and Refining & Chemicals segments for an amount of $179 million, $77 million of the impairment of non-consolidated shares and loans granted to non-consolidated subsidiaries and equity affiliates.
In 2017, losses on disposal mainly related to the sale of 15% interests in the Gina Krog field in Norway. The heading "Other" mainly consisted of the impairment of non-consolidated shares and loans granted to non-consolidated subsidiaries and equity affiliates for an amount of $172 million and $64 million of restructuring charges in the Exploration & Production, Gas Renewables & Power and Refining & Chemicals segments.
In 2016, the loss on disposals mainly related to the sale of 20% of interests in Kharyaga in Russia. The heading "Other" mainly consisted of the impairment of non-consolidated shares and loans granted to non-consolidated subsidiaries and equity affiliates for an amount of $142 million and $37 million of restructuring charges in the Refining & Chemicals and Marketing & Services segments.
6.2 Other financial income and expense
As of December 31, (M$) | 2018 | 2017 | 2016 |
Dividend income on non-consolidated subsidiaries | 171 | 167 | 170 |
Capitalized financial expenses | 519 | 460 | 477 |
Other | 430 | 330 | 324 |
Other financial income | 1,120 | 957 | 971 |
Accretion of asset retirement obligations | (530) | (544) | (523) |
Other | (155) | (98) | (113) |
Other financial expense | (685) | (642) | (636) |
6.3 Other non-current assets
As of December 31, 2018 (M$) | Gross value | Valuation allowance | Net value |
Loans and advances (a) | 2,180 | (303) | 1,877 |
Other non-current financial assets related to operational activities | 471 | - | 471 |
Other | 161 | - | 161 |
Total | 2,812 | (303) | 2,509 |
As of December 31, 2017 (M$) | Gross value | Valuation allowance | Net value |
Loans and advances (a) | 3,237 | (359) | 2,878 |
Other non-current financial assets related to operational activities | 937 | - | 937 |
Other | 169 | - | 169 |
Total | 4,343 | (359) | 3,984 |
As of December 31, 2016 (M$) | Gross value | Valuation allowance | Net value |
Loans and advances (a) | 3,334 | (286) | 3,048 |
Other non-current financial assets related to operational activities | 1,069 | - | 1,069 |
Other | 26 | - | 26 |
Total | 4,429 | (286) | 4,143 |
(a) Excluding loans to equity affiliates.
Changes in the valuation allowance on loans and advances are detailed as follows:
For the year ended December 31, (M$) | Valuation allowance as of January 1, | Increases | Decreases | Currency translation adjustment and other variations | Valuation allowance as of December 31, |
2018 | (359) | (5) | 35 | 26 | (303) |
2017 | (286) | (50) | 11 | (34) | (359) |
2016 | (280) | (15) | 7 | 2 | (286) |
7.1 Intangible assets
Accounting policies Exploration costs The Group applies IFRS 6 "Exploration for and Evaluation of Mineral Resources". Oil and gas exploration and production properties and assets are accounted for in accordance with the Successful Efforts method. Mineral interests are tested for impairment on a regular basis, property-by-property, based on the results of the exploratory activity and the management’s evaluation. In the event of a discovery, the unproved mineral interests are transferred to proved mineral interests at their net book value as soon as proved reserves are booked. Exploratory wells are tested for impairment on a well-by-well basis and accounted for as follows: -costs of exploratory wells which result in proved reserves are capitalized and then depreciated using the unit-of-production method based on proved developed reserves; -costs of exploratory wells are temporarily capitalized until a determination is made as to whether the well has found proved reserves if both of the following conditions are met: -the well has found a sufficient quantity of reserves to justify, if appropriate, its completion as a producing well, assuming that the required capital expenditures are made; -the Group is making sufficient progress assessing the reserves and the economic and operating viability of the project. This progress is evaluated on the basis of indicators such as whether additional exploratory works are under way or firmly planned (wells, seismic or significant studies), whether costs are being incurred for development studies and whether the Group is waiting for governmental or other third-party authorization of a proposed project, or availability of capacity on an existing transport or processing facility. Costs of exploratory wells not meeting these conditions are charged to exploration costs. Proved mineral interests are depreciated using the unit-of-production method based on proved reserves. The corresponding expense is recorded as depreciation of tangible assets and mineral interests. Goodwill and other intangible assets excluding mineral interests Other intangible assets include patents, trademarks, and lease rights. Intangible assets are carried at cost, after deducting any accumulated amortization and accumulated impairment losses. Guidance for calculating goodwill is presented in Note 1.1 paragraph B to the Consolidated Financial Statements. Goodwill is not amortized but is tested for impairment at least annually and as soon as there is any indication of impairment. Intangible assets (excluding mineral interests) that have a finite useful life are amortized on a straight-line basis over three to twenty years depending on the useful life of the assets. The corresponding expense is recorded under other expense. |
As of December 31, 2018 (M$) | Cost | Amortization and impairment | Net |
Goodwill | 9,188 | (1,014) | 8,174 |
Proved mineral interests | 14,775 | (7,947) | 6,828 |
Unproved mineral interests | 16,712 | (4,491) | 12,221 |
Other intangible assets | 5,824 | (4,125) | 1,699 |
Total intangible assets | 46,499 | (17,577) | 28,922 |
As of December 31, 2017 (M$) | Cost | Amortization and impairment | Net |
Goodwill | 2,442 | (1,015) | 1,427 |
Proved mineral interests | 13,081 | (7,674) | 5,407 |
Unproved mineral interests | 11,686 | (5,324) | 6,362 |
Other intangible assets | 4,831 | (3,440) | 1,391 |
Total intangible assets | 32,040 | (17,453) | 14,587 |
As of December 31, 2016 (M$) | Cost | Amortization and impairment | Net |
Goodwill | 2,159 | (1,002) | 1,157 |
Proved mineral interests | 13,347 | (6,985) | 6,362 |
Unproved mineral interests | 11,582 | (5,130) | 6,452 |
Other intangible assets | 4,182 | (2,791) | 1,391 |
Total intangible assets | 31,270 | (15,908) | 15,362 |
Change in net intangible assets is analyzed in the following table:
(M$) | Net amount as of January 1, | Expenditures | Disposals | Amortization and impairment | Currency translation adjustment | Other | Net amount as of December 31, |
2018 | 14,587 | 3,745 | (28) | (852) | (351) | 11,821 | 28,922 |
2017 | 15,362 | 404 | (23) | (1,512) | 234 | 122 | 14,587 |
2016 | 14,549 | 1,039 | (117) | (1,252) | (187) | 1,330 | 15,362 |
In 2018, the heading "Amortization and impairment" includes the accounting impact of exceptional asset impairments for an amount of $67 million (see Note 3 paragraph D to the Consolidated Financial Statements).
In 2018, the heading "Other" principally corresponds to the effect of the entries in the consolidation scope (including Maersk Oil, Global LNG and Direct Énergie) for $12,044 million.
In 2017, the heading "Amortization and impairment" included the accounting impact of exceptional asset impairments for an amount of $785 million (see Note 3 paragraph D to the Consolidated Financial Statements).
In 2016, the heading "Amortization and impairment" included the accounting impact of exceptional asset impairments for an amount of $543 million (see Note 3 paragraph D to the Consolidated Financial Statements).
In 2016, the heading "Other" principally corresponded to the effect of the entries in the consolidation scope (including SAFT Group and Lampiris) for $1,394 million and to the reclassification of assets classified in accordance with IFRS 5 "Non-current assets held for sale and discontinued operations".
A summary of changes in the carrying amount of goodwill by business segment for the year ended December 31, 2018 is as follows:
(M$) | Net goodwill as of January 1, 2018 | Increases | Impairments | Other | Net goodwill as of December 31, 2018 |
Exploration & Production | - | 2,642 | - | - | 2,642 |
Gas, Renewables & Power | 650 | 4,165 | - | (108) | 4,707 |
Refining & Chemicals | 491 | - | - | (16) | 475 |
Marketing & Services | 256 | 77 | - | (12) | 321 |
Corporate | 30 | - | - | (1) | 29 |
Total | 1,427 | 6,884 | - | (137) | 8,174 |
The heading "Increases" corresponds to the effect of the acquisitions mainly Maersk Oil for an amount of $2,642 million, Global LNG for $2,791 million and Direct Énergie for $1,282 million (see Note 2 paragraph 2 to the Consolidated Financial Statements).
7.2 Property, plant and equipment
Accounting policies Exploration & Production Oil and Gas producing assets Development costs incurred for the drilling of development wells and for the construction of production facilities are capitalized, together with borrowing costs incurred during the period of construction and the present value of estimated future costs of asset retirement obligations. The depletion rate is equal to the ratio of oil and gas production for the period to proved developed reserves (unit-of-production method). In the event that, due to the price effect on reserves evaluation, the unit-of-production method does not reflect properly the useful life of the asset, an alternative depreciation method is applied based on the reserves evaluated with the price of the previous year. With respect to phased development projects or projects subject to progressive well production start-up, the fixed assets’ depreciable amount, excluding production or service wells, is adjusted to exclude the portion of development costs attributable to the undeveloped reserves of these projects. With respect to production sharing contracts, the unit-of-production method is based on the portion of production and reserves assigned to the Group taking into account estimates based on the contractual clauses regarding the reimbursement of exploration, development and production costs (cost oil/gas) as well as the sharing of hydrocarbon rights (profit oil/gas). Hydrocarbon transportation and processing assets are depreciated using the unit-of-production method based on throughput or by using the straight-line method whichever best reflects the duration of use of the economic life of the asset. Other property, plant and equipment excluding Exploration & Production Other property, plant and equipment are carried at cost, after deducting any accumulated depreciation and accumulated impairment losses. This cost includes borrowing costs directly attributable to the acquisition or production of a qualifying asset incurred until assets are placed in service. Borrowing costs are capitalized as follows: -if the project benefits from a specific funding, the capitalization of borrowing costs is based on the borrowing rate; -if the project is financed by all the Group’s debt, the capitalization of borrowing costs is based on the weighted average borrowing cost for the period. |
Routine maintenance and repairs are charged to expense as incurred. The costs of major turnarounds of refineries and large petrochemical units are capitalized as incurred and depreciated over the period of time between two consecutive major turnarounds. Other property, plant and equipment are depreciated using the straight-line method over their useful lives, which are as follows: | |
Furniture, office equipment, machinery and tools | 3-12 years |
Transportation equipment | 5-20 years |
Storage tanks and related equipment | 10-15 years |
Specialized complex installations and pipelines | 10-30 years |
Buildings | 10-50 years |
As of December 31, 2018 (M$) | Cost | Depreciation and impairment | Net |
Exploration & Production properties | |||
Proved properties | 192,272 | (120,435) | 71,837 |
Unproved properties | 1,673 | (152) | 1,521 |
Work in progress | 22,553 | (1,128) | 21,425 |
Subtotal | 216,498 | (121,715) | 94,783 |
Other property, plant and equipment | |||
Land | 1,775 | (648) | 1,127 |
Machinery, plant and equipment (including transportation equipment) | 34,564 | (25,393) | 9,171 |
Buildings | 8,864 | (5,640) | 3,224 |
Work in progress | 2,540 | (2) | 2,538 |
Other | 9,171 | (6,690) | 2,481 |
Subtotal | 56,914 | (38,373) | 18,541 |
Total property, plant and equipment | 273,412 | (160,088) | 113,324 |
As of December 31, 2017 (M$) | Cost | Depreciation and impairment | Net |
Exploration & Production properties | |||
Proved properties | 174,336 | (112,113) | 62,223 |
Unproved properties | 1,980 | (152) | 1,828 |
Work in progress | 30,286 | (2,537) | 27,749 |
Subtotal | 206,602 | (114,802) | 91,800 |
Other property, plant and equipment | |||
Land | 1,809 | (652) | 1,157 |
Machinery, plant and equipment (including transportation equipment) | 33,554 | (25,774) | 7,780 |
Buildings | 9,203 | (5,859) | 3,344 |
Work in progress | 2,310 | (1) | 2,309 |
Other | 9,463 | (6,456) | 3,007 |
Subtotal | 56,339 | (38,742) | 17,597 |
Total property, plant and equipment | 262,941 | (153,544) | 109,397 |
As of December 31, 2016 (M$) | Cost | Depreciation and impairment | Net |
Exploration & Production properties | |||
Proved properties | 163,860 | (100,959) | 62,901 |
Unproved properties | 1,996 | - | 1,996 |
Work in progress | 33,860 | (2,075) | 31,785 |
Subtotal | 199,716 | (103,034) | 96,682 |
Other property, plant and equipment | |||
Land | 1,578 | (567) | 1,011 |
Machinery, plant and equipment (including transportation equipment) | 28,620 | (22,940) | 5,680 |
Buildings | 7,977 | (4,979) | 2,998 |
Work in progress | 2,780 | (10) | 2,770 |
Other | 8,296 | (5,466) | 2,830 |
Subtotal | 49,251 | (33,962) | 15,289 |
Total property, plant and equipment | 248,967 | (136,996) | 111,971 |
Change in net property, plant and equipment is analyzed in the following table:
(M$) | Net amount as of January 1, | Expenditures | Disposals | Depreciation and impairment | Currency translation adjustment | Other | Net amount as of December 31, |
2018 | 109,397 | 13,336 | (2,494) | (13,732) | (1,454) | 8,271 | 113,324 |
2017 | 111,971 | 13,363 | (1,117) | (15,099) | 2,302 | (2,023) | 109,397 |
2016 | 109,518 | 17,067 | (1,869) | (13,171) | (1,057) | 1,483 | 111,971 |
In 2018, the heading "Disposals" mainly includes the impact of sales in the Exploration & Production segment (mainly Martin Linge in Norway and Fort Hills in Canada).
In 2018, the heading "Depreciation and impairment" includes the impact of impairments of assets recognized for an amount of $1,707 million (see Note 3 paragraph D to the Consolidated Financial Statements).
In 2018, the heading "Other" principally corresponds to the effect of the entries in the consolidation scope (including Maersk, Lapa and Iara in Brazil and Direct Énergie) for $6,987 million, to the reclassification of assets in accordance with IFRS 5 "Non-current assets held for sale and discontinued operations" (mainly related to the 4% sale of Ichthys for $(812) million) and the reversal of the reclassification under IFRS 5 as at December 31, 2017 for $2,604 million corresponding to disposals.
In 2017, the heading "Disposals" mainly included the impact of sales in the Exploration & Production segment (sale of interests in Gina Krog in Norway, and in Gabon).
In 2017, the heading "Depreciation and impairment" included the impact of impairments of assets recognized for an amount of $3,901 million (see Note 3 paragraph D to the Consolidated Financial Statements).
In 2017, the heading "Other" principally corresponded to the impact of $855 million of finance lease contracts, the decrease of the asset for site restitution for an amount of $(773) million and the reclassification of assets classified in accordance with IFRS 5 "Non-current assets held for sale and discontinued operations" for $(2,604) million, related to the Martin Linge field in Norway.
In 2016, the heading "Disposals" mainly included the impact of sales in the Exploration & Production segment (sale of interests in the FUKA and SIRGE gas pipelines, and the St. Fergus gas terminal in the United Kingdom, and sale of a 20% stake in Kharyaga, Russia).
In 2016, the heading "Depreciation and impairment" included the impact of impairments of assets recognized for an amount of $1,780 million (see Note 3 paragraph D to the Consolidated Financial Statements).
In 2016, the heading "Other" principally corresponded to the effect of the entries in the consolidation scope (including SAFT Group and Lampiris) for $751 million, to the reclassification of assets in accordance with IFRS 5 "Non-current assets held for sale and discontinued operations" for $(365) million and the reversal of the reclassification under IFRS 5 as at December 31, 2015 for $627 million corresponding to disposals.
Property, plant and equipment presented above include the following amounts for facilities and equipment under finance leases:
As of December 31, 2018 (M$) | Cost | Depreciation and impairment | Net |
Machinery, plant and equipment | 1,778 | (605) | 1,173 |
Buildings | 121 | (56) | 65 |
Other | 543 | (83) | 460 |
Total | 2,442 | (744) | 1,698 |
As of December 31, 2017 (M$) | Cost | Depreciation and impairment | Net |
Machinery, plant and equipment | 1,140 | (468) | 672 |
Buildings | 124 | (57) | 67 |
Other | 378 | (58) | 320 |
Total | 1,642 | (583) | 1,059 |
As of December 31, 2016 (M$) | Cost | Depreciation and impairment | Net |
Machinery, plant and equipment | 426 | (391) | 35 |
Buildings | 109 | (38) | 71 |
Other | 179 | (41) | 138 |
Total | 714 | (470) | 244 |
8.1 Equity affiliates: investments and loans
Accounting principles Under the equity method, the investment in the associate or joint venture is initially recognized at acquisition cost and subsequently adjusted to recognize the Group’s share of the net income and other comprehensive income of the associate or joint venture. Unrealized gains on transactions between the Group and its equity-accounted entities are eliminated to the extent of the Group’s interest in the equity accounted entity. In equity affiliates, goodwill is included in investment book value. In cases where the group holds less than 20% of the voting rights in another entity, the determination of whether the Group exercises significant influence is also based on other facts and circumstances: representation on the Board of Directors or an equivalent governing body of the entity, participation in policy-making processes, including participation in decisions relating to dividends or other distributions, significant transactions between the investor and the entity, exchange of management personnel, or provision of essential technical information. |
The contribution of equity affiliates in the consolidated balance sheet, consolidated statement of income and consolidated statement of comprehensive income is presented below:
Equity value, as of December 31, (M$) | 2018 | 2017 | 2016 |
Total Associates | 13,330 | 12,177 | 11,819 |
Total Joint ventures | 5,359 | 4,791 | 4,039 |
Total | 18,689 | 16,968 | 15,858 |
Loans | 4,755 | 5,135 | 4,718 |
Total | 23,444 | 22,103 | 20,576 |
Profit/(loss), as of December 31, (M$) | 2018 | 2017 | 2016 |
Total Associates | 2,329 | 1,694 | 1,530 |
Total Joint ventures | 841 | 321 | 684 |
Total | 3,170 | 2,015 | 2,214 |
Other comprehensive income, as of December 31, (M$) | 2018 | 2017 | 2016 |
Total Associates | (461) | (801) | 847 |
Total Joint ventures | (79) | 124 | 88 |
Total | (540) | (677) | 935 |
A) Information related to associates
Information (100% gross) related to significant associates is as follows:
Exploration & Production (M$) | Novatek (a) | Liquefaction entities | PetroCedeño | ||||||
2018 | 2017 | 2016 | 2018 | 2017 | 2016 | 2018 | 2017 | 2016 | |
Non current assets | 14,639 | 14,232 | 13,981 | 28,664 | 29,656 | 31,044 | 4,324 | 5,551 | 5,515 |
Current assets | 4,545 | 3,404 | 2,409 | 9,358 | 7,875 | 5,790 | 5,580 | 4,291 | 4,166 |
Total Assets | 19,184 | 17,636 | 16,390 | 38,022 | 37,531 | 36,834 | 9,904 | 9,842 | 9,681 |
Shareholder’s equity | 14,163 | 12,842 | 11,015 | 22,615 | 22,804 | 22,886 | 4,581 | 5,178 | 5,515 |
Non current liabilities | 3,086 | 3,187 | 3,574 | 9,826 | 10,291 | 10,839 | 20 | 13 | 10 |
Current liabilities | 1,935 | 1,607 | 1,801 | 5,581 | 4,436 | 3,109 | 5,303 | 4,651 | 4,156 |
Total Liabilities | 19,184 | 17,636 | 16,390 | 38,022 | 37,531 | 36,834 | 9,904 | 9,842 | 9,681 |
Revenue from sales | 13,415 | 10,022 | 7,779 | 25,644 | 20,401 | 15,557 | 1,629 | 1,708 | 1,398 |
Net income | 4,636 | 1,950 | 3,137 | 7,408 | 5,781 | 1,472 | 122 | 204 | 277 |
Other comprehensive income | (2,545) | 580 | 1,651 | - | - | - | - | - | - |
% owned | 19.40% | 18.90% | 18.90% | 30.32% | 30.32% | 30.32% | |||
Revaluation identifiable assets on equity affiliates | 1,556 | 1,804 | 1,811 | 44 | 6 | - | - | - | - |
Equity value | 4,303 | 4,231 | 3,893 | 3,758 | 3,768 | 3,755 | 1,389 | 1,570 | 1,672 |
Profit/(loss) | 794 | 263 | 494 | 874 | 735 | 147 | 37 | 62 | 84 |
Share of Other Comprehensive Income, net amount | (540) | (491) | 808 | 49 | (194) | 23 | - | - | - |
Dividends paid to the Group | 151 | 128 | 111 | 816 | 672 | 479 | 218 | 164 | 91 |
(a) Information includes the best Group’s estimates of results at the date of TOTAL’s financial statements.
Novatek, listed in Moscow and London, is the 2nd largest producer of natural gas in Russia. The Group share of Novatek’s market value amounted to $9,578 million as at December 31, 2018. Novatek is consolidated by the equity method. TOTAL considers, in fact, that it exercises significant influence particularly via its representation on the Board of Directors of Novatek and its interest in the major project of Yamal LNG.
The Group is not aware of significant restrictions limiting the ability of OAO Novatek to transfer funds to its shareholder, be it under the form of dividends, repayment of advances or loans made.
The Group’s interests in associates operating liquefaction plants are combined. The amounts include investments in: Nigeria LNG (15.00%), Angola LNG (13.60%), Yemen LNG (39.62%), Qatar Liquefied Gas Company Limited (Qatargas) (10.00%), Qatar Liquefied Gas Company Limited II (16.70%), Oman LNG (5.54%), and Abu Dhabi Gas Liquefaction Company Limited (5.00%).
PetroCedeño produces and upgrades extra-heavy crude oil in Venezuela.
Refining & Chemicals (M$) | Saudi Aramco Total Refining & Petrochemicals | Qatar | ||||
2018 | 2017 | 2016 | 2018 | 2017 | 2016 | |
Non current assets | 11,281 | 11,601 | 12,056 | 3,968 | 4,405 | 4,152 |
Current assets | 2,069 | 2,021 | 1,531 | 1,741 | 1,696 | 1,404 |
Total Assets | 13,350 | 13,622 | 13,587 | 5,709 | 6,101 | 5,556 |
Shareholder’s equity | 2,412 | 2,424 | 2,302 | 2,748 | 3,200 | 3,393 |
Non current liabilities | 8,398 | 9,029 | 9,466 | 1,914 | 1,895 | 1,349 |
Current liabilities | 2,540 | 2,169 | 1,819 | 1,047 | 1,006 | 814 |
Total Liabilities | 13,350 | 13,622 | 13,587 | 5,709 | 6,101 | 5,556 |
Revenue from sales | 11,886 | 9,049 | 7,134 | 9,929 | 7,388 | 4,665 |
Net income | 122 | 222 | 289 | 409 | 490 | 615 |
Other comprehensive income | 16 | 20 | 2 | (21) | 80 | (11) |
% owned | 37.50% | 37.50% | 37.50% | |||
Revaluation identifiable assets on equity affiliates | - | - | - | - | - | - |
Equity value | 905 | 909 | 863 | 740 | 814 | 832 |
Profit/(loss) | 46 | 83 | 108 | 198 | 190 | 211 |
Share of Other Comprehensive Income, net amount | 40 | (82) | 22 | 6 | (12) | 6 |
Dividends paid to the Group | 56 | 45 | - | 271 | 201 | 292 |
Saudi Aramco Total Refining & Petrochemicals is an entity including a refinery in Jubail, Saudi Arabia, with a capacity of 440,000 barrels/day with integrated petrochemical units.
The Group’s interests in associates of the Refining & Chemicals segment, operating steam crackers and polyethylene lines in Qatar have been combined: Qatar Petrochemical Company Ltd. (20.00%), Qatofin (49.09%), Laffan Refinery (10.00%) and Laffan Refinery II (10.00%).
B) Information related to joint ventures
The information (100% gross) related to significant joint ventures is as follows:
(M$) | Liquefaction entities (Exploration & Production) | Hanwha Total Petrochemicals (Refining & Chemicals) | ||||
2018 | 2017 | 2016 | 2018 | 2017 | 2016 | |
Non current assets | 68,003 | 59,422 | 47,014 | 4,017 | 3,989 | 3,454 |
Current assets excluding cash and cash equivalents | 1,928 | 966 | 922 | 2,180 | 2,258 | 1,506 |
Cash and cash equivalents | 339 | 1,258 | 703 | 237 | 283 | 473 |
Total Assets | 70,270 | 61,646 | 48,639 | 6,434 | 6,530 | 5,433 |
Shareholder’s equity | 7,059 | 4,037 | 2,961 | 3,534 | 3,612 | 2,947 |
Other non current liabilities | 3,472 | 504 | 327 | 157 | 148 | 120 |
Non current financial debts | 56,841 | 55,566 | 43,980 | 1,418 | 1,078 | 1,105 |
Other current liabilities | 2,898 | 1,539 | 1,371 | 725 | 1,144 | 764 |
Current financial debts | - | - | - | 600 | 548 | 497 |
Total Liabilities | 70,270 | 61,646 | 48,639 | 6,434 | 6,530 | 5,433 |
Revenue from sales | 2,908 | 37 | 52 | 10,191 | 8,565 | 7,057 |
Depreciation and depletion of tangible assets and mineral interests | (1,227) | (10) | (12) | (269) | (264) | (259) |
Interest income | 119 | 16 | 5 | 9 | - | - |
Interest expense | (670) | (15) | (7) | (5) | (3) | (3) |
Income taxes | (386) | 338 | (29) | (310) | (369) | (338) |
Net income | 2,029 | (1,730) | 449 | 754 | 973 | 930 |
Other comprehensive income | 132 | 97 | 166 | (169) | 398 | (79) |
% owned | 50.00% | 50.00% | 50.00% | |||
Revaluation identifiable assets on equity affiliates | 683 | 905 | 905 | - | - | - |
Equity value | 2,404 | 2,049 | 1,555 | 1,767 | 1,806 | 1,474 |
Profit/(loss) | 192 | (348) | 88 | 377 | 486 | 465 |
Share of Other Comprehensive Income, net amount | 40 | 29 | 50 | (67) | 170 | 22 |
Dividends paid to the Group | - | - | - | 332 | 353 | 256 |
The Group’s interests in joint ventures operating liquefaction plants have been combined. The amounts include investments in Yamal LNG in Russia (20.02% direct holding) and Ichthys LNG in Australia (30.00%).
Hanwha Total Petrochemicals is a South Korean company that operates a petrochemical complex in Daesan (condensate separator, steam cracker, styrene, paraxylene, polyolefins).
Off balance sheet commitments relating to joint ventures are disclosed in Note 13 of the Consolidated Financial Statements.
C) Other equity consolidated affiliates
In Group share, the main aggregated financial items in equity consolidated affiliates including assets held for sale, which have not been presented individually are as follows:
As of December 31, (M$) | 2018 | 2017 | 2016 | |||
Associates | Joint ventures | Associates | Joint ventures | Associates | Joint ventures | |
Non Current assets | 4,512 | 2,487 | 2,908 | 2,428 | 3,047 | 1,971 |
Current assets | 1,263 | 752 | 1,156 | 1,150 | 1,365 | 825 |
Total Assets | 5,775 | 3,239 | 4,064 | 3,578 | 4,412 | 2,796 |
Shareholder’s equity | 1,438 | 1,108 | 885 | 1,102 | 804 | 1,010 |
Non current liabilities | 3,254 | 1,585 | 2,171 | 1,281 | 2,369 | 985 |
Current liabilities | 1,083 | 546 | 1,008 | 1,195 | 1,239 | 801 |
Total Liabilities | 5,775 | 3,239 | 4,064 | 3,578 | 4,412 | 2,796 |
As of December 31, (M$) | 2018 | 2017 | 2016 | |||
Associates | Joint ventures | Associates | Joint ventures | Associates | Joint ventures | |
Revenues from sales | 2,542 | 11,914 | 2,226 | 4,358 | 2,603 | 3,181 |
Net income | 380 | 281 | 361 | 183 | 486 | 131 |
Share of other comprehensive income items | (16) | (52) | (22) | (75) | (12) | 16 |
Equity value | 2,235 | 1,188 | 885 | 936 | 804 | 1,010 |
Profit/(Loss) | 380 | 272 | 361 | 183 | 486 | 131 |
Dividends paid to the Group | 416 | 49 | 328 | 147 | 308 | 30 |
8.2 Other investments
Accounting policies Other investments are equity instruments and are measured according to IFRS 9 at fair value through profit and loss (default option). On initial recognition, the standard allows to make an election and record the changes of fair value in other comprehensive income. For these securities, only dividends can be recognized in profit or loss. The Group recognizes changes in fair value in equity or in profit or loss according to the option chosen on an instrument by instrument basis. For securities traded in active markets, this fair value is equal to the market price. For other shares, if the fair value is not reliably determinable, they are recorded at their acquisition value. For years prior to the application of IFRS 9, equity instruments were classified as available for sale financial assets and measured at fair value. For securities traded in active markets, this fair value was equal to the market price. Changes in fair value were recorded in other comprehensive income. If there was any evidence of a significant or long-lasting impairment loss, a loss was recorded in the statement of income. This impairment was irreversible. For other securities, if the fair value was not reliably determinable, the securities were recorded at their historical value. |
For the year 2018, (M$) | As of January 1, | Increase - (Decrease) | Change in fair value | As of December 31, |
Tellurian Investments Inc. | 207 | - | - | 207 |
Other shares through fair value OCI (unit value < $50M) | 77 | 80 | (2) | 155 |
Equity instruments recorded through fair value OCI | 284 | 80 | (2) | 362 |
BBPP | 62 | - | - | 62 |
BTC Limited | 55 | - | (5) | 50 |
DUNKERQUE LNG SAS | 144 | (217) | 73 | - |
Total Lubrificantes do Brasil (a) | - | 111 | - | 111 |
Other shares through fair value P&L (unit value < $50M) | 1,182 | (346) | - | 836 |
Equity instruments recorded through fair value P&L | 1,443 | (452) | 68 | 1,059 |
Total equity instruments | 1,727 | (372) | 66 | 1,421 |
(a) Total Lubrificantes do Brasil will be consolidated in 2019.
As of December 31, 2017 (M$) | Historical value | Unrealized gain (loss) | Balance sheet value |
Other equity securities publicly traded in active markets | 8 | 42 | 50 |
Total equity securities publicly traded in active markets (a) | 8 | 42 | 50 |
BBPP | 62 | - | 62 |
BTC Limited | 55 | - | 55 |
DUNKERQUE LNG SAS | 144 | - | 144 |
Tellurian Investments Inc. | 207 | - | 207 |
Total Eren Holding SA (b) | 285 | - | 285 |
Greenflex (b) | 76 | - | 76 |
Other equity securities (unit value < $50 million) | 848 | - | 848 |
Total other equity securities (a) | 1,677 | - | 1,677 |
Other investments | 1,685 | 42 | 1,727 |
As of December 31, 2016 (M$) | Historical value | Unrealized gain (loss) | Balance sheet value |
Areva | 17 | - | 17 |
Other equity securities publicly traded in active markets | 8 | 29 | 37 |
Total equity securities publicly traded in active markets (a) | 25 | 29 | 54 |
BBPP | 62 | - | 62 |
BTC Limited | 121 | - | 121 |
DUNKERQUE LNG SAS | 133 | - | 133 |
Other equity securities (unit value < $50 million) | 763 | - | 763 |
Total other equity securities (a) | 1,079 | - | 1,079 |
Other investments | 1,104 | 29 | 1,133 |
(a) Including cumulative impairments of $2,029 million in 2017 and $1,633 million in 2016.
(b) Acquisitions made in the fourth quarter 2017 and consolidated in 2018.
8.3 Related parties
The main transactions and receivable and payable balances with related parties (principally non-consolidated subsidiaries and equity consolidated affiliates) are detailed as follows:
As of December 31, (M$) | 2018 | 2017 | 2016 |
Balance sheet | |||
Receivables | |||
Debtors and other debtors | 496 | 492 | 492 |
Loans (excl. loans to equity affiliates) | 57 | 63 | 65 |
Payables | |||
Creditors and other creditors | 888 | 1,161 | 897 |
Debts | 2 | 2 | 6 |
For the year ended December 31, (M$) | 2018 | 2017 | 2016 |
Statement of income | |||
Sales | 4,192 | 3,407 | 2,270 |
Purchases | (9,253) | (7,354) | (4,882) |
Financial income | 2 | 6 | 6 |
Financial expense | (5) | (9) | - |
8.4 Compensation for the administration and management bodies
The aggregate amount of direct and indirect compensation accounted by the French and foreign affiliates of the Company, for all executive officers of TOTAL as of December 31, 2018 and for the members of the Board of Directors who are employees of the Group, is detailed below.
The main Group executive officers include the members of the Executive Committee and the four directors of the corporate functions members of the Group Performance Management Committee (Communication, Legal, Health, Safety and Environment, Strategy & Climate), the Deputy Chief Financial Officer of the Group and the Group Treasurer.
For the year ended December 31, (M$) | 2018 | 2017 | 2016 |
Number of people | 15 | 15 | 14 |
Direct or indirect compensation | 17.7 | 15.6 | 13.4 |
Pension expenses (a) | 2.5 | 10.8 | 6.1 |
Share-based payments expense (IFRS 2) (b) | 12.6 | 6.5 | 5.3 |
(a) The benefits provided for executive officers of the Group and the members of the Board of Directors, who are employees of the Group, include severance to be paid upon retirement, supplementary pension schemes and insurance plans, which represent $117.0 million provisioned as of December 31, 2018 (against $119.7 million as of December 31, 2017 and $104.7 million as of December 31, 2016).
The decrease in the pension expenses in 2018 is due to the recognition in 2017 of the entire expense related to the agreement on the transition from work to retirement in France.
(b) Share-based payments expense computed for the executive officers and the members of the Board of Directors who are employees of the Group and based on the principles of IFRS 2 "Share-based payments" described in Note 9. The achievement of the performance conditions for the grant of the number of shares (82%) having been higher than assumption used for the estimation (70%) for the year 2017, the grant rate of the 2015 to 2018 plans has been revised upwards.
The compensation allocated to members of the Board of Directors for directors’ fees totaled $1.65 million in 2018 (against $1.44 million in 2017 and $1.22 million in 2016).
9.1 Shareholders’ equity
Number of TOTAL shares
There is only one category of shares of TOTAL S.A., and the shares have a par value of €2.50, as of December 31, 2018. Shares may be held in either bearer or registered form.
Double voting rights are assigned to shares that are fully-paid and held in registered form in the name of the same shareholder for at least two years, with due consideration for the total portion of the share capital represented. Double voting rights are also assigned, in the event of an increase in share capital by incorporation of reserves, profits or premiums, to registered shares granted for free to a shareholder due to shares already held that are entitled to this rights.
Pursuant to the Company’s bylaws (Statutes), no shareholder may cast a vote at a Shareholders’ Meeting, either by himself or through an agent, representing more than 10% of the total voting rights for the Company’s shares. This limit applies to the aggregated amount of voting rights held directly, indirectly or through voting proxies. However, in the case of double voting rights, this limit may be extended to 20%.
These restrictions no longer apply if any individual or entity, acting alone or in concert, acquires at least two-thirds of the total share capital of the Company, directly or indirectly, following a public tender offer for all of the Company’s shares.
The authorized share capital amounts to 3,669,077,772 shares as of December 31, 2018 compared to 3,434,245,369 shares as of December 31, 2017 and 3,449,682,749 as of December 31, 2016. As of December 31, 2018, the share capital of TOTAL S.A. amounted to €6,601,505,017.50.
Share cancellation
Fiscal year 2018
TOTAL S.A. completed a share capital decrease by way of treasury shares cancellation. The Board of Directors met on December 12, 2018 and decided, following the authorization granted by the Extraordinary Shareholders’ Meeting of May 26, 2017, to cancel 44,590,699 TOTAL shares repurchased on the market. This transaction had no impact on the Consolidated Financial Statements of TOTAL S.A., the number of fully-diluted weighted-average shares and on the earnings per share.
Fiscal year 2017
In fiscal year 2017, TOTAL S.A. did not cancel any shares.
Fiscal year 2016
The Board of Directors of TOTAL S.A. decided, on December 15, 2016, following the authorization of the Extraordinary Shareholders’ Meeting of May 11, 2012, to cancel 100,331,268 treasury shares. Those shares were previously repurchased off-market from four of its 100% indirectly controlled subsidiaries. Following this transaction, the Group affiliates no longer hold TOTAL shares. These transactions had no impact on the Consolidated Financial Statements of TOTAL S.A., the fully-diluted weighted-average shares and on the earnings per share.
Variation of the number of shares composing the share capital
As of December 31, 2015 (a) | 2,440,057,883 | |
Shares issued in connection with: | Capital increase as payment of the scrip dividend (second 2015 interim dividend, third 2015 interim dividend, 2015 final dividend and first 2016 interim dividend) | 88,401,329 |
Exercise of TOTAL share subscription options | 2,237,918 | |
Cancellation of treasury shares | (100,331,268) | |
As of December 31, 2016 (b) | 2,430,365,862 | |
Shares issued in connection with: | Capital increase reserved for employees | 9,532,190 |
Capital increase as payment of the scrip dividend (second 2016 interim dividend, third 2016 interim dividend, 2016 final dividend and first 2017 interim dividend) | 86,442,256 | |
Exercise of TOTAL share subscription options | 2,649,308 | |
As of December 31, 2017 (c) | 2,528,989,616 | |
Shares issued in connection with: | Capital increase reserved for employees | 9,354,889 |
Capital increase as payment of the scrip dividend (second 2017 interim dividend, third 2017 interim dividend, 2017 final dividend and first 2018 interim dividend) | 47,229,037 | |
Exercise of TOTAL share subscription options | 2,096,571 | |
Issuance of shares in consideration for the acquisition of Maersk Olie og Gas A/S | 97,522,593 | |
Cancellation of treasury shares | (44,590,699) | |
As of December 31, 2018 (d) | 2,640,602,007 |
(a) Including 113,967,758 treasury shares deducted from consolidated shareholders’ equity.
(b) Including 10,587,822 treasury shares deducted from consolidated shareholders’ equity.
(c) Including 8,376,756 treasury shares deducted from consolidated shareholders’ equity.
(d) Including 32,473,281 treasury shares deducted from consolidated shareholders’ equity.
Capital increase reserved for Group employees
The Combined General Meeting of June 1, 2018, in its eighteenth resolution, granted the authority to the Board of Directors to carry out a capital increase, in one or more occasion(s) within a maximum period of twenty-six months, reserved to members (employees and retirees) of a company or group savings plan of the Company.
In fiscal year 2018, following this delegation, the Board of Directors of September 19, 2018 decided to proceed with a capital increase reserved for Group employees and retirees that included a classic offering and a leveraged offering depending on the employees’ or retirees’ choice, within the limit of 18 million shares with immediate dividend rights. The Board of Directors has granted all powers to the Chairman and Chief Executive Officer to determine the opening and closing dates of the subscription period and the subscription price. This capital increase will open in 2019 and is expected to be completed after the General Meeting of May 29, 2019.
In the fiscal year 2018, TOTAL S.A. also completed a capital increase reserved for Group employees and retirees which resulted in the subscription of 9,174,817 shares with a nominal value of €2.50 and a price of €37.20 per share and of the issuance of 180,072 shares with a nominal value of €2.50 granted as free shares. The issuance of the shares was acknowledged on May 3, 2018. Moreover, the Board of Directors of April 25, 2018, by virtue of the twenty-fourth resolution of the Combined General Meeting of May 24, 2016, decided to grant, 6,784 free shares to 1,360 beneficiaries subject to a presence condition during the five-year acquisition period ending on April 25, 2023, as a deferred contribution.
In fiscal year 2017, TOTAL S.A. completed a capital increase reserved for Group employees and retirees which resulted in the subscription of 9,350,220 shares with a nominal value of €2.50 and a price of €38.10 per share and of the issuance of 181,970 shares with a par value of €2.50 granted as free shares. The issuance of the shares was acknowledged on April 26, 2017. Moreover, the Board of Directors, during its meeting on April 26, 2017, by virtue of the twenty-fourth resolution of the Combined General Meeting of May 24, 2016, decided to grant 10,393 free shares to 2,086 beneficiaries subject to a presence condition during the five-year acquisition period ending on April 26, 2022, as a deferred contribution.
Treasury shares
Accounting policies Treasury shares of the parent company held by its subsidiaries or itself are deducted from consolidated shareholders’ equity. Gains or losses on sales of treasury shares are excluded from the determination of net income and are recognized in shareholders’ equity. |
TOTAL shares held by TOTAL S.A.
As of December 31, | 2018 | 2017 | 2016 |
Number of treasury shares | 32,473,281 | 8,376,756 | 10,587,822 |
Percentage of share capital | 1.23% | 0.33% | 0.44% |
Of which shares acquired with the intention to cancel them | 27,360,278 | - | - |
Of which shares allocated to TOTAL share performance plans for Group employees | 5,044,817 | 8,345,847 | 10,555,887 |
Of which shares intended to be allocated to new TOTAL share subscription or purchase options plans or to new share performance plans | 68,186 | 30,909 | 31,935 |
Paid-in surplus
In accordance with French law, the paid-in surplus corresponds to premiums related to shares issuances, contributions or mergers of the parent company which can be capitalized or used to offset losses if the legal reserve has reached its minimum required level. The amount of the paid-in surplus may also be distributed subject to taxation except in cases of a refund of shareholder contributions.
As of December 31, 2018, paid-in surplus relating to TOTAL S.A. amounted to €37,276 million (€32,882 million as of December 31, 2017 and €28,961 million as of December 31, 2016).
Reserves
Under French law, 5% of net income must be transferred to the legal reserve until the legal reserve reaches 10% of the nominal value of the share capital. This reserve cannot be distributed to the shareholders other than upon liquidation but can be used to offset losses.
If wholly distributed, the unrestricted reserves of the parent company would be taxed for an approximate amount of $607 million as of December 31, 2018 ($750 million as of December 31, 2017 and $569 million as of December 31, 2016) with regards to additional corporation tax to be applied on regulatory reserves so that they become distributable.
Earnings per share
Accounting policies Earnings per share is calculated by dividing net income (Group share) by the weighted-average number of common shares outstanding during the period, excluding TOTAL shares held by TOTAL S.A. (Treasury shares) which are deducted from consolidated shareholders’ equity. Diluted earnings per share is calculated by dividing net income (Group share) by the fully-diluted weighted-average number of common shares outstanding during the period. Treasury shares held by the parent company, TOTAL S.A. are deducted from consolidated shareholders’ equity. These shares are not considered outstanding for purposes of this calculation which also takes into account the dilutive effect of share subscription or purchase options plans, share grants and capital increases with a subscription period closing after the end of the fiscal year. The weighted-average number of fully-diluted shares is calculated in accordance with the treasury stock method provided for by IAS 33. The proceeds, which would be recovered in the event of an exercise of rights related to dilutive instruments, are presumed to be a share buyback at the average market price over the period. The number of shares thereby obtained leads to a reduction in the total number of shares that would result from the exercise of rights. In compliance with IAS 33, earnings per share and diluted earnings per share are based on the net income after deduction of the remuneration due to the holders of deeply subordinated notes. |
The variation of both weighted-average number of shares and weighted-average number of diluted shares respectively, as of December 31, respectively used in the calculation of earnings per share and fully-diluted earnings per share is detailed as follows:
2018 | 2017 | 2016 | |
Number of shares as of January 1, | 2,528,989,616 | 2,430,365,862 | 2,440,057,883 |
Number of shares issued during the year (pro rated) | |||
Exercise of TOTAL share subscription options | 1,351,465 | 1,198,036 | 538,621 |
Exercise of TOTAL share purchase options | - | - | - |
Total performance shares | 2,039,729 | 1,105,796 | 1,524,172 |
Capital increase reserved for employees | 6,236,593 | 6,354,793 | - |
Issuance of shares in consideration for the acquisition of Maersk Olie og Gas A/S | 81,268,828 | - | - |
Capital increase as payment of the scrip dividend | 26,352,572 | 53,365,971 | 51,029,237 |
Buyback of treasury shares including: | (30,405,112) | - | 4,180,470 |
Treasury shares repurchased from subsidiaries and cancelled on December 15, 2016 | - | - | 4,180,470 |
Shares repurchased in 2018 to cancel the dilution caused by the scrip dividend payment | (30,102,242) | - | - |
Shares repurchased in 2018 to cover for the stock options plans | (302,870) | - | - |
Cancellation of treasury shares on December 15, 2016 | - | - | (4,180,470) |
Total shares held by TOTAL S.A. or by its subsidiaries and deducted from shareholders’ equity | (8,376,756) | (10,587,822) | (113,967,758) |
Weighted-average number of shares | 2,607,456,934 | 2,481,802,636 | 2,379,182,155 |
Dilutive effect | |||
Grant of TOTAL share subscription or purchase options | 296,830 | 727,864 | 630,474 |
Grant of TOTAL performance shares | 13,794,896 | 10,238,411 | 9,058,264 |
Capital increase reserved for employees | 2,167,784 | 1,987,502 | 843,043 |
Weighted-average number of diluted shares | 2,623,716,444 | 2,494,756,413 | 2,389,713,936 |
Earnings per share in euros
The earnings per share in euros, obtained from the earnings per share in dollars, converted by using the average exchange rate euro/dollar, is €3.62 per share for 2018 closing (€2.97 for 2017 closing). The fully-diluted earnings per share calculated by using the same method is €3.59 per share for 2018 closing (€2.96 for 2017 closing).
Dividend
TOTAL S.A. has distributed and paid the following interim dividends with respect to fiscal year 2018:
-on September 19, 2018, the Board of Directors decided on the payment of the first interim dividend for fiscal year 2018 of €0.64 per share and set the issuance price of these newly issued shares at €52.95 per share, equal to the average Euronext Paris opening price of the shares for the 20 trading days preceding the Board of Directors meeting, reduced by the amount of the interim dividend, without a discount, and rounded up to the nearest cent. The ex-dividend date of this interim dividend was September 25, 2018 and on October 12, 2018 the dividend was paid in cash and in shares; and
-on December 12, 2018, the Board of Directors decided on the payment of the second interim dividend for fiscal year 2018 of €0.64 per share set the issuance price of these newly issued shares at €48.27 per share, equal to the average Euronext Paris opening price of the shares for the 20 trading days preceding the Board of Directors meeting, reduced by the amount of the second interim dividend, without a discount and rounded up to the nearest cent. The ex-dividend date of this interim dividend was December 18, 2018 and on January 10, 2019, the dividend was paid to shareholders in cash or shares.
The Board of Directors, during its October 25, 2018 meeting, decided to set the third interim dividend for fiscal year 2018 of €0.64 per share. The ex-dividend date will be March 19, 2019, and this interim dividend will be paid on April 5, 2019.
A resolution will be submitted at the Shareholders’ Meeting on May 29, 2019 to pay a dividend of €2.56 per share for the 2018 fiscal year, as a balance of €0.64 per share to be distributed after deducting the three interim dividends of €0.64 per share that will have already been paid.
Issuance of perpetual subordinated notes
The Group did not issue any perpetual subordinated notes in 2018 nor in 2017.
In 2016, the Group issued three tranches of perpetual subordinated notes in euros through TOTAL S.A.:
-deeply subordinated note 3.875% perpetual maturity callable after 6 years (€1,750 million);
-deeply subordinated note 2.708% perpetual maturity callable after 6.6 years (€1,000 million); and
-deeply subordinated note 3.369% perpetual maturity callable after 10 years (€1,500 million).
In 2015, the Group issued two tranches of perpetual subordinated notes in euros through TOTAL S.A.:
-deeply subordinated note 2.250% perpetual maturity callable after 6 years (€2,500 million);
-deeply subordinated note 2.625% perpetual maturity callable after 10 years (€2,500 million).
Based on their characteristics (mainly no mandatory repayment and no obligation to pay a coupon except in the event of a dividend distribution) and in compliance with IAS 32 standard - Financial instruments - Presentation, these notes were recorded in equity.
As of December 31, 2018, the amount of the perpetual deeply subordinated note booked in the Group shareholders’ equity is $10,328 million. The coupons attributable to the holders of these securities are booked in deduction of the Group shareholders’ equity for an amount of $315 million for fiscal year 2018 closing. The tax saving due to these coupons is booked in the statement of income.
Other comprehensive income
Detail of other comprehensive income showing both items potentially reclassifiable and those not potentially reclassifiable from equity to net income is presented in the table below:
For the year ended December 31, (M$) | 2018 | 2017 | 2016 | |||
Actuarial gains and losses | (12) | 823 | (371) | |||
Change in fair value of investments in equity instruments | - | - | - | |||
Tax effect | 13 | (390) | 55 | |||
Currency translation adjustment generated by the parent company | (4,022) | 9,316 | (1,548) | |||
Sub-total items not potentially reclassifiable to profit & loss | (4,021) | 9,749 | (1,864) | |||
Currency translation adjustment | 1,113 | (2,578) | (1,098) | |||
- Unrealized gain/(loss) of the period | 1,238 | (2,408) | (543) | |||
- Less gain/(loss) included in net income | 125 | 170 | 555 | |||
Available for sale financial assets | - | 7 | 4 | |||
- Unrealized gain/(loss) of the period | - | 7 | 4 | |||
- Less gain/(loss) included in net income | - | - | - | |||
Cash flow hedge | 25 | 324 | 239 | |||
- Unrealized gain/(loss) of the period | (94) | 584 | 186 | |||
- Less gain/(loss) included in net income | (119) | 260 | (53) | |||
Variation of foreign currency basis spread | (80) | - | - | |||
- Unrealized gain/(loss) of the period | (80) | - | - | |||
- Less gain/(loss) included in net income | - | - | - | |||
Share of other comprehensive income of equity affiliates, net amount | (540) | (677) | 935 | |||
- Unrealized gain/(loss) of the period | (495) | (655) | 933 | |||
- Less gain/(loss) included in net income | 45 | 22 | (2) | |||
Other | (5) | - | 1 | |||
Tax effect | 14 | (100) | (76) | |||
Sub-total items potentially reclassifiable to profit & loss | 527 | (3,024) | 5 | |||
TOTAL OTHER COMPREHENSIVE INCOME, NET AMOUNT | (3,494) | 6,725 | (1,859) | |||
The currency translation adjustment by currency is detailed in the following table:
As of December 31, 2018 (M$) | Total | Euro | Pound sterling | Ruble | Other currencies |
Currency translation adjustment generated by the parent company | (4,022) | (4,022) | - | - | - |
Currency translation adjustment | 1,113 | 1,883 | (431) | (10) | (329) |
Currency translation adjustment of equity affiliates | (564) | 343 | 14 | (805) | (116) |
Total currency translation adjustment recognized in comprehensive income | (3,473) | (1,796) | (417) | (815) | (445) |
As of December 31, 2017 (M$) | Total | Euro | Pound sterling | Ruble | Other currencies |
Currency translation adjustment generated by the parent company | 9,316 | 9,316 | - | - | - |
Currency translation adjustment | (2,578) | (3,275) | 462 | 3 | 232 |
Currency translation adjustment of equity affiliates | (730) | (1,099) | (25) | 207 | 187 |
Total currency translation adjustment recognized in comprehensive income | 6,008 | 4,943 | 436 | 210 | 419 |
As of December 31, 2016 (M$) | Total | Euro | Pound sterling | Ruble | Other currencies |
Currency translation adjustment generated by the parent company | (1,548) | (1,548) | - | - | - |
Currency translation adjustment | (1,098) | (184) | (887) | 7 | (34) |
Currency translation adjustment of equity affiliates | 890 | 223 | 54 | 643 | (30) |
Total currency translation adjustment recognized in comprehensive income | (1,756) | (1,509) | (833) | 650 | (64) |
Tax effects relating to each component of other comprehensive income are as follows:
For the year ended December 31, (M$) | 2018 | 2017 | 2016 | ||||||
pre-tax amount | Tax effect | Net amount | pre-tax amount | Tax effect | Net amount | pre-tax amount | Tax effect | Net amount | |
Actuarial gains and losses | (12) | 13 | 1 | 823 | (390) | 433 | (371) | 55 | (316) |
Change in fair value of investments in equity instruments | - | - | - | - | - | - | - | - | - |
Currency translation adjustment generated by the parent company | (4,022) | - | (4,022) | 9,316 | - | 9,316 | (1,548) | - | (1,548) |
Sub-total items not potentially reclassifiable to profit & loss | (4,034) | 13 | (4,021) | 10,139 | (390) | 9,749 | (1,919) | 55 | (1,864) |
Currency translation adjustment | 1,113 | - | 1,113 | (2,578) | - | (2,578) | (1,098) | - | (1,098) |
Available for sale financial assets | - | - | - | 7 | (3) | 4 | 4 | - | 4 |
Cash flow hedge | 25 | (6) | 19 | 324 | (97) | 227 | 239 | (76) | 163 |
Variation of foreign currency basis spread | (80) | 20 | (60) | - | - | - | - | - | - |
Share of other comprehensive income of equity affiliates, net amount | (540) | - | (540) | (677) | - | (677) | 935 | - | 935 |
Other | (5) | - | (5) | - | - | - | 1 | - | 1 |
Sub-total items potentially reclassifiable to profit & loss | 513 | 14 | 527 | (2,924) | (100) | (3,024) | 81 | (76) | 5 |
Total other comprehensive income | (3,521) | 27 | (3,494) | 7,215 | (490) | 6,725 | (1,838) | (21) | (1,859) |
Non-controlling interests
As of December 31, 2018, no subsidiary has non-controlling interests that would be material to the Group financial statements.
9.2 Share-based payments
Accounting policies The Group may grant employees share subscription or purchase options plans and offer its employees the opportunity to subscribe to reserved capital increases. These employee benefits are recognized as expenses with a corresponding credit to shareholders’ equity. The expense is equal to the fair value of the instruments granted. The expense is recognized on a straight-line basis over the period in which the advantages are acquired. The fair value of the options is calculated using the Black-Scholes model at the grant date. For restricted share plans, the fair value is calculated using the market price at the grant date after deducting the expected distribution rate during the vesting period. The global cost is reduced to take into account the non-transferability over a 2-year holding period of the shares that could be awarded. The number of allocated equity instruments can be revised during the vesting period in cases of non-compliance with performance conditions, with the exception of those related to the market, or according to the rate of turnover of the beneficiaries. The cost of employee-reserved capital increases is immediately expensed. The cost of the capital increase reserved for employees consists of the cost related to the discount on all the shares subscribed using both the classic and the leveraged schemes, and the opportunity gain for the shares subscribed using the leveraged scheme. This opportunity gain corresponds to the benefit of subscribing to the leveraged offer, rather than reproducing the same economic profile through the purchase of options in the market for individual investors. The global cost is reduced to take into account the non-transferability of the shares that could be subscribed by the employees over a period of five years. |
A) TOTAL share subscription or purchase option plans
2008 Plan | 2009 Plan | 2010 Plan | 2011 Plan | Total | Weighted average exercise price | |
Date of the Shareholders’ Meeting | 5/11/2007 | 5/11/2007 | 5/21/2010 | 5/21/2010 | ||
Award date (a) | 10/9/2008 | 9/15/2009 | 9/14/2010 | 9/14/2011 | ||
Strike price | 42.90 € | 39.90 € | 38.20 € | 33.00 € | ||
Expiry date | 10/9/2016 | 9/15/2017 | 9/14/2018 | 9/14/2019 | ||
Number of options | ||||||
Existing options as of January 1, 2016 | 2,561,502 | 2,710,783 | 3,323,246 | 722,309 | 9,317,840 | 39.58 € |
Granted | - | - | - | - | - | - |
Cancelled (b) | (1,794,304) | - | - | - | (1,794,304) | 42.90 € |
Exercised | (767,198) | (931,730) | (443,009) | (95,981) | (2,237,918) | 40.80 € |
Existing options as of January 1, 2017 | - | 1,779,053 | 2,880,237 | 626,328 | 5,285,618 | 38.16 € |
Granted | - | - | - | - | - | - |
Cancelled (b) | - | (195,370) | - | - | (195,370) | 39.90 € |
Exercised | - | (1,583,683) | (929,865) | (135,760) | (2,649,308) | 38.95 € |
Existing options as of January 1, 2018 | - | - | 1,950,372 | 490,568 | 2,440,940 | 37.15 € |
Granted | - | - | - | - | - | - |
Cancelled (b) | - | - | (79,139) | - | (79,139) | 38.20 € |
Exercised | - | - | (1,871,233) | (225,338) | (2,096,571) | 37.64 € |
Existing options as of December 31, 2018 | - | - | - | 265,230 | 265,230 | 33.00 € |
(a) The grant date is the date of the Board meeting awarding the share subscription or purchase options, except for the grant of October 9, 2008, decided by the Board on September 9, 2008.
(b) Out of the options canceled in 2016, 2017 and 2018, 1,794,304 options that were not exercised expired on October 9, 2016 due to the expiry of the 2008 plan, 195,370 options that were not exercised expired on September 15, 2017 due to expiry of 2009 plan and 79,139 options that were not exercised expired on September 14, 2018 due to expiry of 2010 plan.
Options are exercisable, subject to a presence condition, after a 2-year period from the date of the Board meeting awarding the options and expire eight years after this date. The underlying shares cannot be transferred during four years from the date of grant. For the 2008 to 2011 Plans, the 4-year transfer restriction period does not apply to employees of non-French subsidiaries as of the date of the grant, who may transfer the underlying shares after a 2-year period from the date of the grant.
Since September 14, 2011, no new TOTAL share subscription or purchase options plan was decided.
B) TOTAL performance share plans
2013 Plan | 2014 Plan | 2015 Plan | 2016 Plan | 2017 Plan | 2018 Plan | Total | |
Date of the Shareholders’ Meeting | 5/13/2011 | 5/16/2014 | 5/16/2014 | 5/24/2016 | 5/24/2016 | 5/24/2016 | |
Award date | 7/25/2013 | 7/29/2014 | 7/28/2015 | 7/27/2016 | 7/26/2017 | 3/14/2018 | |
Date of the final award (end of the vesting period) | 7/26/2016 | 7/30/2017 | 7/29/2018 | 7/28/2019 | 7/27/2020 | 3/15/2021 | |
Transfer authorized as from | 7/26/2018 | 7/30/2019 | 7/29/2020 | 7/29/2021 | 7/28/2022 | 3/16/2023 | |
Grant date IFRS 2 fair value | €32.64 | €44.66 | €35.90 | €35.37 | €35.57 | €36,22 | |
Number of performance shares | |||||||
Outstanding as of January 1, 2016 | 4,350,830 | 4,402,460 | 4,760,505 | - | - | - | 13,513,795 |
Notified | - | - | - | 5,639,400 | - | - | 5,639,400 |
Cancelled (a) | (1,303,506) | (37,100) | (29,170) | (1,730) | - | - | (1,371,506) |
Finally granted (a) | (3,047,324) | (860) | (600) | (110) | - | - | (3,048,894) |
Outstanding as of January 1, 2017 | - | 4,364,500 | 4,730,735 | 5,637,560 | - | - | 14,732,795 |
Notified | - | - | - | - | 5,679,949 | - | 5,679,949 |
Cancelled | - | (2,157,820) | (31,480) | (29,050) | (910) | - | (2,219,260) |
Finally granted | - | (2,206,680) | (1,950) | (1,410) | - | - | (2,210,040) |
Outstanding as of January 1, 2018 | - | - | 4,697,305 | 5,607,100 | 5,679,039 | - | 15,983,444 |
Notified | - | - | - | - | - | 6,083,145 | 6,083,145 |
Cancelled | - | - | (621,568) | (61,840) | (26,640) | (12,350) | (722,398) |
Finally granted | - | - | (4,075,737) | (2,040) | (1,480) | - | (4,079,257) |
Outstanding as of December 31, 2018 | - | - | - | 5,543,220 | 5,650,919 | 6,070,795 | 17,264,934 |
(a) The number of performance shares finally granted in 2016 has been adjusted by 226 performance shares granted in 2017.
The performance shares, which are bought back by the TOTAL S.A. on the market, are finally granted to their beneficiaries after a 3-year vesting period for the 2013 plan and following Plans, from the date of the grant. The final grant is subject to a continued employment condition as well as one performance condition for the 2013 and 2014 plans and two performance conditions for the 2015 plans and subsequent plans. Moreover, the transfer of the performance shares finally granted will not be permitted until the end of a 2-year holding period from the date of the final grant.
2018 Plan
The Board of Directors, on March 14, 2018, granted performance shares to certain employees and executive directors of the Company or Group companies, subject to the fulfilment of the presence condition and two performance conditions.
The presence condition applies to all shares. The performance conditions apply for all shares granted to senior executives. The grant of the first 150 shares to non-senior executive are not subject to the performance condition abovementioned, but the performance conditions will apply to any shares granted above this threshold.
The performance conditions, weighting for 50% of the final grant rate, are the Group’s ranking relative to those of its peers (ExxonMobil, Royal Dutch Shell, BP and Chevron) according to the following two criteria:
-Total Shareholder Return (TSR), which is calculate annually using the average of closing prices over one quarter, in USD, at the beginning and at the end of each three-year period (Q4 year N/Q4 year N-3). The dividend is considered as being reinvested on the closing price basis, on the ex-dividend date; and
-annual variation in net cash-flow per share, in USD.
TOTAL S.A.’s ranking will determined a grant rate for each year and each criteria:
Ranking | Grant rate |
1st place | 180% |
2nd place | 130% |
3rd place | 80% |
4th and 5th places | 0% |
For each performance condition, the average of the three grant rates (on each of the three financial years on which the performance conditions are based), will be expressed in percentage and capped at 100%.
C) SunPower plans
During fiscal 2018, SunPower had three stock incentive plans: the Third Amended and Restated 2005 SunPower Corporation Stock Incentive Plan ("2005 Plan"); the PowerLight Corporation Common Stock Option and Common Stock Purchase Plan ("PowerLight Plan"); and the SunPower Corporation 2015 Omnibus Incentive Plan ("2015 Plan"). The PowerLight Plan, which was adopted by PowerLight’s Board of Directors in October 2000, was assumed by SunPower by way of the acquisition of PowerLight in fiscal 2007. The 2005 Plan was adopted by the SunPower’s Board of Directors in August 2005, and was approved by shareholders in November 2005. The 2015 Plan, which subsequently replaced the 2005 Plan, was adopted by the SunPower’s Board of Directors in February 2015, and was
approved by shareholders in June 2015. On November 13, 2018, SunPower filed post-effective amendments to registration statements associated with the 2005 Plan and the PowerLight Plan, among others, to deregister shares no longer required to be registered for issuance under those plans, as no new awards had been made and all options had been exercised or had expired. The 2015 Plan allows for the grant of options, as well as grant of stock appreciation rights, restricted stock grants, restricted stock units and other equity rights. The 2015 Plan also allows for tax withholding obligations related to stock option exercises or restricted stock awards to be satisfied through the retention of shares otherwise released upon vesting.
The 2015 Plan includes an automatic annual increase mechanism equal to the lower of three percent of the outstanding shares of all classes of the SunPower’s common stock measured on the last day of the immediately preceding fiscal year, 6 million shares, or such other number of shares as determined by SunPower’s Board of Directors. In fiscal 2015, the SunPower’s Board of Directors voted to reduce the stock incentive plan’s automatic increase from 3% to 2% for 2016. As of December 31, 2018, approximately 11.2 million shares were available for grant under the 2015 Plan.
Incentive stock options, nonstatutory stock options, and stock appreciation rights may be granted at no less than the fair value of the common stock on the date of grant. The options and rights become exercisable when and as determined by SunPower’s Board of Directors, although these terms generally do not exceed ten years for stock options. SunPower has not granted stock options since fiscal 2008. All previously granted stock options have been exercised or expired and accordingly no options remain outstanding. Under the 2015 Plan, the restricted stock grants and restricted stock units typically vest in equal installments annually over three or four years.
The majority of shares issued are net of the minimum statutory withholding requirements that SunPower pays on behalf of its employees. During fiscal 2018, 2017, and 2016, SunPower withheld 0.7 million, 0.6 million and 1.0 million shares, respectively, to satisfy the employees’ tax obligations. SunPower pays such withholding requirements in cash to the appropriate taxing authorities. Shares withheld are treated as common stock repurchases for accounting and disclosure purposes and reduce the number of shares outstanding upon vesting.
There were no options outstanding and exercisable as of December 31, 2018. The intrinsic value of the options exercised in fiscal 2018, 2017, and 2016 were zero, $1.7 thousand, and zero, respectively. There were no stock options granted in fiscal 2018, 2017, and 2016.
The following table summarizes SunPower’s restricted stock activities:
Restricted stock awards and units | ||
Shares | Weighted-average grant date fair value per share (in dollars) (a) | |
Outstanding as of January 3, 2016 | 5,063 | 26.68 |
Granted | 4,978 | 18.81 |
Vested (b) | (2,837) | 23.47 |
Forfeited | (1,057) | 26.30 |
Outstanding as of January 1, 2017 | 6,147 | 21.85 |
Granted | 4,863 | 6.76 |
Vested (b) | (1,738) | 25.87 |
Forfeited | (1,979) | 18.15 |
Outstanding as of January 1, 2018 | 7,293 | 11.83 |
Granted | 4,449 | 7.77 |
Vested (b) | (2,266) | 14.45 |
Forfeited | (1,816) | 10.10 |
Outstanding as of December 31, 2018 | 7,660 | 9.11 |
(a) SunPower estimates the fair value of the restricted stock unit awards as the stock price on the grant date.
(b) Restricted stock awards and units vested include shares withheld on behalf of employees to satisfy the minimum statutory tax withholding requirements.
D) Share-based payment expense
Share-based payment expense before tax was broken down as follows:
As of December 31, (M$) | 2018 | 2017 | 2016 |
Total restricted shares plans | 264 | 135 | 113 |
SunPower plans | 21 | 31 | 28 |
Capital increase reserved for employees | 30 | 16 | - |
Total | 315 | 182 | 141 |
During the year 2018, the main assumptions used for the valuation of the cost of the capital increase reserved for employees for both the classic and the leverage schemes were the following:
For the year ended December 31, | 2018 |
Date of the Board of Directors meeting that decided the issue | July 26, 2017 |
Subscription price (€) (a) | 37.20 |
Share price at the reference date (€) (b) | 47.03 |
Number of shares (in millions) | 9.17 |
Risk free interest rate (%) (c) | 0.003 |
Employees loan financing rate (%) (d) | 3.95 |
Non transferability cost (% of the reference’s share price) | 17.33 |
Expenses ($ million) | 30.00 |
(a) Average of the closing TOTAL share prices during the twenty trading days prior to the subscription period, after deduction of a 20% discount.
(b) Closing share price on March 14, 2018, date on which the Chief Executive Officer set the subscription period.
(c) Zero coupon euro swap rate at 5 years.
(d) The employees’ loan financing rate is based on a 5 year consumer’s credit rate.
10.1 Employee benefits obligations
Accounting policies In accordance with the laws and practices of each country, the Group participates in employee benefit plans offering retirement, death and disability, healthcare and special termination benefits. These plans provide benefits based on various factors such as length of service, salaries, and contributions made to the governmental bodies responsible for the payment of benefits. These plans can be either defined contribution or defined benefit pension plans and may be entirely or partially funded with investments made in various non-Group instruments such as mutual funds, insurance contracts, and other instruments. For defined contribution plans, expenses correspond to the contributions paid. Defined benefit obligations are determined according to the Projected Unit Method. Actuarial gains and losses may arise from differences between actuarial valuation and projected commitments (depending on new calculations or assumptions) and between projected and actual return of plan assets. Such gains and losses are recognized in the statement of comprehensive income, with no possibility to subsequently recycle them to the income statement. The past service cost is recorded immediately in the statement of income, whether vested or unvested. The net periodic pension cost is recognized under "Other operating expenses". |
Liabilities for employee benefits obligations consist of the following:
As of December 31, (M$) | 2018 | 2017 | 2016 |
Pension benefits liabilities | 2,545 | 2,877 | 2,948 |
Other benefits liabilities | 669 | 705 | 648 |
Restructuring reserves (early retirement plans) | 149 | 153 | 150 |
Total | 3,363 | 3,735 | 3,746 |
Net liabilities relating to assets held for sale | - | - | 145 |
Description of plans and risk management
The Group operates, for the benefit of its current and former employees, both defined benefit plans and defined contribution plans.
The Group recognized a charge of $130 million for defined contribution plans in 2018 ($128 million in 2017 and $157 million in 2016).
The Group’s main defined benefit pension plans are located in France, the United Kingdom, the United States, Belgium and Germany. Their main characteristics, depending on the country-specific regulatory environment, are the following:
-the benefits are usually based on the final salary and seniority;
-they are usually funded (pension fund or insurer);
-they are usually closed to new employees who benefit from defined contribution pension plans;
-they are paid in annuity or in lump sum.
The pension benefits include also termination indemnities and early retirement benefits. The other benefits are employer contributions to post-employment medical care.
In order to manage the inherent risks, the Group has implemented a dedicated governance framework to ensure the supervision of the different plans. These governance rules provide for:
-the Group’s representation in key governance bodies or monitoring committees;
-the principles of the funding policy;
-the general investment policy, including for most plans the establishment of a monitoring committee to define and follow the investment strategy and performance and to ensure the principles in respect of investment allocation are respected;
-a procedure to approve the establishment of new plans or the amendment of existing plans;
-principles of administration, communication and reporting.
Change in benefit obligations and plan assets
The fair value of the defined benefit obligation and plan assets in the Consolidated Financial Statements is detailed as follows:
As of December 31, (M$) | Pension benefits | Other benefits | ||||
2018 | 2017 | 2016 | 2018 | 2017 | 2016 | |
Change in benefit obligation | ||||||
Benefit obligation at beginning of year | 12,872 | 12,164 | 12,473 | 705 | 648 | 627 |
Current service cost | 236 | 263 | 251 | 14 | 16 | 13 |
Interest cost | 296 | 320 | 373 | 17 | 17 | 21 |
Past service cost | (1) | 239 | (92) | (2) | 12 | - |
Settlements | (141) | (1) | - | - | - | - |
Plan participants’ contributions | 8 | 7 | 8 | - | - | - |
Benefits paid | (902) | (717) | (651) | (28) | (27) | (30) |
Actuarial losses/(gains) | (372) | (450) | 762 | (29) | (36) | 37 |
Foreign currency translation and other | (495) | 1,047 | (960) | (8) | 75 | (20) |
Benefit obligation at year-end | 11,501 | 12,872 | 12,164 | 669 | 705 | 648 |
Of which plans entirely or partially funded | 10,864 | 12,140 | 11,376 | - | - | - |
Of which plans not funded | 637 | 732 | 788 | 669 | 705 | 648 |
Change in fair value of plan assets | ||||||
Fair value of plan assets at beginning of year | (10,205) | (9,123) | (9,627) | - | - | - |
Interest income | (261) | (256) | (307) | - | - | - |
Actuarial losses/(gains) | 424 | (344) | (428) | - | - | - |
Settlements | 129 | - | - | - | - | - |
Plan participants’ contributions | (8) | (7) | (8) | - | - | - |
Employer contributions | (417) | (171) | (130) | - | - | - |
Benefits paid | 778 | 591 | 538 | - | - | - |
Foreign currency translation and other | 415 | (895) | 839 | - | - | - |
Fair value of plan assets at year-end | (9,145) | (10,205) | (9,123) | - | - | - |
Unfunded status | 2,356 | 2,667 | 3,041 | 669 | 705 | 648 |
Asset ceiling | 28 | 40 | 26 | - | - | - |
Net recognized amount | 2,384 | 2,707 | 3,067 | 669 | 705 | 648 |
Pension benefits and other benefits liabilities | 2,545 | 2,877 | 2,948 | 669 | 705 | 648 |
Other non-current assets | (161) | (170) | (26) | - | - | - |
Net benefit liabilities relating to assets held for sale | - | - | 145 | - | - | - |
As of December 31, 2018, the contribution from the main geographical areas for the net pension liability in the balance sheet is: 60% for the Euro area, 19% for the United Kingdom and 18% for the United States.
The amounts recognized in the consolidated income statement and the consolidated statement of comprehensive income for defined benefit plans are detailed as follows:
For the year ended December 31, (M$) | Pension benefits | Other benefits | ||||
2018 | 2017 | 2016 | 2018 | 2017 | 2016 | |
Current service cost | 236 | 263 | 251 | 14 | 16 | 13 |
Past service cost | (1) | 239 | (92) | (2) | 12 | - |
Settlements | (12) | (1) | - | - | - | - |
Net interest cost | 35 | 64 | 66 | 17 | 17 | 21 |
Benefit amounts recognized on Profit & Loss | 258 | 565 | 225 | 29 | 45 | 34 |
Actuarial (Gains)/Losses | ||||||
- Effect of changes in demographic assumptions | (1) | (16) | (56) | (21) | 3 | (7) |
- Effect of changes in financial assumptions | (354) | (241) | 1,008 | (3) | (5) | 48 |
- Effect of experience adjustments | (17) | (193) | (190) | (5) | (34) | (4) |
- Actual return on plan assets (excluding interest income) | 424 | (344) | (421) | - | - | - |
- Effect of asset ceiling | (11) | 7 | (7) | - | - | - |
Benefit amounts recognized on Equity | 41 | (787) | 334 | (29) | (36) | 37 |
Total benefit amounts recognized on comprehensive income | 299 | (222) | 559 | - | 9 | 71 |
Expected future cash outflows
The average duration of accrued benefits is approximately 14 years for defined pension benefits and 17 years for other benefits. The Group expects to pay contributions of $165 million in respect of funded pension plans in 2019.
Estimated future benefits either financed from plan assets or directly paid by the employer are detailed as follows:
Estimated future payments (M$) | Pension benefits | Other benefits |
2019 | 779 | 27 |
2020 | 700 | 27 |
2021 | 706 | 27 |
2022 | 675 | 27 |
2023 | 677 | 27 |
2024-2028 | 3,245 | 125 |
Type of assets
Asset allocation as of December 31, | Pension benefits | ||
2018 | 2017 | 2016 | |
Equity securities | 24% | 26% | 27% |
Debt securities | 47% | 43% | 42% |
Monetary | 1% | 3% | 2% |
Annuity contracts | 20% | 20% | 21% |
Real estate | 8% | 8% | 8% |
Investments on equity and debt markets are quoted on active markets.
Main actuarial assumptions and sensitivity analysis
Assumptions used to determine benefits obligations As of December 31, | Pension benefits | Other benefits | ||||
2018 | 2017 | 2016 | 2018 | 2017 | 2016 | |
Discount rate (weighted average for all regions) | 2.68% | 2.48% | 2.60% | 2.56% | 2.52% | 2.51% |
Of which Euro zone | 1.72% | 1.71% | 1.69% | 1.87% | 1.93% | 1.85% |
Of which United States | 4.00% | 3.75% | 4.00% | 4.00% | 3.75% | 4.00% |
Of which United Kingdom | 3.00% | 2.50% | 2.75% | - | - | - |
Inflation rate (weighted average for all regions) | 2.44% | 2.40% | 2.41% | - | - | - |
Of which Euro zone | 1.50% | 1.50% | 1.50% | - | - | - |
Of which United States | 2.50% | 2.50% | 2.50% | - | - | - |
Of which United Kingdom | 3.50% | 3.50% | 3.50% | - | - | - |
The discount rate retained is determined by reference to the high quality rates for AA-rated corporate bonds for a duration equivalent to that of the obligations. It derives from a benchmark per monetary area of different market data at the closing date.
Sensitivity to inflation in respect of defined benefit pension plans is not material in the United States.
A 0.5% increase or decrease in discount rates - all other things being equal - would have the following approximate impact on the benefit obligation:
(M$) | 0.5% Increase | 0.5% Decrease |
Benefit obligation as of December 31, 2018 | (766) | 862 |
A 0.5% increase or decrease in inflation rates - all other things being equal - would have the following approximate impact on the benefit obligation:
(M$) | 0.5% Increase | 0.5% Decrease |
Benefit obligation as of December 31, 2018 | 582 | (533) |
10.2 Payroll and staff
For the year ended December 31, | 2018 | 2017 | 2016 |
Personnel expenses (M$) | |||
Wages and salaries (including social charges) | 9,099 | 7,985 | 8,238 |
Group employees at December 31, | |||
France | |||
- Management | 13,377 | 11,880 | 12,057 |
- Other | 22,629 | 19,372 | 19,567 |
International | |||
- Management | 16,963 | 16,489 | 17,186 |
- Other | 51,491 | 50,536 | 53,358 |
Total | 104,460 | 98,277 | 102,168 |
The number of employees includes only employees of fully consolidated subsidiaries.
Accounting policies Income taxes disclosed in the statement of income include the current tax expenses (or income) and the deferred tax expenses (or income). The expense (or income) of current tax is the estimated amount of the tax due for the taxable income of the period. The Group uses the method whereby deferred income taxes are recorded based on the temporary differences between the carrying amounts of assets and liabilities recorded in the balance sheet and their tax bases, and on carry-forwards of unused tax losses and tax credits. Deferred tax assets and liabilities are measured using the tax rates that have been enacted or substantially enacted at the balance sheet date. The tax rates used depend on the timing of reversals of temporary differences, tax losses and other tax credits. The effect of a change in tax rate is recognized either in the Consolidated statement of income or in shareholders’ equity depending on the item it relates to. Deferred tax resulting from temporary differences between the carrying amounts of equity-method investments and their tax bases are recognized. The deferred tax calculation is based on the expected future tax effect (dividend distribution rate or tax rate on capital gains). |
Income taxes are detailed as follows:
For the year ended December 31, (M$) | 2018 | 2017 | 2016 |
Current income taxes | (6,971) | (3,416) | (2,911) |
Deferred income taxes | 455 | 387 | 1,941 |
Total income taxes | (6,516) | (3,029) | (970) |
Before netting deferred tax assets and liabilities by fiscal entity, the components of deferred tax balances are as follows:
As of December 31, (M$) | 2018 | 2017 | 2016 |
Net operating losses and tax carry forwards | 3,779 | 3,014 | 3,267 |
Employee benefits | 995 | 1,153 | 1,257 |
Other temporary non-deductible provisions | 8,409 | 6,344 | 5,862 |
Differences in depreciations | (15,469) | (13,387) | (14,952) |
Other temporary tax deductions | (2,541) | (2,746) | (2,126) |
Net deferred tax liability | (4,827) | (5,622) | (6,692) |
The reserves of TOTAL subsidiaries that would be taxable if distributed but for which no distribution is planned, and for which no deferred tax liability has therefore been recognized, totaled $10,713 million as of December 31, 2018.
Deferred tax assets not recognized as of December 31, 2018 amount to $3,315 million as their future recovery was not regarded as probable given the expected results of the entities. Particularly in the Exploration & Production segment, when the affiliate or the field concerned is in its exploration phase, the net operating losses created during this phase will be useable only if a final investment and development decision is made. Accordingly, the time limit for the utilization of those net operating losses is not known.
Deferred tax assets not recognized relate notably to France for an amount of $470 million, to Australia for an amount of $370 million, to Nigeria for an amount of $303 million and to Canada for an amount of $250 million.
After netting deferred tax assets and liabilities by fiscal entity, deferred taxes are presented on the balance sheet as follows:
As of December 31, (M$) | 2018 | 2017 | 2016 |
Deferred tax assets, non-current | 6,663 | 5,206 | 4,368 |
Deferred tax liabilities, non-current | (11,490) | (10,828) | (11,060) |
Net amount | (4,827) | (5,622) | (6,692 |
The net deferred tax variation in the balance sheet is analyzed as follows:
As of December 31, (M$) | 2018 | 2017 | 2016 |
Opening balance | (5,622) | (6,692) | (8,378) |
Deferred tax on income | 455 | 387 | 1,941 |
Deferred tax on shareholders’ equity (a) | 27 | (490) | (21) |
Changes in scope of consolidation | 151 | 1,154 | (370) |
Currency translation adjustment | 162 | 19 | 136 |
Closing balance | (4,827) | (5,622) | (6,692) |
(a) This amount includes mainly deferred taxes on actuarial gains and losses, current income taxes and deferred taxes for changes in fair value of listed securities classified as financial assets available for sale, as well as deferred taxes related to the cash flow hedge (see note 9 to the Consolidated Financial Statements).
Reconciliation between provision for income taxes and pre-tax income
For the year ended December 31, (M$) | 2018 | 2017 | 2016 |
Consolidated net income | 11,550 | 8,299 | 6,206 |
Provision for income taxes | 6,516 | 3,029 | 970 |
pre-tax income | 18,066 | 11,328 | 7,176 |
French statutory tax rate | 34.43% | 44.43% | 34.43% |
Theoretical tax charge | (6,220) | (5,033) | (2,471) |
Difference between French and foreign income tax rates | (3,058) | (633) | 5 |
Tax effect of equity in income (loss) of affiliates | 1,080 | 888 | 761 |
Permanent differences | 1,740 | 1,491 | (76) |
Adjustments on prior years income taxes | (40) | (91) | 54 |
Adjustments on deferred tax related to changes in tax rates | 2 | (309) | 234 |
Changes in valuation allowance of deferred tax assets | (20) | 658 | 523 |
Net provision for income taxes | (6,516) | (3,029) | (970) |
The French statutory tax rate includes the standard corporate tax rate (33.33%), additional and exceptional applicable taxes that bring the overall tax rate to 34.43% in 2018 (versus 44.43% in 2017 and 34.43% in 2016).
Permanent differences are mainly due to impairment of goodwill and to dividends from non-consolidated companies as well as the specific taxation rules applicable to certain activities.
Net operating losses and carried forward tax credits
Deferred tax assets related to carried forward tax credits on net operating losses expire in the following years:
As of December 31, (M$) | 2018 | 2017 | 2016 |
2017 | 130 | ||
2018 | 75 | 109 | |
2019 | 90 | 64 | 60 |
2020 | 70 | 60 | |
2021 (a) | 38 | 24 | 1,154 |
2022 (b) | 32 | 1,330 | |
2023 and after | 1,423 | ||
Unlimited | 2,126 | 1,461 | 1,814 |
Total | 3,779 | 3,014 | 3,267 |
(a) 2021 and after for 2016.
(b) 2022 and after for 2017.
As of December 31, 2018 the schedule of deferred tax assets related to carried forward tax credits on net operating losses for the main countries is as follows:
As of December 31, 2018 (M$) | Tax | ||||
Canada | France | Australia | United States | United Kingdom | |
2019 | 6 | ||||
2020 | 6 | ||||
2021 | 7 | ||||
2022 | |||||
2023 and after | 844 | 492 | |||
Unlimited | 719 | 704 | 441 | ||
Total | 844 | 738 | 704 | 492 | 441 |
12.1 Provisions and other non-current liabilities
Accounting policies A provision is recognized when the Group has a present obligation (legal or constructive) as a result of a past event for which it is probable that an outflow of resources will be required and when a reliable estimate can be made regarding the amount of the obligation. The amount of the liability corresponds to the best possible estimate. Provisions and non-current liabilities are comprised of liabilities for which the amount and the timing are uncertain. They arise from environmental risks, legal and tax risks, litigation and other risks. |
As of December 31, (M$) | 2018 | 2017 | 2016 |
Litigations and accrued penalty claims | 736 | 706 | 1,123 |
Provisions for environmental contingencies | 862 | 964 | 938 |
Asset retirement obligations | 14,286 | 12,240 | 12,665 |
Other non-current provisions | 3,144 | 1,370 | 1,455 |
Of which restructuring activities (Refining & Chemicals and Marketing & Services) | 134 | 160 | 184 |
Of which financial risks related to non-consolidated and equity consolidated affiliates | 100 | 59 | 63 |
Of which contingency reserve on solar panels warranties (SunPower) | 173 | 177 | 168 |
Other non-current liabilities | 2,404 | 706 | 665 |
Total | 21,432 | 15,986 | 16,846 |
In 2018, litigation reserves amount to $736 million of which $561 million in the Exploration & Production, notably in Angola, Nigeria and Brazil.
In 2018, other non-current liabilities mainly include debts (whose maturity is more than one year) related to fixed assets acquisitions.
In 2017, litigation reserves amounted to $706 million of which $512 million in the Exploration & Production, notably in Angola and Nigeria.
In 2017, other non-current liabilities mainly included debts (whose maturity is more than one year) related to fixed assets acquisitions.
In 2016, litigation reserves amounted to $1,123 million of which $959 million was in the Exploration & Production, notably in Angola and Nigeria.
In 2016, other non-current liabilities mainly included debts (whose maturity is more than one year) related to fixed assets acquisitions.
Changes in provisions and other non-current liabilities
Changes in provisions and other non-current liabilities are as follows:
(M$) | As of | Allowances | Reversals | Currency translation adjustment | Other | As of |
2018 | 15,986 | 2,416 | (1,378) | (519) | 4,927 | 21,432 |
Of which asset retirement obligations (corresponds to accretion for allowances) | 530 | (320) | ||||
Of which environmental contingencies (Marketing & Services, Refining & Chemicals) | 33 | (111) | ||||
Of which restructuring of activities | 149 | (106) | ||||
2017 | 16,846 | 1,172 | (1,612) | 681 | (1,101) | 15,986 |
Of which asset retirement obligations (corresponds to accretion for allowances) | 544 | (330) | ||||
Of which environmental contingencies (Marketing & Services, Refining & Chemicals) | 37 | (120) | ||||
Of which restructuring of activities | 48 | (84) | ||||
2016 | 17,502 | 1,569 | (1,268) | (484) | (473) | 16,846 |
Of which asset retirement obligations (corresponds to accretion for allowances) | 523 | (502) | ||||
Of which environmental contingencies (Marketing & Services, Refining & Chemicals) | 29 | (82) | ||||
Of which restructuring of activities | 25 | (68) |
In 2018, the heading "Other" mainly corresponds to the effect of acquisitions:
-Maersk Oil’s asset retirement obligation for an amount of $2,003 million;
-and Global LNG’s provisions and other non-current liabilities for an amount of $1,766 million of which the additional purchase price of $550 million (see Note 2 paragraph 2 to the Consolidated Financial Statements).
Changes in the asset retirement obligation
Accounting policies Asset retirement obligations, which result from a legal or constructive obligation, are recognized based on a reasonable estimate in the period in which the obligation arises. The associated asset retirement costs are capitalized as part of the carrying amount of the underlying asset and depreciated over the useful life of this asset. An entity is required to measure changes in the liability for an asset retirement obligation due to the passage of time (accretion) by applying a risk-free discount rate to the amount of the liability. Given the long term nature of expenditures related to our asset retirement obligations, the rate is determined by reference to the high quality rates for AA-rated Corporate bonds on the USD area for a long-term horizon. The increase of the provision due to the passage of time is recognized as "Other financial expense". |
The discount rate used in 2018 for the valuation of asset retirement obligation is 4.5% as in 2017 and 2016 (the expenses are estimated at current currency values with an inflation rate of 2%). A decrease of 0.5% of this rate would increase the asset retirement obligation by $1,353 million, with a corresponding impact in tangible assets, and with a negative impact of approximately $90 million on the following years net income. Conversely, an increase of 0.5% would have a nearly symmetrical impact compared to the effect of the decrease of 0.5%.
Changes in the asset retirement obligation are as follows:
(M$) | As of | Accretion | Revision in estimates | New | Spending on existing obligations | Currency translation adjustment | Other | As of |
2018 | 12,240 | 530 | (458) | 811 | (320) | (364) | 1,847 | 14,286 |
2017 | 12,665 | 544 | (1,107) | 334 | (330) | 448 | (314) | 12,240 |
2016 | 13,314 | 523 | (558) | 375 | (502) | (395) | (92) | 12,665 |
12.2 Other risks and contingent liabilities
TOTAL is not currently aware of any exceptional event, dispute, risks or contingent liabilities that could have a material impact on the assets and liabilities, results, financial position or operations of the Group.
FERC
The Office of Enforcement of the U.S. Federal Energy Regulatory Commission (FERC) began in 2015 an investigation in connection with the natural gas trading activities in the United States of Total Gas & Power North America, Inc. (TGPNA), a U.S. subsidiary of the Group. The investigation covered transactions made by TGPNA between June 2009 and June 2012 on the natural gas market. TGPNA received a Notice of Alleged Violations from FERC on September 21, 2015. On April 28, 2016, FERC issued an order to show cause to TGPNA and two of its former employees, and to TOTAL S.A. and Total Gas & Power Ltd., regarding the same facts. TGPNA contests the claims brought against it.
A class action launched to seek damages from these three companies, was dismissed by a judgment of the U.S. District Court of New York issued on March 15, 2017. The Court of Appeal upheld this judgment on May 4, 2018.
13.1 Off balance sheet commitments and contingencies
As of December 31, 2018 (M$) | Maturity and installments | |||
Total | Less than 1 year | Between 1 and 5 years | More than 5 years | |
Non-current debt obligations net of hedging instruments (Note 15) | 37,784 | - | 19,072 | 18,712 |
Current portion of non-current debt obligations net of hedging instruments (Note 15) | 5,027 | 5,027 | - | - |
Finance lease obligations (Note 13.2) | 1,878 | 213 | 468 | 1,197 |
Asset retirement obligations (Note 12) | 14,286 | 844 | 3,388 | 10,054 |
Contractual obligations recorded in the balance sheet | 58,975 | 6,084 | 22,928 | 29,963 |
Operating lease obligations (Note 13.2) | 9,130 | 1,644 | 3,691 | 3,795 |
Purchase obligations | 121,119 | 9,708 | 30,652 | 80,759 |
Contractual obligations not recorded in the balance sheet | 130,249 | 11,352 | 34,343 | 84,554 |
Total of contractual obligations | 189,224 | 17,436 | 57,271 | 114,517 |
Guarantees given for excise taxes | 2,043 | 1,904 | 12 | 127 |
Guarantees given against borrowings | 18,680 | 169 | 68 | 18,443 |
Indemnities related to sales of businesses | 334 | 165 | 10 | 159 |
Guarantees of current liabilities | 222 | 83 | 74 | 65 |
Guarantees to customers/suppliers | 8,463 | 1,222 | 847 | 6,394 |
Letters of credit | 3,515 | 3,164 | 160 | 191 |
Other operating commitments | 29,416 | 2,085 | 1,046 | 26,285 |
Total of other commitments given | 62,673 | 8,792 | 2,217 | 51,664 |
Mortgages and liens received | 84 | 23 | 33 | 28 |
Sales obligations | 91,695 | 7,989 | 27,709 | 55,997 |
Other commitments received | 21,565 | 15,527 | 1,328 | 4,710 |
Total of commitments received | 113,344 | 23,539 | 29,070 | 60,735 |
Of which commitments given relating to joint ventures | 42,768 | 162 | 4,425 | 38,181 |
Of which commitments given relating to associates | 39,437 | 773 | 8,378 | 30,286 |
As of December 31, 2017 (M$) | Maturity and installments | |||
Total | Less than 1 year | Between 1 and 5 years | More than 5 years | |
Non-current debt obligations net of hedging instruments (Note 15) | 39,544 | - | 19,540 | 20,004 |
Current portion of non-current debt obligations net of hedging instruments (Note 15) | 4,646 | 4,646 | - | - |
Finance lease obligations (Note 13.2) | 1,156 | 39 | 261 | 856 |
Asset retirement obligations (Note 12) | 12,240 | 485 | 2,165 | 9,590 |
Contractual obligations recorded in the balance sheet | 57,586 | 5,170 | 21,966 | 30,450 |
Operating lease obligations (Note 13.2) | 6,441 | 1,401 | 2,886 | 2,154 |
Purchase obligations | 86,366 | 8,605 | 23,917 | 53,844 |
Contractual obligations not recorded in the balance sheet | 92,807 | 10,006 | 26,803 | 55,998 |
Total of contractual obligations | 150,393 | 15,176 | 48,769 | 86,448 |
Guarantees given for excise taxes | 2,073 | 1,938 | 29 | 106 |
Guarantees given against borrowings | 16,080 | 411 | 10,607 | 5,062 |
Indemnities related to sales of businesses | 341 | 120 | 61 | 160 |
Guarantees of current liabilities | 321 | 91 | 109 | 121 |
Guarantees to customers/suppliers | 4,180 | 1,100 | 268 | 2,812 |
Letters of credit | 2,965 | 2,680 | 102 | 183 |
Other operating commitments | 17,431 | 1,165 | 637 | 15,629 |
Total of other commitments given | 43,391 | 7,505 | 11,813 | 24,073 |
Mortgages and liens received | 89 | 23 | 26 | 40 |
Sales obligations | 67,014 | 6,263 | 21,513 | 39,238 |
Other commitments received | 7,398 | 3,549 | 1,111 | 2,738 |
Total of commitments received | 74,501 | 9,835 | 22,650 | 42,016 |
Of which commitments given relating to joint ventures | 36,847 | 160 | 12,225 | 24,462 |
Of which commitments given relating to associates | 20,629 | 580 | 5,991 | 14,058 |
As of December 31, 2016 (M$) | Maturity and installments | |||
Total | Less than 1 year | Between 1 and 5 years | More than 5 years | |
Non-current debt obligations net of hedging instruments (Note 15) | 41,848 | - | 18,449 | 23,399 |
Current portion of non-current debt obligations net of hedging instruments (Note 15) | 4,614 | 4,614 | - | - |
Finance lease obligations (Note 13.2) | 319 | 8 | 103 | 208 |
Asset retirement obligations (Note 12) | 12,665 | 685 | 2,269 | 9,711 |
Contractual obligations recorded in the balance sheet | 59,446 | 5,307 | 20,821 | 33,318 |
Operating lease obligations (Note 13.2) | 6,478 | 1,582 | 2,953 | 1,943 |
Purchase obligations | 105,208 | 10,898 | 20,570 | 73,740 |
Contractual obligations not recorded in the balance sheet | 111,686 | 12,480 | 23,523 | 75,683 |
Total of contractual obligations | 171,132 | 17,787 | 44,344 | 109,001 |
Guarantees given for excise taxes | 1,887 | 1,740 | 58 | 89 |
Guarantees given against borrowings | 14,666 | 215 | 664 | 13,787 |
Indemnities related to sales of businesses | 375 | 158 | 59 | 158 |
Guarantees of current liabilities | 391 | 89 | 99 | 203 |
Guarantees to customers/suppliers | 3,997 | 1,038 | 225 | 2,734 |
Letters of credit | 1,457 | 1,215 | 81 | 161 |
Other operating commitments | 3,592 | 1,319 | 409 | 1,864 |
Total of other commitments given | 26,365 | 5,774 | 1,595 | 18,996 |
Mortgages and liens received | 77 | 20 | 19 | 38 |
Sales obligations | 82,756 | 7,331 | 21,356 | 54,069 |
Other commitments received | 6,799 | 3,133 | 1,124 | 2,542 |
Total of commitments received | 89,632 | 10,484 | 22,499 | 56,649 |
Of which commitments given relating to joint ventures | 48,257 | 61 | 3,211 | 44,985 |
Of which commitments given relating to associates | 21,959 | 603 | 3,265 | 18,091 |
A) Contractual obligations
Debt obligations
"Non-current debt obligations" are included in the items "Non-current financial debt" and "Non-current financial assets" of the consolidated balance sheet. It includes the non-current portion of swaps hedging bonds, and excludes non-current finance lease obligations of $1,665 million.
The current portion of non-current debt is included in the items "Current borrowings", "Current financial assets" and "Other current financial liabilities" of the consolidated balance sheet. It includes the current portion of swaps hedging bonds, and excludes the current portion of finance lease obligations of $213 million.
The information regarding contractual obligations linked to indebtedness is presented in Note 15 to the Consolidated Financial Statements.
Lease contracts
The information regarding operating and finance leases is presented in Note 13.2 to the Consolidated Financial Statements.
Asset retirement obligations
This item represents the discounted present value of Exploration & Production asset retirement obligations, primarily asset removal costs at the completion date. The information regarding contractual obligations linked to asset retirement obligations is presented in Note 12 to the Consolidated Financial Statements.
Purchase obligations
Purchase obligations are obligations under contractual agreements to purchase goods or services, including capital projects. These obligations are enforceable and legally binding on the Company and specify all significant terms, including the amount and the timing of the payments.
These obligations mainly include: unconditional hydrocarbon purchase contracts (except where an active, highly-liquid market exists and when the hydrocarbons are expected to be re-sold shortly after purchase), reservation of transport capacities in pipelines, unconditional exploration works and development works in the Exploration & Production segment, and contracts for capital investment projects in the Refining & Chemicals segment.
B) Other commitments given
Guarantees given for excise taxes
These consist of guarantees given by the Group to customs authorities in order to guarantee the payments of taxes and excise duties on the importation of oil and gas products, mostly in France.
Guarantees given against borrowings
The Group guarantees bank debt and finance lease obligations of certain non-consolidated subsidiaries and equity affiliates. Maturity dates vary, and guarantees will terminate on payment and/or cancellation of the obligation. A payment would be triggered by failure of the guaranteed party to fulfill its obligation covered by the guarantee, and no assets are held as collateral for these guarantees. As of December 31, 2018, the maturities of these guarantees are up to 2043.
As of December 31, 2018, the guarantees provided by TOTAL S.A. in connection with the financing of the Ichthys LNG project amounted to $9,425 million. As of December 31, 2017, the guarantees amounted to $8,500 million.
Guarantees given against borrowings also include the guarantee given in 2018 by TOTAL S.A. in connection with the financing of the Yamal LNG project for an amount of $3,875 million by TOTAL S.A. As of December 31, 2017, the guarantees amounted to $4,038 million.
As of December 31, 2018, TOTAL S.A. has confirmed guarantees for Total Refining SAUDI ARABIA SAS shareholders’ advances for an amount of $1,462 million as in 2017.
As of December 31, 2018, the guarantee given in 2008 by TOTAL S.A. in connection with the financing of the Yemen LNG project amounts to $551 million as in 2017.
As of December 31, 2018, guarantees provided by TOTAL S.A. in connection with the financing of the Bayport Polymers LLC project, amounted to $1,820 million.
Indemnities related to sales of businesses
In the ordinary course of business, the Group executes contracts involving standard indemnities for the oil industry and indemnities specific to transactions such as sales of businesses. These indemnities might include claims against any of the following: environmental, tax and shareholder matters, intellectual property rights, governmental regulations and employment-related matters, dealer, supplier, and other commercial contractual relationships. Performance under these indemnities would generally be triggered by a breach of terms of the contract or by a third party claim. The Group regularly evaluates the probability of having to incur costs associated with these indemnities.
Other guarantees given
Non-consolidated subsidiaries
The Group also guarantees the current liabilities of certain non-consolidated subsidiaries. Performance under these guarantees would be triggered by a financial default of the entity.
Operating agreements
As part of normal ongoing business operations and consistent with generally accepted and recognized industry practices, the Group enters into numerous agreements with other parties. These commitments are often entered into for commercial purposes, for regulatory purposes or for other operating agreements.
C) Commitments received
Sales obligations
These amounts represent binding obligations under contractual agreements to sell goods, including in particular unconditional hydrocarbon sales contracts (except where an active, highly-liquid market exists and when the volumes are expected to be re-sold shortly after purchase).
13.2 Lease contracts
Accounting principles A finance lease transfers substantially all the risks and rewards incidental to ownership from the lessor to the lessee. These contracts are capitalized as assets at fair value or, if lower, at the present value of the minimum lease payments according to the contract. A corresponding financial debt is recognized as a financial liability. These assets are depreciated over the corresponding useful life used by the Group. Leases that are not finance leases as defined above are recorded as operating leases. Certain arrangements do not take the legal form of a lease but convey the right to use an asset or a group of assets in return for fixed payments. Such arrangements are accounted for as leases and are analyzed to determine whether they should be classified as operating leases or as finance leases. |
The Group leases real estate, retail stations, ships, and other equipment (see Note 7 to the Consolidated Financial Statements).
The future minimum lease payments on operating and finance leases to which the Group is committed are as follows:
For the year ended December 31, 2018 (M$) | Operating leases | Finance leases |
2019 | 1,644 | 263 |
2020 | 1,282 | 183 |
2021 | 967 | 182 |
2022 | 772 | 179 |
2023 | 669 | 179 |
2024 and beyond | 3,796 | 1,826 |
Total minimum payments | 9,130 | 2,812 |
Less financial expenses | (934) | |
Nominal value of contracts | 1,878 | |
Less current portion of finance lease contracts | (213) | |
Non-current finance lease liabilities | 1,665 |
For the year ended December 31, 2017 (M$) | Operating leases | Finance leases |
2018 | 1,401 | 76 |
2019 | 988 | 67 |
2020 | 814 | 67 |
2021 | 623 | 65 |
2022 | 462 | 65 |
2023 and beyond | 2,153 | 864 |
Total minimum payments | 6,441 | 1,204 |
Less financial expenses | (48) | |
Nominal value of contracts | 1,156 | |
Less current portion of finance lease contracts | (39) | |
Non-current finance lease liabilities | 1,117 |
For the year ended December 31, 2016 (M$) | Operating leases | Finance leases |
2017 | 1,582 | 24 |
2018 | 1,054 | 26 |
2019 | 777 | 44 |
2020 | 687 | 27 |
2021 | 435 | 25 |
2022 and beyond | 1,943 | 247 |
Total minimum payments | 6,478 | 393 |
Less financial expenses | (74) | |
Nominal value of contracts | 319 | |
Less current portion of finance lease contracts | (8) | |
Non-current finance lease liabilities | 311 |
Net rental expense incurred under operating leases for the year ended December 31, 2018 is $1,304 million (against $1,467 million in 2017 and $1,629 million in 2016).
The financial assets and liabilities disclosed in the balance sheet are detailed as follows:
As of December 31, 2018 (M$) ASSETS/(LIABILITIES) | Amortized cost | Fair value through P&L | Fair value through OCI - equity instruments | Fair value of instruments hedge | Total | Fair value |
Equity affiliates: loans | 4,755 | - | - | - | 4,755 | 4,755 |
Other investments | - | 1,059 | 362 | - | 1,421 | 1,421 |
Non-current financial assets | - | 67 | - | 613 | 680 | 680 |
Other non-current assets | 2,348 | - | - | - | 2,348 | 2,348 |
Accounts receivable, net (b) | 17,270 | - | - | - | 17,270 | 17,270 |
Other operating receivables | 6,994 | 2,731 | - | 8 | 9,733 | 9,733 |
Current financial assets | 3,536 | 73 | - | 45 | 3,654 | 3,654 |
Cash and cash equivalents | 27,907 | - | - | - | 27,907 | 27,907 |
Total financial assets | 62,810 | 3,930 | 362 | 666 | 67,768 | 67,768 |
Total non-financial assets | 188,994 | |||||
Total assets | 256,762 | |||||
Non-current financial debt (a) | (38,220) | (29) | - | (1,880) | (40,129) | (41,281) |
Accounts payable (b) | (26,134) | - | - | - | (26,134) | (26,134) |
Other operating liabilities | (9,854) | (3,429) | - | (3) | (13,286) | (13,286) |
Current borrowings (a) | (13,306) | - | - | - | (13,306) | (13,306) |
Other current financial liabilities | - | (183) | - | (295) | (478) | (478) |
Total financial liabilities | (87,514) | (3,641) | - | (2,178) | (93,333) | (94,485) |
Total non-financial liabilities | (163,429) | |||||
Total liabilities | (256,762) |
(a) The financial debt is adjusted to the hedged risks value (currency and interest rate) as part of hedge accounting (see Note 15 to the Consolidated Financial Statements).
(b) The impact of offsetting on accounts receivable, net is $(2,903) million and $2,903 million on accounts payable.
As of December 31, 2017 (M$) | Financial instruments related to financing and operational activities | Other financial instruments | Total | Fair value | ||||||
Amortized cost | Fair value | Amortized cost | ||||||||
ASSETS/(LIABILITIES) | Available for sale (a) | Held for trading | Financial debt (b) | Hedging of Financial debt | Cash flow hedge | Net investment hedge and other | ||||
Equity affiliates: loans | 5,135 | - | - | - | - | - | - | - | 5,135 | 5,135 |
Other investments | - | 1,727 | - | - | - | - | - | - | 1,727 | 1,727 |
Non-current financial assets | - | - | 73 | - | 337 | 269 | - | - | 679 | 679 |
Other non-current assets | 3,765 | 50 | - | - | - | - | - | - | 3,815 | 3,815 |
Accounts receivable, net (c) | - | - | - | - | - | - | - | 14,893 | 14,893 | 14,893 |
Other operating receivables | - | - | 1,977 | - | - | 12 | - | 7,347 | 9,336 | 9,336 |
Current financial assets | 2,970 | - | 251 | - | 172 | - | - | - | 3,393 | 3,393 |
Cash and cash equivalents | - | - | - | - | - | - | - | 33,185 | 33,185 | 33,185 |
Total financial assets | 11,870 | 1,777 | 2,301 | - | 509 | 281 | - | 55,425 | 72,163 | 72,163 |
Total non-financial assets | - | - | - | - | - | - | - | - | 170,468 | - |
Total assets | - | - | - | - | - | - | - | - | 242,631 | - |
Non-current financial debt | (18,470) | - | (20) | (21,768) | (951) | (131) | - | - | (41,340) | (42,886) |
Accounts payable (c) | - | - | - | - | - | - | - | (26,479) | (26,479) | (26,479) |
Other operating liabilities | - | - | (1,794) | - | - | - | - | (8,341) | (10,135) | (10,135) |
Current borrowings | (6,925) | - | - | (4,171) | - | - | - | - | (11,096) | (11,095) |
Other current financial liabilities | - | - | (88) | - | (157) | - | - | - | (245) | (245) |
Total financial liabilities | (25,395) | - | (1,902) | (25,939) | (1,108) | (131) | - | (34,820) | (89,295) | (90,840) |
Total non-financial liabilities | - | - | - | - | - | - | - | - | (153,336) | - |
Total liabilities | - | - | - | - | - | - | - | - | (242,631) | - |
(a) Financial assets available for sale are measured at their fair value except for unlisted securities and listed securities on non active markets (see Note 8 to the Consolidated Financial Statements).
(b) The financial debt is adjusted to the hedged risks value (currency and interest rate) as part of hedge accounting (see Note 15 to the Consolidated Financial Statements).
(c) The impact of offsetting on accounts receivable, net is $(3,471) million and $3,471 million on accounts payable.
As of December 31, 2016 (M$) | Financial instruments related to financing and operational activities | Other financial instruments | Total | Fair value | ||||||
Amortized cost | Fair value | Amortized cost | ||||||||
ASSETS/(LIABILITIES) | Available for sale (a) | Held for trading | Financial debt (b) | Hedging of Financial debt | Cash flow hedge | Net investment hedge and other | ||||
Equity affiliates: loans | 4,718 | - | - | - | - | - | - | - | 4,718 | 4,718 |
Other investments | - | 1,133 | - | - | - | - | - | - | 1,133 | 1,133 |
Non-current financial assets | - | - | 63 | - | 716 | 129 | - | - | 908 | 908 |
Other non-current assets | 4,051 | 66 | - | - | - | - | - | - | 4,117 | 4,117 |
Accounts receivable, net (c) | - | - | - | - | - | - | - | 12,213 | 12,213 | 12,213 |
Other operating receivables | - | - | 2,425 | - | - | 4 | - | 7,789 | 10,218 | 10,218 |
Current financial assets | 4,413 | - | 94 | - | 41 | - | - | - | 4,548 | 4,548 |
Cash and cash equivalents | - | - | - | - | - | - | - | 24,597 | 24,597 | 24,597 |
Total financial assets | 13,182 | 1,199 | 2,582 | - | 757 | 133 | - | 44,599 | 62,452 | 62,452 |
Total non-financial assets | - | - | - | - | - | - | - | - | 168,526 | - |
Total assets | - | - | - | - | - | - | - | - | 230,978 | - |
Non-current financial debt | (11,188) | - | (5) | (28,223) | (3,007) | (644) | - | - | (43,067) | (44,168) |
Accounts payable (c) | - | - | - | - | - | - | - | (23,227) | (23,227) | (23,227) |
Other operating liabilities | - | - | (2,001) | - | - | (107) | - | (7,508) | (9,616) | (9,616) |
Current borrowings | (9,700) | - | - | (4,220) | - | - | - | - | (13,920) | (13,920) |
Other current financial liabilities | - | - | (115) | - | (212) | - | - | - | (327) | (327) |
Total financial liabilities | (20,888) | - | (2,121) | (32,443) | (3,219) | (751) | - | (30,735) | (90,157) | (91,258) |
Total non-financial liabilities | - | - | - | - | - | - | - | - | (140,821) | - |
Total liabilities | - | - | - | - | - | - | - | - | (230,978) | - |
(a) Financial assets available for sale are measured at their fair value except for unlisted securities and listed securities on non active markets (see Note 8 to the Consolidated Financial Statements).
(b) The financial debt is adjusted to the hedged risks value (currency and interest rate) as part of hedge accounting (see Note 15 to the Consolidated Financial Statements).
(c) The impact of offsetting on accounts receivable, net is $(1,828) million and $1,828 million on accounts payable.
15.1 Financial debt and derivative financial instruments
A) Non-current financial debt and derivative financial instruments
As of December 31, 2018 (M$) (ASSETS)/LIABILITIES | Secured | Unsecured | Total |
Non-current financial debt | 1,870 | 38,259 | 40,129 |
Of which hedging instruments of non-current financial debt (liabilities) | - | 1,880 | 1,880 |
Non-current financial assets | - | (680) | (680) |
Of which hedging instruments of non-current financial debt (assets) | - | (613) | (613) |
Non-current financial debt and related financial instruments | 1,870 | 37,579 | 39,449 |
Variable rates bonds after fair value hedge | - | 20,570 | 20,570 |
Fixed rate bonds after cash flow hedge | - | 15,672 | 15,672 |
Other floating rate debt | 111 | 621 | 732 |
Other fixed rate debt | 94 | 754 | 848 |
Financial lease obligations | 1,665 | - | 1,665 |
Non-current instruments held for trading | - | (38) | (38) |
Non-current financial debt and related financial instruments | 1,870 | 37,579 | 39,449 |
As of December 31, 2017 (M$) (ASSETS)/LIABILITIES | Secured | Unsecured | Total |
Non-current financial debt | 1,310 | 40,030 | 41,340 |
Of which hedging instruments of non-current financial debt (liabilities) | - | 1,082 | 1,082 |
Non-current financial assets | - | (679) | (679) |
Of which hedging instruments of non-current financial debt (assets) | - | (606) | (606) |
Non-current financial debt and related financial instruments | 1,310 | 39,351 | 40,661 |
Variable rates bonds after fair value hedge | - | 20,620 | 20,620 |
Fixed rate bonds after cash flow hedge | - | 16,469 | 16,469 |
Other floating rate debt | 70 | 1,692 | 1,762 |
Other fixed rate debt | 123 | 623 | 746 |
Financial lease obligations | 1,117 | - | 1,117 |
Non-current instruments held for trading | - | (53) | (53) |
Non-current financial debt and related financial instruments | 1,310 | 39,351 | 40,661 |
As of December 31, 2016 (M$) (ASSETS)/LIABILITIES | Secured | Unsecured | Total |
Non-current financial debt | 572 | 42,495 | 43,067 |
Of which hedging instruments of non-current financial debt (liabilities) | - | 3,651 | 3,651 |
Non-current financial assets | - | (908) | (908) |
Of which hedging instruments of non-current financial debt (assets) | - | (845) | (845) |
Non-current financial debt and related financial instruments | 572 | 41,587 | 42,159 |
Variable rates bonds after fair value hedge | - | 29,147 | 29,147 |
Fixed rate bonds after cash flow hedge | - | 10,315 | 10,315 |
Other floating rate debt | 76 | 1,291 | 1,367 |
Other fixed rate debt | 185 | 892 | 1,077 |
Financial lease obligations | 311 | - | 311 |
Non-current instruments held for trading | - | (58) | (58) |
Non-current financial debt and related financial instruments | 572 | 41,587 | 42,159 |
The bonds, as of December 31, 2018, after taking into account currency and interest rates swaps fair value, is detailed as follows:
Bonds after fair value hedge and variable rate bonds (M$) | Currency of issuance | Amount after hedging as of December 31, 2018 | Amount after hedging as of December 31, 2017 | Amount after hedging as of December 31, 2016 | Range of current maturities | Range of initial current rate before hedging instruments |
Bond | USD | 6,276 | 7,266 | 11,036 | 2019 - 2028 | 2.100% - 3.883% |
Bond | USD | 750 | 1,385 | 1,385 | 2019 - 2020 | USLIBOR 3 mois + 0.35% USLIBOR 3 mois + 0.75% |
Bond | CHF | 204 | 391 | 1,441 | 2026 | 0.298% |
Bond | NZD | 252 | 252 | 251 | 2019 - 2020 | 4.750% - 5.000% |
Bond | AUD | 699 | 850 | 1,211 | 2019 - 2025 | 3.750% - 4.250% |
Bond | EUR | 10,212 | 8,266 | 10,958 | 2019 - 2044 | 0.250% - 4.875% |
Bond | EUR | 1,644 | 1,639 | 1,638 | 2020 | EURIBOR 3 mois + 0.30% EURIBOR 3 mois + 0.31% |
Bond | CAD | 93 | 188 | 289 | 2020 | 2.125% |
Bond | GBP | 1,536 | 1,855 | 2,215 | 2020 - 2022 | 1.750% - 2.250% |
Bond | GBP | 472 | 470 | 469 | 2019 | GBLIB3M + 0.30% |
Bond | NOK | - | 103 | 355 | ||
Bond | HKD | 207 | 212 | 392 | 2019 - 2025 | 2.920% - 4.180% |
Current portion (less than one year) | (3,679) | (4,156) | (4,391) | |||
Total Principal Financing Entities (a) | 18,666 | 18,721 | 27,249 | |||
TOTAL S.A. (b) | 1,203 | 1,201 | 1,200 | 2022 | 0.500% | |
Other consolidated subsidiaries | 701 | 698 | 698 | |||
Total bonds after fair value hedge | 20,570 | 20,620 | 29,147 |
Bonds after cash flow hedge and fixed rate bonds (M$) | Currency of issuance | Amount after hedging as of December 31, 2018 | Amount after hedging as of December 31, 2017 | Amount after hedging as of December 31, 2016 | Range of current maturities | Range of initial current rate before hedging instruments |
Bond | EUR | 9,268 | 9,337 | 5,248 | 2019 - 2029 | 0.750% - 5.125% |
Bond | USD | 5,040 | 5,000 | 4,250 | 2020 - 2024 | 2.750% - 4.450% |
Bond | CNY | - | 164 | 153 | ||
Bond | HKD | 187 | 188 | - | 2026 | 3.088% |
Bond | CHF | 1,035 | 1,037 | - | 2024-2027 | 0.510% - 1.010% |
Bond | GBP | 326 | 324 | - | 2024 | 1.250% |
Current portion (less than one year) | (946) | (164) | - | |||
Total Principal Financing Entities (a) | 14,910 | 15,886 | 9,651 | |||
Other consolidated subsidiaries | 762 | 583 | 664 | |||
Total bonds after cash flow hedge and fixed rate bonds | 15,672 | 16,469 | 10,315 |
(a) All debt securities issued through the following subsidiaries are fully and unconditionally guaranteed by TOTAL S.A. as to payment of principal, premium, if any, interest and any other amounts due:
- Total Capital is a wholly-owned subsidiary of TOTAL S.A. (except for one share held by each director). It acts as a financing vehicle for the Group. The repayment of its financial debt (capital, premium and interest) is fully and unconditionally guaranteed by TOTAL S.A.
- Total Capital Canada Ltd. is a wholly-owned subsidiary of TOTAL S.A.. It acts as a financing vehicle for the activities of the Group in Canada. The repayment of its financial debt (capital, premium and interest) is fully and unconditionally guaranteed by TOTAL S.A.
- Total Capital International is a wholly-owned subsidiary of TOTAL S.A. (except for one share held by each director). It acts as a financing vehicle for the Group. The repayment of its financial debt (capital, premium and interest) is fully and unconditionally guaranteed by TOTAL S.A.
(b) Debt financing of $1.2 billion through a structure combining the issue of cash-settled convertible bonds with the purchase of cash-settled call options to hedge TOTAL’s exposure to the exercise of the conversion rights under the bonds.
Loan repayment schedule (excluding current portion)
As of December 31, 2018 (M$) | Non-current financial debt | of which hedging instruments of non-current financial debt (liabilities) | Non-current financial assets | of which hedging instruments of non-current financial debt (assets) | Non-current financial debt and related financial instruments | % |
2020 | 5,442 | 386 | (10) | - | 5,432 | 14% |
2021 | 4,042 | 251 | (76) | (57) | 3,966 | 10% |
2022 | 5,262 | 448 | (104) | (104) | 5,158 | 13% |
2023 | 5,020 | 93 | (37) | - | 4,983 | 13% |
2024 and beyond | 20,363 | 702 | (453) | (452) | 19,910 | 50% |
Total | 40,129 | 1,880 | (680) | (613) | 39,449 | 100% |
As of December 31, 2017 (M$) | Non-current financial debt | of which hedging instruments of non-current financial debt (liabilities) | Non-current financial assets | of which hedging instruments of non-current financial debt (assets) | Non-current financial debt and related financial instruments | % |
2019 | 6,005 | 164 | (75) | (68) | 5,930 | 15% |
2020 | 5,119 | 222 | (2) | - | 5,117 | 13% |
2021 | 3,810 | 96 | (15) | - | 3,795 | 9% |
2022 | 5,026 | 165 | (67) | (67) | 4,959 | 12% |
2023 and beyond | 21,380 | 435 | (520) | (471) | 20,860 | 51% |
Total | 41,340 | 1,082 | (679) | (606) | 40,661 | 100% |
As of December 31, 2016 (M$) | Non-current financial debt | of which hedging instruments of non-current financial debt (liabilities) | Non-current financial assets | of which hedging instruments of non-current financial debt (assets) | Non-current financial debt and related financial instruments | % |
2018 | 4,572 | 249 | (252) | (235) | 4,320 | 10% |
2019 | 5,812 | 327 | (110) | (104) | 5,702 | 14% |
2020 | 4,956 | 564 | (4) | - | 4,952 | 12% |
2021 | 3,609 | 237 | (31) | (7) | 3,578 | 8% |
2022 and beyond | 24,118 | 2,274 | (511) | (499) | 23,607 | 56% |
Total | 43,067 | 3,651 | (908) | (845) | 42,159 | 100% |
Analysis by currency and interest rate
These analyses take into account interest rate and foreign currency swaps to hedge non-current financial debt.
As of December 31, (M$) | 2018 | % | 2017 | % | 2016 | % |
U.S. dollar | 38,120 | 97% | 38,703 | 95% | 39,963 | 95% |
Euro | 1,103 | 3% | 724 | 2% | 977 | 2% |
Norwegian krone | 27 | 0% | 975 | 2% | 928 | 2% |
Other currencies | 199 | 0% | 259 | 1% | 291 | 1% |
Total | 39,449 | 100% | 40,661 | 100% | 42,159 | 100% |
As of December 31, (M$) | 2018 | % | 2017 | % | 2016 | % |
Fixed rate | 18,139 | 46% | 18,332 | 45% | 11,703 | 28% |
Floating rate | 21,310 | 54% | 22,329 | 55% | 30,456 | 72% |
Total | 39,449 | 100% | 40,661 | 100% | 42,159 | 100% |
B) Current financial assets and liabilities
Current borrowings consist mainly of commercial paper or treasury bills or drawings on bank loans. These instruments bear interest at rates that are close to market rates.
As of December 31, (M$) (ASSETS)/LIABILITIES | 2018 | 2017 | 2016 |
Current financial debt (a) | 8,316 | 6,396 | 9,469 |
Current portion of non-current financial debt | 4,990 | 4,700 | 4,451 |
Current borrowings (Note 14) | 13,306 | 11,096 | 13,920 |
Current portion of hedging instruments of debt (liabilities) | 295 | 157 | 212 |
Other current financial instruments (liabilities) | 183 | 88 | 115 |
Other current financial liabilities (Note 14) | 478 | 245 | 327 |
Current deposits beyond three months | (3,536) | (2,970) | (4,413) |
Current portion of hedging instruments of debt (assets) | (45) | (172) | (41) |
Other current financial instruments (assets) | (73) | (251) | (94) |
Current financial assets (Note 14) | (3,654) | (3,393) | (4,548) |
Current borrowings and related financial assets and liabilities, net | 10,130 | 7,948 | 9,699 |
(a) As of December 31, 2018, December 31, 2017 and December 31, 2016, the current financial debt includes a commercial paper program in Total Capital Canada Ltd. Total Capital Canada Ltd. is a wholly-owned subsidiary of TOTAL S.A. It acts as a financing vehicle for the activities of the Group in Canada. Its debt securities are fully and unconditionally guaranteed by TOTAL S.A. as to payment of principal, premium, if any, interest and any other amounts due.
C) Cash flow from (used in) financing activities
The variations of financial debt are detailed as follows:
(M$) | As of January 1, 2018 | Cash changes | Non-cash changes | As of December 31, 2018 | ||||
Change in scope, including IFRS 5 reclassification | Foreign currency | Changes in fair value | Reclassification Non-current/ Current | Other | ||||
Non-current financial instruments - assets (a) | (679) | - | (72) | 12 | 59 | - | - | (680) |
Non-current financial debt | 41,340 | 649 | 4,708 | (59) | 62 | (6,260) | (311) | 40,129 |
Non-current financial debt and related financial instruments | 40,661 | 649 | 4,636 | (47) | 121 | (6,260) | (311) | 39,449 |
Current financial instruments - assets (a) | (423) | - | - | 10 | 295 | - | - | (118) |
Current borrowings | 11,096 | (3,990) | 230 | 270 | (514) | 6,260 | (46) | 13,306 |
Current financial instruments - liabilities (a) | 245 | - | 67 | (11) | 177 | - | - | 478 |
Current financial debt and related financial instruments | 10,918 | (3,990) | 297 | 269 | (42) | 6,260 | (46) | 13,666 |
Financial debt classified as held for sale | - | - | - | - | - | - | - | - |
Financial debt | 51,579 | (3,341) | 4,933 | 222 | 79 | - | (357) | 53,115 |
(M$) | As of | Cash changes | Non-cash changes | As of | ||||
Change in scope, including IFRS 5 reclassification | Foreign currency | Changes in fair value | Reclassification Non-current/ Current | Other | ||||
Non-current financial instruments - assets (a) | (908) | - | - | (62) | 291 | - | - | (679) |
Non-current financial debt | 43,067 | 2,277 | 2 | 203 | (451) | (4,713) | 955 | 41,340 |
Non-current financial debt and related financial instruments | 42,159 | 2,277 | 2 | 141 | (160) | (4,713) | 955 | 40,661 |
Current financial instruments - assets (a) | (135) | - | - | (34) | (254) | - | - | (423) |
Current borrowings | 13,920 | (7,175) | (50) | (585) | 290 | 4,713 | (17) | 11,096 |
Current financial instruments - liabilities (a) | 327 | - | - | 18 | (100) | - | - | 245 |
Current financial debt and related financial instruments | 14,112 | (7,175) | (50) | (601) | (64) | 4,713 | (17) | 10,918 |
Financial debt classified as held for sale | 21 | - | (21) | - | - | - | - | - |
Financial debt | 56,292 | (4,898) | (69) | (460) | (224) | - | 938 | 51,579 |
(a) Fair value or cash flow hedge instruments and other non-hedge debt-related derivative instruments.
Monetary changes in non-current financial debt are detailed as follows:
For the year ended December 31, (M$) | 2018 | 2017 | 2016 |
Issuance of non-current debt | 3,938 | 2,959 | 4,096 |
Repayment of non-current debt | (3,289) | (682) | (520) |
Net amount | 649 | 2,277 | 3,576 |
D) Cash and cash equivalents
Accounting policies Cash and cash equivalents are comprised of cash on hand and highly liquid short-term investments that are easily convertible into known amounts of cash and are subject to insignificant risks of changes in value. Investments with maturity greater than three months and less than twelve months are shown under "Current financial assets". Changes in current financial assets and liabilities are included in the financing activities section of the Consolidated Statement of Cash Flows. |
Cash and cash equivalents are detailed as follows:
For the year ended December 31, (M$) | 2018 | 2017 | 2016 |
Cash | 15,186 | 13,427 | 12,129 |
Cash equivalents | 12,721 | 19,758 | 12,468 |
Total | 27,907 | 33,185 | 24,597 |
Cash equivalents are mainly composed of deposits less than three months deposited in government institutions or deposit banks selected in accordance with strict criteria.
As of December 31, 2018, the cash and cash equivalents include $1,842 million subject to restrictions particularly due to a regulatory framework or due to the fact they are owned by affiliates located in countries with exchange controls.
E) Net-debt-to-capital ratio
For its internal and external communication needs, the Group calculates a debt ratio by dividing its net financial debt by its capital.
The ratio is calculated as follows: Net debt/(Equity + Net debt)
As of December 31, (M$) (ASSETS)/LIABILITIES | 2018 | 2017 | 2016 |
Current borrowings | 13,306 | 11,096 | 13,920 |
Other current financial liabilities | 478 | 245 | 327 |
Current financial assets | (3,654) | (3,393) | (4,548) |
Net financial assets and liabilities held for sale or exchange | (15) | - | (140) |
Non-current financial debt | 40,129 | 41,340 | 43,067 |
Non-current financial assets | (680) | (679) | (908) |
Cash and cash equivalents | (27,907) | (33,185) | (24,597) |
Net financial debt | 21,657 | 15,424 | 27,121 |
Shareholders’ equity - Group share | 115,640 | 111,556 | 98,680 |
Non-controlling interests | 2,474 | 2,481 | 2,894 |
Shareholders’ equity | 118,114 | 114,037 | 101,574 |
Net-debt-to-capital ratio | 15.5% | 11.9% | 21.1% |
15.2 Fair value of financial instruments (excluding commodity contracts)
Accounting policies The Group uses derivative instruments to manage its exposure to risks of changes in interest rates, foreign exchange rates and commodity prices. These financial instruments are accounted for in accordance with IFRS 9. Changes in fair value of derivative instruments are recognized in the statement of income or in other comprehensive income and are recognized in the balance sheet in the accounts corresponding to their nature, according to the risk management strategy. The derivative instruments used by the Group are the following: Cash management Financial instruments used for cash management purposes are part of a hedging strategy of currency and interest rate risks within global limits set by the Group and are considered to be used for transactions (held for trading). Changes in fair value are systematically recorded in the statement of income. The balance sheet value of those instruments is included in "Current financial assets" or "Other current financial liabilities". Long-term financing When an external long-term financing is set up, specifically to finance subsidiaries, and when this financing involves currency and interest rate derivatives, these instruments are qualified as: 1) Fair value hedge of the interest rate risk on the external debt and of the currency risk of the loans to subsidiaries. Changes in fair value of derivatives are recognized in the statement of income as are changes in fair value of underlying financial debts and loans to subsidiaries. Under IFRS9 the Group has recognized in a separate component of the comprehensive income the variation of foreign currency basis spread identified in the hedging relationships qualifying as a fair value hedge. The fair value of those hedging instruments of long-term financing is included in assets under "Non-current financial assets" or in liabilities under "Non-current financial debt" for the non-current portion. The current portion (less than one year) is accounted for in "Current financial assets" or "Other current financial liabilities". In case of the anticipated termination of derivative instruments accounted for as fair value hedges, the amount paid or received is recognized in the statement of income and: -if this termination is due to an early cancellation of the hedged items, the adjustment previously recorded as revaluation of those hedged items is also recognized in the statement of income; -if the hedged items remain in the balance sheet, the adjustment previously recorded as a revaluation of those hedged items is spread over the remaining life of those items. During a change in the nature of the hedge (fair value hedge to cash flow hedge), if the components of aggregate exposure had already been designated in a hedging relationship (FVH), the Group recognizes the second relationship (CFH) without having to de-qualify and re-qualify the initial hedging relationship. 2) Cash flow hedge when the Group implements a strategy of fixing interest rate on the external debt. Changes in fair value are recorded in Other comprehensive Income for the effective portion of the hedging and in the statement of income for the ineffective portion of the hedging. Amounts recorded in equity are transferred to the income statement when the hedged transaction affects profit or loss. The fair value of those hedging instruments of long-term financing is included in assets under "Non-current financial assets" or in liabilities under "Non-current financial debt" for the non-current portion. The current portion (less than one year) is accounted for in "Current financial assets" or "Other current financial liabilities". |
If the hedging instrument expires, is sold or terminated by anticipation, gains or losses previously recognized in equity remain in equity. Amounts are recycled to the income statement only when the hedged transaction affects profit or loss. Foreign subsidiaries’ equity hedge Certain financial instruments hedge against risks related to the equity of foreign subsidiaries whose functional currency is not the euro (mainly the dollar). These instruments qualify as "net investment hedges" and changes in fair value are recorded in other comprehensive income under "Currency translation" for the effective portion of the hedging and in the statement of income for the ineffective portion of the hedging. Gains or losses on hedging instruments previously recorded in equity, are reclassified to the statement of income in the same period as the total or partial disposal of the foreign activity. The fair value of these instruments is recorded under "Current financial assets" or "Other current financial liabilities". Commitments to purchase shares held by non-controlling interests (put options written on minority interests) Put options granted to non-controlling-interest shareholders are initially recognized as financial liabilities at the present value of the exercise price of the options with a corresponding reduction in shareholders’ equity. The financial liability is subsequently measured at fair value at each balance sheet date in accordance with contractual clauses and any variation is recorded in the statement of income (cost of debt). |
A) Impact on the statement of income per nature of financial instruments
Assets and liabilities from financing activities
The impact on the statement of income of financing assets and liabilities mainly includes:
-financial income on cash, cash equivalents, and current financial assets (notably current deposits beyond three months) classified as "Loans and receivables";
-financial expense of long term subsidiaries financing, associated hedging instruments (excluding ineffective portion of the hedge detailed below) and financial expense of short term financing classified as "Financing liabilities and associated hedging instruments";
-ineffective portion of bond hedging; and
-financial income, financial expense and fair value of derivative instruments used for cash management purposes classified as "Assets and liabilities held for trading".
Financial derivative instruments used for cash management purposes (interest rate and foreign exchange) are considered to be held for trading. Based on practical documentation issues, the Group did not elect to set up hedge accounting for such instruments. The impact on income of the derivatives is offset by the impact of loans and current liabilities they are related to. Therefore these transactions taken as a whole do not have a significant impact on the Consolidated Financial Statements.
For the year ended December 31, (M$) | 2018 | 2017 | 2016 |
Loans and receivables | 161 | 53 | 82 |
Financing liabilities and associated hedging instruments | (1,927) | (1,395) | (1,111) |
Fair value hedge (ineffective portion) | (6) | (1) | 3 |
Assets and liabilities held for trading | (349) | (191) | (78) |
Impact on the cost of net debt | (2,121) | (1,534) | (1,104) |
B) Impact of the hedging strategies
Fair value hedge
The impact on the statement of income of the bond hedging instruments which is recorded in the item "Financial interest on debt" in the Consolidated statement of income is detailed as follows:
For the year ended December 31, (M$) | 2018 | 2017 | 2016 |
Revaluation at market value of bonds | 1,332 | (2,519) | 693 |
Swap hedging of bonds | (1,338) | 2,518 | (690) |
Ineffective portion of the fair value hedge | (6) | (1) | 3 |
The ineffective portion is not representative of the Group’s performance considering the Group’s objective to hold swaps to maturity. The current portion of the swaps valuation is not subject to active management.
Net investment hedge
The variations of the period are detailed in the table below:
For the year ended December 31, (M$) | As of January 1, | Variations | Disposals | As of December 31, |
2018 | (762) | 38 | - | (724) |
2017 | (658) | (104) | - | (762) |
2016 | (674) | 16 | - | (658) |
As of December 31, 2018, 2017 and 2016 the Group had no open forward contracts under these hedging instruments.
Cash flow hedge
The impact on the statement of income and other comprehensive income of the hedging instruments qualified as cash flow hedges is detailed as follows:
For the year ended December 31, (M$) | 2018 | 2017 | 2016 |
Profit (Loss) recorded in equity during the period | 24 | 253 | 308 |
Recycled amount from equity to the income statement during the period | (116) | 266 | (52) |
As of December 31, 2018, 2017 and 2016, the ineffective portion of these financial instruments is nil.
C) Maturity of derivative instruments
The maturity of the notional amounts of derivative instruments, excluding the commodity contracts, is detailed in the following table:
For the year ended December 31, 2018 (M$) ASSETS/(LIABILITIES) | Fair value | Notional value 2019 | Fair value | Notional value schedule | |||||
2020 and | 2020 | 2021 | 2022 | 2023 | 2024 | ||||
Fair value hedge | |||||||||
Swaps hedging bonds (assets) | 45 | 1,345 | 235 | 3,712 | |||||
Swaps hedging bonds (liabilities) | (208) | 1,874 | (1,281) | 16,225 | |||||
Total swaps hedging bonds | (163) | 3,219 | (1,046) | 19,937 | 3,346 | 1,945 | 4,309 | 3,858 | 6,479 |
Cash flow hedge | |||||||||
Swaps hedging bonds (assets) | - | - | 378 | 10,043 | |||||
Swaps hedging bonds (liabilities) | (87) | 969 | (599) | 11,265 | |||||
Total swaps hedgings bonds | (87) | 969 | (221) | 21,308 | - | - | - | - | 21,308 |
Forward exchange contracts related to operational activites (assets) | 2 | 39 | - | 4 | |||||
Forward exchange contracts related to operational activites (liabilities) | - | - | - | - | |||||
Total forward exchange contracts related to operating activities | 2 | 39 | - | 4 | 4 | - | - | - | - |
Held for trading | |||||||||
Other interest rate swaps (assets) | 7 | 17,001 | 57 | 2,515 | |||||
Other interest rate swaps (liabilities) | (79) | 20,816 | (22) | 2,686 | |||||
Total other interest rate swaps | (72) | 37,817 | 35 | 5,201 | 2,186 | 1,004 | 56 | 1 | 1,954 |
Currency swaps and forward exchange contracts (assets) | 66 | 10,500 | 11 | 44 | |||||
Currency swaps and forward exchange contracts (liabilities) | (104) | 9,107 | (7) | 34 | |||||
Total currency swaps and forward exchange contracts | (38) | 19,607 | 4 | 78 | 65 | 12 | 1 | - | - |
Notional amounts set the levels of commitment and are indicative nor of a contingent gain or loss neither of a related debt.
For the year ended December 31, 2017 (M$) ASSETS/(LIABILITIES) | Fair value | Notional value 2019 | Fair value | Notional value schedule | |||||
2020 and after | 2020 | 2021 | 2022 | 2023 | 2024 | ||||
Fair value hedge | |||||||||
Swaps hedging bonds (assets) | 172 | 2,391 | 337 | 5,075 | |||||
Swaps hedging bonds (liabilities) | (157) | 1,840 | (951) | 14,669 | |||||
Total swaps hedging fixed-rates bonds | 15 | 4,231 | (614) | 19,744 | 3,247 | 3,346 | 1,945 | 4,336 | 6,870 |
Cash flow hedge | |||||||||
Swaps hedging bonds (assets) | - | - | 269 | 9,466 | |||||
Swaps hedging bonds (liabilities) | - | - | (131) | 11,288 | |||||
Total swaps hedging bonds | - | - | 138 | 20,754 | 969 | - | - | - | 19,785 |
Forward exchange contracts related to operational activites (assets) | 2 | 55 | - | 28 | |||||
Forward exchange contracts related to operational activites (liabilities) | - | - | - | - | |||||
Total forward exchange contracts related to operational activites | 2 | 55 | - | 28 | 24 | 4 | - | - | - |
Held for trading | |||||||||
Other interest rate swaps (assets) | 32 | 36,775 | 64 | 2,300 | |||||
Other interest rate swaps (liabilities) | (17) | 13,905 | (3) | 370 | |||||
Total other interest rate swaps | 15 | 50,680 | 61 | 2,670 | 41 | 50 | 1,000 | - | 1,579 |
Currency swaps and forward exchange contracts (assets) | 219 | 15,132 | 9 | 175 | |||||
Currency swaps and forward exchange contracts (liabilities) | (71) | 6,048 | (17) | 229 | |||||
Total currency swaps and forward exchange contracts | 148 | 21,180 | (8) | 404 | 222 | 128 | 46 | 7 | 1 |
Notional amounts set the levels of commitment and are indicative nor of a contingent gain or loss neither of a related debt.
For the year ended December 31, 2016 (M$) ASSETS/(LIABILITIES) | Fair value | Notional value 2019 | Fair value | Notional value schedule | |||||
2020 and after | 2020 | 2021 | 2022 | 2023 | 2024 | ||||
Fair value hedge | |||||||||
Swaps hedging bonds (assets) | 41 | 2,213 | 716 | 7,618 | |||||
Swaps hedging bonds (liabilities) | (212) | 2,175 | (3,007) | 20,549 | |||||
Total swaps hedging bonds | (171) | 4,388 | (2,291) | 28,167 | 4,097 | 3,172 | 3,346 | 1,945 | 15,607 |
Cash flow hedge | |||||||||
Swaps hedging bonds (assets) | - | - | 129 | 3,457 | |||||
Swaps hedging bonds (liabilities) | - | - | (644) | 5,679 | |||||
Total swaps hedging bonds | - | - | (515) | 9,136 | - | 969 | - | - | 8,167 |
Forward exchange contracts related to operational activites (assets) | 3 | 30 | 1 | 13 | |||||
Forward exchange contracts related to operational activites (liabilities) | (26) | 296 | (5) | 80 | |||||
Total forward exchange contracts related to operational activites | (23) | 326 | (4) | 93 | 93 | - | - | - | - |
Held for trading | |||||||||
Other interest rate swaps (assets) | 7 | 16,582 | 35 | 1,859 | |||||
Other interest rate swaps (liabilities) | (5) | 24,642 | (4) | 603 | |||||
Total other interest rate swaps | 2 | 41,224 | 31 | 2,462 | 1,291 | - | - | 1,000 | 171 |
Currency swaps and forward exchange contracts (assets) | 87 | 6,714 | 28 | 578 | |||||
Currency swaps and forward exchange contracts (liabilities) | (110) | 3,803 | (1) | 6 | |||||
Total currency swaps and forward exchange contracts | (23) | 10,517 | 27 | 584 | 322 | 137 | 80 | 43 | 2 |
Notional amounts set the levels of commitment and are indicative nor of a contingent gain or loss neither of a related debt.
D) Fair value hierarchy
Accounting policies Fair values are estimated for the majority of the Group’s financial instruments, with the exception of publicly traded equity securities and marketable securities for which the market price is used. Estimations of fair value, which are based on principles such as discounting future cash flows to present value, must be weighted by the fact that the value of a financial instrument at a given time may be influenced by the market environment (liquidity especially), and also the fact that subsequent changes in interest rates and exchange rates are not taken into account. As a consequence, the use of different estimates, methodologies and assumptions could have a material effect on the estimated fair value amounts. The methods used are as follows: Financial debts, swaps The market value of swaps and of bonds that are hedged by those swaps has been determined on an individual basis by discounting future cash flows with the market curves existing at year-end. Other financial instruments The fair value of the interest rate swaps and of FRA’s (Forward Rate Agreements) are calculated by discounting future cash flows on the basis of market curves existing at year-end after adjustment for interest accrued but unpaid. Forward exchange contracts and currency swaps are valued on the basis of a comparison of the negotiated forward rates with the rates in effect on the financial markets at year-end for similar maturities. Exchange options are valued based on models commonly used by the market. |
The fair value hierarchy for financial instruments, excluding commodity contracts, is as follows:
As of December 31, 2018 (M$) | Quoted prices in active markets for identical assets (level 1) | Prices based on observable data (level 2) | Prices based on non observable data (level 3) | Total |
Fair value hedge instruments | - | (1,209) | - | (1,209) |
Cash flow hedge instruments | - | (306) | - | (306) |
Assets and liabilities held for trading | - | (71) | - | (71) |
Equity instruments | 94 | - | - | 94 |
Total | 94 | (1,586) | - | (1,492) |
As of December 31, 2017 (M$) | Quoted prices in active markets for identical assets (level 1) | Prices based on observable data (level 2) | Prices based on non observable data (level 3) | Total |
Fair value hedge instruments | - | (599) | - | (599) |
Cash flow hedge instruments | - | 140 | - | 140 |
Assets and liabilities held for trading | - | 216 | - | 216 |
Assets available for sale | 100 | - | - | 100 |
Total | 100 | (243) | - | (143) |
As of December 31, 2018 (M$) | Quoted prices in active markets for identical assets (level 1) | Prices based on observable data (level 2) | Prices based on non observable data (level 3) | Total |
Fair value hedge instruments | - | (2,462) | - | (2,462) |
Cash flow hedge instruments | - | (542) | - | (542) |
Assets and liabilities held for trading | - | 37 | - | 37 |
Assets available for sale | 120 | - | - | 120 |
Total | 120 | (2,967) | - | (2,847) |
15.3 Financial risks management
Financial markets related risks
As part of its financing and cash management activities, the Group uses derivative instruments to manage its exposure to changes in interest rates and foreign exchange rates. These instruments are mainly interest rate and currency swaps. The Group may also occasionally use futures contracts and options. These operations and their accounting treatment are detailed in Notes 14, 15.1 and 15.2 to the Consolidated Financial Statements.
Risks relative to cash management operations and to interest rate and foreign exchange financial instruments are managed according to rules set by the Group’s senior management, which provide for regular pooling of available cash balances, open positions and management of the financial instruments by the Treasury Department. Excess cash of the Group is deposited mainly in government institutions, deposit banks, or major companies through deposits, reverse repurchase agreements and purchase of commercial paper. Liquidity positions and the management of financial instruments are centralized by the Treasury Department, where they are managed by a team specialized in foreign exchange and interest rate market transactions.
The Cash Monitoring-Management Unit within the Treasury Department monitors limits and positions per bank on a daily basis and results of the Front Office. This unit also prepares marked-to-market valuations of used financial instruments and, when necessary, performs sensitivity analysis.
Counterparty risk
The Group has established standards for market transactions under which bank counterparties must be approved in advance, based on an assessment of the counterparty’s financial soundness (multi-criteria analysis including a review of market prices and of the Credit Default Swap (CDS), its ratings with Standard & Poor’s and Moody’s, which must be of high quality, and its overall financial condition).
An overall authorized credit limit is set for each bank and is allotted among the subsidiaries and the Group’s central treasury entities according to their needs.
To reduce the market value risk on its commitments, in particular for swaps set as part of bonds issuance, the Treasury Department has concluded margin call contracts with counterparties.
Short-term interest rate exposure and cash
Cash balances, which are primarily composed of euros and dollars, are managed according to the guidelines established by the Group’s senior management (to maintain an adequate level of liquidity, optimize revenue from investments considering existing interest rate yield curves, and minimize the cost of borrowing) over a less than twelve-month horizon and on the basis of a daily interest rate benchmark, primarily through short-term interest rate swaps and short-term currency swaps, without modifying currency exposure.
Interest rate risk on non-current debt
The Group’s policy consists, according to general corporate needs, of incurring non-current debt at a floating rate or at a fixed rate, depending on the interest rates at the time of issue, in dollars or in euros. Long-term interest rate and currency swaps may be used to hedge bonds at their issuance in order to create a variable or fixed rate synthetic debt. In order to partially modify the interest rate structure of the long-term debt, TOTAL may also enter into long-term interest rate swaps.
Currency exposure
The Group generally seeks to minimize the currency exposure of each entity to its functional currency (primarily the dollar, the euro, the pound sterling and the Norwegian krone).
For currency exposure generated by commercial activity, the hedging of revenues and costs in foreign currencies is typically performed using currency operations on the spot market and, in some cases, on the forward market. The Group rarely hedges future cash flows, although it may use options to do so.
With respect to currency exposure linked to non-current assets, the Group has a hedging policy of financing these assets in their functional currency.
Net short-term currency exposure is periodically monitored against limits set by the Group’s senior management.
The non-current debt described in Note 15.1 to the Consolidated Financial Statements is generally raised by the corporate treasury entities either directly in dollars or in euros, or in other currencies which are then exchanged for dollars or euros through swap issues to appropriately match general corporate needs. The proceeds from these debt issuances are loaned to affiliates whose accounts are kept in dollars or in euros. Thus, the net sensitivity of these positions to currency exposure is not significant.
The Group’s short-term currency swaps, the notional value of which appears in Note 15.2 to the Consolidated Financial Statements, are used to attempt to optimize the centralized cash management of the Group. Thus, the sensitivity to currency fluctuations which may be induced is likewise considered negligible.
Sensitivity analysis on interest rate and foreign exchange risk
The tables below present the potential impact of an increase or decrease of 10 basis points on the interest rate yield curves for each of the currencies on the fair value of the current financial instruments as of December 31, 2018, 2017 and 2016.
ASSETS/(LIABILITIES) (M$) | Carrying amount | Estimated fair value | Change in fair value due to a change in interest rate by | |
+10 basis points | -10 basis points | |||
As of December 31, 2018 | ||||
Bonds (non-current portion, before swaps) | (34,975) | (36,127) | 185 | (185) |
Swaps hedging fixed-rates bonds (liabilities) | (1,880) | (1,880) | - | - |
Swaps hedging fixed-rates bonds (assets) | 613 | 613 | - | - |
Total swaps hedging fixed-rates bonds (assets and liabilities) | (1,267) | (1,267) | (59) | 59 |
Current portion of non-current debt after swap (excluding capital lease obligations) | (5,027) | (5,027) | - | - |
Other interest rates swaps | (37) | (37) | 12 | (12) |
Currency swaps and forward exchange contracts | (34) | (34) | - | - |
As of December 31, 2017 | ||||
Bonds (non-current portion, before swaps) | (36,613) | (38,159) | 191 | (191) |
Swaps hedging fixed-rates bonds (liabilities) | (1,082) | (1,082) | - | - |
Swaps hedging fixed-rates bonds (assets) | 606 | 606 | - | - |
Total swaps hedging fixed-rates bonds (assets and liabilities) | (476) | (476) | (83) | 83 |
Current portion of non-current debt after swap (excluding capital lease obligations) | (4,646) | (4,645) | 1 | (1) |
Other interest rates swaps | 76 | 76 | 12 | (12) |
Currency swaps and forward exchange contracts | 142 | 142 | 0 | 0 |
As of December 31, 2016 | ||||
Bonds (non-current portion, before swaps) | (36,656) | (37,757) | 221 | (221) |
Swaps hedging fixed-rates bonds (liabilities) | (3,651) | (3,651) | - | - |
Swaps hedging fixed-rates bonds (assets) | 845 | 845 | - | - |
Total swaps hedging fixed-rates bonds (assets and liabilities) | (2,806) | (2,806) | (117) | 117 |
Current portion of non-current debt after swap (excluding capital lease obligations) | (4,614) | (4,614) | 5 | (4) |
Other interest rates swaps | 33 | 33 | 7 | (7) |
Currency swaps and forward exchange contracts | (23) | (23) | - | - |
The impact of changes in interest rates on the cost of debt before tax is as follows:
For the year ended December 31, (M$) | 2018 | 2017 | 2016 |
Cost of net debt | (2,121) | (1,534) | (1,104) |
Interest rate translation of: | |||
+10 basis points | 29 | 29 | 41 |
-10 basis points | (29) | (29) | (41) |
As a result of the policy for the management of currency exposure previously described, the Group’s sensitivity to currency exposure is primarily influenced by the net equity of the subsidiaries whose functional currency is the euro and the ruble, and to a lesser extent, the pound sterling, the Norwegian krone.
This sensitivity is reflected in the historical evolution of the currency translation adjustment recorded in the statement of changes in consolidated shareholders’ equity which, over the course of the last three years, is essentially related to the fluctuation of the euro, the ruble and the pound sterling and is set forth in the table below:
Dollar/Euro | Dollar/ | Dollar/Ruble | |
December 31, 2018 | 0.87 | 0.78 | 69.62 |
December 31, 2017 | 0.83 | 0.74 | 57.86 |
December 31, 2016 | 0.95 | 0.81 | 61.00 |
As of December 31, 2018 (M$) | Total | Euro | Dollar | Pound | Ruble | Other |
Shareholders’ equity at historical exchange rate | 126,953 | 41,518 | 59,125 | 9,077 | 8,248 | 8,985 |
Currency translation adjustment before net investment hedge | (11,321) | (3,706) | - | (1,960) | (3,892) | (1,763) |
Net investment hedge - open instruments | 8 | 8 | - | - | - | - |
Shareholders’ equity at exchange rate as of December 31, 2018 | 115,640 | 37,820 | 59,125 | 7,117 | 4,356 | 7,222 |
As of December 31, 2017 (M$) | Total | Euro | Dollar | Pound | Ruble | Other |
Shareholders’ equity at historical exchange rate | 119,450 | 44,930 | 51,674 | 6,467 | 7,366 | 9,013 |
Currency translation adjustment before net investment hedge | (7,908) | (1,903) | - | (1,543) | (3,076) | (1,386) |
Net investment hedge - open instruments | 14 | 14 | - | - | - | - |
Shareholders’ equity at exchange rate as of December 31, 2017 | 111,556 | 43,041 | 51,674 | 4,924 | 4,290 | 7,627 |
As of December 31, 2016 (M$) | Total | Euro | Dollar | Pound | Ruble | Other |
Shareholders’ equity at historical exchange rate | 112,551 | 38,645 | 51,863 | 5,997 | 7,227 | 8,819 |
Currency translation adjustment before net investment hedge | (13,871) | (6,845) | - | (1,978) | (3,286) | (1,762) |
Net investment hedge - open instruments | - | - | - | - | - | - |
Shareholders’ equity at exchange rate as of December 31, 2016 | 98,680 | 31,800 | 51,863 | 4,019 | 3,941 | 7,057 |
Based on the 2018 financial statements, a conversion using rates different from + or - 10% for each of the currencies below would have the following impact on shareholders equity and net income (Group share):
As of December 31, 2018 (M$) | Euro | Pound | Ruble |
Impact of an increase of 10% of exchange rates on: | |||
- shareholders equity | 3,782 | 712 | 436 |
- net income (Group share) | 122 | 135 | 81 |
Impact of a decrease of 10% of exchange rates on: | |||
- shareholders equity | (3,782) | (712) | (436) |
- net income (Group share) | (122) | (135) | (81) |
Stock market risk
The Group holds interests in a number of publicly-traded companies (see Note 8 to the Consolidated Financial Statements). The market value of these holdings fluctuates due to various factors, including stock market trends, valuations of the sectors in which the companies operate, and the economic and financial condition of each individual company.
Liquidity risk
TOTAL S.A. has confirmed lines of credit granted by international banks, which are calculated to allow it to manage its short-term liquidity needs as required.
As of December 31, 2018, these lines of credit amounted to $11,515 million, of which $11,515 million was unused. The agreements for the lines of credit granted to TOTAL S.A. do not contain conditions related to the Company’s financial ratios, to its financial ratings from specialized agencies, or to the occurrence of events that could have a material adverse effect on its financial position. As of December 31, 2018, the aggregate amount of the principal confirmed lines of credit granted by international banks to Group companies, including TOTAL S.A., was $13,191 million, of which $12,599 million was unused. The lines of credit granted to Group companies other than TOTAL S.A. are not intended to finance the Group’s general needs; they are intended to finance either the general needs of the borrowing subsidiary or a specific project.
The following tables show the maturity of the financial assets and liabilities of the Group as of December 31, 2018, 2017 and 2016 (see Note 15 to the Consolidated Financial Statements).
As of December 31, 2018 (M$) ASSETS/(LIABILITIES) | Less than 1 year | 1-2 years | 2-3 years | 3-4 years | 4-5 years | More than 5 years | Total |
Non-current financial debt (notional value excluding interests) | - | (5,432) | (3,966) | (5,158) | (4,983) | (19,910) | (39,449) |
Current borrowings | (13,306) | - | - | - | - | - | (13,306) |
Other current financial liabilities | (478) | - | - | - | - | - | (478) |
Current financial assets | 3,654 | - | - | - | - | - | 3,654 |
Assets and liabilities available for sale or exchange | 15 | - | - | - | - | - | 15 |
Cash and cash equivalents | 27,907 | - | - | - | - | - | 27,907 |
Net amount before financial expense | 17,792 | (5,432) | (3,966) | (5,158) | (4,983) | (19,910) | (21,657) |
Financial expense on non-current financial debt | (718) | (682) | (598) | (506) | (427) | (1,037) | (3,968) |
Interest differential on swaps | (484) | (412) | (369) | (309) | (234) | (869) | (2,677) |
Net amount | 16,590 | (6,526) | (4,933) | (5,973) | (5,644) | (21,816) | (28,302) |
As of December 31, 2017 (M$) ASSETS/(LIABILITIES) | Less than 1 year | 1-2 years | 2-3 years | 3-4 years | 4-5 years | More than 5 years | Total |
Non-current financial debt (notional value excluding interests) | - | (5,930) | (5,117) | (3,795) | (4,959) | (20,860) | (40,661) |
Current borrowings | (11,096) | - | - | - | - | - | (11,096) |
Other current financial liabilities | (245) | - | - | - | - | - | (245) |
Current financial assets | 3,393 | - | - | - | - | - | 3,393 |
Assets and liabilities available for sale or exchange | - | - | - | - | - | - | - |
Cash and cash equivalents | 33,185 | - | - | - | - | - | 33,185 |
Net amount before financial expense | 25,237 | (5,930) | (5,117) | (3,795) | (4,959) | (20,860) | (15,424) |
Financial expense on non-current financial debt | (805) | (779) | (636) | (545) | (454) | (1,093) | (4,312) |
Interest differential on swaps | (193) | (223) | (257) | (245) | (198) | (681) | (1,797) |
Net amount | 24,239 | (6,932) | (6,010) | (4,585) | (5,611) | (22,634) | (21,533) |
As of December 31, 2016 (M$) ASSETS/(LIABILITIES) | Less than 1 year | 1-2 years | 2-3 years | 3-4 years | 4-5 years | More than 5 years | Total |
Non-current financial debt (notional value excluding interests) | - | (4,320) | (5,702) | (4,952) | (3,578) | (23,607) | (42,159) |
Current borrowings | (13,920) | - | - | - | - | - | (13,920) |
Other current financial liabilities | (327) | - | - | - | - | - | (327) |
Current financial assets | 4,548 | - | - | - | - | - | 4,548 |
Assets and liabilities available for sale or exchange | 140 | - | - | - | - | - | 140 |
Cash and cash equivalents | 24,597 | - | - | - | - | - | 24,597 |
Net amount before financial expense | 15,038 | (4,320) | (5,702) | (4,952) | (3,578) | (23,607) | (27,121) |
Financial expense on non-current financial debt | (799) | (783) | (682) | (552) | (465) | (1,271) | (4,552) |
Interest differential on swaps | (79) | (56) | (201) | (253) | (272) | (910) | (1,771) |
Net amount | 14,160 | (5,159) | (6,585) | (5,757) | (4,315) | (25,788) | (33,444) |
The following table sets forth financial assets and liabilities related to operating activities as of December 31, 2018, 2017 and 2016 (see Note 14 of the Notes to the Consolidated Financial Statements).
As of December 31, (M$) ASSETS/(LIABILITIES) | 2018 | 2017 | 2016 |
Accounts payable | (26,134) | (26,479) | (23,227) |
Other operating liabilities | (13,286) | (10,135) | (9,616) |
Including financial instruments related to commodity contracts | (3,429) | (1,794) | (2,077) |
Accounts receivable, net | 17,270 | 14,893 | 12,213 |
Other operating receivables | 9,733 | 9,336 | 10,218 |
Including financial instruments related to commodity contracts | 2,731 | 1,987 | 2,425 |
Total | (12,417) | (12,385) | (10,412) |
These financial assets and liabilities mainly have a maturity date below one year.
Credit risk
Credit risk is defined as the risk of the counterparty to a contract failing to perform or pay the amounts due.
The Group is exposed to credit risks in its operating and financing activities. The Group’s maximum exposure to credit risk is partially related to financial assets recorded on its balance sheet, including energy derivative instruments that have a positive market value.
The following table presents the Group’s maximum credit risk exposure:
As of December 31, (M$) ASSETS/(LIABILITIES) | 2018 | 2017 | 2016 |
Loans to equity affiliates (Note 8) | 4,755 | 5,135 | 4,718 |
Loans and advances (Note 6) | 1,877 | 2,878 | 3,048 |
Other non-current financial assets related to operational activities (Note 6) | 471 | 937 | 1,069 |
Non-current financial assets (Note 15.1) | 680 | 679 | 908 |
Accounts receivable (Note 5) | 17,270 | 14,893 | 12,213 |
Other operating receivables (Note 5) | 9,733 | 9,336 | 10,218 |
Current financial assets (Note 15.1) | 3,654 | 3,393 | 4,548 |
Cash and cash equivalents (Note 15.1) | 27,907 | 33,185 | 24,597 |
Total | 66,347 | 70,436 | 61,319 |
The valuation allowance on accounts receivable, other operating receivables and on loans and advances is detailed in Notes 5 and 6 to the Consolidated Financial Statements.
As part of its credit risk management related to operating and financing activities, the Group has developed margining agreements with certain counterparties. As of December 31, 2018, the net margin call paid amounted to $2,581 million (against $870 million paid as of December 31, 2017 and $2,605 million paid as of December 31, 2016).
The Group has established a number of programs for the sale of receivables, without recourse, with various banks, primarily to reduce its exposure to such receivables. As a result of these programs the Group retains no risk of payment default after the sale, but may continue to service the customer accounts as part of a service arrangement on behalf of the buyer and is required to pay to the buyer payments it receives from the customers relating to the receivables sold. As of December 31, 2018, the net value of receivables sold amounted to $6,856 million. The Group has substantially transferred all the risks and rewards related to receivables. No financial asset or liability remains recognized in the consolidated balance sheet after the date of sale.
Furthermore, in 2018 the Group conducted several operations of reverse factoring for a value of $289 million.
Credit risk is managed by the Group’s business segments as follows:
-Exploration & Production segment
Risks arising under contracts with government authorities or other oil companies or under long-term supply contracts necessary for the development of projects are evaluated during the project approval process. The long-term aspect of these contracts and the high-quality of the other parties lead to a low level of credit risk.
Risks related to commercial operations, other than those described above (which are, in practice, directly monitored by subsidiaries), are subject to procedures for establishing credit limits and reviewing outstanding balances.
-Gas, Renewables & Power segment
-Gas & Power activities
Trading Gas & Power activities deal with counterparties in the energy, industrial and financial sectors throughout the world. Financial institutions providing credit risk coverage are highly rated international bank and insurance groups.
Potential counterparties are subject to credit assessment and approval before concluding transactions and are thereafter subject to regular review, including re-appraisal and approval of the limits previously granted.
The creditworthiness of counterparties is assessed based on an analysis of quantitative and qualitative data regarding financial standing and business risks, together with the review of any relevant third party and market information, such as data published by rating agencies. On this basis, credit limits are defined for each potential counterparty and, where appropriate, transactions are subject to specific authorizations.
Credit exposure, which is essentially an economic exposure or an expected future physical exposure, is permanently monitored and subject to sensitivity measures.
Credit risk is mitigated by the systematic use of industry standard contractual frameworks that permit netting, enable requiring added security in case of adverse change in the counterparty risk, and allow for termination of the contract upon occurrence of certain events of default.
About the Professionals and Retail Gas and Power Sales activities, credit risk management policy is adapted to the type of customer either through the use of procedures of prepayments and appropriate collection, especially for mass customers or through credit insurances and sureties/guarantees obtaining. For the Professionals segment, the separation of responsibilities between the commercial and financial teams allows a "a priori" positions risk control.
-Renewables and Innovation, Energy Efficiency (IEE)
Internal procedures for the Renewables division and the Innovation & Energy Efficiency division include rules on credit risk management. Procedures to monitor customer risk are defined at the local level, especially for SunPower, Saft and Greenflex (rules for the approval of credit limits, use of guarantees, monitoring and assessment of the receivables portfolio…).
-Refining & Chemicals segment
-Refining & Chemicals
Credit risk is primarily related to commercial receivables. Internal procedures of Refining & Chemicals include rules for the management of credit describing the fundamentals of internal control in this domain. Each Business Unit implements the procedures of the activity for managing and provisioning credit risk according to the size of the subsidiary and the market in which it operates. The principal elements of these procedures are:
-implementation of credit limits with different authorization schemes;
-use of insurance policies or specific guarantees (letters of credit);
-regular monitoring and assessment of overdue accounts (aging balance), including dunning procedures.
Counterparties are subject to credit assessment and approval prior to any transaction being concluded. Regular reviews are made for all active counterparties including a re-appraisal and renewing of the granted credit limits. The limits of the counterparties are assessed based on quantitative and qualitative data regarding financial standing, together with the review of any relevant third party and market information, such as that provided by rating agencies and insurance companies.
-Trading & Shipping
Trading & Shipping deals with commercial counterparties and financial institutions located throughout the world. Counterparties to physical and derivative transactions are primarily entities involved in the oil and gas industry or in the trading of energy commodities, or financial institutions. Credit risk coverage is arranged with financial institutions, international banks and insurance groups selected in accordance with strict criteria.
The Trading & Shipping division applies a strict policy of internal delegation of authority governing establishment of country and counterparty credit limits and approval of specific transactions. Credit exposures contracted under these limits and approvals are monitored on a daily basis.
Potential counterparties are subject to credit assessment and approval prior to any transaction being concluded and all active counterparties are subject to regular reviews, including re-appraisal and approval of granted limits. The creditworthiness of counterparties is assessed based on an analysis of quantitative and qualitative data regarding financial standing and business risks, together with the review of any relevant third party and market information, such as ratings published by Standard & Poor’s, Moody’s Investors Service and other agencies.
Contractual arrangements are structured so as to maximize the risk mitigation benefits of netting between transactions wherever possible and additional protective terms providing for the provision of security in the event of financial deterioration and the termination of transactions on the occurrence of defined default events are used to the greatest permitted extent.
Credit risks in excess of approved levels are secured by means of letters of credit and other guarantees, cash deposits and insurance arrangements. In respect of derivative transactions, risks are secured by margin call contracts wherever possible.
-Marketing & Services segment
Internal procedures for the Marketing & Services division include rules on credit risk that describe the basis of internal control in this domain, including the separation of authority between commercial and financial operations.
Credit policies are defined at the local level and procedures to monitor customer risk are implemented (credit committees at the subsidiary level, the creation of credit limits for corporate customers, etc.). Each entity also implements monitoring of its outstanding receivables. Risks related to credit may be mitigated or limited by subscription of credit insurance and/or requiring security or guarantees.
16.1 Financial instruments related to commodity contracts
Accounting policies Financial instruments related to commodity contracts, including crude oil, petroleum products, gas, and power purchase/sales contracts within the trading activities, together with the commodity contract derivative instruments such as energy contracts and forward freight agreements, are used to adjust the Group’s exposure to price fluctuations within global trading limits. According to the industry practice, these instruments are considered as held for trading. Changes in fair value are recorded in the statement of income. The fair value of these instruments is recorded in "Other current assets" or "Other creditors and accrued liabilities" depending on whether they are assets or liabilities. The valuation methodology is to mark-to-market all open positions for both physical and paper transactions. The valuations are determined on a daily basis using observable market data based on organized and over the counter (OTC) markets. In particular cases when market data is not directly available, the valuations are derived from observable data such as arbitrages, freight or spreads and market corroboration. For valuation of risks which are the result of a calculation, such as options for example, commonly known models are used to compute the fair value. |
As of December 31, 2018 (M$) ASSETS/(LIABILITIES) | Gross value before offsetting - assets | Gross value before offsetting - liabilities | Amounts offset - assets (c) | Amounts offset - liabilities (c) | Net balance sheet value presented - assets | Net balance sheet value presented - liabilities | Other amounts not offset | Net carrying amount | Fair value (b) |
Crude oil, petroleum products and freight rates activities | |||||||||
Petroleum products, crude oil and freight rate swaps | 389 | (272) | (140) | 140 | 249 | (132) | - | 117 | 117 |
Forwards (a) | 243 | (373) | (59) | 59 | 184 | (314) | - | (130) | (130) |
Options | 243 | (363) | (156) | 156 | 87 | (207) | - | (120) | (120) |
Futures | 10 | - | - | - | 10 | - | - | 10 | 10 |
Options on futures | 529 | (689) | (529) | 529 | - | (160) | - | (160) | (160) |
Other/Collateral | - | - | - | - | - | - | (118) | (118) | (118) |
Total crude oil, petroleum products and freight rates | 1,414 | (1,697) | (884) | 884 | 530 | (813) | (118) | (401) | (401) |
Gas, Renewables & Power activities | |||||||||
Swaps | 18 | (624) | (6) | 6 | 12 | (618) | - | (606) | (606) |
Forwards (a) | 2,492 | (2,285) | (316) | 316 | 2,176 | (1,969) | - | 207 | 207 |
Options | 3 | (20) | (18) | 18 | (15) | (2) | - | (17) | (17) |
Futures | 126 | (125) | (98) | 98 | 28 | (27) | - | 1 | 1 |
Other/Collateral | - | - | - | - | - | - | 445 | 445 | 445 |
Total Gas, Renewables & Power | 2,639 | (3,054) | (438) | 438 | 2,201 | (2,616) | 445 | 30 | 30 |
Total | 4,053 | (4,751) | (1,322) | 1,322 | 2,731 | (3,429) | 327 | (371) | (371) |
Total of fair value non recognized in the balance sheet | - | ||||||||
(a) Forwards: contracts resulting in physical delivery are accounted for as derivative commodity contracts and included in the amounts shown.
(b) When the fair value of derivatives listed on an organized exchange market (futures, options on futures and swaps) is offset with the margin call received or paid in the balance sheet, this fair value is set to zero.
(c) Amounts offset in accordance with IAS 32.
As of December 31, 2017 (M$) ASSETS/(LIABILITIES) | Gross value before offsetting - assets | Gross value before offsetting - liabilities | Amounts offset - assets (c) | Amounts offset - liabilities (c) | Net balance sheet value presented - assets | Net balance sheet value presented - liabilities | Other amounts not offset | Net carrying amount | Fair value (b) |
Crude oil, petroleum products and freight rates activities | |||||||||
Petroleum products, crude oil and freight rate swaps | 244 | (333) | (102) | 102 | 142 | (231) | - | (89) | (89) |
Forwards (a) | 109 | (113) | (12) | 12 | 97 | (101) | - | (4) | (4) |
Options | 82 | (163) | (52) | 52 | 30 | (111) | - | (81) | (81) |
Futures | - | - | - | - | - | - | - | - | - |
Options on futures | 202 | (251) | (155) | 155 | 47 | (96) | - | (49) | (49) |
Other/Collateral | - | - | - | - | - | - | 63 | 63 | 63 |
Total crude oil, petroleum products and freight rates | 637 | (860) | (321) | 321 | 316 | (539) | 63 | (160) | (160) |
Gas, Renewables & Power activities | |||||||||
Swaps | 76 | (7) | (3) | 3 | 73 | (4) | - | 69 | 69 |
Forwards (a) | 1,717 | (1,345) | (92) | 92 | 1,625 | (1,253) | - | 372 | 372 |
Options | 6 | (30) | (33) | 33 | (27) | 3 | - | (24) | (24) |
Futures | - | (1) | - | - | - | (1) | - | (1) | (1) |
Other/Collateral | - | - | - | - | - | - | (86) | (86) | (86) |
Total Gas, Renewables & Power | 1,799 | (1,383) | (128) | 128 | 1,671 | (1,255) | (86) | 330 | 330 |
Total | 2,436 | (2,243) | (449) | 449 | 1,987 | (1,794) | (23) | 170 | 170 |
Total of fair value non recognized in the balance sheet | - | ||||||||
(a) Forwards: contracts resulting in physical delivery are accounted for as derivative commodity contracts and included in the amounts shown.
(b) When the fair value of derivatives listed on an organized exchange market (futures, options on futures and swaps) is offset with the margin call received or paid in the balance sheet, this fair value is set to zero.
(c) Amounts offset in accordance with IAS 32.
As of December 31, 2016 (M$) ASSETS/(LIABILITIES) | Gross value before offsetting - assets | Gross value before offsetting - liabilities | Amounts offset - assets (c) | Amounts offset - liabilities (c) | Net balance sheet value presented - assets | Net balance sheet value presented - liabilities | Other amounts not offset | Net carrying amount | Fair value (b) |
Crude oil, petroleum products and freight rates activities | |||||||||
Petroleum products, crude oil and freight rate swaps | 464 | (266) | (140) | 140 | 324 | (126) | - | 198 | 198 |
Forwards (a) | 172 | (214) | (8) | 8 | 164 | (206) | - | (42) | (42) |
Options | 194 | (207) | (125) | 125 | 69 | (82) | - | (13) | (13) |
Futures | - | - | - | - | - | - | - | - | - |
Options on futures | 151 | (164) | (150) | 150 | 1 | (14) | - | (13) | (13) |
Other/Collateral | - | - | - | - | - | - | (220) | (220) | (220) |
Total crude oil, petroleum products and freight rates | 981 | (851) | (423) | 423 | 558 | (428) | (220) | (90) | (90) |
Gas, Renewables & Power activities | |||||||||
Swaps | 63 | (39) | (3) | 3 | 60 | (36) | - | 24 | 24 |
Forwards (a) | 1,879 | (1,672) | (61) | 61 | 1,818 | (1,611) | - | 207 | 207 |
Options | 15 | (28) | (26) | 26 | (11) | (2) | - | (13) | (13) |
Futures | - | - | - | - | - | - | - | - | - |
Other/Collateral | - | - | - | - | - | - | (97) | (97) | (97) |
Total Gas, Renewables & Power | 1,957 | (1,739) | (90) | 90 | 1,867 | (1,649) | (97) | 121 | 121 |
Total | 2,938 | (2,590) | (513) | 513 | 2,425 | (2,077) | (317) | 31 | 31 |
Total of fair value non recognized in the balance sheet | - | ||||||||
(a) Forwards: contracts resulting in physical delivery are accounted for as derivative commodity contracts and included in the amounts shown.
(b) When the fair value of derivatives listed on an organized exchange market (futures, options on futures and swaps) is offset with the margin call received or paid in the balance sheet, this fair value is set to zero.
(c) Amounts offset in accordance with IAS 32.
Most commitments on crude oil and refined products have a short term maturity (less than one year). The maturity of most Gas, Renewables & Power division derivatives is less than three years forward.
The changes in fair value of financial instruments related to commodity contracts are detailed as follows:
For the year ended December 31, (M$) | Fair value as of January 1, | Impact on income | Settled contracts | Other | Fair value as of December 31, |
Crude oil, petroleum products and freight rates activities | |||||
2018 | (223) | 2,689 | (2,749) | - | (283) |
2017 | 130 | 2,693 | (3,047) | - | (223) |
2016 | 1,157 | 3,013 | (4,040) | - | 130 |
Gas, Renewables & Power activities | |||||
2018 | 416 | 1,220 | (2,057) | 6 | (415) |
2017 | 218 | 717 | (554) | 35 | 416 |
2016 | 613 | 392 | (742) | (45) | 218 |
The fair value hierarchy for financial instruments related to commodity contracts is as follows:
As of December 31, 2018 (M$) | Quoted prices in active markets for identical assets (level 1) | Prices based on observable data (level 2) | Prices based on non observable data (level 3) | Total |
Crude oil, petroleum products and freight rates activities | (303) | 20 | - | (283) |
Gas, Renewables & Power activities | 424 | (638) | (201) | (415) |
Total | 121 | (618) | (201) | (698) |
As of December 31, 2017 (M$) | Quoted prices in active markets for identical assets (level 1) | Prices based on observable data (level 2) | Prices based on non observable data (level 3) | Total |
Crude oil, petroleum products and freight rates activities | (49) | (173) | - | (223) |
Gas, Renewables & Power activities | 288 | 128 | - | 416 |
Total | 239 | (45) | - | 193 |
As of December 31, 2016 (M$) | Quoted prices in active markets for identical assets (level 1) | Prices based on observable data (level 2) | Prices based on non observable data (level 3) | Total |
Crude oil, petroleum products and freight rates activities | (22) | 152 | - | 130 |
Gas, Renewables & Power activities | 409 | (191) | - | 218 |
Total | 387 | (39) | - | 348 |
Financial instruments classified as level 3 in 2018 consist of long-term liquefied natural gas purchase and sales contracts which relate to the trading activity.
The composition and size of this portfolio of contracts changed in 2018 compared to 2017 as a result of the acquisition of ENGIE’s activities.
The Group values these contracts on the basis of observable inputs on the forward price of natural gas, liquefied natural gas and crude oil and on the basis of internal assumptions for price evolution beyond observable horizon, on price renegotiation terms for long-term contracts and on uncertainties related to the execution of contracts.
These valuation methods lead to an assessment of the fair value of the portfolio of contracts over an effective horizon of two years.
The description of each fair value level is presented in Note 15 to the Consolidated Financial Statements.
Cash Flow hedge
The impact on the statement of income and other comprehensive income of the hedging instruments related to commodity contracts and qualified as cash flow hedges is detailed as follows:
As of December 31, (M$) | 2018 | 2017 | 2016 |
Profit (Loss) recorded in equity during the period | 3 | 71 | (69) |
Recycled amount from equity to the income statement during the period | (3) | (6) | (1) |
These financial instruments are mainly one year term Henry Hub derivatives.
As of December 31, 2018, the ineffective portion of these financial instruments is nil (in 2017 the ineffective portion of these financial instruments was nil and in 2016, the ineffective portion of these financial instruments was a loss of $5 million).
16.2 Oil and Gas market related risks management
Oil and gas market related risks
Due to the nature of its business, the Group has significant oil and gas trading activities as part of its day-to-day operations in order to optimize revenues from its oil and gas production and to obtain favorable pricing to supply its refineries.
In its international oil trading business, the Group follows a policy of not selling its future production. However, in connection with this trading business, the Group, like most other oil companies, uses energy derivative instruments to adjust its exposure to price fluctuations of crude oil, refined products, natural gas, and power. The Group also uses freight rate derivative contracts in its shipping business to adjust its exposure to freight-rate fluctuations. To hedge against this risk, the Group uses various instruments such as futures, forwards, swaps and options on organized markets or over-the-counter markets. The list of the different derivatives held by the Group in these markets is detailed in Note 16.1 to the Consolidated Financial Statements.
The Trading & Shipping division measures its market risk exposure, i.e., potential loss in fair values, on its crude oil, refined products and freight rates trading activities using a value-at-risk technique. This technique is based on an historical model and makes an assessment of the market risk arising from possible future changes in market values over a 24-hour period. The calculation of the range of potential changes in fair values is based on the end-of-day exposures and historical price movements of the last 400 business days for all traded instruments and maturities. Options are systematically re-evaluated using appropriate models.
The "value-at-risk" represents the most unfavorable movement in fair value obtained with a 97.5% confidence level. This means that the Group’s portfolio result is likely to exceed the value-at-risk loss measure once over 40 business days if the portfolio exposures were left unchanged.
Trading & Shipping: value-at-risk with a 97.5% probability
As of December 31, (M$) | High | Low | Average | Year end |
2018 | 21 | 5 | 12 | 7 |
2017 | 28 | 4 | 16 | 7 |
2016 | 25 | 7 | 14 | 22 |
As part of its gas and power trading activity, the Group also uses derivative instruments such as futures, forwards, swaps and options in both organized and over-the-counter markets. In general, the transactions are settled at maturity date through physical delivery. The Gas division measures its market risk exposure, i.e., potential loss in fair values, on its trading business using a value-at-risk technique. This technique is based on an historical model and makes an assessment of the market risk arising from possible future changes in market values over a one-day period. The calculation of the range of potential changes in fair values takes into account a snapshot of the end-of-day exposures and the set of historical price movements for the past two years for all instruments and maturities in the global trading business.
Gas, Renewables & Power division trading: value-at-risk with a 97.5% probability
As of December 31, (M$) | High | Low | Average | Year end |
2018 | 20 | 3 | 10 | 10 |
2017 | 13 | 3 | 6 | 4 |
2016 | 8 | 2 | 4 | 2 |
The Group has implemented strict policies and procedures to manage and monitor these market risks. These are based on the separation of control and front-office functions and on an integrated information system that enables real-time monitoring of trading activities.
Limits on trading positions are approved by the Group’s Executive Committee and are monitored daily. To increase flexibility and encourage liquidity, hedging operations are performed with numerous independent operators, including other oil companies, major energy producers or consumers and financial institutions. The Group has established counterparty limits and monitors outstanding amounts with each counterparty on an ongoing basis.
There was no post closing event.
As of December 31, 2018, 1,191 entities are consolidated of which 145 are accounted for under the equity method (E).
The table below sets forth the main Group consolidated entities:
Business segment | Statutory corporate name | % Group interest | Method | Country of incorporation | Country of operations |
Exploration & Production | |||||
Abu Dhabi Gas Industries Limited | 15.00% | E | United Arab Emirates | United Arab Emirates | |
Abu Dhabi Gas Liquefaction Company Limited | 5.00% | E | United Arab Emirates | United Arab Emirates | |
Abu Dhabi Marine Areas Limited | 33.33% | E | United Kingdom | United Arab Emirates | |
Abu Dhabi Petroleum Company Limited | 23.75% | E | United Kingdom | United Arab Emirates | |
Angola Block 14 B.V. | 50.01% | Netherlands | Angola | ||
Angola LNG Limited | 13.60% | E | Bermuda | Angola | |
Angola LNG Supply Services, LLC | 13.60% | E | United States | United States | |
Bonny Gas Transport Limited | 15.00% | E | Bermuda | Nigeria | |
Brass Holdings S.A.R.L. | 100.00% | Luxembourg | Luxembourg | ||
Brass LNG Limited | 20.48% | E | Nigeria | Nigeria | |
Deer Creek Pipelines Limited | 75.00% | Canada | Canada | ||
Dolphin Energy Limited | 24.50% | E | United Arab Emirates | United Arab Emirates | |
E.F. Oil And Gas Limited | 100.00% | United Kingdom | United Kingdom | ||
Elf E&P | 100.00% | France | France | ||
Elf Exploration UK Limited | 100.00% | United Kingdom | United Kingdom | ||
Elf Petroleum Iran | 100.00% | France | Iran | ||
Elf Petroleum UK Limited | 100.00% | United Kingdom | United Kingdom | ||
Gas Investment and Services Company Limited | 10.00% | E | Bermuda | Oman | |
Ichthys LNG PTY Limited | 26.00% * | E | Australia | Australia | |
Mabruk Oil Operations | 49.02% | France | Libya | ||
Marathon Oil Libya Limited | 100.00% | Cayman Islands | Libya | ||
Moattama Gas Transportation Company Limited | 31.24% | E | Bermuda | Myanmar | |
National Gas Shipping Company Limited | 5.00% | E | United Arab Emirates | United Arab Emirates | |
Nigeria LNG Limited | 15.00% | E | Nigeria | Nigeria | |
Norpipe Oil A/S | 34.93% | E | Norway | Norway | |
Norpipe Petroleum UK Limited | 45.22% | E | United Kingdom | Norway | |
Norpipe Terminal Holdco Limited | 45.22% | E | United Kingdom | United Kingdom | |
North Oil Company | 30.00% | E | Qatar | Qatar | |
Novatek | 19.40% | E | Russia | Russia | |
Oman LNG, LLC | 5.54% | E | Oman | Oman | |
Pars LNG Limited | 40.00% | E | Bermuda | Iran | |
Petrocedeño | 30.32% | E | Venezuela | Venezuela | |
Private Oil Holdings Oman Limited | 10.00% | E | United Kingdom | Oman | |
Qatar Liquefied Gas Company Limited | 10.00% | E | Qatar | Qatar | |
Qatar Liquefied Gas Company Limited (II) | 16.70% | E | Qatar | Qatar | |
Stogg Eagle Funding B.V. | 100.00% | Netherlands | Nigeria | ||
Tep Barnett Usa (75) | 100.00% | United States | United States | ||
Tep Gom Moh. LLC | 100.00% | United States | United States | ||
Tep Jack LLC | 100.00% | United States | United States | ||
Tepkri Sarsang A/S | 100.00% | Denmark | Iraq | ||
Terneftegaz JSC (a) | 58.89% | E | Russia | Russia | |
Total (BTC) B.V. | 100.00% | Netherlands | Netherlands | ||
Total Abu Al Bu Khoosh | 100.00% | France | United Arab Emirates | ||
Total Austral | 100.00% | France | Argentina | ||
Total Brazil Ltda | 100.00% | Brazil | Brazil | ||
Total Brazil Services B.V. | 100.00% | Netherlands | Netherlands | ||
Total Danmark Pipelines A/S | 100.00% | Denmark | Denmark | ||
Total Dolphin Midstream | 100.00% | France | France | ||
Total E&P Chissonga Limited | 100.00% | British Virgin Islands | Angola | ||
Total E&P Absheron B.V. | 100.00% | Netherlands | Azerbaijan | ||
Total E&P Al Shaheen A/S | 100.00% | Denmark | Qatar | ||
Total E&P Algérie | 100.00% | France | Algeria | ||
Total E&P Algerie Berkine A/S | 100.00% | Denmark | Algeria | ||
Total E&P Americas, LLC | 100.00% | United States | United States | ||
Total E&P Angola | 100.00% | France | Angola | ||
Total E&P Angola Block 15/06 Limited | 100.00% | Bermuda | Angola | ||
Business segment | Statutory corporate name | % Group interest | Method | Country of incorporation | Country of operations |
Exploration & Production (contd) | |||||
Total E&P Angola Block 16 A/S | 100.00% | Denmark | Angola | ||
Total E&P Angola Block 16 Holding A/S | 100.00% | Denmark | Angola | ||
Total E&P Angola Block 17.06 | 100.00% | France | Angola | ||
Total E&P Angola Block 25 | 100.00% | France | Angola | ||
Total E&P Angola Block 32 | 100.00% | France | Angola | ||
Total E&P Angola Block 33 | 100.00% | France | Angola | ||
Total E&P Angola Block 39 | 100.00% | France | Angola | ||
Total E&P Angola Block 40 | 100.00% | France | Angola | ||
Total E&P Angola Block 48 B.V. | 100.00% | Netherlands | Angola | ||
Total E&P Angola Chissonga Holdings Limited | 100.00% | British Virgin Islands | Angola | ||
Total E&P Aruba B.V. | 100.00% | Netherlands | Aruba | ||
Total E&P Asia Pacific Pte. Limited | 100.00% | Singapore | Singapore | ||
Total E&P Australia | 100.00% | France | Australia | ||
Total E&P Australia Exploration PTY Limited | 100.00% | Australia | Australia | ||
Total E&P Australia II | 100.00% | France | Australia | ||
Total E&P Australia III | 100.00% | France | Australia | ||
Total E&P Azerbaijan B.V. | 100.00% | Netherlands | Azerbaijan | ||
Total E&P Bolivie | 100.00% | France | Bolivia | ||
Total E&P Borneo B.V. | 100.00% | Netherlands | Brunei | ||
Total E&P Bulgaria B.V. | 100.00% | Netherlands | Bulgaria | ||
Total E&P Cambodge | 100.00% | France | Cambodia | ||
Total E&P Canada Limited | 100.00% | Canada | Canada | ||
Total E&P Chine | 100.00% | France | China | ||
Total E&P Chorey, LLC | 100.00% | United States | United States | ||
Total E&P Colombie | 100.00% | France | Colombia | ||
Total E&P Congo | 85.00% | Republic of the Congo | Republic of the Congo | ||
Total E&P Côte d’Ivoire | 100.00% | France | Côte d’Ivoire | ||
Total E&P Côte d’Ivoire CI - 514 | 100.00% | France | Côte d’Ivoire | ||
Total E&P Côte d’Ivoire CI - 515 | 100.00% | France | Côte d’Ivoire | ||
Total E&P Côte d’Ivoire CI - 516 | 100.00% | France | Côte d’Ivoire | ||
Total E&P Côte d’Ivoire CI-605 B.V. | 100.00% | Netherlands | Côte d’Ivoire | ||
Total E&P Cyprus B.V. | 100.00% | Netherlands | Cyprus | ||
Total E&P Danmark A/S - CPH | 100.00% | Denmark | Denmark | ||
Total E&P Danmark A/S - EBJ | 100.00% | Denmark | Denmark | ||
Total E&P Deep Offshore Borneo B.V. | 100.00% | Netherlands | Brunei | ||
Total E&P Denmark B.V. | 100.00% | Netherlands | Denmark | ||
Total E&P Do Brasil Ltda | 100.00% | Brazil | Brazil | ||
Total E&P Dolphin Upstream | 100.00% | France | France | ||
Total E&P Dunga GmbH | 100.00% | Germany | Kazakhstan | ||
Total E&P East El Burullus Offshore B.V. | 100.00% | Netherlands | Egypt | ||
Total E&P Egypt Block 2 B.V. | 100.00% | Netherlands | Egypt | ||
Total E&P Égypte | 100.00% | France | Egypt | ||
Total E&P Energia Ltda | 100.00% | Brazil | Brazil | ||
Total E&P Europe and Central Asia Limited | 100.00% | United Kingdom | United Kingdom | ||
Total E&P France | 100.00% | France | France | ||
Total E&P Golfe Limited | 100.00% | France | Qatar | ||
Total E&P Greece Bv | 100.00% | Netherlands | Greece | ||
Total E&P Guyana B.V. | 100.00% | Netherlands | Guyana | ||
Total E&P Guyane Francaise | 100.00% | France | France | ||
Total E&P Holding Ichthys | 100.00% | France | France | ||
Total E&P Holdings Australia PTY Limited | 100.00% | Australia | Australia | ||
Total E&P Holdings Russia | 100.00% | France | France | ||
Total E&P Holdings UAE B.V. | 100.00% | Netherlands | United Arab Emirates | ||
Total E&P Ichthys B.V. | 100.00% | Netherlands | Australia | ||
Total E&P Indonesia Mentawai B.V. | 100.00% | Netherlands | Indonesia | ||
Total E&P Indonésie | 100.00% | France | Indonesia | ||
Total E&P International K1 Limited | 100.00% | United Kingdom | Kenya | ||
Total E&P International K2 Limited | 100.00% | United Kingdom | Kenya | ||
Total E&P International K3 Limited | 100.00% | United Kingdom | Kenya | ||
Total E&P International Limited | 100.00% | United Kingdom | Kenya | ||
Business segment | Statutory corporate name | % Group interest | Method | Country of incorporation | Country of operations |
Exploration & Production (contd) | |||||
Total E&P Iraq | 100.00% | France | Iraq | ||
Total E&P Ireland B.V. | 100.00% | Netherlands | Ireland | ||
Total E&P Italia | 100.00% | Italy | Italy | ||
Total E&P Kazakhstan | 100.00% | France | Kazakhstan | ||
Total E&P Kenya B.V. | 100.00% | Netherlands | Kenya | ||
Total E&P Kurdistan Region of Iraq (Harir) B.V. | 100.00% | Netherlands | Iraq | ||
Total E&P Kurdistan Region of Iraq (Safen) B.V. | 100.00% | Netherlands | Iraq | ||
Total E&P Kurdistan Region of Iraq (Taza) B.V. | 100.00% | Netherlands | Iraq | ||
Total E&P Kurdistan Region of Iraq B.V. | 100.00% | Netherlands | Iraq | ||
Total E&P Liban S.A.L. | 100.00% | Lebanon | Lebanon | ||
Total E&P Libye | 100.00% | France | Libya | ||
Total E&P Lower Zakum B.V. | 100.00% | Netherlands | United Arab Emirates | ||
Total E&P Malaysia | 100.00% | France | Malaysia | ||
Total E&P Mauritania Block C18 B.V. | 100.00% | Netherlands | Mauritania | ||
Total E&P Mauritania Block C9 B.V. | 100.00% | Netherlands | Mauritania | ||
Total E&P Mauritania Blocks DW B.V. | 100.00% | Netherlands | Mauritania | ||
Total E&P Mauritanie | 100.00% | France | Mauritania | ||
Total E&P Mexico S.A. de C.V. | 100.00% | Mexico | Mexico | ||
Total E&P Mozambique B.V. | 100.00% | Netherlands | Mozambique | ||
Total E&P Myanmar | 100.00% | France | Myanmar | ||
Total E&P Namibia B.V. | 100.00% | Netherlands | Namibia | ||
Total E&P Nederland B.V. | 100.00% | Netherlands | Netherlands | ||
Total E&P New Ventures Inc. | 100.00% | United States | United States | ||
Total E&P Nigeria Deepwater A Limited | 100.00% | Nigeria | Nigeria | ||
Total E&P Nigeria Deepwater B Limited | 100.00% | Nigeria | Nigeria | ||
Total E&P Nigeria Deepwater C Limited | 100.00% | Nigeria | Nigeria | ||
Total E&P Nigeria Deepwater D Limited | 100.00% | Nigeria | Nigeria | ||
Total E&P Nigeria Deepwater E Limited | 100.00% | Nigeria | Nigeria | ||
Total E&P Nigeria Deepwater F Limited | 100.00% | Nigeria | Nigeria | ||
Total E&P Nigeria Deepwater G Limited | 100.00% | Nigeria | Nigeria | ||
Total E&P Nigeria Deepwater H Limited | 100.00% | Nigeria | Nigeria | ||
Total E&P Nigeria Limited | 100.00% | Nigeria | Nigeria | ||
Total E&P Nigeria S.A.S. | 100.00% | France | France | ||
Total E&P Norge AS | 100.00% | Norway | Norway | ||
Total E&P North Sea UK Limited | 100.00% | United Kingdom | United Kingdom | ||
Total E&P Oman | 100.00% | France | Oman | ||
Total E&P Participations Petrolieres Congo | 100.00% | Republic of the Congo | Republic of the Congo | ||
Total E&P Philippines B.V. | 100.00% | Netherlands | Philippines | ||
Total E&P PNG 2 B.V. | 100.00% | Netherlands | Papua New Guinea | ||
Total E&P PNG 5 B.V. | 100.00% | Netherlands | Papua New Guinea | ||
Total E&P PNG Limited | 100.00% | Papua New Guinea | Papua New Guinea | ||
Total E&P Poland B.V. | 100.00% | Netherlands | Poland | ||
Total E&P Qatar | 100.00% | France | Qatar | ||
Total E&P RDC | 100.00% | Democratic Republic of Congo | Democratic Republic of Congo | ||
Total E&P Research & Technology USA LLC | 100.00% | United States | United States | ||
Total E&P Russie | 100.00% | France | Russia | ||
Total E&P Sebuku | 100.00% | France | Indonesia | ||
Total E&P Senegal | 100.00% | France | Senegal | ||
Total E&P Services China Company Limited | 100.00% | China | China | ||
Total E&P South Africa B.V. | 100.00% | Netherlands | South Africa | ||
Total E&P South Pars | 100.00% | France | Iran | ||
Total E&P South Sudan | 100.00% | France | Republic of South Sudan | ||
Total E&P Syrie | 100.00% | France | Syria | ||
Total E&P Tajikistan B.V. | 100.00% | Netherlands | Tajikistan | ||
Total E&P Thailand | 100.00% | France | Thailand | ||
Total E&P Three PL B.V. | 100.00% | Netherlands | Brazil | ||
Total E&P Timan-Pechora LLC | 100.00% | Russia | Russia | ||
Total E&P UAE Unconventional Gas B.V. | 100.00% | Netherlands | United Arab Emirates | ||
Total E&P Uganda B.V. | 100.00% | Netherlands | Uganda | ||
Business segment | Statutory corporate name | % Group interest | Method | Country of incorporation | Country of operations |
Exploration & Production (contd) | |||||
Total E&P UK Limited | 100.00% | United Kingdom | United Kingdom | ||
Total E&P Umm Shaif Nasr B.V. | 100.00% | Netherlands | United Arab Emirates | ||
Total E&P Uruguay B.V. | 100.00% | Netherlands | Uruguay | ||
Total E&P Uruguay Onshore B.V. | 100.00% | Netherlands | Uruguay | ||
Total E&P USA Inc. | 100.00% | United States | United States | ||
Total E&P USA Oil Shale, LLC | 100.00% | United States | United States | ||
Total E&P Well Response | 100.00% | France | France | ||
Total E&P Yamal | 100.00% | France | France | ||
Total E&P Yemen | 100.00% | France | Yemen | ||
Total E&P Yemen Block 3 B.V. | 100.00% | Netherlands | Yemen | ||
Total East Africa Midstream B.V. | 100.00% | Netherlands | Uganda | ||
Total Energy (Meuk) Limited | 100.00% | United Kingdom | United Kingdom | ||
Total Exploration M’Bridge | 100.00% | Netherlands | Angola | ||
Total Facilities Management B.V. | 100.00% | Netherlands | Netherlands | ||
Total Gabon | 58.28% | Gabon | Gabon | ||
Total Gass Handel Norge AS | 100.00% | Norway | Norway | ||
Total Gastransport Nederland B.V. | 100.00% | Netherlands | Netherlands | ||
Total GLNG Australia | 100.00% | France | Australia | ||
Total GLNG Australia Holdings | 100.00% | France | Australia | ||
Total Holding Dolphin Amont | 100.00% | France | France | ||
Total Holdings Nederland B.V. | 100.00% | Netherlands | Netherlands | ||
Total Holdings Nederland International B.V. | 100.00% | Netherlands | Netherlands | ||
Total Iran B.V. | 100.00% | Netherlands | Iran | ||
Total LNG Angola | 100.00% | France | France | ||
Total LNG Supply Services USA Inc. | 100.00% | United States | United States | ||
Total Oil and Gas South America | 100.00% | France | France | ||
Total Oil and Gas Venezuela B.V. | 100.00% | Netherlands | Venezuela | ||
Total Oil Gb Limited | 100.00% | United Kingdom | United Kingdom | ||
Total Oil UK Limited | 100.00% | United Kingdom | United Kingdom | ||
Total Pars LNG | 100.00% | France | Iran | ||
Total Petroleum Angola | 100.00% | France | Angola | ||
Total Profils Pétroliers | 100.00% | France | France | ||
Total Qatar | 100.00% | France | Qatar | ||
Total South Pars | 100.00% | France | Iran | ||
Total Tengah | 100.00% | France | Indonesia | ||
Total Termokarstovoye B.V. | 100.00% | Netherlands | Russia | ||
Total UAE SERVICES | 100.00% | France | United Arab Emirates | ||
Total Upstream Danmark A/S | 100.00% | Denmark | Denmark | ||
Total Upstream Nigeria Limited | 100.00% | Nigeria | Nigeria | ||
Total Upstream UK Limited | 100.00% | United Kingdom | United Kingdom | ||
Total Venezuela | 100.00% | France | France | ||
Total Yemen LNG Company Limited | 100.00% | Bermuda | Bermuda | ||
Unitah Colorado Resources II, LLC | 100.00% | United States | United States | ||
Yamal LNG (b) | 29.73% | E | Russia | Russia | |
Yemen LNG Company Limited | 39.62% | E | Bermuda | Yemen | |
Ypergas S.A. | 37.33% | Venezuela | Venezuela | ||
Gas, Renewables & Power | |||||
3Cb S.A.S. | 100.00% | France | France | ||
Advanced Thermal Batteries Inc. | 50.00% | E | United States | United States | |
Aerospatiale Batteries (ASB) | 50.00% | E | France | France | |
Aerowatt Energies | 61.99% | E | France | France | |
Aerowatt Energies 2 | 48.64% | E | France | France | |
Alcad AB | 100.00% | Sweden | Sweden | ||
Altinergie | 51.00% | E | France | France | |
Aton Solar Program, LLC | 55.66% | United States | United States | ||
Badenhorst PV 2 Hold Company LLC | 55.66% | United States | United States | ||
Bertophase (PTY) Limited | 55.66% | South Africa | South Africa | ||
Biogaz Breuil | 100.00% | France | France | ||
Biogaz Chatillon | 100.00% | France | France | ||
Biogaz Corcelles | 100.00% | France | France | ||
Biogaz Epinay | 100.00% | France | France | ||
Business segment | Statutory corporate name | % Group interest | Method | Country of incorporation | Country of operations |
Gas, Renewables & Power (contd) | |||||
Biogaz Libron | 100.00% | France | France | ||
Biogaz Milhac | 100.00% | France | France | ||
Biogaz Soignolles | 100.00% | France | France | ||
Biogaz Torcy | 100.00% | France | France | ||
Biogaz Vert Le Grand | 100.00% | France | France | ||
Biogaz Viriat | 100.00% | France | France | ||
BNB Bloomfield Solar, LLC | 55.66% | United States | United States | ||
Borrowed Sunshine Parent, LLC | 55.66% | United States | United States | ||
Borrowed Sunshine, LLC | 55.66% | United States | United States | ||
Boulder Solar III, LLC | 55.66% | United States | United States | ||
Boulder Solar IV, LLC | 55.66% | United States | United States | ||
Boulder Solar Power, LLC | 55.66% | United States | United States | ||
BSP Class B Member HoldCo, LLC | 55.66% | United States | United States | ||
BSP Class B Member, LLC | 55.66% | United States | United States | ||
BSP Holding Company, LLC | 55.66% | United States | United States | ||
BSP II Parent, LLC | 55.66% | United States | United States | ||
Buffalo North Star Solar, LLC | 55.66% | United States | United States | ||
Cameron LNG Holdings LLC | 16.60% | E | United States | United States | |
Ce De La Vallee Gentillesse | 70.00% | France | France | ||
Ce Les Ailes De Taillard | 47.69% | E | France | France | |
Ce Varades | 51.00% | France | France | ||
Centrale Eolienne De Couloumi | 51.00% | France | France | ||
Centrale Eolienne De Coume | 100.00% | France | France | ||
Centrale Eolienne De Dainville | 100.00% | France | France | ||
Centrale Eolienne De Goulien | 100.00% | France | France | ||
Centrale Eolienne De L’Olivier | 51.00% | France | France | ||
Centrale Eolienne Des Malandaux | 51.00% | France | France | ||
Centrale Eolienne Du Plan Du Pal | 51.00% | France | France | ||
Centrale Eolienne La Croix De Cuitot | 51.00% | France | France | ||
Centrale Eolienne Les Champs Parents | 51.00% | France | France | ||
Centrale Photovoltaique De La Croix | 100.00% | France | France | ||
Centrale Photovoltaique De Merle Sud | 40.00% | E | France | France | |
Centrale Photovoltaique Du Seneguier | 100.00% | France | France | ||
Centrale Photovoltaique Le Barou | 100.00% | France | France | ||
Centrale Solaire 2 | 55.66% | France | United States | ||
Centrale Solaire Centre Ouest 2 | 100.00% | France | France | ||
Centrale Solaire Couloumine | 100.00% | France | France | ||
Centrale Solaire De Cazedarnes | 50.00% | E | France | France | |
Centrale Solaire Du Centre Ouest | 100.00% | France | France | ||
Centrale Solaire Du Pla De La Roque | 100.00% | France | France | ||
Centrale Solaire Heliovale | 59.00% | E | France | France | |
Centrale Solaire Manosque Ombriere | 100.00% | France | France | ||
Ch Arvan | 100.00% | France | France | ||
Ch Barbaira | 100.00% | France | France | ||
Ch Bonnant | 100.00% | France | France | ||
Ch Hydrotinee | 47.69% | E | France | France | |
Ch La Buissiere | 100.00% | France | France | ||
Ch Previnquieres | 100.00% | France | France | ||
Ch. Alas | 100.00% | France | France | ||
Co Biogaz | 26.00% | E | France | France | |
Cogenra Solar, Inc. | 55.66% | United States | United States | ||
Colón LNG Marketing S. de R. L. | 50.00% | E | Panama | Panama | |
Côte d’Ivoire GNL | 34.00% | E | Côte d’Ivoire | Côte d’Ivoire | |
CS Autoprod | 100.00% | France | France | ||
CS Betheniville | 51.00% | E | France | France | |
CS Briffaut | 100.00% | France | France | ||
CS Cazedarnes | 47.69% | E | France | France | |
CS Chemin De Melette | 100.00% | France | France | ||
CS Dom | 100.00% | France | France | ||
CS Du Lavoir | 85.71% | France | France | ||
CS Estarac | 33.38% | E | France | France | |
Business segment | Statutory corporate name | % Group interest | Method | Country of incorporation | Country of operations |
Gas, Renewables & Power (contd) | |||||
CS Felix | 100.00% | France | France | ||
CS Forum Laudun | 100.00% | France | France | ||
CS Fremy | 100.00% | France | France | ||
CS Gardanne | 100.00% | France | France | ||
CS Gigognan | 51.00% | E | France | France | |
CS Heliovale | 48.64% | E | France | France | |
CS Le Castellet | 100.00% | France | France | ||
CS Le Cres | 51.00% | E | France | France | |
CS Les Aspres | 100.00% | France | France | ||
CS Les Cordeliers | 75.00% | France | France | ||
CS Les Cordeliers 2 | 100.00% | France | France | ||
CS Les Galliennes | 100.00% | France | France | ||
CS Les Melettes | 100.00% | France | France | ||
CS Lodes | 100.00% | France | France | ||
CS Mazeran Lr | 100.00% | France | France | ||
CS Mazeran Paca | 100.00% | France | France | ||
CS Olinoca | 9.54% | E | France | France | |
CS Ombrieres Cap Agathois | 75.00% | France | France | ||
CS Pezenas | 100.00% | France | France | ||
CS Piennes | 100.00% | France | France | ||
CS Plateau De Pouls | 76.12% | France | France | ||
CS Quadrao | 100.00% | France | France | ||
CS Sableyes | 51.00% | E | France | France | |
CS Supdevenergie | 100.00% | France | France | ||
CS Valorbi | 100.00% | France | France | ||
CS Viguier | 100.00% | France | France | ||
CS Zabo | 100.00% | France | France | ||
CS Zabo 2 | 100.00% | France | France | ||
CSMED | 100.00% | France | France | ||
DeAar PV Hold Company LLC | 55.66% | United States | United States | ||
Desert Equinox, LLC | 55.66% | E | United States | United States | |
Direct Énergie Belgium | 100.00% | Belgium | Belgium | ||
Direct Énergie Concessions | 100.00% | France | France | ||
Direct Énergie Génération | 100.00% | France | France | ||
Direct Énergie S.A. | 100.00% | France | France | ||
Dongfang Huansheng Photovoltaic (Jiangsu) Company Limited | 55.66% | E | China | United States | |
Dragonfly Systems, Inc. | 55.66% | United States | United States | ||
Eau Chaude Réunion (ECR) | 50.00% | E | France | France | |
Electricite Solaire De Molleges | 100.00% | France | France | ||
Eole Balaze 2 | 65.00% | E | France | France | |
Eole Balaze S.A.R.L. | 66.00% | E | France | France | |
Eole Boin | 100.00% | France | France | ||
Eole Broceliande | 51.00% | France | France | ||
Eole Champagne Conlinoise | 100.00% | France | France | ||
Eole Cote Du Moulin | 100.00% | France | France | ||
Eole Desirade 4 | 66.00% | E | France | France | |
Eole Du Bocage | 51.00% | France | France | ||
Eole Fonds Caraibes | 100.00% | France | France | ||
Eole Grand Maison | 100.00% | France | France | ||
Eole La Montagne | 100.00% | France | France | ||
Eole La Motelle | 66.00% | E | France | France | |
Eole La Perriere S.A.R.L. | 100.00% | France | France | ||
Eole Les Buissons | 100.00% | France | France | ||
Eole Les Patoures | 51.00% | France | France | ||
Eole Maxent | 66.00% | E | France | France | |
Eole Morne Carriere | 100.00% | France | France | ||
Eole Morne Constant | 100.00% | France | France | ||
Eole Moulin Tizon | 100.00% | France | France | ||
Eole Petit Fougeray | 51.00% | France | France | ||
Eole Petite Place | 53.00% | E | France | France | |
Business segment | Statutory corporate name | % Group interest | Method | Country of incorporation | Country of operations |
Gas, Renewables & Power (contd) | |||||
Eole Pierrefitte Es Bois | 100.00% | France | France | ||
Eole Saint-Jean Lachalm | 100.00% | France | France | ||
Eole Sorbon S.A.R.L. | 100.00% | France | France | ||
Eole Yate | 100.00% | France | France | ||
Eoliennes Arques 1 | 100.00% | France | France | ||
Eoliennes Arques 2 | 100.00% | France | France | ||
Eoliennes Arques 3 | 100.00% | France | France | ||
Eoliennes De La Chaussee Brunehaut | 51.00% | France | France | ||
Eoliennes De La Chaussee Brunehaut 1 | 51.00% | France | France | ||
Eoliennes De La Chaussee Brunehaut 2 | 51.00% | France | France | ||
Eoliennes De La Chaussee Brunehaut 3 | 51.00% | France | France | ||
Eoliennes De La Chaussee Brunehaut 4 | 51.00% | France | France | ||
Eoliennes De La Chaussee Brunehaut 5 | 51.00% | France | France | ||
Eoliennes De L’Ourcq Et Du Clignon | 51.00% | France | France | ||
Eoliennes Du Champ Chardon | 100.00% | France | France | ||
Eoloue | 17.00% | E | France | France | |
Fassett-Walker Ii, LLC | 55.66% | United States | United States | ||
Fassett-Walker Ph1, LLC | 55.66% | United States | United States | ||
Fassett-Walker, LLC | 55.66% | United States | United States | ||
Fast Jung KB | 100.00% | Sweden | Sweden | ||
Finansol 1 | 100.00% | France | France | ||
Finansol 2 | 100.00% | France | France | ||
Finansol 3 | 100.00% | France | France | ||
Fosmax LNG | 27.50% | E | France | France | |
Frieman & Wolf Batterietechnick GmbH | 100.00% | Germany | Germany | ||
Gas Del Litoral SRLCV | 25.00% | E | Mexico | Mexico | |
GFS I Class B Member, LLC | 55.66% | United States | United States | ||
Gfs I Holding Company, LLC | 55.66% | United States | United States | ||
Giovanni Holdings, LLC | 55.66% | United States | United States | ||
Glaciere De Palisse | 100.00% | France | France | ||
Global Energy Armateur SNC | 100.00% | France | France | ||
Global LNG Armateur S.A.S. | 100.00% | France | France | ||
Global LNG Cameron France S.A.S. | 100.00% | France | France | ||
Global LNG Downstream S.A.S. | 100.00% | France | France | ||
Global LNG North America Corporation | 100.00% | United States | United States | ||
Global LNG S.A.S. | 100.00% | France | France | ||
Global LNG Supply S.A. | 100.00% | Luxembourg | Luxembourg | ||
Global LNG UK Limited | 100.00% | United Kingdom | United Kingdom | ||
Golden Fields Solar I, LLC | 55.66% | United States | United States | ||
Goodfellow Solar I, LLC | 55.66% | United States | United States | ||
Greenbotics, Inc. | 55.66% | United States | United States | ||
Greenflex S.A.S. | 100.00% | France | France | ||
Gulf Total Tractebel Power Company PSJC | 20.00% | E | United Arab Emirates | United Arab Emirates | |
Hambrégie | 100.00% | France | France | ||
Hazira LNG Private Limited | 26.00% | E | India | India | |
Hazira Port Private Limited | 26.00% | E | India | India | |
Helio 100 Kw | 100.00% | France | France | ||
Helio 21 | 100.00% | France | France | ||
Helio 974 Toitures | 100.00% | France | France | ||
Helio Bakia | 100.00% | France | France | ||
Helio Beziers | 65.00% | E | France | France | |
Helio Boulouparis | 100.00% | France | France | ||
Helio Boulouparis 2 | 100.00% | France | France | ||
Helio Florensac | 65.00% | E | France | France | |
Helio Fonds Caraibes | 100.00% | France | France | ||
Helio La Perriere | 66.00% | E | France | France | |
Helio Logistique | 65.00% | E | France | France | |
Helio L’R | 100.00% | France | France | ||
Helio Orange | 65.00% | E | France | France | |
Helio Piin Patch | 100.00% | France | France | ||
Helio Popidery | 100.00% | France | France | ||
Business segment | Statutory corporate name | % Group interest | Method | Country of incorporation | Country of operations |
Gas, Renewables & Power (contd) | |||||
Helio Reunion | 100.00% | France | France | ||
Helio Tamoa | 100.00% | France | France | ||
Helio Temala | 100.00% | France | France | ||
Helios Beau Champ Limited | 48.64% | E | Mauritius | Mauritius | |
Helios II Residential Solar Fund, LLC | 55.66% | E | United States | United States | |
Helios Residential Solar Fund, LLC | 55.66% | United States | United States | ||
Helix Project III, LLC | 55.66% | United States | United States | ||
Helix Project Iv, LLC | 55.66% | United States | United States | ||
Helix Project V, LLC | 55.66% | United States | United States | ||
Heracles Solar PH1, LLC | 55.66% | United States | United States | ||
Heracles Solar, LLC | 55.66% | United States | United States | ||
High Plains Ranch I, LLC | 55.66% | United States | United States | ||
Holding Eole 2018 | 100.00% | France | France | ||
Holding Otev | 100.00% | France | France | ||
Holding Pdr | 100.00% | France | France | ||
Huaxia CPV (Inner Mongolia) Power Corporation, Limited | 13.91% | E | China | China | |
Hydro Tinee | 50.00% | E | France | France | |
Hydro-M Ingenierie Des Energies Renouvelables | 100.00% | France | France | ||
Hydromons | 100.00% | France | France | ||
Infigen Energy US Development Corporation | 55.66% | France | United States | ||
Institut Photovoltaïque D’Ile De France (IPVF) | 43.00% | France | France | ||
Ise Total Nanao Power Plant G.K. | 50.00% | E | Japan | Japan | |
JBAB Solar, LLC | 55.66% | United States | United States | ||
JDA Overseas Holdings, LLC | 55.66% | United States | United States | ||
Jmb Hydro S.A.R.L. | 100.00% | France | France | ||
Jmb Solar | 100.00% | France | France | ||
Jmb Solar Nogara | 100.00% | France | France | ||
Jmcp | 50.05% | France | France | ||
K2015014806 (South Africa) (PTY) Limited | 55.66% | South Africa | United States | ||
K2015014875 (South Africa) (PTY) Limited | 55.66% | South Africa | South Africa | ||
K2015070451 (South Africa) (PTY) Limited | 55.66% | South Africa | South Africa | ||
K2015263261 (South Africa) (PTY) Limited | 55.66% | South Africa | United States | ||
Kern High School District Solar, LLC | 55.66% | United States | United States | ||
Klipgats 7 Hold Company LLC | 55.66% | United States | United States | ||
Klipgats PV 3 Hold Company LLC | 55.66% | United States | United States | ||
Kozani Energy Anonymi Energeiaki Etaireia (distinctive title Kozani Energy S.A.) | 55.66% | Greece | Greece | ||
Kozani Energy Malta Limited | 55.66% | Malta | Malta | ||
LA Basin Solar I, LLC | 55.66% | United States | United States | ||
LA Basin Solar II, LLC | 55.66% | United States | United States | ||
LA Basin Solar III, LLC | 55.66% | United States | United States | ||
La Compagnie Electrique De Bretagne | 60.00% | E | France | France | |
La Metairie Neuve | 23.84% | E | France | France | |
Lampiris S.A. | 100.00% | Belgium | Belgium | ||
Lemoore Stratford Land Holdings IV, LLC | 55.66% | United States | United States | ||
Les Eoliennes De Conquereuil | 100.00% | France | France | ||
Les Moulins A Vent De Kermadeen | 51.00% | France | France | ||
Les Vents De Ranes | 100.00% | France | France | ||
Libcom | 100.00% | France | France | ||
Libwatt | 100.00% | France | France | ||
Lucerne Valley Solar I, LLC | 55.66% | United States | United States | ||
Luis Solar, LLC | 55.66% | United States | United States | ||
Lux II Residential Solar Fund, LLC | 55.66% | E | United States | United States | |
Lux Residential Solar Fund, LLC | 55.66% | United States | United States | ||
Marcinelle Energie | 100.00% | Belgium | Belgium | ||
Margeriaz Energie | 100.00% | France | France | ||
Marysville Unified School District Solar, LLC | 55.66% | United States | United States | ||
Messigaz SNC | 100.00% | France | France | ||
Methanergy | 100.00% | France | France | ||
Minneola Solar I, LLC | 55.66% | United States | United States | ||
Missiles & Space Batteries Limited | 50.00% | E | United Kingdom | United Kingdom | |
Business segment | Statutory corporate name | % Group interest | Method | Country of incorporation | Country of operations |
Gas, Renewables & Power (contd) | |||||
Miyako Kuzakai Solarpark G.K. | 50.00% | E | Japan | Japan | |
Mojave Solar Investment, LLC | 55.66% | United States | United States | ||
Mulilo Prieska PV (RF) Proprietary Limited | 27.00% | E | South Africa | South Africa | |
Napa Sanitation District Solar, LLC | 55.66% | United States | United States | ||
Nelle Centr.Eolienne-Lastours | 47.69% | E | France | France | |
NorthStar Energy Management, LLC | 55.66% | United States | United States | ||
Northstar Santa Clara County 2016, LLC | 55.66% | United States | United States | ||
Nouvelle Entreprise D’Energie Solaire | 51.00% | E | France | France | |
Nyk Armateur S.A.S. | 50.00% | E | France | France | |
Ombrieres Te Vendres | 100.00% | France | France | ||
Oro Fields Solar, LLC | 55.66% | United States | United States | ||
Parc Des Hauts Vents | 66.00% | E | France | France | |
Parc Eolien De Cassini | 47.69% | E | France | France | |
Parc Eolien De Nesle La Reposte | 100.00% | France | France | ||
Parc Eolien Nordex III | 47.69% | E | France | France | |
Parc Eolien Nordex XXIX | 47.69% | E | France | France | |
Parc Eolien Nordex XXX | 47.69% | E | France | France | |
Parc Solaire De Servian | 100.00% | France | France | ||
Partrederiet Bw Gas Global LNG | 49.00% | E | Norway | Norway | |
Perpetual Sunhine Solar Program I, LLC | 55.66% | United States | United States | ||
Perpetual Sunshine I, LLC | 55.66% | United States | United States | ||
PGC Plano I, LLC | 55.66% | United States | United States | ||
Phantom Field Resources, LLC | 55.66% | United States | United States | ||
Photon Residential Solar Fund, LLC | 55.66% | E | United States | United States | |
Photovoltaic Park Malta Limited | 55.66% | Malta | Malta | ||
Photovoltaica Parka Veroia Anonymi Etaireia | 55.66% | Greece | Greece | ||
Pont-Sur-Sambre Power S.A.S. | 100.00% | France | France | ||
Pos | 100.00% | France | France | ||
Pos Production Ii | 60.00% | France | France | ||
Pos Production Iii | 70.00% | France | France | ||
Pos Production Iv | 70.00% | France | France | ||
Pos Production V | 70.00% | France | France | ||
Proteus Solar, S.A. De C.V. | 55.66% | Mexico | Mexico | ||
PV Salvador SPA | 20.00% | E | Chile | Chile | |
Quadran Caraibes | 100.00% | France | France | ||
Quadran Holding Daac | 100.00% | France | France | ||
Quadran Holding Nc | 100.00% | France | France | ||
Quadran Nogara | 100.00% | France | France | ||
Quadran Pacific | 100.00% | France | France | ||
Quadran S.A.S. | 100.00% | France | France | ||
Quadrelio | 100.00% | France | France | ||
Quadrica | 51.00% | France | France | ||
Redstone Solar I, LLC | 55.66% | United States | United States | ||
Roquefort Solar | 51.00% | E | France | France | |
Saft (Zhuhai FTZ) Batteries Company Limited | 100.00% | China | China | ||
Saft AB | 100.00% | Sweden | Sweden | ||
Saft Acquisition S.A.S. | 100.00% | France | France | ||
Saft America Inc. | 100.00% | United States | United States | ||
Saft AS | 100.00% | Norway | Norway | ||
Saft Australia PTY Limited | 100.00% | Australia | Australia | ||
Saft Batterias SL | 100.00% | Spain | Spain | ||
Saft Batterie Italia S.R.L. | 100.00% | Italy | Italy | ||
Saft Batterien GmbH | 100.00% | Germany | Germany | ||
Saft Batteries Pte Limited | 100.00% | Singapore | Singapore | ||
Saft Batteries PTY Limited | 100.00% | Australia | Australia | ||
Saft Batterijen B.V. | 100.00% | Netherlands | Netherlands | ||
Saft Do Brasil Ltda | 100.00% | Brazil | Brazil | ||
Saft Ferak AS | 100.00% | Czech Republic | Czech Republic | ||
Saft Finance S.A.R.L. | 100.00% | Luxembourg | Luxembourg | ||
Saft Groupe S.A. | 100.00% | France | France | ||
Saft Hong Kong Limited | 100.00% | Hong Kong | Hong Kong | ||
Business segment | Statutory corporate name | % Group interest | Method | Country of incorporation | Country of operations |
Gas, Renewables & Power (contd) | |||||
Saft India Private Limited | 100.00% | India | India | ||
Saft Japan KK | 100.00% | Japan | Japan | ||
Saft Limited | 100.00% | United Kingdom | United Kingdom | ||
Saft LLC | 100.00% | Russia | Russia | ||
Saft Nife ME Limited | 100.00% | Cyprus | Cyprus | ||
Saft S.A.S. | 100.00% | France | France | ||
Saft Sweden AB | 100.00% | Sweden | Sweden | ||
Sem La Champenoise | 15.26% | E | France | France | |
Semper | 34.26% | E | France | France | |
SGS Antelope Valley Development, LLC | 55.66% | United States | United States | ||
Sgula (East) Green Energies Limited | 55.66% | Israel | United States | ||
Shams Power Company PJSC | 20.00% | E | United Arab Emirates | United Arab Emirates | |
Smalt Energie | 100.00% | France | France | ||
Société d’exploitation de centrales photovoltaïques 1 | 27.88% | France | France | ||
Solaire Generation, LLC | 55.66% | United States | United States | ||
Solaire Grand Sud | 100.00% | France | France | ||
Solaire Libron | 100.00% | France | France | ||
Solaire Villon | 51.00% | E | France | France | |
Solar Carport NJ, LLC | 55.66% | United States | United States | ||
Solar Energies | 61.99% | E | France | France | |
Solar Greenhouse I, LLC | 55.66% | United States | United States | ||
Solar Mimizan | 100.00% | France | France | ||
Solar Star 1969, LLC | 55.66% | United States | United States | ||
Solar Star Always Low Prices Ct, LLC | 55.66% | United States | United States | ||
Solar Star Always Low Prices Hi, LLC | 55.66% | United States | United States | ||
Solar Star Always Low Prices Il, LLC | 55.66% | United States | United States | ||
Solar Star Always Low Prices Ma, LLC | 55.66% | United States | United States | ||
Solar Star Arizona HMR-I, LLC | 55.66% | United States | United States | ||
Solar Star Arizona I, LLC | 55.66% | United States | United States | ||
Solar Star Arizona II, LLC | 55.66% | United States | United States | ||
Solar Star Arizona III, LLC | 55.66% | United States | United States | ||
Solar Star Arizona IV, LLC | 55.66% | United States | United States | ||
Solar Star Arizona V, LLC | 55.66% | United States | United States | ||
Solar Star Arizona VI, LLC | 55.66% | United States | United States | ||
Solar Star Arizona VII, LLC | 55.66% | United States | United States | ||
Solar Star Arizona XIII, LLC | 55.66% | United States | United States | ||
Solar Star Bay City 2, LLC | 55.66% | United States | United States | ||
Solar Star Bay City I, LLC | 55.66% | United States | United States | ||
Solar Star California I, LLC | 55.66% | United States | United States | ||
Solar Star California IV, LLC | 55.66% | United States | United States | ||
Solar Star California L (2), LLC | 55.66% | United States | United States | ||
Solar Star California L (3), LLC | 55.66% | United States | United States | ||
Solar Star California L, LLC | 55.66% | United States | United States | ||
Solar Star California LX, LLC | 55.66% | United States | United States | ||
Solar Star California LXII, LLC | 55.66% | United States | United States | ||
Solar Star California LXIII, LLC | 55.66% | United States | United States | ||
Solar Star California LXIV, LLC | 55.66% | United States | United States | ||
Solar Star California LXV, LLC | 55.66% | United States | United States | ||
Solar Star California LXVI, LLC | 55.66% | United States | United States | ||
Solar Star California LXXV, LLC | 55.66% | United States | United States | ||
Solar Star California LXXVI, LLC | 55.66% | United States | United States | ||
Solar Star California LXXVII, LLC | 55.66% | United States | United States | ||
Solar Star California LXXVIII, LLC | 55.66% | United States | United States | ||
Solar Star California VII, LLC | 55.66% | United States | United States | ||
Solar Star California XII, LLC | 55.66% | United States | United States | ||
Solar Star California XL, LLC | 55.66% | United States | United States | ||
Solar Star California XLI Parent, LLC | 55.66% | United States | United States | ||
Solar Star California XLI, LLC | 55.66% | United States | United States | ||
Solar Star California XLII, LLC | 55.66% | United States | United States | ||
Solar Star California XLIII, LLC | 55.66% | United States | United States | ||
Solar Star California XLIV, LLC | 55.66% | United States | United States | ||
Business segment | Statutory corporate name | % Group interest | Method | Country of incorporation | Country of operations |
Gas, Renewables & Power (contd) | |||||
Solar Star California XLV, LLC | 55.66% | United States | United States | ||
Solar Star California XLVI, LLC | 55.66% | United States | United States | ||
Solar Star California XLVII, LLC | 55.66% | United States | United States | ||
Solar Star California XLVIII, LLC | 55.66% | United States | United States | ||
Solar Star California XV Parent, LLC | 55.66% | United States | United States | ||
Solar Star California XV, LLC | 55.66% | United States | United States | ||
Solar Star California XVI, LLC | 55.66% | United States | United States | ||
Solar Star California XVII, LLC | 55.66% | United States | United States | ||
Solar Star California XVIII, LLC | 55.66% | United States | United States | ||
Solar Star California XXI, LLC | 55.66% | United States | United States | ||
Solar Star California XXII, LLC | 55.66% | United States | United States | ||
Solar Star California XXIII, LLC | 55.66% | United States | United States | ||
Solar Star California XXIV, LLC | 55.66% | United States | United States | ||
Solar Star California XXIX, LLC | 55.66% | United States | United States | ||
Solar Star California XXV, LLC | 55.66% | United States | United States | ||
Solar Star California XXVI, LLC | 55.66% | United States | United States | ||
Solar Star California XXVII, LLC | 55.66% | United States | United States | ||
Solar Star California XXVIII, LLC | 55.66% | United States | United States | ||
Solar Star California XXXIV, LLC | 55.66% | United States | United States | ||
Solar Star California XXXIX, LLC | 55.66% | United States | United States | ||
Solar Star California XXXV, LLC | 55.66% | United States | United States | ||
Solar Star California XXXVI, LLC | 55.66% | United States | United States | ||
Solar Star California XXXVII, LLC | 55.66% | United States | United States | ||
Solar Star California XXXVIII, LLC | 55.66% | United States | United States | ||
Solar Star Colorado II, LLC | 55.66% | United States | United States | ||
Solar Star Connecticut I, LLC | 55.66% | United States | United States | ||
Solar Star Grossmont St Cr, LLC | 55.66% | United States | United States | ||
Solar Star Hawaii I, LLC | 55.66% | United States | United States | ||
Solar Star Hawaii IV, LLC | 55.66% | United States | United States | ||
Solar Star HD Connecticut, LLC | 55.66% | United States | United States | ||
Solar Star HD Illinois, LLC | 55.66% | United States | United States | ||
Solar Star HD Maryland, LLC | 55.66% | United States | United States | ||
Solar Star HD New Jersey, LLC | 55.66% | United States | United States | ||
Solar Star HD New York, LLC | 55.66% | United States | United States | ||
Solar Star Healthy 1, LLC | 55.66% | United States | United States | ||
Solar Star HI Air, LLC | 55.66% | United States | United States | ||
Solar Star Illinois I, LLC | 55.66% | United States | United States | ||
Solar Star Irwd Baker, LLC | 55.66% | United States | United States | ||
Solar Star Khsd, LLC | 55.66% | United States | United States | ||
Solar Star La County I, LLC | 55.66% | United States | United States | ||
Solar Star Lost Hills, LLC | 55.66% | United States | United States | ||
Solar Star Massachusetts II, LLC | 55.66% | United States | United States | ||
Solar Star Massachusetts III, LLC | 55.66% | United States | United States | ||
Solar Star Maxx 1, LLC | 55.66% | United States | United States | ||
Solar Star New Jersey IV, LLC | 55.66% | United States | United States | ||
Solar Star New York I, LLC | 55.66% | United States | United States | ||
Solar Star Northwestern University, LLC | 55.66% | United States | United States | ||
Solar Star NVUSD II, LLC | 55.66% | United States | United States | ||
Solar Star Oceanside, LLC | 55.66% | United States | United States | ||
Solar Star Oregon I, LLC | 55.66% | United States | United States | ||
Solar Star Oregon II Parent, LLC | 55.66% | United States | United States | ||
Solar Star Palo Alto I, LLC | 55.66% | United States | United States | ||
Solar Star Plano I, LLC | 55.66% | United States | United States | ||
Solar Star Rancho CWD I, LLC | 55.66% | United States | United States | ||
Solar Star Rpuwd, LLC | 55.66% | United States | United States | ||
Solar Star Santa Barbara 3, LLC | 55.66% | United States | United States | ||
Solar Star Santa Cruz, LLC | 55.66% | United States | United States | ||
Solar Star SH MA, LLC | 55.66% | United States | United States | ||
Solar Star Texas II, LLC | 55.66% | United States | United States | ||
Solar Star Texas IV, LLC | 55.66% | United States | United States | ||
Solar Star Urbana Landfill Central, LLC | 55.66% | United States | United States | ||
Business segment | Statutory corporate name | % Group interest | Method | Country of incorporation | Country of operations |
Gas, Renewables & Power (contd) | |||||
Solar Star Urbana Landfill East, LLC | 55.66% | United States | United States | ||
Solar Star Wfm 1, LLC | 55.66% | United States | United States | ||
Solar Star Wfm 2, LLC | 55.66% | United States | United States | ||
Solar Star Woodlands St Cr, LLC | 55.66% | United States | United States | ||
Solar Star YC, LLC | 55.66% | United States | United States | ||
Solar University, LLC | 55.66% | United States | United States | ||
SolarBridge Technologies Inc. | 55.66% | United States | United States | ||
Solarstar Billerica I, LLC | 55.66% | United States | United States | ||
Solarstar Ma I, LLC | 55.66% | United States | United States | ||
Solarstar Prime I, LLC | 55.66% | United States | United States | ||
SolarStorage Fund A, LLC | 55.66% | United States | United States | ||
SolarStorage Fund B, LLC | 55.66% | United States | United States | ||
SolarStorage Fund C, LLC | 55.66% | United States | United States | ||
Sophye Lacmort | 50.00% | E | France | France | |
South Hook LNG Terminal Company Limited | 8.35% | E | United Kingdom | United Kingdom | |
SPML Land Inc. | 55.66% | Philippines | Philippines | ||
SPWR EW 2013-1, LLC | 0.56% | United States | United States | ||
SPWR MS 2013-1, LLC | 27.83% | United States | United States | ||
SPWR SS 1, LLC | 55.66% | United States | United States | ||
Srec Ne Holdings, LLC | 55.66% | United States | United States | ||
Srec Ne, LLC | 55.66% | United States | United States | ||
SSCA XLI Class B Member, LLC | 55.66% | United States | United States | ||
SSCA XLI Holding Company, LLC | 55.66% | United States | United States | ||
Strata Solar, LLC | 55.66% | United States | United States | ||
SunPower AssetCo, LLC | 55.66% | United States | United States | ||
SunPower Bermuda Holdings | 55.66% | Bermuda | Bermuda | ||
SunPower Bobcat Solar, LLC | 55.66% | United States | United States | ||
SunPower Capital Services, LLC | 55.66% | United States | United States | ||
SunPower Capital, LLC | 55.66% | United States | United States | ||
SunPower Commercial Holding Company IV Parent, LLC | 55.66% | United States | United States | ||
SunPower Commercial Holding Company IV, LLC | 55.66% | United States | United States | ||
SunPower Commercial Holding Company V, LLC | 55.66% | United States | United States | ||
SunPower Commercial Holding Company VI, LLC | 55.66% | United States | United States | ||
Sunpower Commercial St Revolver, LLC | 55.66% | United States | United States | ||
SunPower Corp Israel Limited | 55.66% | Israel | Israel | ||
SunPower Corporation | 55.66% | United States | United States | ||
SunPower Corporation (Switzerland) S.A.R.L. | 55.66% | Switzerland | Switzerland | ||
SunPower Corporation Australia PTY Limited | 55.66% | Australia | Australia | ||
SunPower Corporation Limited | 55.66% | Hong Kong | Hong Kong | ||
SunPower Corporation Mexico, S. de R.L. de C.V. | 55.66% | Mexico | Mexico | ||
SunPower Corporation Southern Africa (PTY) Limited | 55.66% | South Africa | South Africa | ||
SunPower Corporation SPA | 55.66% | Chile | Chile | ||
SunPower Corporation UK Limited | 55.66% | United Kingdom | United Kingdom | ||
SunPower Corporation, Systems | 55.66% | United States | United States | ||
SunPower DevCo, LLC | 55.66% | United States | United States | ||
SunPower Development Company | 55.66% | United States | United States | ||
SunPower Energ’a SPA | 55.66% | Chile | Chile | ||
SunPower Energy Corporation Limited | 55.66% | Hong Kong | United States | ||
SunPower Energy Solutions France S.A.S. | 55.66% | France | France | ||
SunPower Energy Systems Canada Corporation | 55.66% | Canada | Canada | ||
SunPower Energy Systems Korea | 55.66% | South Korea | South Korea | ||
SunPower Energy Systems Singapore PTE Limited | 55.66% | Singapore | Singapore | ||
SunPower Energy Systems Southern Africa (PTY) Limited | 55.66% | South Africa | South Africa | ||
SunPower Energy Systems Spain, SL | 55.66% | Spain | Spain | ||
SunPower Engineering and Construction of Energy Production and Trade (Turkey) | 55.66% | Turkey | Turkey | ||
SunPower Foundation | 55.66% | United States | United States | ||
SunPower GmbH | 55.66% | Germany | Germany | ||
SunPower Helix I, LLC | 55.66% | United States | United States | ||
SunPower HoldCo, LLC | 55.66% | United States | United States | ||
SunPower Italia S.R.L. | 55.66% | Italy | Italy | ||
Business segment | Statutory corporate name | % Group interest | Method | Country of incorporation | Country of operations |
Gas, Renewables & Power (contd) | |||||
SunPower Japan KK | 55.66% | Japan | Japan | ||
SunPower Malaysia Manufacturing Sdn. Bhd. | 55.66% | Malaysia | Malaysia | ||
SunPower Malta Limited | 55.66% | Malta | Malta | ||
SunPower Manufacturing (PTY) Limited | 55.66% | South Africa | South Africa | ||
SunPower Manufacturing Corporation Limited | 55.66% | Hong Kong | United States | ||
SunPower Manufacturing de Vernejoul | 55.66% | France | France | ||
SunPower Muhendislik Insaat Enerji Üretim ve Ticaret A.S | 55.66% | Turkey | Turkey | ||
SunPower Nanao Parent, LLC | 55.66% | United States | United States | ||
SunPower Netherlands B.V. | 55.66% | Netherlands | Netherlands | ||
SunPower Netherlands Hold Company 1 B.V. | 55.66% | Netherlands | Netherlands | ||
SunPower Netherlands Hold Company 2 B.V. | 55.66% | Netherlands | Netherlands | ||
SunPower Netherlands Hold Company 3 B.V. | 55.66% | Netherlands | Netherlands | ||
SunPower Netherlands Hold Company 4 B.V. | 55.66% | Netherlands | Netherlands | ||
SunPower Netherlands Hold Company 5 B.V. | 55.66% | Netherlands | Netherlands | ||
SunPower Netherlands Hold Company 6 B.V. | 55.66% | Netherlands | Netherlands | ||
SunPower Netherlands Hold Company 7 B.V. | 55.66% | Netherlands | Netherlands | ||
Sunpower Netherlands Hold Company 8 B.V. | 55.66% | Netherlands | United States | ||
SunPower Netherlands Holdings B.V. | 55.66% | Netherlands | Netherlands | ||
Sunpower North America Manufacturing, LLC | 55.66% | United States | United States | ||
SunPower North America, LLC | 55.66% | United States | United States | ||
SunPower NY CDG 1, LLC | 55.66% | United States | United States | ||
SunPower Osato Parent, LLC | 55.66% | United States | United States | ||
SunPower Philippines Limited - Regional Operating Headquarters | 55.66% | Cayman Islands | Philippines | ||
SunPower Philippines Manufacturing Limited | 55.66% | Cayman Islands | Philippines | ||
SunPower Revolver HoldCo I Parent, LLC | 55.66% | United States | United States | ||
SunPower Revolver HoldCo I, LLC | 55.66% | United States | United States | ||
SunPower Solar Energy Technology (Tianjin) Corporation, Limited | 55.66% | China | China | ||
SunPower Solar India Private Limited | 55.66% | India | India | ||
SunPower Solar Malaysia Sdn. Bhd. | 55.66% | Malaysia | Malaysia | ||
SunPower Systems Belgium SPRL | 55.66% | Belgium | Belgium | ||
SunPower Systems International Limited | 55.66% | Hong Kong | United States | ||
SunPower Systems Mexico S. de R.L. de C.V. | 55.66% | Mexico | Mexico | ||
SunPower Systems S.A.R.L. | 55.66% | Switzerland | Switzerland | ||
SunPower Technologies France S.A.S. | 55.66% | France | France | ||
Sunpower Technologies, Inc. | 55.66% | United States | United States | ||
SunPower Technology Limited | 55.66% | Cayman Islands | Cayman Islands | ||
SunPower YC Holdings LLC | 55.66% | United States | United States | ||
Sunrise 3, LLC | 55.66% | United States | United States | ||
Sunstrong Capital Holdings, LLC | 55.66% | E | United States | United States | |
Sunzil | 50.00% | E | France | France | |
Sunzil Caraibes | 50.00% | E | France | France | |
Sunzil Mayotte S.A.S. | 50.00% | E | France | France | |
Sunzil Ocean Indien | 50.00% | E | France | France | |
Sunzil Pacific | 50.00% | E | France | France | |
Sunzil Polynésie | 50.00% | E | France | France | |
Sunzil Polynésie Services | 50.00% | E | France | France | |
Sunzil Services Caraibes | 50.00% | E | France | France | |
Sunzil Services Ocean Indien | 50.00% | E | France | France | |
Swingletree Operations, LLC | 55.66% | United States | United States | ||
Tadiran Batteries GmbH | 100.00% | Germany | Germany | ||
Tadiran Batteries Limited | 100.00% | Israel | Israel | ||
TEMASOL | 55.66% | Morocco | Morocco | ||
Tenesol Venezuela | 55.66% | Venezuela | Venezuela | ||
Thezan Solar | 100.00% | France | France | ||
Toitures Capiscol | 100.00% | France | France | ||
Torimode (PTY) Limited | 55.66% | South Africa | South Africa | ||
Toriprox (PTY) Limited | 55.66% | South Africa | South Africa | ||
Torisol (PTY) Limited | 55.66% | South Africa | South Africa | ||
Total Abengoa Solar Emirates Investment Company B.V. | 50.00% | E | Netherlands | United Arab Emirates | |
Business segment | Statutory corporate name | % Group interest | Method | Country of incorporation | Country of operations |
Gas, Renewables & Power (contd) | |||||
Total Energie Do Brasil | 55.66% | Brazil | Brazil | ||
Total Energie Gas GmbH | 100.00% | Germany | Germany | ||
Total Énergie Gaz | 100.00% | France | France | ||
Total ENERGY SERVICES | 100.00% | France | France | ||
Total Energy Ventures Europe | 100.00% | France | France | ||
Total Energy Ventures International | 100.00% | France | France | ||
Total Eren Holding | 33.86% | E | France | France | |
Total Gas & Power Actifs Industriels | 100.00% | France | France | ||
Total Gas & Power Asia Private Limited | 100.00% | Singapore | Singapore | ||
Total Gas & Power Brazil | 100.00% | France | France | ||
Total Gas & Power Chartering Limited | 100.00% | United Kingdom | United Kingdom | ||
Total Gas & Power Limited | 100.00% | United Kingdom | United Kingdom | ||
Total Gas & Power North America Inc. | 100.00% | United States | United States | ||
Total Gas & Power Services Limited | 100.00% | United Kingdom | United Kingdom | ||
Total Gas & Power Thailand | 100.00% | France | France | ||
Total Gas Pipeline USA Inc. | 100.00% | United States | United States | ||
Total Gas Y Electricidad Argentina S.A. | 100.00% | Argentina | Argentina | ||
Total Gasandes | 100.00% | France | France | ||
Total Gaz Electricité Holdings France | 100.00% | France | France | ||
Total Midstream Holdings UK Limited | 100.00% | United Kingdom | United Kingdom | ||
Total New Energies Limited | 100.00% | United Kingdom | United Kingdom | ||
Total New Energies Ventures USA, Inc. | 100.00% | United States | United States | ||
Total Solar | 100.00% | France | France | ||
Total Solar International | 100.00% | France | France | ||
Total Solar Latin America SPA | 100.00% | Chile | Chile | ||
Total Spring France | 100.00% | France | France | ||
Total SunPower Energia S.A. | 55.66% | Chile | Chile | ||
Total Tractebel Emirates O & M Company | 50.00% | E | France | United Arab Emirates | |
Total Tractebel Emirates Power Company | 50.00% | E | France | United Arab Emirates | |
Toul Power | 100.00% | France | France | ||
Transportadora de Gas del Mercosur S.A. | 32.68% | E | Argentina | Argentina | |
Valorene | 66.00% | France | France | ||
Vandenberg Solar I, LLC | 55.66% | United States | United States | ||
Vega Solar 1 S.A.P.I. de C.V. | 55.66% | Mexico | United States | ||
Vega Solar 2 S.A.P.I. de C.V. | 55.66% | Mexico | United States | ||
Vega Solar 3 S.A.P.I. de C.V. | 55.66% | Mexico | United States | ||
Vega Solar 4 S.A.P.I. de C.V. | 55.66% | Mexico | United States | ||
Vega Solar 5 S.A.P.I. de C.V. | 55.66% | Mexico | United States | ||
Vent De Thierache 01 | 51.00% | France | France | ||
Vent De Thierache 02 | 51.00% | France | France | ||
Vent De Thierache 03 | 100.00% | France | France | ||
Vents D’Oc Centrale D’Energie Renouvelable 18 | 100.00% | France | France | ||
Vertigo | 25.00% | E | France | France | |
Whippletree Solar, LLC | 55.66% | United States | United States | ||
White Wolf Solar, LLC | 55.66% | United States | United States | ||
Wood Draw Solar LLC | 55.66% | United States | United States | ||
Yfrégie | 100.00% | France | France | ||
Zeeland Solar B.V. | 100.00% | Netherlands | Netherlands | ||
Refining & Chemicals | |||||
Appryl S.N.C | 50.00% | France | France | ||
Atlantic Trading and Marketing Financial Inc. | 100.00% | United States | United States | ||
Atlantic Trading and Marketing Inc. | 100.00% | United States | United States | ||
Balzatex S.A.S. | 100.00% | France | France | ||
Barry Controls Aerospace S.N.C. | 100.00% | France | France | ||
BASF Total Petrochemicals LLC | 40.00% | United States | United States | ||
Bay Junction Inc. | 100.00% | United States | United States | ||
Bayport Polymers LLC | 50.00% | E | United States | United States | |
Bayport Polymers LLC | 100.00% | United States | United States | ||
Borrachas Portalegre Ltda | 100.00% | Portugal | Portugal | ||
BOU Verwaltungs GmbH | 100.00% | Germany | Germany | ||
Buckeye Products Pileline LP | 14.66% | E | United States | United States | |
Business segment | Statutory corporate name | % Group interest | Method | Country of incorporation | Country of operations |
Refining & Chemicals (contd) | |||||
Catelsa-Caceres S.A.U. | 100.00% | Spain | Spain | ||
Cie Tunisienne du Caoutchouc S.A.R.L. | 100.00% | Tunisia | Tunisia | ||
Composite Industrie Maroc S.A.R.L. | 100.00% | Morocco | Morocco | ||
Composite Industrie S.A. | 100.00% | France | France | ||
Cosden, LLC | 100.00% | United States | United States | ||
COS-MAR Company | 50.00% | United States | United States | ||
Cray Valley (Guangzhou) Chemical Company, Limited | 100.00% | China | China | ||
Cray Valley Czech | 100.00% | Czech Republic | Czech Republic | ||
Cray Valley HSC Asia Limited | 100.00% | China | China | ||
Cray Valley Italia S.R.L. | 100.00% | Italy | Italy | ||
Cray Valley S.A. | 100.00% | France | France | ||
CSSA - Chartering and Shipping Services S.A. | 100.00% | Switzerland | Switzerland | ||
Espa S.A.R.L. | 100.00% | France | France | ||
Ethylène Est | 99.98% | France | France | ||
Feluy Immobati | 100.00% | Belgium | Belgium | ||
FINA Technology, Inc. | 100.00% | United States | United States | ||
FPL Enterprises, Inc. | 100.00% | United States | United States | ||
Gasket (Suzhou) Valve Components Company, Limited | 100.00% | China | China | ||
Gasket International SPA | 100.00% | Italy | Italy | ||
Grande Paroisse S.A. | 100.00% | France | France | ||
Gulf Coast Pipeline LP | 14.66% | E | United States | United States | |
Hanwha Total Petrochemical Co. Limited | 50.00% | E | South Korea | South Korea | |
HBA Hutchinson Brasil Automotive Ltda | 100.00% | Brazil | Brazil | ||
Hutchinson (UK) Limited | 100.00% | United Kingdom | United Kingdom | ||
Hutchinson (Wuhan) Automotive Rubber Products Company Limited | 100.00% | China | China | ||
Hutchinson Aéronautique & Industrie Limited | 100.00% | Canada | Canada | ||
Hutchinson Aeroservices S.A.S. | 100.00% | France | France | ||
Hutchinson Aerospace & Industry Inc. | 100.00% | United States | United States | ||
Hutchinson Aerospace GmbH | 100.00% | Germany | Germany | ||
Hutchinson Aftermarket USA Inc. | 100.00% | United States | United States | ||
Hutchinson Antivibration Systems Inc. | 100.00% | United States | United States | ||
Hutchinson Automotive Systems Company, Limited | 100.00% | China | China | ||
Hutchinson Autopartes Mexico S.A. de C.V. | 100.00% | Mexico | Mexico | ||
Hutchinson Borrachas de Portugal Ltda | 100.00% | Portugal | Portugal | ||
Hutchinson Corporation | 100.00% | United States | United States | ||
Hutchinson d.o.o Ruma | 100.00% | Serbia | Serbia | ||
Hutchinson Do Brasil S.A. | 100.00% | Brazil | Brazil | ||
Hutchinson Fluid Management Systems Inc. | 100.00% | United States | United States | ||
Hutchinson GmbH | 100.00% | Germany | Germany | ||
Hutchinson Holding GmbH | 100.00% | Germany | Germany | ||
Hutchinson Holdings UK Limited | 100.00% | United Kingdom | United Kingdom | ||
Hutchinson Iberia S.A. | 100.00% | Spain | Spain | ||
Hutchinson Industrial Rubber Products (Suzhou) Company, Limited | 100.00% | China | China | ||
Hutchinson Industrias Del Caucho SAU | 100.00% | Spain | Spain | ||
Hutchinson Industries Inc. | 100.00% | United States | United States | ||
Hutchinson Japan Company Limited | 100.00% | Japan | Japan | ||
Hutchinson Korea Limited | 100.00% | South Korea | South Korea | ||
Hutchinson Maroc S.A.R.L. AU | 100.00% | Morocco | Morocco | ||
Hutchinson Palamos | 100.00% | Spain | Spain | ||
Hutchinson Poland SP ZO.O. | 100.00% | Poland | Poland | ||
Hutchinson Polymers S.N.C. | 100.00% | France | France | ||
Hutchinson Porto Tubos Flexiveis Ltda | 100.00% | Portugal | Portugal | ||
Hutchinson Precision Sealing Systems Inc. | 100.00% | United States | United States | ||
Hutchinson Rubber Products Private Limited Inde | 100.00% | France | India | ||
Hutchinson S.A. | 100.00% | France | France | ||
Hutchinson S.N.C. | 100.00% | France | France | ||
Hutchinson S.R.L. (Italie) | 100.00% | Italy | Italy | ||
Hutchinson S.R.L. (Roumanie) | 100.00% | Romania | Romania | ||
Hutchinson Sales Corporation | 100.00% | United States | United States | ||
Business segment | Statutory corporate name | % Group interest | Method | Country of incorporation | Country of operations |
Refining & Chemicals (contd) | |||||
Hutchinson Seal De Mexico S.A. de CV. | 100.00% | Mexico | Mexico | ||
Hutchinson Sealing Systems Inc. | 100.00% | United States | United States | ||
Hutchinson SRO | 100.00% | Czech Republic | Czech Republic | ||
Hutchinson Stop - Choc GmbH & CO. KG | 100.00% | Germany | Germany | ||
Hutchinson Suisse S.A. | 100.00% | Switzerland | Switzerland | ||
Hutchinson Transferencia de Fluidos S.A. de C.V. | 100.00% | Mexico | Mexico | ||
Hutchinson Tunisie S.A.R.L. | 100.00% | Tunisia | Tunisia | ||
Hutchinson Vietnam Company Limited | 100.00% | Vietnam | Vietnam | ||
Industrias Tecnicas De La Espuma SL | 100.00% | Spain | Spain | ||
Industrielle Desmarquoy S.N.C. | 100.00% | France | France | ||
Jéhier S.A.S. | 99.89% | France | France | ||
JPR S.A.S. | 100.00% | France | France | ||
KTN Kunststofftechnik Nobitz GmbH | 100.00% | Germany | Germany | ||
Laffan Refinery Company Limited | 10.00% | E | Qatar | Qatar | |
Laffan Refinery Company Limited 2 | 10.00% | E | Qatar | Qatar | |
LaPorte Pipeline Company LP | 20.16% | E | United States | United States | |
LaPorte Pipeline GP LLC | 19.96% | E | United States | United States | |
Le Joint Francais S.N.C. | 100.00% | France | France | ||
Legacy Site Services LLC | 100.00% | United States | United States | ||
Les Stratifiés S.A.S. | 100.00% | France | France | ||
Lone Wolf Land Company | 100.00% | United States | United States | ||
LSS Funding Inc. | 100.00% | United States | United States | ||
Machen Land Limited | 100.00% | United Kingdom | United Kingdom | ||
Mapa - Spontex Inc. | 100.00% | United States | United States | ||
Naphtachimie | 50.00% | France | France | ||
Novogy, Inc. | 100.00% | United States | United States | ||
Olutex Oberlausitzer Luftfahrttextilien GmbH | 100.00% | Germany | Germany | ||
Pamargan (Malta) Products Limited | 100.00% | Malta | Malta | ||
Pamargan Products Limited | 100.00% | United Kingdom | United Kingdom | ||
Paulstra S.N.C. | 100.00% | France | France | ||
Paulstra Silentbloc S.A. | 100.00% | Belgium | Belgium | ||
Polyblend GmbH | 68.00% | Germany | Germany | ||
Qatar Petrochemical Company Q.S.C. (QAPCO) | 20.00% | E | Qatar | Qatar | |
Qatofin Company Limited | 49.09% | E | Qatar | Qatar | |
Résilium | 100.00% | Belgium | Belgium | ||
Retia | 100.00% | France | France | ||
Retia USA LLC | 100.00% | United States | United States | ||
San Jacinto Rail Limited | 17.00% | E | United States | United States | |
Saudi Aramco Total Refining & Petrochemical Company | 37.50% | E | Saoudia Arabia | Saoudia Arabia | |
Sealants Europe | 34.00% | E | France | France | |
SigmaKalon Group B.V. | 100.00% | Netherlands | Netherlands | ||
Société Béarnaise De Gestion Industrielle | 100.00% | France | France | ||
Société du Pipeline Sud-Européen | 35.14% | E | France | France | |
Stillman Seal Corporation | 100.00% | United States | United States | ||
Stop-Choc (UK) Limited | 100.00% | United Kingdom | United Kingdom | ||
Techlam S.A.S. | 100.00% | France | France | ||
Total Activités Maritimes | 100.00% | France | France | ||
Total Corbion PLA B.V. | 50.00% | E | Netherlands | Netherlands | |
Total Deutschland GmbH (c) | 100.00% | Germany | Germany | ||
Total Downstream UK PLC | 100.00% | United Kingdom | United Kingdom | ||
Total Energy Marketing A/S | 100.00% | Denmark | Denmark | ||
Total European Trading | 100.00% | France | France | ||
Total Laffan Refinery | 100.00% | France | France | ||
Total Laffan Refinery II B.V. | 100.00% | Netherlands | Netherlands | ||
Total Lindsey Oil Refinery Limited | 100.00% | United Kingdom | United Kingdom | ||
Total New Energies USA, Inc. | 100.00% | United States | United States | ||
Total Olefins Antwerp | 100.00% | Belgium | Belgium | ||
Total Opslag En Pijpleiding Nederland NV | 100.00% | Netherlands | Netherlands | ||
Total PAR LLC | 100.00% | United States | United States | ||
Total Petrochemicals (China) Trading Company, Limited | 100.00% | China | China | ||
Business segment | Statutory corporate name | % Group interest | Method | Country of incorporation | Country of operations |
Refining & Chemicals (contd) | |||||
Total Petrochemicals (Foshan) Limited | 100.00% | China | China | ||
Total Petrochemicals (Hong Kong) Limited | 100.00% | Hong Kong | Hong Kong | ||
Total Petrochemicals (Ningbo) Limited | 100.00% | China | China | ||
Total Petrochemicals (Shangai) Limited | 100.00% | China | China | ||
Total Petrochemicals Development Feluy | 100.00% | Belgium | Belgium | ||
Total Petrochemicals Ecaussinnes | 100.00% | Belgium | Belgium | ||
Total Petrochemicals Feluy | 100.00% | Belgium | Belgium | ||
Total Petrochemicals France | 100.00% | France | France | ||
Total Petrochemicals Iberica | 100.00% | Spain | Spain | ||
Total Petrochemicals Pipeline USA Inc. | 100.00% | United States | United States | ||
Total Petrochemicals UK Limited | 100.00% | United Kingdom | United Kingdom | ||
Total Polymers Antwerp | 100.00% | Belgium | Belgium | ||
Total Raffinaderij Antwerpen N.V. | 100.00% | Belgium | Belgium | ||
Total Raffinage France | 100.00% | France | France | ||
Total Raffinerie Mitteldeutschland GmbH | 100.00% | Germany | Germany | ||
Total Refining & Chemicals | 100.00% | France | France | ||
Total Refining & Chemicals Saudi Arabia S.A.S. | 100.00% | France | France | ||
Total Research & Technology Feluy | 100.00% | Belgium | Belgium | ||
Total Splitter USA Inc | 100.00% | United States | United States | ||
Total Trading and Marketing Canada LP | 100.00% | Canada | Canada | ||
Total Trading Asia Pte Limited | 100.00% | Singapore | Singapore | ||
Total Trading Canada Limited | 100.00% | Canada | Canada | ||
Total Trading Products S.A. | 100.00% | Switzerland | Switzerland | ||
TOTSA Total Oil Trading S.A. | 100.00% | Switzerland | Switzerland | ||
Totseanergy | 49.00% | E | Belgium | Belgium | |
Transalpes S.N.C. | 67.00% | France | France | ||
Trans-Ethylène | 99.98% | France | France | ||
Tssa Total Storage & Services S.A. | 100.00% | Switzerland | Switzerland | ||
Vibrachoc SAU | 100.00% | Spain | Spain | ||
Zeeland Refinery NV | 55.00% | Netherlands | Netherlands | ||
Marketing & Services | |||||
Air Total (Suisse) S.A. | 100.00% | Switzerland | Switzerland | ||
Air Total International S.A. | 100.00% | Switzerland | Switzerland | ||
Alvea | 100.00% | France | France | ||
Antilles Gaz | 100.00% | France | France | ||
Argedis | 100.00% | France | France | ||
Aristea | 51.00% | E | Belgium | Belgium | |
Arteco | 49.99% | E | Belgium | Belgium | |
AS 24 | 100.00% | France | France | ||
AS 24 Tankservice GmbH | 100.00% | Germany | Germany | ||
AS24 Belgie N.V. | 100.00% | Belgium | Belgium | ||
AS24 Espanola S.A. | 100.00% | Spain | Spain | ||
AS24 Fuel Cards Limited | 100.00% | United Kingdom | United Kingdom | ||
AS24 Polska SP ZO.O. | 100.00% | Poland | Poland | ||
Caldeo | 100.00% | France | France | ||
Charvet La Mure Bianco | 100.00% | France | France | ||
Clean Energy | 25.00% | E | United States | United States | |
Compagnie Pétrolière de l’Ouest - CPO | 100.00% | France | France | ||
CPE Énergies | 100.00% | France | France | ||
Cristal Marketing Egypt | 80.78% | Egypt | Egypt | ||
DCA-MORY-SHIPP | 100.00% | France | France | ||
Egedis | 100.00% | France | France | ||
Elf Oil UK Aviation Limited | 100.00% | United Kingdom | United Kingdom | ||
Elf Oil UK Properties Limited | 100.00% | United Kingdom | United Kingdom | ||
Fioulmarket.fr | 100.00% | France | France | ||
Gapco Kenya Limited | 100.00% | Kenya | Kenya | ||
Gapco Tanzania Limited | 100.00% | Tanzania | Tanzania | ||
Gapco Uganda Limited | 100.00% | Uganda | Uganda | ||
Guangzhou Elf Lubricants Company Limited | 77.00% | China | China | ||
Gulf Africa Petroleum Corporation | 100.00% | Mauritius | Mauritius | ||
Lubricants Vietnam Holding Limited | 100.00% | Hong Kong | Hong Kong | ||
Business segment | Statutory corporate name | % Group interest | Method | Country of incorporation | Country of operations |
Marketing & Services (contd) | |||||
National Petroleum Refiners Of South Africa (PTY) Limited | 18.22% | E | South Africa | South Africa | |
Pitpoint B.V. | 100.00% | Netherlands | Netherlands | ||
Pitpoint Cng B.V. | 100.00% | Netherlands | Netherlands | ||
Produits Pétroliers Stela | 99.99% | France | France | ||
Quimica Vasca S.A. Unipersonal | 100.00% | Spain | Spain | ||
Saudi Total Petroleum Products | 51.00% | E | Saoudia Arabia | Saoudia Arabia | |
Servauto Nederland B.V. | 100.00% | Netherlands | Netherlands | ||
Société des transports pétroliers par pipeline | 35.50% | E | France | France | |
Société d’exploitation de l’usine de Rouen | 98.98% | France | France | ||
Société mahoraise de stockage de produits pétroliers | 100.00% | France | France | ||
Société Urbaine des Pétroles | 100.00% | France | France | ||
S-Oil Total Lubricants Company Limited | 50.00% | E | South Korea | South Korea | |
South Asia LPG Private Limited | 50.00% | E | India | India | |
Total (Africa) Limited | 100.00% | United Kingdom | United Kingdom | ||
Total (Fiji) Limited | 100.00% | Fiji Islands | Fiji Islands | ||
Total Additifs et Carburants Spéciaux | 100.00% | France | France | ||
Total Africa S.A. | 100.00% | France | France | ||
Total Aviation & Export Limited | 100.00% | Zambia | Zambia | ||
Total Belgium | 100.00% | Belgium | Belgium | ||
Total Bitumen Deutschland GmbH | 100.00% | Germany | Germany | ||
Total Bitumen UK Limited | 100.00% | United Kingdom | United Kingdom | ||
Total Botswana (PTY) Limited | 50.10% | Botswana | Botswana | ||
Total Burkina | 100.00% | Burkina Faso | Burkina Faso | ||
Total Cambodge | 100.00% | Cambodia | Cambodia | ||
Total Cameroun | 67.01% | Cameroon | Cameroon | ||
Total Caraïbes | 100.00% | France | France | ||
Total Ceska Republika S.R.O. | 100.00% | Czech Republic | Czech Republic | ||
Total China Investment Company Limited | 100.00% | China | China | ||
Total Congo | 100.00% | Republic of the Congo | Republic of the Congo | ||
Total Corse | 100.00% | France | France | ||
Total Côte D’Ivoire | 72.99% | Côte d’Ivoire | Côte d’Ivoire | ||
Total Denmark A/S | 100.00% | Denmark | Denmark | ||
Total Egypt | 80.78% | Egypt | Egypt | ||
Total España S.A. | 100.00% | Spain | Spain | ||
Total Especialidades Argentina | 98.78% | Argentina | Argentina | ||
Total Ethiopia | 100.00% | Ethiopia | Ethiopia | ||
Total Fluides | 100.00% | France | France | ||
Total Freeport Corporation | 51.00% | E | Philippines | Philippines | |
Total Fuels Wuhan Company Limited | 100.00% | China | China | ||
Total Glass Lubricants Europe GmbH | 100.00% | Germany | Germany | ||
Total Guadeloupe | 100.00% | France | France | ||
Total Guinea Ecuatorial | 70.00% | Equatorial Guinea | Equatorial Guinea | ||
Total Guinée | 100.00% | Guinea | Guinea | ||
Total Holding Asie | 100.00% | France | France | ||
Total Holding India | 100.00% | France | France | ||
Total Italia | 100.00% | Italy | Italy | ||
Total Jamaica Limited | 100.00% | Jamaica | Jamaica | ||
Total Jordan PSC | 100.00% | Jordan | Jordan | ||
Total Kenya | 93.96% | Kenya | Kenya | ||
Total Liban | 100.00% | Lebanon | Lebanon | ||
Total Liberia Inc. | 100.00% | Liberia | Liberia | ||
Total Lubricants (China) Company Limited | 77.00% | China | China | ||
Total Lubricants Taiwan Limited | 63.00% | Taiwan | Taiwan | ||
Total Lubrifiants | 99.98% | France | France | ||
Total Lubrifiants Algérie | 78.90% | Algeria | Algeria | ||
Total Lubrifiants Service Automobile | 99.98% | France | France | ||
Total Luxembourg S.A. | 100.00% | Luxembourg | Luxembourg | ||
Total Madagasikara S.A. | 79.44% | Madagascar | Madagascar | ||
Total Mali | 100.00% | Mali | Mali | ||
Total Marine Fuels | 100.00% | Singapore | Singapore | ||
Business segment | Statutory corporate name | % Group interest | Method | Country of incorporation | Country of operations |
Marketing & Services (contd) | |||||
Total Marketing Egypt | 80.78% | Egypt | Egypt | ||
Total Marketing France | 100.00% | France | France | ||
Total Marketing Gabon | 90.00% | Gabon | Gabon | ||
Total Marketing Middle East Free Zone | 100.00% | United Arab Emirates | United Arab Emirates | ||
Total Marketing Services | 100.00% | France | France | ||
Total Marketing Tchad | 100.00% | Chad | Chad | ||
Total Marketing Uganda | 100.00% | Uganda | Uganda | ||
Total Maroc | 55.00% | Morocco | Morocco | ||
Total Mauritius | 55.00% | Mauritius | Mauritius | ||
Total Mayotte | 100.00% | France | France | ||
Total Mexico S.A. de C.V. | 100.00% | Mexico | Mexico | ||
Total Mineraloel und Chemie GmbH | 100.00% | Germany | Germany | ||
Total Mineralol GmbH | 100.00% | Germany | Germany | ||
Total Mozambique | 100.00% | Mozambique | Mozambique | ||
Total Namibia (PTY) Limited | 50.10% | Namibia | Namibia | ||
Total Nederland NV | 100.00% | Netherlands | Netherlands | ||
Total Niger S.A. | 100.00% | Niger | Niger | ||
Total Nigeria PLC | 61.72% | Nigeria | Nigeria | ||
Total Oil Asia-Pacific Pte Limited | 100.00% | Singapore | Singapore | ||
Total Oil India Private Limited | 100.00% | India | India | ||
Total Outre-Mer | 100.00% | France | France | ||
Total Pacifique | 100.00% | France | France | ||
Total Parco Pakistan Limited | 50.00% | E | Pakistan | Pakistan | |
Total Petroleum (Shanghai) Company Limited | 100.00% | China | China | ||
Total Petroleum Ghana Limited | 76.74% | Ghana | Ghana | ||
Total Petroleum Puerto Rico Corp. | 100.00% | Puerto Rico | Puerto Rico | ||
Total Philippines Corporation | 51.00% | E | Philippines | Philippines | |
Total Polska | 100.00% | Poland | Poland | ||
Total Polynésie | 99.81% | France | France | ||
Total RDC | 60.00% | Democratic Republic of Congo | Democratic Republic of Congo | ||
Total Réunion | 100.00% | France | France | ||
Total Romania S.A. | 100.00% | Romania | Romania | ||
Total Sénégal | 69.14% | Senegal | Senegal | ||
Total Singapore Shared Services Pte Limited | 100.00% | Singapore | Singapore | ||
Total Sinochem Fuels Company Limited | 49.00% | E | China | China | |
Total Sinochem Oil Company Limited | 49.00% | E | China | China | |
Total South Africa (PTY) Limited | 50.10% | South Africa | South Africa | ||
Total Specialties USA Inc. | 100.00% | United States | United States | ||
Total Supply MS S.A. | 100.00% | Switzerland | Switzerland | ||
Total Swaziland (PTY) Limited | 50.10% | Swaziland | Swaziland | ||
Total Tanzania Limited | 100.00% | Tanzania | Tanzania | ||
Total Tianjin Manufacturing Company Limited | 77.00% | China | China | ||
Total Togo | 76.72% | Togo | Togo | ||
Total Tunisie | 100.00% | Tunisia | Tunisia | ||
Total Turkey Pazarlama | 100.00% | Turkey | Turkey | ||
Total UAE LLC | 49.00% | United Arab Emirates | United Arab Emirates | ||
Total Uganda Limited | 100.00% | Uganda | Uganda | ||
Total UK Limited | 100.00% | United Kingdom | United Kingdom | ||
Total Ukraine LLC | 100.00% | Ukraine | Ukraine | ||
Total Union Océane | 100.00% | France | France | ||
Total Vietnam Limited | 100.00% | Vietnam | Vietnam | ||
Total Vostok | 100.00% | Russia | Russia | ||
Total Zambia | 100.00% | Zambia | Zambia | ||
Total Zimbabwe Limited | 80.00% | Zimbabwe | Zimbabwe | ||
Totalgaz Vietnam LLC | 100.00% | Vietnam | Vietnam | ||
Upbeatprops 100 PTY Limited | 50.10% | South Africa | South Africa | ||
V Energy S.A. | 70.00% | Dominican Republic | Dominican Republic | ||
Business segment | Statutory corporate name | % Group interest | Method | Country of incorporation | Country of operations |
Corporate | |||||
Albatros | 100.00% | France | France | ||
Elf Aquitaine | 100.00% | France | France | ||
Elf Aquitaine Fertilisants | 100.00% | France | France | ||
Elf Aquitaine Inc. | 100.00% | United States | United States | ||
Elf Forest Products LLC | 100.00% | United States | United States | ||
Etmofina | 100.00% | Belgium | Belgium | ||
Omnium Reinsurance Company S.A. | 100.00% | Switzerland | Switzerland | ||
Pan Insurance Limited | 100.00% | Ireland | Ireland | ||
Septentrion Participations | 100.00% | France | France | ||
Socap S.A.S. | 100.00% | France | France | ||
Société Civile Immobilière CB2 | 100.00% | France | France | ||
Sofax Banque | 100.00% | France | France | ||
Total American Services Inc. | 100.00% | United States | United States | ||
Total Capital | 100.00% | France | France | ||
Total Capital Canada Limited | 100.00% | Canada | Canada | ||
Total Capital International | 100.00% | France | France | ||
Total Consulting | 100.00% | France | France | ||
Total Corporate Management (Beijing) Company Limited | 100.00% | China | China | ||
Total Delaware Inc. | 100.00% | United States | United States | ||
Total Développement Régional S.A.S. | 100.00% | France | France | ||
Total Facilities Management Services (TFMS) | 100.00% | France | France | ||
Total Finance | 100.00% | France | France | ||
Total Finance Corporate Services Limited | 100.00% | United Kingdom | United Kingdom | ||
Total Finance Global Services (TOFIG) | 100.00% | Belgium | Belgium | ||
Total Finance international B.V. | 100.00% | Netherlands | Netherlands | ||
Total Finance Nederland B.V. | 100.00% | Netherlands | Netherlands | ||
Total Finance USA Inc. | 100.00% | United States | United States | ||
Total Funding Nederland B.V. | 100.00% | Netherlands | Netherlands | ||
Total Funding Nederland International B.V. | 100.00% | Netherlands | Netherlands | ||
Total Gestion Filiales | 100.00% | France | France | ||
Total Gestion USA | 100.00% | France | France | ||
Total Global Financial Services | 100.00% | France | France | ||
Total Global Human Ressources Services | 100.00% | France | France | ||
Total Global Information Technology Services Belgium | 99.98% | Belgium | Belgium | ||
Total Global IT Services (TGITS) | 100.00% | France | France | ||
Total Global Procurement (TGP) | 100.00% | France | France | ||
Total Global Procurement Belgium S.A. (TGPB) | 100.00% | Belgium | Belgium | ||
Total Global Services Bucharest | 99.01% | Romania | Romania | ||
Total Global Services Philippines | 100.00% | Philippines | Philippines | ||
Total Holding Allemagne | 100.00% | France | France | ||
Total Holdings Europe | 100.00% | France | France | ||
Total Holdings International B.V. | 100.00% | Netherlands | Netherlands | ||
Total Holdings UK Limited | 100.00% | United Kingdom | United Kingdom | ||
Total Holdings USA Inc. | 100.00% | United States | United States | ||
Total International NV | 100.00% | Netherlands | Netherlands | ||
Total Learning Solutions (TLS) | 100.00% | France | France | ||
Total Operations Canada Limited | 100.00% | Canada | Canada | ||
Total Overseas Holding (PTY) Limited | 100.00% | South Africa | Netherlands | ||
Total Participations | 100.00% | France | France | ||
Total Petrochemicals & Refining S.A./NV (c) | 100.00% | Belgium | Belgium | ||
Total Petrochemicals & Refining USA Inc. (c) | 100.00% | United States | United States | ||
Total Petrochemicals Security USA Inc. | 100.00% | United States | United States | ||
Total Resources (Canada) Limited | 100.00% | Canada | Canada | ||
Total S.A. | - | France | France | ||
Total Treasury | 100.00% | France | France | ||
Total UK Finance Limited | 100.00% | United Kingdom | United Kingdom |
* After the closing of the transaction described in the Note 2.3 of the Notes to the Consolidated Financial Statements.
(a) % of control different from % of interest: 49%.
(b) % of control different from % of interest: 20.02%.
(c) Multi-segment entities.
9
SUPPLEMENTAL OIL AND GAS INFORMATION (UNAUDITED)
9.1 Oil and gas information pursuant to FASB Accounting Standards Codification 932
Proved reserves estimates are calculated according to the Securities and Exchange Commission (SEC) Rule 4-10 of Regulation S-X set forth in the "Modernization of Oil and Gas Reporting" release (SEC Release n° 33-8995) and the Financial Accounting Standard Board (FASB) Accounting Standards Update regarding Extractive Activities - Oil and Gas (ASC 932), which provide definitions and disclosure requirements.
9.1.1 Assessment process for reserves
Reserves estimations are performed by experienced geoscientists, engineers and economists under the supervision of each affiliate’s General Management. Staff involved in reserves evaluation are trained to follow SEC-compliant internal guidelines and policies regarding criteria that must be met before reserves can be considered as proved. All of the Group’s proved reserves held in subsidiaries and equity affiliates are estimated within the affiliates of the Group with the exception of the proved reserves held by the equity affiliate PAO Novatek. The assessment of the net proved liquids and natural gas reserves of certain properties owned by PAO Novatek was completed as of December 31, 2018, in accordance with the standards applied by the Group, based on an independent third-party report from DeGolyer & MacNaughton. These independently assessed reserves account for 51% of the total net proved reserves TOTAL held in Russia as of December 31, 2018.
The technical validation process relies on a Technical Reserves Committee that is responsible for approving proved reserves variations above a certain threshold and technical evaluations of reserves associated with an investment decision that requires approval from the Exploration & Production Executive Committee. The Chairman of the Technical Reserves Committee is appointed by the Senior Management of Exploration & Production and its members have expertise in reservoir engineering, production geology, production geophysics, reserves methodology, drilling and development studies.
An internal control process related to reserves estimation is formalized and involves the following elements:
-a central Reserve Entity the responsibility of which is: to consolidate, document and archive the Group’s reserves; to ensure coherence of evaluations worldwide; to maintain the Corporate Reserves Guidelines Standards in line with SEC guidelines and policies; to deliver training on reserves evaluation and classification; and to conduct periodically in-depth technical review of reserves for each affiliate;
-an annual review of affiliates reserves conducted by an internal group of specialists selected for their expertise in geosciences and engineering and their knowledge of the affiliate. All members of this group, chaired by the Reserves Vice-President ("RVP") of the Development and Support to Operations division and composed of at least three Technical Reserves Committee members, are knowledgeable in the SEC guidelines for proved reserves evaluation. Their responsibility is to provide an independent review of reserves changes proposed by affiliates and ensure that reserves are estimated using appropriate standards and procedures;
-at the end of the annual review carried out by the Development and Support to Operations division, an SEC Reserves Committee chaired by the Exploration & Production Senior Vice President Corporate Affairs and comprised of the Development and Support to Operations, Strategy-Business Development-R&D, Finance and Legal Senior Vice Presidents as well as the Chairman of the Technical Reserves Committee and the RVP, approves the elements of the SEC reserve booking proposals concerning criteria that are not dependent upon reservoir and geosciences techniques. The results of the annual review and the proposals for including revisions or additions of SEC Proved Reserves are presented to the Exploration & Production Executive Committee for approval before final validation by the Group’s General Management and Chief Financial Officer.
The reserves evaluation and control process is audited periodically by the Group’s internal auditors.
The RVP of the Development and Support to Operations division is the technical person responsible for preparing the reserves estimates for the Group. Appointed by the President of Exploration & Production, the RVP supervises the Reserve Entity, chairs the annual review of reserves, and is a member of the Technical Reserves Committee and the SEC Reserves Committee. The current RVP has over 20 years of experience in the oil and gas industry. He previously held several management positions in the Group in reservoir engineering and geosciences, and in the field of reserves evaluation and control process. He holds an engineering degree from École Centrale Paris, France, and a petroleum engineering degree from École Nationale Supérieure du Pétrole et des Moteurs (IFP School), France. He is a member of the UNECE (United Nations Economic Commission for Europe) Expert Group on Resource Classification, and an active member of the Society of Petroleum Engineers.
9.1.2 Proved developed reserves
As of December 31, 2018, proved developed reserves of hydrocarbons (oil, bitumen and gas) were 8,400 Mboe and represented 70% of the proved reserves. As of December 31, 2017, proved developed reserves of hydrocarbons (oil, bitumen and gas) were 7,010 Mboe and represented 61% of the proved reserves. As of December 31, 2016, proved developed reserves of hydrocarbons (oil, bitumen and gas) were 6,667 Mboe and represented 58% of the proved reserves. Over the past three years, the average of proved developed reserves renewal has remained well above 1,300 Mboe per year.
9.1.3 Proved undeveloped reserves
As of December 31, 2018, TOTAL’s combined proved undeveloped reserves (PUDs) of oil and gas were 3,650 Mboe compared to 4,465 Mboe at the end of 2017.
The variation is due to (i) -1247 Mboe converted from PUDs to proved developed reserves; (ii) +72 Mboe of revisions of previous estimates; (iii) -136 Mboe of divestitures. Variations of PUDs not included in opening balance correspond to +178 Mboe related to extensions and discoveries, +359 Mboe from acquisitions and -40 Mboe converted from PUDs to proved developed reserves.
In 2018, 910 Mboe of PUDs were converted to proved developed through the start up of production of Timimoun (Algeria), Kaombo Norte (Angola), Ichthys (Australia), Forth Hills (Canada), and Egina (Nigeria); 377 Mboe correspond to conversions of PUDs to developed reserves on other fields. These developments confirm once again the Group’s ability to develop and bring into production similar large scale and complex projects.
In 2018, the cost incurred to develop proved undeveloped reserves (PUDs) was $8.8 billion, which represented 87% of 2018 development costs incurred, and was related to projects located for the most part in Angola, Nigeria, Australia, Norway, Canada, Brazil, the United Arab Emirates and the United States.
The variations of PUDs due to acquisitions and divestitures consist mainly of the acquisition of Maersk Oil assets in Norway (Johan Sverdrup) and United Kingdom (Culzean), the acquisition of new assets in Brazil and the sales of 51% of Martin Linge.
The Group’s PUDs that may remain undeveloped for five years or more after first disclosure (PUD5+) correspond to the remaining PUD on large scale and complex development projects and to field development projects for which planning is controlled by capacity constrains. Indeed, although the Group has converted significant amount of reserves associated to large scale and complex projects from PUD5+ into developed reserves in 2018, those projects still hold PUD5+ that are expected to be developed over time as part of initial field development plans or additional development phases.
In addition, some projects are designed and optimized for a given production capacity that controls the pace at which the field is developed and the wells are drilled. At production start-up, only a portion of the proved reserves is developed in order to deliver sufficient production potential to meet capacity constraints and contractual obligations.
Under these specific circumstances, the Group believes that it is justified to report those PUDs as proved reserves, despite the fact that some of these PUDs may remain undeveloped for more than five years.
9.1.4 Estimated proved reserves of oil, bitumen and gas
The following tables present, for oil, bitumen and gas reserves, an estimate of the Group’s oil, bitumen and gas quantities by geographic areas as of December 31, 2018, 2017 and 2016.
Quantities shown correspond to proved developed and undeveloped reserves together with changes in quantities for 2018, 2017 and 2016.
The definitions used for proved, proved developed and proved undeveloped oil and gas reserves are in accordance with the revised Rule 4-10 of SEC Regulation S-X.
All references in the following tables to reserves or production are to the Group’s entire share of such reserves or production. TOTAL’s worldwide proved reserves include the proved reserves of its consolidated subsidiaries as well as its proportionate share of the proved reserves of equity affiliates.
Significant changes in proved reserves between 2017 and 2018 are discussed below.
For consolidated subsidiaries, the revisions of +450 Mboe for the year 2018 were due to:
-+438 Mboe due to new information obtained from drilling and production history mainly in the United Arab Emirates, the United Kingdom and Angola;
-+29 Mboe due to economic factors as a result of higher yearly average hydrocarbon prices, including a delayed economic limit on a number of assets, partly compensated by lower entitlement share from production sharing and risked service contracts; and
--17 Mboe due to other revisions.
The acquisitions in Europe and Central Asia, and in Middle East and North Africa, correspond mainly to the acquired Maersk Oil assets in the United Kingdom, Norway, Denmark and Algeria.
The acquisitions in the Americas correspond mainly to new assets in Brazil.
The sales in Europe and Central Asia correspond mainly to the sale in Norway.
The sales in Asia-Pacific correspond to decrease in interest in Australia.
The extensions in Europe and Central Asia correspond mainly to recognition of reserves in Denmark, posterior to the acquisition of Maersk Oil.
The extensions in Middle East and North Africa correspond mainly to recognition of reserves in the United Arab Emirates and Algeria.
For equity affiliates, the revisions of +187 Mboe for the year 2018 were mainly due to new information obtained from drilling and production history in Russia.
The acquisitions in Russia correspond to the acquisition by Novatek of GeoTransGas and the increased interest in Novatek’s share capital.
9.1.4.1 Changes in oil, bitumen and gas reserves
Proved developed and undeveloped reserves (in million barrels of oil equivalent) | Consolidated subsidiaries | ||||||
Europe and Central Asia (excl. Russia) | Russia | Africa (excl. North Africa) | Middle East and North Africa | Americas | Asia- Pacific | Total | |
BALANCE AS OF DECEMBER 31, 2015 - BRENT AT 54.17 $/b | 1,812 | 25 | 2,020 | 1,309 | 1,799 | 1,025 | 7,990 |
Revisions of previous estimates | 49 | 1 | 1 | 232 | (234) | 39 | 88 |
Extensions, discoveries and other | 47 | - | 11 | 5 | 33 | 15 | 111 |
Acquisitions of reserves in place | - | - | - | - | 152 | - | 152 |
Sales of reserves in place | (27) | (13) | - | - | (21) | - | (61) |
Production for the year | (155) | (2) | (230) | (104) | (90) | (97) | (678) |
BALANCE AS OF DECEMBER 31, 2016 - BRENT AT 42.82 $/b | 1,726 | 11 | 1,802 | 1,442 | 1,639 | 982 | 7,602 |
Revisions of previous estimates | 122 | 2 | 106 | 50 | 195 | 44 | 519 |
Extensions, discoveries and other | - | - | 29 | 62 | 149 | 6 | 246 |
Acquisitions of reserves in place | 9 | - | 2 | - | - | - | 11 |
Sales of reserves in place | (17) | - | (28) | - | (52) | - | (97) |
Production for the year | (162) | (2) | (232) | (104) | (115) | (89) | (704) |
BALANCE AS OF DECEMBER 31, 2017 - BRENT AT 54.36 $/b | 1,678 | 11 | 1,679 | 1,450 | 1,816 | 943 | 7,577 |
Revisions of previous estimates | 126 | - | 132 | 137 | 28 | 27 | 450 |
Extensions, discoveries and other | 69 | - | 45 | 444 | 27 | 13 | 598 |
Acquisitions of reserves in place | 316 | - | - | 85 | 86 | - | 487 |
Sales of reserves in place | (103) | - | (5) | - | (24) | (89) | (221) |
Production for the year | (190) | (1) | (238) | (154) | (134) | (51) | (768) |
BALANCE AS OF DECEMBER 31, 2018 - BRENT AT 71.43 $/b | 1,896 | 10 | 1,613 | 1,962 | 1,799 | 843 | 8,123 |
Minority interest in proved developed and undeveloped reserves as of | |||||||
December 31, 2016 - Brent at 42.82 $/b | - | - | 105 | - | - | - | 105 |
December 31, 2017 - Brent at 54.36 $/b | - | - | 102 | - | - | - | 102 |
DECEMBER 31, 2018 - BRENT AT 71.43 $/b | - | - | 98 | - | - | - | 98 |
Proved developed and undeveloped reserves (in million barrels of oil equivalent) | Equity affiliates | ||||||
Europe and Central Asia (excl. Russia) | Russia | Africa (excl. North Africa) | Middle East and North Africa | Americas | Asia- Pacific | Total | |
BALANCE AS OF DECEMBER 31, 2015 - BRENT AT 54.17 $/b | - | 2,220 | 71 | 1,121 | 178 | - | 3,590 |
Revisions of previous estimates | - | 16 | - | 68 | (1) | - | 83 |
Extensions, discoveries and other | - | 331 | - | - | - | - | 331 |
Acquisitions of reserves in place | - | - | - | 190 | - | - | 190 |
Sales of reserves in place | - | (59) | - | - | - | - | (59) |
Production for the year | - | (119) | (1) | (87) | (12) | - | (219) |
BALANCE AS OF DECEMBER 31, 2016 - BRENT AT 42.82 $/b | - | 2,389 | 70 | 1,292 | 165 | - | 3,916 |
Revisions of previous estimates | - | 17 | - | 45 | (6) | - | 56 |
Extensions, discoveries and other | - | 124 | - | - | - | - | 124 |
Acquisitions of reserves in place | - | 35 | - | - | - | - | 35 |
Sales of reserves in place | - | - | - | - | - | - | - |
Production for the year | - | (114) | (7) | (100) | (12) | - | (233) |
BALANCE AS OF DECEMBER 31, 2017 - BRENT AT 54.36 $/b | - | 2,451 | 63 | 1,237 | 147 | - | 3,898 |
Revisions of previous estimates | - | 128 | (1) | 61 | (1) | - | 187 |
Extensions, discoveries and other | - | 11 | - | - | - | - | 11 |
Acquisitions of reserves in place | - | 102 | - | - | - | - | 102 |
Sales of reserves in place | - | (26) | - | - | - | - | (26) |
Production for the year | - | (141) | (7) | (89) | (8) | - | (245) |
BALANCE AS OF DECEMBER 31, 2018 - BRENT AT 71.43 $/b | - | 2,525 | 55 | 1,209 | 138 | - | 3,927 |
Proved developed and undeveloped reserves (in million barrels of oil equivalent) | Consolidated subsidiaries and equity affiliates | ||||||
Europe and Central Asia (excl. Russia) | Russia | Africa (excl. North Africa) | Middle East and North Africa | Americas | Asia- Pacific | Total | |
AS OF DECEMBER 31, 2016 - BRENT AT 42.82 $/b | |||||||
Proved developed and undeveloped reserves | 1,726 | 2,400 | 1,872 | 2,734 | 1,804 | 982 | 11,518 |
Consolidated subsidiaries | 1,726 | 11 | 1,802 | 1,442 | 1,639 | 982 | 7,602 |
Equity affiliates | - | 2,389 | 70 | 1,292 | 165 | - | 3,916 |
Proved developed reserves | 1,025 | 1,017 | 1,141 | 2,281 | 979 | 224 | 6,667 |
Consolidated subsidiaries | 1,025 | 7 | 1,132 | 1,158 | 897 | 224 | 4,443 |
Equity affiliates | - | 1,010 | 9 | 1,123 | 82 | - | 2,224 |
Proved undeveloped reserves | 701 | 1,383 | 731 | 453 | 825 | 758 | 4,851 |
Consolidated subsidiaries | 701 | 4 | 670 | 284 | 742 | 758 | 3,159 |
Equity affiliates | - | 1,379 | 61 | 169 | 83 | - | 1,692 |
AS OF DECEMBER 31, 2017 - BRENT AT 54.36 $/b | |||||||
Proved developed and undeveloped reserves | 1,678 | 2,462 | 1,742 | 2,687 | 1,963 | 943 | 11,475 |
Consolidated subsidiaries | 1,678 | 11 | 1,679 | 1,450 | 1,816 | 943 | 7,577 |
Equity affiliates | - | 2,451 | 63 | 1,237 | 147 | - | 3,898 |
Proved developed reserves | 1,100 | 1,344 | 1,206 | 2,256 | 907 | 197 | 7,010 |
Consolidated subsidiaries | 1,100 | 8 | 1,192 | 1,177 | 836 | 197 | 4,510 |
Equity affiliates | - | 1,336 | 14 | 1,079 | 71 | - | 2,500 |
Proved undeveloped reserves | 578 | 1,118 | 536 | 431 | 1,056 | 746 | 4,465 |
Consolidated subsidiaries | 578 | 3 | 487 | 273 | 979 | 746 | 3,066 |
Equity affiliates | - | 1,115 | 49 | 158 | 77 | - | 1,399 |
AS OF DECEMBER 31, 2018 - BRENT AT 71.43 $/b | |||||||
Proved developed and undeveloped reserves | 1,896 | 2,535 | 1,668 | 3,171 | 1,937 | 843 | 12,050 |
Consolidated subsidiaries | 1,896 | 10 | 1,613 | 1,962 | 1,799 | 843 | 8,123 |
Equity affiliates | - | 2,525 | 55 | 1,209 | 138 | - | 3,927 |
Proved developed reserves | 1,275 | 1,395 | 1,266 | 2,702 | 1,245 | 517 | 8,400 |
Consolidated subsidiaries | 1,275 | 8 | 1,257 | 1,649 | 1,182 | 517 | 5,888 |
Equity affiliates | - | 1,387 | 9 | 1,053 | 63 | - | 2,512 |
Proved undeveloped reserves | 621 | 1,140 | 402 | 469 | 692 | 326 | 3,650 |
Consolidated subsidiaries | 621 | 2 | 356 | 313 | 617 | 326 | 2,235 |
Equity affiliates | - | 1,138 | 46 | 156 | 75 | - | 1,415 |
9.1.4.2 Changes in oil reserves
The oil reserves include crude oil, condensates and natural gas liquids reserves.
Proved developed and undeveloped reserves (in million barrels) | Consolidated subsidiaries | ||||||
Europe and Central Asia (excl. Russia) | Russia | Africa (excl. North Africa) | Middle East and North Africa | Americas | Asia- Pacific | Total | |
BALANCE AS OF DECEMBER 31, 2015 - BRENT AT 54.17 $/b | 976 | 23 | 1,450 | 1,051 | 101 | 205 | 3,806 |
Revisions of previous estimates | 22 | 1 | 6 | 239 | (9) | 6 | 265 |
Extensions, discoveries and other | 14 | - | 11 | 4 | 11 | - | 40 |
Acquisitions of reserves in place | - | - | - | - | - | - | - |
Sales of reserves in place | (13) | (11) | - | - | (2) | - | (26) |
Production for the year | (63) | (3) | (185) | (84) | (16) | (11) | (362) |
BALANCE AS OF DECEMBER 31, 2016 - BRENT AT 42.82 $/b | 936 | 10 | 1,282 | 1,210 | 85 | 200 | 3,723 |
Revisions of previous estimates | 42 | - | 94 | 57 | 7 | 2 | 202 |
Extensions, discoveries and other | - | - | 18 | 38 | 91 | - | 147 |
Acquisitions of reserves in place | 3 | - | 2 | - | - | - | 5 |
Sales of reserves in place | (8) | - | (26) | - | - | - | (34) |
Production for the year | (71) | (1) | (182) | (87) | (15) | (10) | (366) |
BALANCE AS OF DECEMBER 31, 2017 - BRENT AT 54.36 $/b | 902 | 9 | 1,188 | 1,218 | 168 | 192 | 3,677 |
Revisions of previous estimates | 34 | - | 122 | 141 | 51 | 3 | 351 |
Extensions, discoveries and other | 34 | - | 7 | 404 | 2 | 8 | 455 |
Acquisitions of reserves in place | 221 | - | - | 60 | 83 | - | 364 |
Sales of reserves in place | (36) | - | (3) | - | - | (23) | (62) |
Production for the year | (95) | (1) | (185) | (136) | (24) | (6) | (447) |
BALANCE AS OF DECEMBER 31, 2018 - BRENT AT 71.43 $/b | 1,060 | 8 | 1,129 | 1,687 | 280 | 174 | 4,338 |
Minority interest in proved developed and undeveloped reserves as of | |||||||
December 31, 2016 - Brent at 42.82 $/b | - | - | 95 | - | - | - | 95 |
December 31, 2017 - Brent at 54.36 $/b | - | - | 93 | - | - | - | 93 |
DECEMBER 31, 2018 - BRENT AT 71.43 $/b | - | - | 90 | - | - | - | 90 |
Proved developed and undeveloped reserves (in million barrels) | Equity affiliates | ||||||
Europe and Central Asia (excl. Russia) | Russia | Africa (excl. North Africa) | Middle East and North Africa | Americas | Asia- Pacific | Total | |
BALANCE AS OF DECEMBER 31, 2015 - BRENT AT 54.17 $/b | - | 246 | 13 | 260 | 170 | - | 689 |
Revisions of previous estimates | - | 42 | - | 58 | (1) | - | 99 |
Extensions, discoveries and other | - | 15 | - | - | - | - | 15 |
Acquisitions of reserves in place | - | - | - | 167 | - | - | 167 |
Sales of reserves in place | - | (2) | - | - | - | - | (2) |
Production for the year | - | (25) | - | (53) | (12) | - | (90) |
BALANCE AS OF DECEMBER 31, 2016 - BRENT AT 42.82 $/b | - | 276 | 13 | 432 | 157 | - | 878 |
Revisions of previous estimates | - | 16 | - | 44 | (6) | - | 54 |
Extensions, discoveries and other | - | 12 | - | - | - | - | 12 |
Acquisitions of reserves in place | - | 4 | - | - | - | - | 4 |
Sales of reserves in place | - | - | - | - | - | - | - |
Production for the year | - | (24) | (2) | (66) | (11) | - | (103) |
BALANCE AS OF DECEMBER 31, 2017 - BRENT AT 54.36 $/b | - | 284 | 11 | 410 | 140 | - | 845 |
Revisions of previous estimates | - | 54 | - | 57 | (3) | - | 108 |
Extensions, discoveries and other | - | - | - | - | - | - | - |
Acquisitions of reserves in place | - | 10 | - | - | - | - | 10 |
Sales of reserves in place | - | (5) | - | - | - | - | (5) |
Production for the year | - | (26) | (2) | (54) | (8) | - | (90) |
BALANCE AS OF DECEMBER 31, 2018 - BRENT AT 71.43 $/b | - | 317 | 9 | 413 | 129 | - | 868 |
Proved developed and undeveloped reserves (in million barrels) | Consolidated subsidiaries and equity affiliates | ||||||
Europe and Central Asia (excl. Russia) | Russia | Africa (excl. North Africa) | Middle East and North Africa | Americas | Asia- Pacific | Total | |
AS OF DECEMBER 31, 2016 - BRENT AT 42.82 $/b | |||||||
Proved developed and undeveloped reserves (a) | 936 | 286 | 1,295 | 1,642 | 242 | 200 | 4,601 |
Consolidated subsidiaries | 936 | 10 | 1,282 | 1,210 | 85 | 200 | 3,723 |
Equity affiliates | - | 276 | 13 | 432 | 157 | - | 878 |
Proved developed reserves | 476 | 152 | 819 | 1,309 | 151 | 14 | 2,921 |
Consolidated subsidiaries | 476 | 7 | 816 | 955 | 73 | 14 | 2,341 |
Equity affiliates | - | 145 | 3 | 354 | 78 | - | 580 |
Proved undeveloped reserves | 460 | 134 | 476 | 333 | 91 | 186 | 1,680 |
Consolidated subsidiaries | 460 | 3 | 466 | 255 | 12 | 186 | 1,382 |
Equity affiliates | - | 131 | 10 | 78 | 79 | - | 298 |
AS OF DECEMBER 31, 2017 - BRENT AT 54.36 $/b | |||||||
Proved developed and undeveloped reserves (a) | 902 | 293 | 1,199 | 1,628 | 308 | 192 | 4,522 |
Consolidated subsidiaries | 902 | 9 | 1,188 | 1,218 | 168 | 192 | 3,677 |
Equity affiliates | - | 284 | 11 | 410 | 140 | - | 845 |
Proved developed reserves | 541 | 176 | 853 | 1,321 | 145 | 10 | 3,046 |
Consolidated subsidiaries | 541 | 8 | 849 | 1,000 | 77 | 10 | 2,485 |
Equity affiliates | - | 168 | 4 | 321 | 68 | - | 561 |
Proved undeveloped reserves | 361 | 117 | 346 | 307 | 163 | 182 | 1,476 |
Consolidated subsidiaries | 361 | 2 | 338 | 217 | 91 | 182 | 1,191 |
Equity affiliates | - | 115 | 8 | 90 | 72 | - | 285 |
AS OF DECEMBER 31, 2018 - BRENT AT 71.43 $/b | |||||||
Proved developed and undeveloped reserves (a) | 1,060 | 325 | 1,138 | 2,100 | 409 | 174 | 5,206 |
Consolidated subsidiaries | 1,060 | 8 | 1,129 | 1,687 | 280 | 174 | 4,338 |
Equity affiliates | - | 317 | 9 | 413 | 129 | - | 868 |
Proved developed reserves | 698 | 196 | 928 | 1,750 | 164 | 118 | 3,854 |
Consolidated subsidiaries | 698 | 6 | 927 | 1,430 | 106 | 118 | 3,285 |
Equity affiliates | - | 190 | 1 | 320 | 58 | - | 569 |
Proved undeveloped reserves | 362 | 129 | 210 | 350 | 245 | 56 | 1,352 |
Consolidated subsidiaries | 362 | 2 | 202 | 257 | 174 | 56 | 1,053 |
Equity affiliates | - | 127 | 8 | 93 | 71 | - | 299 |
(a) The tables do not include separate figures for NGL reserves because they represented less than 8.5% of the Group’s proved developed and undeveloped oil reserves in each of the years 2016, 2017 and 2018.
9.1.4.3 Changes in bitumen reserves
Proved developed and undeveloped reserves (in million barrels) | Consolidated subsidiaries | ||||||
Europe and Central Asia (excl. Russia) | Russia | Africa (excl. North Africa) | Middle East and North Africa | Americas | Asia- Pacific | Total | |
BALANCE AS OF DECEMBER 31, 2015 BRENT AT 54.17 $/b | - | - | - | - | 1,110 | - | 1,110 |
Revisions of previous estimates | - | - | - | - | (284) | - | (284) |
Extensions, discoveries and other | - | - | - | - | - | - | - |
Acquisitions of reserves in place | - | - | - | - | - | - | - |
Sales of reserves in place | - | - | - | - | - | - | - |
Production for the year | - | - | - | - | (13) | - | (13) |
BALANCE AS OF DECEMBER 31, 2016 BRENT AT 42.82 $/b | - | - | - | - | 813 | - | 813 |
Revisions of previous estimates | - | - | - | - | 189 | - | 189 |
Extensions, discoveries and other | - | - | - | - | - | - | - |
Acquisitions of reserves in place | - | - | - | - | - | - | - |
Sales of reserves in place | - | - | - | - | (52) | - | (52) |
Production for the year | - | - | - | - | (22) | - | (22) |
BALANCE AS OF DECEMBER 31, 2017 BRENT AT 54.36 $/b | - | - | - | - | 928 | - | 928 |
Revisions of previous estimates | - | - | - | - | (26) | - | (26) |
Extensions, discoveries and other | - | - | - | - | - | - | - |
Acquisitions of reserves in place | - | - | - | - | - | - | - |
Sales of reserves in place | - | - | - | - | (24) | - | (24) |
Production for the year | - | - | - | - | (35) | - | (35) |
BALANCE AS OF DECEMBER 31, 2018 brent at 71.43 $/b | - | - | - | - | 843 | - | 843 |
Proved developed reserves as of | |||||||
December 31, 2016 - Brent at 42.82 $/b | - | - | - | - | 160 | - | 160 |
December 31, 2017 - Brent at 54.36 $/b | - | - | - | - | 142 | - | 142 |
DECEMBER 31, 2018 - BRENT AT 71.43 $/b | - | - | - | - | 512 | - | 512 |
Proved undeveloped reserves as of | |||||||
December 31, 2016 - Brent at 42.82 $/b | - | - | - | - | 653 | - | 653 |
December 31, 2017 - Brent at 54.36 $/b | - | - | - | - | 786 | - | 786 |
DECEMBER 31, 2018 - BRENT AT 71.43 $/b | - | - | - | - | 331 | - | 331 |
There are no bitumen reserves for equity affiliates. There are no minority interests for bitumen reserves.
9.1.4.4 Changes in gas reserves
Proved developed and undeveloped reserves (in billion cubic feet) | Consolidated subsidiaries | ||||||
Europe and Central Asia (excl. Russia) | Russia | Africa (excl. North Africa) | Middle East and North Africa | Americas | Asia- Pacific | Total | |
BALANCE AS OF DECEMBER 31, 2015 - BRENT AT 54.17 $/b | 4,470 | 15 | 2,848 | 1,429 | 3,301 | 4,485 | 16,548 |
Revisions of previous estimates | 143 | (2) | (44) | (28) | 347 | 189 | 605 |
Extensions, discoveries and other | 173 | - | - | 7 | 126 | 85 | 391 |
Acquisitions of reserves in place | - | - | - | - | 874 | - | 874 |
Sales of reserves in place | (80) | (7) | - | - | (101) | - | (188) |
Production for the year | (498) | (1) | (220) | (111) | (343) | (494) | (1,667) |
BALANCE AS OF DECEMBER 31, 2016 - BRENT AT 42.82 $/b | 4,208 | 5 | 2,584 | 1,297 | 4,204 | 4,265 | 16,563 |
Revisions of previous estimates | 434 | 2 | 52 | (44) | (21) | 233 | 656 |
Extensions, discoveries and other | - | - | 53 | 131 | 323 | 35 | 542 |
Acquisitions of reserves in place | 34 | - | - | - | - | - | 34 |
Sales of reserves in place | (49) | - | (10) | - | - | - | (59) |
Production for the year | (495) | - | (248) | (94) | (440) | (455) | (1,732) |
BALANCE AS OF DECEMBER 31, 2017 - BRENT AT 54.36 $/b | 4,132 | 7 | 2,431 | 1,290 | 4,066 | 4,078 | 16,004 |
Revisions of previous estimates | 481 | 1 | 39 | (21) | 24 | 141 | 665 |
Extensions, discoveries and other | 176 | - | 191 | 214 | 141 | 29 | 751 |
Acquisitions of reserves in place | 516 | - | - | 130 | 14 | - | 660 |
Sales of reserves in place | (362) | - | (5) | - | - | (343) | (710) |
Production for the year | (515) | - | (257) | (110) | (421) | (273) | (1,576) |
BALANCE AS OF DECEMBER 31, 2018 - BRENT AT 71.43 $/b | 4,428 | 8 | 2,399 | 1,503 | 3,824 | 3,632 | 15,794 |
Minority interest in proved developed and undeveloped reserves as of | |||||||
December 31, 2016 - Brent at 42.82 $/b | - | - | 48 | - | - | - | 48 |
December 31, 2017 - Brent at 54.36 $/b | - | - | 44 | - | - | - | 44 |
DECEMBER 31, 2018 - BRENT AT 71.43 $/b | - | - | 43 | - | - | - | 43 |
Proved developed and undeveloped reserves (in billion cubic feet) | Equity affiliates | ||||||
Europe and Central Asia (excl. Russia) | Russia | Africa (excl. North Africa) | Middle East and North Africa | Americas | Asia- Pacific | Total | |
BALANCE AS OF DECEMBER 31, 2015 - BRENT AT 54.17 $/b | - | 10,604 | 311 | 4,695 | 48 | - | 15,658 |
Revisions of previous estimates | - | (132) | (3) | 51 | (1) | - | (85) |
Extensions, discoveries and other | - | 1,717 | - | - | - | - | 1,717 |
Acquisitions of reserves in place | - | - | - | 132 | - | - | 132 |
Sales of reserves in place | - | (308) | - | - | - | - | (308) |
Production for the year | - | (503) | (7) | (181) | (2) | - | (693) |
BALANCE AS OF DECEMBER 31, 2016 - BRENT AT 42.82 $/b | - | 11,378 | 301 | 4,697 | 45 | - | 16,421 |
Revisions of previous estimates | - | 3 | 4 | 3 | (1) | - | 9 |
Extensions, discoveries and other | - | 607 | - | - | - | - | 607 |
Acquisitions of reserves in place | - | 164 | - | - | - | - | 164 |
Sales of reserves in place | - | - | - | - | - | - | - |
Production for the year | - | (481) | (29) | (187) | (2) | - | (699) |
BALANCE AS OF DECEMBER 31, 2017 - BRENT AT 54.36 $/b | - | 11,671 | 276 | 4,513 | 42 | - | 16,502 |
Revisions of previous estimates | - | 394 | (9) | 28 | 11 | - | 424 |
Extensions, discoveries and other | - | 60 | - | - | - | - | 60 |
Acquisitions of reserves in place | - | 489 | - | - | - | - | 489 |
Sales of reserves in place | - | (112) | - | - | - | - | (112) |
Production for the year | - | (616) | (30) | (184) | (2) | - | (832) |
BALANCE AS OF DECEMBER 31, 2018 - BRENT AT 71.43 $/b | - | 11,886 | 237 | 4,357 | 51 | - | 16,531 |
Proved developed and undeveloped reserves (in billion cubic feet) | Consolidated subsidiaries and equity affiliates | ||||||
Europe and Central Asia (excl. Russia) | Russia | Africa (excl. North Africa) | Middle East and North Africa | Americas | Asia- Pacific | Total | |
AS OF DECEMBER 31, 2016 - BRENT AT 42.82 $/b | |||||||
Proved developed and undeveloped reserves | 4,208 | 11,383 | 2,885 | 5,994 | 4,249 | 4,265 | 32,984 |
Consolidated subsidiaries | 4,208 | 5 | 2,584 | 1,297 | 4,204 | 4,265 | 16,563 |
Equity affiliates | - | 11,378 | 301 | 4,697 | 45 | - | 16,421 |
Proved developed reserves | 2,912 | 4,606 | 1,582 | 5,356 | 3,774 | 1,260 | 19,490 |
Consolidated subsidiaries | 2,912 | 3 | 1,545 | 1,157 | 3,751 | 1,260 | 10,628 |
Equity affiliates | - | 4,603 | 37 | 4,199 | 23 | - | 8,862 |
Proved undeveloped reserves | 1,296 | 6,777 | 1,303 | 638 | 475 | 3,005 | 13,494 |
Consolidated subsidiaries | 1,296 | 2 | 1,039 | 140 | 453 | 3,005 | 5,935 |
Equity affiliates | - | 6,775 | 264 | 498 | 22 | - | 7,559 |
AS OF DECEMBER 31, 2017 - BRENT AT 54.36 $/b | |||||||
Proved developed and undeveloped reserves | 4,132 | 11,678 | 2,707 | 5,803 | 4,108 | 4,078 | 32,506 |
Consolidated subsidiaries | 4,132 | 7 | 2,431 | 1,289 | 4,066 | 4,078 | 16,004 |
Equity affiliates | - | 11,671 | 276 | 4,514 | 42 | - | 16,502 |
Proved developed reserves | 2,964 | 6,262 | 1,749 | 5,151 | 3,493 | 1,127 | 20,746 |
Consolidated subsidiaries | 2,964 | 4 | 1,692 | 1,013 | 3,476 | 1,127 | 10,276 |
Equity affiliates | - | 6,258 | 57 | 4,138 | 17 | - | 10,470 |
Proved undeveloped reserves | 1,168 | 5,416 | 958 | 652 | 615 | 2,951 | 11,760 |
Consolidated subsidiaries | 1,168 | 3 | 739 | 276 | 590 | 2,951 | 5,727 |
Equity affiliates | - | 5,413 | 219 | 376 | 25 | - | 6,033 |
AS OF DECEMBER 31, 2018 - BRENT AT 71.43 $/b | |||||||
Proved developed and undeveloped reserves | 4,428 | 11,894 | 2,636 | 5,860 | 3,875 | 3,632 | 32,325 |
Consolidated subsidiaries | 4,428 | 8 | 2,399 | 1,503 | 3,824 | 3,632 | 15,794 |
Equity affiliates | - | 11,886 | 237 | 4,357 | 51 | - | 16,531 |
Proved developed reserves | 3,050 | 6,426 | 1,658 | 5,233 | 3,213 | 2,219 | 21,799 |
Consolidated subsidiaries | 3,050 | 4 | 1,625 | 1,224 | 3,188 | 2,219 | 11,310 |
Equity affiliates | - | 6,422 | 33 | 4,009 | 25 | - | 10,489 |
Proved undeveloped reserves | 1,378 | 5,468 | 978 | 627 | 662 | 1,413 | 10,526 |
Consolidated subsidiaries | 1,378 | 4 | 774 | 279 | 636 | 1,413 | 4,484 |
Equity affiliates | - | 5,464 | 204 | 348 | 26 | - | 6,042 |
9.1.5 Results of operations for oil and gas producing activities
The following tables do not include revenues and expenses related to oil and gas transportation activities and LNG liquefaction and transportation.
(M$) | Consolidated subsidiaries | ||||||
Europe and Central Asia (excl. Russia) | Russia | Africa (excl. North Africa) | Middle East and North Africa | Americas | Asia- Pacific | Total | |
2016 | |||||||
Revenues Non-Group sales | 1,075 | - | 507 | 613 | 963 | 2,113 | 5,271 |
Group sales | 3,046 | 72 | 6,826 | 3,033 | 494 | 444 | 13,915 |
Total Revenues | 4,121 | 72 | 7,333 | 3,646 | 1,457 | 2,557 | 19,186 |
Production costs | (1,083) | (30) | (1,601) | (478) | (488) | (351) | (4,031) |
Exploration expenses | (512) | (3) | (108) | (368) | (196) | (77) | (1,264) |
Depreciation, depletion and amortization and valuation allowances | (3,421) | (89) | (4,566) | (599) | (603) | (1,191) | (10,469) |
Other expenses (a) | (339) | (8) | (615) | (2,328) | (224) | (97) | (3,611) |
pre-tax income from producing activities (b) | (1,234) | (58) | 443 | (127) | (54) | 841 | (189) |
Income tax | 818 | 14 | (143) | (205) | (27) | (184) | 273 |
Results of oil and gas producing activities (b) | (416) | (44) | 300 | (332) | (81) | 657 | 84 |
(a) Included production taxes and accretion expense as provided by IAS 37 ($507 million in 2016).
(b) Including adjustment items applicable to ASC 932 perimeter, amounting to a net charge of $1.943 million before tax and $1.198 million after tax, mainly related to asset impairments.
2017 | |||||||
Revenues Non-Group sales | 1,454 | - | 975 | 934 | 1,335 | 2,160 | 6,858 |
Group sales | 3,932 | 41 | 8,486 | 3,706 | 821 | 453 | 17,439 |
Total Revenues | 5,386 | 41 | 9,461 | 4,640 | 2,156 | 2,613 | 24,297 |
Production costs | (1,072) | (14) | (1,350) | (434) | (601) | (318) | (3,789) |
Exploration expenses | (419) | (2) | (164) | (10) | (193) | (76) | (864) |
Depreciation, depletion and amortization and valuation allowances | (2,928) | (36) | (5,790) | (511) | (2,569) | (820) | (12,654) |
Other expenses (a) | (352) | (7) | (775) | (2,619) | (338) | (121) | (4,212) |
pre-tax income from producing activities (b) | 615 | (18) | 1,382 | 1,066 | (1,545) | 1,278 | 2,778 |
Income tax | (776) | (2) | (853) | (469) | 387 | (482) | (2,195) |
Results of oil and gas producing activities (b) | (161) | (20) | 529 | 597 | (1,158) | 796 | 583 |
(a) Included production taxes and accretion expense as provided by IAS 37 ($525 million in 2017).
(b) Including adjustment items applicable to ASC 932 perimeter, amounting to a net charge of $3.712 million before tax and $3.305 million after tax, essentially related to asset impairments.
2018 | |||||||
Revenues Non-Group sales | 2,199 | - | 1,899 | 2,331 | 1,109 | 1,384 | 8,922 |
Group sales | 6,686 | 86 | 10,702 | 6,760 | 1,730 | 222 | 26,186 |
Total Revenues | 8,885 | 86 | 12,601 | 9,091 | 2,839 | 1,606 | 35,108 |
Production costs | (1,546) | (14) | (1,208) | (617) | (864) | (147) | (4,396) |
Exploration expenses | (297) | (1) | (144) | (45) | (218) | (93) | (798) |
Depreciation, depletion and amortization and valuation allowances | (2,464) | (33) | (4,400) | (1,227) | (1,356) | (1,066) | (10,546) |
Other expenses (a) | (395) | (12) | (993) | (5,561) | (423) | (141) | (7,525) |
pre-tax income from producing activities (b) | 4,183 | 26 | 5,856 | 1,641 | (22) | 159 | 11,843 |
Income tax | (2,356) | (16) | (2,440) | (868) | 88 | (25) | (5,617) |
Results of oil and gas producing activities (b) | 1,827 | 10 | 3,416 | 773 | 66 | 134 | 6,226 |
(a) Included production taxes and accretion expense as provided by IAS 37 ($515 million in 2018).
(b) Including adjustment items applicable to ASC 932 perimeter, amounting to a net charge of $1.238 million before tax and $703 million after tax, essentially related to asset impairments.
(M$) | Equity affiliates | ||||||
Europe and Central Asia (excl. Russia) | Russia | Africa (excl. North Africa) | Middle East and North Africa | Americas | Asia- Pacific | Total | |
2016 | |||||||
Revenues Non-Group sales | - | 831 | - | 399 | 310 | - | 1,540 |
Group sales | - | - | - | 2,104 | (11) | - | 2,093 |
Total Revenues | - | 831 | - | 2,503 | 299 | - | 3,633 |
Production costs | - | (103) | - | (246) | (42) | - | (391) |
Exploration expenses | - | (4) | - | - | - | - | (4) |
Depreciation, depletion and amortization and valuation allowances | - | (137) | - | (496) | (94) | - | (727) |
Other expenses | - | (109) | - | (1,274) | (116) | - | (1,499) |
pre-tax income from producing activities | - | 478 | - | 487 | 47 | - | 1,012 |
Income tax | - | (80) | - | (107) | 55 | - | (132) |
Results of oil and gas producing activities | - | 398 | - | 380 | 102 | - | 880 |
2017 | |||||||
Revenues Non-Group sales | - | 1,027 | 81 | 1,526 | 351 | - | 2,985 |
Group sales | - | 8 | - | 2,247 | 19 | - | 2,274 |
Total Revenues | - | 1,034 | 81 | 3,774 | 370 | - | 5,259 |
Production costs | - | (106) | - | (283) | (55) | - | (444) |
Exploration expenses | - | (5) | - | - | - | - | (5) |
Depreciation, depletion and amortization and valuation allowances | - | (149) | - | (423) | (88) | - | (660) |
Other expenses | - | (187) | (9) | (2,309) | (159) | - | (2,664) |
pre-tax income from producing activities | - | 587 | 72 | 759 | 67 | - | 1,485 |
Income tax | - | (104) | - | (212) | (5) | - | (321) |
Results of oil and gas producing activities | - | 483 | 72 | 547 | 62 | - | 1,164 |
2018 | |||||||
Revenues Non-Group sales | - | 1,915 | 122 | 3,429 | 346 | - | 5,812 |
Group sales | - | 45 | 32 | 941 | - | - | 1,018 |
Total Revenues | - | 1,960 | 154 | 4,370 | 346 | - | 6,830 |
Production costs | - | (139) | - | (399) | (49) | - | (587) |
Exploration expenses | - | (14) | - | - | - | - | (14) |
Depreciation, depletion and amortization and valuation allowances | - | (196) | - | (253) | (68) | - | (517) |
Other expenses | - | (239) | (32) | (2,548) | (185) | - | (3,004) |
pre-tax income from producing activities | - | 1,372 | 122 | 1,170 | 44 | - | 2,708 |
Income tax | - | (228) | - | (424) | (3) | - | (655) |
Results of oil and gas producing activities | - | 1,144 | 122 | 746 | 41 | - | 2,053 |
9.1.6 Cost incurred
The following tables set forth the costs incurred in the Group’s oil and gas property acquisition, exploration and development activities, including both capitalized and expensed amounts. They do not include costs incurred related to oil and gas transportation and LNG liquefaction and transportation activities.
(M$) | Consolidated subsidiaries | ||||||
Europe and Central Asia (excl. Russia) | Russia | Africa (excl. North Africa) | Middle East and North Africa | Americas | Asia- Pacific | Total | |
2016 | |||||||
Proved property acquisition | 102 | 1 | 31 | 10 | 415 | - | 559 |
Unproved property acquisition | 5 | - | 19 | 1 | 289 | 15 | 329 |
Exploration costs | 594 | 3 | 145 | 93 | 387 | 166 | 1,388 |
Development costs (a) | 3,041 | 30 | 5,977 | 729 | 2,032 | 898 | 12,707 |
Total cost incurred | 3,742 | 34 | 6,172 | 833 | 3,123 | 1,079 | 14,983 |
2017 | |||||||
Proved property acquisition | 47 | - | 1 | 1 | 14 | - | 63 |
Unproved property acquisition | 13 | - | 56 | 5 | 153 | 507 | 734 |
Exploration costs | 415 | 2 | 170 | 61 | 388 | 141 | 1,177 |
Development costs (a) | 1,445 | 20 | 3,544 | 948 | 1,957 | 1,073 | 8,987 |
Total cost incurred | 1,919 | 22 | 3,771 | 1,014 | 2,512 | 1,721 | 10,959 |
2018 (b) | |||||||
Proved property acquisition | 2,899 | - | 210 | 473 | 1,417 | - | 4,999 |
Unproved property acquisition | 3,173 | - | 245 | 2,337 | 2,137 | 1 | 7,893 |
Exploration costs | 379 | 1 | 196 | 34 | 406 | 156 | 1,172 |
Development costs (a) | 1,642 | 23 | 3,252 | 1,378 | 1,649 | 1,346 | 9,290 |
Total cost incurred | 8,093 | 24 | 3,903 | 4,222 | 5,609 | 1,503 | 23,354 |
(M$) | Equity affiliates | ||||||
Europe and Central Asia (excl. Russia) | Russia | Africa (excl. North Africa) | Middle East and North Africa | Americas | Asia- Pacific | Total | |
2016 | |||||||
Proved property acquisition | - | - | - | 35 | - | - | 35 |
Unproved property acquisition | - | - | - | - | - | - | - |
Exploration costs | - | - | - | 7 | - | - | 7 |
Development costs (a) | - | 243 | - | 502 | 61 | - | 806 |
Total cost incurred | - | 243 | - | 544 | 61 | - | 848 |
2017 | |||||||
Proved property acquisition | - | - | - | - | - | - | - |
Unproved property acquisition | - | - | - | - | - | - | - |
Exploration costs | - | - | - | 4 | - | - | 4 |
Development costs (a) | - | 219 | - | 625 | 88 | - | 932 |
Total cost incurred | - | 219 | - | 629 | 88 | - | 936 |
2018 | |||||||
Proved property acquisition | - | 153 | - | - | - | - | 153 |
Unproved property acquisition | - | 9 | - | - | - | - | 9 |
Exploration costs | - | - | - | 3 | - | - | 3 |
Development costs (a) | - | 204 | - | 590 | 67 | - | 861 |
Total cost incurred | - | 366 | - | 593 | 67 | - | 1,026 |
(a) Including asset retirement costs capitalized during the year and any gains or losses recognized upon settlement of asset retirement obligation during the year.
(b) Including costs incurred relating to acquisitions of Maerk Oil, Iara and Lapa concessions and Marathon Oil Libya Ltd.
9.1.7 Capitalized costs related to oil and gas producing activities
Capitalized costs represent the amount of capitalized proved and unproved property costs, including support equipement and facilities, along with the related accumulated depreciation, depletion and amortization. The following tables do not include capitalized costs related to oil and gas transportation and LNG liquefaction and transportation activities.
(M$) | Consolidated subsidiaries | ||||||
Europe and Central Asia (excl. Russia) | Russia | Africa (excl. North Africa) | Middle East and North Africa | Americas | Asia- Pacific | Total | |
As of December 31, 2016 | |||||||
Proved properties | 54,611 | 600 | 78,638 | 11,275 | 23,392 | 23,622 | 192,138 |
Unproved properties | 1,000 | 4 | 4,357 | 1,657 | 8,611 | 1,037 | 16,666 |
Total capitalized costs | 55,611 | 604 | 82,995 | 12,932 | 32,003 | 24,659 | 208,804 |
Accumulated depreciation, depletion and amortization | (29,227) | (385) | (42,988) | (7,973) | (12,764) | (14,735) | (108,072) |
Net capitalized costs | 26,384 | 219 | 40,007 | 4,959 | 19,239 | 9,924 | 100,732 |
As of December 31, 2017 | |||||||
Proved properties | 58,624 | 619 | 79,793 | 12,544 | 25,354 | 24,626 | 201,560 |
Unproved properties | 1,085 | 4 | 4,289 | 1,331 | 8,265 | 1,630 | 16,604 |
Total capitalized costs | 59,709 | 623 | 84,082 | 13,874 | 33,619 | 26,256 | 218,163 |
Accumulated depreciation, depletion and amortization | (34,370) | (421) | (46,725) | (8,450) | (14,345) | (15,550) | (119,861) |
Net capitalized costs | 25,339 | 202 | 37,357 | 5,424 | 19,274 | 10,706 | 98,303 |
As of December 31, 2018 | |||||||
Proved properties | 58,981 | 641 | 82,077 | 15,684 | 28,744 | 26,122 | 212,249 |
Unproved properties | 2,873 | 4 | 4,631 | 2,802 | 8,969 | 1,708 | 20,987 |
Total capitalized costs | 61,854 | 645 | 86,708 | 18,486 | 37,713 | 27,830 | 233,236 |
Accumulated depreciation, depletion and amortization | (35,036) | (454) | (50,029) | (10,012) | (14,398) | (16,682) | (126,611) |
Net capitalized costs | 26,818 | 191 | 36,679 | 8,474 | 23,315 | 11,148 | 106,625 |
(M$) | Equity affiliates | ||||||
Europe and Central Asia (excl. Russia) | Russia | Africa (excl. North Africa) | Middle East and North Africa | Americas | Asia- Pacific | Total | |
As of December 31, 2016 | |||||||
Proved properties | - | 5,802 | - | 5,029 | 1,600 | - | 12,431 |
Unproved properties | - | 211 | - | - | - | - | 211 |
Total capitalized costs | - | 6,013 | - | 5,029 | 1,600 | - | 12,642 |
Accumulated depreciation, depletion and amortization | - | (1,026) | - | (3,850) | (506) | - | (5,382) |
Net capitalized costs | - | 4,987 | - | 1,179 | 1,094 | - | 7,260 |
As of December 31, 2017 | |||||||
Proved properties | - | 6,232 | - | 5,583 | 1,676 | - | 13,491 |
Unproved properties | - | 185 | - | - | - | - | 185 |
Total capitalized costs | - | 6,417 | - | 5,583 | 1,676 | - | 13,676 |
Accumulated depreciation, depletion and amortization | - | (1,344) | - | (4,340) | (592) | - | (6,276) |
Net capitalized costs | - | 5,074 | - | 1,243 | 1,084 | - | 7,401 |
As of December 31, 2018 | |||||||
Proved properties | - | 6,268 | - | 3,463 | 1,743 | - | 11,474 |
Unproved properties | - | 132 | - | - | - | - | 132 |
Total capitalized costs | - | 6,400 | - | 3,463 | 1,743 | - | 11,606 |
Accumulated depreciation, depletion and amortization | - | (1,461) | - | (1,856) | (660) | - | (3,977) |
Net capitalized costs | - | 4,939 | - | 1,607 | 1,083 | - | 7,629 |
9.1.8 Standardized measure of discounted future net cash flows (excluding transportation)
The standardized measure of discounted future net cash flows relating to proved oil and gas reserve quantities was developed as follows:
-estimates of proved reserves and the corresponding production profiles are based on existing technical and economic conditions;
-the estimated future cash flows are determined based on prices used in estimating the Group’s proved oil and gas reserves;
-the future cash flows incorporate estimated production costs (including production taxes), future development costs and asset retirement costs. All cost estimates are based on year-end technical and economic conditions;
-future income taxes are computed by applying the year-end statutory tax rate to future net cash flows after consideration of permanent differences and future income tax credits; and
-future net cash flows are discounted at a standard discount rate of 10%.
These principles applied are those required by ASC 932 and do not reflect the expectations of real revenues from these reserves, nor their present value; hence, they do not constitute criteria for investment decisions. An estimate of the fair value of reserves should also take into account, among other things, the recovery of reserves not presently classified as proved, anticipated future changes in prices and costs and a discount factor more representative of the time value of money and the risks inherent in reserves estimates.
(M$) | Consolidated subsidiaries | ||||||
Europe and Central Asia (excl. Russia) | Russia | Africa (excl. North Africa) | Middle East and North Africa | Americas | Asia- Pacific | Total | |
As of December 31, 2016 | |||||||
Future cash inflows | 46,212 | 365 | 51,677 | 52,891 | 21,520 | 19,209 | 191,874 |
Future production costs | (15,428) | (179) | (19,519) | (39,108) | (14,267) | (7,495) | (95,996) |
Future development costs | (15,334) | (219) | (19,300) | (4,995) | (5,487) | (4,805) | (50,140) |
Future income taxes | (2,599) | (1) | (7,480) | (2,517) | (989) | (955) | (14,541) |
Future net cash flows, after income taxes | 12,851 | (34) | 5,378 | 6,271 | 777 | 5,954 | 31,197 |
Discount at 10% | (5,172) | 8 | (64) | (2,986) | (815) | (2,666) | (11,695) |
Standardized measure of discounted future net cash flows | 7,679 | (26) | 5,314 | 3,285 | (38) | 3,288 | 19,502 |
As of December 31, 2017 | |||||||
Future cash inflows | 58,133 | 420 | 63,319 | 67,180 | 37,203 | 20,616 | 246,871 |
Future production costs | (16,644) | (221) | (18,554) | (50,240) | (19,372) | (5,780) | (110,811) |
Future development costs | (13,302) | (115) | (15,319) | (5,648) | (6,337) | (4,044) | (44,765) |
Future income taxes | (9,385) | (36) | (11,403) | (4,450) | (921) | (1,721) | (27,916) |
Future net cash flows, after income taxes | 18,802 | 47 | 18,043 | 6,843 | 10,572 | 9,070 | 63,377 |
Discount at 10% | (8,106) | (3) | (4,977) | (3,065) | (6,562) | (3,567) | (26,280) |
Standardized measure of discounted future net cash flows | 10,696 | 44 | 13,066 | 3,778 | 4,010 | 5,503 | 37,097 |
As of December 31, 2018 | |||||||
Future cash inflows | 90,506 | 508 | 79,258 | 121,614 | 41,224 | 19,936 | 353,046 |
Future production costs | (21,813) | (226) | (19,236) | (92,616) | (21,282) | (4,570) | (159,743) |
Future development costs | (17,735) | (135) | (13,861) | (11,186) | (6,584) | (3,093) | (52,594) |
Future income taxes | (22,486) | (63) | (16,357) | (5,965) | (2,322) | (2,809) | (50,002) |
Future net cash flows, after income taxes | 28,472 | 84 | 29,804 | 11,847 | 11,036 | 9,464 | 90,707 |
Discount at 10% | (11,811) | (16) | (8,277) | (4,828) | (5,479) | (3,247) | (33,658) |
Standardized measure of discounted future net cash flows | 16,661 | 68 | 21,527 | 7,019 | 5,557 | 6,217 | 57,049 |
Minority interests in future net cash flows as of | |||||||
December 31, 2016 | - | - | 253 | - | - | - | 253 |
December 31, 2017 | - | - | 862 | - | - | - | 862 |
December 31, 2018 | - | - | 1,440 | - | - | - | 1,440 |
(M$) | Equity affiliates | ||||||
Europe and Central Asia (excl. Russia) | Russia | Africa (excl. North Africa) | Middle East and North Africa | Americas | Asia- Pacific | Total | |
As of December 31, 2016 | |||||||
Future cash inflows | - | 22,393 | (248) | 30,045 | 5,815 | - | 58,005 |
Future production costs | - | (5,704) | (53) | (15,846) | (2,017) | - | (23,620) |
Future development costs | - | (929) | (1) | (2,339) | (392) | - | (3,661) |
Future income taxes | - | (1,228) | (20) | (4,661) | - | - | (5,909) |
Future net cash flows, after income taxes | - | 14,532 | (322) | 7,199 | 3,406 | - | 24,815 |
Discount at 10% | - | (9,471) | 139 | (3,869) | (1,697) | - | (14,898) |
Standardized measure of discounted future net cash flows | - | 5,061 | (183) | 3,330 | 1,709 | - | 9,917 |
As of December 31, 2017 | |||||||
Future cash inflows | - | 30,769 | 365 | 39,518 | 6,719 | - | 77,371 |
Future production costs | - | (7,647) | (46) | (17,654) | (3,209) | - | (28,556) |
Future development costs | - | (1,267) | (1) | (3,066) | (299) | - | (4,633) |
Future income taxes | - | (2,097) | (17) | (7,459) | - | - | (9,573) |
Future net cash flows, after income taxes | - | 19,758 | 301 | 11,338 | 3,211 | - | 34,608 |
Discount at 10% | - | (12,050) | (166) | (5,901) | (1,549) | - | (19,666) |
Standardized measure of discounted future net cash flows | - | 7,708 | 135 | 5,437 | 1,662 | - | 14,942 |
As of December 31, 2018 | |||||||
Future cash inflows | - | 40,376 | 1,368 | 48,144 | 6,969 | - | 96,857 |
Future production costs | - | (11,136) | (47) | (21,248) | (3,372) | - | (35,803) |
Future development costs | - | (1,118) | (28) | (2,731) | (326) | - | (4,203) |
Future income taxes | - | (4,825) | - | (11,631) | (1,233) | - | (17,689) |
Future net cash flows, after income taxes | - | 23,297 | 1,293 | 12,534 | 2,038 | - | 39,162 |
Discount at 10% | - | (12,454) | (658) | (6,279) | (1,019) | - | (20,410) |
Standardized measure of discounted future net cash flows | - | 10,843 | 635 | 6,255 | 1,019 | - | 18,752 |
9.1.9 Changes in the standardized measure of discounted future net cash flows
Consolidated subsidiaries (M$) | 2016 | 2017 | 2018 |
Discounted future net cash flows at January 1 | 24,011 | 19,502 | 37,097 |
Sales and transfers, net of production costs | (12,015) | (16,822) | (23,700) |
Net change in sales and transfer prices and in production costs and other expenses | (21,189) | 26,699 | 29,065 |
Extensions, discoveries and improved recovery | 156 | 3,244 | 6,724 |
Changes in estimated future development costs | 400 | (324) | (1,071) |
Previously estimated development costs incurred during the year | 13,967 | 8,952 | 6,636 |
Revisions of previous quantity estimates | 5,347 | 2,427 | 4,875 |
Accretion of discount | 2,401 | 1,950 | 3,710 |
Net change in income taxes | 6,304 | (8,155) | (11,538) |
Purchases of reserves in place | 364 | 98 | 7,876 |
Sales of reserves in place | (244) | (474) | (2,625) |
End of year | 19,502 | 37,097 | 57,049 |
Equity affiliates (M$) | 2016 | 2017 | 2018 |
Discounted future net cash flows at January 1 | 10,501 | 9,917 | 14,942 |
Sales and transfers, net of production costs | (1,745) | (2,151) | (3,248) |
Net change in sales and transfer prices and in production costs and other expenses | (3,840) | 7,075 | 7,322 |
Extensions, discoveries and improved recovery | 1,204 | 57 | 76 |
Changes in estimated future development costs | 83 | (1,171) | (255) |
Previously estimated development costs incurred during the year | 971 | 789 | 789 |
Revisions of previous quantity estimates | 214 | 783 | 1,030 |
Accretion of discount | 1,050 | 992 | 1,494 |
Net change in income taxes | (340) | (1,420) | (3,691) |
Purchases of reserves in place | 1,929 | 71 | 388 |
Sales of reserves in place | (110) | - | (95) |
End of year | 9,917 | 14,942 | 18,752 |
9.2 Other information
9.2.1 Natural Gas Production available for sale
Consolidated subsidiaries | |||||||
Europe and Central Asia (excl. Russia) | Russia | Africa (excl. North Africa) | Middle East and North Africa | Americas | Asia- Pacific | Total | |
2016 | |||||||
Natural Gas production available for sale (a) (Bcf) | 469 | - | 180 | 94 | 337 | 471 | 1,551 |
2017 | |||||||
Natural Gas production available for sale (a) (Bcf) | 465 | - | 205 | 80 | 432 | 436 | 1,618 |
2018 | |||||||
Natural Gas production available for sale (a) (Bcf) | 480 | - | 215 | 91 | 413 | 262 | 1,461 |
(a) The reported volumes are different from those shown in the reserves table due to gas consumed in operations.
Consolidated subsidiaries | |||||||
Europe and Central Asia (excl. Russia) | Russia | Africa (excl. North Africa) | Middle East and North Africa | Americas | Asia- Pacific | Total | |
2016 | |||||||
Natural Gas production available for sale (Bcf) (a) | - | 492 | 5 | 173 | - | - | 670 |
2017 | |||||||
Natural Gas production available for sale (Bcf) (a) | - | 461 | 25 | 176 | - | - | 662 |
2018 | |||||||
Natural Gas production available for sale (Bcf) (a) | - | 586 | 26 | 173 | - | - | 785 |
(a) The reported volumes are different from those shown in the reserves table due to gas consumed in operations. .
9.2.2 Production prices
Consolidated subsidiaries | |||||||
Europe and Central Asia (excl. Russia) | Russia | Africa (excl. North Africa) | Middle East and North Africa | Americas | Asia- Pacific | Total | |
2016 (a) | |||||||
Oil ($/b) (b) | 34.63 | 30.89 | 37.77 | 40.23 | 23.54 | 37.89 | 37.18 |
Bitumen ($/b) | - | - | - | - | 10.77 | - | 10.77 |
Natural Gas ($/kcf) | 4.24 | - | 1.43 | 1.20 | 2.50 | 4.53 | 3.48 |
2017 (a) | |||||||
Oil ($/b) (b) | 47.73 | 40.94 | 50.02 | 52.28 | 31.69 | 48.86 | 49.25 |
Bitumen ($/b) | - | - | - | - | 20.77 | - | 20.77 |
Natural Gas ($/kcf) | 4.51 | - | 1.45 | 1.29 | 2.68 | 4.99 | 3.60 |
2018 (a) | |||||||
Oil ($/b) (b) | 61.71 | 59.88 | 67.17 | 69.56 | 50.29 | 66.29 | 65.72 |
Bitumen ($/b) | - | - | - | - | 11.48 | - | 11.48 |
Natural Gas ($/kcf) | 6.58 | - | 2.05 | 2.06 | 2.89 | 4.86 | 4.30 |
(a) The volumes used for calculation of the average sales prices are the ones sold from the Group’s own production. .
(b) The reported price represents an average aggregate price of prices for crude oil, condensates and NGL. The table does not include separate figures for NGL production prices because the production of NGL represented less than 7.5% of the Group’s total liquids production in each of the years 2016, 2017 and 2018.
Equity affiliates | |||||||
Europe and Central Asia (excl. Russia) | Russia | Africa (excl. North Africa) | Middle East and North Africa | Americas | Asia- Pacific | Total | |
2016 (a) | |||||||
Oil ($/b) (b) | - | 19.36 | - | 38.61 | 28.49 | - | 32.77 |
Bitumen ($/b) | - | - | - | - | - | - | - |
Natural Gas ($/kcf) | - | 1.21 | - | 1.85 | - | - | 1.43 |
2017 (a) | |||||||
Oil ($/b) (b) | - | 26.28 | - | 50.03 | 34.36 | - | 43.51 |
Bitumen ($/b) | - | - | - | - | - | - | - |
Natural Gas ($/kcf) | - | 1.49 | 2.35 | 2.23 | - | - | 1.78 |
2018 (a) | |||||||
Oil ($/b) (b) | - | 38.85 | - | 64.41 | 50.80 | - | 56.13 |
Bitumen ($/b) | - | - | - | - | - | - | - |
Natural Gas ($/kcf) | - | 2.38 | 5.11 | 5.92 | - | - | 3.26 |
(a) The volumes used for calculation of the average sales prices are the ones sold from the Group’s own production. .
(b) The reported price represents an average aggregate price of prices for crude oil, condensates and NGL. The table does not include separate figures for NGL production prices because the production of NGL represented less than 7.5% of the Group’s total liquids production in each of the years 2016, 2017 and 2018.
9.2.3 Production costs
(in $/boe) | Consolidated subsidiaries | ||||||
Europe and Central Asia (excl. Russia) | Russia | Africa (excl. North Africa) | Middle East and North Africa | Americas | Asia- Pacific | Total | |
2016 (a) | |||||||
Total liquids and natural gas | 7.25 | 10.90 | 7.20 | 4.76 | 5.52 | 3.78 | 6.14 |
Bitumen | - | - | - | - | 19.03 | - | 19.03 |
2017 (a) | |||||||
Total liquids and natural gas | 6.85 | 9.59 | 6.05 | 4.28 | 5.27 | 3.72 | 5.56 |
Bitumen | - | - | - | - | 12.06 | - | 12.06 |
2018 (a) | |||||||
Total liquids and natural gas | 8.44 | 9.72 | 5.27 | 4.08 | 6.54 | 2.97 | 5.89 |
Bitumen | - | - | - | - | 13.69 | - | 13.69 |
(a) The volumes of liquids used for this computation are shown in the proved reserves tables of this report. The reported volumes for natural gas are different from those shown in the reserves table due to gas consumed in operations.
(in $/boe) | Equity affiliates | ||||||
Europe and Central Asia (excl. Russia) | Russia | Africa (excl. North Africa) | Middle East and North Africa | Americas | Asia- Pacific | Total | |
2016 (a) | |||||||
Total liquids and natural gas | - | 0.88 | - | 2.92 | 3.59 | - | 1.82 |
Bitumen | - | - | - | - | - | - | - |
2017 (a) | |||||||
Total liquids and natural gas | - | 0.95 | - | 2.88 | 4.94 | - | 1.96 |
Bitumen | - | - | - | - | - | - | - |
2018 (a) | |||||||
Total liquids and natural gas | - | 1.03 | - | 4.62 | 6.00 | - | 2.49 |
Bitumen | - | - | - | - | - | - | - |
(a) The volumes of liquids used for this computation are shown in the proved reserves tables of this report. The reported volumes for natural gas are different from those shown in the reserves table due to gas consumed in operations.
9.3 Report on the payments made to governments (Article L. 225-102-3 of the French Commercial Code)
Article L. 225-102-3 of the French Commercial Code (1) requires large undertakings and public-interest entities that are active in the extractive industry or logging of primary forests to disclose in an annual report payments of at least 100,000 euros made to governments in the countries in which they operate.
The consolidated report of TOTAL is presented below pursuant to the aforementioned provisions. This report covers the aforementioned payments made by the Group’s Extractive Companies as defined below, for the benefit of each government of states or territories in which TOTAL carries out its activities, by detailing the total amount of payments made, the total amount by payment type, the total amount by project and the total amount by payment type for each project. When payments were made in kind, valuated hydrocarbons’ volumes are specified.
This report has been approved by the Board of Directors of TOTAL S.A.
Definitions
The meaning of certain terms used in this report are set forth below.
Extractive Companies: TOTAL S.A. and any company of undertaking of which the activities consist, in whole or in part, of exploration, prospection, discovery, development and extraction of minerals, crude oil and natural gas, among others, fully consolidated by TOTAL S.A.
Payment: a single payment of multiple interconnected payments of an amount equal to, or in excess of, 100,000 euros (or its equivalent) paid, whether in money or in kind, for extractive activities.
Payment types included in this report are the following:
-Taxes: taxes and levies paid on income, production or profits, excluding taxes levied on consumption such as added value taxes, customs duties, personal income taxes and sales taxes.
-Royalties: percentage of production payable to the owner of mineral rights.
-License Fees: annual license fees, surface or rental fees, and other consideration for licenses and /or concessions that are paid for access to the area where the extractive activities will be conducted.
-License bonus: bonuses paid for and in consideration of signature, discovery, production, awards, grants and transfers of extraction rights; bonuses related to the achievement or failure to achieve certain production levels or certain targets, and discovery of additional mineral reserves /deposits.
-Dividends: dividends paid to a host government holding an interest in an Extractive Company.
-Payments for Infrastructure Improvements: payments for local development, including the improvement of infrastructure, not directly necessary for the conduct of extractive activities but mandatory pursuant to the terms of a production sharing contract or to the terms of a law relating to oil and gas activities.
-Production entitlement: host Government’s share of production. This payment is generally made in kind.
Government: any national, regional or local authority of a country or territory, or any department, agency or undertaking controlled by that authority.
Project: operational activities governed by a single contract, license, lease, concession or similar legal agreement and that form the basis for payment liabilities with a Government. If multiple such agreements are substantially interconnected, they shall be considered as a single Project. Payments (such as company income tax when it concerns several projects which cannot be separated in application of the fiscal regulations) unable to be attributed to a Project are disclosed under the item "non-attributable".
Reporting principles
This report sets forth all payments as booked in the Extractive Companies’ accounts. They are presented based on the Group share in each Project, whether the payments have been made directly by the Group Extractive Companies as operator or indirectly through third-party operating companies.
Production entitlement and Royalties that are mandatorily paid in kind and that are owed to host Governments pursuant to legal or contractual provisions (not booked in the Extractive Companies’ accounts pursuant to accounting standards) are reported in proportion of the interest held by the Extractive Company in the Project as of the date on which such Production entitlements and Royalties are deemed to be acquired.
Payments in kind are estimated at fair value.
Fair value corresponds to the contractual price of hydrocarbons used to calculate Production entitlement, market price (if available) or an appropriate benchmark price. These prices might be calculated on an averaged basis over a given period.
(1) Article L. 225-102-3 of the French Commercial Code transposes certain provisions set out in Directive 2013/34/UE of the European Parliament and of the Council of June 26, 2013 (chapter 10).
9.3.1 Reporting by country and type of Payment
(in k$) | Taxes | Royalties | License fees | License bonus | Dividends | Infrastructure improvements | Production entitlements | Total of Payments |
Europe and Central Asia | 1,063,539 | - | 25,154 | 799 | - | 10,442 | 100,560 | 1,200,494 |
Bulgaria | - | - | 169 | - | - | - | - | 169 |
Denmark | 265,034 | - | 5,098 | - | - | - | - | 270,132 |
Greece | - | - | 258 | 295 | - | - | - | 553 |
Italy | 59 | - | 336 | - | - | 36 | - | 431 |
Kazakhstan | 41,081 | - | - | 504 | - | 10,406 | 52,838 | 104,829 |
Netherlands | (37,600) (a) | - | 1,271 | - | - | - | - | (36,329) |
Norway | 567,885 | - | 7,567 | - | - | - | - | 575,452 |
Russia | 20,382 | - | 74 | - | - | - | 47,722 | 68,178 |
United Kingdom | 206,698 | - | 10,381 | - | - | - | - | 217,079 |
Africa | 3,139,947 | - | 56,002 | 152,318 | 6,188 | 66,343 | 2,274,817 | 5,695,615 |
Angola | 840,918 | - | 12,521 | 151,794 | - | - | 2,159,257 | 3,164,490 |
Côte d’Ivoire | - | - | 1,590 | - | - | - | - | 1,590 |
Democratic Republic of the Congo | - | - | 900 | - | - | 340 | - | 1,240 |
Gabon | 224,365 | - | 6,008 | 425 | 6,188 | 21,749 | - | 258,735 |
Kenya | - | - | 403 | - | - | 108 | - | 511 |
Mauritania | - | - | 2,987 | - | - | - | - | 2,987 |
Mozambique | - | - | 2,184 | - | - | - | - | 2,184 |
Namibia | - | - | 105 | - | - | - | - | 105 |
Nigeria | 1,372,888 | - | 3,523 | - | - | 44,146 | 111,132 | 1,531,689 |
Republic of the Congo | 701,776 | - | 26,400 | 99 | - | - | 4,428 | 732,703 |
Senegal | - | - | 2,396 | - | - | - | - | 2,396 |
South Africa | - | - | 274 | - | - | - | - | 274 |
Uganda | - | - | (3,289) (b) | - | - | - | - | (3,289) |
Middle East and North Africa | 7,419,799 | - | 10,910 | 1,454,184 | - | - | 2,519,968 | 11,404,861 |
Algeria | 477,968 | - | 311 | 3,059 | - | - | 186,293 | 667,631 |
Cyprus | - | - | 541 | - | - | - | - | 541 |
Iraq | 14,033 | - | - | 1,125 | - | - | - | 15,158 |
Libya | 682,510 | - | - | - | - | - | 1,561,280 | 2,243,790 |
Oman | 324,832 | - | - | - | - | - | 21,766 | 346,598 |
Qatar | 146,148 | - | - | - | - | - | 750,629 | 896,777 |
United Arab Emirates | 5,774,308 | - | 10,058 | 1,450,000 | - | - | - | 7,234,366 |
Americas | 465,204 | 99,622 | 45,080 | 1,975,597 | - | 582 | 51,251 | 2,637,336 |
Argentina | 162,061 | - | 6,244 | 2,156 | - | - | - | 170,461 |
Bolivia | 214,704 | - | 1,156 | 2,018 | - | 582 | 32,509 | 250,969 |
Brazil | 57,412 | - | 738 | 1,950,516 | - | - | 18,742 | 2,027,408 |
Canada | (325) (c) | 39,340 | 24,185 | - | - | - | - | 63,200 |
Colombia | 5,810 | 1,387 | - | - | - | - | - | 7,197 |
France (French Guiana) | 3,634 | - | - | - | - | - | - | 3,634 |
Mexico | 11,331 | - | 8,453 | - | - | - | - | 19,784 |
United States | 10,577 | 58,895 | 4,304 | 20,907 | - | - | - | 94,683 |
Asia Pacific | 435,352 | - | 11,525 | 52,645 | - | - | 197,317 | 696,839 |
Australia | 8,340 | - | - | - | - | - | - | 8,340 |
Brunei | 32,525 | - | 10,969 | - | - | - | 4,844 | 48,338 |
Cambodia | - | - | 190 | - | - | - | - | 190 |
China | 12,293 | - | - | - | - | - | 24,067 | 36,360 |
Indonesia | 85,939 | - | - | - | - | - | 20,197 | 106,136 |
Myanmar | 30,951 | - | - | 1,500 | - | - | 148,209 | 180,660 |
Papua New Guinea | - | - | 366 | - | - | - | - | 366 |
Thailand | 265,304 | - | - | 51,145 | - | - | - | 316,449 |
Total | 12,523,841 | 99,622 | 148,671 | 3,635,543 | 6,188 | 77,367 | 5,143,913 | 21,635,145 |
(a) Includes the refund of taxes due to carry back of losses of 2017.
(b) Includes the refund of stamp duties.
(c) Corresponds to the reimbursement of Alberta Research & Development Tax Credit.
9.3.2 Reporting of Payments by Project and by type of Payment, and by Government and by type of Payment
(in k$) | Taxes | Royalties | License fees | License bonus | Dividends | Infrastructure improvements | Production entitlements | Total of Payments |
ALGERIA | ||||||||
Payments per Project | ||||||||
Tin Fouyé Tabankort | 62,806 (a) | - | - | - | - | - | 186,293 (b) | 249,099 |
Timimoun | 3,338 | - | - | 3,059 | - | - | - | 6,397 |
Groupement Berkine | 331,342 (c) | - | - | - | - | - | - | 331,342 |
Tin Fouyé Tabankort II | 13,754 | - | 311 | - | - | - | - | 14,065 |
Organisation Orhoud | 66,728 (d) | - | - | - | - | - | - | 66,728 |
Total | 477,968 | - | 311 | 3,059 | - | - | 186,293 | 667,631 |
Payments per Government | ||||||||
Direction Générale des Impôts, Direction des Grandes Entreprises c/o Sonatrach | 460,876 (e) | - | - | - | - | - | - | 460,876 |
Direction Générale des Impôts, Direction des Grandes Entreprises | 7,552 | - | 311 | - | - | - | - | 7,863 |
Agence Nationale pour Valorisation des Ressources en Hydrocarbures (ALNAFT) | 9,540 | - | - | - | - | - | - | 9,540 |
Sonatrach | - | - | - | 3,059 | - | - | 186,293 (f) | 189,352 |
Total | 477,968 | - | 311 | 3,059 | - | - | 186,293 | 667,631 |
(a) Corresponds to the valuation of 2,107 kboe at fiscal selling prices for taxes of different natures.
(b) Corresponds to the valuation of 6,357 kboe at fiscal selling prices for production entitlements.
(c) Corresponds to the valuation of 4,849 kboe at fiscal selling prices for taxes of different natures.
(d) Corresponds to the valuation of 930 kboe at fiscal selling prices for taxes of different natures.
(e) Corresponds to the valuation of 7,886 kboe at fiscal selling prices for taxes of different natures.
(f) Corresponds to the valuation of 6,357 kboe at fiscal selling prices for production entitlements.
ANGOLA | ||||||||
Payments per Project | ||||||||
Block 17 | 596,550 | - | 9,440 | - | - | - | 2,066,516 (a) | 2,672,506 |
Block 0 | 200,190 | - | 1,314 | 1,695 | - | - | - | 203,199 |
Block 14 | 20,932 | - | 665 | - | - | - | 74,616 (b) | 96,213 |
Block 14k | 6,817 | - | 195 | 99 | - | - | 4,428 (c) | 11,539 |
Block 16 | - | - | 197 | - | - | - | - | 197 |
Block 48 | - | - | 50 | 150,000 | - | - | - | 150,050 |
Block 32 | 16,393 | - | 366 | - | - | - | 13,697 (d) | 30,456 |
Block 17/06 | 9 | - | 115 | - | - | - | - | 124 |
Block 25 | 25 | - | 86 | - | - | - | - | 111 |
Block 40 | 2 | - | 93 | - | - | - | - | 95 |
Total | 840,918 | - | 12,521 | 151,794 | - | - | 2,159,257 | 3,164,490 |
Payments per Government | ||||||||
Caixa do Tesouro Nacional | 840,918 | - | 543 | - | - | - | - | 841,461 |
Ministério dos Petróleos | - | - | 11,978 | 99 | - | - | - | 12,077 |
Sonangol, E.P. | - | - | - | 151,695 | - | - | 2,159,257 (e) | 2,310,952 |
Total | 840,918 | - | 12,521 | 151,794 | - | - | 2,159,257 | 3,164,490 |
(a) Corresponds to the valuation of 29,465 kboe at the weighted average fiscal price of the year.
(b) Corresponds to the valuation of 1,057 kboe at the weighted average fiscal price of the year.
(c) Corresponds to the valuation of 62 kboe at the weighted average fiscal price of the year.
(d) Corresponds to the valuation of 199 kboe at the weighted average fiscal price of the year.
(e) Corresponds to the valuation of 30,783 kboe at the weighted average fiscal price of the year.
(in k$) | Taxes | Royalties | License fees | License bonus | Dividends | Infrastructure improvements | Production entitlements | Total of Payments |
ARGENTINA | ||||||||
Payments per Project | ||||||||
Neuquen | 32,619 | - | 220 | 1,036 | - | - | - | 33,875 |
Tierra del Fuego | 57,780 | - | 5,251 | 1,120 | - | - | - | 64,151 |
Santa Cruz | - | - | 773 | - | - | - | - | 773 |
Non-attributable | 71,662 | - | - | - | - | - | - | 71,662 |
Total | 162,061 | - | 6,244 | 2,156 | - | - | - | 170,461 |
Payments per Government | ||||||||
Administracion Federal de Ingresos Publicos | 71,662 | - | - | - | - | - | - | 71,662 |
Secretaria de Energia, Republica Argentina | 32,849 | - | 545 | - | - | - | - | 33,394 |
Provincia del Neuquen | 32,619 | - | 220 | 1,036 | - | - | - | 33,875 |
Provincia de Tierra del Fuego | 24,931 | - | 4,969 | 1,120 | - | - | - | 31,020 |
Provincia de Santa Cruz | - | - | 510 | - | - | - | - | 510 |
Total | 162,061 | - | 6,244 | 2,156 | - | - | - | 170,461 |
AUSTRALIA | ||||||||
Payments per Project | ||||||||
GLNG | 8,340 | - | - | - | - | - | - | 8,340 |
Total | 8,340 | - | - | - | - | - | - | 8,340 |
Payments per Government | ||||||||
Queensland Government, Office of State Revenue | 8,340 | - | - | - | - | - | - | 8,340 |
Total | 8,340 | - | - | - | - | - | - | 8,340 |
BOLIVIA | ||||||||
Payments per Project | ||||||||
Ipati | 104,424 | - | 219 | - | - | 462 | - | 105,105 |
Azero | - | - | 590 | - | - | 120 | - | 710 |
Aquio | 33,109 | - | 137 | - | - | - | - | 33,246 |
Itau | 9,427 | - | 119 | - | - | - | - | 9,546 |
San Alberto | 13,891 | - | 31 | 1,425 | - | - | 4,053 (a) | 19,400 |
San Antonio | 53,853 | - | 60 | 593 | - | - | 28,456 (b) | 82,962 |
Total | 214,704 | - | 1,156 | 2,018 | - | 582 | 32,509 | 250,969 |
Payments per Government | ||||||||
Yacimientos Petroliferos Fiscales Bolivianos (YPFB) | - | - | 1,156 | 2,018 | - | - | 32,509 (c) | 35,683 |
Servicio de Impuestos Nacionales (SIN) c/o YPFB | 137,410 | - | - | - | - | - | - | 137,410 |
Departamentos c/o YPFB | 77,294 | - | - | - | - | - | - | 77,294 |
Fundesoc c/o Indigeneous Communities | - | - | - | - | - | 582 | - | 582 |
Total | 214,704 | - | 1,156 | 2,018 | - | 582 | 32,509 | 250,969 |
(a) Corresponds to the valuation of 219 kboe for production entitlements at a fixed regulated price for condensates and on a net-back regulated price for gas.
(b) Corresponds to the valuation of 1,373 kboe for production entitlements at a fixed regulated price for condensates and on a net-back regulated price for gas.
(c) Corresponds to the valuation of 1,592 kboe for production entitlements at a fixed regulated price for condensates and on a net-back regulated price for gas.
(in k$) | Taxes | Royalties | License fees | License bonus | Dividends | Infrastructure improvements | Production entitlements | Total of Payments |
BRAZIL | ||||||||
Payments per Project | ||||||||
Foz de Amazonas | - | - | 37 | - | - | - | - | 37 |
Ceara (CE-M-661) | - | - | 86 | - | - | - | - | 86 |
Xerelete (BC-2) | - | - | 34 | - | - | - | - | 34 |
Barreirinhas | - | - | 49 | - | - | - | - | 49 |
Espirito Santo | - | - | 33 | - | - | - | - | 33 |
Pelotas | - | - | 48 | - | - | - | - | 48 |
Lapa/Iara | - | - | - | 1,950,516 | - | - | - | 1,950,516 |
Lapa | 27,375 | - | 131 | - | - | - | - | 27,506 |
Iara | 4,209 | - | - | - | - | - | - | 4,209 |
Sul do Gato do Mato | - | - | 60 | - | - | - | - | 60 |
Libra | 19,748 | - | - | - | - | - | 18,742 (a) | 38,490 |
Non-attributable | 6,080 | - | 260 | - | - | - | - | 6,340 |
Total | 57,412 | - | 738 | 1,950,516 | - | - | 18,742 | 2,027,408 |
Payments per Government | ||||||||
Agencia National de Petroleo, Gas Natural e Biocombustiveis | - | - | 607 | - | - | - | - | 607 |
Pré-sal Petróleo (PPSA) | - | - | - | - | - | - | 18,742 (a) | 18,742 |
Instituto Brasileiro do Meio Ambiente e dos Recursos Naturais Renovaveis (IBAMA) | - | - | 131 | - | - | - | - | 131 |
Receita Federal | 57,412 | - | - | - | - | - | - | 57,412 |
Petrobras (b) | - | - | - | 1,950,516 | - | - | - | 1,950,516 |
Total | 57,412 | - | 738 | 1,950,516 | - | - | 18,742 | 2,027,408 |
(a) Corresponds to the valuation of 272 kboe at the fiscal reference price determined by ANP (Agencia National de Petroleo) for production entitlements.
(b) Petrobras, majority controlled by the Brazilian State as of December 31, 2018.
BRUNEI | ||||||||
Payments per Project | ||||||||
Block B | 18,025 | - | 5 | - | - | - | - | 18,030 |
Block CA1 | 14,500 | - | 10,964 | - | - | - | 4,844 | 30,308 |
Total | 32,525 | - | 10,969 | - | - | - | 4,844 | 48,338 |
Payments per Government | ||||||||
Brunei Government | 18,025 | - | 3,483 | - | - | - | - | 21,508 |
Brunei National Petroleum Company Sdn Bhd | 14,500 | - | 7,486 | - | - | - | 4,844 | 26,830 |
Total | 32,525 | - | 10,969 | - | - | - | 4,844 | 48,338 |
BULGARIA | ||||||||
Payments per Project | ||||||||
Khan Asparuh | - | - | 169 | - | - | - | - | 169 |
Total | - | - | 169 | - | - | - | - | 169 |
Payments per Government | ||||||||
Ministry of Energy of Bulgaria | - | - | 169 | - | - | - | - | 169 |
Total | - | - | 169 | - | - | - | - | 169 |
CAMBODIA | ||||||||
Payments per Project | ||||||||
OCA - zone 3 | - | - | 190 | - | - | - | - | 190 |
Total | - | - | 190 | - | - | - | - | 190 |
Payments per Government | ||||||||
Ministry of Mines and Energy | - | - | 190 | - | - | - | - | 190 |
Total | - | - | 190 | - | - | - | - | 190 |
(in k$) | Taxes | Royalties | License fees | License bonus | Dividends | Infrastructure improvements | Production entitlements | Total of Payments |
CANADA | ||||||||
Payments per Project | ||||||||
Joslyn | - | - | 376 | - | - | - | - | 376 |
Surmont | (325) (a) | 26,655 | 17,168 | - | - | - | - | 43,498 |
Northern Lights | - | - | 67 | - | - | - | - | 67 |
Fort Hills | - | 12,685 | 6,556 | - | - | - | - | 19,241 |
Other oil sands projects | - | - | 6 | - | - | - | - | 6 |
Deer Creek | - | - | 12 | - | - | - | - | 12 |
Total | (325) | 39,340 | 24,185 | - | - | - | - | 63,200 |
Payments per Government | ||||||||
Province of Alberta | (325) (a) | 39,340 | 2,103 | - | - | - | - | 41,118 |
Municipality of Wood Buffalo (Alberta) | - | - | 21,696 | - | - | - | - | 21,696 |
Fort McKay First Nations (FMFN) | - | - | 386 | - | - | - | - | 386 |
Total | (325) | 39,340 | 24,185 | - | - | - | - | 63,200 |
(a) Reimbursement of Alberta Research & Development Tax Credit.
CHINA | ||||||||
Payments per Project | ||||||||
Sulige | 12,293 (a) | - | - | - | - | - | 24,067 (b) | 36,360 |
Total | 12,293 | - | - | - | - | - | 24,067 | 36,360 |
Payments per Government | ||||||||
China National Petroleum Company | 12,293 (a) | - | - | - | - | - | 24,067 (b) | 36,360 |
Total | 12,293 | - | - | - | - | - | 24,067 | 36,360 |
(a) Includes the valuation for 11,233 k$ of 374 kboe for taxes of different natures.
(b) Corresponds to the valuation of 800 kboe for production entitlements.
COLOMBIA | ||||||||
Payments per Project | ||||||||
Niscota | 5,810 | 1,387 (a) | - | - | - | - | - | 7,197 |
Total | 5,810 | 1,387 | - | - | - | - | - | 7,197 |
Payments per Government | ||||||||
Dirección de Impuestos y aduanas Nacionales | 727 | - | - | - | - | - | - | 727 |
Agencia Nacional de Hidrocarburos | 5,083 | 1,387 (a) | - | - | - | - | - | 6,470 |
Total | 5,810 | 1,387 | - | - | - | - | - | 7,197 |
(a) Includes the valuation for 1,325 k$ of 23 kboe as royalties, based on the crude oil average selling price.
CÔTE D’IVOIRE | ||||||||
Payments per Project | ||||||||
CI-100 | - | - | 829 | - | - | - | - | 829 |
CI-605 | - | - | 761 | - | - | - | - | 761 |
Total | - | - | 1,590 | - | - | - | - | 1,590 |
Payments per Government | ||||||||
République de Côte d’Ivoire, Direction Générale des Hydrocarbures | - | - | 1,590 | - | - | - | - | 1,590 |
Total | - | - | 1,590 | - | - | - | - | 1,590 |
CYPRUS | ||||||||
Payments per Project | ||||||||
Block 7 | - | - | 6 | - | - | - | - | 6 |
Block 11 | - | - | 277 | - | - | - | - | 277 |
Block 6 | - | - | 258 | - | - | - | - | 258 |
Total | - | - | 541 | - | - | - | - | 541 |
Payments per Government | ||||||||
Ministry of Energy, Commerce, Industry and Tourism | - | - | 541 | - | - | - | - | 541 |
Total | - | - | 541 | - | - | - | - | 541 |
(in k$) | Taxes | Royalties | License fees | License bonus | Dividends | Infrastructure improvements | Production entitlements | Total of Payments |
DEMOCRATIC REPUBLIC OF THE CONGO | ||||||||
Payments per Project | ||||||||
Block 3 | - | - | 900 | - | - | 340 | - | 1,240 |
Total | - | - | 900 | - | - | 340 | - | 1,240 |
Payments per Government | ||||||||
Ministère des Hydrocarbures | - | - | 750 | - | - | 340 | - | 1,090 |
Ministère de l’Environnement | - | - | 150 | - | - | - | - | 150 |
Total | - | - | 900 | - | - | 340 | - | 1,240 |
DENMARK | ||||||||
Payments per Project | ||||||||
Sole Concession Area | 265,034 | - | 5,098 | - | - | - | - | 270,132 |
Total | 265,034 | - | 5,098 | - | - | - | - | 270,132 |
Payments per Government | ||||||||
Arbejdstilsynet | - | - | 170 | - | - | - | - | 170 |
Energistyrelsen | - | - | 224 | - | - | - | - | 224 |
Dansk Teknisk Universitet | - | - | 4,704 | - | - | - | - | 4,704 |
Skat | 265,034 | - | - | - | - | - | - | 265,034 |
Total | 265,034 | - | 5,098 | - | - | - | - | 270,132 |
FRANCE (FRENCH GUIANA) | ||||||||
Payments per Project | ||||||||
Guyane Maritime | 3,634 | - | - | - | - | - | - | 3,634 |
Total | 3,634 | - | - | - | - | - | - | 3,634 |
Payments per Government | ||||||||
Trésor Public | 3,634 | - | - | - | - | - | - | 3,634 |
Total | 3,634 | - | - | - | - | - | - | 3,634 |
(in k$) | Taxes | Royalties | License fees | License bonus | Dividends | Infrastructure improvements | Production entitlements | Total of Payments |
GABON | ||||||||
Payments per Project | ||||||||
Concessions (périmètre Convention d’Etablissement) | 20,009 | - | 4,024 | - | - | 19,338 (a) | - | 43,371 |
Concession Anguille | 45,976 | - | - | - | - | - | - | 45,976 |
Concession Grondin | 32,335 | - | - | - | - | - | - | 32,335 |
Concession Torpille | 40,925 | - | - | - | - | - | - | 40,925 |
Atora CEPP | 2 | - | - | - | - | - | - | 2 |
Coucal CEPP | 1 | - | - | - | - | - | - | 1 |
Avocette CEPP | 8 | - | - | - | - | - | 8 | |
Baudroie-Mérou CEPP | 51,363 (b) | - | 1,037 | - | - | 1,877 (a) | - | 54,277 |
Hylia II CEPP | 3,984 (c) | - | 372 | - | - | - | - | 4,356 |
Diaba CEPP | - | - | 387 | 425 | - | - | - | 812 |
Rabi CEPP | 29,762 (d) | - | 188 | - | - | 534 (a) | - | 30,484 |
Non-attributable | - | - | - | - | 6,188 | - | - | 6,188 |
Total | 224,365 | - | 6,008 | 425 | 6,188 | 21,749 | - | 258,735 |
Payments per Government | ||||||||
Trésor Public Gabonais | 159,941 | - | 1,406 | - | - | - | - | 161,347 |
Direction Générale des Hydrocarbures | - | - | 2,754 | 425 | - | - | - | 3,179 |
République du Gabon | 64,424 (e) | - | - | - | 6,188 | 12,180 | - | 82,792 |
Direction Générale des Impôts | - | - | 607 | - | - | - | - | 607 |
Ville de Port-Gentil | - | - | 1,241 | - | - | 6,803 | - | 8,044 |
Miscellaneous PID beneficiaries | - | - | - | - | - | 666 | - | 666 |
Miscellaneous PIH beneficiaries | - | - | - | - | - | 2,100 | - | 2,100 |
Total | 224,365 | - | 6,008 | 425 | 6,188 | 21,749 | - | 258,735 |
(a) Financing of projects (infrastructure, education, health) under joint control of the State and Total within the framework of the Provision pour Investissements Diversifiés (contribution to diversified investments) and of the Provision pour Investissements dans les Hydrocarbures (contribution to investments in hydrocarbons).
(b) Includes the valuation for 40,802 k$ of 599 kboe at the official selling price and applying the fiscal terms of the profit sharing agreements.
(c) Includes the valuation for 1,916 k$ of 29 kboe at the official selling price and applying the fiscal terms of the profit sharing agreements.
(d) Includes the valuation for 21,706 k$ of 300 kboe at the official selling price and applying the fiscal terms of the profit sharing agreements.
(e) Corresponds to the valuation of 928 kboe at the official selling price and applying the fiscal terms of the profit sharing agreements.
GREECE | ||||||||
Payments per Project | ||||||||
Block 2 | - | - | 258 | 295 | - | - | - | 553 |
Total | - | - | 258 | 295 | - | - | - | 553 |
Payments per Government | ||||||||
Hellenic Hydrocarbon Resources Management | - | - | 258 | 295 | - | - | - | 553 |
Total | - | - | 258 | 295 | - | - | - | 553 |
INDONESIA | ||||||||
Payments per Project | ||||||||
Mahakam PSC | 74,001 | - | - | - | - | - | 15,815 (a)(b) | 89,816 |
Tengah PSC | 5,708 | - | - | - | - | - | 2,068 (c) | 7,776 |
Sebuku PSC | 6,230 | - | - | - | - | - | 2,314 (d) | 8,544 |
Total | 85,939 | - | - | - | - | - | 20,197 | 106,136 |
Payments per Government | ||||||||
Directorate General of Taxation, Ministry of Finance | 85,939 | - | - | - | - | - | - | 85,939 |
Satuan Khusus Kegiatan Usaha Hulu Minyak dan Gas Bumi (SKK Migas) | - | - | - | - | - | - | 20,197 (e) | 20,197 |
Total | 85,939 | - | - | - | - | - | 20,197 | 106,136 |
(a) Disclosed production entitlements correspond to adjustments of 2017 operations done in 2018. Government Production entitlement for export LNG is valued on a net-back price basis (revenues less costs, such as liquefaction and transportation costs). Production entitlement includes volume of oil taken by the Government to meet domestic obligation. The fees received from the Government are deducted from the valuation of these volumes.
(b) Includes the valuation at net-back price for 15,799 k$ of 613 kboe for production entitlements, partly dedicated to domestic delivery obligations. The indemnity of the government is deducted from the valuation of these volumes.
(c) Includes the valuation at net-back price for 2,331 k$ of 47 kboe for production entitlements, partly dedicated to domestic delivery obligations. The indemnity of the government is deducted from the valuation of these volumes.
(d) Corresponds to the valuation at net-back price of 63 kboe for production entitlements.
(e) Includes the valuation at net-back price for 20,445 k$ of 723 kboe for production entitlements, partly dedicated to domestic delivery obligations. The indemnity of the government is deducted from the valuation of these volumes.
(in k$) | Taxes | Royalties | License fees | License bonus | Dividends | Infrastructure improvements | Production entitlements | Total of Payments |
IRAQ | ||||||||
Payments per Project | ||||||||
Halfaya | 6,697 | - | - | - | - | - | - | 6,697 |
Sarsang | 7,336 (a) | - | - | 1,125 | - | - | - | 8,461 |
Total | 14,033 | - | - | 1,125 | - | - | - | 15,158 |
Payments per Government | ||||||||
Ministry of Natural Resources, Erbil, Kurdistan region of Iraq | 7,336 (a) | - | - | 1,125 | - | - | - | 8,461 |
Ministry of Finance, General Commission of Taxation | 6,697 | - | - | - | - | - | - | 6,697 |
Total | 14,033 | - | - | 1,125 | - | - | - | 15,158 |
(a) Corresponds to the valuation of 112 kboe based on market prices for taxes of different natures.
ITALY | ||||||||
Payments per Project | ||||||||
Gorgoglione Unified License | 59 | - | 336 | - | - | 36 | - | 431 |
Total | 59 | - | 336 | - | - | 36 | - | 431 |
Payments per Government | ||||||||
Regione Basilicata | - | - | 309 | - | - | - | - | 309 |
Comune Corleto Perticara | 59 | - | 27 | - | - | 36 | - | 122 |
Total | 59 | - | 336 | - | - | 36 | - | 431 |
KAZAKHSTAN | ||||||||
Payments per Project | ||||||||
Kashagan | 41,081 | - | - | 504 | - | 10,406 | 22,275 (a) | 74,266 |
Dunga | - | - | - | - | - | - | 30,563 | 30,563 |
Total | 41,081 | - | - | 504 | - | 10,406 | 52,838 | 104,829 |
Payments per Government | ||||||||
Atyrau and Mangistau regions c/o North Caspian Operating Company b.v. | - | - | - | - | - | 318 | - | 318 |
Atyrau region c/o North Caspian Operating Company b.v. | - | - | - | - | - | 6,770 | - | 6,770 |
Mangistau region c/o North Caspian Operating Company b.v. | - | - | - | - | - | 3,318 | - | 3,318 |
Ministry of Finance | 41,081 | - | - | 504 | - | - | 30,563 | 72,148 |
Ministry of Energy | - | - | - | - | - | - | 22,275 (a) | 22,275 |
Total | 41,081 | - | - | 504 | - | 10,406 | 52,838 | 104,829 |
(a) Corresponds to the valuation of 426 kboe at average net-back prices for production entitlements.
KENYA | ||||||||
Payments per Project | ||||||||
10BA | - | - | 77 | - | - | - | - | 77 |
10BB | - | - | 148 | - | - | - | - | 148 |
13T | - | - | 21 | - | - | - | - | 21 |
L11A | - | - | 53 | - | - | 36 | - | 89 |
L11B | - | - | 52 | - | - | 36 | - | 88 |
L12 | - | - | 52 | - | - | 36 | - | 88 |
Total | - | - | 403 | - | - | 108 | - | 511 |
Payments per Government | ||||||||
Kenya Ministry of Energy | - | - | 403 | - | - | - | - | 403 |
National Oil Corporation of Kenya | - | - | - | - | - | 108 | - | 108 |
Total | - | - | 403 | - | - | 108 | - | 511 |
(in k$) | Taxes | Royalties | License fees | License bonus | Dividends | Infrastructure improvements | Production entitlements | Total of Payments |
LIBYA | ||||||||
Payments per Project | ||||||||
Areas 15, 16 & 32 (Al Jurf) | 192,468 (a) | - | - | - | - | - | 248,613 (b) | 441,081 |
Areas 129 & 130 | 323,464 (c) | - | - | - | - | - | 948,065 (d) | 1,271,529 |
Waha | 66,147 | - | - | - | - | - | - | 66,147 |
Areas 130 & 131 | 100,431 (e) | - | - | - | - | - | 364,602 (f) | 465,033 |
Total | 682,510 | - | - | - | - | - | 1,561,280 | 2,243,790 |
Payments per Government | ||||||||
National Oil Corporation | 66,147 | - | - | - | - | - | 1,561,280 (g) | 1,627,427 |
Ministry of Finance c/o National Oil Corporation | 616,363 (h) | - | - | - | - | - | - | 616,363 |
Total | 682,510 | - | - | - | - | - | 1,561,280 | 2,243,790 |
(a) Corresponds to the valuation of 2,767 kboe at official selling prices and applying the fiscal terms of the profit sharing agreements.
(b) Corresponds to the valuation of 3,574 kboe at official selling prices and applying the profit sharing agreements.
(c) Corresponds to the valuation of 4,525 kboe at official selling prices and applying the fiscal terms of the profit sharing agreements.
(d) Corresponds to the valuation of 13,263 kboe at official selling prices and applying the profit sharing agreements.
(e) Corresponds to the valuation of 1,404 kboe at official selling prices and applying the fiscal terms of the profit sharing agreements.
(f) Corresponds to the valuation of 5,097 kboe at official selling prices and applying the profit sharing agreements.
(g) Corresponds to the valuation of 21,934 kboe at official selling prices and applying the profit sharing agreements.
(h) Corresponds to the valuation of 8,696 kboe at official selling prices and applying the fiscal terms of the profit sharing agreements.
Mauritania | ||||||||
Payments per Project | ||||||||
Block C9 | - | - | 170 | - | - | - | - | 170 |
Block C7 | - | - | 1,529 | - | - | - | - | 1,529 |
Block C18 | - | - | 1,288 | - | - | - | - | 1,288 |
Total | - | - | 2,987 | - | - | - | - | 2,987 |
Payments per Government | ||||||||
Trésor Public de Mauritanie | - | - | 887 | - | - | - | - | 887 |
SMHPM (Société Mauritanienne des Hydrocarbures et du Patrimoine Minier) | - | - | 900 | - | - | - | - | 900 |
Commission Environnementale | - | - | 1,200 | - | - | - | - | 1,200 |
Total | - | - | 2,987 | - | - | - | - | 2,987 |
MEXICO | ||||||||
Payments per Project | ||||||||
Perdido Block 2 | 3,121 | - | 2,393 | - | - | - | - | 5,514 |
Block 15 | 1,019 | - | 781 | - | - | - | - | 1,800 |
Salina 1 | 2,492 | - | 1,755 | - | - | - | - | 4,247 |
Salina 3 | 3,445 | - | 2,656 | - | - | - | - | 6,101 |
G-CS-02 (B32) | 553 | - | 364 | - | - | - | - | 917 |
AS-CS-06 (B33) | 313 | - | 240 | - | - | - | - | 553 |
G-CS-03 (B34) | 388 | - | 264 | - | - | - | - | 652 |
Total | 11,331 | - | 8,453 | - | - | - | - | 19,784 |
Payments per Government | ||||||||
Servicio de Administracion Tributaria | 11,331 | - | - | - | - | - | - | 11,331 |
Fondo Mexicano del Petroleo | - | - | 8,453 | - | - | - | - | 8,453 |
Total | 11,331 | - | 8,453 | - | - | - | - | 19,784 |
MOZAMBIQUE | ||||||||
Payments per Project | ||||||||
Rovuma Basin Area 3 & 6 | - | - | 2,184 | - | - | - | - | 2,184 |
Total | - | - | 2,184 | - | - | - | - | 2,184 |
Payments per Government | ||||||||
Instituto Nacional de Petroleo | - | - | 2,184 | - | - | - | - | 2,184 |
Total | - | - | 2,184 | - | - | - | - | 2,184 |
(in k$) | Taxes | Royalties | License fees | License bonus | Dividends | Infrastructure improvements | Production entitlements | Total of Payments |
MYANMAR | ||||||||
Payments per Project | ||||||||
Blocks M5 and M6 | 30,951 | - | - | - | - | - | 148,209 (a) | 179,160 |
Block MD4 | - | - | - | 500 | - | - | - | 500 |
Block MD7 | - | - | - | 1,000 | - | - | - | 1,000 |
Total | 30,951 | - | - | 1,500 | - | - | 148,209 | 180,660 |
Payments per Government | ||||||||
Myanmar Ministry of Finance | 30,951 | - | - | - | - | - | - | 30,951 |
Myanmar Oil and Gas Enterprise | - | - | - | 1,500 | - | - | 148,209 (a) | 149,709 |
Total | 30,951 | - | - | 1,500 | - | - | 148,209 | 180,660 |
(a) Includes the valuation at a net-back price for 78,299 k$ of 2,693 kboe for production entitlements dedicated to domestic delivery obligations.
NAMIBIA | ||||||||
Payments per Government | ||||||||
Block 2912 | - | - | 105 | - | - | - | - | 105 |
Total | - | - | 105 | - | - | - | - | 105 |
Payments per Government | ||||||||
Ministry of Mines & Energy | - | - | 105 | - | - | - | - | 105 |
Total | - | - | 105 | - | - | - | - | 105 |
Netherlands | ||||||||
Payments per Project | ||||||||
Offshore Blocks | - | - | 1,271 | - | - | - | - | 1,271 |
Non-attributable | (37,600) (a) | - | - | - | - | - | - | (37,600) |
Total | (37,600) | - | 1,271 | - | - | - | - | (36,329) |
Payments per Government | ||||||||
Belastingdienst Nederland | (37,600) (a) | - | 1,271 | - | - | - | - | (36,329) |
Total | (37,600) | - | 1,271 | - | - | - | - | (36,329) |
(a) Includes the refund of taxes due to carry back of losses of 2017.
(in k$) | Taxes | Royalties | License fees | License bonus | Dividends | Infrastructure improvements | Production entitlements | Total of Payments |
NIGERIA | ||||||||
Payments per Project | ||||||||
Joint ventures with NNPC, operated - Non-attributable | - | - | 2,834 | - | - | 13,947 | - | 16,781 |
Joint ventures with NNPC, non operated - Non-attributable | 106,468 | - | 326 | - | - | 8,940 | - | 115,734 |
OML 58 (joint venture with NNPC, operated) | 45,705 | - | - | - | - | - | - | 45,705 |
OML 99 Amenam-Kpono (joint venture with NNPC, operated) | 48,288 | - | - | - | - | - | - | 48,288 |
OML 100 (joint venture with NNPC, operated) | 33,368 | - | - | - | - | - | - | 33,368 |
OML 102 (joint venture with NNPC, operated) | 308,416 | - | - | - | - | - | - | 308,416 |
OML 102 Ekanga (joint venture with NNPC, non operated) | (726) (a) | - | - | - | - | - | - | (726) |
OML 130 | 723 | - | 360 | - | - | - | - | 1,083 |
OML 130 PSA (Akpo & Egina) | 4,627 | - | - | - | - | 16,129 | - | 20,756 |
OML 118 (Bonga) | 103,666 (b) | - | - | - | - | 4,370 | 94,900 (c) | 202,936 |
OML 138 (Usan) | 35,423 (d) | - | 3 | - | - | 760 | 16,232 (e) | 52,418 |
Non-attributable | 686,930 (f) | - | - | - | - | - | - | 686,930 |
Total | 1,372,888 | - | 3,523 | - | - | 44,146 | 111,132 | 1,531,689 |
Payments per Government | ||||||||
Federal Inland Revenue Service | 699,629 | - | - | - | - | - | - | 699,629 |
Department of Petroleum Resources, Federal Government of Nigeria | 542,242 | - | 1,308 | - | - | - | - | 543,550 |
Niger Delta Development Commission | - | - | - | - | - | 44,146 | - | 44,146 |
Nigerian Maritime Administration & Safety Agency, Federal Government of Nigeria | - | - | 2,212 | - | - | - | - | 2,212 |
Nigerian National Petroleum Corporation | - | - | - | - | - | 111,132 (g) | 111,132 | |
Federal Inland Revenue Service c/o Nigerian National Petroleum Corporation | 94,566 (h) | - | - | - | - | - | - | 94,566 |
Department of Petroleum Resources c/o Nigerian National Petroleum Corporation | 36,451 (i) | - | 3 | - | - | - | - | 36,454 |
Total | 1,372,888 | - | 3,523 | - | - | 44,146 | 111,132 | 1,531,689 |
(a) Refund resulting from adjustment in final prices applicable to the year 2013.
(b) Includes the valuation for 99,784 k$ of 1,405 kboe at average entitlement price and applying the fiscal terms of the profit sharing agreements.
(c) Corresponds to the valuation for 1,302 kboe at average entitlement price and applying the terms of the profit sharing agreements.
(d) Includes the valuation for 31,233 k$ of 443 kboe at average entitlement price and applying the fiscal terms of the profit sharing agreements.
(e) Corresponds to the valuation for 226 kboe at average entitlement price and applying the terms of the profit sharing agreements.
(f) This amount includes the tax implications of the provisions of the Modified Carry Agreement (MCA). Under the MCA, Total E&P Nigeria is entitled to recover 85% of the Carry Capital Cost through claims of capital allowance, described in the MCA as "Carry Tax Relief". The balance of 15% is to be recovered from NNPC’s share of crude oil produced.
(g) Corresponds to the valuation for 1,528 kboe at average entitlement price and applying the terms of the profit sharing agreements.
(h) Corresponds to the valuation for 1,332 kboe at average entitlement price and applying the fiscal terms of the profit sharing agreements.
(i) Corresponds to the valuation for 516 kboe at average entitlement price and applying the fiscal terms of the profit sharing agreements.
NORWAY | ||||||||
Payments per Project | ||||||||
Martin Linge PL043 | - | - | (243) (a) | - | - | - | - | (243) |
Åsgard area | - | - | 2,773 | - | - | - | - | 2,773 |
Ekofisk area | - | - | 2,927 | - | - | - | - | 2,927 |
Heimdal area | - | - | 311 | - | - | - | - | 311 |
Oseberg area | - | - | 1,038 | - | - | - | - | 1,038 |
Sn-hvit area | - | - | 472 | - | - | - | - | 472 |
Troll area | - | - | 233 | - | - | - | - | 233 |
Johan Sverdrup | - | - | 56 | - | - | - | - | 56 |
Non-attributable | 567,885 | - | - | - | - | - | - | 567,885 |
Total | 567,885 | - | 7,567 | - | - | - | - | 575,452 |
Payments per Government | ||||||||
Norwegian Tax Administration | 567,885 | - | - | - | - | - | - | 567,885 |
Norwegian Petroleum Directorate | - | - | 7,567 | - | - | - | - | 7,567 |
Total | 567,885 | - | 7,567 | - | - | - | - | 575,452 |
(a) Reimbursment of area fees received prior to disposal of the asset.
(in k$) | Taxes | Royalties | License fees | License bonus | Dividends | Infrastructure improvements | Production entitlements | Total of Payments |
OMAN | ||||||||
Payments per Project | ||||||||
Block 6 | 320,479 | - | - | - | - | - | - | 320,479 |
Block 53 | 4,353 (a) | - | - | - | - | - | 21,766 (b) | 26,119 |
Total | 324,832 | - | - | - | - | - | 21,766 | 346,598 |
Payments per Government | ||||||||
Oman Ministry of Oil and Gas | - | - | - | - | - | - | 21,766 (b) | 21,766 |
Oman Ministry of Finance | 324,832 (c) | - | - | - | - | - | - | 324,832 |
Total | 324,832 | - | - | - | - | - | 21,766 | 346,598 |
(a) Corresponds to the valuation for 66 kboe at the weighted average selling price and applying the fiscal terms of the profit sharing agreements.
(b) Corresponds to the valuation for 331 kboe at the weighted average selling price and applying the profit sharing agreements.
(c) Includes the valuation for 4,353 k$ of 66 kboe at the weighted average selling price and applying the fiscal terms of the profit sharing agreements.
PAPUA NEW GUINEA | ||||||||
Payments per Project | ||||||||
PRL-15 | - | - | 249 | - | - | - | - | 249 |
PPL-576 | - | - | 117 | - | - | - | - | 117 |
Total | - | - | 366 | - | - | - | - | 366 |
Payments per Government | ||||||||
Conservation & Environment Protection Authority | - | - | 366 | - | - | - | - | 366 |
Total | - | - | 366 | - | - | - | - | 366 |
QATAR | ||||||||
Payments per Project | ||||||||
Al Khalij | 21,381 | - | - | - | - | - | - | 21,381 |
Qatargas 1 | 49,349 (a) | - | - | - | - | - | 60,004 (b) | 109,353 |
Dolphin | 75,418 (c) | - | - | - | - | - | 690,625 (d) | 766,043 |
Total | 146,148 | - | - | - | - | - | 750,629 | 896,777 |
Payments per Government | ||||||||
Qatar Petroleum | - | - | - | - | - | - | 750,629 (e) | 750,629 |
Qatar Ministry of Finance | 146,148 (f) | - | - | - | - | - | - | 146,148 |
Total | 146,148 | - | - | - | - | - | 750,629 | 896,777 |
(a) Corresponds to the valuation of 685 kboe based on the average price of production entitlements and as per the fiscal terms of the profit sharing agreements.
(b) Corresponds to the valuation of 829 kboe based on the average price of production entitlements.
(c) Corresponds to the valuation of 3,325 kboe based on the average price of production entitlements and as per the fiscal terms of the profit sharing agreements.
(d) Corresponds to the valuation of 30,542 kboe based on the average price of production entitlements.
(e) Corresponds to the valuation of 31,371 kboe based on the average price of production entitlements.
(f) Includes the valuation for 124,767 k$ of 4,010 kboe based on the average price of the production entitlements and as per the fiscal terms of the profit sharing agreements.
(in k$) | Taxes | Royalties | License fees | License bonus | Dividends | Infrastructure improvements | Production entitlements | Total of Payments |
REPUBLIC OF THE CONGO | ||||||||
Payments per Project | ||||||||
CPP Haute Mer - Zone A | 63,201 (a) | - | 2,238 | - | - | - | - | 65,439 |
CPP Haute Mer - Zone B | 13,030 (b) | - | 240 | - | - | - | - | 13,270 |
CPP Haute Mer - Zone D | 400,183 (c) | - | 20,881 | - | - | - | - | 421,064 |
CPP Pointe Noire Grands Fonds (PNGF) | 62,864 (d) | - | 1,549 | - | - | - | - | 64,413 |
Kombi, Likalala & Libondo | 126,272 (e) | - | 142 | - | - | - | - | 126,414 |
Lianzi | 6,817 | - | 195 | 99 | - | - | 4,428 (f) | 11,539 |
Madingo | 29,409 (g) | - | 1,155 | - | - | - | - | 30,564 |
Total | 701,776 | - | 26,400 | 99 | - | - | 4,428 | 732,703 |
Payments per Government | ||||||||
Ministère des hydrocarbures | 657,786 (h) | - | - | - | - | - | - | 657,786 |
Trésor Public | 37,173 | - | 26,362 | 99 | - | - | - | 63,634 |
Société Nationale des Pétroles Congolais | 6,817 | - | 38 | - | - | - | 4,428 (f) | 11,283 |
Total | 701,776 | - | 26,400 | 99 | - | - | 4,428 | 732,703 |
(a) Includes the valuation for 29,483 k$ of 414 kboe at official fiscal prices and applying the fiscal terms of the profit sharing agreements.
(b) Includes the valuation for 9,575 k$ of 133 kboe at official fiscal prices and applying the fiscal terms of the profit sharing agreements.
(c) Corresponds to the valuation of 5,807 kboe at official fiscal prices and applying the fiscal terms of the profit sharing agreements.
(d) Corresponds to the valuation of 906 kboe at official fiscal prices and applying the fiscal terms of the profit sharing agreements.
(e) Corresponds to the valuation of 1,826 kboe at official fiscal prices and applying the fiscal terms of the profit sharing agreements.
(f) Corresponds to the valuation of 62 kboe at official fiscal prices and applying the profit sharing agreements.
(g) Corresponds to the valuation of 430 kboe at official fiscal prices and applying the fiscal terms of the profit sharing agreements.
(h) Corresponds to the valuation of 9,516 kboe at official fiscal prices and applying the fiscal terms of the profit sharing agreements.
RUSSIA | ||||||||
Payments per Project | ||||||||
Kharyaga | 20,382 | - | 74 | - | - | - | 47,722 | 68,178 |
Total | 20,382 | - | 74 | - | - | - | 47,722 | 68,178 |
Payments per Government | ||||||||
Nenets Tax Inspection | 20,382 | - | 74 | - | - | - | - | 20,456 |
Ministry of Energy | - | - | - | - | - | - | 47,722 | 47,722 |
Total | 20,382 | - | 74 | - | - | - | 47,722 | 68,178 |
SENEGAL | ||||||||
Payments per Project | ||||||||
ROP | - | - | 2,396 | - | - | - | - | 2,396 |
Total | - | - | 2,396 | - | - | - | - | 2,396 |
Payments per Government | ||||||||
Société des Pétroles du Sénégal | - | - | 2,396 | - | - | - | - | 2,396 |
Total | - | - | 2,396 | - | - | - | - | 2,396 |
SOUTH AFRICA | ||||||||
Payments per Project | ||||||||
Blocks 11b and 12b | - | - | 68 | - | - | - | - | 68 |
Block South Outeniqua | - | - | 206 | - | - | - | - | 206 |
Total | - | - | 274 | - | - | - | - | 274 |
Payments per Government | ||||||||
Petroleum Agency South Africa (PASA) | - | - | 124 | - | - | - | - | 124 |
Upstream Training Trust (UTT) | - | - | 150 | - | - | - | - | 150 |
Total | - | - | 274 | - | - | - | - | 274 |
(in k$) | Taxes | Royalties | License fees | License bonus | Dividends | Infrastructure improvements | Production entitlements | Total of Payments |
THAILAND | ||||||||
Payments per Project | ||||||||
Bongkot | 265,298 | - | - | 51,145 | - | - | - | 316,443 |
G12/48 | 6 | - | - | - | - | - | - | 6 |
Total | 265,304 | - | - | 51,145 | - | - | - | 316,449 |
Payments per Government | ||||||||
Revenue Department | 158,598 | - | - | - | - | - | - | 158,598 |
Department of Mineral Fuels, Ministry Of Energy | 106,706 | - | - | - | - | - | - | 106,706 |
Ministry Of Energy | - | - | - | 51,145 | - | - | - | 51,145 |
Total | 265,304 | - | - | 51,145 | - | - | - | 316,449 |
UGANDA | ||||||||
Payments per Project | ||||||||
Block EA-1 | - | - | 90 | - | - | - | - | 90 |
Block EA-1A | - | - | 67 | - | - | - | - | 67 |
Block EA-2 | - | - | (3,631) (a) | - | - | - | - | (3,631) |
Block EA-3 | - | - | 185 | - | - | - | - | 185 |
Total | - | - | (3,289) | - | - | - | - | (3,289) |
Payments per Government | ||||||||
Ministry of Energy and Mineral Development | - | - | 411 | - | - | - | - | 411 |
Uganda Revenue Authority | - | - | (3,700) (a) | - | - | - | - | (3,700) |
Total | - | - | (3,289) | - | - | - | - | (3,289) |
(a) Includes the refund of stamp duties for 3.700 k$.
UNITED ARAB EMIRATES | ||||||||
Payments per Project | ||||||||
Abu Al Bukhoosh | 87,398 | - | - | - | - | - | - | 87,398 |
ADNOC Gas Processing | 207,629 | - | 2,344 | - | - | - | - | 209,973 |
ADNOC Offshore | 545,048 | - | - | - | - | - | - | 545,048 |
ADNOC Onshore | 3,851,477 | - | 5,464 | - | - | - | - | 3,856,941 |
Umm Shaif Nasr | 775,090 | - | 1,800 | 1,150,000 | - | - | - | 1,926,890 |
Lower Zakum | 307,666 | - | 450 | 300,000 | - | - | - | 608,116 |
Total | 5,774,308 | - | 10,058 | 1,450,000 | - | - | - | 7,234,366 |
Payments per Government | ||||||||
Supreme Petroleum Council - Government of Abu Dhabi | 87,398 | - | - | - | - | - | - | 87,398 |
Abu Dhabi Fiscal Authorities c/o Abu Dhabi Marine Areas Ltd | 545,048 | - | - | - | - | - | - | 545,048 |
Abu Dhabi Fiscal Authorities | 5,141,862 | - | - | 1,450,000 | - | - | - | 6,591,862 |
Petroleum Institute | - | - | 5,109 | - | - | - | - | 5,109 |
Abu Dhabi National Oil Company | - | - | 4,949 | - | - | - | - | 4,949 |
Total | 5,774,308 | - | 10,058 | 1,450,000 | - | - | - | 7,234,366 |
(in k$) | Taxes | Royalties | License fees | License bonus | Dividends | Infrastructure improvements | Production entitlements | Total of Payments |
UNITED KINGDOM | ||||||||
Payments per Project | ||||||||
Northern North Sea | - | - | 1,980 | - | - | - | - | 1,980 |
Central Graben Area | - | - | 973 | - | - | - | - | 973 |
Markham Area | - | - | 144 | - | - | - | - | 144 |
Greater Laggan Area | - | - | 4,561 | - | - | - | - | 4,561 |
Eastern North Sea | - | - | 2,568 | - | - | - | - | 2,568 |
Culzean | - | - | 3 | - | - | - | - | 3 |
Non-attributable | 206,698 | - | 152 | - | - | - | - | 206,850 |
Total | 206,698 | - | 10,381 | - | - | - | - | 217,079 |
Payments per Government | ||||||||
HM Revenue & Customs | 206,698 | - | - | - | - | - | - | 206,698 |
Crown Estate | - | - | 152 | - | - | - | - | 152 |
Oil and Gas Authority | - | - | 10,229 | - | - | - | - | 10,229 |
Total | 206,698 | - | 10,381 | - | - | - | - | 217,079 |
(in k$) | Taxes | Royalties | License fees | License bonus | Dividends | Infrastructure improvements | Production entitlements | Total of Payments |
UNITED STATES | ||||||||
Payments per Project | ||||||||
Tahiti | - | 42,573 | - | - | - | - | - | 42,573 |
Barnett Shale | 7,415 | 16,322 | - | - | - | - | - | 23,737 |
Utica | 2,271 | - | - | - | - | - | - | 2,271 |
Gulf of Mexico | - | - | 4,304 | 20,907 | - | - | - | 25,211 |
Jack | 841 | - | - | - | - | - | - | 841 |
Non-attributable | 50 | - | - | - | - | - | - | 50 |
Total | 10,577 | 58,895 | 4,304 | 20,907 | - | - | - | 94,683 |
Payments per Government | ||||||||
Office of Natural Resources Revenue | - | 42,573 | 4,304 | 20,907 | - | - | - | 67,784 |
State of Ohio | 624 | - | - | - | - | - | - | 624 |
Johnson County Tax Assessor | 1,716 | - | - | - | - | - | - | 1,716 |
Tarrant County Tax Assessor | 3,313 | - | - | - | - | - | - | 3,313 |
Texas State Comptroller’s Office | 2,207 | - | - | - | - | - | - | 2,207 |
City of Fort Worth | - | 6,637 | - | - | - | - | - | 6,637 |
Dallas/Fort Worth International Airport Board | - | 2,145 | - | - | - | - | - | 2,145 |
City of Arlington | - | 1,282 | - | - | - | - | - | 1,282 |
Tarrant Regional Water District | - | 941 | - | - | - | - | - | 941 |
State of Texas | - | 511 | - | - | - | - | - | 511 |
City of North Richland Hills | - | 473 | - | - | - | - | - | 473 |
Fort Worth Independent School District | - | 448 | - | - | - | - | - | 448 |
Burleson Independent School District | - | 315 | - | - | - | - | - | 315 |
Arlington Independent School District | - | 317 | - | - | - | - | - | 317 |
Harrison County | 590 | - | - | - | - | - | - | 590 |
Carroll County | 903 | - | - | - | - | - | - | 903 |
Birdville Independent School District | - | 766 | - | - | - | - | - | 766 |
Tarrant County College | - | 550 | - | - | - | - | - | 550 |
City of Grand Prairie | - | 307 | - | - | - | - | - | 307 |
Kennedale Independent School District | - | 236 | - | - | - | - | - | 236 |
Tarrant County AAAA | - | 191 | - | - | - | - | - | 191 |
Grapevine-Colleyville Tax Office | 179 | - | - | - | - | - | - | 179 |
Louisiana Revenue Service | 891 | - | - | - | - | - | - | 891 |
Columbiana County | 154 | - | - | - | - | - | - | 154 |
City of Cleburne | - | 401 | - | - | - | - | - | 401 |
City of Burleson | - | 245 | - | - | - | - | - | 245 |
Mansfield Independent School District | - | 170 | - | - | - | - | - | 170 |
Crowley Independent School District | - | 147 | - | - | - | - | - | 147 |
City of Crowley | - | 139 | - | - | - | - | - | 139 |
White Settlement Independent School District | - | 101 | - | - | - | - | - | 101 |
Total | 10,577 | 58,895 | 4,304 | 20,907 | - | - | - | 94,683 |
Glossary
The terms "TOTAL" and "Group" as used in this document refer to TOTAL S.A. collectively with all of its direct and indirect consolidated companies located in or outside of France. The term "Company" as used in this document exclusively refers to TOTAL S.A., which is the parent company of the Group.
Abbreviations
€: euro
$ or dollar: U.S. dollar
ADR: American depositary receipt (evidencing an ADS)
ADS: American depositary share (representing a share of a company)
AMF: Autorité des marchés financiers (French Financial Markets Authority)
API: American Petroleum Institute
CNG: compressed natural gas
DACF: debt adjusted cash flow (refer to definition of operating cash flow before working capital changes w/o financial charges below)
ERMI: European Refining Margin Indicator of the Group (refer to definition below)
FLNG: floating liquefied natural gas
FPSO: floating production, storage and offloading
FSRU: floating storage and regasification unit
GHG: greenhouse gas
HSE: health, safety and the environment
IFRS: International Financial Reporting Standards
IPIECA: International Petroleum Industry Environmental Conservation Association
LNG: liquefied natural gas
LPG: liquefied petroleum gas
NGL: natural gas liquids
NGV: natural gas vehicle
OML: oil mining license
ROE: return on equity
ROACE: return on average capital employed
SEC: United States Securities and Exchange Commission
Units of measurement
b = barrel (1)
B = billion
boe = barrel of oil equivalent
BTU = British thermal unit
cf = cubic feet
CO2e = carbon dioxide equivalent
/d = per day
GWh = gigawatt hour
k = thousand
km = kilometer
m = meter
m³ or cm = cubic meter (1)
M = million
MW = megawatt
MWp = megawatt peak (direct current)
t = (Metric) ton
TWh = terawatt hour
W = watt
/y = per year
Conversion table
1 acre ≈ 0.405 hectares
1 b = 42 U.S. gallons ≈ 159 liters
1 b/d of crude oil ≈ 50 t/y of crude oil
1 Bm³/y (1 Bcm) ≈ 0.1 Bcf/d
1 km ≈ 0.62 miles
1 m³ ≈ 35.3 cf
1 Mt of LNG ≈ 48 Bcf of gas
1 Mt/y of LNG ≈ 131 Mcf/d of gas
1 t of oil ≈ 7.5 b of oil (assuming a specific gravity of 37° API)
1 boe = 1 b of crude oil ≈ 5,387 cf of gas in 2018 (2) (5,396 cf in 2017 and 5,403 cf in 2016)
(1) Liquid and gas volumes are reported at international standard metric conditions (15°C and 1 atm).
(2) Natural gas is converted to barrels of oil equivalent using a ratio of cubic feet of natural gas per one barrel. This ratio is based on the actual average equivalent energy content of TOTAL’s natural gas reserves during the applicable periods, and is subject to change. The tabular conversion rate is applicable to TOTAL’s natural gas reserves on a Group-wide basis.
A
acreage
Areas in which mining rights are exercised.
adjusted results
Results using replacement cost, adjusted for special items, excluding the impact of changes for fair value.
API degree
Scale established by the API to measure oil density. A high API degree indicates light oil from which a high yield of gasoline can be refined.
appraisal (delineation)
Work performed after a discovery for the purpose of determining the boundaries or extent of an oil or gas field or assessing its reserves and production potential.
asset retirement (site restitution)
Companies may have obligations related to well-abandonment, dismantlement of facilities, decommissioning of plants or restoration of the environment. These obligations generally result from international conventions, local regulations or contractual obligations.
associated gas
Gas released during oil production.
association/consortium/joint venture:
Terms used to generally describe a project in which two or more entities participate. For the principles and methods of consolidation applicable to different types of joint arrangements according to IFRS, refer to Note 1 to the Consolidated Financial Statements.
B
barrel
Unit of measurement of volume of crude oil equal to 42 U.S. gallons or 159 liters.
barrel of oil equivalent (boe)
Conventional unit for measuring the energy released by a quantity of fuel by relating it to the energy released by the combustion of a barrel of oil.
biochemical conversion
Conversion of carbon resources through biological transformation (reactions involving living organisms). Fermentation of sugar into ethanol is an example.
biofuel
Liquid or gaseous fuel that can be used for transport and produced from biomass, and meeting criteria of reducing GHG compared to the fossil reference.
biomass
All organic matter from vegetal or animal sources.
bitumen
Sometimes referred to as natural bitumen, is petroleum in a solid or semi-solid state in natural deposits. In its natural state, it usually contains sulfur, metals, and other non-hydrocarbons. Bitumen has a viscosity greater than 10,000 centipoise measured at original temperature in the deposit and atmospheric pressure, on a gas free basis.
Brent
Quality of crude oil (38° API) produced in the North Sea, at the Brent fields.
brownfield project
Project concerning developed existing fields.
C
capacity of treatment
Annual crude oil treatment capacity of the atmospheric distillation units of a refinery.
carbon capture, use and storage (CCUS)
Technologies designed to reduce GHG emissions by capturing (C) CO2 and then compressing and transporting it either to use (U) it for various industrial processes (e.g., enhanced recovery of oil or gas, production of chemical products), or to permanently store (S) it in deep geological formations.
catalysts
Substances that increase a chemical reaction speed. During the refining process, they are used in conversion units (reformer, hydrocracker, catalytic cracker) and desulphurization units. Principal catalysts are precious metals (platinum) or other metals such as nickel and cobalt.
coal bed methane
Natural gas present in coal seams.
cogeneration
Simultaneous generation of electrical and thermal energies from a combustible source (gas, fuel oil or coal).
coker (deep conversion unit)
Unit that produces light products (gas, gasoline, diesel) and coke through the cracking of distillation residues.
commercial gas
Gas produced by the upstream facilities and sent directly or indirectly to the gas market.
concession contract
Exploration and production contract under which a host country grants to an oil and gas company (or a consortium) the right to explore a geographic area and develop and produce potential reserves. The oil and gas company (or consortium) undertakes the execution and financing, at its own risk, of all operations. In return, it is entitled to the entire production.
condensate
Light hydrocarbon substances produced with natural gas that exist - either in a gaseous phase or in solution - in the oil and gas under the initial pressure and temperature conditions in the reservoir, and which are recovered in a liquid state in separators, on-site facilities or gas treatment units.
condensate splitter
Unit that distillates condensates upstream of a refining or petrochemical units.
consortium
Refer to the definition above of "association/consortium/joint venture".
conversion
Refining operation aimed at transforming heavy products (heavy fuel oil) into lighter or less viscous products (e.g., gasoline, jet fuels).
cost oil/gas
In a production sharing contract, the portion of the oil and gas production made available to the contractor (contractor group) and contractually reserved for reimbursement of exploration, development, operation and site restitution costs ("recoverable" costs). The reimbursement may be capped by a contractual stop that corresponds to the maximum share of production that may be allocated to the reimbursement of costs.
cracking
Refining process that entails converting the molecules of large, complex, heavy hydrocarbons into simpler, lighter molecules using heat, pressure and, in some cases, a catalyst. A distinction is made between catalytic cracking and steam cracking, which uses heat instead of a catalyst. Cracking then produces ethylene and propylene, in particular.
crude oil
A mixture of compounds (mainly pentanes and heavier hydrocarbons) that exists in a liquid phase at original reservoir temperature and pressure and remains liquid at atmospheric pressure and ambient temperature.
D
Dated Brent
A market term representing the minimum value of physical cargoes of Brent, Forties, Oseberg, or Ekofisk crude oil, loading between the 10th and the 25th day forward. Dated Brent prices are used, directly and indirectly, as a benchmark for a large proportion of the crude oil that is traded internationally.
debottlenecking
Change made to a facility to increase its production capacity.
desulphurization unit
Unit in which sulphur and sulphur compounds are eliminated from mixtures of gaseous or liquid hydrocarbons.
development
Operations carried out to access the proved reserves and set up the technical facilities for extraction, processing, transportation and storage of the oil and gas: drilling of development or injection wells, platforms, pipelines, etc.
distillates
Products obtained through the atmospheric distillation of crude oil or through vacuum distillation. Includes medium distillate such as aviation fuel, diesel fuel and heating oil.
E
effective tax rate
(Tax on adjusted net operating income)/(adjusted net operating income - income from equity affiliates - dividends received from investments - impairment of goodwill + tax on adjusted net operating income).
effect of changes in fair value
The effect of changes in fair value presented as an adjustment item reflects, for some transactions, differences between internal measures of performance used by TOTAL’s Executive Committee and the accounting for these transactions under IFRS. IFRS requires that trading inventories be recorded at their fair value using period-end spot prices. In order to best reflect the management of economic exposure through derivative transactions, internal indicators used to measure performance include valuations of trading inventories based on forward prices. Furthermore, TOTAL, in its trading activities, enters into storage contracts, the future effects of which are recorded at fair value in the Group’s internal economic performance. IFRS precludes recognition of this fair value effect.
energy mix
The various energy sources used to meet the demand for energy.
ERMI (European Refining Margin Indicator)
A Group indicator intended to represent the margin after variable costs for a hypothetical complex refinery located around Rotterdam in Northern Europe that processes a mix of crude oil and other inputs commonly supplied to this region to produce and market the main refined products at prevailing prices in this region. The indicator margin may not be representative of the actual margins achieved by the Group in any period because of TOTAL’s particular refinery configurations, product mix effects or other company-specific operating conditions.
ethane
A colorless, odorless combustible gas of the alkanes class composed of two carbon atoms found in natural gas and petroleum gas.
ethanol
Also commonly called ethyl alcohol or alcohol, ethanol is obtained through the fermentation of sugar (beetroot, sugarcane) or starch (grains). Ethanol has numerous food, chemical and energy (biofuel) applications.
ethylene/propylene
Petrochemical products derived from cracking naphtha and used mainly in the production of polyethylene and polypropylene, two plastics frequently used in packaging, the automotive industry, household appliances, healthcare and textiles.
F
fair value
Fair value is the price that would be received to sell an asset or paid to transfer a liability in a transaction under normal conditions between market participants at the measurement date.
farm-in (or farm-out)
Acquisition (or sale) of all or part of a participating interest in an oil and gas mining property by way of an assignment of rights and obligations in the corresponding permit or license and related contracts.
farnesane
A hydrocarbon molecule containing 15 carbon atoms, which can be used to produce fuel or chemical compounds.
FEED studies (front-end engineering design)
Studies aimed at defining the project and preparing for its execution. In the TOTAL process, this covers the pre-project and basic engineering phases.
FLNG (floating liquefied natural gas)
Floating unit permitting the liquefaction of natural gas and the storage of LNG.
fossil energies
Energies produced from oil, natural gas and coal.
FPSO (floating production, storage and offloading)
Floating integrated offshore unit comprising the equipment used to produce, process and store hydrocarbons and offload them directly to an offshore oil tanker.
FSRU (floating storage and regasification unit)
Floating unit permitting the regasification and the storage of natural gas.
G
gearing ratio
Net Debt/(Net debt + shareholders equity Group share + Non-controlling interests).
greenfield project
Project concerning fields that have never been developed.
gross investments
Investments including acquisitions and increases in non-current loans.
H
hydraulic fracturing
Technique that involves fracturing rock to improve its permeability.
hydrocarbons
Molecules composed principally of carbon and hydrogen atoms. They can be solid such as asphalt, liquid such as crude oil or gaseous such as natural gas. They may also include compounds with sulphur, nitrogen, metals, etc.
hydrocracker
A refinery unit that uses catalysts and extraordinarily high pressure, in the presence of surplus hydrogen, to convert heavy oils into lighter fractions.
I
inventory valuation effect
The adjusted results of the Refining & Chemicals and Marketing & Services segments are presented according to the replacement cost method. This method is used to assess the segments’ performance and facilitate the comparability of the segments’ performance with those of its competitors. In the replacement cost method, which approximates the LIFO (Last-In, First-Out) method, the variation of inventory values in the statement of income is, depending on the nature of the inventory, determined using either the month-end price differentials between one period and another or the average prices of the period rather than the historical value. The inventory valuation effect is the difference between the results according to the FIFO (First-In, First-Out) and the replacement cost.
J
joint venture
Refer to the definition above of "association/consortium/joint venture".
L
lignocellulose
Lignocellulose is the main component of the wall of plant cells. It can be sourced from agricultural and farming wastes or by-products of wood transformation as well as dedicated plantations and constitutes the most abundant renewable carbon source on the planet. This abundance and its composition (very rich in polymerized sugars) makes it an excellent choice to produce biofuels. As a result, its conversion, whether by thermochemical (e.g., gasification) or biochemical techniques, is widely studied.
liquids
Liquids consist of crude oil, bitumen, condensates and NGL.
LNG (liquefied natural gas)
Natural gas, comprised primarily of methane, that has been liquefied by cooling in order to transport it.
LNG train
Facility for converting liquefying storing and off-loading natural gas.
LPG (liquefied petroleum gas)
Light hydrocarbons (comprised of butane and propane, belonging to the alkanes class and composed of three and four carbon atoms respectively) that are gaseous under normal temperature and pressure conditions and that are kept in liquid state by increasing the pressure or reducing the temperature. LPG is included in NGL.
M
mineral interests
Rights to explore for and/or produce oil and gas in a specific area for a fixed period. Covers the concepts of "permit", "license", "title", etc.
N
naphtha
Heavy gasoline used as a base in petrochemicals.
natural gas
Mixture of gaseous hydrocarbons, composed mainly of methane.
natural gas liquids (NGL)
A mixture of light hydrocarbons that exist in the gaseous phase at room temperature and pressure and are recovered as liquid in gas processing plants. NGL include very light hydrocarbons (ethane, propane and butane).
net cash flow
Cash flow from operating activities before working capital changes at replacement cost - net investments (including other transactions with non-controlling interests).
net financial debt
Non-current financial debt, including current portion, current borrowings, other current financial liabilities less cash and cash equivalents and other current financial assets.
net investments
Gross investments - divestments - repayment of non-current loans - other operations with non-controlling interests.
O
oil
Generic term designating crude oil, condensates and NGL.
oil and gas
Generic term which includes all hydrocarbons (e.g., crude oil, condensates, NGL, bitumen and natural gas).
oil sands
sandstones containing natural bitumen.
olefins
Group of products (gas) obtained after cracking of petroleum streams. Olefins are ethylene, propylene and butadiene. These products are used in the production of large plastics (polyethylene, polypropylene, PVC, etc.), in the production of elastomers (polybutadiene, etc.) or in the production of large chemical intermediates.
OPEC
Organization of the Petroleum Exporting Countries.
operated oil & gas facilities
Facilities operated in the Exploration & Production, Refining & Chemicals and Marketing & Services segments of the Group.
operating cash flow before working capital changes
Cash flow from operating activities before changes in working capital at replacement cost.
operating cash flow before working capital changes w/o financial charges (DACF)
Cash flow from operating activities before changes in working capital at replacement cost, without financial charges.
organic investments
Net investments, excluding acquisitions, divestments and other operations with non-controlling interests.
operated production
Total quantity of oil and gas produced on fields operated by an oil and gas company.
operator
Partner of an oil and gas joint venture in charge of carrying out the operations on a specific area on behalf of the joint venture. A refinery is also said to be operated by a specific partner when the operations are carried out by the partner on behalf of the joint venture that owns the refinery.
P
permit
Area contractually granted to an oil and gas company (or a consortium) by the host country for a defined period to carry out exploration work or to exploit a field.
petcoke (or petroleum coke)
Residual product remaining after the improvement of very heavy petroleum cuts. This solid black product consists mainly of carbon and can be used as fuel.
polymers
Molecule composed of monomers bonded together by covalent bonds, such as polyolefins obtained from olefins or starch and proteins produced naturally.
pre-dividend organic cash breakeven
Brent price for which the operating cash flow before working capital changes covers the organic investments.
price effect
The impact of changing hydrocarbon prices on entitlement volumes from production sharing contracts and on economic limit dates.
production costs
Costs related to the production of hydrocarbons in accordance with FASB ASC 932-360-25-15.
production plateau
Expected average stabilized level of production for a field following the production build-up.
production sharing contract/agreement (PSC/PSA)
Exploration and production contract under which a host country or, more frequently, its national company, transfers to an oil and gas company (the contractor) or a consortium (the contractor group) the right to explore a geographic area and develop the fields discovered. The contractor (or contractor group) undertakes the execution and financing, at its own risk, of all operations. In return, it is entitled to a portion of the production, called cost oil/gas, to recover its costs and investment. The remaining production, called profit oil/gas, is then shared between the contractor (contractor group), and the national company and/or host country.
project
As used in this document, "project" may encompass different meanings, such as properties, agreements, investments, developments, phases, activities or components, each of which may also informally be described as a "project". Such use is for convenience only and is not intended as a precise description of the term "project" as it relates to any specific governmental law or regulation.
proved permit
Permit for which there are proved reserves.
proved reserves (1P reserves)
Proved oil and gas reserves are those quantities of oil and gas, which, by analysis of geoscience and engineering data, can be estimated with certainty of 90% to be economically producible from a given date forward, from known reservoirs, and under existing economic conditions, operating methods, and government regulations, prior to the time at which contracts providing the right to operate expire, unless evidence indicates that renewal is reasonably certain, regardless of whether deterministic or probabilistic methods are used for the estimation.
proved developed reserves
Proved developed oil and gas reserves are proved reserves that can be expected to be recovered (i) through existing wells with existing equipment and operating methods or in which the cost of the required equipment is relatively minor compared to the cost of a new well; and (ii) through installed extraction equipment and infrastructure operational at the time of the reserves estimate if the extraction is by means not involving a well.
proved undeveloped reserves
Proved undeveloped oil and gas reserves are proved reserves that are expected to be recovered with new investments (new wells on undrilled acreage, or from existing wells where a relatively major expenditure is required for recompletion, surface facilities).
[REDACTED SECTION: CERTAIN TEXT HAS BEEN REDACTED.]
R
refining
The various processes used to produce petroleum products from crude oil (e.g., distillation, reforming, desulphurization, cracking).
renewable energies
An energy source the inventories of which can be renewed or are inexhaustible, such as solar, wind, hydraulic, biomass and geothermal energy.
reserve life
Synthetic indicator calculated from data published under ASC 932. Ratio of the proved reserves at the end of the period to the production of the past year.
reserves
Estimated remaining quantities of oil and gas and related substances expected to be economically producible, as of a given date, by application of development projects to known accumulations.
reservoirs
Porous, permeable underground rock formation that contains oil or natural gas.
resource acquisitions
Acquisition of a participating interest in an oil and gas mining property by way of an assignment of rights and obligations in the corresponding permit or license and related contracts, with a view to producing the recoverable oil and gas.
return on average capital employed (ROACE)
Ratio of adjusted net operating income to average capital employed at replacement cost between the beginning and the end of the period.
return on equity (ROE)
Ratio of adjusted consolidated net income to average adjusted shareholders’ equity (after distribution) between the beginning and the end of the period. Adjusted shareholders’ equity for a given period is calculated after distribution of the dividend (subject to approval by the Shareholders’ Meeting).
Risked service contract
Service contract where the contractor bears the investments and the risks. The contractor usually receives a portion of the production to cover the refund of the investments and the related interests, and a monetary remuneration linked to the performance of the field.
S
seismic
Method of exploring the subsoil that entails methodically sending vibration or sound waves and recording their reflections to assess the type, size, shape and depth of subsurface layers.
shale gas
Natural gas in a source rock that has not migrated to a reservoir.
shale oil
Oil in a source rock that has not migrated to a reservoir.
sidetrack
Well drilled from a portion of an existing well (and not by starting from the surface). It is used to get around an obstruction in the original well or resume drilling in a new direction or to explore a nearby geological area.
silicon
The most abundant element in Earth’s crust after oxygen. It does not exist in a free state but in the form of compounds such as silica, which has long been used as an essential element of glass. Polysilicon (or crystalline silicon), which is obtained by purifying silicon and consists of metal-like crystals, is used in the construction of photovoltaic solar panels, but other minerals or alloys may be used.
special items
Due to their unusual nature or particular significance, certain transactions qualifying as "special items" are excluded from the business segment figures. In general, special items relate to transactions that are significant, infrequent or unusual. In certain instances, transactions such as restructuring costs or asset disposals, which are not considered to be representative of the normal course of business, may qualify as special items although they may have occurred in prior years or are likely to recur in following years.
steam cracker
A petrochemical plant that turns naphtha and light hydrocarbons into ethylene, propylene, and other chemical raw materials.
T
thermochemical conversion
Conversion of carbon energy sources (gas, coal, biomass, waste, CO2) through thermal transformation (chemical reactions controlled by the combined action of temperature, pressure and often of a catalyst). Gasification is an example.
tight gas
Natural gas trapped in very low-permeable reservoir.
turnaround
Temporary shutdown of a facility for maintenance, overhaul and upgrading.
U
unconventional hydrocarbons
Oil and gas that cannot be produced or extracted using conventional methods. These hydrocarbons generally include shale gas, coal bed methane, gas located in very low-permeable reservoirs, methane hydrates, extra heavy oil, bitumen and liquid or gaseous hydrocarbons generated during pyrolysis of oil shale.
unitization
Creation of a new joint venture and appointment of a single operator for the development and production as single unit of an oil or gas field involving several permits/licenses or countries.
unproved permit
Permit for which there are no proved reserves.