MD&A
Management’s Discussion and Analysis
| This management’s discussion and analysis (MD&A) contains information to help you understand our business and financial performance. Information is as of March 3, 2017. This MD&A focuses on our Consolidated Financial Statements and Notes and includes a discussion of known risks and uncertainties relating to our business and the oilfield services sector. It does not, however, cover the potential effects of general economic, political, governmental and environmental events, or other events that could affect us in the future.
You should read this MD&A with the accompanying audited Consolidated Financial Statements and Notes, which have been prepared in accordance with International Financial Reporting Standards (IFRS) and with the information inCautionary StatementAbout Forward-Looking Informationand Statements on page 3.
The terms we, us, our, Precision DrillingandPrecision mean Precision Drilling Corporation and our subsidiaries, and includeany partnerships that we and/or our subsidiaries are part of.
All amounts are in Canadian dollars unless otherwise stated. | |||||||
Precision Drilling Corporation 2016
| ||||||||
| 2 | Management’s Discussion and Analysis | |||||||||
CAUTIONARY STATEMENT ABOUT FORWARD-LOOKING INFORMATION AND STATEMENTS We disclose forward-looking information to help current and prospective investors understand our future prospects.
This MD&A contains statements about what we believe, intend and expect about developments, results and events that may or will occur in the future and are forward-looking within the meaning of Canadian securities legislation and the safe harbor provisions of the United States (U.S.) Private Securities Litigation Reform Act of 1995 (collectively, the forward-looking information and statements).
Forward-looking information and statements in this MD&A: ∎ typically include words and phrases about the future, such asanticipate,could,should,can,expect,seek,may,intend,likely,will,plan,estimate andbelieve ∎ are based on certain assumptions and analyses based on our experience, understanding of historical trends, current conditions and expected future developments, and other factors we believe are appropriate given the circumstances ∎ can be affected by known and unknown risks, uncertainties and other factors that could cause actual results to differ materially from our expectations.
In particular, our forward-looking information and statements in this MD&A include, but are not limited to, the following: ∎ our outlook on oil and natural gas prices ∎ our expectations about drilling activity in North America and the demand for Tier 1 rigs ∎ our capital expenditure plans for 2017 ∎ our 2017 strategic priorities ∎ the potential impact liquefied natural gas export development could have on North American drilling activity ∎ our expectations that new or newer rigs will enter the markets we currently operate in ∎ our ability to remain compliant with our senior secured facility financial debt covenants.
Theforward-looking information and statements are based on certain assumptions and analysis Precision has made in light of our experience and our perception of historical trends, current conditions and expected future developments as well as other factors we believe are appropriate in the circumstances. These include, among other things: ∎ our ability to react to customer spending plans as a result of changes in oil and natural gas prices ∎ the status of current negotiations with our customers and vendors ∎ continued market demand for Tier 1 rigs ∎ our ability to deliver rigs to customers on a timely basis ∎ the general stability of the economic and political environment in the jurisdictions we operate in ∎ impact of an increase/decrease in capital spending. |
| Precision Drilling Corporation 2016 Annual Report | 3 | |||||||||
Readers are cautioned not to place undue reliance on forward looking information and statements. Actual results, performance or achievements could differ materially from those we currently anticipate due to a number of risks and uncertainties. These include, but are not limited to, the following: ∎ fluctuations in the price and demand for oil and natural gas ∎ fluctuations in the level of oil and natural gas exploration and development activities ∎ fluctuations in the demand for contract drilling, directional drilling, well servicing and ancillary oilfield services ∎ liquidity of the capital markets to fund customer drilling programs ∎ availability of cash flow, debt and equity sources to fund our capital and operating requirements, as needed ∎ the impact of weather and seasonal conditions on operations and facilities ∎ competitive operating risks inherent in contract drilling, directional drilling, well servicing and ancillary oilfield services ∎ ability to improve our rig technology to improve drilling efficiency ∎ general economic, market or business conditions ∎ changes in laws or regulations ∎ availability of qualified personnel, management or other key inputs ∎ currency exchange fluctuations |
∎ operating in foreign countries ∎ other unforeseen conditions that could affect the use of our services ∎ other risks and uncertainties set out in this MD&A under the headingRisks in our Business.
Readers are cautioned that this list of risk factors is not exhaustive. You can find more information about these and other factors that could affect our business, operations or financial results in reports on file with securities regulatory authorities: including but not limited to our annual information form (AIF) for the year ended December 31, 2016, which you can find in our profile on SEDAR (www.sedar.com) or in our profile on EDGAR (www.sec.gov).
All of the forward-looking information and statements made in this MD&A are expressly qualified by these cautionary statements. There can be no assurance that actual results or developments that we anticipate will be realized. We caution you not to place undue reliance on forward-looking information and statements. The forward-looking information and statements made in this MD&A are made as of the date hereof. We will not necessarily update or revise this forward-looking information as a result of new information, future events or otherwise, unless we are required to by securities law. |
| 4 | Management’s Discussion and Analysis | |||||||||
NON-GAAP MEASURES In this MD&A, we reference additional generally accepted accounting principles (GAAP) measures that are not defined terms under IFRS to assess performance because we believe they provide useful supplemental information to investors.
Adjusted EBITDA We believe that Adjusted EBITDA (earnings before income taxes, finance charges, foreign exchange, impairment of goodwill, impairment of property, plant and equipment, loss on asset decommissioning, gain onre-measurement of property, plant and equipment and depreciation and amortization), as reported in the Consolidated Statements of Earnings (Loss), is a useful supplemental measure because it gives us, and our investors, an indication of the results from our principal business activities before consideration of how our activities are financed and exclude the impact of foreign exchange, taxation, andnon-cash impairment, decommissioning, depreciation, and amortization charges.
Operating Earnings (Loss) We believe that operating earnings (loss), as reported in the Consolidated Statements of Earnings (Loss), is a useful measure of our income because it gives us, and our investors, an indication of the results of our principal business activities before consideration of how our activities are financed and exclude the impact of foreign exchange and taxation.
Funds Provided by Operations We believe that funds provided by operations, as reported in the Consolidated Statements of Cash Flow, is a useful measure because it gives us, and our investors, an indication of the funds our principal business activities generated prior to consideration of working capital, which is primarily made up of highly liquid balances. |
| Precision Drilling Corporation 2016 Annual Report | 5 | |||||||||
Precision Drilling Corporation provides onshore drilling and completion and production services to exploration and production companies in the oil and natural gas industry.
| ||
Headquartered in Calgary, Alberta, Canada, we are Canada’s largest oilfield services company and one of the largest in the United States (U.S.). We also have operations in Mexico and the Middle East.
Our shares trade on the Toronto Stock Exchange, under the symbol PD, and on the New York Stock Exchange, under the symbol PDS. | Vision
Our vision is to be recognized as theHigh Performance, High Valueprovider of onshore drilling and related services globally.
You can read about our strategic priorities for 2017 on page 22.
| |
STRENGTH AND FLEXIBILITY From our founding as a private drilling contractor in the 1950s, Precision has grown to become one of the most active drillers in North America. Our strength and flexibility are underpinned by five distinguishing features: | ||
∎ a competitive operating model that drives efficiency, quality and cost control ∎ a culture focused on safety and field performance ∎ size and scale of operations that provide higher margins and better service capabilities ∎ liquidity that allows us to take advantage of business cycle opportunities ∎ a capital structure that provides long-term stability and flexibility.
CORPORATE GOVERNANCE At Precision, we believe that a strong culture of corporate governance and ethical behaviour in decision-making is fundamental to the way we do business.
We have a strong Board of Directors (Board) made up of directors with a history of achievement and an effective mix of skills, knowledge, and business experience. The directors oversee the conduct of our business, provide oversight in support of future operations and monitor regulatory developments and governance best practices in Canada and the United States. Our Board also reviews our governance charters, guidelines, policies and procedures to make sure they are appropriate and that we maintain high governance standards.
Our Board has established three standing committees, comprised of independent directors, to help it carry out its responsibilities effectively: | ||
∎ Audit Committee ∎ Corporate Governance, Nominating and Risk Committee ∎ Human Resources and Compensation Committee
The Board may also create specialad hoc committees from time to time to deal with important matters that arise.
You can find more information about our approach to governance in our management information circular, available on our website (www.precisiondrilling.com). | ||
| 6 | Management’s Discussion and Analysis | |||||||||
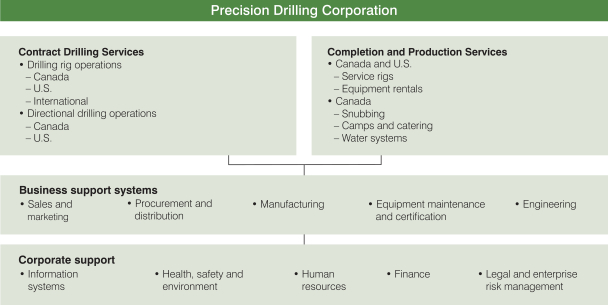
TWO BUSINESS SEGMENTS We operate our business in two segments, supported by vertically integrated business support systems.
|
| Precision Drilling Corporation 2016 Annual Report | 7 | |||||||||
Contract Drilling Services We provide onshore drilling services to exploration and production companies in the oil and natural gas industry, operating in Canada, the U.S. and internationally.
We are the third largest land drilling contractor in North America, servicing approximately 27% of the active land drilling market in Canada and 6% of the active U.S. market. We also have an international presence with operations in Mexico and the Middle East.
At December 31, 2016, our Contract Drilling Services segment consisted of: ∎ 255 land drilling rigs, including: – 135 in Canada – 103 in the U.S. – 5 in Mexico – 4 in Saudi Arabia – 5 in Kuwait – 2 in the Kurdistan region of Iraq – 1 in the country of Georgia ∎ capacity for approximately 70 concurrent directional drilling jobs in Canada and the U.S. ∎ engineering, manufacturing and repair services, primarily for Precision’s operations ∎ centralized procurement, inventory and distribution of consumable supplies for our global operations.
At March 3, 2017, we had239 Super Series drilling rigs, with 16 additional rigs that are good candidates to be upgraded. OurTier 1, orSuper Series rigs are highly mobile and automated, which make them safer and more efficient in drilling directional and horizontal wells than older generation drilling rigs. OurSuper Seriesrigs have a broad range of features to meet a diverse range of customer needs, from drilling shallow- to medium-depth wells to exploiting the deep, unconventional shale plays that have driven North American energy resource development programs. Available features include alternating current (AC) power, digitized control systems, integrated top drive,bi-directional pad walking systems formulti-pad well drilling, highly mechanized pipe handling, and high capacity mud pumps. OurSuper Seriesfleet includes a number of smaller, fast-moving, hydraulically-powered mechanized rigs that are optimized for shallow- to medium-depth resource plays found across North America.
|
| 8 | Management’s Discussion and Analysis | |||||||||
Completion and Production Services We provide well completion, workover, abandonment, andre-entry preparation services, as well as snubbing units for pressure control services and equipment rentals to oil and natural gas exploration and production companies in Canada and the U.S.
In December 2016 we acquired 48 well service rigs and ancillary equipment in a business acquisition for consideration of $12 million and our coil tubing assets.
On an operating hour basis in 2016, we serviced approximately 10% of the well completion and workover service rig market demand in Canada and less than 1% of the market in the United States.
At December 31, 2016, our Completion and Production Services segment consisted of: ∎ 196 well completion and workover service rigs, including: – 188 in Canada – 8 in the U.S. ∎ 11 snubbing units in Canada ∎ approximately 2,200 oilfield rental items, including surface storage, small-flow wastewater treatment, power generation, and solids control equipment, primarily in Canada ∎ 132 wellsite accommodation units in Canada ∎ 43 drill camps and 4 base camps in Canada ∎ 10 large-flow wastewater treatment units, 24 pump houses and eight potable water production units in Canada.
|
| Precision Drilling Corporation 2016 Annual Report | 9 | |||||||||
Adjusted EBITDA and funds provided by operations are Non-GAAP measures. See page 5 for more information.
Financial Highlights
|
| |||||||||||||||||||||||
Year ended December 31 (thousands of dollars, except where noted) | 2016 | | % increase/ (decrease | ) | 2015 | | % increase/ (decrease | ) | 2014 | | % increase/ (decrease | ) | ||||||||||||
Revenue | 951,411 | (38.8 | ) | 1,555,624 | (33.8 | ) | 2,350,538 | 15.8 | ||||||||||||||||
Adjusted EBITDA | 228,075 | (51.9 | ) | 473,865 | (40.8 | ) | 800,370 | 25.3 | ||||||||||||||||
Adjusted EBITDA % of revenue | 24.0% | 30.5% | 34.1% | |||||||||||||||||||||
Net earnings (loss) | (155,555 | ) | (57.2 | ) | (363,436 | ) | (1,196.3 | ) | 33,152 | (82.7 | ) | |||||||||||||
Cash provided by operations | 122,508 | (76.3 | ) | 517,016 | (24.0 | ) | 680,159 | 58.9 | ||||||||||||||||
Funds provided by operations | 105,375 | (70.5 | ) | 357,090 | (48.8 | ) | 697,474 | 51.0 | ||||||||||||||||
Investing activities | ||||||||||||||||||||||||
Capital spending | ||||||||||||||||||||||||
Expansion | 148,887 | (58.8 | ) | 361,425 | (36.7 | ) | 571,383 | 102.5 | ||||||||||||||||
Upgrade | 19,862 | (59.0 | ) | 48,487 | (64.5 | ) | 136,475 | (3.3 | ) | |||||||||||||||
Maintenance and infrastructure | 34,723 | (28.8 | ) | 48,798 | (67.2 | ) | 148,832 | 32.3 | ||||||||||||||||
Proceeds on sale | (7,840 | ) | (19.9 | ) | (9,786 | ) | (90.4 | ) | (101,826 | ) | 661.5 | |||||||||||||
Net capital spending | 195,632 | (56.4 | ) | 448,924 | (40.5 | ) | 754,864 | 44.5 | ||||||||||||||||
Business acquisition | 12,200 | n/m | – | – | – | – | ||||||||||||||||||
Earnings (loss) per share($) | ||||||||||||||||||||||||
Basic | (0.53 | ) | (57.3 | ) | (1.24 | ) | (1,227.3 | ) | 0.11 | (84.1 | ) | |||||||||||||
Diluted | (0.53 | ) | (57.3 | ) | (1.24 | ) | (1,227.3 | ) | 0.11 | (83.3 | ) | |||||||||||||
Dividends per share($) | – | (100.0 | ) | 0.28 | 12.0 | 0.25 | 19.0 | |||||||||||||||||
n/m – calculation not meaningful
Operating Highlights
|
| |||||||||||||||||||||||
Year ended December 31 | 2016 | % increase/ (decrease) | 2015 | % increase/ (decrease) | 2014 | % increase/ (decrease) | ||||||||||||||||||
Contract drilling rig fleet | 255 | 1.6 | 251 | (19.8 | ) | 313 | (4.3 | ) | ||||||||||||||||
Drilling rig utilization days | ||||||||||||||||||||||||
Canada | 12,722 | (26.2 | ) | 17,238 | (47.5 | ) | 32,810 | 7.5 | ||||||||||||||||
U.S. | 11,343 | (46.4 | ) | 21,172 | (39.6 | ) | 35,075 | 15.9 | ||||||||||||||||
International | 2,786 | (31.8 | ) | 4,084 | 1.2 | 4,036 | 13.5 | |||||||||||||||||
Revenue per utilization day | ||||||||||||||||||||||||
Canada(Cdn$) | 21,084 | (10.9 | ) | 23,670 | 6.4 | 22,250 | 0.6 | |||||||||||||||||
U.S.(US$) | 25,601 | (1.2 | ) | 25,901 | 6.5 | 24,330 | 3.2 | |||||||||||||||||
International(US$) | 45,753 | 5.2 | 43,491 | (0.9 | ) | 43,885 | 17.2 | |||||||||||||||||
Operating cost per utilization day | ||||||||||||||||||||||||
Canada(Cdn$) | 10,832 | (6.4 | ) | 11,577 | 8.0 | 10,715 | 1.3 | |||||||||||||||||
U.S.(US$) | 15,003 | 1.1 | 14,839 | 2.5 | 14,480 | (1.2 | ) | |||||||||||||||||
Service rig fleet | 207 | 27.0 | 163 | (7.9 | ) | 177 | (20.3 | ) | ||||||||||||||||
Service rig operating hours | 99,451 | (33.5 | ) | 149,574 | (45.2 | ) | 273,194 | (3.7 | ) | |||||||||||||||
Revenue per operating hour(Cdn$) | 646 | (17.6 | ) | 784 | (13.6 | ) | 907 | 6.2 | ||||||||||||||||
| 10 | Management’s Discussion and Analysis | |||||||||
Financial Position and Ratios
| ||||||||||||
| (thousands of dollars, except ratios) | December 31, 2016 | December 31, 2015 | December 31, 2014 | |||||||||||||
Working capital | 230,874 | 536,815 | 653,630 | |||||||||||||
Working capital ratio | 2.0 | 3.2 | 2.3 | |||||||||||||
Long-term debt | 1,906,934 | 2,180,510 | 1,852,186 | |||||||||||||
Total long-term financial liabilities | 1,946,742 | 2,210,231 | 1,881,275 | |||||||||||||
Total assets | 4,324,214 | 4,878,690 | 5,308,996 | |||||||||||||
Enterprise value(1) | 3,937,737 | 3,337,980 | 3,428,014 | |||||||||||||
Long-term debt to long-term debt plus equity(2) | 0.5 | 0.5 | 0.4 | |||||||||||||
Long-term debt to cash provided by operations | 15.6 | 4.2 | 2.7 | |||||||||||||
Long-term debt to enterprise value | 0.5 | 0.7 | 0.6 | |||||||||||||
(1) Share price multiplied by the number of shares outstanding plus long-term debt minus cash. See page 38 for more information. (2) Net of unamortized debt issue costs. |
| |||||||||||||||
2016 OVERVIEW Crude oil prices have decreased significantly sincemid-2014, resulting in a severe, industry-wide downturn. Persistently low oil and natural gas prices have reduced our customers’ cash flows, causing them to scale back their capital budgets. As a result, drilling activity declined rapidly throughout most of 2015 and into 2016, which had a negative impact our activity and resulting cash flow. In the fourth quarter of 2016 OPEC and certainnon-OPEC countries agreed to production caps, resulting in more stable crude oil prices.
For the year ended December 31, 2016, our net loss was $156 million, or $0.53 per diluted share, compared with net loss of $363 million, or $1.24 per diluted share in 2015. In 2015 we recorded asset decommissioning and asset impairment charges totalling $466 million that,after-tax, reduced net earnings by $329 million and net earnings per diluted share by $1.12.
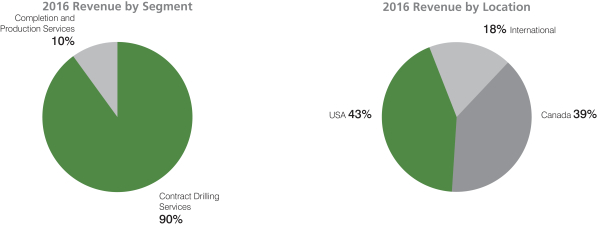
Revenue in 2016 was $951 million, or 39% lower than in 2015, mainly due to lower activity. Contract Drilling Services revenue was down 38%, while Completion and Production Services revenue was down 46%. Our Canadian, U.S. and international drilling activity decreased 26%, 46% and 32%, respectively.
Adjusted EBITDA in 2016 was $228 million, or 52% lower than in 2015. Our Adjusted EBITDA margin was 24%, compared with 30% in 2015. The decrease in Adjusted EBITDA margin was mainly the result of lower utilization in North America and the effect of fixed costs and operating overhead. Adjusted EBITDA margin for the year in our Contract Drilling Services segment was 35%, compared with 39% in the prior year, while Adjusted EBITDA margin from our Completion and Production Services segment was negative 4%, compared with a prior year of 5%. Price competition, resulting from excess industry capacity, and fixed costs allocated to lower activity levels contributed to the negative margin in our Completion and Production Services segment. Our portfolio of term customer contracts, a scalable operating cost structure, and economies achieved through vertical integration of the supply chain help us manage our Adjusted EBITDA margin.
We undertook a number of measures to manage our variable costs during the industry downturn, including reducing our capital and operating expenditures. We also reduced our fixed cost structure by consolidating several of our North American operating facilities, streamlining management reporting structures, and reducing staff, which resulted inone-time costs of $6 million in 2016 and $21 million in 2015.
Capital expenditures for the purchase of property, plant and equipment were $203 million in 2016, a decrease of $255 million over 2015. Capital spending for 2016 included $149 million for expansion capital, $20 million for upgrade capital and $34 million for the maintenance of existing assets and infrastructure. Expansion capital primarily relates to the twonew-build drilling rigs for Kuwait delivered in the fourth quarter.
In 2016, we added fourSuper Series drilling rigs to our fleet, one in Canada, one in the U.S. and two in Kuwait. In December 2016, we also added 48 well service rigs and ancillary equipment in a business acquisition for consideration of $12 million and our coil tubing units and associated equipment.
Under IFRS, we are required to assess the carrying value of our assets in cash generating units (CGUs) when indicators of impairment exist. In addition, CGUs to which goodwill is allocated are required to be tested for impairment annually. Due to low activity levels in 2016 and the outlook for future activity we determined that indicators of impairment existed for our Mexico drilling operation. We completed our tests for this operation and CGUs with goodwill as at December 31, |
| Precision Drilling Corporation 2016 Annual Report | 11 | |||||||||
2016 and determined that no impairment existed. In 2015 we recognized a $282 million impairment of property, plant and equipment and a goodwill impairment charge of $17 million associated with our rentals division. In addition, we incurred asset decommissioning charges of $166 million associated with 79 legacy drilling rigs due to their high maintenance costs, low demand, and highly competitive market.
On February 11, 2016, we suspended our dividend as a result of a debt covenant restriction in our note indentures. SeeFinancial Condition – Covenants on page 36 for more information. |
OUTLOOK
Contracts
|
| Term customer contracts provide a base level of activity and revenue. As of March 3, 2017, we had term contracts in place for an average of 49 rigs: 20 in Canada, 21 in the U.S. and eight internationally for 2017, and an average of 20 rigs for 2018. In Canada, term contracted rigs normally generate 250 utilization days per rig year because of the seasonal nature of wellsite access. In most regions in the U.S. and | 70%
In 2016, approximately 70% of our total contract drilling revenue was generated from rigs under term contracts. | |
| internationally, term contracts normally generate 365 utilization days per rig year. In 2016, we had an average of 62 drilling rigs working under term contracts and revenue from these contracts was approximately 70% of our total contract drilling revenue for the year. | ||
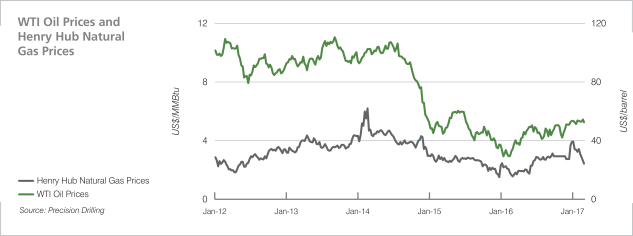
Pricing, Demand and Utilization Global crude oil prices continued their decline early in 2016 as persistent oversupply in the market was compounded by OPEC’s inaction in reducing production quotas, anticipation of Iran’s return to the global oil market, and fears of economic slowdown in China and other emerging economies. However, in the fourth quarter of 2016, OPEC and certain other oil producing countries agreed to control production volumes resulting in a somewhat stabilized global crude oil price with West Texas Intermediate (WTI) crude oil trading between US$51 and US$54. U.S. unconventional oil production continues to increase offsetting declines in many other regions globally. For 2016, WTI averaged US$43.30 per barrel and closed the year at US$53.56 per barrel. For the first two months of 2017 WTI averaged US$53.27 per barrel.
Natural gas prices remained depressed in 2016, due to increased production from unconventional resource development, higher than average storage levels, mild weather, and the lack of a fully developed export market from North America. Natural gas prices, referenced by the average Henry Hub on the New York Mercantile Exchange (NYMEX) price, averaged US$2.48 per MMBtu in 2016, and closed the year at US$3.93 per MMBtu. For the first two months of 2017 Henry Hub averaged US$3.21 per MMBtu.
Despite the industry-wide decline in natural gas drilling activity, U.S. production has continued to grow, keeping prices low. Looking ahead to 2017, natural gas pricing is expected to remain somewhat capped as a result of high inventory levels and the industry’s ability to increase production to respond to increases in demand. Seasonally adjusted drilling activity in 2016 consistently decreased in both Canada and the U.S. and this trend continued until the fourth quarter of 2016. The oil rig count at March 3, 2017 was 27% higher in the U.S. than it was a year ago and 294% higher in Canada. From peak levels achieved in November 2014, the overall North American land oil directed rig count on March 3, 2017 was down 56%.
In general, lower oil prices have caused producers to significantly reduce their drilling budgets in 2015 and 2016, decreasing demand for drilling rigs, resulting in pricing pressure on spot market day rates and significantly depressing industry activity levels. Recently, following OPEC’s actions to limit production to stabilize oil prices, we have experienced increased demand for our rigs and if current commodity prices continue to improve we expect our customers to enhance their drilling programs further strengthening rig demand.
| ||
| 12 | Management’s Discussion and Analysis | |||||||||
With improved oil prices and increasing activity levels we have recently been able to increase pricing on spot market rigs across the majority of our fleet. Should commodity prices continue to improve, we expect further improvements in pricing in the U.S. and the Deep Basin in Canada. We expect pricing improvements in the shallower parts of the Canadian market; however, the increases are not expected to be of the same magnitude as other North American markets in which we operate.
In 2016, the Canadian dollar strengthened relative to the U.S. dollar, as crude oil prices stabilized somewhat and the Canadian government enacted fiscal stimulus. The Canadian dollar averaged US$0.7544 (Cdn$/US$1.3255) for 2016, and closed the year at US$0.7448 (Cdn$/US$1.3427). The lower Canadian dollar relative to the U.S. dollar serves to partially offset the impact of lower U.S. dollar-denominated crude oil and natural gas prices for Canadian exploration and production companies. | ||
International We currently have 17 rigs in Mexico and the Middle East, with eight working under term contracts.
Upgrading the Fleet The industry trend toward more complex drilling programs has accelerated the retirement of older generation, less capable rigs. Over the past several years, we and some of our competitors have been upgrading the drilling rig fleet by building new rigs, upgrading existing rigs, and decommissioning lower capacity rigs. We believe this retooling of the industry-wide fleet has been making legacy rigs virtually obsolete in North America.
After an eight-yearnew-build program, the upgrading of a number of existing rigs, and the cumulative decommissioning of 236 legacy rigs, our fleet now consists of 239 Tier 1 rigs with 16 additional rigs that are good candidates for upgrade.
Capital Spending We expect capital spending in 2017 to be $108 million, including $4 million for expansion capital, $52 million for maintenance and infrastructure expenditures; and $52 million to upgrade existing rigs. We expect that the $108 million will be split $102 million in the Contract Drilling segment and $6 million in the Completion and Production Services segment. Precision’s sustaining and infrastructure capital plan is based on currently anticipated activity levels for 2017. If we can obtain attractive term contracts we would consider additional upgrade and expansion capital opportunities. Maintenance capital is variable and will increase or decrease with activity. |
| Precision Drilling Corporation 2016 Annual Report | 13 | |||||||||
|

| 14 | Management’s Discussion and Analysis | |||||||||
Precision operates in the energy services business, which is an inherently challenging cyclical industry. We depend on oil and natural gas exploration and production companies to contract our services as part of their development activities. The economics of their business are dictated by the current and expected future margin between their finding and development costs and the eventual market price for the commodities they produce: crude oil, natural gas, and natural gas liquids.
Commodity Prices Cash flow to fund exploration and development is dependent on commodity prices: higher prices increase cash flow and encourage investment and when prices decline, the opposite is true.
Oil can be transported relatively easily, so it is generally priced in a global market that is influenced by an array of economic and political factors. Oil prices were relatively strong between 2009 and 2014, as supply and demand fundamentals remained tight. Strong prices contributed to significant drilling activity in North America, resulting in supply growth, particularly from shale plays in the U.S. This activity, combined with slower than expected global demand growth and sustained production levels from OPEC, led to a supply-demand imbalance, which resulted in price deterioration beginning in late 2014 and continuing through 2016. In the fourth quarter of 2016, in an effort to rebalance global supply and demand, OPEC countries and certainnon-OPEC oil producing countries agreed to new production targets. This announcement, along with the results of reduced oil drilling, worked to stabilize the price of oil during the first couple of months in 2017.
Natural gas and natural gas liquids continue to be priced more regionally. In North America, natural gas demand largely depends on the weather. Colder winter temperatures, and to a lesser extent, warmer summer temperatures, result in greater natural gas demand. Other demand drivers, such as natural gas fired power generation, industrial applications, and transportation, have shown positive growth over the past several years driven by a preference for natural gas over coal, favourable regulation, and lower prices. The potential for liquefied natural gas (LNG) export development in both Canada and the U.S. also could serve as a catalyst for natural gas directed drilling activity over the medium to long term.
The key driver of price continues to be increased production from unconventional shale gas drilling. Since the cold winter of 2014, prices for natural gas in North America have been depressed, as supplies of unconventional natural gas have increased and current inventory levels are viewed as adequate to keep North American markets well supplied. |
Average Oil and Natural Gas Prices
| ||||||||||||
| 2016 | 2015 | 2014 | ||||||||||
Oil | ||||||||||||
WTI(US$ per barrel) | 43.30 | 48.77 | 93.06 | |||||||||
Natural gas | ||||||||||||
Canada | ||||||||||||
AECO ($ per MMBtu) | 2.14 | 2.70 | 4.45 | |||||||||
U.S. | ||||||||||||
Henry Hub(US$ per MMBtu) | 2.48 | 2.60 | 4.33 |
| Precision Drilling Corporation 2016 Annual Report | 15 | |||||||||
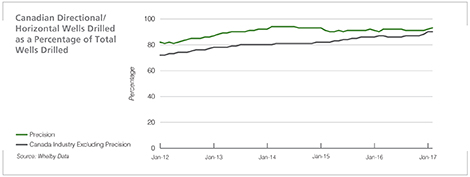
New Technology Technological advancements in horizontal drilling, fracturing and stimulation have brought about a shift in development from conventional to unconventional natural gas and oil reservoirs. This is giving companies cost-effective access to more complex reservoirs in North America in existing and new basins that have not been economic in the past.
The following chart shows the consistent trend away from vertical wells to more demanding directional/horizontal well programs, which require higher capacity equipment and greater technical expertise for drilling. These trends are driving the demand for Tier 1 drilling rigs, which garner premium contract rates.
|
| 16 | Management’s Discussion and Analysis | |||||||||
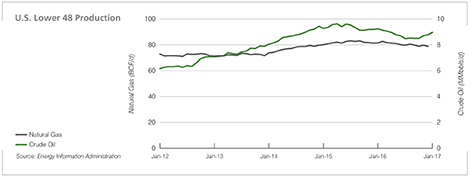
These technical innovations have been a major factor in the increase in oil and natural gas production in the U.S.
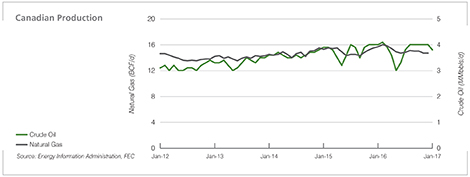
Natural gas production in Canada has been flat because of lower natural gas directed drilling due to pricing pressure and Canada’s lack of an export market other than the U.S.
|
| Precision Drilling Corporation 2016 Annual Report | 17 | |||||||||
Drilling Activity The North American land drilling industry is almost two and a half years into a deep downturn, a result of lower commodity prices pushing customer spending down and decreasing drilling demand.
In 2016, the industry drilled 3,963 wells in western Canada, compared with 5,241 in 2015 and 10,942 in 2014. Total industry drilling operating days were 42,391 in 2016 compared with 64,880 in 2015 and 131,021 in 2014. Average industry drilling operating days per well was 10.7 compared with 12.4 in 2015 and 12.0 in 2014. From 2015 to 2016 the average depth of a well increased 2% compared with an increase of 14% from 2014 to 2015.
In 2016 approximately 11,200 wells were started onshore in the U.S., compared with approximately 20,400 in 2015 and 37,900 in 2014. |
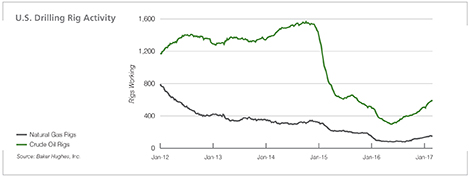
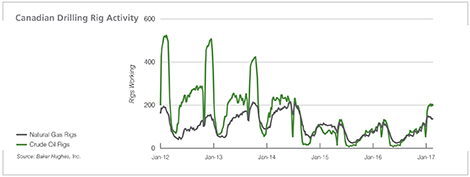
In Canada, there has been relative strength in natural gas and natural gas liquids drilling activity related to deep basin drilling in northwestern Alberta and northeastern British Columbia, while in the U.S. the bias towardsoil-directed drilling continues. In 2016, approximately 48% of the Canadian industry’s active rigs and 80% of the U.S. industry’s active rigs were drilling for oil targets, compared with 45% for Canada and 77% for the U.S. in 2015.
The graphs below show the shift in drilling activity to oil targets since 2012, in both the U.S. and Canada. The difference in activity has narrowed with the rapid decline in the price of crude oil in late 2014. The Canadian drilling rig activity graph also shows how Canadian drilling activity fluctuates with the seasons, a market dynamic that generally is not present in the U.S.
|
| 18 | Management’s Discussion and Analysis | |||||||||
The contract drilling business is highly competitive, with many industry participants. We compete for drilling contracts that are often awarded in a competitive bid process.
We believe potential customers focus on pricing and rig availability when selecting a drilling contractor, but also consider many other things, including drilling capabilities and condition of rigs, quality of rig crews, breadth of service, and safety record, among others.
ProvidingHigh Performance, High Value services to our customers is the core of our competitive strategy. We deliverHigh Performance through passionate people supported by quality business systems, drilling technology, equipment and infrastructure designed to optimize results and reduce risks. We createHigh Value by operating safely and sustainably, lowering our customers’ risks and costs while improving efficiency, developing our people, and generating superior financial returns for our investors.
Operating Efficiency We keep customer well costs down by maximizing the efficiency of operations in several ways: ∎ using innovative and advanced drilling technology that is efficient and reduces costs ∎ having equipment that is geographically dispersed, reliable and well maintained ∎ monitoring our equipment to minimize mechanical downtime ∎ managing operations effectively to keepnon-productive time to a minimum ∎ compensating our executives and eligible employees based on performance against safety, operational, employee retention, and financial measures.
Efficient, Cost-Reducing Technology We focus on providing efficient, cost-reducing drilling technology. Design innovations and technology improvements, such as multi-well pad capability and mobility between wells, capture incremental time savings during the drilling process.
OurSuper Seriesdrillingrigs, have a broad range of features to meet a diverse range of customer needs, from drilling shallow- to medium-depth wells to exploiting the deep, unconventional shale plays that have driven the North American energy production boom over the past decade. Available features include alternating current (AC) power, digitized control systems, integrated top drive,bi-directional pad walking systems formulti-pad well drilling, highly mechanized pipe handling and high capacity mud pumps. OurSuper Series fleet includes a number of smaller, fast-moving, hydraulically-powered mechanized rigs that are optimized for shallow- to medium-depth resource plays found across North America.
Broad Geographic Footprint Geographic proximity and fleet versatility supportthe High Performance, High Value services we provide to our customers. Our large, diverse fleet of rigs is strategically deployed across the most active drilling regions in North America, including all major unconventional oil and natural gas basins.
Managing Downtime Reliable and well-maintained equipment minimizes downtime andnon-productive time during operations. We manage mechanical downtime through preventative maintenance programs, detailed inspection processes, an extensive fleet of strategically-located spare equipment, and anin-house supply chain. We minimizenon-productive time (to move,rig-up andrig-out) by utilizing walking and skidding systems, reducing the number of move loads per rig, and using mechanized equipment for safer and quicker rig component connections.
|
| Precision Drilling Corporation 2016 Annual Report | 19 | |||||||||
Tracking Our Results We unitize key financial information per day and per hour, and compare these measures to established benchmarks and past performance. We evaluate the relative strength of our financial position by monitoring our working capital, debt ratios, and returns on capital employed. We track industry rig utilization statistics to evaluate our performance against competitors.
|
We reward executives and eligible employees through incentive compensation plans for performance against the following measures:
∎ Safety performance – total recordable incident frequency per 200,000man-hours. Measured against prior year performance and current year industry performance in Canada and the U.S. ∎ Operational performance – rig down time for repair as measured by time not billed to the customer. Measured against a predetermined target of available billable time. ∎ Key field employee retention – senior field employee retention rates. Measured against predetermined target rates of retention. ∎ Financial performance – adjusted EBITDA, adjusted cash flow and return on capital employed. Measured against predetermined targets. ∎ Investment returns – total shareholder return performance (including dividends) against a group of industry peers, over a three-year period. Measured against predetermined group of companies with similar business operations that we compete with for investors.
Top Tier Service We pride ourselves on providing quality equipment operated by experienced and well-trained crews. We also strive to align our capabilities with evolving technical requirements associated with more complex well bore programs.
High Performance Rig Fleet Our fleet of drilling rigs is well positioned to address the unconventional drilling programs of our customers. The vast majority of our drilling rigs have been designed or significantly upgraded to drill horizontal wells. With a breadth of horsepower types and drilling depth capabilities, our large fleet can address every type of onshore unconventional oil and natural gas drilling opportunity in North America.
Our service rigs provide completion, workover, abandonment, well maintenance, high pressure operations and critical sour gas well work, and wellre-entry preparation across the Western Canada Sedimentary Basin and in the northern U.S. Service rigs are supported by four field locations in Alberta, two in Saskatchewan, and one each in Manitoba, British Columbia and North Dakota.
Snubbing units complement traditional natural gas well servicing by allowing customers to work on wells while they are pressurized and production has been suspended. We have two kinds of snubbing units:rig-assist and self-contained. Self-contained units do not require a service rig on site and are capable of snubbing and performing many other well servicing procedures. Included in our self-contained units are three patentedL-frame units, which are more efficient in the rig up and rig out process than standard self-contained units.
Upgrade Opportunities We leverage our internal manufacturing and repair capabilities and inventory of quality rigs to address market demand through upgraded drilling and service rigs. For drilling rigs, the upgrade is typically performed at the request of a customer and includes a term contract. Certain upgrades have sometimes resulted in a change in tier classification.
Ancillary Equipment and Services An inventory of equipment (portable top drives, loaders, boilers, tubulars, and well control equipment) supports our fleet of drilling and service rigs. We also maintain an inventory of key rig components to minimize downtime due to equipment failure.
We benefit from internal services for equipment certifications and component manufacturing provided by Rostel Industries and for standardization and distribution of consumable oilfield products through Columbia Oilfield Supply in Canada and PD Supply in the U.S.
Precision Rentals supplies customers with an inventory of specialized equipment and wellsite accommodations. Precision Camp Services supplies meals and provides accommodation for crews at remote oilfield worksites. Terra Water Systems plays an essential role in providing water treatment services as well as potable water production plants for Precision Camp Services and other camp facilities. |
| 20 | Management’s Discussion and Analysis | |||||||||
Technical Centres We operate two contract drilling technical centres, one in Nisku, Alberta and one in Houston, Texas. We also operate one completion and production services technical centre in Red Deer, Alberta. These centres accommodate our technical service and field training groups and enable us to consolidate support and training for our operations. Both of our contract drilling technical centres include fully functioning training rigs with the latest drilling technologies. In addition, our Houston facility accommodates our rig manufacturing group. | ||
People | ||
| Having an experienced, high performance crew is a competitive strength and highly valued by our customers. There are often shortages of industry manpower in peak operating periods. We rely heavily on our | Toughnecks (www.toughnecks.com) has been a highly successful field recruiting program for us since we introduced it in 2008. | |
| safety record, investment in employee development, and reputation to | ||
attract and retain employees. Our people strategies focus on initiatives that provide a safe and productive work environment, opportunity for advancement, and added wage security. We have centralized personnel, orientation, and training programs in Canada and the U.S. Our people strategies have enabled us to have sufficient and good quality field crews at all points in the industry cycle.
Systems Our fully integrated, enterprise-wide reporting system has improved business performance through real-time access to information across all functional areas. All of our divisions operate on a common integrated system using standardized business processes across marketing, equipment maintenance, procurement, manufacturing, HSE, inventory control, engineering, finance, payroll and human resources.
We continue to invest in information systems that provide competitive advantages. Electronic links between field and financial systems provide accuracy and timely processing. This repository of rig data improves response time to customer inquiries. Rig manufacturing projects also benefit from scheduling and budgeting tools, which identify and help leverage economies of scale as construction demands increase.
Safe Operations Safety, environmental stewardship and employee wellness are critical for us and for our customers and are the foundation of our culture.
| ||
| Safety performance is a fundamental contributor to operating performance and the financial results we generate for our shareholders. We track safety using Total Recordable Incident Frequency (TRIF), an industry standard. This statistic benchmarks our successes and isolates | Target Zero
Our safety vision for eliminating workplace incidents is a core belief that all injuries can be prevented. | |
areas for improvement. We have taken it to another level by tracking and measuring all injuries, regardless of severity, because they are leading indicators for the potential for more serious events. In 2016, 88% of our drilling rigs and 96% of our service rigs achieved Target Zero.
We continuously review our rig designs and components and use advanced technologies to improve the life cycle, maintain safety and operational efficiency, reduce energy use, and manage our energy and resources.
Together with our customers, we are continuously looking for opportunities to reduce our consumption ofnon-renewable resources and reduce our environmental footprint. We use technology to minimize our impact on the environment, including:
∎ heat recovery and distribution systems ∎ power generation and distribution ∎ fuel management ∎ fuel type ∎ noise reduction ∎ recycling of used materials ∎ use of recycled materials ∎ efficient equipment designs ∎ spill containment. | ||
| Precision Drilling Corporation 2016 Annual Report | 21 | |||||||||
Precision’s vision is to be recognized as theHigh Performance, High Value provider of services for global energy exploration and development. We work toward this vision by defining and measuring our results against strategic priorities we establish at the beginning of every year.
| ||
2016 Strategic Priorities
|
2016 Results
| |
Maintain adequate liquidity to manage through an extended downturn Sustain adequate liquidity by generating positive operating cash flow, ensuring full access to the Senior Credit Facility, extend the maturity profile of our debt, and begin a multi-year plan for net debt reduction. |
Generated $105 million funds from operations, seeNon-GAAP Measures on page 5
Amended financial ratio covenants under senior Credit Facility to improve access to capital through the industry downturn.
Using cash on hand we reduced our long-term debt outstanding as at December 31, 2016 by approximately $213 million from our balance as at December 31, 2015.
Extended the earliest maturity of our long-term debt by 18 months to November 2020.
| |
SustainHigh Performance, High Value service offering Continue to deliver maximum efficiency and lower risks to support development drilling programs by operating the highest quality assets in the industry with well-trained, professional crews supported by robust systems that eliminate manual processes and improve automation throughout the Precision organization.
|
Leveraged the Nisku Drilling Support Centre and Houston Technical Centre to lower repair, maintenance, and new manufacturing operations costs.
Achieved Target Zero for 88% of our drilling rigs and 96% of our service rigs. | |
Position for an eventual rebound Concurrent withright-sizing the organization for the current downturn, we are also taking steps to prepare for a rebound:
a. Asset integrity – maintain high quality and integrity of our Tier 1 drilling fleet by utilizing spare equipment, avoiding fleet cannibalization and maintaining rigorous equipment standards.
b. People – retain field leadership within the organization, maintain relationships with former crew members and continue to develop leadership and skills of workers within our organization.
c. Strong liquidity – maintain strong liquidity to fund working capital requirements and other short term commitments that arise when activity levels increase. |
For 2017 compared with 2016 gained market share in both Canada and the U.S. as measured by the percent of drilling days in Canada and the average active rigs in the U.S.
Our maintenance standards and spending did not deteriorate during the year. As a result, we were able to reactivate over 100 rigs without significant reactivation costs or catch-up purchases of critical components, such as drill pipe.
Delivered fournew-build Super Series rigs, including two in Kuwait, under budget and ahead of schedule.
Exceeded mechanical downtime targets.
Retained field leadership and successfully staffed over 100 incremental rigs with highly-trained crews.
Maintained a strong cash balance and retained access to our revolver throughout the year, drawing only letters of credit.
| |
Our corporate and competitive growth strategies are designed to optimize resource allocation and differentiate us from the competition, generating value for investors. Despite the downturn in industry activity, we see opportunities for long-term growth in our Contract Drilling Services land drilling rig fleet both in North America and internationally. Unconventional drilling is the primary opportunity in the North American marketplace. Unconventional resource development requires advanced Tier 1 drilling rigs and other highly developed services that facilitate the drilling of reliable, predictable and repeatable horizontal wells. The completion and production work associated with unconventional wells provides the most profitable growth opportunities for our Completion and Production Services segment. | ||
Strategic Priorities for 2017
1. Deliver High Performance, High Value service offerings in an improving demand environment while demonstrating fixed cost leverage.
2. Commercialize rig automation and efficiency-driven technologies across our Super Series fleet.
3. Maintain strict financial discipline in pursuing growth opportunities with a focus on free cash flow and debt reduction. | ||||||
| 22 | Management’s Discussion and Analysis | |||||||||
Adjusted EBITDA and operating earnings (loss) are Non-GAAP measures. See page 5 for more information.
Consolidated Statements of Earnings (Loss) Summary
|
| |||||||||||
| Year ended December 31(thousands of dollars) | 2016 | 2015 | 2014 | |||||||||
Revenue | ||||||||||||
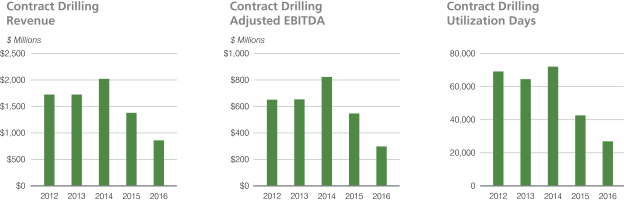
Contract Drilling Services | 855,999 | 1,378,336 | 2,017,110 | |||||||||
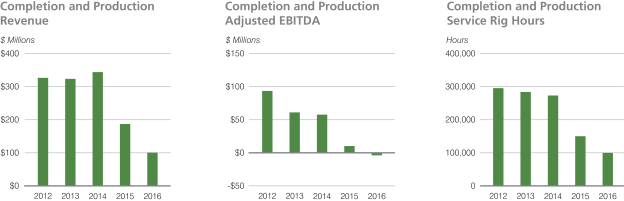
Completion and Production Services | 100,049 | 186,317 | 343,556 | |||||||||
Inter-segment elimination | (4,637 | ) | (9,029 | ) | (10,128 | ) | ||||||
| 951,411 | 1,555,624 | 2,350,538 | ||||||||||
Adjusted EBITDA(1) | ||||||||||||
Contract Drilling Services | 296,651 | 535,394 | 812,567 | |||||||||
Completion and Production Services | (3,649 | ) | 10,239 | 57,954 | ||||||||
Corporate and Other | (64,927 | ) | (71,768 | ) | (70,151 | ) | ||||||
| 228,075 | 473,865 | 800,370 | ||||||||||
Depreciation and amortization | 391,659 | 486,655 | 448,669 | |||||||||
Gain onre-measurement of property, plant and equipment | (7,605 | ) | – | – | ||||||||
Loss on asset decommissioning | – | 166,486 | 126,699 | |||||||||
Impairment of property, plant and equipment | – | 281,987 | – | |||||||||
Operating earnings (loss) | (155,979 | ) | (461,263 | ) | 225,002 | |||||||
Impairment of goodwill | – | 17,117 | 95,170 | |||||||||
Foreign exchange | 6,008 | (33,251 | ) | (946 | ) | |||||||
Finance charges | 146,360 | 121,043 | 109,701 | |||||||||
Loss on redemption and repurchase of unsecured senior notes | 239 | – | – | |||||||||
Earnings (loss) before income taxes | (308,586 | ) | (566,172 | ) | 21,077 | |||||||
Income taxes | (153,031 | ) | (202,736 | ) | (12,075 | ) | ||||||
Net earnings (loss) | (155,555 | ) | (363,436 | ) | 33,152 | |||||||
(1) See Non-GAAP Measures on page 5 of this report.
Results by Geographic Segment
|
| |||||||||||
| Year ended December 31 (thousands of dollars) | 2016 | 2015 | 2014 | |||||||||
Revenue | ||||||||||||
Canada | 374,452 | 589,759 | 1,077,814 | |||||||||
U.S. | 418,302 | 759,472 | 1,096,918 | |||||||||
International | 169,286 | 226,129 | 195,487 | |||||||||
Inter-segment elimination | (10,629 | ) | (19,736 | ) | (19,681 | ) | ||||||
| 951,411 | 1,555,624 | 2,350,538 | ||||||||||
Total assets | ||||||||||||
Canada | 1,738,853 | 2,077,077 | 2,434,774 | |||||||||
U.S. | 1,861,908 | 2,096,214 | 2,244,867 | |||||||||
International | 723,453 | 705,399 | 629,355 | |||||||||
| 4,324,214 | 4,878,690 | 5,308,996 | ||||||||||
| Precision Drilling Corporation 2016 Annual Report | 23 | |||||||||
Net loss in 2016 was $156 million, or $0.53 per diluted share, compared with net loss of $363 million, or $1.24 per diluted share, in 2015. In 2015 we recorded apre-tax asset decommissioning charge, impairment of property, plant and equipment and goodwill write down totalling $466 million that reducedafter-tax net earnings by $329 million and net earnings per diluted share by $1.12.
Revenue was $951 million (39% lower than 2015) because of lower activity in all of our operations.
Adjusted EBITDA in 2016 was $228 million (52% lower than 2015), mainly because activity levels were lower in all of our operations. Activity, as measured by drilling utilization days, decreased 26% in Canada, 46% in the U.S., and 32% internationally compared with 2015.
Impairment Under IFRS, we are required to assess the carrying value of our assets inCGUs containing goodwill annually and in any CGUs when indicators of impairment exist. With activity and resultsin-line with expectations and the stabilization of commodity prices in the fourth quarter indications of impairment did not exist as at any reporting dates in 2016 with the exception of our Mexico contract drilling operations as at December 31, 2016. As a result we completed an impairment test on only the CGUs that contained goodwill and our Mexico drilling business. The test involves determining a value in use based on a multi-year discounted cash flow approach with cash flow assumptions based on historical and expected future results. The resulting value in use is then compared to the carrying value of the CGU. The tests did not result in any impairments for the year ended December 31, 2016.
As a result of continued low commodity prices and their impact on industry activity, we completed an impairment test for all of our CGUs as at December 31, 2015. As a result of these tests, it was determined that property, plant and equipment was impaired by US$73 million in our U.S. contract drilling business, by US$49 million in our international contract drilling business, and by US$26 million in our Mexico contract drilling business. From similar tests during the third quarter of 2015, it was determined that property, plant and equipment in our Canadian well service business were impaired by $73 million and property, plant and equipment in our U.S. completion and production business were impaired by $7 million. In addition, goodwill associated with our rentals cash generating unit was impaired for its full value of $17 million. These impairment adjustments were reflected in our third quarter 2015 financial statements.
Foreign Exchange We recognized a foreign exchange loss of $6 million in 2016 (2015 – $33 million gain) because the Canadian dollar strengthened in value against the U.S. dollar and this affected the net U.S. dollar denominated monetary position in our Canadian dollar-based companies.
Finance Charges Finance charges were $146 million, an increase of $25 million compared with 2015. The increase is the result of the recognition of $14 million of interest revenue in the comparative period related to an income tax dispute settlement, the recognition of deferred financing costs related to the early redemption of our senior unsecured notes and the impact of foreign exchange on our U.S. dollar denominated interest partly offset by a reduction in interest expense related to debt retired during the year.
Income Taxes Income taxes were a recovery of $153 million, $50 million lower than the $203 million recovery booked in 2015 mainly due to lower operating results in 2015 from the loss on asset decommissioning and impairment charges in the year.
|
| 24 | Management’s Discussion and Analysis | |||||||||
Net loss in 2015 was $363 million, or $1.24 per diluted share, compared with net earnings of $33 million, or $0.11 per diluted share, in 2014. During the year, we recorded apre-tax asset decommissioning charge, impairment of property, plant and equipment and goodwill write down totalling $466 million that reducedafter-tax net earnings by $329 million and net earnings per diluted share by $1.12 compared with apre-tax asset decommissioning charge and goodwill write down totalling $222 million that reduced net earnings by $182 million and net earnings per diluted share by $0.62 in 2014.
Revenue was $1,556 million, 34% lower than 2014. The decrease was the result of lower activity from our North American operations.
Adjusted EBITDA in 2015 was $474 million, 41% lower than 2014, primarily because of lower activity levels in all of our North American based operations. Activity, as measured by drilling utilization days, decreased 48% in Canada and 40% in the U.S., and increased 1% internationally compared with 2014.
Impairment As at December 31, 2015, it was determined that property, plant and equipment was impaired by US$73 million in our U.S. contract drilling business, by US$49 million in our international contract drilling business, and by US$26 million in our Mexico contract drilling business.
As a result of similar tests during the third quarter of 2015, it was determined that property, plant and equipment in our Canadian well service business were impaired by $73 million and property, plant and equipment in our U.S. completion and production business were impaired by $7 million. In addition, goodwill associated with our rentals cash generating unit was impaired for its full value of $17 million.
Foreign Exchange We recognized a foreign exchange gain of $33 million in 2015 (2014 – $1 million) because the Canadian dollar weakened in value against the U.S. dollar and this affected the net U.S. dollar denominated monetary position in our Canadian dollar-based companies.
Finance Charges Finance charges were $121 million, an increase of $11 million compared with 2014. The increase is the result of the impact of the weaker Canadian dollar on our U.S. dollar denominated interest and the issuance, in June 2014, of US$400 million 5.25% senior notes due in 2024, partially offset by an increase of $14 million in interest income from the settlement of an income tax dispute.
Income Taxes Income taxes were a recovery of $203 million, $191 million higher than the $12 million recovery booked in 2014 mainly due to lower operating results from the loss on asset decommissioning and impairment charges in the year. |
| Precision Drilling Corporation 2016 Annual Report | 25 | |||||||||
CONTRACT DRILLING SERVICES
Financial Results Adjusted EBITDA and operating earnings (loss) are Non-GAAP measures. See page 5 for more information.
|
| |||||||||||||||||||||||
Year ended December 31 (thousands of dollars, except where noted) | 2016 | % of revenue | 2015 | % of revenue | 2014 | % of revenue | ||||||||||||||||||
Revenue | 855,999 | 1,378,336 | 2,017,110 | |||||||||||||||||||||
Expenses(1) | ||||||||||||||||||||||||
Operating | 518,862 | 60.6 | 781,754 | 56.7 | 1,150,945 | 57.1 | ||||||||||||||||||
General and administrative | 37,446 | 4.4 | 50,279 | 3.6 | 53,598 | 2.7 | ||||||||||||||||||
Restructuring | 3,040 | 0.4 | 10,909 | 0.8 | – | – | ||||||||||||||||||
Adjusted EBITDA(2) | 296,651 | 34.7 | 535,394 | 38.8 | 812,567 | 40.3 | ||||||||||||||||||
Depreciation and amortization | 348,005 | 40.7 | 439,261 | 31.9 | 381,465 | 18.9 | ||||||||||||||||||
Loss on asset decommissioning | – | – | 165,109 | 12.0 | 97,947 | 4.9 | ||||||||||||||||||
Impairment of property, plant and equipment | – | – | 202,414 | 14.7 | – | – | ||||||||||||||||||
Operating earnings (loss)(2) | (51,354 | ) | (6.0 | ) | (271,390 | ) | (19.7 | ) | 333,155 | 16.5 | ||||||||||||||
(1) Certain expenses in the prior year have been reclassified to conform to current year presentation. (2) See Non-GAAP measures on page 5 of this report.
2016 Compared with 2015 Revenue from Contract Drilling Services was $856 million, 38% lower than 2015, mainly because of lower activity in all of our contract drilling operations and lower average day rates in North America.
In 2016, total shortfall payments in Canada and idle but contracted revenue in the U.S. were $25 million and US$42 million, compared with $29 million and US$39 million, respectively in 2015.
Operating expenses were 61% of revenue, compared with 57% in 2015. On a per utilization day basis, operating costs for our international drilling rig division was 13% higher than 2015 due to fixed costs spread across lower activity as more rigs were on standby during the year. In the U.S., operating costs on a per utilization day basis were 1% higher than 2015 because of fixed costs spread across lower activity partially offset by cost saving initiatives. In Canada, operating costs on a per utilization day basis were lower than the prior year by 6% primarily due to cost saving initiatives taken in 2015 and 2016. General and administrative expenses for 2016 were lower than 2015 as a result of cost saving initiatives undertaken during 2015 and 2016, partially offset by the impact of the weakening Canadian dollar on our U.S. dollar denominated costs. Restructuring costs incurred in 2016 and 2015 were primarily severance related to right size the business for current activity levels.
Operating loss was $51 million, compared with operating loss of $271 million in 2015. Operating results in 2016 were negatively impacted by the decrease in drilling activity in all of the regions in which we operate. Depreciation in the year was down from 2015 due to lower capital asset base as a result of prior year asset decommissioning’s and impairments. Operating results in 2015 were affected by the impairment of property, plant and equipment and the decommissioning of certain drilling rigs and spare equipment. Excluding asset impairment and decommissioning charges, operating earnings would have been $96 million in 2015.
Capital expenditures in 2016 were $196 million: ∎ $149 million – to expand our asset base ∎ $20 million – to upgrade existing equipment ∎ $27 million – on maintenance and infrastructure.
Most of the expansion capital was for twonew-build rigs for our Kuwait division that were placed into service in the fourth quarter of 2016. In addition, we added twonew-build rigs, one in Canada and one in the U.S. earlier in 2016. |
| |||||||||||||||||||||||
| 26 | Management’s Discussion and Analysis | |||||||||
Operating Statistics
|
| |||||||||||||||||||||||
| Year ended December 31 | 2016 | % increase/ (decrease) | 2015 | % increase/ (decrease) | 2014 | % increase/ (decrease) | ||||||||||||||||||
Number of drilling rigs(year-end) | 255 | 1.6 | 251 | (19.8 | ) | 313 | (4.3 | ) | ||||||||||||||||
Drilling utilization days (operating and moving) | ||||||||||||||||||||||||
Canada | 12,722 | (26.2 | ) | 17,238 | (47.5 | ) | 32,810 | 7.5 | ||||||||||||||||
U.S. | 11,343 | (46.4 | ) | 21,172 | (39.6 | ) | 35,075 | 15.9 | ||||||||||||||||
International | 2,786 | (31.8 | ) | 4,084 | 1.2 | 4,036 | 13.5 | |||||||||||||||||
Drilling revenue per utilization day | ||||||||||||||||||||||||
Canada (Cdn$) | 21,084 | (10.9 | ) | 23,670 | 6.4 | 22,250 | 0.6 | |||||||||||||||||
U.S. (US$) | 25,601 | (1.2 | ) | 25,901 | 6.5 | 24,330 | 3.2 | |||||||||||||||||
International (US$) | 45,753 | 5.2 | 43,491 | (0.9 | ) | 43,885 | 17.2 | |||||||||||||||||
Drilling statistics (Canadian operations only) | ||||||||||||||||||||||||
Wells drilled | 962 | (28.8 | ) | 1,351 | (56.3 | ) | 3,091 | (3.7 | ) | |||||||||||||||
Average days per well | 11.7 | 2.6 | 11.4 | 21.3 | 9.4 | 11.9 | ||||||||||||||||||
Metres drilled (hundreds) | 2,548 | (21.0 | ) | 3,224 | (45.0 | ) | 5,864 | 5.2 | ||||||||||||||||
Average metres per well | 2,649 | 11.0 | 2,386 | 25.8 | 1,897 | 9.3 | ||||||||||||||||||
Canadian Drilling Revenue from Canadian drilling was down $140 million, or 34%, from 2015. Drilling rig activity, as measured by utilization days, was down 26% while average day rates were down 11%.
Adjusted EBITDA was $124 million, 32% lower than 2015, because of lower drilling activity and lower average day rates partially offset by cost reduction initiatives.
Depreciation expense for the year was $48 million lower than 2015 because of a lower asset base after decommissioning equipment in 2015.
Drilling Statistics – Canada In 2016, we completed onenew-build rig bringing our Canadian 2016year-end net rig count to 135 (2015 –134).
The industry drilling rig fleet has decreased – there were approximately 668 rigs at the end of 2016 compared with 721 at the end of 2015. Our operating day utilization was 22% (2015 – 24%), compared with industry utilization of 17% (2015 – 23%).
U.S. Drilling Revenue from U.S. drilling was lower than 2015 by US$256 million, or 47%. Drilling rig activity, as measured by utilization days, was down 46% while average revenue per day was down 1%.
Adjusted EBITDA was US$102 million, 51% lower than US$210 million in 2015, mainly because of lower industry activity.
Depreciation expense for the year was US$71 million lower than 2015 because of lower a capital asset base as a result of prior year asset decommissioning’s and impairments.
Drilling Statistics – U.S. In 2016, we completed onenew-build rig leaving our U.S.year-end net rig count at 103 (2015 – 102). In 2016, we averaged 31 rigs working, a 47% decrease from 58 rigs in 2015. The industry drilling fleet declined as well, averaging 486 active land rigs in 2016, down 49% from 944 rigs in 2015.
Our average dayrates in the U.S. decreased 1% in 2016 as lower spot market day rates and lower newly contracted day rates were partially offset but an increase from idle but contracted rigs. Turnkey utilization days decreased 63% over 2015 and accounted for approximately 1% of our U.S. rig utilization compared with 2% in 2015. |
| |||||||||||||||||||||||
| Precision Drilling Corporation 2016 Annual Report | 27 | |||||||||
Drilling Statistics – U.S.
|
| |||||||||||||||||||||
2016
| 2015
| 2014
| ||||||||||||||||||||
Precision
| Industry(1)
| Precision
| Industry(1)
| Precision
| Industry(1)
| |||||||||||||||||
| Average number of active land rigs for quarters ended: | ||||||||||||||||||||||
March 31 | 32 | 516 | 80 | 1,353 | 94 | 1,724 | ||||||||||||||||
June 30 | 24 | 397 | 57 | 873 | 93 | 1,802 | ||||||||||||||||
September 30 | 29 | 465 | 51 | 829 | 97 | 1,842 | ||||||||||||||||
December 31 | 39 | 567 | 45 | 720 | 100 | 1,856 | ||||||||||||||||
| Annual average | 31 | 486 | 58 | 944 | 96 | 1,806 | ||||||||||||||||
(1) Source: Baker Hughes
COMPLETION AND PRODUCTION SERVICES
Financial Results Adjusted EBITDA and operating earnings (loss) are Non-GAAP measures. See page 5 for more information. |
| |||||||||||||||||||||
| Year ended December 31 (thousands of dollars, except where noted) | 2016
| % of revenue
| 2015
| % of
| 2014
| % of
| ||||||||||||||||||
Revenue | 100,049 | 186,317 | 343,556 | |||||||||||||||||||||
Expenses(1) | ||||||||||||||||||||||||
Operating | 93,070 | 93.0 | 161,968 | 86.9 | 273,248 | 79.5 | ||||||||||||||||||
General and administrative | 8,607 | 8.6 | 10,476 | 5.6 | 12,354 | 3.6 | ||||||||||||||||||
Restructuring | 2,021 | 2.0 | 3,634 | 2.0 | – | – | ||||||||||||||||||
Adjusted EBITDA(2) | (3,649 | ) | (3.6 | ) | 10,239 | 5.5 | 57,954 | 16.9 | ||||||||||||||||
Depreciation and amortization | 29,272 | 29.3 | 32,396 | 17.4 | 58,621 | 17.1 | ||||||||||||||||||
Gain onre-measurement of property, plant and equipment | (7,605 | ) | n/m | – | – | – | – | |||||||||||||||||
Loss on asset decommissioning | – | – | 1,377 | 0.7 | 28,752 | 8.4 | ||||||||||||||||||
Impairment of property, plant and equipment | – | – | 79,573 | 42.7 | – | – | ||||||||||||||||||
Operating loss(2) | (25,316 | ) | (25.3 | ) | (103,107 | ) | (55.3 | ) | (29,419 | ) | (8.6 | ) | ||||||||||||
(1) Certain expenses in the prior year have been reclassified to conform to current year presentation. (2) See Non-GAAP Measures on page 5 of this report. n/m– calculation not meaningful
Revenue from Completion and Production Services was $100 million in 2016, 46% lower than 2015, mainly because of lower activity and pricing across all of our product lines.
Operating loss was $25 million in 2016, compared with a loss of $103 million in 2015, because of lower activity, lower average rates and the charge for impairment of property, plant and equipment in 2015.
Operating expenses were 93% of revenue, 6% points higher than 2015, mainly because of lower activity and lower revenue rates.
Depreciation was 10% less than 2015 because of a lower asset base from asset decommissioning, impairments and disposals.
Capital expenditures were $1 million, for the maintenance of existing assets and infrastructure. We also acquired 48 well service rigs and ancillary equipment in a business acquisition for consideration of $12 million and our coil tubing assets.
Revenue from Precision Well Servicing in Canada was $58 million, down $42 million from 2015 as activity was down 30% and average revenue rates were down 17%.
Revenue from our U.S. based completion and production businesses was US$8 million, 66% lower than 2015. The decrease was the result of lower activity and lower average rates.
|
| |||||||||||||||||||||||
| Revenue from Precision Rentals was $19 million, 21% lower than 2015. The decrease was due to lower activity partially offset by higher average revenue rates. | ||||||||||||||||||||||||
| 28 | Management’s Discussion and Analysis | |||||||||
Revenue from Precision Camp Services was $6 million, 70% lower than 2015, because of a decrease in camp activity. Precision operated four base camps and 43 drill camps during 2016.
Operating Results
|
| |||||||||||||||||||||||
| Year ended December 31 | 2016 | % increase/ (decrease) | 2015 | % increase/ (decrease) | 2014 | % increase/ (decrease) | ||||||||||||||||||
Number of service rigs (end of year) | 207 | (27.0 | ) | 163 | (7.9 | ) | 177 | (20.3 | ) | |||||||||||||||
Service rig operating hours | 99,451 | (33.5 | ) | 149,574 | (45.2 | ) | 273,194 | (3.7 | ) | |||||||||||||||
Revenue per operating hour | 646 | (17.6 | ) | 784 | (13.6 | ) | 907 | 6.2 | ||||||||||||||||
In December 2016, we acquired 48 service rigs for consideration of $12 million and our coil tubing assets.
Service rig hours declined 34% as industry activity declined. Service rig rates decreased 18% as bidding for work became more competitive.
CORPORATE AND OTHER
Financial Results Adjusted EBITDA is an Non-GAAP measure. See page 5 for more information. |
| |||||||||||||||||||||||
Year ended December 31 (thousands of dollars, except where noted) | 2016 | 2015 | 2014 | |||||||||
Revenue | – | – | – | |||||||||
Expenses(1) | ||||||||||||
Operating | – | – | – | |||||||||
General and administrative | 64,234 | 65,668 | 70,151 | |||||||||
Restructuring | 693 | 6,100 | – | |||||||||
Adjusted EBITDA(2) | (64,927 | ) | (71,768 | ) | (70,151 | ) | ||||||
Depreciation and amortization | 14,382 | 14,998 | 8,583 | |||||||||
Operating loss | (79,309 | ) | (86,766 | ) | (78,734 | ) | ||||||
(1) Certain expenses in the prior year have been reclassified to conform to current year presentation. (2) See Non-GAAP Measures on page 5 of this report.
Our Corporate and Other segment has support functions that provide assistance to our other business segments. It includes costs incurred in corporate groups in both Canada and the U.S.
Corporate and Other expenses were $64 million in 2016, $1 million less than 2015. The decrease is mainly related to cost cutting initiatives taken in 2015, partially offset by foreign exchange translation on U.S. dollar based costs and higher share based incentive compensation expense. In 2016, corporate general and administrative costs were 6.8% of consolidated revenue compared with 4.2% in 2015 and 3.0% in 2014. |
| |||||||||||
Adjusted EBITDA and funds provided by operations are Non-GAAP measures. See page 5 for more information.
|
| |||||||||||||||
2016 – Quarters Ended (thousands of dollars, except per share amounts) | March 31 | June 30 | September 30 | December 31 | ||||||||||||
Revenue | 301,727 | 163,979 | 201,802 | 283,903 | ||||||||||||
Adjusted EBITDA(1) | 99,264 | 22,400 | 41,411 | 65,000 | ||||||||||||
Net loss | (19,883 | ) | (57,677 | ) | (47,377 | ) | (30,618 | ) | ||||||||
per basic share | (0.07 | ) | (0.20 | ) | (0.16 | ) | (0.10 | ) | ||||||||
per diluted share | (0.07 | ) | (0.20 | ) | (0.16 | ) | (0.10 | ) | ||||||||
Funds provided by (used in) operations | 93,593 | (31,372 | ) | 31,688 | 11,466 | |||||||||||
Cash provided by (used in) operations | 112,174 | 20,665 | 17,515 | (27,846 | ) | |||||||||||
(1) See Non-GAAP measures on page 5 of this report. |
| |||||||||||||||
| Precision Drilling Corporation 2016 Annual Report | 29 | |||||||||
2015 – Quarters Ended (thousands of dollars, except per share amounts) | March 31 | June 30 | September 30 | December 31 | ||||||||||||
Revenue | 512,120 | 334,462 | 364,089 | 344,953 | ||||||||||||
Adjusted EBITDA(1) | 163,384 | 88,355 | 111,031 | 111,095 | ||||||||||||
Net earnings (loss) | 24,033 | (29,817 | ) | (86,700 | ) | (270,952 | ) | |||||||||
per basic share | 0.08 | (0.10 | ) | (0.30 | ) | (0.93 | ) | |||||||||
per diluted share | 0.08 | (0.10 | ) | (0.30 | ) | (0.93 | ) | |||||||||
Funds provided by operations | 155,186 | 53,173 | 99,228 | 49,503 | ||||||||||||
Cash provided by operations | 215,138 | 169,877 | 61,049 | 70,952 | ||||||||||||
Dividends per share | 0.07 | 0.07 | 0.07 | 0.07 | ||||||||||||
(1) See Non-GAAP measures on page 5 of this report. |
| |||||||||||||||
Seasonality Drilling and well servicing activity is affected by seasonal weather patterns and ground conditions. In northern Canada, some drilling sites can only be accessed in the winter once the terrain is frozen, which is usually late in the fourth quarter. Activity therefore peaks in the winter, in the fourth and first quarters. In the spring, wet weather and the spring thaw in Canada and the northern U.S. make the ground unstable. Government road bans restrict the movement of rigs and other heavy equipment, reducing activity in the second quarter. This leads to quarterly fluctuations in operating results and working capital requirements.
Fourth Quarter 2016 Compared with Fourth Quarter 2015 In the fourth quarter of 2016, we recorded a net loss of $31 million, or net loss per diluted share of $0.10, compared with a net loss of $271 million, or $0.93 per diluted share, in the fourth quarter of 2015. In the fourth quarter of 2015 we incurred asset decommissioning and impairment charges totalling $369 million that,after-tax, reduced net earnings by $254 million and net earnings per diluted share by $0.87.
Revenue in the fourth quarter was $284 million or 18% lower than the fourth quarter of 2015, mainly due to decreased activity in our U.S. and international contract drilling operations along with lower day rates in Canada and U.S. Revenue in the fourth quarter from our Contract Drilling Services segment decreased by 17% and from our Completion and from our Production Services segment by 26% compared to the fourth quarter of 2015.
Adjusted EBITDA in the fourth quarter 2016 was $65 million, 42% lower than the fourth quarter of 2015. Our activity for the quarter, as measured by drilling rig utilization days, increased 12% in Canada while it decreased 13% in the U.S. and 10% internationally, compared with the fourth quarter of 2015.
Our Adjusted EBITDA as a percentage of revenue was 23% this quarter, compared with 32% in the fourth quarter of 2015. The decrease in adjusted EBITDA as a percentage of revenue was mainly due to decreases in activity and profitability in our Contract Drilling Services segment.
As a percentage of revenue, operating costs were 66% in the fourth quarter of 2016 compared with 57% in the same quarter of 2015. The increase is primarily due to lower average day rates in our North American operations and the impact of lower activity on fixed costs. Our portfolio of term customer contracts and a highly variable operating cost structure, helped us manage our Adjusted EBITDA margin.
| ||||||||
Contract Drilling Services Revenue from Contract Drilling Services was $255 million this quarter, or 17% lower than the fourth quarter of 2015, while adjusted EBITDA decreased by 34% to $86 million. The decreases were mainly due to lower drilling rig utilization days in our U.S. and international contract drilling businesses along with a decrease in average day rates in our Canadian and U.S. contract drilling businesses.
Drilling rig utilization days in Canada (drilling days plus move days) were 4,672 during the fourth quarter of 2016, an increase of 12% compared with 2015. Drilling rig utilization days in the U.S. were 3,570, or 13% lower than the same quarter of 2015. Drilling rig utilization days in our international business were 742, or 10% lower than the same quarter of 2015, as activity declines in Mexico were partially offset by adding two contracted rigs in Kuwait in the fourth quarter of 2016.
|
| 30 | Management’s Discussion and Analysis | |||||||||
Compared with the same quarter in 2015, drilling rig revenue per utilization day was down 22% in Canada, down 15% in the U.S. and up 13% internationally. In Canada and the U.S., the day rate decrease was the result of lower day rates from market rate pressure resulting from lower industry demand. The average international day rate is up due to the addition of twonew-build rigs in Kuwait.
In Canada, 35% of utilization days in the fourth quarter of 2016 were generated from rigs under term contract, compared to 53% in the fourth quarter of 2015. In the U.S., 56% of utilization days were generated from rigs under term contract as compared to 64% in the fourth quarter of 2015. At the end of the fourth quarter in 2016, we had 27 drilling rigs under contract in Canada, 25 in the U.S. and eight internationally.
Operating costs were 63% of revenue for the quarter, which was 10 percentage points higher than the prior year period. On a per utilization day basis, operating costs for the drilling rig division in Canada were lower than the prior year primarily because of 2015 rig move costs and the impact of fixed costs on higher activity. In the U.S., operating costs for the quarter on a per day basis were higher than the prior year primarily due to the impact of fixed costs spread over lower activity. Both Canada and U.S. operating costs benefited from cost saving initiatives taken in 2015 and 2016.
General and administrative costs are lower than the prior year by $2 million due to cost saving initiatives taken throughout 2015 and 2016.
Depreciation expense in the quarter was 20% lower than in the fourth quarter of 2015 because of a lower asset base after decommissioning equipment and the recording of an impairment charge to our property, plant and equipment in the fourth quarter of 2015 partially offset bynew-build rigs deployed in 2015 and 2016.
In the fourth quarter of 2015 it was determined that property, plant and equipment were impaired by US$73 million in our U.S. contract drilling business, by US$49 million in our international contract drilling business, and by US$26 million in our Mexico contract drilling business. There were no such charges in 2016.
During the fourth quarter of 2015, the Contract Drilling Services segment recognized a loss of $165 million related to the decommissioning of 79 drilling rigs, comprised of 48 in Canada, 30 in the U.S., and one in Mexico, along with certain spare equipment.
Completion and Production Services Revenue from Completion and Production Services was down $11 million or 26% compared to the fourth quarter of 2015 due to lower activity levels in all service lines, except our rentals business, and lower average rates. In response to lower oil prices, customers curtailed spending and activity including well completion and production programs through the majority of 2016. Our well servicing activity in the quarter was down 9% from the fourth quarter of 2015. Approximately 78% of our fourth quarter Canadian service rig activity was oil related.
During the quarter, Completion and Production Services generated 88% of its revenue from Canadian and 12% from U.S. operations.
Average service rig revenue per operating hour in the quarter was $629 or $131 lower than the fourth quarter of 2015. The decrease was primarily the result of industry pricing pressure.
|
Adjusted EBITDA was $1 million higher than the fourth quarter of 2015 as cost cutting initiatives have reduced the cost structure partially offset by lower activity and rates.
Operating costs as a percentage of revenue increased to 93% in the fourth quarter of 2016, from 90% in the fourth quarter of 2015. The increase is the result of lower revenue from pricing pressure and the impact of fixed costs spread across lower activity levels.
Depreciation in the quarter was 40% higher than the fourth quarter of 2015 because of a change in estimate on the salvage value in our rentals division.
The gain inre-measurement of property, plant and equipment relates to the acquisition of 48 well service rigs and ancillary equipment in exchange for $12 million cash and our coil tubing assets. The total fair value of the assets acquired and consideration provided was $28 million. The book value of our coil tubing assets was $8 million and, we recorded a gain onre-measuring these assets of $8 million.
|
| Precision Drilling Corporation 2016 Annual Report | 31 | |||||||||
Corporate and Other The Corporate and Other segment had an adjusted EBITDA loss of $22 million for the fourth quarter of 2016, $2 million higher than the fourth quarter of 2015 as higher share based incentive compensation was partially offset by cost saving initiatives and restructuring costs incurred in the prior year.
Net finance charges were $42 million, $8 million higher than the fourth quarter of 2015 due to the early recognition of debt issue costs from the current quarter redemption of long-term debt and additional interest expense from having additional debt for a period when we had the new debt balance and when existing debt was redeemed.
During the quarter we redeemed all $200 million of our 6.5% unsecured senior notes due 2019, redeemed on a pro rata basis US$250 million face value of our 6.625% unsecured senior notes due 2020 and repurchased and cancelled US$53 million face value of our 6.5% unsecured senior notes due 2021, incurring a net loss of $10 million.
Capital expenditures were $45 million in the fourth quarter compared with $66 million in the fourth quarter of 2015. Spending in the fourth quarter of 2016 included: ∎ $15 million to expand our asset base ∎ $14 million to upgrade existing equipment ∎ $16 million on maintenance and infrastructure. |
| 32 | Management’s Discussion and Analysis | |||||||||
The oilfield services business is inherently cyclical. To manage this variability, we focus on maintaining a strong balance sheet so we have the financial flexibility we need to continue to manage our capital expenditures and cash flows, no matter where we are in the business cycle.
We apply a disciplined approach to managing and tracking the results of our operations to keep costs down. We maintain a scalable cost structure so we can be responsive to changing competition and market demand. And we invest in our fleet to make sure we remain competitive. Our maintenance capital expenditures are tightly governed by and highly responsive to activity levels with additional cost savings leverage provided through our internal manufacturing and supply divisions. Term contracts on expansion capital fornew-build rig programs help provide more certainty of future revenues and return on our growth capital investments.
On January 20, 2017 we agreed with our lenders to the following amendments to our senior credit facility: ∎ Reduce the Adjusted EBITDA (as defined in the debt agreement) to interest expense coverage ratio to greater than 1.25:1 for the periods ending March 31, June 30 and September 30, 2017. For the periods ending December 31, 2017 and March 31, 2018 the ratio is 1.5:1 reverting to 2.5:1 thereafter. ∎ Reduce the size of the facility to US$525 million.
In April, 2016, with the continued uncertainty in the oil and gas industry outlook, we agreed with our lending group to the following additional amendments to our senior credit facility: ∎ The Adjusted EBITDA (as defined in the debt agreement) to interest expense coverage ratio of greater than 2:1 was temporarily reduced to 1.5:1 and reverts to 2.5:1 for periods ending after March 31, 2018; ∎ Permit second lien debt not to exceed US$400 million subject to certain terms and conditions; ∎ Amend certain negative covenants to, among other things, prohibit distributions during the covenant relief period; ∎ Add a new covenant with respect to anti-cash hoarding whereby we are only permitted to draw a maximum of $50 million on the facility if the only purpose is to accumulate cash; ∎ Add a new covenant that restricts the repurchase and redemption of unsecured debt if ourpro-forma liquidity is less than US$500 million during the covenant relief period.
During the year we repurchased and cancelled US$28 million face value of our 6.625% unsecured senior notes due 2020 and US$81 million face value of our 6.5% unsecured senior notes due 2021 for a total of $135 million, realizing a total gain on repurchase of $10 million.
On November 4, 2016, we issued US$350 million of 7.75% senior notes due in 2023 in a private offering. The Notes are guaranteed on a senior unsecured basis by current and future U.S. and Canadian subsidiaries that also guarantee our Senior Credit Facility and certain other indebtedness. The Notes were issued to redeem and repurchase existing debt.
On December 4, 2016 we redeemed in full our $200 million 6.5% unsecured senior notes due 2019 for $203 million plus accrued and unpaid interest and redeemed on a pro rata basis US$250 million of our then outstanding 6.625% unsecured senior notes due 2020 for US$256 million plus accrued and unpaid interest incurring a loss on redemption of $11 million.
As at December 31, 2016, our liquidity was supported by a cash balance of $116 million, our Senior Credit Facility of US$550 million, operating facilities totalling approximately $60 million, and a US$30 million secured facility for letters of credit. Our ability to draw on our Senior Credit Facility is governed by financial covenants. SeeSources and Uses of Cash – Covenants on page 36.
We expect that cash provided by operations and our sources of financing, including our Senior Credit Facility, will be sufficient to meet our debt obligations and to fund future capital expenditures.
|
| Precision Drilling Corporation 2016 Annual Report | 33 | |||||||||
| At December 31, 2016, including letters of credit, we had approximately $2,020 million (2015 – $2,330 million) outstanding under our secured and unsecured credit facilities and $27 million in unamortized debt issue costs. Our Senior Credit Facility includes financial ratio covenants that are tested quarterly. | Key Ratios
We ended 2016 with a long-term debt to long-term debt plus equity ratio of 0.49, and a ratio of long-term debt to cash provided by operations of 15.6. | |
We ended 2016 with a long-term debt to long-term debt plus equity ratio of 0.5 (2015 – 0.5) and a ratio of long-term debt to cash provided by operations of 15.6 (2015 – 4.2).
The current blended cash interest cost of our debt is about 6.5%.
Ratios and Key Financial Indicators We evaluate the relative strength of our financial position by monitoring our working capital, debt ratios and liquidity.
We also monitor returns on capital, and we link our executives’ incentive compensation to the returns to our shareholders relative to the shareholder returns of our peers.
Financial Position and Ratios
|
| |||||||||||
| (in thousands of dollars, except ratios) | December 31, 2016 | December 31, 2015 | December 31, 2014 | |||||||||
Working capital | 230,874 | 536,815 | 653,630 | |||||||||
Working capital ratio | 2.0 | 3.2 | 2.3 | |||||||||
Long-term debt | 1,906,934 | 2,180,510 | 1,852,186 | |||||||||
Total long-term financial liabilities | 1,946,742 | 2,210,231 | 1,881,275 | |||||||||
Total assets | 4,324,214 | 4,878,690 | 5,308,996 | |||||||||
Enterprise value (see table on page 38) | 3,937,737 | 3,337,980 | 3,428,014 | |||||||||
Long-term debt to long-term debt plus equity | 0.5 | 0.5 | 0.4 | |||||||||
Long-term debt to cash provided by operations | 15.6 | 4.2 | 2.7 | |||||||||
Long-term debt to Adjusted EBITDA | 8.4 | 4.6 | 2.3 | |||||||||
Long-term debt to enterprise value | 0.5 | 0.7 | 0.6 | |||||||||
Credit Rating Credit ratings affect our ability to obtain short and long-term financing, the cost of this financing, and our ability to engage in certain business activities cost-effectively. In March, 2016, Moody’s downgraded our corporate credit rating from Ba2 to B2 and senior unsecured credit rating from Ba2 to B3 and, S&P downgraded our corporate rating from BB+ to BB. |
| |||||||||||
| Moody’s |
S&P | |||
Corporate credit rating | B2 | BB | ||
Senior Credit Facility rating | Not rated | Not rated | ||
Senior unsecured credit rating | B3 | BB | ||
To maintain and grow our business, we invest in growth, upgrade and sustaining capital. We base expansion and upgrade capital decisions on return on capital employed and payback, and we mitigate the risk that we may not be able to fully recover our capital by requiringtwo- to five-year term contracts fornew-build rigs.
We base our maintenance capital decisions on actual activity levels, using key financial indicators that we express as per operating day or per operating hour. Sourcing internally (through our manufacturing and supply divisions) helps keep our maintenance capital costs as low as possible.
| ||||
Foreign Exchange Risk Our U.S. and international operations have revenue, expenses, assets and liabilities denominated in currencies other than the Canadian dollar (mostly in U.S. dollars and currencies that are pegged to the U.S. dollar). This means that changes in currency exchange rates can materially affect our income statement, balance sheet and statement of cash flow. We manage this risk by matching the currency of our debt obligations with the currency of cash flows generated by the operations that the debt supports. | ||||
| 34 | Management’s Discussion and Analysis | |||||||||
Hedge of Investments in Foreign Operations We utilize foreign currency long-term debt to hedge our exposure to changes in the carrying values of our net investment in certain foreign operations as a result of changes in foreign exchange rates.
Effective December 4, 2016, we included the US$350 million of 7.75% senior notes due in 2023 as a designated hedge of our investment in our U.S. dollar denominated foreign operations, and now all of our U.S. dollar senior notes are designated as a net investment hedge.
To be accounted for as a hedge, the foreign currency denominated long-term debt must be designated and documented as such and must be effective at inception and on an ongoing basis. We recognize the effective amount of this hedge (net of tax) in other comprehensive income. We recognize ineffective amounts in earnings.
|
At December 31(thousands of dollars) | 2016 | 2015 | 2014 | |||||||||
Cash from operations | 122,508 | 517,016 | 680,159 | |||||||||
Cash used in investing | (213,925 | ) | (541,102 | ) | (629,987 | ) | ||||||
Surplus (deficit) | (91,417 | ) | (24,086 | ) | 50,172 | |||||||
Cash from (used in) financing Effect of exchange rate changes on cash | | (218,324 (19,313 | ) ) | | (84,044 61,408 | )
| | 329,704 30,999 |
| |||
Net cash generated (used) | (329,054 | ) | (46,722 | ) | 410,875 | |||||||
Cash from Operations In 2016, we generated cash from operations of $123 million compared with $517 million in 2015. The decrease is primarily the result of lower operating results due to the industry downturn and decreasing working capital in 2015.
Investing Activity We made growth and sustaining capital investments of $203 million in 2016: ∎ $149 million in expansion capital ∎ $20 million in upgrade capital ∎ $34 million in maintenance and infrastructure capital.
The $203 million in capital expenditures in 2016 was split between segments as follows: ∎ $196 million in Contract Drilling Services ∎ $1 million in Completion and Production Services ∎ $6 million in Corporate and Other.
Expansion and upgrade capital includes the cost of long-lead items purchased for our capital inventory, such as top drives, drill pipe, control systems, engines and other items we can use to completenew-build projects or upgrade our rigs in North America and internationally.
In December 2016, we acquired 48 well service rigs and ancillary equipment in a business acquisition for consideration of $12 million and our coil tubing assets.
We sold underutilized capital assets for proceeds of $8 million in 2016 compared with $10 million in 2015.
Financing Activity As discussed on page 33 during the year we issued US$350 million of senior notes, redeemed US$250 million and $200 million of senior notes and repurchased and cancelled US$109 million of senior notes. |
In May 2015, we increased the size of our demand facility for letters of credit facility with HSBC Canada to US$40 million from US$25 million to provide additional availability to issue letters of credit for international opportunities and in April 2016, we reduced the size of this facility to US$30 million to align with our expected requirements for this facility.
As at December 31, 2016, our operating facility of $40 million with Royal Bank of Canada was undrawn except for $22 million in outstanding letters of credit; our operating facility of US$15 million with Wells Fargo remained undrawn; and our demand facility for letters of credit of US$30 million with HSBC Canada had US$23.5 million available.
|
| Precision Drilling Corporation 2016 Annual Report | 35 | |||||||||
CAPITAL STRUCTURE
Debt As at December 31, 2016, we had a cash balance of $116 million and available capacity under our secured facilities of $752 million.
As at December 31, 2016, we had $1,934 million outstanding under our senior unsecured notes. |
| Amount | Availability | Used for | Maturity | |||
Senior Credit Facility (secured) | ||||||
US$550 million (1) (extendible, revolving term credit facility with US$250 million accordion feature)
|
Undrawn, except US$41 million in outstanding letters of credit |
General corporate purposes |
June 3, 2019 | |||
Operating facilities (secured) | ||||||
$40 million |
Undrawn, except $22 million in outstanding letters of credit
|
Letters of credit and general corporate purposes | ||||
US$15 million |
Undrawn |
Short term working capital requirements
| ||||
Demand letter of credit facility (secured) | ||||||
US$30 million |
Undrawn, except US$6.5 million in outstanding letters of credit
|
Letters of credit | ||||
Senior notes (unsecured) | ||||||
US$372 million |
Fully drawn |
Debt repayment and general corporate purposes
|
November 15, 2020 | |||
US$319 million |
Fully drawn |
Capital expenditures and general corporate purposes
|
December 15, 2021 | |||
US$350 million |
Fully drawn |
Debt redemption and repurchases
|
December 15, 2023 | |||
US$400 million |
Fully drawn |
Capital expenditures and general corporate purposes
|
November 15, 2024 | |||
(1)Subsequent to December 31, 2016 we reduced our revolving term facility to US$525 million.
| ||||||
Covenants
Senior Credit Facility The Senior Credit Facility requires that we comply with certain financial covenants including a leverage ratio of consolidated senior debt to earnings before interest, taxes, depreciation and amortization as defined in the agreement (Adjusted EBITDA) of less than 2.5:1. For purposes of calculating the leverage ratio, consolidated senior debt only includes secured indebtedness. Adjusted EBITDA as defined in our Senior Credit Facility agreement differs from Adjusted EBITDA as defined under Non-GAAP Measures by the exclusion of bad debt expense and certain foreign exchange amounts. As at December 31, 2016, our consolidated senior debt to Adjusted EBITDA ratio was 0.02:1.
Under the Senior Credit Facility, we are required to maintain an Adjusted EBITDA coverage ratio, calculated as Adjusted EBITDA to interest expense for the most recent four consecutive fiscal quarters, of greater than 1.5:1, which, after the January 2017 amendment, reduces to 1.25:1 for the periods ending March 31, June 30 and September 30, 2017, increases to 1.5:1 for the periods ending December 31, 2017 and March 31, 2018 and reverts to 2.5:1 for periods ending after March 31, 2018 until the maturity date of the facility. As at December 31, 2016, our Adjusted EBITDA coverage ratio was 1.69:1.
The Senior Credit Facility also prevents us from making distributions prior to April 1, 2018 and restricts our ability to repurchase our unsecured senior notes if our pro-forma liquidity is less than US$500 million prior to April 2018.
|
| 36 | Management’s Discussion and Analysis | |||||||||
In addition, the Senior Credit Facility contains certain covenants that place restrictions on our ability to incur or assume additional indebtedness; dispose of assets; pay dividends, share redemptions or other distributions; change our primary business; incur liens on assets; engage in transactions with affiliates; enter into mergers, consolidations or amalgamations; and enter into speculative swap agreements.
At December 31, 2016, we were in compliance with the covenants of the Senior Credit Facility.
Senior Notes The senior notes require that we comply with certain covenants including an incurrence based consolidated interest coverage ratio test, as defined in the senior note agreements, of greater than 2.0:1 for the most recent four consecutive fiscal quarters. In the event that our consolidated interest coverage ratio is less than 2.0:1 for the most recent four consecutive fiscal quarters the senior notes restrict our ability to incur additional indebtedness. As at December 31, 2016, our senior notes consolidated interest coverage ratio was 1.58:1 which limits our ability to incur additional indebtedness, except as permitted under the agreements, until such time as we are in compliance with the ratio test but would not restrict our access to available funds under the Senior Credit Facility or refinance our existing debt. Furthermore, it does not give rise to any cross-covenant violations, give the lenders the right to demand repayment of any outstanding portion of the senior notes prior to the stated maturity dates, or provide any other forms of recourse to the lenders.
The senior notes contain a restricted payments covenant that limits our ability to make payments in the nature of dividends, distributions and repurchases from shareholders. The restricted payments basket grows from a starting point of January 1, 2010 for the 2020, 2021 and 2024 Senior Notes and from November 1, 2016 for the 2023 Senior Note by, among other things, 50% of cumulative consolidated net earnings, and decreases by 100% of cumulative consolidated net losses as defined in the note agreements, and cumulative payments made to shareholders. Based on our consolidated financial results for the period ended December 31, 2015, the governing net restricted payments basket under the senior notes was negative $152 million prohibiting us from making any further dividend payments for dividends declared on or after December 31, 2015 until the restricted payments baskets become positive. As a result, Precision suspended our dividend on February 11, 2016.
Based on our consolidated financial results for the period ended December 31, 2016, the governing net restricted payments basket was negative $310 million.
For further information, please see the senior note indentures which are available on SEDAR and EDGAR. |
In addition, the senior notes contain certain covenants that limit our ability, and the ability of certain subsidiaries, to incur additional indebtedness and issue preferred shares; create liens; create or permit to exist restrictions on our ability or certain subsidiaries to make certain payments and distributions; engage in amalgamations, mergers or consolidations; make certain dispositions and engage in transactions with affiliates.
Shelf Registration In August 2016, we completed the filing of a short form base shelf prospectus with the securities regulatory authorities in each of the provinces of Canada and a corresponding registration statement in the United States, for the offering of up to $1 billion of common shares, preferred shares, debt securities, warrants, subscription receipts or units (the Securities). The Securities may be offered from time to time during the 25-month period for which the short form base shelf prospectus remains valid.
Contractual Obligations Our contractual obligations include both financial obligations (long-term debt and interest) andnon-financial obligations(new-build rig commitments, operating leases, and equity-based compensation for key executives and officers). |
| Precision Drilling Corporation 2016 Annual Report | 37 | |||||||||
| The table below shows the amounts of these obligations and when payments are due for each. |
At December 31, 2016 (thousands of dollars) | Payments due (by period) | |||||||||||||||||||
| Less than 1 year | 1-3 years | 4-5 years | More than 5 years | Total | ||||||||||||||||
Long-term debt (1) | – | – | 926,968 | 1,007,025 | 1,933,993 | |||||||||||||||
Interest on long-term debt (1) | 125,494 | 250,988 | 212,628 | 152,390 | 741,500 | |||||||||||||||
Purchase of property, plant and equipment (1)(2) | 29,094 | 112,486 | – | – | 141,580 | |||||||||||||||
Operating leases(1) | 16,564 | 23,094 | 12,521 | – | 52,179 | |||||||||||||||
Contractual incentive plans (1)(3) | 22,854 | 65,655 | – | – | 88,509 | |||||||||||||||
Total | 194,006 | 452,223 | 1,152,117 | 1,159,415 | 2,957,761 | |||||||||||||||
(1) U.S. dollar denominated balances are translated at the period end exchange rate of Cdn$1.00 equals US$0.7448. (2) The balance relates primarily to the costs of rig equipment with a flexible delivery schedule wherein we can take delivery of the equipment between 2017 and 2019 at our discretion. (3) Includes amounts we have not yet accrued but are likely to pay at the end of the contract term. Our long-term incentive plans compensate officers and key employees through cash payments when their awards vest. Equity-based compensation amounts are shown based on thefive-day weighted average share price on the TSX of $7.40 at December 31, 2016.
|
| |||||||||||||||||||
| ||||||||||||||||||||
| March 3, 2017 | December 31, 2016 | December 31, 2015 | December 31, 2014 | |||||||||||||||||
Shares outstanding | 293,238,858 | 293,238,858 | 292,912,090 | 292,819,921 | ||||||||||||||||
Deferred shares outstanding | 195,743 | 195,743 | 195,743 | 226,010 | ||||||||||||||||
Share options outstanding | 12,052,174 | 11,525,742 | 10,750,833 | 8,560,088 | ||||||||||||||||
You can find more information about our capital structure in our AIF, available on our website and on SEDAR.
Common Shares Our articles of amalgamation allow us to issue an unlimited number of common shares.
In the fourth quarter of 2012, our Board of Directors approved the introduction of an annualized dividend of $0.20 per common share, payable quarterly. In the fourth quarter of 2013, our Board of Directors approved an increase in the quarterly dividend payment to $0.06 per common share and in the fourth quarter of 2014, our Board of Directors approved an increase in the quarterly dividend to $0.07 per common share.
In the first quarter of 2016, we suspended our quarterly dividend. SeeCovenants – Senior Notes on page 37 for more information.
Preferred Shares We can issue preferred shares in one or more series. The number of preferred shares that may be authorized for issue at any time cannot exceed more than half of the number of issued and outstanding common shares. We currently have no preferred shares issued. |
Enterprise Value
|
| |||||||||||
| (thousands of dollars, except shares outstanding and per share amounts) | December 31, 2016 | December 31, 2015 | December 31, 2014 | |||||||||
Shares outstanding | 293,238,858 | 292,912,090 | 292,819,921 | |||||||||
Year-end share price on the TSX | 7.32 | 5.47 | 7.06 | |||||||||
Shares at market | 2,146,508 | 1,602,229 | 2,067,309 | |||||||||
Long-term debt | 1,906,934 | 2,180,510 | 1,852,186 | |||||||||
Less cash | (115,705) | (444,759) | (491,481) | |||||||||
Enterprise value | 3,937,737 | 3,337,980 | 3,428,014 | |||||||||
| 38 | Management’s Discussion and Analysis | |||||||||
CRITICAL ACCOUNTING ESTIMATES AND JUDGEMENTS Because of the nature of our business, we are required to make estimates about the future that affect the reported amounts of assets, liabilities, revenues and expenses, and the disclosure of contingent liabilities. Estimates are based on our past experience, our best judgment and assumptions we think are reasonable.
Our significant accounting policies are described in Note 3 to the Consolidated Financial Statements. We believe the following are the most difficult, subjective or complex judgments, and are the most critical to how we report our financial position and results of operations: ∎ impairment of long-lived assets ∎ depreciation and amortization ∎ income taxes.
Impairment of Long-Lived Assets Long-lived assets, which include property, plant and equipment, intangibles and goodwill, comprise the majority of our assets. The carrying value of these assets is reviewed for impairment periodically or whenever events or changes in circumstances indicate that their carrying amounts may not be recoverable. For property, plant and equipment, this requires us to forecast future cash flows to be derived from the utilization of these assets based on assumptions about future business conditions and technological developments. Significant, unanticipated changes to these assumptions could require a provision for impairment in the future.
For goodwill, we conduct impairment tests annually in the fourth quarter or whenever there is a change in circumstance that indicates that the carrying value may not be recoverable. The recoverability of goodwill requires a calculation of the recoverable amount of the CGU or groups of CGUs to which goodwill has been allocated. A CGU is the smallest identifiable group of assets that generates cash inflows that are largely independent of the cash inflows from other assets or groups of assets. Judgment is required in the aggregation of assets into CGUs. The recoverability calculation requires an estimation of the future cash flows from the CGU or group of CGUs, and judgment is required in projecting cash flows and selecting the appropriate discount rate. We use observable market data inputs to develop a discount rate that we believe approximates the discount rate from market participants.
In deriving the underlying projected cash flows, assumptions must also be made about future drilling activity, margins and market conditions over the long-term life of the assets or CGUs. We cannot predict if an event that triggers impairment will occur, when it will occur or how it will occur, or how it will affect reported asset amounts. Although we believe the estimates are reasonable and consistent with current conditions, internal planning, and expected future operations, such estimations are subject to significant uncertainty and judgment.
Depreciation and Amortization Our property, plant and equipment and intangible assets are depreciated and amortized based on estimates of useful lives and salvage values. These estimates consider data and information from various sources, including vendors, industry practice, and our own historical experience, and may change as more experience is gained, market conditions shift, or new technological advancements are made.
|
| Determination of which parts of the drilling rig equipment represent a significant cost relative to the entire rig and identifying the consumption patterns along with the useful lives of these significant parts are matters of judgment. This determination can be complex and subject to differing interpretations and views, particularly when rig equipment comprises individual components for which different depreciation methods or rates are appropriate. |
| Precision Drilling Corporation 2016 Annual Report | 39 | |||||||||
Income Taxes Uncertainties exist with respect to the interpretation of complex tax regulations, changes in tax laws, and the amount and timing of future taxable income. Differences arising between the actual results and the assumptions made, or future changes to such assumptions, could necessitate future adjustments to taxable income and expenses already recorded. We establish provisions, based on reasonable estimates, for possible consequences of audits by the tax authorities of the respective countries in which we operate. The amount of such provisions is based on various factors, such as experience of previous tax audits and differing interpretations of tax regulations by the taxable entity and the responsible tax authority.
ACCOUNTING POLICIES ADOPTED JANUARY 1, 2016 There were no new accounting policies adopted by Precision with an initial application date of January 1, 2016.
ACCOUNTING POLICIES NOT YET ADOPTED
IFRS 9, Financial Instruments In November 2009, the International Accounting Standards Board (IASB) issued IFRS 9, replacing IAS 39, Financial Instruments, Recognition and Measurement. IFRS 9 will be issued in three phases. The first phase, which has already been issued, addresses the accounting for financial assets and financial liabilities. The second phase will address impairment of financial instruments, while the third phase will address hedge accounting. IFRS 9 uses a single approach to determine whether a financial asset is measured at amortized cost or fair value, and replaces the multiple category and measurement models in IAS 39. The approach in IFRS 9 focuses on how an entity manages its financial instruments in the context of its business model, as well as the contractual cash flow characteristics of the financial assets. The new standard also requires a single impairment method to be used, replacing the multiple impairment methods currently provided in IAS 39.
Requirements for financial liabilities were added to IFRS 9 in October 2010. Although the classification criteria for financial liabilities will not change under IFRS 9, the fair value option may require different accounting for changes to the fair value of a financial liability resulting from changes to an entity’s own credit risk.
In December 2013, new hedge accounting requirements were incorporated into IFRS 9 that increase the scope of items that can qualify as a hedged item and change the requirements of hedge effectiveness testing that must be met to use hedge accounting.
In July 2014, the IASB issued final amendments to IFRS 9, replacing earlier versions of IFRS 9. These amendments to IFRS 9 introduce a single, forward-looking ‘expected loss’ impairment model for financial assets, which will require more timely recognition of expected credit losses, and a fair value through other comprehensive income category for financial assets that are debt instruments.
The amendments to IFRS 9 are effective for annual periods beginning on or after January 1, 2018 and are available for earlier adoption. We do not expect that the implementation of IFRS 9 will have a material effect on the financial statements. |
IFRS 15, Revenue from Contracts with Customers In May 2014, the IASB issued IFRS 15 to address how and when to recognize revenue as well as requiring entities to provide users of financial statements with more informative, relevant disclosures in order to understand the nature, amount, timing and uncertainty of revenue and cash flows arising from contracts with customers. The standard provides a principles based, five-step model to be applied to all contracts with customers. This five-step model involves identifying the contract(s) with a customer; identifying the performance obligations in the contract; determining the transaction price; allocating the transaction price to the performance obligations in the contract; and recognizing revenue when (or as) the entity satisfies a performance obligation.
Application of this new standard is mandatory for annual reporting periods beginning on or after January 1, 2017, with earlier application permitted. We do not expect that the implementation of IFRS 15 will have a material effect on the financial statements.
IFRS 16, Leases In January 2016, the IASB issued IFRS 16 replacing IAS 17. The new standard requires lessees to recognize a lease liability reflecting future lease payments and a right of use asset for virtually all lease contracts. In addition, IFRS 16 has updated the definition of a lease and introduced new disclosure requirements. IFRS 16 is effective for annual periods beginning on or after January 1, 2019, with earlier application permitted in certain circumstances. We have yet to determine the impact this new standard will have on the financial statements. |
| 40 | Management’s Discussion and Analysis | |||||||||
Our key business risks are summarized below. Additional information and other risks in business are discussed in our AIF, available on our website (www.precisiondrilling.com).
Precision’s Corporate enterprise risk management leverages the risk framework in each of our businesses, which have adopted an approach that corresponds to the overall risk policies, guidelines, and review mechanisms. Our risk framework operates at the business and functional levels and is designed to identify, evaluate, and mitigate risks within each of the risk categories below.
Our businesses routinely encounter and address risks, some of which will cause our future results to be different, sometimes materially different, then we presently anticipate. Below, we describe certain important strategic, operational, financial, and legal and compliance risks. Our reactions to material future developments, as well as our reactions to those developments, will affect our future results.
Our operations depend on the price of oil and natural gas We sell our services to oil and natural gas exploration and production companies. Macroeconomic and geopolitical factors associated with oil and natural gas supply and demand are the primary factors driving pricing and profitability in the oilfield services industry. We generally experience high demand for our services when commodity prices are relatively high and the opposite is true when commodity prices are low, as is currently the case. The volatility of crude oil and natural gas prices accounts for much of the cyclical nature of the oilfield services business.
The markets for oil and natural gas are separate and distinct. Oil is a global commodity with a vast distribution network, although the differential between benchmarks such as West Texas Intermediate, Western Canadian Select, and European Brent crude oil can fluctuate. As in all markets, when supply, demand, inability to access domestic or export markets and other factors change, so can the spreads between benchmarks. The most economical way to transport natural gas is in its gaseous state by pipeline, and the natural gas market depends on pipeline infrastructure and regional supply and demand. However, developments in the transportation of liquefied natural gas in ocean going tanker ships have introduced an element of globalization to the natural gas market.
Worldwide military, political and economic events, such as conflict in the Middle East, expectations for global economic growth, or initiatives by the Organization of the Petroleum Exporting Countries (OPEC) and other major petroleum exporting countries, can affect supply and demand for oil and natural gas. Weather conditions, governmental regulation (in Canada and elsewhere), levels of consumer demand, the availability of pipeline capacity, U.S. and Canadian natural gas storage levels, and other factors beyond our control can also affect the supply of and demand for oil and natural gas and lead to price volatility in the future.
The North American land drilling industry is almost two years into a deep downturn, a result of lower commodity prices restricting customer spending and decreasing drilling demand. In 2016, approximately 11,200 wells were started onshore in the U.S., compared with approximately 20,500 in 2015 and 43,700 in 2014. According to industry sources, the U.S. average active land drilling rig count was down approximately 48% in 2016 when compared to the prior year, and the Canadian active land drilling rig count was down approximately 33% during the same time period. Oil and natural gas prices declined significantly in the second half of 2014 and have continued to decline throughout 2015 and early 2016. Oil and natural gas remained volatile throughout 2016 and could continue at these relatively low levels or lower levels for the foreseeable future. Prices have been negatively affected by a combination of factors, including increased production, the decisions of OPEC and a strengthening in the U.S. dollar relative to most other currencies. These factors have adversely affected, and could continue to adversely affect, the prices of oil and natural gas, which would adversely affect the level of capital spending by our customers and in turn could have a material and adverse effect on our results of operations. As a result of the continued pressure on commodity prices, many of our customers have reduced spending budgets for 2017 compared to earlier periods, and further reductions in commodity prices or prices remaining at current levels for a
|
| Precision Drilling Corporation 2016 Annual Report | 41 | |||||||||
prolonged period may result in further capital budget reductions in the future. Moreover, the prolonged reduction in oil and natural gas prices has depressed, and may continue to depress, the overall level of exploration and production activity, resulting in corresponding decline in the demand for our services that has had, and could continue to have, a material adverse effect on our revenue, cash flow, and profitability and restrict our ability to make capital expenditures. Our capital plan does not currently include any expansion capital expenditures in 2017. In addition, sustained periods with oil and natural gas prices at current or lower levels could also lead to lower future revenues if these prices caused our customers to avoidre-contracting rigs currently under contract, therefore making our financial covenants more difficult to attain.
Lower oil and natural gas prices could also cause our customers to terminate, renegotiate, or fail to honour their drilling contracts with us, which could affect the anticipated revenues that support our capital expenditure program and deliveries ofnew-build rigs. In addition, lower oil and natural gas prices, lower demand for oilfield services, or lower rig utilization could affect the fair market value of our rig fleet, which in turn could trigger a write down for accounting purposes. There is no assurance that demands for our services or conditions in the oil and natural gas and oilfield services sector will not decline in the future, and a significant decline in demand could have a material adverse effect on our financial condition.
We have accounts receivable with customers in the oil and natural gas industry and their revenues may be affected by fluctuations in commodity prices. Our ability to collect receivables may be adversely affected by any prolonged weakness in oil and natural gas prices.
We try to manage these risk by keeping our cost structure as variable as we can while still being able to maintain the level of service our customers require.
Intense price competition and the cyclical nature of the contract drilling industry could have an adverse effect on revenue and profitability The contract drilling business is highly competitive with many industry participants. We compete for drilling contracts that are usually awarded based on competitive bids. We believe pricing and rig availability are the primary factors potential customers consider when selecting a drilling contractor. We believe other factors are also important, such as the drilling capabilities and condition of drilling rigs, the quality of service and experience of rig crews, the safety record of the contractor and the particular drilling rig, the offering of ancillary services, the ability to provide drilling equipment that is adaptable to and having personnel familiar with new technologies and drilling techniques, and rig mobility and efficiency.
Historically, contract drilling has been cyclical with periods of low demand, excess rig supply and low dayrates, followed by periods of high demand, short rig supply and increasing dayrates. Periods of excess drilling rig supply intensify the competition and often result in rigs being idle. There are numerous contract drilling companies in the markets where we operate, and an oversupply of drilling rigs can cause greater price competition. Contract drilling companies compete primarily on a regional basis, and the intensity of competition can vary significantly from region to region at any particular time. If demand for drilling services is better in a region where we operate, our competitors might respond by moving suitable drilling rigs in from other regions, reactivating previously stacked rigs or purchasing new drilling rigs. An influx of drilling rigs into a market from any source could rapidly intensify competition and make any improvement in the demand for our drilling rigs short-lived, which could in turn have a material adverse effect on our revenue, cash flow and earnings.
Our business results and the strength of our financial position are affected by our ability to strategically manage our capital expenditure program in a manner consistent with industry cycles and fluctuations in the demand for contract drilling services. If we do not effectively manage our capital expenditures or respond to market signals relating to the supply or demand for contract drilling and oilfield services, it could have a material adverse effect on our revenue, operations and financial condition.
New capital expenditures in the contract drilling industry expose us to the risk of oversupply of equipment Periods of high demand often lead to higher capital expenditures on drilling rigs and other oilfield services equipment. The number of newer drilling rigs competing for work in markets where we operate has increased as the industry has added new and upgraded rigs. The industry supply of drilling rigs may exceed actual demand because of the relatively long life span of oilfield services equipment as well as the typically long time from when a decision is made to upgrade or build new equipment to when the equipment is built and placed into service. Excess supply resulting from industry-wide capital expenditures could lead to lower demand for term drilling contracts and for our equipment and services. The additional supply of drilling rigs has served to intensify price competition in the past and could continue to do so. This could lead to lower rates in the oilfield services industry generally and lower utilization of existing rigs. If any of these factors materialize, it would have an adverse effect on our revenue, cash flow, earnings and asset valuation. |
| 42 | Management’s Discussion and Analysis | |||||||||
We require sufficient cash flows to service and repay our debt We will need sufficient cash flows in the future to service and repay our debt. Our ability to generate cash in the future is affected to some extent by general economic, financial, competitive and other factors that may be beyond our control. If we need to borrow funds in the future to service our debt, our ability will depend on covenants in the Senior Credit Facility, the 2020 Note Indenture, the 2021 Note Indenture, the 2023 Note Indenture, the 2024 Note Indenture, and other debt agreements we may have in the future, and on our credit ratings. We may not be able to access sufficient amounts under the Senior Credit Facility or from the capital markets in the future to pay our obligations as they mature or to fund other
liquidity requirements. If we are not able to borrow a sufficient amount, or generate enough cash flow from operations to service and repay our debt, we will need to refinance our debt or we will be in default, and we could be forced to reduce or delay investments and capital expenditures or dispose of material assets or issue equity. We may not be able to refinance or arrange alternative measures on favourable terms or at all. If we are unable to service, repay, or refinance our debt, it could have a negative impact on our financial condition and results of operations.
Repaying the debt depends on our guarantor subsidiaries generating cash flow and making it available to us by dividend, debt repayment or otherwise. Our guarantor subsidiaries may not be able to, or may not be permitted to, make distributions to allow us to make payments on our debt. Each guarantor subsidiary is a distinct legal entity and, under certain circumstances, legal and contractual restrictions may limit our ability to obtain cash from the subsidiaries. While the agreements governing certain existing debt limits the ability of our subsidiaries to incur consensual restrictions on their ability to pay dividends or make other intercompany payments to us, these limitations are subject to qualifications and exceptions.
A substantial portion of our operations is carried out through subsidiaries, and some of them are not guarantors of our debt. The assets and operations of thenon-guarantor subsidiaries are not material, and these subsidiaries do not have any obligation to pay amounts due on the debt or to make funds available for that purpose.
If we do not receive dividends from our guarantor subsidiaries, we may be unable to make the required principal and interest payments, which could have a material adverse effect on our financial position and results of operations.
Customers’ inability to obtain credit/financing could lead to lower demand for our services Many of our customers require reasonable access to credit facilities and debt capital markets to finance their oil and gas drilling activity. If the availability of credit to our customers is reduced, they may reduce their drilling and production expenditures, thereby decreasing demand for our products and services. A reduction in spending by our customers could adversely affect our operating results and financial condition.
Our debt facilities contain restrictive covenants The Senior Credit Facility, the 2020 Note Indenture, the 2021 Note Indenture, the 2023 Note Indenture, and the 2024 Note Indenture contain a number of covenants which, among other things, restrict us and some of our subsidiaries from conducting certain activities (seeSources and Uses of Cash – Covenants – Senior Notes, on page 37). In the event the Consolidated Interest Coverage ratio (as defined in our four senior note indentures) is less than 2.0:1 for the most recent four consecutive fiscal quarters the senior note indentures restrict our ability to incur additional indebtedness. As at December 31, 2016, our consolidated interest coverage ratio, as calculated per our senior notes indentures, was 1.58:1 which limits our ability to incur additional indebtedness, except as permitted under the indentures, until such time as we are in compliance with the ratio test but would not restrict our access to available funds under the senior credit facility or ability refinance our existing debt.
In addition, we must satisfy and maintain certain financial ratio tests under the Senior Credit Facility (seeSources and Uses of Cash – Covenants – Senior Credit Facility, on page 36). Events beyond our control could affect our ability to meet these tests in the future. If we breach any of the covenants, it could result in a default under the Senior Credit Facility or any of the note indentures. If there is a default under the Senior Credit Facility, the applicable lenders could decide to declare all amounts outstanding under the Senior Credit Facility or any of the note indentures to be due and payable immediately, and terminate any commitments to extend further credit. If there is such an acceleration by such lenders and such accelerated amounts exceed a specific threshold, the applicable note holders could decide to declare all amounts outstanding under any of the note indentures to be due and payable immediately.
At December 31, 2016 we were in compliance with the covenants of the Senior Credit Facility.
Risks and uncertainties associated with our international operations can negatively affect our business We conduct some of our business in Mexico and the Middle East. Our growth plans contemplate establishing operations in other international regions, including countries where the political and economic systems may be less stable than in Canada or the U.S. |
| Precision Drilling Corporation 2016 Annual Report | 43 | |||||||||
Our international operations are subject to risks normally associated with conducting business in foreign countries, including, but not limited to, the following:
∎ an uncertain political and economic environment ∎ the loss of revenue, property and equipment as a result of expropriation, confiscation, nationalization, contract deprivation and force majeure ∎ war, terrorist acts or threats, civil insurrection, and geopolitical and other political risks ∎ fluctuations in foreign currency and exchange controls ∎ restrictions on the repatriation of income or capital ∎ increases in duties, taxes and governmental royalties ∎ renegotiation of contracts with governmental entities ∎ changes in laws and policies governing operations of companies ∎ compliance with anti-corruption and anti-bribery legislation in Canada, the U.S. and other countries ∎ trade restrictions or embargoes imposed by the U.S. or other countries.
If there is a dispute relating to our international operations, we may be subject to the exclusive jurisdiction of foreign courts or may not be able to subject foreign persons to the jurisdiction of a court in Canada or the U.S.
Government-owned petroleum companies located in some of the countries where we operate now or in the future may have policies, or may be subject to governmental policies, that give preference to the purchase of goods and services from companies that are majority-owned by local nationals. As such, we may rely on joint ventures, licence arrangements and other business combinations with local nationals in these countries, which may expose us to certain counterparty risks, including the failure of local nationals to meet contractual obligations or comply with local or international laws that apply to us.
In the international markets where we operate, we are subject to various laws and regulations that govern the operation and taxation of our businesses and the import and export of our equipment from country to country. There may be uncertainty about how these laws and regulations are imposed, applied or interpreted, and they could be subject to change. Since we derive a portion of our revenues from subsidiaries outside of Canada and the U.S., the subsidiaries paying dividends or making other cash payments or advances may be restricted from transferring funds in or out of the respective countries, or face exchange controls or taxes on any payments or advances. We have organized our foreign operations partly based on certain assumptions about various tax laws (including capital gains and withholding taxes), foreign currency exchange, and capital repatriation laws and other relevant laws of a variety of foreign jurisdictions. We believe these assumptions are reasonable, however, there is no assurance that foreign taxing or other authorities will reach the same conclusion. If these foreign jurisdictions change or modify the laws, we could suffer adverse tax and financial consequences.
While we have developed policies and procedures designed to achieve compliance with applicable international laws, we could be exposed to potential claims, economic sanctions, or other restrictions for alleged or actual violations of international laws related to our international operations, including anti-corruption and anti-bribery legislation, trade laws and trade sanctions. The Canadian government, the U.S. Department of Justice, the Securities and Exchange Commission (SEC), the U.S. Office of Foreign Assets Control, and similar agencies and authorities in other jurisdictions have a broad range of civil and criminal penalties they may seek to impose against corporations and individuals for such violations, including injunctive relief, disgorgement, fines, penalties and modifications to business practices and compliance programs, among other things. While we cannot accurately predict the impact of any of these factors, if any of those risks materialize, it could have a material adverse effect on our reputation, business, financial condition, results of operations and cash flow.
Our operations are subject to numerous environmental laws, regulations and guidelines Our operations are affected by numerous laws, regulations and guidelines relating to the protection of the environment, including those governing the management, transportation and disposal of hazardous substances and other waste materials. These include those relating to spills, releases, and discharges of hazardous substances or other waste materials into the environment, requiring removal or remediation of pollutants or contaminants, and imposing civil and criminal penalties for violations. Some of these apply to our operations and authorize the recovery of natural resource damages by the government, injunctive relief, and the imposition of stop, control, remediation and abandonment orders. In addition, our land drilling operations may be conducted in or near ecologically sensitive areas, such as wetlands that are subject to special protective measures, which may expose us to additional operating costs and liabilities for noncompliance with certain laws. Some environmental laws and regulations may impose strict and, in certain cases joint and several, liability. This means that in some situations we could be exposed to liability as a result of conduct that was lawful at the time it occurred, or conditions caused by prior operators or other third parties, including any liability related to offsite treatment or disposal facilities. The costs arising from compliance with these laws, regulations and guidelines may be material. |
| 44 | Management’s Discussion and Analysis | |||||||||
We maintain liability insurance, including insurance for certain environmental claims, but coverage is limited and some of our policies exclude coverage for damages resulting from environmental contamination. We cannot assure that insurance will continue to be available to us on commercially reasonable terms, that the possible types of liabilities that we may incur will be covered by insurance, or that the dollar amount of the liabilities will not exceed our policy limits. Even a partially uninsured claim, if successful and of sufficient magnitude, could have a material adverse effect on our business, results of operations and prospects.
Environment regulations could have a significant impact on the energy industry The subject of energy and the environment has created intense public debate around the world in recent years. Debate is likely to continue for the foreseeable future and could potentially have a significant impact on all aspects of the economy. The trend in environmental regulation has been to impose more restrictions and limitations on activities that may impact the environment. Any regulatory changes that impose additional environmental restrictions or requirements on us, or our customers, could increase our operating costs and potentially lead to lower demand for our services and have an adverse effect on us. For example, there is growing concern about the apparent connection between the burning of fossil fuels and climate change. Laws, regulations, or treaties concerning climate change or greenhouse gas emissions can have an adverse impact on the demand for oil and natural gas, which could have a material adverse effect on us.
Governments in Canada and the U.S. are also considering more stringent regulation or restriction of hydraulic fracturing, a technology used by most of our customers that involves the injection of water, sand and chemicals under pressure into rock formations to stimulate oil and natural gas production.
Increasing regulatory restrictions could have a negative impact on the exploration of unconventional energy resources, which are only commercially viable with the use of hydraulic fracturing. Laws relating to hydraulic fracturing are in various stages of development at levels of governments in markets where we operate and the outcome of these developments and their effect on the regulatory landscape and the contract drilling industry is uncertain. Hydraulic fracturing laws or regulations that cause a decrease in the completion of new oil and natural gas wells and an associated decrease in demand for our services could have a material adverse effect on our operations and financial results.
Poor safety performance could lead to lower demand for our services Standards for accident prevention in the oil and natural gas industry are governed by service company safety policies and procedures, accepted industry safety practices, customer-specific safety requirements, and health and safety legislation. Safety is a key factor that customers consider when selecting an oilfield service company. A decline in our safety performance could result in lower demand for services, and this could have a material adverse effect on our revenue, cash flow and earnings.
We are subject to various health and safety laws, rules, legislation and guidelines which can impose material liability, increase our costs or lead to lower demand for our services.
Relying on third-party suppliers has risks We source certain key rig components, raw materials, equipment and component parts from a variety of suppliers in Canada, the U.S. and overseas. We also outsource some or all construction services for drilling and service rigs, includingnew-build rigs, as part of our capital expenditure programs. We maintain relationships with several key suppliers and contractors and an inventory of key components, materials, equipment and parts. We also place advance orders for components that have long lead times. We may, however, experience cost increases, delays in delivery due to strong activity or financial hardship of suppliers or contractors, or other unforeseen circumstances relating to third parties. If our current or alternate suppliers are unable to deliver the necessary components, materials, equipment, parts and services we require for our businesses, including the construction ofnew-build drilling rigs, it can delay service to our customers and have a material adverse effect on our revenue, cash flow and earnings.
Acquisitions entail numerous risks and may disrupt our business or distract management We consider and evaluate acquisitions of, or significant investments in, complementary businesses and assets as part of our business strategy. Any acquisition could have a material adverse effect on our operating results, financial condition, or the price of our securities. Acquisitions involve numerous risks, including unanticipated costs and liabilities, difficulty in integrating the operations and assets of the acquired business, the ability to properly access and maintain an effective internal control environment over an acquired company to comply with public reporting requirements, potential loss of key employees and customers of the acquired companies, and an increase in our expenses and working capital requirements.
We may incur substantial debt to finance future acquisitions and also may issue equity securities or convertible securities for acquisitions. Debt service requirements could be a burden on our results of operations and financial condition. We would also be required to meet certain conditions to borrow money to fund future acquisitions. Acquisitions could also |
| Precision Drilling Corporation 2016 Annual Report | 45 | |||||||||
divert the attention of management and other employees from ourday-to-day operations and the development of new business opportunities. Even if we are successful in integrating future acquisitions into our operations, we may not derive the benefits, such as operational or administrative synergies, we expect from acquisitions, which may result in us committing capital resources and not receiving the expected returns. In addition, we may not be able to continue to identify attractive acquisition opportunities or successfully acquire identified targets.
New technology could reduce demand for certain rigs or put us at a competitive disadvantage Complex drilling programs for the exploration and development of conventional and unconventional oil and natural gas reserves demand high performance drilling rigs. The ability of drilling rig service providers to meet this demand depends on continuous improvement of existing rig technology, such as drive systems, control systems, automation, mud systems and top drives, to improve drilling efficiency. Our ability to deliver equipment and services that meet customer demand is essential to our continued success. We cannot guarantee that our rig technology will continue to meet the needs of our customers, especially as rigs age and technology advances, or that our competitors will not develop technological improvements that are more advantageous, timely, or cost effective.
Our operations face risks of interruption and casualty losses Our operations face many hazards inherent in the drilling and well servicing industries, including blowouts, cratering, explosions, fires, loss of well control, loss of hole, reservoir damage, loss of directional control, damaged or lost equipment, and damage or loss from inclement weather or natural disasters. Any of these hazards could result in personal injury or death, damage to or destruction of equipment and facilities, suspension of operations, environmental damage, damage to the property of others, and damage to producing or potentially productive oil and natural gas formations that we drill through.
Generally, drilling and service rig contracts separate the responsibilities of a drilling or service rig company and the customer, and we try to obtain indemnification from our customers by contract for some of these risks even though we also have insurance coverage to protect us. We cannot assure, however, that any insurance or indemnification agreements will adequately protect us against liability from all the consequences described above. If there is an event that is not fully insured or indemnified against, or a customer or insurer does not meet its indemnification or insurance obligations, it could result in substantial losses. In addition, we may not be able to get insurance to cover any or all these risks, or the coverage may not be adequate. Insurance premiums or other costs may rise significantly in the future, making the insurance prohibitively expensive or uneconomic. Significant events, including terrorist attacks in the U.S., severe hurricane damage, and well blowout damage in the U.S. Gulf Coast region, have resulted in significantly higher insurance costs, deductibles and coverage restrictions. When we renew our insurance, we may decide to self-insure at higher levels and assume increased risk in order to reduce costs associated with higher insurance premiums.
Business in our industry is seasonal and highly variable Seasonal weather patterns in Canada and the northern U.S. affect activity in the oilfield services industry. During the spring months, wet weather and the spring thaw make the ground unstable so municipalities and counties and provincial and state transportation departments enforce road bans that restrict the movement of rigs and other heavy equipment. This reduces activity and highlights the importance of the location of our equipment prior to the imposition of the road bans. The timing and length of road bans depend on weather conditions leading to the spring thaw and during the thawing period.
Additionally, certain oil and natural gas producing areas are located in parts of western Canada that are only accessible during the winter months because the ground surrounding or containing the drilling sites in these areas consists of terrain known as muskeg. Rigs and other necessary equipment cannot cross this terrain to reach the drilling site until the muskeg freezes. Moreover, once the rigs and other equipment have been moved to a drilling site, they may become stranded or be unable to move to another site if the muskeg thaws unexpectedly. Our business activity depends, at least in part, upon the severity and duration of the winter season.
Our operations are subject to foreign exchange risk Our U.S. and international operations have revenue, expenses, assets and liabilities denominated in currencies other than the Canadian dollar, mostly in U.S. dollars and currencies that are pegged to the U.S. dollar. This means that currency exchange rates can affect our income statement, balance sheet and statement of cash flow.
|
| 46 | Management’s Discussion and Analysis | |||||||||
Translation into Canadian Dollars When preparing our consolidated financial statements, we translate the financial statements for foreign operations that do not have a Canadian dollar functional currency into Canadian dollars. We translate assets and liabilities at exchange rates in effect at the balance sheet date. We translate revenues and expenses using average exchange rates for the month of the transaction. We initially recognize gains or losses from these translation adjustments in other comprehensive income, and reclassify them from equity to net earnings on disposal or partial disposal of the foreign operation. Changes in currency exchange rates could materially increase or decrease our foreign currency-denominated net assets, which would increase or decrease shareholders’ equity. Changes in currency exchange rates will affect the amount of revenues and expenses we record for our U.S. and international operations, which will increase or decrease our net earnings. If the Canadian dollar strengthens against the U.S. dollar, the net earnings we record in Canadian dollars from our U.S. and international operations will be lower.
Transaction Exposure We have long-term debt denominated in U.S. dollars. We have designated our U.S. dollar denominated unsecured senior notes as a hedge against the net asset position of our U.S. and foreign operations. This debt is converted at the exchange rate in effect at the balance sheet date with the resulting gains or losses included in the statement of comprehensive income. If the Canadian dollar strengthens against the U.S. dollar, we will incur a foreign exchange gain from the translation of this debt. Similarly, if the Canadian dollar weakens against the U.S. dollar, we will incur a foreign exchange loss from the translation of this debt. The vast majority of our international operations are transacted in U.S. dollars or U.S. dollar-pegged currencies. Transactions for our Canadian operations are primarily transacted in Canadian dollars. However, we occasionally purchase goods and supplies in U.S. dollars for our Canadian operations, and we maintain U.S. dollar cash in our Canadian operations.
We may be unable to access additional financing We may need to obtain additional debt or equity financing in the future to support ongoing operations, undertake capital expenditures, repay existing or future debt (including the Senior Credit Facility, the 2020 Notes, the 2021 Notes, the 2023 Notes and the 2024 Notes), or pursue acquisitions or other business combination transactions. Volatility or uncertainty in the credit markets may increase costs associated with issuing debt or equity, and there is no assurance that we will be able to access additional financing when we need it, or on terms we find acceptable or favourable. If we are unable to obtain financing to support ongoing operations or to fund capital expenditures, acquisitions, debt repayments, or other business combination transactions, it could limit growth and may have a material adverse effect on our revenue, cash flow and profitability.
We regularly assess our credit policies and capital structure and have enough liquidity to meet our needs. SeeFinancial Condition – Liquidity on page 33 for information.
Risks associated with turnkey drilling operations could adversely affect our business We earn some of our revenue from turnkey drilling contracts. We expect that turnkey drilling will continue to be part of our service offering, however, turnkey contracts pose substantially more risk than wells drilled on a daywork basis. Under a typical turnkey drilling contract, we agree to drill a well for a customer to a specified depth and under specified conditions for a fixed price. We typically provide technical expertise and engineering services, as well as most of the equipment required for the drilling of turnkey wells, and use subcontractors for related services. We typically do not receive progress payments and are entitled to payment by the customer only after we have met the full terms of the drilling contract. We sometimes encounter difficulties on wells and incur unanticipated costs, and not all the costs are covered by insurance. As a result, under turnkey contracts we assume most of the risks associated with drilling operations that are generally assumed by customers under a daywork contract. Operating cost overruns or operational difficulties on turnkey jobs could have a material adverse effect on our financial position and results of operations.
There are risks associated with increased capital expenditures The timing and amount of capital expenditures we incur will directly affect the amount of cash available to us. The cost of equipment generally escalates as a result of high input costs during periods of high demand for our drilling rigs and oilfield services equipment and other factors. There is no assurance that we will be able to recover higher capital costs through rate increases to our customers.
|
| Precision Drilling Corporation 2016 Annual Report | 47 | |||||||||
A successful challenge by the tax authorities of expense deductions could negatively affect the value of our common shares Taxation authorities may not agree with the classification of expenses we or our subsidiaries have claimed or may challenge the amount of interest expense deducted. If the taxation authorities successfully challenge our classifications or deductions, it could have an adverse effect on our return to shareholders.
Losing key management could reduce our competitiveness and prospects for future success Our future success and growth depends partly on the expertise and experience of our key management. There is no assurance that we will be able to retain key management. Losing these individuals could have a material adverse effect on our operations and financial condition.
Our assessment of goodwill or capital assets for impairment may result in anon-cash charge against our consolidated net income We are required to assess our goodwill balance for impairment at least annually, and our capital assets balance for impairment when certain internal and external factors indicate the need for further analysis. We calculate impairment based on management’s estimates and assumptions. We may consider several factors, including any declines in our share price and market capitalization, lower future cash flow and earnings estimates, significantly reduced or depressed markets in our industry and general economic conditions, among other things. Any impairment write down to goodwill or capital assets would result in anon-cash charge against net earnings, and it could be material.
Our credit ratings may change Credit ratings affect our financing costs, liquidity and operations over the long term and are intended as an independent measure of the credit quality of long-term debt. Credit ratings affect our ability to obtain short and long-term financing and the cost of this financing, and our ability to engage in certain business activities cost-effectively.
If a rating agency reduces its current rating on our debt, or downgrades us, or we experience a negative change in our ratings outlook, it could have an adverse effect on our financing costs and access to liquidity and capital.
The price of our common shares can fluctuate The price of our common shares can fluctuate. Several factors can cause volatility, including increases or decreases in revenue or earnings, changes in revenue or earnings estimates by the investment community, failure to meet analysts’ expectations, changes in credit ratings, and speculation in the media or investment community about our financial condition or results of operations. General market conditions and Canadian, U.S., or international economic factors and political events unrelated to our performance may also affect the price of our common shares. Investors should therefore not rely on past performance of our common shares to predict the future performance of our common shares or financial results.
Selling additional common shares could affect share value We may issue additional common shares in the future to fund our needs or those of other entities owned directly or indirectly by us, as authorized by the Board. We do not need shareholder approval to issue additional common shares, and shareholders do not have any pre-emptive rights related to share issues.
Any difficulty in retaining, replacing, or adding personnel could adversely affect our business Our ability to provide reliable services depends on the availability of well-trained, experienced crews to operate our field equipment. We must also balance our need to maintain a skilled workforce with cost structures that fluctuate with activity levels. We retain the most experienced employees during periods of low utilization by having them fill lower level positions on field crews. Many of our businesses experience manpower shortages in peak operating periods, and we may experience more severe shortages if the industry adds more rigs, oilfield service companies expand, and new companies enter the business.
We may not be able to find enough skilled labour to meet our needs, and this could limit growth. We may also have difficulty finding enough skilled and unskilled labour in the future if demand for our services increases. Shortages of qualified personnel have occurred in the past during periods of high demand. The demand for qualified rig personnel generally increases with stronger demand for land drilling services and as new and refurbished rigs are brought into service. Increased demand typically leads to higher wages that may or may not be reflected in any increases in service rates.
|
| 48 | Management’s Discussion and Analysis | |||||||||
Other factors can also affect our ability to find enough workers to meet our needs. Our business requires skilled workers who can perform physically demanding work. Volatility in oil and natural gas activity and the demanding nature of the work, however, may prompt workers to pursue other kinds of jobs that offer a more desirable work environment and wages competitive to ours. Our success depends on our ability to continue to employ and retain skilled technical personnel and qualified rig personnel. If we are unable to, it could have a material adverse effect on our operations.
We continually monitor crew availability. To retain and attract quality staff, we focus on providing a safe and productive work environment, opportunity for advancement, and added wage security.
Our business is subject to cybersecurity risks. Threats to information technology systems associated with cybersecurity risks and cyber incidents or attacks continue to grow. Cybersecurity attacks could include, but are not limited to, malicious software, attempts to gain unauthorized access to data and the unauthorized release, corruption or loss of data and personal information, account takeovers, and other electronic security breaches that could lead to disruptions in our critical systems. Risks associated with these attacks include, among other things, loss of intellectual property, disruption of our and customers’ business operations and safety procedures, loss or damage to our data delivery systems, unauthorized disclosure of personal information and increased costs to prevent, respond to or mitigate cybersecurity events. Although we utilize various procedures and controls to mitigate our exposure to such risk, cybersecurity attacks are evolving and unpredictable. The occurrence of such an attack could go unnoticed for a period of time. Any such attack could have a material adverse effect on our business, financial condition and results of operations.
As a foreign private issuer in the U.S., we may file less information with the SEC than a company incorporated in the U.S. As aforeign private issuer, we are exempt from certain rules under the United States Exchange Act of 1934 (theExchange Act) that impose disclosure requirements, as well as procedural requirements, for proxy solicitations under Section 14 of the Exchange Act. Our directors, officers and principal shareholders are also exempt from the reporting andshort-swing profit recovery provisions of Section 16 of the Exchange Act. We are not required to file periodic reports and financial statements with the SEC as frequently or as promptly as U.S. companies whose securities are registered under the Exchange Act, nor are we generally required to comply with Regulation FD, which restricts the selective disclosure of material non-public information. As a result, there may be less publicly available information about us than U.S. public companies and this information may not be provided as promptly. In addition, we are permitted, under a multi-jurisdictional disclosure system adopted by the U.S. and Canada, to prepare our disclosure documents in accordance with Canadian disclosure requirements, including preparing our financial statements in accordance with International Financial Reporting Standards(IFRS), which differs in some respects from U.S. GAAP. We are required to assess ourforeign private issuer status under U.S. securities laws on an annual basis at the end of each second quarter. If we were to lose status as aforeign private issuer under U.S. securities laws, we would be required to fully comply with U.S. securities and accounting requirements.
We have retained liabilities from prior reorganizations We have retained all liabilities of our predecessor companies, including liabilities relating to corporate and income tax matters.
We may become a passive foreign investment company, which could result in adverse U.S. tax consequences to U.S. investors Management does not believe that we are or will be treated as a passive foreign investment company (PFIC) for U.S. tax purposes. However, because PFIC status is determined annually and will depend on the composition of our income and assets from time to time, it is possible that we could be considered a PFIC in the future. This could result in adverse U.S. tax consequences to a U.S. investor. In particular, a U.S. investor would be subject to U.S. federal income tax at ordinary income rates, plus a possible interest charge, for any gain derived from a disposition of common shares, as well as certain distributions by us. In addition, a step-up in the tax basis of our common shares would not be available if an individual holder dies.
An investor who acquires 10% or more of our common shares may be subject to taxation under the controlled foreign corporation (CFC) rules.
Under certain circumstances, a U.S. person who directly or indirectly owns 10% or more of the voting power of a foreign corporation that is a CFC (generally, a foreign corporation where 10% of the U.S. shareholders own more than 50% of the voting power or value of the stock of the foreign corporation) for 30 straight days or more during a taxable year and who holds any shares of the foreign corporation on the last day of the corporation’s tax year must include in gross income for U.S. federal income tax purposes its pro rata share of certain income of the CFC even if the share is not distributed to the person. We are not currently a CFC, but this could change in the future. |
| Precision Drilling Corporation 2016 Annual Report | 49 | |||||||||
Internal Control over Financial Reporting We maintain internal control over financial reporting that is designed to provide reasonable assurance regarding the reliability of financial reporting and the preparation of financial statements for external purposes in accordance with IFRS.
Management is responsible for establishing and maintaining adequate internal control over financial reporting, as defined in Rules 13a – 15(f) and 15d – 15(f) under the United States Securities Exchange Act of 1934, as amended (the Exchange Act) and under National Instrument52-109 Certification of Disclosure in Issuer’s Annual and Interim Filings(NI 52-109).
Management, including the Chief Executive Officer (CEO) and the Chief Financial Officer (CFO), has conducted an evaluation of our internal control over financial reporting based on criteria established in Internal Control – Integrated Framework (2013) issued by the Committee of Sponsoring Organizations of the Treadway Commission (COSO 2013). |
Based on management’s assessment as at December 31, 2016, management has concluded that our internal control over financial reporting is effective.
The effectiveness of internal control over financial reporting as of December 31, 2016 was audited by KPMG LLP, an independent registered public accounting firm, as stated in their Report of Independent Registered Public Accounting Firm, which is included in this annual report.
Due to its inherent limitations, internal control over financial reporting is not intended to provide absolute assurance that a misstatement of our financial statements would be prevented or detected. Further, the evaluation of the effectiveness of internal control over financial reporting was made as of a specific date, and continued effectiveness in future periods is subject to the risks that controls may become inadequate.
Disclosure Controls and Procedures We maintain disclosure controls and procedures designed to provide reasonable assurance that information required to be disclosed in our interim and annual filings is reviewed, recognized and disclosed accurately and in the appropriate time period.
Management, including the CEO and CFO, carried out an evaluation, as of December 31, 2016, of the effectiveness of the design and operation of Precision’s disclosure controls and procedures, as defined in Rule 13a – 15(e) and 15d – 15(e) under the Exchange Act and NI52-109. Based on that evaluation, the CEO and CFO have concluded that the design and operation of Precision’s disclosure controls and procedures were effective to ensure that information required to be disclosed in the reports we file or submit under the Exchange Act or Canadian securities legislation is recorded, processed, summarized and reported within the time periods specified in the rules and forms therein.
It should be noted that while the CEO and CFO believe that our disclosure controls and procedures provide a reasonable level of assurance that they are effective, they do not expect that these disclosure controls and procedures will prevent all errors and fraud. A control system, no matter how well conceived or operated, can provide only reasonable, not absolute, assurance that the objectives of the control system are met. |
| 50 | Management’s Discussion and Analysis | |||||||||