UNITED STATES
SECURITIES AND EXCHANGE COMMISSION
Washington, D.C. 20549
FORM N-CSR
CERTIFIED SHAREHOLDER REPORT OF REGISTERED
MANAGEMENT INVESTMENT COMPANIES
Investment Company Act file number 811-08361
Goldman Sachs Variable Insurance Trust
(Exact name of registrant as specified in charter)
71 South Wacker Drive, Chicago, Illinois 60606-6303
(Address of principal executive offices) (Zip code)
Caroline Kraus
Goldman, Sachs & Co.
200 West Street
New York, NY 10282
Copies to:
Geoffrey R.T. Kenyon, Esq.
Dechert LLP
One International Place, 40th Floor
100 Oliver Street
Boston, MA 02110-2605
(Name and address of agents for service)
Registrant’s telephone number, including area code: (312) 655-4400
Date of fiscal year end: December 31
Date of reporting period: June 30, 2016
| ITEM 1. | REPORTS TO STOCKHOLDERS. |
| The Semi-Annual Reports to Shareholders are filed herewith. |
Goldman
Sachs Variable Insurance Trust
Goldman Sachs
Global Trends
Allocation Fund
Semi-Annual Report
June 30, 2016

GOLDMAN SACHS VARIABLE INSURANCE TRUST GLOBAL TRENDS ALLOCATION FUND
INVESTMENT OBJECTIVE
The Fund seeks total return while seeking to provide volatility management.
Portfolio Management Discussion and Analysis
Below, the Goldman Sachs Quantitative Investment Strategies Team discusses the Goldman Sachs Variable Insurance Trust — Goldman Sachs Global Trends Allocation Fund’s (the “Fund”) performance and positioning for the six-month period ended June 30, 2016 (the “Reporting Period”).
How did the Fund perform during the Reporting Period?
During the Reporting Period, the Fund’s Institutional and Service Shares generated cumulative total returns of 0.46% and 0.37%, respectively. These returns compare to the 2.84% cumulative total return of the Fund’s benchmark, the Global Trends Allocation Composite Index (the “Index”), during the same time period. The components of the Fund’s benchmark, the Morgan Stanley Capital International (MSCI) World Index and the Barclays U.S. Aggregate Bond Index, generated cumulative total returns of 1.02% and 5.31%, respectively, during the same time period.
Importantly, during the Reporting Period, the Fund’s overall annualized volatility (which is measured versus the S&P 500® Index) was 5.64%, less than the S&P 500® Index’s annualized volatility of 16.16% during the same time period.
What economic and market factors most influenced the Fund during the Reporting Period?
Global equities suffered a rout at the beginning of the Reporting Period, triggered by concerns about an intensifying economic slowdown in China and exacerbated by a plunge in crude oil prices. Near the middle of the Reporting Period, central bank dovishness, along with receding global economic concerns and oil price stabilization, helped to drive a global equity market recovery. (Dovish tends to suggest lower interest rates.) Near the end of the Reporting Period, however, the surprise “leave” result in the U.K. referendum on membership in the European Union, popularly known as Brexit, shook the global equity markets. Global equities then rebounded in the latter days of the Reporting Period owing to improving risk appetite, as markets digested the outcome of the Brexit vote and on continued dovish policy by global central banks.
In terms of fixed income, when the Reporting Period began, spread (or non-government bond) sectors retreated, selling off significantly from January to mid-February 2016. The selloff was driven by an increase in a number of perceived risks, such as slowing Chinese economic activity, the possibility of persistent oil oversupply and deteriorating corporate bond fundamentals, as the U.S. credit cycle entered its later stage. Some of these risks eased in the second half of the first calendar quarter, as economic news from China improved, U.S. oil production showed signs of slowing and commodity prices appeared to stabilize. As a result, spread sectors largely retraced their losses by the end of March 2016. During the second quarter of 2016, spread sectors rallied on stabilization of commodities prices as well as on declining fears about slowing Chinese economic growth and the potential for a U.S. economic recession. Spread sectors withstood the Brexit vote relatively well, selling off at first but then recovering most of their losses afterwards. Overall, during the Reporting Period, global interest rates broadly declined amid continued accommodative monetary policy from the world’s central banks.
What key factors were responsible for the Fund’s performance during the Reporting Period?
The Fund primarily seeks to achieve its investment objective by investing in a global portfolio of equity and fixed income asset classes. Under normal market conditions, the Fund expects to invest at least 40% of its assets in equity investments and at least 20% of its assets in fixed income investments. The Investment Adviser makes investment decisions based upon its analysis of market factors around the world and may allocate more of the Fund’s assets to investments with strong recent performance and allocate assets away from investments with poor recent performance. The percentage of the Fund’s portfolio exposed to any asset class or geographic region will vary from time to time as the weightings of the Fund change, and the Fund may not be invested in each asset class at all times.
As part of the Fund’s investment strategy, the Investment Adviser seeks to manage volatility and limit losses by allocating the Fund’s assets away from risky investments in distressed or volatile market environments. Volatility is a statistical measurement of the magnitude of up and down fluctuations in the value of a financial instrument or index. In distressed or volatile market environments, the Fund may also hold significant amounts of U.S. Treasury, short-term or other fixed income investments,
1
GOLDMAN SACHS VARIABLE INSURANCE TRUST GLOBAL TRENDS ALLOCATION FUND
including money market funds and repurchase agreements or cash, and at times may invest up to 100% of its assets in such investments.
During the Reporting Period, the Fund continued dynamically allocating across global asset classes, using a momentum-based methodology, as it sought total return while also seeking to provide volatility management. Momentum investing seeks growth of capital by gaining exposure to asset classes that have exhibited trends in price performance over selected time periods. In managing the Fund, we use a methodology that evaluates historical three-, six- and nine-month returns, volatilities and correlations across a range of nine global asset classes. Represented by indices, these asset classes include, within the equities category, the U.S. large-cap and small-cap, Europe, Asia, emerging markets, and U.K. stocks. Within the fixed income category, the Fund may allocate assets to the U.S., Europe and Japan. The analysis of these asset classes drives the aggregate allocations of the Fund over time. We believe market price momentum — either positive or negative — has significant predictive power.
During the Reporting Period, the Fund’s allocations to Japanese and European stocks detracted from performance. Conversely, the Fund’s allocation to fixed income bolstered returns as yields fell in many global economies. An allocation to U.S. Treasury securities contributed positively as did its allocation to Japanese government bonds. The Fund’s allocation to German government bonds also helped returns, albeit to a lesser extent. An allocation to cash provided downside protection, as global equity markets broadly pulled back at the beginning of the Reporting Period amid increased market volatility and broad-based investor risk aversion. Within equities, the Fund’s allocations to U.S. large-cap stocks and U.K. equities enhanced performance. A small allocation to U.S. small-cap equities also contributed positively. The Fund’s allocation to emerging market equities had a relatively neutral impact on performance during the Reporting Period.
What was the Fund’s volatility during the Reporting Period?
As part of our investment approach, we seek to mitigate the Fund’s volatility. As mentioned earlier, for the Reporting Period overall, the Fund’s actual volatility (annualized, using daily returns) was 5.64% versus the S&P 500® Index’s annualized volatility of 16.16%.
How was the Fund positioned during the Reporting Period?
During the Reporting Period, we tactically managed the Fund’s allocations across equity and fixed income markets based on the momentum and volatility of these asset classes. At the beginning of the Reporting Period, the Fund’s total assets were allocated 46% to equities, 27% to fixed income and 26% to cash. The Fund maintained a modest allocation to cash at the beginning of the Reporting Period when bond yields rose and dampened fixed income market momentum. Within fixed income, the Fund had small allocations to U.S. Treasuries as well as to German and Japanese government bonds. Within equities, the Fund had a significant allocation to U.S. large-cap equities and smaller allocations to Japanese, European and U.K. equities. The Fund did not have any exposure to emerging market and U.S. small-cap equities. Near the middle of the Reporting Period, we reduced the Fund’s allocation to cash as global equity markets continued to rally strongly. Within equities, the Fund continued to hold a significant allocation to U.S. large-cap equities and modest allocations to U.K., European and Japanese equities. It continued to have no exposure to U.S. small-cap and emerging market equities. Within fixed income, we increased the Fund’s allocation to U.S. Treasuries and to German and Japanese government bonds. Toward the end of the Reporting Period, we reduced the Fund’s allocation to cash as global equity markets continued to advance. We increased allocations to both equities and fixed income. Within equities, we slightly increased the Fund’s allocation to U.S. large-cap equities while adding smaller allocations to emerging markets equities and U.S. small-cap equities. The Fund maintained modest exposures to U.K., European and Japanese equities. Within fixed income, we increased the Fund’s allocations to U.S. Treasuries and Japanese government bonds while maintaining its small allocation to German government bonds.
How did the Fund use derivatives and similar instruments during the Reporting Period?
During the Reporting Period, the Fund used exchange-traded index futures contracts to gain exposure to the European, Japanese and U.K. equity markets as well as to Japanese and German government bonds. The use of exchange-traded index futures had a negative impact on the Fund’s performance during the Reporting Period, as these allocations detracted from returns.
What is the Fund’s tactical asset allocation view and strategy for the months ahead?
At the end of the Reporting Period, we slightly increased the Fund’s allocation to cash. We reduced its allocation to equities and increased its allocation to fixed income. Within equities, we decreased the Fund’s allocations to U.S. large-cap, U.K., European and Japanese equities. We eliminated the Fund’s allocations to U.S. small-cap and emerging markets equities. Within fixed income, we increased its allocations to German government bonds and U.S. Treasury securities. We decreased the Fund’s allocation to Japanese
2
GOLDMAN SACHS VARIABLE INSURANCE TRUST GLOBAL TRENDS ALLOCATION FUND
government bonds. Overall, at the end of the Reporting Period, the Fund’s total assets were allocated 34% to equities, 60% to fixed income and 6% to cash.
Going forward, we intend to position the Fund to provide exposure to price momentum from among nine underlying asset classes, while seeking to manage the volatility, or risk, of the overall portfolio. In general, the Fund seeks to maintain a strategic allocation of 60% of its assets in equity investments and 40% of its assets in fixed income investments. The Fund may deviate from these strategic allocations in order to allocate a greater percentage to asset classes with strong momentum and to reduce its allocation to assets with weak momentum. When volatility increases, our goal is to preserve capital by proportionally increasing the Fund’s cash exposure and reducing its exposure to riskier asset classes. There is no guarantee the Fund’s dynamic management strategy will cause it to achieve its investment objective.
3
GOLDMAN SACHS VARIABLE INSURANCE TRUST GLOBAL TRENDS ALLOCATION FUND
Index Definitions
Global Trends Allocation Composite Index is composed 60% of MSCI World Index and 40% of Barclays U.S. Aggregate Bond Index. It is a composite representation prepared by the Investment Adviser of the performance of the Fund’s asset classes, weighted according to their respective weightings in the Fund’s target range.
MSCI World Index (Net, USD, unhedged) is a free float-adjusted market capitalization weighted index that is designed to measure the equity market performance of 23 developed markets.
Barclays U.S. Aggregate Bond Index represents an unmanaged diversified portfolio of fixed income securities, including U.S. Treasuries, investment grade corporate bonds, and mortgage-backed and asset-backed securities.
4
FUND BASICS
Global Trends Allocation Fund
as of June 30, 2016
STANDARDIZED TOTAL RETURNS1
| For the period ended 6/30/16 | One Year | Three Years | Since Inception | Inception Date | ||||||||||
| Institutional | -4.91 | % | N/A | 0.76 | % | 10/16/13 | ||||||||
| Service | -5.22 | 1.61 | % | 3.54 | 4/16/12 | |||||||||
| 1 | Standardized Total Returns are average annual total returns as of the most recent calendar quarter-end. They assume reinvestment of all distributions at net asset value (“NAV”). Because Institutional Shares and Service Shares do not involve a sales charge, such a charge is not applied to their Standardized Total Returns. |
Total return figures in the above chart represent past performance and do not indicate future results, which will vary. The investment return and principal value of an investment will fluctuate and, therefore, an investor’s shares, when redeemed, may be worth more or less than their original cost. Current performance may be lower or higher than the total return figures in the above chart. Please visit www.GSAMFUNDS.com to obtain the most recent month-end returns. Performance reflects fee waivers and/or expense limitations in effect during the periods shown. In their absence, performance would be reduced.
EXPENSE RATIOS2
| Net Expense Ratio (Current) | Gross Expense Ratio (Before Waivers) | |||||||
| Institutional | 0.82 | % | 0.99 | % | ||||
| Service | 1.07 | 1.24 | ||||||
| 2 | The expense ratios of the Fund, both current (net of applicable fee waivers and/or expense limitations) and before waivers (gross of applicable fee waivers and/or expense limitations) are as set forth above according to the most recent publicly available Prospectuses for the Fund and may differ from the expense ratios disclosed in the Financial Highlights in this report. Pursuant to a contractual arrangement, the Fund’s waivers and/or expense limitations will remain in place through at least April 29, 2017, and prior to such date the Investment Adviser may not terminate the arrangements without the approval of the Fund’s Board of Trustees. If these arrangements are discontinued in the future, the expense ratios may change without shareholder approval. |
5
FUND BASICS
FUND COMPOSITION3
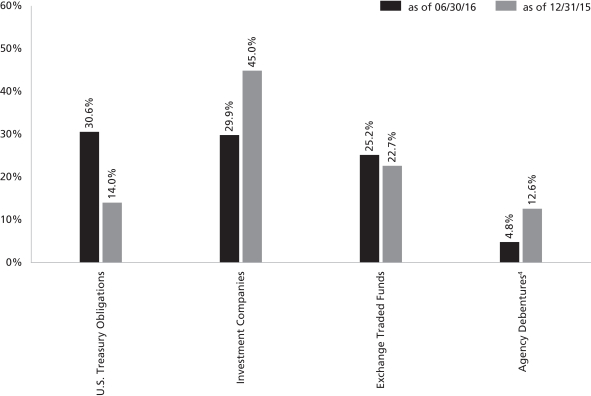
| 3 | The percentage shown for each investment category reflects the value of investments in that category as a percentage of net assets (excluding investments in the securities lending reinvestment vehicle, if any). Figures in the graph may not sum to 100% due to the exclusion of other assets and liabilities. Consequently, the Fund’s overall sector allocations may differ from the percentages contained in the graph above. The graph depicts the Fund’s investments but may not represent the Fund’s market exposure due to the exclusion of certain derivatives, if any, as listed in the Additional Investment Information section of the Schedule of Investments. |
| 4 | “Agency Debentures” include agency securities offered by companies such as Federal National Mortgage Association, which operate under a government charter. While they are required to report to a government regulator, their assets are not explicitly guaranteed by the government and they otherwise operate like any other publicly traded company. |
6
GOLDMAN SACHS VARIABLE INSURANCE TRUST GLOBAL TRENDS ALLOCATION FUND
Schedule of Investments
June 30, 2016 (Unaudited)
| Principal Amount | Interest Rate | Maturity Date | Value | |||||||||||
| Agency Debenture(a) – 4.8% | ||||||||||||||
| FNMA Discount Notes |
| ||||||||||||
| $ | 17,877,000 | 0.000 | % | 08/01/16 | $ | 17,873,156 | ||||||||
| (Cost $17,871,612) | ||||||||||||||
|
|
|
| |||||||||||
| U.S. Treasury Obligation – 30.6% | ||||||||||||||
| United States Treasury Note |
| ||||||||||||
| $ | 103,015,000 | 2.750 | % | 11/15/23 | $ | 113,553,438 | ||||||||
| (Cost $110,868,503) | ||||||||||||||
|
|
|
| |||||||||||
| Shares | Description | Value | ||||||
| Exchange Traded Funds – 25.2% | ||||||||
| 304,745 | iShares Core S&P 500 Fund | $ | 64,209,771 | |||||
| 153,562 | Vanguard S&P 500 Fund | 29,517,688 | ||||||
|
| |||||||
| TOTAL EXCHANGE TRADED FUNDS | ||||||||
| (Cost $90,517,665) | $ | 93,727,459 | ||||||
|
| |||||||
| Shares | Distribution Rate | Value | ||||||
| Investment Company(b)(c) – 29.9% | ||||||||
| Goldman Sachs Financial Square Government Fund — | | ||||||
| 110,962,728 | 0.299% | $ | 110,962,728 | |||||
| (Cost $110,962,728) | ||||||||
|
| |||||||
| TOTAL INVESTMENTS – 90.5% | ||||||||
| (Cost $330,220,508) | $ | 336,116,781 | ||||||
|
| |||||||
| OTHER ASSETS IN EXCESS OF | 35,165,204 | ||||||
|
| |||||||
| NET ASSETS – 100.0% | $ | 371,281,985 | ||||||
|
| |||||||
| The percentage shown for each investment category reflects the value of investments in that category as a percentage of net assets. | ||
| (a) | Issued with a zero coupon. Income is recognized through the accretion of discount. | |
| (b) | Represents an affiliated issuer. | |
| (c) | Variable rate security. Interest rate or distribution rate disclosed is that which is in effect on June 30, 2016. | |
| Investment Abbreviation: | ||
| FNMA | —Federal National Mortgage Association | |
ADDITIONAL INVESTMENT INFORMATION
FUTURES CONTRACTS — At June 30, 2016, the Fund had the following futures contracts:
| Type | Number of Contracts Long (Short) | Expiration Date | Current Value | Unrealized Gain (Loss) | ||||||||||||
| EURO STOXX 50 Index | 293 | September 2016 | $ | 9,283,225 | $ | (111,147 | ) | |||||||||
| Euro-Bund | 359 | September 2016 | 66,580,649 | 441,549 | ||||||||||||
| FTSE 100 Index | 170 | September 2016 | 14,534,920 | 966,487 | ||||||||||||
| TSE TOPIX Index | 60 | September 2016 | 7,236,721 | (455,265 | ) | |||||||||||
| 10 Year Japanese Government Bonds | 52 | September 2016 | 77,004,212 | 432,196 | ||||||||||||
| TOTAL | $ | 1,273,820 | ||||||||||||||
| The accompanying notes are an integral part of these financial statements. | 7 |
GOLDMAN SACHS VARIABLE INSURANCE TRUST GLOBAL TRENDS ALLOCATION FUND
Statement of Assets and Liabilities
June 30, 2016 (Unaudited)
| Assets: | ||||
Investments in unaffiliated issuers, at value (cost $219,257,780) | $ | 225,154,053 | ||
Investments in affiliated Underlying Fund, at value (cost $110,962,728) | 110,962,728 | |||
Cash | 33,171,799 | |||
Receivables: | ||||
Investments sold | 31,800,097 | |||
Collateral on certain derivative contracts | 3,595,578 | |||
Dividends and interest | 278,788 | |||
Fund shares sold | 190,632 | |||
Reimbursement from investment adviser | 23,804 | |||
Securities lending income | 2,049 | |||
Variation margin on certain derivative contracts | 21,516 | |||
| Total assets | 405,201,044 | |||
| Liabilities: | ||||
Payables: | ||||
Investments purchased | 33,403,462 | |||
Management fees | 225,542 | |||
Distribution and Service fees and Transfer Agency fees | 81,559 | |||
Fund shares redeemed | 80,854 | |||
Accrued expenses | 127,642 | |||
| Total liabilities | 33,919,059 | |||
| Net Assets: | ||||
Paid-in capital | 386,878,036 | |||
Undistributed net investment income | 62,165 | |||
Accumulated net realized loss | (22,787,813 | ) | ||
Net unrealized gain | 7,129,597 | |||
| NET ASSETS | $ | 371,281,985 | ||
Net Assets: | ||||
Institutional | $ | 25,484 | ||
Service | 371,256,501 | |||
Total Net Assets | $ | 371,281,985 | ||
Shares of beneficial interest outstanding $0.001 par value (unlimited shares authorized): | ||||
Institutional | 2,333 | |||
Service | 34,040,546 | |||
Net asset value, offering and redemption price per share: | ||||
Institutional | $10.92 | |||
Service | 10.91 | |||
| 8 | The accompanying notes are an integral part of these financial statements. |
GOLDMAN SACHS VARIABLE INSURANCE TRUST GLOBAL TRENDS ALLOCATION FUND
Statement of Operations
For the Six Months Ended June 30, 2016 (Unaudited)
| Investment income: | ||||
Dividends — unaffiliated issuers | $ | 1,020,533 | ||
Interest | 640,570 | |||
Dividends — affiliated issuer | 175,045 | |||
Securities lending income — affiliated issuer | 2,049 | |||
| Total investment income | 1,838,197 | |||
| Expenses: | ||||
Management fees | 1,406,356 | |||
Distribution and Service fees — Service Shares | 444,715 | |||
Professional fees | 75,077 | |||
Transfer Agency fees(a) | 35,600 | |||
Printing and mailing costs | 30,028 | |||
Custody, accounting and administrative services | 24,943 | |||
Trustee fees | 12,098 | |||
Other | 9,596 | |||
| Total expenses | 2,038,413 | |||
Less — expense reductions | (262,381 | ) | ||
| Net expenses | 1,776,032 | |||
| NET INVESTMENT INCOME | 62,165 | |||
| Realized and unrealized gain (loss): | ||||
Net realized gain (loss) from: | ||||
Investments | (3,601,769 | ) | ||
Futures contracts | (3,057,269 | ) | ||
Foreign currency transactions | 118,091 | |||
Net change in unrealized gain (loss) on: | ||||
Investments | 6,397,298 | |||
Futures contracts | 1,021,483 | |||
Foreign currency translation | (56,106 | ) | ||
| Net realized and unrealized gain | 821,728 | |||
| NET INCREASE IN NET ASSETS RESULTING FROM OPERATIONS | $ | 883,893 | ||
(a) Institutional and Service Shares incurred Transfer Agency fees of $26 and $35,574, respectively.
| The accompanying notes are an integral part of these financial statements. | 9 |
GOLDMAN SACHS VARIABLE INSURANCE TRUST GLOBAL TRENDS ALLOCATION FUND
Statement of Changes in Net Assets
For the Six Months Ended June 30, 2016 (Unaudited) | For the Fiscal Year Ended December 31, 2015 | |||||||
| From operations: | ||||||||
Net investment income (loss) | $ | 62,165 | $ | (486,837 | ) | |||
Net realized loss | (6,540,947 | ) | (14,388,102 | ) | ||||
Net change in unrealized gain (loss) | 7,362,675 | (5,187,236 | ) | |||||
| Net increase (decrease) in net assets resulting from operations | 883,893 | (20,062,175 | ) | |||||
| Distributions to shareholders: | ||||||||
From net investment income | ||||||||
Institutional Shares | — | (3,063 | ) | |||||
Service Shares | — | (309,376 | ) | |||||
From net realized gains | ||||||||
Institutional Shares | — | (21,380 | ) | |||||
Service Shares | — | (7,668,103 | ) | |||||
| Total distributions to shareholders | — | (8,001,922 | ) | |||||
| From share transactions: | ||||||||
Proceeds from sales of shares | 33,123,773 | 141,160,161 | ||||||
Reinvestment of distributions | — | 8,001,922 | ||||||
Cost of shares redeemed | (18,439,874 | ) | (33,842,796 | ) | ||||
| Net increase in net assets resulting from share transactions | 14,683,899 | 115,319,287 | ||||||
| TOTAL INCREASE | 15,567,792 | 87,255,190 | ||||||
| Net assets: | ||||||||
Beginning of period | 355,714,193 | 268,459,003 | ||||||
End of period | $ | 371,281,985 | $ | 355,714,193 | ||||
| Undistributed net investment income | $ | 62,165 | $ | — | ||||
| 10 | The accompanying notes are an integral part of these financial statements. |
GOLDMAN SACHS VARIABLE INSURANCE TRUST GLOBAL TRENDS ALLOCATION FUND
Financial Highlights
Selected Data for a Share Outstanding Throughout Each Period
| Income (loss) from investment operations | Distributions to shareholders | |||||||||||||||||||||||||||||||||||||||||||||||||||||||
| Year - Share Class | Net asset value, beginning of period | Net investment income (loss)(a) | Net realized and unrealized gain (loss) | Total from investment operations | From net investment income | From net realized gains | Total distributions | Net asset value, end of period | Total return(b) | Net assets, end of period (in 000s) | Ratio of net expenses to average net assets | Ratio of total expenses to average net assets | Ratio of net investment income (loss) to average net assets | Portfolio rate(c) | ||||||||||||||||||||||||||||||||||||||||||
FOR THE SIX MONTHS ENDED JUNE 30, (UNAUDITED) | ||||||||||||||||||||||||||||||||||||||||||||||||||||||||
2016 - Institutional | $ | 10.89 | $ | (0.02 | ) | $ | 0.05 | $ | 0.03 | $ | — | $ | — | $ | — | $ | 10.92 | 0.46 | % | $ | 25 | 0.74 | %(d) | 0.90 | %(d) | (0.34 | )%(d) | 144 | % | |||||||||||||||||||||||||||
2016 - Service | 10.88 | — | (e) | 0.03 | 0.03 | — | — | — | 10.91 | 0.37 | 371,257 | 1.00 | (d) | 1.15 | (d) | 0.04 | (d) | 144 | ||||||||||||||||||||||||||||||||||||||
FOR THE FISCAL YEARS ENDED DECEMBER 31, | ||||||||||||||||||||||||||||||||||||||||||||||||||||||||
2015 - Institutional | 11.82 | 0.01 | (0.67 | ) | (0.66 | ) | (0.03 | ) | (0.24 | ) | (0.27 | ) | 10.89 | (5.52 | ) | 1,008 | 0.75 | 0.92 | 0.12 | 504 | ||||||||||||||||||||||||||||||||||||
2015 - Service | 11.82 | (0.02 | ) | (0.67 | ) | (0.69 | ) | (0.01 | ) | (0.24 | ) | (0.25 | ) | 10.88 | (5.82 | ) | 354,706 | 1.00 | 1.17 | (0.16 | ) | 504 | ||||||||||||||||||||||||||||||||||
2014 - Institutional | 11.46 | 0.08 | 0.41 | 0.49 | (0.03 | ) | (0.10 | ) | (0.13 | ) | 11.82 | 4.23 | 739 | 0.77 | 1.01 | 0.68 | 304 | |||||||||||||||||||||||||||||||||||||||
2014 - Service | 11.47 | — | (e) | 0.45 | 0.45 | — | (e) | (0.10 | ) | (0.10 | ) | 11.82 | 3.95 | 267,720 | 1.03 | 1.24 | 0.04 | 304 | ||||||||||||||||||||||||||||||||||||||
2013 - Institutional (Commenced October 16, 2013) | 11.41 | 0.01 | 0.34 | 0.35 | (0.02 | ) | (0.28 | ) | (0.30 | ) | 11.46 | 3.17 | 26 | 0.81 | (d) | 1.09 | (d) | 0.33 | (d) | 195 | ||||||||||||||||||||||||||||||||||||
2013 - Service | 10.36 | (0.02 | ) | 1.42 | 1.40 | (0.01 | ) | (0.28 | ) | (0.29 | ) | 11.47 | 13.57 | 136,116 | 1.04 | 1.51 | (0.21 | ) | 195 | |||||||||||||||||||||||||||||||||||||
FOR THE PERIOD ENDED DECEMBER 31, | ||||||||||||||||||||||||||||||||||||||||||||||||||||||||
2012 (Commenced April 16, 2012) | 10.00 | 0.02 | 0.35 | 0.37 | — | (0.01 | ) | (0.01 | ) | 10.36 | 3.74 | 25,990 | 1.04 | (d) | 4.21 | (d) | 0.27 | (d) | 300 | |||||||||||||||||||||||||||||||||||||
| (a) | Calculated based on the average shares outstanding methodology. |
| (b) | Assumes investment at the net asset value at the beginning of the period, reinvestment of all distributions, and a complete redemption of the investment at the net asset value at the end of the period. Total returns for periods less than one full year are not annualized. |
| (c) | The Fund’s portfolio turnover rate is calculated in accordance with regulatory requirements, without regard to transactions involving short term investments and certain derivatives. If such transactions were included, the Fund’s portfolio turnover rate may be higher. |
| (d) | Annualized. |
| (e) | Amount is less than $0.005 per share. |
| The accompanying notes are an integral part of these financial statements. | 11 |
GOLDMAN SACHS VARIABLE INSURANCE TRUST GLOBAL TRENDS ALLOCATION FUND
Notes to Financial Statements
June 30, 2016 (Unaudited)
1. ORGANIZATION
Goldman Sachs Variable Insurance Trust (the “Trust” or “VIT”) is a Delaware statutory trust registered under the Investment Company Act of 1940, as amended (the “Act”), as an open-end management investment company. The Trust includes the Goldman Sachs Global Trends Allocation Fund (the “Fund”). The Fund is a non-diversified portfolio under the Act offering two classes of shares — Institutional and Service Shares. Shares of the Trust are offered to separate accounts of participating life insurance companies for the purpose of funding variable annuity contracts and variable life insurance policies.
Goldman Sachs Asset Management, L.P. (“GSAM”), an affiliate of Goldman, Sachs & Co. (“Goldman Sachs”), serves as investment adviser to the Fund pursuant to a management agreement (the “Agreement”) with the Trust.
2. SIGNIFICANT ACCOUNTING POLICIES
The financial statements have been prepared in accordance with accounting principles generally accepted in the United States of America (“GAAP”) and require management to make estimates and assumptions that may affect the reported amounts and disclosures. Actual results may differ from those estimates and assumptions.
A. Investment Valuation — The Fund’s valuation policy is to value investments at fair value.
B. Investment Income and Investments — Investment income includes interest income, dividend income, net of any foreign withholding taxes, less any amounts reclaimable, and securities lending income. Interest income is accrued daily and adjusted for amortization of premiums and accretion of discounts. Dividend income is recognized on ex-dividend date or, for certain foreign securities, as soon as such information is obtained subsequent to the ex-dividend date. Investment transactions are reflected on trade date. Realized gains and losses are calculated using identified cost. Investment transactions are recorded on the following business day for daily net asset value (“NAV”) calculations. Any foreign capital gains tax is accrued daily based upon net unrealized gains, and is payable upon sale of such investments.
For derivative contracts, realized gains and losses are recorded upon settlement of the contract.
C. Class Allocations and Expenses — Investment income, realized and unrealized gain (loss), and non-class specific expenses of the Fund are allocated daily based upon the proportion of net assets of each class. Non-class specific expenses directly incurred by the Fund are charged to the Fund, while such expenses incurred by the Trust are allocated across the Fund on a straight-line and/or pro-rata basis depending upon the nature of the expenses. Class specific expenses, where applicable, are borne by the respective share classes and include Distribution and Service and Transfer Agency fees.
D. Federal Taxes and Distributions to Shareholders — It is the Fund’s policy to comply with the requirements of the Internal Revenue Code of 1986, as amended (the “Code”), applicable to regulated investment companies (mutual funds) and to distribute each year substantially all of its investment company taxable income and capital gains to its shareholders. Accordingly, the Fund is not required to make any provisions for the payment of federal income tax. Distributions to shareholders are recorded on the ex-dividend date. Income and capital gains distributions, if any, are declared and paid annually.
Net capital losses are carried forward to future fiscal years and may be used to the extent allowed by the Code to offset any future capital gains. Losses that are carried forward will retain their character as either short-term or long-term capital losses. Utilization of capital loss carryforwards will reduce the requirement of future capital gains distributions.
12
GOLDMAN SACHS VARIABLE INSURANCE TRUST GLOBAL TRENDS ALLOCATION FUND
2. SIGNIFICANT ACCOUNTING POLICIES (continued)
The characterization of distributions to shareholders for financial reporting purposes is determined in accordance with federal income tax rules, which may differ from GAAP. The source of the Fund’s distributions may be shown in the accompanying financial statements as either from net investment income, net realized gain or capital. Certain components of the Fund’s net assets on the Statement of Assets and Liabilities reflect permanent GAAP/tax differences based on the appropriate tax character.
E. Foreign Currency Translation — The accounting records and reporting currency of the Fund are maintained in United States (“U.S.”) dollars. Assets and liabilities denominated in foreign currencies are translated into U.S. dollars using the current exchange rates at the close of each business day. The effect of changes in foreign currency exchange rates on investments is included within net realized and unrealized gain (loss) on investments. Changes in the value of other assets and liabilities as a result of fluctuations in foreign exchange rates are included in the Statement of Operations within net change in unrealized gain (loss) on foreign currency translations. Transactions denominated in foreign currencies are translated into U.S. dollars on the date the transaction occurred, the effects of which are included within net realized gain (loss) on foreign currency transactions.
3. INVESTMENTS AND FAIR VALUE MEASUREMENTS
The fair value of a financial instrument is the amount that would be received to sell an asset or paid to transfer a liability in an orderly transaction between market participants at the measurement date (i.e., the exit price). GAAP establishes a fair value hierarchy that prioritizes the inputs to valuation techniques used to measure fair value. The hierarchy gives the highest priority to unadjusted quoted prices in active markets for identical assets or liabilities (Level 1 measurements) and the lowest priority to unobservable inputs (Level 3 measurements). The levels used for classifying investments are not necessarily an indication of the risk associated with investing in these investments. The three levels of the fair value hierarchy are described below:
Level 1 — Unadjusted quoted prices in active markets that are accessible at the measurement date for identical, unrestricted assets or liabilities;
Level 2 — Quoted prices in markets that are not active or financial instruments for which significant inputs are observable (including, but not limited to, quoted prices for similar investments, interest rates, foreign exchange rates, volatility and credit spreads), either directly or indirectly;
Level 3 — Prices or valuations that require significant unobservable inputs (including GSAM’s assumptions in determining fair value measurement).
Changes in valuation techniques may result in transfers into or out of an assigned level within the hierarchy. In accordance with the Fund’s policy, transfers between different levels of the fair value hierarchy resulting from such changes are deemed to have occurred as of the beginning of the reporting period.
The Board of Trustees (“Trustees”) has approved Valuation Procedures that govern the valuation of the portfolio investments held by the Fund, including investments for which market quotations are not readily available. The Trustees have delegated to GSAM day-to-day responsibility for implementing and maintaining internal controls and procedures related to the valuation of the Fund’s portfolio investments. To assess the continuing appropriateness of pricing sources and methodologies, GSAM regularly performs price verification procedures and issues challenges as necessary to third party pricing vendors or brokers, and any differences are reviewed in accordance with the Valuation Procedures.
13
GOLDMAN SACHS VARIABLE INSURANCE TRUST GLOBAL TRENDS ALLOCATION FUND
Notes to Financial Statements (continued)
June 30, 2016 (Unaudited)
3. INVESTMENTS AND FAIR VALUE MEASUREMENTS (continued)
A. Level 1 and Level 2 Fair Value Investments — The valuation techniques and significant inputs used in determining the fair values for investments classified as Level 1 and Level 2 are as follows:
Equity Securities — Equity securities traded on a U.S. securities exchange or the NASDAQ system, or those located on certain foreign exchanges, including but not limited to the Americas, are valued daily at their last sale price or official closing price on the principal exchange or system on which they are traded. If there is no sale or official closing price or such price is believed by GSAM to not represent fair value, equity securities are valued at the last bid price for long positions and at the last ask price for short positions. To the extent these investments are actively traded, they are classified as Level 1 of the fair value hierarchy, otherwise they are generally classified as Level 2.
Unlisted equity securities for which market quotations are available are valued at the last sale price on the valuation date, or if no sale occurs, at the last bid price. Securities traded on certain foreign securities exchanges are valued daily at fair value determined by an independent fair value service (if available) under Valuation Procedures approved by the Trustees and consistent with applicable regulatory guidance. The independent fair value service takes into account multiple factors including, but not limited to, movements in the securities markets, certain depositary receipts, futures contracts and foreign currency exchange rates that have occurred subsequent to the close of the foreign securities exchange. These investments are generally classified as Level 2 of the fair value hierarchy.
Underlying Funds (including Money Market Funds) — Underlying Funds (“Underlying Funds”) include other investment companies and exchange-traded funds (“ETFs”). Investments in the Underlying Funds (except ETFs) are valued at the NAV per share of the Institutional Share class (the FST Institutional Share class for Money Market Funds) on the day of valuation. ETFs are valued daily at the last sale price or official closing price on the principal exchange or system on which the investment is traded. Because the Fund invests in Underlying Funds that fluctuate in value, the Fund’s shares will correspondingly fluctuate in value. To the extent these investments are actively traded, they are classified as Level 1 of the fair value hierarchy, otherwise they are generally classified as Level 2. For information regarding an Underlying Fund’s accounting policies and investment holdings, please see the Underlying Fund’s shareholder report.
Debt Securities — Debt securities for which market quotations are readily available are valued daily on the basis of quotations supplied by dealers or an independent pricing service approved by the Trustees. The pricing services may use valuation models or matrix pricing, which consider: (i) yield or price with respect to bonds that are considered comparable in characteristics such as rating, interest rate and maturity date or (ii) quotations from securities dealers to determine current value. Short-term debt obligations that mature in sixty days or less and that do not exhibit signs of credit deterioration are valued at amortized cost, which approximates fair value. With the exception of treasury securities of G8 countries (not held in money market funds), which are generally classified as Level 1, these investments are generally classified as Level 2 of the fair value hierarchy.
Derivative Contracts — A derivative is an instrument whose value is derived from underlying assets, indices, reference rates or a combination of these factors. The Fund enters into derivative transactions to hedge against changes in interest rates, securities prices, and/or currency exchange rates, to increase total return, or to gain access to certain markets or attain exposure to other underliers.
14
GOLDMAN SACHS VARIABLE INSURANCE TRUST GLOBAL TRENDS ALLOCATION FUND
3. INVESTMENTS AND FAIR VALUE MEASUREMENTS (continued)
Exchange-traded derivatives, including futures and options contracts, are valued at the last sale or settlement price and typically fall within Level 1 of the fair value hierarchy. Over-the-counter (“OTC”) and centrally cleared derivatives are valued using market transactions and other market evidence, including market-based inputs to models, calibration to market-clearing transactions, broker or dealer quotations, or other alternative pricing sources. Where models are used, the selection of a particular model to value OTC and centrally cleared derivatives depends upon the contractual terms of, and specific risks inherent in, the instrument, as well as the availability of pricing information in the market. Valuation models require a variety of inputs, including contractual terms, market prices, yield curves, credit curves, measures of volatility, voluntary and involuntary prepayment rates, loss severity rates and correlations of such inputs. For OTC and centrally cleared derivatives that trade in liquid markets, model inputs can generally be verified and model selection does not involve significant management judgment. OTC and centrally cleared derivatives are classified within Level 2 of the fair value hierarchy when significant inputs are corroborated by market evidence.
i. Futures Contracts — Futures contracts are contracts to buy or sell a standardized quantity of a specified commodity or security and are valued based on exchanged settlement prices or independent market quotes. Futures contracts are valued at the last settlement price, or in the absence of a sale, the last bid price for long positions and at the last ask price for short positions, at the end of each day on the board of trade or exchange upon which they are traded. Upon entering into a futures contract, the Fund deposits cash or securities in an account on behalf of the broker in an amount sufficient to meet the initial margin requirement. Subsequent payments are made or received by the Fund equal to the daily change in the contract value and are recorded as variation margin receivable or payable with a corresponding offset to unrealized gains or losses.
B. Level 3 Fair Value Investments — To the extent that significant inputs to valuation models and other alternative pricing sources are unobservable, or if quotations are not readily available, or if GSAM believes that such quotations do not accurately reflect fair value, the fair value of the Fund’s investments may be determined under Valuation Procedures approved by the Trustees. GSAM, consistent with its procedures and applicable regulatory guidance, may make an adjustment to the most recent valuation prices of either domestic or foreign securities in light of significant events to reflect what it believes to be the fair value of the securities at the time of determining a Fund’s NAV. Significant events which could affect a large number of securities in a particular market may include, but are not limited to: significant fluctuations in U.S. or foreign markets; market dislocations; market disruptions; or unscheduled market closings. Significant events which could also affect a single issuer may include, but are not limited to: corporate actions such as reorganizations, mergers and buy-outs; ratings downgrades; and bankruptcies.
15
GOLDMAN SACHS VARIABLE INSURANCE TRUST GLOBAL TRENDS ALLOCATION FUND
Notes to Financial Statements (continued)
June 30, 2016 (Unaudited)
3. INVESTMENTS AND FAIR VALUE MEASUREMENTS (continued)
C. Fair Value Hierarchy — The following is a summary of the Fund’s investments and derivatives classified in the fair value hierarchy as of June 30, 2016:
| Investment Type | Level 1 | Level 2 | Level 3 | |||||||||
| Assets | ||||||||||||
| Fixed Income | ||||||||||||
Agency Debenture | $ | — | $ | 17,873,156 | $ | — | ||||||
U.S. Treasury Obligations and/or Other U.S. Government Agencies | 113,553,438 | — | — | |||||||||
| Exchange Traded Funds | 93,727,459 | — | — | |||||||||
| Investment Company | 110,962,728 | — | — | |||||||||
| Total | $ | 318,243,625 | $ | 17,873,156 | $ | — | ||||||
| Derivative Type | ||||||||||||
| Assets(a) | ||||||||||||
| Futures Contracts | $ | 1,840,232 | $ | — | $ | — | ||||||
| Liabilities(a) | ||||||||||||
| Futures Contracts | $ | (566,412 | ) | $ | — | $ | — | |||||
| (a) | Amount shown represents unrealized gain (loss) at period end. |
For further information regarding security characteristics, see the Schedule of Investments.
4. INVESTMENTS IN DERIVATIVES
The following table sets forth, by certain risk types, the gross value of derivative contracts as of June 30, 2016. These instruments were used as part of the Fund’s investment strategies and to obtain and/or manage exposure related to the risks below. The values in the table below exclude the effects of cash collateral received or posted pursuant to these derivative contracts, and therefore are not representative of the Fund’s net exposure.
| Risk | Statement of Assets and Liabilities | Assets(a) | Statement of Assets and Liabilities | Liabilities(a) | ||||||||||
| Equity | Variation margin on certain derivative contracts | $ | 966,487 | Variation margin on certain derivative contracts | $ | (566,412 | ) | |||||||
| Interest Rate | Variation margin on certain derivative contracts | 873,745 | — | — | ||||||||||
| Total | $ | 1,840,232 | $ | (566,412 | ) | |||||||||
| (a) | Includes unrealized gain (loss) on futures contracts described in the Additional Investment Information section of the Schedule of Investments. Only current day’s variation margin is reported within the Statement of Assets and Liabilities. |
16
GOLDMAN SACHS VARIABLE INSURANCE TRUST GLOBAL TRENDS ALLOCATION FUND
4. INVESTMENTS IN DERIVATIVES (continued)
The following table sets forth, by certain risk types, the Fund’s gains (losses) related to these derivatives and their indicative volumes for the six months ended June 30, 2016. These gains (losses) should be considered in the context that these derivative contracts may have been executed to create investment opportunities and/or economically hedge certain investments, and accordingly, certain gains (losses) on such derivative contracts may offset certain (losses) gains attributable to investments. These gains (losses) are included in “Net realized gain (loss)” or “Net change in unrealized gain (loss)” on the Statement of Operations:
| Risk | Statement of Operations | Net Realized Gain (Loss) | Net Change in Unrealized Gain (Loss) | Average Number of Contracts(a) | ||||||||||
| Equity | Net realized gain (loss) from futures contracts/Net change in unrealized gain (loss) on futures contracts | $ | (4,922,793 | ) | $ | (134,088 | ) | 581 | ||||||
| Interest Rate | Net realized gain (loss) from futures contracts/Net change in unrealized gain (loss) on futures contracts | 1,865,524 | 1,155,571 | 249 | ||||||||||
| Total | $ | (3,057,269 | ) | $ | 1,021,483 | 830 | ||||||||
| (a) | Average number of contracts is based on the average of month end balances for the six months ended June 30, 2016. |
5. AGREEMENTS AND AFFILIATED TRANSACTIONS
A. Management Agreement — Under the Agreement, GSAM manages the Fund, subject to the general supervision of the Trustees.
As compensation for the services rendered pursuant to the Agreement, the assumption of the expenses related thereto and administration of the Fund’s business affairs, including providing facilities, GSAM is entitled to a management fee, accrued daily and paid monthly, equal to an annual percentage rate of the Fund’s average daily net assets.
For the six months ended June 30, 2016, contractual and effective net management fees with GSAM were at the following rates:
| Contractual Management Rate | ||||||||||||||||||||||||||
| First $1 billion | Next $1 billion | Next $3 billion | Next $3 billion | Over $8 billion | Effective Rate | Effective Net Management Rate^ | ||||||||||||||||||||
| 0.79% | 0.71 | % | 0.68 | % | 0.66 | % | 0.65 | % | 0.79 | % | 0.73 | % | ||||||||||||||
| ^ | Effective Net Management Rate includes the impact of management fee waivers of affiliated underlying funds, if any. |
The Fund invests in FST Institutional Shares of the Goldman Sachs Financial Square Government Fund, which is an affiliated Underlying Fund. GSAM has agreed to waive a portion of its management fee payable by the Fund in an amount equal to the management fee it earns as an investment adviser to any of the affiliated Underlying Funds in which the Fund invests. For the six months ended June 30, 2016, GSAM waived $108,960 of the Fund’s management fee.
17
GOLDMAN SACHS VARIABLE INSURANCE TRUST GLOBAL TRENDS ALLOCATION FUND
Notes to Financial Statements (continued)
June 30, 2016 (Unaudited)
5. AGREEMENTS AND AFFILIATED TRANSACTIONS (continued)
B. Distribution and Service Plan — The Trust, on behalf of the Service Shares of the Fund, has adopted a Distribution and Service Plan (the “Plan”). Under the Plan, Goldman Sachs, which serves as distributor (the “Distributor”), is entitled to a fee accrued daily and paid monthly, for distribution services and personal and account maintenance services, which may then be paid by Goldman Sachs to authorized dealers, equal to, on an annual basis, 0.25% of the Fund’s average daily net assets attributable to Service Shares.
C. Transfer Agency Agreement — Goldman Sachs also serves as the transfer agent of the Fund for a fee pursuant to the Transfer Agency Agreement. The fees charged for such transfer agency services are accrued daily and paid monthly at an annual rate of 0.02% of the average daily net assets of Institutional and Service Shares.
D. Other Expense Agreements and Affiliated Transactions — GSAM has agreed to limit certain “Other Expenses” of the Fund (excluding acquired fund fees and expenses, transfer agency fees and expenses, taxes, interest, brokerage fees, shareholder meeting, litigation, indemnification, and extraordinary expenses) to the extent such expenses exceed, on an annual basis, a percentage rate of the average daily net assets of the Fund. Such Other Expense reimbursements, if any, are accrued daily and paid monthly. In addition, the Fund is not obligated to reimburse GSAM for prior fiscal year expense reimbursements, if any. The Other Expense limitation as an annual percentage rate of average daily net assets for the Fund is 0.004%. The Other Expense limitation will remain in place through at least April 29, 2017, and prior to such date GSAM may not terminate the arrangement without the approval of the Trustees. For the six months ended June 30, 2016, GSAM reimbursed $144,622 to the Fund. In addition, the Fund has entered into certain offset arrangements with the custodian and the transfer agent, which may result in a reduction of the Fund’s expenses and are received irrespective of the application of the “Other Expense” limitations described above. For the six months ended June 30, 2016, custody fee credits were $8,799.
E. Line of Credit Facility — As of June 30, 2016, the Fund participated in a $1,100,000,000 committed, unsecured revolving line of credit facility (the “facility”) together with other funds of the Trust and registered investment companies having management agreements with GSAM or its affiliates (“Other Borrowers”). This facility is to be used for temporary or emergency purposes, or to allow for an orderly liquidation of securities to meet redemption requests. The interest rate on borrowings is based on the federal funds rate. The facility also requires a fee to be paid by the Fund based on the amount of the commitment that has not been utilized. For the six months ended June 30, 2016, the Fund did not have any borrowings under the facility.
F. Other Transactions with Affiliates — The following table provides information about the Fund’s investment in the Goldman Sachs Financial Square Government Fund as of and for the six months ended June 30, 2016:
| Market Value 12/31/2015 | Purchases at Cost | Proceeds from Sales | Market Value 6/30/2016 | Dividend Income | ||||||||||||||
| $ | 160,199,048 | $ | 124,650,855 | $ | (173,887,175 | ) | $ | 110,962,728 | $ | 175,045 | ||||||||
As of June 30, 2015, the Goldman Sachs Group, Inc. was the beneficial owner of approximately 100% of Institutional Shares of the Fund.
18
GOLDMAN SACHS VARIABLE INSURANCE TRUST GLOBAL TRENDS ALLOCATION FUND
6. PORTFOLIO SECURITIES TRANSACTIONS
The cost of purchases and proceeds from sales and maturities of long-term securities for the six months ended June 30, 2016, were as follows:
Purchases of U.S. Government and Agency Obligations | Purchases (Excluding U.S. Government and Agency Obligations) | Sales and Maturities of Agency Obligations | Sales and Maturities (Excluding U.S. Government and Agency Obligations) | |||||||||||
| $ | 169,949,677 | $ | 126,710,847 | $ | 109,087,142 | $ | 113,015,345 | |||||||
7. SECURITIES LENDING
Pursuant to exemptive relief granted by the Securities and Exchange Commission (“SEC”) and the terms and conditions contained therein, the Fund may lend its securities through a securities lending agent, Goldman Sachs Agency Lending (“GSAL”), a wholly-owned subsidiary of Goldman Sachs, to certain qualified borrowers including Goldman Sachs and affiliates. In accordance with the Fund’s securities lending procedures, the Fund receives cash collateral at least equal to the market value of the securities on loan. The market value of the loaned securities is determined at the close of business of the Fund, at their last sale price or official closing price on the principal exchange or system on which they are traded, and any additional required collateral is delivered to the Fund on the next business day. As with other extensions of credit, the Fund may experience delay in the recovery of its securities or incur a loss should the borrower of the securities breach its agreement with the Fund or become insolvent at a time when the collateral is insufficient to cover the cost of repurchasing securities on loan. Dividend income received from securities on loan may not be subject to withholding taxes and therefore withholding taxes paid may differ from the amounts listed in the Statement of Operations. Loans of securities are terminable at any time and as such 1) the remaining contractual maturities of the outstanding securities lending transactions are considered to be overnight and continuous and 2) the borrower, after notice, is required to return borrowed securities within the standard time period for settlement of securities transactions.
The Fund invests the cash collateral received in connection with securities lending transactions in the Goldman Sachs Financial Square Money Market Fund (“Money Market Fund”), an affiliated series of the Trust. The Money Market Fund is registered under the Act as an open end investment company, is subject to Rule 2a-7 under the Act, and is managed by GSAM, for which GSAM may receive an investment advisory fee of up to 0.205% on an annualized basis of the average daily net assets of the Money Market Fund.
In the event of a default by a borrower with respect to any loan, GSAL will exercise any and all remedies provided under the applicable borrower agreement to make the Fund whole. These remedies include purchasing replacement securities by applying the collateral held from the defaulting broker against the purchase cost of the replacement securities. If, despite such efforts by GSAL to exercise these remedies, the Fund sustains losses as a result of a borrower’s default, GSAL indemnifies the Fund by purchasing replacement securities at GSAL’s expense, or paying the Fund an amount equal to the market value of the replacement securities, subject to an exclusion for any shortfalls resulting from a loss of value in the cash collateral pool due to reinvestment risk and a requirement that the Fund agrees to assign rights to the collateral to GSAL for purpose of using the collateral to cover purchase of replacement securities as more fully described in the Securities Lending Agency Agreement. The Fund’s loaned securities were all subject to enforceable Securities Lending Agreements and the value of the collateral is at least equal to the value of the cash received. The value of loaned securities and cash collateral at period end are disclosed in the Fund’s Statement of Assets and Liabilities.
19
GOLDMAN SACHS VARIABLE INSURANCE TRUST GLOBAL TRENDS ALLOCATION FUND
Notes to Financial Statements (continued)
June 30, 2016 (Unaudited)
7. SECURITIES LENDING (continued)
Both the Fund and GSAL received compensation relating to the lending of the Fund’s securities. The amounts earned by the Fund for the six months ended June 30, 2016, are reported under Investment Income on the Statement of Operations. For the six months ended June 30, 2016, GSAL earned $228 in fees as securities lending agent.
The following table provides information about the Fund’s investment in the Money Market Fund for the six months ended June 30, 2016:
| Market Value 12/31/15 | Purchases at Cost | Proceeds from Sales | Market Value 6/30/16 | |||||||||||
| $ | — | $ | 10,425,000 | $ | (10,425,000 | ) | $ | — | ||||||
8. TAX INFORMATION
As of the Fund’s most recent fiscal year end, December 31, 2015, the Fund’s capital loss carryforwards and certain timing differences, on a tax-basis were as follows:
| Capital loss carryforwards: | ||||
| Perpetual short-term | $ | (13,375,529 | ) | |
| Timing differences (Qualified Late Year Loss Deferral/Post October Loss Deferral) | (218,043 | ) |
As of June 30, 2016, the Fund’s aggregate security unrealized gains and losses based on cost for U.S. federal income tax purposes were as follows:
| Tax cost | $ | 332,581,708 | ||
| Gross unrealized gain | 5,896,273 | |||
| Gross unrealized loss | (2,361,200 | ) | ||
| Net unrealized gain | $ | 3,535,073 |
The difference between GAAP-basis and tax-basis unrealized gains (losses) is attributable primarily to wash sales and net mark to market gains (losses) on regulated futures contracts.
GSAM has reviewed the Fund’s tax positions for all open tax years (the current and prior three years, as applicable) and has concluded that no provision for income tax is required in the Fund’s financial statements. Such open tax years remain subject to examination and adjustment by tax authorities.
20
GOLDMAN SACHS VARIABLE INSURANCE TRUST GLOBAL TRENDS ALLOCATION FUND
9. OTHER RISKS
The Fund’s risks include, but are not limited to, the following:
Derivatives Risk — Loss may result from the Fund’s investments in derivative instruments. These instruments may be illiquid, difficult to price and leveraged so that small changes in the value of the underlying instruments may produce disproportionate losses to the Fund. Derivatives are also subject to counterparty risk, which is the risk that the other party in the transaction will not fulfill its contractual obligation. Losses from investments in derivatives can also result from a lack of correlation between changes in the value of derivative instruments and the portfolio assets (if any) being hedged.
Foreign and Emerging Countries Risk — Investing in foreign markets may involve special risks and considerations not typically associated with investing in the U.S. Foreign securities may be subject to risk of loss because of more or less foreign government regulation, less public information and less economic, political and social stability in the countries in which the Fund invests. Loss may also result from the imposition of exchange controls, confiscations and other government restrictions by the U.S. or other governments, or from problems in registration, settlement or custody. Foreign risk also involves the risk of negative foreign currency rate fluctuations, which may cause the value of securities denominated in such foreign currency (or other instruments through which the Fund has exposure to foreign currencies) to decline in value. Currency exchange rates may fluctuate significantly over short periods of time. To the extent that the Fund also invests in securities of issuers located in emerging markets, these risks may be more pronounced.
Foreign Custody Risk — A Fund that invests in foreign securities may hold such securities and cash with foreign banks, agents, and securities depositories appointed by the Fund’s custodian (each a “Foreign Custodian”). Some foreign custodians may be recently organized or new to the foreign custody business. In some countries, Foreign Custodians may be subject to little or no regulatory oversight over, or independent evaluation of, their operations. Further, the laws of certain countries may place limitations on a Fund’s ability to recover its assets if a Foreign Custodian enters bankruptcy. Investments in emerging markets may be subject to even greater custody risks than investments in more developed markets. Custody services in emerging market countries are very often undeveloped and may be considerably less well regulated than in more developed countries, and thus may not afford the same level of investor protection as would apply in developed countries.
Industry Concentration Risk — The Fund will not invest more than 25% of the value of its total assets in the securities of one or more issuers conducting their principal business activities in the same industry, except that, to the extent that an industry represents 20% or more of the Fund’s index at the time of investment, the Fund may invest up to 35% of its assets in that industry. Concentrating Fund investments in issuers conducting business in the same industry will subject the Fund to a greater risk of loss as a result of adverse economic, business or other developments affecting that industry than if its investments were not so concentrated.
Interest Rate Risk — When interest rates increase, fixed income securities or instruments held by the Fund will generally decline in value. Long-term fixed income securities or instruments will normally have more price volatility because of this risk than short-term fixed income securities or instruments. The risks associated with increasing rates are heightened given that interest rates are near historic lows, but may be expected to increase in the future with unpredictable effects on the markets and the Fund‘s investments.
21
GOLDMAN SACHS VARIABLE INSURANCE TRUST GLOBAL TRENDS ALLOCATION FUND
Notes to Financial Statements (continued)
June 30, 2016 (Unaudited)
9. OTHER RISKS (continued)
Investments in Other Investment Companies — As a shareholder of another investment company, including an exchange traded fund (“ETF”), a Fund will indirectly bear its proportionate share of any net management fees and other expenses paid by such other investment companies, in addition to the fees and expenses regularly borne by the Fund. ETFs are subject to risks that do not apply to conventional mutual funds, including but not limited to the following: (i) the market price of the ETF’s shares may trade at a premium or a discount to their NAV; and (ii) an active trading market for an ETF’s shares may not develop or be maintained.
Large Shareholder Transactions Risk — The Fund may experience adverse effects when certain large shareholders, such as other funds, participating insurance companies, accounts and Goldman Sachs affiliates, purchase or redeem large amounts of shares of the Fund. Such large shareholder redemptions may cause the Fund to sell portfolio securities at times when it would not otherwise do so, which may negatively impact the Fund’s NAV and liquidity. These transactions may also accelerate the realization of taxable income to shareholders if such sales of investments resulted in gains, and may also increase transaction costs. In addition, a large redemption could result in the Fund’s current expenses being allocated over a smaller asset base, leading to an increase in the Fund’s expense ratio. Similarly, large Fund share purchases may adversely affect the Fund’s performance to the extent that the Fund is delayed in investing new cash and is required to maintain a larger cash position than it ordinarily would.
Liquidity Risk — The Fund may make investments that are illiquid or that may become less liquid in response to market developments or adverse investor perceptions. Illiquid investments may be more difficult to value. Liquidity risk may also refer to the risk that the Fund will not be able to pay redemption proceeds within the allowable time period because of unusual market conditions, an unusually high volume of redemption requests, or other reasons. To meet redemption requests, the Fund may be forced to sell investments at an unfavorable time and/or under unfavorable conditions. Liquidity risk may be the result of, among other things, the reduced number and capacity of traditional market participants to make a market in fixed income securities or the lack of an active market. The potential for liquidity risk may be magnified by a rising interest rate environment or other circumstances where investor redemptions from fixed income mutual funds may be higher than normal, potentially causing increased supply in the market due to selling activity.
Market and Credit Risks — In the normal course of business, the Fund trades financial instruments and enters into financial transactions where risk of potential loss exists due to changes in the market (market risk). Additionally, the Fund may also be exposed to credit risk in the event that an issuer or guarantor fails to perform or that an institution or entity with which the Fund has unsettled or open transactions defaults.
Non-Diversification Risk — The Fund is non-diversified, meaning that it is permitted to invest a larger percentage of its assets in fewer issuers than diversified mutual funds. Thus, the Fund may be more susceptible to adverse developments affecting any single issuer held in its portfolio, and may be more susceptible to greater losses because of these developments.
22
GOLDMAN SACHS VARIABLE INSURANCE TRUST GLOBAL TRENDS ALLOCATION FUND
10. INDEMNIFICATIONS
Under the Trust’s organizational documents, its Trustees, officers, employees and agents are indemnified, to the extent permitted by the Act and state law, against certain liabilities that may arise out of performance of their duties to the Fund. Additionally, in the course of business, the Fund enters into contracts that contain a variety of indemnification clauses. The Fund’s maximum exposure under these arrangements is unknown, as this would involve future claims that may be made against the Fund that have not yet occurred. However, GSAM believes the risk of loss under these arrangements to be remote.
11. SUBSEQUENT EVENTS
Subsequent events after the Statement of Assets and Liabilities date have been evaluated through the date the financial statements were issued. GSAM has concluded that there is no impact requiring adjustment or disclosure in the financial statements.
12. SUMMARY OF SHARE TRANSACTIONS
Share activity is as follows:
| For the Six Months Ended June 30, 2016 (Unaudited) | For the Fiscal Year Ended December 31, 2015 | |||||||||||||||
| Shares | Dollars | Shares | Dollars | |||||||||||||
| Institutional Shares | ||||||||||||||||
| Shares sold | — | $ | — | 65,120 | $ | 767,595 | ||||||||||
| Reinvestment of distributions | — | — | 2,244 | 24,443 | ||||||||||||
| Shares redeemed | (90,223 | ) | (961,682 | ) | (37,336 | ) | (453,426 | ) | ||||||||
| (90,223 | ) | (961,682 | ) | 30,028 | 338,612 | |||||||||||
| Service Shares | ||||||||||||||||
| Shares sold | 3,078,154 | 33,123,773 | 12,070,417 | 140,392,566 | ||||||||||||
| Reinvestment of distributions | — | — | 732,551 | 7,977,479 | ||||||||||||
| Shares redeemed | (1,626,164 | ) | (17,478,192 | ) | (2,872,736 | ) | (33,389,370 | ) | ||||||||
| 1,451,990 | 15,645,581 | 9,930,232 | 114,980,675 | |||||||||||||
| NET INCREASE | 1,361,767 | $ | 14,683,899 | 9,960,260 | $ | 115,319,287 | ||||||||||
23
GOLDMAN SACHS VARIABLE INSURANCE TRUST GLOBAL TRENDS ALLOCATION FUND
| Fund Expenses — Six Month Period Ended June 30, 2016 (Unaudited) |
As a shareholder of the Institutional or Service Shares of the Fund, you incur ongoing costs, including management fees, distribution and service (12b-1) fees (with respect to Service Shares) and other Fund expenses. This example is intended to help you understand your ongoing costs (in dollars) of investing in the Institutional Shares and Service Shares of the Fund and to compare these costs with the ongoing costs of investing in other mutual funds.
The example is based on an investment of $1,000 invested at the beginning of the period and held for the entire period from January 1, 2016 through June 30, 2016, which represents a period of 182 days of a 366 day year.
Actual Expenses — The first line under each share class in the table below provides information about actual account values and actual expenses. You may use the information in this line, together with the amount you invested, to estimate the expenses that you paid over the period. Simply divide your account value by $1,000 (for example, an $8,600 account value divided by $1,000=8.6), then multiply the result by the number in the first line under the heading entitled “Expenses Paid” to estimate the expenses you paid on your account during this period.
Hypothetical Example for Comparison Purposes — The second line under each share class in the table below provides information about hypothetical account values and hypothetical expenses based on the Fund's actual net expense ratio and an assumed rate of return of 5% per year before expenses, which is not the Fund's actual return. The hypothetical account values and expenses may not be used to estimate the actual ending account balance or expenses you paid for the period. You may use this information to compare the ongoing costs of investing in the Fund and other funds. To do so, compare this 5% hypothetical example with the 5% hypothetical examples that appear in the shareholder reports of the other funds.
Please note that the expenses shown in the table are meant to highlight your ongoing costs only. As a shareholder of the Fund, you do not incur any transaction costs, such as sales charges, redemption fees, or exchange fees, but shareholders of other funds may incur such costs. The second line of the table is useful in comparing ongoing costs only, and will not help you determine the relative total costs of owning different funds whose shareholders may incur transaction costs.
| Share Class | Beginning Account Value 01/01/16 | Ending Account Value | Expenses Paid for the 6 Months Ended 06/30/16* | |||||||||
| Institutional | ||||||||||||
| Actual | $ | 1,000 | $ | 1,002.80 | $ | 3.68 | ||||||
| Hypothetical 5% return | 1,000 | 1,021.18 | + | 3.72 | ||||||||
| Service | ||||||||||||
| Actual | 1,000 | 1,002.80 | 4.98 | |||||||||
| Hypothetical 5% return | 1,000 | 1,019.89 | + | 5.02 | ||||||||
| * | Expenses are calculated using the Fund’s annualized net expense ratio for each class, which represents the ongoing expenses as a percentage of net assets for the six months ended June 30, 2016. Expenses are calculated by multiplying the annualized net expense ratio by the average account value for the period; then multiplying the result by the number of days in the most recent fiscal half year; and then dividing that result by the number of days in the fiscal year. The annualized net expense ratios for the period were 0.74% and 1.00% for Institutional and Service Shares, respectively. |
| + | Hypothetical expenses are based on the Fund's actual annualized net expense ratio and an assumed rate of return of 5% per year before expenses. |
24
GOLDMAN SACHS VARIABLE INSURANCE TRUST GLOBAL TRENDS ALLOCATION FUND
Statement Regarding Basis for Approval of Management Agreement (Unaudited)
Background
The Goldman Sachs Global Trends Allocation Fund (the “Fund”) is an investment portfolio of Goldman Sachs Variable Insurance Trust (the “Trust”). The Board of Trustees oversees the management of the Trust and reviews the investment performance and expenses of the Fund at regularly scheduled meetings held throughout the year. In addition, the Board of Trustees determines annually whether to approve the continuance of the Trust’s investment management agreement (the “Management Agreement”) with Goldman Sachs Asset Management, L.P. (the “Investment Adviser”) on behalf of the Fund.
The Management Agreement was most recently approved for continuation until June 30, 2017 by the Board of Trustees, including those Trustees who are not parties to the Management Agreement or “interested persons” (as defined in the Investment Company Act of 1940, as amended) of any party thereto (the “Independent Trustees”), at a meeting held on June 15-16, 2016 (the “Annual Meeting”).
The review process undertaken by the Trustees spans the course of the year and culminates with the Annual Meeting. To assist the Trustees in their deliberations, the Trustees have established a Contract Review Committee (the “Committee”), comprised of the Independent Trustees. The Committee held three meetings over the course of the year since the Management Agreement was last approved. At those Committee meetings, regularly scheduled Board or other committee meetings, and/or the Annual Meeting, matters relevant to the renewal of the Management Agreement were considered by the Board, or the Independent Trustees, as applicable. With respect to the Fund, such matters included:
| (a) | the nature and quality of the advisory, administrative, and other services provided to the Fund by the Investment Adviser and its affiliates, including information about: |
| (i) | the structure, staff, and capabilities of the Investment Adviser and its portfolio management teams; |
| (ii) | the groups within the Investment Adviser and its affiliates that support the portfolio management teams or provide other types of necessary services, including fund services groups (e.g., accounting and financial reporting, tax, shareholder services, and operations); controls and risk management groups (e.g., legal, compliance, valuation oversight, credit risk management, internal audit, compliance testing, market risk analysis, finance, and central funding); sales and distribution support groups, and others (e.g., information technology and training); |
| (iii) | trends in employee headcount; |
| (iv) | the Investment Adviser’s financial resources and ability to hire and retain talented personnel and strengthen its operations; and |
| (v) | the parent company’s support of the Investment Adviser and its mutual fund business, as expressed by the firm’s senior management; |
| (b) | information on the investment performance of the Fund, including comparisons to the performance of similar mutual funds, as provided by a third-party mutual fund data provider engaged as part of the contract review process (the “Outside Data Provider”), and a benchmark performance index, and general investment outlooks in the markets in which the Fund invests; |
| (c) | information provided by the Investment Adviser indicating the Investment Adviser’s views on whether the Fund’s peer group and/or benchmark index had high, medium, or low relevance given the Fund’s particular investment strategy; |
| (d) | the terms of the Management Agreement and other agreements with affiliated service providers entered into by the Trust on behalf of the Fund; |
| (e) | fee and expense information for the Fund, including: |
| (i) | the relative management fee and expense level of the Fund as compared to those of comparable funds managed by other advisers, as provided by the Outside Data Provider; and |
| (ii) | the Fund’s expense trends over time; |
| (f) | with respect to the extensive investment performance and expense comparison data provided by the Outside Data Provider, its processes in producing that data for the Fund; |
| (g) | the undertaking of the Investment Adviser to waive certain fees and to limit certain expenses of the Fund that exceed a specified level; |
| (h) | information relating to the profitability of the Management Agreement and the transfer agency and distribution and service arrangements of the Fund and the Trust as a whole to the Investment Adviser and its affiliates; |
| (i) | whether the Fund’s existing management fee schedule adequately addressed any economies of scale; |
| (j) | a summary of the “fall-out” benefits derived by the Investment Adviser and its affiliates from their relationships with the Fund, including the fees received by the Investment Adviser’s affiliates from the Fund for transfer agency, securities lending, portfolio trading, distribution and other services; |
| (k) | a summary of potential benefits derived by the Fund as a result of its relationship with the Investment Adviser; |
25
GOLDMAN SACHS VARIABLE INSURANCE TRUST GLOBAL TRENDS ALLOCATION FUND
Statement Regarding Basis for Approval of Management Agreement (Unaudited) (continued)
| (l) | information regarding commissions paid by the Fund and broker oversight, other information regarding portfolio trading, and how the Investment Adviser carries out its duty to seek best execution; |
| (m) | the manner in which portfolio manager compensation is determined; and the number and types of accounts managed by the portfolio managers; |
| (n) | the nature and quality of the services provided to the Fund by its unaffiliated service providers, and the Investment Adviser’s general oversight and evaluation (including reports on due diligence) of those service providers as part of the administration services provided under the Management Agreement; and |
| (o) | the Investment Adviser’s processes and policies addressing various types of potential conflicts of interest; its approach to risk management; the annual review of the effectiveness of the Fund’s compliance program; and periodic compliance reports. |
The Trustees also received an overview of the Fund’s distribution arrangements. They received information regarding the Fund’s assets, share purchase and redemption activity, and payment of distribution and service fees. Information was also provided to the Trustees relating to revenue sharing payments made by and services provided by the Investment Adviser and its affiliates to intermediaries that promote the sale, distribution, and/or servicing of Fund shares. The Independent Trustees also discussed the broad range of other investment choices that are available to Fund investors, including the availability of comparable funds managed by other advisers.
The presentations made at the Board and Committee meetings and at the Annual Meeting encompassed the Fund and other mutual funds for which the Board of Trustees has responsibility. In evaluating the Management Agreement at the Annual Meeting, the Trustees relied upon their knowledge, resulting from their meetings and other interactions throughout the year, of the Investment Adviser and its affiliates, their services, and the Fund. In conjunction with these meetings, the Trustees received written materials and oral presentations on the topics covered, and the Investment Adviser addressed the questions and concerns of the Trustees, including concerns regarding the investment performance of certain of the funds they oversee. The Independent Trustees were advised by their independent legal counsel regarding their responsibilities and other regulatory requirements related to the approval and continuation of mutual fund investment management agreements under applicable law. In addition, the Investment Adviser and its affiliates provided the Independent Trustees with a written response to a formal request for information sent on behalf of the Independent Trustees by their independent legal counsel. During the course of their deliberations, the Independent Trustees met in executive sessions with their independent legal counsel, without representatives of the Investment Adviser or its affiliates present.
Nature, Extent, and Quality of the Services Provided Under the Management Agreement
As part of their review, the Trustees considered the nature, extent, and quality of the services provided to the Fund by the Investment Adviser. In this regard, the Trustees considered both the investment advisory services and non-advisory services that are provided by the Investment Adviser and its affiliates. The Trustees noted the transition in the leadership and changes in personnel of various of the Investment Adviser’s portfolio management teams that had occurred in recent periods, and the ongoing recruitment efforts aimed at bringing high quality investment talent to the Investment Adviser. They also noted the Investment Adviser’s commitment to maintaining high quality systems and expending substantial resources to respond to ongoing changes to the regulatory and control environment in which the Fund and their service providers operate, as well as the efforts of the Investment Adviser and its affiliates to combat cyber security risks. The Trustees concluded that the Investment Adviser continued to commit substantial financial and operational resources to the Fund and expressed confidence that the Investment Adviser would continue to do so in the future. The Trustees also recognized that the Investment Adviser had made significant commitments to address regulatory compliance requirements applicable to the Fund and the Investment Adviser and its affiliates.
Investment Performance
The Trustees also considered the investment performance of the Fund. In this regard, they compared the investment performance of the Fund to its peers using rankings and ratings compiled by the Outside Data Provider as of December 31, 2015, and updated performance information prepared by the Investment Adviser using the peer group identified by the Outside Data Provider as of March 31, 2016. The information on the Fund’s investment performance was provided for the one-year period ending on the applicable dates. The Trustees also reviewed the Fund’s investment performance relative to its performance benchmark. As part of this review, they considered the investment performance trends of the Fund over time, and reviewed the investment performance of the Fund in light of its investment objective and policies and market conditions.
In addition, the Trustees considered materials prepared and presentations made by the Investment Adviser’s senior management and portfolio management personnel in which Fund performance was assessed. The Trustees also considered the
26
GOLDMAN SACHS VARIABLE INSURANCE TRUST GLOBAL TRENDS ALLOCATION FUND
Statement Regarding Basis for Approval of Management Agreement (Unaudited) (continued)
Investment Adviser’s periodic reports with respect to the Fund’s risk profile, and how the Investment Adviser’s approach to risk monitoring and management influences portfolio management. They noted the efforts of the Fund’s portfolio management team to continue to enhance the investment model used in managing the Fund.
The Trustees noted that the Fund’s Institutional Shares had placed in the fourth quartile of the Fund’s peer group and had underperformed the Fund’s benchmark index and its Competitor Fund Average for the one-year period ended March 31, 2016. They also noted that in April 2015 the Fund had been repositioned from the Goldman Sachs Global Markets Navigator Fund, which involved changes to the Fund’s investment objective, investment strategy, and benchmark.
Costs of Services Provided and Competitive Information
The Trustees considered the contractual terms of the Management Agreement and the fee rates payable by the Fund thereunder. In this regard, the Trustees considered information on the services rendered by the Investment Adviser to the Fund, which included both advisory and administrative services that were directed to the needs and operations of the Fund as a registered mutual fund.
In particular, the Trustees reviewed analyses prepared by the Outside Data Provider regarding the expense rankings of the Fund. The analyses provided a comparison of the Fund’s management fee and breakpoints to those of a relevant peer group and category universe; an expense analysis which compared the Fund’s overall net and gross expenses to a peer group and a category universe; and a three-year history comparing the Fund’s net expenses to the peer and category medians. The analyses also compared the Fund’s transfer agency, custody, and distribution fees, other expenses and fee waivers/reimbursements to those of the peer group and category medians. The Trustees concluded that the comparisons provided by the Outside Data Provider were useful in evaluating the reasonableness of the management fees and total expenses paid by the Fund.
In addition, the Trustees considered the Investment Adviser’s undertaking to waive a portion of its management fee and to limit certain expenses of the Fund that exceed specified levels. The Trustees also noted that certain changes were being made to existing fee waiver or expense limitation arrangements of the Fund that would have the effect of decreasing total Fund expenses, with such changes taking effect in connection with the Fund’s next annual registration statement update. They also considered, to the extent that the Investment Adviser manages other types of accounts having investment objectives and policies similar to those of the Fund, comparative fee information for services provided by the Investment Adviser to those accounts, and information that indicated that services provided to the Fund differed in various significant respects from the services provided to other types of accounts which, in many cases, operated under less stringent legal and regulatory structures, required fewer services from the Investment Adviser to a smaller number of client contact points, and were less time-intensive.
In addition, the Trustees noted that shareholders are able to redeem their Fund shares at any time if shareholders believe that the Fund fees and expenses are too high or if they are dissatisfied with the performance of the Fund.
Profitability
The Trustees reviewed the Investment Adviser’s revenues and pre-tax profit margins with respect to the Trust and the Fund. In this regard the Trustees noted that they had received, among other things, profitability analyses and summaries, revenue and expense schedules by Fund and by function (i.e., investment management, transfer agency and distribution and service), and information on the Investment Adviser’s expense allocation methodology. They observed that the profitability and expense figures are substantially similar to those used by the Investment Adviser for many internal purposes, including compensation decisions among various business groups, and are thus subject to a vigorous internal debate about how certain revenue and expenses should be allocated. The Trustees also noted that the internal audit group within the Goldman Sachs organization had audited the expense allocation methodology and was satisfied with the reasonableness, consistency, and accuracy of the Investment Adviser’s expense allocation methodology and profitability analysis calculations. Profitability data for the Trust and the Fund were provided for 2015 and 2014, and the Trustees considered this information in relation to the Investment Adviser’s overall profitability. The Trustees considered the Investment Adviser’s revenues and pre-tax profit margins both in absolute terms and in comparison to information on the reported pre-tax profit margins earned by certain other asset management firms.
27
GOLDMAN SACHS VARIABLE INSURANCE TRUST GLOBAL TRENDS ALLOCATION FUND
Statement Regarding Basis for Approval of Management Agreement (Unaudited) (continued)
Economies of Scale
The Trustees considered the information that had been provided regarding the Investment Adviser’s profitability. The Trustees also considered the breakpoints in the fee rate payable under the Management Agreement for the Fund at the following annual percentage rates of the average daily net assets of the Fund:
| First $1 billion | 0.79 | % | ||
| Next $1 billion | 0.71 | |||
| Next $3 billion | 0.68 | |||
| Next $3 billion | 0.66 | |||
| Over $8 billion | 0.65 |
The Trustees noted that the breakpoints were designed to share potential economies of scale, if any, with the Fund and its shareholders as assets under management reach those asset levels. The Trustees considered the amounts of assets in the Fund; the Fund’s recent share purchase and redemption activity; the information provided by the Investment Adviser relating to the costs of the services provided by the Investment Adviser and its affiliates and their realized profits; information comparing fee rates charged by the Investment Adviser with fee rates charged to other funds in the peer group; and the Investment Adviser’s undertaking to waive a portion of its management fee and to limit certain expenses of the Fund that exceed a specified level. Upon reviewing these matters at the Annual Meeting, the Trustees concluded that the fee breakpoints represented a means of assuring that benefits of scalability, if any, would be passed along to shareholders at the specified asset levels.
Other Benefits to the Investment Adviser and Its Affiliates
The Trustees also considered the other benefits derived by the Investment Adviser and its affiliates from their relationships with the Fund as stated above, including: (a) transfer agency fees received by Goldman, Sachs & Co. (“Goldman Sachs”); (b) brokerage and futures commissions earned by Goldman Sachs for executing securities and futures transactions on behalf of the Fund; (c) trading efficiencies resulting from aggregation of orders of the Fund with those for other funds or accounts managed by the Investment Adviser; (d) fees earned by Goldman Sachs Agency Lending (“GSAL”), an affiliate of the Investment Adviser, as securities lending agent (and fees earned by the Investment Adviser for managing the fund in which the Fund’s cash collateral is invested); (e) the Investment Adviser’s ability to leverage the infrastructure designed to service the Fund on behalf of its other clients; (f) the Investment Adviser’s ability to cross-market other products and services to Fund shareholders; (g) Goldman Sachs’ retention of certain fees as Fund Distributor; (h) the Investment Adviser’s ability to negotiate better pricing with custodians on behalf of its other clients, as a result of the relationship with the Fund; and (i) the possibility that the working relationship between the Investment Adviser and the Fund’s third-party service providers may cause those service providers to be more likely to do business with other areas of Goldman Sachs. In the course of considering the foregoing, the Independent Trustees requested and received further information quantifying certain of these fall-out benefits.
Other Benefits to the Fund and Its Shareholders
The Trustees also noted that the Fund receives certain potential benefits as a result of its relationship with the Investment Adviser, including: (a) trading efficiencies resulting from aggregation of orders of the Fund with those of other funds or accounts managed by the Investment Adviser; (b) enhanced servicing from vendors because of the volume of business generated by the Investment Adviser and its affiliates; (c) enhanced servicing from broker-dealers because of the volume of business generated by the Investment Adviser and its affiliates; (d) the Investment Adviser’s ability to negotiate favorable terms with derivatives counterparties on behalf of the Fund as a result of the size and reputation of the Goldman Sachs organization; (e) the Investment Adviser’s knowledge and experience gained from managing other accounts and products; (f) the Investment Adviser’s ability to hire and retain qualified personnel to provide services to the Fund because of the reputation of the Goldman Sachs organization; (g) the Fund’s access, through the Investment Adviser, to certain firmwide resources (e.g., proprietary risk management systems and databases), subject to certain restrictions; (h) the Fund’s ability to participate in the securities lending program administered by GSAL, as measured by the revenue received by the Fund in connection with the program; and (i) the Fund’s access to certain affiliated distribution channels. In addition, the Trustees noted the competitive nature of the mutual fund marketplace, and considered that many of the Fund’s shareholders invested in the Fund in part because of the Fund’s relationship with the Investment Adviser and that those shareholders have a general expectation that the relationship will continue.
28
GOLDMAN SACHS VARIABLE INSURANCE TRUST GLOBAL TRENDS ALLOCATION FUND
Statement Regarding Basis for Approval of Management Agreement (Unaudited) (continued)
Conclusion
In connection with their consideration of the Management Agreement, the Trustees gave weight to each of the factors described above, but did not identify any particular factor as controlling their decision. After deliberation and consideration of all of the information provided, including the factors described above, the Trustees concluded, in the exercise of their business judgment, that the management fees paid by the Fund were reasonable in light of the services provided to it by the Investment Adviser, the Investment Adviser’s costs and the Fund’s current and reasonably foreseeable asset levels. The Trustees unanimously concluded that the Investment Adviser’s continued management likely would benefit the Fund and its shareholders and that the Management Agreement should be approved and continued with respect to the Fund until June 30, 2017.
29
| TRUSTEES | OFFICERS | |
| Ashok N. Bakhru, Chairman | James A. McNamara, President | |
| Kathryn A. Cassidy | Scott M. McHugh, Principal Financial Officer, | |
| Diana M. Daniels | Senior Vice President and Treasurer | |
| Herbert J. Markley | Caroline L. Kraus, Secretary | |
| James A. McNamara | ||
| Jessica Palmer | ||
| Alan A. Shuch | ||
| Roy W. Templin | ||
| Gregory G. Weaver |
GOLDMAN, SACHS & CO.
Distributor and Transfer Agent
GOLDMAN SACHS ASSET MANAGEMENT, L.P.
Investment Adviser
200 West Street, New York
New York 10282
Visit our web site at www.GSAMFUNDS.com to obtain the most recent month-end returns.
The reports concerning the Fund included in this shareholder report may contain certain forward-looking statements about the factors that may affect the performance of the Fund in the future. These statements are based on Fund management’s predictions and expectations concerning certain future events and their expected impact on the Fund, such as performance of the economy as a whole and of specific industry sectors, changes in the levels of interest rates, the impact of developing world events, and other factors that may influence the future performance of the Fund. Management believes these forward-looking statements to be reasonable, although they are inherently uncertain and difficult to predict. Actual events may cause adjustments in portfolio management strategies from those currently expected to be employed.
A description of the policies and procedures that the Fund uses to determine how to vote proxies relating to portfolio securities and information regarding how the Fund voted proxies relating to portfolio securities for the 12-month period ended June 30 is available (i) without charge, upon request by calling 1-800-621-2550; and (ii) on the Securities and Exchange Commission (“SEC”) web site at http://www.sec.gov.
The Fund files its complete schedule of portfolio holdings with the SEC for the first and third quarters of each fiscal year on Form N-Q. The Fund’s Form N-Qs are available on the SEC’s web site at http://www.sec.gov within 60 days after the Fund’s first and third fiscal quarters. The Fund’s Form N-Qs may be reviewed and copied at the SEC’s Public Reference Room in Washington, D.C. and information on the operation of the Public Reference Room may also be obtained by calling 1-800-SEC-0330. Form N-Qs may be obtained upon request and without charge by calling 1-800-621-2550.
The website links provided are for your convenience only and are not an endorsement or recommendation by GSAM of any of these websites or the products or services offered. GSAM is not responsible for the accuracy and validity of the content of these websites.
Fund holdings and allocations shown are as of June 30, 2016 and may not be representative of future investments. Fund holdings should not be relied on in making investment decisions and should not be construed as research or investment advice regarding particular securities. Current and future holdings are subject to risk.
References to indices, benchmarks or other measures of relative market performance over a specified period of time are provided for your information only and do not imply that the portfolio will achieve similar results. The index composition may not reflect the manner in which a portfolio is constructed. While an adviser seeks to design a portfolio which reflects appropriate risk and return features, portfolio characteristics may deviate from those of the benchmark.
The portfolio risk management process includes an effort to monitor and manage risk, but does not imply low risk.
Shares of the Goldman Sachs VIT Funds are offered to separate accounts of participating life insurance companies for the purpose of funding variable annuity contracts and variable life insurance policies. Shares of the Fund are not offered directly to the general public. The variable annuity contracts and variable life insurance policies are described in the separate prospectuses issued by participating insurance companies. You should refer to those prospectuses for information about surrender charges, mortality and expense risk fees and other charges that may be assessed by participating insurance companies under the variable annuity contracts or variable life insurance policies. Such fees or charges, if any, may affect the return you may realize with respect to your investments. Ask your representative for more complete information. Please consider a fund’s objectives, risks and charges and expenses, and read the prospectus carefully before investing. The prospectus contains this and other information about the Fund.
This material is not authorized for distribution to prospective investors unless preceded or accompanied by a current Prospectus or summary prospectus, if applicable. Investors should consider a Fund’s objective, risks, and charges and expenses, and read the summary prospectus, if available, and/or the Prospectus carefully before investing or sending money. The summary prospectus, if available, and the Prospectus contain this and other information about a Fund and may be obtained from your Authorized Institution or from Goldman, Sachs & Co. by calling 1-800-621-2550.
This report is prepared for the general information of contract owners and is not an offer of shares of the Goldman Sachs Variable Insurance Trust: Goldman Sachs Global Trends Allocation Fund.
Goldman, Sachs & Co. is the distributor of the Goldman Sachs Funds and the Goldman Sachs Variable Insurance Trust Funds.
© 2016 Goldman Sachs. All rights reserved.
VITNAVSAR-16/58881-TMPL-08/2016/12.8K
Goldman
Sachs Variable Insurance Trust
Goldman Sachs
Large Cap Value Fund
Semi-Annual Report
June 30, 2016

GOLDMAN SACHS VARIABLE INSURANCE TRUST LARGE CAP VALUE FUND
INVESTMENT OBJECTIVE
The Fund seeks long-term capital appreciation.
Portfolio Management Discussion and Analysis
Below, the Goldman Sachs Value Portfolio Management Team discusses the Goldman Sachs Variable Insurance Trust — Goldman Sachs Large Cap Value Fund’s (the “Fund”) performance and positioning for the six-month period ended June 30, 2016 (the “Reporting Period”).
How did the Fund perform during the Reporting Period?
During the Reporting Period, the Fund’s Institutional and Service Shares generated cumulative total returns of 1.17% and 0.96%, respectively. These returns compare to the -6.30% cumulative total return of the Fund’s benchmark, the Russell 1000® Value Index (with dividends reinvested) (the “Russell Index”) during the same time period.
What economic and market factors most influenced the equity markets as a whole during the Reporting Period?
Representing the U.S. equity market, the S&P 500® Index gained 3.84% during the Reporting Period.
As the Reporting Period began in January 2016, U.S. equities were embroiled in a global rout, triggered by investor concerns about an intensifying economic slowdown in China and exacerbated by an oil price plunge. Following a December 2015 interest rate hike, the January 2016 Federal Reserve (“Fed”) statement acknowledged these external risks and tightening financial conditions. U.S. equities stabilized in February 2016, as market sentiment improved on the more dovish tone set by global central banks. (Dovish language tends to suggest lower interest rates.) U.S. equities were also supported by stronger economic data, rallying as fourth quarter U.S. Gross Domestic Product (“GDP”) came in above consensus expectations. In March 2016, the Fed kept interest rates on hold and surprised on the dovish side, reducing its forecast to two interest rate hikes in 2016, down from four. Along with receding global economic concerns, we believe this helped to drive a recovery in U.S. equities. Released in March 2016, February 2016 unemployment data came in ahead of market consensus, with unemployment steady at 4.9% in spite of higher participation rates and declining underemployment.
Following the rebound in March 2016, market sentiment appeared to remain sanguine in April 2016, as oil prices rose and China’s economic growth concerns abated. U.S. equities fell near the end of the month as investors were disappointed by a lack of additional stimulus from the Bank of Japan and by a weaker than consensus expected first quarter U.S. GDP rate of 0.5%. Hawkish Fed minutes released in May 2016 temporarily revived market expectations for a Fed interest rate hike in June 2016, but weaker than expected May 2016 payroll data subsequently drove such expectations lower. (Hawkish language tends to suggest higher interest rates; opposite of dovish.) The Fed ultimately held interest rates steady in June 2016 and signaled a slower pace of hikes, acknowledging the slowdown in the labor market. Markets were otherwise dominated in June 2016 by the U.K. referendum on membership in the European Union, popularly known as Brexit. U.S. equities sold off in the global risk-off, or heightened risk adverse sentiment in June 2016 following the surprise “leave” result. Markets rebounded in the latter days of the month owing to improving risk sentiment as markets digested the Brexit vote outcome and on dovish remarks from Bank of England Governor Carney.
For the Reporting Period overall, telecommunication services and utilities were the best performing sectors in the S&P 500 Index by a wide margin. Energy and consumer staples also posted double-digit gains. The energy sector was the largest positive contributor to S&P 500 Index returns, as measured by weight times performance. The weakest performing sectors in the S&P 500 Index during the Reporting Period were financials and information technology, the only two to post negative absolute returns, followed by consumer discretionary and health care, which were also weak but generated modestly positive returns during the Reporting Period.
Within the U.S. equity market, there was significant disparity in performance not only among sectors but also among the various capitalization and style segments. While all capitalization segments posted positive returns, mid-cap stocks, as measured by the Russell Midcap® Index, performed best, followed by large-cap stocks, as measured by the Russell 1000® Index, and then, small-cap stocks, as measured by the Russell 2000® Index. From a style perspective, value-oriented stocks significantly outpaced growth-oriented stocks across the capitalization spectrum. Value outperformed relative to growth during the Reporting Period primarily due to weaker performance of the growth-oriented health care sector. (All as measured by the Russell Investments indices.)
1
GOLDMAN SACHS VARIABLE INSURANCE TRUST LARGE CAP VALUE FUND
What key factors were responsible for the Fund’s performance during the Reporting Period?
While the Fund posted absolute gains, it underperformed the Russell Index on a relative basis. Stock selection had the greatest effect on the Fund’s performance relative to the Russell Index during the Reporting Period.
Which equity market sectors most significantly affected Fund performance?
Stock selection in the financials, health care and industrials sectors detracted most from the Fund’s relative results. Only partially offsetting these detractors was stock selection in the energy and consumer discretionary sectors, which contributed positively. Having an overweighted allocation to telecommunication services, which was the second best performing sector in the Russell Index during the Reporting Period, also helped.
Which stocks detracted significantly from the Fund’s performance during the Reporting Period?
Detracting most from the Fund’s results relative to its benchmark index were positions in global pharmaceutical company Allergan, multinational banking and financial services company Bank of America and generic and specialty pharmaceuticals company Mylan.
During the Reporting Period, Allergan’s shares were negatively affected when its announced merger with Pfizer fell through due to potential regulatory risk. In light of this underperformance, we believe the company’s valuation was even more attractive on both an absolute basis and relative to its peers, and thus we added to the Fund’s position on weakness. Additionally, the company is in the final stages of selling its generic business to Teva Pharmaceuticals, which could allow Allergan to pay down debt, return capital to shareholders, invest in its pipeline and seek accretive merger and acquisition opportunities, in our view.
Banks underperformed the Russell Index broadly during the Reporting Period as a result of lowered consensus expectations for interest rate increases and capital markets activity as well as on concerns about loan exposure to the energy sector. Bank of America was no exception. We added to the Fund’s position given our view that the company’s valuation was even more attractive on both an absolute basis and relative to its peers following this recent underperformance. Additionally, we remained positive at the end of the Reporting Period based on Bank of America’s leverage to a strengthening U.S. economy and its management’s focus on cost control initiatives.
Mylan’s stock declined during the Reporting Period due to investor concerns about weaker than expected generic drug pricing in North America. Additionally, its stock price declined early in 2016 following an agreement to acquire Meda Pharmaceuticals for a larger than expected premium, which was received negatively by the market. While we continue to be positive about the company, we became worried about Mylan’s ability to maintain pricing power and thus exited the position in favor of higher conviction opportunities.
What were some of the Fund’s best-performing individual stocks?
Relative to the Russell Index, the Fund benefited most from positions in Southwestern Energy, BP and Apache—each an energy-related company.
Southwestern Energy, a natural gas and oil exploration and production company, was the top contributor to the Fund’s relative performance during the Reporting Period. Its stock performance was driven primarily by a rise in natural gas prices during the Reporting Period. Sentiment on natural gas and on natural gas-related companies improved due to a better supply and demand outlook for the natural gas market. At the end of the Reporting Period, we continued to see upside for Southwestern Energy given what we view as the company’s high quality assets, specifically in the Marcellus, Fayetteville and Utica Shales. We were encouraged by its management team’s focus on cutting costs and divesting assets in an effort to keep debt in check and by its commitment to capital efficiency amidst a more challenging macro environment.
BP, an integrated oil and gas company, performed well, similarly supported by rising oil and natural gas prices during the Reporting Period. At the end of the Reporting Period, we viewed the company’s capital efficiency favorably, evidenced by production growth despite capital expenditure reductions. What we see as the capital discipline of BP’s management also gave us confidence in the sustainability of the company’s dividend, and we believed the company was attractively valued relative to its peers. We added to the Fund’s position in BP during the Reporting Period.
Apache explores, develops and produces natural gas, crude oil and natural gas liquids. The company has exploration and production interests in six countries and regions — the U.S., Canada, Egypt, the U.K, the North Sea and Argentina. Stronger oil and gas prices led to a rally in Apache’s stock during the Reporting Period, but we exited the Fund’s position in its stock in May 2016 as the price target we had established was reached.
2
GOLDMAN SACHS VARIABLE INSURANCE TRUST LARGE CAP VALUE FUND
How did the Fund use derivatives and similar instruments during the Reporting Period?
During the Reporting Period, we did not use derivatives as part of an active management strategy.
Did the Fund make any significant purchases or sales during the Reporting Period?
Based predominantly on valuation, we re-initiated a Fund position in Verizon Communication, a wireless communications provider, having sold the Fund’s position in its stock during the prior reporting period. In our view, the company is a high quality franchise with solid new product revenues and an improving free cash flow profile. Additionally, we believe Verizon has some of the best assets in the industry, and we were positive, at the time of purchase, on its recent customer growth. We believe that going forward Verizon should have the potential to experience healthy growth should its management team continue to invest and focus on its strong wireless business.
During the Reporting Period, we established a Fund position in Chevron, an integrated energy company. In our view, Chevron has a strong management team focused on creating shareholder value. Further, we believe its management team has been disciplined with cost reductions and demonstrated capital efficiency in a challenging commodity price environment. Indeed, despite a more challenging backdrop for energy, we believe Chevron should be able to grow production while significantly reducing capital expenditures. Finally, in our opinion, shares of the company were undervalued at the time of our purchase compared to its integrated energy peers.
In addition to those sales already mentioned, we sold the Fund’s position in Cabot Oil & Gas. We chose to sell the Fund’s position following strong performance during the Reporting Period, driven largely by the rally in oil and gas prices but which left less upside potential, in our view. Similarly, we exited the Fund’s position in Lowe’s Companies, selling the position following strong performance during the Reporting Period, which left less upside potential, in our opinion. In both cases, we used the sales proceeds to fund other positions in the Fund that we felt had better risk-adjusted return potential.
Were there any notable changes in the Fund’s weightings during the Reporting Period?
In constructing the Fund’s portfolio, we focus on picking stocks rather than on making industry or sector bets. We seek to outpace the benchmark index by overweighting stocks that we expect to outperform and underweighting those that we think may lag. Consequently, changes in its sector weights are generally the direct result of individual stock selection or of stock appreciation or depreciation. That said, during the Reporting Period, the Fund’s exposure to energy, health care and industrials increased compared to the Russell Index. The Fund’s position in cash also increased during the Reporting Period. The Fund’s allocations compared to the benchmark index in consumer discretionary and financials decreased.
How was the Fund positioned relative to its benchmark index at the end of the Reporting Period?
At the end of June 2016, the Fund had overweighted positions relative to the Russell Index in the health care, information technology and consumer discretionary sectors. On the same date, the Fund had underweighted positions compared to the Russell Index in financials and utilities and was rather neutrally weighted to the Russell Index in consumer staples, energy, industrials, materials and telecommunication services.
Were there any changes to the Fund’s portfolio management team during the Reporting Period?
Effective June 30, 2016, Andrew Braun, Managing Director and Portfolio Manager on the U.S. Value Equity Team for the Mid and Large Cap Value strategies, left the firm. For the Fund, John Arege, Managing Director and Portfolio Manager, has assumed Andy’s responsibilities in the financials (excluding REITs) industry. He will retain his existing coverage in the insurance and energy market segment and has transitioned his responsibilities in industrials to Kevin Martens, Vice President and Portfolio Manager. John will continue as Co-lead Portfolio Manager along with Sean Gallagher, Managing Director and Chief Investment Officer.
The U.S. Value Equity Team continues to be led by Sean Gallagher. Sean has 23 years of investing experience and has been the Head of the U.S. Value Equity Team and Chief Investment Officer since 2009. He joined Goldman Sachs in 2000. Sean continues to lead a well-resourced and talented team of investment professionals. The U.S. Value Equity Team consists of more than 25 investment professionals, including 15 portfolio managers averaging more than 17 years of investment experience.
3
GOLDMAN SACHS VARIABLE INSURANCE TRUST LARGE CAP VALUE FUND
What is the Fund’s tactical view and strategy for the months ahead?
As we enter the second half of 2016, we continue to see what we believe are opportunities across the U.S. equity markets. While our aggregate return expectations are lower than in recent years given slow economic growth and a dearth of outright cheap valuations, we believe equities still looked more attractive at the end of the Reporting Period than most other asset classes. At the same time, we recognize the increased risk from rising geopolitical tensions. Accordingly, we favor high quality, domestically-oriented companies. In an environment with lower expected absolute returns, we believe an active approach is paramount for generating strong performance.
Regardless of market direction, our fundamental, bottom-up stock selection continues to drive our process, rather than headlines or sentiment. We maintain high conviction in the companies the Fund owns and believe they have the potential to outperform relative to the broader market regardless of economic growth conditions. We continue to focus on undervalued companies that we believe have comparatively greater control of their own destiny, such as innovators with differentiated products, companies with low cost structures or companies that have been investing in their own businesses and may be poised to gain market share. We maintain our discipline in identifying companies with what we believe to be strong or improving balance sheets, led by quality management teams and trading at discounted valuations. We remain focused on the long-term performance of the Fund.
4
GOLDMAN SACHS VARIABLE INSURANCE TRUST LARGE CAP VALUE FUND
Index Definitions
The Russell 1000® Value Index (with dividends reinvested) is an unmanaged market capitalization weighted index of the 1000 largest U.S. companies with lower price-to-book ratios and lower forecasted growth values. The figures for the Index do not include any deduction for fees, expenses or taxes. It is not possible to invest directly in an index.
The Russell 2000® Index (with dividends reinvested) is an unmanaged index of common stock prices that measures the performance of the 2000 smallest companies in the Russell 3000® Index. The figures for the Index do not include any deduction for fees, expenses or taxes. It is not possible to invest directly in an index.
The S&P 500® Index (with dividends reinvested) is the Standard & Poor’s 500 Composite Index of 500 stocks, an unmanaged index of common stock prices. The figures for the Index do not include any deduction for fees, expenses or taxes. It is not possible to invest directly in an index.
The Russell Midcap® Index measures the performance of the 800 smallest companies in the Russell 1000® Index, which represent approximately 25% of the total market capitalization of the Russell 1000 Index. It is not possible to invest directly in an index.
The Russell 1000® Index measures the performance of the 1,000 largest companies in the Russell 3000® Index, which represents approximately 92% of the total market capitalization of the Russell 3000 Index. It is not possible to invest directly in an index.
5
FUND BASICS
Large Cap Value Fund
as of June 30, 2016
STANDARDIZED TOTAL RETURNS1
| For the period ended 6/30/16 | One Year | Five Years | Ten Years | Since Inception | Inception Date | |||||||||||||
| Institutional | -4.45 | % | 9.26 | % | 5.00 | % | 4.51 | % | 1/12/98 | |||||||||
| Service | -4.66 | 9.00 | N/A | 3.04 | 7/24/07 | |||||||||||||
| 1 | The Standardized Total Returns are average annual total returns as of the most recent calendar quarter-end. They assume reinvestment of all distributions at net asset value (“NAV”). Because Institutional Shares and Service Shares do not involve a sales charge, such a charge is not applied to their Standardized Total Returns. |
Total return figures in the above chart represent past performance and do not indicate future results, which will vary. The investment return and principal value of an investment will fluctuate and, therefore, an investor’s shares, when redeemed, may be worth more or less than their original cost. Current performance may be lower or higher than the total return figures in the above chart. Please visit www.GSAMFUNDS.com to obtain the most recent month-end returns. Performance reflects fee waivers and/or expense limitations in effect during the periods shown. In their absence, performance would be reduced.
EXPENSE RATIOS2
| Net Expense Ratio (Current) | Gross Expense Ratio (Before Waivers) | |||||||
| Institutional | 0.74 | % | 0.81 | % | ||||
| Service | 0.99 | 1.06 | ||||||
| 2 | The expense ratios of the Fund, both current (net of any fee waivers or expense limitations) and before waivers (gross of any fee waivers or expense limitations) are as set forth above according to the most recent publicly available Prospectuses for the Fund and may differ from the expense ratios disclosed in the Financial Highlights in this report. Pursuant to a contractual arrangement, the Fund’s waivers and/or expense limitations will remain in place through at least April 29, 2017 and prior to such date the Investment Adviser may not terminate the arrangements without the approval of the Fund’s Board of Trustees. If these arrangements are discontinued in the future, the expense ratios may change without shareholder approval. |
TOP TEN HOLDINGS AS OF 6/30/163
| Holding | % of Net Assets | Line of Business | ||||
| General Electric Co. | 4.8% | Capital Goods | ||||
| Wells Fargo & Co. | 4.6 | Banks | ||||
| Verizon Communications, Inc. | 4.5 | Telecommunication Services | ||||
| Bank of America Corp. | 4.0 | Banks | ||||
| Exxon Mobil Corp. | 3.8 | Energy | ||||
| JPMorgan Chase & Co. | 3.2 | Banks | ||||
| The Procter & Gamble Co. | 3.2 | Household & Personal Products | ||||
| Johnson & Johnson | 2.8 | Pharmaceuticals, Biotechnology & Life Sciences | ||||
| Pfizer, Inc. | 2.7 | Pharmaceuticals, Biotechnology & Life Sciences | ||||
| Chevron Corp. | 2.5 | Energy | ||||
| 3 | The top 10 holdings may not be representative of the Fund’s future investments. |
6
FUND BASICS
FUND vs. BENCHMARK SECTOR ALLOCATIONS4
As of June 30, 2016
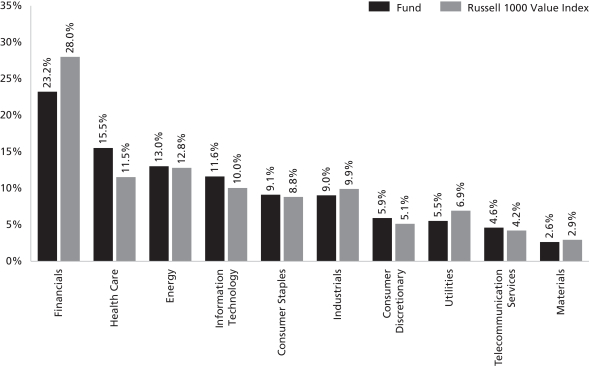
| 4 | The Fund is actively managed and, as such, its composition may differ over time. Consequently, the Fund’s overall sector allocations may differ from percentages contained in the graph above. The graph categorizes investments using Global Industry Classification Standard (“GICS”), however, the sector classifications used by the portfolio management team may differ from GICS. The percentage shown for each investment category reflects the value of investments in that category as a percentage of total market value. The graph depicts the Fund’s investments but may not represent the Fund’s market exposure due to the exclusion of certain derivatives, if any, as listed in the Additional Investment Information section of the Schedule of Investments. |
7
GOLDMAN SACHS VARIABLE INSURANCE TRUST LARGE CAP VALUE FUND
Schedule of Investments
June 30, 2016 (Unaudited)
| Shares | Description | Value | ||||||
| Common Stocks – 97.6% | ||||||||
| Banks – 13.8% |
| ||||||
| 2,625,371 | Bank of America Corp. | $ | 34,838,673 | |||||
| 452,453 | JPMorgan Chase & Co. | 28,115,430 | ||||||
| 149,085 | M&T Bank Corp. | 17,626,320 | ||||||
| 838,880 | Wells Fargo & Co. | 39,704,190 | ||||||
|
| |||||||
| 120,284,613 | ||||||||
|
| |||||||
| Capital Goods – 7.2% |
| ||||||
| 1,334,805 | General Electric Co. | 42,019,662 | ||||||
| 198,113 | United Technologies Corp. | 20,316,488 | ||||||
|
| |||||||
| 62,336,150 | ||||||||
|
| |||||||
| Consumer Durables & Apparel – 3.0% |
| ||||||
| 280,867 | Mattel, Inc. | 8,788,329 | ||||||
| 214,581 | Newell Brands, Inc. | 10,422,199 | ||||||
| 106,472 | VF Corp. | 6,546,963 | ||||||
|
| |||||||
| 25,757,491 | ||||||||
|
| |||||||
| Diversified Financials – 5.8% |
| ||||||
| 303,691 | American Express Co. | 18,452,265 | ||||||
| 177,490 | Capital One Financial Corp. | 11,272,390 | ||||||
| 250,363 | Invesco Ltd. | 6,394,271 | ||||||
| 536,887 | Morgan Stanley | 13,948,324 | ||||||
|
| |||||||
| 50,067,250 | ||||||||
|
| |||||||
| Energy – 12.7% |
| ||||||
| 237,221 | Baker Hughes, Inc. | 10,705,784 | ||||||
| 463,684 | BP PLC ADR | 16,465,419 | ||||||
| 205,736 | Chevron Corp. | 21,567,305 | ||||||
| 299,392 | ConocoPhillips | 13,053,491 | ||||||
| 356,405 | Exxon Mobil Corp. | 33,409,404 | ||||||
| 218,572 | National Oilwell Varco, Inc. | 7,354,948 | ||||||
| 600,816 | Southwestern Energy Co.* | 7,558,265 | ||||||
|
| |||||||
| 110,114,616 | ||||||||
|
| |||||||
| Food & Staples Retailing – 3.3% |
| ||||||
| 289,981 | Wal-Mart Stores, Inc. | 21,174,413 | ||||||
| 233,256 | Whole Foods Market, Inc. | 7,468,857 | ||||||
|
| |||||||
| 28,643,270 | ||||||||
|
| |||||||
| Food, Beverage & Tobacco – 1.5% |
| ||||||
| 126,882 | Mondelez International, Inc. Class A | 5,774,400 | ||||||
| 141,247 | Reynolds American, Inc. | 7,617,451 | ||||||
|
| |||||||
| 13,391,851 | ||||||||
|
| |||||||
| Health Care Equipment & Services – 4.4% |
| ||||||
| 358,561 | Abbott Laboratories | 14,095,033 | ||||||
| 59,185 | Aetna, Inc. | 7,228,264 | ||||||
| 193,051 | Medtronic PLC | 16,751,035 | ||||||
|
| |||||||
| 38,074,332 | ||||||||
|
| |||||||
| Household & Personal Products – 4.1% |
| ||||||
| 56,088 | Kimberly-Clark Corp. | 7,710,978 | ||||||
| 325,834 | The Procter & Gamble Co. | 27,588,365 | ||||||
|
| |||||||
| 35,299,343 | ||||||||
|
| |||||||
| Common Stocks – (continued) | ||||||||
| Insurance – 1.5% |
| ||||||
| 98,370 | The Hartford Financial Services Group, Inc. | $ | 4,365,661 | |||||
| 272,746 | XL Group PLC | 9,085,169 | ||||||
|
| |||||||
| 13,450,830 | ||||||||
|
| |||||||
| Materials – 2.6% |
| ||||||
| 237,062 | E.I. du Pont de Nemours & Co. | 15,361,617 | ||||||
| 176,448 | Newmont Mining Corp. | 6,902,646 | ||||||
|
| |||||||
| 22,264,263 | ||||||||
|
| |||||||
| Media – 2.1% |
| ||||||
| 112,015 | Comcast Corp. Class A | 7,302,258 | ||||||
| 81,465 | DISH Network Corp. Class A* | 4,268,766 | ||||||
| 159,729 | Viacom, Inc. Class B | 6,623,961 | ||||||
|
| |||||||
| 18,194,985 | ||||||||
|
| |||||||
| Pharmaceuticals, Biotechnology & Life Sciences – 10.7% |
| ||||||
| 73,045 | Allergan PLC* | 16,879,969 | ||||||
| 32,154 | Biogen, Inc.* | 7,775,480 | ||||||
| 82,477 | Celgene Corp.* | 8,134,707 | ||||||
| 86,418 | Eli Lilly & Co. | 6,805,417 | ||||||
| 198,051 | Johnson & Johnson | 24,023,586 | ||||||
| 658,427 | Pfizer, Inc. | 23,183,215 | ||||||
| 72,045 | Vertex Pharmaceuticals, Inc.* | 6,197,311 | ||||||
|
| |||||||
| 92,999,685 | ||||||||
|
| |||||||
| Real Estate Investment Trusts – 1.5% |
| ||||||
| 34,816 | AvalonBay Communities, Inc. | 6,280,458 | ||||||
| 69,343 | Vornado Realty Trust | 6,942,621 | ||||||
|
| |||||||
| 13,223,079 | ||||||||
|
| |||||||
| Retailing – 0.8% |
| ||||||
| 62,747 | Expedia, Inc. | 6,670,006 | ||||||
|
| |||||||
| Semiconductors & Semiconductor Equipment – 1.8% |
| ||||||
| 94,432 | Maxim Integrated Products, Inc. | 3,370,278 | ||||||
| 227,943 | QUALCOMM, Inc. | 12,210,907 | ||||||
|
| |||||||
| 15,581,185 | ||||||||
|
| |||||||
| Software & Services – 5.9% |
| ||||||
| 19,217 | Alphabet, Inc. Class A* | 13,519,736 | ||||||
| 433,869 | eBay, Inc.* | 10,156,873 | ||||||
| 87,867 | Microsoft Corp. | 4,496,154 | ||||||
| 333,765 | Oracle Corp. | 13,661,002 | ||||||
| 461,199 | Symantec Corp. | 9,473,028 | ||||||
|
| |||||||
| 51,306,793 | ||||||||
|
| |||||||
| Technology Hardware & Equipment – 3.6% |
| ||||||
| 129,981 | Apple, Inc. | 12,426,184 | ||||||
| 369,129 | Cisco Systems, Inc. | 10,590,311 | ||||||
| 219,425 | Corning, Inc. | 4,493,824 | ||||||
| 74,322 | TE Connectivity Ltd. | 4,244,529 | ||||||
|
| |||||||
| 31,754,848 | ||||||||
|
| |||||||
| Telecommunication Services – 4.4% |
| ||||||
| 694,167 | Verizon Communications, Inc. | 38,762,285 | ||||||
|
| |||||||
| 8 | The accompanying notes are an integral part of these financial statements. |
GOLDMAN SACHS VARIABLE INSURANCE TRUST LARGE CAP VALUE FUND
| Shares | Description | Value | ||||||
| Common Stocks – (continued) | ||||||||
| Transportation – 1.6% |
| ||||||
| 157,615 | Union Pacific Corp. | $ | 13,751,909 | |||||
|
| |||||||
| Utilities – 5.3% |
| ||||||
| 54,429 | Consolidated Edison, Inc. | 4,378,269 | ||||||
| 121,856 | Duke Energy Corp. | 10,454,026 | ||||||
| 166,632 | FirstEnergy Corp. | 5,817,123 | ||||||
| 102,294 | NextEra Energy, Inc. | 13,339,138 | ||||||
| 194,183 | PG&E Corp. | 12,412,177 | ||||||
|
| |||||||
| 46,400,733 | ||||||||
|
| |||||||
| TOTAL INVESTMENTS – 97.6% | ||||||||
| (Cost $748,716,076) | $ | 848,329,517 | ||||||
|
| |||||||
| OTHER ASSETS IN EXCESS OF | 21,023,388 | ||||||
|
| |||||||
| NET ASSETS – 100.0% | $ | 869,352,905 | ||||||
|
| |||||||
| The percentage shown for each investment category reflects the value of investments in that category as a percentage of net assets. | ||
| * | Non-income producing security. | |
| Investment Abbreviation: | ||||
| ADR | —American Depositary Receipt | |||
| The accompanying notes are an integral part of these financial statements. | 9 |
GOLDMAN SACHS VARIABLE INSURANCE TRUST LARGE CAP VALUE FUND
Statement of Assets and Liabilities
June 30, 2016 (Unaudited)
| Assets: | ||||
Investments, at value (cost $748,716,076) | $ | 848,329,517 | ||
Cash | 33,270,297 | |||
Receivables: | ||||
Investments sold | 5,052,695 | |||
Dividends | 800,957 | |||
Fund shares sold | 129,063 | |||
Reimbursement from investment adviser | 21,815 | |||
| Total assets | 887,604,344 | |||
| Liabilities: | ||||
Payables: | ||||
Fund shares redeemed | 8,868,395 | |||
Investments purchased | 8,637,558 | |||
Management fees | 515,567 | |||
Distribution and Service fees and Transfer Agency fees | 138,764 | |||
Accrued expenses | 91,155 | |||
| Total liabilities | 18,251,439 | |||
| Net Assets: | ||||
Paid-in capital | 810,514,109 | |||
Undistributed net investment income | 10,373,437 | |||
Accumulated net realized loss | (51,148,082 | ) | ||
Net unrealized gain | 99,613,441 | |||
| NET ASSETS | $ | 869,352,905 | ||
Net Assets: | ||||
Institutional | $ | 263,642,810 | ||
Service | 605,710,095 | |||
Total Net Assets | $ | 869,352,905 | ||
Shares of beneficial interest outstanding $0.001 par value (unlimited shares authorized): | ||||
Institutional | 27,767,289 | |||
Service | 63,905,375 | |||
Net asset value, offering and redemption price per share: | ||||
Institutional | $9.49 | |||
Service | 9.48 | |||
| 10 | The accompanying notes are an integral part of these financial statements. |
GOLDMAN SACHS VARIABLE INSURANCE TRUST LARGE CAP VALUE FUND
Statement of Operations
For the Six Months Ended June 30, 2016 (Unaudited)
| Investment income: | ||||
Dividends | $ | 12,941,677 | ||
| Expenses: | ||||
Management fees | 3,172,366 | |||
Distribution and Service fees — Service Shares | 730,937 | |||
Transfer Agency fees(a) | 84,589 | |||
Printing and mailing costs | 48,470 | |||
Professional fees | 35,363 | |||
Custody, accounting and administrative services | 27,458 | |||
Trustee fees | 13,745 | |||
Other | 24,671 | |||
| Total expenses | 4,137,599 | |||
Less — expense reductions | (269,458 | ) | ||
| Net expenses | 3,868,141 | |||
| NET INVESTMENT INCOME | 9,073,536 | |||
| Realized and unrealized gain (loss): | ||||
Net realized loss from investments (including commissions recaptured of $48,740) | (46,844,880 | ) | ||
Net change in unrealized gain on investments | 45,603,821 | |||
| Net realized and unrealized loss | (1,241,059 | ) | ||
| NET INCREASE IN NET ASSETS RESULTING FROM OPERATIONS | $ | 7,832,477 | ||
(a) Institutional and Service Shares incurred Transfer Agency fees of $26,119 and $58,470, respectively.
| The accompanying notes are an integral part of these financial statements. | 11 |
GOLDMAN SACHS VARIABLE INSURANCE TRUST LARGE CAP VALUE FUND
Statements of Changes in Net Assets
| For the Six Months Ended June 30, 2016 (Unaudited) | For the Fiscal Year Ended December 31, 2015 | |||||||
| From operations: | ||||||||
Net investment income | $ | 9,073,536 | $ | 11,690,140 | ||||
Net realized gain (loss) | (46,844,880 | ) | 95,458,298 | |||||
Net change in unrealized gain (loss) | 45,603,821 | (148,127,736 | ) | |||||
| Net increase (decrease) in net assets resulting from operations | 7,832,477 | (40,979,298 | ) | |||||
| Distributions to shareholders: | ||||||||
From net investment income | ||||||||
Institutional Shares | — | (4,277,987 | ) | |||||
Service Shares | — | (7,701,841 | ) | |||||
From net realized gains | ||||||||
Institutional Shares | — | (34,533,023 | ) | |||||
Service Shares | — | (75,483,763 | ) | |||||
| Total distributions to shareholders | — | (121,996,614 | ) | |||||
| From share transactions: | ||||||||
Proceeds from sales of shares | 34,758,459 | 81,069,087 | ||||||
Reinvestment of distributions | — | 121,996,614 | ||||||
Cost of shares redeemed | (63,836,608 | ) | (168,775,231 | ) | ||||
| Net increase (decrease) in net assets resulting from share transactions | (29,078,149 | ) | 34,290,470 | |||||
| TOTAL DECREASE | (21,245,672 | ) | (128,685,442 | ) | ||||
| Net assets: | ||||||||
Beginning of period | 890,598,577 | 1,019,284,019 | ||||||
End of period | $ | 869,352,905 | $ | 890,598,577 | ||||
| Undistributed net investment income | $ | 10,373,437 | $ | 1,299,901 | ||||
| 12 | The accompanying notes are an integral part of these financial statements. |
GOLDMAN SACHS VARIABLE INSURANCE TRUST LARGE CAP VALUE FUND
Financial Highlights
Selected Data for a Share Outstanding Throughout Each Period
| Income (loss) from investment operations | Distributions to shareholders | |||||||||||||||||||||||||||||||||||||||||||||||||||||||
| Year - Share Class | Net asset value, beginning of period | Net investment income(a) | Net realized and unrealized gain (loss) | Total from investment operations | From net investment income | From net | Total distributions | Net asset value, end of period | Total return(b) | Net assets, (in 000s) | Ratio of net expenses to average net assets | Ratio of total expenses to average net assets | Ratio of net investment income to average net assets | Portfolio turnover rate(c) | ||||||||||||||||||||||||||||||||||||||||||
FOR THE SIX MONTHS ENDED JUNE 30, (UNAUDITED) | ||||||||||||||||||||||||||||||||||||||||||||||||||||||||
2016 - Institutional | $ | 9.39 | $ | 0.10 | (d) | $ | — | $ | 0.10 | $ | — | $ | — | $ | — | $ | 9.49 | 1.17 | % | $ | 263,643 | 0.74 | %(d) | 0.81 | %(e) | 2.32 | %(d)(e) | 79 | % | |||||||||||||||||||||||||||
2016 - Service | 9.39 | 0.09 | (d) | — | 0.09 | — | — | — | 9.48 | 0.96 | 605,710 | 0.99 | (d) | 1.06 | (e) | 2.07 | (d)(e) | 79 | ||||||||||||||||||||||||||||||||||||||
FOR THE FISCAL YEARS ENDED DECEMBER 31, | ||||||||||||||||||||||||||||||||||||||||||||||||||||||||
2015 - Institutional | 11.39 | 0.15 | (0.67 | ) | (0.52 | ) | (0.16 | ) | (1.32 | ) | (1.48 | ) | 9.39 | (4.41 | ) | 279,910 | 0.74 | 0.81 | 1.38 | 83 | ||||||||||||||||||||||||||||||||||||
2015 - Service | 11.38 | 0.13 | (0.67 | ) | (0.54 | ) | (0.13 | ) | (1.32 | ) | (1.45 | ) | 9.39 | (4.58 | ) | 610,689 | 0.99 | 1.06 | 1.13 | 83 | ||||||||||||||||||||||||||||||||||||
2014 - Institutional | 12.59 | 0.16 | 1.38 | 1.54 | (0.19 | ) | (2.55 | ) | (2.74 | ) | 11.39 | 12.94 | 326,543 | 0.75 | 0.80 | 1.21 | 72 | |||||||||||||||||||||||||||||||||||||||
2014 - Service | 12.58 | 0.13 | 1.37 | 1.50 | (0.15 | ) | (2.55 | ) | (2.70 | ) | 11.38 | 12.61 | 692,741 | 1.00 | 1.05 | 0.96 | 72 | |||||||||||||||||||||||||||||||||||||||
2013 - Institutional | 10.76 | 0.14 | 3.39 | 3.53 | (0.16 | ) | (1.54 | ) | (1.70 | ) | 12.59 | 33.23 | 370,241 | 0.75 | 0.79 | 1.15 | 86 | |||||||||||||||||||||||||||||||||||||||
2013 - Service | 10.75 | 0.11 | 3.39 | 3.50 | (0.13 | ) | (1.54 | ) | (1.67 | ) | 12.58 | 32.93 | 792,553 | 1.00 | 1.04 | 0.91 | 86 | |||||||||||||||||||||||||||||||||||||||
2012 - Institutional | 9.39 | 0.15 | 1.64 | 1.79 | (0.15 | ) | (0.27 | ) | (0.42 | ) | 10.76 | 19.07 | 351,677 | 0.77 | 0.78 | 1.40 | 120 | |||||||||||||||||||||||||||||||||||||||
2012 - Service | 9.38 | 0.12 | 1.64 | 1.76 | (0.12 | ) | (0.27 | ) | (0.39 | ) | 10.75 | 18.77 | 734,577 | 1.02 | 1.03 | 1.15 | 120 | |||||||||||||||||||||||||||||||||||||||
2011 - Institutional | 10.24 | 0.14 | (f) | (0.86 | ) | (0.72 | ) | (0.13 | ) | — | (0.13 | ) | 9.39 | (7.05 | ) | 421,560 | 0.78 | 0.79 | 1.39 | (f) | 91 | |||||||||||||||||||||||||||||||||||
2011 - Service | 10.23 | 0.12 | (f) | (0.87 | ) | (0.75 | ) | (0.10 | ) | — | (0.10 | ) | 9.38 | (7.27 | ) | 857,659 | 1.03 | 1.04 | 1.23 | (f) | 91 | |||||||||||||||||||||||||||||||||||
| (a) | Calculated based on the average shares outstanding methodology. |
| (b) | Assumes investment at the net asset value at the beginning of the period, reinvestment of all distributions, and a complete redemption of the investment at the net asset value at the end of the period. Total returns for periods less than one full year are not annualized. |
| (c) | The Fund's portfolio turnover rate is calculated in accordance with regulatory requirements, without regard to transactions involving short term investments. If such transactions were included, the Fund's portfolio turnover rate may be higher. |
| (d) | Reflects income recognized from a special dividend which amounted to $0.02 per share and 0.19% of average net assets. |
| (e) | Annualized. |
| (f) | Reflects income recognized from special dividends which amounted to $0.02 per share and 0.19% of average net assets. |
| The accompanying notes are an integral part of these financial statements. | 13 |
GOLDMAN SACHS VARIABLE INSURANCE TRUST LARGE CAP VALUE FUND
Notes to Financial Statements
June 30, 2016 (Unaudited)
1. ORGANIZATION
Goldman Sachs Variable Insurance Trust (the “Trust” or “VIT”) is a Delaware statutory trust registered under the Investment Company Act of 1940, as amended (the “Act”), as an open-end management investment company. The Trust includes the Goldman Sachs Large Cap Value Fund (the “Fund”). The Fund is a diversified portfolio under the Act offering two classes of shares — Institutional and Service Shares. Shares of the Trust are offered to separate accounts of participating life insurance companies for the purpose of funding variable annuity contracts and variable life insurance policies.
Goldman Sachs Asset Management, L.P. (“GSAM”), an affiliate of Goldman, Sachs & Co. (“Goldman Sachs”), serves as investment adviser to the Fund pursuant to a management agreement (the “Agreement”) with the Trust.
2. SIGNIFICANT ACCOUNTING POLICIES
The financial statements have been prepared in accordance with accounting principles generally accepted in the United States of America (“GAAP”) and require management to make estimates and assumptions that may affect the reported amounts and disclosures. Actual results may differ from those estimates and assumptions.
A. Investment Valuation — The Fund’s valuation policy is to value investments at fair value.
B. Investment Income and Investments — Investment income includes interest income, dividend income, net of any foreign withholding taxes, less any amounts reclaimable, and securities lending income. Interest income is accrued daily and adjusted for amortization of premiums and accretion of discounts. Dividend income is recognized on ex-dividend date or, for certain foreign securities, as soon as such information is obtained subsequent to the ex-dividend date. Investment transactions are reflected on trade date. Realized gains and losses are calculated using identified cost. Investment transactions are recorded on the following business day for daily net asset value (“NAV”) calculations. Any foreign capital gains tax is accrued daily based upon net unrealized gains, and is payable upon sale of such investments. Distributions received from the Fund’s investments in United States (“U.S.”) real estate investment trusts (“REITs”) may be characterized as ordinary income, net capital gain or a return of capital. A return of capital is recorded by the Fund as a reduction to the cost basis of the REIT.
C. Class Allocations and Expenses — Investment income, realized and unrealized gain (loss), and non-class specific expenses of the Fund are allocated daily based upon the proportion of net assets of each class. Non-class specific expenses directly incurred by the Fund are charged to the Fund, while such expenses incurred by the Trust are allocated across the Fund on a straight-line and/or pro-rata basis depending upon the nature of the expenses. Class specific expenses, where applicable, are borne by the respective share classes and include Distribution and Service and Transfer Agency fees.
D. Federal Taxes and Distributions to Shareholders — It is the Fund’s policy to comply with the requirements of the Internal Revenue Code of 1986, as amended (the “Code”), applicable to regulated investment companies (mutual funds) and to distribute each year substantially all of its investment company taxable income and capital gains to its shareholders. Accordingly, the Fund is not required to make any provisions for the payment of federal income tax. Distributions to shareholders are recorded on the ex-dividend date. Income and capital gains distributions, if any, are declared and paid annually.
Net capital losses are carried forward to future fiscal years and may be used to the extent allowed by the Code to offset any future capital gains. Losses that are carried forward will retain their character as either short-term or long-term capital losses. Utilization of capital loss carryforwards will reduce the requirement of future capital gains distributions.
The characterization of distributions to shareholders for financial reporting purposes is determined in accordance with federal income tax rules, which may differ from GAAP. The source of the Fund’s distributions may be shown in the accompanying financial statements as either from net investment income, net realized gain or capital. Certain components of the Fund’s net assets on the Statement of Assets and Liabilities reflect permanent GAAP/tax differences based on the appropriate tax character.
E. Commission Recapture — GSAM, on behalf of certain Funds, may direct portfolio trades, subject to seeking best execution, to various brokers who have agreed to rebate a portion of the commissions generated. Such rebates are made directly to a Fund as cash payments and are included in net realized gain (loss) from investments on the Statement of Operations.
14
GOLDMAN SACHS VARIABLE INSURANCE TRUST LARGE CAP VALUE FUND
3. INVESTMENTS AND FAIR VALUE MEASUREMENTS
The fair value of a financial instrument is the amount that would be received to sell an asset or paid to transfer a liability in an orderly transaction between market participants at the measurement date (i.e., the exit price). GAAP establishes a fair value hierarchy that prioritizes the inputs to valuation techniques used to measure fair value. The hierarchy gives the highest priority to unadjusted quoted prices in active markets for identical assets or liabilities (Level 1 measurements) and the lowest priority to unobservable inputs (Level 3 measurements). The levels used for classifying investments are not necessarily an indication of the risk associated with investing in these investments. The three levels of the fair value hierarchy are described below:
Level 1 — Unadjusted quoted prices in active markets that are accessible at the measurement date for identical, unrestricted assets or liabilities;
Level 2 — Quoted prices in markets that are not active or financial instruments for which significant inputs are observable (including, but not limited to, quoted prices for similar investments, interest rates, foreign exchange rates, volatility and credit spreads), either directly or indirectly;
Level 3 — Prices or valuations that require significant unobservable inputs (including GSAM’s assumptions in determining fair value measurement).
Changes in valuation techniques may result in transfers into or out of an assigned level within the hierarchy. In accordance with the Fund’s policy, transfers between different levels of the fair value hierarchy resulting from such changes are deemed to have occurred as of the beginning of the reporting period.
The Board of Trustees (“Trustees”) has approved Valuation Procedures that govern the valuation of the portfolio investments held by the Fund, including investments for which market quotations are not readily available. The Trustees have delegated to GSAM day-to-day responsibility for implementing and maintaining internal controls and procedures related to the valuation of the Fund’s portfolio investments. To assess the continuing appropriateness of pricing sources and methodologies, GSAM regularly performs price verification procedures and issues challenges as necessary to third party pricing vendors or brokers, and any differences are reviewed in accordance with the Valuation Procedures.
A. Level 1 and Level 2 Fair Value Investments — The valuation techniques and significant inputs used in determining the fair values for investments classified as Level 1 and Level 2 are as follows:
Equity Securities — Equity securities traded on a U.S. securities exchange or the NASDAQ system, or those located on certain foreign exchanges, including but not limited to the Americas, are valued daily at their last sale price or official closing price on the principal exchange or system on which they are traded. If there is no sale or official closing price or such price is believed by GSAM to not represent fair value, equity securities are valued at the last bid price for long positions and at the last ask price for short positions. To the extent these investments are actively traded, they are classified as Level 1 of the fair value hierarchy, otherwise they are generally classified as Level 2.
Unlisted equity securities for which market quotations are available are valued at the last sale price on the valuation date, or if no sale occurs, at the last bid price. Securities traded on certain foreign securities exchanges are valued daily at fair value determined by an independent fair value service (if available) under Valuation Procedures approved by the Trustees and consistent with applicable regulatory guidance. The independent fair value service takes into account multiple factors including, but not limited to, movements in the securities markets, certain depositary receipts, futures contracts and foreign currency exchange rates that have occurred subsequent to the close of the foreign securities exchange. These investments are generally classified as Level 2 of the fair value hierarchy.
B. Level 3 Fair Value Investments — To the extent that significant inputs to valuation models and other alternative pricing sources are unobservable, or if quotations are not readily available, or if GSAM believes that such quotations do not accurately reflect fair value, the fair value of the Fund’s investments may be determined under Valuation Procedures approved by the Trustees. GSAM, consistent with its procedures and applicable regulatory guidance, may make an adjustment to the most recent valuation prices of either domestic or foreign securities in light of significant events to reflect what it believes to be the fair value of the securities at the time of determining the Fund’s NAV. Significant events which could affect a large number of securities in a
15
GOLDMAN SACHS VARIABLE INSURANCE TRUST LARGE CAP VALUE FUND
Notes to Financial Statements (continued)
June 30, 2016 (Unaudited)
3. INVESTMENTS AND FAIR VALUE MEASUREMENTS (continued)
particular market may include, but are not limited to: significant fluctuations in U.S. or foreign markets; market dislocations; market disruptions; or unscheduled market closings. Significant events which could also affect a single issuer may include, but are not limited to: corporate actions such as reorganizations, mergers and buy-outs; ratings downgrades; and bankruptcies.
C. Fair Value Hierarchy — The following is a summary of the Fund’s investments classified in the fair value hierarchy as of June 30, 2016:
| Investment Type | Level 1 | Level 2 | Level 3 | |||||||||
| Assets | ||||||||||||
| Common Stock and/or Other Equity Investments(a) | ||||||||||||
North America | $ | 848,329,517 | $ | — | $ | — | ||||||
| (a) | Amounts are disclosed by continent to highlight the impact of time zone differences between local market close and the calculation of NAV. Security valuations are based on the principal exchange or system on which they are traded, which may differ from country of domicile noted in table. |
For further information regarding security characteristics, see the Schedule of Investments.
4. AGREEMENTS AND AFFILIATED TRANSACTIONS
A. Management Agreement — Under the Agreement, GSAM manages the Fund, subject to the general supervision of the Trustees.
As compensation for the services rendered pursuant to the Agreement, the assumption of the expenses related thereto and administration of the Fund’s business affairs, including providing facilities, GSAM is entitled to a management fee, accrued daily and paid monthly, equal to an annual percentage rate of the Fund’s average daily net assets.
For the six months ended June 30, 2016, contractual and effective net management fees with GSAM were at the following rates:
| Contractual Management Rate | ||||||||||||||||||||||||||
| First $1 billion | Next $1 billion | Next $3 billion | Next $3 billion | Over $8 billion | Effective Rate | Effective Net Management Rate^ | ||||||||||||||||||||
| 0.75% | 0.68 | % | 0.65 | % | 0.64 | % | 0.63 | % | 0.75 | % | 0.72 | %* | ||||||||||||||
| ^ | Effective Net Management Rate includes the impact of management fee waivers of affiliated underlying funds, if any. |
| * | GSAM agreed to waive a portion of its management fee in order to achieve a net management rate, as defined in the Fund’s most recent prospectus. This waiver will be effective through at least April 29, 2017, and prior to such date GSAM may not terminate the arrangement without approval of the Trustees. For the six months ended June 30, 2016, GSAM waived $126,899 of its management fee. |
B. Distribution and Service Plan — The Trust, on behalf of the Service Shares of the Fund, has adopted a Distribution and Service Plan (the “Plan”). Under the Plan, Goldman Sachs, which serves as distributor (the “Distributor”), is entitled to a fee accrued daily and paid monthly, for distribution services and personal and account maintenance services, which may then be paid by Goldman Sachs to authorized dealers, equal to, on an annual basis, 0.25% of the Fund’s average daily net assets attributable to Service Shares.
C. Transfer Agency Agreement — Goldman Sachs also serves as the transfer agent of the Fund for a fee pursuant to the Transfer Agency Agreement. The fees charged for such transfer agency services are accrued daily and paid monthly at an annual rate of 0.02% of the average daily net assets of Institutional and Service Shares.
D. Other Expense Agreements and Affiliated Transactions — GSAM has agreed to limit certain “Other Expenses” of the Fund (excluding acquired fund fees and expenses, transfer agency fees and expenses, taxes, interest, brokerage fees, shareholder meeting, litigation, indemnification and extraordinary expenses) to the extent such expenses exceed, on an annual basis, a percentage rate of the average daily net assets of the Fund. Such Other Expense reimbursements, if any, are accrued daily and paid
16
GOLDMAN SACHS VARIABLE INSURANCE TRUST LARGE CAP VALUE FUND
4. AGREEMENTS AND AFFILIATED TRANSACTIONS (continued)
monthly. In addition, the Fund is not obligated to reimburse GSAM for prior fiscal year expense reimbursements, if any. The Other Expense limitation as an annual percentage rate of average daily net assets for the Fund is 0.004%. The Other Expense limitation will remain in place through at least April 29, 2017, and prior to such date GSAM may not terminate the arrangement without the approval of the Trustees. For the six months ended June 30, 2016, GSAM reimbursed $132,789 to the Fund. In addition, the Fund has entered into certain offset arrangements with the custodian and the transfer agent, which may result in a reduction of the Fund’s expenses and are received irrespective of the application of the “Other Expense” limitations described above. For the six months ended June 30, 2016, custody fee credits were $9,770.
E. Line of Credit Facility — As of June 30, 2016, the Fund participated in a $1,100,000,000 committed, unsecured revolving line of credit facility (the “facility”) together with other funds of the Trust and registered investment companies having management agreements with GSAM or its affiliates (“Other Borrowers”). This facility is to be used for temporary or emergency purposes, or to allow for an orderly liquidation of securities to meet redemption requests. The interest rate on borrowings is based on the federal funds rate. The facility also requires a fee to be paid by the Fund based on the amount of the commitment that has not been utilized. For the six months ended June 30, 2016, the Fund did not have any borrowings under the facility.
5. PORTFOLIO SECURITIES TRANSACTIONS
The cost of purchases and proceeds from sales and maturities of long-term securities for the six months ended June 30, 2016, were $661,027,707 and $700,147,374, respectively.
6. TAX INFORMATION
As of the Fund’s most recent fiscal year end, December 31, 2015, the Fund’s timing differences, on a tax-basis were as follows:
| Timing differences (Qualified Late Year Loss Deferral/Post October Loss Deferral) | $ | (2,441,596 | ) |
As of June 30, 2016, the Fund’s aggregate security unrealized gains and losses based on cost for U.S. federal income tax purposes were as follows:
| Tax cost | $ | 758,109,085 | ||
| Gross unrealized gain | 113,533,050 | |||
| Gross unrealized loss | (23,312,618 | ) | ||
| Net unrealized security gain | $ | 90,220,432 |
The difference between GAAP-basis and tax-basis unrealized gains (losses) is attributable primarily to wash sales.
GSAM has reviewed the Fund’s tax positions for all open tax years (the current and prior three years, as applicable) and has concluded that no provision for income tax is required in the Fund’s financial statements. Such open tax years remain subject to examination and adjustment by tax authorities.
17
GOLDMAN SACHS VARIABLE INSURANCE TRUST LARGE CAP VALUE FUND
Notes to Financial Statements (continued)
June 30, 2016 (Unaudited)
7. OTHER RISKS
The Fund’s risks include, but are not limited to, the following:
Large Shareholder Transactions Risk — The Fund may experience adverse effects when certain large shareholders, such as other funds, participating insurance companies, accounts and Goldman Sachs affiliates, purchase or redeem large amounts of shares of the Fund. Such large shareholder redemptions may cause the Fund to sell portfolio securities at times when it would not otherwise do so, which may negatively impact the Fund’s NAV and liquidity. These transactions may also accelerate the realization of taxable income to shareholders if such sales of investments resulted in gains, and may also increase transaction costs. In addition, a large redemption could result in the Fund’s current expenses being allocated over a smaller asset base, leading to an increase in the Fund’s expense ratio. Similarly, large Fund share purchases may adversely affect the Fund’s performance to the extent that the Fund is delayed in investing new cash and is required to maintain a larger cash position than it ordinarily would.
Liquidity Risk — The Fund may make investments that are illiquid or that may become less liquid in response to market developments or adverse investor perceptions. Illiquid investments may be more difficult to value. Liquidity risk may also refer to the risk that the Fund will not be able to pay redemption proceeds within the allowable time period because of unusual market conditions, an unusually high volume of redemption requests, or other reasons. To meet redemption requests, the Fund may be forced to sell investments at an unfavorable time and/or under unfavorable conditions.
Market and Credit Risks — In the normal course of business, the Fund trades financial instruments and enters into financial transactions where risk of potential loss exists due to changes in the market (market risk). Additionally, the Fund may also be exposed to credit risk in the event that an issuer or guarantor fails to perform or that an institution or entity with which the Fund has unsettled or open transactions defaults.
8. INDEMNIFICATIONS
Under the Trust’s organizational documents, its Trustees, officers, employees and agents are indemnified, to the extent permitted by the Act and state law, against certain liabilities that may arise out of performance of their duties to the Fund. Additionally, in the course of business, the Fund enters into contracts that contain a variety of indemnification clauses. The Fund’s maximum exposure under these arrangements is unknown, as this would involve future claims that may be made against the Fund that have not yet occurred. However, GSAM believes the risk of loss under these arrangements to be remote.
9. SUBSEQUENT EVENTS
Subsequent events after the Statement of Assets and Liabilities date have been evaluated through the date the financial statements were issued. GSAM has concluded that there is no impact requiring adjustment or disclosure in the financial statements.
18
GOLDMAN SACHS VARIABLE INSURANCE TRUST LARGE CAP VALUE FUND
10. SUMMARY OF SHARE TRANSACTIONS
Share activity is as follows:
| For the Six Months Ended June 30, 2016 (Unaudited) | For the Fiscal Year Ended December 31, 2015 | |||||||||||||||
| Shares | Dollars | Shares | Dollars | |||||||||||||
| Institutional Shares | ||||||||||||||||
| Shares sold | 813,858 | $ | 7,397,760 | 2,160,929 | $ | 23,733,358 | ||||||||||
| Reinvestment of distributions | — | — | 4,177,719 | 38,811,010 | ||||||||||||
| Shares redeemed | (2,840,639 | ) | (25,936,267 | ) | (5,222,161 | ) | (57,804,985 | ) | ||||||||
| (2,026,781 | ) | (18,538,507 | ) | 1,116,487 | 4,739,383 | |||||||||||
| Service Shares | ||||||||||||||||
| Shares sold | 2,998,916 | 27,360,699 | 5,254,815 | 57,335,729 | ||||||||||||
| Reinvestment of distributions | — | — | 8,954,317 | 83,185,604 | ||||||||||||
| Shares redeemed | (4,129,061 | ) | (37,900,341 | ) | (10,053,254 | ) | (110,970,246 | ) | ||||||||
| (1,130,145 | ) | (10,539,642 | ) | 4,155,878 | 29,551,087 | |||||||||||
| NET INCREASE (DECREASE) | (3,156,926 | ) | $ | (29,078,149 | ) | 5,272,365 | $ | 34,290,470 | ||||||||
19
GOLDMAN SACHS VARIABLE INSURANCE TRUST LARGE CAP VALUE FUND
| Fund Expenses — Six Month Period Ended June 30, 2016 (Unaudited) |
As a shareholder of Institutional or Service Shares of the Fund, you incur ongoing costs, including management fees, distribution and service (12b-1) fees (with respect to Service Shares) and other Fund expenses. This example is intended to help you understand your ongoing costs (in dollars) of investing in the Institutional Shares and Service Shares of the Fund and to compare these costs with the ongoing costs of investing in other mutual funds.
The example is based on an investment of $1,000 invested at the beginning of the period and held for the entire period from January 1, 2016 through June 30, 2016, which represents a period of 182 days of a 366 day year.
Actual Expenses — The first line under each share class in the table below provides information about actual account values and actual expenses. You may use the information in this line, together with the amount you invested, to estimate the expenses that you paid over the period. Simply divide your account value by $1,000 (for example, an $8,600 account value divided by $1,000=8.6), then multiply the result by the number in the first line under the heading entitled “Expenses Paid” to estimate the expenses you paid on your account during this period.
Hypothetical Example for Comparison Purposes — The second line under each share class in the table below provides information about hypothetical account values and hypothetical expenses based on the Fund's actual net expense ratio and an assumed rate of return of 5% per year before expenses, which is not the Fund's actual return. The hypothetical account values and expenses may not be used to estimate the actual ending account balance or expenses you paid for the period. You may use this information to compare the ongoing costs of investing in the Fund and other funds. To do so, compare this 5% hypothetical example with the 5% hypothetical examples that appear in the shareholder reports of the other funds.
Please note that the expenses shown in the table are meant to highlight your ongoing costs only. As a shareholder of the Fund, you do not incur any transaction costs, such as sales charges, redemption fees, or exchange fees, but shareholders of other funds may incur such costs. The second line of the table is useful in comparing ongoing costs only, and will not help you determine the relative total costs of owning different funds whose shareholders may incur transaction costs.
| Share Class | Beginning Account Value 01/01/16 | Ending Account Value | Expenses Paid for the 6 Months Ended 06/30/16* | |||||||||
| Institutional | ||||||||||||
| Actual | $ | 1,000 | $ | 1,011.70 | $ | 3.70 | ||||||
| Hypothetical 5% return | 1,000 | 1,021.18 | + | 3.72 | ||||||||
| Service | ||||||||||||
| Actual | 1,000 | 1,009.60 | 4.95 | |||||||||
| Hypothetical 5% return | 1,000 | 1,019.94 | + | 4.97 | ||||||||
| * | Expenses are calculated using the Fund’s annualized net expense ratio for each class, which represents the ongoing expenses as a percentage of net assets for the six months ended June 30, 2016. Expenses are calculated by multiplying the annualized net expense ratio by the average account value for the period; then multiplying the result by the number of days in the most recent fiscal half year; and then dividing that result by the number of days in the fiscal year. The annualized net expense ratios for the period were 0.74% and 0.99% for the Institutional and Service Shares, respectively. |
| + | Hypothetical expenses are based on the Fund’s actual annualized net expense ratios and an assumed rate of return of 5% per year before expenses. |
20
GOLDMAN SACHS VARIABLE INSURANCE TRUST LARGE CAP VALUE FUND
Statement Regarding Basis for Approval of Management Agreement (Unaudited)
Background
The Goldman Sachs Large Cap Value Fund (the “Fund”) is an investment portfolio of Goldman Sachs Variable Insurance Trust (the “Trust”). The Board of Trustees oversees the management of the Trust and reviews the investment performance and expenses of the Fund at regularly scheduled meetings held throughout the year. In addition, the Board of Trustees determines annually whether to approve the continuance of the Trust’s investment management agreement (the “Management Agreement”) with Goldman Sachs Asset Management, L.P. (the “Investment Adviser”) on behalf of the Fund.
The Management Agreement was most recently approved for continuation until June 30, 2017 by the Board of Trustees, including those Trustees who are not parties to the Management Agreement or “interested persons” (as defined in the Investment Company Act of 1940, as amended) of any party thereto (the “Independent Trustees”), at a meeting held on June 15-16, 2016 (the “Annual Meeting”).
The review process undertaken by the Trustees spans the course of the year and culminates with the Annual Meeting. To assist the Trustees in their deliberations, the Trustees have established a Contract Review Committee (the “Committee”), comprised of the Independent Trustees. The Committee held three meetings over the course of the year since the Management Agreement was last approved. At those Committee meetings, regularly scheduled Board or other committee meetings, and/or the Annual Meeting, matters relevant to the renewal of the Management Agreement were considered by the Board, or the Independent Trustees, as applicable. With respect to the Fund, such matters included:
| (a) | the nature and quality of the advisory, administrative, and other services provided to the Fund by the Investment Adviser and its affiliates, including information about: |
| (i) | the structure, staff, and capabilities of the Investment Adviser and its portfolio management teams; |
| (ii) | the groups within the Investment Adviser and its affiliates that support the portfolio management teams or provide other types of necessary services, including fund services groups (e.g., accounting and financial reporting, tax, shareholder services, and operations); controls and risk management groups (e.g., legal, compliance, valuation oversight, credit risk management, internal audit, compliance testing, market risk analysis, finance, and central funding); sales and distribution support groups, and others (e.g., information technology and training); |
| (iii) | trends in employee headcount; |
| (iv) | the Investment Adviser’s financial resources and ability to hire and retain talented personnel and strengthen its operations; and |
| (v) | the parent company’s support of the Investment Adviser and its mutual fund business, as expressed by the firm’s senior management; |
| (b) | information on the investment performance of the Fund, including comparisons to the performance of similar mutual funds, as provided by a third-party mutual fund data provider engaged as part of the contract review process (the “Outside Data Provider”), a benchmark performance index, a composite of accounts with comparable investment strategies managed by the Investment Adviser and general investment outlooks in the markets in which the Fund invests; |
| (c) | information provided by the Investment Adviser indicating the Investment Adviser’s views on whether the Fund’s peer group and/or benchmark index had high, medium, or low relevance given the Fund’s particular investment strategy; |
| (d) | the terms of the Management Agreement and other agreements with affiliated service providers entered into by the Trust on behalf of the Fund; |
| (e) | fee and expense information for the Fund, including: |
| (i) | the relative management fee and expense level of the Fund as compared to those of comparable funds managed by other advisers, as provided by the Outside Data Provider; |
| (ii) | the Fund’s expense trends over time; and |
| (iii) | to the extent the Investment Adviser manages other types of accounts (such as bank collective trusts, private wealth management accounts, institutional separate accounts, sub-advised mutual funds, and non-U.S. funds) having investment objectives and policies similar to those of the Fund, comparative information on the advisory fees charged and services provided to those accounts by the Investment Adviser; |
| (f) | with respect to the extensive investment performance and expense comparison data provided by the Outside Data Provider, its processes in producing that data for the Fund; |
| (g) | the undertaking of the Investment Adviser to waive certain fees and to limit certain expenses of the Fund that exceed a specified level; |
| (h) | information relating to the profitability of the Management Agreement and the transfer agency and distribution and service arrangements of the Fund and the Trust as a whole to the Investment Adviser and its affiliates; |
| (i) | whether the Fund’s existing management fee schedule adequately addressed any economies of scale; |
21
GOLDMAN SACHS VARIABLE INSURANCE TRUST LARGE CAP VALUE FUND
Statement Regarding Basis for Approval of Management Agreement (Unaudited) (continued)
| (j) | a summary of the “fall-out” benefits derived by the Investment Adviser and its affiliates from their relationships with the Fund, including the fees received by the Investment Adviser’s affiliates from the Fund for transfer agency, portfolio trading, distribution and other services; |
| (k) | a summary of potential benefits derived by the Fund as a result of its relationship with the Investment Adviser; |
| (l) | information regarding commissions paid by the Fund and broker oversight, an update on the Investment Adviser’s soft dollars practices, other information regarding portfolio trading, and how the Investment Adviser carries out its duty to seek best execution; |
| (m) | the manner in which portfolio manager compensation is determined; and the number and types of accounts managed by the portfolio managers; |
| (n) | the nature and quality of the services provided to the Fund by its unaffiliated service providers, and the Investment Adviser’s general oversight and evaluation (including reports on due diligence) of those service providers as part of the administration services provided under the Management Agreement; and |
| (o) | the Investment Adviser’s processes and policies addressing various types of potential conflicts of interest; its approach to risk management; the annual review of the effectiveness of the Fund’s compliance program; and periodic compliance reports. |
The Trustees also received an overview of the Fund’s distribution arrangements. They received information regarding the Fund’s assets, share purchase and redemption activity, and payment of distribution and service fees by the Fund’s Service Shares. Information was also provided to the Trustees relating to revenue sharing payments made by and services provided by the Investment Adviser and its affiliates to intermediaries that promote the sale, distribution, and/or servicing of Fund shares. The Independent Trustees also discussed the broad range of other investment choices that are available to Fund investors, including the availability of comparable funds managed by other advisers.
The presentations made at the Board and Committee meetings and at the Annual Meeting encompassed the Fund and other mutual funds for which the Board of Trustees has responsibility. In evaluating the Management Agreement at the Annual Meeting, the Trustees relied upon their knowledge, resulting from their meetings and other interactions throughout the year, of the Investment Adviser and its affiliates, their services, and the Fund. In conjunction with these meetings, the Trustees received written materials and oral presentations on the topics covered, and the Investment Adviser addressed the questions and concerns of the Trustees, including concerns regarding the investment performance of certain of the funds they oversee. The Independent Trustees were advised by their independent legal counsel regarding their responsibilities and other regulatory requirements related to the approval and continuation of mutual fund investment management agreements under applicable law. In addition, the Investment Adviser and its affiliates provided the Independent Trustees with a written response to a formal request for information sent on behalf of the Independent Trustees by their independent legal counsel. During the course of their deliberations, the Independent Trustees met in executive sessions with their independent legal counsel, without representatives of the Investment Adviser or its affiliates present.
Nature, Extent, and Quality of the Services Provided Under the Management Agreement
As part of their review, the Trustees considered the nature, extent, and quality of the services provided to the Fund by the Investment Adviser. In this regard, the Trustees considered both the investment advisory services and non-advisory services that are provided by the Investment Adviser and its affiliates. The Trustees noted the transition in the leadership and changes in personnel of various of the Investment Adviser’s portfolio management teams that had occurred in recent periods, and the ongoing recruitment efforts aimed at bringing high quality investment talent to the Investment Adviser. They also noted the Investment Adviser’s commitment to maintaining high quality systems and expending substantial resources to respond to ongoing changes to the regulatory and control environment in which the Fund and its service providers operate, as well as the efforts of the Investment Adviser and its affiliates to combat cyber security risks. The Trustees concluded that the Investment Adviser continued to commit substantial financial and operational resources to the Fund and expressed confidence that the Investment Adviser would continue to do so in the future. The Trustees also recognized that the Investment Adviser had made significant commitments to address regulatory compliance requirements applicable to the Fund and the Investment Adviser and its affiliates.
Investment Performance
The Trustees also considered the investment performance of the Fund. In this regard, they compared the investment performance of the Fund to its peers using rankings and ratings compiled by the Outside Data Provider as of December 31, 2015, and updated performance information prepared by the Investment Adviser using the peer group identified by the Outside Data Provider as of March 31, 2016. The information on the Fund’s investment performance was provided for the one-, three-, five-, and
22
GOLDMAN SACHS VARIABLE INSURANCE TRUST LARGE CAP VALUE FUND
Statement Regarding Basis for Approval of Management Agreement (Unaudited) (continued)
ten-year periods ending on the applicable dates. The Trustees also reviewed the Fund’s investment performance relative to its performance benchmark. As part of this review, they considered the investment performance trends of the Fund over time, and reviewed the investment performance of the Fund in light of its investment objective and policies and market conditions. The Trustees also received information comparing the Fund’s performance to that of a composite of accounts with comparable investment strategies managed by the Investment Adviser.
In addition, the Trustees considered materials prepared and presentations made by the Investment Adviser’s senior management and portfolio management personnel in which Fund performance was assessed. The Trustees also considered the Investment Adviser’s periodic reports with respect to the Fund’s risk profile, and how the Investment Adviser’s approach to risk monitoring and management influences portfolio management.
The Trustees noted that the Fund’s Institutional Shares had placed in the third quartile of the Fund’s peer group for the three-, five-, and ten-year periods and in the fourth quartile for the one-year period, and had underperformed the Fund’s benchmark index for the one-, three-, five-, and ten-year periods ended March 31, 2016.
Costs of Services Provided and Competitive Information
The Trustees considered the contractual terms of the Management Agreement and the fee rates payable by the Fund thereunder. In this regard, the Trustees considered information on the services rendered by the Investment Adviser to the Fund, which included both advisory and administrative services that were directed to the needs and operations of the Fund as a registered mutual fund.
In particular, the Trustees reviewed analyses prepared by the Outside Data Provider regarding the expense rankings of the Fund. The analyses provided a comparison of the Fund’s management fee and breakpoints to those of a relevant peer group and category universe; an expense analysis which compared the Fund’s overall net and gross expenses to a peer group and a category universe; and a five-year history comparing the Fund’s net expenses to the peer and category medians. The analyses also compared the Fund’s transfer agency, custody, and distribution fees, other expenses and fee waivers/reimbursements to those of the peer group and category medians. The Trustees concluded that the comparisons provided by the Outside Data Provider were useful in evaluating the reasonableness of the management fee and total expenses paid by the Fund.
In addition, the Trustees considered the Investment Adviser’s undertaking to waive a portion of its management fee and to limit certain expenses of the Fund that exceed a specified level. The Trustees also noted that certain changes were being made to existing fee waiver or expense limitation arrangements of the Fund that would have the effect of decreasing total Fund expenses, with such changes taking effect in connection with the Fund’s next annual registration statement update. They also considered, to the extent that the Investment Adviser manages other types of accounts having investment objectives and policies similar to those of the Fund, comparative fee information for services provided by the Investment Adviser to those accounts, and information that indicated that services provided to the Fund differed in various significant respects from the services provided to other types of accounts which, in many cases, operated under less stringent legal and regulatory structures, required fewer services from the Investment Adviser to a smaller number of client contact points, and were less time-intensive.
In addition, the Trustees noted that shareholders are able to redeem their Fund shares at any time if shareholders believe that the Fund fees and expenses are too high or if they are dissatisfied with the performance of the Fund.
Profitability
The Trustees reviewed the Investment Adviser’s revenues and pre-tax profit margins with respect to the Trust and the Fund. In this regard the Trustees noted that they had received, among other things, profitability analyses and summaries, revenue and expense schedules by Fund and by function (i.e., investment management, transfer agency and distribution and service), and information on the Investment Adviser’s expense allocation methodology. They observed that the profitability and expense figures are substantially similar to those used by the Investment Adviser for many internal purposes, including compensation decisions among various business groups, and are thus subject to a vigorous internal debate about how certain revenue and expenses should be allocated. The Trustees also noted that the internal audit group within the Goldman Sachs organization had audited the expense allocation methodology and was satisfied with the reasonableness, consistency, and accuracy of the Investment Adviser’s expense allocation methodology and profitability analysis calculations. Profitability data for the Trust and the Fund were provided for 2015 and 2014, and the Trustees considered this information in relation to the Investment Adviser’s overall profitability. The Trustees considered the Investment Adviser’s revenues and pre-tax profit margins both in absolute terms and in comparison to information on the reported pre-tax profit margins earned by certain other asset management firms.
23
GOLDMAN SACHS VARIABLE INSURANCE TRUST LARGE CAP VALUE FUND
Statement Regarding Basis for Approval of Management Agreement (Unaudited) (continued)
Economies of Scale
The Trustees considered the information that had been provided regarding the Investment Adviser’s profitability. The Trustees also considered the breakpoints in the fee rate payable under the Management Agreement for the Fund at the following annual percentage rates of the average daily net assets of the Fund:
| First $1 billion | 0.75 | % | ||
| Next $1 billion | 0.68 | |||
| Next $3 billion | 0.65 | |||
| Next $3 billion | 0.64 | |||
| Over $8 billion | 0.63 |
The Trustees noted that the breakpoints were designed to share potential economies of scale, if any, with the Fund and its shareholders as assets under management reach those asset levels. The Trustees considered the amounts of assets in the Fund; the Fund’s recent share purchase and redemption activity; the information provided by the Investment Adviser relating to the costs of the services provided by the Investment Adviser and its affiliates and their realized profits; information comparing fee rates charged by the Investment Adviser with fee rates charged to other funds in the peer group; and the Investment Adviser’s undertaking to waive a portion of its management fee and to limit certain expenses of the Fund that exceed a specified level. Upon reviewing these matters at the Annual Meeting, the Trustees concluded that the fee breakpoints represented a means of assuring that benefits of scalability, if any, would be passed along to shareholders at the specified asset levels.
Other Benefits to the Investment Adviser and Its Affiliates
The Trustees also considered the other benefits derived by the Investment Adviser and its affiliates from their relationships with the Fund as stated above, including: (a) transfer agency fees received by Goldman, Sachs & Co. (“Goldman Sachs”); (b) brokerage and futures commissions earned by Goldman Sachs for executing securities and futures transactions on behalf of the Fund; (c) research received by the Investment Adviser from broker-dealers in exchange for executing certain transactions on behalf of the Fund; (d) trading efficiencies resulting from aggregation of orders of the Fund with those for other funds or accounts managed by the Investment Adviser; (e) the Investment Adviser’s ability to leverage the infrastructure designed to service the Fund on behalf of its other clients; (f) the Investment Adviser’s ability to cross-market other products and services to Fund shareholders; (g) Goldman Sachs’ retention of certain fees as Fund Distributor; (h) the Investment Adviser’s ability to negotiate better pricing with custodians on behalf of its other clients, as a result of the relationship with the Fund; and (i) the possibility that the working relationship between the Investment Adviser and the Fund’s third-party service providers may cause those service providers to be more likely to do business with other areas of Goldman Sachs. In the course of considering the foregoing, the Independent Trustees requested and received further information quantifying certain of these fall-out benefits.
Other Benefits to the Fund and Its Shareholders
The Trustees also noted that the Fund receives certain potential benefits as a result of its relationship with the Investment Adviser, including: (a) trading efficiencies resulting from aggregation of orders of the Fund with those of other funds or accounts managed by the Investment Adviser; (b) enhanced servicing from vendors because of the volume of business generated by the Investment Adviser and its affiliates; (c) enhanced servicing from broker-dealers because of the volume of business generated by the Investment Adviser and its affiliates; (d) the Investment Adviser’s ability to negotiate favorable terms with derivatives counterparties on behalf of the Fund as a result of the size and reputation of the Goldman Sachs organization; (e) the Investment Adviser’s knowledge and experience gained from managing other accounts and products; (f) the Investment Adviser’s ability to hire and retain qualified personnel to provide services to the Fund because of the reputation of the Goldman Sachs organization; (g) the Fund’s access, through the Investment Adviser, to certain firmwide resources (e.g., proprietary risk management systems and databases), subject to certain restrictions; and (h) the Fund’s access to certain affiliated distribution channels. In addition, the Trustees noted the competitive nature of the mutual fund marketplace, and considered that many of the Fund’s shareholders invested in the Fund in part because of the Fund’s relationship with the Investment Adviser and that those shareholders have a general expectation that the relationship will continue.
Conclusion
In connection with their consideration of the Management Agreement, the Trustees gave weight to each of the factors described above, but did not identify any particular factor as controlling their decision. After deliberation and consideration of all of
24
GOLDMAN SACHS VARIABLE INSURANCE TRUST LARGE CAP VALUE FUND
Statement Regarding Basis for Approval of Management Agreement (Unaudited) (continued)
the information provided, including the factors described above, the Trustees concluded, in the exercise of their business judgment, that the management fees paid by the Fund were reasonable in light of the services provided to it by the Investment Adviser, the Investment Adviser’s costs and the Fund’s current and reasonably foreseeable asset levels. The Trustees unanimously concluded that the Investment Adviser’s continued management likely would benefit the Fund and its shareholders and that the Management Agreement should be approved and continued with respect to the Fund until June 30, 2017.
25
| TRUSTEES | OFFICERS | |
| Ashok N. Bakhru, Chairman | James A. McNamara, President | |
| Kathryn A. Cassidy | Scott M. McHugh, Principal Financial Officer, | |
| Diana M. Daniels | Senior Vice President and Treasurer | |
| Herbert J. Markley | Caroline L. Kraus, Secretary | |
| James A. McNamara | ||
| Jessica Palmer | ||
| Alan A. Shuch | ||
| Roy W. Templin | ||
| Gregory G. Weaver |
GOLDMAN, SACHS & CO.
Distributor and Transfer Agent
GOLDMAN SACHS ASSET MANAGEMENT, L.P.
Investment Adviser
200 West Street, New York
New York 10282
Visit our web site at www.GSAMFUNDS.com to obtain the most recent month-end returns.
The reports concerning the Fund included in this shareholder report may contain certain forward-looking statements about the factors that may affect the performance of the Fund in the future. These statements are based on Fund management’s predictions and expectations concerning certain future events and their expected impact on the Fund, such as performance of the economy as a whole and of specific industry sectors, changes in the levels of interest rates, the impact of developing world events, and other factors that may influence the future performance of the Fund. Management believes these forward-looking statements to be reasonable, although they are inherently uncertain and difficult to predict. Actual events may cause adjustments in portfolio management strategies from those currently expected to be employed.
A description of the policies and procedures that the Fund uses to determine how to vote proxies relating to portfolio securities and information regarding how the Fund voted proxies relating to portfolio securities for the 12-month period ended June 30 is available (i) without charge, upon request by calling 1-800-621-2550; and (ii) on the Securities and Exchange Commission (“SEC”) web site at http://www.sec.gov.
The Fund files its complete schedule of portfolio holdings with the SEC for the first and third quarters of each fiscal year on Form N-Q. The Fund’s Form N-Qs are available on the SEC’s web site at http://www.sec.gov within 60 days after the Fund’s first and third fiscal quarters. The Fund’s Form N-Qs may be reviewed and copied at the SEC’s Public Reference Room in Washington, D.C. and information on the operation of the Public Reference Room may also be obtained by calling 1-800-SEC-0330. Form N-Qs may be obtained upon request and without charge by calling 1-800-621-2550.
The website links provided are for your convenience only and are not an endorsement or recommendation by GSAM of any of these websites or the products or services offered. GSAM is not responsible for the accuracy and validity of the content of these websites.
Fund holdings and allocations shown are as of June 30, 2016 and may not be representative of future investments. Fund holdings should not be relied on in making investment decisions and should not be construed as research or investment advice regarding particular securities. Current and future holdings are subject to risk.
References to indices, benchmarks or other measures of relative market performance over a specified period of time are provided for your information only and do not imply that the portfolio will achieve similar results. The index composition may not reflect the manner in which a portfolio is constructed. While an adviser seeks to design a portfolio which reflects appropriate risk and return features, portfolio characteristics may deviate from those of the benchmark.
The Global Industry Classification Standard (“GICS”) was developed by and is the exclusive property and a service mark of Morgan Stanley Capital International Inc. (“MSCI”) and Standard & Poor’s, a division of The McGraw-Hill Companies, Inc. (“S&P”) and is licensed for use by Goldman Sachs. Neither MSCI, S&P nor any other party involved in making or compiling the GICS or any GICS classifications makes any express or implied warranties or representations with respect to such standard or classification (or the results to be obtained by the use thereof), and all such parties hereby expressly disclaim all warranties of originality, accuracy, completeness, merchantability or fitness for a particular purpose with respect to any of such standard or classification. Without limiting any of the foregoing, in no event shall MSCI, S&P, any of their affiliates or any third party involved in making or compiling the GICS or any GICS classifications have any liability for any direct, indirect, special, punitive, consequential or any other damages (including lost profits) even if notified of the possibility of such damages.
The portfolio risk management process includes an effort to monitor and manage risk, but does not imply low risk.
Shares of the Goldman Sachs VIT Funds are offered to separate accounts of participating life insurance companies for the purpose of funding variable annuity contracts and variable life insurance policies. Shares of the Fund are not offered directly to the general public. The variable annuity contracts and variable life insurance policies are described in the separate prospectuses issued by participating insurance companies. You should refer to those prospectuses for information about surrender charges, mortality and expense risk fees and other charges that may be assessed by participating insurance companies under the variable annuity contracts or variable life insurance policies. Such fees or charges, if any, may affect the return you may realize with respect to your investments. Ask your representative for more complete information. Please consider a fund’s objectives, risks and charges and expenses, and read the prospectus carefully before investing. The prospectus contains this and other information about the Fund.
This material is not authorized for distribution to prospective investors unless preceded or accompanied by a current Prospectus or summary prospectus, if applicable. Investors should consider a Fund’s objective, risks, and charges and expenses, and read the summary prospectus, if available, and/or the Prospectus carefully before investing or sending money. The summary prospectus, if available, and the Prospectus contain this and other information about a Fund and may be obtained from your Authorized Institution or from Goldman, Sachs & Co. by calling 1-800-621-2550.
This report is prepared for the general information of contract owners and is not an offer of shares of the Goldman Sachs Variable Insurance Trust: Goldman Sachs Large Cap Value Fund.
Goldman, Sachs & Co. is the distributor of the Goldman Sachs Funds and the Goldman Sachs Variable Insurance Trust Funds.
© 2016 Goldman Sachs. All rights reserved.
VITLCVSAR-16/58885-TMPL-08/2016/72.6K
Goldman
Sachs Variable Insurance Trust
Goldman Sachs
Mid Cap Value Fund
Semi-Annual Report
June 30, 2016

GOLDMAN SACHS VARIABLE INSURANCE TRUST MID CAP VALUE FUND
INVESTMENT OBJECTIVE
The Fund seeks long-term capital appreciation.
Portfolio Management Discussion and Analysis
Below, the Goldman Sachs Value Portfolio Management Team discusses the Goldman Sachs Variable Insurance Trust — Goldman Sachs Mid Cap Value Fund’s (the “Fund”) performance and positioning for the six-month period ended June 30, 2016 (the “Reporting Period”).
How did the Fund perform during the Reporting Period?
During the Reporting Period, the Fund’s Institutional and Service Shares generated cumulative total returns of 3.80% and 3.72%, respectively. These returns compare to the 8.87% cumulative total return of the Fund’s benchmark, the Russell Midcap® Value Index (with dividends reinvested) (the “Russell Index”), during the same time period.
What economic and market factors most influenced the equity markets as a whole during the Reporting Period?
Representing the U.S. equity market, the S&P 500® Index gained 3.84% during the Reporting Period.
As the Reporting Period began in January 2016, U.S. equities were embroiled in a global rout, triggered by investor concerns about an intensifying economic slowdown in China and exacerbated by an oil price plunge. Following a December 2015 interest rate hike, the January 2016 Federal Reserve (“Fed”) statement acknowledged these external risks and tightening financial conditions. U.S. equities stabilized in February 2016, as market sentiment improved on the more dovish tone set by global central banks. (Dovish language tends to suggest lower interest rates.) U.S. equities were also supported by stronger economic data, rallying as fourth quarter U.S. Gross Domestic Product (“GDP”) came in above consensus expectations. In March 2016, the Fed kept interest rates on hold and surprised on the dovish side, reducing its forecast to two interest rate hikes in 2016, down from four. Along with receding global economic concerns, we believe this helped to drive a recovery in U.S. equities. Released in March 2016, February 2016 unemployment data came in ahead of market consensus, with unemployment steady at 4.9% in spite of higher participation rates and declining underemployment.
Following the rebound in March 2016, market sentiment appeared to remain sanguine in April 2016, as oil prices rose and China’s economic growth concerns abated. U.S. equities fell near the end of the month as investors were disappointed by a lack of additional stimulus from the Bank of Japan and by a weaker than consensus expected first quarter U.S. GDP rate of 0.5%. Hawkish Fed minutes released in May 2016 temporarily revived market expectations for a Fed interest rate hike in June 2016, but weaker than expected May 2016 payroll data subsequently drove such expectations lower. (Hawkish language tends to suggest higher interest rates; opposite of dovish.) The Fed ultimately held interest rates steady in June 2016 and signaled a slower pace of hikes, acknowledging the slowdown in the labor market. Markets were otherwise dominated in June 2016 by the U.K. referendum on membership in the European Union, popularly known as Brexit. U.S. equities sold off in the global risk-off in June 2016 following the surprise “leave” result. Markets rebounded in the latter days of the month owing to improving risk sentiment as markets digested the Brexit vote outcome and on dovish remarks from Bank of England Governor Carney.
For the Reporting Period overall, telecommunication services and utilities were the best performing sectors in the S&P 500 Index by a wide margin. Energy and consumer staples also posted double-digit gains. The energy sector was the largest positive contributor to S&P 500 Index returns, as measured by weight times performance. The weakest performing sectors in the S&P 500 Index during the Reporting Period were financials and information technology, the only two to post negative absolute returns, followed by consumer discretionary and health care, which were also weak but generated modestly positive returns during the Reporting Period.
Within the U.S. equity market, there was significant disparity in performance not only among sectors but also among the various capitalization and style segments. While all capitalization segments posted positive returns, mid-cap stocks, as measured by the Russell Midcap® Index, performed best, followed by large-cap stocks, as measured by the Russell 1000® Index, and then, small-cap stocks, as measured by the Russell 2000® Index. From a style perspective, value-oriented stocks significantly outpaced growth-oriented stocks across the capitalization spectrum. Value outperformed relative to growth during the Reporting Period primarily due to weaker performance of the growth-oriented health care sector. (All as measured by the Russell Investments indices.)
1
GOLDMAN SACHS VARIABLE INSURANCE TRUST MID CAP VALUE FUND
What key factors were responsible for the Fund’s performance during the Reporting Period?
While the Fund posted positive absolute returns, it underperformed the Russell Index on a relative basis. Stock selection had the greatest effect on the Fund’s performance relative to the Russell Index during the Reporting Period.
Which equity market sectors most significantly affected Fund performance?
Detracting from the Fund’s relative results most was stock selection in the financials, materials and industrials sectors. Such detractors were only partially offset by effective stock selection in the energy sector, the only sector to contribute positively to the Fund’s performance relative to the Russell Index during the Reporting Period.
Which stocks detracted significantly from the Fund’s performance during the Reporting Period?
Detracting from the Fund’s results relative to its benchmark index were positions in consumer and commercial banking company Citizens Financial Group, over-the-counter pharmaceuticals manufacturer Perrigo and life insurance company Lincoln National.
During the Reporting Period, Citizens Financial Group’s stock performed poorly despite the company reporting solid fourth quarter 2015 earnings and announcing an in-line with consensus 2016 outlook. The majority of its weakness appeared to be driven by the company’s sensitivity to interest rates, as the trajectory of future rate expectations flattened during the Reporting Period due to a more dovish posture from central banks and tempered global economic growth expectations. Despite its recent weakness, at the end of the Reporting Period, we believed its management could improve the bank’s operational efficiency through its cost savings program. Additionally, we believed Citizens Financial Group was attractively valued relative to its peers and had a strong management team committed to enhancing shareholder value over time.
Shares of Perrigo, a new position for the Fund during the Reporting Period, fell after the company reported first quarter 2016 earnings below consensus expectations and lowered its future guidance. Despite these headwinds, at the end of the Reporting Period, we remained constructive on the company given its exposure to what we view as multiple secular growth tailwinds, including aging demographics and increasing store-brand over-the counter penetration. Additionally, we believe the company’s strong cash flow generation can be used to repurchase shares or make strategic acquisitions, while its robust pipeline and international expansion opportunities could support incremental revenue growth. However, following a change in management and an increasingly challenging pricing environment, we trimmed the position to better reflect how we viewed its risk/return profile.
Life insurers came under pressure during the Reporting Period as a result of lowered consensus expectations for the trajectory of long-term interest rates and an impending Department of Labor ruling that has proposed introducing fiduciary standards into the retirement industry. Additionally, weaker than expected fourth quarter 2015 earnings, driven by lower than expected alternative investment income and a decline in variable annuity production, caused Lincoln National’s stock to decline. At the end of the Reporting Period, we maintained a constructive view on the company’s strategy to shift sales to lower risk products and believed its strong risk management practices may well result in the market having greater confidence in its return on equity sustainability, potentially leading to a higher valuation for Lincoln National’s stock.
What were some of the Fund’s best-performing individual stocks?
The Fund benefited most relative to the Russell Index from positions in Newfield Exploration, Martin Marietta Materials and Cheniere Energy.
The Fund’s investment in Newfield Exploration, an oil-focused exploration and production company, was a top contributor to its relative performance during the Reporting Period. Aside from a rebound in oil prices, its stock reacted positively to news of the company’s acquisition of additional acreage in the Sooner Trend Anadarko Basin Canadian and Kingfisher Counties (“STACK”) play, or area of operations. Newfield Exploration has identified more than 1,000 potential drilling locations within the new acreage. Following the acquisition, the company raised its production guidance for the second quarter of 2016 and for the full calendar year. Additionally, the company benefited from positive data points surrounding well production in the STACK play. At the end of the Reporting Period, we believed the company would likely benefit from its strategy of selling non-core assets and investing a higher percentage of its capital in core acreage with higher production growth potential. Finally, we believed investor interest in the STACK play, where the majority of the company’s assets are located, should continue to gain traction if data points continue to show improving well results.
Martin Marietta Materials, a supplier of construction aggregates and heavy building materials, performed well. The company benefited from a positive backdrop in which construction trends in Texas, where the company has significant exposure, have been strong. Pricing has been a key contributor to its positive earnings trajectory and margin expansion. We originally initiated the Fund’s position in the company’s stock because we believed Martin Marietta Materials was a high quality company with the ability
2
GOLDMAN SACHS VARIABLE INSURANCE TRUST MID CAP VALUE FUND
to expand margins, both in its core business and as the company integrates recent acquisitions. We maintained this view at the end of the Reporting Period.
Cheniere Energy, a new purchase for the Fund during the Reporting Period, is an energy company primarily engaged in liquefied natural gas (“LNG”) businesses. We felt that some of the uncertainty in the name was lifted after the company shipped the first ever cargo of U.S. LNG from its Sabine Pass liquefaction and export facility in Louisiana. Stronger commodity prices as the Reporting Period progressed also supported the stock. As one of the largest LNG exporters in the world, we were positive on the company’s market position in an industry with what we view as compelling secular growth potential. Additionally, the majority of Cheniere Energy’s capacity is contracted in long-term take-or-pay agreements with investment grade rated counterparties, making the company’s cash flow highly visible. Given the company’s strong performance since the Fund’s time of purchase, we opted to sell the Fund’s position in its stock by the end of the Reporting Period, taking profits.
How did the Fund use derivatives and similar instruments during the Reporting Period?
During the Reporting Period, we did not use derivatives as part of an active management strategy.
Did the Fund make any significant purchases or sales during the Reporting Period?
We initiated a Fund position in Synchrony Financial, a consumer financial services company, following its exchange offer from General Electric (“GE”). We believe the company’s transition out of GE’s majority ownership and into a stand-alone public company should enable meaningful internal investments to drive future growth. In addition, we believe Synchrony Financial is well positioned to capitalize on industry-wide accelerating credit card receivable growth from a healthy U.S. consumer and the company’s long-term contracts with major partners should limit downside surprises.
We established a Fund position in Nucor, a steel products manufacturer. In our view, Nucor has the most latent capacity and is among the lowest cost domestic producers of steel and thus has the greatest market share gain potential. Any market share gains should further expand its margins, as taking share from imports and shut-in domestic capacity could lead to higher operating rates. We believe Nucor also has more exposure to construction and infrastructure-oriented steel products than its peers, areas where we see growth opportunities. Further, Nucor, in our view, has made good capital allocation decisions over time. The company has raised its dividend every year since 1973 and has what we consider to be a compelling net debt/earnings before interest, taxes, depreciation and amortization (“EBITDA”) ratio, potentially enabling the company to invest in internal growth projects or acquire assets to further consolidate its domestic market. Finally, from a broader perspective, we believe the supply/demand dynamics for steel could see incremental improvement going forward. Approximately 20% to 25% of North American steel supply was cut late in 2015 through a combination of blocking imports from China and closing high cost domestic capacity. This has created a tight steel market in North America, which may support higher prices. Also, China began addressing its significant overcapacity in steel late in 2015 through announced supply cuts that we believe should gradually improve the global supply/demand balance.
We exited the Fund’s position in ProLogis, a global owner, operator and developer of industrial logistics properties. We had believed that Prologis was positioned to benefit from improving occupancy and rental rate growth supported by strong demand fundamentals. Additionally, we were positive on the company’s attractive valuation and capable management team. As our investment thesis played out and the company’s market capitalization appreciated, we sold the position in favor of opportunities where we saw more attractive risk-adjusted return potential.
We sold the Fund’s position in Ralph Lauren. After two years of significant investments and restructuring in the business, we believed Ralph Lauren was poised to see significant operating margin expansion over the next few years, along with robust sales expansion, particularly in international markets. A new Chief Executive Officer (“CEO”) was appointed last year, and we believed his appointment would help reinvigorate the brand and the core operations of the business. Instead, the CEO announced a new restructuring program focused on shrinking underperforming parts of Ralph Lauren’s distribution network. While we continue to believe that Ralph Lauren is a strong brand with significant future opportunities, we became incrementally less positive on the newly announced restructuring program and therefore the pace of the company’s transition. We ultimately decided to transition capital from the sale of its shares into higher conviction names where we saw more attractive risk/reward profiles.
Were there any notable changes in the Fund’s weightings during the Reporting Period?
In constructing the Fund’s portfolio, we focus on picking stocks rather than on making industry or sector bets. We seek to outpace the benchmark index by overweighting stocks that we expect to outperform and underweighting those that we think may lag. Consequently, changes in its sector weights are generally the direct result of individual stock selection or of stock appreciation or depreciation. That said, during the Reporting Period, the Fund’s exposure to health care and utilities increased compared to the Russell Index. The Fund’s allocations compared to the benchmark index in consumer discretionary and financials decreased.
3
GOLDMAN SACHS VARIABLE INSURANCE TRUST MID CAP VALUE FUND
How was the Fund positioned relative to its benchmark index at the end of the Reporting Period?
At the end of June 2016, the Fund had overweighted positions relative to the Russell Index in the health care, consumer staples and information technology sectors. On the same date, the Fund had underweighted positions compared to the Russell Index in financials and industrials and was rather neutrally weighted to the Russell Index in consumer discretionary, energy, materials and utilities. The Fund had no exposure to telecommunication services at the end of the Reporting Period.
Were there any changes to the Fund’s portfolio management team during the Reporting Period?
Effective June 30, 2016, Andrew Braun, Managing Director and Portfolio Manager on the U.S. Value Equity Team for the Mid and Large Cap Value strategies, left the firm.
The U.S. Value Equity Team continues to be led by Sean Gallagher. Sean has 23 years of investing experience and has been the Head of the U.S. Value Equity Team and Chief Investment Officer since 2009. He joined Goldman Sachs in 2000. Sean continues to lead a well-resourced and talented team of investment professionals. The U.S. Value Equity Team consists of more than 25 investment professionals, including 15 portfolio managers averaging more than 17 years of investment experience.
What is the Fund’s tactical view and strategy for the months ahead?
As we enter the second half of 2016, we continue to see what we believe are opportunities across the U.S. equity markets. While our aggregate return expectations are lower than in recent years given slow economic growth and a dearth of outright cheap valuations, we believe equities still looked more attractive at the end of the Reporting Period than most other asset classes. At the same time, we recognize the increased risk from rising geopolitical tensions. Accordingly, we favor high quality, domestically-oriented companies. In an environment with lower expected absolute returns, we believe an active approach is paramount for generating strong performance.
Regardless of market direction, our fundamental, bottom-up stock selection continues to drive our process, rather than headlines or sentiment. We maintain high conviction in the companies the Fund owns and believe they have the potential to outperform relative to the broader market regardless of economic growth conditions. We continue to focus on undervalued companies that we believe have comparatively greater control of their own destiny, such as innovators with differentiated products, companies with low cost structures or companies that have been investing in their own businesses and may be poised to gain market share. We maintain our discipline in identifying companies with what we believe to be strong or improving balance sheets, led by quality management teams and trading at discounted valuations. We remain focused on the long-term performance of the Fund.
4
GOLDMAN SACHS VARIABLE INSURANCE TRUST MID CAP VALUE FUND
Index Definitions
The Russell Midcap Value® Index is an unmanaged index of common stock prices that measures the performance of those Russell Midcap companies with lower price-to-book ratios and lower forecasted growth values. The Index figures do not reflect any deduction for fees, expenses or taxes. It is not possible to invest directly in an index.
The Russell 2000® Index (with dividends reinvested) is an unmanaged index of common stock prices that measures the performance of the 2000 smallest companies in the Russell 3000® Index. The figures for the Index do not include any deduction for fees, expenses or taxes. It is not possible to invest directly in an index.
The S&P 500® Index (with dividends reinvested) is the Standard & Poor’s 500 Composite Index of 500 stocks, an unmanaged index of common stock prices. The figures for the Index do not include any deduction for fees, expenses or taxes. It is not possible to invest directly in an index.
The Russell Midcap® Index measures the performance of the 800 smallest companies in the Russell 1000® Index, which represent approximately 25% of the total market capitalization of the Russell 1000 Index. It is not possible to invest directly in an index.
The Russell 1000® Index measures the performance of the 1,000 largest companies in the Russell 3000® Index, which represents approximately 92% of the total market capitalization of the Russell 3000 Index. It is not possible to invest directly in an index.
5
FUND BASICS
Mid Cap Value Fund
as of June 30, 2016
STANDARDIZED TOTAL RETURNS1
| For the period ended 6/30/16 | One Year | Five Years | Ten Years | Since Inception | Inception Date | |||||||||||||
| Institutional | -5.73 | % | 8.24 | % | 6.58 | % | 8.39 | % | 5/01/98 | |||||||||
| Service | -5.98 | 7.98 | 6.33 | 6.23 | 1/09/06 | |||||||||||||
| 1 | The Standardized Total Returns are average annual total returns as of the most recent calendar quarter-end. They assume reinvestment of all distributions at net asset value (“NAV”). Because Institutional Shares and Service Shares do not involve a sales charge, such a charge is not applied to their Standardized Total Returns. |
Total return figures in the above chart represent past performance and do not indicate future results, which will vary. The investment return and principal value of an investment will fluctuate and, therefore, an investor’s shares, when redeemed, may be worth more or less than their original cost. Current performance may be lower or higher than the total return figures in the above chart. Please visit www.GSAMFUNDS.com to obtain the most recent month-end returns. Performance reflects fee waivers and/or expense limitations in effect during the periods shown. In their absence, performance would be reduced.
EXPENSE RATIOS2
| Net Expense Ratio (Current) | Gross Expense Ratio (Before Waivers) | |||||||
| Institutional | 0.84 | % | 0.87 | % | ||||
| Service | 1.09 | 1.12 | ||||||
| 2 | The expense ratios of the Fund, both current (net of any fee waivers or expense limitations) and before waivers (gross of any fee waivers or expense limitations) are as set forth above according to the most recent publicly available Prospectuses for the Fund and may differ from the expense ratios disclosed in the Financial Highlights in this report. Pursuant to a contractual arrangement, the Fund’s waivers and/or expense limitations will remain in place through at least April 29, 2017 and prior to such date the Investment Adviser may not terminate the arrangements without the approval of the Fund’s Board of Trustees. If these arrangements are discontinued in the future, the expense ratios may change without shareholder approval. |
TOP TEN HOLDINGS AS OF 6/30/163
| Holding | % of Net Assets | Line of Business | ||||||||
| Vornado Realty Trust | 2.1% | Real Estate Investment Trusts | ||||||||
| Synchrony Financial | 2.1 | Diversified Financials | ||||||||
| Sempra Energy | 2.0 | Utilities | ||||||||
| Citizens Financial Group, Inc. | 2.0 | Banks | ||||||||
| Zimmer Biomet Holdings, Inc. | 1.9 | Health Care Equipment & Services | ||||||||
| DDR Corp. | 1.7 | Real Estate Investment Trusts | ||||||||
| Huntington Bancshares, Inc. | 1.7 | Banks | ||||||||
| Brixmor Property Group, Inc. | 1.7 | Real Estate Investment Trusts | ||||||||
| Laboratory Corp. of America Holdings | 1.7 | Health Care Equipment & Services | ||||||||
| ConAgra Foods, Inc. | 1.7 | Food, Beverage & Tobacco | ||||||||
| 3 | The top 10 holdings may not be representative of the Fund’s future investments. |
6
FUND BASICS
FUND vs. BENCHMARK SECTOR ALLOCATIONS4
As of June 30, 2016
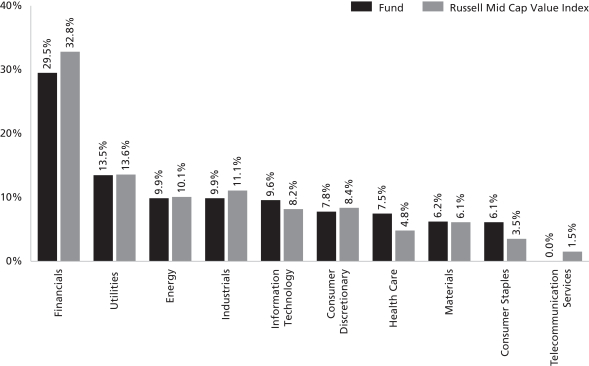
| 4 | The Fund is actively managed and, as such, its composition may differ over time. Consequently, the Fund’s overall sector allocations may differ from percentages contained in the graph above. The graph categorizes investments using Global Industry Classification Standard (“GICS”), however, the sector classifications used by the portfolio management team may differ from GICS. The percentage shown for each investment category reflects the value of investments in that category as a percentage of total market value. The graph depicts the Fund’s investments but may not represent the Fund’s market exposure due to the exclusion of certain derivatives, if any, as listed in the Additional Investment Information section of the Schedule of Investments. |
7
GOLDMAN SACHS VARIABLE INSURANCE TRUST MID CAP VALUE FUND
Schedule of Investments
June 30, 2016 (Unaudited)
Shares | Description | Value | ||||||
| Common Stocks – 95.8% | ||||||||
| Banks – 4.7% |
| ||||||
| 797,564 | Citizens Financial Group, Inc. | $ | 15,935,329 | |||||
| 169,985 | Comerica, Inc. | 6,991,483 | ||||||
| 1,552,380 | Huntington Bancshares, Inc. | 13,878,277 | ||||||
| 39,282 | Zions Bancorporation | 987,157 | ||||||
|
| |||||||
| 37,792,246 | ||||||||
|
| |||||||
| Capital Goods – 7.6% |
| ||||||
| 168,575 | AMETEK, Inc. | 7,793,222 | ||||||
| 120,246 | Fortune Brands Home & Security, Inc. | 6,970,661 | ||||||
| 40,984 | Hubbell, Inc. | 4,322,582 | ||||||
| 200,281 | Ingersoll-Rand PLC | 12,753,894 | ||||||
| 54,903 | L-3 Communications Holdings, Inc. | 8,053,721 | ||||||
| 112,368 | Stanley Black & Decker, Inc. | 12,497,569 | ||||||
| 246,291 | Textron, Inc. | 9,004,399 | ||||||
|
| |||||||
| 61,396,048 | ||||||||
|
| |||||||
| Commercial & Professional Services – 1.9% |
| ||||||
| 78,488 | Nielsen Holdings PLC | 4,079,022 | ||||||
| 156,204 | Waste Connections, Inc. | 11,254,498 | ||||||
|
| |||||||
| 15,333,520 | ||||||||
|
| |||||||
| Consumer Durables & Apparel – 1.2% |
| ||||||
| 176,696 | Hanesbrands, Inc. | 4,440,371 | ||||||
| 161,311 | Mattel, Inc. | 5,047,421 | ||||||
|
| |||||||
| 9,487,792 | ||||||||
|
| |||||||
| Consumer Services – 0.3% |
| ||||||
| 106,381 | MGM Resorts International* | 2,407,402 | ||||||
|
| |||||||
| Diversified Financials – 4.9% |
| ||||||
| 197,392 | Raymond James Financial, Inc. | 9,731,425 | ||||||
| 1,499,875 | SLM Corp.* | 9,269,227 | ||||||
| 679,974 | Synchrony Financial* | 17,189,743 | ||||||
| 132,164 | Voya Financial, Inc. | 3,272,381 | ||||||
|
| |||||||
| 39,462,776 | ||||||||
|
| |||||||
| Energy – 9.5% |
| ||||||
| 185,976 | Anadarko Petroleum Corp. | 9,903,222 | ||||||
| 236,830 | Antero Resources Corp.* | 6,152,843 | ||||||
| 91,248 | Baker Hughes, Inc. | 4,118,022 | ||||||
| 212,296 | Cabot Oil & Gas Corp. | 5,464,499 | ||||||
| 73,848 | Cimarex Energy Co. | 8,811,543 | ||||||
| 799,193 | Encana Corp. | 6,225,714 | ||||||
| 191,297 | FMC Technologies, Inc.* | 5,101,891 | ||||||
| 283,712 | Gulfport Energy Corp.* | 8,868,837 | ||||||
| 248,449 | Newfield Exploration Co.* | 10,976,477 | ||||||
| 75,009 | Pioneer Natural Resources Co. | 11,342,111 | ||||||
|
| |||||||
| 76,965,159 | ||||||||
|
| |||||||
| Food & Staples Retailing – 0.8% |
| ||||||
| 208,788 | Whole Foods Market, Inc. | 6,685,392 | ||||||
|
| |||||||
| Food, Beverage & Tobacco – 4.1% |
| ||||||
| 282,250 | ConAgra Foods, Inc. | 13,494,372 | ||||||
| 66,503 | Dr. Pepper Snapple Group, Inc. | 6,426,185 | ||||||
|
| |||||||
| Common Stocks – (continued) | ||||||||
| Food, Beverage & Tobacco – (continued) |
| ||||||
| 103,004 | Molson Coors Brewing Co. Class B | $ | 10,416,795 | |||||
| 66,115 | The Hain Celestial Group, Inc.* | 3,289,221 | ||||||
|
| |||||||
| 33,626,573 | ||||||||
|
| |||||||
| Health Care Equipment & Services – 5.2% |
| ||||||
| 142,853 | Centene Corp.* | 10,195,419 | ||||||
| 105,553 | Laboratory Corp. of America Holdings* | 13,750,389 | ||||||
| 37,118 | St. Jude Medical, Inc. | 2,895,204 | ||||||
| 128,306 | Zimmer Biomet Holdings, Inc. | 15,445,476 | ||||||
|
| |||||||
| 42,286,488 | ||||||||
|
| |||||||
| Household & Personal Products – 0.9% |
| ||||||
| 85,835 | Edgewell Personal Care Co.* | 7,245,332 | ||||||
|
| |||||||
| Insurance – 5.3% |
| ||||||
| 204,921 | Arthur J. Gallagher & Co. | 9,754,240 | ||||||
| 122,566 | Endurance Specialty Holdings Ltd. | 8,231,532 | ||||||
| 164,726 | Lincoln National Corp. | 6,386,427 | ||||||
| 203,761 | W.R. Berkley Corp. | 12,209,359 | ||||||
| 201,389 | XL Group PLC | 6,708,268 | ||||||
|
| |||||||
| 43,289,826 | ||||||||
|
| |||||||
| Materials – 5.9% |
| ||||||
| 189,842 | Axalta Coating Systems Ltd.* | 5,036,508 | ||||||
| 163,937 | Celanese Corp. Series A | 10,729,677 | ||||||
| 59,156 | Martin Marietta Materials, Inc. | 11,357,952 | ||||||
| 220,000 | Newmont Mining Corp. | 8,606,400 | ||||||
| 252,478 | Nucor Corp. | 12,474,938 | ||||||
|
| |||||||
| 48,205,475 | ||||||||
|
| |||||||
| Media – 1.7% |
| ||||||
| 76,555 | DISH Network Corp. Class A* | 4,011,482 | ||||||
| 142,285 | Liberty SiriusXM Group* | 4,392,338 | ||||||
| 123,357 | Viacom, Inc. Class B | 5,115,615 | ||||||
|
| |||||||
| 13,519,435 | ||||||||
|
| |||||||
| Pharmaceuticals, Biotechnology & Life Sciences – 2.0% |
| ||||||
| 105,553 | Perrigo Co. PLC | 9,570,491 | ||||||
| 75,009 | Vertex Pharmaceuticals, Inc.* | 6,452,274 | ||||||
|
| |||||||
| 16,022,765 | ||||||||
|
| |||||||
| Real Estate Investment Trusts – 13.4% |
| ||||||
| 522,355 | Brixmor Property Group, Inc. | 13,821,513 | ||||||
| 774,834 | DDR Corp. | 14,055,489 | ||||||
| 53,743 | Federal Realty Investment Trust | 8,897,154 | ||||||
| 818,491 | MFA Financial, Inc. | 5,950,430 | ||||||
| 82,355 | Mid-America Apartment Communities, Inc. | 8,762,572 | ||||||
| 429,947 | RLJ Lodging Trust | 9,222,363 | ||||||
| 421,856 | Starwood Property Trust, Inc. | 8,740,856 | ||||||
| 85,835 | Taubman Centers, Inc. | 6,368,957 | ||||||
| 362,524 | Two Harbors Investment Corp. | 3,103,205 | ||||||
|
| |||||||
| 8 | The accompanying notes are an integral part of these financial statements. |
GOLDMAN SACHS VARIABLE INSURANCE TRUST MID CAP VALUE FUND
Shares | Description | Value | ||||||
| Common Stocks – (continued) | ||||||||
| Real Estate Investment Trusts – (continued) |
| ||||||
| 165,790 | Ventas, Inc. | $ | 12,072,828 | |||||
| 172,113 | Vornado Realty Trust | 17,231,954 | ||||||
|
| |||||||
| 108,227,321 | ||||||||
|
| |||||||
| Retailing – 4.3% |
| ||||||
| 91,731 | Expedia, Inc. | 9,751,005 | ||||||
| 269,912 | Liberty Interactive Corp QVC Group Series A* | 6,847,668 | ||||||
| 231,307 | Macy’s, Inc. | 7,774,228 | ||||||
| 179,823 | Sally Beauty Holdings, Inc.* | 5,288,594 | ||||||
| 100,323 | Williams-Sonoma, Inc. | 5,229,838 | ||||||
|
| |||||||
| 34,891,333 | ||||||||
|
| |||||||
| Semiconductors & Semiconductor Equipment – 2.5% |
| ||||||
| 201,552 | Intersil Corp. Class A | 2,729,014 | ||||||
| 221,721 | Maxim Integrated Products, Inc. | 7,913,222 | ||||||
| 61,863 | Skyworks Solutions, Inc. | 3,914,691 | ||||||
| 132,816 | Xilinx, Inc. | 6,126,802 | ||||||
|
| |||||||
| 20,683,729 | ||||||||
|
| |||||||
| Software & Services – 4.2% |
| ||||||
| 174,845 | Fidelity National Information Services, Inc. | 12,882,579 | ||||||
| 154,271 | IAC/InterActiveCorp | 8,685,457 | ||||||
| 190,050 | Match Group, Inc.* | 2,865,004 | ||||||
| 454,857 | Symantec Corp. | 9,342,763 | ||||||
|
| |||||||
| 33,775,803 | ||||||||
|
| |||||||
| Technology Hardware & Equipment – 2.5% |
| ||||||
| 902,728 | Brocade Communications Systems, Inc. | 8,287,043 | ||||||
| 161,636 | Corning, Inc. | 3,310,305 | ||||||
| 34,590 | F5 Networks, Inc.* | 3,937,726 | ||||||
| 677,787 | Viavi Solutions, Inc.* | 4,493,728 | ||||||
|
| |||||||
| 20,028,802 | ||||||||
|
| |||||||
| Common Stocks – (continued) | ||||||||
| Utilities – 12.9% |
| ||||||
| 143,832 | Ameren Corp. | $ | 7,706,519 | |||||
| 91,248 | American Water Works Co., Inc. | 7,711,368 | ||||||
| 66,115 | Atmos Energy Corp. | 5,376,472 | ||||||
| 147,311 | CMS Energy Corp. | 6,755,682 | ||||||
| 103,616 | Consolidated Edison, Inc. | 8,334,871 | ||||||
| 231,062 | FirstEnergy Corp. | 8,066,374 | ||||||
| 147,697 | PG&E Corp. | 9,440,792 | ||||||
| 84,675 | Pinnacle West Capital Corp. | 6,863,756 | ||||||
| 178,629 | PPL Corp. | 6,743,245 | ||||||
| 114,130 | SCANA Corp. | 8,635,076 | ||||||
| 142,671 | Sempra Energy | 16,267,347 | ||||||
| 275,442 | Xcel Energy, Inc. | 12,334,293 | ||||||
|
| |||||||
| 104,235,795 | ||||||||
|
| |||||||
| TOTAL INVESTMENTS – 95.8% | ||||||||
| (Cost $701,765,902) | $ | 775,569,012 | ||||||
|
| |||||||
| OTHER ASSETS IN EXCESS OF | 33,806,949 | ||||||
|
| |||||||
| NET ASSETS – 100.0% | $ | 809,375,961 | ||||||
|
| |||||||
| The percentage shown for each investment category reflects the value of investments in that category as a percentage of net assets. | ||
| * | Non-income producing security. | |
| The accompanying notes are an integral part of these financial statements. | 9 |
GOLDMAN SACHS VARIABLE INSURANCE TRUST MID CAP VALUE FUND
Statement of Assets and Liabilities
June 30, 2016 (Unaudited)
| Assets: | ||||
Investments, at value (cost $701,765,902) | $ | 775,569,012 | ||
Cash | 31,353,515 | |||
Receivables: | ||||
Investments sold | 8,329,536 | |||
Dividends | 1,740,246 | |||
Fund shares sold | 22,947 | |||
| Total assets | 817,015,256 | |||
| Liabilities: | ||||
Payables: | ||||
Investments purchased | 5,724,620 | |||
Fund shares redeemed | 1,222,510 | |||
Management fees | 507,015 | |||
Distribution and Service fees and Transfer Agency fees | 80,380 | |||
Accrued expenses | 104,770 | |||
| Total liabilities | 7,639,295 | |||
| Net Assets: | ||||
Paid-in capital | 806,219,055 | |||
Undistributed net investment income | 9,086,402 | |||
Accumulated net realized loss | (79,732,606 | ) | ||
Net unrealized gain | 73,803,110 | |||
| NET ASSETS | $ | 809,375,961 | ||
Net Assets: | ||||
Institutional | $ | 464,267,431 | ||
Service | 345,108,530 | |||
Total Net Assets | $ | 809,375,961 | ||
Shares outstanding $0.001 par value (unlimited shares authorized): | ||||
Institutional | 30,859,393 | |||
Service | 22,926,716 | |||
Net asset value, offering and redemption price per share: | ||||
Institutional | $15.04 | |||
Service | 15.05 | |||
| 10 | The accompanying notes are an integral part of these financial statements. |
GOLDMAN SACHS VARIABLE INSURANCE TRUST MID CAP VALUE FUND
Statement of Operations
For the Six Months Ended June 30, 2016 (Unaudited)
| Investment income: | ||||
Dividends (net of foreign taxes withheld of $1,720) | $ | 8,581,655 | ||
| Expenses: | ||||
Management fees | 3,014,511 | |||
Distribution and Service fees — Service Shares | 333,028 | |||
Transfer Agency fees(a) | 75,356 | |||
Printing and mailing costs | 69,597 | |||
Professional fees | 41,085 | |||
Custody, accounting and administrative services | 31,446 | |||
Trustee fees | 13,202 | |||
Other | 25,032 | |||
| Total expenses | 3,603,257 | |||
Less — expense reductions | (126,193 | ) | ||
| Net expenses | 3,477,064 | |||
| NET INVESTMENT INCOME | 5,104,591 | |||
| Realized and unrealized gain (loss): | ||||
Net realized loss from investments (including commissions recaptured of $32,016) | (56,599,815 | ) | ||
Net change in unrealized gain on investments | 77,406,747 | |||
| Net realized and unrealized gain | 20,806,932 | |||
| NET INCREASE IN NET ASSETS RESULTING FROM OPERATIONS | $ | 25,911,523 | ||
(a) Institutional and Service Shares incurred Transfer Agency fees of $48,716 and $26,640, respectively.
| The accompanying notes are an integral part of these financial statements. | 11 |
GOLDMAN SACHS VARIABLE INSURANCE TRUST MID CAP VALUE FUND
Statements of Changes in Net Assets
| For the Six Months Ended June 30, 2016 (Unaudited) | For the Fiscal Year Ended December 31, 2015 | |||||||
| From operations: | ||||||||
Net investment income | $ | 5,104,591 | $ | 6,217,364 | ||||
Net realized gain (loss) | (56,599,815 | ) | 24,622,227 | |||||
Net change in unrealized gain (loss) | 77,406,747 | (116,718,047 | ) | |||||
| Net increase (decrease) in net assets resulting from operations | 25,911,523 | (85,878,456 | ) | |||||
| Distributions to shareholders: | ||||||||
From net investment income | ||||||||
Institutional Shares | — | (2,359,711 | ) | |||||
Service Shares | — | (329,903 | ) | |||||
From net realized gains | ||||||||
Institutional Shares | — | (42,488,374 | ) | |||||
Service Shares | — | (21,063,319 | ) | |||||
| Total distributions to shareholders | — | (66,241,307 | ) | |||||
| From share transactions: | ||||||||
Proceeds from sales of shares | 106,848,301 | 71,780,808 | ||||||
Reinvestment of distributions | — | 66,241,307 | ||||||
Cost of shares redeemed | (124,387,406 | ) | (239,467,354 | ) | ||||
| Net decrease in net assets resulting from share transactions | (17,539,105 | ) | (101,445,239 | ) | ||||
| TOTAL INCREASE (DECREASE) | 8,372,418 | (253,565,002 | ) | |||||
| Net assets: | ||||||||
Beginning of period | 801,003,543 | 1,054,568,545 | ||||||
End of period | $ | 809,375,961 | $ | 801,003,543 | ||||
| Undistributed net investment income | $ | 9,086,402 | $ | 3,981,811 | ||||
| 12 | The accompanying notes are an integral part of these financial statements. |
GOLDMAN SACHS VARIABLE INSURANCE TRUST MID CAP VALUE FUND
Financial Highlights
Selected Data for a Share Outstanding Throughout Each Period
| Income (loss) from investment operations | Distributions to shareholders | |||||||||||||||||||||||||||||||||||||||||||||||||||||||
| Year - Share Class | Net asset value, beginning of period | Net investment income(a) | Net realized and unrealized gain (loss) | Total from investment operations | From net investment income | From net realized gains | Total distributions | Net asset value, end of period | Total return(b) | Net assets, end of period (in 000s) | Ratio of net expenses to average net assets | Ratio of total expenses to average net assets | Ratio of net investment income to average net assets | Portfolio turnover rate(c) | ||||||||||||||||||||||||||||||||||||||||||
FOR THE SIX MONTHS ENDED JUNE 30, (UNAUDITED) | ||||||||||||||||||||||||||||||||||||||||||||||||||||||||
2016 - Institutional | $ | 14.49 | $ | 0.10 | $ | 0.45 | $ | 0.55 | $ | — | $ | — | $ | — | $ | 15.04 | 3.80 | % | $ | 464,267 | 0.83 | %(d) | 0.87 | %(d) | 1.42 | %(d) | 77 | % | ||||||||||||||||||||||||||||
2016 - Service | 14.51 | 0.09 | 0.45 | 0.54 | — | — | — | 15.05 | 3.72 | 345,109 | 1.08 | (d) | 1.12 | (d) | 1.23 | (d) | 77 | |||||||||||||||||||||||||||||||||||||||
FOR THE FISCAL YEARS ENDED DECEMBER 31, | ||||||||||||||||||||||||||||||||||||||||||||||||||||||||
2015 - Institutional | 17.43 | 0.13 | (1.75 | ) | (1.62 | ) | (0.07 | ) | (1.25 | ) | (1.32 | ) | 14.49 | (9.24 | ) | 535,459 | 0.84 | 0.87 | 0.74 | 94 | ||||||||||||||||||||||||||||||||||||
2015 - Service | 17.45 | 0.08 | (1.75 | ) | (1.67 | ) | (0.02 | ) | (1.25 | ) | (1.27 | ) | 14.51 | (9.52 | ) | 265,545 | 1.09 | 1.12 | 0.48 | 94 | ||||||||||||||||||||||||||||||||||||
2014 - Institutional | 18.64 | 0.12 | 2.31 | 2.43 | (0.21 | ) | (3.43 | ) | (3.64 | ) | 17.43 | 13.57 | 692,068 | 0.83 | 0.87 | 0.62 | 88 | |||||||||||||||||||||||||||||||||||||||
2014 - Service | 18.66 | 0.07 | 2.31 | 2.38 | (0.16 | ) | (3.43 | ) | (3.59 | ) | 17.45 | 13.29 | 362,501 | 1.08 | 1.12 | 0.38 | 88 | |||||||||||||||||||||||||||||||||||||||
2013 - Institutional | 15.33 | 0.13 | 4.88 | 5.01 | (0.16 | ) | (1.54 | ) | (1.70 | ) | 18.64 | 32.89 | 695,832 | 0.83 | 0.86 | 0.74 | 108 | |||||||||||||||||||||||||||||||||||||||
2013 - Service | 15.35 | 0.09 | 4.88 | 4.97 | (0.12 | ) | (1.54 | ) | (1.66 | ) | 18.66 | 32.56 | 319,524 | 1.08 | 1.11 | 0.51 | 108 | |||||||||||||||||||||||||||||||||||||||
2012 - Institutional | 13.09 | 0.18 | (e) | 2.24 | 2.42 | (0.18 | ) | — | (0.18 | ) | 15.33 | 18.41 | 601,620 | 0.84 | 0.87 | 1.24 | (e) | 79 | ||||||||||||||||||||||||||||||||||||||
2012 - Service | 13.11 | 0.15 | (e) | 2.23 | 2.38 | (0.14 | ) | — | (0.14 | ) | 15.35 | 18.13 | 221,917 | 1.09 | 1.12 | 1.05 | (e) | 79 | ||||||||||||||||||||||||||||||||||||||
2011 - Institutional | 14.10 | 0.11 | (1.01 | ) | (0.90 | ) | (0.11 | ) | — | (0.11 | ) | 13.09 | (6.38 | ) | 604,797 | 0.85 | 0.86 | 0.81 | 75 | |||||||||||||||||||||||||||||||||||||
2011 - Service | 14.12 | 0.08 | (1.01 | ) | (0.93 | ) | (0.08 | ) | — | (0.08 | ) | 13.11 | (6.59 | ) | 159,638 | 1.10 | 1.11 | 0.61 | 75 | |||||||||||||||||||||||||||||||||||||
| (a) | Calculated based on the average shares outstanding methodology. |
| (b) | Assumes investment at the net asset value at the beginning of the period, reinvestment of all distributions, and a complete redemption of the investment at the net asset value at the end of the period. Total returns for periods less than one full year are not annualized. |
| (c) | The Fund’s portfolio turnover rate is calculated in accordance with regulatory requirements, without regard to transactions involving short term investments. If such transactions were included, the Fund’s portfolio turnover rate may be higher. |
| (d) | Annualized. |
| (e) | Reflects income recognized from special dividends which amounted to $0.04 per share and 0.31% of average net assets. |
| The accompanying notes are an integral part of these financial statements. | 13 |
GOLDMAN SACHS VARIABLE INSURANCE TRUST MID CAP VALUE FUND
Notes to Financial Statements
June 30, 2016 (Unaudited)
1. ORGANIZATION
Goldman Sachs Variable Insurance Trust (the “Trust” or “VIT”) is a Delaware statutory trust registered under the Investment Company Act of 1940, as amended (the “Act”), as an open-end management investment company. The Trust includes the Goldman Sachs Mid Cap Value Fund (the “Fund”). The Fund is a diversified portfolio under the Act offering two classes of shares — Institutional and Service Shares. Shares of the Trust are offered to separate accounts of participating life insurance companies for the purpose of funding variable annuity contracts and variable life insurance policies.
Goldman Sachs Asset Management, L.P. (“GSAM”), an affiliate of Goldman, Sachs & Co. (“Goldman Sachs”), serves as investment adviser to the Fund pursuant to a management agreement (the “Agreement”) with the Trust.
2. SIGNIFICANT ACCOUNTING POLICIES
The financial statements have been prepared in accordance with accounting principles generally accepted in the United States of America (“GAAP”) and require management to make estimates and assumptions that may affect the reported amounts and disclosures. Actual results may differ from those estimates and assumptions.
A. Investment Valuation — The Fund’s valuation policy is to value investments at fair value.
B. Investment Income and Investments — Investment income includes interest income, dividend income, net of any foreign withholding taxes, less any amounts reclaimable, and securities lending income. Interest income is accrued daily and adjusted for amortization of premiums and accretion of discounts. Dividend income is recognized on ex-dividend date or, for certain foreign securities, as soon as such information is obtained subsequent to the ex-dividend date. Investment transactions are reflected on trade date. Realized gains and losses are calculated using identified cost. Investment transactions are recorded on the following business day for daily net asset value (“NAV”) calculations. Any foreign capital gains tax is accrued daily based upon net unrealized gains, and is payable upon sale of such investments. Distributions received from the Fund’s investments in United States (“U.S.”) real estate investment trusts (“REITs”) may be characterized as ordinary income, net capital gain or a return of capital. A return of capital is recorded by the Fund as a reduction to the cost basis of the REIT.
C. Class Allocations and Expenses — Investment income, realized and unrealized gain (loss), and non-class specific expenses of the Fund are allocated daily based upon the proportion of net assets of each class. Non-class specific expenses directly incurred by the Fund are charged to the Fund, while such expenses incurred by the Trust are allocated across the Fund on a straight-line and/or pro-rata basis depending upon the nature of the expenses. Class specific expenses, where applicable, are borne by the respective share classes and include Distribution and Service and Transfer Agency fees.
D. Federal Taxes and Distributions to Shareholders — It is the Fund’s policy to comply with the requirements of the Internal Revenue Code of 1986, as amended (the “Code”), applicable to regulated investment companies (mutual funds) and to distribute each year substantially all of its investment company taxable income and capital gains to its shareholders. Accordingly, the Fund is not required to make any provisions for the payment of federal income tax. Distributions to shareholders are recorded on the ex-dividend date. Income and capital gains distributions, if any, are declared and paid annually.
Net capital losses are carried forward to future fiscal years and may be used to the extent allowed by the Code to offset any future capital gains. Losses that are carried forward will retain their character as either short-term or long-term capital losses. Utilization of capital loss carryforwards will reduce the requirement of future capital gains distributions.
The characterization of distributions to shareholders for financial reporting purposes is determined in accordance with federal income tax rules, which may differ from GAAP. The source of the Fund’s distributions may be shown in the accompanying financial statements as either from net investment income, net realized gain or capital. Certain components of the Fund’s net assets on the Statement of Assets and Liabilities reflect permanent GAAP/tax differences based on the appropriate tax character.
E. Commission Recapture — GSAM, on behalf of certain Funds, may direct portfolio trades, subject to seeking best execution, to various brokers who have agreed to rebate a portion of the commissions generated. Such rebates are made directly to a Fund as cash payments and are included in net realized gain (loss) from investments on the Statement of Operations.
14
GOLDMAN SACHS VARIABLE INSURANCE TRUST MID CAP VALUE FUND
3. INVESTMENTS AND FAIR VALUE MEASUREMENTS
The fair value of a financial instrument is the amount that would be received to sell an asset or paid to transfer a liability in an orderly transaction between market participants at the measurement date (i.e., the exit price). GAAP establishes a fair value hierarchy that prioritizes the inputs to valuation techniques used to measure fair value. The hierarchy gives the highest priority to unadjusted quoted prices in active markets for identical assets or liabilities (Level 1 measurements) and the lowest priority to unobservable inputs (Level 3 measurements). The levels used for classifying investments are not necessarily an indication of the risk associated with investing in these investments. The three levels of the fair value hierarchy are described below:
Level 1 — Unadjusted quoted prices in active markets that are accessible at the measurement date for identical, unrestricted assets or liabilities;
Level 2 — Quoted prices in markets that are not active or financial instruments for which significant inputs are observable (including, but not limited to, quoted prices for similar investments, interest rates, foreign exchange rates, volatility and credit spreads), either directly or indirectly;
Level 3 — Prices or valuations that require significant unobservable inputs (including GSAM’s assumptions in determining fair value measurement).
Changes in valuation techniques may result in transfers into or out of an assigned level within the hierarchy. In accordance with the Fund’s policy, transfers between different levels of the fair value hierarchy resulting from such changes are deemed to have occurred as of the beginning of the reporting period.
The Board of Trustees (“Trustees”) has approved Valuation Procedures that govern the valuation of the portfolio investments held by the Fund, including investments for which market quotations are not readily available. The Trustees have delegated to GSAM day-to-day responsibility for implementing and maintaining internal controls and procedures related to the valuation of the Fund’s portfolio investments. To assess the continuing appropriateness of pricing sources and methodologies, GSAM regularly performs price verification procedures and issues challenges as necessary to third party pricing vendors or brokers, and any differences are reviewed in accordance with the Valuation Procedures.
A. Level 1 and Level 2 Fair Value Investments — The valuation techniques and significant inputs used in determining the fair values for investments classified as Level 1 and Level 2 are as follows:
Equity Securities — Equity securities traded on a U.S. securities exchange or the NASDAQ system, or those located on certain foreign exchanges, including but not limited to the Americas, are valued daily at their last sale price or official closing price on the principal exchange or system on which they are traded. If there is no sale or official closing price or such price is believed by GSAM to not represent fair value, equity securities are valued at the last bid price for long positions and at the last ask price for short positions. To the extent these investments are actively traded, they are classified as Level 1 of the fair value hierarchy, otherwise they are generally classified as Level 2.
Unlisted equity securities for which market quotations are available are valued at the last sale price on the valuation date, or if no sale occurs, at the last bid price. Securities traded on certain foreign securities exchanges are valued daily at fair value determined by an independent fair value service (if available) under Valuation Procedures approved by the Trustees and consistent with applicable regulatory guidance. The independent fair value service takes into account multiple factors including, but not limited to, movements in the securities markets, certain depositary receipts, futures contracts and foreign currency exchange rates that have occurred subsequent to the close of the foreign securities exchange. These investments are generally classified as Level 2 of the fair value hierarchy.
B. Level 3 Fair Value Investments — To the extent that significant inputs to valuation models and other alternative pricing sources are unobservable, or if quotations are not readily available, or if GSAM believes that such quotations do not accurately reflect fair value, the fair value of the Fund’s investments may be determined under Valuation Procedures approved by the Trustees. GSAM, consistent with its procedures and applicable regulatory guidance, may make an adjustment to the most recent valuation prices of either domestic or foreign securities in light of significant events to reflect what it believes to be the fair value of the securities at the time of determining the Fund’s NAV. Significant events which could affect a large number of securities in a
15
GOLDMAN SACHS VARIABLE INSURANCE TRUST MID CAP VALUE FUND
Notes to Financial Statements (continued)
June 30, 2016 (Unaudited)
3. INVESTMENTS AND FAIR VALUE MEASUREMENTS (continued)
particular market may include, but are not limited to: significant fluctuations in U.S. or foreign markets; market dislocations; market disruptions; or unscheduled market closings. Significant events which could also affect a single issuer may include, but are not limited to: corporate actions such as reorganizations, mergers and buy-outs; ratings downgrades; and bankruptcies.
C. Fair Value Hierarchy — The following is a summary of the Fund’s investments classified in the fair value hierarchy as of June 30, 2016:
| Investment Type | Level 1 | Level 2 | Level 3 | |||||||||
| Assets | ||||||||||||
| Common Stock and/or Other Equity Investments(a) | ||||||||||||
North America | $ | 775,569,012 | $ | — | $ | — | ||||||
| (a) | Amounts are disclosed by continent to highlight the impact of time zone differences between local market close and the calculation of NAV. Security valuations are based on the principal exchange or system on which they are traded, which may differ from country of domicile noted in table. |
For further information regarding security characteristics, see the Schedule of Investments.
4. AGREEMENTS AND AFFILIATED TRANSACTIONS
A. Management Agreement — Under the Agreement, GSAM manages the Fund, subject to the general supervision of the Trustees.
As compensation for the services rendered pursuant to the Agreement, the assumption of the expenses related thereto and administration of the Fund’s business affairs, including providing facilities, GSAM is entitled to a management fee, accrued daily and paid monthly, equal to an annual percentage rate of the Fund’s average daily net assets.
For the six months ended June 30, 2016, contractual and effective net management fees with GSAM were at the following rates:
| Contractual Management Rate | ||||||||||||||||||||||
| First $2 billion | Next $3 billion | Next $3 billion | Over $8 billion | Effective Rate | Effective Net Management Rate^ | |||||||||||||||||
| 0.80% | 0.72 | % | 0.68 | % | 0.67 | % | 0.80 | % | 0.77 | %* | ||||||||||||
| ^ | Effective Net Management Rate includes the impact of management fee waivers of affiliated underlying funds, if any. |
| * | GSAM agreed to waive a portion of its management fee in order to achieve a net management rate, as defined in the Fund’s most recent prospectus. This waiver will be effective through at least April 29, 2017, and prior to such date GSAM may not terminate the arrangement without approval of the Trustees. For the six months ended June 30, 2016, GSAM waived $113,048 of its management fee. |
B. Distribution and Service Plan — The Trust, on behalf of the Service Shares of the Fund, has adopted a Distribution and Service Plan (the “Plan”). Under the Plan, Goldman Sachs, which serves as distributor (the “Distributor”), is entitled to a fee accrued daily and paid monthly, for distribution services and personal and account maintenance services, which may then be paid by Goldman Sachs to authorized dealers, equal to, on an annual basis, 0.25% of the Fund’s average daily net assets attributable to Service Shares.
C. Transfer Agency Agreement — Goldman Sachs also serves as the transfer agent of the Fund for a fee pursuant to the Transfer Agency Agreement. The fees charged for such transfer agency services are accrued daily and paid monthly at an annual rate of 0.02% of the average daily net assets of Institutional and Service Shares.
D. Other Expense Agreements and Affiliated Transactions — GSAM has agreed to limit certain “Other Expenses” of the Fund (excluding acquired fund fees and expenses, transfer agency fees and expenses, taxes, interest, brokerage fees, shareholder meeting, litigation, indemnification and extraordinary expenses) to the extent such expenses exceed, on an annual basis, a
16
GOLDMAN SACHS VARIABLE INSURANCE TRUST MID CAP VALUE FUND
4. AGREEMENTS AND AFFILIATED TRANSACTIONS (continued)
percentage rate of the average daily net assets of the Fund. Such Other Expense reimbursements, if any, are accrued daily and paid monthly. In addition, the Fund is not obligated to reimburse GSAM for prior fiscal year expense reimbursements, if any. The Other Expense limitation as an annual percentage rate of average daily net assets for the Fund is 0.054%. The Other Expense limitation will remain in place through at least April 29, 2017, and prior to such date GSAM may not terminate the arrangement without the approval of the Trustees. For the six months ended June 30, 2016, GSAM did not reimburse the Fund. In addition, the Fund has entered into certain offset arrangements with the custodian and the transfer agent, which may result in a reduction of the Fund’s expenses and are received irrespective of the application of the “Other Expense” limitations described above. For the six months ended June 30, 2016, custody fee credits were $13,145.
E. Line of Credit Facility — As of June 30, 2016, the Fund participated in a $1,100,000,000 committed, unsecured revolving line of credit facility (the “facility”) together with other funds of the Trust and registered investment companies having management agreements with GSAM or its affiliates (“Other Borrowers”). This facility is to be used for temporary or emergency purposes, or to allow for an orderly liquidation of securities to meet redemption requests. The interest rate on borrowings is based on the federal funds rate. The facility also requires a fee to be paid by the Fund based on the amount of the commitment that has not been utilized. For the six months ended June 30, 2016, the Fund did not have any borrowings under the facility.
F. Other Transactions with Affiliates — For the six months ended June 30, 2016, Goldman Sachs earned $46,933 in brokerage commissions from portfolio transactions.
5. PORTFOLIO SECURITIES TRANSACTIONS
The cost of purchases and proceeds from sales and maturities of long-term securities for the six months ended June 30, 2016, were $570,912,114 and $590,289,597, respectively.
6. TAX INFORMATION
As of the Fund’s most recent fiscal year end, December 31, 2015, the Fund’s timing differences, on a tax-basis were as follows:
| Timing differences (Post October Loss Deferral, and certain REIT Adjustments) | $ | (13,981,487 | ) |
As of June 30, 2016, the Fund’s aggregate security unrealized gains and losses based on cost for U.S. federal income tax purposes were as follows:
| Tax cost | $ | 710,686,971 | ||
| Gross unrealized gain | 88,965,057 | |||
| Gross unrealized loss | (24,083,016 | ) | ||
| Net unrealized security gain | $ | 64,882,041 |
The difference between GAAP-basis and tax-basis unrealized gains (losses) is attributable primarily to wash sales and differences in the tax treatment of real estate investment trust investments.
GSAM has reviewed the Fund’s tax positions for all open tax years (the current and prior three years, as applicable) and has concluded that no provision for income tax is required in the Fund’s financial statements. Such open tax years remain subject to examination and adjustment by tax authorities.
17
GOLDMAN SACHS VARIABLE INSURANCE TRUST MID CAP VALUE FUND
Notes to Financial Statements (continued)
June 30, 2016 (Unaudited)
7. OTHER RISKS
The Fund’s risks include, but are not limited to, the following:
Large Shareholder Transactions Risk — The Fund may experience adverse effects when certain large shareholders, such as other funds, participating insurance companies, accounts and Goldman Sachs affiliates, purchase or redeem large amounts of shares of the Fund. Such large shareholder redemptions may cause the Fund to sell portfolio securities at times when it would not otherwise do so, which may negatively impact the Fund’s NAV and liquidity. These transactions may also accelerate the realization of taxable income to shareholders if such sales of investments resulted in gains, and may also increase transaction costs. In addition, a large redemption could result in the Fund’s current expenses being allocated over a smaller asset base, leading to an increase in the Fund’s expense ratio. Similarly, large Fund share purchases may adversely affect the Fund’s performance to the extent that the Fund is delayed in investing new cash and is required to maintain a larger cash position than it ordinarily would.
Liquidity Risk — The Fund may make investments that are illiquid or that may become less liquid in response to market developments or adverse investor perceptions. Illiquid investments may be more difficult to value. Liquidity risk may also refer to the risk that the Fund will not be able to pay redemption proceeds within the allowable time period because of unusual market conditions, an unusually high volume of redemption requests, or other reasons. To meet redemption requests, the Fund may be forced to sell investments at an unfavorable time and/or under unfavorable conditions.
Market and Credit Risks — In the normal course of business, the Fund trades financial instruments and enters into financial transactions where risk of potential loss exists due to changes in the market (market risk). Additionally, the Fund may also be exposed to credit risk in the event that an issuer or guarantor fails to perform or that an institution or entity with which the Fund has unsettled or open transactions defaults.
8. INDEMNIFICATIONS
Under the Trust’s organizational documents, its Trustees, officers, employees and agents are indemnified, to the extent permitted by the Act and state law, against certain liabilities that may arise out of performance of their duties to the Fund. Additionally, in the course of business, the Fund enters into contracts that contain a variety of indemnification clauses. The Fund’s maximum exposure under these arrangements is unknown, as this would involve future claims that may be made against the Fund that have not yet occurred. However, GSAM believes the risk of loss under these arrangements to be remote.
9. SUBSEQUENT EVENTS
Subsequent events after the Statement of Assets and Liabilities date have been evaluated through the date the financial statements were issued. GSAM has concluded that there is no impact requiring adjustment or disclosure in the financial statements.
18
GOLDMAN SACHS VARIABLE INSURANCE TRUST MID CAP VALUE FUND
10. SUMMARY OF SHARE TRANSACTIONS
Share activity is as follows:
| For the Six Months Ended June 30, 2016 (Unaudited) | For the Fiscal Year Ended December 31, 2015 | |||||||||||||||
| Shares | Dollars | Shares | Dollars | |||||||||||||
| Institutional Shares | ||||||||||||||||
| Shares sold | 589,108 | $ | 8,272,092 | 1,719,609 | $ | 28,721,424 | ||||||||||
| Reinvestment of distributions | — | — | 3,114,450 | 44,848,085 | ||||||||||||
| Shares redeemed | (6,691,793 | ) | (96,277,341 | ) | (7,566,438 | ) | (128,872,863 | ) | ||||||||
| (6,102,685 | ) | (88,005,249 | ) | (2,732,379 | ) | (55,303,354 | ) | |||||||||
| Service Shares | ||||||||||||||||
| Shares sold | 6,598,068 | 98,576,209 | 2,499,549 | 43,059,384 | ||||||||||||
| Reinvestment of distributions | — | — | 1,482,552 | 21,393,222 | ||||||||||||
| Shares redeemed | (1,969,320 | ) | (28,110,065 | ) | (6,456,250 | ) | (110,594,491 | ) | ||||||||
| 4,628,748 | 70,466,144 | (2,474,149 | ) | (46,141,885 | ) | |||||||||||
| NET DECREASE | (1,473,937 | ) | $ | (17,539,105 | ) | (5,206,528 | ) | $ | (101,445,239 | ) | ||||||
19
GOLDMAN SACHS VARIABLE INSURANCE TRUST MID CAP VALUE FUND
| Fund Expenses — Six Month Period Ended June 30, 2016 (Unaudited) |
As a shareholder of Institutional or Service Shares of the Fund, you incur ongoing costs, including management fees, distribution and service (12b-1) fees (with respect to Service Shares) and other Fund expenses. This example is intended to help you understand your ongoing costs (in dollars) of investing in the Institutional Shares and Service Shares of the Fund and to compare these costs with the ongoing costs of investing in other mutual funds.
The example is based on an investment of $1,000 invested at the beginning of the period and held for the entire period from January 1, 2016 through June 30, 2016, which represents a period of 182 days of a 366 day year.
Actual Expenses — The first line under each share class in the table below provides information about actual account values and actual expenses. You may use the information in this line, together with the amount you invested, to estimate the expenses that you paid over the period. Simply divide your account value by $1,000 (for example, an $8,600 account value divided by $1,000=8.6), then multiply the result by the number in the first line under the heading entitled “Expenses Paid” to estimate the expenses you paid on your account during this period.
Hypothetical Example for Comparison Purposes — The second line under each share class in the table below provides information about hypothetical account values and hypothetical expenses based on the Fund's actual net expense ratio and an assumed rate of return of 5% per year before expenses, which is not the Fund's actual return. The hypothetical account values and expenses may not be used to estimate the actual ending account balance or expenses you paid for the period. You may use this information to compare the ongoing costs of investing in the Fund and other funds. To do so, compare this 5% hypothetical example with the 5% hypothetical examples that appear in the shareholder reports of the other funds.
Please note that the expenses shown in the table are meant to highlight your ongoing costs only. As a shareholder of the Fund you do not incur any transaction costs, such as sales charges, redemption fees, or exchange fees, but shareholders of other funds may incur such costs. The second line of the table is useful in comparing ongoing costs only, and will not help you determine the relative total costs of owning different funds whose shareholders may incur transaction costs.
| Share Class | Beginning Account Value 01/01/16 | Ending Account Value 06/30/16 | Expenses Paid for the 6 Months Ended 06/30/16* | |||||||||
| Institutional | ||||||||||||
| Actual | $ | 1,000 | $ | 1,038.00 | $ | 4.21 | ||||||
| Hypothetical 5% return | 1,000 | 1,020.74 | + | 4.17 | ||||||||
| Service | ||||||||||||
| Actual | 1,000 | 1,037.20 | 5.47 | |||||||||
| Hypothetical 5% return | 1,000 | 1,019.49 | + | 5.42 | ||||||||
| * | Expenses are calculated using the Fund’s annualized net expense ratio for each class, which represents the ongoing expenses as a percentage of net assets for the six months ended June 30, 2016. Expenses are calculated by multiplying the annualized net expense ratio by the average account value for the period; then multiplying the result by the number of days in the most recent fiscal half year; and then dividing that result by the number of days in the fiscal year. The annualized net expense ratios for the period were 0.83% and 1.08% for Institutional and Service Shares, respectively. |
| + | Hypothetical expenses are based on the Fund’s actual annualized net expense ratios and an assumed rate of return of 5% per year before expenses. |
20
GOLDMAN SACHS VARIABLE INSURANCE TRUST MID CAP VALUE FUND
Statement Regarding Basis for Approval of Management Agreement (Unaudited)
Background
The Goldman Sachs Mid Cap Value Fund (the “Fund”) is an investment portfolio of Goldman Sachs Variable Insurance Trust (the “Trust”). The Board of Trustees oversees the management of the Trust and reviews the investment performance and expenses of the Fund at regularly scheduled meetings held throughout the year. In addition, the Board of Trustees determines annually whether to approve the continuance of the Trust’s investment management agreement (the “Management Agreement”) with Goldman Sachs Asset Management, L.P. (the “Investment Adviser”) on behalf of the Fund.
The Management Agreement was most recently approved for continuation until June 30, 2017 by the Board of Trustees, including those Trustees who are not parties to the Management Agreement or “interested persons” (as defined in the Investment Company Act of 1940, as amended) of any party thereto (the “Independent Trustees”), at a meeting held on June 15-16, 2016 (the “Annual Meeting”).
The review process undertaken by the Trustees spans the course of the year and culminates with the Annual Meeting. To assist the Trustees in their deliberations, the Trustees have established a Contract Review Committee (the “Committee”), comprised of the Independent Trustees. The Committee held three meetings over the course of the year since the Management Agreement was last approved. At those Committee meetings, regularly scheduled Board or other committee meetings, and/or the Annual Meeting, matters relevant to the renewal of the Management Agreement were considered by the Board, or the Independent Trustees, as applicable. With respect to the Fund, such matters included:
| (a) | the nature and quality of the advisory, administrative, and other services provided to the Fund by the Investment Adviser and its affiliates, including information about: |
| (i) | the structure, staff, and capabilities of the Investment Adviser and its portfolio management teams; |
| (ii) | the groups within the Investment Adviser and its affiliates that support the portfolio management teams or provide other types of necessary services, including fund services groups (e.g., accounting and financial reporting, tax, shareholder services, and operations); controls and risk management groups (e.g., legal, compliance, valuation oversight, credit risk management, internal audit, compliance testing, market risk analysis, finance, and central funding); sales and distribution support groups, and others (e.g., information technology and training); |
| (iii) | trends in employee headcount; |
| (iv) | the Investment Adviser’s financial resources and ability to hire and retain talented personnel and strengthen its operations; and |
| (v) | the parent company’s support of the Investment Adviser and its mutual fund business, as expressed by the firm’s senior management; |
| (b) | information on the investment performance of the Fund, including comparisons to the performance of similar mutual funds, as provided by a third-party mutual fund data provider engaged as part of the contract review process (the “Outside Data Provider”), a benchmark performance index, and a composite of accounts with comparable investment strategies managed by the Investment Adviser; and general investment outlooks in the markets in which the Fund invests; |
| (c) | information provided by the Investment Adviser indicating the Investment Adviser’s views on whether the Fund’s peer group and/or benchmark index had high, medium, or low relevance given the Fund’s particular investment strategy; |
| (d) | the terms of the Management Agreement and other agreements with affiliated service providers entered into by the Trust on behalf of the Fund; |
| (e) | fee and expense information for the Fund, including: |
| (i) | the relative management fee and expense level of the Fund as compared to those of comparable funds managed by other advisers, as provided by the Outside Data Provider; |
| (ii) | the Fund’s expense trends over time; and |
| (iii) | to the extent the Investment Adviser manages other types of accounts (such as bank collective trusts, private wealth management accounts, institutional separate accounts, sub-advised mutual funds, and non-U.S. funds) having investment objectives and policies similar to those of the Fund, comparative information on the advisory fees charged and services provided to those accounts by the Investment Adviser; |
| (f) | with respect to the extensive investment performance and expense comparison data provided by the Outside Data Provider, its processes in producing that data for the Fund; |
| (g) | the undertaking of the Investment Adviser to waive certain fees and to limit certain expenses of the Fund that exceed a specified level; |
21
GOLDMAN SACHS VARIABLE INSURANCE TRUST MID CAP VALUE FUND
Statement Regarding Basis for Approval of Management Agreement (Unaudited) (continued)
| (h) | information relating to the profitability of the Management Agreement and the transfer agency and distribution and service arrangements of the Fund and the Trust as a whole to the Investment Adviser and its affiliates; |
| (i) | whether the Fund’s existing management fee schedule adequately addressed any economies of scale; |
| (j) | a summary of the “fall-out” benefits derived by the Investment Adviser and its affiliates from their relationships with the Fund, including the fees received by the Investment Adviser’s affiliates from the Fund for transfer agency, portfolio trading, distribution and other services; |
| (k) | a summary of potential benefits derived by the Fund as a result of its relationship with the Investment Adviser; |
| (l) | information regarding commissions paid by the Fund and broker oversight, an update on the Investment Adviser’s soft dollars practices, other information regarding portfolio trading, and how the Investment Adviser carries out its duty to seek best execution; |
| (m) | the manner in which portfolio manager compensation is determined; and the number and types of accounts managed by the portfolio managers; |
| (n) | the nature and quality of the services provided to the Fund by its unaffiliated service providers, and the Investment Adviser’s general oversight and evaluation (including reports on due diligence) of those service providers as part of the administration services provided under the Management Agreement; and |
| (o) | the Investment Adviser’s processes and policies addressing various types of potential conflicts of interest; its approach to risk management; the annual review of the effectiveness of the Fund’s compliance program; and periodic compliance reports. |
The Trustees also received an overview of the Fund’s distribution arrangements. They received information regarding the Fund’s assets, share purchase and redemption activity, and payment of distribution and service fees. Information was also provided to the Trustees relating to revenue sharing payments made by and services provided by the Investment Adviser and its affiliates to intermediaries that promote the sale, distribution, and/or servicing of Fund shares. The Independent Trustees also discussed the broad range of other investment choices that are available to Fund investors, including the availability of comparable funds managed by other advisers.
The presentations made at the Board and Committee meetings and at the Annual Meeting encompassed the Fund and other mutual funds for which the Board of Trustees has responsibility. In evaluating the Management Agreement at the Annual Meeting, the Trustees relied upon their knowledge, resulting from their meetings and other interactions throughout the year, of the Investment Adviser and its affiliates, their services, and the Fund. In conjunction with these meetings, the Trustees received written materials and oral presentations on the topics covered, and the Investment Adviser addressed the questions and concerns of the Trustees, including concerns regarding the investment performance of certain of the funds they oversee. The Independent Trustees were advised by their independent legal counsel regarding their responsibilities and other regulatory requirements related to the approval and continuation of mutual fund investment management agreements under applicable law. In addition, the Investment Adviser and its affiliates provided the Independent Trustees with a written response to a formal request for information sent on behalf of the Independent Trustees by their independent legal counsel. During the course of their deliberations, the Independent Trustees met in executive sessions with their independent legal counsel, without representatives of the Investment Adviser or its affiliates present.
Nature, Extent, and Quality of the Services Provided Under the Management Agreement
As part of their review, the Trustees considered the nature, extent, and quality of the services provided to the Fund by the Investment Adviser. In this regard, the Trustees considered both the investment advisory services and non-advisory services that are provided by the Investment Adviser and its affiliates. The Trustees noted the transition in the leadership and changes in personnel of various of the Investment Adviser’s portfolio management teams that had occurred in recent periods, and the ongoing recruitment efforts aimed at bringing high quality investment talent to the Investment Adviser. They also noted the Investment Adviser’s commitment to maintaining high quality systems and expending substantial resources to respond to ongoing changes to the regulatory and control environment in which the Fund and its service providers operate, as well as the efforts of the Investment Adviser and its affiliates to combat cyber security risks. The Trustees concluded that the Investment Adviser continued to commit substantial financial and operational resources to the Fund and expressed confidence that the Investment Adviser would continue to do so in the future. The Trustees also recognized that the Investment Adviser had made significant commitments to address regulatory compliance requirements applicable to the Fund and the Investment Adviser and its affiliates.
22
GOLDMAN SACHS VARIABLE INSURANCE TRUST MID CAP VALUE FUND
Statement Regarding Basis for Approval of Management Agreement (Unaudited) (continued)
Investment Performance
The Trustees also considered the investment performance of the Fund. In this regard, they compared the investment performance of the Fund to its peers using rankings and ratings compiled by the Outside Data Provider as of December 31, 2015, and updated performance information prepared by the Investment Adviser using the peer group identified by the Outside Data Provider as of March 31, 2016. The information on the Fund’s investment performance was provided for the one-, three-, five-, and ten-year periods ending on the applicable dates. The Trustees also reviewed the Fund’s investment performance relative to its performance benchmark. As part of this review, they considered the investment performance trends of the Fund over time, and reviewed the investment performance of the Fund in light of its investment objective and policies and market conditions. The Trustees also received information comparing the Fund’s performance to that of a composite of accounts with comparable investment strategies managed by the Investment Adviser.
In addition, the Trustees considered materials prepared and presentations made by the Investment Adviser’s senior management and portfolio management personnel in which Fund performance was assessed. The Trustees also considered the Investment Adviser’s periodic reports with respect to the Fund’s risk profile, and how the Investment Adviser’s approach to risk monitoring and management influences portfolio management.
The Trustees observed that the Fund’s Institutional Shares had placed in the third quartile of the Fund’s peer group for the five- and ten-year periods and in the fourth quartile for the one- and three-year periods, and had underperformed the Fund’s benchmark index for the one-, three-, five-, and ten-year periods ended March 31, 2016.
Costs of Services Provided and Competitive Information
The Trustees considered the contractual terms of the Management Agreement and the fee rates payable by the Fund thereunder. In this regard, the Trustees considered information on the services rendered by the Investment Adviser to the Fund, which included both advisory and administrative services that were directed to the needs and operations of the Fund as a registered mutual fund.
In particular, the Trustees reviewed analyses prepared by the Outside Data Provider regarding the expense rankings of the Fund. The analyses provided a comparison of the Fund’s management fee and breakpoints to those of a relevant peer group and category universe; an expense analysis which compared the Fund’s overall net and gross expenses to a peer group and a category universe; and a five-year history comparing the Fund’s net expenses to the peer and category medians. The analyses also compared the Fund’s transfer agency, custody, and distribution fees, other expenses and fee waivers/reimbursements to those of the peer group and category medians. The Trustees concluded that the comparisons provided by the Outside Data Provider were useful in evaluating the reasonableness of the management fees and total expenses paid by the Fund.
In addition, the Trustees considered the Investment Adviser’s undertaking to waive a portion of its management fee and to limit certain expenses of the Fund that exceed a specified level. They also considered, to the extent that the Investment Adviser manages other types of accounts having investment objectives and policies similar to those of the Fund, comparative fee information for services provided by the Investment Adviser to those accounts, and information that indicated that services provided to the Fund differed in various significant respects from the services provided to other types of accounts which, in many cases, operated under less stringent legal and regulatory structures, required fewer services from the Investment Adviser to a smaller number of client contact points, and were less time-intensive.
In addition, the Trustees noted that shareholders are able to redeem their Fund shares at any time if shareholders believe that the Fund fees and expenses are too high or if they are dissatisfied with the performance of the Fund.
Profitability
The Trustees reviewed the Investment Adviser’s revenues and pre-tax profit margins with respect to the Trust and the Fund. In this regard the Trustees noted that they had received, among other things, profitability analyses and summaries, revenue and expense schedules by Fund and by function (i.e., investment management, transfer agency and distribution and service), and information on the Investment Adviser’s expense allocation methodology. They observed that the profitability and expense figures are substantially similar to those used by the Investment Adviser for many internal purposes, including compensation decisions among various business groups, and are thus subject to a vigorous internal debate about how certain revenue and expenses should be allocated. The Trustees also noted that the internal audit group within the Goldman Sachs organization had audited the expense allocation methodology and was satisfied with the reasonableness, consistency, and accuracy of the Investment Adviser’s expense allocation methodology and profitability analysis calculations. Profitability data for the Trust and the Fund were provided for 2015
23
GOLDMAN SACHS VARIABLE INSURANCE TRUST MID CAP VALUE FUND
Statement Regarding Basis for Approval of Management Agreement (Unaudited) (continued)
and 2014, and the Trustees considered this information in relation to the Investment Adviser’s overall profitability. The Trustees considered the Investment Adviser’s revenues and pre-tax profit margins both in absolute terms and in comparison to information on the reported pre-tax profit margins earned by certain other asset management firms.
Economies of Scale
The Trustees considered the information that had been provided regarding the Investment Adviser’s profitability. The Trustees also considered the breakpoints in the fee rate payable under the Management Agreement for the Fund at the following annual percentage rates of the average daily net assets of the Fund:
| First $2 billion | 0.80 | % | ||
| Next $3 billion | 0.72 | |||
| Next $3 billion | 0.68 | |||
| Over $8 billion | 0.67 |
The Trustees noted that the breakpoints were designed to share potential economies of scale, if any, with the Fund and its shareholders as assets under management reach those asset levels. The Trustees considered the amounts of assets in the Fund; the Fund’s recent share purchase and redemption activity; the information provided by the Investment Adviser relating to the costs of the services provided by the Investment Adviser and its affiliates and their realized profits; information comparing fee rates charged by the Investment Adviser with fee rates charged to other funds in the peer group; and the Investment Adviser’s undertaking to waive a portion of its management fee and to limit certain expenses of the Fund that exceed a specified level. Upon reviewing these matters at the Annual Meeting, the Trustees concluded that the fee breakpoints represented a means of assuring that benefits of scalability, if any, would be passed along to shareholders at the specified asset levels.
Other Benefits to the Investment Adviser and Its Affiliates
The Trustees also considered the other benefits derived by the Investment Adviser and its affiliates from their relationships with the Fund as stated above, including: (a) transfer agency fees received by Goldman, Sachs & Co. (“Goldman Sachs”); (b) brokerage and futures commissions earned by Goldman Sachs for executing securities and futures transactions on behalf of the Fund; (c) research received by the Investment Adviser from broker-dealers in exchange for executing certain transactions on behalf of the Fund; (d) trading efficiencies resulting from aggregation of orders of the Fund with those for other funds or accounts managed by the Investment Adviser; (e) the Investment Adviser’s ability to leverage the infrastructure designed to service the Fund on behalf of its other clients; (f) the Investment Adviser’s ability to cross-market other products and services to Fund shareholders; (g) Goldman Sachs’ retention of certain fees as Fund Distributor; (h) the Investment Adviser’s ability to negotiate better pricing with custodians on behalf of its other clients, as a result of the relationship with the Fund; and (i) the possibility that the working relationship between the Investment Adviser and the Fund’s third-party service providers may cause those service providers to be more likely to do business with other areas of Goldman Sachs. In the course of considering the foregoing, the Independent Trustees requested and received further information quantifying certain of these fall-out benefits.
Other Benefits to the Fund and Its Shareholders
The Trustees also noted that the Fund receives certain potential benefits as a result of its relationship with the Investment Adviser, including: (a) trading efficiencies resulting from aggregation of orders of the Fund with those of other funds or accounts managed by the Investment Adviser; (b) enhanced servicing from vendors because of the volume of business generated by the Investment Adviser and its affiliates; (c) enhanced servicing from broker-dealers because of the volume of business generated by the Investment Adviser and its affiliates; (d) the Investment Adviser’s ability to negotiate favorable terms with derivatives counterparties on behalf of the Fund as a result of the size and reputation of the Goldman Sachs organization; (e) the Investment Adviser’s knowledge and experience gained from managing other accounts and products; (f) the Investment Adviser’s ability to hire and retain qualified personnel to provide services to the Fund because of the reputation of the Goldman Sachs organization; (g) the Fund’s access, through the Investment Adviser, to certain firmwide resources (e.g., proprietary risk management systems and databases), subject to certain restrictions; and (h) the Fund’s access to certain affiliated distribution channels. In addition, the Trustees noted the competitive nature of the mutual fund marketplace, and considered that many of the Fund’s shareholders invested in the Fund in part because of the Fund’s relationship with the Investment Adviser and that those shareholders have a general expectation that the relationship will continue.
24
GOLDMAN SACHS VARIABLE INSURANCE TRUST MID CAP VALUE FUND
Statement Regarding Basis for Approval of Management Agreement (Unaudited) (continued)
Conclusion
In connection with their consideration of the Management Agreement, the Trustees gave weight to each of the factors described above, but did not identify any particular factor as controlling their decision. After deliberation and consideration of all of the information provided, including the factors described above, the Trustees concluded, in the exercise of their business judgment, that the management fees paid by the Fund were reasonable in light of the services provided to it by the Investment Adviser, the Investment Adviser’s costs and the Fund’s current and reasonably foreseeable asset levels. The Trustees unanimously concluded that the Investment Adviser’s continued management likely would benefit the Fund and its shareholders and that the Management Agreement should be approved and continued with respect to the Fund until June 30, 2017.
25
| TRUSTEES | OFFICERS | |
| Ashok N. Bakhru, Chairman | James A. McNamara, President | |
| Kathryn A. Cassidy | Scott M. McHugh, Principal Financial Officer, | |
| Diana M. Daniels | Senior Vice President and Treasurer | |
| Herbert J. Markley | Caroline L. Kraus, Secretary | |
| James A. McNamara | ||
| Jessica Palmer | ||
| Alan A. Shuch | ||
| Roy W. Templin | ||
| Gregory G. Weaver |
GOLDMAN, SACHS & CO.
Distributor and Transfer Agent
GOLDMAN SACHS ASSET MANAGEMENT, L.P.
Investment Adviser
200 West Street, New York
New York 10282
Visit our web site at www.GSAMFUNDS.com to obtain the most recent month-end returns.
The reports concerning the Fund included in this shareholder report may contain certain forward-looking statements about the factors that may affect the performance of the Fund in the future. These statements are based on Fund management’s predictions and expectations concerning certain future events and their expected impact on the Fund, such as performance of the economy as a whole and of specific industry sectors, changes in the levels of interest rates, the impact of developing world events, and other factors that may influence the future performance of the Fund. Management believes these forward-looking statements to be reasonable, although they are inherently uncertain and difficult to predict. Actual events may cause adjustments in portfolio management strategies from those currently expected to be employed.
A description of the policies and procedures that the Fund uses to determine how to vote proxies relating to portfolio securities and information regarding how the Fund voted proxies relating to portfolio securities for the 12-month period ended June 30 is available (i) without charge, upon request by calling 1-800-621-2550; and (ii) on the Securities and Exchange Commission (“SEC”) web site at http://www.sec.gov.
The Fund files its complete schedule of portfolio holdings with the SEC for the first and third quarters of each fiscal year on Form N-Q. The Fund’s Form N-Qs are available on the SEC’s web site at http://www.sec.gov within 60 days after the Fund’s first and third fiscal quarters. The Fund’s Form N-Qs may be reviewed and copied at the SEC’s Public Reference Room in Washington, D.C. and information on the operation of the Public Reference Room may also be obtained by calling 1-800-SEC-0330. Form N-Qs may be obtained upon request and without charge by calling 1-800-621-2550.
The website links provided are for your convenience only and are not an endorsement or recommendation by GSAM of any of these websites or the products or services offered. GSAM is not responsible for the accuracy and validity of the content of these websites.
Fund holdings and allocations shown are as of June 30, 2016 and may not be representative of future investments. Fund holdings should not be relied on in making investment decisions and should not be construed as research or investment advice regarding particular securities. Current and future holdings are subject to risk.
References to indices, benchmarks or other measures of relative market performance over a specified period of time are provided for your information only and do not imply that the portfolio will achieve similar results. The index composition may not reflect the manner in which a portfolio is constructed. While an adviser seeks to design a portfolio which reflects appropriate risk and return features, portfolio characteristics may deviate from those of the benchmark.
The Global Industry Classification Standard (“GICS”) was developed by and is the exclusive property and a service mark of Morgan Stanley Capital International Inc. (“MSCI”) and Standard & Poor’s, a division of The McGraw-Hill Companies, Inc. (“S&P”) and is licensed for use by Goldman Sachs. Neither MSCI, S&P nor any other party involved in making or compiling the GICS or any GICS classifications makes any express or implied warranties or representations with respect to such standard or classification (or the results to be obtained by the use thereof), and all such parties hereby expressly disclaim all warranties of originality, accuracy, completeness, merchantability or fitness for a particular purpose with respect to any of such standard or classification. Without limiting any of the foregoing, in no event shall MSCI, S&P, any of their affiliates or any third party involved in making or compiling the GICS or any GICS classifications have any liability for any direct, indirect, special, punitive, consequential or any other damages (including lost profits) even if notified of the possibility of such damages.
The portfolio risk management process includes an effort to monitor and manage risk, but does not imply low risk.
Shares of the Goldman Sachs VIT Funds are offered to separate accounts of participating life insurance companies for the purpose of funding variable annuity contracts and variable life insurance policies. Shares of the Fund are not offered directly to the general public. The variable annuity contracts and variable life insurance policies are described in the separate prospectuses issued by participating insurance companies. You should refer to those prospectuses for information about surrender charges, mortality and expense risk fees and other charges that may be assessed by participating insurance companies under the variable annuity contracts or variable life insurance policies. Such fees or charges, if any, may affect the return you may realize with respect to your investments. Ask your representative for more complete information. Please consider a fund’s objectives, risks and charges and expenses, and read the prospectus carefully before investing. The prospectus contains this and other information about the Fund.
This material is not authorized for distribution to prospective investors unless preceded or accompanied by a current Prospectus or summary prospectus, if applicable. Investors should consider a Fund’s objective, risks, and charges and expenses, and read the summary prospectus, if available, and/or the Prospectus carefully before investing or sending money. The summary prospectus, if available, and the Prospectus contain this and other information about a Fund and may be obtained from your Authorized Institution or from Goldman, Sachs & Co. by calling 1-800-621-2550.
This report is prepared for the general information of contract owners and is not an offer of shares of the Goldman Sachs Variable Insurance Trust: Goldman Sachs Mid Cap Value Fund.
Goldman, Sachs & Co. is the distributor of the Goldman Sachs Funds and the Goldman Sachs Variable Insurance Trust Funds.
© 2016 Goldman Sachs. All rights reserved.
VITMCVSAR-16/58887-TMPL-08/2016/32.5K
Goldman
Sachs Variable Insurance Trust
Goldman Sachs Government
Money Market Fund
(formerly Goldman Sachs Money Market Fund)
Semi-Annual Report
June 30, 2016

GOLDMAN SACHS VARIABLE INSURANCE TRUST GOVERNMENT MONEY MARKET FUND
INVESTMENT OBJECTIVE
The Fund seeks to maximize current income to the extent consistent with the preservation of capital and the maintenance of liquidity by investing exclusively in high quality money market instruments.
Portfolio Management Discussion and Analysis
Effective April 15, 2016, the VIT Goldman Sachs Money Market Fund was repositioned and renamed the VIT Goldman Sachs Government Money Market Fund. The repositioned and renamed Fund pursues its investment objective by investing only in government securities.
Below, the Goldman Sachs Money Market Portfolio Management Team discusses the Goldman Sachs Variable Insurance Trust — Goldman Sachs Government Money Market Fund’s (the “Fund”) performance and positioning for the six-month period ended June 30, 2016 (the “Reporting Period”).
How did the Fund perform during the Reporting Period?
The Fund’s Institutional Shares’ standardized 7-day current yield was 0.31% and their standardized 7-day effective yield was also 0.31% as of June 30, 2016. The Institutional Shares’ one-month simple average yield was 0.29% as of June 30, 2016. The Institutional Shares’ 7-day distribution yield as of June 30, 2016 was 0.34%.
The Fund’s Service Shares’ standardized 7-day current yield was 0.06% and their standardized 7-day effective yield was also 0.06% as of June 30, 2016. The Service Shares’ one-month simple average yield was 0.04% as of June 30, 2016. The Service Shares’ 7-day distribution yield as of June 30, 2016 was 0.09%.
The yields represent past performance. Past performance does not guarantee future results. Current performance may be lower or higher than the performance quoted above.
Yields will fluctuate as market conditions change. The yield quotations more closely reflect the current earnings of the Fund than total return quotations.
What economic and market factors most influenced the money markets as a whole during the Reporting Period?
The Reporting Period was one wherein money market yields remained low throughout, as the Federal Reserve (the “Fed”), after making its initial rate hike since 2006 in December 2015, kept interest rates steady throughout. Following the Brexit vote, or the U.K. referendum on membership in the European Union, which ended in a surprise “leave” decision, expectations for further Fed rate hikes reduced sharply, and, in turn, the short-term end of the U.S. Treasury yield curve flattened materially, meaning differentials between yields on various maturities narrowed. The credit curve widened versus U.S. Treasuries, as increased uncertainty added to already weak investor demand. In terms of absolute yield, credit yields were higher at the end of the Reporting Period than they were pre-Brexit. For the Reporting Period overall, the money market yield curve flattened, as short-term rates rose slightly while longer-end rates declined.
During the Reporting Period, all eyes were on the Fed, with the release of its policy statement, updated economic projections and a press conference following a two-day meeting in March 2016 of particular attention. The statement leaned dovish, as it twice mentioned global economic conditions as a key concern. (Dovish languages tends to suggest lower interest rates.) The projections were also dovish, as the path of interest rates came down, with the median projection then calling for two hikes in 2016, down from four in December 2015. Near-term core inflation was unchanged. The press conference was fairly balanced, focusing on global concerns and inflation expectations, which remained lower than the Fed would like, among other topics. However, the Fed was also careful to note that it does not view an overshoot of its inflation target as an acceptable outcome.
Markets reacted accordingly, with rates rallying, the U.S. dollar falling, equities rising and the derivative market reducing the probability of a June 2016 interest rate hike. The Fed signaled more sensitivity to the global economic environment than expected from many market participants.
On the domestic economic front, the labor market performed well, and developments at the end of the first quarter of 2016 maintained the dichotomy between further improvement in the labor market and concerns about global conditions on the part of the Fed leadership. Non-farm payrolls were above consensus expectations. The unemployment rate rose 0.1% to 5.0%, however, this
1
GOLDMAN SACHS VARIABLE INSURANCE TRUST GOVERNMENT MONEY MARKET FUND
was largely due to an uptick in the participation rate, also by 0.1%, to 63.0%. Average hourly earnings rose more than expected, increasing at a 2.3% year over year pace.
We began 2016 talking of gradually improving economic growth prospects and firming inflation, with a pro-risk stance. This view evolved to become more bearish on risk assets based on the events of the second calendar quarter. More specifically, risk assets rallied on stabilization in commodities prices and a decline in perceived risks around slowing Chinese economic growth and U.S. recession. However, the U.K.’s vote to leave the European Union produced a renewed sense of uncertainty in the markets. In addition, upcoming U.S. elections are likely, in our view, to add to uncertainty and volatility in markets. Sovereign bond yields declined during the second quarter of 2016 on easy monetary policy from central banks globally and diminished chances of a Fed interest rate hike in 2016.
U.S. non-farm payrolls indicated 287,000 new jobs in June 2016, significantly above market expectations of approximately 180,000. The unemployment rate ticked back down to 4.9%. Still, it remained unclear what the jobs report means for the Fed given limited wage/inflation pressure. The Fed remained focused on downside risk and lack of inflation pressure.
The Fed met in June 2016. While its statement was marginally dovish, and the economic data estimates for Gross Domestic Product (“GDP”), inflation and unemployment, were largely unchanged, the fed funds forecasts shifted in a materially dovish way. Median projections for 2017-2018 as well as the long-run federal funds rate estimate all came down. In addition, the tone of the press conference leaned dovish, with worries about slowing labor market momentum as the key takeaway. Given the small changes to the economic forecasts followed by the larger changes to the fed funds projections, it seems as though this dichotomy can be explained by one of two — or possibly both — ways. One, a dovish shift in the Fed reaction function, or how it interprets and reacts to economic data and market developments. And two, a belief that the U.S. economy’s long-term potential is diminished and therefore may require a lower rate of interest going forward, a theory the Fed had previously been reluctant to embrace.
Were there any changes to the Fund’s investment strategy during the Reporting Period?
During the Reporting Period, the Fund officially transitioned from a prime money market fund to a government money market fund, effective April 15, 2016. In the months prior to April 15, 2016, we gradually increased the Fund’s holdings of U.S. government securities. To qualify as a government money market fund, the Fund must invest at least 99.5% of its total assets in government securities, cash or repurchase agreements collateralized by government securities or cash. As a government money market fund, the Fund seeks to maintain a stable $1.00 net asset value per share and is not subject to liquidity fees and/or redemption gates.
What key factors were responsible for the Fund’s performance during the Reporting Period?
The Fund’s yields remained low during the Reporting Period due primarily to the market factors discussed above. With the targeted federal funds rate within a range of 0.25% and 0.50% throughout the Reporting Period, money market yields remained anchored near the same level with little difference between maturities. That said, the money market yield curve, or spectrum of maturities, did flatten during the Reporting Period, as shorter-term rates rose slightly and longer-rate rates declined. The Fund remained highly liquid throughout.
During the first quarter of 2016, we had a bias to keep the Fund’s weighted average maturity long and targeted a 45 to 55 day range. We preferred floating rate securities, as, in our view, the market was pricing attractively versus a more aggressive Fed rate hike scenario.
In the second quarter of 2016, we shortened the Fund’s weighted average maturity target range to 30 to 40 days, as we felt yield levels did not offer enough compensation to extend on the money market yield curve. We continued to focus on floating rate securities where we saw what we considered to be attractive opportunities. We also looked to extend duration opportunistically later in the second quarter given dovish messaging from the Fed.
We felt comfortable that the Fund was appropriately positioned given the interest rate environment during the Reporting Period. While conditions throughout the Reporting Period did not provide bountiful opportunities to pick up yield, as the interest rate yield curve flattened through most of the Reporting Period, it should be noted that regardless of interest rate conditions, we manage the Fund consistently. Our investment approach has always been tri-fold—to seek preservation of capital, daily liquidity and maximization of yield potential. We manage interest and credit risk daily. Whether interest rates are historically low, high or in-between, we intend to continue to use our actively managed approach to seek to provide the best possible return within the framework of the Fund’s guidelines and objectives.
2
GOLDMAN SACHS VARIABLE INSURANCE TRUST GOVERNMENT MONEY MARKET FUND
How did you manage the Fund’s weighted average maturity during the Reporting Period?
On December 31, 2015, the Fund’s weighted average maturity was 52 days. During the first quarter of 2016, we maintained the Fund’s weighted average maturity in a 45 to 55 day range. During the second quarter of 2016, we targeted a weighted average maturity for the Fund in a 30 to 40 day range. Throughout, we made adjustments in line with our outlook on interest rates, Fed policy and the shape of the yield curve over the near term. The Fund’s weighted average maturity on June 30, 2016 was 35 days. The weighted average maturity of a money market fund is a measure of its price sensitivity to changes in interest rates. Also known as effective maturity, weighted average maturity measures the weighted average of the maturity date of bonds held by the Fund taking into consideration any available maturity shortening features.
How did you manage the Fund’s weighted average life during the Reporting Period?
The weighted average life of the Fund was 104 days as of June 30, 2016. The weighted average life of a money market fund is a measure of a money market fund’s price sensitivity to changes in liquidity and/or credit risk.
Under amendments to SEC Rule 2a-7, which governs money market funds, became effective in May 2010, the maximum allowable weighted average life of a money market fund is 120 days. While one of the goals of Rule 2a-7 is to reinforce conservative investment practices across the money market fund industry, our security selection process has long emphasized conservative investment choices.
How was the Fund invested during the Reporting Period?
The Fund had investments in commercial paper, asset-backed commercial paper, U.S. Treasury securities, government agency securities, repurchase agreements, government guaranteed paper, variable rate demand notes, municipal debt and certificates of deposit during the Reporting Period. We focused on securities across the maturity spectrum, from overnight repurchase agreements to securities with one-year maturities. We preferred secured positions to unsecured positions.
With yields bound in a low range, there was not a lot of dispersion in performance among securities available for purchase. Throughout, though, we stayed true to our investment discipline, favoring liquidity and high quality credits over added yield. The primary focal points for our team are consistently managing interest rate risk and credit risk. We were able to navigate interest rate risk by adjusting the Fund’s weighted average maturity longer or shorter as market conditions shifted and to mitigate potential credit risk by buying high quality, creditworthy names, strategies which added to the Fund’s performance during the Reporting Period.
Did you make any changes in the Fund’s portfolio during the Reporting Period?
As mentioned earlier, the Fund transitioned from a prime money market fund to a government money market fund during the Reporting Period. As such, the Fund ended the Reporting Period with investments in government agency securities, U.S. Treasury securities and government agency repurchase agreements. Also, as indicated earlier, we made adjustments to the Fund’s weighted average maturity and to specific security type composition allocations based on then-current market conditions, our near-term view, and anticipated and actual Fed monetary policy statements.
What is the Fund’s tactical view and strategy for the months ahead?
At the end of the Reporting Period, it was our view that the chances of an interest rate hike by the Fed in the remainder of 2016 were diminished following the Brexit vote. However, with domestic economic momentum still generally positive, we do not view an interest rate hike later this year as off the table.
We expect to keep the Fund conservatively positioned as we continue to focus on preservation of capital and daily liquidity. We do not believe there is value in sacrificing liquidity in exchange for opportunities that only modestly increase yield potential. We will continue to use our actively managed approach to seek the best possible return within the framework of the Fund’s investment guidelines and objectives. In addition, we will continue to manage interest, liquidity and credit risk daily.
We will, of course, continue to closely monitor economic data, Fed policy, and any shifts in the money market yield curve, as we strive to strategically navigate the interest rate environment.
3
FUND BASICS
FUND COMPOSITION†
Security Type
(Percentage of Net Assets)
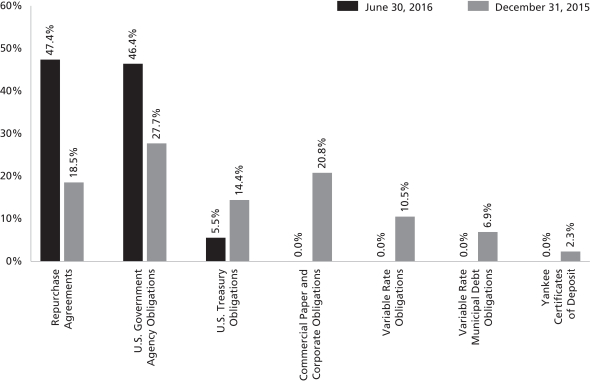
| † | The Fund is actively managed and, as such, its portfolio composition may differ over time. The percentage shown for each investment category reflects the value (based on amortized cost) of investments in that category as a percentage of net assets. Figures in the above chart may not sum to 100% due to the exclusion of other assets and liabilities. |
4
GOLDMAN SACHS VARIABLE INSURANCE TRUST GOVERNMENT MONEY MARKET FUND
Schedule of Investments
June 30, 2016 (Unaudited)
Principal Amount | Interest Rate | Maturity Date | Amortized Cost | |||||||||||
| U.S. Government Agency Obligations – 46.4% | ||||||||||||||
| Federal Farm Credit Bank |
| ||||||||||||
| $ | 200,000 | 0.530 | %(a) | 07/27/16 | $ | 199,998 | ||||||||
| 1,000,000 | 0.527 | (a) | 09/14/16 | 1,000,000 | ||||||||||
| 3,000,000 | 0.469 | 09/28/16 | 2,996,588 | |||||||||||
| 2,000,000 | 0.489 | (a) | 09/29/16 | 1,999,988 | ||||||||||
| 8,000,000 | 0.490 | 10/06/16 | 7,989,653 | |||||||||||
| 3,000,000 | 0.454 | (a) | 12/02/16 | 2,999,953 | ||||||||||
| 1,500,000 | 0.519 | (a) | 12/29/16 | 1,499,926 | ||||||||||
| 100,000 | 0.511 | (a) | 12/30/16 | 100,031 | ||||||||||
| 2,500,000 | 0.533 | (a) | 01/20/17 | 2,500,000 | ||||||||||
| 500,000 | 0.545 | (a) | 04/07/17 | 499,985 | ||||||||||
| 1,200,000 | 0.553 | (a) | 04/25/17 | 1,200,000 | ||||||||||
| 10,000,000 | 0.511 | (a) | 05/23/17 | 10,000,000 | ||||||||||
| 300,000 | 0.626 | (a) | 06/13/17 | 300,348 | ||||||||||
| 350,000 | 0.513 | (a) | 06/15/17 | 350,000 | ||||||||||
| 2,000,000 | 0.485 | (a) | 06/30/17 | 1,999,919 | ||||||||||
| 1,000,000 | 0.637 | (a) | 08/01/17 | 999,467 | ||||||||||
| 300,000 | 0.482 | (a) | 09/15/17 | 299,982 | ||||||||||
| Federal Home Loan Bank |
| ||||||||||||
| 3,000,000 | 0.610 | 07/08/16 | 3,000,000 | |||||||||||
| 3,500,000 | 0.500 | 07/26/16 | 3,500,000 | |||||||||||
| 3,000,000 | 0.405 | 09/16/16 | 2,997,446 | |||||||||||
| 1,250,000 | 0.407 | 09/16/16 | 1,248,931 | |||||||||||
| 2,500,000 | 0.510 | 09/19/16 | 2,497,222 | |||||||||||
| 2,550,000 | 0.519 | 09/21/16 | 2,547,044 | |||||||||||
| 1,000,000 | 0.533 | (a) | 09/22/16 | 999,999 | ||||||||||
| 2,000,000 | 0.500 | 09/23/16 | 1,999,903 | |||||||||||
| 1,350,000 | 0.454 | 10/03/16 | 1,348,431 | |||||||||||
| 2,500,000 | 0.551 | (a) | 10/12/16 | 2,499,887 | ||||||||||
| 2,000,000 | 0.454 | 10/13/16 | 1,997,429 | |||||||||||
| 2,750,000 | 0.463 | 10/21/16 | 2,746,116 | |||||||||||
| 2,000,000 | 0.474 | 10/26/16 | 1,996,977 | |||||||||||
| 2,500,000 | 0.557 | (a) | 11/01/16 | 2,500,000 | ||||||||||
| 5,000,000 | 0.525 | (a) | 11/03/16 | 5,000,000 | ||||||||||
| 2,500,000 | 0.557 | (a) | 11/03/16 | 2,500,000 | ||||||||||
| 3,000,000 | 0.464 | 11/04/16 | 2,995,222 | |||||||||||
| 1,000,000 | 0.459 | 11/07/16 | 998,387 | |||||||||||
| 5,500,000 | 0.552 | (a) | 11/08/16 | 5,499,999 | ||||||||||
| 900,000 | 0.457 | 11/14/16 | 898,477 | |||||||||||
| 600,000 | 0.513 | 12/07/16 | 598,662 | |||||||||||
| 1,600,000 | 0.519 | 12/07/16 | 1,596,396 | |||||||||||
| 3,250,000 | 0.510 | 12/09/16 | 3,242,733 | |||||||||||
| 1,500,000 | 0.442 | (a) | 12/15/16 | 1,500,000 | ||||||||||
| 1,750,000 | 0.482 | (a) | 12/23/16 | 1,750,000 | ||||||||||
| 3,000,000 | 0.519 | 12/23/16 | 2,992,592 | |||||||||||
| 2,500,000 | 0.543 | (a) | 01/17/17 | 2,498,726 | ||||||||||
| 3,500,000 | 0.488 | (a) | 01/25/17 | 3,500,000 | ||||||||||
| 5,000,000 | 0.464 | (a) | 02/06/17 | 5,000,000 | ||||||||||
| 500,000 | 0.572 | (a) | 02/07/17 | 499,964 | ||||||||||
| 5,000,000 | 0.568 | (a) | 02/17/17 | 5,000,000 | ||||||||||
| 10,000,000 | 0.556 | (a) | 03/03/17 | 10,000,000 | ||||||||||
| 2,000,000 | 0.611 | (a) | 03/03/17 | 2,000,000 | ||||||||||
| 1,500,000 | 0.596 | (a) | 03/13/17 | 1,500,000 | ||||||||||
| 1,500,000 | 0.595 | (a) | 03/16/17 | 1,500,000 | ||||||||||
| 3,400,000 | 0.569 | (a) | 03/21/17 | 3,400,000 | ||||||||||
|
| |||||||||||||
| U.S. Government Agency Obligations – (continued) | ||||||||||||||
| Federal Home Loan Bank – (continued) |
| ||||||||||||
| $ | 3,500,000 | 0.517 | %(a) | 03/29/17 | $ | 3,500,000 | ||||||||
| 2,450,000 | 0.528 | (a) | 04/13/17 | 2,450,000 | ||||||||||
| 1,500,000 | 0.533 | (a) | 04/18/17 | 1,500,000 | ||||||||||
| 7,000,000 | 0.547 | (a) | 06/09/17 | 7,000,000 | ||||||||||
| 1,500,000 | 0.518 | (a) | 06/15/17 | 1,500,000 | ||||||||||
| 2,500,000 | 0.644 | (a) | 08/28/17 | 2,499,708 | ||||||||||
| 1,000,000 | 0.607 | (a) | 09/29/17 | 1,000,000 | ||||||||||
| Federal Home Loan Mortgage Corporation |
| ||||||||||||
| 10,000,000 | 0.453 | (a) | 04/20/17 | 9,998,772 | ||||||||||
| 6,099,000 | 0.709 | (a) | 04/26/17 | 6,098,500 | ||||||||||
| 1,434,000 | 1.250 | 05/12/17 | 1,441,067 | |||||||||||
| 139,000 | 1.000 | 06/29/17 | 139,568 | |||||||||||
| 3,500,000 | 0.567 | (a) | 12/20/17 | 3,500,000 | ||||||||||
| Federal National Mortgage Association |
| ||||||||||||
| 200,000 | 0.750 | 04/20/17 | 200,156 | |||||||||||
| 1,994,000 | 5.000 | 05/11/17 | 2,066,515 | |||||||||||
| 100,000 | 0.609 | 06/01/17 | 99,445 | |||||||||||
| 735,000 | 5.375 | 06/12/17 | 767,765 | |||||||||||
| 1,225,000 | 0.468 | (a) | 07/20/17 | 1,224,221 | ||||||||||
|
| |||||||||||||
|
| TOTAL U.S. GOVERNMENT AGENCY OBLIGATIONS |
| $ | 178,272,098 | ||||||||||
|
| |||||||||||||
| U.S. Treasury Obligations – 5.5% | ||||||||||||||
| United States Treasury Floating Rate Note |
| ||||||||||||
| $ | 9,000,000 | 0.330 | %(a) | 07/31/16 | $ | 9,000,316 | ||||||||
| United States Treasury Notes |
| ||||||||||||
| 5,150,000 | 4.875 | 08/15/16 | 5,176,191 | |||||||||||
| 2,000,000 | 1.000 | 10/31/16 | 2,003,017 | |||||||||||
| 2,000,000 | 3.125 | 10/31/16 | 2,017,103 | |||||||||||
| 1,200,000 | 4.625 | 11/15/16 | 1,217,393 | |||||||||||
| 1,500,000 | 7.500 | 11/15/16 | 1,538,285 | |||||||||||
|
| |||||||||||||
| | TOTAL U.S. TREASURY OBLIGATIONS | | $ | 20,952,305 | ||||||||||
|
| |||||||||||||
| | TOTAL INVESTMENTS BEFORE REPURCHASE AGREEMENTS | | $ | 199,224,403 | ||||||||||
|
| |||||||||||||
| Repurchase Agreements(b) – 47.4% | ||||||||||||||
| Joint Repurchase Agreement Account III |
| ||||||||||||
| $ | 182,400,000 | 0.429 | % | 07/01/16 | $ | 182,400,000 | ||||||||
| Maturity Value: $182,402,172 |
| ||||||||||||
|
| |||||||||||||
| TOTAL INVESTMENTS – 99.3% | $ | 381,624,403 | ||||||||||||
|
| |||||||||||||
| OTHER ASSETS IN EXCESS OF | | 2,802,839 | |||||||||||
|
| |||||||||||||
| NET ASSETS – 100.0% | $ | 384,427,242 | ||||||||||||
|
| |||||||||||||
| The accompanying notes are an integral part of these financial statements. | 5 |
GOLDMAN SACHS VARIABLE INSURANCE TRUST GOVERNMENT MONEY MARKET FUND
Schedule of Investments (continued)
June 30, 2016 (Unaudited)
| The percentage shown for each investment category reflects the value of investments in that category as a percentage of net assets. | ||
| (a) | Variable or floating rate security. Interest rate disclosed is that which is in effect at June 30, 2016. | |
| (b) | Unless noted, all repurchase agreements were entered into on June 30, 2016. Additional information on Joint Repurchase Agreement Account III appears on page 7. | |
| Interest rates represent either the stated coupon rate, annualized yield on date of purchase for discounted securities, or, for floating rate securities, the current reset rate, which is based upon current interest rate indices. | ||
| Maturity dates represent either the final legal maturity date on the security, the demand date for puttable securities, or the prerefunded date for those types of securities. | ||
| 6 | The accompanying notes are an integral part of these financial statements. |
GOLDMAN SACHS VARIABLE INSURANCE TRUST GOVERNMENT MONEY MARKET FUND
ADDITIONAL INVESTMENT INFORMATION
JOINT REPURCHASE AGREEMENT ACCOUNT III — At June 30, 2016, the Fund had undivided interests in the Joint Repurchase Agreement Account III, with a maturity date of July 1, 2016, as follows:
| Principal Amount | Maturity Value | Collateral Value | |||||||||||
| $182,400,000 | $ | 182,402,172 | $ | 187,607,476 | |||||||||
REPURCHASE AGREEMENTS — At June 30, 2016, the Principal Amounts of the Fund’s interest in the Joint Repurchase Agreement Account III were as follows:
| Counterparty | Interest Rate | Principal Amount | ||||||
ABN Amro Bank N.V. | 0.440 | % | $ | 8,130,081 | ||||
Bank of America, N.A. | 0.440 | 16,260,163 | ||||||
BNP Paribas | 0.400 | 48,780,488 | ||||||
Citigroup Global Markets, Inc. | 0.440 | 5,164,228 | ||||||
Credit Agricole Corporate and Investment Bank | 0.480 | 13,008,130 | ||||||
TD Securities USA, LLC | 0.440 | 27,642,276 | ||||||
Wells Fargo Securities, LLC | 0.430 | 63,414,634 | ||||||
| TOTAL | $ | 182,400,000 | ||||||
At June 30, 2016, the Joint Repurchase Agreement Account III was fully collateralized by:
| Issuer | Interest Rates | Maturity Dates | ||||||
| Federal Home Loan Mortgage Corp. | 2.000 to 6.000 | % | 12/01/23 to 12/01/47 | |||||
| Federal National Mortgage Association | 2.000 to 8.500 | 12/01/17 to 06/01/46 | ||||||
| Government National Mortgage Association | 3.500 to 4.000 | 06/15/42 to 12/20/45 | ||||||
| U.S. Treasury Bill | 0.000 | 09/08/16 | ||||||
| U.S. Treasury Bonds | 3.000 to 5.375 | 02/15/31 to 11/15/44 | ||||||
| U.S. Treasury Inflation-Indexed Notes | 0.250 to 0.625 | 01/15/24 to 01/15/25 | ||||||
| U.S. Treasury Notes | 0.625 to 2.750 | 08/31/17 to 02/15/25 | ||||||
| The accompanying notes are an integral part of these financial statements. | 7 |
GOLDMAN SACHS VARIABLE INSURANCE TRUST GOVERNMENT MONEY MARKET FUND
Statement of Assets and Liabilities
June 30, 2016 (Unaudited)
| Assets: | ||||
Investments based on amortized cost | $ | 199,224,403 | ||
Repurchase agreements based on amortized cost | 182,400,000 | |||
Cash | 48,977 | |||
Receivables: | ||||
Fund shares sold | 2,709,626 | |||
Interest | 233,932 | |||
Reimbursement from adviser | 16,765 | |||
| Total assets | 384,633,703 | |||
| Liabilities: | ||||
Payables: | ||||
Distribution and Service fees and Transfer Agency fees | 73,385 | |||
Fund shares redeemed | 66,043 | |||
Management fees | 47,955 | |||
Accrued expenses | 19,078 | |||
| Total liabilities | 206,461 | |||
| Net Assets: | ||||
Paid-in capital | 384,416,013 | |||
Accumulated net realized gain from investments | 11,229 | |||
| NET ASSETS | $ | 384,427,242 | ||
Net asset value, offering and redemption price per share | $ | 1.00 | ||
Net Assets: | ||||
Institutional Shares | $ | 37,945,999 | ||
Service Shares | 346,481,243 | |||
Total Net Assets | $ | 384,427,242 | ||
Shares of beneficial interest outstanding $0.001 par value (unlimited shares authorized): | ||||
Institutional Shares | 37,944,928 | |||
Service Shares | 346,471,066 | |||
| 8 | The accompanying notes are an integral part of these financial statements. |
GOLDMAN SACHS VARIABLE INSURANCE TRUST GOVERNMENT MONEY MARKET FUND
Statement of Operations
For the Six Months Ended June 30, 2016 (Unaudited)
| Investment income: | ||||
Interest | $ | 788,698 | ||
| Expenses: | ||||
Distribution and Service fees — Service Shares | 419,148 | |||
Management fees | 351,682 | |||
Professional fees | 44,792 | |||
Transfer Agency fees(a) | 34,310 | |||
Custody, accounting and administrative services | 22,848 | |||
Printing and mailing costs | 18,676 | |||
Trustee fees | 12,973 | |||
Other | 2,077 | |||
| Total expenses | 906,506 | |||
Less — expense reductions | (136,356 | ) | ||
| Net expenses | 770,150 | |||
| NET INVESTMENT INCOME | 18,548 | |||
| NET REALIZED GAIN FROM INVESTMENT TRANSACTIONS | 33,550 | |||
| NET INCREASE IN NET ASSETS RESULTING FROM OPERATIONS | $ | 52,098 | ||
(a) Institutional and Service Shares incurred Transfer Agency fees of $ 779 and $ 33,531, respectively.
| The accompanying notes are an integral part of these financial statements. | 9 |
GOLDMAN SACHS VARIABLE INSURANCE TRUST GOVERNMENT MONEY MARKET FUND
Statements of Changes in Net Assets
| For the Six Months Ended June 30, 2016 (Unaudited) | For the Fiscal Year Ended December 31, 2015 | |||||||
| From operations: | ||||||||
Net investment income | $ | 18,548 | $ | 17,323 | ||||
Net realized gain from investment transactions | 33,550 | 1,557 | ||||||
| Net increase in net assets resulting from operations | 52,098 | 18,880 | ||||||
| Distributions to shareholders: | ||||||||
From net investment income: | ||||||||
Institutional Shares | (10,063 | ) | (179 | ) | ||||
Service Shares | (8,485 | ) | (17,144 | ) | ||||
From net realized gains: | ||||||||
Institutional Shares | (886 | ) | (3 | ) | ||||
Service Shares | (22,919 | ) | (1,874 | ) | ||||
| Total distributions to shareholders | (42,353 | ) | (19,200 | ) | ||||
| From share transactions (at $1.00 per share): | ||||||||
Proceeds from sales of shares | 165,366,719 | 206,637,372 | ||||||
Reinvestment of distributions | 42,353 | 19,200 | ||||||
Cost of shares redeemed | (110,336,178 | ) | (184,078,571 | ) | ||||
| Net increase in net assets resulting from share transactions | 55,072,894 | 22,578,001 | ||||||
| TOTAL INCREASE | 55,082,639 | 22,577,681 | ||||||
| Net assets: | ||||||||
Beginning of period | 329,344,603 | 306,766,922 | ||||||
End of period | $ | 384,427,242 | $ | 329,344,603 | ||||
| 10 | The accompanying notes are an integral part of these financial statements. |
GOLDMAN SACHS VARIABLE INSURANCE TRUST GOVERNMENT MONEY MARKET FUND
Financial Highlights
Selected Data for a Share Outstanding Throughout Each Period
| Year - Share Class | Net asset value, beginning of period | Net investment income(a) | Distributions from net investment income(b) | Net asset value, end of period | Total return(c) | Net assets, end of period (in 000's) | Ratio of net expenses to average net assets | Ratio of total expenses to average net assets | Ratio of net investment income to average net assets | |||||||||||||||||||||||||||
FOR THE SIX MONTHS ENDED JUNE 30, (UNAUDITED) | ||||||||||||||||||||||||||||||||||||
2016 - Institutional | $ | 1.00 | $ | 0.001 | $ | (0.001 | ) | $ | 1.00 | 0.07 | % | $ | 37,946 | 0.21 | %(d) | 0.29 | %(d) | 0.26 | %(d) | |||||||||||||||||
2016 - Service | 1.00 | — | (e) | — | (e) | 1.00 | 0.01 | 346,481 | 0.45 | (d) | 0.54 | (d) | 0.01 | (d) | ||||||||||||||||||||||
FOR THE FISCAL YEARS ENDED DECEMBER 31, | ||||||||||||||||||||||||||||||||||||
2015 - Institutional | 1.00 | — | (e) | — | (e) | 1.00 | 0.02 | 1,143 | 0.23 | 0.31 | 0.03 | |||||||||||||||||||||||||
2015 - Service | 1.00 | — | (e) | — | (e) | 1.00 | 0.01 | 328,202 | 0.26 | 0.56 | 0.01 | |||||||||||||||||||||||||
2014 - Institutional | 1.00 | — | (e) | — | (e) | 1.00 | 0.01 | 773 | 0.23 | 0.31 | 0.03 | |||||||||||||||||||||||||
2014 - Service | 1.00 | — | (e) | — | (e) | 1.00 | 0.01 | 305,994 | 0.24 | 0.56 | — | (f) | ||||||||||||||||||||||||
2013 - Institutional(g) | 1.00 | — | (e) | — | (e) | 1.00 | 0.01 | 25 | 0.24 | (d) | 0.36 | (d) | 0.04 | (d) | ||||||||||||||||||||||
2013 - Service | 1.00 | — | (e) | — | (e) | 1.00 | 0.01 | 316,404 | 0.28 | 0.55 | — | (f) | ||||||||||||||||||||||||
2012 - Service | 1.00 | — | (e) | — | (e) | 1.00 | 0.01 | 357,545 | 0.35 | 0.53 | — | (f) | ||||||||||||||||||||||||
2011 - Service | 1.00 | — | (e) | — | (e) | 1.00 | 0.01 | 144,173 | 0.30 | 0.66 | 0.01 | |||||||||||||||||||||||||
| (a) | Calculated based on the average shares outstanding methodology. |
| (b) | Distributions may not coincide with the current year net investment income or net realized gains as distributions may be paid from current or prior year earnings. |
| (c) | Assumes reinvestment of all distributions. |
| (d) | Annualized. |
| (e) | Amount is less than $0.0005 per share. |
| (f) | Amount is less than 0.005% of average net assets. |
| (g) | Commenced operations on October 16, 2013. |
| The accompanying notes are an integral part of these financial statements. | 11 |
GOLDMAN SACHS VARIABLE INSURANCE TRUST GOVERNMENT MONEY MARKET FUND
Notes to Financial Statements
June 30, 2016 (Unaudited)
1. ORGANIZATION
Goldman Sachs Variable Insurance Trust (the “Trust” or “VIT”) is a Delaware statutory trust registered under the Investment Company Act of 1940, as amended (the “Act”), as an open-end management investment company. The Trust includes the Goldman Sachs Government Money Market Fund (formerly, Goldman Sachs Money Market Fund) (the “Fund”). The Fund is a diversified portfolio under the Act offering two classes of shares — Institutional and Service Shares. Shares of the Trust are offered to separate accounts of participating life insurance companies for the purpose of funding variable annuity contracts and variable life insurance policies.
Goldman Sachs Asset Management, L.P. (“GSAM”), an affiliate of Goldman, Sachs & Co. (“Goldman Sachs”), serves as investment adviser to the Fund pursuant to a management agreement (the “Agreement”) with the Trust.
2. SIGNIFICANT ACCOUNTING POLICIES
The financial statements have been prepared in accordance with accounting principles generally accepted in the United States of America (“GAAP”) and require management to make estimates and assumptions that may affect the reported amounts and disclosures. Actual results may differ from those estimates and assumptions.
A. Investment Valuation — The investment valuation policy of the Fund is to use the amortized-cost method permitted by Rule 2a-7 under the Act, which approximates market value, for valuing portfolio securities. Under this method, all investments purchased at a discount or premium are valued by accreting or amortizing the difference between the original purchase price and maturity value of the issue, as an adjustment to interest income. Under procedures and tolerances approved by the Board of Trustees (“Trustees”), GSAM evaluates the difference between the Fund’s net asset value per share (“NAV”) based upon the amortized cost of the Fund’s securities and the NAV based upon available market quotations (or permitted substitutes) at least once a week.
B. Investment Income and Investments — Interest income is accrued daily and adjusted for amortization of premiums and accretion of discounts. Investment transactions are reflected on trade date. Realized gains and losses are calculated using identified cost.
C. Class Allocations and Expenses — Investment income, realized and unrealized gain (loss), and non-class specific expenses of the Fund are allocated daily based upon the proportion of net assets of each class. Class specific expenses, where applicable, are borne by the respective share classes and include Distribution and Service and Transfer Agency fees. Non-class specific expenses directly incurred by the Fund are charged to the Fund, while such expenses incurred by the Trust are allocated across the applicable Funds on a straight-line and/or pro-rata basis depending upon the nature of the expenses.
D. Federal Taxes and Distributions to Shareholders — It is the Fund’s policy to comply with the requirements of the Internal Revenue Code of 1986, as amended (the “Code”), applicable to regulated investment companies (mutual funds) and to distribute each year substantially all of its investment company taxable and tax-exempt income and capital gains to its shareholders. Accordingly, the Fund is not required to make any provisions for the payment of federal income tax. Distributions to shareholders are declared and recorded daily and paid monthly by the Fund and may include short-term capital gains. Long-term capital gain distributions, if any, are declared and paid annually.
Under the Regulated Investment Company Modernization Act of 2010, the Fund is permitted to carry forward capital losses incurred in taxable years beginning after December 22, 2010 for an unlimited period. However, any losses incurred during those future taxable years will be required to be utilized prior to the losses incurred in pre-enactment taxable years. As a result of this ordering rule, pre-enactment capital loss carryforwards may be more likely to expire unused. Additionally, post-enactment capital losses that are carried forward will retain their character as either short-term or long-term capital losses rather than being considered all short-term as under previous law.
The characterization of distributions to shareholders for financial reporting purposes is determined in accordance with federal income tax rules, which may differ from GAAP. The source of the Fund’s distributions may be shown in the accompanying
12
GOLDMAN SACHS VARIABLE INSURANCE TRUST GOVERNMENT MONEY MARKET FUND
2. SIGNIFICANT ACCOUNTING POLICIES (continued)
financial statements as either from net investment income, net realized gain or capital. Certain components of the Fund’s net assets on the Statement of Assets and Liabilities reflect permanent GAAP/tax differences based on the appropriate tax character.
The amortized cost for the Fund stated in the accompanying Statement of Assets and Liabilities also represents aggregate cost for U.S. federal income tax purposes.
GSAM has reviewed the Fund’s tax positions for all open tax years (the current and prior three years, as applicable) and has concluded that no provision for income tax is required in the Fund’s financial statements. Such open tax years remain subject to examination and adjustment by tax authorities.
E. Forward Commitments — A forward commitment involves entering into a contract to purchase or sell securities, typically on an extended settlement basis, for a fixed price at a future date. The purchase of securities on a forward commitment basis involves a risk of loss if the value of the security to be purchased declines before the settlement date. Conversely, the sale of securities on a forward commitment basis involves the risk that the value of the securities sold may increase before the settlement date. Although the Fund will generally purchase securities on a forward commitment basis with the intention of acquiring the securities for its portfolio, the Fund may dispose of forward commitments prior to settlement which may result in a realized gain or loss.
F. Repurchase Agreements — Repurchase agreements involve the purchase of securities subject to the seller’s agreement to repurchase the securities at a mutually agreed upon date and price, under the terms of a Master Repurchase Agreement (“MRA”). During the term of a repurchase agreement, the value of the underlying securities held as collateral on behalf of the Fund, including accrued interest, is required to exceed the value of the repurchase agreement, including accrued interest. The gross value of repurchase agreements is included in the Statement of Assets and Liabilities for financial reporting purposes. The underlying securities for all repurchase agreements are held at the Fund’s custodian or designated sub-custodians under tri-party repurchase agreements.
An MRA governs transactions between a Fund and select counterparties. An MRA contains provisions for, among other things, initiation of the transaction, income payments, events of default and maintenance of securities for repurchase agreements. An MRA also permits offsetting with collateral to create one single net payment in the event of default or similar events, including the bankruptcy or insolvency of a counterparty.
If the seller defaults, a Fund could suffer a loss to the extent that the proceeds from the sale of the underlying securities and other collateral held by the Fund are less than the repurchase price and the Fund’s costs associated with delay and enforcement of the repurchase agreement. In addition, in the event of default or insolvency of the seller, a court could determine that a Fund’s interest in the collateral is not enforceable, resulting in additional losses to the Fund.
Pursuant to exemptive relief granted by the Securities and Exchange Commission (“SEC”) and terms and conditions contained therein, the Fund, together with other funds of the Trust and registered investment companies having management agreements with GSAM or its affiliates, may transfer uninvested cash into joint accounts, the daily aggregate balance of which is invested in one or more repurchase agreements. Under these joint accounts, the Fund maintains pro-rata credit exposure to the underlying repurchase agreements’ counterparties. With the exception of certain transaction fees, the Fund is not subject to any expenses in relation to these investments.
3. INVESTMENTS AND FAIR VALUE MEASUREMENTS
The fair value of a financial instrument is the amount that would be received to sell an asset or paid to transfer a liability in an orderly transaction between market participants at the measurement date (i.e., the exit price). GAAP establishes a fair value hierarchy that prioritizes the inputs to valuation techniques used to measure fair value. The hierarchy gives the highest priority to unadjusted quoted prices in active markets for identical assets or liabilities (Level 1 measurements) and the lowest priority to
13
GOLDMAN SACHS VARIABLE INSURANCE TRUST GOVERNMENT MONEY MARKET FUND
Notes to Financial Statements (continued)
June 30, 2016 (Unaudited)
3. INVESTMENTS AND FAIR VALUE MEASUREMENTS (continued)
unobservable inputs (Level 3 measurements). The levels used for classifying investments are not necessarily an indication of the risk associated with investing in these investments. The three levels of the fair value hierarchy are described below:
Level 1 — Unadjusted quoted prices in active markets that are accessible at the measurement date for identical, unrestricted assets or liabilities;
Level 2 — Quoted prices in markets that are not active or financial instruments for which significant inputs are observable (including, but not limited to, quoted prices for similar investments, interest rates, foreign exchange rates, volatility and credit spreads), either directly or indirectly;
Level 3 — Prices or valuations that require significant unobservable inputs (including GSAM’s assumptions in determining fair value measurement).
The Trustees have approved Rule 2a-7 Procedures (“Procedures”) that govern the valuation of the portfolio investments held by the Fund at amortized cost. The Trustees have delegated to GSAM day-to-day responsibility for implementing and maintaining internal controls and procedures related to the valuation (including both amortized cost and market-based methods of valuation) of the Fund’s portfolio investments. To assess the continuing appropriateness of pricing sources and methodologies related to the market-based method of valuation, GSAM regularly performs price verification procedures and issues challenges as necessary to third party pricing vendors or brokers, and any differences are reviewed in accordance with the Procedures.
As of June 30, 2016, all investments are classified as Level 2. Please refer to the Schedule of Investments for further detail.
4. AGREEMENTS AND AFFILIATED TRANSACTIONS
A. Management Agreement — Under the Agreement, GSAM manages the Fund, subject to the general supervision of the Trustees.
As compensation for the services rendered pursuant to the Agreement, the assumption of the expenses related thereto and administration of the Fund’s business affairs, including providing facilities, GSAM is entitled to a management fee, accrued daily and paid monthly, equal to an annual percentage rate of the Fund’s average daily net assets. GSAM has agreed to waive a portion of the management fee equal to 0.045% of the annual contractual rate applicable to the Fund’s average daily net assets. The management fee waiver will remain in effect through at least April 29, 2017, and prior to such date GSAM may not terminate the arrangement without the approval of the Board of Trustees. For the six months ended June 30, 2016, GSAM waived $27,279 of its management fee pursuant to the contractual management fee waiver.
B. Distribution and Service Plan — The Trust, on behalf of the Service Shares of the Fund, has adopted a Distribution and Service Plan (the “Plan”). Under the Plan, Goldman Sachs, which serves as distributor, is entitled to a fee, accrued daily and paid monthly for distribution services, which may then be paid by Goldman Sachs to authorized dealers. This fee is equal to an annual percentage rate of the average daily net assets.
C. Transfer Agency Agreement — Goldman Sachs also serves as the transfer agent of the Fund for a fee pursuant to a Transfer Agency Agreement. The fee charged for such transfer agency services is accrued daily and paid monthly at an annual rate of 0.02% of the average daily net assets of Institutional and Service Shares.
D. Other Expense Agreements — GSAM has agreed to limit certain “Other Expenses” of the Fund (excluding acquired fund fees and expenses, transfer agency fees and expenses, taxes, interest, brokerage fees, shareholder meeting, litigation, indemnification and extraordinary expenses) to the extent that such expenses exceed, on an annual basis, 0.004% of the average daily net assets of the Fund. Such Other Expense reimbursements, if any, are accrued daily and paid monthly. In addition, the Fund is not obligated to reimburse GSAM for prior fiscal year expense reimbursements, if any. This Other Expense limitation will remain in place through at least April 29, 2017 and prior to such date GSAM may not terminate the arrangement without the approval of the Trustees. For the six months ended June 30, 2016, GSAM reimbursed $94,504 to the Fund. In addition, the Fund
14
GOLDMAN SACHS VARIABLE INSURANCE TRUST GOVERNMENT MONEY MARKET FUND
4. AGREEMENTS AND AFFILIATED TRANSACTIONS (continued)
has entered into certain offset arrangements with the custodian and the transfer agent, which may result in a reduction of the Fund’s expenses and are received irrespective of the application of the “Other Expense” limitation described above.
E. Contractual and Net Fund Expenses — During the six months ended June 30, 2016, GSAM as the investment adviser, and Goldman Sachs, as distributor and transfer agent, voluntarily agreed to waive a portion of management fees, distribution and service plan fees and transfer agency fees attributable to the Fund. These waivers may be modified or terminated at any time at the option of GSAM or Goldman Sachs (as applicable). The following table outlines such fees (net of waivers) and Other Expenses (net of reimbursements and custodian and transfer agency fee credit reductions) in order to determine the Fund’s net annualized expenses for the fiscal period. The Fund is not obligated to reimburse Goldman Sachs for prior fiscal year fee waivers, if any.
| Institutional Shares | Service Shares | |||||||||||||||
| Fee/Expense Type | Contractual rate, if any | Ratio of net expenses to average net assets for the six months ended June 30, 2016* | Contractual rate, if any | Ratio of net expenses to average net assets for the six months ended June 30, 2016* | ||||||||||||
| Management Fee | 0.205 | % | 0.189 | % | 0.205 | % | 0.189 | % | ||||||||
| Distribution and Service Fees | N/A | N/A | 0.25 | 0.24 | ||||||||||||
| Transfer Agency Fees | 0.02 | 0.02 | 0.02 | 0.02 | ||||||||||||
| Other Expenses | — | 0.00 | (a) | — | 0.00 | (a) | ||||||||||
| Net Expenses | 0.21 | % | 0.45 | % | ||||||||||||
| * | Annualized |
| (a) | Amount is less than 0.005% of average net assets. |
N/A - Fees not applicable to respective share class.
For the six months ended June 30, 2016, Goldman Sachs waived $27,279, $14,570 and $3 in management, distribution and service fees, and transfer agency fees, respectively.
For the six months ended June 30, 2016, the amounts owed to affiliates of the Fund were $47,955, $67,391 and $13 for management, distribution and service fees, and transfer agency fees, respectively.
F. Other Transactions with Affiliates — The Fund may purchase securities from, or sell securities to, an affiliated fund provided the affiliation is solely due to having a common investment adviser, common officers, or common Trustees. For the six months ended June 30, 2016, the purchase and sale transactions for the Fund with affiliated funds in compliance with Rule 17a-7 under the Act were $0 and $250,029, respectively.
G. Line of Credit Facility — As of June 30, 2016, the Fund participated in a $1,100,000,000 committed, unsecured revolving line of credit facility (the “facility”) together with other funds of the Trust and certain registered investment companies having management agreements with GSAM or its affiliates (“Other Borrowers”). This facility is to be used for temporary emergency purposes, or to allow for an orderly liquidation of securities to meet redemption requests. The interest rate on borrowings is based on the federal funds rate. The facility also requires a fee to be paid by the Fund based on the amount of the commitment that has not been utilized. For the six months ended June 30, 2016, the Fund did not have any borrowings under the facility.
5. OTHER RISKS
The Fund’s risks include, but are not limited to, the following:
Large Shareholder Transactions Risk — The Fund may experience adverse effects when certain large shareholders, such as other funds, participating insurance companies, accounts and Goldman Sachs affiliates, purchase or redeem large amounts of shares of the Fund. Such large shareholder redemptions may cause the Fund to sell portfolio securities at times when it would not otherwise do so, which may negatively impact the Fund’s NAV and liquidity. These transactions may also increase transaction
15
GOLDMAN SACHS VARIABLE INSURANCE TRUST GOVERNMENT MONEY MARKET FUND
Notes to Financial Statements (continued)
June 30, 2016 (Unaudited)
5. OTHER RISKS (continued)
costs. In addition, a large redemption could result in the Fund’s current expenses being allocated over a smaller asset base, leading to an increase in the Fund’s expense ratio. Similarly, large Fund share purchases may adversely affect the Fund’s performance to the extent that the Fund is delayed in investing new cash and is required to maintain a larger cash position that it ordinarily would.
Interest Rate Risk — When interest rates increase, the Fund’s yield will tend to be lower than prevailing market rates, and the market value of its securities or instruments may also be adversely affected. A low interest rate environment poses additional risks to the Fund, because low yields on the Fund’s portfolio holdings may have an adverse impact on the Fund’s ability to provide a positive yield to its shareholders, pay expenses out of Fund assets, or, at times, maintain a stable $1.00 share price. The risks associated with increasing interest rates are heightened given that interest rates are near historic lows, but may be expected to increase in the future with unpredictable effects on the markets and a Fund’s investments.
Market and Credit Risks — In the normal course of business, the Fund trades financial instruments and enters into financial transactions where risk of potential loss exists due to changes in the market (market risk). Additionally, the Fund may also be exposed to credit risk in the event that an issuer or guarantor fails to perform or that an institution or entity with which the Fund has unsettled or open transactions defaults.
6. INDEMNIFICATIONS
Under the Trust’s organizational documents, its Trustees, officers, employees and agents are indemnified, to the extent permitted by the Act and state law, against certain liabilities that may arise out of performance of their duties to the Fund. Additionally, in the course of business, the Fund enters into contracts that contain a variety of indemnification clauses. The Fund’s maximum exposure under these arrangements is unknown, as this would involve future claims that may be made against the Fund that have not yet occurred. However, GSAM believes the risk of loss under these arrangements to be remote.
7. SUBSEQUENT EVENTS
Subsequent events after the Statement of Assets and Liabilities date have been evaluated through the date the financial statements were issued. GSAM has concluded that there is no impact requiring adjustment or disclosure in the financial statements.
16
GOLDMAN SACHS VARIABLE INSURANCE TRUST GOVERNMENT MONEY MARKET FUND
8. SUMMARY OF SHARE TRANSACTIONS
Share activity is as follows:
| For the Six Months Ended June 30, 2016 (Unaudited) | For the Fiscal Year Ended December 31, 2015 | |||||||
| Institutional Shares | ||||||||
| Shares sold | 39,052,656 | 2,610,668 | ||||||
| Reinvestment of distributions | 10,949 | 182 | ||||||
| Shares redeemed | (2,261,289 | ) | (2,241,115 | ) | ||||
| 36,802,316 | 369,735 | |||||||
| Service Shares | ||||||||
| Shares sold | 126,314,064 | 204,026,704 | ||||||
| Reinvestment of distributions | 31,403 | 19,018 | ||||||
| Shares redeemed | (108,074,889 | ) | (181,837,456 | ) | ||||
| 18,270,578 | 22,208,266 | |||||||
| NET INCREASE IN SHARES | 55,072,894 | 22,578,001 | ||||||
17
GOLDMAN SACHS VARIABLE INSURANCE TRUST GOVERNMENT MONEY MARKET FUND
| Fund Expenses — Six Month Period Ended June 30, 2016 (Unaudited) |
As a shareholder of the Institutional Shares and Service Shares of the Fund, you incur ongoing costs, including management fees; distribution and service (12b-1) fees (with respect to Service Shares); and other Fund expenses. This Example is intended to help you understand your ongoing costs (in dollars) of investing in the Fund and to compare these costs with the ongoing costs of investing in other mutual funds.
The example is based on an investment of $1,000 invested at the beginning of the period and held for the entire period from January 1, 2016 through June 30, 2016, which represents a period of 182 days of a 366 day year.
Actual Expenses — The first line in the table below provides information about actual account values and actual expenses. You may use the information in this line, together with the amount you invested, to estimate the expenses that you paid over the period. Simply divide your account value by $1,000 (for example, an $8,600 account value divided by $1,000=8.6), then multiply the result by the number in the first line under the heading entitled “Expenses Paid” to estimate the expenses you paid on your account during this period.
Hypothetical Example for Comparison Purposes — The second line in the table below provides information about hypothetical account values and hypothetical expenses based on the Fund’s actual net expense ratio and an assumed rate of return of 5% per year before expenses, which is not the Fund’s actual return. The hypothetical account values and expenses may not be used to estimate the actual ending account balance or expenses you paid for the period. You may use this information to compare the ongoing costs of investing in the Fund and other funds. To do so, compare this 5% hypothetical example with the 5% hypothetical examples that appear in the shareholder reports of the other funds.
Please note that the expenses shown in the table are meant to highlight your ongoing costs only and do not reflect any transactional costs, such as sales charges, redemption fees, or exchange fees. Therefore, the second line of the table is useful in comparing ongoing costs only, and will not help you determine the relative total costs of owning different funds. In addition, if these transactional costs were included, your costs would have been higher.
| Share Class | Beginning Account Value 1/1/16 | Ending Account Value 6/30/16 | Expenses Paid for the 6 months Ended 6/30/16* | |||||||||
| Institutional Shares | ||||||||||||
| Actual | $ | 1,000.00 | $ | 1,000.72 | $ | 1.04 | ||||||
| Hypothetical 5% return | 1,000.00 | 1,023.82 | + | 1.06 | ||||||||
| Service Shares | ||||||||||||
| Actual | 1,000.00 | 1,000.09 | 2.26 | |||||||||
| Hypothetical 5% return | 1,000.00 | 1,022.60 | + | 2.29 | ||||||||
| * | Expenses are calculated using the Fund’s annualized net expense ratio for each class, which represents the ongoing expenses as a percentage of net assets for the six months ended June 30, 2016. Expenses are calculated by multiplying the annualized net expense ratio by the average account value for the period; then multiplying the result by the number of days in the most recent fiscal half year (or, since inception, if shorter); and then dividing that result by the number of days in the period. The annualized net expense ratios for the period were 0.21% and 0.45% for the Institutional Shares and Service Shares, respectively. |
| + | Hypothetical expenses are based on the Fund’s actual annualized net expense ratio and an assumed rate of return of 5% per year before expenses. |
18
GOLDMAN SACHS VARIABLE INSURANCE TRUST GOVERNMENT MONEY MARKET FUND
Statement Regarding Basis for Approval of Management Agreement (Unaudited)
Background
The Goldman Sachs Government Money Market Fund (formerly, Goldman Sachs Money Market Fund) (the “Fund”) is an investment portfolio of Goldman Sachs Variable Insurance Trust (the “Trust”). The Board of Trustees oversees the management of the Trust and reviews the investment performance and expenses of the Fund at regularly scheduled meetings held throughout the year. In addition, the Board of Trustees determines annually whether to approve the continuance of the Trust’s investment management agreement (the “Management Agreement”) with Goldman Sachs Asset Management, L.P. (the “Investment Adviser”) on behalf of the Fund.
The Management Agreement was most recently approved for continuation until June 30, 2017 by the Board of Trustees, including those Trustees who are not parties to the Management Agreement or “interested persons” (as defined in the Investment Company Act of 1940, as amended) of any party thereto (the “Independent Trustees”), at a meeting held on June 15-16, 2016 (the “Annual Meeting”).
The review process undertaken by the Trustees spans the course of the year and culminates with the Annual Meeting. To assist the Trustees in their deliberations, the Trustees have established a Contract Review Committee (the “Committee”), comprised of the Independent Trustees. The Committee held three meetings over the course of the year since the Management Agreement was last approved. At those Committee meetings, regularly scheduled Board or other committee meetings, and/or the Annual Meeting, matters relevant to the renewal of the Management Agreement were considered by the Board, or the Independent Trustees, as applicable. With respect to the Fund, such matters included:
| (a) | the nature and quality of the advisory, administrative, and other services provided to the Fund by the Investment Adviser and its affiliates, including information about: |
| (i) | the structure, staff, and capabilities of the Investment Adviser and its portfolio management teams; |
| (ii) | the groups within the Investment Adviser and its affiliates that support the portfolio management teams or provide other types of necessary services, including fund services groups (e.g., accounting and financial reporting, tax, shareholder services, and operations); controls and risk management groups (e.g., legal, compliance, valuation oversight, credit risk management, internal audit, compliance testing, market risk analysis, finance, and central funding); sales and distribution support groups, and others (e.g., information technology and training); |
| (iii) | trends in employee headcount; |
| (iv) | the Investment Adviser’s financial resources and ability to hire and retain talented personnel and strengthen its operations; and |
| (v) | the parent company’s support of the Investment Adviser and its mutual fund business, as expressed by the firm’s senior management; |
19
GOLDMAN SACHS VARIABLE INSURANCE TRUST GOVERNMENT MONEY MARKET FUND
Statement Regarding Basis for Approval of Management Agreement (Unaudited) (continued)
| (b) | information on the investment performance of the Fund, including comparisons to the performance of similar mutual funds, as provided by a third-party mutual fund data provider engaged as part of the contract review process (the “Outside Data Provider”), and general investment outlooks in the markets in which the Fund invests; |
| (c) | information provided by the Investment Adviser indicating the Investment Adviser’s views on whether the Fund’s peer group and/or benchmark index had high, medium, or low relevance given the Fund’s particular investment strategy; |
| (d) | the terms of the Management Agreement and other agreements with affiliated service providers entered into by the Trust on behalf of the Fund; |
| (e) | fee and expense information for the Fund, including: |
| (i) | the relative management fee and expense level of the Fund as compared to those of comparable funds managed by other advisers, as provided by the Outside Data Provider; and |
| (ii) | the Fund’s expense trends over time; |
| (f) | with respect to the extensive investment performance and expense comparison data provided by the Outside Data Provider, its processes in producing that data for the Fund; |
| (g) | the undertakings of the Investment Adviser and Goldman, Sachs & Co. (“Goldman Sachs”), the Fund’s affiliated distributor, to waive certain fees in order to maintain a positive yield for the Fund and to limit certain expenses of the Fund that exceed a specified level; |
| (h) | information relating to the profitability of the Management Agreement and the transfer agency and distribution and service arrangements of the Fund and the Trust as a whole to the Investment Adviser and its affiliates; |
| (i) | whether the Fund’s existing management fee schedule adequately addressed any economies of scale; |
| (j) | a summary of the “fall-out” benefits derived by the Investment Adviser and its affiliates from their relationships with the Fund, including the fees received by the Investment Adviser’s affiliates from the Fund for transfer agency, distribution and other services; |
| (k) | a summary of potential benefits derived by the Fund as a result of its relationship with the Investment Adviser; |
| (l) | the nature and quality of the services provided to the Fund by its unaffiliated service providers, and the Investment Adviser’s general oversight and evaluation (including reports on due diligence) of those service providers as part of the administration services provided under the Management Agreement; and |
| (m) | the Investment Adviser’s processes and policies addressing various types of potential conflicts of interest; its approach to risk management; the annual review of the effectiveness of the Fund’s compliance program; and periodic compliance reports. |
The Trustees also received an overview of the Fund’s distribution arrangements. They received information regarding the Fund’s assets, share purchase and redemption activity, and payment of distribution and service fees. Information was also provided to the Trustees relating to revenue sharing payments made by and services provided by the Investment Adviser and its affiliates to intermediaries that promote the sale, distribution, and/or servicing of Fund shares. The Independent Trustees also discussed the broad range of other investment choices that are available to Fund investors, including the availability of comparable funds managed by other advisers.
20
GOLDMAN SACHS VARIABLE INSURANCE TRUST GOVERNMENT MONEY MARKET FUND
Statement Regarding Basis for Approval of Management Agreement (Unaudited) (continued)
The presentations made at the Board and Committee meetings and at the Annual Meeting encompassed the Fund and other mutual funds for which the Board of Trustees has responsibility. In evaluating the Management Agreement at the Annual Meeting, the Trustees relied upon their knowledge, resulting from their meetings and other interactions throughout the year, of the Investment Adviser and its affiliates, their services, and the Fund. In conjunction with these meetings, the Trustees received written materials and oral presentations on the topics covered, and the Investment Adviser addressed the questions and concerns of the Trustees, including concerns regarding the investment performance of certain of the funds they oversee. The Independent Trustees were advised by their independent legal counsel regarding their responsibilities and other regulatory requirements related to the approval and continuation of mutual fund investment management agreements under applicable law. In addition, the Investment Adviser and its affiliates provided the Independent Trustees with a written response to a formal request for information sent on behalf of the Independent Trustees by their independent legal counsel. During the course of their deliberations, the Independent Trustees met in executive sessions with their independent legal counsel, without representatives of the Investment Adviser or its affiliates present.
Nature, Extent, and Quality of the Services Provided Under the Management Agreement
As part of their review, the Trustees considered the nature, extent, and quality of the services provided to the Fund by the Investment Adviser. In this regard, the Trustees considered both the investment advisory services and non-advisory services that are provided by the Investment Adviser and its affiliates. The Trustees noted the transition in the leadership and changes in personnel of various of the Investment Adviser’s portfolio management teams that had occurred in recent periods, and the ongoing recruitment efforts aimed at bringing high quality investment talent to the Investment Adviser. They also noted the Investment Adviser’s commitment to maintaining high quality systems and expending substantial resources to respond to ongoing changes to the regulatory and control environment in which the Fund and its service providers operate, as well as the efforts of the Investment Adviser and its affiliates to combat cyber security risks. The Trustees concluded that the Investment Adviser continued to commit substantial financial and operational resources to the Fund and expressed confidence that the Investment Adviser would continue to do so in the future. The Trustees also recognized that the Investment Adviser had made significant commitments to address regulatory compliance requirements applicable to the Fund and the Investment Adviser and its affiliates.
Investment Performance
The Trustees also considered the investment performance of the Fund. In this regard, they compared the investment performance of the Fund to its peers using rankings compiled by the Outside Data Provider as of December 31, 2015. The information on the Fund’s investment performance was provided for the one-, three- and five-year periods ending on December 31, 2015.
In addition, the Trustees considered materials prepared and presentations made by the Investment Adviser’s senior management and portfolio management personnel in which Fund performance was assessed. The Trustees also considered the Investment Adviser’s periodic reports with respect to the Fund’s risk profile, and how the Investment Adviser’s approach to risk monitoring and management influences portfolio management.
21
GOLDMAN SACHS VARIABLE INSURANCE TRUST GOVERNMENT MONEY MARKET FUND
Statement Regarding Basis for Approval of Management Agreement (Unaudited) (continued)
The Trustees considered the performance of the Fund in light of its investment objective and the credit parameters. They also considered the challenging yield environment in which the Fund had operated since 2009, and noted that the Investment Adviser had been able to maintain a stable net asset value and positive yield to meet the demand of the Fund’s investors, in many instances as the result of voluntary fee waivers and expense reimbursements. In light of these considerations, the Trustees believed that the Fund was providing investment performance within a competitive range for investors. The Trustees also recalled that the Fund had been repositioned as a government money market fund in April 2016.
Costs of Services Provided and Competitive Information
The Trustees considered the contractual terms of the Management Agreement and the fee rates payable by the Fund thereunder. In this regard, the Trustees considered information on the services rendered by the Investment Adviser to the Fund, which included both advisory and administrative services that were directed to the needs and operations of the Fund as a registered mutual fund.
In particular, the Trustees reviewed analyses prepared by the Outside Data Provider regarding the expense rankings of the Fund. The analyses provided a comparison of the Fund’s management fee to those of a relevant peer group and category universe; an expense analysis which compared the Fund’s overall net and gross expenses to a peer group and a category universe; and a five-year history comparing the Fund’s net expenses to the peer and category medians. The analyses also compared the Fund’s transfer agency and custody fees, other expenses and fee waivers/reimbursements to those of the peer group and category medians. The Trustees concluded that the comparisons provided by the Outside Data Provider were useful in evaluating the reasonableness of the management fees and total expenses paid by the Fund.
In addition, the Trustees considered the Investment Adviser’s undertaking to waive a portion of its management fee and to limit certain expenses of the Fund that exceed a specified level. They noted that the Investment Adviser and Goldman Sachs had waived fees and reimbursed expenses for the Fund in order to maintain a positive yield. They also observed that the Investment Adviser was expending substantial resources to respond to recent amendments to the regulatory regime for money market funds. They also noted that the Investment Adviser did not manage other types of accounts having investment objectives and policies similar to those of the Fund, and therefore this type of fee comparison was not possible.
In addition, the Trustees noted that shareholders are able to redeem their Fund shares at any time if shareholders believe that the Fund fees and expenses are too high or if they are dissatisfied with the performance of the Fund.
Profitability
The Trustees reviewed the Investment Adviser’s revenues and pre-tax profit margins with respect to the Trust and the Fund. In this regard the Trustees noted that they had received, among other things, profitability analyses and summaries, revenue and expense schedules by Fund and by function (i.e., investment management, transfer agency and distribution and service), and information on the Investment Adviser’s expense allocation methodology. They observed that the profitability and expense figures are substantially similar to those used by the Investment Adviser for many internal purposes, including compensation decisions among various business groups, and are thus subject to a vigorous internal debate about how certain revenue and expenses should be allocated. The Trustees also noted that the internal audit group within the Goldman Sachs organization had audited the expense allocation methodology and was satisfied with the reasonableness, consistency, and accuracy of the Investment Adviser’s expense allocation methodology and profitability analysis calculations. Profitability data for the Trust and the Fund were provided for 2015
22
GOLDMAN SACHS VARIABLE INSURANCE TRUST GOVERNMENT MONEY MARKET FUND
Statement Regarding Basis for Approval of Management Agreement (Unaudited) (continued)
and 2014, and the Trustees considered this information in relation to the Investment Adviser’s overall profitability. The Trustees considered the Investment Adviser’s revenues and pre-tax profit margins both in absolute terms and in comparison to information on the reported pre-tax profit margins earned by certain other asset management firms.
Economies of Scale
The Trustees considered the information that had been provided regarding the Investment Adviser’s profitability. The Trustees noted that the Fund does not have management fee breakpoints. They considered the asset levels in the Fund; the Fund’s recent purchase and redemption activity; the information provided by the Investment Adviser relating to the costs of the services provided by the Investment Adviser and its affiliates and their realized profits; information comparing the contractual fee rates charged by the Investment Adviser with fee rates charged to other money market funds in the peer group; the Investment Adviser’s undertaking to limit certain expenses of the Fund that exceed a specified level; and the willingness of the Investment Adviser and Goldman Sachs to waive certain fees on a temporary basis in order to maintain a positive Fund yield. They considered a report prepared by the Outside Data Provider, which surveyed money market funds’ management fee arrangements and use of breakpoints. The Trustees also considered the competitive nature of the money market fund business and the competitiveness of the fees charged to the Fund by the Investment Adviser. They also observed that the Investment Adviser’s (and its affiliates’) level of profitability had been reduced as a result of fee waivers and expense limitations.
Other Benefits to the Investment Adviser and Its Affiliates
The Trustees also considered the other benefits derived by the Investment Adviser and its affiliates from their relationships with the Fund as stated above, including: (a) transfer agency fees received by Goldman Sachs; (b) trading efficiencies resulting from aggregation of orders of the Fund with those for other funds or accounts managed by the Investment Adviser; (c) the Investment Adviser’s ability to leverage the infrastructure designed to service the Fund on behalf of its other clients; (d) the Investment Adviser’s ability to cross-market other products and services to Fund shareholders; (e) Goldman Sachs’ retention of certain fees as Fund Distributor; (f) Goldman Sachs’ ability to engage in principal transactions with the Fund under exemptive orders from the U.S. Securities and Exchange Commission permitting such trades; (g) the Investment Adviser’s ability to negotiate better pricing with custodians on behalf of its other clients, as a result of the relationship with the Fund; and (h) the possibility that the working relationship between the Investment Adviser and the Fund’s third-party service providers may cause those service providers to be more likely to do business with other areas of Goldman Sachs. In the course of considering the foregoing, the Independent Trustees requested and received further information quantifying certain of these fall-out benefits.
Other Benefits to the Fund and Its Shareholders
The Trustees also noted that the Fund receives certain potential benefits as a result of its relationship with the Investment Adviser, including: (a) trading efficiencies resulting from aggregation of orders of the Fund with those of other funds or accounts managed by the Investment Adviser; (b) enhanced servicing from vendors because of the volume of business generated by the Investment Adviser and its affiliates; (c) enhanced servicing from broker-dealers because of the volume of business generated by the Investment Adviser and its affiliates; (d) the Investment Adviser’s knowledge and experience gained from managing other accounts and products; (e) the Investment Adviser’s ability to hire and retain qualified personnel to provide services to the Fund because of the reputation of the Goldman Sachs organization; (f) the Fund’s access, through the Investment Adviser, to certain firmwide resources (e.g., proprietary risk management systems and databases), subject to certain restrictions; and (g) the Fund’s
23
GOLDMAN SACHS VARIABLE INSURANCE TRUST GOVERNMENT MONEY MARKET FUND
Statement Regarding Basis for Approval of Management Agreement (Unaudited) (continued)
access to certain affiliated distribution channels. In addition, the Trustees noted the competitive nature of the mutual fund marketplace, and considered that many of the Fund’s shareholders invested in the Fund in part because of the Fund’s relationship with the Investment Adviser and that those shareholders have a general expectation that the relationship will continue.
Conclusion
In connection with their consideration of the Management Agreement, the Trustees gave weight to each of the factors described above, but did not identify any particular factor as controlling their decision. After deliberation and consideration of all of the information provided, including the factors described above, the Trustees concluded, in the exercise of their business judgment, that the management fees paid by the Fund were reasonable in light of the services provided to it by the Investment Adviser, the Investment Adviser’s costs and the Fund’s current and reasonably foreseeable asset levels. The Trustees unanimously concluded that the Investment Adviser’s continued management likely would benefit the Fund and its shareholders and that the Management Agreement should be approved and continued with respect to the Fund until June 30, 2017.
24
TRUSTEES Ashok N. Bakhru, Chairman Kathryn A. Cassidy Diana M. Daniels Herbert J. Markley James A. McNamara Jessica Palmer Alan A. Shuch Roy W. Templin Gregory G. Weaver | OFFICERS James A. McNamara, President Scott M. McHugh, Principal Financial Officer, Senior Vice President and Treasurer Caroline L. Kraus, Secretary |
GOLDMAN, SACHS & CO.
Distributor and Transfer Agent
GOLDMAN SACHS ASSET MANAGEMENT, L.P.
Investment Adviser
200 West Street, New York
New York 10282
Visit our Web site at www.GSAMFUNDS.com to obtain the most recent month-end returns.
The reports concerning the Fund included in this shareholder report may contain certain forward-looking statements about the factors that may affect the performance of the Fund in the future. These statements are based on Fund management’s predictions and expectations concerning certain future events and their expected impact on the Fund, such as performance of the economy as a whole and of specific industry sectors, changes in the levels of interest rates, the impact of developing world events, and other factors that may influence the future performance of the Fund. Management believes these forward-looking statements to be reasonable, although they are inherently uncertain and difficult to predict. Actual events may cause adjustments in portfolio management strategies from those currently expected to be employed.
A description of the policies and procedures that the Fund uses to determine how to vote proxies relating to portfolio securities and information regarding how the Fund voted proxies relating to portfolio securities during the most recent 12-month period ended June 30 is available (i) without charge, upon request by calling 1-800-621-2550; and (ii) on the Securities and Exchange Commission (“SEC”) Web site at http://www.sec.gov.
The Fund files its complete schedule of portfolio holdings with the SEC for the first and third quarters of each fiscal year on Form N-Q. The Fund’s Forms N-Q are available on the SEC’s web site at http://www.sec.gov within 60 days after the Fund’s first and third fiscal quarters. The Fund’s Forms N-Q may be reviewed and copied at the SEC’s Public Reference Room in Washington, D.C. and information on the operation of the Public Reference Room may also be obtained by calling 1-800-SEC-0330. Forms N-Q may be obtained upon request and without charge by calling 1-800-621-2550.
The web site links provided are for your convenience only and are not an endorsement or recommendation by GSAM of any of these web sites or the products or services offered. GSAM is not responsible for the accuracy and validity of the content of these web sites.
Fund holdings and allocations shown are as of June 30, 2016 and may not be representative of future investments. Fund holdings should not be relied on in making investment decisions and should not be construed as research or investment advice regarding particular securities. Current and future holdings are subject to risk.
The portfolio risk management process includes an effort to monitor and manage risk, but does not imply low risk.
Shares of the Goldman Sachs VIT Funds are offered to separate accounts of participating life insurance companies for the purpose of funding variable annuity contracts and variable life insurance policies. Shares of the Fund are not offered directly to the general public. The variable annuity contracts and variable life insurance policies are described in the separate prospectuses issued by participating insurance companies. You should refer to those prospectuses for information about surrender charges, mortality and expense risk fees and other charges that may be assessed by participating insurance companies under the variable annuity contracts or variable life insurance policies. Such fees or charges, if any, may affect the return you may realize with respect to your investments. Ask your representative for more complete information. Please consider a fund’s objectives, risks and charges and expenses, and read the prospectus carefully before investing. The prospectus contains this and other information about the Fund.
This material is not authorized for distribution to prospective investors unless preceded or accompanied by a current Prospectus or summary prospectus, if applicable. Investors should consider a Fund’s objective, risks, and charges and expenses, and read the summary prospectus, if available, and/or the Prospectus carefully before investing or sending money. The summary prospectus, if available, and the Prospectus contain this and other information about a Fund and may be obtained from your authorized dealer or from Goldman, Sachs & Co. by calling 1-800-621-2550.
This report is prepared for the general information of contract owners and is not an offer of shares of the Goldman Sachs Variable Insurance Trust: Goldman Sachs Money Market Fund.
© 2016 Goldman Sachs. All rights reserved.
VITMMSAR-16/58884-TMPL-08/2016
Goldman
Sachs Variable Insurance Trust
Goldman Sachs
Multi-Strategy
Alternatives Portfolio
Semi-Annual Report
June 30, 2016

GOLDMAN SACHS VARIABLE INSURANCE TRUST MULTI-STRATEGY ALTERNATIVES PORTFOLIO
INVESTMENT OBJECTIVE
The Portfolio seeks long-term growth of capital.
Portfolio Management Discussion and Analysis
Below, the Goldman Sachs Global Portfolio Solutions Team discusses the Goldman Sachs Variable Insurance Trust — Goldman Sachs Multi-Strategy Alternatives Portfolio’s (the “Portfolio”) performance and positioning for the six-month period ended June 30, 2016 (the “Reporting Period”).
How did the Portfolio perform during the Reporting Period?
During the Reporting Period, the Portfolio’s Advisor, Institutional and Service Shares generated cumulative total returns of -1.64%, -1.53% and -1.64%, respectively. These returns compare to the 0.31% cumulative total return of the Portfolio’s benchmark, the Bank of America Merrill Lynch Three-Month LIBOR Constant Maturity Index (the “LIBOR Index”), during the same period.
Please note that the Portfolio’s benchmark being the LIBOR Index is a means of emphasizing that the Portfolio has an unconstrained strategy. That said, this Portfolio employs a benchmark agnostic strategy and thus comparisons to a benchmark index are not particularly relevant.
What economic and market factors most influenced the Portfolio during the Reporting Period?
Broad concerns surrounding global economic growth (particularly within China), sentiment about crude oil prices and signs the U.S. economy was in the later stage of the credit cycle increased volatility in the global financial markets during the Reporting Period. As a result, dispersion of returns across asset classes grew more pronounced, resulting in significant winners and losers. In this environment, momentum or trend-following1 strategies underperformed traditional equity and fixed income classes, largely as a by-product of the heightened market volatility. Global equities, which had a rocky start in early 2016, recouped most of their losses by the end of the Reporting Period. Global fixed income generated positive returns, as global yields remained low and investors sought traditionally considered safe-haven assets in the volatile market environment. Toward the end of the Reporting Period, political instability in Europe and the unexpected “leave” result of the U.K. referendum on European Union membership, popularly known as the Brexit vote, increased uncertainty for investors within the developed markets.
Global inflation expectations remained low during the Reporting Period, as many of the world’s central banks, especially the European Central Bank, the Bank of Japan (the “BOJ”) and the People’s Bank of China, continued their accommodative monetary policies. The BOJ’s negative interest rate policy along with more stable energy prices and muted global economic growth also contributed to lower inflation expectations.
Within currencies, the U.S. dollar weakened during the Reporting Period but nevertheless remained strong relative to most other global developed currencies. An exception was the Japanese yen, which appreciated sharply versus the U.S. dollar. Emerging markets currencies also broadly appreciated, driven by the weaker U.S. dollar, stabilizing oil prices and easing concerns about China.
After several consecutive quarterly declines, commodity prices rebounded during the first quarter of 2016, but they remained volatile throughout the Reporting Period. Crude oil prices stayed well below their historic average.
What key factors were responsible for the Portfolio’s performance during the Reporting Period?
The Portfolio’s performance is driven by three sources of return: strategic asset allocation to market exposures, short-term tactical allocation and excess returns from investments in underlying funds. During the Reporting Period, the Portfolio underperformed relative to its benchmark primarily because of weak security selection within its underlying funds. Tactical asset allocation also detracted modestly. These results were partially offset by the Portfolio’s strategic asset allocation, which added value.
Strategic asset allocation contributed positively to performance during the Reporting Period. In particular, the Portfolio was helped by its strategic allocations to satellite real asset classes, such as U.S. and international real estate securities, which benefited from low interest rates and the accommodative monetary policies of global central banks. The Portfolio’s short volatility strategy also
| 1 | In trend-following strategies, investment decisions are based on trends in asset classes over time. |
1
GOLDMAN SACHS VARIABLE INSURANCE TRUST MULTI-STRATEGY ALTERNATIVES PORTFOLIO
bolstered returns. Offsetting these results slightly was a strategic allocation to liquid alternatives, primarily long-short equity strategies within developed and emerging markets, as well as an allocation to momentum and macro fixed income strategies.
After accounting for their market exposures, overall investments in underlying funds detracted from the Portfolio’s results. More specifically, three of the Portfolio’s underlying funds — the Goldman Sachs Long Short Fund, the Goldman Sachs Managed Futures Strategy Fund and the Goldman Sachs Fixed Income Macro Strategy Fund — underperformed their respective benchmark indices. On the positive side, two of the underlying funds — the Goldman Sachs Dynamic Emerging Markets Debt Fund and the Goldman Sachs Long Short Credit Fund — outperformed their respective benchmark indices.
Tactical asset allocation had a modestly negative impact on the Portfolio’s returns. The underperformance was led by the Portfolio’s short-term tactical allocations to European and Japanese equities, which lagged the broad global equity market during the Reporting Period. Both positions were managed throughout the Reporting Period to increase the Portfolio’s risk exposure opportunistically and in an effort to secure gains based on the Goldman Sachs Global Portfolio Solutions Team’s (the “Team”) fundamental views. In addition, the Portfolio was hurt by the Team’s decision to tactically manage a basket of international currencies to express its views about slowing economic growth in China and other emerging markets countries. Adding positively to results was the Portfolio’s short-term tactical long position in gold, which fared well amid a flight to traditionally considered safe-haven assets in January through mid-February 2016. Gold was also one of the top performing asset classes of the Reporting Period. The Portfolio’s short-term tactical long position in U.S. bank stocks also enhanced returns.
How was the Portfolio positioned at the beginning of the Reporting Period?
At the beginning of the Reporting Period, the Portfolio was positioned, in terms of its total net assets, with 75.8% in liquid alternative strategies, 13.7% in real assets and 2.6% in cash. (Liquid alternatives strategies generally include, but are not limited to, momentum or trend trading strategies (investment decisions based on trends in asset prices over time), hedge fund beta (long term total returns consistent with investment results that approximate the return and risk patterns of a diversified universe of hedge funds), managed risk investment strategies (which seek to manage extreme risk scenarios by implementing daily and monthly risk targets across a diversified mix of asset classes), emerging markets debt and unconstrained fixed income strategies (which have the ability to move across various fixed income sectors). Real assets generally include, but are not limited to, commodities, global real estate securities, infrastructure and master limited partnerships (“MLPs”).) The strategic asset allocation of the Portfolio reflects a risk-based allocation approach to increase diversification across the Portfolio. The Portfolio had 7.9% of its total net assets invested in tactical exposures at the beginning of the Reporting Period.
How did you tactically manage the Portfolio’s allocations during the Reporting Period?
During the Reporting Period overall, the Portfolio maintained an overweight in liquid alternatives and an underweight in real assets to express the Team’s view that relatively unconstrained strategies may continue to benefit from the flexibility to go long and short in an uncertain market environment.
Within its strategic asset allocation, the Team eliminated the Portfolio’s exposure to commodities during the Reporting Period due to continued weakness in the energy sector. Because inventory levels remained elevated and production had not significantly decelerated, the Team did not expect commodities to be a meaningful driver of returns in the near term.
Within its tactical asset allocation, the Team established a tactical long position in Japanese equities during February 2016. This positioning was adopted because of the positive market sentiment surrounding the BOJ’s announcement to enact further easing measures and the Team’s expectation that Japanese equities would outperform other developed markets equities as a result of those easing measures. During March 2016, the Team exited the Portfolio’s tactical long position in gold. In June 2016, the Team enacted a long position in Indian equity futures due to the broadening economic recovery, recent legislative victories by Prime Minister Narendra Modi and what we viewed as limited near-term political risks. Additionally, the Team believed valuations remained fair, as India had underperformed broader emerging markets equities since the beginning of 2016.
During the Reporting Period, the Team established a tactical long position in U.S. bank stocks. The U.S. banking sector had previously underperformed the broader global equity market on concerns surrounding European banks. The Team believed the selloff had been excessive and that fundamentals, such as loan growth, the focus on expense controls and the shoring up of capital positions, was supportive. In addition, during the Reporting Period, the Team added a tactical allocation to the international currency markets while also seeking to provide the Portfolio with a potential hedge against currency exchange rate fluctuations. More specifically, the Team tactically managed a basket of currencies as it sought to take advantage of the monetary and inflationary environment across developed and emerging market countries. During the Reporting Period, this basket of currencies was used to express the Team’s views about slowing economic growth in China and other emerging market countries. It was also
2
GOLDMAN SACHS VARIABLE INSURANCE TRUST MULTI-STRATEGY ALTERNATIVES PORTFOLIO
employed to express the Team’s view that lower commodity prices would have a positive impact on commodity importers, such as India, and a negative impact on commodity exporters, such as Australia.
Over the course of the Reporting Period, the Team tactically adjusted the Portfolio’s exposure to U.S. stocks and developed markets equities. At the end of March 2016, the Team reduced the Portfolio’s exposure to U.S. stocks and developed markets equities on the belief that the rally that had started in mid-February 2016 had run its course. Near the end of the Reporting Period, the Team increased the Portfolio’s exposure to U.S. stocks and developed markets equities on the belief there was potential for further upside in the near term because of the Federal Reserve’s (the “Fed”) accommodative monetary policy, improving conditions in China and poor investor sentiment.
In addition, during the Reporting Period overall, the Team adjusted the Portfolio’s asset allocation to more evenly balance the different sources of active risk in the Portfolio. These changes translated into the elimination of the Portfolio’s investment in the Goldman Sachs VIT Global Trends Allocation Fund. The proceeds were invested in the Goldman Sachs Managed Futures Strategy Fund, which allows the Portfolio to, in the Team’s view, more effectively access momentum and cross-asset trend strategies.
Also as part of its risk management efforts, the Team reduced the Portfolio’s equity long-short allocation during the Reporting Period. The decision was driven by concerns about negative momentum and overcrowding in the hedge fund universe.
How was the Portfolio positioned at the end of the Reporting Period?
At the end of the Reporting Period, the Portfolio was positioned, in terms of its total net assets, with 77.0% in liquid alternative strategies, 11.6% in real assets and 0.6% in cash. The Portfolio had 10.8% of its total net assets invested in tactical exposures.
How did the Portfolio use derivatives and similar instruments during the Reporting Period?
During the Reporting Period, the Portfolio used derivatives primarily to express views across the developed and emerging market equity markets. The Portfolio employed equity index futures to replicate U.S. large cap equity and European equity exposures, which had, respectively, a marginally positive impact and a negative impact on results. Additionally, the Portfolio used equity index futures to gain tactical exposure to Indian equities (marginally positive impact), Japanese equities (negative impact) and U.S. large cap bank stocks (positive impact). The Portfolio also used emerging markets equity index futures to partially hedge the beta associated with investing in emerging markets stocks, thus isolating returns from active security selection. These futures detracted from the Portfolio’s performance. (Beta is a measure of the volatility, or systematic risk, of a security or a portfolio in comparison to the market as a whole.) In addition, during the Reporting Period, the Portfolio employed foreign exchange forwards to go long and short select developed and emerging market currencies within a tactical basket of currencies. The use of these instruments had a negative impact on performance. Additionally, some of the underlying funds used derivatives during the Reporting Period to apply their active investment views with greater versatility and potentially to afford greater risk management precision. As market conditions warranted during the Reporting Period, some of these underlying funds engaged in forward foreign currency exchange contracts, financial futures contracts, options, swap contracts and structured securities to attempt to enhance portfolio return and for hedging purposes.
What is the Portfolio’s tactical view and strategy for the months ahead?
When the Reporting Period began, the Portfolio was positioned for a market environment supportive of riskier asset classes, with an overweight in equities and an underweight in fixed income. Looking ahead, the Team remains broadly positive on riskier asset classes, given supportive central bank monetary policy and low inflation expectations globally, and its expectation that global economic growth in calendar year 2016 will be on par with growth during calendar year 2015. That said, the Team acknowledges inflationary pressures appear to be becoming more prevalent in the U.S.
The Team believes that a tactical and selective approach to equity selection is required in this environment. Accordingly, the Team remains focused on markets where it sees scope for an improvement in fundamentals, such as developed markets where there is ample monetary policy support or regions where there is opportunity for secular improvement. In the near term, the Team expects global equity returns to be capped on both the upside and downside, with potential idiosyncratic risks — such as a hard landing for China’s economy, the aftermath of Brexit, an unforeseen European crisis, inflation scares and/or oil price uncertainty — likely, in the Team’s view, to generate substantial volatility. As a result, the Team believes the risk-reward of a dynamic approach to investing in equities and riskier asset classes broadly is becoming more attractive. In terms of U.S. equities, the difficult start to 2016 and a steep intra-month decline in June 2016 following the Brexit vote led the Team to adopt a more tactically defensive stance by the end of the Reporting Period.
3
GOLDMAN SACHS VARIABLE INSURANCE TRUST MULTI-STRATEGY ALTERNATIVES PORTFOLIO
In China, ongoing policy and monetary support from the People’s Bank of China has, in the Team’s view, helped the Chinese economy to stabilize. However, the Team believes China faces structural headwinds that could represent meaningful downside risks to the trajectory of global equity markets in the short term. Potential upside could result, in the Team’s view, from any additional stabilization relative to the market’s muted expectations, which could assuage concerns about the emerging markets broadly and, in turn, the export sectors of developed economies.
Elsewhere in the world, the Team remains bullish on prospects in Europe and Japan given their central banks’ accommodative monetary policies but continues to be cautious about investing further in economies that are in the mature mid-cycle expansion phase. Market uncertainty following the U.K.’s Brexit vote was also informing the Team’s investment decision-making at the end of the Reporting Period.
In terms of fixed income, the Team believes the markets have underestimated the pace of potential Fed rate hikes and at the end of the Reporting Period were pricing in too dovish a sentiment. (Dovish sentiment tends to suggest lower interest rates.)
Overall, at the end of the Reporting Period, the Team continued to favor equities over fixed income and maintained an underweight in government bonds. It also maintained a marginally positive view on emerging markets equities relative to developed markets equities at the end of the Reporting Period.
4
GOLDMAN SACHS VARIABLE INSURANCE TRUST MULTI-STRATEGY ALTERNATIVES PORTFOLIO
Index Definitions
The BofA Merrill Lynch U.S. Dollar Three-Month LIBOR Constant Maturity Index is based on the assumed purchase of a synthetic instrument having three months to maturity and with a coupon equal to the closing quote for three-month LIBOR. That issue is sold the following day (priced at a yield equal to the current day closing three-month LIBOR rate) and is rolled into a new three-month instrument. The index, therefore, will always have a constant maturity equal to exactly three months.
The S&P GSCI is the first major investable commodity index. It is one of the most widely recognized benchmarks that is broad-based and production weighted to represent the global commodity market beta. The index is designed to be investable by including the most liquid commodity futures and provides diversification with low correlations to other asset classes.
5
FUND BASICS
Multi-Strategy Alternatives Portfolio
as of June 30, 2016
STANDARDIZED TOTAL RETURNS1
| For the period ended 6/30/16 | One Year | Since Inception | Inception Date | |||||||
| Institutional | -6.43 | % | -3.07 | % | 4/25/14 | |||||
| Service | -6.68 | -3.32 | 4/25/14 | |||||||
| Advisor | -6.72 | -3.44 | 4/25/14 | |||||||
| 1 | The Standardized Total Returns are average annual total returns or cumulative total returns (only if the performance period is one year or less) as of the most recent calendar quarter-end. They assume reinvestment of all distributions at net asset value (“NAV”). Because Institutional, Service and Advisor Shares do not involve a sales charge, such a charge is not applied to their Standardized Total Returns. |
Total return figures in the above chart represent past performance and do not indicate future results, which will vary. The investment return and principal value of an investment will fluctuate and, therefore, an investor’s shares, when redeemed, may be worth more or less than their original cost. Current performance may be lower or higher than the total return figures in the above chart. Please visit www.GSAMFUNDS.com to obtain the most recent month-end returns. Performance reflects fee waivers and/or expense limitations in effect during the periods shown. In their absence, performance would be reduced.
EXPENSE RATIOS2
| Net Expense Ratio (Current) | Gross Expense Ratio (Before Waivers) | |||||||
| Institutional | 1.05 | % | 4.28 | % | ||||
| Service | 1.30 | 3.21 | ||||||
| Advisor | 1.45 | 3.39 | ||||||
| 2 | The expense ratios of the Portfolio, both current (net of any fee waivers or expense limitations) and before waivers (gross of any fee waivers or expense limitations) are as set forth above according to the most recent publicly available Prospectuses for the Portfolio and may differ from the expense ratios disclosed in the Financial Highlights of this report. Pursuant to a contractual arrangement, the Portfolio’s waivers and/or expense limitations will remain in place through at least April 29, 2017 and prior to such date the Investment Adviser may not terminate the arrangements without the approval of the Portfolio’s Board of Trustees. If these arrangements are discontinued in the future, the expense ratios may change without shareholder approval. |
6
FUND BASICS
OVERALL UNDERLYING FUND AND ETF WEIGHTINGS3
Percentage of Net Assets
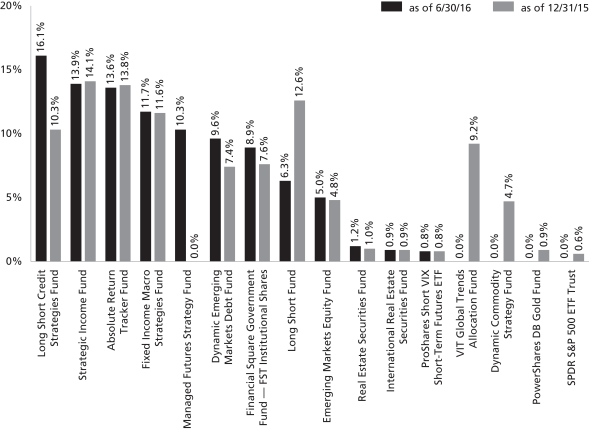
| 3 | The Portfolio is actively managed and, as such, its composition may differ over time. The percentage shown for each Underlying Fund and ETF reflects the value of that underlying fund or ETF as a percentage of net assets of the Portfolio. Figures in the graph above may not sum to 100% due to rounding and/or exclusion of other assets and liabilities. Underlying sector allocations of Exchange Traded Funds and Investment Companies held by the Portfolio are not reflected in the graph above. The above graph depicts the Portfolio’s investments but may not represent the Portfolio’s market exposure due to the exclusion of certain derivatives, if any, as listed in the Additional Investment Information section of the Schedule of Investments. |
7
GOLDMAN SACHS VARIABLE INSURANCE TRUST MULTI-STRATEGY ALTERNATIVES PORTFOLIO
Schedule of Investments
June 30, 2016 (Unaudited)
| Shares | Description | Value | ||||||
| Underlying Funds (Institutional Shares)(a) – 88.6% | ||||||||
| Equity – 13.4% |
| ||||||
| 75,111 | Goldman Sachs Long Short Fund | $ | 634,688 | |||||
| 31,205 | Goldman Sachs Emerging Markets Equity Fund | 499,280 | ||||||
| 5,489 | Goldman Sachs Real Estate Securities Fund | 119,009 | ||||||
| 15,458 | Goldman Sachs International Real Estate Securities Fund | 92,283 | ||||||
|
| |||||||
| 1,345,260 | ||||||||
|
| |||||||
| Fixed Income – 75.2% |
| ||||||
| 170,436 | Goldman Sachs Long Short Credit Strategies Fund | 1,624,257 | ||||||
| 148,695 | Goldman Sachs Strategic Income Fund | 1,393,269 | ||||||
| 152,978 | Goldman Sachs Absolute Return Tracker Fund | 1,372,211 | ||||||
| 136,456 | Goldman Sachs Fixed Income Macro Strategies Fund | 1,174,890 | ||||||
| 99,044 | Goldman Sachs Managed Futures Strategy Fund | 1,034,015 | ||||||
| 113,952 | Goldman Sachs Dynamic Emerging Markets Debt Fund | 965,174 | ||||||
|
| |||||||
| 7,563,816 | ||||||||
|
| |||||||
|
| TOTAL UNDERLYING FUNDS (INSTITUTIONAL SHARES) |
| ||||||
| (Cost $9,195,902) | $ | 8,909,076 | ||||||
|
| |||||||
| Exchange Traded Fund – 0.8% | ||||||||
| 1,591 | ProShares Short VIX Short-Term Futures Fund | $ | 78,182 | |||||
| (Cost $71,170) | ||||||||
|
| |||||||
| Shares | Distribution Rate | Value | ||||||
| Investment Company(a)(b) – 8.9% | ||||||||
Goldman Sachs Financial Square Government Fund — |
| |||||||
| 900,071 | 0.299 | % | $ | 900,071 | ||||
| (Cost $900,071) | ||||||||
| ||||||||
| TOTAL INVESTMENTS – 98.3% | ||||||||
| (Cost $10,167,143) | $ | 9,887,329 | ||||||
| ||||||||
OTHER ASSETS IN EXCESS OF LIABILITIES – 1.7% |
| 171,422 | ||||||
| ||||||||
| NET ASSETS – 100.0% | $ | 10,058,751 | ||||||
| ||||||||
| The percentage shown for each investment category reflects the value of investments in that category as a percentage of net assets. | ||
| (a) | Represents Affiliated Funds. | |
| (b) | Variable rate security. Interest rate or distribution rate disclosed is that which is in effect on June 30, 2016. | |
| Currency Abbreviations: | ||
| AUD | —Australian Dollar | |
| CHF | —Swiss Franc | |
| CNY | —Chinese Yuan | |
| COP | —Colombian Peso | |
| EUR | —Euro | |
| GBP | —British Pound | |
| HUF | —Hungarian Forint | |
| IDR | —Indonesian Rupiah | |
| INR | —Indian Rupee | |
| JPY | —Japanese Yen | |
| MYR | —Malaysian Ringgit | |
| NZD | —New Zealand Dollar | |
| PLN | —Polish Zloty | |
| RUB | —Russian Ruble | |
| SEK | —Swedish Krona | |
| TRY | —Turkish Lira | |
| TWD | —Taiwan Dollar | |
| USD | —United States Dollar | |
| ZAR | —South African Rand | |
| 8 | The accompanying notes are an integral part of these financial statements. |
GOLDMAN SACHS VARIABLE INSURANCE TRUST MULTI-STRATEGY ALTERNATIVES PORTFOLIO
ADDITIONAL INVESTMENT INFORMATION
FORWARD FOREIGN CURRENCY EXCHANGE CONTRACTS — At June 30, 2016, the Portfolio had the following forward foreign currency exchange contracts:
FORWARD FOREIGN CURRENCY EXCHANGE CONTRACTS WITH UNREALIZED GAIN
| Counterparty | Currency Purchased | Currency Sold | Settlement Date | Current Value | Unrealized Gain | |||||||||||||||
Barclays Bank PLC | COP | 132,000,000 | USD | 44,103 | 09/21/16 | $ | 44,439 | $ | 336 | |||||||||||
| TWD | 300,000 | USD | 9,326 | 09/21/16 | 9,336 | 10 | ||||||||||||||
| USD | 1,512 | CNY | 10,000 | 09/21/16 | 1,495 | 17 | ||||||||||||||
Citibank, N.A. | USD | 87,439 | CNY | 580,000 | 09/21/16 | 86,710 | 729 | |||||||||||||
Deutsche Bank AG | AUD | 60,000 | USD | 44,514 | 09/21/16 | 44,619 | 105 | |||||||||||||
| NZD | 10,000 | USD | 7,077 | 09/21/16 | 7,111 | 34 | ||||||||||||||
| RUB | 3,000,000 | USD | 43,513 | 09/21/16 | 45,934 | 2,421 | ||||||||||||||
| ZAR | 70,000 | USD | 4,629 | 09/21/16 | 4,676 | 47 | ||||||||||||||
JPMorgan Chase Bank, N.A. | USD | 44,879 | EUR | 40,000 | 09/21/16 | 44,520 | 359 | |||||||||||||
Standard Chartered Bank | TRY | 130,000 | USD | 43,033 | 09/21/16 | 44,365 | 1,332 | |||||||||||||
| USD | 86,609 | GBP | 60,000 | 09/21/16 | 79,937 | 6,672 | ||||||||||||||
| USD | 42,744 | HUF | 12,000,000 | 09/21/16 | 42,169 | 575 | ||||||||||||||
| ZAR | 700,000 | USD | 43,794 | 09/21/16 | 46,764 | 2,970 | ||||||||||||||
UBS AG | IDR | 1,170,000,000 | USD | 84,172 | 09/21/16 | 87,779 | 3,607 | |||||||||||||
| TOTAL | $ | 19,214 | ||||||||||||||||||
FORWARD FOREIGN CURRENCY EXCHANGE CONTRACTS WITH UNREALIZED LOSS
| Counterparty | Currency Purchased | Currency Sold | Settlement Date | Current Value | Unrealized Loss | |||||||||||||||
Bank of America, N.A. | USD | 46,543 | GBP | 35,000 | 09/21/16 | $ | 46,630 | $ | (87 | ) | ||||||||||
| USD | 7,017 | HUF | 2,000,000 | 09/21/16 | 7,028 | (11 | ) | |||||||||||||
| USD | 64,307 | TWD | 2,100,000 | 09/21/16 | 65,352 | (1,045 | ) | |||||||||||||
Barclays Bank PLC | USD | 3,795 | RUB | 250,000 | 09/21/16 | 3,828 | (33 | ) | ||||||||||||
| USD | 9,314 | TWD | 300,000 | 09/21/16 | 9,336 | (22 | ) | |||||||||||||
| USD | 4,636 | ZAR | 70,000 | 09/21/16 | 4,677 | (41 | ) | |||||||||||||
Deutsche Bank AG | CHF | 10,000 | USD | 10,433 | 09/21/16 | 10,288 | (145 | ) | ||||||||||||
| GBP | 30,000 | USD | 44,085 | 09/21/16 | 39,968 | (4,117 | ) | |||||||||||||
JPMorgan Chase Bank, N.A. | GBP | 30,000 | USD | 43,286 | 09/21/16 | 39,968 | (3,318 | ) | ||||||||||||
| SEK | 375,000 | USD | 45,252 | 09/21/16 | 44,478 | (774 | ) | |||||||||||||
| USD | 10,166 | CHF | 10,000 | 09/21/16 | 10,287 | (121 | ) | |||||||||||||
Morgan Stanley Co., Inc. | INR | 9,000,000 | USD | 131,704 | 09/21/16 | 131,530 | (174 | ) | ||||||||||||
| RUB | 250,000 | USD | 3,836 | 09/21/16 | 3,828 | (8 | ) | |||||||||||||
| USD | 1,491 | CNY | 10,000 | 09/21/16 | 1,495 | (4 | ) | |||||||||||||
| USD | 43,783 | INR | 3,000,000 | 09/21/16 | 43,843 | (60 | ) | |||||||||||||
Standard Chartered Bank | PLN | 180,000 | USD | 45,698 | 09/21/16 | 45,541 | (157 | ) | ||||||||||||
| USD | 101,534 | CHF | 100,000 | 09/21/16 | 102,878 | (1,344 | ) | |||||||||||||
| USD | 41,399 | COP | 132,000,000 | 09/21/16 | 44,439 | (3,040 | ) | |||||||||||||
| USD | 46,191 | JPY | 5,000,000 | 09/21/16 | 48,551 | (2,360 | ) | |||||||||||||
| The accompanying notes are an integral part of these financial statements. | 9 |
GOLDMAN SACHS VARIABLE INSURANCE TRUST MULTI-STRATEGY ALTERNATIVES PORTFOLIO
Schedule of Investments (continued)
June 30, 2016 (Unaudited)
ADDITIONAL INVESTMENT INFORMATION (continued)
FORWARD FOREIGN CURRENCY EXCHANGE CONTRACTS WITH UNREALIZED LOSS (continued)
| Counterparty | Currency Purchased | Currency Sold | Settlement Date | Current Value | Unrealized Loss | |||||||||||||||
State Street Bank | USD | 43,182 | AUD | 60,000 | 09/21/16 | $ | 44,619 | $ | (1,437 | ) | ||||||||||
| USD | 47,491 | NZD | 70,000 | 09/21/16 | 49,779 | (2,288 | ) | |||||||||||||
UBS AG | USD | 43,592 | MYR | 180,000 | 09/21/16 | 45,029 | (1,437 | ) | ||||||||||||
| TOTAL | $ | (22,023 | ) | |||||||||||||||||
FUTURES CONTRACTS — At June 30, 2016, the Portfolio had the following futures contracts:
| Type | Number of Contracts Long (Short) | Expiration Date | Current Value | Unrealized Gain (Loss) | ||||||||||||
| EURO STOXX 50 Index | 1 | September 2016 | $ | 31,683 | $ | (498 | ) | |||||||||
| mini MSCI EAFE Index Futures | 2 | September 2016 | 161,520 | (5,254 | ) | |||||||||||
| mini MSCI Emerging Markets Index Futures | (9 | ) | September 2016 | (375,615 | ) | (3,838 | ) | |||||||||
| S&P 500 E-Mini Index | 2 | September 2016 | 209,020 | 296 | ||||||||||||
SGX Nifty 50 Equity Index | 9 | July 2016 | 150,039 | 3,723 | ||||||||||||
| TOTAL | $ | (5,571 | ) | |||||||||||||
| 10 | The accompanying notes are an integral part of these financial statements. |
GOLDMAN SACHS VARIABLE INSURANCE TRUST MULTI-STRATEGY ALTERNATIVES PORTFOLIO
Statement of Assets and Liabilities
June 30, 2016 (Unaudited)
| Assets: | ||||
Investments in Affiliated Underlying Funds, at value (cost $10,095,973) | $ | 9,809,147 | ||
Investments, at value (cost $71,170) | 78,182 | |||
Cash | 98,390 | |||
Receivables: | ||||
Investments sold | 130,000 | |||
Collateral on certain derivative contracts | 37,001 | |||
Portfolio shares sold | 23,577 | |||
Reimbursement from investment adviser | 16,746 | |||
Dividends | 237 | |||
Unrealized gain on forward foreign currency exchange contracts | 19,214 | |||
Variation margin on certain derivative contracts | 2,729 | |||
| Total assets | 10,215,223 | |||
| Liabilities: | ||||
Unrealized loss on forward foreign currency exchange contracts | 22,023 | |||
Payables: | ||||
Portfolio shares redeemed | 35,639 | |||
Distribution and Service fees and Transfer Agency fees | 3,395 | |||
Accrued expenses | 95,415 | |||
| Total liabilities | 156,472 | |||
| Net Assets: | ||||
Paid-in capital | 11,097,990 | |||
Undistributed net investment income | 37,009 | |||
Accumulated net realized loss | (788,310 | ) | ||
Net unrealized loss | (287,938 | ) | ||
| NET ASSETS | $ | 10,058,751 | ||
Net Assets: | ||||
Institutional | $ | 40,083 | ||
Service | 279,260 | |||
Advisor | 9,739,408 | |||
Total Net Assets | $ | 10,058,751 | ||
Shares outstanding $0.001 par value (unlimited shares authorized): | ||||
Institutional | 4,445 | |||
Service | 31,053 | |||
Advisor | 1,085,418 | |||
Net asset value, offering and redemption price per share: | ||||
Institutional | $9.02 | |||
Service | 8.99 | |||
Advisor | 8.97 | |||
| The accompanying notes are an integral part of these financial statements. | 11 |
GOLDMAN SACHS VARIABLE INSURANCE TRUST MULTI-STRATEGY ALTERNATIVES PORTFOLIO
Statement of Operations
For the Six Months Ended June 30, 2016 (Unaudited)
| Investment income: | ||||
Dividends from Affiliated Underlying Funds | $ | 63,310 | ||
Dividends from Unaffiliated Underlying Funds | 310 | |||
| Total investment income | 63,620 | |||
| Expenses: | ||||
Professional fees | 45,964 | |||
Printing and mailing costs | 32,281 | |||
Distribution and Service fees(a) | 18,772 | |||
Custody, accounting and administrative services | 16,760 | |||
Trustee fees | �� | 12,154 | ||
Management fees | 7,610 | |||
Transfer Agency fees(a) | 1,014 | |||
Other | 3,707 | |||
| Total expenses | 138,262 | |||
Less — expense reductions | (108,932 | ) | ||
| Net expenses | 29,330 | |||
| NET INVESTMENT INCOME | 34,290 | |||
| Realized and unrealized gain (loss): | ||||
Net realized gain (loss) from: | ||||
Investments in Affiliated Underlying Funds | (513,590 | ) | ||
Investments in Unaffiliated Underlying Funds | 10,714 | |||
Futures contracts | (71,147 | ) | ||
Forward foreign currency exchange contracts | (16,162 | ) | ||
Foreign currency transactions | 24 | |||
Net change in unrealized gain (loss) on: | ||||
Investments in Affiliated Underlying Funds | 386,922 | |||
Investments in Unaffiliated Underlying Funds | 23,472 | |||
Futures contracts | (19,233 | ) | ||
Forward foreign currency exchange contracts | (2,809 | ) | ||
Foreign currency translation | 218 | |||
| Net realized and unrealized loss | (201,591 | ) | ||
| NET DECREASE IN NET ASSETS RESULTING FROM OPERATIONS | $ | (167,301 | ) | |
(a) Class specific Distribution and Service, and Transfer Agency fees were as follows:
| Distribution and Service Fees | Transfer Agency Fees | |||||||||||||||||
Advisor | Service | Advisor | Institutional | Service | ||||||||||||||
| $ | 18,725 | $ | 47 | $ | 936 | $ | 75 | $ | 3 | |||||||||
| 12 | The accompanying notes are an integral part of these financial statements. |
GOLDMAN SACHS VARIABLE INSURANCE TRUST MULTI-STRATEGY ALTERNATIVES PORTFOLIO
Statements of Changes in Net Assets
| For the Six Months Ended June 30, 2016 (Unaudited) | For the Fiscal Year Ended December 31, 2015 | |||||||
| From operations: | ||||||||
Net investment income | $ | 34,290 | $ | 170,751 | ||||
Net realized loss | (590,161 | ) | (155,810 | ) | ||||
Net change in unrealized gain (loss) | 388,570 | (565,645 | ) | |||||
| Net decrease in net assets resulting from operations | (167,301 | ) | (550,704 | ) | ||||
| Distributions to shareholders: | ||||||||
From net investment income | ||||||||
Institutional Shares | — | (20,864 | ) | |||||
Service Shares | — | (439 | ) | |||||
Advisor Shares | — | (183,729 | ) | |||||
From net realized gains | ||||||||
Institutional Shares | — | (1,452 | ) | |||||
Service Shares | — | (33 | ) | |||||
Advisor Shares | — | (14,588 | ) | |||||
| Total distributions to shareholders | — | (221,105 | ) | |||||
| From share transactions: | ||||||||
Proceeds from sales of shares | 2,169,762 | 9,018,089 | ||||||
Reinvestment of distributions | — | 221,105 | ||||||
Cost of shares redeemed | (2,589,511 | ) | (2,079,723 | ) | ||||
| Net increase (decrease) in net assets resulting from share transactions | (419,749 | ) | 7,159,471 | |||||
| TOTAL INCREASE (DECREASE) | (587,050 | ) | 6,387,662 | |||||
| Net assets: | ||||||||
Beginning of period | 10,645,801 | 4,258,139 | ||||||
End of period | $ | 10,058,751 | $ | 10,645,801 | ||||
| Undistributed net investment income | $ | 37,009 | $ | 2,719 | ||||
| The accompanying notes are an integral part of these financial statements. | 13 |
GOLDMAN SACHS VARIABLE INSURANCE TRUST MULTI-STRATEGY ALTERNATIVES PORTFOLIO
Financial Highlights
Selected Data for a Share Outstanding Throughout Each Period
| Income (loss) from investment operations | Distributions to shareholders | |||||||||||||||||||||||||||||||||||||||||||||||||||||||
| Year - Share Class | Net asset value, beginning of period | Net investment income(a)(b) | Net realized and unrealized loss | Total from investment operations | From net investment income | From net realized gains | Total distributions | Net asset value, end of period | Total return(c) | Net assets, end of period (in 000s) | Ratio of net expenses to average net assets(d) | Ratio of total expenses to average net assets(d) | Ratio of net investment income to average net assets(b) | Portfolio turnover rate(e) | ||||||||||||||||||||||||||||||||||||||||||
FOR THE SIX MONTHS ENDED JUNE 30, (UNAUDITED) | ||||||||||||||||||||||||||||||||||||||||||||||||||||||||
2016 - Institutional | $ | 9.15 | $ | 0.04 | $ | (0.17 | ) | $ | (0.13 | ) | $ | — | $ | — | $ | — | $ | 9.02 | (1.53 | )% | $ | 40 | 0.21 | %(f) | 2.38 | %(f) | 0.97 | %(f) | 32 | % | ||||||||||||||||||||||||||
2016 - Service | 9.14 | 0.05 | (0.20 | ) | (0.15 | ) | — | — | — | 8.99 | (1.64 | ) | 279 | 0.46 | (f) | 2.61 | (f) | 1.14 | (f) | 32 | ||||||||||||||||||||||||||||||||||||
2016 - Advisor | 9.12 | 0.03 | (0.18 | ) | (0.15 | ) | — | — | — | 8.97 | (1.64 | ) | 9,739 | 0.61 | (f) | 2.75 | (f) | 0.65 | (f) | 32 | ||||||||||||||||||||||||||||||||||||
FOR THE FISCAL YEAR ENDED DECEMBER 31, | ||||||||||||||||||||||||||||||||||||||||||||||||||||||||
2015 - Institutional | 9.81 | 0.20 | (0.65 | ) | (0.45 | ) | (0.20 | ) | (0.01 | ) | (0.21 | ) | 9.15 | (4.51 | ) | 958 | 0.22 | 4.40 | 2.02 | 53 | ||||||||||||||||||||||||||||||||||||
2015 - Service | 9.81 | 0.24 | (0.71 | ) | (0.47 | ) | (0.19 | ) | (0.01 | ) | (0.20 | ) | 9.14 | (4.76 | ) | 22 | 0.48 | 3.33 | 2.54 | 53 | ||||||||||||||||||||||||||||||||||||
2015 - Advisor | 9.79 | 0.21 | (0.69 | ) | (0.48 | ) | (0.18 | ) | (0.01 | ) | (0.19 | ) | 9.12 | (4.89 | ) | 9,666 | 0.62 | 3.51 | 2.16 | 53 | ||||||||||||||||||||||||||||||||||||
FOR THE PERIOD ENDED DECEMBER 31, | ||||||||||||||||||||||||||||||||||||||||||||||||||||||||
2014 - Institutional (Commenced April 25, 2014) | 10.00 | 0.09 | (0.16 | ) | (0.07 | ) | (0.12 | ) | — | (g) | (0.12 | ) | 9.81 | (0.67 | ) | 1,003 | 0.22 | (f) | 24.63 | (f) | 1.30 | (f) | 25 | |||||||||||||||||||||||||||||||||
2014 - Service (Commenced April 25, 2014) | 10.00 | 0.07 | (0.16 | ) | (0.09 | ) | (0.10 | ) | — | (g) | (0.10 | ) | 9.81 | (0.85 | ) | 10 | 0.49 | (f) | 25.05 | (f) | 1.02 | (f) | 25 | |||||||||||||||||||||||||||||||||
2014 - Advisor (Commenced April 25, 2014) | 10.00 | 0.11 | (0.21 | ) | (0.10 | ) | (0.11 | ) | — | (g) | (0.11 | ) | 9.79 | (0.97 | ) | 3,246 | 0.62 | (f) | 16.16 | (f) | 1.66 | (f) | 25 | |||||||||||||||||||||||||||||||||
| (a) | Calculated based on the average shares outstanding methodology. |
| (b) | Recognition of net investment income by the Portfolio is affected by the timing of declaration of dividends by the Underlying Funds in which the Portfolio invests. |
| (c) | Assumes investment at the net asset value at the beginning of the period, reinvestment of all distributions, and a complete redemption of the investment at the net asset value at the end of the period. Total returns for periods less than one full year are not annualized. |
| (d) | Expense ratios exclude the expenses of the Underlying Funds in which the Portfolio invests. |
| (e) | The portfolio turnover rate is calculated in accordance with regulatory requirements, without regard to transactions involving short term investments and certain derivatives. If such transactions were included, the portfolio turnover rate may be higher. |
| (f) | Annualized. |
| (g) | Amount is less than $0.005 per share. |
| The accompanying notes are an integral part of these financial statements. | 14 |
GOLDMAN SACHS VARIABLE INSURANCE TRUST MULTI-STRATEGY ALTERNATIVES PORTFOLIO
Notes to Financial Statements
June 30, 2016 (Unaudited)
1. ORGANIZATION
Goldman Sachs Variable Insurance Trust (the “Trust” or “VIT”) is a Delaware statutory trust registered under the Investment Company Act of 1940, as amended (the “Act”), as an open-end management investment company. The Trust includes the Goldman Sachs Multi-Strategy Alternatives Portfolio (the “Portfolio”). The Portfolio is a diversified portfolio under the Act offering three classes of shares — Institutional, Service and Advisor Shares. Shares of the Trust are offered to separate accounts of participating life insurance companies for the purpose of funding variable annuity contracts and variable life insurance policies.
Goldman Sachs Asset Management, L.P. (“GSAM”), an affiliate of Goldman, Sachs & Co. (“Goldman Sachs”), serves as investment adviser to the Portfolio pursuant to a management agreement (the “Agreement”) with the Trust.
The Portfolio invests primarily in a combination of domestic and international equity and fixed income underlying funds (“Underlying Funds”) which are registered under the Act, for which GSAM or Goldman Sachs Asset Management International (“GSAMI”), also an affiliate of Goldman Sachs, act as investment advisers. Additionally, this Portfolio may invest a portion of its assets directly in other securities and instruments, including unaffiliated exchange traded funds (“Unaffiliated Funds”).
2. SIGNIFICANT ACCOUNTING POLICIES
The financial statements have been prepared in accordance with accounting principles generally accepted in the United States of America (“GAAP”) and require management to make estimates and assumptions that may affect the reported amounts and disclosures. Actual results may differ from those estimates and assumptions.
A. Investment Valuation — The Portfolio’s valuation policy, as well as the Underlying Funds’ is to value investments at fair value.
B. Investment Income and Investments — Investment income includes interest income, dividend income, net of any foreign withholding taxes, less any amounts reclaimable, and securities lending income. Interest income is accrued daily and adjusted for amortization of premiums and accretion of discounts. Dividend income is recognized on ex-dividend date or, for certain foreign securities, as soon as such information is obtained subsequent to the ex-dividend date. Capital gain distributions received from Underlying Funds are recognized on ex-dividend date. Investment transactions are reflected on trade date. Realized gains and losses are calculated using identified cost. Investment transactions are recorded on the following business day for daily net asset value (“NAV”) calculations. Any foreign capital gains tax is accrued daily based upon net unrealized gains, and is payable upon sale of such investments. Income distributions are recognized as capital gains or income in the financial statements in accordance with the character that is distributed.
For derivative contracts, realized gains and losses are recorded upon settlement of the contract.
C. Class Allocations and Expenses — Investment income, realized and unrealized gain (loss), and non-class specific expenses of the Portfolio are allocated daily based upon the proportion of net assets of each class. Non-class specific expenses directly incurred by the Portfolio are charged to the Portfolio, while such expenses incurred by the Trust are allocated across the applicable Portfolios on a straight-line and/or pro-rata basis depending upon the nature of the expenses. Class specific expenses, where applicable, are borne by the respective share classes and include Distribution and Service and Transfer Agency fees.
Expenses included in the accompanying financial statements reflect the expenses of the Portfolio and do not include any expenses associated with the Underlying Funds. Because the Underlying Funds have varied expense and fee levels and the Portfolio may own different proportions of the Underlying Funds at different times, the amount of fees and expenses incurred indirectly by the Portfolio will vary.
D. Federal Taxes and Distributions to Shareholders — It is the Portfolio’s policy to comply with the requirements of the Internal Revenue Code of 1986, as amended (the “Code”), applicable to regulated investment companies (mutual funds) and to distribute each year substantially all of its investment company taxable income and capital gains to its shareholders. Accordingly, the Portfolio is not required to make any provisions for the payment of federal income tax. Distributions to shareholders are recorded on the ex-dividend date. Income and capital gains distributions, if any, are declared and paid annually.
15
GOLDMAN SACHS VARIABLE INSURANCE TRUST MULTI-STRATEGY ALTERNATIVES PORTFOLIO
Notes to Financial Statements (continued)
June 30, 2016 (Unaudited)
2. SIGNIFICANT ACCOUNTING POLICIES (continued)
Net capital losses are carried forward to future fiscal years and may be used to the extent allowed by the Code to offset any future capital gains. Losses that are carried forward will retain their character as either short-term or long-term capital losses. Utilization of capital loss carryforwards will reduce the requirement of future capital gains distributions.
The characterization of distributions to shareholders for financial reporting purposes is determined in accordance with federal income tax rules, which may differ from GAAP. The source of the Portfolio’s distributions may be shown in the accompanying financial statements as either from net investment income, net realized gain or capital. Certain components of the Portfolio’s net assets on the Statement of Assets and Liabilities reflect permanent GAAP/tax differences based on the appropriate tax character.
3. INVESTMENTS AND FAIR VALUE MEASUREMENTS
The fair value of a financial instrument is the amount that would be received to sell an asset or paid to transfer a liability in an orderly transaction between market participants at the measurement date (i.e., the exit price). GAAP establishes a fair value hierarchy that prioritizes the inputs to valuation techniques used to measure fair value. The hierarchy gives the highest priority to unadjusted quoted prices in active markets for identical assets or liabilities (Level 1 measurements) and the lowest priority to unobservable inputs (Level 3 measurements). The levels used for classifying investments are not necessarily an indication of the risk associated with investing in these investments. The three levels of the fair value hierarchy are described below:
Level 1 — Unadjusted quoted prices in active markets that are accessible at the measurement date for identical, unrestricted assets or liabilities;
Level 2 — Quoted prices in markets that are not active or financial instruments for which significant inputs are observable (including, but not limited to, quoted prices for similar investments, interest rates, foreign exchange rates, volatility and credit spreads), either directly or indirectly;
Level 3 — Prices or valuations that require significant unobservable inputs (including GSAM’s assumptions in determining fair value measurement).
Changes in valuation techniques may result in transfers into or out of an assigned level within the hierarchy. In accordance with the Portfolio’s policy, transfers between different levels of the fair value hierarchy resulting from such changes are deemed to have occurred as of the beginning of the reporting period.
The Board of Trustees (“Trustees”) has approved Valuation Procedures that govern the valuation of the portfolio investments held by the Portfolio, including investments for which market quotations are not readily available. The Trustees have delegated to GSAM day-to-day responsibility for implementing and maintaining internal controls and procedures related to the valuation of the Portfolio’s investments. To assess the continuing appropriateness of pricing sources and methodologies, GSAM regularly performs price verification procedures and issues challenges as necessary to third party pricing vendors or brokers, and any differences are reviewed in accordance with the Valuation Procedures.
A. Level 1 and Level 2 Fair Value Investments — The valuation techniques and significant inputs used in determining the fair values for investments classified as Level 1 and Level 2 are as follows:
Underlying Funds (Including Money Market Funds) — Investments in the Underlying Funds are valued at the NAV per share of the Institutional Share class (the FST Institutional Share class for Money Market Funds) of each Underlying Fund on the day of valuation. Because the Portfolio invests primarily in other mutual funds that fluctuate in value, the Portfolio’s shares will correspondingly fluctuate in value. These investments are generally classified as Level 1 of the fair value hierarchy. For information regarding an Underlying Fund’s accounting policies and investment holdings, please see the Underlying Fund’s shareholder report.
16
GOLDMAN SACHS VARIABLE INSURANCE TRUST MULTI-STRATEGY ALTERNATIVES PORTFOLIO
3. INVESTMENTS AND FAIR VALUE MEASUREMENTS (continued)
Derivative Contracts — A derivative is an instrument whose value is derived from underlying assets, indices, reference rates or a combination of these factors. The Portfolio enters into derivative transactions to hedge against changes in interest rates, securities prices, and/or currency exchange rates, to increase total return, or to gain access to certain markets or attain exposure to other underliers.
Exchange-traded derivatives, including futures and options contracts, are valued at the last sale or settlement price and typically fall within Level 1 of the fair value hierarchy. Over-the-counter (“OTC”) and centrally cleared derivatives are valued using market transactions and other market evidence, including market-based inputs to models, calibration to market-clearing transactions, broker or dealer quotations, or other alternative pricing sources. Where models are used, the selection of a particular model to value OTC and centrally cleared derivatives depends upon the contractual terms of, and specific risks inherent in, the instrument, as well as the availability of pricing information in the market. Valuation models require a variety of inputs, including contractual terms, market prices, yield curves, credit curves, measures of volatility, voluntary and involuntary prepayment rates, loss severity rates and correlations of such inputs. For OTC and centrally cleared derivatives that trade in liquid markets, model inputs can generally be verified and model selection does not involve significant management judgment. OTC and centrally cleared derivatives are classified within Level 2 of the fair value hierarchy when significant inputs are corroborated by market evidence.
i. Forward Contracts — A forward contract is a contract between two parties to buy or sell an asset at a specified price on a future date. A forward contract settlement can occur on a cash or delivery basis. Forward contracts are marked-to-market daily using independent vendor prices, and the change in value, if any, is recorded as an unrealized gain or loss. Cash and certain investments may be used to collateralize forward contracts.
A forward foreign currency contract is a forward contract in which the Portfolio agrees to receive or deliver a fixed quantity of one currency for another, at a pre-determined price at a future date. All forward foreign currency exchange contracts are marked-to-market daily at the applicable forward rate. Non-deliverable forward foreign currency exchange contracts are settled with the counterparty in cash without the delivery of foreign currency.
ii. Futures Contracts — Futures contracts are contracts to buy or sell a standardized quantity of a specified commodity or security and are valued based on exchanged settlement prices or independent market quotes. Futures contracts are valued at the last settlement price, or in the absence of a sale, the last bid price for long positions and at the last ask price for short positions, at the end of each day on the board of trade or exchange upon which they are traded. Upon entering into a futures contract, the Portfolio deposits cash or securities in an account on behalf of the broker in an amount sufficient to meet the initial margin requirement. Subsequent payments are made or received by the Portfolio equal to the daily change in the contract value and are recorded as variation margin receivable or payable with a corresponding offset to unrealized gains or losses.
B. Level 3 Fair Value Investments — To the extent that significant inputs to valuation models and other alternative pricing sources are unobservable, or if quotations are not readily available, or if GSAM believes that such quotations do not accurately reflect fair value, the fair value of the Portfolio’s investments may be determined under Valuation Procedures approved by the Trustees. GSAM, consistent with its procedures and applicable regulatory guidance, may make an adjustment to the most recent valuation prices of either domestic or foreign securities in light of significant events to reflect what it believes to be the fair value of the securities at the time of determining a Portfolio’s NAV. Significant events which could affect a large number of securities in a particular market may include, but are not limited to: significant fluctuations in U.S. or foreign markets; market dislocations; market disruptions; or unscheduled market closings. Significant events which could also affect a single issuer may include, but are not limited to: corporate actions such as reorganizations, mergers and buy-outs; ratings downgrades; and bankruptcies.
17
GOLDMAN SACHS VARIABLE INSURANCE TRUST MULTI-STRATEGY ALTERNATIVES PORTFOLIO
Notes to Financial Statements (continued)
June 30, 2016 (Unaudited)
3. INVESTMENTS AND FAIR VALUE MEASUREMENTS (continued)
C. Fair Value Hierarchy — The following is a summary of the Portfolio’s investments and derivatives classified in the fair value hierarchy as of June 30, 2016:
| Investment Type | Level 1 | Level 2 | Level 3 | |||||||||
| Assets | ||||||||||||
| Equity Underlying Funds | $ | 1,345,260 | $ | — | $ | — | ||||||
| Fixed Income Underlying Funds | 7,563,816 | — | — | |||||||||
| Exchange Traded Fund | 78,182 | — | — | |||||||||
| Investment Company | 900,071 | — | — | |||||||||
| Total | $ | 9,887,329 | $ | — | $ | — | ||||||
| Derivative Type | ||||||||||||
| Assets(a) | ||||||||||||
| Forward Foreign Currency Exchange Contracts | $ | — | $ | 19,214 | $ | — | ||||||
| Futures Contracts | 4,019 | — | — | |||||||||
| Total | $ | 4,019 | $ | 19,214 | $ | — | ||||||
| Liabilities(a) | ||||||||||||
| Forward Foreign Currency Exchange Contracts | $ | — | $ | (22,023 | ) | $ | — | |||||
| Futures Contracts | (9,590 | ) | — | — | ||||||||
| Total | $ | (9,590 | ) | $ | (22,023 | ) | $ | — | ||||
| (a) | Amount shown represents unrealized gain (loss) at period end. |
For further information regarding security characteristics, see the Schedule of Investments.
4. INVESTMENTS IN DERIVATIVES
The following table sets forth, by certain risk types, the gross value of derivative contracts as of June 30, 2016. These instruments were used as part of the Portfolio’s investment strategies and to obtain and/or manage exposure related to the risks below. The values in the table below exclude the effects of cash collateral received or posted pursuant to these derivative contracts, and therefore are not representative of the Portfolio’s net exposure.
| Risk | Statement of Assets and Liabilities | Assets(a) | Statement of Assets and Liabilities | Liabilities(a) | ||||||||||
| Equity | Variation margin on certain derivative contracts | $ | 4,019 | Variation margin on certain derivative contracts | $ | (9,590 | ) | |||||||
| Currency | Receivable for unrealized gain on forward foreign currency exchange contracts | 19,214 | Payable for unrealized loss on forward foreign currency exchange contracts | (22,023 | ) | |||||||||
| Total | 23,233 | (31,613 | ) | |||||||||||
| (a) | Includes unrealized gain (loss) on futures contracts and centrally cleared swap contracts described in the Additional Investment Information section of the Schedule of Investments. Only current day’s variation margin is reported within the Statement of Assets and Liabilities. |
18
GOLDMAN SACHS VARIABLE INSURANCE TRUST MULTI-STRATEGY ALTERNATIVES PORTFOLIO
4. INVESTMENTS IN DERIVATIVES (continued)
The following table sets forth, by certain risk types, the Portfolio’s gains (losses) related to these derivatives and their indicative volumes for the six months ended June 30, 2016. These gains (losses) should be considered in the context that these derivative contracts may have been executed to create investment opportunities and/or economically hedge certain investments, and accordingly, certain gains (losses) on such derivative contracts may offset certain (losses) gains attributable to investments. These gains (losses) are included in “Net realized gain (loss)” or “Net change in unrealized gain (loss)” on the Statement of Operations.
| Risk | Statement of Operations | Net Realized Gain (Loss) | Net Change in Unrealized Gain (Loss) | Average Number of Contracts(a) | ||||||||||
| Equity | Net realized gain (loss) from futures contracts/Net change in unrealized gain (loss) on futures contracts | $ | (71,147 | ) | $ | (19,233 | ) | 24 | ||||||
| Currency | Net realized gain (loss) from forward foreign currency exchange contracts/Net change in unrealized gain (loss) on forward foreign currency exchange contracts | (16,162 | ) | (2,809 | ) | 39 | ||||||||
| Total | $ | (87,309 | ) | $ | (22,042 | ) | 63 | |||||||
| (a) | Average number of contracts is based on the average of month end balances for the six months ended June 30, 2016. |
5. AGREEMENTS AND AFFILIATED TRANSACTIONS
A. Management Agreement — Under the Agreement, GSAM manages the Portfolio, subject to the general supervision of the Trustees.
As compensation for the services rendered pursuant to the Agreement, the assumption of the expenses related thereto and administration of the Portfolio’s business affairs, including providing facilities, GSAM is entitled to a management fee, accrued daily and paid monthly, equal to an annual percentage rate of 0.15% of the Portfolio’s average daily net assets. GSAM has agreed to waive all of its management fee. The management fee waiver will remain in effect through at least April 29, 2017, and prior to such date, GSAM may not terminate the arrangement without the approval of the Board of Trustees. For the six months ended June 30, 2016, GSAM waived $7,610 of its management fee.
B. Distribution and Service Plans — The Trust, on behalf of the Portfolio, has adopted Distribution and Service Plans (the “Plans”). Under each Plan, Goldman Sachs, which serves as distributor (the “Distributor”), is entitled to a fee accrued daily and paid monthly, for distribution services and personal and account maintenance services, which may then be paid by Goldman Sachs to authorized dealers, equal to, on an annual basis, 0.25% and 0.40% of the Portfolio’s average daily net assets attributable to Service and Advisor Shares, respectively.
C. Transfer Agency Agreement — Goldman Sachs also serves as the transfer agent of the Portfolio for a fee pursuant to the Transfer Agency Agreement. The fees charged for such transfer agency services are accrued daily and paid monthly at an annual rate of 0.02% of the average daily net assets of Institutional, Service and Advisor Shares.
D. Other Expense Agreements and Affiliated Transactions — GSAM has agreed to limit certain “Other Expenses” of the Portfolio (excluding acquired fund fees and expenses, transfer agency fees and expenses, taxes, interest, brokerage fees, shareholder meeting, litigation, indemnification, and extraordinary expenses) to the extent such expenses exceed, on an annual basis, a percentage rate of the average daily net assets of the Portfolio. Such Other Expense reimbursements, if any, are accrued daily and paid monthly. In addition, the Portfolio is not obligated to reimburse GSAM for prior fiscal year expense reimbursements, if any. The Other Expense limitation as an annual percentage rate of average daily net assets for the Portfolio is 0.204%. The Other Expense limitation will remain in place through at least April 29, 2017, and prior to such date GSAM may not terminate the arrangement without the approval of the Trustees. For the six months ended June 30, 2016, GSAM reimbursed $100,516 to the Portfolio. In addition, the Portfolio has entered into certain offset arrangements with the custodian and the transfer agent, which
19
GOLDMAN SACHS VARIABLE INSURANCE TRUST MULTI-STRATEGY ALTERNATIVES PORTFOLIO
Notes to Financial Statements (continued)
June 30, 2016 (Unaudited)
5. AGREEMENTS AND AFFILIATED TRANSACTIONS (continued)
may result in a reduction of the Portfolio’s expenses and are received irrespective of the application of the “Other Expense” limitations described above. For the six months ended June 30, 2016, custody fee credits were $27.
The Portfolio invests in FST Institutional Shares of the Goldman Sachs Financial Square Government Fund, which is an affiliated Underlying Fund. GSAM has agreed to waive an amount equal to any management fee it earns as an investment to the Goldman Sachs Financial Square Government Fund. For the six months ended June 30, 2016, GSAM waived $779 of the Portfolio’s other expenses.
E. Line of Credit Facility — As of June 30, 2016, the Portfolio participated in a $1,100,000,000 committed, unsecured revolving line of credit facility (the “facility”) together with other funds of the Trust and registered investment companies having management agreements with GSAM or its affiliates (“Other Borrowers”). This facility is to be used for temporary or emergency purposes, or to allow for an orderly liquidation of securities to meet redemption requests. The interest rate on borrowings is based on the federal funds rate. The facility also requires a fee to be paid by the Portfolio based on the amount of the commitment that has not been utilized. For the six months ended June 30, 2016, the Portfolio did not have any borrowings under the facility.
F. Other Transactions with Affiliates — The Portfolio invests primarily in the Institutional Shares of the Underlying Funds. These Underlying Funds are considered to be affiliated with the Portfolio. The table below shows the transactions in and earnings from investments in these Underlying Funds for the six months ended June 30, 2016:
| Underlying Funds | Market Value | Purchases at Cost | Proceeds Sales | Net (Loss) | Change in Unrealized Appreciation (Depreciation) | Market Value 6/30/2016 | Dividend Income | |||||||||||||||||||||
Goldman Sachs Absolute Return Tracker Fund | $ | 1,464,549 | $ | 120,000 | $ | (228,000 | ) | $ | (14,214 | ) | $ | 29,876 | $ | 1,372,211 | $ | — | ||||||||||||
Goldman Sachs Dynamic Commodity Strategy Fund | 502,270 | — | (488,156 | ) | (123,211 | ) | 109,097 | — | — | |||||||||||||||||||
Goldman Sachs Dynamic Emerging Markets Debt Fund | 789,146 | 272,240 | (165,000 | ) | (16,586 | ) | 85,374 | 965,174 | 22,573 | |||||||||||||||||||
Goldman Sachs Emerging Markets Equity Fund | 510,845 | 35,000 | (71,000 | ) | 921 | 23,514 | 499,280 | — | ||||||||||||||||||||
Goldman Sachs Financial Square Government Fund | 812,720 | 2,376,132 | (2,288,782 | ) | — | 1 | 900,071 | 1,263 | ||||||||||||||||||||
Goldman Sachs Fixed Income Macro Strategies Fund | 1,235,596 | 145,000 | (175,000 | ) | (17,938 | ) | (12,768 | ) | 1,174,890 | — | ||||||||||||||||||
Goldman Sachs International Real Estate Securities Fund | 90,303 | 1,051 | — | — | 929 | 92,283 | 1,051 | |||||||||||||||||||||
Goldman Sachs Long Short Credit Strategies Fund | 1,092,205 | 777,136 | (260,000 | ) | (17,673 | ) | 32,589 | 1,624,257 | 17,427 | |||||||||||||||||||
Goldman Sachs Long Short Fund | 1,343,748 | 170,000 | (752,000 | ) | (201,765 | ) | 74,705 | 634,688 | — | |||||||||||||||||||
Goldman Sachs Managed Futures Strategy Fund | — | 1,140,000 | (75,000 | ) | (5,203 | ) | (25,782 | ) | 1,034,015 | — | ||||||||||||||||||
Goldman Sachs Real Estate Securities Fund | 108,252 | 1,455 | — | — | 9,302 | 119,009 | 1,455 | |||||||||||||||||||||
Goldman Sachs Strategic Income Fund | 1,499,095 | 171,021 | (240,000 | ) | (26,775 | ) | (10,072 | ) | 1,393,269 | 19,541 | ||||||||||||||||||
Goldman Sachs VIT Global Trends Allocation Fund | 982,531 | — | (961,542 | ) | (91,146 | ) | 70,157 | — | — | |||||||||||||||||||
| Total | $ | 10,431,260 | $ | 5,209,035 | $ | (5,704,480 | ) | $ | (513,590 | ) | $ | 386,922 | $ | 9,809,147 | $ | 63,310 | ||||||||||||
As of June 30, 2016, the Goldman Sachs Group, Inc. was the beneficial owner of approximately 28% of the Institutional Class Shares of the Portfolio.
20
GOLDMAN SACHS VARIABLE INSURANCE TRUST MULTI-STRATEGY ALTERNATIVES PORTFOLIO
6. PORTFOLIO SECURITIES TRANSACTIONS
The cost of purchases and proceeds from sales and maturities of long-term securities for the six months ended June 30, 2016, were $2,950,617 and $3,735,540, respectively.
7. TAX INFORMATION
As of the Portfolio’s most recent fiscal year end, December 31, 2015, the Portfolio’s capital loss carryforwards and timing differences, on a tax-basis were as follows:
| Capital loss carryforward | ||||
Perpetual short-term | $ | (38,410 | ) | |
| Timing differences (Post October Loss Deferral) | (65,991 | ) |
As of June 30, 2016, the Portfolio’s aggregate security unrealized gains and losses based on cost for U.S. federal income tax purposes were as follows:
| Tax cost | $ | 10,246,728 | ||
| Gross unrealized gain | 51,659 | |||
| Gross unrealized loss | (411,058 | ) | ||
| Net unrealized security loss | $ | (359,399 | ) |
The difference between GAAP-basis and tax-basis unrealized gains (losses) is attributable primarily to wash sales, net mark to market gains/(losses) on regulated futures contracts and differences in the tax treatment of underlying fund investments.
GSAM has reviewed the Portfolio’s tax position for all open tax years (the current and prior three years, as applicable) and has concluded that no provision for income tax is required in the Portfolio’s financial statements. Such open tax years remain subject to examination and adjustment by tax authorities.
8. OTHER RISKS
The Portfolio’s risks include, but are not limited to, the following:
Derivatives Risk — Loss may result from the Portfolio’s or an Underlying Fund’s investments in derivative instruments. These instruments may be illiquid, difficult to price and leveraged so that small changes in the value of the underlying instruments may produce disproportionate losses to the Portfolio or an Underlying Fund. Derivatives are also subject to counterparty risk, which is the risk that the other party in the transaction will not fulfill its contractual obligation. Losses from investments in derivatives can also result from a lack of correlation between changes in the value of derivative instruments and the portfolio assets (if any) being hedged.
Investments in the Underlying Funds — The investments of the Portfolio are concentrated in the Underlying Funds, and the Portfolio’s investment performance is directly related to the investment performance of the Underlying Funds it holds. The Portfolio is subject to the risk factors associated with the investments of the Underlying Funds in direct proportion to the amount of assets allocated to each. To the extent that the Portfolio has a relative concentration of its portfolio in a single Underlying Fund, the Portfolio may be more susceptible to adverse developments affecting that Underlying Fund, and may be more susceptible to losses because of these developments.
Investments in Other Investment Companies – As a shareholder of another investment company, including an exchange-traded fund (“ETF”), the Portfolio will indirectly bear its proportionate share of any net management fees and other expenses paid by such
21
GOLDMAN SACHS VARIABLE INSURANCE TRUST MULTI-STRATEGY ALTERNATIVES PORTFOLIO
Notes to Financial Statements (continued)
June 30, 2016 (Unaudited)
8. OTHER RISKS (continued)
other investment companies, in addition to the fees and expenses regularly borne by the Portfolio. ETFs are subject to risks that do not apply to conventional mutual funds, including but not limited to the following: (i) the market price of the ETF’s shares may trade at a premium or a discount to their NAV; and (ii) an active trading market for an ETF’s shares may not develop or be maintained.
Large Shareholder Transactions Risk — The Portfolio or an Underlying Fund may experience adverse effects when certain large shareholders, such as other funds, participating insurance companies, accounts and Goldman Sachs affiliates, purchase or redeem large amounts of shares of the Portfolio or an Underlying Fund. Such large shareholder redemptions may cause the Portfolio or an Underlying Fund to sell portfolio securities at times when it would not otherwise do so, which may negatively impact the Portfolio’s or an Underlying Fund’s NAV and liquidity. These transactions may also accelerate the realization of taxable income to shareholders if such sales of investments resulted in gains, and may also increase transaction costs. In addition, a large redemption could result in the Portfolio��s or an Underlying Fund’s current expenses being allocated over a smaller asset base, leading to an increase in the Portfolio’s or an Underlying Fund’s expense ratio. Similarly, large Portfolio or Underlying Fund share purchases may adversely affect the Portfolio’s or an Underlying Fund’s performance to the extent that the Portfolio or an Underlying Fund is delayed in investing new cash and is required to maintain a larger cash position than it ordinarily would.
Liquidity Risk — The Underlying Funds may make investments that are illiquid or that may become less liquid in response to market developments or adverse investor perceptions. Illiquid investments may be more difficult to value. Liquidity risk may also refer to the risk that a Portfolio will not be able to pay redemption proceeds within the allowable time period because of unusual market conditions, an unusually high volume of redemption requests, or other reasons. To meet redemption requests, a Portfolio may be forced to sell investments at an unfavorable time and/or under unfavorable conditions. Liquidity risk may be the result of, among other things, the reduced number and capacity of traditional market participants to make a market in fixed income securities or the lack of an active market. The potential for liquidity risk may be magnified by a rising interest rate environment or other circumstances where investor redemptions from fixed income mutual funds may be higher than normal, potentially causing increased supply in the market due to selling activity.
Market and Credit Risks — In the normal course of business, the Portfolio and the Underlying Funds trade financial instruments and enter into financial transactions where risk of potential loss exists due to changes in the market (market risk). Additionally, the Portfolio and the Underlying Funds may also be exposed to credit risk in the event that an issuer or guarantor fails to perform or that an institution or entity with which the Portfolio and the Underlying Funds have unsettled or open transactions defaults.
Short Position Risk — The Portfolio or an Underlying Fund may enter into a short position through a futures contract, an option or swap agreement or through short sales of any instrument that the Portfolio or an Underlying Fund may purchase for investment. Taking short positions involves leverage of the Portfolio’s assets and presents various risks. If the value of the underlying instrument or market in which the Portfolio or an Underlying Fund has taken a short position increases, then the Portfolio or an Underlying Fund will incur a loss equal to the increase in value from the time that the short position was entered into plus any related interest payments or other fees. Taking short positions involves the risk that losses may be disproportionate, may exceed the amount invested, and may be unlimited.
9. INDEMNIFICATIONS
Under the Trust’s organizational documents, its Trustees, officers, employees and agents are indemnified, to the extent permitted by the Act and state law, against certain liabilities that may arise out of performance of their duties to the Portfolio. Additionally, in the course of business, the Portfolio enters into contracts that contain a variety of indemnification clauses. The Portfolio’s maximum exposure under these arrangements is unknown, as this would involve future claims that may be made against the Portfolio that have not yet occurred. However, GSAM believes the risk of loss under these arrangements to be remote.
22
GOLDMAN SACHS VARIABLE INSURANCE TRUST MULTI-STRATEGY ALTERNATIVES PORTFOLIO
10. SUBSEQUENT EVENTS
Subsequent events after the Statement of Assets and Liabilities date have been evaluated through the date the financial statements were issued. GSAM has concluded that there is no impact requiring adjustment or disclosure in the financial statements.
11. SUMMARY OF SHARE TRANSACTIONS
Share activity is as follows:
| For the Six Months Ended June 30, 2016 (Unaudited) | For the Fiscal Year Ended December 31, 2015 | |||||||||||||||
| Shares | Dollars | Shares | Dollars | |||||||||||||
| Institutional Shares | ||||||||||||||||
| Shares sold | 125 | $ | 1,122 | 167 | $ | 1,635 | ||||||||||
| Reinvestment of distributions | — | — | 2,436 | 22,316 | ||||||||||||
| Shares redeemed | (100,385 | ) | (901,609 | ) | (90 | ) | (866 | ) | ||||||||
| (100,260 | ) | (900,487 | ) | 2,513 | 23,085 | |||||||||||
| Service Shares | ||||||||||||||||
| Shares sold | 28,902 | 259,278 | 1,310 | 12,500 | ||||||||||||
| Reinvestment of distributions | — | — | 51 | 472 | ||||||||||||
| Shares redeemed | (215 | ) | (1,926 | ) | (5 | ) | (51 | ) | ||||||||
| 28,687 | 257,352 | 1,356 | 12,921 | |||||||||||||
| Advisor Shares | ||||||||||||||||
| Shares sold | 213,535 | 1,909,362 | 924,410 | 9,003,954 | ||||||||||||
| Reinvestment of distributions | — | — | 21,718 | 198,317 | ||||||||||||
| Shares redeemed | (187,976 | ) | (1,685,976 | ) | (217,661 | ) | (2,078,806 | ) | ||||||||
| 25,559 | 223,386 | 728,467 | 7,123,465 | |||||||||||||
| NET INCREASE (DECREASE) | (46,014 | ) | $ | (419,749 | ) | 732,336 | $ | 7,159,471 | ||||||||
23
GOLDMAN SACHS VARIABLE INSURANCE TRUST MULTI-STRATEGY ALTERNATIVES PORTFOLIO
| Portfolio Expenses — Six Month Period Ended June 30, 2016 (Unaudited) |
As a shareholder of Institutional, Service or Advisor Shares of the Portfolio, you incur ongoing costs, including management fees, distribution and service (12b-1) fees (with respect to Service and Advisor Shares) and other Portfolio expenses. This example is intended to help you understand your ongoing costs (in dollars) of investing in the Institutional Shares, Service Shares and Advisor Shares of the Portfolio and to compare these costs with the ongoing costs of investing in other mutual funds.
The example is based on an investment of $1,000 invested at the beginning of the period and held for the entire period from January 1, 2016 through June 30, 2016, which represents a period of 182 days of a 366 day year.
Actual Expenses — The first line under each share class in the table below provides information about actual account values and actual expenses. You may use the information in this line, together with the amount you invested, to estimate the expenses that you paid over the period. Simply divide your account value by $1,000 (for example, an $8,600 account value divided by $1,000=8.6), then multiply the result by the number in the first line under the heading entitled “Expenses Paid” to estimate the expenses you paid on your account during this period.
Hypothetical Example for Comparison Purposes — The second line under each share class in the table below provides information about hypothetical account values and hypothetical expenses based on the Portfolio's actual net expense ratio and an assumed rate of return of 5% per year before expenses, which is not the Portfolio's actual return. The hypothetical account values and expenses may not be used to estimate the actual ending account balance or expenses you paid for the period. You may use this information to compare the ongoing costs of investing in the Portfolios and other funds. To do so, compare this 5% hypothetical example with the 5% hypothetical examples that appear in the shareholder reports of the other funds.
Please note that the expenses shown in the table are meant to highlight your ongoing costs only. As a shareholder of the Portfolio you do not incur any transaction costs, such as sales charges, redemption fees, or exchange fees, but shareholders of other funds may incur such costs. The second line of the table is useful in comparing ongoing costs only, and will not help you determine the relative total costs of owning different funds whose shareholders may incur transaction costs.
| Share Class | Beginning Account Value 01/01/16 | Ending Account Value | Expenses Paid for the 6 Months Ended 06/30/16* | |||||||||
| Institutional | ||||||||||||
| Actual | $ | 1,000 | $ | 984.70 | $ | 0.84 | ||||||
| Hypothetical 5% return | 1,000 | 1,024.02 | + | 0.86 | ||||||||
| Service | ||||||||||||
| Actual | 1,000 | 983.60 | 2.27 | |||||||||
| Hypothetical 5% return | 1,000 | 1,022.58 | + | 2.31 | ||||||||
| Advisor | ||||||||||||
| Actual | 1,000 | 983.60 | 3.01 | |||||||||
| Hypothetical 5% return | 1,000 | 1,021.83 | + | 3.07 | ||||||||
| * | Expenses are calculated using the Portfolio’s annualized net expense ratio for each class, which represents the ongoing expenses as a percentage of net assets for the six months ended June 30, 2016. Expenses are calculated by multiplying the annualized net expense ratio by the average account value for the period; then multiplying the result by the number of days in the most recent fiscal half year; and then dividing that result by the number of days in the fiscal year. The annualized net expense ratios for the period were 0.21%, 0.46% and 0.61% for Institutional, Service and Advisor Shares, respectively. |
| + | Hypothetical expenses are based on the Portfolio’s actual annualized net expense ratios and an assumed rate of return of 5% per year before expenses. |
24
GOLDMAN SACHS VARIABLE INSURANCE TRUST MULTI-STRATEGY ALTERNATIVES PORTFOLIO
Statement Regarding Basis for Approval of Management Agreement (Unaudited)
Background
The Goldman Sachs Multi-Strategy Alternatives Portfolio (the “Portfolio”) is an investment portfolio of Goldman Sachs Variable Insurance Trust (the “Trust”). The Board of Trustees oversees the management of the Trust and reviews the investment performance and expenses of the Portfolio at regularly scheduled meetings held throughout the year. In addition, the Board of Trustees determines annually whether to approve the continuance of the Trust’s investment management agreement (the “Management Agreement”) with Goldman Sachs Asset Management, L.P. (the “Investment Adviser”) on behalf of the Portfolio.
The Management Agreement was most recently approved for continuation until June 30, 2017 by the Board of Trustees, including those Trustees who are not parties to the Management Agreement or “interested persons” (as defined in the Investment Company Act of 1940, as amended) of any party thereto (the “Independent Trustees”), at a meeting held on June 15-16, 2016 (the “Annual Meeting”).
The review process undertaken by the Trustees spans the course of the year and culminates with the Annual Meeting. To assist the Trustees in their deliberations, the Trustees have established a Contract Review Committee (the “Committee”), comprised of the Independent Trustees. The Committee held three meetings over the course of the year since the Management Agreement was last approved. At those Committee meetings, regularly scheduled Board or other committee meetings, and/or the Annual Meeting, matters relevant to the renewal of the Management Agreement were considered by the Board, or the Independent Trustees, as applicable. With respect to the Portfolio, such matters included:
| (a) | the nature and quality of the advisory, administrative, and other services provided to the Portfolio and the underlying funds in which it invests (the “Underlying Funds”) by the Investment Adviser and its affiliates, including information about: |
| (i) | the structure, staff, and capabilities of the Investment Adviser and its portfolio management teams; |
| (ii) | the groups within the Investment Adviser and its affiliates that support the portfolio management teams or provide other types of necessary services, including fund services groups (e.g., accounting and financial reporting, tax, shareholder services, and operations); controls and risk management groups (e.g., legal, compliance, valuation oversight, credit risk management, internal audit, compliance testing, market risk analysis, finance, and central funding); sales and distribution support groups, and others (e.g., information technology and training); |
| (iii) | trends in employee headcount; |
| (iv) | the Investment Adviser’s financial resources and ability to hire and retain talented personnel and strengthen its operations; and |
| (v) | the parent company’s support of the Investment Adviser and its mutual fund business, as expressed by the firm’s senior management; |
| (b) | information on the investment performance of the Portfolio and Underlying Funds, including comparisons to the performance of similar mutual funds, as provided by a third-party mutual fund data provider engaged as part of the contract review process (the “Outside Data Provider”), and a benchmark performance index; and general investment outlooks in the markets in which the Portfolio and Underlying Funds invest; |
| (c) | information provided by the Investment Adviser indicating the Investment Adviser’s views on whether the Portfolio’s peer group and/or benchmark index had high, medium, or low relevance given the Portfolio’s particular investment strategy; |
| (d) | the terms of the Management Agreement and other agreements with affiliated service providers entered into by the Trust on behalf of the Portfolio; |
| (e) | fee and expense information for the Portfolio, including: |
| (i) | the relative management fee and expense level of the Portfolio as compared to those of comparable funds managed by other advisers, as provided by the Outside Data Provider; and |
| (ii) | the Portfolio’s expense trends over time; |
| (f) | with respect to the investment performance and expense comparison data provided by the Outside Data Provider, its processes in producing that data for the Portfolio; |
| (g) | the undertaking of the Investment Adviser to waive the management fee paid by the Portfolio and a portion of the management fees paid by certain Underlying Funds and to limit certain expenses of the Portfolio and the Underlying Funds that exceed specified levels; |
| (h) | information relating to the profitability of the Management Agreement and the transfer agency and distribution and service arrangements of the Portfolio and the Trust as a whole to the Investment Adviser and its affiliates; |
| (i) | whether the Portfolio’s existing management fee schedule, together with the management fee schedules of the Underlying Funds, adequately addressed any economies of scale; |
25
GOLDMAN SACHS VARIABLE INSURANCE TRUST MULTI-STRATEGY ALTERNATIVES PORTFOLIO
Statement Regarding Basis for Approval of Management Agreement (Unaudited) (continued)
| (j) | a summary of the “fall-out” benefits derived by the Investment Adviser and its affiliates from their relationships with the Portfolio and/or the Underlying Funds, including the fees received by the Investment Adviser’s affiliates from the Portfolio and/or the Underlying Funds for transfer agency, portfolio trading, distribution and other services; |
| (k) | a summary of potential benefits derived by the Portfolio and/or the Underlying Funds as a result of their relationship with the Investment Adviser; |
| (l) | with respect to the applicable Underlying Funds, information regarding commissions paid by the Underlying Equity Funds and broker oversight, an update on the Investment Adviser’s soft dollars practices, other information regarding portfolio trading, and how the Investment Adviser carries out its duty to seek best execution; |
| (m) | the manner in which portfolio manager compensation is determined; and the number and types of accounts managed by the portfolio managers; |
| (n) | the nature and quality of the services provided to the Portfolio and the Underlying Funds by their unaffiliated service providers, and the Investment Adviser’s general oversight and evaluation (including reports on due diligence) of those service providers as part of the administration services provided under the Management Agreement; and |
| (o) | the Investment Adviser’s processes and policies addressing various types of potential conflicts of interest; its approach to risk management; the annual review of the effectiveness of the Portfolio’s compliance program; and periodic compliance reports. |
The Trustees also received an overview of the Portfolio’s distribution arrangements. They received information regarding the Portfolio’s assets, share purchase and redemption activity, and payment of distribution and service fees. Information was also provided to the Trustees relating to revenue sharing payments made by and services provided by the Investment Adviser and its affiliates to intermediaries that promote the sale, distribution, and/or servicing of Portfolio shares. The Independent Trustees also discussed the broad range of other investment choices that are available to Portfolio investors, including the availability of comparable funds managed by other advisers.
The presentations made at the Board and Committee meetings and at the Annual Meeting encompassed the Portfolio and other mutual funds for which the Board of Trustees has responsibility. In evaluating the Management Agreement at the Annual Meeting, the Trustees relied upon their knowledge, resulting from their meetings and other interactions throughout the year, of the Investment Adviser and its affiliates, their services, and the Portfolio. In conjunction with these meetings, the Trustees received written materials and oral presentations on the topics covered, and the Investment Adviser addressed the questions and concerns of the Trustees, including concerns regarding the investment performance of certain of the funds they oversee. The Independent Trustees were advised by their independent legal counsel regarding their responsibilities and other regulatory requirements related to the approval and continuation of mutual fund investment management agreements under applicable law. In addition, the Investment Adviser and its affiliates provided the Independent Trustees with a written response to a formal request for information sent on behalf of the Independent Trustees by their independent legal counsel. During the course of their deliberations, the Independent Trustees met in executive sessions with their independent legal counsel, without representatives of the Investment Adviser or its affiliates present.
Nature, Extent, and Quality of the Services Provided Under the Management Agreement
As part of their review, the Trustees considered the nature, extent, and quality of the services provided to the Portfolio and the Underlying Funds by the Investment Adviser. In this regard, the Trustees considered both the investment advisory services and non-advisory services that are provided by the Investment Adviser and its affiliates. The Trustees noted the transition in the leadership and changes in personnel of various of the Investment Adviser’s portfolio management teams that had occurred in recent periods, and the ongoing recruitment efforts aimed at bringing high quality investment talent to the Investment Adviser. They also noted the Investment Adviser’s commitment to maintaining high quality systems and expending substantial resources to respond to ongoing changes to the regulatory and control environment in which the Portfolio and the Underlying Funds and their service providers operate, as well as the efforts of the Investment Adviser and its affiliates to combat cyber security risks. The Trustees concluded that the Investment Adviser continued to commit substantial financial and operational resources to the Portfolio and expressed confidence that the Investment Adviser would continue to do so in the future. The Trustees also recognized that the Investment Adviser had made significant commitments to address regulatory compliance requirements applicable to the Portfolio, the Underlying Funds, and the Investment Adviser and its affiliates.
Investment Performance
The Trustees also considered the investment performance of the Portfolio and the Underlying Funds. In this regard, they compared the investment performance of the Portfolio to its peers using rankings compiled by the Outside Data Provider as of
26
GOLDMAN SACHS VARIABLE INSURANCE TRUST MULTI-STRATEGY ALTERNATIVES PORTFOLIO
Statement Regarding Basis for Approval of Management Agreement (Unaudited) (continued)
December 31, 2015, and updated performance information prepared by the Investment Adviser using the peer group identified by the Outside Data Provider as of March 31, 2016. The information on the Portfolio’s investment performance was provided for the one-year period ending on the applicable date. The Trustees also reviewed the Portfolio’s investment performance relative to its performance benchmark. As part of this review, they considered the investment performance trends of the Portfolio over time, and reviewed the investment performance of the Portfolio in light of its investment objective and policies and market conditions.
In addition, the Trustees considered materials prepared and presentations made by the Investment Adviser’s senior management and portfolio management personnel in which Portfolio performance was assessed. The Trustees also considered the Investment Adviser’s periodic reports with respect to the Portfolio’s risk profile, and how the Investment Adviser’s approach to risk monitoring and management influences portfolio management.
The Trustees noted that the Portfolio’s Institutional Shares placed in the third quartile of the Portfolio’s peer group and underperformed the Portfolio’s LIBOR-based benchmark index by 6.67% for the one-year period, and underperformed the average performance of a group of competitor funds, as determined by the Investment Adviser, for the one-year period ending March 31, 2016. They observed that the Portfolio had certain significant differences from the Portfolio’s benchmark index that caused it to be an imperfect basis for comparison.
Costs of Services Provided and Competitive Information
The Trustees considered the contractual terms of the Management Agreement and the fee rates payable by the Portfolio thereunder. In this regard, the Trustees considered information on the services rendered by the Investment Adviser to the Portfolio, which included both advisory and administrative services that were directed to the needs and operations of the Portfolio as a registered mutual fund.
In particular, the Trustees reviewed analyses prepared by the Outside Data Provider regarding the expense rankings of the Portfolio. The analyses provided a comparison of the Portfolio’s management fee to those of a relevant peer group and category universe; an expense analysis which compared the Portfolio’s overall net and gross expenses to a peer group and a category universe; and a one-year history comparing the Portfolio’s net expenses to the peer and category medians. The analyses also compared the Portfolio’s transfer agency, custody, and distribution fees, other expenses and fee waivers/reimbursements to those of the peer group and category medians. The Trustees concluded that the comparisons provided by the Outside Data Provider were useful in evaluating the reasonableness of the management fees and total expenses paid by the Portfolio.
In addition, the Trustees considered the Investment Adviser’s undertaking to waive the management fee paid by the Portfolio and a portion of the management fees paid by certain Underlying Funds and to limit certain expenses of the Portfolio and the Underlying Funds that exceed specified levels. They also noted that the Investment Adviser did not manage other types of accounts having investment objectives and policies similar to those of the Portfolio, and therefore this type of fee comparison was not possible.
In addition, the Trustees noted that shareholders are able to redeem their Portfolio shares at any time if shareholders believe that the Portfolio fees and expenses are too high or if they are dissatisfied with the performance of the Portfolio.
Profitability
The Trustees reviewed the Investment Adviser’s revenues and pre-tax profit margins with respect to the Trust and the Portfolio. In this regard the Trustees noted that they had received, among other things, profitability analyses and summaries, revenue and expense schedules by Portfolio and by function (i.e., investment management, transfer agency and distribution and service), and information on the Investment Adviser’s expense allocation methodology. They observed that the profitability and expense figures are substantially similar to those used by the Investment Adviser for many internal purposes, including compensation decisions among various business groups, and are thus subject to a vigorous internal debate about how certain revenue and expenses should be allocated. The Trustees also noted that the internal audit group within the Goldman Sachs organization had audited the expense allocation methodology and was satisfied with the reasonableness, consistency, and accuracy of the Investment Adviser’s expense allocation methodology and profitability analysis calculations. Profitability data for the Trust and the Portfolio were provided for 2015 and 2014, and the Trustees considered this information in relation to the Investment Adviser’s overall profitability. The Trustees considered the Investment Adviser’s revenues and pre-tax profit margins both in absolute terms and in comparison to information on the reported pre-tax profit margins earned by certain other asset management firms.
27
GOLDMAN SACHS VARIABLE INSURANCE TRUST MULTI-STRATEGY ALTERNATIVES PORTFOLIO
Statement Regarding Basis for Approval of Management Agreement (Unaudited) (continued)
Economies of Scale
The Trustees considered the information that had been provided regarding the Investment Adviser’s profitability. The Trustees noted that, although the Portfolio itself does not have breakpoints in its management fee schedule, any benefits of the breakpoints in the management fee schedules of certain Underlying Funds, when reached, would pass through to the shareholders in the Portfolio at the specified asset levels. The Trustees considered the amounts of assets in the Portfolio; the Portfolio’s recent purchase and redemption activity; the information provided by the Investment Adviser relating to the costs of the services provided by the Investment Adviser and its affiliates and the profits realized by them; information comparing the fee rates charged by the Investment Adviser with fee rates charged to other funds in the peer group; and the Investment Adviser’s undertaking to limit certain expenses of the Portfolio and Underlying Funds that exceed specified levels. They also considered the services provided to the Portfolio under the Management Agreement and the fees and expenses borne by the Underlying Funds, and determined that the management fees payable by the Portfolio were not duplicative of the management fees paid at the Underlying Fund level.
Other Benefits to the Investment Adviser and Its Affiliates
The Trustees also considered the other benefits derived by the Investment Adviser and its affiliates from their relationships with the Portfolio and/or the Underlying Funds as stated above, including: (a) transfer agency fees received by Goldman, Sachs & Co. (“Goldman Sachs”); (b) brokerage and futures commissions earned by Goldman Sachs for executing securities and futures transactions on behalf of certain Underlying Funds; (c) research received by the Investment Adviser from broker-dealers in exchange for executing certain transactions on behalf of certain Underlying Funds; (d) trading efficiencies resulting from aggregation of orders of the Underlying Funds with those for other funds or accounts managed by the Investment Adviser; (e) the Investment Adviser’s ability to leverage the infrastructure designed to service the Portfolio on behalf of its other clients; (f) the Investment Adviser’s ability to cross-market other products and services to Portfolio shareholders; (g) Goldman Sachs’ retention of certain fees as Portfolio Distributor; (h) the Investment Adviser’s ability to negotiate better pricing with custodians on behalf of its other clients, as a result of the relationship with the Portfolio and Underlying Funds; and (i) the possibility that the working relationship between the Investment Adviser and the Portfolio’s and Underlying Funds’ third-party service providers may cause those service providers to be more likely to do business with other areas of Goldman Sachs. In the course of considering the foregoing, the Independent Trustees requested and received further information quantifying certain of these fall-out benefits.
Other Benefits to the Portfolio and Its Shareholders
The Trustees also noted that the Portfolio and/or the Underlying Funds receive certain potential benefits as a result of their relationship with the Investment Adviser, including: (a) trading efficiencies resulting from aggregation of orders of the Underlying Funds with those of other funds or accounts managed by the Investment Adviser; (b) enhanced servicing from vendors because of the volume of business generated by the Investment Adviser and its affiliates; (c) with respect to the Underlying Funds, enhanced servicing from broker-dealers because of the volume of business generated by the Investment Adviser and its affiliates; (d) with respect to certain Underlying Funds, the Investment Adviser’s ability to negotiate favorable terms with derivatives counterparties on behalf of the Portfolio as a result of the size and reputation of the Goldman Sachs organization; (e) the Investment Adviser’s knowledge and experience gained from managing other accounts and products; (f) the Investment Adviser’s ability to hire and retain qualified personnel to provide services to the Portfolio and the Underlying Funds because of the reputation of the Goldman Sachs organization; (g) the Portfolio’s and Underlying Funds’ access, through the Investment Adviser, to certain firmwide resources (e.g., proprietary risk management systems and databases), subject to certain restrictions; and (h) the Portfolio’s access to certain affiliated distribution channels. In addition, the Trustees noted the competitive nature of the mutual fund marketplace, and considered that many of the Portfolio’s shareholders invested in the Portfolio in part because of the Portfolio’s relationship with the Investment Adviser and that those shareholders have a general expectation that the relationship will continue.
Conclusion
In connection with their consideration of the Management Agreement, the Trustees gave weight to each of the factors described above, but did not identify any particular factor as controlling their decision. After deliberation and consideration of all of the information provided, including the factors described above, the Trustees concluded, in the exercise of their business judgment, that the management fees paid by the Portfolio were reasonable in light of the services provided to it by the Investment Adviser, the Investment Adviser’s costs and the Portfolio’s current and reasonably foreseeable asset levels. The Trustees unanimously concluded that the Investment Adviser’s continued management likely would benefit the Portfolio and its shareholders and that the Management Agreement should be approved and continued with respect to the Portfolio until June 30, 2017.
28
| TRUSTEES | OFFICERS | |
| Ashok N. Bakhru, Chairman | James A. McNamara, President | |
| Kathryn A. Cassidy | Scott M. McHugh, Principal Financial Officer, | |
| Diana M. Daniels | Senior Vice President and Treasurer | |
| Herbert J. Markley | Caroline L. Kraus, Secretary | |
| James A. McNamara | ||
| Jessica Palmer | ||
| Alan A. Shuch | ||
| Roy W. Templin | ||
| Gregory G. Weaver |
GOLDMAN, SACHS & CO.
Distributor and Transfer Agent
GOLDMAN SACHS ASSET MANAGEMENT, L.P.
Investment Adviser
200 West Street, New York
New York 10282
Visit our web site at www.GSAMFUNDS.com to obtain the most recent month-end returns.
The reports concerning the Portfolio included in this shareholder report may contain certain forward-looking statements about the factors that may affect the performance of the Portfolio in the future. These statements are based on Portfolio management’s predictions and expectations concerning certain future events and their expected impact on the Portfolio, such as performance of the economy as a whole and of specific industry sectors, changes in the levels of interest rates, the impact of developing world events, and other factors that may influence the future performance of the Portfolio. Management believes these forward-looking statements to be reasonable, although they are inherently uncertain and difficult to predict. Actual events may cause adjustments in portfolio management strategies from those currently expected to be employed.
A description of the policies and procedures that the Portfolio uses to determine how to vote proxies relating to portfolio securities and information regarding how the Portfolio voted proxies relating to portfolio securities for the 12-month period ended June 30 is available (i) without charge, upon request by calling 1-800-621-2550; and (ii) on the Securities and Exchange Commission (“SEC”) web site at http://www.sec.gov.
The Portfolio files its complete schedule of portfolio holdings with the SEC for the first and third quarters of each fiscal year on Form N-Q. The Portfolio’s Form N-Qs are available on the SEC’s web site at http://www.sec.gov within 60 days after the Portfolio’s first and third fiscal quarters. The Portfolio’s Form N-Qs may be reviewed and copied at the SEC’s Public Reference Room in Washington, D.C. and information on the operation of the Public Reference Room may also be obtained by calling 1-800-SEC-0330. Form N-Qs may be obtained upon request and without charge by calling 1-800-621-2550.
The website links provided are for your convenience only and are not an endorsement or recommendation by GSAM of any of these websites or the products or services offered. GSAM is not responsible for the accuracy and validity of the content of these websites.
Portfolio holdings and allocations shown are as of June 30, 2016 and may not be representative of future investments. Portfolio holdings should not be relied on in making investment decisions and should not be construed as research or investment advice regarding particular securities. Current and future holdings are subject to risk.
References to indices, benchmarks or other measures of relative market performance over a specified period of time are provided for your information only and do not imply that the portfolio will achieve similar results. The index composition may not reflect the manner in which a portfolio is constructed. While an adviser seeks to design a portfolio which reflects appropriate risk and return features, portfolio characteristics may deviate from those of the benchmark.
The Global Industry Classification Standard (“GICS”) was developed by and is the exclusive property and a service mark of Morgan Stanley Capital International Inc. (“MSCI”) and Standard & Poor’s, a division of The McGraw-Hill Companies, Inc. (“S&P”) and is licensed for use by Goldman Sachs. Neither MSCI, S&P nor any other party involved in making or compiling the GICS or any GICS classifications makes any express or implied warranties or representations with respect to such standard or classification (or the results to be obtained by the use thereof), and all such parties hereby expressly disclaim all warranties of originality, accuracy, completeness, merchantability or fitness for a particular purpose with respect to any of such standard or classification. Without limiting any of the foregoing, in no event shall MSCI, S&P, any of their affiliates or any third party involved in making or compiling the GICS or any GICS classifications have any liability for any direct, indirect, special, punitive, consequential or any other damages (including lost profits) even if notified of the possibility of such damages.
The portfolio risk management process includes an effort to monitor and manage risk, but does not imply low risk.
Diversification does not protect an investor from market risk and does not ensure a profit.
Shares of the Goldman Sachs VIT Funds are offered to separate accounts of participating life insurance companies for the purpose of funding variable annuity contracts and variable life insurance policies. Shares of the Portfolio are not offered directly to the general public. The variable annuity contracts and variable life insurance policies are described in the separate prospectuses issued by participating insurance companies. You should refer to those prospectuses for information about surrender charges, mortality and expense risk fees and other charges that may be assessed by participating insurance companies under the variable annuity contracts or variable life insurance policies. Such fees or charges, if any, may affect the return you may realize with respect to your investments. Ask your representative for more complete information. Please consider a fund’s objectives, risks and charges and expenses, and read the prospectus carefully before investing. The prospectus contains this and other information about the Portfolio.
This material is not authorized for distribution to prospective investors unless preceded or accompanied by a current Prospectus or summary prospectus, if applicable. Investors should consider a Fund’s objective, risks, and charges and expenses, and read the summary prospectus, if available, and/or the Prospectus carefully before investing or sending money. The summary prospectus, if available, and the Prospectus contain this and other information about a Fund and may be obtained from your Authorized Institution or from Goldman, Sachs & Co. by calling 1-800-621-2550.
This report is prepared for the general information of contract owners and is not an offer of shares of the Goldman Sachs Variable Insurance Trust: Goldman Sachs Multi-Strategy Alternatives Portfolio.
Goldman, Sachs & Co. is the distributor of the Goldman Sachs Funds and the Goldman Sachs Variable Insurance Trust Funds.
© 2016 Goldman Sachs. All rights reserved.
VITMSASAR-16/58889-TMPL-08/2016/359
Goldman
Sachs Variable Insurance Trust
Goldman Sachs Core Fixed Income Fund
Goldman Sachs Equity Index Fund
Goldman Sachs Growth Opportunities Fund
Goldman Sachs High Quality Floating Rate Fund
Semi-Annual Report
June 30, 2016

MARKET REVIEW
Goldman Sachs Variable Insurance Trust Funds
Market Review
During the six months ended June 30, 2016 (the “Reporting Period”), the broad U.S. equities and fixed income markets recorded positive returns.
Equity Markets
As the Reporting Period began in January 2016, U.S. equities were embroiled in a global rout, triggered by investor concerns about an intensifying economic slowdown in China and exacerbated by an oil price plunge. Following a December 2015 interest rate hike, the January 2016 Federal Reserve (“Fed”) statement acknowledged these external risks and tightening financial conditions. U.S. equities stabilized in February 2016, as market sentiment improved on the more dovish tone set by global central banks. (Dovish language tends to suggest lower interest rates.) U.S. equities were also supported by stronger economic data, rallying as fourth quarter U.S. Gross Domestic Product (“GDP”) came in above consensus expectations. In March 2016, the Fed kept interest rates on hold and surprised on the dovish side, reducing its forecast to two interest rate hikes in 2016, down from four. Along with receding global economic concerns, we believe this helped to drive a recovery in U.S. equities. Released in March 2016, February 2016 unemployment data came in ahead of market consensus, with unemployment steady at 4.9% in spite of higher participation rates and declining underemployment.
Following the rebound in March 2016, market sentiment appeared to remain sanguine in April 2016, as oil prices rose and China’s economic growth concerns abated. U.S. equities fell near the end of the month as investors were disappointed by a lack of additional stimulus from the Bank of Japan and by a weaker than consensus expected first quarter U.S. GDP rate of 0.5%. Hawkish Fed minutes released in May 2016 temporarily revived market expectations for a Fed interest rate hike in June 2016, but weaker than expected May 2016 payroll data subsequently drove such expectations lower. (Hawkish language tends to suggest higher interest rates; opposite of dovish.) The Fed ultimately held interest rates steady in June 2016 and signaled a slower pace of hikes, acknowledging the slowdown in the labor market. Markets were otherwise dominated in June 2016 by the U.K. referendum on membership in the European Union, popularly known as Brexit. U.S. equities sold off in the global risk-off, or heightened risk averse sentiment in June 2016 following the surprise “leave” result. Markets rebounded in the latter days of the month owing to improving risk sentiment as markets digested the Brexit vote outcome and on dovish remarks from Bank of England Governor Carney.
U.S. equities, as represented by the S&P 500® Index, gained 3.84% during the Reporting Period. Telecommunication services and utilities were the best performing sectors in the S&P 500® Index by a wide margin. Energy and consumer staples also posted double-digit gains. The energy sector was the largest positive contributor to S&P 500® Index returns, as measured by weight times performance. The weakest performing sectors in the S&P 500® Index during the Reporting Period were financials and information technology, the only two to post negative absolute returns, followed by consumer discretionary and health care, which were also weak but generated modestly positive returns during the Reporting Period.
Within the U.S. equity market, there was significant disparity in performance not only among sectors but also among the various capitalization and style segments. While all capitalization segments posted positive returns, mid-cap stocks, as measured by the Russell Midcap® Index, performed best, followed by large-cap stocks, as measured by the Russell 1000® Index, and then, small-cap stocks, as measured by the Russell 2000® Index. From a style perspective, value-oriented stocks significantly outpaced growth-oriented stocks across the capitalization spectrum. Value outperformed relative to growth during the Reporting Period primarily due to weaker performance of the growth-oriented health care sector. (All as measured by the Russell Investments indices.)
Fixed Income Markets
When the Reporting Period began, spread (or non-government bond) sectors retreated, selling off significantly from January to mid-February 2016. The selloff was driven by an increase in a number of perceived risks, such as slowing Chinese economic activity, the possibility of persistent oil oversupply and deteriorating corporate bond fundamentals, as the U.S. credit cycle entered its later stage. Some of these risks eased in the second half of the first calendar quarter, as economic news from China improved, U.S. oil production showed signs of slowing, and commodity prices appeared to stabilize. As a result, spread sectors largely retraced their losses by the end of March 2016. Global central banks remained accommodative. The Bank of Japan, in a surprise move at its January 2016 policy meeting, introduced a -0.1% interest rate, reaffirming its commitment to achieving a 2% inflation target. The European Central Bank shifted its focus from currency depreciation to credit creation by leaving the deposit rate unchanged, expanding its asset purchase program to include purchases of non-financial corporate credit and announcing a new
1
MARKET REVIEW
series of easing measures in the form of targeted long-term refinancing operations (“TLTRO II”). (TLTRO II is designed to offer attractive long-term funding conditions to Eurozone banks to further ease private sector credit conditions and to stimulate credit creation.) In the U.S., the Fed left interest rates unchanged and reduced its forecast to two rate hikes in 2016 from four. After a sustained period of appreciation, the U.S. dollar weakened during the first quarter of 2016 due to generally tighter financial conditions, mixed U.S. economic data and the Fed’s more dovish commentary.
During the second quarter of 2016, spread sectors rallied on stabilization of commodities prices as well as on declining fears about slowing Chinese economic growth and the potential for a U.S. economic recession. Global interest rates broadly declined amid continued accommodative monetary policy from the world’s central banks. In the U.S., minutes from the Fed’s April 2016 policy meeting, released in mid-May 2016, suggested Fed policymakers might raise interest rates in June 2016 if U.S. economic growth strengthened, employment data firmed and inflation rose toward the Fed’s 2% target. In early June 2016, however, the release of weak May 2016 employment data raised concerns about the health of the U.S. economy, pushing down expectations of a Fed rate hike. Indeed, the Fed did not raise interest rates at its June 2016 policy meeting. In the last week of June 2016, the unexpected “leave” vote in the U.K.’s referendum regarding Brexit renewed investor uncertainty about the path of global economic growth. Spread sectors withstood the Brexit vote relatively well, selling off at first but then recovering most of their losses afterwards. The U.S. dollar strengthened versus most global currencies during the second calendar quarter, though it weakened against the Japanese yen.
For the Reporting Period overall, sovereign emerging markets debt and high yield corporate bonds outperformed U.S Treasuries, followed at some distance by asset-backed securities and investment grade corporate bonds. Commercial mortgage-backed securities, agency securities and mortgage-backed securities generally performed in line with U.S. Treasuries. The U.S. Treasury yield curve, or spectrum of maturities, flattened during the Reporting Period as yields of six months and longer fell. The yield on the bellwether 10-year U.S. Treasury dropped approximately 80 basis points to end the Reporting Period at 1.47%. (A basis point is 1/100th of a percentage point. A flattening yield curve is one wherein the differential in yields between longer-term and shorter-term maturities narrows.)
Looking Ahead
Equity Markets
At the end of the Reporting Period, persistently low economic growth, interest rates and visibility reinforced our expectation for lower than average returns across asset classes for the remainder of 2016. In our view, equities remain relatively attractive in this environment. We believe equities can still generate positive returns for calendar year 2016, driven by earnings growth.
We consider economic and corporate fundamentals to be strongest in the U.S. relative to many other global regions, which we believe should buoy near-term U.S. equity performance. However, valuations increasingly reflect this scenario, which makes stock selection all the more important. We continue to seek what we believe are good investment opportunities with a focus on companies exposed to long-term secular growth trends and/or that are trading at discounts to their intrinsic value.
Overall, we believe many companies could benefit from increasing domestic consumption while being more insulated from currency volatility. We expect the strong U.S. dollar to continue to be a headwind for many globally-exposed companies but believe the consumer remains healthy.
Fixed Income Markets
At the end of the Reporting Period, we expected global economic growth to remain slow. We believed the impact of Brexit would take time to play out, with much of the effects, in our view, coming during 2017. Near term, we expect Brexit to add downside risk to the U.K. and European outlook. In terms of the U.K., we have reduced our forecast for 2016 economic growth from 1.8% to 1.2% and our 2017 forecast down from 2.0% to 0.5%. We also believe there is the potential for the U.K. to experience a recession during the next one to two years. In terms of the European Union, we have revised our 2016 economic growth forecast down from 1.4% to 1.3% and our 2017 forecast down from 1.2% to 0.6%. Our forecasts for the U.S., Japan and China remain unchanged, as we expect Brexit to have limited effects on these economies unless there is broader contagion. We believe the U.S. economy could see some near-term improvement as a number of headwinds fade, including the oil price-driven decline in business investment. That said, we see a growing risk of a U.S. recession in 2017 as tight labor markets put pressure on corporate sector profits. At the end of the Reporting Period, we generally expected inflation to stay low across developed economies.
2
GOLDMAN SACHS VARIABLE INSURANCE TRUST – GOLDMAN SACHS CORE FIXED INCOME FUND
INVESTMENT OBJECTIVE
The Fund seeks a total return consisting of capital appreciation and income that exceeds the total return of the Barclays U.S. Aggregate Bond Index.
Portfolio Management Discussion and Analysis
Below, the Goldman Sachs Fixed Income Portfolio Management Team discusses the Goldman Sachs Variable Insurance Trust — Goldman Sachs Core Fixed Income Fund’s (the “Fund”) performance and positioning for the six-month period ended June 30, 2016 (the “Reporting Period”).
How did the Fund perform during the Reporting Period?
During the Reporting Period, the Fund’s Institutional and Service Shares generated cumulative total returns of 4.95% and 4.82%, respectively. These returns compare to the 5.31% cumulative total return of the Fund’s benchmark, the Barclays U.S. Aggregate Bond Index (the “Barclays Index”), during the same time period.
What key factors were responsible for the Fund’s performance during the Reporting Period?
During the Reporting Period, the Fund’s tactical duration and yield curve positioning detracted from its relative performance. Duration is a measure of the Fund’s sensitivity to changes in interest rates. Yield curve indicates a spectrum of maturities. In addition, the Fund’s top-down country strategy hurt relative returns. Early in the Reporting Period, the Fund was hampered by its long positions in the European peripheral countries of Italy and Spain. Later in the Reporting Period, a long position in Canada versus a short position in the U.S. detracted from performance. Our top-down currency strategy, especially the Fund’s short position in the Japanese yen, also dampened results during the Reporting Period.
On the positive side, the Fund benefited from our top-down cross-sector strategy. In our cross-sector strategy, we invest Fund assets across a variety of fixed income sectors, including some that may not be included in the Barclays Index. Additionally, our bottom-up individual issue selection within the corporate bond sector added to results during the Reporting Period.
Which fixed income market sectors most affected Fund performance during the Reporting Period?
During the Reporting Period, overweight positions relative to the Barclays Index in asset-backed securities (“ABS”) and collateralized loan obligations (“CLOs”) bolstered Fund performance. This was offset somewhat by the Fund’s overweight in U.S. corporate bonds, which underperformed early in the Reporting Period as credit spreads (yield differentials to U.S. Treasuries) widened significantly on concerns about U.S. manufacturing weakness.
In terms of individual issue selection, the Fund benefited from its holdings of long-term corporate bonds. In the government/swaps sector, selection of U.S. Treasury inflation protected securities (“TIPS”) was also positive for Fund performance. Offsetting this somewhat was our issue selection among CLOs and external emerging markets debt.
Did the Fund’s duration and yield curve positioning strategy help or hurt its results during the Reporting Period?
Tactical management of the Fund’s duration and yield curve positioning detracted overall from relative returns during the Reporting Period. In particular, the Fund was hurt by its short duration position relative to the Barclays Index as U.S. interest rates fell.
How did the Fund use derivatives and similar instruments during the Reporting Period?
As market conditions warranted during the Reporting Period, currency transactions were carried out using primarily over-the-counter (“OTC”) forward foreign exchange contracts. Currency transactions were used as we sought both to enhance returns and to hedge the Fund’s portfolio against currency exchange rate fluctuations. OTC forward foreign exchange contracts detracted from Fund performance during the Reporting Period. In addition, Treasury futures were employed as warranted to facilitate specific duration, yield curve and country strategies. During the Reporting Period, Treasury futures contributed positively to Fund results. Swaptions (options on interest rate swap contracts), which were used to express our interest rate views and to hedge volatility and yield curve risks in the Fund, did not have a meaningful impact on the Fund’s performance during the Reporting Period. Interest rate swaps were used to manage exposure to fluctuations in interest rates. They detracted from Fund performance during the Reporting Period. In addition, the Fund employed credit default swaps to implement specific credit-related investment strategies,
3
GOLDMAN SACHS VARIABLE INSURANCE TRUST – GOLDMAN SACHS CORE FIXED INCOME FUND
including management of the Fund’s exposure to credit spreads. Credit default swaps had a negative impact on the Fund’s results during the Reporting Period. Overall, we employ derivatives and similar instruments for the efficient management of the Fund’s portfolio. Derivatives and similar instruments allow us to manage interest rate, credit and currency risks more effectively by allowing us both to hedge and to apply active investment views with greater versatility and to afford greater risk management precision than we would otherwise be able to implement.
Were there any notable changes in the Fund’s weightings during the Reporting Period?
The Fund began the Reporting Period with a long duration position relative to that of the Barclays Index, which we shifted to a neutral position in February 2016 and then to a short position in March 2016. We maintained this short duration positioning through the end of the Reporting Period because we expected U.S. economic growth to continue improving amid positive inflation and wage data.
Also, at the start of the Reporting Period, we maintained the Fund’s overweight compared to the Barclays Index in corporate credit. We moved to a small underweight within the sector in June 2016 in anticipation of summer seasonal pressures and due to our view that Brexit volatility would cause credit spreads to drift wider. (Brexit refers to the U.K. “leave” vote on membership in the European Union.)
Were there any changes to the Fund’s portfolio management team during the Reporting Period?
There were no changes to the Fund’s portfolio management team during the Reporting Period.
How was the Fund positioned relative to the Barclays Index at the end of the Reporting Period?
At the end of the Reporting Period, the Fund was underweight U.S. government securities compared to the Barclays Index on a market-value weighted basis. It was also underweight mortgage pass-through securities. (Pass-through mortgages consist of a pool of residential mortgage loans, where homeowners’ monthly payments of principal, interest and prepayments pass from the original bank through a government agency or investment bank to investors.) The Fund was overweight investment grade corporate bonds, ABS, agency commercial mortgage obligations, agency mortgage-backed securities and commercial mortgage-backed securities. It was marginally overweight non-agency mortgage-backed securities and emerging markets debt. The Fund was neutral relative to the Barclays Index in quasi-government bonds and covered bonds at the end of the Reporting Period. (Covered bonds are securities created from either mortgage loans or public sector loans.)
4
FUND BASICS
Core Fixed Income Fund
as of June 30, 2016
STANDARDIZED TOTAL RETURNS1
| For the period ended 6/30/16 | One Year | Five Years | Ten Years | Since Inception | Inception Date | |||||||||||||
| Institutional | 5.56 | % | N/A | N/A | 2.81 | % | 4/30/13 | |||||||||||
| Service | 5.31 | 4.01 | % | 4.66 | % | 4.34 | 1/09/06 | |||||||||||
| 1 | The Standardized Total Returns are average annual total returns as of the most recent calendar quarter-end. They assume reinvestment of all distributions at net asset value (“NAV”). Because Institutional and Service Shares do not involve a sales charge, such a charge is not applied to their Standardized Total Returns. |
Total return figures in the above chart represent past performance and do not indicate future results, which will vary. The investment return and principal value of an investment will fluctuate and, therefore, an investor’s shares, when redeemed, may be worth more or less than their original cost. Current performance may be lower or higher than the total return figures in the above chart. Please visit www.GSAMFUNDS.com to obtain the most recent month-end returns. Performance reflects fee waivers and/or expense limitations in effect during the periods shown. In their absence, performance would be reduced.
EXPENSE RATIOS2
| Net Expense Ratio (Current) | Gross Expense Ratio (Before Waivers) | |||||||
| Institutional | 0.42 | % | 0.74 | % | ||||
| Service | 0.67 | 0.99 | ||||||
| 2 | The expense ratios of the Fund, both current (net of any fee waivers or expense limitations) and before waivers (gross of any fee waivers or expense limitations) are as set forth above according to the most recent publicly available Prospectus for the Fund and may differ from the expense ratios disclosed in the Financial Highlights in this report. Pursuant to a contractual arrangement, the Fund’s waivers and/or expense limitations will remain in place through at least April 29, 2017 and prior to such date the Investment Adviser may not terminate the arrangements without the approval of the Fund’s Board of Trustees. If these arrangements are discontinued in the future, the expense ratios may change without shareholder approval. |
5
FUND BASICS
FUND COMPOSITION3
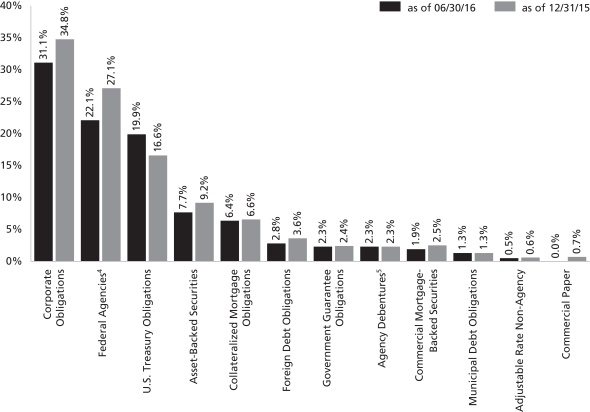
| 3 | The percentage shown for each investment category reflects the value of investments in that category as a percentage of net assets. Figures in the graph may not sum to 100% due to the exclusion of other assets and liabilities. The graph depicts the Fund’s investments but may not represent the Fund’s market exposure due to the exclusion of certain derivatives, if any, as listed in the Additional Investment Information section of the Schedule of Investments. |
| 4 | “Federal Agencies” are mortgage-backed securities guaranteed by the Government National Mortgage Association (“GNMA”), the Federal National Mortgage Association (“FNMA”) or the Federal Home Loan Mortgage Corp. (“FHLMC”). GNMA instruments are backed by the full faith and credit of the United States Government. |
| 5 | “Agency Debentures” include agency securities offered by companies such as FNMA and FHLMC, which operate under a government charter. While they are required to report to a government regulator, their assets are not explicitly guaranteed by the government and they otherwise operate like any other publicly traded company. |
6
GOLDMAN SACHS VARIABLE INSURANCE TRUST – GOLDMAN SACHS EQUITY INDEX FUND
INVESTMENT OBJECTIVE
The Fund seeks to achieve investment results that correspond to the aggregate price and yield performance of a benchmark index that measures the investment returns of large capitalization stocks.
Portfolio Management Discussion and Analysis
Below, SSgA Funds Management, Inc. (“SSgA”), the Fund’s Subadvisor, discusses the Goldman Sachs Variable Insurance Trust — Goldman Sachs Equity Index Fund’s (the “Fund”) performance and positioning for the six-month period ended June 30, 2016 (the “Reporting Period”).
How did the Fund perform during the Reporting Period?
During the Reporting Period, the Fund’s Service Shares generated a cumulative total return of 3.59%. This return compares to the 3.84% cumulative total return of the Fund’s benchmark, the Standard & Poor’s 500® Index (with dividends reinvested) (the “S&P 500® Index”), during the same time period.
During the Reporting Period, which sectors and which industries in the S&P 500® Index were the strongest contributors to the Fund’s performance?
Seven of the 10 sectors in the S&P 500® Index advanced during the Reporting Period. In terms of total return, the sectors that made the strongest positive contributions to the S&P 500® Index and to the Fund were telecommunication services, utilities and energy. The largest sector by weighting in the S&P 500® Index at the end of the Reporting Period was information technology at a weighting of 19.77%. The industries with the strongest performance in terms of total return were precious metals; construction materials; casinos/gambling; oil and gas pipelines; and major telecommunications.
On the basis of impact (which takes both total returns and weightings into account), the sectors that made the strongest positive contributions to the S&P 500® Index and to the Fund were consumer staples, energy and utilities. The industries with the strongest performance on the basis of impact were electric utilities, major telecommunications, integrated oil, major pharmaceuticals and industrial conglomerates.
Which sectors and industries in the S&P 500® Index were the weakest contributors to the Fund’s performance?
In terms of total return, during the Reporting Period, the weakest performing sectors were financials, information technology and health care. The weakest performing industries in terms of total return were other pharmaceuticals, airlines, real estate development, generic pharmaceuticals and movies/entertainment.
On the basis of impact, the weakest performing sectors were financials, information technology and health care. The weakest performing industries on the basis of impact were biotechnology, major banks, financial conglomerates, generic pharmaceuticals and telecommunications equipment.
Which individual stocks were the top performers, and which were the greatest detractors?
On the basis of impact, the stocks that made the strongest positive contribution during the Reporting Period were Exxon Mobil, Verizon Communications, AT&T, Johnson & Johnson and Chevron. The weakest performers were Apple, Allergan, Bank of America, Citigroup and Wells Fargo.
How did the Fund use derivatives and similar instruments during the Reporting Period?
During the Reporting Period, the Fund did not use derivatives as part of an active management strategy to add value to the Fund’s results. However, equity index futures were used to equitize the Fund’s cash holdings. In other words, we put the Fund’s cash holdings to work by using them as collateral for the purchase of equity index futures. We also used these equity index futures to provide liquidity for daily cash flow requirements. Equity index futures had a neutral impact on the Fund’s performance during the Reporting Period.
Were there any changes to the Fund’s portfolio management team during the Reporting Period?
There were no changes to the Fund’s portfolio management team during the Reporting Period.
7
GOLDMAN SACHS VARIABLE INSURANCE TRUST – GOLDMAN SACHS EQUITY INDEX FUND
What changes were made to the makeup of the S&P 500® Index during the Reporting Period?
Twenty-one stocks were removed from the S&P 500® Index during the Reporting Period. They were Airgas, Baxalta, Broadcom, Cablevision Systems, Cameron International, Chubb, Coca-Cola Enterprises, Consol Energy, Ensco, Fossil Group, GameStop, Ingevity, Keurig Green Mountain, Pepco Holdings, Plum Creek Timber, Precision Castparts, SanDisk, Tenet Healthcare, ADT, Time Warner Cable and Vistana Signature Experiences. There were 22 stocks added to the S&P 500® Index during the Reporting Period. They were Acuity Brands, Alaska Air Group, American Water Works, Centene, Citizens Financial Group, Concho Resources, Digital Realty Trust, Extra Space Storage, Federal Realty Investment Trust, Foot Locker, Fortune Brands Home & Security, Arthur J. Gallagher & Co., Global Payments, Hologic, Ingevity, LKQ, TransDigm Group, UDR, Ulta Salon Cosmetics & Fragrance, Under Armour Class C, Vistana Signature Experiences and Willis Group Holdings.
The source of the data included in the above Portfolio Management Discussion and Analysis with respect to the Goldman Sachs Equity Index Fund is FactSet as of 6/30/16.
Characteristics presented are calculated using the month end market value of holdings, except for beta and standard deviation, if shown, which use month end return values. Averages reflect the market weight of securities in the portfolio. Market data, prices, and dividend estimates for characteristics calculations provided by FactSet Research Systems, Inc. All other portfolio data provided by SSGA. Characteristics are as of the date indicated, are subject to change, and should not be relied upon as current thereafter.
Past performance is not a guarantee of future results.
Index returns are unmanaged and do not reflect the deduction of any fees or expenses. Index returns reflect all items of income, gain and loss and the reinvestment of dividends and other income.
SSgA may have or may seek investment management or other business relationships with companies discussed in this material or affiliates of those companies, such as their officers, directors and pension plans.
The views expressed in this material are the views of SSGA’s Global Equity Beta Solutions Team through the period ended June 30, 2016 and are subject to change based on market and other conditions. All information has been obtained from sources believed to be reliable, but its accuracy is not guaranteed. There is no representation or warranty as to the current accuracy, reliability or completeness of, nor liability for, decisions based on such information and it should not be relied on as such. This document contains certain statements that may be deemed forward-looking statements. Please note that any such statements are not guarantees of any future performance and actual results or developments may differ materially from those projected.
8
FUND BASICS
Equity Index Fund
as of June 30, 2016
STANDARDIZED TOTAL RETURNS1
| For the period ended 6/30/16 | One Year | Five Years | Ten Years | Since Inception | Inception Date | |||||||||||||
| Service | 3.59 | % | 11.60 | % | 7.08 | % | 6.70 | % | 1/09/06 | |||||||||
| 1 | The Standardized Total Returns are average annual total returns as of the most recent calendar quarter-end. They assume reinvestment of all distributions at net asset value (“NAV”). Because Service Shares do not involve a sales charge, such a charge is not applied to their Standardized Total Returns. |
Total return figures in the above chart represent past performance and do not indicate future results, which will vary. The investment return and principal value of an investment will fluctuate and, therefore, an investor’s shares, when redeemed, may be worth more or less than their original cost. Current performance may be lower or higher than the total return figures in the above chart. Please visit www.GSAMFUNDS.com to obtain the most recent month-end returns. Performance reflects fee waivers and/or expense limitations in effect during the periods shown. In their absence, performance would be reduced.
EXPENSE RATIOS2
| Net Expense Ratio (Current) | Gross Expense Ratio (Before Waivers) | |||||||
| Service | 0.48 | % | 0.70 | % | ||||
| 2 | The expense ratios of the Fund, both current (net of any fee waivers or expense limitations) and before waivers (gross of any fee waivers or expense limitations) are as set forth above according to the most recent publicly available Prospectus for the Fund and may differ from the expense ratios disclosed in the Financial Highlights in this report. Pursuant to a contractual arrangement, the Fund’s waivers and/or expense limitations will remain in place through at least April 29, 2017 and prior to such date the Investment Adviser may not terminate the arrangements without the approval of the Fund’s Board of Trustees. If these arrangements are discontinued in the future, the expense ratios may change without shareholder approval. |
TOP TEN HOLDINGS AS OF 6/30/163
| Holding | % of Net Assets | Line of Business | ||||
| Apple, Inc. | 2.9% | Technology Hardware & Equipment | ||||
| Microsoft Corp. | 2.2 | Software & Services | ||||
| Exxon Mobil Corp. | 2.1 | Energy | ||||
| Johnson & Johnson | 1.8 | Pharmaceuticals, Biotechnology & Life Sciences | ||||
| General Electric Co. | 1.6 | Capital Goods | ||||
| Amazon.com, Inc. | 1.5 | Retailing | ||||
| Berkshire Hathaway, Inc. Class B | 1.5 | Diversified Financials | ||||
| AT&T, Inc. | 1.5 | Telecommunication Services | ||||
| Facebook, Inc. Class A | 1.4 | Software & Services | ||||
| Verizon Communications, Inc. | 1.2 | Telecommunication Services | ||||
| 3 | The top 10 holdings may not be representative of the Fund’s future investments. |
9
FUND BASICS
FUND VS. BENCHMARK SECTOR ALLOCATIONS4
As of June 30, 2016
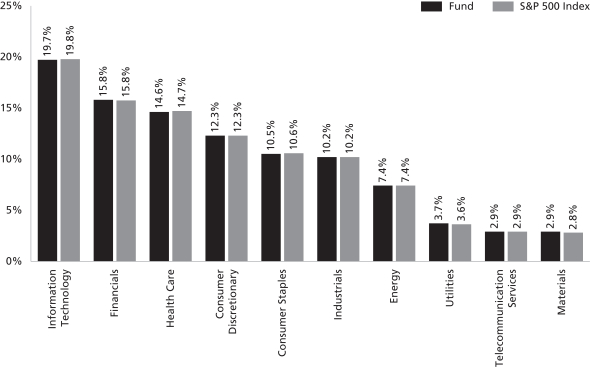
| 4 | The Fund is actively managed and, as such, its composition may differ over time. Consequently, the Fund’s overall sector allocations may differ from percentages contained in the graph above. The graph categorizes investments using Global Industry Classification Standard (“GICS”), however, the sector classifications used by the portfolio management team may differ from GICS. The percentage shown for each investment category reflects the value of investments in that category as a percentage of market value. Underlying sector allocations of Exchange Traded Funds and Investment Companies held by the Fund are not reflected in the graph above. The graph depicts the Fund’s investments but may not represent the Fund’s market exposure due to the exclusion of certain derivatives, if any, as listed in the Additional Investment Information section of the Schedule of Investments. |
10
GOLDMAN SACHS VARIABLE INSURANCE TRUST – GOLDMAN SACHS GROWTH OPPORTUNITIES FUND
INVESTMENT OBJECTIVE
The Fund seeks long-term growth of capital.
Portfolio Management Discussion and Analysis
Below, the Goldman Sachs Growth Investment Team discusses the Goldman Sachs Variable Insurance Trust — Goldman Sachs Growth Opportunities Fund’s (the “Fund”) performance and positioning for the six-month period ended June 30, 2016 (the “Reporting Period”).
How did the Fund perform during the Reporting Period?
During the Reporting Period, the Fund’s Institutional and Service Shares generated cumulative total returns of 2.38% and 2.25%, respectively. These returns compare to the -2.15% cumulative total return of the Fund’s benchmark, the Russell Midcap® Growth Index (with dividends reinvested) (the “Russell Index”), during the same time period.
What key factors were responsible for the Fund’s performance during the Reporting Period?
The Fund outperformed the Russell Index during the Reporting Period as a result of stock selection.
Which equity market sectors helped and hurt Fund performance?
Our bottom-up approach focuses on security selection, and as a result, we do not make active sector-level investment decisions. That said, on a sector level, stock selection in the consumer staples, financials and health care sectors added to the Fund’s relative performance. Stock choices in the information technology, energy and industrials sectors detracted from Fund returns.
Which individual stocks added to the Fund’s relative performance during the Reporting Period?
The Fund benefited most relative to the Russell Index from its positions in McCormick, a manufacturer of spices, herbs and flavorings; Ulta Salon, Cosmetics & Fragrances, a beauty products retailer; and Equinix, a data center real estate investment trust (“REIT”).
McCormick was the top positive contributor to the Fund’s relative results during the Reporting Period. Its share price rose in April 2016 after the company walked away from the acquisition of Premier Foods due to the lack of a price agreement, demonstrating, in our view, management discipline. The stock continued to perform well thereafter with the appreciation of its share price accelerating near the end of the Reporting Period on news of strong fiscal second quarter results. At the end of the Reporting Period, we remained optimistic about strong 2016 performance for the stock, as we believe McCormick continues to meet consumer demand for healthy flavor and high quality products through an expanding product pipeline. The Fund maintained a position in the stock at the end of the Reporting Period.
Ulta Salon, Cosmetics & Fragrance was another notable positive contributor to Fund performance during the Reporting Period. After a challenging start to 2016, its share price picked up momentum in early April 2016 after the company issued strong first quarter 2016 earnings, and the stock was added to the S&P 500® Index. The first quarter 2016 results were driven by better than expected margins, revenues and e-commerce growth. In our view, Ulta Salon, Cosmetics & Fragrance is a strong brand that continues to gain recognition. We believe the company has a potential opportunity to grow market share through higher brand awareness, increasing loyalty to existing stores, expansion of new stores and e-commerce. At the end of the Reporting Period, the Fund continued to hold Ulta Salon, Cosmetics & Fragrance.
Equinix was a leading positive contributor to Fund returns during the Reporting Period. Its stock advanced on first quarter 2016 results that beat market expectations for organic revenue growth and earnings growth. Its share price also benefited from a decline in U.S. Treasury yields, given the attractive yield and growth potential of REITs compared to bonds. At the end of the Reporting Period, we believed Equinix had substantial pipeline opportunities, particularly with enterprise customers willing to pay a higher price. We also thought the continued integration of the company’s Telecity Group acquisition and its strategic partnership with Datang Telecom could further increase Equinix’s global presence and strengthen its competitive advantage. In our view, Equinix remains an asset with robust upside to its revenues and free cash flows as it balances organic growth, low leverage and a sound capital structure. Accordingly, we maintained the Fund’s position in Equinix at the end of the Reporting Period.
11
GOLDMAN SACHS VARIABLE INSURANCE TRUST – GOLDMAN SACHS GROWTH OPPORTUNITIES FUND
Which individual stocks detracted from the Fund’s performance during the Reporting Period?
Leading detractors from the Fund’s relative performance were LinkedIn, an online professional networking service; Restoration Hardware, a home furnishings retailer; and Sensata Technologies, a leading supplier of sensing, electrical, control and power management solutions.
The Fund’s top relative detractor during the Reporting Period was LinkedIn. The company reported solid fourth quarter 2015 results, but its outlook was well below market expectations. Given that the company is a high multiple growth stock in a challenging market environment, its share price fell sharply. At the end of the Reporting Period, we believed there was room for progress in better monetizing LinkedIn’s business model, but we had a positive outlook on the company’s competitive positioning, offering and long-term growth. As a result, the Fund continued to hold LinkedIn at the end of the Reporting Period.
Restoration Hardware was a key detractor from the Fund’s relative performance during the Reporting Period. The company experienced headwinds in an increasingly challenging retail environment, especially relative to the high-end consumer. Restoration Hardware also saw a sequential gross margin decline in markets, such as South America, where currency has been a factor. In early June 2016, the company released first quarter 2016 earnings that were generally in line with market expectations, but the stock fell on news of lower gross margins, a slightly downward adjustment in earnings per share, increased inventory guidance and higher capital expenditures. In our view, its fiscal year 2016 results may be impacted by cost control efforts, including product delays, investments and timing issues. Given the higher costs suggested by its management’s guidance and what we see as lower and rather volatile consumer demand for the company’s products, we decided to exit the Fund’s position in Restoration Hardware during the Reporting Period and reallocate the proceeds to what we consider better risk/reward opportunities.
Another relative detractor from the Fund’s returns was Sensata Technologies. Although the company released earnings in line with expectations for both the fourth quarter of 2015 and first quarter of 2016, the market reacted negatively. Its stock also fell following the announcement that the company’s South Korean subsidiary would be investigated for violations of a law related to subcontractors. At the end of the Reporting Period, we believed Sensata Technologies was a strong growth company that was undervalued. In our opinion, the company continues to drive margin expansion through the successful integration of acquisitions, especially in sensing technology for autonomous driving. At the end of the Reporting Period, we maintained the Fund’s position in its stock.
Did the Fund make any significant purchases or sales during the Reporting Period?
Among the purchases initiated during the Reporting Period, we established a Fund position in off-price retailer Ross Stores. Off-price retailers seek to take advantage of excess inventory from full-price retailers by purchasing goods at a significant discount to their original price. We believe Ross Stores is well positioned within its industry and is attractively valued for a high quality company that has delivered consistent sales and earnings growth over time. In our view, Ross Stores has also provided strong free cash flow and demonstrated a track record of returning capital to shareholders.
We added a Fund position in Sherwin-Williams, which manufactures and distributes paint and coating brands globally. We believe Sherwin-Williams is a strong business franchise with attractive market positioning and a focus on innovative products. In our view, Sherwin-Williams has a solid business model supported by a high quality management team.
In addition to the sale of Restoration Hardware, already mentioned, among notable sales during the Reporting Period was the Fund’s position in LKQ, an American auto parts company. We believe its sales were vulnerable to cyclicality and weather sensitivity. Further, there were longer term concerns, in our view, related to collision avoidance technology, which could have negative implications for LKQ. Therefore, we decided to exit the Fund’s position in the stock in favor of what we considered to be more attractive risk/return opportunities.
Were there any notable changes in the Fund’s weightings during the Reporting Period?
During the Reporting Period, we reduced the size of the Fund’s underweight position relative to the Russell Index in the financials sector. We increased the Fund’s overweight in telecommunication services and its underweight in consumer discretionary. In addition, we shifted the Fund from a neutral position compared to the Russell Index in consumer staples to an overweight position. We moved from neutral positions in energy and information technology to underweight positions relative to the Russell Index. Also, we shifted the Fund from overweight positions in health care and industrials to neutral positions compared to the Russell Index. In addition, during the Reporting Period, we moved the Fund from an underweight position relative to the Russell Index in the materials sector to a neutral position.
12
GOLDMAN SACHS VARIABLE INSURANCE TRUST – GOLDMAN SACHS GROWTH OPPORTUNITIES FUND
How did the Fund use derivatives and similar instruments during the Reporting Period?
The Fund did not use derivatives or similar instruments within its investment process during the Reporting Period.
Were there any changes to the Fund’s portfolio management team during the Reporting Period?
There were no changes to the Fund’s portfolio management team during the Reporting Period.
How was the Fund positioned relative to the Russell Index at the end of the Reporting Period?
As mentioned, the Fund’s sector positioning relative to the Russell Index is the result of our stock selection, as we take a pure bottom-up, research-intensive approach to investing. From that perspective, then, at the end of the Reporting Period, the Fund’s portfolio was broadly diversified with overweight positions compared to the Russell Index in the telecommunication services and consumer staples sectors. The Fund had smaller weightings than the Russell Index in the consumer discretionary, financials and information technology sectors at the end of the Reporting Period. It was relatively neutral compared to the Russell Index at the end of the Reporting Period in the energy, health care, industrials, materials and utilities sectors.
13
FUND BASICS
Growth Opportunities Fund
as of June 30, 2016
STANDARDIZED TOTAL RETURNS1
| For the period ended 6/30/16 | One Year | Five Years | Ten Years | Since Inception | Inception Date | |||||||||||||
| Institutional | -4.77 | % | N/A | N/A | 8.45 | % | 4/30/13 | |||||||||||
| Service | -4.80 | 9.39 | % | 8.89 | % | 7.98 | 1/09/06 | |||||||||||
| 1 | The Standardized Total Returns are average annual total returns as of the most recent calendar quarter-end. They assume reinvestment of all distributions at net asset value (“NAV”). Because Institutional and Service Shares do not involve a sales charge, such a charge is not applied to their Standardized Total Returns. |
Total return figures in the above chart represent past performance and do not indicate future results, which will vary. The investment return and principal value of an investment will fluctuate and, therefore, an investor’s shares, when redeemed, may be worth more or less than their original cost. Current performance may be lower or higher than the total return figures in the above chart. Please visit www.GSAMFUNDS.com to obtain the most recent month-end returns. Performance reflects fee waivers and/or expense limitations in effect during the periods shown. In their absence, performance would be reduced.
EXPENSE RATIOS2
| Net Expense Ratio (Current) | Gross Expense Ratio (Before Waivers) | |||||||
| Institutional | 0.89 | % | 1.14 | % | ||||
| Service | 1.05 | 1.40 | ||||||
| 2 | The expense ratios of the Fund, both current (net of any fee waivers or expense limitations) and before waivers (gross of any fee waivers or expense limitations) are as set forth above according to the most recent publicly available Prospectus for the Fund and may differ from the expense ratios disclosed in the Financial Highlights in this report. Pursuant to a contractual arrangement, the Fund’s waivers and/or expense limitations will remain in place through at least April 29, 2017 and prior to such date the Investment Adviser may not terminate the arrangements without the approval of the Fund’s Board of Trustees. If these arrangements are discontinued in the future, the expense ratios may change without shareholder approval. |
TOP TEN HOLDINGS AS OF 6/30/163
| Holding | % of Net Assets | Line of Business | ||||
| Amphenol Corp. Class A | 2.6% | Technology Hardware & Equipment | ||||
| McCormick & Co., Inc. | 2.5 | Food, Beverage & Tobacco | ||||
| Equinix, Inc. | 2.5 | Real Estate Investment Trust | ||||
| SBA Communications Corp. Class A | 2.4 | Telecommunication Services | ||||
| Ross Stores, Inc. | 2.4 | Retailing | ||||
| Panera Bread Co. Class A | 2.4 | Consumer Services | ||||
| Ulta Salon, Cosmetics & Fragrance, Inc. | 2.3 | Retailing | ||||
| Tractor Supply Co. | 2.3 | Retailing | ||||
| Fidelity National Information Services, Inc. | 2.3 | Software & Services | ||||
| Intuit, Inc. | 2.3 | Software & Services | ||||
| 3 | The top 10 holdings may not be representative of the Fund’s future investments. |
14
FUND BASICS
FUND vs. BENCHMARK SECTOR ALLOCATIONS4
As of June 30, 2016
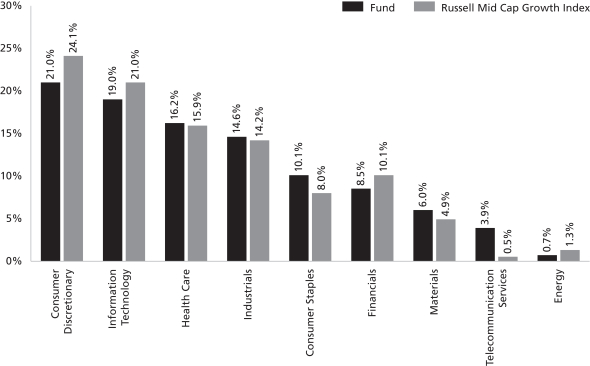
| 4 | The Fund is actively managed and, as such, its composition may differ over time. Consequently, the Fund’s overall sector allocations may differ from percentages contained in the graph above. The graph categorizes investments using Global Industry Classification Standard (“GICS”), however, the sector classifications used by the portfolio management team may differ from GICS. The percentage shown for each investment category reflects the value of investments in that category as a percentage of market value. Underlying sector allocations of Exchange Traded Funds and Investment Companies held by the Fund are not reflected in the graph above. The graph depicts the Fund’s investments but may not represent the Fund’s market exposure due to the exclusion of certain derivatives, if any, as listed in the Additional Investment Information section of the Schedule of Investments. |
15
GOLDMAN SACHS VARIABLE INSURANCE TRUST – GOLDMAN SACHS HIGH QUALITY FLOATING RATE FUND
INVESTMENT OBJECTIVE
The Fund seeks to provide a high level of current income, consistent with low volatility of principal.
Portfolio Management Discussion and Analysis
Below, the Goldman Sachs Fixed Income Portfolio Management Team discusses the Goldman Sachs Variable Insurance Trust — Goldman Sachs High Quality Floating Rate Fund’s (the “Fund”) performance and positioning for the six-month period ended June 30, 2016 (the “Reporting Period”).
How did the Fund perform during the Reporting Period?
During the Reporting Period, the Fund’s Advisor, Institutional and Service Shares generated cumulative total returns of 0.12%, 0.30% and 0.18%, respectively. These returns compare to the 0.15% cumulative total return of the Fund’s benchmark, the Bank of America Merrill Lynch Three-Month U.S. Treasury Bill Index (the “BofA Index”), during the Reporting Period.
We note that the Fund’s benchmark being the BofA Index is a means of emphasizing that the Fund has an unconstrained strategy. That said, this Fund employs a benchmark agnostic strategy and thus comparisons to a benchmark index are not particularly relevant.
What key factors had the greatest impact on the Fund’s performance during the Reporting Period?
During the Reporting Period, our top-down cross-sector strategy added positively to relative performance. In our cross-sector strategy, we invest Fund assets based on a discipline of valuing each fixed income sector in the context of all investment opportunities within the Fund’s universe.
Conversely, the Fund’s tactical duration and U.S. yield curve positioning detracted from results. Duration is a measure of the Fund’s sensitivity to changes in interest rates. Yield curve indicates a spectrum of maturities.
Which fixed income market sectors helped or hurt Fund performance during the Reporting Period?
Within our cross-sector strategy, the Fund benefited from its overweight in asset-backed securities (“ABS”) and mortgage-backed securities.
Individual issue selection had a neutral impact on relative performance during the Reporting Period. Selection among government securities added positively to results, while selection among ABS and mortgage-backed securities detracted.
Did the Fund’s duration and yield curve positioning strategy help or hurt its results during the Reporting Period?
Tactical management of the Fund’s duration and yield curve positioning detracted overall from relative returns during the Reporting Period. More specifically, the Fund’s limited exposure to the three-month, five-year and 20-year segments of the U.S. Treasury yield curve hurt performance.
Were there any notable changes in the Fund’s weightings during the Reporting Period?
We slightly increased the Fund��s short duration position relative to the BofA Index during the Reporting Period. We increased the Fund’s position in the longer-term segments of the U.S. Treasury yield curve and decreased its position in the shorter-term segments. In addition, we increased the Fund’s exposure to government securities and residential mortgage-backed securities.
How did the Fund use derivatives and similar instruments during the Reporting Period?
As market conditions warranted, the Fund used U.S. Treasury futures to manage the duration and term structure of the Fund. (Term structure, most often depicted as a yield curve, refers to the term structure of interest rates, which is the relationship between the yield to maturity and the time to maturity for pure discount bonds.) Treasury futures detracted from Fund performance during the Reporting Period.
16
GOLDMAN SACHS VARIABLE INSURANCE TRUST – GOLDMAN SACHS HIGH QUALITY FLOATING RATE FUND
Were there any changes to the Fund’s portfolio management team during the Reporting Period?
On February 11, 2016, co-portfolio manager James McCarthy announced his intention to retire from the firm and, as of that date, he no longer had portfolio management responsibilities for the Fund. Effective February 11, 2016, joining Dave Fishman, portfolio manager and head of the Fund’s global liquidity management strategy, were John Olivo, head of the Fund’s short duration strategy, and Matthew Kaiser. By design, the portfolio management team is organized into a series of specialist teams which focus on generating and implementing investment ideas within their area of expertise. Both top-down and bottom-up decisions are made by these small strategy teams, rather than by one portfolio manager or committee. Ultimate accountability for the portfolio resides with the portfolio managers, who set the long-term risk budget and oversee the portfolio construction process.
How was the Fund positioned relative to the BofA Index at the end of the Reporting Period?
At the end of the Reporting Period, the Fund had very little exposure to U.S. government securities, which represent 100% of the BofA Index. The Fund had positions in ABS, U.S. and non-U.S. residential mortgage-backed securities, agency adjustable-rate mortgage-backed securities, agency collateralized mortgage obligations, mortgage pass-through securities and commercial mortgage-backed securities, none of which are represented in the BofA Index. Pass-through mortgages consist of a pool of residential mortgage loans, where homeowners’ monthly payments of principal, interest and prepayments pass from the original bank through a government agency or investment bank to investors.
17
FUND BASICS
High Quality Floating Rate Fund
as of June 30, 2016
STANDARDIZED TOTAL RETURNS1
| For the period ended 6/30/16 | One Year | Five Years | Ten Years | Since Inception | Inception Date | |||||||||||||
| Institutional | -0.04 | % | N/A | N/A | 0.25 | % | 4/30/13 | |||||||||||
| Service | -0.29 | 1.44 | % | 3.53 | % | 3.32 | 1/09/06 | |||||||||||
| Advisor | -0.40 | N/A | N/A | -0.31 | 10/15/14 | |||||||||||||
| 1 | The Standardized Total Returns are average annual total returns as of the most recent calendar quarter-end. They assume reinvestment of all distributions at net asset value (“NAV”). Because Institutional, Service and Advisor Shares do not involve a sales charge, such a charge is not applied to their Standardized Total Returns. |
Total return figures in the above chart represent past performance and do not indicate future results, which will vary. The investment return and principal value of an investment will fluctuate and, therefore, an investor’s shares, when redeemed, may be worth more or less than their original cost. Current performance may be lower or higher than the total return figures in the above chart. Please visit www.GSAMFUNDS.com to obtain the most recent month-end returns. Performance reflects fee waivers and/or expense limitations in effect during the periods shown. In their absence, performance would be reduced.
EXPENSE RATIOS2
| Net Expense Ratio (Current) | Gross Expense Ratio (Before Waivers) | |||||||
| Institutional | 0.39 | % | 0.82 | % | ||||
| Service | 0.65 | 1.06 | ||||||
| Advisor | 0.79 | 1.26 | ||||||
| 2 | The expense ratios of the Fund, both current (net of any fee waivers or expense limitations) and before waivers (gross of any fee waivers or expense limitations) are as set forth above according to the most recent publicly available Prospectus for the Fund and may differ from the expense ratios disclosed in the Financial Highlights in this report. Pursuant to a contractual arrangement, the Fund’s waivers and/or expense limitations will remain in place through at least April 29, 2017 and prior to such date the Investment Adviser may not terminate the arrangements without the approval of the Fund’s Board of Trustees. If these arrangements are discontinued in the future, the expense ratios may change without shareholder approval. |
18
FUND BASICS
FUND COMPOSITION3
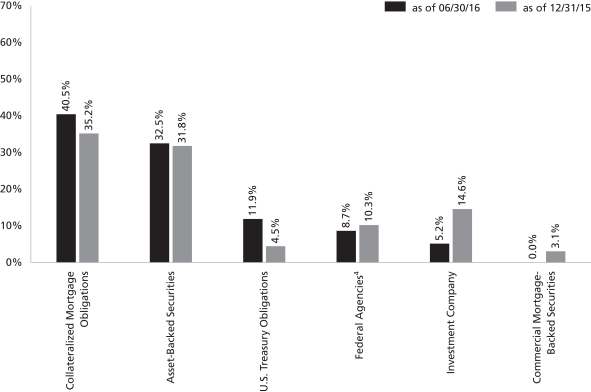
| 3 | The percentage shown for each investment category reflects the value of investments in that category as a percentage of net assets. Figures in the above graph may not sum to 100% due to the exclusion of other assets and liabilities. Underlying sector allocations of Investment Companies held by the Fund are not reflected in the graph above. The graph depicts the Fund’s investments but may not represent the Fund’s market exposure due to the exclusion of certain derivatives, if any, as listed in the Additional Investment Information section of the Schedule of Investments. |
| 4 | “Federal Agencies” are mortgage-backed securities guaranteed by the Government National Mortgage Association (“GNMA”), the Federal National Mortgage Association (“FNMA”) or the Federal Home Loan Mortgage Corp. (“FHLMC”). GNMA instruments are backed by the full faith and credit of the United States Government. |
19
GOLDMAN SACHS VARIABLE INSURANCE TRUST FUNDS
Index Definitions
Barclays U.S. Aggregate Bond Index is a broad based index that follows the U.S. dollar denominated investment grade fixed rate taxable bond market. It includes U.S. Treasuries, agency and corporate securities, mortgage-backed securities, asset-backed securities and commercial mortgage-backed securities.
The S&P 500® Index is a U.S. stock market index based on the market capitalizations of 500 large companies having common stock listed on the New York Stock Exchange or NASDAQ. The S&P 500® Index components and their weightings are determined by S&P Dow Jones Indices.
Russell Midcap® Index measures the performance of the mid-cap segment of the U.S. equity universe. The Russell Midcap® Index is a subset of the Russell 1000® Index. The Russell Midcap® Index includes approximately 800 of the smallest securities based on a combination of their market cap and current index membership. The Russell Midcap® Index represents approximately 31% of the total market capitalization of the Russell 1000® Index companies. The Russell Midcap® Index is constructed to provide a comprehensive and unbiased barometer for the mid-cap segment. The Russell Midcap® Index is completely reconstituted annually to ensure larger stocks do not distort the performance and characteristics of the true mid-cap opportunity set.
Russell Midcap® Growth Index is an unmanaged index that measures the performance of those companies in the Russell Midcap® Index with higher price-to-book ratios and higher forecasted growth values. Its figures do not reflect any deduction for fees, expenses or taxes.
Russell 1000® Index measures the performance of the large-cap segment of the U.S. equity universe. The Russell 1000® Index is a subset of the Russell 3000® Index and includes approximately 1000 of the largest securities based on a combination of their market cap and current index membership. The Russell 1000® Index represents approximately 92% of the U.S. market. The Russell 1000® Index is constructed to provide a comprehensive and unbiased barometer for the large-cap segment and is completely reconstituted annually to ensure new and growing equities are reflected.
Russell 2000® Index measures the performance of the small-cap segment of the U.S. equity universe. The Russell 2000® Index is a subset of the Russell 3000® Index representing approximately 10% of the total market capitalization of that index. The Russell 2000® Index includes approximately 2000 of the smallest securities based on a combination of their market cap and current index membership. The Russell 2000® Index is constructed to provide a comprehensive and unbiased small-cap barometer and is completely reconstituted annually to ensure larger stocks do not distort the performance and characteristics of the true small-cap opportunity set.
Bank of America Merrill Lynch Three-Month U.S. Treasury Bill Index is an unmanaged market index of U.S. Treasury securities maturing in 90 days that assumes reinvestment of all income. It is composed of a single issue purchased at the beginning of the month and held for a full month. At the end of the month that issue is sold and rolled into a newly selected issue. The issue selected at each month-end rebalancing is the outstanding U.S. Treasury Bill that matures closest to, but not beyond, three months from the rebalancing date. To qualify for selection, an issue must have settled on or before the month-end rebalancing date. While the index will often hold the U.S. Treasury Bill issued at the most recent three-month auction, it is also possible for a seasoned six-month U.S. Treasury Bill to be selected.
20
GOLDMAN SACHS VARIABLE INSURANCE TRUST CORE FIXED INCOME FUND
Schedule of Investments
June 30, 2016 (Unaudited)
Principal Amount | Interest Rate | Maturity Date | Value | |||||||||||
| Corporate Obligations – 31.1% | ||||||||||||||
| Automobiles & Components – 0.5% |
| ||||||||||||
| Ford Motor Credit Co. LLC |
| ||||||||||||
| $ | 475,000 | 5.875 | % | 08/02/21 | $ | 547,065 | ||||||||
|
| |||||||||||||
| Banks – 8.4% |
| ||||||||||||
| American Express Co.(a) |
| ||||||||||||
| 75,000 | 3.625 | 12/05/24 | 77,072 | |||||||||||
| 250,000 | 6.800 | (b) | 09/01/66 | 249,375 | ||||||||||
| Banco Bilbao Vizcaya Argentaria SA |
| ||||||||||||
| 300,000 | 3.000 | 10/20/20 | 307,126 | |||||||||||
| Bank of America Corp. |
| ||||||||||||
| 100,000 | 5.700 | 01/24/22 | 115,596 | |||||||||||
| 225,000 | 4.125 | 01/22/24 | 242,881 | |||||||||||
| 275,000 | 4.000 | 04/01/24 | 293,993 | |||||||||||
| BNP Paribas SA |
| ||||||||||||
| 275,000 | 2.375 | 05/21/20 | 279,406 | |||||||||||
| Compass Bank(a) |
| ||||||||||||
| 375,000 | 2.750 | 09/29/19 | 370,339 | |||||||||||
| Credit Suisse Group Funding Guernsey Ltd.(c) |
| ||||||||||||
| 400,000 | 3.125 | 12/10/20 | 399,338 | |||||||||||
| Credit Suisse New York |
| ||||||||||||
| 325,000 | 2.300 | 05/28/19 | 329,534 | |||||||||||
| Discover Financial Services(a) |
| ||||||||||||
| 225,000 | 3.750 | 03/04/25 | 225,899 | |||||||||||
| HSBC Holdings PLC |
| ||||||||||||
| 225,000 | 3.400 | 03/08/21 | 231,734 | |||||||||||
| ING Bank NV(a)(b) |
| ||||||||||||
| 325,000 | 4.125 | 11/21/23 | 329,518 | |||||||||||
| Intesa Sanpaolo SpA |
| ||||||||||||
| 350,000 | 2.375 | 01/13/17 | 351,309 | |||||||||||
| 350,000 | 3.875 | 01/16/18 | 358,880 | |||||||||||
| JPMorgan Chase & Co. |
| ||||||||||||
| 450,000 | 4.400 | 07/22/20 | 489,418 | |||||||||||
| 275,000 | 2.700 | (a) | 05/18/23 | 275,891 | ||||||||||
| JPMorgan Chase & Co. Series Z(a)(b) |
| ||||||||||||
| 250,000 | 5.300 | 12/29/49 | 249,375 | |||||||||||
| KBC Bank NV(a)(b) |
| ||||||||||||
| 200,000 | 8.000 | 01/25/23 | 212,000 | |||||||||||
| KeyCorp |
| ||||||||||||
| 400,000 | 2.900 | 09/15/20 | 412,892 | |||||||||||
| Lloyds Bank PLC |
| ||||||||||||
| 175,000 | 2.300 | 11/27/18 | 175,849 | |||||||||||
| Macquarie Bank Ltd.(c) |
| ||||||||||||
| 150,000 | 6.625 | 04/07/21 | 173,403 | |||||||||||
| Mizuho Bank Ltd.(c) |
| ||||||||||||
| 200,000 | 2.550 | 03/17/17 | 201,758 | |||||||||||
| Morgan Stanley |
| ||||||||||||
| 650,000 | 3.700 | 10/23/24 | 683,509 | |||||||||||
| Morgan Stanley Series F |
| ||||||||||||
| 100,000 | 3.875 | 04/29/24 | 106,461 | |||||||||||
| PNC Preferred Funding Trust II(a)(b)(c) |
| ||||||||||||
| 200,000 | 1.875 | 03/29/49 | 176,000 | |||||||||||
| Regions Bank |
| ||||||||||||
| 250,000 | 7.500 | 05/15/18 | 273,719 | |||||||||||
| Royal Bank of Scotland Group PLC |
| ||||||||||||
| 100,000 | 5.125 | 05/28/24 | 97,359 | |||||||||||
|
| |||||||||||||
| Corporate Obligations – (continued) | ||||||||||||||
| Banks – (continued) |
| ||||||||||||
| Royal Bank of Scotland PLC(a)(b) |
| ||||||||||||
| $ | 100,000 | 9.500 | % | 03/16/22 | $ | 104,133 | ||||||||
| Santander Bank NA(a) |
| ||||||||||||
| 250,000 | 2.000 | 01/12/18 | 249,282 | |||||||||||
| Santander UK PLC(c) |
| ||||||||||||
| 500,000 | 5.000 | 11/07/23 | 513,250 | |||||||||||
| Synchrony Financial(a) |
| ||||||||||||
| 350,000 | 2.600 | 01/15/19 | 353,286 | |||||||||||
| The Bank of Tokyo-Mitsubishi UFJ Ltd.(c) |
| ||||||||||||
| 300,000 | 2.150 | 09/14/18 | 303,172 | |||||||||||
| UBS Group Funding Jersey Ltd.(c) |
| ||||||||||||
| 350,000 | 3.000 | 04/15/21 | 356,983 | |||||||||||
|
| |||||||||||||
| 9,569,740 | ||||||||||||||
|
| |||||||||||||
| Consumer Services(a) – 0.3% |
| ||||||||||||
| Marriott International, Inc. |
| ||||||||||||
| 125,000 | 2.875 | 03/01/21 | 128,852 | |||||||||||
| 250,000 | 2.300 | 01/15/22 | 251,726 | |||||||||||
|
| |||||||||||||
| 380,578 | ||||||||||||||
|
| |||||||||||||
| Diversified Financials – 0.3% |
| ||||||||||||
| General Motors Financial Co., Inc. |
| ||||||||||||
| 125,000 | 3.250 | 05/15/18 | 127,591 | |||||||||||
| 175,000 | 3.500 | 07/10/19 | 181,080 | |||||||||||
|
| |||||||||||||
| 308,671 | ||||||||||||||
|
| |||||||||||||
| Diversified Manufacturing(a) – 0.1% |
| ||||||||||||
| Roper Technologies, Inc. |
| ||||||||||||
| 125,000 | 3.000 | 12/15/20 | 129,704 | |||||||||||
|
| |||||||||||||
| Electric – 1.3% |
| ||||||||||||
| Emera US Finance LP(a)(c) |
| ||||||||||||
| 125,000 | 2.700 | 06/15/21 | 126,112 | |||||||||||
| Florida Power & Light Co.(a) |
| ||||||||||||
| 193,000 | 4.125 | 02/01/42 | 217,711 | |||||||||||
| Pacific Gas & Electric Co.(a) |
| ||||||||||||
| 100,000 | 3.500 | 06/15/25 | 108,480 | |||||||||||
| Progress Energy, Inc. |
| ||||||||||||
| 350,000 | 7.000 | 10/30/31 | 472,134 | |||||||||||
| Puget Sound Energy, Inc. Series A(a)(b) |
| ||||||||||||
| 150,000 | 6.974 | 06/01/67 | 127,313 | |||||||||||
| Southern California Edison Co.(a) |
| ||||||||||||
| 175,000 | 4.050 | 03/15/42 | 191,488 | |||||||||||
| The Southern Co.(a) |
| ||||||||||||
| 225,000 | 2.350 | 07/01/21 | 229,250 | |||||||||||
|
| |||||||||||||
| 1,472,488 | ||||||||||||||
|
| |||||||||||||
| Energy – 1.6% |
| ||||||||||||
| Anadarko Petroleum Corp. |
| ||||||||||||
| 35,000 | 3.450 | (a) | 07/15/24 | 34,171 | ||||||||||
| 100,000 | 6.450 | 09/15/36 | 113,945 | |||||||||||
| Apache Corp.(a) |
| ||||||||||||
| 50,000 | 2.625 | 01/15/23 | 48,765 | |||||||||||
| 150,000 | 4.250 | 01/15/44 | 143,768 | |||||||||||
|
| |||||||||||||
| The accompanying notes are an integral part of these financial statements. | 21 |
GOLDMAN SACHS VARIABLE INSURANCE TRUST CORE FIXED INCOME FUND
Schedule of Investments (continued)
June 30, 2016 (Unaudited)
Principal Amount | Interest Rate | Maturity Date | Value | |||||||||||
| Corporate Obligations – (continued) | ||||||||||||||
| Energy – (continued) |
| ||||||||||||
| ConocoPhillips Co.(a) |
| ||||||||||||
| $ | 150,000 | 3.350 | % | 11/15/24 | $ | 154,368 | ||||||||
| 50,000 | 4.950 | 03/15/26 | 56,548 | |||||||||||
| 100,000 | 4.150 | 11/15/34 | 99,808 | |||||||||||
| Devon Energy Corp.(a) |
| ||||||||||||
| 25,000 | 4.000 | 07/15/21 | 25,250 | |||||||||||
| 75,000 | 5.600 | 07/15/41 | 71,932 | |||||||||||
| 80,000 | 4.750 | 05/15/42 | 71,111 | |||||||||||
| Dolphin Energy Ltd.(c) |
| ||||||||||||
| 50,880 | 5.888 | 06/15/19 | 54,314 | |||||||||||
| Energy Transfer Partners LP(a) |
| ||||||||||||
| 75,000 | 4.750 | 01/15/26 | 77,249 | |||||||||||
| Kinder Morgan Energy Partners LP(a) |
| ||||||||||||
| 50,000 | 5.400 | 09/01/44 | 49,179 | |||||||||||
| Kinder Morgan, Inc.(a) |
| ||||||||||||
| 175,000 | 3.050 | 12/01/19 | 176,354 | |||||||||||
| Occidental Petroleum Corp.(a) |
| ||||||||||||
| 200,000 | 3.400 | 04/15/26 | 210,080 | |||||||||||
| Petroleos Mexicanos |
| ||||||||||||
| 30,000 | 5.500 | (c) | 02/04/19 | 31,575 | ||||||||||
| 60,000 | 6.375 | (c) | 02/04/21 | 65,238 | ||||||||||
| 50,000 | 6.875 | (c) | 08/04/26 | 55,615 | ||||||||||
| 20,000 | 5.500 | 06/27/44 | 18,000 | |||||||||||
| 70,000 | 5.625 | 01/23/46 | 63,805 | |||||||||||
| Pioneer Natural Resources Co.(a) |
| ||||||||||||
| 125,000 | 3.450 | 01/15/21 | 128,883 | |||||||||||
| Valero Energy Corp. |
| ||||||||||||
| 100,000 | 3.650 | 03/15/25 | 100,038 | |||||||||||
|
| |||||||||||||
| 1,849,996 | ||||||||||||||
|
| |||||||||||||
| Food & Beverage – 2.4% |
| ||||||||||||
| Anheuser-Busch InBev Finance, Inc.(a) |
| ||||||||||||
| 675,000 | 2.650 | 02/01/21 | 699,547 | |||||||||||
| 525,000 | 3.650 | 02/01/26 | 562,579 | |||||||||||
| 75,000 | 4.900 | 02/01/46 | 87,757 | |||||||||||
| Kraft Heinz Foods Co.(a)(c) |
| ||||||||||||
| 100,000 | 2.800 | 07/02/20 | 103,693 | |||||||||||
| 175,000 | 3.950 | 07/15/25 | 190,198 | |||||||||||
| 225,000 | 4.375 | 06/01/46 | 237,695 | |||||||||||
| Molson Coors Brewing Co.(a) |
| ||||||||||||
| 50,000 | 2.100 | 07/15/21 | 50,246 | |||||||||||
| 75,000 | 3.000 | 07/15/26 | 75,036 | |||||||||||
| Pernod-Ricard SA(c) |
| ||||||||||||
| 375,000 | 4.450 | 01/15/22 | 413,176 | |||||||||||
| Suntory Holdings Ltd.(c) |
| ||||||||||||
| 275,000 | 2.550 | 09/29/19 | 280,252 | |||||||||||
|
| |||||||||||||
| 2,700,179 | ||||||||||||||
|
| |||||||||||||
| Food & Staples Retailing(a) – 1.1% |
| ||||||||||||
| CVS Health Corp. |
| ||||||||||||
| 125,000 | 2.800 | 07/20/20 | 129,744 | |||||||||||
| 125,000 | 4.125 | 05/15/21 | 136,760 | |||||||||||
| 225,000 | 3.500 | 07/20/22 | 241,134 | |||||||||||
| 89,000 | 3.875 | 07/20/25 | 98,141 | |||||||||||
| 375,000 | 2.875 | 06/01/26 | 382,981 | |||||||||||
|
| |||||||||||||
| Corporate Obligations – (continued) | ||||||||||||||
| Food & Staples Retailing(a) – (continued) |
| ||||||||||||
| Walgreens Boots Alliance, Inc. |
| ||||||||||||
| $ | 125,000 | 2.600 | % | 06/01/21 | $ | 127,137 | ||||||||
| 125,000 | 3.450 | 06/01/26 | 128,060 | |||||||||||
|
| |||||||||||||
| 1,243,957 | ||||||||||||||
|
| |||||||||||||
| Health Care Equipment & Services – 0.9% |
| ||||||||||||
| Aetna, Inc.(a) |
| ||||||||||||
| 100,000 | 2.400 | 06/15/21 | 102,387 | |||||||||||
| 75,000 | 2.800 | 06/15/23 | 76,789 | |||||||||||
| Becton Dickinson and Co. |
| ||||||||||||
| 200,000 | 2.675 | 12/15/19 | 205,260 | |||||||||||
| Cigna Corp.(a) |
| ||||||||||||
| 150,000 | 3.250 | 04/15/25 | 152,870 | |||||||||||
| Medtronic, Inc. |
| ||||||||||||
| 75,000 | 2.500 | 03/15/20 | 77,514 | |||||||||||
| 150,000 | 3.150 | 03/15/22 | 159,381 | |||||||||||
| Stryker Corp.(a) |
| ||||||||||||
| 50,000 | 2.625 | 03/15/21 | 51,720 | |||||||||||
| 125,000 | 3.375 | 11/01/25 | 131,300 | |||||||||||
| UnitedHealth Group, Inc. |
| ||||||||||||
| 100,000 | 4.625 | 07/15/35 | 116,070 | |||||||||||
|
| |||||||||||||
| 1,073,291 | ||||||||||||||
|
| |||||||||||||
| Healthcare – 0.1% |
| ||||||||||||
| Dentsply Sirona, Inc. |
| ||||||||||||
| 125,000 | 2.750 | 08/15/16 | 125,227 | |||||||||||
|
| |||||||||||||
| Life Insurance – 0.5% |
| ||||||||||||
| American International Group, Inc.(a) |
| ||||||||||||
| 50,000 | 3.750 | 07/10/25 | 50,960 | |||||||||||
| 25,000 | 4.500 | 07/16/44 | 24,282 | |||||||||||
| Reliance Standard Life Global Funding II(c) |
| ||||||||||||
| 225,000 | 2.500 | 01/15/20 | 228,338 | |||||||||||
| The Northwestern Mutual Life Insurance Co.(c) |
| ||||||||||||
| 200,000 | 6.063 | 03/30/40 | 255,827 | |||||||||||
|
| |||||||||||||
| 559,407 | ||||||||||||||
|
| |||||||||||||
| Materials – 0.1% |
| ||||||||||||
| Ecolab, Inc. |
| ||||||||||||
| 100,000 | 5.500 | 12/08/41 | 123,528 | |||||||||||
|
| |||||||||||||
| Media – 0.8% |
| ||||||||||||
| 21st Century Fox America, Inc.(a) |
| ||||||||||||
| 75,000 | 3.700 | 09/15/24 | 80,926 | |||||||||||
| CCO Safari II LLC(a)(c) |
| ||||||||||||
| 25,000 | 3.579 | 07/23/20 | 26,127 | |||||||||||
| 200,000 | 4.908 | 07/23/25 | 218,275 | |||||||||||
| Comcast Corp.(a) |
| ||||||||||||
| 400,000 | 3.375 | 08/15/25 | 430,526 | |||||||||||
| Time Warner Cable, Inc. |
| ||||||||||||
| 50,000 | 5.000 | 02/01/20 | 54,374 | |||||||||||
| 25,000 | 7.300 | 07/01/38 | 31,279 | |||||||||||
| 25,000 | 5.875 | (a) | 11/15/40 | 27,236 | ||||||||||
| Time Warner, Inc.(a) |
| ||||||||||||
| 25,000 | 3.875 | 01/15/26 | 26,943 | |||||||||||
|
| |||||||||||||
| 895,686 | ||||||||||||||
|
| |||||||||||||
| 22 | The accompanying notes are an integral part of these financial statements. |
GOLDMAN SACHS VARIABLE INSURANCE TRUST CORE FIXED INCOME FUND
Principal Amount | Interest Rate | Maturity Date | Value | |||||||||||
| Corporate Obligations – (continued) | ||||||||||||||
| Metals and Mining – 0.3% |
| ||||||||||||
| Glencore Finance Canada Ltd.(c) |
| ||||||||||||
| $ | 350,000 | 2.700 | % | 10/25/17 | $ | 348,688 | ||||||||
| Glencore Funding LLC(c) |
| ||||||||||||
| 50,000 | 2.500 | 01/15/19 | 48,062 | |||||||||||
|
| |||||||||||||
| 396,750 | ||||||||||||||
|
| |||||||||||||
| Noncaptive-Financial – 0.3% |
| ||||||||||||
| Capital One Financial Corp.(a) |
| ||||||||||||
| 200,000 | 4.200 | 10/29/25 | 204,455 | |||||||||||
| International Lease Finance Corp.(c) |
| ||||||||||||
| 150,000 | 7.125 | 09/01/18 | 164,250 | |||||||||||
|
| |||||||||||||
| 368,705 | ||||||||||||||
|
| |||||||||||||
| Pharmaceuticals, Biotechnology & Life Sciences – 2.1% |
| ||||||||||||
| AbbVie, Inc.(a) |
| ||||||||||||
| 225,000 | 2.500 | 05/14/20 | 229,371 | |||||||||||
| 75,000 | 2.300 | 05/14/21 | 75,526 | |||||||||||
| 25,000 | 3.200 | 05/14/26 | 25,302 | |||||||||||
| Actavis Funding SCS |
| ||||||||||||
| 225,000 | 2.350 | 03/12/18 | 227,541 | |||||||||||
| 50,000 | 3.450 | (a) | 03/15/22 | 51,618 | ||||||||||
| 160,000 | 3.800 | (a) | 03/15/25 | 166,528 | ||||||||||
| 125,000 | 4.850 | (a) | 06/15/44 | 131,550 | ||||||||||
| Bayer US Finance LLC(c) |
| ||||||||||||
| 400,000 | 3.000 | 10/08/21 | 417,703 | |||||||||||
| EMD Finance LLC(a)(c) |
| ||||||||||||
| 375,000 | 2.950 | 03/19/22 | 384,207 | |||||||||||
| Forest Laboratories LLC(a)(c) |
| ||||||||||||
| 325,000 | 4.375 | 02/01/19 | 342,791 | |||||||||||
| 100,000 | 5.000 | 12/15/21 | 111,913 | |||||||||||
| Thermo Fisher Scientific, Inc.(a) |
| ||||||||||||
| 175,000 | 3.000 | 04/15/23 | 178,195 | |||||||||||
| 100,000 | 3.650 | 12/15/25 | 104,832 | |||||||||||
|
| |||||||||||||
| 2,447,077 | ||||||||||||||
|
| |||||||||||||
| Pipelines(a) – 0.9% |
| ||||||||||||
| Columbia Pipeline Group, Inc. |
| ||||||||||||
| 100,000 | 3.300 | 06/01/20 | 103,500 | |||||||||||
| Enbridge, Inc. |
| ||||||||||||
| 50,000 | 3.500 | 06/10/24 | 47,675 | |||||||||||
| EnLink Midstream Partners LP |
| ||||||||||||
| 175,000 | 4.150 | 06/01/25 | 161,311 | |||||||||||
| Enterprise Products Operating LLC |
| ||||||||||||
| 25,000 | 3.350 | 03/15/23 | 25,592 | |||||||||||
| Enterprise Products Operating LLC Series A(b) |
| ||||||||||||
| 450,000 | 8.375 | 08/01/66 | 396,473 | |||||||||||
| Sunoco Logistics Partners Operations LP |
| ||||||||||||
| 50,000 | 4.250 | 04/01/24 | 50,177 | |||||||||||
| Western Gas Partners LP |
| ||||||||||||
| 100,000 | 3.950 | 06/01/25 | 94,167 | |||||||||||
| Williams Partners LP |
| ||||||||||||
| 175,000 | 3.900 | 01/15/25 | 159,906 | |||||||||||
|
| |||||||||||||
| 1,038,801 | ||||||||||||||
|
| |||||||||||||
| Corporate Obligations – (continued) | ||||||||||||||
| Property/Casualty Insurance(a)(b) – 0.1% |
| ||||||||||||
| The Chubb Corp. |
| ||||||||||||
| $ | 125,000 | 6.375 | % | 04/15/37 | $ | 108,750 | ||||||||
|
| |||||||||||||
| Real Estate Development(a) – 0.1% |
| ||||||||||||
| MDC Holdings, Inc. |
| ||||||||||||
| 150,000 | 5.500 | 01/15/24 | 149,162 | |||||||||||
|
| |||||||||||||
| Real Estate Investment Trusts – 2.5% |
| ||||||||||||
| American Campus Communities Operating Partnership LP(a) |
| ||||||||||||
| 275,000 | 4.125 | 07/01/24 | 291,488 | |||||||||||
| Brixmor Operating Partnership LP(a) |
| ||||||||||||
| 75,000 | 3.850 | 02/01/25 | 74,925 | |||||||||||
| Camden Property Trust |
| ||||||||||||
| 325,000 | 5.700 | 05/15/17 | 336,171 | |||||||||||
| CubeSmart LP(a) |
| ||||||||||||
| 125,000 | 4.000 | 11/15/25 | 132,915 | |||||||||||
| DDR Corp. |
| ||||||||||||
| 375,000 | 7.500 | 04/01/17 | 390,920 | |||||||||||
| HCP, Inc. |
| ||||||||||||
| 275,000 | 6.000 | 01/30/17 | 282,200 | |||||||||||
| 25,000 | 2.625 | (a) | 02/01/20 | 25,191 | ||||||||||
| Healthcare Realty Trust, Inc. |
| ||||||||||||
| 350,000 | 5.750 | 01/15/21 | 390,320 | |||||||||||
| Healthcare Trust of America Holdings LP(a) |
| ||||||||||||
| 100,000 | 3.375 | 07/15/21 | 102,306 | |||||||||||
| National Retail Properties, Inc.(a) |
| ||||||||||||
| 125,000 | 4.000 | 11/15/25 | 132,407 | |||||||||||
| Select Income REIT(a) |
| ||||||||||||
| 50,000 | 2.850 | 02/01/18 | 50,372 | |||||||||||
| 75,000 | 3.600 | 02/01/20 | 76,197 | |||||||||||
| Ventas Realty LP(a) |
| ||||||||||||
| 125,000 | 3.500 | 02/01/25 | 128,054 | |||||||||||
| Welltower, Inc. |
| ||||||||||||
| 375,000 | 2.250 | 03/15/18 | 378,501 | |||||||||||
|
| |||||||||||||
| 2,791,967 | ||||||||||||||
|
| |||||||||||||
| Retailing(a) – 0.2% |
| ||||||||||||
| The Priceline Group, Inc. |
| ||||||||||||
| 200,000 | 3.600 | 06/01/26 | 206,365 | |||||||||||
|
| |||||||||||||
| Software & Services(a) – 0.4% |
| ||||||||||||
| Fidelity National Information Services, Inc. |
| ||||||||||||
| 250,000 | 3.625 | 10/15/20 | 264,285 | |||||||||||
| Fiserv, Inc. |
| ||||||||||||
| 150,000 | 2.700 | 06/01/20 | 155,007 | |||||||||||
|
| |||||||||||||
| 419,292 | ||||||||||||||
|
| |||||||||||||
| Technology – 0.4% |
| ||||||||||||
| Amphenol Corp.(a) |
| ||||||||||||
| 125,000 | 3.125 | 09/15/21 | 129,557 | |||||||||||
| Cisco Systems, Inc. |
| ||||||||||||
| 100,000 | 2.200 | 02/28/21 | 102,751 | |||||||||||
| Intel Corp.(a) |
| ||||||||||||
| 200,000 | 3.700 | 07/29/25 | 223,709 | |||||||||||
|
| |||||||||||||
| 456,017 | ||||||||||||||
|
| |||||||||||||
| The accompanying notes are an integral part of these financial statements. | 23 |
GOLDMAN SACHS VARIABLE INSURANCE TRUST CORE FIXED INCOME FUND
Schedule of Investments (continued)
June 30, 2016 (Unaudited)
Principal Amount | Interest Rate | Maturity Date | Value | |||||||||||
| Corporate Obligations – (continued) | ||||||||||||||
| Technology Hardware & Equipment(a)(c) – 0.1% |
| ||||||||||||
| Hewlett Packard Enterprise Co. |
| ||||||||||||
| $ | 125,000 | 4.900 | % | 10/15/25 | $ | 130,050 | ||||||||
|
| |||||||||||||
| Tobacco – 1.6% |
| ||||||||||||
| BAT International Finance PLC(c) |
| ||||||||||||
| 400,000 | 3.950 | 06/15/25 | 445,155 | |||||||||||
| Imperial Brands Finance PLC(c) |
| ||||||||||||
| 400,000 | 2.050 | 02/11/18 | 403,469 | |||||||||||
| Philip Morris International, Inc.(a) |
| ||||||||||||
| 125,000 | 2.750 | 02/25/26 | 128,510 | |||||||||||
| Reynolds American, Inc.(a) |
| ||||||||||||
| 775,000 | 4.450 | 06/12/25 | 864,606 | |||||||||||
|
| |||||||||||||
| 1,841,740 | ||||||||||||||
|
| |||||||||||||
| Transportation(c) – 0.5% |
| ||||||||||||
| ERAC USA Finance LLC |
| ||||||||||||
| 350,000 | 2.350 | 10/15/19 | 356,608 | |||||||||||
| Penske Truck Leasing Co. LP / PTL Finance Corp.(a) |
| ||||||||||||
| 200,000 | 3.375 | 02/01/22 | 203,958 | |||||||||||
|
| |||||||||||||
| 560,566 | ||||||||||||||
|
| |||||||||||||
| Wireless Telecommunications – 2.8% |
| ||||||||||||
| American Tower Corp. |
| ||||||||||||
| 75,000 | 3.300 | (a) | 02/15/21 | 78,074 | ||||||||||
| 125,000 | 4.700 | 03/15/22 | 137,890 | |||||||||||
| AT&T, Inc. |
| ||||||||||||
| 250,000 | 3.800 | 03/15/22 | 266,284 | |||||||||||
| 50,000 | 4.450 | (a) | 04/01/24 | 54,681 | ||||||||||
| 100,000 | 3.400 | (a) | 05/15/25 | 101,994 | ||||||||||
| Verizon Communications, Inc. |
| ||||||||||||
| 607,000 | 2.625 | 02/21/20 | 627,487 | |||||||||||
| 850,000 | 4.500 | 09/15/20 | 943,812 | |||||||||||
| 800,000 | 5.150 | 09/15/23 | 931,268 | |||||||||||
|
| |||||||||||||
| 3,141,490 | ||||||||||||||
|
| |||||||||||||
| Wirelines Telecommunications – 0.4% |
| ||||||||||||
| Telefonica Emisiones SAU |
| ||||||||||||
| 175,000 | 3.192 | 04/27/18 | 179,848 | |||||||||||
| 225,000 | 5.462 | 02/16/21 | 256,412 | |||||||||||
|
| |||||||||||||
| 436,260 | ||||||||||||||
|
| |||||||||||||
| TOTAL CORPORATE OBLIGATIONS | ||||||||||||||
| (Cost $34,168,627) | $ | 35,472,509 | ||||||||||||
|
| |||||||||||||
| Mortgage-Backed Obligations – 30.9% | ||||||||||||||
| Adjustable Rate Non-Agency(a)(b) – 0.5% |
| ||||||||||||
| Countrywide Alternative Loan Trust Series 2005-38, Class A1 |
| ||||||||||||
| $ | 132,902 | 1.937 | % | 09/25/35 | $ | 116,965 | ||||||||
| Lehman XS Trust Series 2005-7N, Class 1A1A |
| ||||||||||||
| 235,566 | 0.723 | 12/25/35 | 207,027 | |||||||||||
| Master Adjustable Rate Mortgages Trust Series 2006-OA2, | | ||||||||||||
| 289,373 | 1.287 | 12/25/46 | 215,364 | |||||||||||
|
| |||||||||||||
| 539,356 | ||||||||||||||
|
| |||||||||||||
| Mortgage-Backed Obligations – (continued) | ||||||||||||||
| Collateralized Mortgage Obligations – 6.4% |
| ||||||||||||
| Agency Multi-Family – 4.6% |
| ||||||||||||
| FHLMC Multifamily Structured Pass-Through Certificates | | ||||||||||||
| $ | 300,000 | 3.300 | % | 04/25/23 | $ | 329,071 | ||||||||
| FHLMC Multifamily Structured Pass-Through Certificates | | ||||||||||||
| 300,000 | 3.034 | 10/25/20 | 319,457 | |||||||||||
| FNMA |
| ||||||||||||
| 356,918 | 2.800 | 03/01/18 | 362,008 | |||||||||||
| 1,016,998 | 3.740 | 05/01/18 | 1,046,212 | |||||||||||
| 320,000 | 3.840 | 05/01/18 | 329,708 | |||||||||||
| 800,000 | 4.506 | 06/01/19 | 837,009 | |||||||||||
| 161,766 | 3.416 | 10/01/20 | 173,850 | |||||||||||
| 168,595 | 3.619 | 12/01/20 | 181,967 | |||||||||||
| 864,980 | 3.762 | 12/01/20 | 937,853 | |||||||||||
| 358,478 | 4.380 | 06/01/21 | 398,672 | |||||||||||
| FNMA ACES Series 2012-M8, Class A2 |
| ||||||||||||
| 100,000 | 2.349 | 05/25/22 | 103,200 | |||||||||||
| FNMA ACES Series 2012-M8, Class ASQ2 |
| ||||||||||||
| 71,530 | 1.520 | 12/25/19 | 71,842 | |||||||||||
| GNMA |
| ||||||||||||
| 119,456 | 3.950 | 07/15/25 | 130,178 | |||||||||||
|
| |||||||||||||
| 5,221,027 | ||||||||||||||
|
| |||||||||||||
| Regular Floater(a)(b) – 1.4% |
| ||||||||||||
| Aire Valley Mortgages PLC Series 2006-1A, Class 1A(c) |
| ||||||||||||
| 62,184 | 0.867 | 09/20/66 | 59,437 | |||||||||||
| Aire Valley Mortgages PLC Series 2006-1X, Class 2A1 |
| ||||||||||||
| EUR | 176,765 | 0.036 | 09/20/66 | 189,279 | ||||||||||
| Connecticut Avenue Securities Series 2014-C03, Class 1M1 |
| ||||||||||||
| $ | 28,671 | 1.653 | 07/25/24 | 28,667 | ||||||||||
| FNMA REMIC Series 2016-33, Class PF |
| ||||||||||||
| 1,088,752 | 0.953 | 06/25/46 | 1,084,122 | |||||||||||
| Leek Finance Number Eighteen PLC Series 18X, Class A2B |
| ||||||||||||
| 165,776 | 0.904 | 09/21/38 | 176,654 | |||||||||||
| Leek Finance Number Eighteen PLC Series 18X, Class A2C |
| ||||||||||||
| EUR | 41,444 | 0.000 | 09/21/38 | 49,030 | ||||||||||
|
| |||||||||||||
| 1,587,189 | ||||||||||||||
|
| |||||||||||||
| Sequential Fixed Rate – 0.4% |
| ||||||||||||
| FNMA REMIC Series 2012-111, Class B |
| ||||||||||||
| $ | 26,359 | 7.000 | 10/25/42 | 30,516 | ||||||||||
| FNMA REMIC Series 2012-153, Class B |
| ||||||||||||
| 66,993 | 7.000 | 07/25/42 | 79,092 | |||||||||||
| National Credit Union Administration Guaranteed Notes | | ||||||||||||
| 300,000 | 3.000 | 06/12/19 | 317,685 | |||||||||||
|
| |||||||||||||
| 427,293 | ||||||||||||||
|
| |||||||||||||
| | TOTAL COLLATERALIZED MORTGAGE OBLIGATIONS | | $ | 7,235,509 | ||||||||||
|
| |||||||||||||
| 24 | The accompanying notes are an integral part of these financial statements. |
GOLDMAN SACHS VARIABLE INSURANCE TRUST CORE FIXED INCOME FUND
| Principal Amount | Interest Rate | Maturity Date | Value | |||||||||||
| Mortgage-Backed Obligations – (continued) | ||||||||||||||
| Commercial Mortgage-Backed Securities – 1.9% |
| ||||||||||||
| Sequential Fixed Rate(b) – 1.9% |
| ||||||||||||
| Banc of America Commercial Mortgage Trust Series 2007-4, | | ||||||||||||
| $ | 312,171 | 5.774 | % | 02/10/51 | $ | 322,407 | ||||||||
| FREMF Mortgage Trust Series 2014-K40, Class C(a)(c)(d) |
| ||||||||||||
| 100,000 | 4.208 | 11/25/47 | 91,961 | |||||||||||
| FREMF Mortgage Trust Series 2014-K41, Class B(a)(c) |
| ||||||||||||
| 100,000 | 3.961 | 11/25/47 | 98,436 | |||||||||||
| GS Mortgage Securities Trust Series 2007-GG10, Class A1A(d) |
| ||||||||||||
| 599,350 | 5.988 | 08/10/45 | 616,870 | |||||||||||
| GS Mortgage Securities Trust Series 2007-GG10, Class A4(d) |
| ||||||||||||
| 261,675 | 5.988 | 08/10/45 | 268,109 | |||||||||||
| JP Morgan Chase Commercial Mortgage Securities Trust | | ||||||||||||
| 112,699 | 5.811 | 06/12/43 | 112,614 | |||||||||||
| JP Morgan Chase Commercial Mortgage Securities Trust | | ||||||||||||
| 250,832 | 5.887 | 02/12/49 | 257,263 | |||||||||||
| Wachovia Bank Commercial Mortgage Trust Series 2007-C34, | | ||||||||||||
| 453,260 | 5.608 | 05/15/46 | 461,894 | |||||||||||
|
| |||||||||||||
| | TOTAL COMMERCIAL MORTGAGE-BACKED SECURITIES | | $ | 2,229,554 | ||||||||||
|
| |||||||||||||
| Federal Agencies – 22.1% |
| ||||||||||||
| Adjustable Rate FHLMC(b) – 0.5% |
| ||||||||||||
| $ | 536,023 | 2.500 | % | 09/01/35 | $ | 567,207 | ||||||||
|
| |||||||||||||
| Adjustable Rate FNMA(b) – 1.0% |
| ||||||||||||
| 249,476 | 2.604 | 05/01/33 | 258,766 | |||||||||||
| 449,603 | 2.833 | 05/01/35 | 475,907 | |||||||||||
| 356,884 | 2.889 | 09/01/35 | 380,135 | |||||||||||
|
| |||||||||||||
| 1,114,808 | ||||||||||||||
|
| |||||||||||||
| FHLMC – 4.3% |
| ||||||||||||
| 41,521 | 5.500 | 02/01/18 | 42,786 | |||||||||||
| 4,201 | 5.500 | 04/01/18 | 4,323 | |||||||||||
| 1,909 | 4.500 | 09/01/18 | 1,967 | |||||||||||
| 5,609 | 5.500 | 09/01/18 | 5,839 | |||||||||||
| 44 | 9.500 | 08/01/19 | 44 | |||||||||||
| 21 | 9.500 | 08/01/20 | 23 | |||||||||||
| 38,932 | 6.500 | 10/01/20 | 44,854 | |||||||||||
| 8,991 | 4.500 | 07/01/24 | 9,721 | |||||||||||
| 47,743 | 4.500 | 11/01/24 | 51,794 | |||||||||||
| 11,009 | 4.500 | 12/01/24 | 11,920 | |||||||||||
| 10,218 | 6.000 | 03/01/29 | 11,605 | |||||||||||
| 159 | 6.000 | 04/01/29 | 180 | |||||||||||
| 12,115 | 7.500 | 12/01/29 | 13,770 | |||||||||||
| 126,142 | 7.000 | 05/01/32 | 150,000 | |||||||||||
| 199 | 6.000 | 08/01/32 | 231 | |||||||||||
| 74,389 | 7.000 | 12/01/32 | 88,570 | |||||||||||
| 4,622 | 5.000 | 10/01/33 | 5,126 | |||||||||||
| 6,519 | 5.000 | 07/01/35 | 7,226 | |||||||||||
| 8,766 | 5.000 | 12/01/35 | 9,981 | |||||||||||
| 72,338 | 5.500 | 01/01/37 | 80,790 | |||||||||||
|
| |||||||||||||
| Mortgage-Backed Obligations – (continued) | ||||||||||||||
| FHLMC – (continued) |
| ||||||||||||
| $ | 2,163 | 5.000 | % | 03/01/38 | $ | 2,387 | ||||||||
| 128,724 | 7.000 | 02/01/39 | 151,994 | |||||||||||
| 4,267 | 5.000 | 06/01/41 | 4,734 | |||||||||||
| 1,731,105 | 3.500 | 04/01/43 | 1,835,783 | |||||||||||
| 990,325 | 3.500 | 04/01/46 | 1,055,161 | |||||||||||
| 1,196,446 | 3.500 | 05/01/46 | 1,274,776 | |||||||||||
|
| |||||||||||||
| 4,865,585 | ||||||||||||||
|
| |||||||||||||
| FNMA – 7.4% |
| ||||||||||||
| 582 | 6.500 | 09/01/16 | 583 | |||||||||||
| 1,253 | 6.500 | 11/01/16 | 1,257 | |||||||||||
| 130 | 7.500 | 04/01/17 | 131 | |||||||||||
| 48,634 | 5.500 | 02/01/18 | 50,183 | |||||||||||
| 49,633 | 5.000 | 05/01/18 | 51,109 | |||||||||||
| 5,052 | 6.500 | 08/01/18 | 5,820 | |||||||||||
| 32,600 | 7.000 | 08/01/18 | 33,778 | |||||||||||
| 1,010 | 5.000 | 06/01/23 | 1,066 | |||||||||||
| 97,329 | 5.500 | 09/01/23 | 106,301 | |||||||||||
| 26,532 | 5.500 | 10/01/23 | 29,107 | |||||||||||
| 1,246 | 6.000 | 12/01/23 | 1,423 | |||||||||||
| 6,393 | 4.500 | 07/01/24 | 6,932 | |||||||||||
| 120,551 | 4.500 | 11/01/24 | 130,834 | |||||||||||
| 50,145 | 4.500 | 12/01/24 | 54,467 | |||||||||||
| 65 | 7.000 | 07/01/25 | 76 | |||||||||||
| 13,679 | 9.000 | 11/01/25 | 16,198 | |||||||||||
| 39,698 | 7.000 | 08/01/26 | 46,160 | |||||||||||
| 668 | 7.000 | 08/01/27 | 791 | |||||||||||
| 5,198 | 7.000 | 09/01/27 | 5,782 | |||||||||||
| 141 | 7.000 | 01/01/28 | 166 | |||||||||||
| 3,210 | 6.000 | 01/01/29 | 3,665 | |||||||||||
| 76,620 | 6.000 | 02/01/29 | 88,451 | |||||||||||
| 70,677 | 6.000 | 06/01/29 | 81,598 | |||||||||||
| 24,167 | 8.000 | 10/01/29 | 29,625 | |||||||||||
| 6,520 | 7.000 | 12/01/29 | 7,805 | |||||||||||
| 1,327 | 8.500 | 04/01/30 | 1,653 | |||||||||||
| 2,471 | 8.000 | 05/01/30 | 2,886 | |||||||||||
| 263 | 8.500 | 06/01/30 | 295 | |||||||||||
| 7,471 | 7.000 | 05/01/32 | 9,015 | |||||||||||
| 59,415 | 7.000 | 06/01/32 | 70,637 | |||||||||||
| 75,269 | 7.000 | 08/01/32 | 89,717 | |||||||||||
| 12,137 | 8.000 | 08/01/32 | 13,373 | |||||||||||
| 3,242 | 5.000 | 08/01/33 | 3,636 | |||||||||||
| 837 | 5.500 | 09/01/33 | 952 | |||||||||||
| 1,026 | 5.500 | 02/01/34 | 1,166 | |||||||||||
| 198 | 5.500 | 04/01/34 | 226 | |||||||||||
| 7,572 | 5.500 | 12/01/34 | 8,618 | |||||||||||
| 31,384 | 5.000 | 04/01/35 | 35,735 | |||||||||||
| 59,222 | 6.000 | 04/01/35 | 68,504 | |||||||||||
| 1,347 | 5.500 | 09/01/35 | 1,540 | |||||||||||
| 122,082 | 6.000 | 10/01/35 | 139,764 | |||||||||||
| 298,110 | 6.000 | 09/01/36 | 341,288 | |||||||||||
| 91 | 5.500 | 02/01/37 | 104 | |||||||||||
| 201 | 5.500 | 04/01/37 | 228 | |||||||||||
| 62 | 5.500 | 05/01/37 | 71 | |||||||||||
|
| |||||||||||||
| The accompanying notes are an integral part of these financial statements. | 25 |
GOLDMAN SACHS VARIABLE INSURANCE TRUST CORE FIXED INCOME FUND
Schedule of Investments (continued)
June 30, 2016 (Unaudited)
Principal Amount | Interest Rate | Maturity Date | Value | |||||||||||
| Mortgage-Backed Obligations – (continued) | ||||||||||||||
| FNMA – (continued) |
| ||||||||||||
| $ | 194,312 | 5.500 | % | 08/01/37 | $ | 218,869 | ||||||||
| 250 | 5.500 | 03/01/38 | 284 | |||||||||||
| 222 | 5.500 | 06/01/38 | 253 | |||||||||||
| 212 | 5.500 | 07/01/38 | 241 | |||||||||||
| 195 | 5.500 | 08/01/38 | 222 | |||||||||||
| 200 | 5.500 | 09/01/38 | 227 | |||||||||||
| 2,618 | 5.500 | 10/01/38 | 2,974 | |||||||||||
| 61 | 5.500 | 12/01/38 | 70 | |||||||||||
| 139,732 | 5.000 | 01/01/39 | 159,089 | |||||||||||
| 82,969 | 7.000 | 03/01/39 | 97,996 | |||||||||||
| 277,031 | 6.000 | 05/01/39 | 316,411 | |||||||||||
| 20,508 | 4.500 | 08/01/39 | 22,917 | |||||||||||
| 60,926 | 3.000 | 01/01/43 | 63,886 | |||||||||||
| 244,678 | 3.000 | 03/01/43 | 256,568 | |||||||||||
| 340,539 | 3.000 | 04/01/43 | 357,087 | |||||||||||
| 256,507 | 3.000 | 05/01/43 | 268,972 | |||||||||||
| 930,269 | 3.500 | 07/01/43 | 982,477 | |||||||||||
| 901,408 | 3.500 | 05/01/46 | 961,091 | |||||||||||
| 1,000,000 | 3.000 | TBA-30yr | (e) | 1,035,742 | ||||||||||
| 2,000,000 | 4.000 | TBA-30yr | (e) | 2,144,375 | ||||||||||
|
| |||||||||||||
| 8,432,467 | ||||||||||||||
|
| |||||||||||||
| GNMA – 8.9% |
| ||||||||||||
| 2,278 | 7.000 | 10/15/25 | 2,335 | |||||||||||
| 7,883 | 7.000 | 11/15/25 | 8,650 | |||||||||||
| 1,337 | 7.000 | 02/15/26 | 1,384 | |||||||||||
| 6,603 | 7.000 | 04/15/26 | 7,518 | |||||||||||
| 3,391 | 7.000 | 03/15/27 | 4,031 | |||||||||||
| 57,361 | 7.000 | 11/15/27 | 66,994 | |||||||||||
| 502 | 7.000 | 01/15/28 | 570 | |||||||||||
| �� | 19,569 | 7.000 | 02/15/28 | 21,834 | ||||||||||
| 2,967 | 7.000 | 03/15/28 | 3,441 | |||||||||||
| 1,073 | 7.000 | 04/15/28 | 1,285 | |||||||||||
| 342 | 7.000 | 05/15/28 | 402 | |||||||||||
| 4,754 | 7.000 | 06/15/28 | 5,667 | |||||||||||
| 10,124 | 7.000 | 07/15/28 | 12,045 | |||||||||||
| 14,188 | 7.000 | 09/15/28 | 17,030 | |||||||||||
| 2,389 | 7.000 | 11/15/28 | 2,863 | |||||||||||
| 3,145 | 7.500 | 11/15/30 | 3,157 | |||||||||||
| 185,919 | 6.000 | 08/20/34 | 219,490 | |||||||||||
| 200,826 | 5.000 | 06/15/40 | 225,221 | |||||||||||
| 2,777,187 | 4.000 | 08/20/45 | 2,969,095 | |||||||||||
| 1,185,153 | 4.000 | 03/20/46 | 1,271,864 | |||||||||||
| 1,994,674 | 4.000 | 05/20/46 | 2,144,353 | |||||||||||
| 3,000,000 | 4.000 | TBA-30yr | (e) | 3,207,187 | ||||||||||
|
| |||||||||||||
| 10,196,416 | ||||||||||||||
|
| |||||||||||||
| TOTAL FEDERAL AGENCIES | $ | 25,176,483 | ||||||||||||
|
| |||||||||||||
| TOTAL MORTGAGE-BACKED OBLIGATIONS | ||||||||||||||
| (Cost $34,596,453) | $ | 35,180,902 | ||||||||||||
|
| |||||||||||||
| Agency Debentures – 2.3% | ||||||||||||||
| FHLB |
| ||||||||||||
| $ | 600,000 | 2.125 | % | 06/09/23 | $ | 626,411 | ||||||||
| 100,000 | 3.375 | 12/08/23 | 111,886 | |||||||||||
| FNMA |
| ||||||||||||
| 400,000 | 6.250 | 05/15/29 | 582,273 | |||||||||||
| Tennessee Valley Authority |
| ||||||||||||
| 500,000 | 3.875 | 02/15/21 | 560,236 | |||||||||||
| 500,000 | 5.375 | 04/01/56 | 693,585 | |||||||||||
|
| |||||||||||||
| TOTAL AGENCY DEBENTURES | ||||||||||||||
| (Cost $2,268,830) | $ | 2,574,391 | ||||||||||||
|
| |||||||||||||
| Asset-Backed Securities(b) – 7.7% | ||||||||||||||
| Collateralized Loan Obligations – 3.6% |
| ||||||||||||
| Aberdeen Loan Funding Ltd. Series 2008-1A, Class A(a)(c) |
| ||||||||||||
| $ | 220,219 | 1.287 | % | 11/01/18 | $ | 219,008 | ||||||||
| Acis CLO Ltd. Series 2013-1A, Class ACOM(a)(c) |
| ||||||||||||
| 1,500,000 | 1.860 | 04/18/24 | 1,444,500 | |||||||||||
| Acis CLO Ltd. Series 2013-2A, Class A(a)(c) |
| ||||||||||||
| 102,856 | 1.130 | 10/14/22 | 101,607 | |||||||||||
| Acis CLO Ltd. Series 2013-2A, Class ACOM(a)(c) |
| ||||||||||||
| 722,844 | 1.328 | 10/14/22 | 713,158 | |||||||||||
| Black Diamond CLO Ltd. Series 2006-1A, Class AD(a)(c) |
| ||||||||||||
| 155,855 | 0.888 | 04/29/19 | 154,158 | |||||||||||
| Ocean Trails CLO I Series 2006-1X, Class A1(a) |
| ||||||||||||
| 518,650 | 0.881 | 10/12/20 | 514,617 | |||||||||||
| OFSI Fund V Ltd. Series 2013-5A, Class ACOM(a)(c) |
| ||||||||||||
| 950,000 | 0.000 | 04/17/25 | 922,070 | |||||||||||
| Red River CLO Ltd. Series 1A, Class A(a)(c) |
| ||||||||||||
| 953 | 0.907 | 07/27/18 | 952 | |||||||||||
|
| |||||||||||||
| 4,070,070 | ||||||||||||||
|
| |||||||||||||
| Home Equity(a) – 1.9% |
| ||||||||||||
| GMAC Mortgage Corp. Loan Trust Series 2007-HE3, Class 1A1 |
| ||||||||||||
| 45,922 | 7.000 | 09/25/37 | 45,567 | |||||||||||
| GMAC Mortgage Corp. Loan Trust Series 2007-HE3, Class 2A1 |
| ||||||||||||
| 92,334 | 6.708 | 09/25/37 | 92,136 | |||||||||||
| Sound Point CLO VI Ltd. Series 2014-2A, Class ACOM(c) |
| ||||||||||||
| 900,000 | 0.000 | 10/20/26 | 883,620 | |||||||||||
| Sound Point CLO VIII Ltd. Series 2015-1A, Class A(c) |
| ||||||||||||
| 900,000 | 2.158 | 04/15/27 | 891,095 | |||||||||||
| Sound Point CLO VIII Ltd. Series 2015-1A, Class B(c) |
| ||||||||||||
| 250,000 | 2.678 | 04/15/27 | 241,505 | |||||||||||
|
| |||||||||||||
| 2,153,923 | ||||||||||||||
|
| |||||||||||||
| Student Loans – 2.2% |
| ||||||||||||
| Access Group, Inc. Series 2005-2, Class A3(a) |
| ||||||||||||
| 225,989 | 0.834 | 11/22/24 | 223,920 | |||||||||||
| Chase Education Loan Trust Series 2007-A, Class A3 |
| ||||||||||||
| 71,332 | 0.694 | 12/28/23 | 70,042 | |||||||||||
| Edsouth Indenture No. 10 LLC Series 2015-2, Class A(a)(c) |
| ||||||||||||
| 476,298 | 1.446 | 12/25/56 | 472,723 | |||||||||||
| Nelnet Student Loan Trust Series 2006-2, Class A5(a) |
| ||||||||||||
| 448,873 | 0.738 | 01/25/30 | 441,974 | |||||||||||
|
| |||||||||||||
| 26 | The accompanying notes are an integral part of these financial statements. |
GOLDMAN SACHS VARIABLE INSURANCE TRUST CORE FIXED INCOME FUND
Principal Amount | Interest Rate | Maturity Date | Value | |||||||||||
| Asset-Backed Securities(b) – (continued) | ||||||||||||||
| Student Loans – (continued) |
| ||||||||||||
| Northstar Education Finance, Inc. Series 2004-2, Class A3 |
| ||||||||||||
| $ | 47,665 | 0.804 | % | 07/30/18 | $ | 47,503 | ||||||||
| Scholar Funding Trust Series 2010-A, Class A(a)(c) |
| ||||||||||||
| 172,718 | 1.384 | 10/28/41 | 169,260 | |||||||||||
| SLC Student Loan Trust Series 2006-1, Class A5(a) |
| ||||||||||||
| 500,000 | 0.763 | 03/15/27 | 479,708 | |||||||||||
| SLM Student Loan Trust Series 2005-3, Class A5(a) |
| ||||||||||||
| 228,893 | 0.728 | 10/25/24 | 225,497 | |||||||||||
| SLM Student Loan Trust Series 2006-2, Class A5(a) |
| ||||||||||||
| 356,243 | 0.748 | 07/25/25 | 354,146 | |||||||||||
|
| |||||||||||||
| 2,484,773 | ||||||||||||||
|
| |||||||||||||
| TOTAL ASSET-BACKED SECURITIES | ||||||||||||||
| (Cost $8,694,190) | $ | 8,708,766 | ||||||||||||
|
| |||||||||||||
| Foreign Debt Obligations – 2.8% | ||||||||||||||
| Sovereign – 2.6% |
| ||||||||||||
| Chile Government International Bond |
| ||||||||||||
| $ | 468,000 | 3.125 | % | 01/21/26 | $ | 487,305 | ||||||||
| Colombia Government International Bond(a) |
| ||||||||||||
| 240,000 | 4.000 | 02/26/24 | 250,800 | |||||||||||
| Indonesia Government International Bond(c) |
| ||||||||||||
| 230,000 | 4.750 | 01/08/26 | 250,987 | |||||||||||
| Italy Buoni Poliennali Del Tesoro |
| ||||||||||||
| EUR | 232,357 | 2.350 | 09/15/19 | 280,111 | ||||||||||
| 60,268 | 2.350 | (c) | 09/15/24 | 76,821 | ||||||||||
| Mexico Government International Bond |
| ||||||||||||
| $ | 470,000 | 3.600 | 01/30/25 | 491,738 | ||||||||||
| 160,000 | 4.750 | 03/08/44 | 171,760 | |||||||||||
| 200,000 | 4.600 | 01/23/46 | 210,500 | |||||||||||
| 10,000 | 5.750 | 10/12/10 | 11,000 | |||||||||||
| Peruvian Government International Bond |
| ||||||||||||
| 110,000 | 6.550 | 03/14/37 | 147,950 | |||||||||||
| Spain Government Inflation Linked Bond(c) |
| ||||||||||||
| EUR | 270,235 | 0.550 | 11/30/19 | 309,436 | ||||||||||
| Turkey Government International Bond |
| ||||||||||||
| $ | 260,000 | 4.250 | 04/14/26 | 264,225 | ||||||||||
|
| |||||||||||||
| 2,952,633 | ||||||||||||||
|
| |||||||||||||
| Supranational – 0.2% |
| ||||||||||||
| Inter-American Development Bank |
| ||||||||||||
| 200,000 | 1.000 | 02/27/18 | 199,461 | |||||||||||
|
| |||||||||||||
| TOTAL FOREIGN DEBT OBLIGATIONS | ||||||||||||||
| (Cost $3,038,032) | $ | 3,152,094 | ||||||||||||
|
| |||||||||||||
| Municipal Debt Obligations – 1.3% | ||||||||||||||
| California – 0.3% |
| ||||||||||||
| California State Various Purpose GO Bonds Series 2010 |
| ||||||||||||
| $ | 140,000 | 7.950 | % | 03/01/36 | $ | 169,643 | ||||||||
| 105,000 | 7.625 | 03/01/40 | 165,979 | |||||||||||
|
| |||||||||||||
| 335,622 | ||||||||||||||
|
| |||||||||||||
| Municipal Debt Obligations – (continued) | ||||||||||||||
| Illinois – 0.2% |
| ||||||||||||
| Illinois State GO Bonds for Build America Bonds Series 2010-5 |
| ||||||||||||
| $ | 250,000 | 7.350 | % | 07/01/35 | $ | 277,665 | ||||||||
|
| |||||||||||||
| New York – 0.5% |
| ||||||||||||
| Rensselaer Polytechnic Institute Taxable Bonds Series 2010 |
| ||||||||||||
| 475,000 | 5.600 | 09/01/20 | 543,025 | |||||||||||
|
| |||||||||||||
| Ohio – 0.3% |
| ||||||||||||
| American Municipal Power, Inc. RB Build America Bond | | ||||||||||||
| 250,000 | 6.270 | 02/15/50 | 327,458 | |||||||||||
|
| |||||||||||||
| TOTAL MUNICIPAL DEBT OBLIGATIONS | ||||||||||||||
| (Cost $1,224,911) | $ | 1,483,770 | ||||||||||||
|
| |||||||||||||
| Government Guarantee Obligations – 2.3% | ||||||||||||||
| Hashemite Kingdom of Jordan Government AID Bond(f) |
| ||||||||||||
| $ | 700,000 | 2.503 | % | 10/30/20 | $ | 735,773 | ||||||||
| Israel Government AID Bond(f) |
| ||||||||||||
| 400,000 | 5.500 | 09/18/23 | 503,697 | |||||||||||
| 200,000 | 5.500 | 12/04/23 | 252,991 | |||||||||||
| 100,000 | 5.500 | 04/26/24 | 127,157 | |||||||||||
| KFW(g) |
| ||||||||||||
| 1,000,000 | 1.125 | 08/06/18 | 1,006,543 | |||||||||||
|
| |||||||||||||
| TOTAL GOVERNMENT GUARANTEE OBLIGATIONS | ||||||||||||||
| (Cost $2,549,344) | $ | 2,626,161 | ||||||||||||
|
| |||||||||||||
| U.S. Treasury Obligations – 19.9% | ||||||||||||||
| United States Treasury Bonds |
| ||||||||||||
| $ | 2,800,000 | 3.625 | %(h) | 08/15/43 | $ | 3,605,812 | ||||||||
| 960,000 | 3.750 | 11/15/43 | 1,264,291 | |||||||||||
| 790,000 | 3.625 | 02/15/44 | 1,016,667 | |||||||||||
| 1,300,000 | 3.375 | 05/15/44 | 1,599,247 | |||||||||||
| 100,000 | 3.000 | 11/15/44 | 114,769 | |||||||||||
| 200,000 | 2.875 | 08/15/45 | 224,064 | |||||||||||
| 50,000 | 2.500 | 05/15/46 | 52,028 | |||||||||||
| United States Treasury Inflation-Protected Securities |
| ||||||||||||
| 1,449,056 | 0.125 | 04/15/18 | 1,471,241 | |||||||||||
| 612,654 | 0.125 | 04/15/19 | 625,771 | |||||||||||
| 103,656 | 0.125 | 01/15/23 | 105,130 | |||||||||||
| 257,030 | 0.375 | 07/15/23 | 265,985 | |||||||||||
| 420,422 | 0.625 | 01/15/24 | 440,460 | |||||||||||
| 151,146 | 0.125 | 07/15/24 | 152,775 | |||||||||||
| 201,786 | 0.375 | 07/15/25 | 207,872 | |||||||||||
| 30,208 | 0.625 | 01/15/26 | 31,827 | |||||||||||
| 390,040 | 2.500 | 01/15/29 | 494,680 | |||||||||||
| 110,697 | 2.125 | 02/15/40 | 144,771 | |||||||||||
| 195,056 | 1.375 | 02/15/44 | 225,410 | |||||||||||
| United States Treasury Notes |
| ||||||||||||
| 470,000 | 0.875 | 11/30/17 | 472,040 | |||||||||||
| 1,200,000 | 1.000 | 12/31/17 | 1,207,704 | |||||||||||
| 200,000 | 0.750 | 01/31/18 | 200,566 | |||||||||||
|
| |||||||||||||
| The accompanying notes are an integral part of these financial statements. | 27 |
GOLDMAN SACHS VARIABLE INSURANCE TRUST CORE FIXED INCOME FUND
Schedule of Investments (continued)
June 30, 2016 (Unaudited)
Principal Amount | Interest Rate | Maturity Date | Value | |||||||||||
| U.S. Treasury Obligations – (continued) | ||||||||||||||
| United States Treasury Notes – (continued) |
| ||||||||||||
| $ | 420,000 | 0.750 | % | 02/28/18 | $ | 421,205 | ||||||||
| 3,400,000 | 1.625 | 06/30/20 | 3,496,662 | |||||||||||
| 2,200,000 | 1.625 | 07/31/20 | 2,262,458 | |||||||||||
| 290,000 | 1.750 | 09/30/22 | 299,190 | |||||||||||
| 540,000 | 1.875 | 10/31/22 | 561,103 | |||||||||||
| 100,000 | 2.250 | 11/15/25 | 106,648 | |||||||||||
| United States Treasury Principal-Only STRIPS(i) |
| ||||||||||||
| 1,900,000 | 0.000 | 11/15/27 | 1,581,370 | |||||||||||
|
| |||||||||||||
| TOTAL U.S. TREASURY OBLIGATIONS | ||||||||||||||
| (Cost $20,531,530) | $ | 22,651,746 | ||||||||||||
|
| |||||||||||||
| TOTAL INVESTMENTS – 98.3% | ||||||||||||||
| (Cost $107,071,917) | $ | 111,850,339 | ||||||||||||
|
| |||||||||||||
| OTHER ASSETS IN EXCESS OF LIABILITIES – 1.7% |
| 1,889,065 | |||||||||||
|
| |||||||||||||
| NET ASSETS – 100.0% | $ | 113,739,404 | ||||||||||||
|
| |||||||||||||
| The percentage shown for each investment category reflects the value of investments in that category as a percentage of net assets. | ||
| (a) | Securities with “Call” features. Maturity dates disclosed are the final maturity dates. | |
| (b) | Variable rate security. Interest rate or distribution rate disclosed is that which is in effect on June 30, 2016. | |
| (c) | Exempt from registration under Rule 144A of the Securities Act of 1933. Under procedures approved by the Board of Trustees, such securities may be deemed liquid by the Investment Adviser and may be resold, normally to qualified institutional buyers in transactions exempt from registration. Total market value of Rule 144A securities amounts to $14,867,927, which represents approximately 13.1% of net assets as of June 30, 2016. | |
| (d) | Interest is based on the weighted net interest rate of the collateral. | |
| (e) | TBA (To Be Announced) Securities are purchased on a forward commitment basis with an approximate principal amount and no defined maturity date. The actual principal and maturity date will be determined upon settlement when the specific mortgage pools are assigned. Total market value of TBA securities (excluding forward sales contracts, if any) amounts to $6,387,304 which represents approximately 5.6% of net assets as of June 30, 2016. | |
| (f) | Guaranteed by the United States Government. Total market value of these securities amounts to 1,619,618, which represents 1.4% of net assets as of June 30, 2016. | |
| (g) | Guaranteed by a foreign government until maturity. Total market value of these securities amounts to 1,006,543, which represents 0.9% of net assets as of June 30, 2016. | |
| (h) | All or a portion of security is segregated as collateral for initial margin requirements on futures transactions. | |
| (i) | Issued with a zero coupon. Income is recognized through the accretion of discount. | |
| Investment Abbreviations: | ||
| BA | —Banker Acceptance Rate | |
| BBR | —Bank Bill Reference Rate | |
| EURIBOR | —Euro Interbank Offered Rate | |
| FHLB | —Federal Home Loan Bank | |
| FHLMC | —Federal Home Loan Mortgage Corp. | |
| FNMA | —Federal National Mortgage Association | |
| GNMA | —Government National Mortgage Association | |
| GO | —General Obligation | |
| LIBOR | —London Interbank Offered Rate | |
| RB | —Revenue Bond | |
| REMIC | —Real Estate Mortgage Investment Conduit | |
| RMKT | —Remarketed | |
| STIBOR | —Stockholm Interbank Offered Rate | |
| STRIPS | —Separate Trading of Registered Interest and Principal of Securities | |
| Currency Abbreviations: | ||
| AUD | —Australian Dollar | |
| CAD | —Canadian Dollar | |
| CHF | —Swiss Franc | |
| EUR | —Euro | |
| GBP | —British Pound | |
| JPY | —Japanese Yen | |
| NOK | —Norwegian Krone | |
| NZD | —New Zealand Dollar | |
| SEK | —Swedish Krona | |
| SGD | —Singapore Dollar | |
| TWD | —Taiwan Dollar | |
| USD | —United States Dollar | |
ADDITIONAL INVESTMENT INFORMATION
FORWARD FOREIGN CURRENCY EXCHANGE CONTRACTS — At June 30, 2016, the Fund had the following forward foreign currency exchange contracts:
FORWARD FOREIGN CURRENCY EXCHANGE CONTRACTS WITH UNREALIZED GAIN
| Counterparty | Currency Purchased | Currency Sold | Settlement Date | Current Value | Unrealized Gain | |||||||||||||||
| Bank of America, N.A. | CHF | 27,480 | EUR | 25,273 | 09/21/16 | $ | 28,270 | $ | 142 | |||||||||||
| EUR | 25,273 | CHF | 27,301 | 09/21/16 | 28,128 | 41 | ||||||||||||||
| 28 | The accompanying notes are an integral part of these financial statements. |
GOLDMAN SACHS VARIABLE INSURANCE TRUST CORE FIXED INCOME FUND
ADDITIONAL INVESTMENT INFORMATION (continued)
FORWARD FOREIGN CURRENCY EXCHANGE CONTRACTS WITH UNREALIZED GAIN (continued)
| Counterparty | Currency Purchased | Currency Sold | Settlement Date | Current Value | Unrealized Gain | |||||||||||||||
| Bank of America, N.A. (continued) | SEK | 373,775 | GBP | 32,024 | 09/21/16 | $ | 44,332 | $ | 1,667 | |||||||||||
| USD | 408,832 | GBP | 278,283 | 07/20/16 | 370,507 | 38,325 | ||||||||||||||
| USD | 84,416 | SEK | 684,927 | 07/29/16 | 81,040 | 3,376 | ||||||||||||||
| BNP Paribas SA | GBP | 132,000 | USD | 175,792 | 09/21/16 | 175,861 | 69 | |||||||||||||
| TWD | 4,136,077 | USD | 127,558 | 07/07/16 | 128,316 | 758 | ||||||||||||||
| USD | 87,040 | EUR | 77,000 | 09/21/16 | 85,701 | 1,339 | ||||||||||||||
| USD | 692,900 | GBP | 506,000 | 09/21/16 | 674,132 | 18,768 | ||||||||||||||
| USD | 35,700 | NOK | 298,077 | 09/21/16 | 35,613 | 87 | ||||||||||||||
| USD | 41,575 | SEK | 341,672 | 09/21/16 | 40,525 | 1,050 | ||||||||||||||
| Citibank, N.A. | AUD | 116,000 | USD | 85,946 | 09/21/16 | 86,262 | 316 | |||||||||||||
| CHF | 249,677 | EUR | 227,623 | 09/21/16 | 256,863 | 3,519 | ||||||||||||||
| GBP | 196,280 | USD | 259,104 | 09/21/16 | 261,499 | 2,395 | ||||||||||||||
| JPY | 20,602,007 | USD | 197,726 | 09/21/16 | 200,052 | 2,326 | ||||||||||||||
| NOK | 1,475,533 | EUR | 157,000 | 09/21/16 | 176,288 | 1,547 | ||||||||||||||
| NOK | 319,341 | USD | 38,068 | 09/21/16 | 38,153 | 85 | ||||||||||||||
| NZD | 121,000 | USD | 85,273 | 09/21/16 | 86,046 | 773 | ||||||||||||||
| USD | 191,334 | EUR | 168,575 | 09/21/16 | 187,622 | 3,712 | ||||||||||||||
| USD | 210,832 | GBP | 143,994 | 09/21/16 | 191,840 | 18,992 | ||||||||||||||
| USD | 64,520 | TWD | 2,070,119 | 08/18/16 | 64,383 | 137 | ||||||||||||||
| Credit Suisse International | CAD | 52,355 | USD | 39,856 | 07/15/16 | 40,526 | 670 | |||||||||||||
| JPMorgan Chase Bank, N.A. | AUD | 53,935 | USD | 39,841 | 08/04/16 | 40,179 | 338 | |||||||||||||
| CHF | 84,112 | EUR | 76,000 | 09/21/16 | 86,533 | 1,945 | ||||||||||||||
| JPY | 4,487,570 | USD | 41,372 | 09/21/16 | 43,576 | 2,204 | ||||||||||||||
| NZD | 160,799 | USD | 114,057 | 09/21/16 | 114,347 | 290 | ||||||||||||||
| USD | 167,869 | GBP | 123,107 | 09/21/16 | 164,012 | 3,857 | ||||||||||||||
| Morgan Stanley Co., Inc. | JPY | 8,934,918 | USD | 86,000 | 09/21/16 | 86,761 | 761 | |||||||||||||
| USD | 85,445 | GBP | 62,000 | 09/21/16 | 82,601 | 2,844 | ||||||||||||||
| Standard Chartered Bank | CAD | 337,627 | USD | 259,000 | 09/21/16 | 261,372 | 2,372 | |||||||||||||
| USD | 87,337 | GBP | 63,000 | 09/21/16 | 83,934 | 3,403 | ||||||||||||||
| State Street Bank | CAD | 225,581 | USD | 173,000 | 09/21/16 | 174,633 | 1,633 | |||||||||||||
| USD | 172,475 | GBP | 121,000 | 09/21/16 | 161,205 | 11,270 | ||||||||||||||
| Westpac Banking Corp. | AUD | 873,687 | USD | 630,788 | 09/21/16 | 649,714 | 18,926 | |||||||||||||
| EUR | 177,741 | GBP | 143,827 | 09/21/16 | 197,825 | 6,208 | ||||||||||||||
| JPY | 19,492,706 | USD | 186,754 | 08/10/16 | 188,979 | 2,225 | ||||||||||||||
| USD | 1,255,110 | EUR | 1,106,589 | 07/13/16 | 1,228,373 | 26,737 | ||||||||||||||
| TOTAL | $ | 185,107 | ||||||||||||||||||
| The accompanying notes are an integral part of these financial statements. | 29 |
GOLDMAN SACHS VARIABLE INSURANCE TRUST CORE FIXED INCOME FUND
Schedule of Investments (continued)
June 30, 2016 (Unaudited)
ADDITIONAL INVESTMENT INFORMATION (continued)
FORWARD FOREIGN CURRENCY EXCHANGE CONTRACTS WITH UNREALIZED LOSS
| Counterparty | Currency Purchased | Currency Sold | Settlement Date | Current Value | Unrealized Loss | |||||||||||||||
| Bank of America, N.A. | EUR | 153,000 | CHF | 165,981 | 09/21/16 | $ | 170,289 | $ | (469 | ) | ||||||||||
| JPY | 17,533,465 | USD | 172,000 | 09/21/16 | 170,255 | (1,745 | ) | |||||||||||||
| SEK | 1,596,422 | EUR | 171,367 | 09/21/16 | 189,347 | (1,384 | ) | |||||||||||||
| USD | 86,000 | JPY | 9,222,210 | 09/21/16 | 89,551 | (3,551 | ) | |||||||||||||
| USD | 45,777 | SGD | 62,426 | 09/21/16 | 46,303 | (526 | ) | |||||||||||||
| BNP Paribas SA | CHF | 167,544 | EUR | 156,000 | 09/21/16 | 172,366 | (1,261 | ) | ||||||||||||
| EUR | 76,000 | CHF | 82,673 | 09/21/16 | 84,588 | (464 | ) | |||||||||||||
| GBP | 151,420 | USD | 221,668 | 09/21/16 | 201,733 | (19,935 | ) | |||||||||||||
| NOK | 404,626 | USD | 48,500 | 09/21/16 | 48,343 | (157 | ) | |||||||||||||
| SEK | 6,519,263 | EUR | 705,902 | 09/21/16 | 773,232 | (12,436 | ) | |||||||||||||
| SEK | 288,976 | USD | 34,796 | 09/21/16 | 34,275 | (521 | ) | |||||||||||||
| USD | 13,895 | AUD | 18,834 | 09/21/16 | 14,005 | (110 | ) | |||||||||||||
| USD | 87,000 | CAD | 112,709 | 09/21/16 | 87,253 | (253 | ) | |||||||||||||
| USD | 320,704 | NZD | 453,982 | 09/21/16 | 322,836 | (2,132 | ) | |||||||||||||
| USD | 127,519 | TWD | 4,136,077 | 08/25/16 | 128,659 | (1,140 | ) | |||||||||||||
| Citibank, N.A. | AUD | 116,765 | NZD | 122,904 | 09/21/16 | 86,832 | (567 | ) | ||||||||||||
| EUR | 76,000 | CHF | 83,361 | 09/21/16 | 84,588 | (1,172 | ) | |||||||||||||
| EUR | 78,000 | SEK | 733,184 | 09/21/16 | 86,814 | (147 | ) | |||||||||||||
| EUR | 37,271 | USD | 42,125 | 07/13/16 | 41,373 | (752 | ) | |||||||||||||
| EUR | 261,524 | USD | 296,786 | 09/21/16 | 291,075 | (5,711 | ) | |||||||||||||
| GBP | 93,486 | USD | 135,016 | 09/21/16 | 124,549 | (10,467 | ) | |||||||||||||
| SEK | 2,740,384 | EUR | 296,119 | 09/21/16 | 325,029 | (4,550 | ) | |||||||||||||
| SEK | 343,914 | USD | 41,731 | 09/21/16 | 40,790 | (941 | ) | |||||||||||||
| USD | 430,848 | CAD | 563,873 | 09/21/16 | 436,519 | (5,671 | ) | |||||||||||||
| USD | 172,110 | GBP | 130,280 | 09/21/16 | 173,569 | (1,459 | ) | |||||||||||||
| USD | 75,953 | NZD | 107,293 | 09/21/16 | 76,299 | (346 | ) | |||||||||||||
| USD | 45,303 | SGD | 62,426 | 09/21/16 | 46,302 | (999 | ) | |||||||||||||
| JPMorgan Chase Bank, N.A. | GBP | 63,000 | USD | 86,399 | 09/21/16 | 83,933 | (2,466 | ) | ||||||||||||
| USD | 87,000 | JPY | 9,009,850 | 09/21/16 | 87,489 | (489 | ) | |||||||||||||
| USD | 41,538 | NZD | 59,173 | 09/21/16 | 42,079 | (541 | ) | |||||||||||||
| USD | 64,041 | TWD | 2,065,958 | 07/07/16 | 64,094 | (53 | ) | |||||||||||||
| Morgan Stanley Co., Inc. | SEK | 595,778 | USD | 72,815 | 09/21/16 | 70,664 | (2,151 | ) | ||||||||||||
| USD | 600,807 | CAD | 786,105 | 09/21/16 | 608,560 | (7,753 | ) | |||||||||||||
| USD | 257,691 | EUR | 233,000 | 09/21/16 | 259,329 | (1,638 | ) | |||||||||||||
| USD | 34,272 | NZD | 50,617 | 09/21/16 | 35,995 | (1,723 | ) | |||||||||||||
| Standard Chartered Bank | CAD | 110,794 | USD | 86,000 | 09/21/16 | 85,771 | (229 | ) | ||||||||||||
| EUR | 225,000 | USD | 257,546 | 09/21/16 | 250,424 | (7,122 | ) | |||||||||||||
| USD | 252,053 | AUD | 340,864 | 09/21/16 | 253,482 | (1,429 | ) | |||||||||||||
| USD | 615,646 | CAD | 804,684 | 09/21/16 | 622,942 | (7,296 | ) | |||||||||||||
| USD | 513,854 | NZD | 754,251 | 09/21/16 | 536,365 | (22,511 | ) | |||||||||||||
| USD | 64,031 | TWD | 2,070,119 | 07/07/16 | 64,223 | (192 | ) | |||||||||||||
| 30 | The accompanying notes are an integral part of these financial statements. |
GOLDMAN SACHS VARIABLE INSURANCE TRUST CORE FIXED INCOME FUND
ADDITIONAL INVESTMENT INFORMATION (continued)
FORWARD FOREIGN CURRENCY EXCHANGE CONTRACTS WITH UNREALIZED LOSS (continued)
| Counterparty | Currency Purchased | Currency Sold | Settlement Date | Current Value | Unrealized Loss | |||||||||||||||
| State Street Bank | AUD | 119,000 | NZD | 126,551 | 09/21/16 | $ | 88,494 | $ | (1,499 | ) | ||||||||||
| CAD | 190,716 | USD | 148,726 | 09/21/16 | 147,642 | (1,084 | ) | |||||||||||||
| EUR | 76,000 | CHF | 83,019 | 09/21/16 | 84,588 | (821 | ) | |||||||||||||
| EUR | 8,070 | SEK | 75,781 | 09/21/16 | 8,982 | (6 | ) | |||||||||||||
| EUR | 87,521 | USD | 98,006 | 09/21/16 | 97,411 | (595 | ) | |||||||||||||
| GBP | 299,534 | USD | 439,786 | 07/20/16 | 398,800 | (40,986 | ) | |||||||||||||
| GBP | 181,711 | USD | 251,413 | 09/21/16 | 242,089 | (9,324 | ) | |||||||||||||
| JPY | 8,765,636 | USD | 86,000 | 09/21/16 | 85,117 | (883 | ) | |||||||||||||
| NOK | 599,313 | USD | 72,629 | 09/21/16 | 71,602 | (1,027 | ) | |||||||||||||
| SEK | 4,871,099 | EUR | 526,234 | 09/21/16 | 577,747 | (7,949 | ) | |||||||||||||
| USD | 209,808 | JPY | 22,715,604 | 09/21/16 | 220,576 | (10,768 | ) | |||||||||||||
| USD | 69,227 | NZD | 98,613 | 09/21/16 | 70,126 | (899 | ) | |||||||||||||
| USD | 45,898 | SGD | 62,452 | 09/21/16 | 46,321 | (423 | ) | |||||||||||||
| Westpac Banking Corp. | AUD | 368,889 | NZD | 388,632 | 09/21/16 | 274,324 | (2,041 | ) | ||||||||||||
| EUR | 287,693 | USD | 326,306 | 07/13/16 | 319,355 | (6,951 | ) | |||||||||||||
| USD | 251,910 | AUD | 343,245 | 09/21/16 | 255,252 | (3,342 | ) | |||||||||||||
| USD | 99,556 | JPY | 10,391,269 | 08/10/16 | 100,742 | (1,186 | ) | |||||||||||||
| TOTAL | $ | (224,243 | ) | |||||||||||||||||
FORWARD SALES CONTRACTS — At June 30, 2016, the Fund had the following forward sales contracts:
| Description | Interest Rate | Maturity Date(a) | Settlement Date | Principal Amount | Value | |||||||||||||||
FHLMC (Proceeds Received: $1,047,344) | 3.500 | % | TBA-30yr | 07/15/45 | $ | (1,000,000 | ) | $ | (1,054,219 | ) | ||||||||||
| (a) | TBA (To Be Announced) Securities are sold on a forward commitment basis with an approximate principal amount and no defined maturity date. The actual principal and maturity date will be determined upon settlement when the specific mortgage pools are assigned. |
FUTURES CONTRACTS — At June 30, 2016, the Fund had the following futures contracts:
| Type | Number of Contracts Long (Short) | Expiration Date | Current Value | Unrealized Gain (Loss) | ||||||||||||
| U.S. Long Bonds | 8 | September 2016 | $ | 1,378,750 | $ | 79,918 | ||||||||||
| 2 Year U.S. Treasury Notes | 26 | September 2016 | 5,702,531 | 38,238 | ||||||||||||
| 5 Year U.S. Treasury Notes | 38 | September 2016 | 4,642,234 | 30,417 | ||||||||||||
| 10 Year Australian Government Bonds | 3 | September 2016 | 304,733 | 3,217 | ||||||||||||
10 Year U.S. Treasury Notes | 1 | September 2016 | 132,984 | (96 | ) | |||||||||||
| TOTAL | $ | 151,694 | ||||||||||||||
| The accompanying notes are an integral part of these financial statements. | 31 |
GOLDMAN SACHS VARIABLE INSURANCE TRUST CORE FIXED INCOME FUND
Schedule of Investments (continued)
June 30, 2016 (Unaudited)
ADDITIONAL INVESTMENT INFORMATION (continued)
SWAP CONTRACTS — At June 30, 2016, the Fund had the following swap contracts:
CENTRALLY CLEARED CREDIT DEFAULT SWAP CONTRACT
| Market Value | ||||||||||||||||||||||||
| Referenced Obligation | Notional Amount (000’s) | Rates Received (Paid) | Termination Date | Credit Spread on June 30, 2016 | Upfront Payments Made (Received) | Unrealized Gain (Loss) | ||||||||||||||||||
Protection Purchased: |
| |||||||||||||||||||||||
CDX North America Investment Grade Index | $ | 750 | (1.000 | )% | 06/20/21 | 0.783 | % | $ | (5,002 | ) | $ | (2,947 | ) | |||||||||||
CENTRALLY CLEARED INTEREST RATE SWAP CONTRACTS
| Rates Exchanged | Market Value | |||||||||||||||||
| Notional Amount (000’s) | Termination Date | Payments Received | Payments Made | Upfront Payments Made (Received) | Unrealized Gain (Loss) | |||||||||||||
| SEK | 9,470 | 06/15/18 | 0.050% | 3 Month STIBOR | $ | 9,115 | $ | 1,938 | ||||||||||
| EUR | 3,850 | (a) | 09/21/18 | 3 Month EURIBOR | 0.375% | 740 | 648 | |||||||||||
| 4,710 | (a) | 09/21/18 | 3 Month EURIBOR | 0.400 | 3,817 | 485 | ||||||||||||
| GBP | 1,440 | (a) | 09/21/18 | 0.400 | 3 Month LIBOR | 10 | 1,195 | |||||||||||
| 1,660 | (a) | 09/21/18 | 0.464 | 3 Month LIBOR | 1,522 | 4,176 | ||||||||||||
| CAD | 6,190 | (a) | 09/21/21 | 1.500 | 3 Month BA | 94,050 | 40,761 | |||||||||||
| EUR | 1,100 | (a) | 09/21/21 | 6 Month EURIBOR | 0.500 | (33,250 | ) | (1,228 | ) | |||||||||
| GBP | 350 | (a) | 09/21/21 | 1.750 | 6 Month LIBOR | 25,066 | 393 | |||||||||||
| SEK | 1,890 | (a) | 09/21/21 | 3 Month STIBOR | 0.250 | 242 | (2,465 | ) | ||||||||||
| $ | 4,520 | (a) | 09/21/21 | 3 Month LIBOR | 2.000 | (172,690 | ) | (45,117 | ) | |||||||||
| EUR | 1,800 | (a) | 05/25/25 | 0.863 | 6 Month EURIBOR | 5,336 | 13,118 | |||||||||||
| 1,210 | (a) | 06/16/26 | 1.000 | 6 Month EURIBOR | 2,251 | 3,650 | ||||||||||||
| AUD | 930 | (a) | 09/21/26 | 2.500 | 6 Month BBR | 6,159 | 13,153 | |||||||||||
| EUR | 1,710 | (a) | 09/21/26 | 1.000 | 6 Month EURIBOR | 80,731 | 23,555 | |||||||||||
| SEK | 3,590 | (a) | 09/21/26 | 3 Month STIBOR | 1.000 | 2,531 | (10,977 | ) | ||||||||||
| $ | 1,110 | (a) | 09/21/26 | 3 Month LIBOR | 2.250 | (72,491 | ) | (17,060 | ) | |||||||||
| JPY | 49,710 | (a) | 03/30/36 | 6 Month LIBOR | 0.900 | (5,090 | ) | (22,296 | ) | |||||||||
| 127,440 | (a) | 09/21/36 | 6 Month LIBOR | 0.500 | (36,764 | ) | (48,352 | ) | ||||||||||
| GBP | 350 | (a) | 06/15/46 | 6 Month LIBOR | 1.600 | (2,014 | ) | (18,037 | ) | |||||||||
| 30 | (a) | 09/21/46 | 6 Month LIBOR | 2.250 | (7,577 | ) | (3,311 | ) | ||||||||||
| $ | 230 | (a) | 09/21/46 | 2.750 | 3 Month LIBOR | 37,754 | 13,045 | |||||||||||
| TOTAL | $ | (60,552 | ) | $ | (52,726 | ) | ||||||||||||
| (a) | Represents forward starting interest rate swaps whose effective dates of commencement of accruals and cash flows occur subsequent to June 30, 2016. |
| 32 | The accompanying notes are an integral part of these financial statements. |
GOLDMAN SACHS VARIABLE INSURANCE TRUST EQUITY INDEX FUND
Schedule of Investments
June 30, 2016 (Unaudited)
| Shares | Description | Value | ||||||
| Common Stocks – 99.5% | ||||||||
| Automobiles & Components – 0.9% |
| ||||||
| 1,939 | BorgWarner, Inc. | $ | 57,239 | |||||
| 2,404 | Delphi Automotive PLC | 150,491 | ||||||
| 35,104 | Ford Motor Co. | 441,257 | ||||||
| 12,538 | General Motors Co. | 354,825 | ||||||
| 1,628 | Harley-Davidson, Inc. | 73,748 | ||||||
| 5,806 | Johnson Controls, Inc. | 256,974 | ||||||
| 2,362 | The Goodyear Tire & Rubber Co. | 60,609 | ||||||
|
| |||||||
| 1,395,143 | ||||||||
|
| |||||||
| Banks – 5.2% |
| ||||||
| 91,889 | Bank of America Corp. | 1,219,367 | ||||||
| 7,100 | BB&T Corp. | 252,831 | ||||||
| 26,182 | Citigroup, Inc. | 1,109,855 | ||||||
| 4,626 | Citizens Financial Group, Inc. | 92,428 | ||||||
| 1,626 | Comerica, Inc. | 66,877 | ||||||
| 7,036 | Fifth Third Bancorp | 123,763 | ||||||
| 7,198 | Huntington Bancshares, Inc. | 64,350 | ||||||
| 32,653 | JPMorgan Chase & Co. | 2,029,057 | ||||||
| 7,309 | KeyCorp | 80,765 | ||||||
| 1,425 | M&T Bank Corp. | 168,478 | ||||||
| 2,938 | People’s United Financial, Inc. | 43,071 | ||||||
| 11,502 | Regions Financial Corp. | 97,882 | ||||||
| 4,565 | SunTrust Banks, Inc. | 187,530 | ||||||
| 4,430 | The PNC Financial Services Group, Inc. | 360,558 | ||||||
| 14,578 | U.S. Bancorp | 587,931 | ||||||
| 41,303 | Wells Fargo & Co. | 1,954,871 | ||||||
| 1,886 | Zions Bancorporation | 47,395 | ||||||
|
| |||||||
| 8,487,009 | ||||||||
|
| |||||||
| Capital Goods – 7.4% |
| ||||||
| 5,424 | 3M Co. | 949,851 | ||||||
| 395 | Acuity Brands, Inc. | 97,944 | ||||||
| 908 | Allegion PLC | 63,042 | ||||||
| 2,057 | AMETEK, Inc. | 95,095 | ||||||
| 5,214 | Caterpillar, Inc. | 395,273 | ||||||
| 1,395 | Cummins, Inc. | 156,854 | ||||||
| 5,349 | Danaher Corp. | 540,249 | ||||||
| 2,637 | Deere & Co. | 213,702 | ||||||
| 1,405 | Dover Corp. | 97,395 | ||||||
| 4,068 | Eaton Corp. PLC | 242,982 | ||||||
| 5,735 | Emerson Electric Co. | 299,138 | ||||||
| 2,645 | Fastenal Co. | 117,411 | ||||||
| 1,146 | Flowserve Corp. | 51,765 | ||||||
| 1,224 | Fluor Corp. | 60,319 | ||||||
| 1,370 | Fortune Brands Home & Security, Inc. | 79,419 | ||||||
| 2,551 | General Dynamics Corp. | 355,201 | ||||||
| 82,132 | General Electric Co. | 2,585,515 | ||||||
| 6,793 | Honeywell International, Inc. | 790,162 | ||||||
| 2,869 | Illinois Tool Works, Inc. | 298,835 | ||||||
| 2,295 | Ingersoll-Rand PLC | 146,146 | ||||||
| 1,109 | Jacobs Engineering Group, Inc.* | 55,239 | ||||||
| 689 | L-3 Communications Holdings, Inc. | 101,069 | ||||||
| 2,341 | Lockheed Martin Corp. | 580,966 | ||||||
|
| |||||||
| Common Stocks – (continued) | ||||||||
| Capital Goods – (continued) |
| ||||||
| 3,036 | Masco Corp. | $ | 93,934 | |||||
| 1,615 | Northrop Grumman Corp. | 358,982 | ||||||
| 3,155 | PACCAR, Inc. | 163,650 | ||||||
| 1,193 | Parker-Hannifin Corp. | 128,904 | ||||||
| 1,574 | Pentair PLC | 91,748 | ||||||
| 1,424 | Quanta Services, Inc.* | 32,923 | ||||||
| 2,634 | Raytheon Co. | 358,092 | ||||||
| 1,175 | Rockwell Automation, Inc. | 134,913 | ||||||
| 1,178 | Rockwell Collins, Inc. | 100,295 | ||||||
| 901 | Roper Technologies, Inc. | 153,675 | ||||||
| 513 | Snap-on, Inc. | 80,962 | ||||||
| 1,363 | Stanley Black & Decker, Inc. | 151,593 | ||||||
| 2,399 | Textron, Inc. | 87,707 | ||||||
| 5,329 | The Boeing Co. | 692,077 | ||||||
| 481 | TransDigm Group, Inc.* | 126,835 | ||||||
| 828 | United Rentals, Inc.* | 55,559 | ||||||
| 6,983 | United Technologies Corp. | 716,107 | ||||||
| 506 | W.W. Grainger, Inc. | 114,988 | ||||||
| 1,547 | Xylem, Inc. | 69,074 | ||||||
|
| |||||||
| 12,085,590 | ||||||||
|
| |||||||
| Commercial & Professional Services – 0.7% |
| ||||||
| 816 | Cintas Corp. | 80,074 | ||||||
| 1,054 | Equifax, Inc. | 135,334 | ||||||
| 3,238 | Nielsen Holdings PLC | 168,279 | ||||||
| 1,596 | Pitney Bowes, Inc. | 28,409 | ||||||
| 2,108 | Republic Services, Inc. | 108,162 | ||||||
| 1,137 | Robert Half International, Inc. | 43,388 | ||||||
| 790 | Stericycle, Inc.* | 82,255 | ||||||
| 341 | The Dun & Bradstreet Corp. | 41,547 | ||||||
| 3,794 | Tyco International PLC | 161,624 | ||||||
| 1,389 | Verisk Analytics, Inc.* | 112,620 | ||||||
| 3,749 | Waste Management, Inc. | 248,446 | ||||||
|
| |||||||
| 1,210,138 | ||||||||
|
| |||||||
| Consumer Durables & Apparel – 1.4% |
| ||||||
| 2,452 | Coach, Inc. | 99,894 | ||||||
| 3,005 | D.R. Horton, Inc. | 94,597 | ||||||
| 1,050 | Garmin Ltd. | 44,541 | ||||||
| 3,283 | Hanesbrands, Inc. | 82,502 | ||||||
| 676 | Harman International Industries, Inc. | 48,550 | ||||||
| 1,011 | Hasbro, Inc. | 84,914 | ||||||
| 1,204 | Leggett & Platt, Inc. | 61,536 | ||||||
| 1,593 | Lennar Corp. Class A | 73,437 | ||||||
| 3,016 | Mattel, Inc. | 94,371 | ||||||
| 1,528 | Michael Kors Holdings Ltd.* | 75,605 | ||||||
| 585 | Mohawk Industries, Inc.* | 111,010 | ||||||
| 4,148 | Newell Brands, Inc. | 201,468 | ||||||
| 11,859 | NIKE, Inc. Class B | 654,617 | ||||||
| 2,750 | PulteGroup, Inc. | 53,598 | ||||||
| 737 | PVH Corp. | 69,448 | ||||||
| 549 | Ralph Lauren Corp. | 49,201 | ||||||
| 1,605 | Under Armour, Inc. Class A* | 64,409 | ||||||
| 1,616 | Under Armour, Inc. Class C* | 58,837 | ||||||
|
| |||||||
| The accompanying notes are an integral part of these financial statements. | 33 |
GOLDMAN SACHS VARIABLE INSURANCE TRUST EQUITY INDEX FUND
Schedule of Investments (continued)
June 30, 2016 (Unaudited)
| Shares | Description | Value | ||||||
| Common Stocks – (continued) | ||||||||
| Consumer Durables & Apparel – (continued) |
| ||||||
| 2,945 | VF Corp. | $ | 181,088 | |||||
| 699 | Whirlpool Corp. | 116,481 | ||||||
|
| |||||||
| 2,320,104 | ||||||||
|
| |||||||
| Consumer Services – 1.7% |
| ||||||
| 3,870 | Carnival Corp. | 171,054 | ||||||
| 255 | Chipotle Mexican Grill, Inc.* | 102,704 | ||||||
| 1,000 | Darden Restaurants, Inc. | 63,340 | ||||||
| 2,181 | H&R Block, Inc. | 50,163 | ||||||
| 1,666 | Marriott International, Inc. Class A | 110,722 | ||||||
| 7,829 | McDonald’s Corp. | 942,142 | ||||||
| 1,515 | Royal Caribbean Cruises Ltd. | 101,732 | ||||||
| 13,087 | Starbucks Corp. | 747,530 | ||||||
| 1,512 | Starwood Hotels & Resorts Worldwide, Inc. | 111,812 | ||||||
| 985 | Wyndham Worldwide Corp. | 70,162 | ||||||
| 716 | Wynn Resorts Ltd. | 64,898 | ||||||
| 3,633 | Yum! Brands, Inc. | 301,248 | ||||||
|
| |||||||
| 2,837,507 | ||||||||
|
| |||||||
| Diversified Financials – 4.6% |
| ||||||
| 502 | Affiliated Managers Group, Inc.* | 70,667 | ||||||
| 7,188 | American Express Co. | 436,743 | ||||||
| 1,456 | Ameriprise Financial, Inc. | 130,822 | ||||||
| 16,753 | Berkshire Hathaway, Inc. Class B* | 2,425,667 | ||||||
| 1,116 | BlackRock, Inc. | 382,263 | ||||||
| 4,553 | Capital One Financial Corp. | 289,161 | ||||||
| 3,064 | CME Group, Inc. | 298,434 | ||||||
| 3,753 | Discover Financial Services | 201,123 | ||||||
| 2,444 | E*TRADE Financial Corp.* | 57,410 | ||||||
| 3,395 | Franklin Resources, Inc. | 113,291 | ||||||
| 1,039 | Intercontinental Exchange, Inc. | 265,942 | ||||||
| 3,701 | Invesco Ltd. | 94,524 | ||||||
| 979 | Legg Mason, Inc. | 28,871 | ||||||
| 2,947 | Leucadia National Corp. | 51,071 | ||||||
| 1,510 | Moody’s Corp. | 141,502 | ||||||
| 13,412 | Morgan Stanley | 348,444 | ||||||
| 993 | Nasdaq, Inc. | 64,217 | ||||||
| 3,037 | Navient Corp. | 36,292 | ||||||
| 1,893 | Northern Trust Corp. | 125,430 | ||||||
| 2,392 | S&P Global, Inc. | 256,566 | ||||||
| 3,602 | State Street Corp. | 194,220 | ||||||
| 7,479 | Synchrony Financial* | 189,069 | ||||||
| 2,221 | T. Rowe Price Group, Inc. | 162,066 | ||||||
| 9,599 | The Bank of New York Mellon Corp. | 372,921 | ||||||
| 10,832 | The Charles Schwab Corp. | 274,158 | ||||||
| 3,446 | The Goldman Sachs Group, Inc.(a) | 512,007 | ||||||
|
| |||||||
| 7,522,881 | ||||||||
|
| |||||||
| Energy – 7.4% |
| ||||||
| 4,577 | Anadarko Petroleum Corp. | 243,725 | ||||||
| 3,395 | Apache Corp. | 189,000 | ||||||
| 3,950 | Baker Hughes, Inc. | 178,264 | ||||||
| 3,946 | Cabot Oil & Gas Corp. | 101,570 | ||||||
|
| |||||||
| Common Stocks – (continued) | ||||||||
| Energy – (continued) |
| ||||||
| 5,166 | Chesapeake Energy Corp.* | $ | 22,111 | |||||
| 16,853 | Chevron Corp. | 1,766,700 | ||||||
| 867 | Cimarex Energy Co. | 103,450 | ||||||
| 3,590 | Columbia Pipeline Group, Inc. | 91,509 | ||||||
| 1,139 | Concho Resources, Inc.* | 135,849 | ||||||
| 11,134 | ConocoPhillips | 485,442 | ||||||
| 4,511 | Devon Energy Corp. | 163,524 | ||||||
| 511 | Diamond Offshore Drilling, Inc. | 12,433 | ||||||
| 4,907 | EOG Resources, Inc. | 409,342 | ||||||
| 1,437 | EQT Corp. | 111,267 | ||||||
| 37,045 | Exxon Mobil Corp. | 3,472,598 | ||||||
| 2,016 | FMC Technologies, Inc.* | 53,767 | ||||||
| 7,714 | Halliburton Co. | 349,367 | ||||||
| 979 | Helmerich & Payne, Inc. | 65,720 | ||||||
| 2,310 | Hess Corp. | 138,831 | ||||||
| 16,435 | Kinder Morgan, Inc. | 307,663 | ||||||
| 7,610 | Marathon Oil Corp. | 114,226 | ||||||
| 4,746 | Marathon Petroleum Corp. | 180,158 | ||||||
| 1,464 | Murphy Oil Corp. | 46,482 | ||||||
| 3,419 | National Oilwell Varco, Inc. | 115,049 | ||||||
| 1,766 | Newfield Exploration Co.* | 78,022 | ||||||
| 3,761 | Noble Energy, Inc. | 134,907 | ||||||
| 6,848 | Occidental Petroleum Corp. | 517,435 | ||||||
| 1,828 | ONEOK, Inc. | 86,739 | ||||||
| 4,147 | Phillips 66 | 329,023 | ||||||
| 1,468 | Pioneer Natural Resources Co. | 221,976 | ||||||
| 1,521 | Range Resources Corp. | 65,616 | ||||||
| 12,449 | Schlumberger Ltd. | 984,467 | ||||||
| 3,328 | Southwestern Energy Co.* | 41,866 | ||||||
| 5,940 | Spectra Energy Corp. | 217,582 | ||||||
| 1,055 | Tesoro Corp. | 79,041 | ||||||
| 6,061 | The Williams Companies, Inc. | 131,099 | ||||||
| 3,110 | Transocean Ltd. | 36,978 | ||||||
| 4,170 | Valero Energy Corp. | 212,670 | ||||||
|
| |||||||
| 11,995,468 | ||||||||
|
| |||||||
| Food & Staples Retailing – 2.3% |
| ||||||
| 3,896 | Costco Wholesale Corp. | 611,828 | ||||||
| 9,577 | CVS Health Corp. | 916,902 | ||||||
| 4,760 | Sysco Corp. | 241,523 | ||||||
| 8,459 | The Kroger Co. | 311,207 | ||||||
| 7,742 | Walgreens Boots Alliance, Inc. | 644,676 | ||||||
| 13,619 | Wal-Mart Stores, Inc. | 994,459 | ||||||
| 2,901 | Whole Foods Market, Inc. | 92,890 | ||||||
|
| |||||||
| 3,813,485 | ||||||||
|
| |||||||
| Food, Beverage & Tobacco – 6.0% |
| ||||||
| 17,454 | Altria Group, Inc. | 1,203,628 | ||||||
| 5,189 | Archer-Daniels-Midland Co. | 222,556 | ||||||
| 930 | Brown-Forman Corp. Class B | 92,777 | ||||||
| 1,622 | Campbell Soup Co. | 107,912 | ||||||
| 3,952 | ConAgra Foods, Inc. | 188,945 | ||||||
| 1,579 | Constellation Brands, Inc. Class A | 261,167 | ||||||
| 1,693 | Dr. Pepper Snapple Group, Inc. | 163,594 | ||||||
|
| |||||||
| 34 | The accompanying notes are an integral part of these financial statements. |
GOLDMAN SACHS VARIABLE INSURANCE TRUST EQUITY INDEX FUND
| Shares | Description | Value | ||||||
| Common Stocks – (continued) | ||||||||
| Food, Beverage & Tobacco – (continued) |
| ||||||
| 5,294 | General Mills, Inc. | $ | 377,568 | |||||
| 2,352 | Hormel Foods Corp. | 86,083 | ||||||
| 2,263 | Kellogg Co. | 184,774 | ||||||
| 1,042 | McCormick & Co., Inc. | 111,150 | ||||||
| 1,693 | Mead Johnson Nutrition Co. | 153,640 | ||||||
| 1,484 | Molson Coors Brewing Co. Class B | 150,077 | ||||||
| 13,857 | Mondelez International, Inc. Class A | 630,632 | ||||||
| 1,261 | Monster Beverage Corp.* | 202,655 | ||||||
| 12,890 | PepsiCo, Inc. | 1,365,567 | ||||||
| 13,861 | Philip Morris International, Inc. | 1,409,941 | ||||||
| 7,407 | Reynolds American, Inc. | 399,459 | ||||||
| 34,823 | The Coca-Cola Co. | 1,578,526 | ||||||
| 1,232 | The Hershey Co. | 139,820 | ||||||
| 1,075 | The J.M. Smucker Co. | 163,841 | ||||||
| 5,315 | The Kraft Heinz Co. | 470,271 | ||||||
| 2,616 | Tyson Foods, Inc. Class A | 174,723 | ||||||
|
| |||||||
| 9,839,306 | ||||||||
|
| |||||||
| Health Care Equipment & Services – 5.3% |
| ||||||
| 13,207 | Abbott Laboratories | 519,167 | ||||||
| 3,109 | Aetna, Inc. | 379,702 | ||||||
| 1,683 | AmerisourceBergen Corp. | 133,495 | ||||||
| 2,337 | Anthem, Inc. | 306,942 | ||||||
| 4,818 | Baxter International, Inc. | 217,870 | ||||||
| 1,884 | Becton, Dickinson and Co. | 319,507 | ||||||
| 11,961 | Boston Scientific Corp.* | 279,529 | ||||||
| 672 | C. R. Bard, Inc. | 158,027 | ||||||
| 2,878 | Cardinal Health, Inc. | 224,513 | ||||||
| 1,556 | Centene Corp.* | 111,052 | ||||||
| 2,704 | Cerner Corp.* | 158,454 | ||||||
| 2,277 | Cigna Corp. | 291,433 | ||||||
| 1,426 | DaVita HealthCare Partners, Inc.* | 110,258 | ||||||
| 2,123 | Denstply Sirona, Inc. | 131,711 | ||||||
| 1,925 | Edwards Lifesciences Corp.* | 191,980 | ||||||
| 5,638 | Express Scripts Holding Co.* | 427,360 | ||||||
| 2,661 | HCA Holdings, Inc.* | 204,924 | ||||||
| 732 | Henry Schein, Inc.* | 129,418 | ||||||
| 2,261 | Hologic, Inc.* | 78,231 | ||||||
| 1,328 | Humana, Inc. | 238,881 | ||||||
| 335 | Intuitive Surgical, Inc.* | 221,572 | ||||||
| 931 | Laboratory Corp. of America Holdings* | 121,281 | ||||||
| 1,998 | McKesson Corp. | 372,927 | ||||||
| 12,557 | Medtronic PLC | 1,089,571 | ||||||
| 779 | Patterson Companies, Inc. | 37,306 | ||||||
| 1,287 | Quest Diagnostics, Inc. | 104,775 | ||||||
| 2,523 | St. Jude Medical, Inc. | 196,794 | ||||||
| 2,834 | Stryker Corp. | 339,598 | ||||||
| 8,473 | UnitedHealth Group, Inc. | 1,196,388 | ||||||
| 827 | Universal Health Services, Inc. Class B | 110,901 | ||||||
| 840 | Varian Medical Systems, Inc.* | 69,073 | ||||||
| 1,592 | Zimmer Biomet Holdings, Inc. | 191,645 | ||||||
|
| |||||||
| 8,664,285 | ||||||||
|
| |||||||
| Common Stocks – (continued) | ||||||||
| Household & Personal Products – 2.1% |
| ||||||
| 1,151 | Church & Dwight Co., Inc. | $ | 118,426 | |||||
| 8,007 | Colgate-Palmolive Co. | 586,112 | ||||||
| 3,215 | Kimberly-Clark Corp. | 441,998 | ||||||
| 1,141 | The Clorox Co. | 157,903 | ||||||
| 1,973 | The Estee Lauder Companies, Inc. Class A | 179,583 | ||||||
| 23,782 | The Procter & Gamble Co. | 2,013,622 | ||||||
|
| |||||||
| 3,497,644 | ||||||||
|
| |||||||
| Insurance – 2.7% |
| ||||||
| 3,724 | Aflac, Inc. | 268,724 | ||||||
| 9,986 | American International Group, Inc. | 528,160 | ||||||
| 2,398 | Aon PLC | 261,934 | ||||||
| 1,588 | Arthur J. Gallagher & Co. | 75,589 | ||||||
| 552 | Assurant, Inc. | 47,643 | ||||||
| 4,118 | Chubb Ltd. | 538,264 | ||||||
| 1,311 | Cincinnati Financial Corp. | 98,181 | ||||||
| 2,149 | Lincoln National Corp. | 83,317 | ||||||
| 2,394 | Loews Corp. | 98,369 | ||||||
| 4,642 | Marsh & McLennan Companies, Inc. | 317,791 | ||||||
| 9,803 | MetLife, Inc. | 390,453 | ||||||
| 2,428 | Principal Financial Group, Inc. | 99,815 | ||||||
| 3,960 | Prudential Financial, Inc. | 282,506 | ||||||
| 3,350 | The Allstate Corp. | 234,332 | ||||||
| 3,581 | The Hartford Financial Services Group, Inc. | 158,925 | ||||||
| 5,283 | The Progressive Corp. | 176,980 | ||||||
| 2,630 | The Travelers Companies, Inc. | 313,075 | ||||||
| 990 | Torchmark Corp. | 61,202 | ||||||
| 2,076 | Unum Group | 65,996 | ||||||
| 1,235 | Willis Towers Watson PLC | 153,523 | ||||||
| 2,664 | XL Group PLC | 88,738 | ||||||
|
| |||||||
| 4,343,517 | ||||||||
|
| |||||||
| Materials – 2.9% |
| ||||||
| 1,757 | Air Products & Chemicals, Inc. | 249,564 | ||||||
| 1,002 | Albemarle Corp. | 79,469 | ||||||
| 11,842 | Alcoa, Inc. | 109,775 | ||||||
| 832 | Avery Dennison Corp. | 62,192 | ||||||
| 1,238 | Ball Corp. | 89,495 | ||||||
| 2,053 | CF Industries Holdings, Inc. | 49,477 | ||||||
| 7,798 | E.I. du Pont de Nemours & Co. | 505,311 | ||||||
| 1,292 | Eastman Chemical Co. | 87,727 | ||||||
| 2,340 | Ecolab, Inc. | 277,524 | ||||||
| 1,149 | FMC Corp. | 53,210 | ||||||
| 10,104 | Freeport-McMoRan, Inc. | 112,559 | ||||||
| 707 | International Flavors & Fragrances, Inc. | 89,132 | ||||||
| 3,647 | International Paper Co. | 154,560 | ||||||
| 3,074 | LyondellBasell Industries NV Class A | 228,767 | ||||||
| 570 | Martin Marietta Materials, Inc. | 109,440 | ||||||
| 3,878 | Monsanto Co. | 401,024 | ||||||
| 4,774 | Newmont Mining Corp. | 186,759 | ||||||
| 2,878 | Nucor Corp. | 142,202 | ||||||
|
| |||||||
| The accompanying notes are an integral part of these financial statements. | 35 |
GOLDMAN SACHS VARIABLE INSURANCE TRUST EQUITY INDEX FUND
Schedule of Investments (continued)
June 30, 2016 (Unaudited)
| Shares | Description | Value | ||||||
| Common Stocks – (continued) | ||||||||
| Materials – (continued) |
| ||||||
| 1,570 | Owens-Illinois, Inc.* | $ | 28,276 | |||||
| 2,395 | PPG Industries, Inc. | 249,439 | ||||||
| 2,574 | Praxair, Inc. | 289,292 | ||||||
| 1,755 | Sealed Air Corp. | 80,677 | ||||||
| 10,016 | The Dow Chemical Co. | 497,895 | ||||||
| 3,030 | The Mosaic Co. | 79,325 | ||||||
| 710 | The Sherwin-Williams Co. | 208,506 | ||||||
| 1,176 | Vulcan Materials Co. | 141,543 | ||||||
| 2,329 | WestRock Co. | 90,528 | ||||||
|
| |||||||
| 4,653,668 | ||||||||
|
| |||||||
| Media – 2.7% |
| ||||||
| 3,668 | CBS Corp. Class B | 199,686 | ||||||
| 21,633 | Comcast Corp. Class A | 1,410,255 | ||||||
| 1,393 | Discovery Communications, Inc. Class A* | 35,145 | ||||||
| 2,095 | Discovery Communications, Inc. Class C* | 49,966 | ||||||
| 3,602 | News Corp. Class A | 40,883 | ||||||
| 1,017 | News Corp. Class B | 11,868 | ||||||
| 2,165 | Omnicom Group, Inc. | 176,426 | ||||||
| 820 | Scripps Networks Interactive, Inc. Class A | 51,061 | ||||||
| 2,048 | TEGNA, Inc. | 47,452 | ||||||
| 3,557 | The Interpublic Group of Companies, Inc. | 82,167 | ||||||
| 13,355 | The Walt Disney Co. | 1,306,386 | ||||||
| 7,070 | Time Warner, Inc. | 519,928 | ||||||
| 9,712 | Twenty-First Century Fox, Inc. Class A | 262,710 | ||||||
| 3,835 | Twenty-First Century Fox, Inc. Class B | 104,504 | ||||||
| 3,091 | Viacom, Inc. Class B | 128,184 | ||||||
|
| |||||||
| 4,426,621 | ||||||||
|
| |||||||
| Pharmaceuticals, Biotechnology & Life Sciences – 9.3% |
| ||||||
| 14,423 | AbbVie, Inc. | 892,928 | ||||||
| 2,884 | Agilent Technologies, Inc. | 127,934 | ||||||
| 1,980 | Alexion Pharmaceuticals, Inc.* | 231,185 | ||||||
| 3,527 | Allergan PLC* | 815,054 | ||||||
| 6,692 | Amgen, Inc. | 1,018,188 | ||||||
| 1,949 | Biogen, Inc.* | 471,307 | ||||||
| 14,873 | Bristol-Myers Squibb Co. | 1,093,909 | ||||||
| 6,919 | Celgene Corp.* | 682,421 | ||||||
| 8,691 | Eli Lilly & Co. | 684,416 | ||||||
| 1,928 | Endo International PLC* | 30,058 | ||||||
| 11,878 | Gilead Sciences, Inc. | 990,863 | ||||||
| 1,325 | Illumina, Inc.* | 186,003 | ||||||
| 24,570 | Johnson & Johnson | 2,980,341 | ||||||
| 972 | Mallinckrodt PLC* | 59,078 | ||||||
| 24,704 | Merck & Co., Inc. | 1,423,197 | ||||||
| 3,693 | Mylan NV* | 159,685 | ||||||
| 950 | PerkinElmer, Inc. | 49,799 | ||||||
| 1,253 | Perrigo Co. PLC | 113,610 | ||||||
| 54,222 | Pfizer, Inc. | 1,909,157 | ||||||
| 707 | Regeneron Pharmaceuticals, Inc.* | 246,906 | ||||||
|
| |||||||
| Common Stocks – (continued) | ||||||||
| Pharmaceuticals, Biotechnology & Life Sciences – (continued) |
| ||||||
| 3,498 | Thermo Fisher Scientific, Inc. | $ | 516,864 | |||||
| 2,228 | Vertex Pharmaceuticals, Inc.* | 191,653 | ||||||
| 724 | Waters Corp.* | 101,831 | ||||||
| 4,119 | Zoetis, Inc. | 195,488 | ||||||
|
| |||||||
| 15,171,875 | ||||||||
|
| |||||||
| Real Estate – 3.3% |
| ||||||
| 3,795 | American Tower Corp. (REIT) | 431,150 | ||||||
| 1,402 | Apartment Investment & Management Co. Class A (REIT) | 61,912 | ||||||
| 1,235 | AvalonBay Communities, Inc. (REIT) | 222,782 | ||||||
| 1,377 | Boston Properties, Inc. (REIT) | 181,626 | ||||||
| 2,716 | CBRE Group, Inc. Class A* | 71,920 | ||||||
| 2,994 | Crown Castle International Corp. (REIT) | 303,681 | ||||||
| 1,314 | Digital Realty Trust, Inc. (REIT) | 143,213 | ||||||
| 617 | Equinix, Inc. (REIT) | 239,229 | ||||||
| 3,311 | Equity Residential (REIT) | 228,062 | ||||||
| 591 | Essex Property Trust, Inc. (REIT) | 134,801 | ||||||
| 1,151 | Extra Space Storage, Inc. (REIT) | 106,514 | ||||||
| 645 | Federal Realty Investment Trust (REIT) | 106,780 | ||||||
| 5,262 | General Growth Properties, Inc. (REIT) | 156,913 | ||||||
| 4,116 | HCP, Inc. (REIT) | 145,624 | ||||||
| 6,529 | Host Hotels & Resorts, Inc. (REIT) | 105,835 | ||||||
| 1,685 | Iron Mountain, Inc. (REIT) | 67,114 | ||||||
| 3,688 | Kimco Realty Corp. (REIT) | 115,729 | ||||||
| 4,664 | Prologis, Inc. (REIT) | 228,723 | ||||||
| 1,317 | Public Storage (REIT) | 336,612 | ||||||
| 2,269 | Realty Income Corp. (REIT) | 157,378 | ||||||
| 2,775 | Simon Property Group, Inc. (REIT) | 601,898 | ||||||
| 888 | SL Green Realty Corp. (REIT) | 94,545 | ||||||
| 1,132 | The Macerich Co. (REIT) | 96,661 | ||||||
| 2,406 | UDR, Inc. (REIT) | 88,830 | ||||||
| 2,988 | Ventas, Inc. (REIT) | 217,586 | ||||||
| 1,602 | Vornado Realty Trust (REIT) | 160,392 | ||||||
| 3,164 | Welltower, Inc. (REIT) | 241,002 | ||||||
| 6,629 | Weyerhaeuser Co. (REIT) | 197,345 | ||||||
|
| |||||||
| 5,243,857 | ||||||||
|
| |||||||
| Retailing – 5.5% |
| ||||||
| 645 | Advance Auto Parts, Inc. | 104,251 | ||||||
| 3,452 | Amazon.com, Inc.* | 2,470,320 | ||||||
| 696 | AutoNation, Inc.* | 32,698 | ||||||
| 271 | AutoZone, Inc.* | 215,131 | ||||||
| 1,471 | Bed Bath & Beyond, Inc. | 63,577 | ||||||
| 2,511 | Best Buy Co., Inc. | 76,837 | ||||||
| 1,795 | CarMax, Inc.* | 88,009 | ||||||
| 2,510 | Dollar General Corp. | 235,940 | ||||||
| 2,081 | Dollar Tree, Inc.* | 196,113 | ||||||
| 1,069 | Expedia, Inc. | 113,635 | ||||||
| 1,254 | Foot Locker, Inc. | 68,794 | ||||||
| 1,334 | Genuine Parts Co. | 135,067 | ||||||
| 1,730 | Kohl’s Corp. | 65,602 | ||||||
|
| |||||||
| 36 | The accompanying notes are an integral part of these financial statements. |
GOLDMAN SACHS VARIABLE INSURANCE TRUST EQUITY INDEX FUND
| Shares | Description | Value | ||||||
| Common Stocks – (continued) | ||||||||
| Retailing – (continued) |
| ||||||
| 2,245 | L Brands, Inc. | $ | 150,707 | |||||
| 2,751 | LKQ Corp.* | 87,207 | ||||||
| 7,955 | Lowe’s Companies, Inc. | 629,797 | ||||||
| 2,799 | Macy’s, Inc. | 94,074 | ||||||
| 3,850 | Netflix, Inc.* | 352,198 | ||||||
| 1,218 | Nordstrom, Inc. | 46,345 | ||||||
| 874 | O’Reilly Automotive, Inc.* | 236,941 | ||||||
| 3,624 | Ross Stores, Inc. | 205,445 | ||||||
| 734 | Signet Jewelers Ltd. | 60,489 | ||||||
| 5,583 | Staples, Inc. | 48,125 | ||||||
| 5,290 | Target Corp. | 369,348 | ||||||
| 2,030 | The Gap, Inc. | 43,077 | ||||||
| 11,103 | The Home Depot, Inc. | 1,417,742 | ||||||
| 445 | The Priceline Group, Inc.* | 555,542 | ||||||
| 5,878 | The TJX Companies, Inc. | 453,958 | ||||||
| 1,026 | Tiffany & Co. | 62,217 | ||||||
| 1,191 | Tractor Supply Co. | 108,595 | ||||||
| 984 | TripAdvisor, Inc.* | 63,271 | ||||||
| 548 | Ulta Salon, Cosmetics & Fragrance, Inc.* | 133,515 | ||||||
| 679 | Urban Outfitters, Inc.* | 18,673 | ||||||
|
| |||||||
| 9,003,240 | ||||||||
|
| |||||||
| Semiconductors & Semiconductor Equipment – 2.8% |
| ||||||
| 2,702 | Analog Devices, Inc. | 153,041 | ||||||
| 9,661 | Applied Materials, Inc. | 231,574 | ||||||
| 3,316 | Broadcom Ltd. | 515,306 | ||||||
| 668 | First Solar, Inc.* | 32,385 | ||||||
| 42,259 | Intel Corp. | 1,386,095 | ||||||
| 1,416 | KLA-Tencor Corp. | 103,722 | ||||||
| 1,418 | Lam Research Corp. | 119,197 | ||||||
| 2,169 | Linear Technology Corp. | 100,924 | ||||||
| 1,811 | Microchip Technology, Inc. | 91,926 | ||||||
| 9,294 | Micron Technology, Inc.* | 127,885 | ||||||
| 4,608 | NVIDIA Corp. | 216,622 | ||||||
| 1,119 | Qorvo, Inc.* | 61,836 | ||||||
| 13,121 | QUALCOMM, Inc. | 702,892 | ||||||
| 1,702 | Skyworks Solutions, Inc. | 107,703 | ||||||
| 8,958 | Texas Instruments, Inc. | 561,219 | ||||||
| 2,343 | Xilinx, Inc. | 108,083 | ||||||
|
| |||||||
| 4,620,410 | ||||||||
|
| |||||||
| Software & Services – 11.9% |
| ||||||
| 5,550 | Accenture PLC Class A | 628,760 | ||||||
| 4,488 | Activision Blizzard, Inc. | 177,859 | ||||||
| 4,485 | Adobe Systems, Inc.* | 429,618 | ||||||
| 1,569 | Akamai Technologies, Inc.* | 87,754 | ||||||
| 532 | Alliance Data Systems Corp.* | 104,229 | ||||||
| 2,623 | Alphabet, Inc. Class A* | 1,845,359 | ||||||
| 2,634 | Alphabet, Inc. Class C* | 1,822,991 | ||||||
| 2,033 | Autodesk, Inc.* | 110,067 | ||||||
| 4,093 | Automatic Data Processing, Inc. | 376,024 | ||||||
| 2,659 | CA, Inc. | 87,295 | ||||||
| 1,412 | Citrix Systems, Inc.* | 113,087 | ||||||
|
| |||||||
| Common Stocks – (continued) | ||||||||
| Software & Services – (continued) |
| ||||||
| 5,411 | Cognizant Technology Solutions Corp. Class A* | $ | 309,726 | |||||
| 1,321 | CSRA, Inc. | 30,951 | ||||||
| 9,339 | eBay, Inc.* | 218,626 | ||||||
| 2,664 | Electronic Arts, Inc.* | 201,825 | ||||||
| 20,647 | Facebook, Inc. Class A* | 2,359,539 | ||||||
| 2,469 | Fidelity National Information Services, Inc. | 181,916 | ||||||
| 2,022 | Fiserv, Inc.* | 219,852 | ||||||
| 1,352 | Global Payments, Inc. | 96,506 | ||||||
| 7,880 | International Business Machines Corp. | 1,196,026 | ||||||
| 2,279 | Intuit, Inc. | 254,359 | ||||||
| 8,676 | MasterCard, Inc. Class A | 764,009 | ||||||
| 70,226 | Microsoft Corp. | 3,593,464 | ||||||
| 27,835 | Oracle Corp. | 1,139,287 | ||||||
| 2,881 | Paychex, Inc. | 171,420 | ||||||
| 9,895 | PayPal Holdings, Inc.* | 361,266 | ||||||
| 1,621 | Red Hat, Inc.* | 117,685 | ||||||
| 5,615 | salesforce.com, Inc.* | 445,887 | ||||||
| 5,432 | Symantec Corp. | 111,573 | ||||||
| 1,169 | Teradata Corp.* | 29,307 | ||||||
| 4,548 | The Western Union Co. | 87,231 | ||||||
| 1,482 | Total System Services, Inc. | 78,709 | ||||||
| 852 | VeriSign, Inc.* | 73,664 | ||||||
| 17,043 | Visa, Inc. Class A | 1,264,079 | ||||||
| 8,761 | Xerox Corp. | 83,142 | ||||||
| 7,730 | Yahoo!, Inc.* | 290,339 | ||||||
|
| |||||||
| 19,463,431 | ||||||||
|
| |||||||
| Technology Hardware & Equipment – 4.9% |
| ||||||
| 2,784 | Amphenol Corp. Class A | 159,607 | ||||||
| 48,944 | Apple, Inc. | 4,679,046 | ||||||
| 44,883 | Cisco Systems, Inc. | 1,287,693 | ||||||
| 9,519 | Corning, Inc. | 194,949 | ||||||
| 17,362 | EMC Corp. | 471,726 | ||||||
| 616 | F5 Networks, Inc.* | 70,126 | ||||||
| 1,314 | FLIR Systems, Inc. | 40,668 | ||||||
| 1,069 | Harris Corp. | 89,197 | ||||||
| 14,729 | Hewlett Packard Enterprise Co. | 269,099 | ||||||
| 15,110 | HP, Inc. | 189,631 | ||||||
| 3,102 | Juniper Networks, Inc. | 69,764 | ||||||
| 1,452 | Motorola Solutions, Inc. | 95,788 | ||||||
| 2,493 | NetApp, Inc. | 61,303 | ||||||
| 2,672 | Seagate Technology PLC | 65,090 | ||||||
| 3,165 | TE Connectivity Ltd. | 180,753 | ||||||
| 2,508 | Western Digital Corp. | 118,528 | ||||||
|
| |||||||
| 8,042,968 | ||||||||
|
| |||||||
| Telecommunication Services – 2.9% |
| ||||||
| 54,997 | AT&T, Inc. | 2,376,420 | ||||||
| 4,915 | CenturyLink, Inc. | 142,584 | ||||||
| 10,443 | Frontier Communications Corp. | 51,589 | ||||||
| 2,557 | Level 3 Communications, Inc.* | 131,660 | ||||||
|
| |||||||
| The accompanying notes are an integral part of these financial statements. | 37 |
GOLDMAN SACHS VARIABLE INSURANCE TRUST EQUITY INDEX FUND
Schedule of Investments (continued)
June 30, 2016 (Unaudited)
| Shares | Description | Value | ||||||
| Common Stocks – (continued) | ||||||||
| Telecommunication Services – (continued) |
| ||||||
| 36,355 | Verizon Communications, Inc. | $ | 2,030,063 | |||||
|
| |||||||
| 4,732,316 | ||||||||
|
| |||||||
| Transportation – 2.0% |
| ||||||
| 1,121 | Alaska Air Group, Inc. | 65,343 | ||||||
| 5,103 | American Airlines Group, Inc. | 144,466 | ||||||
| 1,254 | C.H. Robinson Worldwide, Inc. | 93,109 | ||||||
| 8,678 | CSX Corp. | 226,322 | ||||||
| 6,835 | Delta Air Lines, Inc. | 248,999 | ||||||
| 1,648 | Expeditors International of Washington, Inc. | 80,818 | ||||||
| 2,222 | FedEx Corp. | 337,255 | ||||||
| 810 | J.B. Hunt Transport Services, Inc. | 65,553 | ||||||
| 960 | Kansas City Southern | 86,486 | ||||||
| 2,616 | Norfolk Southern Corp. | 222,700 | ||||||
| 527 | Ryder System, Inc. | 32,221 | ||||||
| 5,793 | Southwest Airlines Co. | 227,144 | ||||||
| 7,482 | Union Pacific Corp. | 652,805 | ||||||
| 2,969 | United Continental Holdings, Inc.* | 121,848 | ||||||
| 6,193 | United Parcel Service, Inc. Class B | 667,110 | ||||||
|
| |||||||
| 3,272,179 | ||||||||
|
| |||||||
| Utilities – 3.6% |
| ||||||
| 5,945 | AES Corp. | 74,194 | ||||||
| 1,111 | AGL Resources, Inc. | 73,293 | ||||||
| 2,026 | Alliant Energy Corp. | 80,432 | ||||||
| 2,123 | Ameren Corp. | 113,750 | ||||||
| 4,437 | American Electric Power Co., Inc. | 310,989 | ||||||
| 1,568 | American Water Works Co., Inc. | 132,512 | ||||||
| 3,794 | CenterPoint Energy, Inc. | 91,056 | ||||||
| 2,425 | CMS Energy Corp. | 111,210 | ||||||
| 2,647 | Consolidated Edison, Inc. | 212,925 | ||||||
| 5,311 | Dominion Resources, Inc. | 413,886 | ||||||
| 1,618 | DTE Energy Co. | 160,376 | ||||||
| 6,169 | Duke Energy Corp. | 529,239 | ||||||
| 2,934 | Edison International | 227,884 | ||||||
| 1,625 | Entergy Corp. | 132,194 | ||||||
| 2,798 | Eversource Energy | 167,600 | ||||||
| 8,190 | Exelon Corp. | 297,788 | ||||||
| 3,809 | FirstEnergy Corp. | 132,972 | ||||||
| 4,128 | NextEra Energy, Inc. | 538,291 | ||||||
| 2,848 | NiSource, Inc. | 75,529 | ||||||
| 2,677 | NRG Energy, Inc. | 40,128 | ||||||
| 4,438 | PG&E Corp. | 283,677 | ||||||
|
| |||||||
| Common Stocks – (continued) | ||||||||
| Utilities – (continued) |
| ||||||
| 1,006 | Pinnacle West Capital Corp. | $ | 81,546 | |||||
| 6,005 | PPL Corp. | 226,689 | ||||||
| 4,561 | Public Service Enterprise Group, Inc. | 212,588 | ||||||
| 1,246 | SCANA Corp. | 94,272 | ||||||
| 2,114 | Sempra Energy | 241,038 | ||||||
| 2,104 | TECO Energy, Inc. | 58,155 | ||||||
| 8,158 | The Southern Co. | 437,514 | ||||||
| 2,852 | WEC Energy Group, Inc. | 186,236 | ||||||
| 4,554 | Xcel Energy, Inc. | 203,928 | ||||||
|
| |||||||
| 5,941,891 | ||||||||
|
| |||||||
| TOTAL COMMON STOCKS | ||||||||
| (Cost $77,834,462) | $ | 162,584,533 | ||||||
|
| |||||||
| Principal Amount | Interest Rate | Maturity Date | Value | |||||||||||
| U.S. Treasury Obligation – 0.1%(b)(c) | ||||||||||||||
| United States Treasury Bill |
| ||||||||||||
| $ | 100,000 | 0.000 | % | 09/08/16 | $ | 99,959 | ||||||||
| (Cost $99,904) | ||||||||||||||
|
| |||||||||||||
| TOTAL INVESTMENTS – 99.6% | ||||||||||||||
| (Cost $77,934,366) | $ | 162,684,492 | ||||||||||||
|
| |||||||||||||
| OTHER ASSETS IN EXCESS OF | | 693,648 | |||||||||||
|
| |||||||||||||
| NET ASSETS – 100.0% | $ | 163,378,140 | ||||||||||||
|
| |||||||||||||
| The percentage shown for each investment category reflects the value of investments in that category as a percentage of net assets. | ||
| * | Non-income producing security. | |
| (a) | Represents an affiliated issuer. | |
| (b) | Issued with a zero coupon. Income is recognized through the accretion of discount. | |
| (c) | All or a portion of security is segregated as collateral for initial margin requirements on futures transactions. | |
| Investment Abbreviation: | ||
| REIT | —Real Estate Investment Trust | |
| 38 | The accompanying notes are an integral part of these financial statements. |
GOLDMAN SACHS VARIABLE INSURANCE TRUST EQUITY INDEX FUND
ADDITIONAL INVESTMENT INFORMATION
FUTURES CONTRACTS — At June 30, 2016, the Fund had the following futures contracts:
| Type | Number of Contracts Long (Short) | Expiration Date | Current Value | Unrealized Gain (Loss) | ||||||||||
| S&P 500 E-Mini Index | 10 | September 2016 | $ | 1,045,100 | $ | 12,075 | ||||||||
| The accompanying notes are an integral part of these financial statements. | 39 |
GOLDMAN SACHS VARIABLE INSURANCE TRUST GROWTH OPPORTUNITIES FUND
Schedule of Investments
June 30, 2016 (Unaudited)
| Shares | Description | Value | ||||||
| Common Stocks – 96.5% | ||||||||
| Automobiles & Components – 0.3% |
| ||||||
| 17,180 | BorgWarner, Inc. | $ | 507,154 | |||||
|
| |||||||
| Banks – 2.1% |
| ||||||
| 40,080 | Eagle Bancorp, Inc.* | 1,928,249 | ||||||
| 24,283 | First Republic Bank | 1,699,567 | ||||||
|
| |||||||
| 3,627,816 | ||||||||
|
| |||||||
| Capital Goods – 13.3% |
| ||||||
| 64,189 | AMETEK, Inc. | 2,967,457 | ||||||
| 40,877 | Fortune Brands Home & Security, Inc. | 2,369,640 | ||||||
| 21,373 | Graco, Inc. | 1,688,253 | ||||||
| 14,001 | Hubbell, Inc. | 1,476,685 | ||||||
| 14,367 | Roper Technologies, Inc. | 2,450,436 | ||||||
| 70,859 | Sensata Technologies Holding NV* | 2,472,271 | ||||||
| 32,044 | The Middleby Corp.* | 3,693,071 | ||||||
| 9,030 | W.W. Grainger, Inc. | 2,052,067 | ||||||
| 75,052 | Xylem, Inc. | 3,351,072 | ||||||
|
| |||||||
| 22,520,952 | ||||||||
|
| |||||||
| Consumer Durables & Apparel – 4.3% |
| ||||||
| 114,449 | Kate Spade & Co.* | 2,358,794 | ||||||
| 54,175 | Newell Brands, Inc. | 2,631,279 | ||||||
| 11,243 | PVH Corp. | 1,059,428 | ||||||
| 29,475 | Under Armour, Inc. Class A* | 1,182,832 | ||||||
|
| |||||||
| 7,232,333 | ||||||||
|
| |||||||
| Consumer Services – 4.0% |
| ||||||
| 6,653 | Chipotle Mexican Grill, Inc.* | 2,679,562 | ||||||
| 19,022 | Panera Bread Co. Class A* | 4,031,523 | ||||||
|
| |||||||
| 6,711,085 | ||||||||
|
| |||||||
| Diversified Financials – 3.6% |
| ||||||
| 20,122 | Affiliated Managers Group, Inc.* | 2,832,574 | ||||||
| 12,654 | Intercontinental Exchange, Inc. | 3,238,918 | ||||||
|
| |||||||
| 6,071,492 | ||||||||
|
| |||||||
| Energy – 0.7% |
| ||||||
| 4,610 | Concho Resources, Inc.* | 549,835 | ||||||
| 10,959 | Dril-Quip, Inc.* | 640,334 | ||||||
|
| |||||||
| 1,190,169 | ||||||||
|
| |||||||
| Food & Staples Retailing – 1.3% |
| ||||||
| 67,868 | Whole Foods Market, Inc. | 2,173,133 | ||||||
|
| |||||||
| Food, Beverage & Tobacco – 8.5% |
| ||||||
| 89,333 | Blue Buffalo Pet Products, Inc.* | 2,085,032 | ||||||
| 8,689 | Brown-Forman Corp. Class B | 866,815 | ||||||
| 39,720 | McCormick & Co., Inc. | 4,236,933 | ||||||
| 25,384 | Mead Johnson Nutrition Co. | 2,303,598 | ||||||
| 11,155 | Monster Beverage Corp.* | 1,792,720 | ||||||
| 30,588 | TreeHouse Foods, Inc.* | 3,139,858 | ||||||
|
| |||||||
| 14,424,956 | ||||||||
|
| |||||||
| Common Stocks – (continued) | ||||||||
| Health Care Equipment & Services – 8.1% |
| ||||||
| 10,288 | Adeptus Health, Inc. Class A* | $ | 531,478 | |||||
| 14,355 | C. R. Bard, Inc. | 3,375,722 | ||||||
| 21,153 | Cardinal Health, Inc. | 1,650,145 | ||||||
| 39,619 | Cerner Corp.* | 2,321,673 | ||||||
| 7,272 | DexCom, Inc.* | 576,888 | ||||||
| 20,312 | Henry Schein, Inc.* | 3,591,162 | ||||||
| 9,783 | Teleflex, Inc. | 1,734,624 | ||||||
|
| |||||||
| 13,781,692 | ||||||||
|
| |||||||
| Materials – 5.7% |
| ||||||
| 25,207 | Ashland, Inc. | 2,893,007 | ||||||
| 34,149 | Axalta Coating Systems Ltd.* | 905,973 | ||||||
| 46,822 | RPM International, Inc. | 2,338,759 | ||||||
| 12,306 | The Sherwin-Williams Co. | 3,613,903 | ||||||
|
| |||||||
| 9,751,642 | ||||||||
|
| |||||||
| Pharmaceuticals, Biotechnology & Life Sciences – 7.5% |
| ||||||
| 53,974 | Agilent Technologies, Inc. | 2,394,287 | ||||||
| 3,603 | Alexion Pharmaceuticals, Inc.* | 420,686 | ||||||
| 24,283 | Alkermes PLC* | 1,049,511 | ||||||
| 23,954 | Cepheid, Inc.* | 736,586 | ||||||
| 11,592 | Medivation, Inc.* | 698,998 | ||||||
| 8,708 | Mettler-Toledo International, Inc.* | 3,177,723 | ||||||
| 13,160 | Vertex Pharmaceuticals, Inc.* | 1,132,023 | ||||||
| 64,478 | Zoetis, Inc. | 3,060,126 | ||||||
|
| |||||||
| 12,669,940 | ||||||||
|
| |||||||
| Real Estate Investment Trust – 2.5% |
| ||||||
| 10,877 | Equinix, Inc. | 4,217,339 | ||||||
|
| |||||||
| Retailing – 11.7% |
| ||||||
| 13,748 | Advance Auto Parts, Inc. | 2,222,089 | ||||||
| 25,953 | Expedia, Inc. | 2,758,804 | ||||||
| 26,598 | Five Below, Inc.* | 1,234,413 | ||||||
| 6,021 | O’Reilly Automotive, Inc.* | 1,632,293 | ||||||
| 72,984 | Ross Stores, Inc. | 4,137,463 | ||||||
| 42,989 | Tractor Supply Co. | 3,919,737 | ||||||
| 16,138 | Ulta Salon, Cosmetics & Fragrance, Inc.* | 3,931,863 | ||||||
|
| |||||||
| 19,836,662 | ||||||||
|
| |||||||
| Semiconductors & Semiconductor Equipment – 0.9% |
| ||||||
| 27,793 | Qorvo, Inc.* | 1,535,841 | ||||||
|
| |||||||
| Software & Services – 14.7% |
| ||||||
| 80,054 | Black Knight Financial Services, Inc. Class A* | 3,010,030 | ||||||
| 40,548 | Electronic Arts, Inc.* | 3,071,916 | ||||||
| 52,420 | Fidelity National Information Services, Inc. | 3,862,306 | ||||||
| 18,541 | FleetCor Technologies, Inc.* | 2,653,773 | ||||||
| 22,180 | Global Payments, Inc. | 1,583,208 | ||||||
| 34,452 | Intuit, Inc. | 3,845,188 | ||||||
| 4,527 | LinkedIn Corp. Class A* | 856,735 | ||||||
|
| |||||||
| 40 | The accompanying notes are an integral part of these financial statements. |
GOLDMAN SACHS VARIABLE INSURANCE TRUST GROWTH OPPORTUNITIES FUND
| Shares | Description | Value | ||||||
| Common Stocks – (continued) | ||||||||
| Software & Services – (continued) |
| ||||||
| 46,997 | Match Group, Inc.* | $ | 708,480 | |||||
| 22,594 | Mobileye NV* | 1,042,487 | ||||||
| 76,374 | Sabre Corp. | 2,046,059 | ||||||
| 15,702 | ServiceNow, Inc.* | 1,042,613 | ||||||
| 20,464 | Splunk, Inc.* | 1,108,740 | ||||||
|
| |||||||
| 24,831,535 | ||||||||
|
| |||||||
| Technology Hardware & Equipment – 2.7% |
| ||||||
| 75,943 | Amphenol Corp. Class A | 4,353,812 | ||||||
| 25,213 | Pure Storage, Inc. Class A* | 274,822 | ||||||
|
| |||||||
| 4,628,634 | ||||||||
|
| |||||||
| Telecommunication Services – 3.8% |
| ||||||
| 44,026 | Level 3 Communications, Inc.* | 2,266,899 | ||||||
| 38,410 | SBA Communications Corp. Class A* | 4,145,975 | ||||||
|
| |||||||
| 6,412,874 | ||||||||
|
| |||||||
| Transportation – 0.8% |
| ||||||
| 14,655 | Kansas City Southern | 1,320,269 | ||||||
|
| |||||||
| TOTAL INVESTMENTS – 96.5% | ||||||||
| (Cost $129,917,386) | $ | 163,445,518 | ||||||
|
| |||||||
| OTHER ASSETS IN EXCESS OF | 5,913,097 | ||||||
|
| |||||||
| NET ASSETS – 100.0% | $ | 169,358,615 | ||||||
|
| |||||||
The percentage shown for each investment category reflects the value of investments in that category as a percentage of net assets. | ||
| * | Non-income producing security. | |
| The accompanying notes are an integral part of these financial statements. | 41 |
GOLDMAN SACHS VARIABLE INSURANCE TRUST HIGH QUALITY FLOATING RATE FUND
Schedule of Investments
June 30, 2016 (Unaudited)
| Principal Amount | Interest Rate | Maturity Date | Value | |||||||||||
| Mortgage-Backed Obligations – 49.2% | ||||||||||||||
| Collateralized Mortgage Obligations – 40.5% |
| ||||||||||||
| Agency Multi-Family(a) – 6.8% |
| ||||||||||||
| FHLMC Multifamily Structured Pass-Through Certificates | | ||||||||||||
| $ | 617,347 | 0.833 | % | 07/25/20 | $ | 617,161 | ||||||||
| FHLMC Multifamily Structured Pass-Through Certificates | | ||||||||||||
| 373,228 | 0.786 | 01/25/21 | 373,154 | |||||||||||
| FHLMC Multifamily Structured Pass-Through Certificates | | ||||||||||||
| 1,454,286 | 0.833 | 08/25/23 | 1,442,357 | |||||||||||
| FNMA |
| ||||||||||||
| 178,459 | 2.800 | 03/01/18 | 181,004 | |||||||||||
| 462,272 | 3.740 | 05/01/18 | 475,551 | |||||||||||
| 110,000 | 3.840 | 05/01/18 | 113,337 | |||||||||||
| 400,000 | 4.506 | 06/01/19 | 418,505 | |||||||||||
| 80,883 | 3.416 | 10/01/20 | 86,925 | |||||||||||
| 84,298 | 3.619 | 12/01/20 | 90,983 | |||||||||||
| 345,992 | 3.762 | 12/01/20 | 375,141 | |||||||||||
| 179,239 | 4.380 | 06/01/21 | 199,336 | |||||||||||
| FNMA ACES Series 2013-M11, Class FA |
| ||||||||||||
| 201,771 | 0.783 | 01/25/18 | 201,296 | |||||||||||
| FNMA ACES Series 2014-M5, Class FA |
| ||||||||||||
| 26,965 | 0.812 | 01/25/17 | 26,952 | |||||||||||
| GNMA |
| ||||||||||||
| 59,728 | 3.950 | 07/15/25 | 65,089 | |||||||||||
|
| |||||||||||||
| 4,666,791 | ||||||||||||||
|
| |||||||||||||
| Regular Floater(a) – 33.7% |
| ||||||||||||
| Aire Valley Mortgages PLC Series 2006-1A, Class 1A(b)(c) |
| ||||||||||||
| 1,450,969 | 0.867 | 09/20/66 | 1,386,863 | |||||||||||
| FHLMC REMIC Series 3049, Class FP |
| ||||||||||||
| 301,053 | 0.792 | 10/15/35 | 299,410 | |||||||||||
| FHLMC REMIC Series 3208, Class FB(c) |
| ||||||||||||
| 189,842 | 0.842 | 08/15/36 | 189,752 | |||||||||||
| FHLMC REMIC Series 3208, Class FD(c) |
| ||||||||||||
| 282,865 | 0.842 | 08/15/36 | 282,730 | |||||||||||
| FHLMC REMIC Series 3208, Class FG(c) |
| ||||||||||||
| 1,139,054 | 0.842 | 08/15/36 | 1,138,511 | |||||||||||
| FHLMC REMIC Series 3307, Class FT |
| ||||||||||||
| 1,737,770 | 0.682 | 07/15/34 | 1,735,877 | |||||||||||
| FHLMC REMIC Series 3311, Class KF |
| ||||||||||||
| 2,864,185 | 0.782 | 05/15/37 | 2,858,180 | |||||||||||
| FHLMC REMIC Series 3371, Class FA(c) |
| ||||||||||||
| 715,797 | 1.042 | 09/15/37 | 720,816 | |||||||||||
| FHLMC REMIC Series 4174, Class FB |
| ||||||||||||
| 1,417,995 | 0.742 | 05/15/39 | 1,411,777 | |||||||||||
| FHLMC REMIC Series 4320, Class FD |
| ||||||||||||
| 662,900 | 0.842 | 07/15/39 | 661,186 | |||||||||||
| FHLMC REMIC Series 4477, Class FG |
| ||||||||||||
| 1,459,862 | 0.739 | 10/15/40 | 1,443,390 | |||||||||||
| FNMA REMIC Series 2006-82, Class F |
| ||||||||||||
| 567,758 | 1.023 | 09/25/36 | 570,332 | |||||||||||
| FNMA REMIC Series 2006-96, Class FA |
| ||||||||||||
| 941,527 | 0.753 | 10/25/36 | 940,976 | |||||||||||
|
| |||||||||||||
| Mortgage-Backed Obligations – (continued) | ||||||||||||||
| Regular Floater(a) – (continued) |
| ||||||||||||
| FNMA REMIC Series 2007-33, Class HF |
| ||||||||||||
| $ | 168,297 | 0.803 | % | 04/25/37 | $ | 167,691 | ||||||||
| FNMA REMIC Series 2007-36, Class F |
| ||||||||||||
| 267,998 | 0.683 | 04/25/37 | 266,382 | |||||||||||
| FNMA REMIC Series 2007-85, Class FC |
| ||||||||||||
| 710,694 | 0.993 | 09/25/37 | 715,513 | |||||||||||
| FNMA REMIC Series 2008-8, Class FB |
| ||||||||||||
| 965,995 | 1.273 | 02/25/38 | 974,605 | |||||||||||
| FNMA REMIC Series 2011-63, Class FG |
| ||||||||||||
| 719,448 | 0.903 | 07/25/41 | 720,750 | |||||||||||
| FNMA REMIC Series 2012-35, Class QF |
| ||||||||||||
| 1,792,209 | 0.853 | 04/25/42 | 1,793,600 | |||||||||||
| FNMA REMIC Series 2016-1, Class FT |
| ||||||||||||
| 1,792,552 | 0.803 | 02/25/46 | 1,776,834 | |||||||||||
| GNMA Series 2005-48, Class AF |
| ||||||||||||
| 901,060 | �� | 0.648 | 06/20/35 | 893,515 | ||||||||||
| Leek Finance Number Eighteen PLC Series 18X, Class A2B(c) |
| ||||||||||||
| 124,332 | 0.904 | 09/21/38 | 132,490 | |||||||||||
| National Credit Union Administration Guaranteed Notes Trust | | ||||||||||||
| 2,197,231 | 0.915 | 01/08/20 | 2,201,179 | |||||||||||
|
| |||||||||||||
| 23,282,359 | ||||||||||||||
|
| |||||||||||||
| | TOTAL COLLATERALIZED MORTGAGE OBLIGATIONS | | $ | 27,949,150 | ||||||||||
|
| |||||||||||||
| Commercial Mortgage-Backed Security – 0.0% |
| ||||||||||||
| Regular Floater(a)(c) – 0.0% |
| ||||||||||||
| Banc of America Commercial Mortgage Trust Series 2006-3, | | ||||||||||||
| $ | 27,388 | 5.889 | % | 07/10/44 | $ | 27,357 | ||||||||
|
| |||||||||||||
| Federal Agencies(a) – 8.7% |
| ||||||||||||
| Adjustable Rate FHLMC – 4.8% |
| ||||||||||||
| 290,277 | 2.904 | 05/01/35 | 305,514 | |||||||||||
| 134,006 | 2.500 | 09/01/35 | 141,802 | |||||||||||
| 273,976 | 2.917 | 12/01/36 | 288,721 | |||||||||||
| 978,533 | 3.305 | 04/01/37 | 1,042,284 | |||||||||||
| 791,512 | 2.573 | 01/01/38 | 830,133 | |||||||||||
| 663,362 | 2.741 | 01/01/38 | 701,130 | |||||||||||
|
| |||||||||||||
| 3,309,584 | ||||||||||||||
|
| |||||||||||||
| Adjustable Rate FNMA – 3.3% |
| ||||||||||||
| 83,159 | 2.604 | 05/01/33 | 86,255 | |||||||||||
| 224,802 | 2.833 | 05/01/35 | 237,954 | |||||||||||
| 528,859 | 2.556 | 06/01/35 | 557,532 | |||||||||||
| 781,854 | 2.383 | 11/01/35 | 817,584 | |||||||||||
| 115,235 | 2.580 | 12/01/35 | 121,190 | |||||||||||
| 439,134 | 2.846 | 03/01/37 | 464,970 | |||||||||||
|
| |||||||||||||
| 2,285,485 | ||||||||||||||
|
| |||||||||||||
| 42 | The accompanying notes are an integral part of these financial statements. |
GOLDMAN SACHS VARIABLE INSURANCE TRUST HIGH QUALITY FLOATING RATE FUND
| Principal Amount | Interest Rate | Maturity Date | Value | |||||||||||
| Mortgage-Backed Obligations – (continued) | ||||||||||||||
| Adjustable Rate GNMA – 0.6% |
| ||||||||||||
| $ | 381,012 | 1.750 | % | 04/20/33 | $ | 394,162 | ||||||||
|
| |||||||||||||
| TOTAL FEDERAL AGENCIES | $ | 5,989,231 | ||||||||||||
|
| |||||||||||||
| TOTAL MORTGAGE-BACKED OBLIGATIONS | ||||||||||||||
| (Cost $33,983,566) | $ | 33,965,738 | ||||||||||||
|
| |||||||||||||
| Asset-Backed Securities – 32.5% | ||||||||||||||
| Automobile(a)(b)(c) – 0.8% |
| ||||||||||||
| Chesapeake Funding II LLC Series 2016-2A, Class A2 |
| ||||||||||||
| $ | 550,000 | 1.448 | % | 06/15/28 | $ | 549,945 | ||||||||
|
| |||||||||||||
| Collateralized Loan Obligations(a) – 8.9% |
| ||||||||||||
| Acis CLO Ltd. Series 2013-2A, Class A(b)(c) |
| ||||||||||||
| 634,277 | 1.130 | 10/14/22 | 626,578 | |||||||||||
| ARES XI CLO Ltd. Series 2007-11A, Class A1A(b)(c) |
| ||||||||||||
| 540,736 | 0.716 | 10/11/21 | 528,635 | |||||||||||
| Black Diamond CLO Ltd. Series 2006-1A, Class AD(b) |
| ||||||||||||
| 280,539 | 0.888 | 04/29/19 | 277,484 | |||||||||||
| Brentwood CLO Corp. Series 2006-1A, Class A1A(b)(c) |
| ||||||||||||
| 445,835 | 0.907 | 02/01/22 | 442,133 | |||||||||||
| Brentwood CLO Corp. Series 2006-1A, Class A1B(b)(c) |
| ||||||||||||
| 175,149 | 0.907 | 02/01/22 | 172,854 | |||||||||||
| Callidus Debt Partners CLO Fund VI Ltd. Series 6A, | | ||||||||||||
| 291,042 | 0.898 | 10/23/21 | 286,392 | |||||||||||
| Halcyon Loan Advisors Funding Ltd. Series 2014-1A, | | ||||||||||||
| 350,000 | 2.163 | 04/18/26 | 343,217 | |||||||||||
| OFSI Fund V Ltd. Series 2013-5A, Class A1LA(b)(c) |
| ||||||||||||
| 300,000 | 1.563 | 04/17/25 | 293,267 | |||||||||||
| OFSI Fund VI Ltd. Series 2014-6A, Class A1(b)(c) |
| ||||||||||||
| 350,000 | 1.658 | 03/20/25 | 341,361 | |||||||||||
| OZLM Funding III Ltd. Series 2013-3A, Class A1(b)(c) |
| ||||||||||||
| 500,000 | 1.965 | 01/22/25 | 497,350 | |||||||||||
| Parallel Ltd. Series 2015-1A, Class A(b)(c) |
| ||||||||||||
| 300,000 | 2.084 | 07/20/27 | 294,034 | |||||||||||
| Sound Point CLO XI Ltd. Series 2016-1A, Class A(b)(c) |
| ||||||||||||
| 700,000 | 2.175 | 07/20/28 | 695,855 | |||||||||||
| Westbrook CLO Ltd. Series 2006-1X, Class A1(c) |
| ||||||||||||
| 51,402 | 0.887 | 12/20/20 | 51,197 | |||||||||||
| Westchester CLO Ltd. Series 2007-1X, Class A1A(c) |
| ||||||||||||
| 896,255 | 0.862 | 08/01/22 | 886,293 | |||||||||||
| Z Capital Credit Partners CLO Ltd. Series 2015-1A, Class A1(b)(c) |
| ||||||||||||
| 400,000 | 1.963 | 07/16/27 | 390,354 | |||||||||||
|
| |||||||||||||
| 6,127,004 | ||||||||||||||
|
| |||||||||||||
| Credit Card(a) – 3.3% |
| ||||||||||||
| Bank of America Credit Card Trust Series 2014-A1, Class A |
| ||||||||||||
| 1,000,000 | 0.822 | 06/15/21 | 1,001,268 | |||||||||||
| Capital One Multi-Asset Execution Trust Series 2016-A1, | | ||||||||||||
| 300,000 | 0.900 | 02/15/22 | 300,259 | |||||||||||
|
| |||||||||||||
| Asset-Backed Securities – (continued) | ||||||||||||||
| Credit Card(a) – (continued) |
| ||||||||||||
| Evergreen Credit Card Trust Series 2016-1, Class A(b)(c) |
| ||||||||||||
| $ | 500,000 | 1.162 | % | 04/15/20 | $ | 500,906 | ||||||||
| Trillium Credit Card Trust II Series 2016-1A, Class A(b)(c) |
| ||||||||||||
| 500,000 | 1.185 | 05/26/21 | 500,000 | |||||||||||
|
| |||||||||||||
| 2,302,433 | ||||||||||||||
|
| |||||||||||||
| Student Loans(a) – 19.5% |
| ||||||||||||
| Academic Loan Funding Trust Series 2013-1A, Class A(b)(c) |
| ||||||||||||
| 613,147 | 1.253 | 12/26/44 | 597,088 | |||||||||||
| Access Group, Inc. Series 2006-1, Class A2 |
| ||||||||||||
| 104,623 | 0.772 | 08/25/23 | 104,146 | |||||||||||
| Access Group, Inc. Series 2015-1, Class A(b)(c) |
| ||||||||||||
| 124,701 | 1.153 | 07/25/56 | 121,907 | |||||||||||
| Access to Loans for Learning Student Loan Corp. Series 2013-I, | | ||||||||||||
| 569,848 | 1.246 | 02/25/41 | 547,703 | |||||||||||
| Brazos Higher Education Authority, Inc. Series 2005-1, | | ||||||||||||
| 44,843 | 0.750 | 09/26/22 | 44,738 | |||||||||||
| Brazos Higher Education Authority, Inc. Series 2005-2, | | ||||||||||||
| 110,689 | 0.760 | 12/26/19 | 110,530 | |||||||||||
| Education Loan Asset-Backed Trust I Series 2013-1, Class A1(b) |
| ||||||||||||
| 416,958 | 1.253 | 06/25/26 | 412,930 | |||||||||||
| Educational Funding of the South, Inc. Series 2011-1, Class A2(c) |
| ||||||||||||
| 750,333 | 1.288 | 04/25/35 | 735,930 | |||||||||||
| Educational Services of America, Inc. Series 2010-1, Class A1(b)(c) |
| ||||||||||||
| 1,021,607 | 1.488 | 07/25/23 | 1,011,996 | |||||||||||
| Educational Services of America, Inc. Series 2014-1, Class A(b)(c) |
| ||||||||||||
| 355,097 | 1.153 | 02/25/39 | 344,572 | |||||||||||
| EFS Volunteer No. 3 LLC Series 2012-1, Class A2(b)(c) |
| ||||||||||||
| 1,520,947 | 1.446 | 02/25/25 | 1,523,593 | |||||||||||
| GCO Education Loan Funding Trust Series 2006-1, Class A8L |
| ||||||||||||
| 569,206 | 0.792 | 05/25/25 | 555,526 | |||||||||||
| Goal Capital Funding Trust Series 2006-1, Class A3 |
| ||||||||||||
| 11,161 | 0.782 | 11/25/26 | 11,145 | |||||||||||
| Goal Capital Funding Trust Series 2007-1, Class A3 |
| ||||||||||||
| 110,031 | 0.730 | 09/25/28 | 109,014 | |||||||||||
| Higher Education Funding I Series 2005-1, Class A4 |
| ||||||||||||
| 85,704 | 0.802 | 02/25/30 | 84,956 | |||||||||||
| Kentucky Higher Education Student Loan Corp. Series 2015-1, | | ||||||||||||
| 872,735 | 1.207 | 12/01/31 | 848,569 | |||||||||||
| Montana Higher Education Student Assistance Corp. | | ||||||||||||
| 984,829 | 1.448 | 05/20/30 | 975,276 | |||||||||||
| Navient Student Loan Trust Series 2016-2, Class A1(b)(c) |
| ||||||||||||
| 558,373 | 1.203 | 06/25/65 | 558,388 | |||||||||||
| Nelnet Student Loan Trust Series 2005-4, Class A3(c) |
| ||||||||||||
| 107,084 | 0.776 | 06/22/26 | 106,522 | |||||||||||
| Nelnet Student Loan Trust Series 2006-2, Class A5(c) |
| ||||||||||||
| 583,535 | 0.738 | 01/25/30 | 574,566 | |||||||||||
|
| |||||||||||||
| The accompanying notes are an integral part of these financial statements. | 43 |
GOLDMAN SACHS VARIABLE INSURANCE TRUST HIGH QUALITY FLOATING RATE FUND
Schedule of Investments (continued)
June 30, 2016 (Unaudited)
| Principal Amount | Interest Rate | Maturity Date | Value | |||||||||||
| Asset-Backed Securities – (continued) | ||||||||||||||
| Student Loans(a) – (continued) |
| ||||||||||||
| Nelnet Student Loan Trust Series 2013-5A, Class A(b)(c) |
| ||||||||||||
| $ | 118,928 | 1.076 | % | 01/25/37 | $ | 116,120 | ||||||||
| Panhandle-Plains Higher Education Authority, Inc. Series 2011-1, | | ||||||||||||
| 621,045 | 1.575 | 07/01/24 | 621,970 | |||||||||||
| Scholar Funding Trust Series 2010-A, Class A(b)(c) |
| ||||||||||||
| 307,055 | 1.384 | 10/28/41 | 300,906 | |||||||||||
| Scholar Funding Trust Series 2011-A, Class A(b)(c) |
| ||||||||||||
| 300,507 | 1.534 | 10/28/43 | 289,865 | |||||||||||
| SLM Student Loan Trust Series 2003-12, Class A5(b)(c) |
| ||||||||||||
| 144,246 | 0.933 | 09/15/22 | 143,798 | |||||||||||
| SLM Student Loan Trust Series 2003-14, Class A5 |
| ||||||||||||
| 53,279 | 0.868 | 01/25/23 | 53,027 | |||||||||||
| SLM Student Loan Trust Series 2005-9, Class A6 |
| ||||||||||||
| 650,000 | 1.188 | 10/26/26 | 647,716 | |||||||||||
| SLM Student Loan Trust Series 2006-2, Class A5(c) |
| ||||||||||||
| 498,740 | 0.748 | 07/25/25 | 495,805 | |||||||||||
| SLM Student Loan Trust Series 2006-4, Class A5(c) |
| ||||||||||||
| 412,319 | 0.738 | 10/27/25 | 411,328 | |||||||||||
| SLM Student Loan Trust Series 2006-9, Class A4(c) |
| ||||||||||||
| 10,615 | 0.708 | 10/25/22 | 10,606 | |||||||||||
| SLM Student Loan Trust Series 2008-5, Class A4(c) |
| ||||||||||||
| 191,808 | 2.338 | 07/25/23 | 191,867 | |||||||||||
| SLM Student Loan Trust Series 2013-3, Class A2(c) |
| ||||||||||||
| 57,181 | 0.753 | 05/26/20 | 56,978 | |||||||||||
| SLM Student Loan Trust Series 2014-1, Class A2(c) |
| ||||||||||||
| 85,634 | 0.833 | 07/26/21 | 85,310 | |||||||||||
| Utah State Board of Regents Series 2015-1, Class A(c) |
| ||||||||||||
| 588,726 | 1.053 | 02/25/43 | 574,961 | |||||||||||
| Wachovia Student Loan Trust Series 2005-1, Class A5(c) |
| ||||||||||||
| 59,364 | 0.768 | 01/26/26 | 58,654 | |||||||||||
|
| |||||||||||||
| 13,438,006 | ||||||||||||||
|
| |||||||||||||
| TOTAL ASSET-BACKED SECURITIES | ||||||||||||||
| (Cost $22,545,184) | $ | 22,417,388 | ||||||||||||
|
| |||||||||||||
| U.S. Treasury Obligations – 11.9% | ||||||||||||||
| United States Treasury Bond |
| ||||||||||||
| $ | 800,000 | 3.750 | % | 11/15/43 | $ | 1,053,576 | ||||||||
| United States Treasury Floating Rate Notes(a) |
| ||||||||||||
| 1,500,000 | 0.410 | 07/31/16 | 1,500,075 | |||||||||||
| 300,000 | 0.508 | 10/31/17 | 300,276 | |||||||||||
| 1,400,000 | 0.612 | 01/31/18 | 1,402,856 | |||||||||||
| United States Treasury Inflation-Protected Securities |
| ||||||||||||
| 310,512 | 0.125 | 04/15/18 | 315,266 | |||||||||||
| 561,600 | 0.125 | 04/15/19 | 573,623 | |||||||||||
| 2,962,901 | 0.125 | 04/15/20 | 3,030,485 | |||||||||||
|
| |||||||||||||
| TOTAL U.S. TREASURY OBLIGATIONS | ||||||||||||||
| (Cost $8,054,159) | $ | 8,176,157 | ||||||||||||
|
| |||||||||||||
| Investment Company(a)(d) – 5.2% | ||||||||||||||
| Goldman Sachs Financial Square Government Fund – | | ||||||||||||
| $ | 3,623,179 | 0.299 | % | $ | 3,623,179 | |||||||||
| (Cost $3,623,179) | ||||||||||||||
|
| |||||||||||||
| TOTAL INVESTMENTS – 98.8% | ||||||||||||||
| (Cost $68,206,088) | $ | 68,182,462 | ||||||||||||
|
| |||||||||||||
| OTHER ASSETS IN EXCESS OF | | 836,197 | |||||||||||
|
| |||||||||||||
| NET ASSETS – 100.0% | $ | 69,018,659 | ||||||||||||
|
| |||||||||||||
| The percentage shown for each investment category reflects the value of investments in that category as a percentage of net assets. | ||
| (a) | Variable rate security. Interest rate or distribution rate disclosed is that which is in effect on June 30, 2016. | |
| (b) | Exempt from registration under Rule 144A of the Securities Act of 1933. Under procedures approved by the Board of Trustees, such securities may be deemed liquid by the Investment Adviser and may be resold, normally to qualified institutional buyers in transactions exempt from registration. Total market value of Rule 144A securities amounts to $13,548,391, which represents approximately 19.6% of net assets as of June 30, 2016. | |
| (c) | Securities with “Call” features with resetting interest rates. Maturity dates disclosed are the final maturity dates. | |
| (d) | Represents an affiliated issuer. | |
| Investment Abbreviations: | ||
| FHLMC | —Federal Home Loan Mortgage Corp. | |
| FNMA | —Federal National Mortgage Association | |
| GNMA | —Government National Mortgage Association | |
| REMIC | —Real Estate Mortgage Investment Conduit | |
| 44 | The accompanying notes are an integral part of these financial statements. |
GOLDMAN SACHS VARIABLE INSURANCE TRUST HIGH QUALITY FLOATING RATE FUND
ADDITIONAL INVESTMENT INFORMATION
FUTURES CONTRACTS — At June 30, 2016, the Fund had the following futures contracts:
| Type | Number of Contracts Long (Short) | Expiration Date | Current Value | Unrealized Gain (Loss) | ||||||||||||
| U.S. Long Bonds | (5 | ) | September 2016 | $ | (861,719 | ) | $ | (47,101 | ) | |||||||
| U.S. Ultra Long Treasury Bonds | (2 | ) | September 2016 | (372,750 | ) | (23,574 | ) | |||||||||
| 2 Year U.S. Treasury Notes | (10 | ) | September 2016 | (2,193,281 | ) | (14,333 | ) | |||||||||
5 Year U.S. Treasury Notes | (28 | ) | September 2016 | (3,420,594 | ) | (61,050 | ) | |||||||||
| TOTAL | $ | (146,058 | ) | |||||||||||||
| The accompanying notes are an integral part of these financial statements. | 45 |
GOLDMAN SACHS VARIABLE INSURANCE TRUST FUNDS
Statements of Assets and Liabilities
June 30, 2016 (Unaudited)
| Core Fixed Income Fund | Equity Index Fund | Growth Fund | High Quality Fund | |||||||||||||
| Assets: | ||||||||||||||||
Investments in unaffiliated issuers, at value (cost $107,071,917, $77,551,727, $129,917,386 and $64,582,909) | $ | 111,850,339 | $ | 162,172,485 | $ | 163,445,518 | $ | 64,559,283 | ||||||||
Investments in affiliated issuers, at value (cost $0, $382,639, $0 and $3,623,179) | — | 512,007 | — | 3,623,179 | ||||||||||||
Cash | 5,326,406 | 970,238 | 5,973,347 | 705,969 | ||||||||||||
Foreign currencies, at value (cost $14,317, $0, $0 and $0) | 14,362 | — | — | — | ||||||||||||
Receivables: | ||||||||||||||||
Investments sold on an extended-settlement basis | 7,370,079 | — | — | 111,283 | ||||||||||||
Investments sold | 1,074,609 | — | 1,751,640 | — | ||||||||||||
Interest and dividends | 683,357 | 183,608 | 60,611 | 75,931 | ||||||||||||
Collateral on certain derivative contracts(a) | 330,960 | — | — | 346,000 | ||||||||||||
Fund shares sold | 81,389 | 990 | 10,807 | 3,325 | ||||||||||||
Reimbursement from investment adviser | 23,590 | 22,518 | 17,552 | 13,979 | ||||||||||||
Unrealized gain on forward foreign currency exchange contracts | 185,107 | — | — | — | ||||||||||||
Variation margin on certain derivative contracts | 42,912 | 12,264 | — | 1,493 | ||||||||||||
| Total assets | 126,983,110 | 163,874,110 | 171,259,475 | 69,440,442 | ||||||||||||
| Liabilities: | ||||||||||||||||
Unrealized loss on forward foreign currency exchange contracts | 224,243 | — | — | — | ||||||||||||
Payables: | ||||||||||||||||
Investments purchased on an extended-settlement basis | 11,744,709 | — | — | — | ||||||||||||
Forward sale contracts, at value (proceeds received $1,047,344, $0, $0, $0) | 1,054,219 | — | — | — | ||||||||||||
Management fees | 36,826 | 28,015 | 119,891 | 17,190 | ||||||||||||
Fund shares redeemed | 34,622 | 194,475 | 77,283 | 13,382 | ||||||||||||
Distribution and Service fees and Transfer Agency fees | 24,850 | 36,020 | 24,801 | 15,537 | ||||||||||||
Investments purchased | — | 159,908 | 1,596,023 | 300,422 | ||||||||||||
Accrued expenses | 124,237 | 77,552 | 82,862 | 75,252 | ||||||||||||
| Total liabilities | 13,243,706 | 495,970 | 1,900,860 | 421,783 | ||||||||||||
| Net Assets: | ||||||||||||||||
Paid-in capital | 114,966,847 | 80,953,839 | 139,994,330 | 70,144,484 | ||||||||||||
Undistributed (distributions in excess of) net investment income (loss) | (29,882 | ) | 2,426,685 | (218,780 | ) | (11,768 | ) | |||||||||
Accumulated net realized loss | (6,028,160 | ) | (4,764,585 | ) | (3,945,067 | ) | (944,373 | ) | ||||||||
Net unrealized gain (loss) | 4,830,599 | 84,762,201 | 33,528,132 | (169,684 | ) | |||||||||||
| NET ASSETS | $ | 113,739,404 | $ | 163,378,140 | $ | 169,358,615 | $ | 69,018,659 | ||||||||
Net Assets: | ||||||||||||||||
Institutional | $ | 27,306 | $ | — | $ | 32,354 | $ | 25,205 | ||||||||
Service | 113,712,098 | 163,378,140 | 169,326,261 | 67,346,764 | ||||||||||||
Advisor | — | — | — | 1,646,690 | ||||||||||||
Total Net Assets | $ | 113,739,404 | $ | 163,378,140 | $ | 169,358,615 | $ | 69,018,659 | ||||||||
Shares of beneficial interest outstanding $0.001 par value (unlimited shares authorized): | ||||||||||||||||
Institutional | 2,510 | — | 4,709 | 2,428 | ||||||||||||
Service | 10,452,804 | 11,338,155 | 24,803,997 | 6,502,640 | ||||||||||||
Advisor | — | — | — | 158,758 | ||||||||||||
Net asset value, offering and redemption price per share: | ||||||||||||||||
Institutional | $10.88 | $ — | $6.87 | $10.38 | ||||||||||||
Service | 10.88 | 14.41 | 6.83 | 10.36 | ||||||||||||
Advisor | — | — | — | 10.37 | ||||||||||||
Segregated for initial margin and/or collateral on futures transactions and swap transactions as follows:
Forwards | Futures | Swaps | ||||||||||
| Core Fixed Income | $ | 110,000 | $ | — | $ | 220,960 | ||||||
| High Quality Floating Rate | — | 346,000 | — | |||||||||
| 46 | The accompanying notes are an integral part of these financial statements. |
GOLDMAN SACHS VARIABLE INSURANCE TRUST FUNDS
Statements of Operations
For the Six Months Ended June 30, 2016 (Unaudited)
| Core Fixed Income Fund | Equity Index Fund | Growth Opportunities Fund | High Quality Floating Rate Fund | |||||||||||||
| Investment income: | ||||||||||||||||
Interest | $ | 1,500,929 | $ | — | $ | — | $ | 398,852 | ||||||||
Dividends | — | 1,814,456 | 605,741 | — | ||||||||||||
Dividends — affiliated issuers | 1,091 | 4,679 | — | 5,264 | ||||||||||||
| Total investment income | 1,502,020 | 1,819,135 | 605,741 | 404,116 | ||||||||||||
| Expenses: | ||||||||||||||||
Management fees | 216,342 | 240,651 | 799,611 | 138,209 | ||||||||||||
Distribution and Service fees(a) | 135,180 | 200,543 | 199,865 | 87,860 | ||||||||||||
Professional fees | 57,745 | 42,453 | 39,922 | 53,273 | ||||||||||||
Custody, accounting and administrative services | 36,336 | 27,316 | 26,718 | 20,448 | ||||||||||||
Printing and mailing costs | 32,321 | 41,152 | 23,480 | 19,925 | ||||||||||||
Trustee fees | 11,612 | 12,849 | 12,753 | 12,551 | ||||||||||||
Transfer Agency fees(a) | 10,815 | 16,042 | 15,991 | 6,909 | ||||||||||||
Other | 7,339 | 16,080 | 6,954 | 4,075 | ||||||||||||
| Total expenses | 507,690 | 597,086 | 1,125,294 | 343,250 | ||||||||||||
Less — expense reductions | (145,260 | ) | (209,028 | ) | (283,859 | ) | (119,279 | ) | ||||||||
| Net expenses | 362,430 | 388,058 | 841,435 | 223,971 | ||||||||||||
| NET INVESTMENT INCOME (LOSS) | 1,139,590 | 1,431,077 | (235,694 | ) | 180,145 | |||||||||||
| Realized and unrealized gain (loss): | ||||||||||||||||
Net realized gain (loss) from: | ||||||||||||||||
Investments — unaffiliated issuers (including commissions recaptured of, $0, $0, $3,606 and $0) | 133,778 | 4,965,735 | (3,960,020 | ) | 48,661 | |||||||||||
Investments — affiliated issuer | — | 7,261 | — | — | ||||||||||||
Futures contracts | 42,284 | 23,384 | — | (97,689 | ) | |||||||||||
Swap contracts | (79,900 | ) | — | — | — | |||||||||||
Forward foreign currency exchange contracts | (168,072 | ) | — | — | — | |||||||||||
Foreign currency transactions | 13,991 | — | — | — | ||||||||||||
Net change in unrealized gain (loss) on: | ||||||||||||||||
Investments — unaffiliated issuers | 3,897,792 | (815,334 | ) | 7,706,944 | 125,856 | |||||||||||
Investments — affiliated issuers | — | (123,245 | ) | — | — | |||||||||||
Futures contracts | 191,079 | 12,969 | — | (157,313 | ) | |||||||||||
Swap contracts | (74,330 | ) | — | — | — | |||||||||||
Forward foreign currency exchange contracts | (13,269 | ) | — | — | — | |||||||||||
Foreign currency translation | 1,775 | — | — | — | ||||||||||||
| Net realized and unrealized gain (loss) | 3,945,128 | 4,070,770 | 3,746,924 | (80,485 | ) | |||||||||||
| NET INCREASE IN NET ASSETS RESULTING FROM OPERATIONS | $ | 5,084,718 | $ | 5,501,847 | $ | 3,511,230 | $ | 99,660 | ||||||||
(a) Class specific Distribution and Service, and Transfer Agency fees were as follows:
| Distribution and Service Fees | Transfer Agency Fees | |||||||||||||||||||
Fund | Service | Advisor | Institutional | Service | Advisor | |||||||||||||||
Core Fixed Income | $ | 135,180 | N/A | $ | 2 | $ | 10,813 | N/A | ||||||||||||
Equity Index | 200,543 | N/A | N/A | 16,042 | N/A | |||||||||||||||
Growth Opportunities | 199,865 | N/A | 3 | 15,988 | N/A | |||||||||||||||
High Quality Floating Rate | 83,831 | $ | 4,029 | 2 | 6,706 | $ | 201 | |||||||||||||
| The accompanying notes are an integral part of these financial statements. | 47 |
GOLDMAN SACHS VARIABLE INSURANCE TRUST FUNDS
Statements of Changes in Net Assets
| Core Fixed Income Fund | Equity Index Fund | |||||||||||||||
| For the Six Months Ended June 30, 2016 (Unaudited) | For the Fiscal Year Ended December 31, 2015 | For the Six Months Ended June 30, 2016 (Unaudited) | For the Fiscal Year Ended December 31, 2015 | |||||||||||||
| From operations: | ||||||||||||||||
Net investment income (loss) | $ | 1,139,590 | $ | 2,333,850 | $ | 1,431,077 | $ | 3,882,193 | ||||||||
Net realized gain (loss) | (57,919 | ) | 824,785 | 4,996,380 | 9,868,912 | |||||||||||
Net change in unrealized gain (loss) | 4,003,047 | (2,799,901 | ) | (925,610 | ) | (11,884,918 | ) | |||||||||
| Net increase (decrease) in net assets resulting from operations | 5,084,718 | 358,734 | 5,501,847 | 1,866,187 | ||||||||||||
| Distributions to shareholders: | ||||||||||||||||
From net investment income | ||||||||||||||||
Institutional Shares | (418 | ) | (693 | ) | — | — | ||||||||||
Service Shares | (1,589,499 | ) | (2,475,317 | ) | — | (3,127,567 | ) | |||||||||
Advisor Shares | — | — | — | — | ||||||||||||
From net realized gains | ||||||||||||||||
Institutional Shares | — | — | — | — | ||||||||||||
Service Shares | — | — | — | (9,730,333 | ) | |||||||||||
| Total distributions to shareholders | (1,589,917 | ) | (2,476,010 | ) | — | (12,857,900 | ) | |||||||||
| From share transactions: | ||||||||||||||||
Proceeds from sales of shares | 12,414,404 | 17,192,161 | 1,597,360 | 3,490,618 | ||||||||||||
Reinvestment of distributions | 1,589,917 | 2,476,010 | — | 12,857,900 | ||||||||||||
Cost of shares redeemed | (8,709,813 | ) | (19,689,934 | ) | (13,016,144 | ) | (26,070,660 | ) | ||||||||
| Net increase (decrease) in net assets resulting from share transactions | 5,294,508 | (21,763 | ) | (11,418,784 | ) | (9,722,142 | ) | |||||||||
| TOTAL INCREASE (DECREASE) | 8,789,309 | (2,139,039 | ) | (5,916,937 | ) | (20,713,855 | ) | |||||||||
| Net assets: | ||||||||||||||||
Beginning of period | 104,950,095 | 107,089,134 | 169,295,077 | 190,008,932 | ||||||||||||
End of period | $ | 113,739,404 | $ | 104,950,095 | $ | 163,378,140 | $ | 169,295,077 | ||||||||
| Undistributed (distributions in excess of) net investment income (loss) | $ | (29,882 | ) | $ | 420,445 | $ | 2,426,685 | $ | 995,608 | |||||||
| 48 | The accompanying notes are an integral part of these financial statements. |
GOLDMAN SACHS VARIABLE INSURANCE TRUST FUNDS
| Growth Opportunities Fund | High Quality Floating Rate Fund | |||||||||||||
| For the Six Months Ended June 30, 2016 (Unaudited) | For the Fiscal Year Ended December 31, 2015 | For the Six Months Ended June 30, 2016 (Unaudited) | For the Fiscal Year Ended December 31, 2015 | |||||||||||
| $ | (235,694 | ) | $ | (682,142 | ) | $ | 180,145 | $ | 202,867 | |||||
| (3,960,020 | ) | 13,086,912 | (49,028 | ) | (91,487 | ) | ||||||||
| 7,706,944 | (22,032,924 | ) | (31,457 | ) | (424,808 | ) | ||||||||
| 3,511,230 | (9,628,154 | ) | 99,660 | (313,428 | ) | |||||||||
| — | — | (123 | ) | (176 | ) | |||||||||
| — | — | (246,030 | ) | (316,783 | ) | |||||||||
| — | — | (7,201 | ) | (3,093 | ) | |||||||||
| — | (2,613 | ) | — | — | ||||||||||
| — | (14,040,255 | ) | — | — | ||||||||||
| — | (14,042,868 | ) | (253,354 | ) | (320,052 | ) | ||||||||
| 8,543,546 | 9,813,897 | 5,562,817 | 8,890,822 | |||||||||||
| — | 14,042,868 | 253,354 | 320,052 | |||||||||||
| (11,381,276 | ) | (33,053,396 | ) | (7,609,111 | ) | (12,538,797 | ) | |||||||
| (2,837,730 | ) | (9,196,631 | ) | (1,792,940 | ) | (3,327,923 | ) | ||||||
| 673,500 | (32,867,653 | ) | (1,946,634 | ) | (3,961,403 | ) | ||||||||
| 168,685,115 | 201,552,768 | 70,965,293 | 74,926,696 | |||||||||||
| $ | 169,358,615 | $ | 168,685,115 | $ | 69,018,659 | $ | 70,965,293 | |||||||
$ | (218,780 | ) | $ | 16,914 | $ | (11,768 | ) | $ | 61,441 | |||||
| The accompanying notes are an integral part of these financial statements. | 49 |
GOLDMAN SACHS VARIABLE INSURANCE TRUST CORE FIXED INCOME FUND
Financial Highlights
Selected Data for a Share Outstanding Throughout Each Period
| Income (loss) from investment operations | ||||||||||||||||||||||||||||||||||||||||||||||||
| Net asset value, beginning of period | Net investment income(a) | Net realized and unrealized gain (loss) | Total from investment operations | Distributions to shareholders from net investment income | Net asset value, end of period | Total return(b) | Net assets, end of period (in 000s) | Ratio of net expenses to average net assets | Ratio of total expenses to average net assets | Ratio of net investment income to average net assets | Portfolio turnover rate(c) | |||||||||||||||||||||||||||||||||||||
FOR THE SIX MONTHS ENDED JUNE 30, (UNAUDITED) | ||||||||||||||||||||||||||||||||||||||||||||||||
2016 - Institutional | $ | 10.53 | $ | 0.13 | $ | 0.39 | $ | 0.52 | $ | (0.17 | ) | $ | 10.88 | 4.95 | % | $ | 27 | 0.41 | %(d) | 0.68 | %(d) | 2.37 | %(d) | 170 | % | |||||||||||||||||||||||
2016 - Service | 10.53 | 0.11 | 0.40 | 0.51 | (0.16 | ) | 10.88 | 4.82 | 113,712 | 0.67 | (d) | 0.94 | (d) | 2.11 | (d) | 170 | ||||||||||||||||||||||||||||||||
FOR THE FISCAL YEARS ENDED DECEMBER 31, | ||||||||||||||||||||||||||||||||||||||||||||||||
2015 - Institutional | 10.75 | 0.27 | (0.20 | ) | 0.07 | (0.29 | ) | 10.53 | 0.60 | 26 | 0.42 | 0.74 | 2.53 | 376 | ||||||||||||||||||||||||||||||||||
2015 - Service | 10.76 | 0.24 | (0.21 | ) | 0.03 | (0.26 | ) | 10.53 | 0.27 | 104,924 | 0.67 | 0.99 | 2.27 | 376 | ||||||||||||||||||||||||||||||||||
2014 - Institutional | 10.48 | 0.25 | 0.34 | 0.59 | (0.32 | ) | 10.75 | 5.68 | 26 | 0.44 | 0.65 | 2.31 | 353 | |||||||||||||||||||||||||||||||||||
2014 - Service | 10.47 | 0.22 | 0.36 | 0.58 | (0.29 | ) | 10.76 | 5.61 | 107,063 | 0.68 | 0.91 | 2.06 | 353 | |||||||||||||||||||||||||||||||||||
2013 - Institutional (Commenced April 30, 2013) | 10.91 | 0.15 | (0.38 | ) | (0.23 | ) | (0.20 | ) | 10.48 | (2.13 | ) | 24 | 0.43 | (d) | 0.69 | (d) | 2.10 | (d) | 557 | |||||||||||||||||||||||||||||
2013 - Service | 10.88 | 0.20 | (0.35 | ) | (0.15 | ) | (0.26 | ) | 10.47 | (1.35 | ) | 116,530 | 0.67 | 0.89 | 1.88 | 557 | ||||||||||||||||||||||||||||||||
2012 - Service | 10.43 | 0.17 | 0.52 | 0.69 | (0.24 | ) | 10.88 | 6.70 | 135,436 | 0.67 | 0.83 | 1.57 | 727 | |||||||||||||||||||||||||||||||||||
2011 - Service | 10.00 | 0.23 | 0.46 | 0.69 | (0.26 | ) | 10.43 | 6.96 | 148,114 | 0.67 | 0.83 | 2.22 | 644 | |||||||||||||||||||||||||||||||||||
| (a) | Calculated based on the average shares outstanding methodology. |
| (b) | Assumes investment at the net asset value at the beginning of the period, reinvestment of all distributions, and a complete redemption of the investment at the net asset value at the end of the period. Total returns for periods less than one full year are not annualized. |
| (c) | The Fund's portfolio turnover rate is calculated in accordance with regulatory requirements, without regard to transactions involving short term investments and certain derivatives. If such transactions were included, the Fund's portfolio turnover rate may be higher. |
| (d) | Annualized. |
| The accompanying notes are an integral part of these financial statements. | 50 |
GOLDMAN SACHS VARIABLE INSURANCE TRUST EQUITY INDEX FUND
Financial Highlights
Selected Data for a Share Outstanding Throughout Each Period
| Income (loss) from investment operations | Distributions to shareholders | |||||||||||||||||||||||||||||||||||||||||||||||||||||||
| Net asset value, beginning of period | Net investment income(a) | Net realized and unrealized gain (loss) | Total from investment operations | From net investment income | From net realized gains | Total distributions | Net asset value, end of period | Total return(b) | Net assets, end of period (in 000s) | Ratio of net expenses to average net assets | Ratio of total expenses to average net assets | Ratio of net investment income to average net assets | Portfolio turnover rate(c) | |||||||||||||||||||||||||||||||||||||||||||
FOR THE SIX MONTHS ENDED JUNE 30, (UNAUDITED) | ||||||||||||||||||||||||||||||||||||||||||||||||||||||||
2016 | $ | 13.91 | $ | 0.12 | $ | 0.38 | $ | 0.50 | $ | — | $ | — | $ | — | $ | 14.41 | 3.59 | % | $ | 163,378 | 0.48 | %(d) | 0.74 | %(d) | 1.78 | %(d) | 2 | % | ||||||||||||||||||||||||||||
FOR THE FISCAL YEARS ENDED DECEMBER 31, | ||||||||||||||||||||||||||||||||||||||||||||||||||||||||
2015 | 14.91 | 0.32 | (0.18 | ) | 0.14 | (0.28 | ) | (0.86 | ) | (1.14 | ) | 13.91 | 0.94 | 169,295 | 0.48 | 0.70 | 2.15 | 4 | ||||||||||||||||||||||||||||||||||||||
2014 | 13.68 | 0.22 | 1.58 | 1.80 | (0.25 | ) | (0.32 | ) | (0.57 | ) | 14.91 | 13.22 | 190,009 | 0.49 | 0.71 | 1.55 | 2 | |||||||||||||||||||||||||||||||||||||||
2013 | 10.54 | 0.20 | 3.15 | 3.35 | (0.21 | ) | — | (0.21 | ) | 13.68 | 31.83 | 193,899 | 0.49 | 0.73 | 1.61 | 3 | ||||||||||||||||||||||||||||||||||||||||
2012 | 9.29 | 0.19 | 1.26 | 1.45 | (0.20 | ) | — | (0.20 | ) | 10.54 | 15.50 | 167,811 | 0.48 | 0.72 | 1.82 | 3 | ||||||||||||||||||||||||||||||||||||||||
2011 | 9.29 | 0.15 | 0.01 | 0.16 | (0.16 | ) | — | (0.16 | ) | 9.29 | 1.75 | 169,711 | 0.48 | 0.70 | 1.59 | 3 | ||||||||||||||||||||||||||||||||||||||||
| (a) | Calculated based on the average shares outstanding methodology. |
| (b) | Assumes investment at the net asset value at the beginning of the period, reinvestment of all distributions, and a complete redemption of the investment at the net asset value at the end of the period. Total returns for periods less than one full year are not annualized. |
| (c) | The Fund's portfolio turnover rate is calculated in accordance with regulatory requirements, without regard to transactions involving short term investments and certain derivatives. If such transactions were included, the Fund's portfolio turnover rate may be higher. |
| (d) | Annualized. |
| The accompanying notes are an integral part of these financial statements. | 51 |
GOLDMAN SACHS VARIABLE INSURANCE TRUST GROWTH OPPORTUNITIES FUND
Financial Highlights
Selected Data for a Share Outstanding Throughout Each Period
| Income (loss) from investment operations | ||||||||||||||||||||||||||||||||||||||||||||||||
| Net asset value, beginning of period | Net investment loss(a) | Net realized and unrealized gain (loss) | Total from investment operations | Distributions to shareholders from net realized gains | Net asset value, end of period | Total return(b) | Net assets, end of period (in 000s) | Ratio of net expenses to average net assets | Ratio of total expenses to average net assets | Ratio of net investment loss to average net assets | Portfolio turnover rate(c) | |||||||||||||||||||||||||||||||||||||
FOR THE SIX MONTHS ENDED JUNE 30, (UNAUDITED) | ||||||||||||||||||||||||||||||||||||||||||||||||
2016 - Institutional | $ | 6.71 | $ | — | (d) | $ | 0.16 | $ | 0.16 | $ | — | $ | 6.87 | 2.38 | % | $ | 32 | 0.90 | %(e) | 1.14 | %(e) | (0.14 | )%(e) | 32 | % | |||||||||||||||||||||||
2016 - Service | 6.68 | (0.01 | ) | 0.16 | 0.15 | — | 6.83 | 2.25 | 169,326 | 1.05 | (e) | 1.41 | (e) | (0.29 | )(e) | 32 | ||||||||||||||||||||||||||||||||
FOR THE FISCAL YEARS ENDED DECEMBER 31, | ||||||||||||||||||||||||||||||||||||||||||||||||
2015 - Institutional | 7.72 | (0.01 | ) | (0.39 | ) | (0.40 | ) | (0.61 | ) | 6.71 | (5.20 | ) | 32 | 0.93 | 1.14 | (0.19 | ) | 57 | ||||||||||||||||||||||||||||||
2015 - Service | 7.69 | (0.03 | ) | (0.37 | ) | (0.40 | ) | (0.61 | ) | 6.68 | (5.20 | ) | 168,653 | 1.09 | 1.40 | (0.36 | ) | 57 | ||||||||||||||||||||||||||||||
2014 - Institutional | 8.59 | (0.02 | ) | 0.94 | 0.92 | (1.79 | ) | 7.72 | 11.32 | 33 | 1.01 | 1.15 | (0.24 | ) | 62 | |||||||||||||||||||||||||||||||||
2014 - Service | 8.58 | (0.03 | ) | 0.93 | 0.90 | (1.79 | ) | 7.69 | 11.10 | 201,519 | 1.17 | 1.39 | (0.39 | ) | 62 | |||||||||||||||||||||||||||||||||
2013 - Institutional (Commenced April 30, 2013) | 7.66 | (0.02 | ) | 1.52 | 1.50 | (0.57 | ) | 8.59 | 19.73 | 30 | 1.00 | (e) | 1.16 | (e) | (0.27 | )(e) | 42 | |||||||||||||||||||||||||||||||
2013 - Service | 6.93 | (0.04 | ) | 2.26 | 2.22 | (0.57 | ) | 8.58 | 32.20 | 201,872 | 1.16 | 1.39 | (0.47 | ) | 42 | |||||||||||||||||||||||||||||||||
2012 - Service | 6.34 | (0.02 | )(f) | 1.25 | 1.23 | (0.64 | ) | 6.93 | 19.37 | 171,870 | 1.15 | 1.39 | (0.26 | )(f) | 46 | |||||||||||||||||||||||||||||||||
2011 - Service | 6.72 | (0.03 | ) | (0.24 | ) | (0.27 | ) | (0.11 | ) | 6.34 | (3.97 | ) | 159,324 | 1.17 | 1.41 | (0.46 | ) | 53 | ||||||||||||||||||||||||||||||
| (a) | Calculated based on the average shares outstanding methodology. |
| (b) | Assumes investment at the net asset value at the beginning of the period, reinvestment of all distributions, and a complete redemption of the investment at the net asset value at the end of the period. Total returns for periods less than one full year are not annualized. |
| (c) | The Fund's portfolio turnover rate is calculated in accordance with regulatory requirements, without regard to transactions involving short term investments. If such transactions were included, the Fund's portfolio turnover rate may be higher. |
| (d) | Amount is less than $0.005 per share. |
| (e) | Annualized. |
| (f) | Reflects income recognized from special dividends which amounted to $0.01 per share and 0.18% of average net assets. |
| The accompanying notes are an integral part of these financial statements. | 52 |
GOLDMAN SACHS VARIABLE INSURANCE TRUST HIGH QUALITY FLOATING RATE FUND
Financial Highlights
Selected Data for a Share Outstanding Throughout Each Period
| Income (loss) from investment operations | Distributions to shareholders | |||||||||||||||||||||||||||||||||||||||||||||||||||||||||||
| Net asset value, beginning of period | Net investment income(a) | Net realized and unrealized gain (loss) | Total from investment operations | From net investment income | From net realized gains | Total distributions | Net asset value, end of period | Total return(b) | Net assets, end of period (in 000s) | Ratio of net expenses to average net assets | Ratio of total expenses to average net assets | Ratio of net investment income to average net assets | Portfolio turnover rate(c) | |||||||||||||||||||||||||||||||||||||||||||||||
FOR THE SIX MONTHS ENDED JUNE 30, (UNAUDITED) | ||||||||||||||||||||||||||||||||||||||||||||||||||||||||||||
2016 - Institutional | $ | 10.40 | $ | 0.04 | $ | (0.01 | ) | $ | 0.03 | $ | (0.05 | ) | $ | — | $ | (0.05 | ) | $ | 10.38 | 0.30 | % | $ | 25 | 0.39 | %(d) | 0.72 | %(d) | 0.78 | %(d) | 26 | % | |||||||||||||||||||||||||||||
2016 - Service | 10.38 | 0.03 | (0.01 | ) | 0.02 | (0.04 | ) | — | (0.04 | ) | 10.36 | 0.18 | 67,347 | 0.64 | (d) | 0.99 | (d) | 0.53 | (d) | 26 | ||||||||||||||||||||||||||||||||||||||||
2016 - Advisor | 10.40 | 0.02 | (0.02 | ) | — | (e) | (0.03 | ) | — | (0.03 | ) | 10.37 | 0.12 | 1,647 | 0.80 | (d) | 1.14 | (d) | 0.38 | (d) | 26 | |||||||||||||||||||||||||||||||||||||||
FOR THE FISCAL YEARS ENDED DECEMBER 31, | ||||||||||||||||||||||||||||||||||||||||||||||||||||||||||||
2015 - Institutional | 10.49 | 0.06 | (0.08 | ) | (0.02 | ) | (0.07 | ) | — | (0.07 | ) | 10.40 | (0.16 | ) | 25 | 0.38 | 0.81 | 0.54 | 14 | |||||||||||||||||||||||||||||||||||||||||
2015 - Service | 10.47 | 0.03 | (0.07 | ) | (0.04 | ) | (0.05 | ) | — | (0.05 | ) | 10.38 | (0.42 | ) | 69,625 | 0.64 | 1.05 | 0.28 | 14 | |||||||||||||||||||||||||||||||||||||||||
2015 - Advisor | 10.49 | 0.01 | (0.06 | ) | (0.05 | ) | (0.04 | ) | — | (0.04 | ) | 10.40 | (0.57 | ) | 1,315 | 0.78 | 1.25 | 0.12 | 14 | |||||||||||||||||||||||||||||||||||||||||
2014 - Institutional | 10.51 | 0.05 | (0.03 | ) | 0.02 | (0.04 | ) | — | (0.04 | ) | 10.49 | 0.17 | 25 | 0.40 | 0.70 | 0.51 | 17 | |||||||||||||||||||||||||||||||||||||||||||
2014 - Service | 10.51 | 0.03 | (0.04 | ) | (0.01 | ) | (0.03 | ) | — | (0.03 | ) | 10.47 | (0.09 | ) | 74,892 | 0.66 | 0.96 | 0.25 | 17 | |||||||||||||||||||||||||||||||||||||||||
2014 - Advisor (Commenced October 15, 2014) | 10.51 | — | (e) | (0.02 | ) | (0.02 | ) | — | — | — | 10.49 | (0.10 | )* | 10 | 0.77 | (d) | 1.13 | (d) | 0.15 | (d) | 17 | |||||||||||||||||||||||||||||||||||||||
2013 - Institutional (Commenced April 30, 2013) | 10.56 | 0.02 | 0.03 | 0.05 | (0.04 | ) | (0.06 | ) | (0.10 | )(f) | 10.51 | 0.50 | 25 | 0.40 | (d) | 0.86 | (d) | 0.25 | (d) | 467 | ||||||||||||||||||||||||||||||||||||||||
2013 - Service | 10.58 | 0.01 | 0.03 | 0.04 | (0.05 | ) | (0.06 | ) | (0.11 | )(f) | 10.51 | 0.40 | 78,142 | 0.70 | 1.10 | 0.08 | 467 | |||||||||||||||||||||||||||||||||||||||||||
2012 - Service | 10.70 | 0.04 | 0.25 | 0.29 | (0.08 | ) | (0.33 | ) | (0.41 | ) | 10.58 | 2.78 | 68,893 | 0.79 | 1.06 | 0.36 | 1,045 | |||||||||||||||||||||||||||||||||||||||||||
2011 - Service | 10.56 | 0.09 | 0.57 | 0.66 | (0.10 | ) | (0.42 | ) | (0.52 | ) | 10.70 | 6.35 | 67,327 | 0.81 | 1.13 | 0.81 | 960 | |||||||||||||||||||||||||||||||||||||||||||
| (a) | Calculated based on the average shares outstanding methodology. |
| (b) | Assumes investment at the net asset value at the beginning of the period, reinvestment of all distributions, and a complete redemption of the investment at the net asset value at the end of the period. Total returns for periods less than one full year are not annualized. |
| (c) | The Fund's portfolio turnover rate is calculated in accordance with regulatory requirements, without regard to transactions involving short term investments and certain derivatives. If such transactions were included, the Fund's portfolio turnover rate may be higher. |
| (d) | Annualized. |
| (e) | Amount is less than $0.005 per share. |
| (f) | Included a distribution from capital of less than $0.01 per share. |
| * | Represents cumulative total returns. |
| The accompanying notes are an integral part of these financial statements. | 53 |
GOLDMAN SACHS VARIABLE INSURANCE TRUST FUNDS
Notes to Financial Statements
June 30, 2016 (Unaudited)
1. ORGANIZATION
Goldman Sachs Variable Insurance Trust (the “Trust” or “VIT”) is a Delaware statutory trust registered under the Investment Company Act of 1940, as amended (the “Act”), as an open-end management investment company. The following table lists those series of the Trust that are included in this report (collectively, the “Funds” or individually a “Fund”), along with their corresponding share classes and respective diversification status under the Act:
| Fund | Share Classes Offered | Diversified/ Non-diversified | ||||
High Quality Floating Rate | Institutional, Service and Advisor | Diversified | ||||
Core Fixed Income and Growth Opportunities | Institutional and Service | Diversified | ||||
Equity Index | Service | Diversified |
Goldman Sachs Asset Management, L.P. (“GSAM”), an affiliate of Goldman, Sachs & Co. (“Goldman Sachs”), serves as investment adviser to the Funds pursuant to management agreements (the “Agreements”) with the Trust.
2. SIGNIFICANT ACCOUNTING POLICIES
The financial statements have been prepared in accordance with accounting principles generally accepted in the United States of America (“GAAP”) and require management to make estimates and assumptions that may affect the reported amounts and disclosures. Actual results may differ from those estimates and assumptions.
A. Investment Valuation — The Funds’ valuation policy is to value investments at fair value.
B. Investment Income and Investments — Investment income includes interest income, dividend income, net of any foreign withholding taxes, less any amounts reclaimable, and securities lending income. Interest income is accrued daily and adjusted for amortization of premiums and accretion of discounts. Dividend income is recognized on ex-dividend date or, for certain foreign securities, as soon as such information is obtained subsequent to the ex-dividend date. Investment transactions are reflected on trade date. Realized gains and losses are calculated using identified cost. Investment transactions are recorded on the following business day for daily net asset value (“NAV”) calculations. Any foreign capital gains tax is accrued daily based upon net unrealized gains, and is payable upon sale of such investments. Distributions received from the Funds’ investments in United States (“U.S.”) real estate investment trusts (“REITs”) may be characterized as ordinary income, net capital gain or a return of capital. A return of capital is recorded by the Funds as a reduction to the cost basis of the REIT.
For derivative contracts, realized gains and losses are recorded upon settlement of the contract. Upfront payments, if any, are made or received upon entering into a swap agreement and are reflected in the Statements of Assets and Liabilities. Upfront payments are recognized over the contract’s term/event as realized gains or losses, with the exception of forward starting interest rate swaps whose realized gains or losses are recognized from the effective start date. For securities with paydown provisions, principal payments received are treated as a proportionate reduction to the cost basis of the securities, and excess or shortfall amounts are recorded as income. For treasury inflation protected securities (“TIPS”), adjustments to principal due to inflation/deflation are reflected as increases/decreases to interest income with a corresponding adjustment to cost.
C. Class Allocations and Expenses — Investment income, realized and unrealized gain (loss), and non-class specific expenses of each Fund are allocated daily based upon the proportion of net assets of each class. Non-class specific expenses directly incurred by a Fund are charged to that Fund, while such expenses incurred by the Trust are allocated across the applicable Funds on a straight-line and/or pro-rata basis depending upon the nature of the expenses. Class specific expenses, where applicable, are borne by the respective share classes and include Distribution and Service and Transfer Agency fees.
D. Federal Taxes and Distributions to Shareholders — It is each Fund’s policy to comply with the requirements of the Internal Revenue Code of 1986, as amended (the “Code”), applicable to regulated investment companies (mutual funds) and to distribute each year substantially all of its investment company taxable income and capital gains to its shareholders. Accordingly,
54
GOLDMAN SACHS VARIABLE INSURANCE TRUST FUNDS
2. SIGNIFICANT ACCOUNTING POLICIES (continued)
the Funds are not required to make any provisions for the payment of federal income tax. Distributions to shareholders are recorded on the ex-dividend date. Income and capital gains distributions, if any, are declared and paid according to the following schedule:
| Fund | Income Distributions Declared/Paid | Capital Gains Distributions Declared/Paid | ||||
Core Fixed Income and High Quality Floating Rate | Quarterly | Annually | ||||
Equity Index and Growth Opportunities | Annually | Annually |
Net capital losses are carried forward to future fiscal years and may be used to the extent allowed by the Code to offset any future capital gains. Utilization of capital loss carryforwards will reduce the requirement of future capital gains distributions.
Under the Regulated Investment Company Modernization Act of 2010, the Funds are permitted to carry forward capital losses incurred in taxable years beginning after December 22, 2010 for an unlimited period. However, any losses incurred during those future taxable years will be required to be utilized prior to the losses incurred in pre-enactment taxable years. As a result of this ordering rule, pre-enactment capital loss carryforwards may be more likely to expire unused. Additionally, post-enactment capital losses that are carried forward will retain their character as either short-term or long-term capital losses rather than being considered all short-term as under previous law.
The characterization of distributions to shareholders for financial reporting purposes is determined in accordance with federal income tax rules, which may differ from GAAP. The source of each Fund’s distributions may be shown in the accompanying financial statements as either from net investment income, net realized gain or capital. Certain components of the Funds’ net assets on the Statements of Assets and Liabilities reflect permanent GAAP/tax differences based on the appropriate tax character.
E. Foreign Currency Translation — The accounting records and reporting currency of the Funds are maintained in U.S. dollars. Assets and liabilities denominated in foreign currencies are translated into U.S. dollars using the current exchange rates at the close of each business day. The effect of changes in foreign currency exchange rates on investments is included within net realized and unrealized gain (loss) on investments. Changes in the value of other assets and liabilities as a result of fluctuations in foreign exchange rates are included in the Statements of Operations within net change in unrealized gain (loss) on foreign currency translations. Transactions denominated in foreign currencies are translated into U.S. dollars on the date the transaction occurred, the effects of which are included within net realized gain (loss) on foreign currency transactions.
F. Commission Recapture — GSAM, on behalf of certain Funds, may direct portfolio trades, subject to seeking best execution, to various brokers who have agreed to rebate a portion of the commissions generated. Such rebates are made directly to a Fund as cash payments and are included in net realized gain (loss) from investments on the Statements of Operations.
3. INVESTMENTS AND FAIR VALUE MEASUREMENTS
The fair value of a financial instrument is the amount that would be received to sell an asset or paid to transfer a liability in an orderly transaction between market participants at the measurement date (i.e., the exit price). GAAP establishes a fair value hierarchy that prioritizes the inputs to valuation techniques used to measure fair value. The hierarchy gives the highest priority to unadjusted quoted prices in active markets for identical assets or liabilities (Level 1 measurements) and the lowest priority to unobservable inputs (Level 3 measurements). The levels used for classifying investments are not necessarily an indication of the risk associated with investing in these investments. The three levels of the fair value hierarchy are described below:
Level 1 — Unadjusted quoted prices in active markets that are accessible at the measurement date for identical, unrestricted assets or liabilities;
Level 2 — Quoted prices in markets that are not active or financial instruments for which significant inputs are observable (including, but not limited to, quoted prices for similar investments, interest rates, foreign exchange rates, volatility and credit spreads), either directly or indirectly;
55
GOLDMAN SACHS VARIABLE INSURANCE TRUST FUNDS
Notes to Financial Statements (continued)
June 30, 2016 (Unaudited)
3. INVESTMENTS AND FAIR VALUE MEASUREMENTS (continued)
Level 3 — Prices or valuations that require significant unobservable inputs (including GSAM’s assumptions in determining fair value measurement).
Changes in valuation techniques may result in transfers into or out of an assigned level within the hierarchy. In accordance with the Funds’ policy, transfers between different levels of the fair value hierarchy resulting from such changes are deemed to have occurred as of the beginning of the reporting period.
The Board of Trustees (“Trustees”) has approved Valuation Procedures that govern the valuation of the portfolio investments held by the Funds, including investments for which market quotations are not readily available. The Trustees have delegated to GSAM day-to-day responsibility for implementing and maintaining internal controls and procedures related to the valuation of the Funds’ portfolio investments. To assess the continuing appropriateness of pricing sources and methodologies, GSAM regularly performs price verification procedures and issues challenges as necessary to third party pricing vendors or brokers, and any differences are reviewed in accordance with the Valuation Procedures.
A. Level 1 and Level 2 Fair Value Investments — The valuation techniques and significant inputs used in determining the fair values for investments classified as Level 1 and Level 2 are as follows:
Equity Securities — Equity securities traded on a U.S. securities exchange or the NASDAQ system, or those located on certain foreign exchanges, including but not limited to the Americas, are valued daily at their last sale price or official closing price on the principal exchange or system on which they are traded. If there is no sale or official closing price or such price is believed by GSAM to not represent fair value, equity securities are valued at the last bid price for long positions and at the last ask price for short positions. To the extent these investments are actively traded, they are classified as Level 1 of the fair value hierarchy, otherwise they are generally classified as Level 2.
Unlisted equity securities for which market quotations are available are valued at the last sale price on the valuation date, or if no sale occurs, at the last bid price. These investments are generally classified as Level 2 of the fair value hierarchy.
Money Market Funds — Investments in the Goldman Sachs Financial Square Government Fund (“Underlying Fund”) are valued at the NAV of the FST Institutional Share class on the day of valuation. These investments are generally classified as Level 1 of the fair value hierarchy. For information regarding an Underlying Fund’s accounting policies and investment holdings, please see the Underlying Fund’s shareholder report.
Debt Securities — Debt securities for which market quotations are readily available are valued daily on the basis of quotations supplied by dealers or an independent pricing service approved by the Trustees. The pricing services may use valuation models or matrix pricing, which consider: (i) yield or price with respect to bonds that are considered comparable in characteristics such as rating, interest rate and maturity date or (ii) quotations from securities dealers to determine current value. Short-term debt obligations that mature in sixty days or less and that do not exhibit signs of credit deterioration are valued at amortized cost, which approximates fair value. With the exception of treasury securities of G8 countries (not held in money market funds), which are generally classified as Level 1, these investments are generally classified as Level 2 of the fair value hierarchy.
i. Mortgage-Backed and Asset-Backed Securities — Mortgage-backed securities represent direct or indirect participations in, or are collateralized by and payable from, mortgage loans secured by residential and/or commercial real estate property. Asset-backed securities include securities whose principal and interest payments are collateralized by pools of other assets or receivables. The value of certain mortgage-backed and asset-backed securities (including adjustable rate mortgage loans) may be particularly sensitive to changes in prevailing interest rates. The value of these securities may also fluctuate in response to the market’s perception of the creditworthiness of the issuers.
Asset-backed securities may present credit risks that are not presented by mortgage-backed securities because they generally do not have the benefit of a security interest in collateral that is comparable to mortgage assets. Some asset-backed securities may only have a subordinated claim on collateral.
Stripped mortgage-backed securities are usually structured with two different classes: one that receives substantially all interest payments (interest-only, or “IO” and/or high coupon rate with relatively low principal amount, or “IOette”), and the
56
GOLDMAN SACHS VARIABLE INSURANCE TRUST FUNDS
3. INVESTMENTS AND FAIR VALUE MEASUREMENTS (continued)
other that receives substantially all principal payments (principal-only, or “PO”) from a pool of mortgage loans. Little to no principal will be received at the maturity of an IO; as a result, periodic adjustments are recorded to reduce the cost of the security until maturity. These adjustments are included in interest income.
ii. Mortgage Dollar Rolls — Mortgage dollar rolls are transactions whereby a Fund sells mortgage-backed-securities and simultaneously contracts with the same counterparty to repurchase similar securities on a specified future date. During the settlement period, a Fund will not be entitled to accrue interest and receive principal payments on the securities sold. The Funds account for mortgage dollar roll transactions as purchases and sales and realize gains and losses on these transactions.
iii. Treasury Inflation Protected Securities — TIPS are treasury securities in which the principal amount is adjusted daily to keep pace with inflation, as measured by the U.S. Consumer Pricing Index for Urban Consumers. The repayment of the original bond principal upon maturity is guaranteed by the full faith and credit of the U.S. Government.
iv. When-Issued Securities and Forward Commitments — When-issued securities, including TBA (“To Be Announced”) securities, are securities that are authorized but not yet issued in the market and purchased in order to secure what is considered to be an advantageous price or yield to a Fund. A forward commitment involves entering into a contract to purchase or sell securities, typically on an extended settlement basis, for a fixed price at a future date. The purchase of securities on a when-issued or forward commitment basis involves a risk of loss if the value of the security to be purchased declines before the settlement date. Conversely, the sale of securities on a forward commitment basis involves the risk that the value of the securities sold may increase before the settlement date. Although a Fund will generally purchase securities on a when-issued or forward commitment basis with the intention of acquiring the securities for its portfolio, the Fund may dispose of when-issued securities or forward commitments prior to settlement, which may result in a realized gain or loss.
Derivative Contracts — A derivative is an instrument whose value is derived from underlying assets, indices, reference rates or a combination of these factors. The Funds enter into derivative transactions to hedge against changes in interest rates, securities prices, and/or currency exchange rates, to increase total return, or to gain access to certain markets or attain exposure to other underliers.
Exchange-traded derivatives, including futures and options contracts, are valued at the last sale or settlement price and typically fall within Level 1 of the fair value hierarchy. Over-the-counter (“OTC”) and centrally cleared derivatives are valued using market transactions and other market evidence, including market-based inputs to models, calibration to market-clearing transactions, broker or dealer quotations, or other alternative pricing sources. Where models are used, the selection of a particular model to value OTC and centrally cleared derivatives depends upon the contractual terms of, and specific risks inherent in, the instrument, as well as the availability of pricing information in the market. Valuation models require a variety of inputs, including contractual terms, market prices, yield curves, credit curves, measures of volatility, voluntary and involuntary prepayment rates, loss severity rates and correlations of such inputs. For OTC and centrally cleared derivatives that trade in liquid markets, model inputs can generally be verified and model selection does not involve significant management judgment. OTC and centrally cleared derivatives are classified within Level 2 of the fair value hierarchy when significant inputs are corroborated by market evidence.
i. Forward Contracts — A forward contract is a contract between two parties to buy or sell an asset at a specified price on a future date. A forward contract settlement can occur on a cash or delivery basis. Forward contracts are marked-to-market daily using independent vendor prices, and the change in value, if any, is recorded as an unrealized gain or loss. Cash and certain investments may be used to collateralize forward contracts.
A forward foreign currency contract is a forward contract in which a Fund agrees to receive or deliver a fixed quantity of one currency for another, at a pre-determined price at a future date. All forward foreign currency exchange contracts are marked-to-market daily at the applicable forward rate. Non-deliverable forward foreign currency exchange contracts are settled with the counterparty in cash without the delivery of foreign currency.
ii. Futures Contracts — Futures contracts are contracts to buy or sell a standardized quantity of a specified commodity or security and are valued based on exchanged settlement prices or independent market quotes. Futures contracts are valued at the
57
GOLDMAN SACHS VARIABLE INSURANCE TRUST FUNDS
Notes to Financial Statements (continued)
June 30, 2016 (Unaudited)
3. INVESTMENTS AND FAIR VALUE MEASUREMENTS (continued)
last settlement price, or in the absence of a sale, the last bid price for long positions and at the last ask price for short positions, at the end of each day on the board of trade or exchange upon which they are traded. Upon entering into a futures contract, a Fund deposits cash or securities in an account on behalf of the broker in an amount sufficient to meet the initial margin requirement. Subsequent payments are made or received by a Fund equal to the daily change in the contract value and are recorded as variation margin receivable or payable with a corresponding offset to unrealized gains or losses.
iii. Swap Contracts — Bilateral swap contracts are agreements in which a Fund and a counterparty agree to exchange periodic payments on a specified notional amount or make a net payment upon termination. Bilateral swap transactions are privately negotiated in the OTC market and payments are settled through direct payments between a Fund and the counterparty. By contrast, certain swap transactions are subject to mandatory central clearing. These swaps are executed through a derivatives clearing member (“DCM”), acting in an agency capacity, and submitted to a central counterparty (“CCP”) (“centrally cleared swaps”), in which case all payments are settled with the CCP through the DCM. Swaps are marked-to-market daily using pricing vendor quotations, counterparty or clearinghouse prices or model prices, and the change in value, if any, is recorded as an unrealized gain or loss. Upon entering into a swap contract, a Fund is required to satisfy an initial margin requirement by delivering cash or securities to the counterparty (or in some cases, segregated in a triparty account on behalf of the counterparty), which can be adjusted by any mark-to-market gains or losses pursuant to bilateral or centrally cleared arrangements. For centrally cleared swaps the daily change in valuation, if any, is recorded as a receivable or payable for variation margin.
An interest rate swap is an agreement that obligates two parties to exchange a series of cash flows at specified intervals, based upon or calculated by reference to changes in interest rates on a specified notional principal amount. The payment flows are usually netted against each other, with the difference being paid by one party to the other.
A credit default swap is an agreement that involves one party (the buyer of protection) making a stream of payments to another party (the seller of protection) in exchange for the right to receive protection on a reference security or obligation, including a group of assets or exposure to the performance of an index. A Fund’s investment in credit default swaps may involve greater risks than if the Fund had invested in the referenced obligation directly. Credit events are contract specific but may include bankruptcy, failure to pay, restructuring and obligation acceleration. If a Fund buys protection through a credit default swap and no credit event occurs, its payments are limited to the periodic payments previously made to the counterparty. Upon the occurrence of a specified credit event, a Fund, as a buyer of credit protection, is entitled to receive an amount equal to the notional amount of the swap and deliver to the seller the defaulted reference obligation in a physically settled trade. A Fund may also receive a net settlement amount in the form of cash or securities equal to the notional amount of the swap reduced by the recovery value of the reference obligation in a cash settled trade.
As a seller of protection, a Fund generally receives a payment stream throughout the term of the swap, provided that there is no credit event. In addition, if a Fund sells protection through a credit default swap, a Fund could suffer a loss because the value of the referenced obligation and the premium payments received may be less than the notional amount of the swap paid to the buyer of protection. Upon the occurrence of a specified credit event, a Fund, as a seller of credit protection, may be required to take possession of the defaulted reference obligation and pay the buyer an amount equal to the notional amount of the swap in a physically settled trade. A Fund may also pay a net settlement amount in the form of cash or securities equal to the notional amount of the swap reduced by the recovery value of the reference obligation in cash settled trade. Recovery values are at times established through the credit event auction process in which market participants are ensured that a transparent price has been set for the defaulted security or obligation. In addition, a Fund is entitled to a return of any assets, which have been pledged as collateral to the counterparty upon settlement.
The maximum potential amount of future payments (undiscounted) that a Fund as seller of protection could be required to make under a credit default swap would be an amount equal to the notional amount of the agreement. These potential amounts would be partially offset by any recovery values of the respective referenced obligations or net amounts received from a settlement of a credit default swap for the same reference security or obligation where a Fund bought credit protection.
58
GOLDMAN SACHS VARIABLE INSURANCE TRUST FUNDS
3. INVESTMENTS AND FAIR VALUE MEASUREMENTS (continued)
Short Term Investments — Short-term investments having a maturity of 60 days or less are generally valued at amortized cost which approximates fair market value. These investments are classified as Level 2 of the fair value hierarchy.
B. Level 3 Fair Value Investments — To the extent that significant inputs to valuation models and other alternative pricing sources are unobservable, or if quotations are not readily available, or if GSAM believes that such quotations do not accurately reflect fair value, the fair value of the Funds’ investments may be determined under Valuation Procedures approved by the Trustees. GSAM, consistent with its procedures and applicable regulatory guidance, may make an adjustment to the most recent valuation prices of either domestic or foreign securities in light of significant events to reflect what it believes to be the fair value of the securities at the time of determining a Fund’s NAV. Significant events which could affect a large number of securities in a particular market may include, but are not limited to: significant fluctuations in U.S. or foreign markets; market dislocations; market disruptions; or unscheduled market closings. Significant events which could also affect a single issuer may include, but are not limited to: corporate actions such as reorganizations, mergers and buy-outs; ratings downgrades; and bankruptcies.
C. Fair Value Hierarchy — The following is a summary of the Funds’ investments and derivatives classified in the fair value hierarchy as of June 30, 2016:
| CORE FIXED INCOME | ||||||||||||
| Investment Type | Level 1 | Level 2 | Level 3 | |||||||||
| Assets | ||||||||||||
| Fixed Income | ||||||||||||
Corporate Obligations | $ | — | $ | 35,472,509 | $ | — | ||||||
Mortgage-Backed Obligations | — | 35,180,902 | — | |||||||||
U.S. Treasury Obligations and/or Other U.S. Government Agencies | 22,651,746 | — | — | |||||||||
Agency Debentures | — | 2,574,391 | — | |||||||||
Asset-Backed Securities | — | 8,708,766 | — | |||||||||
Foreign Debt Obligations | 356,932 | 2,795,162 | — | |||||||||
Municipal Debt Obligations | — | 1,483,770 | — | |||||||||
Government Guarantee Obligations | — | 2,626,161 | — | |||||||||
| Total | $ | 23,008,678 | $ | 88,841,661 | $ | — | ||||||
| Liabilities | ||||||||||||
| Fixed Income | ||||||||||||
Mortgage-Backed Obligations — Forward Sales Contracts | $ | — | $ | (1,054,219 | ) | $ | — | |||||
| Derivative Type | ||||||||||||
| Assets(a) | ||||||||||||
| Forward Foreign Currency Exchange Contracts | $ | — | $ | 185,107 | $ | — | ||||||
| Futures Contracts | 151,790 | — | — | |||||||||
| Interest Rate Swap Contracts | — | 116,117 | — | |||||||||
| Total | $ | 151,790 | $ | 301,224 | $ | — | ||||||
| Liabilities(a) | ||||||||||||
| Forward Foreign Currency Exchange Contracts | $ | — | $ | (224,243 | ) | $ | — | |||||
| Futures Contracts | (96 | ) | — | — | ||||||||
| Credit Default Swap Contract | — | (2,947 | ) | — | ||||||||
| Interest Rate Swap Contracts | — | (168,843 | ) | — | ||||||||
| Total | $ | (96 | ) | $ | (396,033 | ) | $ | — | ||||
59
GOLDMAN SACHS VARIABLE INSURANCE TRUST FUNDS
Notes to Financial Statements (continued)
June 30, 2016 (Unaudited)
3. INVESTMENTS AND FAIR VALUE MEASUREMENTS (continued)
| EQUITY INDEX | ||||||||||||
| Investment Type | Level 1 | Level 2 | Level 3 | |||||||||
| Assets | ||||||||||||
| Common Stock and/or Other Equity Investments(b) | ||||||||||||
| North America | $ | 162,584,533 | $ | — | $ | — | ||||||
| U.S. Treasury Obligations and/or Other U.S. Government Agencies | 99,959 | — | — | |||||||||
| Total | $ | 162,684,492 | $ | — | $ | — | ||||||
| Derivative Type | ||||||||||||
| Assets(a) | ||||||||||||
| Futures Contracts | $ | 12,075 | $ | — | $ | — | ||||||
| GROWTH OPPORTUNITIES | ||||||||||||
| Investment Type | Level 1 | Level 2 | Level 3 | |||||||||
| Assets | ||||||||||||
| Common Stock and/or Other Equity Investments(b) | ||||||||||||
| North America | $ | 163,445,518 | $ | — | $ | — | ||||||
| HIGH QUALITY FLOATING RATE | ||||||||||||
| Investment Type | Level 1 | Level 2 | Level 3 | |||||||||
| Assets | ||||||||||||
| Fixed Income | ||||||||||||
U.S. Treasury Obligations and/or Other U.S. Government Agencies | $ | 8,176,157 | $ | — | $ | — | ||||||
Mortgage-Backed Obligations | — | 33,965,738 | — | |||||||||
Asset-Backed Securities | — | 22,417,388 | — | |||||||||
| Investment Company | 3,623,179 | — | — | |||||||||
| Total | $ | 11,799,336 | $ | 56,383,126 | $ | — | ||||||
| Derivative Type | ||||||||||||
| Liabilities(a) | ||||||||||||
| Futures Contracts | $ | (146,058 | ) | $ | — | $ | — | |||||
| (a) | Amount shown represents unrealized gain (loss) at period end. |
| (b) | Amounts are disclosed by continent to highlight the impact of time zone differences between local market close and the calculation of NAV. Security valuations are based on the principal exchange or system on which they are traded, which may differ from country of domicile noted in table. |
For further information regarding security characteristics, see the Schedules of Investments.
4. INVESTMENTS IN DERIVATIVES
The following tables set forth, by certain risk types, the gross value of derivative contracts as of June 30, 2016. These instruments were used as part of the Funds’ investment strategies and to obtain and/or manage exposure related to the risks below. The values in the tables below exclude the effects of cash collateral received or posted pursuant to these derivative contracts, and therefore are not representative of the Funds’ net exposure.
60
GOLDMAN SACHS VARIABLE INSURANCE TRUST FUNDS
4. INVESTMENTS IN DERIVATIVES (continued)
Core Fixed Income
| Risk | Statements of Assets and Liabilities | Assets | Statements of Assets and Liabilities | Liabilities | ||||||||||
| Interest Rate | Variation margin on certain derivative contracts | $ | 267,907 | (a) | Variation margin on certain derivative contracts | $ | (168,939 | )(a) | ||||||
| Credit | Variation margin on certain derivative contracts | — | Variation margin on certain derivative contracts | (2,947 | ) | |||||||||
| Currency | Receivables for unrealized gain on forward foreign currency exchange contracts | 185,107 | Payable for unrealized loss on forward foreign currency exchange contracts | (224,243 | ) | |||||||||
| Total | $ | 453,014 | $ | (396,129 | ) | |||||||||
| Fund | Risk | Statements of Assets and Liabilities | Assets(a) | Statements of Assets and Liabilities | Liabilities(a) | |||||||||
| Equity Index | Equity | Variation margin on certain derivative contracts | $ | 12,075 | Variation margin on certain derivative contracts | $ | — | |||||||
| High Quality Floating Rate | Interest Rate | Variation margin on certain derivative contracts | — | Variation margin on certain derivative contracts | (146,058 | ) | ||||||||
| (a) | Includes unrealized gain (loss) on futures contracts and swap contracts described in the Additional Investment Information sections of the Schedules of Investments. Only current day’s variation margin is reported within the Statements of Assets and Liabilities. |
The following table sets forth, by certain risk types, the Fund’s gains (losses) related to these derivatives and their indicative volumes for the six months ended June 30, 2016. These gains (losses) should be considered in the context that these derivative contracts may have been executed to create investment opportunities and/or economically hedge certain investments, and accordingly, certain gains (losses) on such derivative contracts may offset certain (losses) gains attributable to investments. These gains (losses) are included in “Net realized gain (loss)” or “Net change in unrealized gain (loss)” on the Statements of Operations:
Core Fixed Income
| Risk | Statements of Operations | Net Realized Gain (Loss) | Net Change in Unrealized Gain (Loss) | Average Number of Contracts(a) | ||||||||||
| Interest Rate | Net realized gain (loss) from investments, futures contracts and swap contracts/Net change in unrealized gain (loss) on futures contracts and swap contracts | $ | 10,668 | $ | 119,696 | 130 | ||||||||
| Credit | Net realized gain (loss) from swap contracts/Net change in unrealized gain (loss) on swap contracts | (53,001 | ) | $ | (2,947 | ) | 1 | |||||||
| Currency | Net realized gain (loss) from forward foreign currency exchange contracts/Net change in unrealized gain (loss) on forward foreign currency exchange contracts | (168,072 | ) | (13,269 | ) | 184 | ||||||||
| Total | $ | (210,405 | ) | $ | 103,480 | 315 | ||||||||
| (a) | Average number of contracts is based on the average of month end balances for the six months ended June 30, 2016. |
61
GOLDMAN SACHS VARIABLE INSURANCE TRUST FUNDS
Notes to Financial Statements (continued)
June 30, 2016 (Unaudited)
4. INVESTMENTS IN DERIVATIVES (continued)
The following table represents gains (losses) which are included in “Net realized gain (loss) from future transactions” and “Net change in unrealized gain (loss) on futures” in the Statements of Operations:
| Fund | Risk | Net Realized Gain (Loss) | Net Change in Unrealized Gain (Loss) | Average Number of Contracts(a) | ||||||||||||||
Equity Index | Equity | $ | 23,384 | $ | 12,969 | 10 | ||||||||||||
High Quality Floating Rate | Interest Rate | (97,689 | ) | (157,313 | ) | 50 | ||||||||||||
| (a) | Average number of contracts is based on the average of month end balances for the period ended June 30, 2016. |
5. AGREEMENTS AND AFFILIATED TRANSACTIONS
A. Management Agreements — Under the Agreements, GSAM manages the Funds, subject to the general supervision of the Trustees.
As compensation for the services rendered pursuant to the Agreements, the assumption of the expenses related thereto and administration of the Funds’ business affairs, including providing facilities, GSAM is entitled to a management fee, accrued daily and paid monthly, equal to an annual percentage rate of each Fund’s average daily net assets.
For the six months ended June 30, 2016, contractual and effective net management fees with GSAM were at the following rates:
| Contractual Management Rate | Effective Net Management Rate^ | |||||||||||||||||||||||||||
| Fund | First $1 billion | Next $1 billion | Next $3 billion | Next $3 billion | Over $8 billion | Effective Rate | ||||||||||||||||||||||
| Core Fixed Income | 0.40 | % | 0.36 | % | 0.34 | % | 0.33 | % | 0.32 | % | 0.40 | % | 0.40 | % | ||||||||||||||
| Growth Opportunities | 1.00 | 1.00 | 0.90 | 0.86 | 0.84 | 1.00 | 0.87 | * | ||||||||||||||||||||
| High Quality Floating Rate | 0.40 | 0.36 | 0.34 | 0.33 | 0.32 | 0.40 | 0.30 | * | ||||||||||||||||||||
| ^ | Effective Net Management Rate includes the impact of management fee waivers of affiliated underlying funds, if any. |
| * | GSAM agreed to waive a portion of its management fee in order to achieve net management rates, as defined in the Funds’ most recent prospectuses. These waivers will be effective through at least April 29, 2017 and prior to such date GSAM may not terminate the arrangements without approval of the Trustees. |
The Core Fixed Income and High Quality Floating Rate Funds invest in FST Institutional Shares of the Goldman Sachs Financial Square Government Fund, which is an affiliated Underlying Fund. GSAM has agreed to waive a portion of its management fee payable by the Funds in an amount equal to the management fee it earns as an investment adviser to any of the affiliated Underlying Funds in which the Funds invest. For the six months ended June 30, 2016, GSAM waived $662 and $3,428 of the Core Fixed Income and High Quality Floating Rate Funds’ management fees, respectively.
The Agreement for the Equity Index Fund provides for a contractual management fee at an annual rate equal to 0.30% of the Fund’s average daily net assets. For the six months ended June 30, 2016, GSAM agreed to waive a portion of its management fee in order to achieve the following effective annual rates which will remain in effect through April 29, 2017 and prior to such date GSAM may not terminate the arrangement without the approval of the Trustees:
| Management Rate | ||||||
| Fund | $0-$400 million | Over $400 million | Effective Rate | |||
| Equity Index | 0.21% | 0.20% | 0.21% | |||
62
GOLDMAN SACHS VARIABLE INSURANCE TRUST FUNDS
5. AGREEMENTS AND AFFILIATED TRANSACTIONS (continued)
As authorized by the Agreement, GSAM has entered into a Sub-advisory Agreement with SSgA Funds Management, Inc. (“SSgA”) which serves as the sub-adviser to the Equity Index Fund and provides the day-to-day advice regarding the Fund’s portfolio transactions. As compensation for its services, SSgA is entitled to a fee, accrued daily and paid monthly by GSAM, at the following annual rates of the Fund’s average daily net assets: 0.03% on the first $50 million, 0.02% on the next $200 million, 0.01% on the next $750 million and 0.008% over $1 billion. The effective Sub-advisory fee was 0.02% for the six months ended June 30, 2016.
B. Distribution and Service Plans — The Trust, on behalf of each Fund, has adopted Distribution and Service Plans (the “Plans”). Under the Plans, Goldman Sachs, which serves as distributor (the “Distributor”), is entitled to a fee accrued daily and paid monthly, for distribution services and personal and account maintenance services, which may then be paid by Goldman Sachs to authorized dealers, equal to, on an annual basis, 0.25% and 0.40% of the Fund’s average daily net assets attributable to Service and Advisor Shares, respectively. For the six months ended June 30, 2016 for the Growth Opportunities Fund, Goldman Sachs agreed to waive distribution and services fees so as not to exceed an annual rate of 0.16% of average daily net assets of the Fund. This distribution and service fee waiver will remain in place through at least April 29, 2017, and prior to such date Goldman Sachs may not terminate the arrangement without the approval of the Trustees.
C. Transfer Agency Agreement — Goldman Sachs also serves as the transfer agent of the Funds for a fee pursuant to the Transfer Agency Agreement. The fees charged for such transfer agency services are accrued daily and paid monthly at an annual rate of 0.02% of the average daily net assets for Institutional, Service and Advisor Shares.
D. Other Expense Agreements and Affiliated Transactions — GSAM has agreed to limit certain “Other Expenses” of the Funds (excluding acquired fund fees and expenses, transfer agency fees and expenses, taxes, interest, brokerage fees, shareholder meeting, litigation, indemnification and extraordinary expenses) to the extent such expenses exceed, on an annual basis, a percentage rate of the average daily net assets of each Fund. Such Other Expense reimbursements, if any, are accrued daily and paid monthly. In addition, the Funds are not obligated to reimburse GSAM for prior fiscal year expense reimbursements, if any. The Other Expense limitations as an annual percentage rate of average daily net assets for Core Fixed Income, Equity Index, Growth Opportunities and High Quality Floating Rate Funds are 0.004%, 0.004%, 0.004% and 0.074%, respectively. These Other Expense limitations will remain in place through at least April 29, 2017, and prior to such date GSAM may not terminate the arrangements without the approval of the Trustees. In addition, the Funds have entered into certain offset arrangements with the custodian and the transfer agent, which may result in a reduction of the Funds’ expenses and are received irrespective of the application of the “Other Expense” limitations described above.
For the six months ended June 30, 2016, these expense reductions, including any fee waivers and Other Expense reimbursements, were as follows:
| Fund | Management Fee Waiver | Distribution and Service Fee Waiver | Custody Fee Credits | Other Expense Reimbursement | Total Expense Reductions | |||||||||||||||||
| Core Fixed Income | $ | 662 | $ | — | $ | 1,409 | $ | 143,189 | $ | 145,260 | ||||||||||||
| Equity Index | 72,195 | — | 195 | 136,638 | 209,028 | |||||||||||||||||
| Growth Opportunities | 103,949 | 71,951 | 1,330 | 106,629 | 283,859 | |||||||||||||||||
| High Quality Floating Rate | 34,525 | — | 50 | 84,704 | 119,279 | |||||||||||||||||
E. Line of Credit Facility — As of June 30, 2016, the Funds participated in a $1,100,000,000 committed, unsecured revolving line of credit facility (the “facility”) together with other funds of the Trust and registered investment companies having management agreements with GSAM or its affiliates (“Other Borrowers”). This facility is to be used for temporary or emergency purposes, or to allow for an orderly liquidation of securities to meet redemption requests. The interest rate on borrowings is based
63
GOLDMAN SACHS VARIABLE INSURANCE TRUST FUNDS
Notes to Financial Statements (continued)
June 30, 2016 (Unaudited)
5. AGREEMENTS AND AFFILIATED TRANSACTIONS (continued)
on the federal funds rate. The facility also requires a fee to be paid by the Funds based on the amount of the commitment that has not been utilized. For the six months ended June 30, 2016, the Funds did not have any borrowings under the facility.
F. Other Transactions with Affiliates — The following table provides information about the investment in shares of issuers of which a Fund is an affiliate as of and for the six months ended June 30, 2016:
| Fund | Name of Affiliated Issuer | Market Value 12/31/2015 | Purchases at Cost | Proceeds from Sales | Net Realized Gain (Loss) | Change in Unrealized Appreciation (Depreciation) | Market Value 6/30/2016 | Dividend Income | ||||||||||||||||||||||||
| Equity Index | The Goldman Sachs Group, Inc. | $ | 669,374 | $ | — | $ | (41,383 | ) | $ | 7,261 | $ | (123,245 | ) | $ | 512,007 | $ | 4,679 | |||||||||||||||
The following table provides information about the Funds’ investment in the Goldman Sachs Financial Square Government Fund as of and for the six months ended June 30, 2016:
| Fund | Market Value | Purchases at Cost | Proceeds from Sales | Market Value 6/30/2016 | Dividend Income | |||||||||||||||||
| Core Fixed Income | $ | — | $ | 16,291,827 | $ | (16,291,827 | ) | $ | — | $ | 1,091 | |||||||||||
| High Quality Floating Rate | 10,347,519 | 14,296,533 | (21,020,873 | ) | 3,623,179 | 5,264 | ||||||||||||||||
As of June 30, 2016, the Goldman Sachs Group, Inc. was the beneficial owner of approximately 100% of the Institutional Shares of the Core Fixed Income, Growth Opportunities and High Quality Floating Rate Funds.
6. PORTFOLIO SECURITIES TRANSACTIONS
The cost of purchases and proceeds from sales and maturities of long-term securities for the six months ended June 30, 2016, were as follows:
| Fund | Purchases of U.S. Government and Agency Obligations | Purchases (Excluding U.S. Government and Agency Obligations) | Sales and Maturities of U.S. Government and Agency Obligations | Sales and Maturities (Excluding U.S. Government and Agency Obligations) | ||||||||||||||
| Core Fixed Income | $ | 186,112,616 | $ | 10,791,463 | $ | 198,791,261 | $ | 14,997,272 | ||||||||||
| Equity Index | — | 2,797,748 | — | 12,449,766 | ||||||||||||||
| Growth Opportunities | — | 50,932,764 | — | 55,661,965 | ||||||||||||||
| High Quality Floating Rate | 15,975,906 | 5,633,469 | 9,000,182 | 7,211,192 | ||||||||||||||
64
GOLDMAN SACHS VARIABLE INSURANCE TRUST FUNDS
7. TAX INFORMATION
As of the Funds’ most recent fiscal year end, December 31, 2015, the Funds’ capital loss carryforwards and certain timing differences, on a tax-basis were as follows:
| Core Fixed Income | Equity Index | Growth Opportunities | High Quality Floating Rate | |||||||||||||
| Capital loss carryforwards:(1) | ||||||||||||||||
Expiring 2017 | $ | (264,763 | ) | $ | — | $ | — | $ | — | |||||||
Expiring 2018 | (4,488,774 | ) | — | — | — | |||||||||||
Perpetual short-term | — | — | — | (275,908 | ) | |||||||||||
Perpetual long-term | — | — | — | (595,824 | ) | |||||||||||
| Total capital loss carryforwards | $ | (4,753,537 | ) | $ | — | $ | — | $ | (871,732 | ) | ||||||
| Timing differences (Qualified late year loss and straddle loss deferrals and certain REIT dividends) | (1,266,922 | ) | 4,012 | (336,485 | ) | (12,359 | ) | |||||||||
| (1) | Expiration occurs on December 31 of the year indicated. |
As of June 30, 2016, the Funds’ aggregate security unrealized gains and losses based on cost for U.S. federal income tax purposes were as follows:
| Core Fixed Income | Equity Index | Growth Opportunities | High Quality Floating Rate | |||||||||||||
| Tax cost | $ | 107,078,933 | $ | 88,503,256 | $ | 130,621,115 | $ | 68,207,960 | ||||||||
| Gross unrealized gain | 5,331,700 | 88,164,150 | 36,517,182 | 370,675 | ||||||||||||
| Gross unrealized loss | (560,294 | ) | (13,982,914 | ) | (3,692,779 | ) | (396,173 | ) | ||||||||
| Net unrealized security gain (loss) | $ | 4,771,406 | $ | 74,181,236 | $ | 32,824,403 | $ | (25,498 | ) | |||||||
The difference between GAAP-basis and tax-basis unrealized gains (losses) is attributable primarily to wash sales, net mark to market gains (losses) on regulated futures and foreign currency contracts, and differences in the tax treatment of underlying fund investments, foreign currency transactions, real estate investment trust investments and inflation-protected securities.
GSAM has reviewed the Funds’ tax positions for all open tax years (the current and prior three years, as applicable) and has concluded that no provision for income tax is required in the Funds’ financial statements. Such open tax years remain subject to examination and adjustment by tax authorities.
8. OTHER RISKS
The Funds’ risks include, but are not limited to, the following:
Derivatives Risk — Loss may result from the Funds’ investments in derivative instruments. These instruments may be illiquid, difficult to price and leveraged so that small changes in the value of the underlying instruments may produce disproportionate losses to the Funds. Derivatives are also subject to counterparty risk, which is the risk that the other party in the transaction will not fulfill its contractual obligation. Losses from investments in derivatives can also result from a lack of correlation between changes in the value of derivative instruments and the portfolio assets (if any) being hedged.
Interest Rate Risk — When interest rates increase, fixed income securities or instruments held by the Funds will generally decline in value. Long-term fixed income securities or instruments will normally have more price volatility because of this risk than short-term fixed income securities or instruments. The risks associated with increasing rates are heightened given that interest rates
65
GOLDMAN SACHS VARIABLE INSURANCE TRUST FUNDS
Notes to Financial Statements (continued)
June 30, 2016 (Unaudited)
8. OTHER RISKS (continued)
are near historic lows, but may be expected to increase in the future with unpredictable effects on the markets and the Fund’s investments.
Investments in Other Investment Companies — As a shareholder of another investment company, including an exchange traded fund (“ETF”), a Fund will indirectly bear its proportionate share of any net management fees and other expenses paid by such other investment companies, in addition to the fees and expenses regularly borne by the Fund. ETFs are subject to risks that do not apply to conventional mutual funds, including but not limited to the following: (i) the market price of the ETF’s shares may trade at a premium or a discount to their NAV; and (ii) an active trading market for an ETF’s shares may not develop or be maintained.
Large Shareholder Transactions Risk — A Fund may experience adverse effects when certain large shareholders, such as other funds, participating insurance companies, accounts and Goldman Sachs affiliates, purchase or redeem large amounts of shares of a Fund. Such large shareholder redemptions may cause a Fund to sell portfolio securities at times when it would not otherwise do so, which may negatively impact a Fund’s NAV and liquidity. These transactions may also accelerate the realization of taxable income to shareholders if such sales of investments resulted in gains, and may also increase transaction costs. In addition, a large redemption could result in a Fund’s current expenses being allocated over a smaller asset base, leading to an increase in the Fund’s expense ratio. Similarly, large Fund share purchases may adversely affect a Fund’s performance to the extent that the Fund is delayed in investing new cash and is required to maintain a larger cash position than it ordinarily would.
Liquidity Risk — A Fund may make investments that are illiquid or that may become less liquid in response to market developments or adverse investor perceptions. Illiquid investments may be more difficult to value. Liquidity risk may also refer to the risk that a Fund will not be able to pay redemption proceeds within the allowable time period because of unusual market conditions, an unusually high volume of redemption requests, or other reasons. To meet redemption requests, a Fund may be forced to sell investments at an unfavorable time and/or under unfavorable conditions. Liquidity risk may be the result of, among other things, the reduced number and capacity of traditional market participants to make a market in fixed income securities or the lack of an active market. The potential for liquidity risk may be magnified by a rising interest rate environment or other circumstances where investor redemptions from fixed income mutual funds may be higher than normal, potentially causing increased supply in the market due to selling activity.
Market and Credit Risks — In the normal course of business, a fund trades financial instruments and enters into financial transactions where risk of potential loss exists due to changes in the market (market risk). Additionally, a Fund may also be exposed to credit risk in the event that an issuer or guarantor fails to perform or that an institution or entity with which the Fund has unsettled or open transactions defaults.
Short Position Risk — A Fund may enter into a short position through a futures contract, an option or swap agreement or through short sales of any instrument that a Fund may purchase for investment. Taking short positions involves leverage of a Fund’s assets and presents various risks. If the value of the underlying instrument or market in which a Fund has taken a short position increases, then the Fund will incur a loss equal to the increase in value from the time that the short position was entered into plus any related interest payments or other fees. Taking short positions involves the risk that losses may be disproportionate, may exceed the amount invested, and may be unlimited.
9. INDEMNIFICATIONS
Under the Trust’s organizational documents, its Trustees, officers, employees and agents are indemnified, to the extent permitted by the Act and state law, against certain liabilities that may arise out of performance of their duties to the Funds. Additionally, in the course of business, the Funds enter into contracts that contain a variety of indemnification clauses. The Funds’ maximum exposure under these arrangements is unknown, as this would involve future claims that may be made against the Funds that have not yet occurred. However, GSAM believes the risk of loss under these arrangements to be remote.
66
GOLDMAN SACHS VARIABLE INSURANCE TRUST FUNDS
10. SUBSEQUENT EVENTS
Subsequent events after the Statements of Assets and Liabilities date have been evaluated through the date the financial statements were issued. GSAM has concluded that there is no impact requiring adjustment or disclosure in the financial statements.
11. SUMMARY OF SHARE TRANSACTIONS
Share activity is as follows:
| Core Fixed Income Fund | ||||||||||||||||
| For the Six Months Ended June 30, 2016 (Unaudited) | For the Fiscal Year Ended December 31, 2015 | |||||||||||||||
| Shares | Dollars | Shares | Dollars | |||||||||||||
| Institutional Shares | ||||||||||||||||
| Reinvestment of distributions | 39 | $ | 418 | 65 | $ | 693 | ||||||||||
| 39 | 418 | 65 | 693 | |||||||||||||
| Service Shares | ||||||||||||||||
| Shares sold | 1,157,775 | 12,414,404 | 1,613,636 | 17,192,161 | ||||||||||||
| Reinvestment of distributions | 147,647 | 1,589,499 | 232,121 | 2,475,317 | ||||||||||||
| Shares redeemed | (813,088 | ) | (8,709,813 | ) | (1,839,915 | ) | (19,689,934 | ) | ||||||||
| 492,334 | 5,294,090 | 5,842 | (22,456 | ) | ||||||||||||
| NET INCREASE (DECREASE) | 492,373 | $ | 5,294,508 | 5,907 | $ | (21,763 | ) | |||||||||
| Equity Index Fund | ||||||||||||||||
| For the Six Months Ended June 30, 2016 (Unaudited) | For the Fiscal Year Ended December 31, 2015 | |||||||||||||||
| Shares | Dollars | Shares | Dollars | |||||||||||||
| Service Shares | ||||||||||||||||
| Shares sold | 117,862 | $ | 1,597,360 | 231,558 | $ | 3,490,618 | ||||||||||
| Reinvestment of distributions | — | — | 925,695 | 12,857,900 | ||||||||||||
| Shares redeemed | (948,705 | ) | (13,016,144 | ) | (1,733,704 | ) | (26,070,660 | ) | ||||||||
| NET DECREASE | (830,843 | ) | $ | (11,418,784 | ) | (576,451 | ) | $ | (9,722,142 | ) | ||||||
67
GOLDMAN SACHS VARIABLE INSURANCE TRUST FUNDS
Notes to Financial Statements (continued)
June 30, 2016 (Unaudited)
11. SUMMARY OF SHARE TRANSACTIONS (continued)
| Growth Opportunities Fund | ||||||||||||||||
| For the Six Months Ended June 30, 2016 (Unaudited) | For the Fiscal Year Ended December 31, 2015 | |||||||||||||||
| Shares | Dollars | Shares | Dollars | |||||||||||||
| Institutional Shares | ||||||||||||||||
| Reinvestment of distributions | — | $ | — | 392 | $ | 2,613 | ||||||||||
| — | — | 392 | 2,613 | |||||||||||||
| Service Shares | ||||||||||||||||
| Shares sold | 1,293,817 | 8,543,546 | 1,275,515 | 9,813,897 | ||||||||||||
| Reinvestment of distributions | — | — | 2,117,685 | 14,040,255 | ||||||||||||
| Shares redeemed | (1,750,095 | ) | (11,381,276 | ) | (4,322,894 | ) | (33,053,396 | ) | ||||||||
| (456,278 | ) | (2,837,730 | ) | (929,694 | ) | (9,199,244 | ) | |||||||||
| NET DECREASE | (456,278 | ) | $ | (2,837,730 | ) | (929,302 | ) | $ | (9,196,631 | ) | ||||||
| High Quality Floating Rate Fund | ||||||||||||||||
| For the Six Months Ended June 30, 2016 (Unaudited) | For the Fiscal Year Ended December 31, 2015 | |||||||||||||||
| Shares | Dollars | Shares | Dollars | |||||||||||||
| Institutional Shares | ||||||||||||||||
| Reinvestment of distributions | 12 | $ | 123 | 17 | $ | 176 | ||||||||||
| 12 | 123 | 17 | 176 | |||||||||||||
| Service Shares | ||||||||||||||||
| Shares sold | 296,923 | 3,076,646 | 591,898 | 6,176,818 | ||||||||||||
| Reinvestment of distributions | 23,783 | 246,030 | 30,398 | 316,783 | ||||||||||||
| Shares redeemed | (526,108 | ) | (5,451,526 | ) | (1,067,471 | ) | (11,135,815 | ) | ||||||||
| (205,402 | ) | (2,128,850 | ) | (445,175 | ) | (4,642,214 | ) | |||||||||
| Advisor Shares | ||||||||||||||||
| Shares sold | 239,700 | 2,486,171 | 259,411 | 2,714,004 | ||||||||||||
| Reinvestment of distributions | 695 | 7,201 | 296 | 3,093 | ||||||||||||
| Shares redeemed | (208,166 | ) | (2,157,585 | ) | (134,130 | ) | (1,402,982 | ) | ||||||||
| 32,229 | 335,787 | 125,577 | 1,314,115 | |||||||||||||
| NET DECREASE | (173,161 | ) | $ | (1,792,940 | ) | (319,581 | ) | $ | (3,327,923 | ) | ||||||
68
GOLDMAN SACHS VARIABLE INSURANCE TRUST FUNDS
| Fund Expenses — Six Month Period Ended June 30, 2016 (Unaudited) |
As a shareholder of Institutional, Service or Advisor Shares of the Fund, you incur ongoing costs, including management fees, distribution and service (12b-1) fees (with respect to Service and Advisor Shares) and other Fund expenses. This example is intended to help you understand your ongoing costs (in dollars) of investing in the Institutional Shares, Service Shares and Advisor Shares of the Funds and to compare these costs with the ongoing costs of investing in other mutual funds.
The example is based on an investment of $1,000 invested at the beginning of the period and held for the entire period from January 1, 2016 through June 30, 2016, which represents a period of 182 days of a 366 day year.
Actual Expenses — The first line under each share class in the table below provides information about actual account values and actual expenses. You may use the information in this line, together with the amount you invested, to estimate the expenses that you paid over the period. Simply divide your account value by $1,000 (for example, an $8,600 account value divided by $1,000=8.6), then multiply the result by the number in the first line under the heading entitled “Expenses Paid” to estimate the expenses you paid on your account during this period.
Hypothetical Example for Comparison Purposes — The second line under each share class in the table below provides information about hypothetical account values and hypothetical expenses based on the Funds' actual net expense ratio and an assumed rate of return of 5% per year before expenses, which is not the Funds' actual return. The hypothetical account values and expenses may not be used to estimate the actual ending account balance or expenses you paid for the period. You may use this information to compare the ongoing costs of investing in the Funds and other funds. To do so, compare this 5% hypothetical example with the 5% hypothetical examples that appear in the shareholder reports of the other funds.
Please note that the expenses shown in the table are meant to highlight your ongoing costs only. As a shareholder of the Fund you do not incur any transaction costs, such as sales charges, redemption fees, or exchange fees, but shareholders of other funds may incur such costs. The second line of the table is useful in comparing ongoing costs only, and will not help you determine the relative total costs of owning different funds whose shareholders may incur transaction costs.
| Core Fixed Income Fund | Equity Index Fund | Growth Opportunities Fund | High Quality Floating Rate Fund | |||||||||||||||||||||||||||||||||||||||||||||
| Share Class | Beginning Account Value 01/01/16 | Ending Account Value 06/30/16 | Expenses Paid for the 6 Months Ended 06/30/16* | Beginning Account Value 01/01/16 | Ending Account Value 06/30/16 | Expenses Paid for the 6 Months Ended 06/30/16* | Beginning Account Value 01/01/16 | Ending Account Value 06/30/16 | Expenses Paid for the 6 Months Ended 06/30/16* | Beginning Account Value 01/01/16 | Ending Account Value 06/30/16 | Expenses Paid for the 6 Months Ended 06/30/16* | ||||||||||||||||||||||||||||||||||||
| Institutional | ||||||||||||||||||||||||||||||||||||||||||||||||
Actual | $ | 1,000 | $ | 1,049.50 | $ | 2.09 | N/A | N/A | N/A | $ | 1,000 | $ | 1,023.80 | $ | 4.53 | $ | 1,000 | $ | 1,003.00 | $ | 1.94 | |||||||||||||||||||||||||||
Hypothetical 5% return | 1,000 | 1,022.82 | + | 2.06 | N/A | N/A | N/A | 1,000 | 1,020.39 | + | 4.52 | 1,000 | 1,022.92 | + | 1.96 | |||||||||||||||||||||||||||||||||
| Service | ||||||||||||||||||||||||||||||||||||||||||||||||
Actual | 1,000 | 1,048.20 | 3.41 | $ | 1,000 | $ | 1,035.90 | $ | 2.43 | 1,000 | 1,022.50 | 5.28 | 1,000 | 1,001.80 | 3.19 | |||||||||||||||||||||||||||||||||
Hypothetical 5% return | 1,000 | 1,021.53 | + | 3.37 | 1,000 | 1,022.48 | + | 2.41 | 1,000 | 1,019.64 | + | 5.27 | 1,000 | 1,021.68 | + | 3.22 | ||||||||||||||||||||||||||||||||
| Advisor | ||||||||||||||||||||||||||||||||||||||||||||||||
Actual | N/A | N/A | N/A | N/A | N/A | N/A | N/A | N/A | N/A | 1,000 | 1,001.20 | 3.98 | ||||||||||||||||||||||||||||||||||||
Hypothetical 5% return | N/A | N/A | N/A | N/A | N/A | N/A | N/A | N/A | N/A | 1,000 | 1,020.89 | + | 4.02 | |||||||||||||||||||||||||||||||||||
| * | Expenses are calculated using each Fund’s annualized net expense ratio for each class, which represents the ongoing expenses as a percentage of net assets for the six months ended June 30, 2016. Expenses are calculated by multiplying the annualized net expense ratio by the average account value for the period; then multiplying the result by the number of days in the most recent fiscal half year; and then dividing that result by the number of days in the fiscal year. The annualized net expense ratios for the period were as follows: |
| Fund | Institutional | Service | Advisor | |||||||||
| Core Fixed Income | 0.41 | % | 0.67 | % | N/A | |||||||
| Equity Index | N/A | 0.48 | N/A | |||||||||
| Growth Opportunities | 0.90 | 1.05 | N/A | |||||||||
| High Quality Floating Rate | 0.39 | 0.64 | 0.80 | % | ||||||||
| + | Hypothetical expenses are based on each Fund’s actual annualized net expense ratios and an assumed rate of return of 5% per year before expenses. |
69
GOLDMAN SACHS VARIABLE INSURANCE TRUST FUNDS
Statement Regarding Basis for Approval of Management Agreements (Unaudited)
Background
The Goldman Sachs Core Fixed Income, Goldman Sachs Equity Index, Goldman Sachs Growth Opportunities and Goldman Sachs High Quality Floating Rate Funds (the “Funds”) are investment portfolios of Goldman Sachs Variable Insurance Trust (the “Trust”). The Board of Trustees oversees the management of the Trust and reviews the investment performance and expenses of the Funds at regularly scheduled meetings held throughout the year. In addition, the Board of Trustees determines annually whether to approve the continuance of the Trust’s investment management agreements (the “Management Agreements”) with Goldman Sachs Asset Management, L.P. (the “Investment Adviser”) on behalf of the Funds and the sub-advisory agreement (the “Sub-Advisory Agreement,” and together with the Management Agreements, the “Agreements”) between the Investment Adviser and SSgA Funds Management, Inc. (the “Sub-Adviser”) on behalf of the Equity Index Fund.
The Agreements were most recently approved for continuation until June 30, 2017 by the Board of Trustees, including those Trustees who are not parties to the Agreements or “interested persons” (as defined in the Investment Company Act of 1940, as amended) of any party thereto (the “Independent Trustees”), at a meeting held on June 15-16, 2016 (the “Annual Meeting”).
The review process undertaken by the Trustees spans the course of the year and culminates with the Annual Meeting. To assist the Trustees in their deliberations, the Trustees have established a Contract Review Committee (the “Committee”), comprised of the Independent Trustees. The Committee held three meetings over the course of the year since the Agreements were last approved. At those Committee meetings, regularly scheduled Board or other committee meetings, and/or the Annual Meeting, matters relevant to the renewal of the Agreements were considered by the Board, or the Independent Trustees, as applicable. With respect to each Fund, such matters included:
| (a) | the nature and quality of the advisory, administrative, and other services provided to the Fund by the Investment Adviser and its affiliates, including information about: |
| (i) | the structure, staff, and capabilities of the Investment Adviser and its portfolio management teams; |
| (ii) | the groups within the Investment Adviser and its affiliates that support the portfolio management teams or provide other types of necessary services, including fund services groups (e.g., accounting and financial reporting, tax, shareholder services, and operations); controls and risk management groups (e.g., legal, compliance, valuation oversight, credit risk management, internal audit, compliance testing, market risk analysis, finance, and central funding); sales and distribution support groups, and others (e.g., information technology and training); |
| (iii) | trends in employee headcount; |
| (iv) | the Investment Adviser’s financial resources and ability to hire and retain talented personnel and strengthen its operations; and |
| (v) | the parent company’s support of the Investment Adviser and its mutual fund business, as expressed by the firm’s senior management; |
| (b) | information on the investment performance of the Fund, including comparisons to the performance of similar mutual funds, as provided by a third-party mutual fund data provider engaged as part of the contract review process (the “Outside Data Provider”), and benchmark performance indices, and (in the case of the Core Fixed Income, Growth Opportunities and High Quality Floating Rate Funds) a composite of accounts with comparable investment strategies managed by the Investment Adviser; and general investment outlooks in the markets in which the Fund invests; |
| (c) | information provided by the Investment Adviser indicating the Investment Adviser’s views on whether the Fund’s peer group and/or benchmark index had high, medium, or low relevance given the Fund’s particular investment strategy; |
| (d) | the terms of the Agreements and other agreements with affiliated service providers entered into by the Trust on behalf of the Fund; |
| (e) | fee and expense information for the Fund, including: |
| (i) | the relative management fee and expense level of the Fund as compared to those of comparable funds managed by other advisers, as provided by the Outside Data Provider; |
| (ii) | the Fund’s expense trends over time; and |
| (iii) | to the extent the Investment Adviser manages other types of accounts (such as bank collective trusts, private wealth management accounts, institutional separate accounts, sub-advised mutual funds, and non-U.S. funds) having investment objectives and policies similar to those of the Fund, comparative information on the advisory fees charged and services provided to those accounts by the Investment Adviser; |
| (f) | with respect to the extensive investment performance and expense comparison data provided by the Outside Data Provider, its processes in producing that data for the Fund; |
| (g) | the undertaking of the Investment Adviser and its affiliates to waive certain fees (with respect to the Equity Index, Growth Opportunities and High Quality Floating Rate Funds) and to limit certain expenses of the Fund that exceed a |
70
GOLDMAN SACHS VARIABLE INSURANCE TRUST FUNDS
Statement Regarding Basis for Approval of Management Agreements (Unaudited) (continued)
| specified level; the undertaking of Goldman, Sachs & Co. (“Goldman Sachs”), the Fund’s affiliated distributor, to waive a portion of the distribution and service fees payable by the Growth Opportunities Fund’s Service Shares, and a summary of contractual fee reductions made by the Investment Adviser and/or its affiliates over the past several years with respect to the Fund; |
| (h) | information relating to the profitability of the Management Agreements and the transfer agency and distribution and service arrangements of the Fund and the Trust as a whole to the Investment Adviser and its affiliates; |
| (i) | whether the Fund’s existing management fee schedule adequately addressed any economies of scale; |
| (j) | a summary of the “fall-out” benefits derived by the Investment Adviser and its affiliates from their relationships with the Fund, including the fees received by the Investment Adviser’s affiliates from the Fund for transfer agency, portfolio trading, distribution and other services; |
| (k) | a summary of potential benefits derived by the Fund as a result of its relationships with the Investment Adviser; |
| (l) | information regarding commissions paid by the Equity Index and Growth Opportunities Funds (the “Equity Funds”) and broker oversight, an update on the Investment Adviser’s soft dollars practices (with respect to the Growth Opportunities Fund), other information regarding portfolio trading, and how the Investment Adviser carries out its duty to seek best execution; |
| (m) | the manner in which portfolio manager compensation is determined; and the number and types of accounts managed by the portfolio managers; |
| (n) | the nature and quality of the services provided to the Fund by its unaffiliated service providers (including the Sub-Adviser for the Equity Index Fund), and the Investment Adviser’s general oversight and evaluation (including reports on due diligence) of those service providers as part of the administration services provided under the Management Agreements; and |
| (o) | the Investment Adviser’s processes and policies addressing various types of potential conflicts of interest; its approach to risk management; the annual review of the effectiveness of the Fund’s compliance program; and periodic compliance reports. |
The Trustees also received an overview of the Funds’ distribution arrangements. They received information regarding the Funds’ assets, share purchase and redemption activity, and payment of distribution and service fees. Information was also provided to the Trustees relating to revenue sharing payments made by and services provided by the Investment Adviser and its affiliates to intermediaries that promote the sale, distribution, and/or servicing of Fund shares. The Independent Trustees also discussed the broad range of other investment choices that are available to Fund investors, including the availability of comparable funds managed by other advisers.
The presentations made at the Board and Committee meetings and at the Annual Meeting encompassed the Funds and other mutual funds for which the Board of Trustees has responsibility. In evaluating the Management Agreements at the Annual Meeting, the Trustees relied upon their knowledge, resulting from their meetings and other interactions throughout the year, of the Investment Adviser and its affiliates, their services, and the Funds. In conjunction with these meetings, the Trustees received written materials and oral presentations on the topics covered, and the Investment Adviser addressed the questions and concerns of the Trustees, including concerns regarding the investment performance of certain of the funds they oversee. The Independent Trustees were advised by their independent legal counsel regarding their responsibilities and other regulatory requirements related to the approval and continuation of mutual fund investment management agreements under applicable law. In addition, the Investment Adviser and its affiliates provided the Independent Trustees with a written response to a formal request for information sent on behalf of the Independent Trustees by their independent legal counsel. During the course of their deliberations, the Independent Trustees met in executive sessions with their independent legal counsel, without representatives of the Investment Adviser or its affiliates present.
Nature, Extent, and Quality of the Services Provided Under the Management Agreements
As part of their review, the Trustees considered the nature, extent, and quality of the services provided to the Funds by the Investment Adviser. In this regard, the Trustees considered both the investment advisory services and non-advisory services (including, with respect to the Equity Index Fund, the Investment Adviser’s oversight of the Sub-Adviser) that are provided by the Investment Adviser and its affiliates. The Trustees noted the transition in the leadership and changes in personnel of various of the Investment Adviser’s portfolio management teams that had occurred in recent periods, and the ongoing recruitment efforts aimed at bringing high quality investment talent to the Investment Adviser. They also noted the Investment Adviser’s commitment to maintaining high quality systems and expending substantial resources to respond to ongoing changes to the regulatory and control environment in which the Funds and their service providers operate, as well as the efforts of the Investment Adviser and its
71
GOLDMAN SACHS VARIABLE INSURANCE TRUST FUNDS
Statement Regarding Basis for Approval of Management Agreements (Unaudited) (continued)
affiliates to combat cyber security risks. The Trustees concluded that the Investment Adviser continued to commit substantial financial and operational resources to the Funds and expressed confidence that the Investment Adviser would continue to do so in the future. The Trustees also recognized that the Investment Adviser had made significant commitments to address regulatory compliance requirements applicable to the Funds and the Investment Adviser and its affiliates.
Investment Performance
The Trustees also considered the investment performance of the Funds. In this regard, they compared the investment performance of each Fund to its peers using rankings and ratings compiled by the Outside Data Provider as of December 31, 2015, and updated performance information prepared by the Investment Adviser using the peer group identified by the Outside Data Provider as of March 31, 2016. The information on each Fund’s investment performance was provided for the one-, three-, five- and ten-year periods ending on the applicable dates, to the extent that each Fund has been in existence for those periods. The Trustees also reviewed each Fund’s investment performance relative to its performance benchmark. As part of this review, they considered the investment performance trends of the Funds over time, and reviewed the investment performance of each Fund in light of its investment objective and policies and market conditions. The Trustees also received information comparing the Core Fixed Income, Growth Opportunities and High Quality Floating Rate Funds’ performance to that of composites of accounts with comparable investment strategies managed by the Investment Adviser.
In addition, the Trustees considered materials prepared and presentations made by the Investment Adviser’s senior management and portfolio management personnel in which Fund performance was assessed. The Trustees also considered the Investment Adviser’s periodic reports with respect to the Funds’ risk profiles, and how the Investment Adviser’s approach to risk monitoring and management influences portfolio management.
The Trustees observed that the Core Fixed Income Fund’s Institutional Shares had placed in the top half of the Fund’s peer group and had underperformed the Fund’s benchmark index for the one-year period ended March 31, 2016. The Trustees also observed that the Equity Index Fund’s Service Shares had placed in the top half of the Fund’s peer group and had underperformed the Fund’s benchmark index by an amount approximately equal to Fund fees and expenses for the one-, three-, five-, and ten-year periods ended March 31, 2016. The Trustees noted that the Growth Opportunities Fund’s Institutional Shares had placed in the third quartile of the Fund’s peer group and had underperformed the Fund’s benchmark index for the one-year period ended March 31, 2016. They also noted that the High Quality Floating Rate Fund had placed in the fourth quartile of the Fund’s peer group and had underperformed the Fund’s benchmark index for the one-year period ended March 31, 2016.
Costs of Services Provided and Competitive Information
The Trustees considered the contractual terms of the Agreements and the fee rates payable by each Fund under its respective Management Agreement and, with respect to the Equity Index Fund, payable by the Investment Adviser under the Sub-Advisory Agreement. In this regard, the Trustees considered information on the services rendered by the Investment Adviser to the Funds, which included both advisory and administrative services that were directed to the needs and operations of the Funds as registered mutual funds.
In particular, the Trustees reviewed analyses prepared by the Outside Data Provider regarding the expense rankings of the Funds. The analyses provided a comparison of each Fund’s management fees and breakpoints (as applicable) to those of a relevant peer group and category universe; an expense analysis which compared each Fund’s overall net and gross expenses to a peer group and a category universe; and a five-year history (or, in the case of Funds that commenced investment operations within a shorter period, since the year in which it commenced operations) comparing each Fund’s net expenses to the peer and category medians. The analyses also compared each Fund’s transfer agency, custody and distribution fees, other expenses and fee waivers/reimbursements to those of the peer group and category medians. The Trustees concluded that the comparisons provided by the Outside Data Provider were useful in evaluating the reasonableness of the management fees and total expenses paid by the Funds.
In addition, the Trustees considered the Investment Adviser’s undertaking to waive a portion of its management fees (with respect to the Equity Index, Growth Opportunities, and High Quality Floating Rate Funds) and to limit certain expenses of the Funds that exceed specified levels as well as the undertaking of Goldman Sachs to waive a portion of the distribution and service fees payable by the Growth Opportunities Fund’s Service Shares. The Trustees also noted that certain changes were being made to existing fee waiver or expense limitation arrangements of the Growth Opportunities and High Quality Floating Rate Funds that would have the effect of decreasing total Fund expenses, with such changes taking effect in connection with the Funds’ next annual registration statement update. They also considered, to the extent that the Investment Adviser manages other types of accounts having investment objectives and policies similar to those of the Funds, comparative fee information for services provided by the Investment Adviser to those accounts, and information that indicated that services provided to the Funds differed in various
72
GOLDMAN SACHS VARIABLE INSURANCE TRUST FUNDS
Statement Regarding Basis for Approval of Management Agreements (Unaudited) (continued)
significant respects from the services provided to other types of accounts which, in many cases, operated under less stringent legal and regulatory structures, required fewer services from the Investment Adviser to a smaller number of client contact points, and were less time-intensive.
In addition, the Trustees noted that shareholders are able to redeem their Fund shares at any time if shareholders believe that the Fund fees and expenses are too high or if they are dissatisfied with the performance of a Fund.
Profitability
The Trustees reviewed the Investment Adviser’s revenues and pre-tax profit margins with respect to the Trust and each of the Funds. In this regard the Trustees noted that they had received, among other things, profitability analyses and summaries, revenue and expense schedules by Fund and by function (i.e., investment management, transfer agency and distribution and service), and information on the Investment Adviser’s expense allocation methodology. They observed that the profitability and expense figures are substantially similar to those used by the Investment Adviser for many internal purposes, including compensation decisions among various business groups, and are thus subject to a vigorous internal debate about how certain revenue and expenses should be allocated. The Trustees also noted that the internal audit group within the Goldman Sachs organization had audited the expense allocation methodology and was satisfied with the reasonableness, consistency, and accuracy of the Investment Adviser’s expense allocation methodology and profitability analysis calculations. Profitability data for the Trust and each Fund were provided for 2015 and 2014, and the Trustees considered this information in relation to the Investment Adviser’s overall profitability. The Trustees considered the Investment Adviser’s revenues and pre-tax profit margins both in absolute terms and in comparison to information on the reported pre-tax profit margins earned by certain other asset management firms.
Economies of Scale
The Trustees considered the information that had been provided regarding the Investment Adviser’s profitability. The Trustees also considered the breakpoints in the fee rate payable under the Management Agreement for each of the Core Fixed Income, Growth Opportunities and High Quality Floating Rate Funds at the following annual percentage rates of the average daily net assets of the Funds:
| Core Fixed Income Fund | High Quality Floating Rate Fund | |||||||
| First $1 billion | 0.40 | % | 0.40 | % | ||||
| Next $1 billion | 0.36 | 0.36 | ||||||
| Next $3 billion | 0.34 | 0.34 | ||||||
| Next $3 billion | 0.33 | 0.33 | ||||||
| Over $8 billion | 0.32 | 0.32 | ||||||
| Growth Opportunities Fund | ||||
| First $2 billion | 1.00 | % | ||
| Next $3 billion | 0.90 | |||
| Next $3 billion | 0.86 | |||
| Over $8 billion | 0.84 | |||
The Trustees noted that the breakpoints were designed to share potential economies of scale, if any, with the Funds and their shareholders as assets under management reach those asset levels. The Trustees considered the amounts of assets in the Funds; the Funds’ recent share purchase and redemption activity; the information provided by the Investment Adviser relating to the costs of the services provided by the Investment Adviser and its affiliates and their realized profits; information comparing fee rates charged by the Investment Adviser with fee rates charged to other funds in the peer groups; and the Investment Adviser’s undertaking to waive a portion of its management fees (with respect to the Equity Index, Growth Opportunities and High Quality Floating Rate Funds) and to limit certain expenses of the Funds that exceed specified levels. Upon reviewing these matters at the Annual Meeting, the Trustees concluded that the fee breakpoints represented a means of assuring that benefits of scalability, if any, would be passed along to shareholders at the specified asset levels.
73
GOLDMAN SACHS VARIABLE INSURANCE TRUST FUNDS
Statement Regarding Basis for Approval of Management Agreements (Unaudited) (continued)
With respect to the Equity Index Fund, the Trustees noted that, while its Management Agreement did not have breakpoints, the Investment Adviser had agreed to waive a portion of its management fee in order to achieve the following effective annual rates: 0.21% on the first $400 million of average daily net assets and 0.20% of average daily net assets in excess of $400 million. The Trustees noted that, in addition to the Investment Adviser’s management fee waiver mentioned above, the Fund’s total expenses were further reduced by the Investment Adviser’s undertaking to limit certain expenses of the Fund that exceed a specified level.
Other Benefits to the Investment Adviser and Its Affiliates
The Trustees also considered the other benefits derived by the Investment Adviser and its affiliates from their relationships with the Funds as stated above, including: (a) transfer agency fees received by Goldman Sachs; (b) brokerage and futures commissions earned by Goldman Sachs for executing securities transactions on behalf of the Equity Funds and futures transactions on behalf of the Funds; (c) research received by the Investment Adviser from broker-dealers in exchange for executing certain transactions on behalf of the Growth Opportunities Fund; (d) trading efficiencies resulting from aggregation of orders of the Funds with those for other funds or accounts managed by the Investment Adviser; (e) the Investment Adviser’s ability to leverage the infrastructure designed to service the Funds on behalf of its other clients; (f) the Investment Adviser’s ability to cross-market other products and services to Fund shareholders; (g) Goldman Sachs’ retention of certain fees as Fund Distributor; (h) the Investment Adviser’s ability to negotiate better pricing with custodians on behalf of its other clients, as a result of the relationship with the Funds; and (i) the possibility that the working relationship between the Investment Adviser and the Funds’ third-party service providers may cause those service providers to be more likely to do business with other areas of Goldman Sachs. In the course of considering the foregoing, the Independent Trustees requested and received further information quantifying certain of these fall-out benefits.
Other Benefits to the Funds and Their Shareholders
The Trustees also noted that the Funds receive certain potential benefits as a result of their relationship with the Investment Adviser, including: (a) trading efficiencies resulting from aggregation of orders of the Funds with those of other funds or accounts managed by the Investment Adviser; (b) enhanced servicing from vendors because of the volume of business generated by the Investment Adviser and its affiliates; (c) enhanced servicing from broker-dealers because of the volume of business generated by the Investment Adviser and its affiliates; (d) the Investment Adviser’s ability to negotiate favorable terms with derivatives counterparties on behalf of the Funds as a result of the size and reputation of the Goldman Sachs organization; (e) the Investment Adviser’s knowledge and experience gained from managing other accounts and products; (f) the Investment Adviser’s ability to hire and retain qualified personnel to provide services to the Funds because of the reputation of the Goldman Sachs organization; (g) the Funds’ access, through the Investment Adviser, to certain firmwide resources (e.g., proprietary risk management systems and databases), subject to certain restrictions; and (h) the Funds’ access to certain affiliated distribution channels. In addition, the Trustees noted the competitive nature of the mutual fund marketplace, and considered that many of the Funds’ shareholders invested in the Funds in part because of the Funds’ relationship with the Investment Adviser and that those shareholders have a general expectation that the relationship will continue.
Conclusion
In connection with their consideration of the Agreements, the Trustees gave weight to each of the factors described above, but did not identify any particular factor as controlling their decision. After deliberation and consideration of all of the information provided, including the factors described above, the Trustees concluded, in the exercise of their business judgment, that the management fees paid by each of the Funds were reasonable in light of the services provided to it by the Investment Adviser, the Investment Adviser’s costs and each Fund’s current and reasonably foreseeable asset levels. The Trustees unanimously concluded that the Investment Adviser’s continued management likely would benefit each Fund and its shareholders and that the Management Agreements should be approved and continued with respect to each Fund until June 30, 2017.
Sub-Advisory Agreement for the Equity Index Fund
Nature, Extent, and Quality of the Services Provided Under the Sub-Advisory Agreement and Investment Performance
In evaluating the Sub-Advisory Agreement, the Trustees relied upon materials furnished and presentations made by the Investment Adviser and the Sub-Adviser. In evaluating the nature, extent, and quality of services provided by the Sub-Adviser, the Trustees considered information on the services provided to the Equity Index Fund by the Sub-Adviser, including information about the Sub-Adviser’s (a) personnel and organizational structure; (b) experience in index investing and track record in tracking
74
GOLDMAN SACHS VARIABLE INSURANCE TRUST FUNDS
Statement Regarding Basis for Approval of Management Agreements (Unaudited) (continued)
the performance of the Fund’s benchmark in line with the investment objective of the Fund; (c) policies and procedures in place to address potential conflicts of interest; and (d) compliance program and code of ethics. The Trustees noted that the Fund had commenced operations in January 2006, and reviewed the Fund’s operations and investment performance since its inception. The Trustees reviewed the services provided to the Fund under the Sub-Advisory Agreement. They noted that the Fund’s Service Shares had placed in the top half of the Fund’s peer group and had underperformed the Fund’s benchmark index by an amount approximately equal to Fund fees and expenses for the one-, three-, five-, and ten-year periods ended March 31, 2016.
Costs of Services Provided.
The Trustees reviewed the terms of the Sub-Advisory Agreement, including the fee schedule for the Sub-Adviser. They considered the breakpoints in the sub-advisory fee rate payable under the Sub-Advisory Agreement at the following annual percentage rates of the average daily net assets of the Fund:
| Average Daily Net Assets | Sub-Advisory Fee Annual Rate | |||
First $50 Million | 0.030 | % | ||
Next $200 Million | 0.020 | % | ||
Next $750 Million | 0.010 | % | ||
Over $1 Billion | 0.008 | % | ||
75
GOLDMAN SACHS VARIABLE INSURANCE TRUST FUNDS
Statement Regarding Basis for Approval of Management Agreements (Unaudited) (continued)
The Trustees noted that the Sub-Adviser’s compensation is paid by the Investment Adviser, not by the Fund, and that the retention of the Sub-Adviser does not increase the fees incurred by the Fund for advisory services. They noted that the Investment Adviser believes that the relationship between the management fees paid by the Fund and the sub-advisory fees paid by the Investment Adviser is appropriate given the level of services the Investment Adviser provides to the Fund and the significant differences in cost drivers and risks associated with the respective services offered by the Investment Adviser and the Sub-Adviser, as well as the management fee waivers and expense limitations that substantially reduce the fees retained by the Investment Adviser.
Conclusion
After deliberation and consideration of the information provided, the Trustees concluded that the sub-advisory fee to be paid by the Investment Adviser to the Sub-Adviser with respect to the Equity Index Fund is reasonable in light of the services to be provided by the Sub-Adviser and the Fund’s reasonably foreseeable asset levels, and that the Sub-Advisory Agreement with respect to the Equity Index Fund should be approved and continued until June 30, 2017.
76
| TRUSTEES | OFFICERS | |
| Ashok N. Bakhru, Chairman | James A. McNamara, President | |
| Kathryn A. Cassidy | Scott M. McHugh, Principal Financial Officer, | |
| Diana M. Daniels | Senior Vice President and Treasurer | |
| Herbert J. Markley | Caroline L. Kraus, Secretary | |
| James A. McNamara | ||
| Jessica Palmer | ||
| Alan A. Shuch | ||
| Roy W. Templin | ||
| Gregory G. Weaver |
GOLDMAN, SACHS & CO.
Distributor and Transfer Agent
GOLDMAN SACHS ASSET MANAGEMENT, L.P.
Investment Adviser
200 West Street, New York, New York 10282
Visit our web site at www.GSAMFUNDS.com to obtain the most recent month-end returns.
The reports concerning the Funds included in this shareholder report may contain certain forward-looking statements about the factors that may affect the performance of the Funds in the future. These statements are based on Fund management’s predictions and expectations concerning certain future events and their expected impact on the Funds, such as performance of the economy as a whole and of specific industry sectors, changes in the levels of interest rates, the impact of developing world events, and other factors that may influence the future performance of the Funds. Management believes these forward-looking statements to be reasonable, although they are inherently uncertain and difficult to predict. Actual events may cause adjustments in portfolio management strategies from those currently expected to be employed.
A description of the policies and procedures that the Funds use to determine how to vote proxies relating to portfolio securities and information regarding how the Funds voted proxies relating to portfolio securities for the 12-month period ended June 30 is available (i) without charge, upon request by calling 1-800-621-2550; and (ii) on the Securities and Exchange Commission (“SEC”) web site at http://www.sec.gov.
The Funds file their complete schedule of portfolio holdings with the SEC for the first and third quarters of each fiscal year on Form N-Q. The Funds’ Form N-Qs are available on the SEC’s web site at http://www.sec.gov within 60 days after the Funds’ first and third fiscal quarters. The Funds’ Form N-Qs may be reviewed and copied at the SEC’s Public Reference Room in Washington, D.C. and information on the operation of the Public Reference Room may also be obtained by calling 1-800-SEC-0330. Form N-Qs may be obtained upon request and without charge by calling 1-800-621-2550.
The website links provided are for your convenience only and are not an endorsement or recommendation by GSAM of any of these websites or the products or services offered. GSAM is not responsible for the accuracy and validity of the content of these websites.
Fund holdings and allocations shown are as of June 30, 2016 and may not be representative of future investments. Fund holdings should not be relied on in making investment decisions and should not be construed as research or investment advice regarding particular securities. Current and future holdings are subject to risk.
References to indices, benchmarks or other measures of relative market performance over a specified period of time are provided for your information only and do not imply that the portfolio will achieve similar results. The index composition may not reflect the manner in which a portfolio is constructed. While an adviser seeks to design a portfolio which reflects appropriate risk and return features, portfolio characteristics may deviate from those of the benchmark.
The Global Industry Classification Standard (“GICS”) was developed by and is the exclusive property and a service mark of Morgan Stanley Capital International Inc. (“MSCI”) and Standard & Poor’s, a division of The McGraw-Hill Companies, Inc. (“S&P”) and is licensed for use by Goldman Sachs. Neither MSCI, S&P nor any other party involved in making or compiling the GICS or any GICS classifications makes any express or implied warranties or representations with respect to such standard or classification (or the results to be obtained by the use thereof), and all such parties hereby expressly disclaim all warranties of originality, accuracy, completeness, merchantability or fitness for a particular purpose with respect to any of such standard or classification. Without limiting any of the foregoing, in no event shall MSCI, S&P, any of their affiliates or any third party involved in making or compiling the GICS or any GICS classifications have any liability for any direct, indirect, special, punitive, consequential or any other damages (including lost profits) even if notified of the possibility of such damages.
The portfolio risk management process includes an effort to monitor and manage risk, but does not imply low risk.
Shares of the Goldman Sachs VIT Funds are offered to separate accounts of participating life insurance companies for the purpose of funding variable annuity contracts and variable life insurance policies. Shares of the Fund are not offered directly to the general public. The variable annuity contracts and variable life insurance policies are described in the separate prospectuses issued by participating insurance companies. You should refer to those prospectuses for information about surrender charges, mortality and expense risk fees and other charges that may be assessed by participating insurance companies under the variable annuity contracts or variable life insurance policies. Such fees or charges, if any, may affect the return you may realize with respect to your investments. Ask your representative for more complete information. Please consider a fund’s objectives, risks and charges and expenses, and read the prospectus carefully before investing. The prospectus contains this and other information about the Fund.
This material is not authorized for distribution to prospective investors unless preceded or accompanied by a current Prospectus or summary prospectus, if applicable. Investors should consider a Fund’s objective, risks, and charges and expenses, and read the summary prospectus, if available, and/or the Prospectus carefully before investing or sending money. The summary prospectus, if available, and the Prospectus contain this and other information about a Fund and may be obtained from your Authorized Institution or from Goldman, Sachs & Co. by calling 1-800-621-2550.
This report is prepared for the general information of contract owners and is not an offer of shares of the Goldman Sachs Variable Insurance Trust Funds.
Goldman, Sachs & Co. is the distributor of the Goldman Sachs Funds and the Goldman Sachs Variable Insurance Trust Funds.
© 2016 Goldman Sachs. All rights reserved.
VITMLTISAR-16/58888-TMPL-08/2016/19.3K
Goldman
Sachs Variable Insurance Trust
Goldman Sachs
Small Cap Equity Insights Fund
Semi-Annual Report
June 30, 2016

GOLDMAN SACHS VARIABLE INSURANCE TRUST SMALL CAP EQUITY INSIGHTS FUND
INVESTMENT OBJECTIVE
The Fund seeks long-term growth of capital.
Portfolio Management Discussion and Analysis
Below, the Goldman Sachs Quantitative Investment Strategies Team discusses the Goldman Sachs Variable Insurance Trust — Goldman Sachs Small Cap Equity Insights Fund’s (the “Fund”) performance and positioning for the six-month period ended June 30, 2016 (the “Reporting Period”).
How did the Fund perform during the Reporting Period?
During the Reporting Period, the Fund’s Institutional and Service Shares generated cumulative total returns of 3.19% and 3.13%, respectively. These returns compare to the -2.22% cumulative total return of the Fund’s benchmark, the Russell 2000® Index (with dividends reinvested) (the “Russell Index”) during the same time period.
What economic and market factors most influenced the equity markets as a whole during the annual period?
Representing the U.S. equity market, the S&P 500® Index gained 3.84% during the Reporting Period.
As the Reporting Period began in January 2016, U.S. equities were embroiled in a global rout, triggered by investor concerns about an intensifying economic slowdown in China and exacerbated by an oil price plunge. Following a December 2015 interest rate hike, the January 2016 Federal Reserve (“Fed”) statement acknowledged these external risks and tightening financial conditions. U.S. equities stabilized in February 2016, as market sentiment improved on the more dovish tone set by global central banks. (Dovish language tends to suggest lower interest rates.) U.S. equities were also supported by stronger economic data, rallying as fourth quarter U.S. Gross Domestic Product (“GDP”) came in above consensus expectations. In March 2016, the Fed kept interest rates on hold and surprised on the dovish side, reducing its forecast to two interest rate hikes in 2016, down from four. Along with receding global economic concerns, we believe this helped to drive a recovery in U.S. equities. Released in March 2016, February 2016 unemployment data came in ahead of market consensus, with unemployment steady at 4.9% in spite of higher participation rates and declining underemployment.
Following the rebound in March 2016, market sentiment appeared to remain sanguine in April 2016, as oil prices rose and China’s economic growth concerns abated. U.S. equities fell near the end of the month as investors were disappointed by a lack of additional stimulus from the Bank of Japan and by a weaker than consensus expected first quarter U.S. GDP rate of 0.5%. Hawkish Fed minutes released in May 2016 temporarily revived market expectations for a Fed interest rate hike in June 2016, but weaker than expected May 2016 payroll data subsequently drove such expectations lower. (Hawkish language tends to suggest higher interest rates; opposite of dovish.) The Fed ultimately held interest rates steady in June 2016 and signaled a slower pace of hikes, acknowledging the slowdown in the labor market. Markets were otherwise dominated in June 2016 by the U.K. referendum on membership in the European Union, popularly known as Brexit. U.S. equities sold off in the global risk-off, or heightened risk averse, sentiment in June 2016 following the surprise “leave” result. Markets rebounded in the latter days of the month owing to improving risk sentiment as markets digested the Brexit vote outcome and on dovish remarks from Bank of England Governor Carney.
For the Reporting Period overall, telecommunication services and utilities were the best performing sectors in the S&P 500 Index by a wide margin. Energy and consumer staples also posted double-digit gains. The energy sector was the largest positive contributor to S&P 500 Index returns, as measured by weight times performance. The weakest performing sectors in the S&P 500 Index during the Reporting Period were financials and information technology, the only two to post negative absolute returns, followed by consumer discretionary and health care, which were also weak but generated modestly positive returns during the Reporting Period.
Within the U.S. equity market, there was significant disparity in performance not only among sectors but also among the various capitalization and style segments. While all capitalization segments posted positive returns, mid-cap stocks, as measured by the Russell Midcap® Index, performed best, followed by large-cap stocks, as measured by the Russell 1000® Index, and then, small-cap stocks, as measured by the Russell 2000® Index. From a style perspective, value-oriented stocks significantly outpaced growth-oriented stocks across the capitalization spectrum. Value outperformed relative to growth during the Reporting Period primarily due to weaker performance of the growth-oriented health care sector. (All as measured by the Russell Investments indices.)
1
GOLDMAN SACHS VARIABLE INSURANCE TRUST SMALL CAP EQUITY INSIGHTS FUND
What key factors were responsible for the Fund’s performance during the Reporting Period?
During the Reporting Period, the Fund outperformed the Russell Index on a relative basis. Stock section driven by our quantitative model and three of its six investment themes contributed positively to relative returns.
What impact did the Fund’s investment themes have on performance during the Reporting Period?
As expected, and in keeping with our investment approach, our quantitative model and its six investment themes — Valuation, Profitability, Quality, Management, Momentum and Sentiment — had the greatest impact on relative performance. We use these themes to take a long-term view of market patterns and look for inefficiencies, selecting stocks for the Fund and overweighting or underweighting the ones chosen by the model. Over time and by design, the performance of any one of the model’s investment themes tends to have a low correlation with the model’s other themes, demonstrating the diversification benefit of the Fund’s theme-driven quantitative model. The variance in performance supports our research indicating that the diversification provided by the Fund’s different investment themes is a significant investment advantage over the long term, even though the Fund may experience underperformance in the short term. Of course, diversification does not protect an investor from market risk nor does it ensure a profit.
During the Reporting Period, three of our six investment themes contributed positively to the Fund’s relative performance. The Quality and Sentiment themes contributed most positively to relative performance, followed by Momentum. The Quality theme assesses both firm and financial quality. The Sentiment theme reflects selected investment views and decisions of individuals and financial intermediaries. The Momentum theme seeks to predict drifts in stock prices caused by delayed investor reaction to company-specific information and information about related companies.
The Fund’s Valuation theme detracted most from the Fund’s relative performance, followed by Management. Valuation attempts to capture potential mispricings of securities, typically by comparing a measure of the company’s intrinsic value to its market value. The Management theme assesses the characteristics, policies and strategic decisions of company management.
The Profitability theme had a rather neutral effect on the Fund’s relative performance during the Reporting Period. The Profitability theme assesses whether a company is earning more than its cost of capital.
How did the Fund’s sector and industry allocations affect relative performance?
In constructing the Fund’s portfolio, we focus on picking stocks rather than making industry or sector bets. Consequently, the Fund is similar to its benchmark, the Russell Index, in terms of its sector allocation and style. We manage the Fund’s industry and sector exposure by including industry factors in our risk model and by explicitly penalizing industry and sector deviations from the benchmark index in optimization. Sector weights or changes in weights generally do not have a meaningful impact on relative performance.
Did stock selection help or hurt Fund performance during the Reporting Period?
We seek to outpace the Russell Index by overweighting stocks that we expect to outperform and underweighting those that we think may lag. We also build positions based on our thematic views. For example, the Fund aims to hold a basket of stocks with more favorable Momentum characteristics than the benchmark index. During the Reporting Period, stock selection overall contributed positively to the Fund’s relative performance.
Security selection in the industrials, health care and financials sectors contributed most positively to the Fund’s relative returns. Stock selection in materials, energy and telecommunication services detracted most from the Fund’s results relative to the Russell Index during the Reporting Period.
Which individual stock positions contributed the most to the Fund’s relative returns during the Reporting Period?
The Fund benefited most from overweight positions in commercial printer Quad/Graphics, utilities company Talen Energy and data center real estate investment trust CoreSite Realty. We chose to overweight Quad/Graphics because of our positive views on Quality and Value. Our positive views on Momentum and Value led us to overweight Talen Energy. The Fund was overweight CoreSite Realty due to our positive views on Momentum and Quality.
Which individual positions detracted from the Fund’s results during the Reporting Period?
Detracting most from the Fund’s results relative to its benchmark index were overweight positions in biopharmaceutical company Halozyme Therapeutics, oil refiner and marketer Alon USA Energy and insurance company American Equity Investment Life Holding Company. The Fund was overweight Halozyme Therapeutics due to our positive views on Quality and Profitability. Our
2
GOLDMAN SACHS VARIABLE INSURANCE TRUST SMALL CAP EQUITY INSIGHTS FUND
positive views on Value and Momentum led us to overweight Alon USA Energy. We chose to overweight American Equity Investment Life Holding Company because of our positive view on Value.
How did the Fund use derivatives during the Reporting Period?
During the Reporting Period, we did not use derivatives as part of an active management strategy to add value to the Fund’s results. However, we used equity index futures contracts, on an opportunistic basis, to equitize the Fund’s excess cash holdings. In other words, we put the Fund’s excess cash holdings to work by using them as collateral for the purchase of stock futures. The use of these futures contracts did not have a material impact on the Fund’s performance during the Reporting Period.
Did you make any enhancements to your quantitative models during the Reporting Period?
We continuously look for ways to improve our investment process. We made no significant changes to our quantitative models during the first quarter of 2016. In the second quarter of 2016, we made a number of enhancements across a variety of investment themes.
We enhanced the Profitability theme for stocks within developed markets by introducing a factor that evaluates the geographic exposure of companies by tracking the physical locations of their branches, outlets and subsidiaries. We believe that a company with a footprint in growing parts of the world is better positioned relative to a company with a footprint in contracting parts. We are able to estimate this factor for more than 5,500 companies globally, which have more than one million subsidiaries spread across more than 47,000 cities in more than 200 countries. This extends our analysis of a company’s global footprint, which has focused historically on their revenue mix across markets.
In the U.S. investment region, we enhanced the Momentum theme by introducing a signal that evaluates linkages embedded within companies’ web pages. Embedded linkages are effective indicators of the similarity of the underlying businesses of companies across a variety of sectors, such as retail, media, hospitality, software, banks, airlines, etc.
We have undertaken research of various Environment, Social and Governance (“ESG”) metrics and their ability to forecast returns. We have enhanced our models with the following ESG related metrics:
| n | Within the Quality theme in the U.S. and Europe investment regions, we have introduced an environmental impact factor. The factor measures the amount of environmental resources consumed to produce a unit of output for more than 2,000 companies. This factor helps to strategically tilt towards companies with a favorable environmental profile. |
| n | Within the Momentum theme in the U.S. investment region, we have introduced the ESG topic signal. We use natural language processing techniques to read through more than 24,000 articles, collected since 1999, on Corporate Social Responsibility (“CSR”) activities to identify economic linkages among more than 1,000 companies. The signal aims to identify companies linked to each other by such common CSR themes and can dynamically adjust our positions accordingly. |
What was the Fund’s sector positioning relative to its benchmark index at the end of the Reporting Period?
As of June 30, 2016, the Fund was overweight the industrials, materials and consumer discretionary sectors relative to the Russell Index. The Fund was underweight information technology, financials, consumer staples and utilities and was rather neutrally weighted in telecommunication services, health care and energy compared to the benchmark index on the same date.
Were there any changes to the Fund’s portfolio management team during the Reporting Period?
On February 5, 2016, Ron Hua, Chief Investment Officer of Equity Alpha Strategies for the Quantitative Investment Strategies (“QIS”) Team, announced his intention to retire from Goldman Sachs Asset Management, L.P. (“GSAM”). As such, effective that date, Mr. Hua no longer had portfolio management responsibility for the Fund.
Ron’s responsibilities were assumed by Armen Avanessians, Managing Director and Chief Investment Officer of GSAM’s QIS Team. The senior portfolio management team for the Fund remained Osman Ali, Len Ioffe and Dennis Walsh, each a Managing Director. Dennis Walsh continues to head research and portfolio management for the Fund. Len Ioffe continues to head portfolio implementation, and Osman Ali continues to head client strategy. Armen Avanessians continues to oversee all QIS strategies globally. Gary Chropuvka, Managing Director, continues to head QIS client strategy efforts globally.
As always, the QIS platform is organized into a series of specialist portfolio management teams that focus on generating and implementing investment ideas within their area of expertise. Investment decisions are made by these portfolio management teams, rather than by one portfolio manager or committee. Ultimate accountability for the Fund resides with the senior portfolio managers dedicated to each Team strategy, who oversee their respective research, portfolio management and implementation processes.
3
GOLDMAN SACHS VARIABLE INSURANCE TRUST SMALL CAP EQUITY INSIGHTS FUND
In all, during the Reporting Period, one Vice President joined the Equity Alpha team and one Managing Director and five Vice Presidents left the Equity Alpha team. QIS employs a globally integrated team of more than 90 professionals, with an additional 90-plus professionals dedicated to trading, information technology and development of analytical tools.
What is your strategy going forward for the Fund?
Looking ahead, we continue to believe that less expensive stocks should outpace more expensive stocks, and stocks with good momentum are likely to outperform those with poor momentum. We intend to maintain our focus on seeking companies about which fundamental research analysts are becoming more positive as well as profitable companies with sustainable earnings and a track record of using their capital to enhance shareholder value. As such, we anticipate remaining fully invested with long-term performance likely to be the result of stock selection rather than sector or capitalization allocations.
We stand behind our investment philosophy that sound economic investment principles, coupled with a disciplined quantitative approach, can provide strong, uncorrelated returns over the long term. Our research agenda is robust, and we continue to enhance our existing models, add new proprietary forecasting signals and improve our trading execution as we seek to provide the most value to our shareholders.
4
GOLDMAN SACHS VARIABLE INSURANCE TRUST SMALL CAP EQUITY INSIGHTS FUND
Index Definitions
The Russell 2000® Index (with dividends reinvested) is an unmanaged index of common stock prices that measures the performance of the 2000 smallest companies in the Russell 3000® Index. The figures for the Index do not include any deduction for fees, expenses or taxes. It is not possible to invest directly in an index.
The S&P 500® Index (with dividends reinvested) is the Standard & Poor’s 500 Composite Index of 500 stocks, an unmanaged index of common stock prices. The figures for the Index do not include any deduction for fees, expenses or taxes. It is not possible to invest directly in an index.
The Russell Midcap® Index measures the performance of the 800 smallest companies in the Russell 1000® Index, which represent approximately 25% of the total market capitalization of the Russell 1000 Index. It is not possible to invest directly in an index.
The Russell 1000® Index measures the performance of the 1,000 largest companies in the Russell 3000® Index, which represents approximately 92% of the total market capitalization of the Russell 3000 Index. It is not possible to invest directly in an index.
5
FUND BASICS
Small Cap Equity Insights Fund
as of June 30, 2016
STANDARDIZED TOTAL RETURNS1
| For the period ended 6/30/16 | One Year | Five Years | Ten Years | Since Inception | Inception Date | |||||||||||||
| Institutional | -3.17 | % | 8.88 | % | 4.97 | % | 6.10 | % | 2/13/98 | |||||||||
| Service | -3.41 | 8.61 | N/A | 6.04 | 8/31/07 | |||||||||||||
| 1 | The Standardized Total Returns are average annual total returns as of the most recent calendar quarter-end. They assume reinvestment of all distributions at net asset value (“NAV”). Because Institutional Shares and Service Shares do not involve a sales charge, such a charge is not applied to their Standardized Total Returns. |
Total return figures in the above chart represent past performance and do not indicate future results, which will vary. The investment return and principal value of an investment will fluctuate and, therefore, an investor’s shares, when redeemed, may be worth more or less than their original cost. Current performance may be lower or higher than the total return figures in the above chart. Please visit www.GSAMFUNDS.com to obtain the most recent month-end returns. Performance reflects fee waivers and/or expense limitations in effect during the periods shown. In their absence, performance would be reduced.
EXPENSE RATIOS2
| Net Expense Ratio (Current) | Gross Expense Ratio (Before Waivers) | |||||||
| Institutional | 0.81 | % | 0.99 | % | ||||
| Service | 1.06 | 1.24 | ||||||
| 2 | The expense ratios of the Fund, both current (net of any fee waivers or expense limitations) and before waivers (gross of any fee waivers or expense limitations) are as set forth above according to the most recent publicly available Prospectuses for the Fund and may differ from the expense ratios disclosed in the Financial Highlights in this report. Pursuant to a contractual arrangement, the Fund’s waivers and/or expense limitations will remain in place through at least April 29, 2017 and prior to such date the Investment Adviser may not terminate the arrangements without the approval of the Fund’s Board of Trustees. If these arrangements are discontinued in the future, the expense ratios may change without shareholder approval. |
TOP TEN HOLDINGS AS OF 6/30/163,4
| Holding | % of Net Assets | Line of Business | ||||
| First Industrial Realty Trust, Inc. (REIT) | 0.9% | Real Estate | ||||
| EMCOR Group, Inc. | 0.9 | Capital Goods | ||||
| CoreSite Realty Corp. (REIT) | 0.8 | Real Estate | ||||
| PS Business Parks, Inc. (REIT) | 0.8 | Real Estate | ||||
| Mack-Cali Realty Corp. (REIT) | 0.8 | Real Estate | ||||
| Prestige Brands Holdings, Inc. | 0.8 | Pharmaceuticals, Biotechnology & Life Sciences | ||||
| ALLETE, Inc. | 0.8 | Utilities | ||||
| Southwest Gas Corp. | 0.7 | Utilities | ||||
| ManTech International Corp. Class A | 0.7 | Software & Services | ||||
| Prosperity Bancshares, Inc. | 0.7 | Banks | ||||
| 3 | The top 10 holdings may not be representative of the Fund’s future investments. |
| 4 | The Fund’s overall top ten holdings differ from the table above due to the exclusion of the Goldman Sachs Financial Square Money Market Fund (a securities lending reinvestment vehicle) which represents 3.1% of the Fund’s net assets as of 06/30/2016. |
6
FUND BASICS
FUND VS. BENCHMARK SECTOR ALLOCATIONS5
As of June 30, 2016
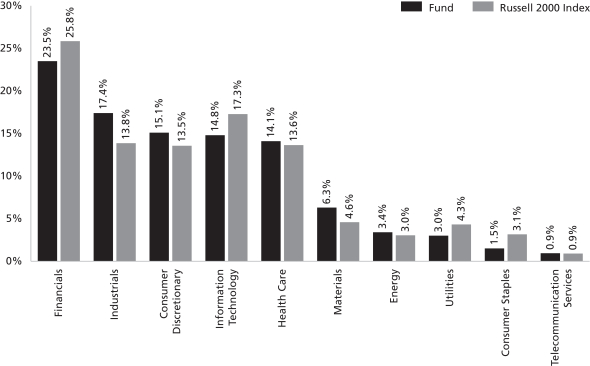
| 5 | The Fund is actively managed and, as such, its composition may differ over time. Consequently, the Fund’s overall sector allocations may differ from percentages contained in the graph above. The graph categorizes investments using Global Industry Classification Standard (“GICS”), however, the sector classifications used by the portfolio management team may differ from GICS. The percentage shown for each investment category reflects the value of investments in that category as a percentage of total market value (excluding investments in the securities lending reinvestment vehicle, if any). Underlying sector allocations of Exchange Traded Funds and Investment Companies held by the Fund are not reflected in the graph above. Investments in the securities lending reinvestment vehicle represented 3.1% of the Fund’s net assets at June 30, 2016. The graph depicts the Fund’s investments but may not represent the Fund’s market exposure due to the exclusion of certain derivatives, if any, as listed in the Additional Investment Information section of the Schedule of Investments. |
7
GOLDMAN SACHS VARIABLE INSURANCE TRUST SMALL CAP EQUITY INSIGHTS FUND
Schedule of Investments
June 30, 2016 (Unaudited)
Shares | Description | Value | ||||||
| Common Stocks – 97.3% | ||||||||
| Automobiles & Components – 2.3% |
| ||||||
| 7,461 | Cooper Tire & Rubber Co. | $ | 222,487 | |||||
| 2,104 | Cooper-Standard Holding, Inc.* | 166,195 | ||||||
| 23,366 | Dana Holding Corp. | 246,745 | ||||||
| 7,429 | Drew Industries, Inc. | 630,276 | ||||||
| 26,323 | Modine Manufacturing Co.* | 231,642 | ||||||
| 11,774 | Superior Industries International, Inc. | 315,308 | ||||||
| 1,426 | Tenneco, Inc.* | 66,466 | ||||||
| 8,036 | Tower International, Inc. | 165,381 | ||||||
|
| |||||||
| 2,044,500 | ||||||||
|
| |||||||
| Banks – 9.5% |
| ||||||
| 15,213 | Bank of the Ozarks, Inc. | 570,792 | ||||||
| 9,561 | Beneficial Bancorp, Inc.* | 121,616 | ||||||
| 1,258 | Berkshire Hills Bancorp, Inc. | 33,865 | ||||||
| 20,114 | BofI Holding, Inc.*(a) | 356,219 | ||||||
| 30,791 | Brookline Bancorp, Inc. | 339,625 | ||||||
| 4,365 | Capitol Federal Financial, Inc. | 60,892 | ||||||
| 24,226 | Central Pacific Financial Corp. | 571,734 | ||||||
| 39,573 | CVB Financial Corp. | 648,601 | ||||||
| 28,072 | Dime Community Bancshares, Inc. | 477,505 | ||||||
| 10,483 | FCB Financial Holdings, Inc. Class A* | 356,422 | ||||||
| 1,976 | First Busey Corp. | 42,267 | ||||||
| 797 | First Citizens BancShares, Inc. Class A | 206,351 | ||||||
| 5,288 | First Interstate BancSystem, Inc. Class A | 148,593 | ||||||
| 31,888 | First Midwest Bancorp, Inc. | 559,953 | ||||||
| 1,439 | Flagstar Bancorp, Inc.* | 35,126 | ||||||
| 4,289 | FNB Corp. | 53,784 | ||||||
| 1,263 | Glacier Bancorp, Inc. | 33,571 | ||||||
| 6,808 | Hanmi Financial Corp. | 159,920 | ||||||
| 1,411 | Hilltop Holdings, Inc.* | 29,617 | ||||||
| 1,434 | Home BancShares, Inc. | 28,379 | ||||||
| 10,692 | IBERIABANK Corp. | 638,633 | ||||||
| 5,071 | International Bancshares Corp. | 132,302 | ||||||
| 41,915 | OFG Bancorp | 347,894 | ||||||
| 18,103 | Old National Bancorp | 226,831 | ||||||
| 18,763 | Oritani Financial Corp. | 300,020 | ||||||
| 13,550 | PrivateBancorp, Inc. | 596,606 | ||||||
| 12,798 | Prosperity Bancshares, Inc. | 652,570 | ||||||
| 24,454 | Radian Group, Inc. | 254,811 | ||||||
| 941 | Renasant Corp. | 30,423 | ||||||
| 7,450 | Umpqua Holdings Corp. | 115,251 | ||||||
| 14,087 | United Community Banks, Inc. | 257,651 | ||||||
| 6,563 | Walker & Dunlop, Inc.* | 149,505 | ||||||
| 1,627 | WSFS Financial Corp. | 52,373 | ||||||
|
| |||||||
| 8,589,702 | ||||||||
|
| |||||||
| Capital Goods – 10.9% |
| ||||||
| 27,208 | Aegion Corp.* | 530,828 | ||||||
| 6,659 | Altra Industrial Motion Corp. | 179,660 | ||||||
| 13,157 | Applied Industrial Technologies, Inc. | 593,907 | ||||||
| 9,459 | Astec Industries, Inc. | 531,123 | ||||||
| 9,523 | AZZ, Inc. | 571,190 | ||||||
| 3,767 | Babcock & Wilcox Enterprises, Inc.* | 55,337 | ||||||
| 1,664 | Briggs & Stratton Corp. | 35,243 | ||||||
|
| |||||||
| Common Stocks – (continued) | ||||||||
| Capital Goods – (continued) |
| ||||||
| 1,910 | CLARCOR, Inc. | $ | 116,185 | |||||
| 11,615 | Comfort Systems USA, Inc. | 378,301 | ||||||
| 9,523 | Continental Building Products, Inc.* | 211,696 | ||||||
| 5,618 | Curtiss-Wright Corp. | 473,316 | ||||||
| 24,076 | DigitalGlobe, Inc.* | 514,986 | ||||||
| 6,629 | Ducommun, Inc.* | 131,122 | ||||||
| 15,747 | EMCOR Group, Inc. | 775,697 | ||||||
| 4,520 | Esterline Technologies Corp.* | 280,421 | ||||||
| 32,049 | Federal Signal Corp. | 412,791 | ||||||
| 27,446 | General Cable Corp. | 348,839 | ||||||
| 9,154 | Granite Construction, Inc. | 416,965 | ||||||
| 14,910 | H&E Equipment Services, Inc. | 283,737 | ||||||
| 5,045 | Hyster-Yale Materials Handling, Inc. | 300,127 | ||||||
| 5,240 | Kadant, Inc. | 269,912 | ||||||
| 3,332 | Kennametal, Inc. | 73,670 | ||||||
| 20,835 | LSI Industries, Inc. | 230,643 | ||||||
| 8,315 | Miller Industries, Inc. | 171,206 | ||||||
| 19,138 | MRC Global, Inc.* | 271,951 | ||||||
| 1,854 | NOW, Inc.* | 33,632 | ||||||
| 2,298 | Standex International Corp. | 189,884 | ||||||
| 1,259 | Tennant Co. | 67,822 | ||||||
| 5,076 | The Manitowoc Co., Inc. | 27,664 | ||||||
| 6,940 | Universal Forest Products, Inc. | 643,269 | ||||||
| 45,911 | Wabash National Corp.* | 583,070 | ||||||
| 3,005 | Woodward, Inc. | 173,208 | ||||||
|
| |||||||
| 9,877,402 | ||||||||
|
| |||||||
| Commercial & Professional Services – 5.2% |
| ||||||
| 19,026 | Brady Corp. Class A | 581,434 | ||||||
| 6,923 | Essendant, Inc. | 211,567 | ||||||
| 983 | G&K Services, Inc. Class A | 75,268 | ||||||
| 8,302 | Heidrick & Struggles International, Inc. | 140,138 | ||||||
| 2,628 | Herman Miller, Inc. | 78,551 | ||||||
| 2,740 | HNI Corp. | 127,383 | ||||||
| 6,357 | Huron Consulting Group, Inc.* | 384,090 | ||||||
| 7,235 | Insperity, Inc. | 558,759 | ||||||
| 32,194 | Kimball International, Inc. Class B | 366,368 | ||||||
| 16,296 | Knoll, Inc. | 395,667 | ||||||
| 1,208 | McGrath RentCorp | 36,953 | ||||||
| 26,496 | Quad/Graphics, Inc. | 617,092 | ||||||
| 6,998 | RPX Corp.* | 64,172 | ||||||
| 2,308 | The Advisory Board Co.* | 81,680 | ||||||
| 13,435 | The Brink’s Co. | 382,763 | ||||||
| 3,684 | TriNet Group, Inc.* | 76,590 | ||||||
| 8,568 | WageWorks, Inc.* | 512,452 | ||||||
|
| |||||||
| 4,690,927 | ||||||||
|
| |||||||
| Consumer Durables & Apparel – 2.6% |
| ||||||
| 4,424 | Cavco Industries, Inc.* | 414,529 | ||||||
| 4,169 | Columbia Sportswear Co. | 239,884 | ||||||
| 2,729 | CSS Industries, Inc. | 73,165 | ||||||
| 1,258 | Deckers Outdoor Corp.* | 72,360 | ||||||
| 16,403 | Ethan Allen Interiors, Inc. | 541,955 | ||||||
| 3,014 | G-III Apparel Group Ltd.* | 137,800 | ||||||
|
| |||||||
| 8 | The accompanying notes are an integral part of these financial statements. |
GOLDMAN SACHS VARIABLE INSURANCE TRUST SMALL CAP EQUITY INSIGHTS FUND
Shares | Description | Value | ||||||
| Common Stocks – (continued) | ||||||||
| Consumer Durables & Apparel – (continued) |
| ||||||
| 4,688 | Helen of Troy Ltd.* | $ | 482,114 | |||||
| 1,083 | La-Z-Boy, Inc. | 30,129 | ||||||
| 7,800 | Smith & Wesson Holding Corp.* | 212,004 | ||||||
| 732 | Sturm, Ruger & Co., Inc.(a) | 46,855 | ||||||
| 3,689 | TopBuild Corp.* | 133,542 | ||||||
|
| |||||||
| 2,384,337 | ||||||||
|
| |||||||
| Consumer Services – 4.8% |
| ||||||
| 8,121 | BJ’s Restaurants, Inc.* | 355,943 | ||||||
| 3,327 | Bloomin’ Brands, Inc. | 59,454 | ||||||
| 12,746 | Bob Evans Farms, Inc./DE | 483,711 | ||||||
| 27,934 | Boyd Gaming Corp.* | 513,986 | ||||||
| 19,200 | Bridgepoint Education, Inc.* | 139,008 | ||||||
| 4,374 | Bright Horizons Family Solutions, Inc.* | 290,040 | ||||||
| 3,172 | Capella Education Co. | 166,974 | ||||||
| 423 | Churchill Downs, Inc. | 53,450 | ||||||
| 6,073 | DeVry Education Group, Inc.(a) | 108,342 | ||||||
| 11,305 | Houghton Mifflin Harcourt Co.* | 176,697 | ||||||
| 1,178 | International Speedway Corp. Class A | 39,404 | ||||||
| 9,513 | Isle of Capri Casinos, Inc.* | 174,278 | ||||||
| 29,727 | K12, Inc.* | 371,290 | ||||||
| 6,737 | La Quinta Holdings, Inc.* | 76,802 | ||||||
| 7,248 | Penn National Gaming, Inc.* | 101,110 | ||||||
| 15,574 | Pinnacle Entertainment, Inc.* | 172,560 | ||||||
| 37,050 | Regis Corp.* | 461,273 | ||||||
| 7,312 | SeaWorld Entertainment, Inc.(a) | 104,781 | ||||||
| 19,528 | Sonic Corp. | 528,232 | ||||||
|
| |||||||
| 4,377,335 | ||||||||
|
| |||||||
| Diversified Financials – 2.4% |
| ||||||
| 1,725 | Cash America International, Inc. | 73,520 | ||||||
| 9,544 | Cohen & Steers, Inc. | 385,959 | ||||||
| 677 | Diamond Hill Investment Group, Inc. | 127,560 | ||||||
| 51,266 | EZCORP, Inc. Class A* | 387,571 | ||||||
| 6,262 | GAMCO Investors, Inc. Class A | 205,206 | ||||||
| 13,896 | Investment Technology Group, Inc. | 232,341 | ||||||
| 2,735 | Nelnet, Inc. Class A | 95,041 | ||||||
| 5,134 | OM Asset Management PLC | 68,539 | ||||||
| 12,518 | Piper Jaffray Companies* | 471,929 | ||||||
| 17,755 | WisdomTree Investments, Inc.(a) | 173,821 | ||||||
|
| |||||||
| 2,221,487 | ||||||||
|
| |||||||
| Energy – 3.3% |
| ||||||
| 28,965 | Alon USA Energy, Inc. | 187,693 | ||||||
| 37,203 | Callon Petroleum Co.* | 417,790 | ||||||
| 4,742 | Carrizo Oil & Gas, Inc.* | 170,001 | ||||||
| 12,545 | Denbury Resources, Inc.* | 45,036 | ||||||
| 22,261 | DHT Holdings, Inc. | 111,973 | ||||||
| 14,167 | Gener8 Maritime, Inc.* | 90,669 | ||||||
| 9,477 | Matador Resources Co.*(a) | 187,645 | ||||||
| 40,507 | McDermott International, Inc.* | 200,105 | ||||||
| 47,210 | Oasis Petroleum, Inc.* | 440,941 | ||||||
| 6,625 | Oil States International, Inc.* | 217,830 | ||||||
| 7,145 | PDC Energy, Inc.* | 411,623 | ||||||
|
| |||||||
| Common Stocks – (continued) | ||||||||
| Energy – (continued) |
| ||||||
| 50,549 | Pioneer Energy Services Corp.* | $ | 232,525 | |||||
| 2,415 | REX American Resources Corp.* | 144,489 | ||||||
| 1,302 | RSP Permian, Inc.* | 45,427 | ||||||
| 6,562 | Scorpio Tankers, Inc. | 27,560 | ||||||
| 10,649 | Seadrill Ltd.* | 34,503 | ||||||
| 4,689 | Unit Corp.* | 72,961 | ||||||
|
| |||||||
| 3,038,771 | ||||||||
|
| |||||||
| Food & Staples Retailing – 0.1% |
| ||||||
| 3,057 | SpartanNash Co. | 93,483 | ||||||
|
| |||||||
| Food, Beverage & Tobacco – 1.3% |
| ||||||
| 4,263 | Calavo Growers, Inc. | 285,621 | ||||||
| 7,013 | Fresh Del Monte Produce, Inc. | 381,718 | ||||||
| 1,583 | John B Sanfilippo & Son, Inc. | 67,483 | ||||||
| 2,640 | The Boston Beer Co., Inc. Class A* | 451,519 | ||||||
|
| |||||||
| 1,186,341 | ||||||||
|
| |||||||
| Health Care Equipment & Services – 5.5% |
| ||||||
| 771 | Amedisys, Inc.* | 38,920 | ||||||
| 440 | Atrion Corp. | 188,258 | ||||||
| 8,597 | Cantel Medical Corp. | 590,872 | ||||||
| 6,461 | Cynosure, Inc. Class A* | 314,295 | ||||||
| 1,203 | Globus Medical, Inc. Class A* | 28,668 | ||||||
| 2,502 | HMS Holdings Corp.* | 44,060 | ||||||
| 5,590 | ICU Medical, Inc.* | 630,273 | ||||||
| 1,101 | Inogen, Inc.* | 55,171 | ||||||
| 1,528 | Insulet Corp.* | 46,207 | ||||||
| 12,055 | Invacare Corp. | 146,227 | ||||||
| 8,374 | Magellan Health, Inc.* | 550,758 | ||||||
| 11,005 | Masimo Corp.* | 577,928 | ||||||
| 8,033 | Merit Medical Systems, Inc.* | 159,294 | ||||||
| 2,085 | Molina Healthcare, Inc.* | 104,042 | ||||||
| 10,622 | Natus Medical, Inc.* | 401,512 | ||||||
| 2,796 | NuVasive, Inc.* | 166,977 | ||||||
| 12,896 | Owens & Minor, Inc. | 482,052 | ||||||
| 13,615 | Triple-S Management Corp. Class B* | 332,614 | ||||||
|
| |||||||
| 4,858,128 | ||||||||
|
| |||||||
| Household & Personal Products – 0.1% |
| ||||||
| 2,355 | Central Garden & Pet Co. Class A* | 51,127 | ||||||
|
| |||||||
| Insurance – 1.8% |
| ||||||
| 38,126 | American Equity Investment Life Holding Co. | 543,295 | ||||||
| 12,478 | Argo Group International Holdings Ltd. | 647,629 | ||||||
| 34,111 | Maiden Holdings Ltd. | 417,519 | ||||||
| 716 | United Fire Group, Inc. | 30,380 | ||||||
|
| |||||||
| 1,638,823 | ||||||||
|
| |||||||
| Materials – 6.1% |
| ||||||
| 35,490 | AK Steel Holding Corp.*(a) | 165,383 | ||||||
| 7,207 | Carpenter Technology Corp. | 237,326 | ||||||
| 20,887 | Chemtura Corp.* | 550,999 | ||||||
| 434 | Clearwater Paper Corp.* | 28,371 | ||||||
| 37,899 | Commercial Metals Co. | 640,493 | ||||||
|
| |||||||
| The accompanying notes are an integral part of these financial statements. | 9 |
GOLDMAN SACHS VARIABLE INSURANCE TRUST SMALL CAP EQUITY INSIGHTS FUND
Schedule of Investments (continued)
June 30, 2016 (Unaudited)
Shares | Description | Value | ||||||
| Common Stocks – (continued) | ||||||||
| Materials – (continued) |
| ||||||
| 8,870 | FutureFuel Corp. | $ | 96,506 | |||||
| 12,320 | HB Fuller Co. | 541,957 | ||||||
| 10,858 | Innophos Holdings, Inc. | 458,316 | ||||||
| 10,112 | Materion Corp. | 250,373 | ||||||
| 9,650 | Minerals Technologies, Inc. | 548,120 | ||||||
| 17,334 | PolyOne Corp. | 610,850 | ||||||
| 25,163 | Schnitzer Steel Industries, Inc. Class A | 442,869 | ||||||
| 1,438 | Schweitzer-Mauduit International, Inc. | 50,733 | ||||||
| 4,828 | Stepan Co. | 287,411 | ||||||
| 3,605 | Trinseo SA*(a) | 154,763 | ||||||
| 1,984 | US Concrete, Inc.* | 120,845 | ||||||
| 9,063 | Worthington Industries, Inc. | 383,365 | ||||||
|
| |||||||
| 5,568,680 | ||||||||
|
| |||||||
| Media – 0.3% |
| ||||||
| 7,952 | Gannett Co., Inc. | 109,817 | ||||||
| 1,056 | Meredith Corp. | 54,817 | ||||||
| 5,630 | New Media Investment Group, Inc. | 101,734 | ||||||
|
| |||||||
| 266,368 | ||||||||
|
| |||||||
| Pharmaceuticals, Biotechnology & Life Sciences – 8.2% |
| ||||||
| 6,028 | Acceleron Pharma, Inc.* | 204,831 | ||||||
| 12,906 | Achillion Pharmaceuticals, Inc.* | 100,667 | ||||||
| 17,912 | Acorda Therapeutics, Inc.* | 456,845 | �� | |||||
| 726 | Cambrex Corp.* | 37,556 | ||||||
| 4,397 | Catalent, Inc.* | 101,087 | ||||||
| 3,133 | Celator Pharmaceuticals, Inc.* | 94,554 | ||||||
| 20,933 | Cepheid, Inc.* | 643,690 | ||||||
| 12,529 | Emergent BioSolutions, Inc.* | 352,315 | ||||||
| 32,412 | Exelixis, Inc.*(a) | 253,138 | ||||||
| 11,143 | FibroGen, Inc.* | 182,857 | ||||||
| 6,412 | Five Prime Therapeutics, Inc.* | 265,136 | ||||||
| 11,066 | Genomic Health, Inc.* | 286,554 | ||||||
| 25,547 | Halozyme Therapeutics, Inc.*(a) | 220,471 | ||||||
| 13,271 | Impax Laboratories, Inc.* | 382,470 | ||||||
| 1,548 | INC Research Holdings, Inc. Class A* | 59,025 | ||||||
| 6,414 | Insys Therapeutics, Inc.*(a) | 82,997 | ||||||
| 20,825 | Ironwood Pharmaceuticals, Inc.* | 272,287 | ||||||
| 3,699 | Lexicon Pharmaceuticals, Inc.*(a) | 53,081 | ||||||
| 16,046 | MiMedx Group, Inc.*(a) | 128,047 | ||||||
| 2,908 | Momenta Pharmaceuticals, Inc.* | 31,406 | ||||||
| 18,684 | Myriad Genetics, Inc.* | 571,730 | ||||||
| 3,486 | Ophthotech Corp.* | 177,891 | ||||||
| 1,217 | Pacira Pharmaceuticals, Inc.* | 41,049 | ||||||
| 87,665 | PDL BioPharma, Inc. | 275,268 | ||||||
| 11,691 | Phibro Animal Health Corp. Class A | 218,154 | ||||||
| 13,075 | Prestige Brands Holdings, Inc.* | 724,355 | ||||||
| 4,198 | Prothena Corp. PLC*(a) | 146,762 | ||||||
| 1,302 | Puma Biotechnology, Inc.* | 38,787 | ||||||
| 21,086 | Repligen Corp.* | 576,913 | ||||||
| 9,072 | Sagent Pharmaceuticals, Inc.* | 135,899 | ||||||
| 25,949 | SciClone Pharmaceuticals, Inc.* | 338,894 | ||||||
| 1,559 | Ultragenyx Pharmaceutical, Inc.* | 76,251 | ||||||
|
| |||||||
| 7,530,967 | ||||||||
|
| |||||||
| Common Stocks – (continued) | ||||||||
| Real Estate – 9.1% |
| ||||||
| 4,315 | Alexander & Baldwin, Inc. | $ | 155,944 | |||||
| 34,949 | American Capital Mortgage Investment Corp. (REIT) | 551,845 | ||||||
| 115,864 | Anworth Mortgage Asset Corp. (REIT)(b) | 544,561 | ||||||
| 6,314 | ARMOUR Residential REIT, Inc. (REIT)(a) | 126,280 | ||||||
| 17,850 | CBL & Associates Properties, Inc. (REIT) | 166,184 | ||||||
| 3,133 | Chesapeake Lodging Trust (REIT) | 72,842 | ||||||
| 8,490 | CoreSite Realty Corp. (REIT) | 752,978 | ||||||
| 51,449 | Cousins Properties, Inc. (REIT) | 535,070 | ||||||
| 9,554 | DuPont Fabros Technology, Inc. (REIT) | 454,197 | ||||||
| 8,102 | FelCor Lodging Trust, Inc. (REIT) | 50,475 | ||||||
| 28,677 | First Industrial Realty Trust, Inc. (REIT) | 797,794 | ||||||
| 20,827 | Hudson Pacific Properties, Inc. (REIT) | 607,732 | ||||||
| 5,195 | InfraREIT, Inc. (REIT) | 91,120 | ||||||
| 32,572 | Invesco Mortgage Capital, Inc. (REIT) | 445,911 | ||||||
| 26,866 | Mack-Cali Realty Corp. (REIT) | 725,382 | ||||||
| 17,699 | Pennsylvania Real Estate Investment Trust (REIT) | 379,644 | ||||||
| 6,863 | PS Business Parks, Inc. (REIT) | 728,027 | ||||||
| 4,332 | RE/MAX Holdings, Inc. Class A | 174,406 | ||||||
| 5,703 | Summit Hotel Properties, Inc. (REIT) | 75,508 | ||||||
| 12,185 | The GEO Group, Inc. (REIT) | 416,483 | ||||||
| 27,703 | Western Asset Mortgage Capital Corp. (REIT)(a) | 260,131 | ||||||
| 13,458 | WP Glimcher, Inc. (REIT) | 150,595 | ||||||
|
| |||||||
| 8,263,109 | ||||||||
|
| |||||||
| Retailing – 4.7% |
| ||||||
| 3,639 | Aaron’s, Inc. | 79,658 | ||||||
| 5,412 | Abercrombie & Fitch Co. Class A | 96,388 | ||||||
| 19,072 | American Eagle Outfitters, Inc.(a) | 303,817 | ||||||
| 7,775 | Asbury Automotive Group, Inc.* | 410,053 | ||||||
| 1,879 | Big Lots, Inc. | 94,157 | ||||||
| 3,492 | Caleres, Inc. | 84,541 | ||||||
| 3,752 | Core-Mark Holding Co., Inc. | 175,819 | ||||||
| 2,225 | FTD Companies, Inc.* | 55,536 | ||||||
| 2,448 | GNC Holdings, Inc. Class A | 59,462 | ||||||
| 9,576 | Group 1 Automotive, Inc. | 472,671 | ||||||
| 1,662 | HSN, Inc. | 81,322 | ||||||
| 16,051 | Liberty TripAdvisor Holdings, Inc. Class A* | 351,196 | ||||||
| 929 | Lithia Motors, Inc. Class A | 66,024 | ||||||
| 5,205 | Outerwall, Inc.(a) | 218,610 | ||||||
| 9,172 | Pier 1 Imports, Inc.(a) | 47,144 | ||||||
| 20,008 | Rent-A-Center, Inc. | 245,698 | ||||||
| 10,526 | Shutterfly, Inc.* | 490,617 | ||||||
| 11,646 | Stage Stores, Inc. | 56,832 | ||||||
| 15,126 | The Cato Corp. Class A | 570,553 | ||||||
|
| |||||||
| 10 | The accompanying notes are an integral part of these financial statements. |
GOLDMAN SACHS VARIABLE INSURANCE TRUST SMALL CAP EQUITY INSIGHTS FUND
Shares | Description | Value | ||||||
| Common Stocks – (continued) | ||||||||
| Retailing – (continued) |
| ||||||
| 13,512 | The Finish Line, Inc. Class A | $ | 272,807 | |||||
|
| |||||||
| 4,232,905 | ||||||||
|
| |||||||
| Semiconductors & Semiconductor Equipment – 3.1% |
| ||||||
| 16,625 | Advanced Energy Industries, Inc.* | 631,085 | ||||||
| 7,148 | Cabot Microelectronics Corp. | 302,646 | ||||||
| 3,862 | Cavium, Inc.* | 149,073 | ||||||
| 5,559 | Entegris, Inc.* | 80,439 | ||||||
| 6,845 | Inphi Corp.* | 219,246 | ||||||
| 3,299 | MaxLinear, Inc. Class A* | 59,316 | ||||||
| 15,030 | MKS Instruments, Inc. | 647,192 | ||||||
| 51,619 | Photronics, Inc.* | 459,925 | ||||||
| 3,287 | Power Integrations, Inc. | 164,580 | ||||||
| 827 | Synaptics, Inc.* | 44,451 | ||||||
| 1,257 | Tessera Technologies, Inc. | 38,515 | ||||||
|
| |||||||
| 2,796,468 | ||||||||
|
| |||||||
| Software & Services – 6.5% |
| ||||||
| 1,906 | Acxiom Corp.* | 41,913 | ||||||
| 25,473 | Bankrate, Inc.* | 190,538 | ||||||
| 1,059 | Blackbaud, Inc. | 71,906 | ||||||
| 3,652 | Bottomline Technologies de, Inc.* | 78,627 | ||||||
| 8,088 | CommVault Systems, Inc.* | 349,321 | ||||||
| 4,856 | Cornerstone OnDemand, Inc.* | 184,819 | ||||||
| 764 | CSG Systems International, Inc. | 30,797 | ||||||
| 14,255 | Cvent, Inc.* | 509,189 | ||||||
| 387 | Demandware, Inc.* | 28,986 | ||||||
| 86,569 | EarthLink Holdings Corp. | 554,042 | ||||||
| 16,940 | EVERTEC, Inc. | 263,248 | ||||||
| 1,103 | Fleetmatics Group PLC* | 47,793 | ||||||
| 1,908 | Imperva, Inc.* | 82,063 | ||||||
| 3,148 | inContact, Inc.* | 43,600 | ||||||
| 4,026 | Infoblox, Inc.* | 75,528 | ||||||
| 674 | j2 Global, Inc. | 42,577 | ||||||
| 3,795 | LogMeIn, Inc.* | 240,717 | ||||||
| 17,831 | ManTech International Corp. Class A | 674,368 | ||||||
| 19,803 | Marchex, Inc. Class B* | 62,973 | ||||||
| 23,322 | Mentor Graphics Corp. | 495,826 | ||||||
| 3,219 | MicroStrategy, Inc. Class A* | 563,389 | ||||||
| 11,704 | Monster Worldwide, Inc.* | 27,972 | ||||||
| 3,916 | New Relic, Inc.*(a) | 115,052 | ||||||
| 13,677 | NIC, Inc. | 300,073 | ||||||
| 3,406 | Pegasystems, Inc. | 91,792 | ||||||
| 7,763 | QAD, Inc. Class A | 149,593 | ||||||
| 4,281 | Qualys, Inc.* | 127,617 | ||||||
| 6,222 | RealPage, Inc.* | 138,937 | ||||||
| 3,873 | RingCentral, Inc. Class A* | 76,376 | ||||||
| 6,545 | Synchronoss Technologies, Inc.* | 208,524 | ||||||
|
| |||||||
| 5,868,156 | ||||||||
|
| |||||||
| Technology Hardware & Equipment – 4.8% |
| ||||||
| 3,325 | Belden, Inc. | 200,730 | ||||||
| 24,723 | Benchmark Electronics, Inc.* | 522,891 | ||||||
| 8,863 | Calix, Inc.* | 61,243 | ||||||
|
| |||||||
| Common Stocks – (continued) | ||||||||
| Technology Hardware & Equipment – (continued) |
| ||||||
| 4,854 | Ciena Corp.* | $ | 91,012 | |||||
| 14,993 | Cray, Inc.* | 448,591 | ||||||
| 1,661 | Finisar Corp.* | 29,084 | ||||||
| 7,529 | II-VI, Inc.* | 141,244 | ||||||
| 6,340 | Infinera Corp.* | 71,515 | ||||||
| 18,470 | Insight Enterprises, Inc.* | 480,220 | ||||||
| 7,475 | Ixia* | 73,405 | ||||||
| 23,758 | Kimball Electronics, Inc.* | 295,787 | ||||||
| 6,088 | Methode Electronics, Inc. | 208,392 | ||||||
| 4,494 | MTS Systems Corp. | 197,017 | ||||||
| 11,246 | NETGEAR, Inc.* | 534,635 | ||||||
| 28,626 | Polycom, Inc.* | 322,043 | ||||||
| 915 | Rogers Corp.* | 55,907 | ||||||
| 2,865 | ScanSource, Inc.* | 106,320 | ||||||
| 5,805 | ShoreTel, Inc.* | 38,835 | ||||||
| 1,667 | SYNNEX Corp. | 158,065 | ||||||
| 946 | Tech Data Corp.* | 67,970 | ||||||
| 25,894 | TTM Technologies, Inc.* | 194,982 | ||||||
| 7,320 | Viavi Solutions, Inc.* | 48,532 | ||||||
|
| |||||||
| 4,348,420 | ||||||||
|
| |||||||
| Telecommunication Services – 0.9% |
| ||||||
| 8,539 | General Communication, Inc. Class A* | 134,916 | ||||||
| 9,976 | Spok Holdings, Inc. | 191,190 | ||||||
| 81,933 | Vonage Holdings Corp.* | 499,792 | ||||||
|
| |||||||
| 825,898 | ||||||||
|
| |||||||
| Transportation – 0.9% |
| ||||||
| 6,581 | ArcBest Corp. | 106,941 | ||||||
| 11,748 | Hawaiian Holdings, Inc.* | 445,954 | ||||||
| 3,626 | Heartland Express, Inc. | 63,056 | ||||||
| 4,859 | Hub Group, Inc. Class A* | 186,440 | ||||||
|
| |||||||
| 802,391 | ||||||||
|
| |||||||
| Utilities – 2.9% |
| ||||||
| 10,887 | ALLETE, Inc. | 703,627 | ||||||
| 3,229 | Dynegy, Inc.* | 55,668 | ||||||
| 9,944 | NorthWestern Corp. | 627,168 | ||||||
| 5,791 | ONE Gas, Inc. | 385,623 | ||||||
| 3,397 | Portland General Electric Co. | 149,875 | ||||||
| 8,604 | Southwest Gas Corp. | 677,221 | ||||||
|
| |||||||
| 2,599,182 | ||||||||
|
| |||||||
| TOTAL COMMON STOCKS | ||||||||
| (Cost $84,428,860) | $ | 88,154,907 | ||||||
|
| |||||||
| The accompanying notes are an integral part of these financial statements. | 11 |
GOLDMAN SACHS VARIABLE INSURANCE TRUST SMALL CAP EQUITY INSIGHTS FUND
Schedule of Investments (continued)
June 30, 2016 (Unaudited)
Units | Description | Value | ||||||
| Right – 0.0% | ||||||||
| Pharmaceuticals, Biotechnology & Life Sciences – 0.0% |
| ||||||
| 1,561 | Shire PLC* | $ | 2,365 | |||||
| (Cost $0) | ||||||||
|
| |||||||
| | TOTAL INVESTMENTS BEFORE SECURITIES LENDING REINVESTMENT VEHICLE | |||||||
| (Cost $84,435,653) | $ | 88,157,272 | ||||||
|
| |||||||
| Shares | Distribution Rate | Value | ||||||
| Securities Lending Reinvestment Vehicle(c)(d) – 3.1% | ||||||||
| Goldman Sachs Financial Square Money Market Fund – | | ||||||
| 2,843,469 | 0.397% | $ | 2,843,469 | |||||
| (Cost $2,843,469) | ||||||||
|
| |||||||
| TOTAL INVESTMENTS – 100.4% | ||||||||
| (Cost $87,279,122) | $ | 91,000,741 | ||||||
|
| |||||||
| LIABILITIES IN EXCESS OF | (397,974 | ) | |||||
|
| |||||||
| NET ASSETS – 100.0% | $ | 90,602,767 | ||||||
|
| |||||||
| The percentage shown for each investment category reflects the value of investments in that category as a percentage of net assets. | ||
| * | Non-income producing security. | |
| (a) | All or a portion of security is on loan. | |
| (b) | All or a portion of security is segregated as collateral for initial margin requirements on futures transactions. | |
| (c) | Variable rate security. Interest rate or distribution rate disclosed is that which is in effect on June 30, 2016. | |
| (d) | Represents an affiliated issuer. | |
| Investment Abbreviation: | ||
| REIT | —Real Estate Investment Trust | |
ADDITIONAL INVESTMENT INFORMATION
FUTURES CONTRACTS — At June 30, 2016, the Fund had the following futures contracts:
| Type | Number of Contracts Long (Short) | Expiration Date | Current Value | Unrealized Gain (Loss) | ||||||||||
| Russell 2000 Mini Index | 13 | September 2016 | $ | 1,491,620 | $ | 4,090 | ||||||||
| 12 | The accompanying notes are an integral part of these financial statements. |
GOLDMAN SACHS VARIABLE INSURANCE TRUST SMALL CAP EQUITY INSIGHTS FUND
Statement of Assets and Liabilities
June 30, 2016 (Unaudited)
| Assets: | ||||
Investments in unaffiliated issuers, at value (cost $84,435,653)(a) | $ | 88,157,272 | ||
Investments in affiliated securities lending reinvestment vehicle, at value which equals cost | 2,843,469 | |||
Cash | 2,473,499 | |||
Receivables: | ||||
Due from custodian | 473,772 | |||
Dividends | 120,113 | |||
Reimbursement from investment adviser | 11,936 | |||
Securities lending income | 2,423 | |||
Fund shares sold | 1,010 | |||
Variation margin on certain derivative contracts | 23,800 | |||
| Total assets | 94,107,294 | |||
| Liabilities: | ||||
Payables: | ||||
Payable upon return of securities loaned | 2,843,469 | |||
Investments purchased | 472,649 | |||
Fund shares redeemed | 65,714 | |||
Management fees | 52,227 | |||
Distribution and Service fees and Transfer Agency fees | 5,511 | |||
Accrued expenses | 64,957 | |||
| Total liabilities | 3,504,527 | |||
| Net Assets: | ||||
Paid-in capital | 87,793,931 | |||
Undistributed net investment income | 847,421 | |||
Accumulated net realized loss | (1,764,294 | ) | ||
Net unrealized gain | 3,725,709 | |||
| NET ASSETS | $ | 90,602,767 | ||
Net Assets: | ||||
Institutional | $ | 71,010,378 | ||
Service | 19,592,389 | |||
Total Net Assets | $ | 90,602,767 | ||
Shares outstanding $0.001 par value (unlimited shares authorized): | ||||
Institutional | 5,932,021 | |||
Service | 1,648,929 | |||
Net asset value, offering and redemption price per share: | ||||
Institutional | $11.97 | |||
Service | 11.88 | |||
(a) Includes loaned securities having a market value of $2,784,827.
| The accompanying notes are an integral part of these financial statements. | 13 |
GOLDMAN SACHS VARIABLE INSURANCE TRUST SMALL CAP EQUITY INSIGHTS FUND
Statement of Operations
For the Six Months Ended June 30, 2016 (Unaudited)
| Investment income: | ||||
Dividends (net of foreign taxes withheld of $673) | $ | 706,529 | ||
Securities lending income — affiliated issuer | 18,097 | |||
| Total investment income | 724,626 | |||
| Expenses: | ||||
Management fees | 328,190 | |||
Professional fees | 37,685 | |||
Custody, accounting and administrative services | 29,209 | |||
Printing and mailing costs | 28,177 | |||
Distribution and Service fees — Service Shares | 23,401 | |||
Trustee fees | 12,562 | |||
Transfer Agency fees(a) | 8,751 | |||
Other | 7,308 | |||
| Total expenses | 475,283 | |||
Less — expense reductions | (96,571 | ) | ||
| Net expenses | 378,712 | |||
| NET INVESTMENT INCOME | 345,914 | |||
| Realized and unrealized gain (loss): | ||||
Net realized gain (loss) from: | ||||
Investments | (2,355,505 | ) | ||
Futures contracts | 33,825 | |||
Net change in unrealized gain (loss) on: | ||||
Investments | 4,692,648 | |||
Futures contracts | 408 | |||
| Net realized and unrealized gain | 2,371,376 | |||
| NET INCREASE IN NET ASSETS RESULTING FROM OPERATIONS | $ | 2,717,290 | ||
(a) Institutional and Service Shares incurred Transfer Agency fees of $6,879 and $1,872, respectively.
| 14 | The accompanying notes are an integral part of these financial statements. |
GOLDMAN SACHS VARIABLE INSURANCE TRUST SMALL CAP EQUITY INSIGHTS FUND
Statements of Changes in Net Assets
| For the Six Months Ended June 30, 2016 (Unaudited) | For the Fiscal Year Ended December 31, 2015 | |||||||
| From operations: | ||||||||
Net investment income | $ | 345,914 | $ | 560,792 | ||||
Net realized gain (loss) | (2,321,680 | ) | 10,703,703 | |||||
Net change in unrealized gain (loss) | 4,693,056 | (12,937,958 | ) | |||||
| Net increase (decrease) in net assets resulting from operations | 2,717,290 | (1,673,463 | ) | |||||
| Distributions to shareholders: | ||||||||
From net investment income | ||||||||
Institutional Shares | — | (225,666 | ) | |||||
Service Shares | — | (5,881 | ) | |||||
From net realized gains | ||||||||
Institutional Shares | — | (9,544,423 | ) | |||||
Service Shares | — | (2,555,468 | ) | |||||
| Total distributions to shareholders | — | (12,331,438 | ) | |||||
| From share transactions: | ||||||||
Proceeds from sales of shares | 2,928,809 | 17,599,123 | ||||||
Reinvestment of distributions | — | 12,331,438 | ||||||
Cost of shares redeemed | (7,801,324 | ) | (35,954,038 | ) | ||||
| Net decrease in net assets resulting from share transactions | (4,872,515 | ) | (6,023,477 | ) | ||||
| TOTAL DECREASE | (2,155,225 | ) | (20,028,378 | ) | ||||
| Net assets: | ||||||||
Beginning of period | 92,757,992 | 112,786,370 | ||||||
End of period | $ | 90,602,767 | $ | 92,757,992 | ||||
| Undistributed net investment income | $ | 847,421 | $ | 501,507 | ||||
| The accompanying notes are an integral part of these financial statements. | 15 |
GOLDMAN SACHS VARIABLE INSURANCE TRUST SMALL CAP EQUITY INSIGHTS FUND
Financial Highlights
Selected Data for a Share Outstanding Throughout Each Period
| Income (loss) from investment operations | Distributions to shareholders | |||||||||||||||||||||||||||||||||||||||||||||||||||||||
| Year - Share Class | Net asset value, beginning of period | Net investment income(a) | Net realized and unrealized gain (loss) | Total from investment operations | From net investment income | From net realized gain | Total distributions | Net asset value, end of period | Total return(b) | Net assets, end of period (in 000s) | Ratio of net expenses to average net assets | Ratio of total expenses to average net assets | Ratio of net investment income to average net assets | Portfolio turnover rate(c) | ||||||||||||||||||||||||||||||||||||||||||
FOR THE SIX MONTHS ENDED JUNE 30, (UNAUDITED) | ||||||||||||||||||||||||||||||||||||||||||||||||||||||||
2016 - Institutional | $ | 11.60 | $ | 0.05 | $ | 0.32 | $ | 0.37 | $ | — | $ | — | $ | — | $ | 11.97 | 3.19 | % | $ | 71,010 | 0.81 | %(d) | 1.03 | %(d) | 0.84 | %(d) | 64 | % | ||||||||||||||||||||||||||||
2016 - Service | 11.52 | 0.03 | 0.33 | 0.36 | — | — | — | 11.88 | 3.13 | 19,592 | 1.06 | (d) | 1.28 | (d) | 0.60 | (d) | 64 | |||||||||||||||||||||||||||||||||||||||
FOR THE FISCAL YEARS ENDED DECEMBER 31, | ||||||||||||||||||||||||||||||||||||||||||||||||||||||||
2015 - Institutional | 13.67 | 0.08 | (e) | (0.37 | ) | (0.29 | ) | (0.04 | ) | (1.74 | ) | (1.78 | ) | 11.60 | (2.13 | ) | 73,270 | 0.81 | 0.99 | 0.59 | (e) | 124 | ||||||||||||||||||||||||||||||||||
2015 - Service | 13.60 | 0.05 | (e) | (0.39 | ) | (0.34 | ) | — | (f) | (1.74 | ) | (1.74 | ) | 11.52 | (2.49 | ) | 19,488 | 1.06 | 1.24 | 0.34 | (e) | 124 | ||||||||||||||||||||||||||||||||||
2014 - Institutional | 15.07 | 0.08 | 0.90 | 0.98 | (0.12 | ) | (2.26 | ) | (2.38 | ) | 13.67 | 6.93 | 89,043 | 0.83 | 1.04 | 0.53 | 119 | |||||||||||||||||||||||||||||||||||||||
2014 - Service | 15.00 | 0.04 | 0.90 | 0.94 | (0.08 | ) | (2.26 | ) | (2.34 | ) | 13.60 | 6.69 | 23,744 | 1.08 | 1.29 | 0.28 | 119 | |||||||||||||||||||||||||||||||||||||||
2013 - Institutional | 12.71 | 0.11 | 4.37 | 4.48 | (0.16 | ) | (1.96 | ) | (2.12 | ) | 15.07 | 35.62 | 98,114 | 0.82 | 0.98 | 0.77 | 152 | |||||||||||||||||||||||||||||||||||||||
2013 - Service | 12.65 | 0.08 | 4.34 | 4.42 | (0.11 | ) | (1.96 | ) | (2.07 | ) | 15.00 | 35.38 | 25,932 | 1.07 | 1.23 | 0.52 | 152 | |||||||||||||||||||||||||||||||||||||||
2012 - Institutional | 11.40 | 0.19 | (g) | 1.27 | (h) | 1.46 | (0.15 | ) | — | (0.15 | ) | 12.71 | 12.79 | (g) | 82,961 | 0.81 | 0.97 | 1.55 | (g) | 95 | ||||||||||||||||||||||||||||||||||||
2012 - Service | 11.35 | 0.17 | (g) | 1.25 | (h) | 1.42 | (0.12 | ) | — | (0.12 | ) | 12.65 | 12.47 | (g) | 22,674 | 1.06 | 1.22 | 1.34 | (g) | 95 | ||||||||||||||||||||||||||||||||||||
2011 - Institutional | 11.42 | 0.06 | (i) | 0.02 | (j) | 0.08 | (0.10 | ) | — | (0.10 | ) | 11.40 | 0.67 | 87,956 | 0.83 | 0.99 | 0.55 | (i) | 33 | |||||||||||||||||||||||||||||||||||||
2011 - Service | 11.37 | 0.03 | (i) | 0.02 | (j) | 0.05 | (0.07 | ) | — | (0.07 | ) | 11.35 | 0.41 | 22,973 | 1.08 | 1.24 | 0.30 | (i) | 33 | |||||||||||||||||||||||||||||||||||||
| (a) | Calculated based on the average shares outstanding methodology. |
| (b) | Assumes investment at the net asset value at the beginning of the period, reinvestment of all distributions, and a complete redemption of the investment at the net asset value at the end of the period. Total returns for periods less than one full year are not annualized. |
| (c) | The Fund's portfolio turnover rate is calculated in accordance with regulatory requirements, without regard to transactions involving short term investments and certain derivatives. If such transactions were included, the Fund's portfolio turnover rate may be higher. |
| (d) | Annualized. |
| (e) | Reflects income recognized from special dividends which amounted to $0.02 per share and 0.15% of average net assets. |
| (f) | Amount is less than $0.005 per share. |
| (g) | Reflects income recognized from special dividends which amounted to $0.08 per share and 0.62% of average net assets. |
| (h) | Reflects payment from affiliate relating to certain investment transactions which amounted to $0.08 per share. Excluding such payment, the total return would have been 12.44% and 12.12%, respectively. |
| (i) | Reflects income recognized from special dividends which amounted to $0.02 per share and 0.21% of average net assets. |
| (j) | Reflects an increase of $0.02 due to payments received for class action settlements received this year. |
| The accompanying notes are an integral part of these financial statements. | 16 |
GOLDMAN SACHS VARIABLE INSURANCE TRUST SMALL CAP EQUITY INSIGHTS FUND
Notes to Financial Statements
June 30, 2016 (Unaudited)
1. ORGANIZATION
Goldman Sachs Variable Insurance Trust (the “Trust” or “VIT”) is a Delaware statutory trust registered under the Investment Company Act of 1940, as amended (the “Act”), as an open-end management investment company. The Trust includes the Goldman Sachs Small Cap Equity Insights Fund (the “Fund”). The Fund is a diversified portfolio under the Act offering two classes of shares — Institutional and Service Shares. Shares of the Trust are offered to separate accounts of participating life insurance companies for the purpose of funding variable annuity contracts and variable life insurance policies.
Goldman Sachs Asset Management, L.P. (“GSAM”), an affiliate of Goldman, Sachs & Co. (“Goldman Sachs”), serves as investment adviser to the Fund pursuant to a management agreement (the “Agreement”) with the Trust.
2. SIGNIFICANT ACCOUNTING POLICIES
The financial statements have been prepared in accordance with accounting principles generally accepted in the United States of America (“GAAP”) and require management to make estimates and assumptions that may affect the reported amounts and disclosures. Actual results may differ from those estimates and assumptions.
A. Investment Valuation — The Fund’s valuation policy is to value investments at fair value.
B. Investment Income and Investments — Investment income includes interest income, dividend income, net of any foreign withholding taxes, less any amounts reclaimable, and securities lending income. Interest income is accrued daily and adjusted for amortization of premiums and accretion of discounts. Dividend income is recognized on ex-dividend date or, for certain foreign securities, as soon as such information is obtained subsequent to the ex-dividend date. Investment transactions are reflected on trade date. Realized gains and losses are calculated using identified cost. Investment transactions are recorded on the following business day for daily net asset value (“NAV”) calculations. Any foreign capital gains tax is accrued daily based upon net unrealized gains, and is payable upon sale of such investments. Distributions received from the Fund’s investments in United States (“U.S.”) real estate investment trusts (“REITs”) may be characterized as ordinary income, net capital gain or a return of capital. A return of capital is recorded by the Fund as a reduction to the cost basis of the REIT.
For derivative contracts, realized gains and losses are recorded upon settlement of the contract.
C. Class Allocations and Expenses — Investment income, realized and unrealized gain (loss), and non-class specific expenses of the Fund are allocated daily based upon the proportion of net assets of each class. Non-class specific expenses directly incurred by the Fund are charged to the Fund, while such expenses incurred by the Trust are allocated across the Fund on a straight-line and/or pro-rata basis depending upon the nature of the expenses. Class specific expenses, where applicable, are borne by the respective share classes and include Distribution and Service and Transfer Agency fees.
D. Federal Taxes and Distributions to Shareholders — It is the Fund’s policy to comply with the requirements of the Internal Revenue Code of 1986, as amended (the “Code”), applicable to regulated investment companies (mutual funds) and to distribute each year substantially all of its investment company taxable income and capital gains to its shareholders. Accordingly, the Fund is not required to make any provisions for the payment of federal income tax. Distributions to shareholders are recorded on the ex-dividend date. Income and capital gains distributions, if any, are declared and paid annually.
Net capital losses are carried forward to future fiscal years and may be used to the extent allowed by the Code to offset any future capital gains. Losses that are carried forward will retain their character as either short-term or long-term capital losses. Utilization of capital loss carryforwards will reduce the requirement of future capital gains distributions.
The characterization of distributions to shareholders for financial reporting purposes is determined in accordance with federal income tax rules, which may differ from GAAP. The source of the Fund’s distributions may be shown in the accompanying financial statements as either from net investment income, net realized gain or capital. Certain components of the Fund’s net assets on the Statement of Assets and Liabilities reflect permanent GAAP/tax differences based on the appropriate tax character.
17
GOLDMAN SACHS VARIABLE INSURANCE TRUST SMALL CAP EQUITY INSIGHTS FUND
Notes to Financial Statements (continued)
June 30, 2016 (Unaudited)
3. INVESTMENTS AND FAIR VALUE MEASUREMENTS
The fair value of a financial instrument is the amount that would be received to sell an asset or paid to transfer a liability in an orderly transaction between market participants at the measurement date (i.e., the exit price). GAAP establishes a fair value hierarchy that prioritizes the inputs to valuation techniques used to measure fair value. The hierarchy gives the highest priority to unadjusted quoted prices in active markets for identical assets or liabilities (Level 1 measurements) and the lowest priority to unobservable inputs (Level 3 measurements). The levels used for classifying investments are not necessarily an indication of the risk associated with investing in these investments. The three levels of the fair value hierarchy are described below:
Level 1 — Unadjusted quoted prices in active markets that are accessible at the measurement date for identical, unrestricted assets or liabilities;
Level 2 — Quoted prices in markets that are not active or financial instruments for which significant inputs are observable (including, but not limited to, quoted prices for similar investments, interest rates, foreign exchange rates, volatility and credit spreads), either directly or indirectly;
Level 3 — Prices or valuations that require significant unobservable inputs (including GSAM’s assumptions in determining fair value measurement).
Changes in valuation techniques may result in transfers into or out of an assigned level within the hierarchy. In accordance with the Fund’s policy, transfers between different levels of the fair value hierarchy resulting from such changes are deemed to have occurred as of the beginning of the reporting period.
The Board of Trustees (“Trustees”) has approved Valuation Procedures that govern the valuation of the portfolio investments held by the Fund, including investments for which market quotations are not readily available. The Trustees have delegated to GSAM day-to-day responsibility for implementing and maintaining internal controls and procedures related to the valuation of the Fund’s portfolio investments. To assess the continuing appropriateness of pricing sources and methodologies, GSAM regularly performs price verification procedures and issues challenges as necessary to third party pricing vendors or brokers, and any differences are reviewed in accordance with the Valuation Procedures.
A. Level 1 and Level 2 Fair Value Investments — The valuation techniques and significant inputs used in determining the fair values for investments classified as Level 1 and Level 2 are as follows:
Equity Securities — Equity securities traded on a U.S. securities exchange or the NASDAQ system, or those located on certain foreign exchanges, including but not limited to the Americas, are valued daily at their last sale price or official closing price on the principal exchange or system on which they are traded. If there is no sale or official closing price or such price is believed by GSAM to not represent fair value, equity securities are valued at the last bid price for long positions and at the last ask price for short positions. To the extent these investments are actively traded, they are classified as Level 1 of the fair value hierarchy, otherwise they are generally classified as Level 2.
Unlisted equity securities for which market quotations are available are valued at the last sale price on the valuation date, or if no sale occurs, at the last bid price. These investments are generally classified as Level 2 of the fair value hierarchy.
Money Market Funds — Investments in the Goldman Sachs Financial Square Money Market Fund (“Underlying Fund”) are valued at the NAV of the FST Institutional Share class on the day of valuation. These investments are generally classified as Level 1 of the fair value hierarchy. For information regarding an Underlying Fund’s accounting policies and investment holdings, please see the Underlying Fund’s shareholder report.
Derivative Contracts — A derivative is an instrument whose value is derived from underlying assets, indices, reference rates or a combination of these factors. The Fund enters into derivative transactions to hedge against changes in interest rates, securities prices, and/or currency exchange rates, to increase total return, or to gain access to certain markets or attain exposure to other underliers.
Exchange-traded derivatives, including futures and options contracts, are valued at the last sale or settlement price and typically fall within Level 1 of the fair value hierarchy. Over-the-counter (“OTC”) and centrally cleared derivatives are valued using market transactions and other market evidence, including market-based inputs to models, calibration to market-clearing
18
GOLDMAN SACHS VARIABLE INSURANCE TRUST SMALL CAP EQUITY INSIGHTS FUND
3. INVESTMENTS AND FAIR VALUE MEASUREMENTS (continued)
transactions, broker or dealer quotations, or other alternative pricing sources. Where models are used, the selection of a particular model to value OTC and centrally cleared derivatives depends upon the contractual terms of, and specific risks inherent in, the instrument, as well as the availability of pricing information in the market. Valuation models require a variety of inputs, including contractual terms, market prices, yield curves, credit curves, measures of volatility, voluntary and involuntary prepayment rates, loss severity rates and correlations of such inputs. For OTC and centrally cleared derivatives that trade in liquid markets, model inputs can generally be verified and model selection does not involve significant management judgment. OTC and centrally cleared derivatives are classified within Level 2 of the fair value hierarchy when significant inputs are corroborated by market evidence.
i. Futures Contracts — Futures contracts are contracts to buy or sell a standardized quantity of a specified commodity or security and are valued based on exchanged settlement prices or independent market quotes. Futures contracts are valued at the last settlement price, or in the absence of a sale, the last bid price for long positions and at the last ask price for short positions, at the end of each day on the board of trade or exchange upon which they are traded. Upon entering into a futures contract, the Fund deposits cash or securities in an account on behalf of the broker in an amount sufficient to meet the initial margin requirement. Subsequent payments are made or received by the Fund equal to the daily change in the contract value and are recorded as variation margin receivable or payable with a corresponding offset to unrealized gains or losses.
B. Level 3 Fair Value Investments — To the extent that significant inputs to valuation models and other alternative pricing sources are unobservable, or if quotations are not readily available, or if GSAM believes that such quotations do not accurately reflect fair value, the fair value of the Fund’s investments may be determined under Valuation Procedures approved by the Trustees. GSAM, consistent with its procedures and applicable regulatory guidance, may make an adjustment to the most recent valuation prices of either domestic or foreign securities in light of significant events to reflect what it believes to be the fair value of the securities at the time of determining a Fund’s NAV. Significant events which could affect a large number of securities in a particular market may include, but are not limited to: significant fluctuations in U.S. or foreign markets; market dislocations; market disruptions; or unscheduled market closings. Significant events which could also affect a single issuer may include, but are not limited to: corporate actions such as reorganizations, mergers and buy-outs; ratings downgrades; and bankruptcies.
C. Fair Value Hierarchy — The following is a summary of the Fund’s investments and derivatives classified in the fair value hierarchy as of June 30, 2016:
| Investment Type | Level 1 | Level 2 | Level 3 | |||||||||
| Assets | ||||||||||||
| Common Stock and/or Other Equity Investments(a) | ||||||||||||
North America | $ | 88,154,907 | $ | — | $ | 2,365 | ||||||
| Securities Lending Reinvestment Vehicle | 2,843,469 | — | — | |||||||||
| Total | $ | 90,998,376 | $ | — | $ | 2,365 | ||||||
| Derivative Type | ||||||||||||
| Assets(b) | ||||||||||||
Futures Contracts | $ | 4,090 | $ | — | $ | — | ||||||
| (a) | Amounts are disclosed by continent to highlight the impact of time zone differences between local market close and the calculation of NAV. Security valuations are based on the principal exchange or system on which they are traded, which may differ from country of domicile noted in table. |
| (b) | Amount shown represents unrealized gain (loss) at period end. |
For further information regarding security characteristics, see the Schedule of Investments.
19
GOLDMAN SACHS VARIABLE INSURANCE TRUST SMALL CAP EQUITY INSIGHTS FUND
Notes to Financial Statements (continued)
June 30, 2016 (Unaudited)
4. INVESTMENTS IN DERIVATIVES
The following table sets forth, by certain risk types, the gross value of derivative contracts as of June 30, 2016. These instruments were used as part of the Fund’s investment strategies and to obtain and/or manage exposure related to the risks below. The values in the table below exclude the effects of cash collateral received or posted pursuant to these derivative contracts, and therefore are not representative of the Fund’s net exposure.
| Risk | Statement of Assets and Liabilities | Assets(a) | Statement of Assets and Liabilities | Liabilities | ||||||||||
| Equity | Variation margin on certain derivative contracts | $ | 4,090 | — | $ | — | ||||||||
| (a) | Includes unrealized gain (loss) on futures contracts described in the Additional Investment Information section of the Schedule of Investments. Only current day’s variation margin is reported within the Statement of Assets and Liabilities. |
The following table sets forth, by certain risk types, the Fund’s gains (losses) related to these derivatives and their indicative volumes for the six months ended June 30, 2016. These gains (losses) should be considered in the context that these derivative contracts may have been executed to create investment opportunities and/or economically hedge certain investments, and accordingly, certain gains (losses) on such derivative contracts may offset certain (losses) gains attributable to investments. These gains (losses) are included in “Net realized gain (loss)” or “Net change in unrealized gain (loss)” on the Statement of Operations:
| Risk | Statement of Operations | Net Realized Gain (Loss) | Net Change in Unrealized Gain (Loss) | Average Number of Contracts(a) | ||||||||||
| Equity | Net realized gain (loss) from futures contracts/Net change in unrealized gain (loss) on futures contracts | $ | 33,825 | $ | 408 | 13 | ||||||||
| (a) | Average number of contracts is based on the average of month end balances for the six months ended June 30, 2016. |
5. AGREEMENTS AND AFFILIATED TRANSACTIONS
A. Management Agreement — Under the Agreement, GSAM manages the Fund, subject to the general supervision of the Trustees.
As compensation for the services rendered pursuant to the Agreement, the assumption of the expenses related thereto and administration of the Fund’s business affairs, including providing facilities, GSAM is entitled to a management fee, accrued daily and paid monthly, equal to an annual percentage rate of the Fund’s average daily net assets.
For the six months ended June 30, 2016, contractual and effective net management fees with GSAM were at the following rates:
| Contractual Management Rate | ||||||||||||||||||||||
| First $2 billion | Next $3 billion | Next $3 billion | Over $8 billion | Effective Rate | Effective Net Management Rate^ | |||||||||||||||||
| 0.75% | 0.68 | % | 0.65 | % | 0.64 | % | 0.75 | % | 0.70 | %* | ||||||||||||
| ^ | Effective Net Management Rate includes the impact of management fee waivers of affiliated underlying funds, if any. |
| * | GSAM agreed to waive a portion of its management fee in order to achieve a net management rate, as defined in the Fund’s most recent prospectus. This waiver will be effective through at least April 29, 2017, and prior to such date GSAM may not terminate the arrangement without approval of the Trustees. For the six months ended June 30, 2016, GSAM waived $21,879 of its management fee. |
B. Distribution and Service Plan — The Trust, on behalf of the Service Shares of the Fund, has adopted a Distribution and Service Plan (the “Plan”). Under the Plan, Goldman Sachs, which serves as distributor (the “Distributor”), is entitled to a fee accrued daily and paid monthly, for distribution services and personal and account maintenance services, which may then be paid by Goldman Sachs to authorized dealers, equal to, on an annual basis, 0.25% of the Fund’s average daily net assets attributable to Service Shares.
20
GOLDMAN SACHS VARIABLE INSURANCE TRUST SMALL CAP EQUITY INSIGHTS FUND
5. AGREEMENTS AND AFFILIATED TRANSACTIONS (continued)
C. Transfer Agency Agreement — Goldman Sachs also serves as the transfer agent of the Fund for a fee pursuant to the Transfer Agency Agreement. The fees charged for such transfer agency services are accrued daily and paid monthly at an annual rate of 0.02% of the average daily net assets of Institutional and Service Shares.
D. Other Expense Agreements and Affiliated Transactions — GSAM has agreed to limit certain “Other Expenses” of the Fund (excluding acquired fund fees and expenses, transfer agency fees and expenses, taxes, interest, brokerage fees, shareholder meeting, litigation, indemnification, and extraordinary expenses) to the extent such expenses exceed, on an annual basis, a percentage rate of the average daily net assets of the Fund. Such Other Expense reimbursements, if any, are accrued daily and paid monthly. In addition, the Fund is not obligated to reimburse GSAM for prior fiscal year expense reimbursements, if any. The Other Expense limitation as an annual percentage rate of average daily net assets for the Fund is 0.094%. The Other Expense limitation will remain in place through at least April 29, 2017, and prior to such date GSAM may not terminate the arrangement without the approval of the Trustees. For the six months ended June 30, 2016, GSAM reimbursed $73,805 to the Fund. In addition, the Fund has entered into certain offset arrangements with the custodian and the transfer agent, which may result in a reduction of the Fund’s expenses and are received irrespective of the application of the “Other Expense” limitations described above. For the six months ended June 30, 2016, custody fee credits were $887.
E. Line of Credit Facility — As of June 30, 2016, the Fund participated in a $1,100,000,000 committed, unsecured revolving line of credit facility (the “facility”) together with other funds of the Trust and registered investment companies having management agreements with GSAM or its affiliates (“Other Borrowers”). This facility is to be used for temporary or emergency purposes, or to allow for an orderly liquidation of securities to meet redemption requests. The interest rate on borrowings is based on the federal funds rate. The facility also requires a fee to be paid by the Fund based on the amount of the commitment that has not been utilized. For the six months ended June 30, 2016, the Fund did not have any borrowings under the facility.
6. PORTFOLIO SECURITIES TRANSACTIONS
The cost of purchases and proceeds from sales and maturities of long-term securities for the six months ended June 30, 2016, were $56,100,059 and $60,730,140, respectively.
7. SECURITIES LENDING
Pursuant to exemptive relief granted by the Securities and Exchange Commission (“SEC”) and the terms and conditions contained therein, the Fund may lend its securities through a securities lending agent, Goldman Sachs Agency Lending (“GSAL”), a wholly-owned subsidiary of Goldman Sachs, to certain qualified borrowers including Goldman Sachs and affiliates. In accordance with the Fund’s securities lending procedures, the Fund receives cash collateral at least equal to the market value of the securities on loan. The market value of the loaned securities is determined at the close of business of the Fund, at their last sale price or official closing price on the principal exchange or system on which they are traded, and any additional required collateral is delivered to the Fund on the next business day. As with other extensions of credit, the Fund may experience delay in the recovery of its securities or incur a loss should the borrower of the securities breach its agreement with the Fund or become insolvent at a time when the collateral is insufficient to cover the cost of repurchasing securities on loan. Dividend income received from securities on loan may not be subject to withholding taxes and therefore withholding taxes paid may differ from the amounts listed in the Statement of Operations. Loans of securities are terminable at any time and as such 1) the remaining contractual maturities of the outstanding securities lending transactions are considered to be overnight and continuous and 2) the borrower, after notice, is required to return borrowed securities within the standard time period for settlement of securities transactions.
The Fund invests the cash collateral received in connection with securities lending transactions in the Goldman Sachs Financial Square Money Market Fund (“Money Market Fund”), an affiliated series of the Trust. The Money Market Fund is registered under the Act as an open end investment company, is subject to Rule 2a-7 under the Act, and is managed by GSAM, for
21
GOLDMAN SACHS VARIABLE INSURANCE TRUST SMALL CAP EQUITY INSIGHTS FUND
Notes to Financial Statements (continued)
June 30, 2016 (Unaudited)
7. SECURITIES LENDING (continued)
which GSAM may receive an investment advisory fee of up to 0.205% on an annualized basis of the average daily net assets of the Money Market Fund.
In the event of a default by a borrower with respect to any loan, GSAL will exercise any and all remedies provided under the applicable borrower agreement to make the Fund whole. These remedies include purchasing replacement securities by applying the collateral held from the defaulting broker against the purchase cost of the replacement securities. If, despite such efforts by GSAL to exercise these remedies, the Fund sustains losses as a result of a borrower’s default, GSAL indemnifies the Fund by purchasing replacement securities at GSAL’s expense, or paying the Fund an amount equal to the market value of the replacement securities, subject to an exclusion for any shortfalls resulting from a loss of value in the cash collateral pool due to reinvestment risk and a requirement that the Fund agrees to assign rights to the collateral to GSAL for purpose of using the collateral to cover purchase of replacement securities as more fully described in the Securities Lending Agency Agreement. The Fund’s loaned securities were all subject to enforceable Securities Lending Agreements and the value of the collateral is at least equal to the value of the cash received. The value of loaned securities and cash collateral at period end are disclosed in the Fund’s Statement of Assets and Liabilities.
Both the Fund and GSAL received compensation relating to the lending of the Fund’s securities. The amounts earned by the Fund for the six months ended June 30, 2016, are reported under Investment Income on the Statement of Operations.
The table below details securities lending activity with affiliates of Goldman Sachs:
| For the six months ended June 30, 2016 | ||||||||||
| Earnings of GSAL Relating to Securities Loaned | Amounts Received by the Fund from Lending to Goldman Sachs | Amounts Payable to Goldman Sachs Upon Return of Securities Loaned as of June 30, 2016 | ||||||||
| $2,010 | $ | 2,152 | $ | 280,575 | ||||||
The following table provides information about the Fund’s investment in the Money Market Fund for the six months ended June 30, 2016:
| Market Value 12/31/2015 | Purchases at Cost | Proceeds from Sales | Market Value 6/30/2016 | |||||||||||
| $ | 2,188,175 | $ | 11,879,342 | $ | (11,224,048 | ) | $ | 2,843,469 | ||||||
8. TAX INFORMATION
As of the Fund’s most recent fiscal year end, December 31, 2015, the Fund’s timing differences, on a tax-basis were as follows:
| Timing differences (Post October Loss Deferral/§ 857(b)(9) Deferred Dividend) | $ | (311,690 | ) |
As of June 30, 2016, the Fund’s aggregate security unrealized gains and losses based on cost for U.S. federal income tax purposes were as follows:
| Tax cost | $ | 87,395,003 | ||
| Gross unrealized gain | 3,721,619 | |||
| Gross unrealized loss | (115,881 | ) | ||
| Net unrealized security gain | $ | 3,605,738 |
22
GOLDMAN SACHS VARIABLE INSURANCE TRUST SMALL CAP EQUITY INSIGHTS FUND
8. TAX INFORMATION (continued)
The difference between GAAP-basis and tax-basis unrealized gains (losses) is attributable primarily to wash sales, net mark to market gains (losses) on regulated futures contracts and differences in the tax treatment of underlying fund investments.
GSAM has reviewed the Fund’s tax positions for all open tax years (the current and prior three years, as applicable) and has concluded that no provision for income tax is required in the Fund’s financial statements. Such open tax years remain subject to examination and adjustment by tax authorities.
9. OTHER RISKS
The Fund’s risks include, but are not limited to, the following:
Derivatives Risk — Loss may result from the Fund’s investments in derivative instruments. These instruments may be illiquid, difficult to price and leveraged so that small changes in the value of the underlying instruments may produce disproportionate losses to the Fund. Derivatives are also subject to counterparty risk, which is the risk that the other party in the transaction will not fulfill its contractual obligation. Losses from investments in derivatives can also result from a lack of correlation between changes in the value of derivative instruments and the portfolio assets (if any) being hedged.
Large Shareholder Transactions Risk — The Fund may experience adverse effects when certain large shareholders, such as other funds, participating insurance companies, accounts and Goldman Sachs affiliates, purchase or redeem large amounts of shares of the Fund. Such large shareholder redemptions may cause the Fund to sell portfolio securities at times when it would not otherwise do so, which may negatively impact the Fund’s NAV and liquidity. These transactions may also accelerate the realization of taxable income to shareholders if such sales of investments resulted in gains, and may also increase transaction costs. In addition, a large redemption could result in the Fund’s current expenses being allocated over a smaller asset base, leading to an increase in the Fund’s expense ratio. Similarly, large Fund share purchases may adversely affect the Fund’s performance to the extent that the Fund is delayed in investing new cash and is required to maintain a larger cash position than it ordinarily would.
Liquidity Risk — The Fund may make investments that are illiquid or that may become less liquid in response to market developments or adverse investor perceptions. Illiquid investments may be more difficult to value. Liquidity risk may also refer to the risk that the Fund will not be able to pay redemption proceeds within the allowable time period because of unusual market conditions, an unusually high volume of redemption requests, or other reasons. To meet redemption requests, the Fund may be forced to sell investments at an unfavorable time and/or under unfavorable conditions.
Market and Credit Risks — In the normal course of business, the Fund trades financial instruments and enters into financial transactions where risk of potential loss exists due to changes in the market (market risk). Additionally, the Fund may also be exposed to credit risk in the event that an issuer or guarantor fails to perform or that an institution or entity with which the Fund has unsettled or open transactions defaults.
10. INDEMNIFICATIONS
Under the Trust’s organizational documents, its Trustees, officers, employees and agents are indemnified, to the extent permitted by the Act and state law, against certain liabilities that may arise out of performance of their duties to the Fund. Additionally, in the course of business, the Fund enters into contracts that contain a variety of indemnification clauses. The Fund’s maximum exposure under these arrangements is unknown, as this would involve future claims that may be made against the Fund that have not yet occurred. However, GSAM believes the risk of loss under these arrangements to be remote.
23
GOLDMAN SACHS VARIABLE INSURANCE TRUST SMALL CAP EQUITY INSIGHTS FUND
Notes to Financial Statements (continued)
June 30, 2016 (Unaudited)
11. SUBSEQUENT EVENTS
Subsequent events after the Statement of Assets and Liabilities date have been evaluated through the date the financial statements were issued. GSAM has concluded that there is no impact requiring adjustment or disclosure in the financial statements.
12. SUMMARY OF SHARE TRANSACTIONS
Share activity is as follows:
| For the Six Months Ended June 30, 2016 (Unaudited) | For the Fiscal Year Ended December 31, 2015 | |||||||||||||||
| Shares | Dollars | Shares | Dollars | |||||||||||||
| Institutional Shares | ||||||||||||||||
| Shares sold | 215,335 | $ | 2,469,336 | 1,203,429 | $ | 17,154,427 | ||||||||||
| Reinvestment of distributions | — | — | 842,249 | 9,770,089 | ||||||||||||
| Shares redeemed | (601,617 | ) | (6,850,288 | ) | (2,240,010 | ) | (31,614,902 | ) | ||||||||
| (386,282 | ) | (4,380,952 | ) | (194,332 | ) | (4,690,386 | ) | |||||||||
| Service Shares | ||||||||||||||||
| Shares sold | 41,631 | 459,473 | 32,525 | 444,696 | ||||||||||||
| Reinvestment of distributions | — | — | 222,147 | 2,561,349 | ||||||||||||
| Shares redeemed | (83,623 | ) | (951,036 | ) | (310,170 | ) | (4,339,136 | ) | ||||||||
| (41,992 | ) | (491,563 | ) | (55,498 | ) | (1,333,091 | ) | |||||||||
| NET DECREASE | (428,274 | ) | $ | (4,872,515 | ) | (249,830 | ) | $ | (6,023,477 | ) | ||||||
24
GOLDMAN SACHS VARIABLE INSURANCE TRUST SMALL CAP EQUITY INSIGHTS FUND
| Fund Expenses — Six Month Period Ended June 30, 2016 (Unaudited) |
As a shareholder of Institutional or Service Shares of the Fund, you incur ongoing costs, including management fees, distribution and service (12b-1) fees (with respect to Service Shares) and other Fund expenses. This example is intended to help you understand your ongoing costs (in dollars) of investing in the Institutional Shares and Service Shares of the Fund and to compare these costs with the ongoing costs of investing in other mutual funds.
The example is based on an investment of $1,000 invested at the beginning of the period and held for the entire period from January 1, 2016 through June 30, 2016, which represents a period of 182 days of a 366 day year.
Actual Expenses — The first line under each share class in the table below provides information about actual account values and actual expenses. You may use the information in this line, together with the amount you invested, to estimate the expenses that you paid over the period. Simply divide your account value by $1,000 (for example, an $8,600 account value divided by $1,000=8.6), then multiply the result by the number in the first line under the heading entitled “Expenses Paid” to estimate the expenses you paid on your account during this period.
Hypothetical Example for Comparison Purposes — The second line under each share class in the table below provides information about hypothetical account values and hypothetical expenses based on the Fund's actual net expense ratio and an assumed rate of return of 5% per year before expenses, which is not the Fund's actual return. The hypothetical account values and expenses may not be used to estimate the actual ending account balance or expenses you paid for the period. You may use this information to compare the ongoing costs of investing in the Fund and other funds. To do so, compare this 5% hypothetical example with the 5% hypothetical examples that appear in the shareholder reports of the other funds.
Please note that the expenses shown in the table are meant to highlight your ongoing costs only. As a shareholder of the Fund you do not incur any transaction costs, such as sales charges, redemption fees, or exchange fees, but shareholders of other funds may incur such costs. The second line of the table is useful in comparing ongoing costs only, and will not help you determine the relative total costs of owning different funds whose shareholders may incur transaction costs.
| Share Class | Beginning Account Value 01/01/16 | Ending Account Value | Expenses Paid for the 6 Months Ended 06/30/16* | |||||||||
| Institutional | ||||||||||||
| Actual | $ | 1,000 | $ | 1,031.90 | $ | 4.09 | ||||||
| Hypothetical 5% return | 1,000 | 1,020.84 | + | 4.07 | ||||||||
| Service | ||||||||||||
| Actual | 1,000 | 1,031.30 | 5.35 | |||||||||
| Hypothetical 5% return | 1,000 | 1,019.59 | + | 5.32 | ||||||||
| * | Expenses are calculated using the Fund’s annualized net expense ratio for each class, which represents the ongoing expenses as a percentage of net assets for the six months ended June 30, 2016. Expenses are calculated by multiplying the annualized net expense ratio by the average account value for the period; then multiplying the result by the number of days in the most recent fiscal half year; and then dividing that result by the number of days in the fiscal year. The annualized net expense ratios for the period were 0.81% and 1.06% for the Institutional and Service Shares, respectively. |
| + | Hypothetical expenses are based on the Fund’s actual annualized net expense ratios and an assumed rate of return of 5% per year before expenses. |
25
GOLDMAN SACHS VARIABLE INSURANCE TRUST SMALL CAP EQUITY INSIGHTS FUND
Statement Regarding Basis for Approval of Management Agreement (Unaudited)
Background
The Goldman Sachs Small Cap Equity Insights Fund (the “Fund”) is an investment portfolio of Goldman Sachs Variable Insurance Trust (the “Trust”). The Board of Trustees oversees the management of the Trust and reviews the investment performance and expenses of the Fund at regularly scheduled meetings held throughout the year. In addition, the Board of Trustees determines annually whether to approve the continuance of the Trust’s investment management agreement (the “Management Agreement”) with Goldman Sachs Asset Management, L.P. (the “Investment Adviser”) on behalf of the Fund.
The Management Agreement was most recently approved for continuation until June 30, 2017 by the Board of Trustees, including those Trustees who are not parties to the Management Agreement or “interested persons” (as defined in the Investment Company Act of 1940, as amended) of any party thereto (the “Independent Trustees”), at a meeting held on June 15-16, 2016 (the “Annual Meeting”).
The review process undertaken by the Trustees spans the course of the year and culminates with the Annual Meeting. To assist the Trustees in their deliberations, the Trustees have established a Contract Review Committee (the “Committee”), comprised of the Independent Trustees. The Committee held three meetings over the course of the year since the Management Agreement was last approved. At those Committee meetings, regularly scheduled Board or other committee meetings, and/or the Annual Meeting, matters relevant to the renewal of the Management Agreement were considered by the Board, or the Independent Trustees, as applicable. With respect to the Fund, such matters included:
| (a) | the nature and quality of the advisory, administrative, and other services provided to the Fund by the Investment Adviser and its affiliates, including information about: |
| (i) | the structure, staff, and capabilities of the Investment Adviser and its portfolio management teams; |
| (ii) | the groups within the Investment Adviser and its affiliates that support the portfolio management teams or provide other types of necessary services, including fund services groups (e.g., accounting and financial reporting, tax, shareholder services, and operations); controls and risk management groups (e.g., legal, compliance, valuation oversight, credit risk management, internal audit, compliance testing, market risk analysis, finance, and central funding); sales and distribution support groups, and others (e.g., information technology and training); |
| (iii) | trends in employee headcount; |
| (iv) | the Investment Adviser’s financial resources and ability to hire and retain talented personnel and strengthen its operations; and |
| (v) | the parent company’s support of the Investment Adviser and its mutual fund business, as expressed by the firm’s senior management; |
| (b) | information on the investment performance of the Fund, including comparisons to the performance of similar mutual funds, as provided by a third-party mutual fund data provider engaged as part of the contract review process (the “Outside Data Provider”), and a benchmark performance index, a composite of accounts with similar investment strategies managed by the Investment Adviser, and general investment outlooks in the markets in which the Fund invests; |
| (c) | information provided by the Investment Adviser indicating the Investment Adviser’s views on whether the Fund’s peer group and/or benchmark index had high, medium, or low relevance given the Fund’s particular investment strategy; |
| (d) | the terms of the Management Agreement and other agreements with affiliated service providers entered into by the Trust on behalf of the Fund; |
| (e) | fee and expense information for the Fund, including: |
| (i) | the relative management fee and expense level of the Fund as compared to those of comparable funds managed by other advisers, as provided by the Outside Data Provider; |
| (ii) | the Fund’s expense trends over time; and |
| (iii) | to the extent the Investment Adviser manages other types of accounts (such as bank collective trusts, private wealth management accounts, institutional separate accounts, sub-advised mutual funds, and non-U.S. funds) having investment objectives and policies similar to those of the Fund, comparative information on the advisory fees charged and services provided to those accounts by the Investment Adviser; |
| (f) | with respect to the extensive investment performance and expense comparison data provided by the Outside Data Provider, its processes in producing that data for the Fund; |
| (g) | the undertaking of the Investment Adviser to waive certain fees and to limit certain expenses of the Fund that exceed a specified level; |
| (h) | information relating to the profitability of the Management Agreement and the transfer agency and distribution and service arrangements of the Fund and the Trust as a whole to the Investment Adviser and its affiliates; |
| (i) | whether the Fund’s existing management fee schedule adequately addressed any economies of scale; |
26
GOLDMAN SACHS VARIABLE INSURANCE TRUST SMALL CAP EQUITY INSIGHTS FUND
Statement Regarding Basis for Approval of Management Agreement (Unaudited) (continued)
| (j) | a summary of the “fall-out” benefits derived by the Investment Adviser and its affiliates from their relationships with the Fund, including the fees received by the Investment Adviser’s affiliates from the Fund for transfer agency, securities lending, portfolio trading, distribution and other services; |
| (k) | a summary of potential benefits derived by the Fund as a result of its relationship with the Investment Adviser; |
| (l) | information regarding commissions paid by the Fund and broker oversight, other information regarding portfolio trading, and how the Investment Adviser carries out its duty to seek best execution; |
| (m) | the manner in which portfolio manager compensation is determined; and the number and types of accounts managed by the portfolio managers; |
| (n) | the nature and quality of the services provided to the Fund by its unaffiliated service providers, and the Investment Adviser’s general oversight and evaluation (including reports on due diligence) of those service providers as part of the administration services provided under the Management Agreement; and |
| (o) | the Investment Adviser’s processes and policies addressing various types of potential conflicts of interest; its approach to risk management; the annual review of the effectiveness of the Fund’s compliance program; and periodic compliance reports. |
The Trustees also received an overview of the Fund’s distribution arrangements. They received information regarding the Fund’s assets, share purchase and redemption activity, and payment of distribution and service fees. Information was also provided to the Trustees relating to revenue sharing payments made by and services provided by the Investment Adviser and its affiliates to intermediaries that promote the sale, distribution, and/or servicing of Fund shares. The Independent Trustees also discussed the broad range of other investment choices that are available to Fund investors, including the availability of comparable funds managed by other advisers.
The presentations made at the Board and Committee meetings and at the Annual Meeting encompassed the Fund and other mutual funds for which the Board of Trustees has responsibility. In evaluating the Management Agreement at the Annual Meeting, the Trustees relied upon their knowledge, resulting from their meetings and other interactions throughout the year, of the Investment Adviser and its affiliates, their services, and the Fund. In conjunction with these meetings, the Trustees received written materials and oral presentations on the topics covered, and the Investment Adviser addressed the questions and concerns of the Trustees, including concerns regarding the investment performance of certain of the funds they oversee. The Independent Trustees were advised by their independent legal counsel regarding their responsibilities and other regulatory requirements related to the approval and continuation of mutual fund investment management agreements under applicable law. In addition, the Investment Adviser and its affiliates provided the Independent Trustees with a written response to a formal request for information sent on behalf of the Independent Trustees by their independent legal counsel. During the course of their deliberations, the Independent Trustees met in executive sessions with their independent legal counsel, without representatives of the Investment Adviser or its affiliates present.
Nature, Extent, and Quality of the Services Provided Under the Management Agreement
As part of their review, the Trustees considered the nature, extent, and quality of the services provided to the Fund by the Investment Adviser. In this regard, the Trustees considered both the investment advisory services and non-advisory services that are provided by the Investment Adviser and its affiliates. The Trustees noted the transition in the leadership and changes in personnel of various of the Investment Adviser’s portfolio management teams that had occurred in recent periods, and the ongoing recruitment efforts aimed at bringing high quality investment talent to the Investment Adviser. They also noted the Investment Adviser’s commitment to maintaining high quality systems and expending substantial resources to respond to ongoing changes to the regulatory and control environment in which the Fund and its service providers operate, as well as the efforts of the Investment Adviser and its affiliates to combat cyber security risks. The Trustees concluded that the Investment Adviser continued to commit substantial financial and operational resources to the Fund and expressed confidence that the Investment Adviser would continue to do so in the future. The Trustees also recognized that the Investment Adviser had made significant commitments to address regulatory compliance requirements applicable to the Fund and the Investment Adviser and its affiliates.
Investment Performance
The Trustees also considered the investment performance of the Fund. In this regard, they compared the investment performance of the Fund to its peers using rankings and ratings compiled by the Outside Data Provider as of December 31, 2015, and updated performance information prepared by the Investment Adviser using the peer group identified by the Outside Data Provider as of March 31, 2016. The information on the Fund’s investment performance was provided for the one-, three-, five-, and ten-year periods ending on the applicable dates. The Trustees also reviewed the Fund’s investment performance relative to its performance benchmark. As part of this review, they considered the investment performance trends of the Fund over time, and reviewed the investment performance of the Fund in light of its investment objective and policies and market conditions. The Trustees also received information comparing the Fund’s performance to that of a composite of accounts with comparable investment strategies managed by the Investment Adviser.
27
GOLDMAN SACHS VARIABLE INSURANCE TRUST SMALL CAP EQUITY INSIGHTS FUND
Statement Regarding Basis for Approval of Management Agreement (Unaudited) (continued)
In addition, the Trustees considered materials prepared and presentations made by the Investment Adviser’s senior management and portfolio management personnel in which Fund performance was assessed. The Trustees also considered the Investment Adviser’s periodic reports with respect to the Fund’s risk profile, and how the Investment Adviser’s approach to risk monitoring and management influences portfolio management. They noted the efforts of the Fund’s portfolio management team to continue to enhance the investment model used in managing the Fund.
The Trustees observed that the Fund’s Institutional Shares had placed in the second quartile of the Fund’s peer group for the one-, three-, and five-year periods and in the fourth quartile for the ten-year period, and had outperformed the Fund’s benchmark index for the one-, three-, and five-year periods and underperformed for the ten-year period ended March 31, 2016.
Costs of Services Provided and Competitive Information
The Trustees considered the contractual terms of the Management Agreement and the fee rates payable by the Fund thereunder. In this regard, the Trustees considered information on the services rendered by the Investment Adviser to the Fund, which included both advisory and administrative services that were directed to the needs and operations of the Fund as a registered mutual fund.
In particular, the Trustees reviewed analyses prepared by the Outside Data Provider regarding the expense rankings of the Fund. The analyses provided a comparison of the Fund’s management fee and breakpoints to those of a relevant peer group and category universe; an expense analysis which compared the Fund’s overall net and gross expenses to a peer group and a category universe; and a five-year history comparing the Fund’s net expenses to the peer and category medians. The analyses also compared the Fund’s transfer agency, custody, and distribution fees, other expenses and fee waivers/reimbursements to those of the peer group and category medians. The Trustees concluded that the comparisons provided by the Outside Data Provider were useful in evaluating the reasonableness of the management fees and total expenses paid by the Fund.
In addition, the Trustees considered the Investment Adviser’s undertaking to waive a portion of its management fee and to limit certain expenses of the Fund that exceed a specified level. They also considered, to the extent that the Investment Adviser manages other types of accounts having investment objectives and policies similar to those of the Fund, comparative fee information for services provided by the Investment Adviser to those accounts, and information that indicated that services provided to the Fund differed in various significant respects from the services provided to other types of accounts which, in many cases, operated under less stringent legal and regulatory structures, required fewer services from the Investment Adviser to a smaller number of client contact points, and were less time-intensive.
In addition, the Trustees noted that shareholders are able to redeem their Fund shares at any time if shareholders believe that the Fund fees and expenses are too high or if they are dissatisfied with the performance of the Fund.
Profitability
The Trustees reviewed the Investment Adviser’s revenues and pre-tax profit margins with respect to the Trust and the Fund. In this regard the Trustees noted that they had received, among other things, profitability analyses and summaries, revenue and expense schedules by Fund and by function (i.e., investment management, transfer agency and distribution and service), and information on the Investment Adviser’s expense allocation methodology. They observed that the profitability and expense figures are substantially similar to those used by the Investment Adviser for many internal purposes, including compensation decisions among various business groups, and are thus subject to a vigorous internal debate about how certain revenue and expenses should be allocated. The Trustees also noted that the internal audit group within the Goldman Sachs organization had audited the expense allocation methodology and was satisfied with the reasonableness, consistency, and accuracy of the Investment Adviser’s expense allocation methodology and profitability analysis calculations. Profitability data for the Trust and the Fund were provided for 2015 and 2014, and the Trustees considered this information in relation to the Investment Adviser’s overall profitability. The Trustees considered the Investment Adviser’s revenues and pre-tax profit margins both in absolute terms and in comparison to information on the reported pre-tax profit margins earned by certain other asset management firms.
Economies of Scale
The Trustees considered the information that had been provided regarding the Investment Adviser’s profitability. The Trustees also considered the breakpoints in the fee rate payable under the Management Agreement for the Fund at the following annual percentage rates of the average daily net assets of the Fund:
| First $2 billion | 0.75 | % | ||
| Next $3 billion | 0.68 | |||
| Next $3 billion | 0.65 | |||
| Over $8 billion | 0.64 |
28
GOLDMAN SACHS VARIABLE INSURANCE TRUST SMALL CAP EQUITY INSIGHTS FUND
Statement Regarding Basis for Approval of Management Agreement (Unaudited) (continued)
The Trustees noted that the breakpoints were designed to share potential economies of scale, if any, with the Fund and its shareholders as assets under management reach those asset levels. The Trustees considered the amounts of assets in the Fund; the Fund’s recent share purchase and redemption activity; the information provided by the Investment Adviser relating to the costs of the services provided by the Investment Adviser and its affiliates and their realized profits; information comparing fee rates charged by the Investment Adviser with fee rates charged to other funds in the peer group; and the Investment Adviser’s undertaking to waive a portion of its management fee and to limit certain expenses of the Fund that exceed a specified level. Upon reviewing these matters at the Annual Meeting, the Trustees concluded that the fee breakpoints represented a means of assuring that benefits of scalability, if any, would be passed along to shareholders at the specified asset levels.
Other Benefits to the Investment Adviser and Its Affiliates
The Trustees also considered the other benefits derived by the Investment Adviser and its affiliates from their relationships with the Fund as stated above, including: (a) transfer agency fees received by Goldman, Sachs & Co. (“Goldman Sachs”); (b) brokerage and futures commissions earned by Goldman Sachs for executing securities and futures transactions on behalf of the Fund; (c) trading efficiencies resulting from aggregation of orders of the Fund with those for other funds or accounts managed by the Investment Adviser; (d) fees earned by Goldman Sachs Agency Lending (“GSAL”), an affiliate of the Investment Adviser, as securities lending agent (and fees earned by the Investment Adviser for managing the fund in which the Fund’s cash collateral is invested); (e) the Investment Adviser’s ability to leverage the infrastructure designed to service the Fund on behalf of its other clients; (f) the Investment Adviser’s ability to cross-market other products and services to Fund shareholders; (g) Goldman Sachs’ retention of certain fees as Fund Distributor; (h) the Investment Adviser’s ability to negotiate better pricing with custodians on behalf of its other clients, as a result of the relationship with the Fund; and (i) the possibility that the working relationship between the Investment Adviser and the Fund’s third-party service providers may cause those service providers to be more likely to do business with other areas of Goldman Sachs. In the course of considering the foregoing, the Independent Trustees requested and received further information quantifying certain of these fall-out benefits.
Other Benefits to the Fund and Its Shareholders
The Trustees also noted that the Fund receives certain potential benefits as a result of its relationship with the Investment Adviser, including: (a) trading efficiencies resulting from aggregation of orders of the Fund with those of other funds or accounts managed by the Investment Adviser; (b) enhanced servicing from vendors because of the volume of business generated by the Investment Adviser and its affiliates; (c) enhanced servicing from broker-dealers because of the volume of business generated by the Investment Adviser and its affiliates; (d) the Investment Adviser’s ability to negotiate favorable terms with derivatives counterparties on behalf of the Fund as a result of the size and reputation of the Goldman Sachs organization; (e) the Investment Adviser’s knowledge and experience gained from managing other accounts and products; (f) the Investment Adviser’s ability to hire and retain qualified personnel to provide services to the Fund because of the reputation of the Goldman Sachs organization; (g) the Fund’s access, through the Investment Adviser, to certain firmwide resources (e.g., proprietary risk management systems and databases), subject to certain restrictions; (h) the Fund’s ability to participate in the securities lending program administered by GSAL, as measured by the revenue received by the Fund in connection with the program; and (i) the Fund’s access to certain affiliated distribution channels. In addition, the Trustees noted the competitive nature of the mutual fund marketplace, and considered that many of the Fund’s shareholders invested in the Fund in part because of the Fund’s relationship with the Investment Adviser and that those shareholders have a general expectation that the relationship will continue.
Conclusion
In connection with their consideration of the Management Agreement, the Trustees gave weight to each of the factors described above, but did not identify any particular factor as controlling their decision. After deliberation and consideration of all of the information provided, including the factors described above, the Trustees concluded, in the exercise of their business judgment, that the management fees paid by the Fund were reasonable in light of the services provided to it by the Investment Adviser, the Investment Adviser’s costs and the Fund’s current and reasonably foreseeable asset levels. The Trustees unanimously concluded that the Investment Adviser’s continued management likely would benefit the Fund and its shareholders and that the Management Agreement should be approved and continued with respect to the Fund until June 30, 2017.
29
| TRUSTEES | OFFICERS | |
| Ashok N. Bakhru, Chairman | James A. McNamara, President | |
| Kathryn A. Cassidy | Scott M. McHugh, Principal Financial Officer, | |
| Diana M. Daniels | Senior Vice President and Treasurer | |
| Herbert J. Markley | Caroline L. Kraus, Secretary | |
| James A. McNamara | ||
| Jessica Palmer | ||
| Alan A. Shuch | ||
| Roy W. Templin | ||
| Gregory G. Weaver |
GOLDMAN, SACHS & CO.
Distributor and Transfer Agent
GOLDMAN SACHS ASSET MANAGEMENT, L.P.
Investment Adviser
200 West Street, New York
New York 10282
Visit our web site at www.GSAMFUNDS.com to obtain the most recent month-end returns.
The reports concerning the Fund included in this shareholder report may contain certain forward-looking statements about the factors that may affect the performance of the Fund in the future. These statements are based on Fund management’s predictions and expectations concerning certain future events and their expected impact on the Fund, such as performance of the economy as a whole and of specific industry sectors, changes in the levels of interest rates, the impact of developing world events, and other factors that may influence the future performance of the Fund. Management believes these forward-looking statements to be reasonable, although they are inherently uncertain and difficult to predict. Actual events may cause adjustments in portfolio management strategies from those currently expected to be employed.
A description of the policies and procedures that the Fund uses to determine how to vote proxies relating to portfolio securities and information regarding how the Fund voted proxies relating to portfolio securities for the 12-month period ended June 30 is available (i) without charge, upon request by calling 1-800-621-2550; and (ii) on the Securities and Exchange Commission (“SEC”) web site at http://www.sec.gov.
The Fund files its complete schedule of portfolio holdings with the SEC for the first and third quarters of each fiscal year on Form N-Q. The Fund’s Form N-Qs are available on the SEC’s web site at http://www.sec.gov within 60 days after the Fund’s first and third fiscal quarters. The Fund’s Form N-Qs may be reviewed and copied at the SEC’s Public Reference Room in Washington, D.C. and information on the operation of the Public Reference Room may also be obtained by calling 1-800-SEC-0330. Form N-Qs may be obtained upon request and without charge by calling 1-800-621-2550.
The website links provided are for your convenience only and are not an endorsement or recommendation by GSAM of any of these websites or the products or services offered. GSAM is not responsible for the accuracy and validity of the content of these websites.
Fund holdings and allocations shown are as of June 30, 2016 and may not be representative of future investments. Fund holdings should not be relied on in making investment decisions and should not be construed as research or investment advice regarding particular securities. Current and future holdings are subject to risk.
References to indices, benchmarks or other measures of relative market performance over a specified period of time are provided for your information only and do not imply that the portfolio will achieve similar results. The index composition may not reflect the manner in which a portfolio is constructed. While an adviser seeks to design a portfolio which reflects appropriate risk and return features, portfolio characteristics may deviate from those of the benchmark.
The Global Industry Classification Standard (“GICS”) was developed by and is the exclusive property and a service mark of Morgan Stanley Capital International Inc. (“MSCI”) and Standard & Poor’s, a division of The McGraw-Hill Companies, Inc. (“S&P”) and is licensed for use by Goldman Sachs. Neither MSCI, S&P nor any other party involved in making or compiling the GICS or any GICS classifications makes any express or implied warranties or representations with respect to such standard or classification (or the results to be obtained by the use thereof), and all such parties hereby expressly disclaim all warranties of originality, accuracy, completeness, merchantability or fitness for a particular purpose with respect to any of such standard or classification. Without limiting any of the foregoing, in no event shall MSCI, S&P, any of their affiliates or any third party involved in making or compiling the GICS or any GICS classifications have any liability for any direct, indirect, special, punitive, consequential or any other damages (including lost profits) even if notified of the possibility of such damages.
The portfolio risk management process includes an effort to monitor and manage risk, but does not imply low risk.
Shares of the Goldman Sachs VIT Funds are offered to separate accounts of participating life insurance companies for the purpose of funding variable annuity contracts and variable life insurance policies. Shares of the Fund are not offered directly to the general public. The variable annuity contracts and variable life insurance policies are described in the separate prospectuses issued by participating insurance companies. You should refer to those prospectuses for information about surrender charges, mortality and expense risk fees and other charges that may be assessed by participating insurance companies under the variable annuity contracts or variable life insurance policies. Such fees or charges, if any, may affect the return you may realize with respect to your investments. Ask your representative for more complete information. Please consider a fund’s objectives, risks and charges and expenses, and read the prospectus carefully before investing. The prospectus contains this and other information about the Fund.
This material is not authorized for distribution to prospective investors unless preceded or accompanied by a current Prospectus or summary prospectus, if applicable. Investors should consider a Fund’s objective, risks, and charges and expenses, and read the summary prospectus, if available, and/or the Prospectus carefully before investing or sending money. The summary prospectus, if available, and the Prospectus contain this and other information about a Fund and may be obtained from your Authorized Institution or from Goldman, Sachs & Co. by calling 1-800-621-2550.
This report is prepared for the general information of contract owners and is not an offer of shares of the Goldman Sachs Variable Insurance Trust: Goldman Sachs Small Cap Equity Insights Fund.
Goldman, Sachs & Co. is the distributor of the Goldman Sachs Funds and the Goldman Sachs Variable Insurance Trust Funds.
© 2016 Goldman Sachs. All rights reserved.
VITSCSAR-16/58891-TMPL-08/2016/9.2K
Goldman
Sachs Variable Insurance Trust
Goldman Sachs
Strategic Growth Fund
Semi-Annual Report
June 30, 2016

GOLDMAN SACHS VARIABLE INSURANCE TRUST STRATEGIC GROWTH FUND
INVESTMENT OBJECTIVE
The Fund seeks long-term growth of capital.
Portfolio Management Discussion and Analysis
Below, the Goldman Sachs Growth Portfolio Management Team discusses the Goldman Sachs Variable Insurance Trust — Goldman Sachs Strategic Growth Fund’s (the “Fund��) performance and positioning for the six-month period ended June 30, 2016 (the “Reporting Period”).
How did the Fund perform during the Reporting Period?
During the Reporting Period, the Fund’s Institutional and Service Shares generated cumulative total returns of -1.09% and -1.22%, respectively. These returns compare to the 1.36% cumulative total return of the Fund’s benchmark, the Russell 1000® Growth Index (with dividends reinvested) (the “Russell Index”), during the same time period.
What economic and market factors most influenced the equity markets as a whole during the Reporting Period?
Representing the U.S. equity market, the S&P 500® Index gained 3.84% during the Reporting Period.
As the Reporting Period began in January 2016, U.S. equities were embroiled in a global rout, triggered by investor concerns about an intensifying economic slowdown in China and exacerbated by an oil price plunge. Following a December 2015 interest rate hike, the January 2016 Federal Reserve (“Fed”) statement acknowledged these external risks and tightening financial conditions. U.S. equities stabilized in February 2016, as market sentiment improved on the more dovish tone set by global central banks. (Dovish language tends to suggest lower interest rates.) U.S. equities were also supported by stronger economic data, rallying as fourth quarter U.S. Gross Domestic Product (“GDP”) came in above consensus expectations. In March 2016, the Fed kept interest rates on hold and surprised on the dovish side, reducing its forecast to two interest rate hikes in 2016, down from four. Along with receding global economic concerns, we believe this helped to drive a recovery in U.S. equities. Released in March 2016, February 2016 unemployment data came in ahead of market consensus, with unemployment steady at 4.9% in spite of higher participation rates and declining underemployment.
Following the rebound in March 2016, market sentiment appeared to remain sanguine in April 2016, as oil prices rose and China economic growth concerns abated. U.S. equities fell near the end of the month as investors were disappointed by a lack of additional stimulus from the Bank of Japan and by a weaker than consensus expected first quarter U.S. GDP rate of 0.5%. Hawkish Fed minutes released in May 2016 temporarily revived market expectations for a Fed interest rate hike in June 2016, but weaker than expected May 2016 payroll data subsequently drove such expectations lower. (Hawkish language tends to suggest higher interest rates; opposite of dovish.) The Fed ultimately held interest rates steady in June 2016 and signaled a slower pace of hikes, acknowledging the slowdown in the labor market. Markets were otherwise dominated in June 2016 by the U.K. referendum on membership in the European Union, popularly known as Brexit. U.S. equities sold off in the global risk-off, or heightened risk averse sentiment in June 2016 following the surprise “leave” result. Markets rebounded in the latter days of the month owing to improving risk sentiment as markets digested the Brexit vote outcome and on dovish remarks from Bank of England Governor Carney.
For the Reporting Period overall, telecommunication services and utilities were the best performing sectors in the S&P 500 Index by a wide margin. Energy and consumer staples also posted double-digit gains. The energy sector was the largest positive contributor to S&P 500 Index returns, as measured by weight times performance. The weakest performing sectors in the S&P 500 Index during the Reporting Period were financials and information technology, the only two to post negative absolute returns, followed by consumer discretionary and health care, which were also weak but generated modestly positive returns during the Reporting Period.
Within the U.S. equity market, there was significant disparity in performance not only among sectors but also among the various capitalization and style segments. While all capitalization segments posted positive returns, mid-cap stocks, as measured by the Russell Midcap® Index, performed best, followed by large-cap stocks, as measured by the Russell 1000® Index, and then, small-cap stocks, as measured by the Russell 2000® Index. From a style perspective, value-oriented stocks significantly outpaced growth-oriented stocks across the capitalization spectrum. Value outperformed relative to growth during the Reporting Period primarily due to weaker performance of the growth-oriented health care sector. (All as measured by the Russell Investments indices.)
1
GOLDMAN SACHS VARIABLE INSURANCE TRUST STRATEGIC GROWTH FUND
What key factors were responsible for the Fund’s performance during the Reporting Period?
The Fund’s underperformance relative to the Russell Index during the Reporting Period can be attributed primarily to stock selection overall. Sector allocation had a rather neutral effect on relative results.
Which equity market sectors most significantly affected Fund performance?
Detracting most from the Fund’s relative results during the Reporting Period was stock selection in the health care, information technology and consumer staples sectors. Partially offsetting such detractors was effective stock selection in the financials, energy and industrials sectors.
Which stocks detracted significantly from the Fund’s performance during the Reporting Period?
Detracting from the Fund’s results relative to its benchmark index were positions in online professional network provider LinkedIn, specialty retailer L Brands and global pharmaceutical company Allergan.
LinkedIn reported solid fourth quarter 2015 results, but its outlook was well below market expectations and because the company is a high multiple growth stock in a challenging market environment, its stock declined sharply. At the end of the Reporting Period, we believed there was room for progress in better monetizing LinkedIn’s business model. However, following the disappointing outlook, we had less confidence in its management’s ability to execute and in the company’s overall long-term growth profile, and thus we exited the Fund’s position in LinkedIn.
L Brands released positive first quarter 2016 earnings, but its margins declined beyond market expectations due primarily to a challenging retail environment. Additionally, Victoria’s Secret, one of L Brands’ flagship brands, is expected to eliminate non-core businesses, such as swimwear and certain accessory goods, given deteriorating sales. There were also international challenges based on investment costs in China. Though we continue to like the company and its franchise, we decided to sell the Fund’s position in L Brands during the Reporting Period, as we believe the risk/reward opportunities became less attractive.
Following the announcement of new tax inversion regulations set forth by the U.S. Treasury, Allergan’s proposed merger with Pfizer was abandoned. Allergan’s stock declined and continued to face headwinds surrounding the divestiture of its generic pharmaceutical business to Teva Pharmaceuticals. For example, there was market skepticism surrounding the delay of its generic pharmaceutical sale, which was expected to close during the first quarter of 2016 but was not yet complete as of the end of the Reporting Period. All that said, we continued to believe at the end of the Reporting Period that Allergan is a high quality growth business, trading at an attractive valuation with meaningful financial flexibility going forward. We added to the Fund’s position in Allergan during the Reporting Period.
What were some of the Fund’s best-performing individual stocks?
The Fund benefited relative to the Russell Index from positions in data center real estate investment trust (“REIT”) Equinix, wireless and broadband communication infrastructure operator REIT American Tower and global apparel company PVH.
During the Reporting Period, Equinix reported first quarter results that positively exceeded market expectations for its organic revenue growth and earnings growth. The company also benefited from a decline in U.S. Treasury yields, which generally favors REITs given their attractive yield and growth potential relative to bonds. At the end of the Reporting Period, we believed Equinix had substantial pipeline opportunities, particularly with enterprise customers willing to pay a higher price. Continued integration with the company’s Telecity acquisition and a strategic partnership with Datang Telecom could further increase Equinix’s global presence and strengthen its competitive advantage. In our view, Equinix remains an asset with robust upside to its revenues and free cash flows, as it balances organic growth, low leverage and a sound capital structure.
American Tower reported positive first quarter 2016 results with revenues in line with and earnings ahead of market expectations. The company also demonstrated strong international organic growth across regions and raised guidance for its adjusted funds from operations (“AFFO”), a key metric of financial performance for REITs. This raised guidance for its AFFO was driven by higher cost efficiencies and foreign exchange tailwinds. A decline in U.S. Treasury yields additionally benefited the REIT. At the end of the Reporting Period, our view was that American Tower should continue to benefit from secular trends toward growing data usage, taking advantage of its dominant market share, global expansion and additional investment opportunities to fuel long-term growth. With recurring revenue streams and strong organic leasing growth at what we consider to be an attractive valuation relative to its peers, we believe American Tower is a high quality and durable growth company.
After a tough environment in 2015, PVH reported during the first quarter of 2016 positive fourth quarter 2015 results with earnings ahead of market estimates, and its stock rebounded. PVH further benefited during the Reporting Period from an overall positive
2
GOLDMAN SACHS VARIABLE INSURANCE TRUST STRATEGIC GROWTH FUND
sentiment in its industry. At the end of the Reporting Period, we believed PVH is a leading franchise with dominant market share, strong pricing power and solid fundamentals. Particularly, established brand names Tommy Hilfiger and Calvin Klein have demonstrated international strength and have been a key source of growth. In our view, PVH remained well positioned for growth given what we view as its high quality of management and significant free cash flow generation ability.
Given each of these holdings’ strong performance during the Reporting Period, we opted to trim the Fund’s position in each to invest in other ideas with what we believed to have better risk/reward opportunities.
How did the Fund use derivatives and similar instruments during the Reporting Period?
During the Reporting Period, we did not use derivatives as part of an active management strategy.
Did the Fund make any significant purchases or sales during the Reporting Period?
Among the purchases initiated during the Reporting Period, we established a Fund position in 3M Company, a diversified technology company that specializes in industrials, health care, electronics and energy. In late April 2016, 3M Company reported first quarter 2016 earnings that exceeded market expectations, and its management reaffirmed guidance of stronger growth in organic sales and margin expansion. Further, we believe 3M Company is a high quality business that has recurring revenue, scalable manufacturing operations and differentiated products. Given that the company had what we viewed as an attractive valuation relative to a long-term growth horizon, we initiated a Fund position.
We established a Fund position in Eli Lilly, a leading pharmaceutical company with a history of innovation and a strong drug pipeline. In our view, the company is aiming to improve its financial profile through a combination of cost savings and revenue growth by reducing its research and development and marketing costs over time. Shares of the company had been weak in early 2016, and we took the opportunity to initiate a Fund position in what believe is a high quality company with a leading franchise, strong growth prospects and a healthy and improving financial profile.
In addition to those sales already mentioned, we sold the Fund’s position in Biogen, a biotechnology company. Like most companies within the health care sector, Biogen faced headwinds during the Reporting Period from increased U.S. regulation. More specifically to the company, Biogen appeared to feel increasing pressure after announcing a divestiture of its hemophilia business. Also, at the beginning of June 2016, Biogen’s stock price faced challenges after Opicinumab, a drug for multiple sclerosis, missed an essential endpoint of its Phase II clinical trial. We exited the Fund’s position in Biogen to invest in what we consider to be better risk/reward and more diversified ideas.
Were there any notable changes in the Fund’s weightings during the Reporting Period?
In constructing the Fund’s portfolio, we focus on picking stocks rather than on making industry or sector bets. We seek to outpace the benchmark index by overweighting stocks that we expect to outperform and underweighting those that we think may lag. Consequently, changes in its sector weights are generally the direct result of individual stock selection or of stock appreciation or depreciation. That said, during the Reporting Period, the Fund’s exposure to industrials increased compared to the Russell Index. The Fund’s allocation to cash also increased during the Reporting Period. The Fund’s allocations compared to the benchmark index in consumer discretionary, financials and health care decreased.
How was the Fund positioned relative to its benchmark index at the end of the Reporting Period?
At the end of June 2016, the Fund had overweighted positions relative to the Russell Index in the financials sector. the same date, the Fund had underweighted positions compared to the Russell Index in health care and materials and was rather neutrally weighted to the Russell Index in consumer discretionary, consumer staples, energy, industrials and information technology. The Fund had no exposure to the utilities and telecommunication services sectors at the end of the Reporting Period.
What is the Fund’s tactical view and strategy for the months ahead?
At the end of the Reporting Period, persistently low economic growth, interest rates and visibility reinforced our expectation for lower than average returns across asset classes for the remainder of 2016. In our view, equities remain relatively attractive in this environment. We believe equities can still generate positive returns for calendar year 2016, driven by earnings growth.
We believe the potential drivers of upside for regional equity markets, especially outside of the U.S., remain unchanged. However, increased political risk and macroeconomic uncertainty make the near-term risks and rewards more balanced across regions, in our opinion.
3
GOLDMAN SACHS VARIABLE INSURANCE TRUST STRATEGIC GROWTH FUND
In our view, economic and corporate fundamentals are still strongest in the U.S., which we believe should buoy near-term U.S. equity performance. However, valuations increasingly reflect this scenario, which makes stock selection all the more important. We continue to seek what we believe are good investment opportunities with a focus on companies exposed to long-term secular growth trends and/or that are trading at discounts to their intrinsic value.
Across major developed markets, we believe domestically-focused companies could benefit from increasing domestic consumption while being more insulated from currency volatility. In the U.S., we expect the strong U.S. dollar to continue to be a headwind for many globally-exposed companies but believe the consumer remains healthy.
Regardless of market direction, we remain committed to our core philosophy and process. We intend to maintain a long-term time horizon, rather than forecast only the next quarter. We intend to continue to favor high quality growth businesses over breathtaking concepts. We intend to invest when we consider valuations to be attractive, rather than following the trend. These core beliefs have guided our team during the past 30 years; we believe they hold the answer for the next 30.
As always, we maintain our focus on seeking companies that we believe will generate long-term growth in today’s ever-changing market conditions.
4
GOLDMAN SACHS VARIABLE INSURANCE TRUST STRATEGIC GROWTH FUND
Index Definitions
The Russell 1000® Growth Index (with dividends reinvested) is an unmanaged market capitalization weighted index of the 1000 largest U.S. companies with higher price-to-book ratios and higher forecasted growth values. The figures for the Index do not include any deduction for fees, expenses or taxes. It is not possible to invest directly in an index.
The Russell 2000® Index (with dividends reinvested) is an unmanaged index of common stock prices that measures the performance of the 2000 smallest companies in the Russell 3000® Index. The figures for the Index do not include any deduction for fees, expenses or taxes. It is not possible to invest directly in an index.
The S&P 500® Index (with dividends reinvested) is the Standard & Poor’s 500 Composite Index of 500 stocks, an unmanaged index of common stock prices. The figures for the Index do not include any deduction for fees, expenses or taxes. It is not possible to invest directly in an index.
The Russell Midcap® Index measures the performance of the 800 smallest companies in the Russell 1000® Index, which represent approximately 25% of the total market capitalization of the Russell 1000 Index. It is not possible to invest directly in an index.
The Russell 1000® Index measures the performance of the 1,000 largest companies in the Russell 3000® Index, which represents approximately 92% of the total market capitalization of the Russell 3000 Index. It is not possible to invest directly in an index.
5
FUND BASICS
Strategic Growth Fund
as of June 30, 2016
STANDARDIZED TOTAL RETURNS1
For the period ended 6/30/16 | One Year | Five Years | Ten Years | Since Inception | Inception Date | |||||||||||||
Institutional | -0.32 | % | 11.63 | % | 7.48 | % | 5.03 | % | 4/30/98 | |||||||||
Service | -0.58 | 11.36 | 7.24 | 6.51 | 1/09/06 | |||||||||||||
| 1 | The Standardized Total Returns are average annual total returns as of the most recent calendar quarter-end. They assume reinvestment of all distributions at net asset value (“NAV”). Because Institutional Shares and Service Shares do not involve a sales charge, such a charge is not applied to their Standardized Total Returns. |
Total return figures in the above chart represent past performance and do not indicate future results, which will vary. The investment return and principal value of an investment will fluctuate and, therefore, an investor’s shares, when redeemed, may be worth more or less than their original cost. Current performance may be lower or higher than the total return figures in the above chart. Please visit www.GSAMFUNDS.com to obtain the most recent month-end returns. Performance reflects fee waivers and/or expense limitations in effect during the periods shown. In their absence, performance would be reduced.
EXPENSE RATIOS2
| Net Expense Ratio (Current) | Gross Expense Ratio (Before Waivers) | |||||||
| Institutional | 0.79 | % | 0.83 | % | ||||
| Service | 1.04 | 1.08 | ||||||
| 2 | The expense ratios of the Fund, both current (net of any fee waivers or expense limitations) and before waivers (gross of any fee waivers or expense limitations) are as set forth above according to the most recent publicly available Prospectuses for the Fund and may differ from the expense ratios disclosed in the Financial Highlights in this report. Pursuant to a contractual arrangement, the Fund’s waivers and/or expense limitations will remain in place through at least April 29, 2017 and prior to such date the Investment Adviser may not terminate the arrangements without the approval of the Fund’s Board of Trustees. If these arrangements are discontinued in the future, the expense ratios may change without shareholder approval. |
TOP TEN HOLDINGS AS OF 6/30/163
| Holding | % of Net Assets | Line of Business | ||||
Apple, Inc. | 6.3% | Technology Hardware & Equipment | ||||
Amazon.com, Inc. | 3.7 | Retailing | ||||
Facebook, Inc. Class A | 3.6 | Software & Services | ||||
Microsoft Corp. | 3.1 | Software & Services | ||||
Alphabet, Inc. Class A | 2.9 | Software & Services | ||||
American Tower Corp. | 2.7 | Real Estate Investment Trusts | ||||
Costco Wholesale Corp. | 2.7 | Food & Staples Retailing | ||||
Comcast Corp. Class A | 2.6 | Media | ||||
McDonald’s Corp. | 2.4 | Consumer Services | ||||
3M Co. | 2.4 | Capital Goods | ||||
| 3 | The top 10 holdings may not be representative of the Fund’s future investments. |
6
FUND BASICS
FUND vs. BENCHMARK SECTOR ALLOCATIONS4
As of June 30, 2016
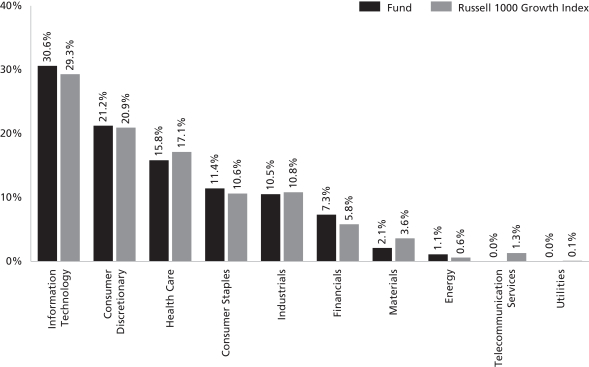
| 4 | The Fund is actively managed and, as such, its composition may differ over time. Consequently, the Fund’s overall sector allocations may differ from percentages contained in the graph above. The graph categorizes investments using Global Industry Classification Standard (“GICS”), however, the sector classifications used by the portfolio management team may differ from GICS. The percentage shown for each investment category reflects the value of investments in that category as a percentage of market value. The graph depicts the Fund’s investments but may not represent the Fund’s market exposure due to the exclusion of certain derivatives, if any, as listed in the Additional Investment Information section of the Schedule of Investments. |
7
GOLDMAN SACHS VARIABLE INSURANCE TRUST STRATEGIC GROWTH FUND
Schedule of Investments
June 30, 2016 (Unaudited)
| Shares | Description | Value | ||||||
| Common Stocks – 96.8% | ||||||||
| Banks – 0.5% |
| ||||||
| 32,564 | First Republic Bank | $ | 2,279,154 | |||||
|
| |||||||
| Capital Goods – 9.2% |
| ||||||
| 60,027 | 3M Co. | 10,511,928 | ||||||
| 54,398 | Danaher Corp. | 5,494,198 | ||||||
| 67,901 | Fortune Brands Home & Security, Inc. | 3,936,221 | ||||||
| 87,697 | Honeywell International, Inc. | 10,200,915 | ||||||
| 18,666 | Roper Technologies, Inc. | 3,183,673 | ||||||
| 17,547 | The Boeing Co. | 2,278,829 | ||||||
| 111,405 | Xylem, Inc. | 4,974,233 | ||||||
|
| |||||||
| 40,579,997 | ||||||||
|
| |||||||
| Consumer Durables & Apparel – 3.3% |
| ||||||
| 145,390 | Kate Spade & Co.* | 2,996,488 | ||||||
| 137,139 | NIKE, Inc. Class B | 7,570,073 | ||||||
| 42,107 | PVH Corp. | 3,967,742 | ||||||
|
| |||||||
| 14,534,303 | ||||||||
|
| |||||||
| Consumer Services – 4.5% |
| ||||||
| 5,173 | Chipotle Mexican Grill, Inc.* | 2,083,477 | ||||||
| 87,824 | McDonald’s Corp. | 10,568,740 | ||||||
| 124,780 | Starbucks Corp. | 7,127,434 | ||||||
|
| |||||||
| 19,779,651 | ||||||||
|
| |||||||
| Diversified Financials – 1.5% |
| ||||||
| 26,000 | Intercontinental Exchange, Inc. | 6,654,960 | ||||||
|
| |||||||
| Energy – 1.1% |
| ||||||
| 104,049 | Halliburton Co. | 4,712,379 | ||||||
|
| |||||||
| Food & Staples Retailing – 4.8% |
| ||||||
| 74,817 | Costco Wholesale Corp. | 11,749,262 | ||||||
| 72,092 | Walgreens Boots Alliance, Inc. | 6,003,101 | ||||||
| 100,895 | Whole Foods Market, Inc. | 3,230,658 | ||||||
|
| |||||||
| 20,983,021 | ||||||||
|
| |||||||
| Food, Beverage & Tobacco – 6.3% |
| ||||||
| 54,123 | McCormick & Co., Inc. | 5,773,300 | ||||||
| 29,115 | Molson Coors Brewing Co. Class B | 2,944,400 | ||||||
| 26,142 | Philip Morris International, Inc. | 2,659,164 | ||||||
| 125,579 | Reynolds American, Inc. | 6,772,476 | ||||||
| 214,184 | The Coca-Cola Co. | 9,708,961 | ||||||
|
| |||||||
| 27,858,301 | ||||||||
|
| |||||||
| Health Care Equipment & Services – 6.4% |
| ||||||
| 178,102 | Abbott Laboratories | 7,001,190 | ||||||
| 28,500 | Aetna, Inc. | 3,480,705 | ||||||
| 91,922 | Cerner Corp.* | 5,386,629 | ||||||
| 34,429 | McKesson Corp. | 6,426,173 | ||||||
| 48,660 | Stryker Corp. | 5,830,928 | ||||||
|
| |||||||
| 28,125,625 | ||||||||
|
| |||||||
| Materials – 2.0% |
| ||||||
| 26,342 | Ashland, Inc. | 3,023,271 | ||||||
| 19,649 | The Sherwin-Williams Co. | 5,770,322 | ||||||
|
| |||||||
| 8,793,593 | ||||||||
|
| |||||||
| Common Stocks – (continued) | ||||||||
| Media – 2.6% |
| ||||||
| 176,770 | Comcast Corp. Class A | $ | 11,523,636 | |||||
|
| |||||||
| Pharmaceuticals, Biotechnology & Life Sciences – 8.9% |
| ||||||
| 66,445 | Agilent Technologies, Inc. | 2,947,500 | ||||||
| 47,425 | Alexion Pharmaceuticals, Inc.* | 5,537,343 | ||||||
| 33,063 | Allergan PLC* | 7,640,529 | ||||||
| 43,220 | Celgene Corp.* | 4,262,789 | ||||||
| 97,314 | Eli Lilly & Co. | 7,663,478 | ||||||
| 41,959 | Gilead Sciences, Inc. | 3,500,220 | ||||||
| 47,419 | Vertex Pharmaceuticals, Inc.* | 4,078,982 | ||||||
| 80,077 | Zoetis, Inc. | 3,800,454 | ||||||
|
| |||||||
| 39,431,295 | ||||||||
|
| |||||||
| Real Estate Investment Trusts – 5.0% |
| ||||||
| 103,486 | American Tower Corp. | 11,757,044 | ||||||
| 26,915 | Equinix, Inc. | 10,435,753 | ||||||
|
| |||||||
| 22,192,797 | ||||||||
|
| |||||||
| Retailing – 10.1% |
| ||||||
| 22,931 | Amazon.com, Inc.* | 16,409,882 | ||||||
| 45,075 | Netflix, Inc.* | 4,123,461 | ||||||
| 125,030 | Ross Stores, Inc. | 7,087,951 | ||||||
| 64,634 | The Home Depot, Inc. | 8,253,116 | ||||||
| 4,808 | The Priceline Group, Inc.* | 6,002,355 | ||||||
| 30,084 | Tractor Supply Co. | 2,743,059 | ||||||
|
| |||||||
| 44,619,824 | ||||||||
|
| |||||||
| Semiconductors & Semiconductor Equipment – 1.0% |
| ||||||
| 54,535 | NXP Semiconductors NV* | 4,272,272 | ||||||
|
| |||||||
| Software & Services – 22.3% |
| ||||||
| 17,939 | Alphabet, Inc. Class A* | 12,620,625 | ||||||
| 13,637 | Alphabet, Inc. Class C* | 9,438,168 | ||||||
| 79,185 | Electronic Arts, Inc.* | 5,999,056 | ||||||
| 139,741 | Facebook, Inc. Class A* | 15,969,601 | ||||||
| 62,381 | Fidelity National Information Services, Inc. | 4,596,232 | ||||||
| 28,812 | FleetCor Technologies, Inc.* | 4,123,862 | ||||||
| 57,999 | Intuit, Inc. | 6,473,268 | ||||||
| 103,451 | MasterCard, Inc. Class A | 9,109,895 | ||||||
| 267,294 | Microsoft Corp. | 13,677,434 | ||||||
| 38,296 | Mobileye NV* | 1,766,977 | ||||||
| 162,489 | Oracle Corp. | 6,650,675 | ||||||
| 126,337 | Sabre Corp. | 3,384,568 | ||||||
| 59,705 | salesforce.com, Inc.* | 4,741,174 | ||||||
|
| |||||||
| 98,551,535 | ||||||||
|
| |||||||
| Technology Hardware & Equipment – 6.3% |
| ||||||
| 292,917 | Apple, Inc. | 28,002,865 | ||||||
|
| |||||||
| 8 | The accompanying notes are an integral part of these financial statements. |
GOLDMAN SACHS VARIABLE INSURANCE TRUST STRATEGIC GROWTH FUND
| Shares | Description | Value | ||||||
| Common Stocks – (continued) | ||||||||
| Transportation – 1.0% |
| ||||||
| 46,718 | Kansas City Southern | $ | 4,208,825 | |||||
|
| |||||||
| TOTAL INVESTMENTS – 96.8% | ||||||||
| (Cost $329,255,439) | $ | 427,104,033 | ||||||
|
| |||||||
| OTHER ASSETS IN EXCESS OF | 14,100,750 | ||||||
|
| |||||||
| NET ASSETS – 100.0% | $ | 441,204,783 | ||||||
|
| |||||||
| The percentage shown for each investment category reflects the value of investments in that category as a percentage of net assets. | ||
| * | Non-income producing security. | |
| The accompanying notes are an integral part of these financial statements. | 9 |
GOLDMAN SACHS VARIABLE INSURANCE TRUST STRATEGIC GROWTH FUND
Statement of Assets and Liabilities
June 30, 2016 (Unaudited)
| Assets: | ||||
Investments, at value (cost $329,255,439) | $ | 427,104,033 | ||
Cash | 323,768 | |||
Receivables: | ||||
Investments sold | 21,014,955 | |||
Dividends | 354,030 | |||
Fund shares sold | 99,405 | |||
| Total assets | 448,896,191 | |||
| Liabilities: | ||||
Payables: | ||||
Investments purchased | 7,101,131 | |||
Management fees | 256,632 | |||
Fund shares redeemed | 184,724 | |||
Distribution and Service fees and Transfer Agency fees | 76,782 | |||
Accrued expenses | 72,139 | |||
| Total liabilities | 7,691,408 | |||
| Net Assets: | ||||
Paid-in capital | 355,989,209 | |||
Undistributed net investment income | 1,843,483 | |||
Accumulated net realized loss | (14,476,503 | ) | ||
Net unrealized gain | 97,848,594 | |||
| NET ASSETS | $ | 441,204,783 | ||
Net Assets: | ||||
Institutional | $ | 101,773,766 | ||
Service | 339,431,017 | |||
Total Net Assets | $ | 441,204,783 | ||
Shares of beneficial interest outstanding $0.001 par value (unlimited shares authorized): | ||||
Institutional | 6,590,496 | |||
Service | 22,053,719 | |||
Net asset value, offering and redemption price per share: | ||||
Institutional | $15.44 | |||
Service | 15.39 | |||
| 10 | The accompanying notes are an integral part of these financial statements. |
GOLDMAN SACHS VARIABLE INSURANCE TRUST STRATEGIC GROWTH FUND
Statement of Operations
For the Six Months Ended June 30, 2016 (Unaudited)
| Investment income: | ||||
Dividends | 2,649,693 | |||
| Expenses: | ||||
Management fees | 1,537,241 | |||
Distribution and Service fees — Service Shares | 385,874 | |||
Printing and mailing costs | 44,308 | |||
Transfer Agency fees(a) | 40,990 | |||
Professional fees | 38,555 | |||
Custody, accounting and administrative services | 26,985 | |||
Trustee fees | 12,986 | |||
Other | 13,029 | |||
| Total expenses | 2,099,968 | |||
Less — expense reductions | (86,340 | ) | ||
| Net expenses | 2,013,628 | |||
| NET INVESTMENT INCOME | 636,065 | |||
| Realized and unrealized gain (loss): | ||||
Net realized loss from investments (including commissions recaptured of $2,306) | (12,308,113 | ) | ||
Net change in unrealized gain on investments | 1,308,000 | |||
| Net realized and unrealized loss | (11,000,113 | ) | ||
| NET DECREASE IN NET ASSETS RESULTING FROM OPERATIONS | $ | (10,364,048 | ) | |
(a) Institutional and Service Shares incurred Transfer Agency fees of $10,123 and $30,867, respectively.
| The accompanying notes are an integral part of these financial statements. | 11 |
GOLDMAN SACHS VARIABLE INSURANCE TRUST STRATEGIC GROWTH FUND
Statements of Changes in Net Assets
| For the Six Months Ended June 30, 2016 (Unaudited) | For the Fiscal Year Ended December 31, 2015 | |||||||
| From operations: | ||||||||
Net investment income | $ | 636,065 | $ | 1,727,870 | ||||
Net realized gain (loss) | (12,308,113 | ) | 18,938,378 | |||||
Net change in unrealized gain (loss) | 1,308,000 | (8,924,679 | ) | |||||
| Net increase (decrease) in net assets resulting from operations | (10,364,048 | ) | 11,741,569 | |||||
| Distributions to shareholders: | ||||||||
From net investment income | ||||||||
Institutional Shares | — | (396,858 | ) | |||||
Service Shares | — | (411,298 | ) | |||||
From net realized gains | ||||||||
Institutional Shares | — | (6,765,013 | ) | |||||
Service Shares | — | (23,357,665 | ) | |||||
| Total distributions to shareholders | — | (30,930,834 | ) | |||||
| From share transactions: | ||||||||
Proceeds from sales of shares | 106,698,507 | 105,471,558 | ||||||
Reinvestment of distributions | — | 30,930,834 | ||||||
Cost of shares redeemed | (125,896,067 | ) | (161,127,801 | ) | ||||
| Net decrease in net assets resulting from share transactions | (19,197,560 | ) | (24,725,409 | ) | ||||
| TOTAL DECREASE | (29,561,608 | ) | (43,914,674 | ) | ||||
| Net assets: | ||||||||
Beginning of period | 470,766,391 | 514,681,065 | ||||||
End of period | $ | 441,204,783 | $ | 470,766,391 | ||||
| Undistributed net investment income | $ | 1,843,483 | $ | 1,207,418 | ||||
| 12 | The accompanying notes are an integral part of these financial statements. |
GOLDMAN SACHS VARIABLE INSURANCE TRUST STRATEGIC GROWTH FUND
Financial Highlights
Selected Data for a Share Outstanding Throughout Each Period
| Income (loss) from investment operations | Distributions to shareholders | |||||||||||||||||||||||||||||||||||||||||||||||||||||||
| Year - Share Class | Net asset value, beginning of period | Net investment income(a) | Net realized and unrealized gain (loss) | Total from investment operations | From net investment income | From net realized gains | Total distributions | Net asset value, end of period | Total return(b) | Net assets, end of period (in 000s) | Ratio of net expenses to average net assets | Ratio of total expenses to average net assets | Ratio of net investment income to average net assets | Portfolio turnover rate(c) | ||||||||||||||||||||||||||||||||||||||||||
FOR THE SIX MONTHS ENDED JUNE 30, (UNAUDITED) | ||||||||||||||||||||||||||||||||||||||||||||||||||||||||
2016 - Institutional | $ | 15.62 | $ | 0.04 | $ | (0.22 | ) | $ | (0.18 | ) | $ | — | $ | — | $ | — | $ | 15.44 | (1.09 | )% | $ | 101,774 | 0.79 | %(d) | 0.84 | %(d) | 0.51 | %(d) | 43 | % | ||||||||||||||||||||||||||
2016 - Service | 15.59 | 0.02 | (0.22 | ) | (0.20 | ) | — | — | — | 15.39 | (1.22 | ) | 339,431 | 1.04 | (d) | 1.09 | (d) | 0.25 | (d) | 43 | ||||||||||||||||||||||||||||||||||||
FOR THE FISCAL YEARS ENDED DECEMBER 31, | ||||||||||||||||||||||||||||||||||||||||||||||||||||||||
2015 - Institutional | 16.16 | 0.09 | (e) | 0.46 | 0.55 | (0.06 | ) | (1.03 | ) | (1.09 | ) | 15.62 | 3.40 | 109,801 | 0.79 | 0.83 | 0.55 | (e) | 56 | |||||||||||||||||||||||||||||||||||||
2015 - Service | 16.13 | 0.05 | (e) | 0.46 | 0.51 | (0.02 | ) | (1.03 | ) | (1.05 | ) | 15.59 | 3.14 | 360,966 | 1.04 | 1.08 | 0.29 | (e) | 56 | |||||||||||||||||||||||||||||||||||||
2014 - Institutional | 17.64 | 0.07 | 2.24 | 2.31 | (0.07 | ) | (3.72 | ) | (3.79 | ) | 16.16 | 13.64 | 119,934 | 0.79 | 0.81 | 0.37 | 48 | |||||||||||||||||||||||||||||||||||||||
2014 - Service | 17.61 | 0.02 | 2.24 | 2.26 | (0.02 | ) | (3.72 | ) | (3.74 | ) | 16.13 | 13.38 | 394,747 | 1.04 | 1.08 | 0.12 | 48 | |||||||||||||||||||||||||||||||||||||||
2013 - Institutional | 13.86 | 0.06 | 4.42 | 4.48 | (0.07 | ) | (0.63 | ) | (0.70 | ) | 17.64 | 32.42 | 122,220 | 0.80 | 0.84 | 0.35 | 66 | |||||||||||||||||||||||||||||||||||||||
2013 - Service | 13.85 | 0.02 | 4.40 | 4.42 | (0.03 | ) | (0.63 | ) | (0.66 | ) | 17.61 | 32.00 | 391,219 | 1.05 | 1.09 | 0.10 | 66 | |||||||||||||||||||||||||||||||||||||||
2012 - Institutional | 11.64 | 0.10 | (f) | 2.21 | 2.31 | (0.09 | ) | — | (0.09 | ) | 13.86 | 19.83 | 106,119 | 0.80 | 0.84 | 0.79 | (f) | 42 | ||||||||||||||||||||||||||||||||||||||
2012 - Service | 11.63 | 0.07 | (f) | 2.21 | 2.28 | (0.06 | ) | — | (0.06 | ) | 13.85 | 19.57 | 304,065 | 1.05 | 1.09 | 0.56 | (f) | 42 | ||||||||||||||||||||||||||||||||||||||
2011 - Institutional | 12.01 | 0.06 | (0.37 | ) | (0.31 | ) | (0.06 | ) | — | (0.06 | ) | 11.64 | (2.62 | ) | 102,018 | 0.83 | 0.85 | 0.47 | 35 | |||||||||||||||||||||||||||||||||||||
2011 - Service | 12.00 | 0.03 | (0.37 | ) | (0.34 | ) | (0.03 | ) | — | (0.03 | ) | 11.63 | (2.86 | ) | 246,208 | 1.08 | 1.10 | 0.23 | 35 | |||||||||||||||||||||||||||||||||||||
| (a) | Calculated based on the average shares outstanding methodology. |
| (b) | Assumes investment at the net asset value at the beginning of the period, reinvestment of all distributions, and a complete redemption of the investment at the net asset value at the end of the period. Total returns for periods less than one full year are not annualized. |
| (c) | The Fund’s portfolio turnover rate is calculated in accordance with regulatory requirements, without regard to transactions involving short term investments. If such transactions were included, the Fund’s portfolio turnover rate may be higher. |
| (d) | Annualized. |
| (e) | Reflects income recognized from special dividends which amounted to $0.03 per share and 0.20% of average net assets. |
| (f) | Reflects income recognized from special dividends which amounted to $0.04 per share and 0.27% of average net assets. |
| The accompanying notes are an integral part of these financial statements. | 13 |
GOLDMAN SACHS VARIABLE INSURANCE TRUST STRATEGIC GROWTH FUND
Notes to Financial Statements
June 30, 2016 (Unaudited)
1. ORGANIZATION
Goldman Sachs Variable Insurance Trust (the “Trust” or “VIT”) is a Delaware statutory trust registered under the Investment Company Act of 1940, as amended (the “Act”), as an open-end management investment company. The Trust includes the Goldman Sachs Strategic Growth Fund (the “Fund”). The Fund is a diversified portfolio under the Act offering two classes of shares — Institutional and Service Shares. Shares of the Trust are offered to separate accounts of participating life insurance companies for the purpose of funding variable annuity contracts and variable life insurance policies.
Goldman Sachs Asset Management, L.P. (“GSAM”), an affiliate of Goldman, Sachs & Co. (“Goldman Sachs”), serves as investment adviser to the Fund pursuant to a management agreement (the “Agreement”) with the Trust.
2. SIGNIFICANT ACCOUNTING POLICIES
The financial statements have been prepared in accordance with accounting principles generally accepted in the United States of America (“GAAP”) and require management to make estimates and assumptions that may affect the reported amounts and disclosures. Actual results may differ from those estimates and assumptions.
A. Investment Valuation — The Fund’s valuation policy is to value investments at fair value.
B. Investment Income and Investments — Investment income includes interest income, dividend income, net of any foreign withholding taxes, less any amounts reclaimable, and securities lending income. Interest income is accrued daily and adjusted for amortization of premiums and accretion of discounts. Dividend income is recognized on ex-dividend date or, for certain foreign securities, as soon as such information is obtained subsequent to the ex-dividend date. Investment transactions are reflected on trade date. Realized gains and losses are calculated using identified cost. Investment transactions are recorded on the following business day for daily net asset value (“NAV”) calculations. Any foreign capital gains tax is accrued daily based upon net unrealized gains, and is payable upon sale of such investments. Distributions received from the Fund’s investments in United States (“U.S.”) real estate investment trusts (“REITs”) may be characterized as ordinary income, net capital gain or a return of capital. A return of capital is recorded by the Fund as a reduction to the cost basis of the REIT.
C. Class Allocations and Expenses — Investment income, realized and unrealized gain (loss), and non-class specific expenses of the Fund are allocated daily based upon the proportion of net assets of each class. Non-class specific expenses directly incurred by the Fund are charged to the Fund, while such expenses incurred by the Trust are allocated across the Fund on a straight-line and/or pro-rata basis depending upon the nature of the expenses. Class specific expenses, where applicable, are borne by the respective share classes and include Distribution and Service and Transfer Agency fees.
D. Federal Taxes and Distributions to Shareholders — It is the Fund’s policy to comply with the requirements of the Internal Revenue Code of 1986, as amended (the “Code”), applicable to regulated investment companies (mutual funds) and to distribute each year substantially all of its investment company taxable income and capital gains to its shareholders. Accordingly, the Fund is not required to make any provisions for the payment of federal income tax. Distributions to shareholders are recorded on the ex-dividend date. Income and capital gains distributions, if any, are declared and paid annually.
Net capital losses are carried forward to future fiscal years and may be used to the extent allowed by the Code to offset any future capital gains. Losses that are carried forward will retain their character as either short-term or long-term capital losses. Utilization of capital loss carryforwards will reduce the requirement of future capital gains distributions.
The characterization of distributions to shareholders for financial reporting purposes is determined in accordance with federal income tax rules, which may differ from GAAP. The source of the Fund’s distributions may be shown in the accompanying financial statements as either from net investment income, net realized gain or capital. Certain components of the Fund’s net assets on the Statement of Assets and Liabilities reflect permanent GAAP/tax differences based on the appropriate tax character.
E. Commission Recapture — GSAM, on behalf of certain Funds, may direct portfolio trades, subject to seeking best execution, to various brokers who have agreed to rebate a portion of the commissions generated. Such rebates are made directly to a Fund as cash payments and are included in net realized gain (loss) from investments on the Statement of Operations.
14
GOLDMAN SACHS VARIABLE INSURANCE TRUST STRATEGIC GROWTH FUND
3. INVESTMENTS AND FAIR VALUE MEASUREMENTS
The fair value of a financial instrument is the amount that would be received to sell an asset or paid to transfer a liability in an orderly transaction between market participants at the measurement date (i.e., the exit price). GAAP establishes a fair value hierarchy that prioritizes the inputs to valuation techniques used to measure fair value. The hierarchy gives the highest priority to unadjusted quoted prices in active markets for identical assets or liabilities (Level 1 measurements) and the lowest priority to unobservable inputs (Level 3 measurements). The levels used for classifying investments are not necessarily an indication of the risk associated with investing in these investments. The three levels of the fair value hierarchy are described below:
Level 1 — Unadjusted quoted prices in active markets that are accessible at the measurement date for identical, unrestricted assets or liabilities;
Level 2 — Quoted prices in markets that are not active or financial instruments for which significant inputs are observable (including, but not limited to, quoted prices for similar investments, interest rates, foreign exchange rates, volatility and credit spreads), either directly or indirectly;
Level 3 — Prices or valuations that require significant unobservable inputs (including GSAM’s assumptions in determining fair value measurement).
Changes in valuation techniques may result in transfers into or out of an assigned level within the hierarchy. In accordance with the Fund’s policy, transfers between different levels of the fair value hierarchy resulting from such changes are deemed to have occurred as of the beginning of the reporting period.
The Board of Trustees (“Trustees”) has approved Valuation Procedures that govern the valuation of the portfolio investments held by the Fund, including investments for which market quotations are not readily available. The Trustees have delegated to GSAM day-to-day responsibility for implementing and maintaining internal controls and procedures related to the valuation of the Fund’s portfolio investments. To assess the continuing appropriateness of pricing sources and methodologies, GSAM regularly performs price verification procedures and issues challenges as necessary to third party pricing vendors or brokers, and any differences are reviewed in accordance with the Valuation Procedures.
A. Level 1 and Level 2 Fair Value Investments — The valuation techniques and significant inputs used in determining the fair values for investments classified as Level 1 and Level 2 are as follows:
Equity Securities — Equity securities traded on a U.S. securities exchange or the NASDAQ system, or those located on certain foreign exchanges, including but not limited to the Americas, are valued daily at their last sale price or official closing price on the principal exchange or system on which they are traded. If there is no sale or official closing price or such price is believed by GSAM to not represent fair value, equity securities are valued at the last bid price for long positions and at the last ask price for short positions. To the extent these investments are actively traded, they are classified as Level 1 of the fair value hierarchy, otherwise they are generally classified as Level 2.
Unlisted equity securities for which market quotations are available are valued at the last sale price on the valuation date, or if no sale occurs, at the last bid price. These investments are generally classified as Level 2 of the fair value hierarchy.
B. Level 3 Fair Value Investments — To the extent that significant inputs to valuation models and other alternative pricing sources are unobservable, or if quotations are not readily available, or if GSAM believes that such quotations do not accurately reflect fair value, the fair value of the Fund’s investments may be determined under Valuation Procedures approved by the Trustees. GSAM, consistent with its procedures and applicable regulatory guidance, may make an adjustment to the most recent valuation prices of either domestic or foreign securities in light of significant events to reflect what it believes to be the fair value of the securities at the time of determining the Fund’s NAV. Significant events which could affect a large number of securities in a particular market may include, but are not limited to: significant fluctuations in U.S. or foreign markets; market dislocations; market disruptions; or unscheduled market closings. Significant events which could also affect a single issuer may include, but are not limited to: corporate actions such as reorganizations, mergers and buy-outs; ratings downgrades; and bankruptcies.
15
GOLDMAN SACHS VARIABLE INSURANCE TRUST STRATEGIC GROWTH FUND
Notes to Financial Statements (continued)
June 30, 2016 (Unaudited)
3. INVESTMENTS AND FAIR VALUE MEASUREMENTS (continued)
C. Fair Value Hierarchy — The following is a summary of the Fund’s investments classified in the fair value hierarchy as of June 30, 2016:
| Investment Type | Level 1 | Level 2 | Level 3 | |||||||||
| Assets | ||||||||||||
| Common Stock and/or Other Equity Investments(a) | ||||||||||||
North America | $ | 427,104,033 | $ | — | $ | — | ||||||
| (a) | Amounts are disclosed by continent to highlight the impact of time zone differences between local market close and the calculation of NAV. Security valuations are based on the principal exchange or system on which they are traded, which may differ from country of domicile noted in table. |
For further information regarding security characteristics, see the Schedule of Investments.
4. AGREEMENTS AND AFFILIATED TRANSACTIONS
A. Management Agreement — Under the Agreement, GSAM manages the Fund, subject to the general supervision of the Trustees.
As compensation for the services rendered pursuant to the Agreement, the assumption of the expenses related thereto and administration of the Fund’s business affairs, including providing facilities, GSAM is entitled to a management fee, accrued daily and paid monthly, equal to an annual percentage rate of the Fund’s average daily net assets.
For the six months ended June 30, 2016, contractual and effective net management fees with GSAM were at the following rates:
| Contractual Management Rate | Effective Net Management Rate^ | |||||||||||||||||||||||
| First $1 billion | Next $1 billion | Next $3 billion | Next $3 billion | Over $8 billion | Effective Rate | |||||||||||||||||||
| 0.75% | 0.68 | % | 0.65 | % | 0.64 | % | 0.63 | % | 0.75 | % | 0.71 | %* | ||||||||||||
| ^ | Effective Net Management Rate includes the impact of management fee waivers of affiliated underlying funds, if any. |
| * | GSAM agreed to waive a portion of its management fee in order to achieve a net management rate, as defined in the Fund’s most recent prospectus. This waiver will be effective through at least April 29, 2017, and prior to such date GSAM may not terminate the arrangement without approval of the Trustees. For the six months ended June 30, 2016, GSAM waived $81,986 of its management fee. |
B. Distribution and Service Plan — The Trust, on behalf of the Service Shares of the Fund, has adopted a Distribution and Service Plan (the “Plan”). Under the Plan, Goldman Sachs, which serves as distributor (the “Distributor”), is entitled to a fee accrued daily and paid monthly, for distribution services and personal and account maintenance services, which may then be paid by Goldman Sachs to authorized dealers, equal to, on an annual basis, 0.25% of the Fund’s average daily net assets attributable to Service Shares.
C. Transfer Agency Agreement — Goldman Sachs also serves as the transfer agent of the Fund for a fee pursuant to the Transfer Agency Agreement. The fees charged for such transfer agency services are accrued daily and paid monthly at an annual rate of 0.02% of the average daily net assets of Institutional and Service Shares.
D. Other Expense Agreements and Affiliated Transactions — GSAM has agreed to limit certain “Other Expenses” of the Fund (excluding acquired fund fees and expenses, transfer agency fees and expenses, taxes, interest, brokerage fees, shareholder meeting, litigation, indemnification and extraordinary expenses) to the extent such expenses exceed, on an annual basis, a percentage rate of the average daily net assets of the Fund. Such Other Expense reimbursements, if any, are accrued daily and paid monthly. In addition, the Fund is not obligated to reimburse GSAM for prior fiscal year expense reimbursements, if any. The Other Expense limitation as an annual percentage rate of average daily net assets for the Fund is 0.114%. The Other Expense limitation will remain in place through at least April 29, 2017, and prior to such date GSAM may not terminate the arrangement without the
16
GOLDMAN SACHS VARIABLE INSURANCE TRUST STRATEGIC GROWTH FUND
4. AGREEMENTS AND AFFILIATED TRANSACTIONS (continued)
approval of the Trustees. For the six months ended June 30, 2016, GSAM did not reimburse to the Fund. In addition, the Fund has entered into certain offset arrangements with the custodian and the transfer agent, which may result in a reduction of the Fund’s expenses and are received irrespective of the application of the “Other Expense” limitations described above. For the six months ended June 30, 2016, custody fee credits were $4,354.
E. Line of Credit Facility — As of June 30, 2016, the Fund participated in a $1,100,000,000 committed, unsecured revolving line of credit facility (the “facility”) together with other funds of the Trust and registered investment companies having management agreements with GSAM or its affiliates (“Other Borrowers”). This facility is to be used for temporary or emergency purposes, or to allow for an orderly liquidation of securities to meet redemption requests. The interest rate on borrowings is based on the federal funds rate. The facility also requires a fee to be paid by the Fund based on the amount of the commitment that has not been utilized. For the six months ended June 30, 2016, the Fund did not have any borrowings under the facility.
5. PORTFOLIO SECURITIES TRANSACTIONS
The cost of purchases and proceeds from sales and maturities of long-term securities for the six months ended June 30, 2016, were $176,056,613 and $200,823,785, respectively.
6. TAX INFORMATION
As of the Fund’s most recent fiscal year end, December 31, 2015, the Fund’s timing differences, on a tax-basis were as follows:
Timing differences (Post October Loss Deferral) | $ | (274,792 | ) |
As of June 30, 2016, the Fund’s aggregate security unrealized gains and losses based on cost for U.S. federal income tax purposes were as follows:
| Tax cost | $ | 331,154,546 | ||
| Gross unrealized gain | 102,900,480 | |||
| Gross unrealized loss | (6,950,993 | ) | ||
| Net unrealized security gain | $ | 95,949,487 |
The difference between GAAP-basis and tax-basis unrealized gains (losses) is attributable primarily to wash sales, and differences in the tax treatment of underlying fund investments.
GSAM has reviewed the Fund’s tax positions for all open tax years (the current and prior three years, as applicable) and has concluded that no provision for income tax is required in the Fund’s financial statements. Such open tax years remain subject to examination and adjustment by tax authorities.
7. OTHER RISKS
The Fund’s risks include, but are not limited to, the following:
Large Shareholder Transactions Risk — The Fund may experience adverse effects when certain large shareholders, such as other funds, participating insurance companies, accounts and Goldman Sachs affiliates, purchase or redeem large amounts of shares of the Fund. Such large shareholder redemptions may cause the Fund to sell portfolio securities at times when it would not otherwise do so, which may negatively impact the Fund’s NAV and liquidity. These transactions may also accelerate the realization of taxable income to shareholders if such sales of investments resulted in gains, and may also increase transaction costs. In addition,
17
GOLDMAN SACHS VARIABLE INSURANCE TRUST STRATEGIC GROWTH FUND
Notes to Financial Statements (continued)
June 30, 2016 (Unaudited)
7. OTHER RISKS (continued)
a large redemption could result in the Fund’s current expenses being allocated over a smaller asset base, leading to an increase in the Fund’s expense ratio. Similarly, large Fund share purchases may adversely affect the Fund’s performance to the extent that the Fund is delayed in investing new cash and is required to maintain a larger cash position than it ordinarily would.
Liquidity Risk — The Fund may make investments that are illiquid or that may become less liquid in response to market developments or adverse investor perceptions. Illiquid investments may be more difficult to value. Liquidity risk may also refer to the risk that the Fund will not be able to pay redemption proceeds within the allowable time period because of unusual market conditions, an unusually high volume of redemption requests, or other reasons. To meet redemption requests, the Fund may be forced to sell investments at an unfavorable time and/or under unfavorable conditions.
Market and Credit Risks — In the normal course of business, the Fund trades financial instruments and enters into financial transactions where risk of potential loss exists due to changes in the market (market risk). Additionally, the Fund may also be exposed to credit risk in the event that an issuer or guarantor fails to perform or that an institution or entity with which the Fund has unsettled or open transactions defaults.
8. INDEMNIFICATIONS
Under the Trust’s organizational documents, its Trustees, officers, employees and agents are indemnified, to the extent permitted by the Act and state law, against certain liabilities that may arise out of performance of their duties to the Fund. Additionally, in the course of business, the Fund enters into contracts that contain a variety of indemnification clauses. The Fund’s maximum exposure under these arrangements is unknown, as this would involve future claims that may be made against the Fund that have not yet occurred. However, GSAM believes the risk of loss under these arrangements to be remote.
9. SUBSEQUENT EVENTS
Subsequent events after the Statement of Assets and Liabilities date have been evaluated through the date the financial statements were issued. GSAM has concluded that there is no impact requiring adjustment or disclosure in the financial statements.
18
GOLDMAN SACHS VARIABLE INSURANCE TRUST STRATEGIC GROWTH FUND
10. SUMMARY OF SHARE TRANSACTIONS
Share activity is as follows:
| For the Six Months Ended June 30, 2016 (Unaudited) | For the Fiscal Year Ended December 31, 2015 | |||||||||||||||
| Shares | Dollars | Shares | Dollars | |||||||||||||
| Institutional Shares | ||||||||||||||||
| Shares sold | 124,957 | $ | 1,886,552 | 319,675 | $ | 5,242,157 | ||||||||||
| Reinvestment of distributions | — | — | 458,800 | 7,161,871 | ||||||||||||
| Shares redeemed | (564,458 | ) | (8,448,786 | ) | (1,170,524 | ) | (19,375,952 | ) | ||||||||
| (439,501 | ) | (6,562,234 | ) | (392,049 | ) | (6,971,924 | ) | |||||||||
| Service Shares | ||||||||||||||||
| Shares sold | 6,784,290 | $ | 104,811,955 | 5,956,788 | 100,229,401 | |||||||||||
| Reinvestment of distributions | — | — | 1,525,608 | 23,768,963 | ||||||||||||
| Shares redeemed | (7,890,897 | ) | (117,447,281 | ) | (8,800,386 | ) | (141,751,849 | ) | ||||||||
| (1,106,607 | ) | (12,635,326 | ) | (1,317,990 | ) | (17,753,485 | ) | |||||||||
| NET DECREASE | (1,546,108 | ) | $ | (19,197,560 | ) | (1,710,039 | ) | $ | (24,725,409 | ) | ||||||
19
GOLDMAN SACHS VARIABLE INSURANCE TRUST STRATEGIC GROWTH FUND
| Fund Expenses — Six Month Period Ended June 30, 2016 (Unaudited) |
As a shareholder of Institutional or Service Shares of the Fund, you incur ongoing costs, including management fees, distribution and service (12b-1) fees (with respect to Service Shares) and other Fund expenses. This example is intended to help you understand your ongoing costs (in dollars) of investing in the Institutional Shares and Service Shares of the Fund and to compare these costs with the ongoing costs of investing in other mutual funds.
The example is based on an investment of $1,000 invested at the beginning of the period and held for the entire period from January 1, 2016 through June 30, 2016, which represents a period of 182 days of a 366 day year.
Actual Expenses — The first line under each share class in the table below provides information about actual account values and actual expenses. You may use the information in this line, together with the amount you invested, to estimate the expenses that you paid over the period. Simply divide your account value by $1,000 (for example, an $8,600 account value divided by $1,000=8.6), then multiply the result by the number in the first line under the heading entitled “Expenses Paid” to estimate the expenses you paid on your account during this period.
Hypothetical Example for Comparison Purposes — The second line under each share class in the table below provides information about hypothetical account values and hypothetical expenses based on the Fund’s actual net expense ratio and an assumed rate of return of 5% per year before expenses, which is not the Fund’s actual return. The hypothetical account values and expenses may not be used to estimate the actual ending account balance or expenses you paid for the period. You may use this information to compare the ongoing costs of investing in the Fund and other funds. To do so, compare this 5% hypothetical example with the 5% hypothetical examples that appear in the shareholder reports of the other funds.
Please note that the expenses shown in the table are meant to highlight your ongoing costs only. As a shareholder of the Fund you do not incur any transaction costs, such as sales charges, redemption fees, or exchange fees, but shareholders of other funds may incur such costs. The second line of the table is useful in comparing ongoing costs only, and will not help you determine the relative total costs of owning different funds whose shareholders may incur transaction costs.
| Share Class | Beginning Account Value 01/01/16 | Ending Account Value 06/30/16 | Expenses Paid for the 6 Months Ended 06/30/16* | |||||||||
| Institutional | ||||||||||||
| Actual | $ | 1,000 | $ | 989.10 | $ | 3.91 | ||||||
| Hypothetical 5% return | 1,000 | 1,020.93 | + | 3.97 | ||||||||
| Service | ||||||||||||
| Actual | 1,000 | 987.80 | 5.14 | |||||||||
| Hypothetical 5% return | 1,000 | 1,019.69 | + | 5.22 | ||||||||
| * | Expenses are calculated using the Fund’s annualized net expense ratio for each class, which represents the ongoing expenses as a percentage of net assets for the six months ended June 30, 2016. Expenses are calculated by multiplying the annualized net expense ratio by the average account value for the period; then multiplying the result by the number of days in the most recent fiscal half year; and then dividing that result by the number of days in the fiscal year. The annualized net expense ratios for the period were 0.79% and 1.04% for the Institutional and Service Shares, respectively. |
| + | Hypothetical expenses are based on the Fund’s actual annualized net expense ratios and an assumed rate of return of 5% per year before expenses. |
20
GOLDMAN SACHS VARIABLE INSURANCE TRUST STRATEGIC GROWTH FUND
Statement Regarding Basis for Approval of Management Agreement (Unaudited)
Background
The Goldman Sachs Strategic Growth Fund (the “Fund”) is an investment portfolio of Goldman Sachs Variable Insurance Trust (the “Trust”). The Board of Trustees oversees the management of the Trust and reviews the investment performance and expenses of the Fund at regularly scheduled meetings held throughout the year. In addition, the Board of Trustees determines annually whether to approve the continuance of the Trust’s investment management agreement (the “Management Agreement”) with Goldman Sachs Asset Management, L.P. (the “Investment Adviser”) on behalf of the Fund.
The Management Agreement was most recently approved for continuation until June 30, 2017 by the Board of Trustees, including those Trustees who are not parties to the Management Agreement or “interested persons” (as defined in the Investment Company Act of 1940, as amended) of any party thereto (the “Independent Trustees”), at a meeting held on June 15-16, 2016 (the “Annual Meeting”).
The review process undertaken by the Trustees spans the course of the year and culminates with the Annual Meeting. To assist the Trustees in their deliberations, the Trustees have established a Contract Review Committee (the “Committee”), comprised of the Independent Trustees. The Committee held three meetings over the course of the year since the Management Agreement was last approved. At those Committee meetings, regularly scheduled Board or other committee meetings, and/or the Annual Meeting, matters relevant to the renewal of the Management Agreement were considered by the Board, or the Independent Trustees, as applicable. With respect to the Fund, such matters included:
| (a) | the nature and quality of the advisory, administrative, and other services provided to the Fund by the Investment Adviser and its affiliates, including information about: |
| (i) | the structure, staff, and capabilities of the Investment Adviser and its portfolio management teams; |
| (ii) | the groups within the Investment Adviser and its affiliates that support the portfolio management teams or provide other types of necessary services, including fund services groups (e.g., accounting and financial reporting, tax, shareholder services, and operations); controls and risk management groups (e.g., legal, compliance, valuation oversight, credit risk management, internal audit, compliance testing, market risk analysis, finance, and central funding); sales and distribution support groups, and others (e.g., information technology and training); |
| (iii) | trends in employee headcount; |
| (iv) | the Investment Adviser’s financial resources and ability to hire and retain talented personnel and strengthen its operations; and |
| (v) | the parent company’s support of the Investment Adviser and its mutual fund business, as expressed by the firm’s senior management; |
| (b) | information on the investment performance of the Fund, including comparisons to the performance of similar mutual funds, as provided by a third-party mutual fund data provider engaged as part of the contract review process (the “Outside Data Provider”), a benchmark performance index, and a composite of accounts with comparable investment strategies managed by the Investment Adviser; and general investment outlooks in the markets in which the Fund invests; |
| (c) | information provided by the Investment Adviser indicating the Investment Adviser’s views on whether the Fund’s peer group and/or benchmark index had high, medium, or low relevance given the Fund’s particular investment strategy; |
| (d) | the terms of the Management Agreement and other agreements with affiliated service providers entered into by the Trust on behalf of the Fund; |
| (e) | fee and expense information for the Fund, including: |
| (i) | the relative management fee and expense level of the Fund as compared to those of comparable funds managed by other advisers, as provided by the Outside Data Provider; |
| (ii) | the Fund’s expense trends over time; and |
| (iii) | to the extent the Investment Adviser manages other types of accounts (such as bank collective trusts, private wealth management accounts, institutional separate accounts, sub-advised mutual funds, and non-U.S. funds) having investment objectives and policies similar to those of the Fund, comparative information on the advisory fees charged and services provided to those accounts by the Investment Adviser; |
| (f) | with respect to the extensive investment performance and expense comparison data provided by the Outside Data Provider, its processes in producing that data for the Fund; |
| (g) | the undertaking of the Investment Adviser to waive certain fees and to limit certain expenses of the Fund that exceed a specified level; |
| (h) | information relating to the profitability of the Management Agreement and the transfer agency and distribution and service arrangements of the Fund and the Trust as a whole to the Investment Adviser and its affiliates; |
| (i) | whether the Fund’s existing management fee schedule adequately addressed any economies of scale; |
21
GOLDMAN SACHS VARIABLE INSURANCE TRUST STRATEGIC GROWTH FUND
Statement Regarding Basis for Approval of Management Agreement (Unaudited) (continued)
| (j) | a summary of the “fall-out” benefits derived by the Investment Adviser and its affiliates from their relationships with the Fund, including the fees received by the Investment Adviser’s affiliates from the Fund for transfer agency, portfolio trading, distribution and other services; |
| (k) | a summary of potential benefits derived by the Fund as a result of its relationship with the Investment Adviser; |
| (l) | information regarding commissions paid by the Fund and broker oversight, an update on the Investment Adviser’s soft dollars practices, other information regarding portfolio trading, and how the Investment Adviser carries out its duty to seek best execution; |
| (m) | the manner in which portfolio manager compensation is determined; and the number and types of accounts managed by the portfolio managers; |
| (n) | the nature and quality of the services provided to the Fund by its unaffiliated service providers, and the Investment Adviser’s general oversight and evaluation (including reports on due diligence) of those service providers as part of the administration services provided under the Management Agreement; and |
| (o) | the Investment Adviser’s processes and policies addressing various types of potential conflicts of interest; its approach to risk management; the annual review of the effectiveness of the Fund’s compliance program; and periodic compliance reports. |
The Trustees also received an overview of the Fund’s distribution arrangements. They received information regarding the Fund’s assets, share purchase and redemption activity, and payment of distribution and service fees. Information was also provided to the Trustees relating to revenue sharing payments made by and services provided by the Investment Adviser and its affiliates to intermediaries that promote the sale, distribution, and/or servicing of Fund shares. The Independent Trustees also discussed the broad range of other investment choices that are available to Fund investors, including the availability of comparable funds managed by other advisers.
The presentations made at the Board and Committee meetings and at the Annual Meeting encompassed the Fund and other mutual funds for which the Board of Trustees has responsibility. In evaluating the Management Agreement at the Annual Meeting, the Trustees relied upon their knowledge, resulting from their meetings and other interactions throughout the year, of the Investment Adviser and its affiliates, their services, and the Fund. In conjunction with these meetings, the Trustees received written materials and oral presentations on the topics covered, and the Investment Adviser addressed the questions and concerns of the Trustees, including concerns regarding the investment performance of certain of the funds they oversee. The Independent Trustees were advised by their independent legal counsel regarding their responsibilities and other regulatory requirements related to the approval and continuation of mutual fund investment management agreements under applicable law. In addition, the Investment Adviser and its affiliates provided the Independent Trustees with a written response to a formal request for information sent on behalf of the Independent Trustees by their independent legal counsel. During the course of their deliberations, the Independent Trustees met in executive sessions with their independent legal counsel, without representatives of the Investment Adviser or its affiliates present.
Nature, Extent, and Quality of the Services Provided Under the Management Agreement
As part of their review, the Trustees considered the nature, extent, and quality of the services provided to the Fund by the Investment Adviser. In this regard, the Trustees considered both the investment advisory services and non-advisory services that are provided by the Investment Adviser and its affiliates. The Trustees noted the transition in the leadership and changes in personnel of various of the Investment Adviser’s portfolio management teams that had occurred in recent periods, and the ongoing recruitment efforts aimed at bringing high quality investment talent to the Investment Adviser. They also noted the Investment Adviser’s commitment to maintaining high quality systems and expending substantial resources to respond to ongoing changes to the regulatory and control environment in which the Fund and its service providers operate, as well as the efforts of the Investment Adviser and its affiliates to combat cyber security risks. The Trustees concluded that the Investment Adviser continued to commit substantial financial and operational resources to the Fund and expressed confidence that the Investment Adviser would continue to do so in the future. The Trustees also recognized that the Investment Adviser had made significant commitments to address regulatory compliance requirements applicable to the Fund and the Investment Adviser and its affiliates.
Investment Performance
The Trustees also considered the investment performance of the Fund. In this regard, they compared the investment performance of the Fund to its peers using rankings and ratings compiled by the Outside Data Provider as of December 31, 2015, and updated performance information prepared by the Investment Adviser using the peer group identified by the Outside Data Provider as of March 31, 2016. The information on the Fund’s investment performance was provided for the one-, three-, five-, and
22
GOLDMAN SACHS VARIABLE INSURANCE TRUST STRATEGIC GROWTH FUND
Statement Regarding Basis for Approval of Management Agreement (Unaudited) (continued)
ten-year periods ending on the applicable dates. The Trustees also reviewed the Fund’s investment performance relative to its performance benchmark. As part of this review, they considered the investment performance trends of the Fund over time, and reviewed the investment performance of the Fund in light of its investment objective and policies and market conditions. The Trustees also received information comparing the Fund’s performance to that of a composite of accounts with comparable investment strategies managed by the Investment Adviser.
In addition, the Trustees considered materials prepared and presentations made by the Investment Adviser’s senior management and portfolio management personnel in which Fund performance was assessed. The Trustees also considered the Investment Adviser’s periodic reports with respect to the Fund’s risk profile, and how the Investment Adviser’s approach to risk monitoring and management influences portfolio management.
The Trustees observed that the Fund’s Institutional Shares had placed in the top half of the Fund’s peer group for the one-, three-, five-, and ten-year periods, and had underperformed the Fund’s benchmark index for the one-, three-, five-, and ten-year periods ended March 31, 2016.
Costs of Services Provided and Competitive Information
The Trustees considered the contractual terms of the Management Agreement and the fee rates payable by the Fund thereunder. In this regard, the Trustees considered information on the services rendered by the Investment Adviser to the Fund, which included both advisory and administrative services that were directed to the needs and operations of the Fund as a registered mutual fund.
In particular, the Trustees reviewed analyses prepared by the Outside Data Provider regarding the expense rankings of the Fund. The analyses provided a comparison of the Fund’s management fee and breakpoints to those of a relevant peer group and category universe; an expense analysis which compared the Fund’s overall net and gross expenses to a peer group and a category universe; and a five-year history comparing the Fund’s net expenses to the peer and category medians. The analyses also compared the Fund’s transfer agency, custody, and distribution fees, other expenses and fee waivers/reimbursements to those of the peer group and category medians. The Trustees concluded that the comparisons provided by the Outside Data Provider were useful in evaluating the reasonableness of the management fees and total expenses paid by the Fund.
In addition, the Trustees considered the Investment Adviser’s undertakings to waive a portion of its management fee and to limit certain expenses of the Fund that exceed a specified level. The Trustees also noted that certain changes were being made to existing fee waiver or expense limitation arrangements of the Fund that would have the effect of decreasing total Fund expenses, with such changes taking effect in connection with the Fund’s next annual registration statement update. They also considered, to the extent that the Investment Adviser manages other types of accounts having investment objectives and policies similar to those of the Fund, comparative fee information for services provided by the Investment Adviser to those accounts, and information that indicated that services provided to the Fund differed in various significant respects from the services provided to other types of accounts which, in many cases, operated under less stringent legal and regulatory structures, required fewer services from the Investment Adviser to a smaller number of client contact points, and were less time-intensive.
In addition, the Trustees noted that shareholders are able to redeem their Fund shares at any time if shareholders believe that the Fund fees and expenses are too high or if they are dissatisfied with the performance of the Fund.
Profitability
The Trustees reviewed the Investment Adviser’s revenues and pre-tax profit margins with respect to the Trust and the Fund. In this regard the Trustees noted that they had received, among other things, profitability analyses and summaries, revenue and expense schedules by Fund and by function (i.e., investment management, transfer agency and distribution and service), and information on the Investment Adviser’s expense allocation methodology. They observed that the profitability and expense figures are substantially similar to those used by the Investment Adviser for many internal purposes, including compensation decisions among various business groups, and are thus subject to a vigorous internal debate about how certain revenue and expenses should be allocated. The Trustees also noted that the internal audit group within the Goldman Sachs organization had audited the expense allocation methodology and was satisfied with the reasonableness, consistency, and accuracy of the Investment Adviser’s expense allocation methodology and profitability analysis calculations. Profitability data for the Trust and the Fund were provided for 2015 and 2014, and the Trustees considered this information in relation to the Investment Adviser’s overall profitability. The Trustees considered the Investment Adviser’s revenues and pre-tax profit margins both in absolute terms and in comparison to information on the reported pre-tax profit margins earned by certain other asset management firms.
23
GOLDMAN SACHS VARIABLE INSURANCE TRUST STRATEGIC GROWTH FUND
Statement Regarding Basis for Approval of Management Agreement (Unaudited) (continued)
Economies of Scale
The Trustees considered the information that had been provided regarding the Investment Adviser’s profitability. The Trustees also considered the breakpoints in the fee rate payable under the Management Agreement for the Fund at the following annual percentage rates of the average daily net assets of the Fund:
| First $1 billion | 0.75 | % | ||
| Next $1 billion | 0.68 | |||
| Next $3 billion | 0.65 | |||
| Next $3 billion | 0.64 | |||
| Over $8 billion | 0.63 |
The Trustees noted that the breakpoints were designed to share potential economies of scale, if any, with the Fund and its shareholders as assets under management reach those asset levels. The Trustees considered the amounts of assets in the Fund; the Fund’s recent share purchase and redemption activity; the information provided by the Investment Adviser relating to the costs of the services provided by the Investment Adviser and its affiliates and their realized profits; information comparing fee rates charged by the Investment Adviser with fee rates charged to other funds in the peer group; and the Investment Adviser’s undertakings to waive a portion of its management fee and to limit certain expenses of the Fund that exceed a specified level. Upon reviewing these matters at the Annual Meeting, the Trustees concluded that the fee breakpoints represented a means of assuring that benefits of scalability, if any, would be passed along to shareholders at the specified asset levels.
Other Benefits to the Investment Adviser and Its Affiliates
The Trustees also considered the other benefits derived by the Investment Adviser and its affiliates from their relationships with the Fund as stated above, including: (a) transfer agency fees received by Goldman, Sachs & Co. (“Goldman Sachs”); (b) brokerage and futures commissions earned by Goldman Sachs for executing securities and futures transactions on behalf of the Fund; (c) research received by the Investment Adviser from broker-dealers in exchange for executing certain transactions on behalf of the Fund; (d) trading efficiencies resulting from aggregation of orders of the Fund with those for other funds or accounts managed by the Investment Adviser; (e) the Investment Adviser’s ability to leverage the infrastructure designed to service the Fund on behalf of its other clients; (f) the Investment Adviser’s ability to cross-market other products and services to Fund shareholders; (g) Goldman Sachs’ retention of certain fees as Fund Distributor; (h) the Investment Adviser’s ability to negotiate better pricing with custodians on behalf of its other clients, as a result of the relationship with the Fund; and (i) the possibility that the working relationship between the Investment Adviser and the Fund’s third-party service providers may cause those service providers to be more likely to do business with other areas of Goldman Sachs. In the course of considering the foregoing, the Independent Trustees requested and received further information quantifying certain of these fall-out benefits.
Other Benefits to the Fund and Its Shareholders
The Trustees also noted that the Fund receives certain potential benefits as a result of its relationship with the Investment Adviser, including: (a) trading efficiencies resulting from aggregation of orders of the Fund with those of other funds or accounts managed by the Investment Adviser; (b) enhanced servicing from vendors because of the volume of business generated by the Investment Adviser and its affiliates; (c) enhanced servicing from broker-dealers because of the volume of business generated by the Investment Adviser and its affiliates; (d) the Investment Adviser’s ability to negotiate favorable terms with derivatives counterparties on behalf of the Fund as a result of the size and reputation of the Goldman Sachs organization; (e) the Investment Adviser’s knowledge and experience gained from managing other accounts and products; (f) the Investment Adviser’s ability to hire and retain qualified personnel to provide services to the Fund because of the reputation of the Goldman Sachs organization; (g) the Fund’s access, through the Investment Adviser, to certain firmwide resources (e.g., proprietary risk management systems and databases), subject to certain restrictions; and (h) the Fund’s access to certain affiliated distribution channels. In addition, the Trustees noted the competitive nature of the mutual fund marketplace, and considered that many of the Fund’s shareholders invested in the Fund in part because of the Fund’s relationship with the Investment Adviser and that those shareholders have a general expectation that the relationship will continue.
Conclusion
In connection with their consideration of the Management Agreement, the Trustees gave weight to each of the factors described above, but did not identify any particular factor as controlling their decision. After deliberation and consideration of all of
24
GOLDMAN SACHS VARIABLE INSURANCE TRUST STRATEGIC GROWTH FUND
Statement Regarding Basis for Approval of Management Agreement (Unaudited) (continued)
the information provided, including the factors described above, the Trustees concluded, in the exercise of their business judgment, that the management fees paid by the Fund were reasonable in light of the services provided to it by the Investment Adviser, the Investment Adviser’s costs and the Fund’s current and reasonably foreseeable asset levels. The Trustees unanimously concluded that the Investment Adviser’s continued management likely would benefit the Fund and its shareholders and that the Management Agreement should be approved and continued with respect to the Fund until June 30, 2017.
25
| TRUSTEES | OFFICERS | |
| Ashok N. Bakhru, Chairman | James A. McNamara, President | |
| Kathryn A. Cassidy | Scott M. McHugh, Principal Financial Officer, | |
| Diana M. Daniels | Senior Vice President and Treasurer | |
| Herbert J. Markley | Caroline L. Kraus, Secretary | |
| James A. McNamara | ||
| Jessica Palmer | ||
| Alan A. Shuch | ||
| Roy W. Templin | ||
| Gregory G. Weaver |
GOLDMAN, SACHS & CO.
Distributor and Transfer Agent
GOLDMAN SACHS ASSET MANAGEMENT, L.P.
Investment Adviser
200 West Street, New York
New York 10282
Visit our web site at www.GSAMFUNDS.com to obtain the most recent month-end returns.
The reports concerning the Fund included in this shareholder report may contain certain forward-looking statements about the factors that may affect the performance of the Fund in the future. These statements are based on Fund management’s predictions and expectations concerning certain future events and their expected impact on the Fund, such as performance of the economy as a whole and of specific industry sectors, changes in the levels of interest rates, the impact of developing world events, and other factors that may influence the future performance of the Fund. Management believes these forward-looking statements to be reasonable, although they are inherently uncertain and difficult to predict. Actual events may cause adjustments in portfolio management strategies from those currently expected to be employed.
A description of the policies and procedures that the Fund uses to determine how to vote proxies relating to portfolio securities and information regarding how the Fund voted proxies relating to portfolio securities for the 12-month period ended June 30 is available (i) without charge, upon request by calling 1-800-621-2550; and (ii) on the Securities and Exchange Commission (“SEC”) web site at http://www.sec.gov.
The Fund files its complete schedule of portfolio holdings with the SEC for the first and third quarters of each fiscal year on Form N-Q. The Fund’s Form N-Qs are available on the SEC’s web site at http://www.sec.gov within 60 days after the Fund’s first and third fiscal quarters. The Fund’s Form N-Qs may be reviewed and copied at the SEC’s Public Reference Room in Washington, D.C. and information on the operation of the Public Reference Room may also be obtained by calling 1-800-SEC-0330. Form N-Qs may be obtained upon request and without charge by calling 1-800-621-2550.
The website links provided are for your convenience only and are not an endorsement or recommendation by GSAM of any of these websites or the products or services offered. GSAM is not responsible for the accuracy and validity of the content of these websites.
Fund holdings and allocations shown are as of June 30, 2016 and may not be representative of future investments. Fund holdings should not be relied on in making investment decisions and should not be construed as research or investment advice regarding particular securities. Current and future holdings are subject to risk.
References to indices, benchmarks or other measures of relative market performance over a specified period of time are provided for your information only and do not imply that the portfolio will achieve similar results. The index composition may not reflect the manner in which a portfolio is constructed. While an adviser seeks to design a portfolio which reflects appropriate risk and return features, portfolio characteristics may deviate from those of the benchmark.
The Global Industry Classification Standard (“GICS”) was developed by and is the exclusive property and a service mark of Morgan Stanley Capital International Inc. (“MSCI”) and Standard & Poor’s, a division of The McGraw-Hill Companies, Inc. (“S&P”) and is licensed for use by Goldman Sachs. Neither MSCI, S&P nor any other party involved in making or compiling the GICS or any GICS classifications makes any express or implied warranties or representations with respect to such standard or classification (or the results to be obtained by the use thereof), and all such parties hereby expressly disclaim all warranties of originality, accuracy, completeness, merchantability or fitness for a particular purpose with respect to any of such standard or classification. Without limiting any of the foregoing, in no event shall MSCI, S&P, any of their affiliates or any third party involved in making or compiling the GICS or any GICS classifications have any liability for any direct, indirect, special, punitive, consequential or any other damages (including lost profits) even if notified of the possibility of such damages.
The portfolio risk management process includes an effort to monitor and manage risk, but does not imply low risk.
Shares of the Goldman Sachs VIT Funds are offered to separate accounts of participating life insurance companies for the purpose of funding variable annuity contracts and variable life insurance policies. Shares of the Fund are not offered directly to the general public. The variable annuity contracts and variable life insurance policies are described in the separate prospectuses issued by participating insurance companies. You should refer to those prospectuses for information about surrender charges, mortality and expense risk fees and other charges that may be assessed by participating insurance companies under the variable annuity contracts or variable life insurance policies. Such fees or charges, if any, may affect the return you may realize with respect to your investments. Ask your representative for more complete information. Please consider a fund’s objectives, risks and charges and expenses, and read the prospectus carefully before investing. The prospectus contains this and other information about the Fund.
This material is not authorized for distribution to prospective investors unless preceded or accompanied by a current Prospectus or summary prospectus, if applicable. Investors should consider a Fund’s objective, risks, and charges and expenses, and read the summary prospectus, if available, and/or the Prospectus carefully before investing or sending money. The summary prospectus, if available, and the Prospectus contain this and other information about a Fund and may be obtained from your Authorized Institution or from Goldman, Sachs & Co. by calling 1-800-621-2550.
This report is prepared for the general information of contract owners and is not an offer of shares of the Goldman Sachs Variable Insurance Trust: Goldman Sachs Strategic Growth Fund.
Goldman, Sachs & Co. is the distributor of the Goldman Sachs Funds and the Goldman Sachs Variable Insurance Trust Funds.
©2016 Goldman Sachs. All rights reserved.
VITGRWSAR-16/58892-TMPL-08/2016/34.6K
Goldman
Sachs Variable Insurance Trust
Goldman Sachs
Strategic Income Fund
Semi-Annual Report
June 30, 2016

GOLDMAN SACHS VARIABLE INSURANCE TRUST STRATEGIC INCOME FUND
INVESTMENT OBJECTIVE
The Fund seeks a total return comprised of income and capital appreciation.
Portfolio Management Discussion and Analysis
Below, the Goldman Sachs Fixed Income Portfolio Management Team discusses the Goldman Sachs Variable Insurance Trust — Goldman Sachs Strategic Income Fund’s (the “Fund”) performance and positioning for the six-month period ended June 30, 2016 (the “Reporting Period”).
How did the Fund perform during the Reporting Period?
During the Reporting Period, the Fund’s Advisor, Institutional and Service Shares generated cumulative total returns of –1.45%, –1.29% and –1.31%, respectively. These returns compare to the 0.31% cumulative total return of the Fund’s benchmark, the Bank of America Merrill Lynch U.S. Dollar Three-Month LIBOR Constant Maturity Index (the “LIBOR Index”), during the same period.
We note that the Fund’s benchmark being the LIBOR Index is a means of emphasizing that the Fund has an unconstrained strategy. That said, this Fund employs a benchmark agnostic strategy and thus comparisons to a benchmark index are not particularly relevant.
What economic and market factors most influenced the Fund during the Reporting Period?
When the Reporting Period began, spread (or non-government bond) sectors retreated, selling off significantly from January to mid-February 2016. The selloff was driven by an increase in a number of perceived risks, such as slowing Chinese economic activity, the possibility of persistent oil oversupply and deteriorating corporate bond fundamentals, as the U.S. credit cycle entered its later stage. Some of these risks eased in the second half of the first calendar quarter, as economic news from China improved, U.S. oil production showed signs of slowing, and commodity prices appeared to stabilize. As a result, spread sectors largely retraced their losses by the end of March 2016. Global central banks remained accommodative. The Bank of Japan, in a surprise move at its January 2016 policy meeting, introduced a –0.1% interest rate, reaffirming its commitment to achieving a 2% inflation target. The European Central Bank shifted its focus from currency depreciation to credit creation by leaving the deposit rate unchanged, expanding its asset purchase program to include purchases of non-financial corporate credit and announcing a new series of easing measures in the form of targeted long-term refinancing operations (“TLTRO II”). (TLTRO II is designed to offer attractive long-term funding conditions to Eurozone banks to further ease private sector credit conditions and to stimulate credit creation.) In the U.S., the Federal Reserve (the “Fed”) left interest rates unchanged and reduced its forecast to two rate hikes in 2016 from four. After a sustained period of appreciation, the U.S. dollar weakened during the first quarter of 2016 due to generally tighter financial conditions, mixed U.S. economic data and the Fed’s more dovish commentary. (Dovish language tends to suggest lower interest rates.)
During the second quarter of 2016, spread sectors rallied on stabilization of commodities prices as well as on declining market fears about slowing Chinese economic growth and the potential for a U.S. economic recession. Global interest rates broadly declined amid continued accommodative monetary policy from the world’s central banks. In the U.S., minutes from the Fed’s April 2016 policy meeting, released in mid-May 2016, suggested Fed policymakers might raise interest rates in June 2016 if U.S. economic growth strengthened, employment data firmed and inflation rose toward the Fed’s 2% target. In early June 2016, however, the release of weak May 2016 employment data raised broad market concerns about the health of the U.S. economy, pushing down consensus expectations of a Fed rate hike. Indeed, the Fed did not raise interest rates at its June 2016 policy meeting. In the last week of June 2016, the unexpected “leave” vote in the U.K. referendum on membership in the European Union, popularly known as Brexit, renewed investor uncertainty about the path of global economic growth. Spread sectors withstood the Brexit vote relatively well, selling off at first but then recovering most of their losses afterwards. The U.S. dollar strengthened versus most global currencies during the second calendar quarter, though it weakened against the Japanese yen.
For the Reporting Period overall, sovereign emerging markets debt and high yield corporate bonds outperformed U.S Treasuries, followed at some distance by asset-backed securities and investment grade corporate bonds. Commercial mortgage-backed securities, agency securities and mortgage-backed securities generally performed in line with U.S. Treasuries. The U.S. Treasury yield curve, or spectrum of maturities, flattened during the Reporting Period as yields of six months and longer fell. The yield on the bellwether 10-year U.S. Treasury dropped approximately 80 basis points to end the Reporting Period at 1.47%. (A basis point is
1
GOLDMAN SACHS VARIABLE INSURANCE TRUST STRATEGIC INCOME FUND
1/100th of a percentage point. A flattening yield curve is one wherein the differential in yields between longer-term and shorter-term maturities narrows.)
What key factors were responsible for the Fund’s performance during the Reporting Period?
Our country, duration and currency strategies detracted from the Fund’s performance during the Reporting Period. Within our country strategy, the Fund was hurt by its overweight in European peripheral nations, such as Italy and Spain. In addition, as U.S. interest rates fell during the Reporting Period, the Fund’s overweight in Canada versus its underweight in the U.S. detracted from results. This was offset somewhat by the positive contribution of the Fund’s overweight in Australia as well as by certain of its relative value trades wherein the Fund held overweight positions in Europe versus underweight positions in other developed markets. (A relative value trade is the simultaneous purchase of one security and sale of a related security as a unit.)
Within our duration strategy, the Fund was hampered by its short duration position. Duration is a measure of sensitivity to changes in interest rates.
Within our currency strategy, the Fund’s short positions in the euro and Japanese yen detracted from performance. Its long position in the Mexican peso also dampened results. On the positive side, a long position in the Russian ruble added to the Fund’s returns.
What fixed income market sectors most significantly affected Fund performance?
During the Reporting Period, the Fund maintained an overweight in corporate bonds, which hurt performance as riskier asset classes overall experienced heightened volatility. In addition, individual issue selection among high yield corporate bonds, most notably energy-related issues, detracted, especially in early 2016 when crude oil prices fell and the broad corporate bond market sold off.
The Fund benefited from individual issue selection in the securitized sector, particularly among mortgage-backed securities. Individual issue selection within emerging markets debt, including Venezuelan external bonds and Brazilian local bonds, also bolstered returns.
Did the Fund’s duration and yield curve positioning strategy help or hurt its results during the Reporting Period?
The combined effect of the Fund’s tactical duration and yield curve positioning detracted from its performance during the Reporting Period. More specifically, the Fund was hurt by its short duration position on the U.S. Treasury yield curve as interest rates fell.
How did the Fund use derivatives and similar instruments during the Reporting Period?
We used derivatives and similar instruments for the efficient management of the Fund. These derivatives and similar instruments allowed us to manage interest rate, credit and currency risks more effectively by allowing us both to hedge and to apply active investment views with greater versatility and to afford greater risk management precision than we would otherwise be able to implement.
During the Reporting Period, we used interest rate and bond exchange traded futures contracts to implement duration and country strategies within the Fund, especially in the U.S. and Eurozone markets. Currency transactions were carried out using primarily over-the-counter (“OTC”) spot and forward foreign exchange contracts as well as by purchasing OTC options. Currency transactions were used as we sought both to enhance returns and to hedge the Fund’s portfolio against currency exchange rate fluctuations. We also employed forward sales contracts to implement long and short views within our currency strategy. The Fund also employed credit default swaps to manage exposure to fluctuations in credit spreads (or the differential in yields between Treasury securities and non-Treasury securities that are identical in all respects except for quality rating). Interest rate swaps were used to manage exposure to fluctuations in interest rates.
During the Reporting Period, our currency strategy, which is implemented through derivatives, detracted from performance. Our country and duration strategies, which employ derivatives to implement interest rate views, also detracted from results. In addition, credit default swaps used to manage the Fund’s exposure to credit spreads had a negative impact on performance during the Reporting Period.
2
GOLDMAN SACHS VARIABLE INSURANCE TRUST STRATEGIC INCOME FUND
Were there any notable changes in the Fund’s weightings during the Reporting Period?
The Fund is a broadly diversified, multi-sector portfolio designed to seek to provide total return opportunities from across the fixed income spectrum, including government, securitized, corporate credit and emerging market fixed income sectors. At the beginning of the Reporting Period, the Fund had modest exposure to corporate credit. However, as crude oil prices fell and the corporate bond sold off in early 2016, we reduced the Fund’s exposure. Within our duration strategy, we reduced the Fund’s short duration position as we believed the Brexit vote made it less likely that the Fed would raise interest rates in the near term.
How was the Fund positioned at the end of the Reporting Period?
At the end of the Reporting Period, the Fund held a modestly short duration position on the U.S. Treasury yield curve. Overall, the Fund was positioned to take advantage of potential dislocations within the global environment via our currency and country strategies. Within corporate credit, the Fund was underweight high yield corporate bonds and emerging markets debt. It was rather neutrally positioned in investment grade corporate bonds. In addition, at the end of the Reporting Period, the Fund maintained overweight exposure to securities that we believed offered attractive spreads, such as certain assets within the securitized sector.
What is the Fund’s tactical view and strategy for the months ahead?
At the end of the Reporting Period, we expected global economic growth to remain slow. We believed the impact of Brexit would take time to play out, with much of the effects, in our view, coming during 2017. Near term, we expect Brexit to add downside risk to the U.K. and European outlook. In terms of the U.K., we have reduced our forecast for 2016 economic growth from 1.8% to 1.2% and our 2017 forecast down from 2.0% to 0.5%. We also believe there is the potential for the U.K. to experience a recession during the next one to two years. In terms of the European Union, we have revised our 2016 economic growth forecast down from 1.4% to 1.3% and our 2017 forecast down from 1.2% to 0.6%. Our forecasts for the U.S., Japan and China remain unchanged, as we expect Brexit to have limited effects on these economies unless there is broader contagion. We believe the U.S. economy could see some near-term improvement as a number of headwinds fade, including the oil price-driven decline in business investment. That said, we see a growing risk of a U.S. recession in 2017 as tight labor markets put pressure on corporate profits. At the end of the Reporting Period, we generally expected inflation to stay low across developed economies.
3
GOLDMAN SACHS VARIABLE INSURANCE TRUST STRATEGIC INCOME FUND
Index Definitions
The BoA Merrill Lynch U.S. Dollar Three-Month LIBOR Constant Maturity Index is based on the assumed purchase of a synthetic instrument having three months to maturity and with a coupon equal to the closing quote for three-month LIBOR. That issue is sold the following day (priced at a yield equal to the current day closing three-month LIBOR rate) and is rolled into a new three-month instrument. The index, therefore, will always have a constant maturity equal to exactly three months.
4
FUND BASICS
Strategic Income Fund
as of June 30, 2016
STANDARDIZED TOTAL RETURNS1
| For the period ended 6/30/16 | One Year | Since Inception | Inception Date | |||||||
| Institutional | -2.10 | % | -1.62 | % | 4/14/14 | |||||
| Service | -2.37 | -1.88 | 4/14/14 | |||||||
| Advisor | -2.45 | -2.02 | 4/14/14 | |||||||
| 1 | The Standardized Total Returns are average annual total returns as of the most recent calendar quarter-end. They assume reinvestment of all distributions at net asset value (“NAV”). Because Institutional, Service and Advisor Shares do not involve a sales charge, such a charge is not applied to their Standardized Total Returns. |
Total return figures in the above chart represent past performance and do not indicate future results, which will vary. The investment return and principal value of an investment will fluctuate and, therefore, an investor’s shares, when redeemed, may be worth more or less than their original cost. Current performance may be lower or higher than the total return figures in the above chart. Please visit www.GSAMFUNDS.com to obtain the most recent month-end returns. Performance reflects fee waivers and/or expense limitations in effect during the periods shown. In their absence, performance would be reduced.
EXPENSE RATIOS2
| Net Expense Ratio (Current) | Gross Expense Ratio (Before Waivers) | |||||||
| Institutional | 0.87 | % | 1.69 | % | ||||
| Service | 1.12 | 1.96 | ||||||
| Advisor | 1.27 | 2.13 | ||||||
| 2 | The expense ratios of the Fund, both current (net of any fee waivers or expense limitations) and before waivers (gross of any fee waivers or expense limitations) are as set forth above according to the most recent publicly available Prospectuses for the Fund and may differ from the expense ratios disclosed in the Financial Highlights in this report. Pursuant to a contractual arrangement, the Fund’s waivers and/or expense limitations will remain in place through at least April 29, 2017 and prior to such date the Investment Adviser may not terminate the arrangements without the approval of the Fund’s Board of Trustees. If these arrangements are discontinued in the future, the expense ratios may change without shareholder approval. |
5
FUND BASICS
FUND COMPOSITION3
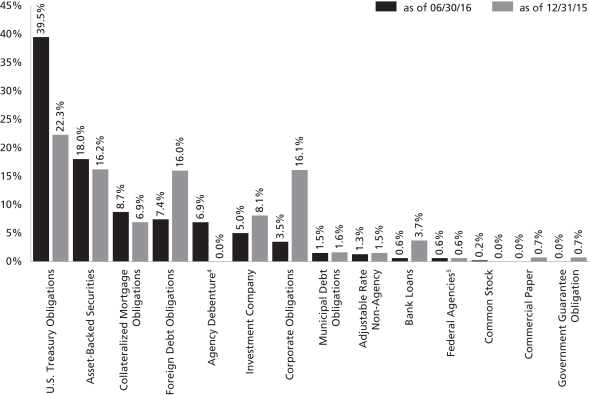
| 3 | The percentage shown for each investment category reflects the value of investments in that category as a percentage of net assets. Underlying sector allocations of Exchange Traded Funds and Investment Companies held by the Fund are not reflected in the graph above. Figures in the graph may not sum to 100% due to the exclusion of other assets and liabilities. The graph depicts the Fund’s investments but may not represent the Fund’s market exposure due to the exclusion of certain derivatives, if any, as listed in the Additional Investment Information section of the Schedule of Investments. |
| 4 | “Agency Debenture” include agency securities offered by companies such as Federal Home Loan Bank (“FHLB”) which operate under a government charter. While they are required to report to a government regulator, their assets are not explicitly guaranteed by the government and they otherwise operate like any other publicly traded company. |
| 5 | “Federal Agencies” are mortgage-backed securities guaranteed by the Government National Mortgage Association (“GNMA”), Federal National Mortgage Association (“FNMA”) or Federal Home Loan Mortgage Corp. (“FHLMC”). GNMA instruments are backed by the full faith and credit of the United States Government. |
6
GOLDMAN SACHS VARIABLE INSURANCE TRUST STRATEGIC INCOME FUND
Schedule of Investments
June 30, 2016 (Unaudited)
Shares | Description | Value | ||||||
| Common Stock – 0.2% | ||||||||
| Energy – 0.2% |
| ||||||
| 5,834 | Magnum Hunter Resources Corp.* | $ | 63,766 | |||||
| (Cost $58,340) | ||||||||
|
| |||||||
| Principal Amount | Interest Rate | Maturity Date | Value | |||||||||||
| Corporate Obligations – 3.5% | ||||||||||||||
| Airlines(a)(b) – 0.1% |
| ||||||||||||
| Air Canada |
| ||||||||||||
| $ | 20,000 | 6.750 | % | 10/01/19 | $ | 20,475 | ||||||||
|
| |||||||||||||
| Banks(a)(c) – 0.6% |
| ||||||||||||
| American Express Co. |
| ||||||||||||
| 75,000 | 6.800 | 09/01/66 | 74,812 | |||||||||||
| Citigroup Capital XIII |
| ||||||||||||
| 997 | 7.008 | 10/30/40 | 25,992 | |||||||||||
| PNC Preferred Funding Trust II(b) |
| ||||||||||||
| 100,000 | 1.875 | 03/29/49 | 88,000 | |||||||||||
|
| |||||||||||||
| 188,804 | ||||||||||||||
|
| |||||||||||||
| Consumer Services – 0.2% |
| ||||||||||||
| MGM Resorts International |
| ||||||||||||
| 50,000 | 8.625 | 02/01/19 | 56,313 | |||||||||||
|
| |||||||||||||
| Energy – 0.7% |
| ||||||||||||
| Antero Resources Corp.(a) |
| ||||||||||||
| 25,000 | 5.375 | 11/01/21 | 24,438 | |||||||||||
| Laredo Petroleum, Inc.(a) |
| ||||||||||||
| 25,000 | 5.625 | 01/15/22 | 23,500 | |||||||||||
| Petrobras Global Finance BV |
| ||||||||||||
| 20,000 | 4.875 | 03/17/20 | 18,629 | |||||||||||
| 80,000 | 8.375 | 05/23/21 | 82,400 | |||||||||||
| Petroleos de Venezuela SA |
| ||||||||||||
| 30,000 | 9.000 | 11/17/21 | 13,026 | |||||||||||
| 70,000 | 6.000 | 05/16/24 | 24,325 | |||||||||||
| 70,000 | 6.000 | 11/15/26 | 24,279 | |||||||||||
|
| |||||||||||||
| 210,597 | ||||||||||||||
|
| |||||||||||||
| Food & Beverage – 0.2% |
| ||||||||||||
| Constellation Brands, Inc. |
| ||||||||||||
| 50,000 | 7.250 | 05/15/17 | 52,312 | |||||||||||
|
| |||||||||||||
| Media – 0.2% |
| ||||||||||||
| Time Warner Cable, Inc. |
| ||||||||||||
| 25,000 | 5.850 | 05/01/17 | 25,879 | |||||||||||
| Univision Communications, Inc.(a)(b) |
| ||||||||||||
| 37,000 | 8.500 | 05/15/21 | 38,619 | |||||||||||
|
| |||||||||||||
| 64,498 | ||||||||||||||
|
| |||||||||||||
| Noncaptive-Financial(a) – 0.2% |
| ||||||||||||
| Nationstar Mortgage LLC/Nationstar Capital Corp. |
| ||||||||||||
| 50,000 | 6.500 | 08/01/18 | 48,500 | |||||||||||
| Speedy Cash Intermediate Holdings Corp.(b) |
| ||||||||||||
| 25,000 | 10.750 | 05/15/18 | 14,344 | |||||||||||
|
| |||||||||||||
| 62,844 | ||||||||||||||
|
| |||||||||||||
| Corporate Obligations – (continued) | ||||||||||||||
| Pharmaceuticals, Biotechnology & Life Sciences(a) – 0.3% |
| ||||||||||||
| Actavis Funding SCS |
| ||||||||||||
| $ | 50,000 | 3.800 | % | 03/15/25 | $ | 52,040 | ||||||||
| 25,000 | 4.750 | 03/15/45 | 26,217 | |||||||||||
|
| |||||||||||||
| 78,257 | ||||||||||||||
|
| |||||||||||||
| Pipelines(c) – 0.6% |
| ||||||||||||
| Enterprise Products Operating LLC Series A(a) |
| ||||||||||||
| 75,000 | 8.375 | 08/01/66 | 66,079 | |||||||||||
| Sabine Pass LNG LP |
| ||||||||||||
| 100,000 | 7.500 | 11/30/16 | 101,750 | |||||||||||
|
| |||||||||||||
| 167,829 | ||||||||||||||
|
| |||||||||||||
| Wireless Telecommunications – 0.2% |
| ||||||||||||
| Sprint Communications, Inc. |
| ||||||||||||
| 50,000 | 9.125 | 03/01/17 | 51,125 | |||||||||||
|
| |||||||||||||
| Wirelines Telecommunications(a) – 0.2% |
| ||||||||||||
| Windstream Services LLC |
| ||||||||||||
| 50,000 | 7.750 | 10/15/20 | 49,000 | |||||||||||
|
| |||||||||||||
| TOTAL CORPORATE OBLIGATIONS | ||||||||||||||
| (Cost $1,019,165) | $ | 1,002,054 | ||||||||||||
|
| |||||||||||||
| Mortgage-Backed Obligations – 10.6% | ||||||||||||||
| Adjustable Rate Non-Agency(c) – 1.3% |
| ||||||||||||
| Alternative Loan Trust Series 2005-51, Class 2A1(a) |
| ||||||||||||
| $ | 50,820 | 0.748 | % | 11/20/35 | $ | 36,923 | ||||||||
| Alternative Loan Trust Series 2006-HY11, Class A1(a) |
| ||||||||||||
| 61,859 | 0.573 | 06/25/36 | 46,358 | |||||||||||
| Deutsche Alt-A Securities Mortgage Loan Trust | | ||||||||||||
| 40,462 | 0.593 | 07/25/47 | 33,454 | |||||||||||
| HomeBanc Mortgage Trust Series 2006-1, Class 3A2(a) |
| ||||||||||||
| 109,614 | 2.719 | 04/25/37 | 68,919 | |||||||||||
| IndyMac INDA Mortgage Loan Trust Series 2006-AR2, | | ||||||||||||
| 58,304 | 2.962 | 09/25/36 | 49,201 | |||||||||||
| JP Morgan Alternative Loan Trust Series 2006-A5, Class 1A1(a) |
| ||||||||||||
| 45,707 | 0.613 | 10/25/36 | 37,480 | |||||||||||
| Lehman XS Trust Series 2005-7N, Class 1A1A(a) |
| ||||||||||||
| 49,076 | 0.723 | 12/25/35 | 43,131 | |||||||||||
| Lehman XS Trust Series 2006-14N, Class 1A1A(a) |
| ||||||||||||
| 76,924 | 0.643 | 09/25/46 | 64,316 | |||||||||||
|
| |||||||||||||
| 379,782 | ||||||||||||||
|
| |||||||||||||
| Collateralized Mortgage Obligations – 8.7% |
| ||||||||||||
| Agency Multi-Family – 3.3% |
| ||||||||||||
| FHLMC Multifamily Structured Pass-Through Certificates | | ||||||||||||
| 400,000 | 2.373 | 05/25/22 | 415,732 | |||||||||||
| FHLMC Multifamily Structured Pass-Through Certificates | | ||||||||||||
| 500,000 | 3.320 | 02/25/23 | 548,529 | |||||||||||
|
| |||||||||||||
| 964,261 | ||||||||||||||
|
| |||||||||||||
| The accompanying notes are an integral part of these financial statements. | 7 |
GOLDMAN SACHS VARIABLE INSURANCE TRUST STRATEGIC INCOME FUND
Schedule of Investments (continued)
June 30, 2016 (Unaudited)
| Principal Amount | Interest Rate | Maturity Date | Value | |||||||||||
| Mortgage-Backed Obligations – (continued) | ||||||||||||||
| Interest Only(d) – 3.5% |
| ||||||||||||
| FHLMC Series 2014-4314, Class SE(a) |
| ||||||||||||
| $ | 599,514 | 5.608 | % | 03/15/44 | $ | 101,906 | ||||||||
| FHLMC Series 2014-4320, Class SD(a) |
| ||||||||||||
| 106,064 | 5.658 | 07/15/39 | 18,627 | |||||||||||
| FNMA Series 2011-124, Class SC |
| ||||||||||||
| 546,476 | 6.097 | 12/25/41 | 102,081 | |||||||||||
| FNMA Series 2013-121, Class SA |
| ||||||||||||
| 886,213 | 5.647 | 12/25/43 | 162,647 | |||||||||||
| FNMA Series 2014-87, Class MS |
| ||||||||||||
| 488,583 | 5.797 | 01/25/45 | 90,727 | |||||||||||
| FNMA Series 2015-81, Class SA |
| ||||||||||||
| 368,717 | 5.247 | 11/25/45 | 58,194 | |||||||||||
| GNMA Series 2010-101, Class S(a) |
| ||||||||||||
| 861,848 | 5.552 | 08/20/40 | 138,746 | |||||||||||
| GNMA Series 2010-20, Class SE(a) |
| ||||||||||||
| 471,760 | 5.802 | 02/20/40 | 78,079 | |||||||||||
| GNMA Series 2010-31, Class SA(a) |
| ||||||||||||
| 147,375 | 5.302 | 03/20/40 | 22,312 | |||||||||||
| GNMA Series 2013-152, Class SG(a) |
| ||||||||||||
| 122,267 | 5.702 | 06/20/43 | 19,669 | |||||||||||
| GNMA Series 2013-181, Class SA(a) |
| ||||||||||||
| 504,539 | 5.652 | 11/20/43 | 83,368 | |||||||||||
| GNMA Series 2015-110, Class MS(a) |
| ||||||||||||
| 561,022 | 5.262 | 08/20/45 | 80,378 | |||||||||||
| GNMA Series 2015-159, Class HS(a) |
| ||||||||||||
| 421,463 | 5.752 | 11/20/45 | 66,311 | |||||||||||
|
| |||||||||||||
| 1,023,045 | ||||||||||||||
|
| |||||||||||||
| Regular Floater(c) – 1.9% |
| ||||||||||||
| Aire Valley Mortgages PLC Series 2006-1X, Class 2A1 |
| ||||||||||||
| EUR | 58,922 | 0.036 | 09/20/66 | 63,093 | ||||||||||
| Alternative Loan Trust Series 2005-36, Class 2A1A(a) |
| ||||||||||||
| $ | 74,984 | 0.763 | 08/25/35 | 51,857 | ||||||||||
| Connecticut Avenue Securities Series 2014-C03, Class 1M1(a) |
| ||||||||||||
| 9,557 | 1.653 | 07/25/24 | 9,556 | |||||||||||
| GreenPoint Mortgage Funding Trust Series 2006-AR1, | | ||||||||||||
| 413,693 | 0.743 | 02/25/36 | 351,515 | |||||||||||
| Morgan Stanley Mortgage Loan Trust Series 2006-16AX, | | ||||||||||||
| 156,543 | 0.623 | 11/25/36 | 62,703 | |||||||||||
|
| |||||||||||||
| 538,724 | ||||||||||||||
|
| |||||||||||||
| | TOTAL COLLATERALIZED MORTGAGE OBLIGATIONS | | $ | 2,526,030 | ||||||||||
|
| |||||||||||||
| Federal Agency – 0.6% |
| ||||||||||||
| FNMA – 0.6% |
| ||||||||||||
| $ | 149,358 | 6.000 | % | 09/01/36 | $ | 171,299 | ||||||||
|
| |||||||||||||
| TOTAL MORTGAGE-BACKED OBLIGATIONS | ||||||||||||||
| (Cost $3,013,025) | $ | 3,077,111 | ||||||||||||
|
| |||||||||||||
| Agency Debenture(c) – 6.9% | ||||||||||||||
| FHLB | ||||||||||||||
| $ | 2,000,000 | 0.554 | % | 10/27/17 | $ | 1,999,359 | ||||||||
|
| |||||||||||||
| TOTAL AGENCY DEBENTURES | ||||||||||||||
| (Cost $2,000,000) | $ | 1,999,359 | ||||||||||||
|
| |||||||||||||
| Asset-Backed Securities – 18.0% | ||||||||||||||
| Collateralized Loan Obligations – 13.4%(b)(c) |
| ||||||||||||
| Aberdeen Loan Funding Ltd. Series 2008-1A, Class A(a) |
| ||||||||||||
| $ | 55,055 | 1.287 | % | 11/01/18 | $ | 54,752 | ||||||||
| Acis CLO Ltd. Series 2014-4A, Class ACOM(a) |
| ||||||||||||
| 150,000 | 2.122 | 05/01/26 | 145,455 | |||||||||||
| Anchorage Capital CLO IV Ltd. Series 2014-4A, Class A1A(a) |
| ||||||||||||
| 250,000 | 2.084 | 07/28/26 | 248,540 | |||||||||||
| Crown Point CLO III Ltd. Series 2015-3A, Class ACOM(a) |
| ||||||||||||
| 250,000 | 0.000 | 12/31/27 | 244,950 | |||||||||||
| Halcyon Loan Advisors Funding Ltd. Series 2014-1A, Class A1(a) |
| ||||||||||||
| 250,000 | 2.163 | 04/18/26 | 245,155 | |||||||||||
| Halcyon Loan Advisors Funding Ltd. Series 2015-2A, Class A(a) |
| ||||||||||||
| 250,000 | 2.028 | 07/25/27 | 240,850 | |||||||||||
| Hildene CLO II Ltd. Series 2014-2A, Class A(a) |
| ||||||||||||
| 250,000 | 2.083 | 07/19/26 | 246,506 | |||||||||||
| Madison Park Funding X Ltd. Series 2012-10A, Class A1A(a) |
| ||||||||||||
| 250,000 | 2.004 | 01/20/25 | 249,653 | |||||||||||
| MidOcean Credit CLO III Series 2014-3A, Class A(a) |
| ||||||||||||
| 250,000 | 2.095 | 07/21/26 | 246,723 | |||||||||||
| Monroe Capital BSL CLO Ltd. Series 2015-1A, Class ACOM |
| ||||||||||||
| 200,000 | 2.207 | 05/22/27 | 196,260 | |||||||||||
| Ocean Trails CLO IV Series 2013-4A, Class A(a) |
| ||||||||||||
| 250,000 | 1.927 | 08/13/25 | 246,824 | |||||||||||
| OCP CLO Ltd. Series 2015-8A, Class A1(a) |
| ||||||||||||
| 250,000 | 2.163 | 04/17/27 | 246,852 | |||||||||||
| OFSI Fund VI Ltd. Series 2014-6A, Class A1(a) |
| ||||||||||||
| 200,000 | 1.658 | 03/20/25 | 195,064 | |||||||||||
| OFSI Fund VII Ltd. Series 2014-7A, Class ACOM |
| ||||||||||||
| 100,000 | 0.000 | 10/18/26 | 97,860 | |||||||||||
| Regatta IV Funding Ltd. Series 2014-1A, Class ACOM(a) |
| ||||||||||||
| 250,000 | 0.000 | 07/25/26 | 246,325 | |||||||||||
| Trinitas CLO II Ltd. Series 2014-2A, Class ACOM(a) |
| ||||||||||||
| 250,000 | 0.000 | 07/15/26 | 240,375 | |||||||||||
| Trinitas CLO III Ltd. Series 2015-3A, Class A2(a) |
| ||||||||||||
| 150,000 | 2.138 | 07/15/27 | 147,398 | |||||||||||
| Wasatch Ltd. Series 2006-1A, Class A1B |
| ||||||||||||
| 229,893 | 0.866 | 11/14/22 | 223,013 | |||||||||||
| Z Capital Credit Partners CLO Ltd. Series 2015-1A, | | ||||||||||||
| 150,000 | 0.000 | 07/16/27 | 146,130 | |||||||||||
|
| |||||||||||||
| 3,908,685 | ||||||||||||||
|
| |||||||||||||
| Home Equity(a) – 1.5% |
| ||||||||||||
| Citigroup Mortgage Loan Trust, Inc. Series 2006-WFH1, | | ||||||||||||
| 100,000 | 0.853 | 01/25/36 | 83,687 | |||||||||||
|
| |||||||||||||
| 8 | The accompanying notes are an integral part of these financial statements. |
GOLDMAN SACHS VARIABLE INSURANCE TRUST STRATEGIC INCOME FUND
| Principal Amount | Interest Rate | Maturity Date | Value | |||||||||||
| Asset-Backed Securities – (continued) | ||||||||||||||
| Home Equity(a) – (continued) |
| ||||||||||||
| Credit-Based Asset Servicing and Securitization LLC | | ||||||||||||
| $ | 11,482 | 4.070 | % | 12/25/35 | $ | 11,510 | ||||||||
| Credit-Based Asset Servicing and Securitization LLC | | ||||||||||||
| 25,000 | 4.070 | 12/25/35 | 23,619 | |||||||||||
| GSAMP Trust Series 2006-HE8, Class A2C(c) |
| ||||||||||||
| 46,982 | 0.623 | 01/25/37 | 37,769 | |||||||||||
| Lehman XS Trust Series 2007-3, Class 1BA2(c) |
| ||||||||||||
| 48,288 | 1.478 | 03/25/37 | 37,054 | |||||||||||
| Saxon Asset Securities Trust Series 2007-2, Class A2C(c) |
| ||||||||||||
| 86,634 | 0.693 | 05/25/47 | 60,201 | |||||||||||
| Structured Asset Securities Corp. Mortgage Loan Trust | | ||||||||||||
| 100,000 | 0.923 | 05/25/35 | 87,375 | |||||||||||
| VOLT XXV LLC Series 2015-NPL8, Class A1(b)(e) |
| ||||||||||||
| 78,594 | 3.500 | 06/26/45 | 78,254 | |||||||||||
|
| |||||||||||||
| 419,469 | ||||||||||||||
|
| |||||||||||||
| Student Loans(c) – 3.1% |
| ||||||||||||
| Access Group, Inc. Series 2006-1, Class A2(a) |
| ||||||||||||
| 13,950 | 0.772 | 08/25/23 | 13,886 | |||||||||||
| Access Group, Inc. Series 2015-1, Class A(a)(b) |
| ||||||||||||
| 83,134 | 1.153 | 07/25/56 | 81,271 | |||||||||||
| Bank of America Student Loan Trust Series 2010-1A, Class A(a)(b) |
| ||||||||||||
| 55,425 | 1.438 | 02/25/43 | 54,609 | |||||||||||
| Goal Capital Funding Trust Series 2006-1, Class A3 |
| ||||||||||||
| 7,441 | 0.782 | 11/25/26 | 7,430 | |||||||||||
| Scholar Funding Trust Series 2010-A, Class A(b) |
| ||||||||||||
| 57,573 | 1.384 | 10/28/41 | 56,420 | |||||||||||
| SLM Student Loan Trust Series 2003-14, Class A5 |
| ||||||||||||
| 35,520 | 0.868 | 01/25/23 | 35,352 | |||||||||||
| SLM Student Loan Trust Series 2006-9, Class A4(a) |
| ||||||||||||
| 7,077 | 0.708 | 10/25/22 | 7,071 | |||||||||||
| SLM Student Loan Trust Series 2007-1, Class A5(a) |
| ||||||||||||
| 250,000 | 0.728 | 01/26/26 | 243,440 | |||||||||||
| SLM Student Loan Trust Series 2008-5, Class A4(a) |
| ||||||||||||
| 95,904 | 2.338 | 07/25/23 | 95,933 | |||||||||||
| SLM Student Loan Trust Series 2012-3, Class A(a) |
| ||||||||||||
| 141,246 | 1.103 | 12/26/25 | 136,457 | |||||||||||
| SunTrust Student Loan Trust Series 2006-1A, Class A4(a)(b) |
| ||||||||||||
| 197,386 | 0.824 | 10/28/37 | 180,878 | |||||||||||
|
| |||||||||||||
| 912,747 | ||||||||||||||
|
| |||||||||||||
| TOTAL ASSET-BACKED SECURITIES | ||||||||||||||
| (Cost $5,262,402) | $ | 5,240,901 | ||||||||||||
|
| |||||||||||||
| Foreign Debt Obligations – 7.4% | ||||||||||||||
| Sovereign – 7.4% |
| ||||||||||||
| Brazilian Government International Bond(f) |
| ||||||||||||
| BRL | 239,000 | 6.000 | % | 08/15/50 | $ | 213,412 | ||||||||
|
| |||||||||||||
| Foreign Debt Obligations – (continued) | ||||||||||||||
| Sovereign – (continued) |
| ||||||||||||
| Dominican Republic International Bond |
| ||||||||||||
| $ | 100,000 | 5.875 | % | 04/18/24 | $ | 104,250 | ||||||||
| 100,000 | 5.500 | 01/27/25 | 101,750 | |||||||||||
| Indonesia Government International Bond |
| ||||||||||||
| 200,000 | 4.125 | 01/15/25 | 208,000 | |||||||||||
| Italy Buoni Poliennali Del Tesoro |
| ||||||||||||
| EUR | 160,505 | 2.100 | 09/15/16 | 179,292 | ||||||||||
| 376,196 | 2.350 | 09/15/19 | 453,513 | |||||||||||
| 80,358 | 2.350 | (b) | 09/15/24 | 102,429 | ||||||||||
| Mexico Government International Bond Series M |
| ||||||||||||
| MXN | 1,560,200 | 7.750 | 11/23/34 | 97,462 | ||||||||||
| Mexico Government International Bond Series M 10 |
| ||||||||||||
| 644,300 | 7.750 | 12/14/17 | 36,896 | |||||||||||
| Spain Government Inflation Linked Bond(b) |
| ||||||||||||
| EUR | 380,331 | 0.550 | 11/30/19 | 435,502 | ||||||||||
| Venezuela Government International Bond |
| ||||||||||||
| $ | 10,000 | 7.000 | 12/01/18 | 5,000 | ||||||||||
| 40,000 | 7.750 | 10/13/19 | 17,900 | |||||||||||
| 10,000 | 12.750 | 08/23/22 | 5,100 | |||||||||||
| 10,000 | 9.000 | 05/07/23 | 4,262 | |||||||||||
| 100,000 | 8.250 | 10/13/24 | 41,750 | |||||||||||
| 10,000 | 7.650 | 04/21/25 | 4,075 | |||||||||||
| 30,000 | 11.750 | 10/21/26 | 14,250 | |||||||||||
| 70,000 | 9.250 | 09/15/27 | 33,775 | |||||||||||
| 130,000 | 9.250 | 05/07/28 | 55,900 | |||||||||||
| 50,000 | 11.950 | 08/05/31 | 23,500 | |||||||||||
| 60,000 | 9.375 | 01/13/34 | 25,950 | |||||||||||
|
| |||||||||||||
| 2,163,968 | ||||||||||||||
|
| |||||||||||||
| TOTAL FOREIGN DEBT OBLIGATIONS | ||||||||||||||
| (Cost $2,203,171) | $ | 2,163,968 | ||||||||||||
|
| |||||||||||||
| Municipal Debt Obligations(a) – 1.5% | ||||||||||||||
| Puerto Rico – 1.5% |
| ||||||||||||
| Puerto Rico Commonwealth Aqueduct & Sewer Authority RB | | ||||||||||||
| $ | 5,000 | 6.000 | % | 07/01/44 | $ | 3,500 | ||||||||
| Puerto Rico Commonwealth Aqueduct & Sewer Authority RB | | ||||||||||||
| 10,000 | 5.500 | 07/01/28 | 7,075 | |||||||||||
| 5,000 | 5.000 | 07/01/33 | 3,350 | |||||||||||
| 5,000 | 5.125 | 07/01/37 | 3,350 | |||||||||||
| 10,000 | 5.750 | 07/01/37 | 7,000 | |||||||||||
| 5,000 | 5.250 | 07/01/42 | 3,350 | |||||||||||
| Puerto Rico Commonwealth GO Bonds Series 2014 A |
| ||||||||||||
| 125,000 | 8.000 | 07/01/35 | 83,281 | |||||||||||
| Puerto Rico Commonwealth GO Refunding for Public | | ||||||||||||
| 20,000 | 5.500 | 07/01/32 | 12,950 | |||||||||||
| Puerto Rico Sales Tax Financing Corp. RB First Subseries 2009 A |
| ||||||||||||
| 20,000 | 5.500 | 08/01/28 | 8,800 | |||||||||||
| 45,000 | 6.000 | 08/01/42 | 20,137 | |||||||||||
|
| |||||||||||||
| The accompanying notes are an integral part of these financial statements. | 9 |
GOLDMAN SACHS VARIABLE INSURANCE TRUST STRATEGIC INCOME FUND
Schedule of Investments (continued)
June 30, 2016 (Unaudited)
| Principal Amount | Interest Rate | Maturity Date | Value | |||||||||||
| Municipal Debt Obligations(a) – (continued) | ||||||||||||||
| Puerto Rico – (continued) |
| ||||||||||||
| Puerto Rico Sales Tax Financing Corp. RB First Subseries 2010 A |
| ||||||||||||
| $ | 15,000 | 5.500 | % | 08/01/37 | $ | 6,600 | ||||||||
| 155,000 | 5.375 | 08/01/39 | 67,813 | |||||||||||
| 115,000 | 5.500 | 08/01/42 | 50,600 | |||||||||||
| Puerto Rico Sales Tax Financing Corp. RB First Subseries 2010 C |
| ||||||||||||
| 30,000 | 5.375 | 08/01/36 | 13,144 | |||||||||||
| 10,000 | 5.375 | 08/01/38 | 4,375 | |||||||||||
| 55,000 | 6.000 | 08/01/39 | 24,613 | |||||||||||
| 105,000 | 5.250 | 08/01/41 | 45,806 | |||||||||||
| Puerto Rico Sales Tax Financing Corp. RB First | | ||||||||||||
| 170,000 | 5.000 | 08/01/43 | 73,525 | |||||||||||
| Puerto Rico Sales Tax Financing Corp. RB for Capital | | ||||||||||||
| 15,000 | 0.000 | 08/01/32 | 6,450 | |||||||||||
|
| |||||||||||||
| 445,719 | ||||||||||||||
|
| |||||||||||||
| TOTAL MUNICIPAL DEBT OBLIGATIONS | ||||||||||||||
| (Cost $580,554) | $ | 445,719 | ||||||||||||
|
| |||||||||||||
| Bank Loans(a)(c)(f)(h) – 0.6% | ||||||||||||||
| Energy – 0.0% |
| ||||||||||||
| American Energy – Marcellus, LLC |
| ||||||||||||
| $ | 25,000 | 5.250 | % | 08/04/20 | $ | 12,875 | ||||||||
| Magnum Hunter Resources Corp. |
| ||||||||||||
| 8,441 | 16.000 | 04/15/19 | 8,188 | |||||||||||
|
| |||||||||||||
| 21,063 | ||||||||||||||
|
| |||||||||||||
| Healthcare – 0.1% |
| ||||||||||||
| Valeant Pharmaceuticals International, Inc. |
| ||||||||||||
| 24,520 | 4.500 | 02/13/19 | 23,807 | |||||||||||
|
| |||||||||||||
| Media – 0.4% |
| ||||||||||||
| Checkout Holding Corp. |
| ||||||||||||
| 73,682 | 4.500 | 04/09/21 | 61,463 | |||||||||||
| 25,000 | 7.750 | 04/11/22 | 15,469 | |||||||||||
| Getty Images, Inc. |
| ||||||||||||
| 57,962 | 4.750 | 10/18/19 | 42,910 | |||||||||||
|
| |||||||||||||
| 119,842 | ||||||||||||||
|
| |||||||||||||
| Technology – 0.1% |
| ||||||||||||
| BMC Software Finance, Inc. |
| ||||||||||||
| 24,019 | 5.000 | 09/10/20 | 21,247 | |||||||||||
|
| |||||||||||||
| TOTAL BANK LOANS | ||||||||||||||
| (Cost $213,205) | $ | 185,959 | ||||||||||||
|
| |||||||||||||
| U.S. Treasury Obligations – 39.5% | ||||||||||||||
| United States Treasury Bill(i) |
| ||||||||||||
| $ | 6,500,000 | 0.000 | % | 07/28/16 | $ | 6,499,147 | ||||||||
| United States Treasury Bonds |
| ||||||||||||
| 300,000 | 3.625 | 08/15/43 | 386,337 | |||||||||||
| 100,000 | 3.750 | 11/15/43 | 131,697 | |||||||||||
|
| |||||||||||||
| U.S. Treasury Obligations – (continued) | ||||||||||||||
| United States Treasury Bonds – (continued) |
| ||||||||||||
| $ | 190,000 | 3.625 | % | 02/15/44 | $ | 244,515 | ||||||||
| 50,000 | 3.000 | 05/15/45 | 57,374 | |||||||||||
| 200,000 | 2.875 | 08/15/45 | 224,064 | |||||||||||
| 50,000 | 2.500 | 05/15/46 | 52,027 | |||||||||||
| United States Treasury Inflation-Protected Securities |
| ||||||||||||
| 1,066,266 | 2.500 | 07/15/16 | 1,069,433 | |||||||||||
| 510,545 | 0.125 | 04/15/19 | 521,476 | |||||||||||
| 310,968 | 0.125 | 01/15/23 | 315,390 | |||||||||||
| 154,218 | 0.375 | 07/15/23 | 159,591 | |||||||||||
| 60,458 | 0.125 | 07/15/24 | 61,110 | |||||||||||
| 50,447 | 0.375 | 07/15/25 | 51,968 | |||||||||||
| 55,349 | 2.125 | 02/15/40 | 72,385 | |||||||||||
| United States Treasury Notes |
| ||||||||||||
| 200,000 | 0.875 | 11/30/17 | 200,868 | |||||||||||
| 200,000 | 1.000 | 12/31/17 | 201,284 | |||||||||||
| 200,000 | 1.750 | 09/30/19 | 206,280 | |||||||||||
| 600,000 | 1.500 | 11/30/19 | 614,028 | |||||||||||
| 400,000 | 1.625 | 12/31/19 | 411,064 | |||||||||||
|
| |||||||||||||
| TOTAL U.S. TREASURY OBLIGATIONS | ||||||||||||||
| (Cost $11,322,250) | $ | 11,480,038 | ||||||||||||
|
| |||||||||||||
| Shares | Distribution Rate | Value | ||||||
| Investment Company(c)(j) – 5.0% | ||||||||
Goldman Sachs Financial Square Government Fund – FST Institutional Shares |
| |||||||
| 1,451,599 | 0.299 | % | $ | 1,451,599 | ||||
| (Cost $1,451,599) | ||||||||
| ||||||||
| TOTAL INVESTMENT COMPANIES | ||||||||
| (Cost $1,451,599) | $ | 1,451,599 | ||||||
| ||||||||
| TOTAL INVESTMENTS – 93.2% | ||||||||
| (Cost $27,123,711) | $ | 27,110,474 | ||||||
| ||||||||
OTHER ASSETS IN EXCESS OF LIABILITIES – 6.8% |
| 1,973,905 | ||||||
| ||||||||
| NET ASSETS – 100.0% | $ | 29,084,379 | ||||||
| ||||||||
| The percentage shown for each investment category reflects the value of investments in that category as a percentage of net assets. | ||
| * | Non-income producing security. | |
| (a) | Securities with “Call” features. Maturity dates disclosed are the final maturity dates. | |
| (b) | Exempt from registration under Rule 144A of the Securities Act of 1933. Under procedures approved by the Board of Trustees, such securities may be deemed liquid by the Investment Adviser and may be resold, normally to qualified institutional buyers in transactions exempt from registration. Total market value of Rule 144A securities amounts to $5,059,486, which represents approximately 17.4% of net assets as of June 30, 2016. | |
| 10 | The accompanying notes are an integral part of these financial statements. |
GOLDMAN SACHS VARIABLE INSURANCE TRUST STRATEGIC INCOME FUND
| (c) | Variable rate security. Interest rate or distribution rate disclosed is that which is in effect on June 30, 2016. | |
| (d) | Inverse floating rate security. Interest rate disclosed is that which is in effect on June 30, 2016. | |
| (e) | Step Bond. Coupon rate is fixed for an initial period then it resets at a specified date and rate. | |
| (f) | Security is currently in default. | |
| (g) | Zero coupon until next reset date. | |
| (h) | Bank Loans often require prepayments from excess cash flows or permit the borrower to repay at its election. The degree to which borrowers repay, whether as a contractual requirement or at their election, cannot be predicted with accuracy. As a result, the actual remaining maturity may be substantially less than the stated maturities shown. The stated interest rate represents the weighted average interest rate of all contracts within the loan facility on June 30, 2016. Bank Loans typically have rates of interest which are predetermined either daily, monthly, quarterly or semi-annually by reference to a base lending rate, plus a premium. These base lending rates are primarily the London-Interbank Offered Rate (“LIBOR”) and secondarily the prime rate offered by one or more major United States banks (the “Prime Rate”) and the certificate of deposit (“CD”) rate or other base lending rates used by commercial lenders. | |
| (i) | Issued with a zero coupon. Income is recognized through the accretion of discount. | |
| (j) | Represents an affiliated issuer. |
| Investment Abbreviations: | ||
| BA | —Banker Acceptance Rate | |
| BBR | —Bank Bill Reference Rate | |
| CD KSDA | —Certificates of Deposit by the Korean Securities Dealers Association | |
| CDI | —Average One-Day Interbank Deposit | |
| EURIBOR | —Euro Interbank Offered Rate | |
| FHLB | —Federal Home Loan Bank | |
| FHLMC | —Federal Home Loan Mortgage Corp. | |
| FNMA | —Federal National Mortgage Association | |
| GNMA | —Government National Mortgage Association | |
| GO | —General Obligation | |
| LIBOR | —London Interbank Offered Rate | |
| RB | —Revenue Bond | |
| STIBOR | —Stockholm Interbank Offered Rate | |
| WIBOR | —Warsaw InterBank Offered Rate | |
| Currency Abbreviations: | ||
| ARS | —Argentina peso | |
| AUD | —Australian Dollar | |
| BRL | —Brazilian Real | |
| CAD | —Canadian Dollar | |
| CHF | —Swiss Franc | |
| CLP | —Chilean Peso | |
| CNH | —Chinese Renminbi | |
| CNY | —Chinese Yuan | |
| COP | —Colombian Peso | |
| EUR | —Euro | |
| GBP | —British Pound | |
| HKD | —Hong Kong Dollar | |
| HUF | —Hungarian Forint | |
| IDR | —Indonesian Rupiah | |
| JPY | —Japanese Yen | |
| KRW | —South Korean Won | |
| MXN | —Mexican Peso | |
| MYR | —Malaysian Ringgit | |
| NOK | —Norwegian Krone | |
| NZD | —New Zealand Dollar | |
| PLN | —Polish Zloty | |
| RUB | —Russian Ruble | |
| SEK | —Swedish Krona | |
| SGD | —Singapore Dollar | |
| THB | —Thailand Baht | |
| TRY | —Turkish Lira | |
| TWD | —Taiwan Dollar | |
| USD | —United States Dollar | |
| ZAR | —South African Rand | |
ADDITIONAL INVESTMENT INFORMATION
FORWARD FOREIGN CURRENCY EXCHANGE CONTRACTS — At June 30, 2016, the Fund had the following forward foreign currency exchange contracts:
FORWARD FOREIGN CURRENCY EXCHANGE CONTRACTS WITH UNREALIZED GAIN
| Counterparty | Currency Purchased | Currency Sold | Settlement Date | Current Value | Unrealized Gain | |||||||||||||||
Bank of America, N.A. | CHF | 17,587 | EUR | 16,174 | 09/21/16 | $ | 18,093 | $ | 91 | |||||||||||
| EUR | 16,174 | CHF | 17,473 | 09/21/16 | 18,002 | 26 | ||||||||||||||
| EUR | 43,000 | HUF | 13,520,662 | 09/21/16 | 47,859 | 346 | ||||||||||||||
| JPY | 4,484,571 | USD | 41,298 | 09/21/16 | 43,546 | 2,248 | ||||||||||||||
| KRW | 125,642,055 | USD | 106,138 | 07/15/16 | 108,951 | 2,813 | ||||||||||||||
| MXN | 4,584,198 | USD | 244,778 | 09/21/16 | 248,748 | 3,970 | ||||||||||||||
| The accompanying notes are an integral part of these financial statements. | 11 |
GOLDMAN SACHS VARIABLE INSURANCE TRUST STRATEGIC INCOME FUND
Schedule of Investments (continued)
June 30, 2016 (Unaudited)
ADDITIONAL INVESTMENT INFORMATION (continued)
FORWARD FOREIGN CURRENCY EXCHANGE CONTRACTS WITH UNREALIZED GAIN (continued)
| Counterparty | Currency Purchased | Currency Sold | Settlement Date | Current Value | Unrealized Gain | |||||||||||||||
Bank of America, N.A. | PLN | 128,283 | EUR | 29,000 | 09/21/16 | $ | 32,457 | $ | 180 | |||||||||||
(continued) | SEK | 504,045 | GBP | 43,186 | 09/21/16 | 59,783 | 2,248 | |||||||||||||
| USD | 58,000 | BRL | 189,498 | 09/02/16 | 57,898 | 102 | ||||||||||||||
| USD | 111,201 | SEK | 902,259 | 07/29/16 | 106,753 | 4,448 | ||||||||||||||
| USD | 84,966 | SGD | 114,328 | 09/21/16 | 84,799 | 167 | ||||||||||||||
Barclays Bank PLC | CAD | 62,693 | USD | 48,000 | 09/21/16 | 48,533 | 533 | |||||||||||||
| CNH | 741,214 | USD | 108,573 | 09/01/16 | 110,953 | 2,380 | ||||||||||||||
| CNY | 375,858 | USD | 55,510 | 08/05/16 | 56,372 | 862 | ||||||||||||||
| CNY | 464,831 | USD | 69,048 | 08/16/16 | 69,661 | 613 | ||||||||||||||
| GBP | 88,000 | USD | 117,051 | 09/21/16 | 117,240 | 189 | ||||||||||||||
| USD | 55,989 | CNH | 372,675 | 08/18/16 | 55,818 | 171 | ||||||||||||||
| USD | 168,325 | CNH | 1,121,041 | 09/01/16 | 167,811 | 514 | ||||||||||||||
| USD | 107,630 | GBP | 76,000 | 09/21/16 | 101,254 | 6,376 | ||||||||||||||
| USD | 117,000 | SGD | 156,857 | 09/21/16 | 116,344 | 656 | ||||||||||||||
| USD | 19,000 | ZAR | 284,356 | 09/21/16 | 18,996 | 4 | ||||||||||||||
| ZAR | 1,055,921 | USD | 69,327 | 09/21/16 | 70,542 | 1,215 | ||||||||||||||
BNP Paribas SA | CNH | 997,468 | USD | 146,428 | 09/01/16 | 149,312 | 2,884 | |||||||||||||
| IDR | 2,061,719,221 | USD | 150,545 | 07/15/16 | 156,307 | 5,762 | ||||||||||||||
| TWD | 4,913,755 | USD | 151,542 | 07/07/16 | 152,442 | 900 | ||||||||||||||
| USD | 117,682 | GBP | 86,000 | 09/21/16 | 114,575 | 3,107 | ||||||||||||||
Citibank, N.A. | ARS | 370,300 | USD | 23,000 | 09/29/16 | 23,533 | 533 | |||||||||||||
| AUD | 64,000 | USD | 47,419 | 09/21/16 | 47,594 | 175 | ||||||||||||||
| CHF | 149,552 | EUR | 136,463 | 09/21/16 | 153,856 | 1,973 | ||||||||||||||
| CNH | 1,282,020 | USD | 187,742 | 09/01/16 | 191,907 | 4,165 | ||||||||||||||
| COP | 29,754,905 | USD | 9,998 | 07/15/16 | 10,163 | 165 | ||||||||||||||
| GBP | 132,189 | USD | 174,502 | 09/21/16 | 176,113 | 1,611 | ||||||||||||||
| IDR | 1,318,065,600 | USD | 98,769 | 08/10/16 | 99,567 | 798 | ||||||||||||||
| MYR | 216,472 | USD | 52,699 | 07/27/16 | 54,274 | 1,575 | ||||||||||||||
| MYR | 153,299 | USD | 38,253 | 07/28/16 | 38,435 | 182 | ||||||||||||||
| NZD | 93,720 | USD | 65,717 | 08/05/16 | 66,805 | 1,088 | ||||||||||||||
| NZD | 83,000 | USD | 58,492 | 09/21/16 | 59,023 | 531 | ||||||||||||||
| RUB | 3,351,910 | USD | 52,000 | 07/14/16 | 52,289 | 289 | ||||||||||||||
| USD | 50,335 | CNH | 329,156 | 09/01/16 | 49,272 | 1,063 | ||||||||||||||
| USD | 465,519 | EUR | 408,537 | 09/21/16 | 454,700 | 10,819 | ||||||||||||||
| USD | 742,698 | GBP | 505,606 | 07/20/16 | 673,165 | 69,533 | ||||||||||||||
| USD | 125,351 | TWD | 4,021,893 | 08/18/16 | 125,085 | 266 | ||||||||||||||
| ZAR | 292,670 | USD | 19,000 | 09/21/16 | 19,552 | 552 | ||||||||||||||
Deutsche Bank AG | AUD | 249,933 | USD | 184,565 | 08/04/16 | 186,187 | 1,622 | |||||||||||||
| BRL | 174,924 | USD | 48,000 | 07/05/16 | 54,455 | 6,455 | ||||||||||||||
| CNH | 765,234 | USD | 112,000 | 09/01/16 | 114,549 | 2,549 | ||||||||||||||
| CNY | 459,818 | USD | 68,063 | 07/26/16 | 69,013 | 950 | ||||||||||||||
| CNY | 389,867 | USD | 57,694 | 08/02/16 | 58,485 | 791 | ||||||||||||||
| CNY | 192,340 | USD | 28,423 | 08/03/16 | 28,851 | 428 | ||||||||||||||
| 12 | The accompanying notes are an integral part of these financial statements. |
GOLDMAN SACHS VARIABLE INSURANCE TRUST STRATEGIC INCOME FUND
ADDITIONAL INVESTMENT INFORMATION (continued)
FORWARD FOREIGN CURRENCY EXCHANGE CONTRACTS WITH UNREALIZED GAIN (continued)
| Counterparty | Currency Purchased | Currency Sold | Settlement Date | Current Value | Unrealized Gain | |||||||||||||||
Deutsche Bank AG | COP | 230,303,567 | USD | 77,012 | 07/15/16 | $ | 78,666 | $ | 1,654 | |||||||||||
(continued) | IDR | 171,037,646 | USD | 12,728 | 07/29/16 | 12,943 | 215 | |||||||||||||
| KRW | 57,225,264 | USD | 48,000 | 07/05/16 | 49,681 | 1,681 | ||||||||||||||
| KRW | 56,536,800 | USD | 48,000 | 07/18/16 | 49,024 | 1,024 | ||||||||||||||
| KRW | 57,225,264 | USD | 48,785 | 08/16/16 | 49,602 | 817 | ||||||||||||||
| MXN | 898,456 | USD | 48,000 | 09/21/16 | 48,752 | 752 | ||||||||||||||
| TWD | 3,131,520 | USD | 96,548 | 07/07/16 | 97,151 | 603 | ||||||||||||||
| USD | 662,769 | CNH | 4,348,300 | 09/01/16 | 650,902 | 11,867 | ||||||||||||||
| USD | 81,500 | CNH | 540,551 | 09/21/16 | 80,840 | 660 | ||||||||||||||
| USD | 47,476 | EUR | 42,000 | 09/21/16 | 46,746 | 730 | ||||||||||||||
| USD | 58,531 | GBP | 42,000 | 09/21/16 | 55,956 | 2,575 | ||||||||||||||
| ZAR | 299,731 | USD | 19,000 | 09/21/16 | 20,024 | 1,024 | ||||||||||||||
JPMorgan Chase Bank, N.A. | CHF | 46,483 | EUR | 42,000 | 09/21/16 | 47,821 | 1,075 | |||||||||||||
| CNY | 1,103,744 | USD | 161,500 | 07/11/16 | 165,865 | 4,365 | ||||||||||||||
| CNY | 732,518 | USD | 107,333 | 07/12/16 | 110,049 | 2,716 | ||||||||||||||
| MXN | 4,215,479 | USD | 225,559 | 09/21/16 | 228,740 | 3,181 | ||||||||||||||
| MYR | 183,503 | USD | 45,275 | 08/01/16 | 46,008 | 733 | ||||||||||||||
| RUB | 6,295,104 | USD | 96,000 | 07/08/16 | 98,364 | 2,364 | ||||||||||||||
| USD | 158,212 | CNH | 1,046,327 | 09/21/16 | 156,479 | 1,733 | ||||||||||||||
| USD | 114,958 | GBP | 84,303 | 09/21/16 | 112,314 | 2,644 | ||||||||||||||
| USD | 17,813 | MXN | 326,795 | 09/21/16 | 17,732 | 81 | ||||||||||||||
Merrill Lynch & Co., Inc. | MXN | 1,872,739 | USD | 99,773 | 09/21/16 | 101,619 | 1,846 | |||||||||||||
Morgan Stanley Co., Inc. | BRL | 993,942 | USD | 271,836 | 07/05/16 | 309,417 | 37,581 | |||||||||||||
| CAD | 99,832 | USD | 75,999 | 07/15/16 | 77,276 | 1,277 | ||||||||||||||
| CNH | 214,617 | USD | 31,472 | 09/01/16 | 32,126 | 654 | ||||||||||||||
| JPY | 4,986,931 | USD | 48,000 | 09/21/16 | 48,425 | 425 | ||||||||||||||
| KRW | 112,229,712 | USD | 97,021 | 07/08/16 | 97,387 | 366 | ||||||||||||||
| MXN | 3,202,691 | USD | 170,337 | 09/21/16 | 173,784 | 3,447 | ||||||||||||||
| MYR | 398,880 | USD | 96,000 | 07/08/16 | 99,398 | 3,398 | ||||||||||||||
| MYR | 172,341 | USD | 42,480 | 07/25/16 | 43,210 | 730 | ||||||||||||||
| MYR | 309,794 | USD | 76,853 | 08/10/16 | 77,647 | 794 | ||||||||||||||
| RUB | 3,745,791 | USD | 58,000 | 07/29/16 | 58,181 | 181 | ||||||||||||||
| RUB | 9,316,864 | USD | 140,300 | 08/11/16 | 144,197 | 3,897 | ||||||||||||||
| USD | 59,260 | GBP | 43,000 | 09/21/16 | 57,287 | 1,973 | ||||||||||||||
| USD | 59,000 | TWD | 1,887,115 | 07/27/16 | 58,667 | 333 | ||||||||||||||
| ZAR | 845,470 | USD | 52,806 | 09/21/16 | 56,482 | 3,676 | ||||||||||||||
Royal Bank of Canada | BRL | 836,771 | USD | 245,737 | 09/02/16 | 255,661 | 9,924 | |||||||||||||
| CAD | 227,916 | USD | 175,000 | 09/21/16 | 176,441 | 1,441 | ||||||||||||||
| USD | 59,000 | CAD | 76,139 | 09/21/16 | 58,943 | 57 | ||||||||||||||
| USD | 117,414 | GBP | 88,000 | 09/21/16 | 117,240 | 174 | ||||||||||||||
Royal Bank of Scotland | EUR | 43,000 | HUF | 13,484,800 | 09/21/16 | 47,859 | 472 | |||||||||||||
| MXN | 350,269 | USD | 19,000 | 09/21/16 | 19,006 | 6 | ||||||||||||||
| NOK | 1,066,312 | EUR | 113,408 | 09/21/16 | 127,396 | 1,174 | ||||||||||||||
| The accompanying notes are an integral part of these financial statements. | 13 |
GOLDMAN SACHS VARIABLE INSURANCE TRUST STRATEGIC INCOME FUND
Schedule of Investments (continued)
June 30, 2016 (Unaudited)
ADDITIONAL INVESTMENT INFORMATION (continued)
FORWARD FOREIGN CURRENCY EXCHANGE CONTRACTS WITH UNREALIZED GAIN (continued)
| Counterparty | Currency Purchased | Currency Sold | Settlement Date | Current Value | Unrealized Gain | |||||||||||||||
Royal Bank of Scotland | TRY | 313,190 | USD | 106,000 | 09/21/16 | $ | 106,883 | $ | 883 | |||||||||||
(continued) | USD | 126,581 | CAD | 162,343 | 09/21/16 | 125,677 | 904 | |||||||||||||
State Street Bank | CAD | 75,791 | USD | 58,000 | 09/21/16 | 58,673 | 673 | |||||||||||||
| MXN | 311,496 | USD | 16,547 | 09/21/16 | 16,902 | 355 | ||||||||||||||
| USD | 106,583 | GBP | 75,000 | 09/21/16 | 99,921 | 6,662 | ||||||||||||||
| USD | 59,000 | SGD | 79,030 | 09/21/16 | 58,618 | 382 | ||||||||||||||
UBS AG | CHF | 20,193 | EUR | 18,605 | 09/21/16 | 20,774 | 67 | |||||||||||||
| CNH | 385,504 | USD | 56,000 | 09/01/16 | 57,707 | 1,707 | ||||||||||||||
| EUR | 18,605 | CHF | 19,955 | 09/21/16 | 20,707 | 178 | ||||||||||||||
| EUR | 19,000 | HUF | 5,959,967 | 09/21/16 | 21,147 | 203 | ||||||||||||||
| GBP | 44,515 | USD | 58,793 | 09/21/16 | 59,306 | 513 | ||||||||||||||
| MYR | 398,880 | USD | 98,241 | 09/08/16 | 99,828 | 1,587 | ||||||||||||||
| RUB | 6,187,056 | USD | 96,000 | 07/11/16 | 96,599 | 599 | ||||||||||||||
| RUB | 7,585,344 | USD | 117,000 | 07/29/16 | 117,817 | 817 | ||||||||||||||
| TWD | 3,536,935 | USD | 108,385 | 07/14/16 | 109,946 | 1,561 | ||||||||||||||
| USD | 117,162 | GBP | 87,000 | 09/21/16 | 115,909 | 1,253 | ||||||||||||||
Westpac Banking Corp. | AUD | 354,243 | USD | 256,139 | 09/21/16 | 263,431 | 7,292 | |||||||||||||
| CNH | 744,916 | USD | 109,000 | 09/01/16 | 111,507 | 2,507 | ||||||||||||||
| EUR | 241,585 | GBP | 195,464 | 09/21/16 | 268,883 | 8,471 | ||||||||||||||
| JPY | 20,822,042 | USD | 199,491 | 08/10/16 | 201,867 | 2,376 | ||||||||||||||
| USD | 201,000 | CNH | 1,320,724 | 09/01/16 | 197,702 | 3,298 | ||||||||||||||
| USD | 1,871,455 | EUR | 1,650,000 | 07/13/16 | 1,831,588 | 39,867 | ||||||||||||||
| TOTAL | $ | 349,393 | ||||||||||||||||||
FORWARD FOREIGN CURRENCY EXCHANGE CONTRACTS WITH UNREALIZED LOSS
| Counterparty | Currency Purchased | Currency Sold | Settlement Date | Current Value | Unrealized Loss | |||||||||||||||
Bank of America, N.A. | EUR | 85,000 | CHF | 92,211 | 09/21/16 | $ | 94,605 | $ | (261 | ) | ||||||||||
| EUR | 53,000 | HUF | 16,940,072 | 09/21/16 | 58,989 | (540 | ) | |||||||||||||
| JPY | 11,927,496 | USD | 117,000 | 09/21/16 | 115,820 | (1,180 | ) | |||||||||||||
| NOK | 373,107 | USD | 44,695 | 09/21/16 | 44,576 | (119 | ) | |||||||||||||
| SEK | 994,521 | EUR | 106,755 | 09/21/16 | 117,957 | (860 | ) | |||||||||||||
| USD | 48,000 | JPY | 5,147,280 | 09/21/16 | 49,982 | (1,982 | ) | |||||||||||||
| USD | 102,384 | SGD | 139,388 | 09/21/16 | 103,387 | (1,003 | ) | |||||||||||||
Barclays Bank PLC | CNY | 372,955 | USD | 55,989 | 08/18/16 | 55,884 | (105 | ) | ||||||||||||
| EUR | 153,000 | USD | 175,035 | 09/21/16 | 170,289 | (4,746 | ) | |||||||||||||
| USD | 58,000 | BRL | 195,640 | 09/02/16 | 59,775 | (1,775 | ) | |||||||||||||
| USD | 55,510 | CNH | 375,636 | 08/05/16 | 56,291 | (781 | ) | |||||||||||||
| USD | 69,048 | CNH | 464,555 | 08/16/16 | 69,585 | (537 | ) | |||||||||||||
| USD | 110,000 | CNH | 747,279 | 09/01/16 | 111,861 | (1,861 | ) | |||||||||||||
| USD | 394,800 | NZD | 583,428 | 09/21/16 | 414,889 | (20,089 | ) | |||||||||||||
| 14 | The accompanying notes are an integral part of these financial statements. |
GOLDMAN SACHS VARIABLE INSURANCE TRUST STRATEGIC INCOME FUND
ADDITIONAL INVESTMENT INFORMATION (continued)
FORWARD FOREIGN CURRENCY EXCHANGE CONTRACTS WITH UNREALIZED LOSS (continued)
| Counterparty | Currency Purchased | Currency Sold | Settlement Date | Current Value | Unrealized Loss | |||||||||||||||
BNP Paribas SA | ARS | 353,607 | USD | 23,341 | 08/01/16 | $ | 23,181 | $ | (160 | ) | ||||||||||
| EUR | 42,000 | CHF | 45,688 | 09/21/16 | 46,746 | (257 | ) | |||||||||||||
| EUR | 29,821 | PLN | 131,227 | 09/21/16 | 33,190 | (11 | ) | |||||||||||||
| HUF | 16,366,433 | EUR | 52,000 | 09/21/16 | 57,513 | (363 | ) | |||||||||||||
| HUF | 30,475,910 | USD | 109,051 | 09/21/16 | 107,095 | (1,956 | ) | |||||||||||||
| SEK | 2,818,701 | EUR | 305,811 | 09/21/16 | 334,318 | (6,048 | ) | |||||||||||||
| USD | 16,116 | AUD | 21,844 | 09/21/16 | 16,244 | (128 | ) | |||||||||||||
| USD | 48,000 | CAD | 62,184 | 09/21/16 | 48,139 | (139 | ) | |||||||||||||
| USD | 95,572 | NZD | 135,000 | 09/21/16 | 96,002 | (430 | ) | |||||||||||||
| USD | 48,000 | TWD | 1,564,800 | 07/07/16 | 48,546 | (546 | ) | |||||||||||||
| USD | 151,495 | TWD | 4,913,755 | 08/25/16 | 152,850 | (1,355 | ) | |||||||||||||
Citibank, N.A. | AUD | 64,982 | NZD | 68,399 | 09/21/16 | 48,324 | (316 | ) | ||||||||||||
| CNH | 318,243 | USD | 48,000 | 09/21/16 | 47,594 | (406 | ) | |||||||||||||
| EUR | 42,000 | CHF | 46,068 | 09/21/16 | 46,746 | (648 | ) | |||||||||||||
| EUR | 126,000 | USD | 143,005 | 09/21/16 | 140,237 | (2,768 | ) | |||||||||||||
| GBP | 355,000 | USD | 521,468 | 07/20/16 | 472,647 | (48,821 | ) | |||||||||||||
| PLN | 365,022 | EUR | 84,000 | 09/21/16 | 92,353 | (1,138 | ) | |||||||||||||
| SEK | 1,603,443 | EUR | 173,264 | 09/21/16 | 190,180 | (2,662 | ) | |||||||||||||
| USD | 210,598 | CAD | 275,620 | 09/21/16 | 213,370 | (2,772 | ) | |||||||||||||
| USD | 116,505 | GBP | 88,189 | 09/21/16 | 117,492 | (987 | ) | |||||||||||||
| USD | 59,000 | IDR | 798,115,420 | 07/28/16 | 60,405 | (1,405 | ) | |||||||||||||
| USD | 48,000 | KRW | 55,622,592 | 07/15/16 | 48,233 | (233 | ) | |||||||||||||
| USD | 309,534 | KRW | 369,768,973 | 07/25/16 | 320,605 | (11,071 | ) | |||||||||||||
| USD | 117,717 | MXN | 2,249,743 | 08/16/16 | 122,540 | (4,823 | ) | |||||||||||||
| USD | 53,042 | MYR | 217,855 | 08/10/16 | 54,603 | (1,561 | ) | |||||||||||||
| USD | 63,109 | NZD | 90,000 | 08/05/16 | 64,154 | (1,045 | ) | |||||||||||||
| USD | 43,603 | RUB | 2,816,500 | 07/11/16 | 43,974 | (371 | ) | |||||||||||||
| USD | 397,755 | SGD | 548,334 | 09/21/16 | 406,709 | (8,954 | ) | |||||||||||||
| USD | 99,802 | TRY | 301,303 | 09/21/16 | 102,826 | (3,024 | ) | |||||||||||||
| USD | 258,577 | TWD | 8,437,641 | 07/14/16 | 262,287 | (3,710 | ) | |||||||||||||
| USD | 97,054 | TWD | 3,142,618 | 08/22/16 | 97,748 | (694 | ) | |||||||||||||
Deutsche Bank AG | CNH | 337,294 | USD | 51,000 | 09/01/16 | 50,490 | (510 | ) | ||||||||||||
| CNH | 1,545,110 | USD | 234,000 | 09/21/16 | 231,073 | (2,927 | ) | |||||||||||||
| GBP | 73,000 | USD | 107,036 | 09/21/16 | 97,256 | (9,780 | ) | |||||||||||||
| USD | 227,446 | AUD | 308,000 | 08/04/16 | 229,445 | (1,999 | ) | |||||||||||||
| USD | 58,000 | BRL | 191,110 | 09/02/16 | 58,390 | (390 | ) | |||||||||||||
| USD | 29,126 | CLP | 19,980,710 | 07/14/16 | 30,162 | (1,036 | ) | |||||||||||||
| USD | 68,063 | CNH | 459,562 | 07/26/16 | 68,895 | (832 | ) | |||||||||||||
| USD | 57,694 | CNH | 389,608 | 08/02/16 | 58,391 | (697 | ) | |||||||||||||
| USD | 28,423 | CNH | 192,226 | 08/03/16 | 28,808 | (385 | ) | |||||||||||||
| USD | 55,000 | CNH | 376,428 | 09/01/16 | 56,348 | (1,348 | ) | |||||||||||||
| USD | 300,788 | HKD | 2,333,878 | 09/21/16 | 301,122 | (334 | ) | |||||||||||||
| USD | 48,814 | KRW | 57,225,264 | 07/05/16 | 49,681 | (867 | ) | |||||||||||||
| The accompanying notes are an integral part of these financial statements. | 15 |
GOLDMAN SACHS VARIABLE INSURANCE TRUST STRATEGIC INCOME FUND
Schedule of Investments (continued)
June 30, 2016 (Unaudited)
ADDITIONAL INVESTMENT INFORMATION (continued)
FORWARD FOREIGN CURRENCY EXCHANGE CONTRACTS WITH UNREALIZED LOSS (continued)
| Counterparty | Currency Purchased | Currency Sold | Settlement Date | Current Value | Unrealized Loss | |||||||||||||||
Deutsche Bank AG | USD | 88,910 | KRW | 103,233,401 | 07/25/16 | $ | 89,508 | $ | (598 | ) | ||||||||||
(continued) | USD | 97,492 | MYR | 402,149 | 07/28/16 | 100,828 | (3,336 | ) | ||||||||||||
| USD5 | 8,254 | NZD | 83,000 | 09/21/16 | 59,023 | (769 | ) | |||||||||||||
| USD | 96,000 | SGD | 130,959 | 09/21/16 | 97,134 | (1,134 | ) | |||||||||||||
| USD | 137,310 | THB | 4,835,034 | 07/27/16 | 137,535 | (225 | ) | |||||||||||||
| USD | 47,143 | THB | 1,665,464 | 08/11/16 | 47,362 | (219 | ) | |||||||||||||
| USD | 48,545 | THB | 1,711,068 | 08/25/16 | 48,646 | (101 | ) | |||||||||||||
| USD | 48,770 | THB | 1,718,737 | 09/02/16 | 48,858 | (88 | ) | |||||||||||||
| USD | 48,000 | TRY | 144,302 | 09/21/16 | 49,246 | (1,246 | ) | |||||||||||||
| USD | 48,000 | TWD | 1,544,400 | 07/13/16 | 48,008 | (8 | ) | |||||||||||||
| USD | 96,562 | TWD | 3,131,520 | 08/26/16 | 97,413 | (851 | ) | |||||||||||||
| USD | 38,000 | ZAR | 587,230 | 09/21/16 | 39,230 | (1,230 | ) | |||||||||||||
JPMorgan Chase Bank, N.A. | EUR | 106,000 | PLN | 475,133 | 09/21/16 | 117,978 | (2,235 | ) | ||||||||||||
| GBP | 43,000 | USD | 58,971 | 09/21/16 | 57,288 | (1,683 | ) | |||||||||||||
| PLN | 862,084 | USD | 218,229 | 09/21/16 | 218,114 | (115 | ) | |||||||||||||
| SEK | 1,401,244 | EUR | 150,137 | 09/21/16 | 166,198 | (904 | ) | |||||||||||||
| USD | 161,500 | CNH | 1,104,175 | 07/11/16 | 165,625 | (4,125 | ) | |||||||||||||
| USD | 107,333 | CNH | 732,814 | 07/12/16 | 109,918 | (2,585 | ) | |||||||||||||
| USD | 55,000 | CNH | 368,849 | 09/01/16 | 55,213 | (213 | ) | |||||||||||||
| USD | 129,609 | COP | 391,819,844 | 07/15/16 | 133,836 | (4,227 | ) | |||||||||||||
| USD | 48,000 | IDR | 644,347,200 | 07/18/16 | 48,831 | (831 | ) | |||||||||||||
| USD | 47,063 | IDR | 628,860,000 | 07/29/16 | 47,588 | (525 | ) | |||||||||||||
| USD | 48,000 | JPY | 4,970,952 | 09/21/16 | 48,270 | (270 | ) | |||||||||||||
| USD | 48,000 | KRW | 56,276,160 | 07/08/16 | 48,834 | (834 | ) | |||||||||||||
| USD | 147,028 | KRW | 169,883,990 | 07/18/16 | 147,310 | (282 | ) | |||||||||||||
| USD | 95,104 | RUB | 6,312,230 | 07/14/16 | 98,470 | (3,366 | ) | |||||||||||||
| USD | 152,223 | TWD | 4,913,755 | 07/07/16 | 152,442 | (219 | ) | |||||||||||||
| USD | 142,576 | TWD | 4,657,962 | 07/28/16 | 144,808 | (2,232 | ) | |||||||||||||
| USD | 47,400 | TWD | 1,535,528 | 08/03/16 | 47,739 | (339 | ) | |||||||||||||
Morgan Stanley Co., Inc. | CNH | 950,443 | USD | 144,000 | 09/21/16 | 142,140 | (1,860 | ) | ||||||||||||
| EUR | 66,137 | USD | 73,655 | 09/21/16 | 73,610 | (45 | ) | |||||||||||||
| USD | 96,000 | BRL | 332,095 | 07/05/16 | 103,382 | (7,382 | ) | |||||||||||||
| USD | 58,000 | BRL | 192,649 | 09/02/16 | 58,861 | (861 | ) | |||||||||||||
| USD | 54,811 | CAD | 72,000 | 07/15/16 | 55,732 | (921 | ) | |||||||||||||
| USD | 209,600 | CAD | 275,299 | 09/21/16 | 213,122 | (3,522 | ) | |||||||||||||
| USD | 20,510 | CLP | 13,859,762 | 07/28/16 | 20,894 | (384 | ) | |||||||||||||
| USD | 176,955 | EUR | 160,000 | 09/21/16 | 178,080 | (1,125 | ) | |||||||||||||
| USD | 48,000 | KRW | 55,953,552 | 07/08/16 | 48,554 | (554 | ) | |||||||||||||
| USD | 96,974 | KRW | 112,229,712 | 08/16/16 | 97,280 | (306 | ) | |||||||||||||
| USD | 19,564 | RUB | 1,295,763 | 07/14/16 | 20,213 | (649 | ) | |||||||||||||
| USD | 235,000 | RUB | 15,538,835 | 07/27/16 | 241,493 | (6,493 | ) | |||||||||||||
| USD | 48,000 | TWD | 1,566,720 | 07/07/16 | 48,605 | (605 | ) | |||||||||||||
| USD | 260,453 | TWD | 8,427,055 | 07/22/16 | 261,971 | (1,518 | ) | |||||||||||||
| 16 | The accompanying notes are an integral part of these financial statements. |
GOLDMAN SACHS VARIABLE INSURANCE TRUST STRATEGIC INCOME FUND
ADDITIONAL INVESTMENT INFORMATION (continued)
FORWARD FOREIGN CURRENCY EXCHANGE CONTRACTS WITH UNREALIZED LOSS (continued)
| Counterparty | Currency Purchased | Currency Sold | Settlement Date | Current Value | Unrealized Loss | |||||||||||||||
Morgan Stanley Co., Inc. | USD | 97,452 | TWD | 3,137,760 | 08/10/16 | 97,567 | (115 | ) | ||||||||||||
(continued) | USD | 19,000 | ZAR | 290,502 | 09/21/16 | 19,407 | (407 | ) | ||||||||||||
Royal Bank of Canada | CAD | 61,853 | USD | 48,000 | 09/21/16 | 47,883 | (117 | ) | ||||||||||||
| USD | 250,036 | BRL | 836,771 | 07/05/16 | 260,490 | (10,454 | ) | |||||||||||||
| USD | 215,825 | BRL | 785,000 | 08/02/16 | 242,185 | (26,360 | ) | |||||||||||||
| USD | 59,000 | CAD | 76,481 | 09/21/16 | 59,207 | (207 | ) | |||||||||||||
Royal Bank of Scotland | COP | 169,181,940 | USD | 58,000 | 07/15/16 | 57,788 | (212 | ) | ||||||||||||
| EUR | 53,000 | PLN | 237,166 | 09/21/16 | 58,989 | (1,016 | ) | |||||||||||||
| EUR | 53,000 | SEK | 497,936 | 09/21/16 | 58,989 | (70 | ) | |||||||||||||
| GBP | 137,005 | USD | 197,002 | 07/20/16 | 182,409 | (14,593 | ) | |||||||||||||
| USD | 48,000 | MXN | 908,231 | 09/21/16 | 49,282 | (1,282 | ) | |||||||||||||
| USD | 58,000 | TRY | 174,057 | 09/21/16 | 59,401 | (1,401 | ) | |||||||||||||
State Street Bank | AUD | 67,000 | NZD | 71,251 | 09/21/16 | 49,824 | (844 | ) | ||||||||||||
| EUR | 6,053 | SEK | 56,836 | 09/21/16 | 6,737 | (4 | ) | |||||||||||||
| EUR | 58,134 | USD | 65,096 | 09/21/16 | 64,702 | (394 | ) | |||||||||||||
| GBP | 87,000 | USD | 117,840 | 09/21/16 | 115,908 | (1,932 | ) | |||||||||||||
| JPY | 6,013,634 | USD | 59,000 | 09/21/16 | 58,394 | (606 | ) | |||||||||||||
| SEK | 5,025,334 | EUR | 541,843 | 09/21/16 | 596,041 | (7,028 | ) | |||||||||||||
| USD | 300,672 | CAD | 392,520 | 09/21/16 | 303,867 | (3,195 | ) | |||||||||||||
| USD | 54,528 | SGD | 74,194 | 09/21/16 | 55,030 | (502 | ) | |||||||||||||
UBS AG | CHF | 113,876 | EUR | 106,000 | 09/21/16 | 117,153 | (824 | ) | ||||||||||||
| EUR | 42,000 | CHF | 45,880 | 09/21/16 | 46,746 | (454 | ) | |||||||||||||
| EUR | 53,000 | HUF | 16,868,879 | 09/21/16 | 58,989 | (290 | ) | |||||||||||||
| HUF | 16,406,265 | EUR | 52,000 | 09/21/16 | 57,653 | (223 | ) | |||||||||||||
| SEK | 2,511,623 | EUR | 270,748 | 09/21/16 | 297,897 | (3,445 | ) | |||||||||||||
| USD | 164,501 | CNH | 1,127,493 | 09/01/16 | 168,776 | (4,275 | ) | |||||||||||||
| USD | 59,147 | GBP | 44,515 | 09/21/16 | 59,307 | (160 | ) | |||||||||||||
| USD | 47,457 | KRW | 54,985,817 | 07/15/16 | 47,681 | (224 | ) | |||||||||||||
| USD | 98,392 | MYR | 398,880 | 07/08/16 | 99,398 | (1,006 | ) | |||||||||||||
| USD | 53,064 | TWD | 1,717,163 | 07/14/16 | 53,378 | (314 | ) | |||||||||||||
Westpac Banking Corp. | AUD | 287,047 | NZD | 301,979 | 09/21/16 | 213,462 | (1,282 | ) | ||||||||||||
| CNH | 773,253 | USD | 117,000 | 09/21/16 | 115,641 | (1,359 | ) | |||||||||||||
| EUR | 510,613 | USD | 577,535 | 07/13/16 | 566,808 | (10,727 | ) | |||||||||||||
| USD | 94,361 | AUD | 131,039 | 09/21/16 | 97,446 | (3,085 | ) | |||||||||||||
| USD | 55,000 | CNH | 376,773 | 09/01/16 | 56,400 | (1,400 | ) | |||||||||||||
| USD | 48,860 | HKD | 378,797 | 09/21/16 | 48,873 | (13 | ) | |||||||||||||
| USD | 62,073 | JPY | 6,478,885 | 08/10/16 | 62,812 | (739 | ) | |||||||||||||
| USD | 43,696 | KRW | 50,973,574 | 07/15/16 | 44,202 | (506 | ) | |||||||||||||
| USD | 101,803 | MYR | 414,031 | 07/27/16 | 103,807 | (2,004 | ) | |||||||||||||
| USD | 107,538 | NZD | 151,856 | 09/21/16 | 107,988 | (450 | ) | |||||||||||||
| TOTAL | $ | (330,280 | ) | |||||||||||||||||
| The accompanying notes are an integral part of these financial statements. | 17 |
GOLDMAN SACHS VARIABLE INSURANCE TRUST STRATEGIC INCOME FUND
Schedule of Investments (continued)
June 30, 2016 (Unaudited)
ADDITIONAL INVESTMENT INFORMATION (continued)
FUTURES CONTRACTS — At June 30, 2016, the Fund had the following futures contracts:
| Type | Number of Contracts Long (Short) | Expiration Date | Current Value | Unrealized Gain (Loss) | ||||||||||||
| U.S. Long Bond | (2 | ) | September 2016 | $ | (344,688 | ) | $ | (11,191 | ) | |||||||
| U.S. Ultra Long Treasury Bonds | (1 | ) | September 2016 | (186,375 | ) | (11,963 | ) | |||||||||
| 2 Year U.S. Treasury Notes | (17 | ) | September 2016 | (3,728,578 | ) | (24,570 | ) | |||||||||
| 5 Year U.S. Treasury Notes | (35 | ) | September 2016 | (4,275,742 | ) | (40,709 | ) | |||||||||
10 Year U.S. Treasury Notes | (12 | ) | September 2016 | (1,595,813 | ) | (10,597 | ) | |||||||||
| TOTAL | $ | (99,030 | ) | |||||||||||||
SWAP CONTRACTS — At June 30, 2016, the Fund had the following swap contracts:
CENTRALLY CLEARED CREDIT DEFAULT SWAP CONTRACT
| Market Value | ||||||||||||||||||||||
| Referenced Obligation | Notional Amount (000’s) | Rates Received (Paid) | Termination Date | Credit Spread on June 30, 2016 | Upfront Payments Made (Received) | Unrealized Gain (Loss) | ||||||||||||||||
Protection Purchased: |
| |||||||||||||||||||||
| CDX North America High Yield Index | $ | 2,300 | (5.000)% | 06/20/21 | 4.263 | % | $ | (35,532 | ) | $ | (40,089 | ) | ||||||||||
OVER THE COUNTER CREDIT DEFAULT SWAP CONTRACTS
| Market Value | ||||||||||||||||||||||||||||
| Counterparty | Referenced Obligation | Notional Amount (000’s) | Rates Received (Paid) | Termination Date | Credit Spread on June 30, 2016 | Upfront Payments Made (Received) | Unrealized Gain (Loss) | |||||||||||||||||||||
Protection Purchased: |
| |||||||||||||||||||||||||||
| Bank of America, N.A. | | People’s Republic of China, 4.250%, 10/28/27 | | $ | 210 | (1.000 | )% | 06/20/19 | 0.719 | % | $ | (797 | ) | $ | (1,002 | ) | ||||||||||||
| | People’s Republic of China, 7.500%, 10/28/27 | | 170 | (1.000 | ) | 12/20/20 | 1.098 | 900 | (232 | ) | ||||||||||||||||||
| | People’s Republic of China, 7.500%, 10/28/27 | | 130 | (1.000 | ) | 06/20/21 | 1.198 | 1,201 | (10 | ) | ||||||||||||||||||
| Barclays Bank PLC | | People’s Republic of China, 7.500%, 10/28/27 | | 70 | (1.000 | ) | 06/20/21 | 1.198 | 643 | (2 | ) | |||||||||||||||||
| JPMorgan Chase Bank, N.A. | | People’s Republic of China, 4.250%, 10/28/27 | | 1,250 | (1.000 | ) | 06/20/19 | 0.719 | (3,570 | ) | (7,136 | ) | ||||||||||||||||
| | People’s Republic of China, 7.500%, 10/28/27 | | 1,420 | (1.000 | ) | 12/20/20 | 1.098 | 10,107 | (4,522 | ) | ||||||||||||||||||
| | People’s Republic of China, 7.500%, 10/28/27 | | 40 | (1.000 | ) | 06/20/21 | 1.198 | 396 | (30 | ) | ||||||||||||||||||
| TOTAL | $ | 8,880 | $ | (12,934 | ) | |||||||||||||||||||||||
| 18 | The accompanying notes are an integral part of these financial statements. |
GOLDMAN SACHS VARIABLE INSURANCE TRUST STRATEGIC INCOME FUND
ADDITIONAL INVESTMENT INFORMATION (continued)
CENTRALLY CLEARED INTEREST RATE SWAP CONTRACTS
| Rates Exchanged | Market Value | |||||||||||||||||
| Notional Amount (000’s) | Termination Date | Payments Received | Payments Made | Upfront Made (Received) | Unrealized Gain (Loss) | |||||||||||||
| SEK | 12,530 | 06/15/18 | 0.050% | 3 Month STIBOR | $ | 12,176 | $ | 2,449 | ||||||||||
| EUR | 6,020 | (a) | 09/21/18 | 3 Month EURIBOR | 0.375% | 1,159 | 1,012 | |||||||||||
| 6,280 | (a) | 09/21/18 | 3 Month EURIBOR | 0.400 | 5,089 | 655 | ||||||||||||
| GBP | 2,250 | (a) | 09/21/18 | 0.400 | 3 Month LIBOR | 16 | 1,882 | |||||||||||
| 2,200 | (a) | 09/21/18 | 0.464 | 3 Month LIBOR | 1,994 | 5,580 | ||||||||||||
| PLN | 90 | 06/17/19 | 3.048 | 6 Month WIBOR | 470 | 486 | ||||||||||||
| 90 | 06/17/19 | 6 Month WIBOR | 3.045 | 0 | (955 | ) | ||||||||||||
| EUR | 2,150 | (a) | 06/22/19 | 6 Month EURIBOR | 0.160 | (584 | ) | (1,204 | ) | |||||||||
| CAD | 9,400 | (a) | 09/21/21 | 1.500 | 3 Month BA | 142,869 | 61,852 | |||||||||||
| EUR | 1,690 | (a) | 09/21/21 | 6 Month EURIBOR | 0.500 | (51,506 | ) | (1,465 | ) | |||||||||
| GBP | 550 | (a) | 09/21/21 | 1.750 | 6 Month LIBOR | 39,486 | 725 | |||||||||||
| SEK | 4,190 | (a) | 09/21/21 | 3 Month STIBOR | 0.250 | 537 | (5,465 | ) | ||||||||||
| $ | 7,490 | (a) | 09/21/21 | 3 Month LIBOR | 2.000 | (286,460 | ) | (74,462 | ) | |||||||||
| EUR | 4,030 | (a) | 05/11/25 | 1.568 | 6 Month EURIBOR | 35,662 | 167,303 | |||||||||||
| 2,850 | (a) | 05/25/25 | 0.863 | 6 Month EURIBOR | 8,245 | 20,973 | ||||||||||||
| 1,980 | (a) | 06/16/26 | 1.000 | 6 Month EURIBOR | 3,766 | 5,892 | ||||||||||||
| AUD | 1,840 | (a) | 09/21/26 | 2.500 | 6 Month BBR | 12,504 | 25,706 | |||||||||||
| EUR | 2,580 | (a) | 09/21/26 | 1.000 | 6 Month EURIBOR | 122,640 | 34,704 | |||||||||||
| SEK | 5,440 | (a) | 09/21/26 | 3 Month STIBOR | 1.000 | 3,872 | (16,671 | ) | ||||||||||
| $ | 2,300 | (a) | 09/21/26 | 3 Month LIBOR | 2.250 | (148,654 | ) | (36,884 | ) | |||||||||
| EUR | 1,080 | (a) | 05/11/35 | 6 Month EURIBOR | 1.695 | (15,077 | ) | (85,228 | ) | |||||||||
| JPY | 70,460 | (a) | 03/30/36 | 6 Month LIBOR | 0.900 | (7,981 | ) | (30,838 | ) | |||||||||
| 178,430 | (a) | 09/21/36 | 6 Month LIBOR | 0.500 | (52,239 | ) | (66,933 | ) | ||||||||||
| GBP | 610 | (a) | 06/15/46 | 6 Month LIBOR | 1.600 | (3,289 | ) | (31,656 | ) | |||||||||
| 80 | (a) | 09/21/46 | 6 Month LIBOR | 2.250 | (20,206 | ) | (8,830 | ) | ||||||||||
| $ | 300 | (a) | 09/21/46 | 2.750 | 3 Month LIBOR | 49,244 | 17,015 | |||||||||||
| TOTAL | $ | (146,267 | ) | $ | (14,357 | ) | ||||||||||||
| (a) | Represents forward starting interest rate swaps whose effective dates of commencement of accruals and cash flows occur subsequent to June 30, 2016. |
OVER THE COUNTER INTEREST RATE SWAP CONTRACTS
| Rates Exchanged | ||||||||||||||||||||
| Counterparty | Notional (000’s) | Termination Date | Payments Received | Payments Made | Unrealized Gain (Loss)(b) | |||||||||||||||
| Bank of America, N.A. | BRL | 3,396 | 01/02/17 | 15.530% | 1 Day CDI | $ | 15,980 | |||||||||||||
| KRW | 290,710 | 11/04/17 | 2.060 | 3 Month CD KSDA | 2,937 | |||||||||||||||
| 320,830 | 08/06/24 | 3 Month CD KSDA | 2.970% | (38,585 | ) | |||||||||||||||
| Deutsche Bank AG | KRW | 142,230 | 10/06/17 | 2.245 | 3 Month CD KSDA | 1,766 | ||||||||||||||
| 209,280 | 10/15/17 | 2.253 | 3 Month CD KSDA | 2,612 | ||||||||||||||||
| 173,640 | 11/04/17 | 2.075 | 3 Month CD KSDA | 1,788 | ||||||||||||||||
JP Morgan Chase Bank, N.A. | KRW | 1,612,725 | 07/29/17 | 1.630 | 3 Month CD KSDA | 5,558 | ||||||||||||||
| TOTAL | $ | (7,944 | ) | |||||||||||||||||
| (b) | There are no upfront payments on the swap contracts listed above, therefore the unrealized gains (losses) on the swap contracts are equal to their market value. |
| The accompanying notes are an integral part of these financial statements. | 19 |
GOLDMAN SACHS VARIABLE INSURANCE TRUST STRATEGIC INCOME FUND
Statement of Assets and Liabilities
June 30, 2016 (Unaudited)
| Assets: | ||||
Investments in unaffiliated issuers, at value (cost $25,672,112) | $ | 25,658,875 | ||
Investments in affiliated issuers, at value (cost $1,451,599) | 1,451,599 | |||
Cash | 474,107 | |||
Foreign currencies, at value (cost $75,556) | 79,036 | |||
Receivables: | ||||
Collateral on certain derivative contracts(a) | 954,748 | |||
Investments sold | 339,373 | |||
Investments sold on an extended-settlement basis | 138,959 | |||
Interest and dividends | 128,297 | |||
Reimbursement from investment adviser | 16,388 | |||
Upfront payments made on swap contracts | 13,247 | |||
Fund shares sold | 885 | |||
Unrealized gain on forward foreign currency exchange contracts | 349,393 | |||
Unrealized gain on swap contracts | 30,641 | |||
| Total assets | 29,635,548 | |||
| Liabilities: | ||||
Unrealized loss on forward foreign currency exchange contracts | 330,280 | |||
Unrealized loss on swap contracts | 51,519 | |||
Variation margin on certain derivative contracts | 17,260 | |||
Payables: | ||||
Investments purchased | 102,000 | |||
Management fees | 13,383 | |||
Upfront payments received on swap contracts | 4,367 | |||
Distribution and Service fees and Transfer Agency fees | 3,197 | |||
Fund shares redeemed | 335 | |||
Accrued expenses | 28,828 | |||
| Total liabilities | 551,169 | |||
| Net Assets: | ||||
Paid-in capital | 31,799,702 | |||
Undistributed net investment income | 34,426 | |||
Accumulated net realized loss | (2,590,120 | ) | ||
Net unrealized loss | (159,629 | ) | ||
| NET ASSETS | $ | 29,084,379 | ||
Net Assets: | ||||
Institutional | $ | 20,804,795 | ||
Service | 9,590 | |||
Advisor | 8,269,994 | |||
Total Net Assets | $ | 29,084,379 | ||
Shares outstanding $0.001 par value (unlimited shares authorized): | ||||
Institutional | 2,300,167 | |||
Service | 1,061 | |||
Advisor | 916,638 | |||
Net asset value, offering and redemption price per share: | ||||
Institutional | $9.04 | |||
Service | 9.04 | |||
Advisor | 9.02 | |||
| (a) | Includes amounts segregated for initial margin and/or collateral on forward foreign currency exchange contract transactions, futures transactions and swaps transactions of $430,000, $77,000 and $447,748, respectively. |
| 20 | The accompanying notes are an integral part of these financial statements. |
GOLDMAN SACHS VARIABLE INSURANCE TRUST STRATEGIC INCOME FUND
Statement of Operations
For the Six Months Ended June 30, 2016 (Unaudited)
| Investment income: | ||||
Interest | $ | 408,914 | ||
Dividends — affiliated issuers | 10,418 | |||
| Total investment income | 419,332 | |||
| Expenses: | ||||
Management fees | 94,779 | |||
Professional fees | 54,061 | |||
Custody, accounting and administrative services | 42,097 | |||
Printing and mailing costs | 25,769 | |||
Distribution and Service fees(a) | 14,023 | |||
Trustee fees | 11,721 | |||
Transfer Agency fees(a) | 3,160 | |||
Other | 2,632 | |||
| Total expenses | 248,242 | |||
Less — expense reductions | (102,685 | ) | ||
| Net expenses | 145,557 | |||
| NET INVESTMENT INCOME | 273,775 | |||
| Realized and unrealized gain (loss): | ||||
Net realized gain (loss) from: | ||||
Investments | (262,882 | ) | ||
Futures contracts | (183,057 | ) | ||
Swap contracts | (578,637 | ) | ||
Forward foreign currency exchange contracts | (362,161 | ) | ||
Foreign currency transactions | 20,895 | |||
Net change in unrealized gain (loss) on: | ||||
Investments | 918,304 | |||
Futures contracts | (110,933 | ) | ||
Swap contracts | (173,057 | ) | ||
Forward foreign currency exchange contracts | 39,211 | |||
Foreign currency translation | 11,021 | |||
| Net realized and unrealized loss | (681,296 | ) | ||
| NET DECREASE IN NET ASSETS RESULTING FROM OPERATIONS | $ | (407,521 | ) | |
(a) Class specific Distribution and Service, and Transfer Agency fees were as follows:
| Distribution and Service Fees | Transfer Agency Fees | |||||||||||||||||
Service | Advisor | Institutional | Service | Advisor | ||||||||||||||
| $ | 12 | $ | 14,011 | $ | 2,458 | $ | 2 | $ | 700 | |||||||||
| The accompanying notes are an integral part of these financial statements. | 21 |
GOLDMAN SACHS VARIABLE INSURANCE TRUST STRATEGIC INCOME FUND
Statements of Changes in Net Assets
| For the Six Months Ended June 30, 2016 (Unaudited) | For the Fiscal Year Ended December 31, 2015 | |||||||
| From operations: | ||||||||
Net investment income | $ | 273,775 | $ | 471,993 | ||||
Net realized loss | (1,365,842 | ) | (175,206 | ) | ||||
Net change in unrealized gain (loss) | 684,546 | (847,108 | ) | |||||
| Net decrease in net assets resulting from operations | (407,521 | ) | (550,321 | ) | ||||
| Distributions to shareholders: | ||||||||
From net investment income | ||||||||
Institutional Shares | (264,996 | ) | (743,475 | ) | ||||
Service Shares | (94 | ) | (250 | ) | ||||
Advisor Shares | (71,557 | ) | (97,996 | ) | ||||
| Total distributions to shareholders | (336,647 | ) | (841,721 | ) | ||||
| From share transactions: | ||||||||
Proceeds from sales of shares | 4,197,700 | 16,426,940 | ||||||
Reinvestment of distributions | 336,647 | 841,721 | ||||||
Cost of shares redeemed | (8,418,007 | ) | (1,527,322 | ) | ||||
| Net increase (decrease) in net assets resulting from share transactions | (3,883,660 | ) | 15,741,339 | |||||
| TOTAL INCREASE (DECREASE) | (4,627,828 | ) | 14,349,297 | |||||
| Net assets: | ||||||||
Beginning of period | 33,712,207 | 19,362,910 | ||||||
End of period | $ | 29,084,379 | $ | 33,712,207 | ||||
| Undistributed net investment income | $ | 34,426 | $ | 97,298 | ||||
| 22 | The accompanying notes are an integral part of these financial statements. |
GOLDMAN SACHS VARIABLE INSURANCE TRUST STRATEGIC INCOME FUND
Financial Highlights
Selected Data for a Share Outstanding Throughout Each Period
| Income (loss) from investment operations | ||||||||||||||||||||||||||||||||||||||||||||||||
| Year - Share Class | Net asset value, beginning of period | Net investment loss(a) | Net realized and unrealized loss | Total from investment operations | Distribution to shareholders from net investment income | Net asset value, end of period | Total return(b) | Net assets, end of period (in 000s) | Ratio of net expenses to average net assets | Ratio of total expenses to average net assets | Ratio of to average net | Portfolio turnover rate(c) | ||||||||||||||||||||||||||||||||||||
FOR THE SIX MONTHS ENDED JUNE 30, (UNAUDITED) | ||||||||||||||||||||||||||||||||||||||||||||||||
2016 - Institutional | $ | 9.25 | $ | 0.08 | $ | (0.19 | ) | $ | (0.11 | ) | $ | (0.10 | ) | $ | 9.04 | (1.29 | )% | $ | 20,805 | 0.83 | %(d) | 1.48 | %(d) | 1.81 | %(d) | 70 | % | |||||||||||||||||||||
2016 - Service | 9.25 | 0.07 | (0.19 | ) | (0.12 | ) | (0.09 | ) | 9.04 | (1.31 | ) | 10 | 1.11 | (d) | 1.77 | (d) | 1.56 | (d) | 70 | |||||||||||||||||||||||||||||
2016 - Advisor | 9.23 | 0.07 | (0.19 | ) | (0.12 | ) | (0.09 | ) | 9.02 | (1.45 | ) | 8,270 | 1.23 | (d) | 1.89 | (d) | 1.47 | (d) | 70 | |||||||||||||||||||||||||||||
FOR THE FISCAL YEAR ENDED DECEMBER 31, | ||||||||||||||||||||||||||||||||||||||||||||||||
2015 - Institutional | 9.70 | 0.16 | (0.34 | ) | (0.18 | ) | (0.27 | ) | 9.25 | (1.81 | ) | 28,036 | 0.86 | 1.82 | 1.71 | 176 | ||||||||||||||||||||||||||||||||
2015 - Service | 9.70 | 0.14 | (0.35 | ) | (0.21 | ) | (0.24 | ) | 9.25 | (2.16 | ) | 10 | 1.14 | 2.09 | 1.44 | 176 | ||||||||||||||||||||||||||||||||
2015 - Advisor | 9.69 | 0.13 | (0.36 | ) | (0.23 | ) | (0.23 | ) | 9.23 | (2.25 | ) | 5,666 | 1.26 | 2.26 | 1.35 | 176 | ||||||||||||||||||||||||||||||||
FOR THE PERIOD ENDED DECEMBER 31, | ||||||||||||||||||||||||||||||||||||||||||||||||
2014 - Institutional (Commenced April 14, 2014) | 10.00 | 0.09 | (0.14 | ) | (0.05 | ) | (0.25 | ) | 9.70 | (0.51 | ) | 18,180 | 0.86 | (d) | 2.77 | (d) | 1.23 | (d) | 157 | |||||||||||||||||||||||||||||
2014 - Service (Commenced April 14, 2014) | 10.00 | 0.07 | (0.14 | ) | (0.07 | ) | (0.23 | ) | 9.70 | (0.70 | ) | 10 | 1.13 | (d) | 3.05 | (d) | 0.96 | (d) | 157 | |||||||||||||||||||||||||||||
2014 - Advisor (Commenced April 14, 2014) | 10.00 | 0.09 | (0.17 | ) | (0.08 | ) | (0.23 | ) | 9.69 | (0.79 | ) | 1,173 | 1.26 | (d) | 2.64 | (d) | 1.30 | (d) | 157 | |||||||||||||||||||||||||||||
| (a) | Calculated based on the average shares outstanding methodology. |
| (b) | Assumes investment at the net asset value at the beginning of the period, reinvestment of all distributions, and a complete redemption of the investment at the net asset value at the end of the period. Total returns for periods less than one full year are not annualized. |
| (c) | The Fund’s portfolio turnover rate is calculated in accordance with regulatory requirements, without regard to transactions involving short term investments and certain derivatives. If such transactions were included, the Fund’s portfolio turnover rate may be higher. |
| (d) | Annualized. |
| The accompanying notes are an integral part of these financial statements. | 23 |
GOLDMAN SACHS VARIABLE INSURANCE TRUST STRATEGIC INCOME FUND
Notes to Financial Statements
June 30, 2016 (Unaudited)
1. ORGANIZATION
Goldman Sachs Variable Insurance Trust (the “Trust” or “VIT”) is a Delaware statutory trust registered under the Investment Company Act of 1940, as amended (the “Act”), as an open-end management investment company. The Trust includes the Goldman Sachs Strategic Income Fund (the “Fund”). The Fund is a diversified Portfolio under the Act offering three classes of shares — Institutional, Service and Advisor Shares. Shares of the Trust are offered to separate accounts of participating life insurance companies for the purpose of funding variable annuity contracts and variable life insurance policies.
Goldman Sachs Asset Management, L.P. (“GSAM”), an affiliate of Goldman, Sachs & Co. (“Goldman Sachs”), serves as investment adviser to the Fund pursuant to a management agreement (the “Agreement”) with the Trust.
2. SIGNIFICANT ACCOUNTING POLICIES
The financial statements have been prepared in accordance with accounting principles generally accepted in the United States of America (“GAAP”) and require management to make estimates and assumptions that may affect the reported amounts and disclosures. Actual results may differ from those estimates and assumptions.
A. Investment Valuation — The Fund’s valuation policy is to value investments at fair value.
B. Investment Income and Investments — Investment income includes interest income, dividend income, net of any foreign withholding taxes, less any amounts reclaimable, and securities lending income. Interest income is accrued daily and adjusted for amortization of premiums and accretion of discounts. Dividend income is recognized on ex-dividend date or, for certain foreign securities, as soon as such information is obtained subsequent to the ex-dividend date. Investment transactions are reflected on trade date. Realized gains and losses are calculated using identified cost. Investment transactions are recorded on the following business day for daily net asset value (“NAV”) calculations. Any foreign capital gains tax is accrued daily based upon net unrealized gains, and is payable upon sale of such investments.
For derivative contracts, realized gains and losses are recorded upon settlement of the contract. Upfront payments, if any, are made or received upon entering into a swap agreement and are reflected in the Statement of Assets and Liabilities. Upfront payments are recognized over the contract’s term/event as realized gains or losses, with the exception of forward starting interest rate swaps whose realized gains or losses are recognized from the effective start date. For securities with paydown provisions, principal payments received are treated as a proportionate reduction to the cost basis of the securities, and excess or shortfall amounts are recorded as income. For treasury inflation protected securities (“TIPS”), adjustments to principal due to inflation/deflation are reflected as increases/decreases to interest income with a corresponding adjustment to cost.
C. Class Allocations and Expenses — Investment income, realized and unrealized gain (loss), and non-class specific expenses of the Fund are allocated daily based upon the proportion of net assets of each class. Non-class specific expenses directly incurred by the Fund are charged to the Fund, while such expenses incurred by the Trust are allocated across the Fund on a straight-line and/or pro-rata basis depending upon the nature of the expenses. Class specific expenses, where applicable, are borne by the respective share classes and include Distribution and Service and Transfer Agency fees.
D. Federal Taxes and Distributions to Shareholders — It is the Fund’s policy to comply with the requirements of the Internal Revenue Code of 1986, as amended (the “Code”), applicable to regulated investment companies (mutual funds) and to distribute each year substantially all of its investment company taxable income and capital gains to its shareholders. Accordingly, the Fund is not required to make any provisions for the payment of federal income tax. Distributions to shareholders are recorded on the ex-dividend date. Income distributions are declared and paid quarterly and capital gains distributions, if any, are declared and paid annually.
Net capital losses are carried forward to future fiscal years and may be used to the extent allowed by the Code to offset any future capital gains. Losses that are carried forward will retain their character as either short-term or long-term capital losses. Utilization of capital loss carryforwards will reduce the requirement of future capital gains distributions.
24
GOLDMAN SACHS VARIABLE INSURANCE TRUST STRATEGIC INCOME FUND
2. SIGNIFICANT ACCOUNTING POLICIES (continued)
The characterization of distributions to shareholders for financial reporting purposes is determined in accordance with federal income tax rules, which may differ from GAAP. The source of the Fund’s distributions may be shown in the accompanying financial statements as either from net investment income, net realized gain or capital. Certain components of the Fund’s net assets on the Statement of Assets and Liabilities reflect permanent GAAP/tax differences based on the appropriate tax character.
E. Foreign Currency Translation — The accounting records and reporting currency of the Fund are maintained in United States (“U.S.”) dollars. Assets and liabilities denominated in foreign currencies are translated into U.S. dollars using the current exchange rates at the close of each business day. The effect of changes in foreign currency exchange rates on investments is included within net realized and unrealized gain (loss) on investments. Changes in the value of other assets and liabilities as a result of fluctuations in foreign exchange rates are included in the Statement of Operations within net change in unrealized gain (loss) on foreign currency translations. Transactions denominated in foreign currencies are translated into U.S. dollars on the date the transaction occurred, the effects of which are included within net realized gain (loss) on foreign currency transactions.
3. INVESTMENTS AND FAIR VALUE MEASUREMENTS
The fair value of a financial instrument is the amount that would be received to sell an asset or paid to transfer a liability in an orderly transaction between market participants at the measurement date (i.e., the exit price). GAAP establishes a fair value hierarchy that prioritizes the inputs to valuation techniques used to measure fair value. The hierarchy gives the highest priority to unadjusted quoted prices in active markets for identical assets or liabilities (Level 1 measurements) and the lowest priority to unobservable inputs (Level 3 measurements). The levels used for classifying investments are not necessarily an indication of the risk associated with investing in these investments. The three levels of the fair value hierarchy are described below:
Level 1 — Unadjusted quoted prices in active markets that are accessible at the measurement date for identical, unrestricted assets or liabilities;
Level 2 — Quoted prices in markets that are not active or financial instruments for which significant inputs are observable (including, but not limited to, quoted prices for similar investments, interest rates, foreign exchange rates, volatility and credit spreads), either directly or indirectly;
Level 3 — Prices or valuations that require significant unobservable inputs (including GSAM’s assumptions in determining fair value measurement).
Changes in valuation techniques may result in transfers into or out of an assigned level within the hierarchy. In accordance with the Fund’s policy, transfers between different levels of the fair value hierarchy resulting from such changes are deemed to have occurred as of the beginning of the reporting period.
The Board of Trustees (“Trustees”) has approved Valuation Procedures that govern the valuation of the portfolio investments held by the Fund, including investments for which market quotations are not readily available. The Trustees have delegated to GSAM day-to-day responsibility for implementing and maintaining internal controls and procedures related to the valuation of the Fund’s portfolio investments. To assess the continuing appropriateness of pricing sources and methodologies, GSAM regularly performs price verification procedures and issues challenges as necessary to third party pricing vendors or brokers, and any differences are reviewed in accordance with the Valuation Procedures.
A. Level 1 and Level 2 Fair Value Investments — The valuation techniques and significant inputs used in determining the fair values for investments classified as Level 1 and Level 2 are as follows:
Equity Securities — Equity securities traded on a U.S. securities exchange or the NASDAQ system, or those located on certain foreign exchanges, including but not limited to the Americas, are valued daily at their last sale price or official closing price on the principal exchange or system on which they are traded. If there is no sale or official closing price or such price is believed by GSAM to not represent fair value, equity securities are valued at the last bid price for long positions and at the last ask price for short positions. To the extent these investments are actively traded, they are classified as Level 1 of the fair value hierarchy, otherwise they are generally classified as Level 2.
25
GOLDMAN SACHS VARIABLE INSURANCE TRUST STRATEGIC INCOME FUND
Notes to Financial Statements (continued)
June 30, 2016 (Unaudited)
3. INVESTMENTS AND FAIR VALUE MEASUREMENTS (continued)
Unlisted equity securities for which market quotations are available are valued at the last sale price on the valuation date, or if no sale occurs, at the last bid price. Securities traded on certain foreign securities exchanges are valued daily at fair value determined by an independent fair value service (if available) under Valuation Procedures approved by the Trustees and consistent with applicable regulatory guidance. The independent fair value service takes into account multiple factors including, but not limited to, movements in the securities markets, certain depositary receipts, futures contracts and foreign currency exchange rates that have occurred subsequent of the close of the foreign securities exchange. These investments are generally classified as Level 2 of the fair value hierarchy.
Money Market Funds — Investments in the Goldman Sachs Financial Square Government Fund (“Underlying Fund”) are valued at the NAV of the FST Institutional Share class on the day of valuation. These investments are generally classified as Level 1 of the fair value hierarchy. For information regarding an Underlying Fund’s accounting policies and investment holdings, please see the Underlying Fund’s shareholder report.
Debt Securities — Debt securities for which market quotations are readily available are valued daily on the basis of quotations supplied by dealers or an independent pricing service approved by the Trustees. The pricing services may use valuation models or matrix pricing, which consider: (i) yield or price with respect to bonds that are considered comparable in characteristics such as rating, interest rate and maturity date or (ii) quotations from securities dealers to determine current value. Short-term debt obligations that mature in sixty days or less and that do not exhibit signs of credit deterioration are valued at amortized cost, which approximates fair value. With the exception of treasury securities of G8 countries (not held in money market funds), which are generally classified as Level 1, these investments are generally classified as Level 2 of the fair value hierarchy.
i. Bank Loans — Bank loans (“Loans”) are interests in amounts owed by corporate, governmental, or other borrowers to lenders or lending syndicates. Loans are arranged through private negotiations between the borrower and one or more financial institutions (“Lenders”). A Fund’s investments in Loans are in the form of either participations in Loans (“Participations”) or assignments of all or a portion of Loans from third parties (“Assignments”). With respect to Participations, a Fund has the right to receive payments of principal, interest and any fees to which it is entitled from the Lender selling the Participations and only upon receipt by the Lender of the payments from the borrower. A Fund generally has no right to enforce compliance by the borrower with the terms of the loan agreement with respect to Participations. Conversely, Assignments result in a Fund having a direct contractual relationship with the borrower, and the Fund may be permitted to enforce compliance by the borrower with the terms of the loan agreement.
ii. Inverse Floaters — The interest rate on inverse floating rate securities (“inverse floaters”) resets in the opposite direction from the market rate of interest to which the inverse floaters are indexed. An inverse floater may be considered to be leveraged to the extent that its interest rate varies by a magnitude that exceeds the magnitude of the change in the index rate of interest. The higher the degree of leverage of an inverse floater, the greater the volatility of its market value.
iii. Mortgage-Backed and Asset-Backed Securities — Mortgage-backed securities represent direct or indirect participations in, or are collateralized by and payable from, mortgage loans secured by residential and/or commercial real estate property. Asset-backed securities include securities whose principal and interest payments are collateralized by pools of other assets or receivables. The value of certain mortgage-backed and asset-backed securities (including adjustable rate mortgage loans) may be particularly sensitive to changes in prevailing interest rates. The value of these securities may also fluctuate in response to the market’s perception of the creditworthiness of the issuers.
Asset-backed securities may present credit risks that are not presented by mortgage-backed securities because they generally do not have the benefit of a security interest in collateral that is comparable to mortgage assets. Some asset-backed securities may only have a subordinated claim on collateral.
Stripped mortgage-backed securities are usually structured with two different classes: one that receives substantially all interest payments (interest-only, or “IO” and/or high coupon rate with relatively low principal amount, or “IOette”), and the other that receives substantially all principal payments (principal-only, or “PO”) from a pool of mortgage loans. Little to no
26
GOLDMAN SACHS VARIABLE INSURANCE TRUST STRATEGIC INCOME FUND
3. INVESTMENTS AND FAIR VALUE MEASUREMENTS (continued)
principal will be received at the maturity of an IO; as a result, periodic adjustments are recorded to reduce the cost of the security until maturity. These adjustments are included in interest income.
iv. Treasury Inflation Protected Securities — TIPS are treasury securities in which the principal amount is adjusted daily to keep pace with inflation, as measured by the U.S. Consumer Pricing Index for Urban Consumers. The repayment of the original bond principal upon maturity is guaranteed by the full faith and credit of the U.S. Government.
v. When-Issued Securities and Forward Commitments — When-issued securities, including TBA (“To Be Announced”) securities, are securities that are authorized but not yet issued in the market and purchased in order to secure what is considered to be an advantageous price or yield to a Fund. A forward commitment involves entering into a contract to purchase or sell securities, typically on an extended settlement basis, for a fixed price at a future date. The purchase of securities on a when-issued or forward commitment basis involves a risk of loss if the value of the security to be purchased declines before the settlement date. Conversely the sale of securities on a forward commitment basis involves the risk that the value of the securities sold may increase before the settlement date. Although a Fund will generally purchase securities on a when-issued or forward commitment basis with the intention of acquiring the securities for its portfolio, the Fund may dispose of when-issued securities or forward commitments prior to settlement, which may result in a realized gain or loss.
Derivative Contracts — A derivative is an instrument whose value is derived from underlying assets, indices, reference rates or a combination of these factors. The Fund enters into derivative transactions to hedge against changes in interest rates, securities prices, and/or currency exchange rates, to increase total return, or to gain access to certain markets or attain exposure to other underliers.
Exchange-traded derivatives, including futures and options contracts, are valued at the last sale or settlement price and typically fall within Level 1 of the fair value hierarchy. Over-the-counter (“OTC”) and centrally cleared derivatives are valued using market transactions and other market evidence, including market-based inputs to models, calibration to market-clearing transactions, broker or dealer quotations, or other alternative pricing sources. Where models are used, the selection of a particular model to value OTC and centrally cleared derivatives depends upon the contractual terms of, and specific risks inherent in, the instrument, as well as the availability of pricing information in the market. Valuation models require a variety of inputs, including contractual terms, market prices, yield curves, credit curves, measures of volatility, voluntary and involuntary prepayment rates, loss severity rates and correlations of such inputs. For OTC and centrally cleared derivatives that trade in liquid markets, model inputs can generally be verified and model selection does not involve significant management judgment. OTC and centrally cleared derivatives are classified within Level 2 of the fair value hierarchy when significant inputs are corroborated by market evidence.
i. Forward Contracts — A forward contract is a contract between two parties to buy or sell an asset at a specified price on a future date. A forward contract settlement can occur on a cash or delivery basis. Forward contracts are marked-to-market daily using independent vendor prices, and the change in value, if any, is recorded as an unrealized gain or loss. Cash and certain investments may be used to collateralize forward contracts.
A forward foreign currency contract is a forward contract in which the Fund agrees to receive or deliver a fixed quantity of one currency for another, at a pre-determined price at a future date. All forward foreign currency exchange contracts are marked-to-market daily at the applicable forward rate. Non-deliverable forward foreign currency exchange contracts are settled with the counterparty in cash without the delivery of foreign currency.
ii. Futures Contracts — Futures contracts are contracts to buy or sell a standardized quantity of a specified commodity or security and are valued based on exchanged settlement prices or independent market quotes. Futures contracts are valued at the last settlement price, or in the absence of a sale, the last bid price for long positions and at the last ask price for short positions, at the end of each day on the board of trade or exchange upon which they are traded. Upon entering into a futures contract, the Fund deposits cash or securities in an account on behalf of the broker in an amount sufficient to meet the initial margin requirement. Subsequent payments are made or received by the Fund equal to the daily change in the contract value and are recorded as variation margin receivable or payable with a corresponding offset to unrealized gains or losses.
27
GOLDMAN SACHS VARIABLE INSURANCE TRUST STRATEGIC INCOME FUND
Notes to Financial Statements (continued)
June 30, 2016 (Unaudited)
3. INVESTMENTS AND FAIR VALUE MEASUREMENTS (continued)
iii. Option Contracts — When a Fund writes call or put option contracts, an amount equal to the premium received is recorded as a liability and is subsequently marked-to-market to reflect the current value of the option written. Swaptions are options on interest rate swap contracts.
Upon the purchase of a call option or a put option by a Fund, the premium paid is recorded as an investment and subsequently marked-to-market to reflect the current value of the option. Certain options may be purchased with premiums to be determined on a future date. The premiums for these options are based upon implied volatility parameters at specified terms.
iv. Swap Contracts — Bilateral swap contracts are agreements in which a Fund and a counterparty agree to exchange periodic payments on a specified notional amount or make a net payment upon termination. Bilateral swap transactions are privately negotiated in the OTC market and payments are settled through direct payments between a Fund and the counterparty. By contrast, certain swap transactions are subject to mandatory central clearing. These swaps are executed through a derivatives clearing member (“DCM”), acting in an agency capacity, and submitted to a central counterparty (“CCP”) (“centrally cleared swaps”), in which case all payments are settled with the CCP through the DCM. Swaps are marked-to-market daily using pricing vendor quotations, counterparty or clearinghouse prices or model prices, and the change in value, if any, is recorded as an unrealized gain or loss. Upon entering into a swap contract, a Fund is required to satisfy an initial margin requirement by delivering cash or securities to the counterparty (or in some cases, segregated in a triparty account on behalf of the counterparty), which can be adjusted by any mark-to-market gains or losses pursuant to bilateral or centrally cleared arrangements. For centrally cleared swaps the daily change in valuation, if any, is recorded as a receivable or payable for variation margin.
An interest rate swap is an agreement that obligates two parties to exchange a series of cash flows at specified intervals, based upon or calculated by reference to changes in interest rates on a specified notional principal amount. The payment flows are usually netted against each other, with the difference being paid by one party to the other.
A credit default swap is an agreement that involves one party (the buyer of protection) making a stream of payments to another party (the seller of protection) in exchange for the right to receive protection on a reference security or obligation, including a group of assets or exposure to the performance of an index. A Fund’s investment in credit default swaps may involve greater risks than if the Fund had invested in the referenced obligation directly. Credit events are contract specific but may include bankruptcy, failure to pay, restructuring and obligation acceleration. If a Fund buys protection through a credit default swap and no credit event occurs, its payments are limited to the periodic payments previously made to the counterparty. Upon the occurrence of a specified credit event, a Fund, as a buyer of credit protection, is entitled to receive an amount equal to the notional amount of the swap and deliver to the seller the defaulted reference obligation in a physically settled trade. A Fund may also receive a net settlement amount in the form of cash or securities equal to the notional amount of the swap reduced by the recovery value of the reference obligation in a cash settled trade.
As a seller of protection, a Fund generally receives a payment stream throughout the term of the swap, provided that there is no credit event. In addition, if a Fund sells protection through a credit default swap, a Fund could suffer a loss because the value of the referenced obligation and the premium payments received may be less than the notional amount of the swap paid to the buyer of protection. Upon the occurrence of a specified credit event, a Fund, as a seller of credit protection, may be required to take possession of the defaulted reference obligation and pay the buyer an amount equal to the notional amount of the swap in a physically settled trade. A Fund may also pay a net settlement amount in the form of cash or securities equal to the notional amount of the swap reduced by the recovery value of the reference obligation in cash settled trade. Recovery values are at times established through the credit event auction process in which market participants are ensured that a transparent price has been set for the defaulted security or obligation. In addition, a Fund is entitled to a return of any assets, which have been pledged as collateral to the counterparty upon settlement.
The maximum potential amount of future payments (undiscounted) that a Fund as seller of protection could be required to make under a credit default swap would be an amount equal to the notional amount of the agreement. These potential amounts would be partially offset by any recovery values of the respective referenced obligations or net amounts received from a settlement of a credit default swap for the same reference security or obligation where a Fund bought credit protection.
28
GOLDMAN SACHS VARIABLE INSURANCE TRUST STRATEGIC INCOME FUND
3. INVESTMENTS AND FAIR VALUE MEASUREMENTS (continued)
Short Term Investments — Short-term investments having a maturity of 60 days or less are generally valued at amortized cost which approximates fair market value. These investments are classified as Level 2 of the fair value hierarchy.
B. Level 3 Fair Value Investments — To the extent that significant inputs to valuation models and other alternative pricing sources are unobservable, or if quotations are not readily available, or if GSAM believes that such quotations do not accurately reflect fair value, the fair value of the Fund’s investments may be determined under Valuation Procedures approved by the Trustees. GSAM, consistent with its procedures and applicable regulatory guidance, may make an adjustment to the most recent valuation prices of either domestic or foreign securities in light of significant events to reflect what it believes to be the fair value of the securities at the time of determining a Fund’s NAV. Significant events which could affect a large number of securities in a particular market may include, but are not limited to: significant fluctuations in U.S. or foreign markets; market dislocations; market disruptions; or unscheduled market closings. Significant events which could also affect a single issuer may include, but are not limited to: corporate actions such as reorganizations, mergers and buy-outs; ratings downgrades; and bankruptcies.
C. Fair Value Hierarchy — The following is a summary of the Fund’s investments and derivatives classified in the fair value hierarchy as of June 30, 2016:
| Investment Type | Level 1 | Level 2 | Level 3 | |||||||||
| Assets | ||||||||||||
| Common Stock and/or Other Equity Investments(a) | ||||||||||||
North America | $ | — | $ | — | $ | 63,766 | ||||||
| Fixed Income | ||||||||||||
Corporate Obligations | — | 1,002,054 | — | |||||||||
Mortgage-Backed Obligations | — | 3,077,111 | — | |||||||||
U.S. Treasury Obligations and/or Other U.S. Government Agencies | 11,480,038 | — | — | |||||||||
Agency Debenture | — | 1,999,359 | — | |||||||||
Asset-Backed Securities | — | 5,240,901 | — | |||||||||
Foreign Debt Obligations | 735,234 | 1,428,734 | — | |||||||||
Municipal Debt Obligations | — | 445,719 | — | |||||||||
Bank Loans | — | 164,896 | 21,063 | |||||||||
| Investment Company | 1,451,599 | — | — | |||||||||
| Total | $ | 13,666,871 | $ | 13,358,774 | $ | 84,829 | ||||||
| Derivative Type | ||||||||||||
| Assets(b) | ||||||||||||
| Forward Foreign Currency Exchange Contracts | $ | — | $ | 349,393 | $ | — | ||||||
| Futures Contracts | — | — | — | |||||||||
| Interest Rate Swaps Contracts | — | 376,875 | — | |||||||||
| Total | $ | — | $ | 726,268 | $ | — | ||||||
| Liabilities(b) | ||||||||||||
| Forward Foreign Currency Exchange Contracts | $ | — | $ | (330,280 | ) | $ | — | |||||
| Futures Contracts | (99,030 | ) | — | — | ||||||||
| Credit Default Swaps Contracts | — | (53,023 | ) | — | ||||||||
| Interest Rate Swaps Contracts | — | (399,176 | ) | — | ||||||||
| Total | $ | (99,030 | ) | $ | (782,479 | ) | $ | — | ||||
| (a) | Amounts are disclosed by continent to highlight the impact of time zone differences between local market close and the calculation of NAV. Security valuations are based on the principal exchange or system on which they are traded, which may differ from country of domicile noted in table. |
29
GOLDMAN SACHS VARIABLE INSURANCE TRUST STRATEGIC INCOME FUND
Notes to Financial Statements (continued)
June 30, 2016 (Unaudited)
3. INVESTMENTS AND FAIR VALUE MEASUREMENTS (continued)
| (b) | Amount shown represents unrealized gain (loss) at period end. |
For further information regarding security characteristics, see the Schedule of Investments.
4. INVESTMENTS IN DERIVATIVES
The following table sets forth, by certain risk types, the gross value of derivative contracts as of June 30, 2016. These instruments were used as part of the Fund’s investment strategies and to obtain and/or manage exposure related to the risks below. The values in the table below exclude the effects of cash collateral received or posted pursuant to these derivative contracts, and therefore are not representative of the Fund’s net exposure.
| Risk | Statement of Assets and Liabilities | Assets | Statement of Assets and Liabilities | Liabilities | ||||||||||
| Credit | — | $ | — | Payable for unrealized loss on swap contracts and variation margin on certain derivative contracts | $ | (53,023 | )(a) | |||||||
| Currency | Receivable for unrealized gain on forward foreign currency exchange contracts | 349,393 | Payable for unrealized loss on forward foreign currency exchange contracts | (330,280 | ) | |||||||||
| Interest Rate | Receivable for unrealized gain on swap contracts and variation margin on certain derivative contracts | 376,875 | Payable for unrealized loss on swap contracts and variation margin on certain derivative contracts | (498,206 | )(a) | |||||||||
| Total | $ | 726,268 | $ | (881,509 | ) | |||||||||
| (a) | Includes unrealized gain (loss) on futures contracts and centrally cleared swap contracts described in the Additional Investment Information section of the Schedule of Investments. Only current day’s variation margin is reported within the Statement of Assets and Liabilities. |
The following table sets forth, by certain risk types, the Fund’s gains (losses) related to these derivatives and their indicative volumes for the six months ended June 30, 2016. These gains (losses) should be considered in the context that these derivative contracts may have been executed to create investment opportunities and/or economically hedge certain investments, and accordingly, certain gains (losses) on such derivative contracts may offset certain (losses) gains attributable to investments. These gains (losses) are included in “Net realized gain (loss)” or “Net change in unrealized gain (loss)” on the Statement of Operations:
| Risk | Statement of Operations | Net Realized Gain (Loss) | Net Change in Unrealized Gain (Loss) | Average Number of Contracts(a) | ||||||||||
| Credit | Net realized gain (loss) from swap contracts/Net change in unrealized gain (loss) on swap contracts | $ | (172,617 | ) | $ | (33,848 | ) | 10 | ||||||
| Currency | Net realized gain (loss) from forward foreign currency exchange contracts/Net change in unrealized gain (loss) on forward foreign currency exchange contracts | (362,161 | ) | 39,211 | 340 | |||||||||
| Interest Rate | Net realized gain (loss) from investments, future contracts and swap contracts/Net change in unrealized gain (loss) on future contracts and swap contracts | (592,986 | ) | (250,142 | ) | 88 | ||||||||
| Total | $ | (1,127,764 | ) | $ | (244,779 | ) | 438 | |||||||
| (a) | Average number of contracts is based on the average of month end balances for the six months ended June 30, 2016. |
In order to better define its contractual rights and to secure rights that will help the Fund mitigate its counterparty risk, the Fund may enter into an International Swaps and Derivatives Association, Inc. Master Agreement (“ISDA Master Agreement”) or similar agreement with its derivatives counterparties. An ISDA Master Agreement is a bilateral agreement between the Fund and a counterparty that governs OTC derivatives (including forward foreign currency exchange contracts, and certain options and swaps), and typically contains, among other things, collateral posting terms and netting provisions in the event of a default and/or
30
GOLDMAN SACHS VARIABLE INSURANCE TRUST STRATEGIC INCOME FUND
4. INVESTMENTS IN DERIVATIVES (continued)
termination event. The provisions of the ISDA Master Agreement typically permit a single net payment in the event of a default (close-out netting) or similar event, including the bankruptcy or insolvency of the counterparty.
Collateral and margin requirements differ between exchange traded derivatives and OTC derivatives. Margin requirements are established by the broker or clearing house for exchange-traded and centrally cleared derivatives (financial futures contracts, options and centrally cleared swaps) pursuant to governing agreements for those instrument types. Brokers can ask for margin in excess of the minimum in certain circumstances. Collateral terms are contract-specific for OTC derivatives. For derivatives traded under an ISDA Master Agreement, the collateral requirements are typically calculated by netting the marked to market amount for each transaction under such agreement and comparing that amount to the value of any collateral currently pledged by the Fund and the counterparty. Additionally, the Fund may be required to post initial margin to the counterparty, the terms of which would be outlined in the confirmation of the OTC transaction.
For financial reporting purposes, cash collateral that has been pledged to cover obligations of the Fund and cash collateral received from the counterparty, if any, is reported separately on the Statement of Assets and Liabilities as receivables/payables for collateral on certain derivative contracts. Non-cash collateral pledged by the Fund, if any, is noted in the Schedule of Investments. Generally, the amount of collateral due from or to a counterparty must exceed a minimum transfer amount threshold before a transfer is required to be made. To the extent amounts due to a Fund from its counterparties are not fully collateralized, contractually or otherwise, the Fund bears the risk of loss from counterparty nonperformance. A Fund attempts to mitigate counterparty risk by only entering into agreements with counterparties that the Investment Adviser believes to be of good standing and by monitoring the financial stability of those counterparties.
Additionally, the netting of assets and liabilities and the offsetting of collateral pledged or received are based on contractual netting/set-off provisions in the ISDA Master Agreement or similar agreements. However, in the event of a default or insolvency of a counterparty, a court could determine that such rights are not enforceable due to the restrictions or prohibitions against the right of setoff that may be imposed in accordance with a particular jurisdiction’s bankruptcy or insolvency laws.
The following table sets forth the Fund’s net exposure for derivative instruments that are subject to enforceable master netting arrangements or similar agreements as of June 30, 2016.
Derivative Assets(1) | Derivative Liabilities(1) |
|
|
| ||||||||||||||||||||||||
| Counterparty | Forwards | Swaps | Forwards | Swaps | Net Derivative Assets (Liabilities) | Collateral (Received) Pledged(1) | Net Amount(2) | |||||||||||||||||||||
| Bank of America, N.A. | $ | 16,639 | $ | 18,917 | $ | (5,945 | ) | $ | (39,829 | ) | $ | (10,218 | ) | $ | 5,945 | $ | (4,273 | ) | ||||||||||
| Barclays Bank PLC | 13,513 | — | (29,894 | ) | (2 | ) | (16,383 | ) | 29,894 | 13,511 | ||||||||||||||||||
| BNP Paribas SA | 12,653 | — | (11,393 | ) | — | 1,260 | 11,393 | 12,653 | ||||||||||||||||||||
| Citibank, N.A. | 95,318 | — | (97,409 | ) | — | (2,091 | ) | 97,409 | 95,318 | |||||||||||||||||||
| Deutsche Bank AG | 36,397 | 6,166 | (30,910 | ) | — | 11,653 | 30,910 | 42,563 | ||||||||||||||||||||
| JPMorgan Chase Bank, N.A. | 18,892 | 5,558 | (24,985 | ) | (11,688 | ) | (12,223 | ) | 24,985 | 12,762 | ||||||||||||||||||
| Merrill Lynch & Co., Inc. | 1,846 | — | — | — | 1,846 | — | 1,846 | |||||||||||||||||||||
| Morgan Stanley Co., Inc. | 58,732 | — | (26,747 | ) | — | 31,985 | 26,747 | 58,732 | ||||||||||||||||||||
| Royal Bank of Canada | 11,596 | — | (37,138 | ) | — | (25,542 | ) | 37,138 | 11,596 | |||||||||||||||||||
| Royal Bank of Scotland | 3,439 | — | (18,574 | ) | — | (15,135 | ) | 18,574 | 3,439 | |||||||||||||||||||
| State Street Bank | 8,072 | — | (14,505 | ) | — | (6,433 | ) | 14,505 | 8,072 | |||||||||||||||||||
| UBS AG | 8,485 | — | (11,215 | ) | — | (2,730 | ) | 11,215 | 8,485 | |||||||||||||||||||
| Westpac Banking Corp. | 63,811 | — | (21,565 | ) | — | 42,246 | 21,565 | 63,811 | ||||||||||||||||||||
| Total | $ | 349,393 | $ | 30,641 | $ | (330,280 | ) | $ | (51,519 | ) | $ | (1,765 | ) | $ | 330,280 | $ | 328,515 | |||||||||||
| (1) | Gross amounts available for offset but not netted in the Statement of Assets and Liabilities. |
| (2) | Net amount represents the net amount due (to) from counterparty in the event of a default based on the contractual set-off rights under the agreement. |
31
GOLDMAN SACHS VARIABLE INSURANCE TRUST STRATEGIC INCOME FUND
Notes to Financial Statements (continued)
June 30, 2016 (Unaudited)
5. AGREEMENTS AND AFFILIATED TRANSACTIONS
A. Management Agreement — Under the Agreement, GSAM manages the Fund, subject to the general supervision of the Trustees.
As compensation for the services rendered pursuant to the Agreement, the assumption of the expenses related thereto and administration of the Fund’s business affairs, including providing facilities, GSAM is entitled to a management fee, accrued daily and paid monthly, equal to an annual percentage rate of the Fund’s average daily net assets.
For the six months ended June 30, 2016, contractual and effective net management fees with GSAM were at the following rates:
| Contractual Management Rate | Effective Net Management | |||||||||||||||||||||||||
First $1 billion | Next $1 billion | Next $3 billion | Next $3 billion | Over $8 billion | Effective Rate | |||||||||||||||||||||
| 0.60% | 0.54 | % | 0.51 | % | 0.50 | % | 0.49 | % | 0.60 | % | 0.56 | % | ||||||||||||||
| ^ | Effective Net Management Rate includes the impact of management fee waivers of affiliated underlying funds, if any. |
The Fund invests in FST Institutional Shares of the Goldman Sachs Financial Square Government Fund, which is an affiliated Underlying Fund. GSAM has agreed to waive a portion of its management fee payable by the Fund in an amount equal to the management fee it earns as an investment adviser to any of the affiliated Underlying Funds in which the Fund invests. For the six months ended June 30, 2016, GSAM waived $6,367 of the Fund’s management fee.
B. Distribution and Service Plans — The Trust, on behalf of the Fund, has adopted Distribution and Service Plans (the “Plans”). Under each Plan, Goldman Sachs, which serves as distributor (the “Distributor”), is entitled to a fee accrued daily and paid monthly, for distribution services and personal and account maintenance services, which may then be paid by Goldman Sachs to authorized dealers, equal to, on an annual basis, 0.25% and 0.40% of the Fund’s average daily net assets attributable to Service and Advisor Shares, respectively.
C. Transfer Agency Agreement — Goldman Sachs also serves as the transfer agent of the Fund for a fee pursuant to the Transfer Agency Agreement. The fees charged for such transfer agency services are accrued daily and paid monthly at an annual rate of 0.02% of the average daily net assets for Institutional, Service and Advisor Shares.
D. Other Expense Agreements and Affiliated Transactions — GSAM has agreed to limit certain “Other Expenses” of the Fund (excluding acquired fund fees and expenses, transfer agency fees and expenses, taxes, interest, brokerage fees, shareholder meeting, litigation, indemnification and extraordinary expenses) to the extent such expenses exceed, on an annual basis, a percentage rate of the average daily net assets of the Fund. Such Other Expense reimbursements, if any, are accrued daily and paid monthly. In addition, the Fund is not obligated to reimburse GSAM for prior fiscal year expense reimbursements, if any. The Other Expense limitation as an annual percentage rate of average daily net assets for the Fund is 0.254%. The Other Expense limitation will remain in place through at least April 29, 2017, and prior to such date GSAM may not terminate the arrangement without the approval of the Trustees. For the six months ended June 30, 2016, GSAM reimbursed $96,163 to the Fund. In addition, the Fund has entered into certain offset arrangements with the custodian and the transfer agent, which may result in a reduction of the Fund’s expenses and are received irrespective of the application of the “Other Expense” limitations described above. For the six months ended June 30, 2016, custody fee credits were $155.
E. Line of Credit Facility — As of June 30, 2016, the Fund participated in a $1,100,000,000 committed, unsecured revolving line of credit facility (the “facility”) together with other funds of the Trust and registered investment companies having management agreements with GSAM or its affiliates (“Other Borrowers”). This facility is to be used for temporary or emergency purposes, or to allow for an orderly liquidation of securities to meet redemption requests. The interest rate on borrowings is based on the federal funds rate. The facility also requires a fee to be paid by the Fund based on the amount of the commitment that has not been utilized. For the six months ended June 30, 2016, the Fund did not have any borrowings under the facility.
32
GOLDMAN SACHS VARIABLE INSURANCE TRUST STRATEGIC INCOME FUND
5. AGREEMENTS AND AFFILIATED TRANSACTIONS (continued)
F. Other Transactions with Affiliates — The following table provides information about the Fund’s investment in the Goldman Sachs Financial Square Government Fund as of and for the six months ended June 30, 2016:
| Market Value 12/31/15 | Purchases at Cost | Proceeds from Sales | Market Value 6/30/16 | Dividend Income | ||||||||||||||
| $ | 2,716,785 | $ | 27,763,452 | $ | (29,028,638 | ) | $ | 1,451,599 | $ | 10,418 | ||||||||
As of June 30, 2016, the Goldman Sachs Group, Inc. was the beneficial owner of approximately 50% of Institutional Shares and 100% of the Service Shares of the Fund.
6. PORTFOLIO SECURITIES TRANSACTIONS
The cost of purchases and proceeds from sales and maturities of long-term securities for the six months ended June 30, 2016, were as follows:
| Purchases of U.S. Government and Agency Obligations | Purchases (Excluding U.S. Government and Agency Obligations) | Sales and Maturities of U.S. Government and Agency Obligations | Sales and Maturities (Excluding U.S. Government and Agency Obligations) | |||||||||||
| $ | 12,275,072 | $ | 3,862,268 | $ | 13,877,135 | $ | 13,051,383 | |||||||
7. TAX INFORMATION
As of the Fund’s most recent fiscal year end, December 31, 2015, the Fund’s capital loss carryforwards and certain timing differences, on a tax-basis were as follows:
| Capital loss carryforwards: | ||||
Perpetual short-term | (640,285 | ) | ||
Perpetual long-term | (396,121 | ) | ||
| Total capital loss carryforwards | $ | (1,036,406 | ) | |
| Timing differences (Qualified Late Year Loss Deferral/Post October Loss Deferral/Straddle Loss Deferral) | (184,559 | ) |
As of June 30, 2016, the Fund’s aggregate security unrealized gains and losses based on cost for U.S. federal income tax purposes were as follows:
| Tax cost | $ | 27,132,408 | ||
| Gross unrealized gain | 370,110 | |||
| Gross unrealized loss | (392,044 | ) | ||
| Net unrealized security loss | $ | (21,934 | ) |
The difference between GAAP-basis and tax-basis unrealized gains (losses) is attributable primarily to wash sales, net mark to market gains/(losses) on regulated futures and foreign currency contracts, and differences in the tax treatment of swap transactions, foreign currency transactions and inflation protected securities.
33
GOLDMAN SACHS VARIABLE INSURANCE TRUST STRATEGIC INCOME FUND
Notes to Financial Statements (continued)
June 30, 2016 (Unaudited)
7. TAX INFORMATION (continued)
GSAM has reviewed the Fund’s tax positions for all open tax years (the current and prior three years, as applicable) and has concluded that no provision for income tax is required in the Fund’s financial statements. Such open tax years remain subject to examination and adjustment by tax authorities.
8. OTHER RISKS
The Fund’s risks include, but are not limited to, the following:
Derivatives Risk — Loss may result from the Fund’s investments in derivative instruments. These instruments may be illiquid, difficult to price and leveraged so that small changes in the value of the underlying instruments may produce disproportionate losses to the Fund. Derivatives are also subject to counterparty risk, which is the risk that the other party in the transaction will not fulfill its contractual obligation. Losses from investments in derivatives can also result from a lack of correlation between changes in the value of derivative instruments and the portfolio assets (if any) being hedged.
Foreign Countries Risk — Investing in foreign markets may involve special risks and considerations not typically associated with investing in the U.S. Foreign securities may be subject to risk of loss because of more or less foreign government regulation, less public information and less economic, political and social stability in the countries in which the Fund invests. Loss may also result from the imposition of exchange controls, confiscations and other government restrictions by the U.S. or other governments, or from problems in registration, settlement or custody. Foreign risk also involves the risk of negative foreign currency rate fluctuations, which may cause the value of securities denominated in such foreign currency (or other instruments through which the Fund has exposure to foreign currencies) to decline in value. Currency exchange rates may fluctuate significantly over short periods of time.
Foreign Custody Risk — A Fund that invests in foreign securities may hold such securities and cash with foreign banks, agents, and securities depositories appointed by the Fund’s custodian (each a “Foreign Custodian”). Some foreign custodians may be recently organized or new to the foreign custody business. In some countries, Foreign Custodians may be subject to little or no regulatory oversight over, or independent evaluation of, their operations. Further, the laws of certain countries may place limitations on a Fund’s ability to recover its assets if a Foreign Custodian enters bankruptcy.
Interest Rate Risk — When interest rates increase, fixed income securities or instruments held by the Fund will generally decline in value. Long-term fixed income securities or instruments will normally have more price volatility because of this risk than short-term fixed income securities or instruments. The risks associated with increasing rates are heightened given that interest rates are near historic lows, but may be expected to increase in the future with unpredictable effects on the markets and the Fund’s investments.
Investments in Other Investment Companies — As a shareholder of another investment company, including an exchange traded fund (“ETF”), the Fund will indirectly bear its proportionate share of any net management fees and other expenses paid by such other investment companies, in addition to the fees and expenses regularly borne by the Fund. ETFs are subject to risks that do not apply to conventional mutual funds, including but not limited to the following: (i) the market price of the ETF’s shares may trade at a premium or a discount to their NAV; and (ii) an active trading market for an ETF’s shares may not develop or be maintained.
Large Shareholder Transactions Risk — The Fund may experience adverse effects when certain large shareholders, such as other funds, participating insurance companies, accounts and Goldman Sachs affiliates, purchase or redeem large amounts of shares of the Fund. Such large shareholder redemptions may cause the Fund to sell portfolio securities at times when it would not otherwise do so, which may negatively impact the Fund’s NAV and liquidity. These transactions may also accelerate the realization of taxable income to shareholders if such sales of investments resulted in gains, and may also increase transaction costs. In addition, a large redemption could result in the Fund’s current expenses being allocated over a smaller asset base, leading to an increase in
34
GOLDMAN SACHS VARIABLE INSURANCE TRUST STRATEGIC INCOME FUND
8. OTHER RISKS (continued)
the Fund’s expense ratio. Similarly, large Fund share purchases may adversely affect the Fund’s performance to the extent that the Fund is delayed in investing new cash and is required to maintain a larger cash position than it ordinarily would.
Liquidity Risk — The Fund may make investments that are illiquid or that may become less liquid in response to market developments or adverse investor perceptions. Illiquid investments may be more difficult to value. Liquidity risk may also refer to the risk that the Fund will not be able to pay redemption proceeds within the allowable time period because of unusual market conditions, an unusually high volume of redemption requests, or other reasons. To meet redemption requests, the Fund may be forced to sell investments at an unfavorable time and/or under unfavorable conditions. Liquidity risk may be the result of, among other things, the reduced number and capacity of traditional market participants to make a market in fixed income securities or the lack of an active market. The potential for liquidity risk may be magnified by a rising interest rate environment or other circumstances where investor redemptions from fixed income mutual funds may be higher than normal, potentially causing increased supply in the market due to selling activity.
Market and Credit Risks — In the normal course of business, the Fund trades financial instruments and enters into financial transactions where risk of potential loss exists due to changes in the market (market risk). Additionally, the Fund may also be exposed to credit risk in the event that an issuer or guarantor fails to perform or that an institution or entity with which the Fund has unsettled or open transactions defaults.
Short Position Risk — The Fund may enter into a short position through a futures contract, an option or swap agreement or through short sales of any instrument that the Fund may purchase for investment. Taking short positions involves leverage of a Fund’s assets and presents various risks. If the value of the underlying instrument or market in which the Fund has taken a short position increases, then the Fund will incur a loss equal to the increase in value from the time that the short position was entered into plus any related interest payments or other fees. Taking short positions involves the risk that losses may be disproportionate, may exceed the amount invested, and may be unlimited.
9. INDEMNIFICATIONS
Under the Trust’s organizational documents, its Trustees, officers, employees and agents are indemnified, to the extent permitted by the Act and state law, against certain liabilities that may arise out of performance of their duties to the Fund. Additionally, in the course of business, the Fund enters into contracts that contain a variety of indemnification clauses. The Fund’s maximum exposure under these arrangements is unknown, as this would involve future claims that may be made against the Fund that have not yet occurred. However, GSAM believes the risk of loss under these arrangements to be remote.
10. SUBSEQUENT EVENTS
Subsequent events after the Statement of Assets and Liabilities date have been evaluated through the date the financial statements were issued. GSAM has concluded that there is no impact requiring adjustment or disclosure in the financial statements.
35
GOLDMAN SACHS VARIABLE INSURANCE TRUST STRATEGIC INCOME FUND
Notes to Financial Statements (continued)
June 30, 2016 (Unaudited)
11. SUMMARY OF SHARE TRANSACTIONS
Share activity is as follows:
| For the Six Months Ended June 30, 2016 (Unaudited) | For the Fiscal Year Ended December 31, 2015 | |||||||||||||||
| Shares | Dollars | Shares | Dollars | |||||||||||||
| Institutional Shares | ||||||||||||||||
| Shares sold | 55,758 | $ | 506,005 | 1,105,959 | $ | 10,607,135 | ||||||||||
| Reinvestment of distributions | 29,271 | 264,996 | 79,151 | 743,475 | ||||||||||||
| Shares redeemed | (814,335 | ) | (7,408,540 | ) | (29,676 | ) | (280,472 | ) | ||||||||
| (729,306 | ) | (6,637,539 | ) | 1,155,434 | 11,070,138 | |||||||||||
| Service Shares | ||||||||||||||||
| Reinvestment of distributions | 11 | 94 | 26 | 250 | ||||||||||||
| 11 | 94 | 26 | 250 | |||||||||||||
| Advisor Shares | ||||||||||||||||
| Shares sold | 406,134 | 3,691,695 | 614,049 | 5,819,805 | ||||||||||||
| Reinvestment of distributions | 7,922 | 71,557 | 10,496 | 97,996 | ||||||||||||
| Shares redeemed | (111,051 | ) | (1,009,467 | ) | (132,060 | ) | (1,246,850 | ) | ||||||||
| 303,005 | 2,753,785 | 492,485 | 4,670,951 | |||||||||||||
| NET INCREASE (DECREASE) | (426,290 | ) | $ | (3,883,660 | ) | 1,647,945 | $ | 15,741,339 | ||||||||
36
GOLDMAN SACHS VARIABLE INSURANCE TRUST STRATEGIC INCOME FUND
| Fund Expenses — Six Month Period Ended June 30, 2016 (Unaudited) |
As a shareholder of Institutional, Service or Advisor Shares of the Fund, you incur ongoing costs, including management fees, distribution and service (12b-1) fees (with respect to Service and Advisor Shares) and other Fund expenses. This example is intended to help you understand your ongoing costs (in dollars) of investing in the Institutional, Service and Advisor Shares of the Fund and to compare these costs with the ongoing costs of investing in other mutual funds.
The example is based on an investment of $1,000 invested at the beginning of the period and held for the entire period from January 1, 2016 through June 30, 2016, which represents a period of 182 days of a 366 day year.
Actual Expenses — The first line under each share class in the table below provides information about actual account values and actual expenses. You may use the information in this line, together with the amount you invested, to estimate the expenses that you paid over the period. Simply divide your account value by $1,000 (for example, an $8,600 account value divided by $1,000=8.6), then multiply the result by the number in the first line under the heading entitled “Expenses Paid” to estimate the expenses you paid on your account during this period.
Hypothetical Example for Comparison Purposes — The second line under each share class in the table below provides information about hypothetical account values and hypothetical expenses based on the Fund’s actual net expense ratio and an assumed rate of return of 5% per year before expenses, which is not the Fund’s actual return. The hypothetical account values and expenses may not be used to estimate the actual ending account balance or expenses you paid for the period. You may use this information to compare the ongoing costs of investing in the Fund and other funds. To do so, compare this 5% hypothetical example with the 5% hypothetical examples that appear in the shareholder reports of the other funds.
Please note that the expenses shown in the table are meant to highlight your ongoing costs only. As a shareholder of the Fund you do not incur any transaction costs, such as sales charges, redemption fees, or exchange fees, but shareholders of other funds may incur such costs. The second line of the table is useful in comparing ongoing costs only, and will not help you determine the relative total costs of owning different funds whose shareholders may incur transaction costs.
| Share Class | Beginning Account Value 01/01/16 | Ending Account Value | Expenses Paid for the 6 Months Ended 06/30/16* | |||||||||
| Institutional | ||||||||||||
| Actual | $ | 1,000 | $ | 987.10 | $ | 4.10 | ||||||
| Hypothetical 5% return | 1,000 | 1,020.74 | + | 4.17 | ||||||||
|
|
|
|
|
|
| ||||||
| Service | ||||||||||||
| Actual | 1,000 | 986.90 | 5.48 | |||||||||
| Hypothetical 5% return | 1,000 | 1,019.34 | + | 5.57 | ||||||||
| Advisor | ||||||||||||
| Actual | 1,000 | 985.50 | 6.07 | |||||||||
| Hypothetical 5% return | 1,000 | 1,018.75 | + | 6.17 | ||||||||
| * | Expenses are calculated using the Fund’s annualized net expense ratio for each class, which represents the ongoing expenses as a percentage of net assets for the six months ended June 30, 2016. Expenses are calculated by multiplying the annualized net expense ratio by the average account value for the period; then multiplying the result by the number of days in the most recent fiscal half year; and then dividing that result by the number of days in the fiscal year. The annualized net expense ratios for the period were 0.83%, 1.11% and 1.23% for the Institutional, Service and Advisor Shares, respectively. |
| + | Hypothetical expenses are based on the Fund’s actual annualized net expense ratios and an assumed rate of return of 5% per year before expenses. |
37
GOLDMAN SACHS VARIABLE INSURANCE TRUST STRATEGIC INCOME FUND
Statement Regarding Basis for Approval of Management Agreement (Unaudited)
Background
The Goldman Sachs Strategic Income Fund (the “Fund”) is an investment portfolio of Goldman Sachs Variable Insurance Trust (the “Trust”). The Board of Trustees oversees the management of the Trust and reviews the investment performance and expenses of the Fund at regularly scheduled meetings held throughout the year. In addition, the Board of Trustees determines annually whether to approve the continuance of the Trust’s investment management agreement (the “Management Agreement”) with Goldman Sachs Asset Management, L.P. (the “Investment Adviser”) on behalf of the Fund.
The Management Agreement was most recently approved for continuation until June 30, 2017 by the Board of Trustees, including those Trustees who are not parties to the Management Agreement or “interested persons” (as defined in the Investment Company Act of 1940, as amended) of any party thereto (the “Independent Trustees”), at a meeting held on June 15-16, 2016 (the “Annual Meeting”).
The review process undertaken by the Trustees spans the course of the year and culminates with the Annual Meeting. To assist the Trustees in their deliberations, the Trustees have established a Contract Review Committee (the “Committee”), comprised of the Independent Trustees. The Committee held three meetings over the course of the year since the Management Agreement was last approved. At those Committee meetings, regularly scheduled Board or other committee meetings, and/or the Annual Meeting, matters relevant to the renewal of the Management Agreement were considered by the Board, or the Independent Trustees, as applicable. With respect to the Fund, such matters included:
| (a) | the nature and quality of the advisory, administrative, and other services provided to the Fund by the Investment Adviser and its affiliates, including information about: |
| (i) | the structure, staff, and capabilities of the Investment Adviser and its portfolio management teams; |
| (ii) | the groups within the Investment Adviser and its affiliates that support the portfolio management teams or provide other types of necessary services, including fund services groups (e.g., accounting and financial reporting, tax, shareholder services, and operations); controls and risk management groups (e.g., legal, compliance, valuation oversight, credit risk management, internal audit, compliance testing, market risk analysis, finance, and central funding); sales and distribution support groups, and others (e.g., information technology and training); |
| (iii) | trends in employee headcount; |
| (iv) | the Investment Adviser’s financial resources and ability to hire and retain talented personnel and strengthen its operations; and |
| (v) | the parent company’s support of the Investment Adviser and its mutual fund business, as expressed by the firm’s senior management; |
| (b) | information on the investment performance of the Fund, including comparisons to the performance of similar mutual funds, as provided by a third-party mutual fund data provider engaged as part of the contract review process (the “Outside Data Provider”), a benchmark performance index, and a composite of accounts with comparable investment strategies managed by the Investment Adviser; and general investment outlooks in the markets in which the Fund invests; |
| (c) | information provided by the Investment Adviser indicating the Investment Adviser’s views on whether the Fund’s peer group and/or benchmark index had high, medium, or low relevance given the Fund’s particular investment strategy; |
| (d) | the terms of the Management Agreement and other agreements with affiliated service providers entered into by the Trust on behalf of the Fund; |
| (e) | fee and expense information for the Fund, including: |
| (i) | the relative management fee and expense level of the Fund as compared to those of comparable funds managed by other advisers, as provided by the Outside Data Provider; |
| (ii) | the Fund’s expense trends over time; and |
| (iii) | to the extent the Investment Adviser manages other types of accounts (such as bank collective trusts, private wealth management accounts, institutional separate accounts, sub-advised mutual funds, and non-U.S. funds) having investment objectives and policies similar to those of the Fund, comparative information on the advisory fees charged and services provided to those accounts by the Investment Adviser; |
| (f) | with respect to the investment performance and expense comparison data provided by the Outside Data Provider, its processes in producing that data for the Fund; |
| (g) | the undertaking of the Investment Adviser to limit certain expenses of the Fund that exceed a specified level; |
| (h) | information relating to the profitability of the Management Agreement and the transfer agency and distribution and service arrangements of the Fund and the Trust as a whole to the Investment Adviser and its affiliates; |
| (i) | whether the Fund’s existing management fee schedule adequately addressed any economies of scale; |
| (j) | a summary of the “fall-out” benefits derived by the Investment Adviser and its affiliates from their relationships with the |
38
GOLDMAN SACHS VARIABLE INSURANCE TRUST STRATEGIC INCOME FUND
Statement Regarding Basis for Approval of Management Agreement (Unaudited) (continued)
| Fund, including the fees received by the Investment Adviser’s affiliates from the Fund for transfer agency, portfolio trading, distribution and other services; |
| (k) | a summary of potential benefits derived by the Fund as a result of its relationship with the Investment Adviser; |
| (l) | information regarding portfolio trading and how the Investment Adviser carries out its duty to seek best execution; |
| (m) | the manner in which portfolio manager compensation is determined; and the number and types of accounts managed by the portfolio managers; |
| (n) | the nature and quality of the services provided to the Fund by its unaffiliated service providers, and the Investment Adviser’s general oversight and evaluation (including reports on due diligence) of those service providers as part of the administration services provided under the Management Agreement; and |
| (o) | the Investment Adviser’s processes and policies addressing various types of potential conflicts of interest; its approach to risk management; the annual review of the effectiveness of the Fund’s compliance program; and periodic compliance reports. |
The Trustees also received an overview of the Fund’s distribution arrangements. They received information regarding the Fund’s assets, share purchase and redemption activity, and payment of distribution and service fees. Information was also provided to the Trustees relating to revenue sharing payments made by and services provided by the Investment Adviser and its affiliates to intermediaries that promote the sale, distribution, and/or servicing of Fund shares. The Independent Trustees also discussed the broad range of other investment choices that are available to Fund investors, including the availability of comparable funds managed by other advisers.
The presentations made at the Board and Committee meetings and at the Annual Meeting encompassed the Fund and other mutual funds for which the Board of Trustees has responsibility. In evaluating the Management Agreement at the Annual Meeting, the Trustees relied upon their knowledge, resulting from their meetings and other interactions throughout the year, of the Investment Adviser and its affiliates, their services, and the Fund. In conjunction with these meetings, the Trustees received written materials and oral presentations on the topics covered, and the Investment Adviser addressed the questions and concerns of the Trustees, including concerns regarding the investment performance of certain of the funds they oversee. The Independent Trustees were advised by their independent legal counsel regarding their responsibilities and other regulatory requirements related to the approval and continuation of mutual fund investment management agreements under applicable law. In addition, the Investment Adviser and its affiliates provided the Independent Trustees with a written response to a formal request for information sent on behalf of the Independent Trustees by their independent legal counsel. During the course of their deliberations, the Independent Trustees met in executive sessions with their independent legal counsel, without representatives of the Investment Adviser or its affiliates present.
Nature, Extent, and Quality of the Services Provided Under the Management Agreement
As part of their review, the Trustees considered the nature, extent, and quality of the services provided to the Fund by the Investment Adviser. In this regard, the Trustees considered both the investment advisory services and non-advisory services that are provided by the Investment Adviser and its affiliates. The Trustees noted the transition in the leadership and changes in personnel of various of the Investment Adviser’s portfolio management teams that had occurred in recent periods, and the ongoing recruitment efforts aimed at bringing high quality investment talent to the Investment Adviser. They also noted the Investment Adviser’s commitment to maintaining high quality systems and expending substantial resources to respond to ongoing changes to the regulatory and control environment in which the Fund and its service providers operate, as well as the efforts of the Investment Adviser and its affiliates to combat cyber security risks. The Trustees concluded that the Investment Adviser continued to commit substantial financial and operational resources to the Fund and expressed confidence that the Investment Adviser would continue to do so in the future. The Trustees also recognized that the Investment Adviser had made significant commitments to address regulatory compliance requirements applicable to the Fund and the Investment Adviser and its affiliates.
Investment Performance
The Trustees also considered the investment performance of the Fund. In this regard, they compared the investment performance of the Fund to its peers using rankings compiled by the Outside Data Provider as of December 31, 2015, and updated performance information prepared by the Investment Adviser using the peer group identified by the Outside Data Provider as of March 31, 2016. The information on the Fund’s investment performance was provided for the one-year period ending on the applicable date. The Trustees also reviewed the Fund’s investment performance relative to its performance benchmark. As part of this review, they considered the investment performance trends of the Fund over time, and reviewed the investment performance of the Fund in light of its investment objective and policies and market conditions. The Trustees also received information comparing the Fund’s performance to that of a composite of accounts with comparable investment strategies managed by the Investment Adviser.
39
GOLDMAN SACHS VARIABLE INSURANCE TRUST STRATEGIC INCOME FUND
Statement Regarding Basis for Approval of Management Agreement (Unaudited) (continued)
In addition, the Trustees considered materials prepared and presentations made by the Investment Adviser’s senior management and portfolio management personnel in which Fund performance was assessed. The Trustees also considered the Investment Adviser’s periodic reports with respect to the Fund’s risk profile, and how the Investment Adviser’s approach to risk monitoring and management influences portfolio management.
The Trustees noted that the Fund’s Institutional Shares had placed in the third quartile of the Fund’s peer group and underperformed the Fund’s benchmark index for the one-year period ending March 31, 2016.
Costs of Services Provided and Competitive Information
The Trustees considered the contractual terms of the Management Agreement and the fee rates payable by the Fund thereunder. In this regard, the Trustees considered information on the services rendered by the Investment Adviser to the Fund, which included both advisory and administrative services that were directed to the needs and operations of the Fund as a registered mutual fund.
In particular, the Trustees reviewed analyses prepared by the Outside Data Provider regarding the expense rankings of the Fund. The analyses provided a comparison of the Fund’s management fee and breakpoints to those of a relevant peer group and category universe; an expense analysis which compared the Fund’s overall net and gross expenses to a peer group and a category universe; and a two-year history comparing the Fund’s net expenses to the peer and category medians. The analyses also compared the Fund’s transfer agency, custody, and distribution fees, other expenses and fee waivers/reimbursements to those of the peer group and category medians. The Trustees concluded that the comparisons provided by the Outside Data Provider were useful in evaluating the reasonableness of the management fees and total expenses paid by the Fund.
In addition, the Trustees considered the Investment Adviser’s undertaking to limit certain expenses of the Fund that exceed a specified level. They also considered, to the extent that the Investment Adviser manages other types of accounts having investment objectives and policies similar to those of the Fund, comparative fee information for services provided by the Investment Adviser to those accounts, and information that indicated that services provided to the Fund differed in various significant respects from the services provided to other types of accounts which, in many cases, operated under less stringent legal and regulatory structures, required fewer services from the Investment Adviser to a smaller number of client contact points, and were less time-intensive.
In addition, the Trustees noted that shareholders are able to redeem their Fund shares at any time if shareholders believe that the Fund fees and expenses are too high or if they are dissatisfied with the performance of the Fund.
Profitability
The Trustees reviewed the Investment Adviser’s revenues and pre-tax profit margins with respect to the Trust and the Fund. In this regard the Trustees noted that they had received, among other things, profitability analyses and summaries, revenue and expense schedules by Fund and by function (i.e., investment management, transfer agency and distribution and service), and information on the Investment Adviser’s expense allocation methodology. They observed that the profitability and expense figures are substantially similar to those used by the Investment Adviser for many internal purposes, including compensation decisions among various business groups, and are thus subject to a vigorous internal debate about how certain revenue and expenses should be allocated. The Trustees also noted that the internal audit group within the Goldman Sachs organization had audited the expense allocation methodology and was satisfied with the reasonableness, consistency, and accuracy of the Investment Adviser’s expense allocation methodology and profitability analysis calculations. Profitability data for the Trust and the Fund were provided for 2015 and 2014, and the Trustees considered this information in relation to the Investment Adviser’s overall profitability. The Trustees considered the Investment Adviser’s revenues and pre-tax profit margins both in absolute terms and in comparison to information on the reported pre-tax profit margins earned by certain other asset management firms.
Economies of Scale
The Trustees considered the information that had been provided regarding the Investment Adviser’s profitability. The Trustees also considered the breakpoints in the fee rate payable under the Management Agreement for the Fund at the following annual percentage rates of the average daily net assets of the Fund:
| First $1 billion | 0.60 | % | ||
| Next $1 billion | 0.54 | |||
| Next $3 billion | 0.51 | |||
| Next $3 billion | 0.50 | |||
| Over $8 billion | 0.49 |
40
GOLDMAN SACHS VARIABLE INSURANCE TRUST STRATEGIC INCOME FUND
Statement Regarding Basis for Approval of Management Agreement (Unaudited) (continued)
The Trustees noted that the breakpoints were designed to share potential economies of scale, if any, with the Fund and its shareholders as assets under management reach those asset levels. The Trustees considered the amounts of assets in the Fund; the Fund’s recent share purchase and redemption activity; the information provided by the Investment Adviser relating to the costs of the services provided by the Investment Adviser and its affiliates and their realized profits; information comparing fee rates charged by the Investment Adviser with fee rates charged to other funds in the peer group; and the Investment Adviser’s undertaking to limit certain expenses of the Fund that exceed a specified level. Upon reviewing these matters at the Annual Meeting, the Trustees concluded that the fee breakpoints represented a means of assuring that benefits of scalability, if any, would be passed along to shareholders at the specified asset levels.
Other Benefits to the Investment Adviser and Its Affiliates
The Trustees also considered the other benefits derived by the Investment Adviser and its affiliates from their relationships with the Fund as stated above, including: (a) transfer agency fees received by Goldman, Sachs & Co. (“Goldman Sachs”); (b) futures commissions earned by Goldman Sachs for executing futures transactions on behalf of the Fund; (c) trading efficiencies resulting from aggregation of orders of the Fund with those for other funds or accounts managed by the Investment Adviser; (d) the Investment Adviser’s ability to leverage the infrastructure designed to service the Fund on behalf of its other clients; (e) the Investment Adviser’s ability to cross-market other products and services to Fund shareholders; (f) Goldman Sachs’ retention of certain fees as Fund Distributor; (g) the Investment Adviser’s ability to negotiate better pricing with custodians on behalf of its other clients, as a result of the relationship with the Fund; and (h) the possibility that the working relationship between the Investment Adviser and the Fund’s third-party service providers may cause those service providers to be more likely to do business with other areas of Goldman Sachs. In the course of considering the foregoing, the Independent Trustees requested and received further information quantifying certain of these fall-out benefits.
Other Benefits to the Fund and Its Shareholders
The Trustees also noted that the Fund receives certain potential benefits as a result of its relationship with the Investment Adviser, including: (a) trading efficiencies resulting from aggregation of orders of the Fund with those of other funds or accounts managed by the Investment Adviser; (b) enhanced servicing from vendors because of the volume of business generated by the Investment Adviser and its affiliates; (c) enhanced servicing from broker-dealers because of the volume of business generated by the Investment Adviser and its affiliates; (d) the Investment Adviser’s ability to negotiate favorable terms with derivatives counterparties on behalf of the Fund as a result of the size and reputation of the Goldman Sachs organization; (e) the Investment Adviser’s knowledge and experience gained from managing other accounts and products; (f) the Investment Adviser’s ability to hire and retain qualified personnel to provide services to the Fund because of the reputation of the Goldman Sachs organization; (g) the Fund’s access, through the Investment Adviser, to certain firmwide resources (e.g., proprietary risk management systems and databases), subject to certain restrictions; and (h) the Fund’s access to certain affiliated distribution channels. In addition, the Trustees noted the competitive nature of the mutual fund marketplace, and considered that many of the Fund’s shareholders invested in the Fund in part because of the Fund’s relationship with the Investment Adviser and that those shareholders have a general expectation that the relationship will continue.
Conclusion
In connection with their consideration of the Management Agreement, the Trustees gave weight to each of the factors described above, but did not identify any particular factor as controlling their decision. After deliberation and consideration of all of the information provided, including the factors described above, the Trustees concluded, in the exercise of their business judgment, that the management fees paid by the Fund were reasonable in light of the services provided to it by the Investment Adviser, the Investment Adviser’s costs and the Fund’s current and reasonably foreseeable asset levels. The Trustees unanimously concluded that the Investment Adviser’s continued management likely would benefit the Fund and its shareholders and that the Management Agreement should be approved and continued with respect to the Fund until June 30, 2017.
41
| TRUSTEES | OFFICERS | |
| Ashok N. Bakhru, Chairman | James A. McNamara, President | |
| Kathryn A. Cassidy | Scott M. McHugh, Principal Financial Officer, | |
| Diana M. Daniels | Senior Vice President and Treasurer | |
| Herbert J. Markley | Caroline L. Kraus, Secretary | |
| James A. McNamara | ||
| Jessica Palmer | ||
| Alan A. Shuch | ||
| Roy W. Templin | ||
| Gregory G. Weaver |
GOLDMAN, SACHS & CO.
Distributor and Transfer Agent
GOLDMAN SACHS ASSET MANAGEMENT, L.P.
Investment Adviser
200 West Street, New York
New York 10282
Visit our web site at www.GSAMFUNDS.com to obtain the most recent month-end returns.
The reports concerning the Fund included in this shareholder report may contain certain forward-looking statements about the factors that may affect the performance of the Fund in the future. These statements are based on Fund management’s predictions and expectations concerning certain future events and their expected impact on the Fund, such as performance of the economy as a whole and of specific industry sectors, changes in the levels of interest rates, the impact of developing world events, and other factors that may influence the future performance of the Fund. Management believes these forward-looking statements to be reasonable, although they are inherently uncertain and difficult to predict. Actual events may cause adjustments in portfolio management strategies from those currently expected to be employed.
A description of the policies and procedures that the Fund uses to determine how to vote proxies relating to portfolio securities and information regarding how the Fund voted proxies relating to portfolio securities for the 12-month period ended June 30 is available (i) without charge, upon request by calling 1-800-621-2550; and (ii) on the Securities and Exchange Commission (“SEC”) web site at http://www.sec.gov.
The Fund files its complete schedule of portfolio holdings with the SEC for the first and third quarters of each fiscal year on Form N-Q. The Fund’s Form N-Qs are available on the SEC’s web site at http://www.sec.gov within 60 days after the Fund’s first and third fiscal quarters. The Fund’s Form N-Qs may be reviewed and copied at the SEC’s Public Reference Room in Washington, D.C. and information on the operation of the Public Reference Room may also be obtained by calling 1-800-SEC-0330. Form N-Qs may be obtained upon request and without charge by calling 1-800-621-2550.
The website links provided are for your convenience only and are not an endorsement or recommendation by GSAM of any of these websites or the products or services offered. GSAM is not responsible for the accuracy and validity of the content of these websites.
Fund holdings and allocations shown are as of June 30, 2016 and may not be representative of future investments. Fund holdings should not be relied on in making investment decisions and should not be construed as research or investment advice regarding particular securities. Current and future holdings are subject to risk.
The portfolio risk management process includes an effort to monitor and manage risk, but does not imply low risk.
Economic and market forecasts presented herein reflect a series of assumptions and judgments as of the date of this presentation and are subject to change without notice. These forecasts do not take into account the specific investment objectives, restrictions, tax and financial situation or other needs of any specific client. Actual data will vary and may not be reflected here. These forecasts are subject to high levels of uncertainty that may affect actual performance. Accordingly, these forecasts should be viewed as merely representative of a broad range of possible outcomes. These forecasts are estimated, based on assumptions, and are subject to significant revision and may change materially as economic and market conditions change. Goldman Sachs has no obligation to provide updates or changes to these forecasts. Case studies and examples are for illustrative purposes only.
Shares of the Goldman Sachs VIT Funds are offered to separate accounts of participating life insurance companies for the purpose of funding variable annuity contracts and variable life insurance policies. Shares of the Fund are not offered directly to the general public. The variable annuity contracts and variable life insurance policies are described in the separate prospectuses issued by participating insurance companies. You should refer to those prospectuses for information about surrender charges, mortality and expense risk fees and other charges that may be assessed by participating insurance companies under the variable annuity contracts or variable life insurance policies. Such fees or charges, if any, may affect the return you may realize with respect to your investments. Ask your representative for more complete information. Please consider a fund’s objectives, risks and charges and expenses, and read the prospectus carefully before investing. The prospectus contains this and other information about the Fund.
This material is not authorized for distribution to prospective investors unless preceded or accompanied by a current Prospectus or summary prospectus, if applicable. Investors should consider a Fund’s objective, risks, and charges and expenses, and read the summary prospectus, if available, and/or the Prospectus carefully before investing or sending money. The summary prospectus, if available, and the Prospectus contain this and other information about a Fund and may be obtained from your Authorized Institution or from Goldman, Sachs & Co. by calling 1-800-621-2550.
This report is prepared for the general information of contract owners and is not an offer of shares of the Goldman Sachs Variable Insurance Trust: Goldman Sachs Strategic Income Fund.
Goldman, Sachs & Co. is the distributor of the Goldman Sachs Funds and the Goldman Sachs Variable Insurance Trust Funds.
© 2016 Goldman Sachs. All rights reserved.
VITSTISAR-16/59654-TMPL-08/2016/324
Goldman
Sachs Variable Insurance Trust
Goldman Sachs
Strategic International Equity Fund
Semi-Annual Report
June 30, 2016

GOLDMAN SACHS VARIABLE INSURANCE TRUST STRATEGIC INTERNATIONAL EQUITY FUND
INVESTMENT OBJECTIVE
The Fund seeks long-term growth of capital.
Portfolio Management Discussion and Analysis
Below, the Goldman Sachs International Equity Portfolio Management Team discusses the Goldman Sachs Variable Insurance Trust — Goldman Sachs Strategic International Equity Fund’s (the “Fund”) performance and positioning for the six-month period ended June 30, 2016 (the “Reporting Period”).
How did the Fund perform during the Reporting Period?
During the Reporting Period, the Fund’s Institutional and Service Shares generated cumulative total returns of -3.70% and -3.80%, respectively. These returns compare to the -4.42% cumulative total return of the Fund’s benchmark, the Morgan Stanley Capital International (MSCI) Europe, Australasia, Far East (EAFE) Index (Net, USD, Unhedged) (the “MSCI EAFE Index”), during the same time period.
What economic and market factors most influenced the international equity markets as a whole during the Reporting Period?
International equities, as measured by the MSCI EAFE Index, posted a return of -4.42% in U.S. dollar terms for the Reporting Period as a whole.
International equities suffered amid a global rout at the beginning of 2016, triggered by investor concerns of an intensifying economic slowdown in China and exacerbated by an oil price plunge. Sentiment improved following a dovish January European Central Bank (“ECB”) press conference on January 21, 2016, and the Bank of Japan’s (“BoJ”) introduction of negative interest rates. (Dovish language tends to suggest lower interest rates.) In turn, international equities stabilized a bit in February 2016. However, the MSCI EAFE Index still fell 1.83% in February 2016. In March 2016, further central bank dovishness, along with receding global economic concerns and oil price stabilization, helped to finally drive a global equity market recovery. Notably, the ECB implemented heavy easing, cutting its deposit rate to -40 basis points, raising its monthly quantitative easing purchases, including those of corporate bonds, and unveiling a new series of four-year loans to banks. (A basis point is 1/100th of a percentage point.) The BoJ left its monetary policy unchanged in March 2016, but its rhetoric about negative interest rates heightened expectations for further easing to come.
Market sentiment appeared to remain sanguine in April 2016, as oil prices rose and China’s economic growth concerns abated with modestly improving economic data. Both the ECB and BoJ were on hold, or did not make any monetary policy changes, in April 2016. BoJ inaction came as a major disappointment against market expectations of further easing, causing international equities to sell off once again and the yen to appreciate. Relative currency appreciation was exacerbated by U.S. dollar weakness following a weaker than expected first quarter U.S. Gross Domestic Product (“GDP”) release and an uneventful Federal Reserve (“Fed”) meeting during which rates were left unchanged.
Hawkish Fed minutes released in May 2016 temporarily revived market expectations for a Fed interest rate hike in June 2016, but weaker than expected May 2016 payroll data subsequently drove such expectations lower. (Hawkish language tends to suggest higher interest rates; opposite of dovish.) Equities rallied toward the end of May 2016 on anticipation of better economic data, rising oil prices and optimism that the economy could withstand rate hikes. Japanese equities also benefited from stronger than expected first quarter 2016 GDP growth and a weaker yen.
Markets were dominated in June 2016 by anticipation around the U.K. referendum on membership in the European Union, popularly known as the Brexit vote. International equities declined in the global risk-off, or heightened risk averse, sentiment that dominated the days following the June 23, 2016 vote given the surprise “leave” result. Markets rebounded in the latter days of June 2016 owing to improving risk appetite, as markets digested the outcome of the Brexit vote and on dovish remarks from Bank of England Governor Carney. Still, the MSCI EAFE Index declined 3.36% in the last month of the Reporting Period.
For the Reporting Period overall, energy, consumer staples, materials, utilities and industrials were the only sectors in the MSCI EAFE Index to post a positive return. The weakest performing sectors in the MSCI EAFE Index during the Reporting Period were financials and consumer discretionary, followed at some distance by information technology, health care and then telecommunication services.
1
GOLDMAN SACHS VARIABLE INSURANCE TRUST STRATEGIC INTERNATIONAL EQUITY FUND
From a country perspective, New Zealand, Singapore and Norway were the best performing equity markets in the MSCI EAFE Index during the Reporting Period. Italy was the weakest individual country constituent in the MSCI EAFE Index during the Reporting Period, followed at some distance by Ireland, Israel and Spain.
What key factors were responsible for the Fund’s performance during the Reporting Period?
While the Fund’s absolute returns were disappointing, its outperformance of the MSCI EAFE Index during the Reporting Period can be primarily attributed to individual stock selection.
What were some of the Fund’s best-performing individual stocks?
The greatest contributors to Fund performance relative to the MSCI EAFE Index during the Reporting Period were Japanese cosmetics manufacturer Pola Orbis, U.K. integrated natural gas company BG Group and Japanese e-commerce company Start Today.
Pola Orbis is known for products such as Pola, Orbis, H2O and Jurlique. Its products are popular both domestically and to foreigners, such as Chinese tourists. The company has been a beneficiary of heightened tourism, the entry of millennials into the marketplace and Japan’s corporate governance revolution. In Japan, its margins continued to improve on the back of growth in Pola, a recovery in Orbis, and higher sales of up-and-coming brands. Other growth drivers during the Reporting Period included an increase in private-brand stores for Pola, an average selling price boost for Orbis as it shifts from the mid-price to high-price bracket and overall market share gains.
BG Group was a new purchase for the Fund during the Reporting Period. In January 2016, both Royal Dutch Shell and BG Group investors voted in favor of the Royal Dutch Shell takeover bid for BG Group. With approval for the deal concluded, BG Groups shares rallied to close the spread, or differential, to Royal Dutch Shell’s offer price for the company. On February 12, 2016, BG Group’s shares ceased trading, and investors in BG Group, including the Fund, received both cash and Royal Dutch Shell shares in exchange for their BG Group shares.
Start Today operates an Internet shopping website named zozotown and provides other related services. The company has been a beneficiary of the millennials entering the marketplace and of domestic wage growth. Regarded as “trendy” and “mainstream” by popular Japanese media and with a strong loyalty among fashion devotees in Japan, Start Today has quickly become the market leader in online fashion in Japan, beating out Yahoo! Japan, Rakuten and Amazon, the incumbents. We sold the Fund’s position in Start Today following a span of strong performance and as valuations became stretched, in our view.
Which stocks detracted significantly from the Fund’s performance during the Reporting Period?
The biggest detractors from Fund performance relative to the MSCI EAFE Index during the Reporting Period were Swiss bank Credit Suisse, Italian bank UniCredit and Irish bank Bank of Ireland — all European banks, which broadly performed poorly given uncertainty and negative sentiment following a “leave” majority in the U.K.’s referendum on European Union membership.
Credit Suisse detracted most from the Fund’s results during the Reporting Period. In addition to the after-effect of the Brexit vote, the bank’s share price declined following reports of weaker than market-expected fourth quarter 2015 results, citing difficult market conditions amidst its transition to shrink its investment bank and focus on its private bank. At the end of the Reporting Period, we believed the stock still presented significant long-term value.
Shares of UniCredit sold off along with other Italian banks in January 2016 following increased concerns surrounding Italian non-performing loans. This came after the resolution of four small Italian banks at the end of 2015, which triggered the bail-in of their subordinated debt. (A non-performing loan is the sum of borrowed money upon which the debtor has not made his or her schedule payments for at least 90 days. A non-performing loan is either in default or close to being in default. A bail-in occurs when the borrower’s creditors are forced to bear some of the burden by having a portion of their debt written off.) We believe these banks represented isolated cases and that asset quality in Italy is gradually improving. The aftermath of the Brexit vote also contributed to the bank’s relative weakness. Still, at the end of the Reporting Period, we believed UniCredit remained attractively valued relative to other European banks.
Given Bank of Ireland’s meaningful U.K. exposure, its underperformance of the MSCI EAFE Index was most closely tied to the uncertainty and negative sentiment following the surprise results of the Brexit vote.
Which equity market sectors most significantly affected Fund performance?
Effective security selection within the consumer discretionary, consumer staples and industrials sectors contributed positively. Having an overweight to consumer staples, which lagged the MSCI EAFE Index during the Reporting Period, and an underweight
2
GOLDMAN SACHS VARIABLE INSURANCE TRUST STRATEGIC INTERNATIONAL EQUITY FUND
to consumer discretionary, which was the second weakest sector in the MSCI EAFE Index during the Reporting Period, also helped. Partially offsetting these positive contributors was stock selection in the financials, health care and utilities sectors, which detracted most from the Fund’s performance relative to the MSCI EAFE Index during the Reporting Period.
Which countries or regions most affected the Fund’s performance during the Reporting Period?
Typically, the Fund’s individual stock holdings will significantly influence the Fund’s performance within a particular country or region relative to the MSCI EAFE Index. This effect may be even more pronounced in countries that represent only a modest proportion of the MSCI EAFE Index.
That said, the Fund’s effective stock selection in Japan, Germany and France contributed most positively to the Fund’s returns relative to the MSCI EAFE Index. The countries that detracted most from the Fund’s performance during the Reporting Period were Switzerland, Australia and Italy, where stock selection and positioning overall hurt.
How did the Fund use derivatives and similar instruments during the Reporting Period?
During the Reporting Period, we did not use derivatives to hedge positions or as part of an active management strategy.
Did the Fund make any significant purchases or sales during the Reporting Period?
In addition to those purchases already mentioned, among the Fund’s other purchases during the Reporting Period were Moncler, Virgin Money and UBM.
We initiated a Fund position in Moncler, a French/Italian apparel brand, most known for its down jackets and sportswear. The company operates in a niche segment of luxury, where there is little competition and where it has continued to have strong momentum. We believe the company should benefit as what is known as the “affordable luxury” segment gains traction with millennials. There is substantial growth potential compared to other luxury brands, in our opinion, which have already over-expanded and are now seeing declining revenue growth. Moncler’s management team is thoughtful, in our view, about the longer-term sustainability of its business, recently choosing to bring its production in house, focus on new product lines and invest in digital/online. Its stock had underperformed the MSCI EAFE Index during the Reporting Period due to warm weather, weak sentiment around exposure to China and a small change in business strategy that concerned the market but which we view as positive. We see each of these headwinds as short-term and believe they created an attractive entry point for the Fund.
We introduced Virgin Money to the Fund during the Reporting Period. Virgin Money is a financial services company based in the U.K. (services available in the U.K, South Africa and Australia), offering retail mortgage, credit cards, savings, individual savings accounts (U.K. tax free accounts), investments and insurance. We saw the company as a favorable opportunity, as it attracts customers with its brand (it calls branches “lounges” as part of its customer experience) and information technology platform. When Northern Rock was bailed out by the U.K. government, Virgin Money bought its platform as a distressed asset. In our view, Virgin Money benefits from strong earnings growth potential as it expands, owing to a fixed cost base (ex-Northern Rock platform) and therefore high operating leverage.
UBM is a global business-to-business event organizer headquartered in the U.K. The majority of its revenues are derived from participating companies in the trade shows, who tend to book attendance one year in advance. We find the company attractive, as it offers steady growth potential and relative immunity to recessions, since companies book in advance and still attend trade shows in a downturn. UBM is also debt light.
In addition to those sales already mentioned, we exited the Fund’s positions in Total and Societe Generale.
We exited the Fund’s position in French integrated oil company Total following a span of relative outperformance. We decided to redeploy capital in other opportunities in the energy sector.
We sold the Fund’s position in French diversified bank Societe Generale due to weak results and our concerns about its ability to improve its efficiency in order to improve returns.
Were there any notable changes in the Fund’s weightings during the Reporting Period?
In constructing the Fund’s portfolio, we focus on picking stocks rather than on making regional, country, sector or industry bets. We seek to outpace the benchmark index by overweighting stocks that we expect to outperform and underweighting those that we think may lag. Consequently, changes in its sector or country weights are generally the direct result of individual stock selection or of stock appreciation or depreciation. That said, there were no notable changes in the Fund’s sector or country weightings during the Reporting Period.
3
GOLDMAN SACHS VARIABLE INSURANCE TRUST STRATEGIC INTERNATIONAL EQUITY FUND
How was the Fund positioned relative to its benchmark index at the end of the Reporting Period?
At the end of June 2016, the Fund had a greater weighting than the MSCI EAFE Index in the consumer staples sector. The Fund had underweighted allocations to the consumer discretionary, industrials, financials and materials sectors and was rather neutrally weighted to the MSCI EAFE Index in the energy, health care, information technology, utilities and telecommunication services sectors at the end of the Reporting Period.
From a country perspective, the Fund had greater positions in Ireland, Italy and Belgium relative to the MSCI EAFE Index at the end of June 2016. The Fund had less exposure to Australia, the U.K., Switzerland and the Netherlands than the MSCI EAFE Index and was rather neutrally weighted to the MSCI EAFE Index in Portugal, Norway, Sweden, China, Singapore, Germany, Spain, Japan, Denmark and France at the end of the Reporting Period. On the same date, the Fund had no exposure to the remaining components of the MSCI EAFE Index and did have exposure to South Korea, which is not a component of the MSCI EAFE Index.
As always, we remained focused on individual stock selection, with sector and country positioning being a secondary, but closely monitored, effect.
What is the Fund’s tactical view and strategy for the months ahead?
At the end of the Reporting Period, persistently low economic growth, interest rates and visibility reinforced our expectation for lower than average returns across asset classes for the remainder of 2016. In our view, equities remain relatively attractive in this environment. We believe equities can still generate positive returns for calendar year 2016, driven by earnings growth.
We believe the potential drivers of upside for regional equity markets, especially outside of the U.S., remain unchanged. However, increased political risk and macroeconomic uncertainty make the near-term risks and rewards more balanced across regions, in our opinion.
Political and economic risks have increased for Europe, especially for the U.K. following the Brexit vote. European companies are more affected by slower GDP growth than U.S. companies because they have higher operating leverage, which could be a near-term headwind. But should economic growth start to improve, we continue to believe European companies have the potential for their earnings growth to catch up to that of their U.S. peers. Heightened global macroeconomic uncertainty drove up the yen, a negative for Japan’s significant export-oriented economy. We believe a strong yen is also likely to dampen inbound tourism, which had been increasing of late. We maintain our belief that Japanese equities may be the beneficiary going forward of a number of non-macro drivers, such as improving corporate governance, potential for shareholder-friendly uses of cash and reasonable valuations.
As always, we maintain our focus on seeking companies that we believe will generate long-term growth in today’s ever-changing market conditions.
4
GOLDMAN SACHS VARIABLE INSURANCE TRUST STRATEGIC INTERNATIONAL EQUITY FUND
Index Definitions
The MSCI® EAFE Index is a market capitalization-weighted composite of securities in 21 developed markets. The MSCI® Index approximates the minimum possible dividend reinvestment. The dividend is reinvested after deduction for withholding tax, applying the rate to non-resident individuals who do not benefit from double taxation treaties. MSCI® Barra uses withholding tax rates applicable to Luxembourg holding companies, as Luxembourg applies the highest rates. The MSCI® EAFE Index is unmanaged and the figures for the Index do not include any deduction for fees or expenses. It is not possible to invest directly in an index.
5
FUND BASICS
Strategic International Equity Fund
as of June 30, 2016
STANDARDIZED TOTAL RETURNS1
| For the period ended 06/30/16 | One Year | Five Years | Ten Years | Since Inception | Inception Date | |||||||||||||
| Institutional | -10.57 | % | 1.92 | % | 0.98 | % | 3.15 | % | 1/12/98 | |||||||||
| Service | -10.81 | 1.66 | 0.76 | 0.73 | 1/9/06 | |||||||||||||
| 1 | The Standardized Total Returns are average annual total returns as of the most recent calendar quarter-end. They assume reinvestment of all distributions at net asset value (“NAV”). Because Institutional Shares and Service Shares do not involve a sales charge, such a charge is not applied to their Standardized Total Returns. |
Total return figures in the above chart represent past performance and do not indicate future results, which will vary. The investment return and principal value of an investment will fluctuate and, therefore, an investor’s shares, when redeemed, may be worth more or less than their original cost. Current performance may be lower or higher than the total return figures in the above chart. Please visit www.GSAMFUNDS.com to obtain the most recent month-end returns.
Performance reflects fee waivers and/or expense limitations in effect during the periods shown. In their absence, performance would be reduced.
EXPENSE RATIOS2
| Net Expense Ratio (Current) | Gross Expense Ratio (Before Waivers) | |||||||||||
| Institutional | 0.87 | % | 1.06 | % | ||||||||
| Service | 1.12 | 1.31 | ||||||||||
| 2 | The expense ratios of the Fund, both current (net of any fee waivers or expense limitations) and before waivers (gross of any fee waivers or expense limitations) are as set forth above according to the most recent publicly available Prospectuses for the Fund and may differ from the expense ratios disclosed in the Financial Highlights in this report. Pursuant to a contractual arrangement, the Fund’s waivers and/or expense limitations will remain in place through at least April 29, 2017 and prior to such date the Investment Adviser may not terminate the arrangements without the approval of the Fund’s Board of Trustees. If these arrangements are discontinued in the future, the expense ratios may change without shareholder approval. |
TOP TEN HOLDINGS AS OF 06/30/163
| Holding | % of Net Assets | Line of Business | Country | |||||
| Royal Dutch Shell PLC Class A | 4.6% | Energy | Netherlands | |||||
| Anheuser-Busch InBev SA/NV | 3.9 | Food, Beverage & Tobacco | Belgium | |||||
| Novartis AG (Registered) | 3.2 | Pharmaceuticals, Biotechnology & Life Sciences | Switzerland | |||||
| Japan Tobacco, Inc. | 2.8 | Food, Beverage & Tobacco | Japan | |||||
| Beiersdorf AG | 2.5 | Household & Personal Products | Germany | |||||
| iShares MSCI Japan Fund | 2.5 | Exchange Traded Fund | United States | |||||
| Kerry Group PLC Class A | 2.5 | Food, Beverage & Tobacco | Ireland | |||||
| Australia & New Zealand Banking Group Ltd. | 2.3 | Banks | Australia | |||||
| Bayer AG (Registered) | 2.3 | Pharmaceuticals, Biotechnology & Life Sciences | Germany | |||||
| Kao Corp. | 2.3 | Household & Personal Products | Japan | |||||
| 3 | The top 10 holdings may not be representative of the Fund’s future investments. |
6
FUND BASICS
FUND VS. BENCHMARK SECTOR ALLOCATIONS4
As of June 30, 2016
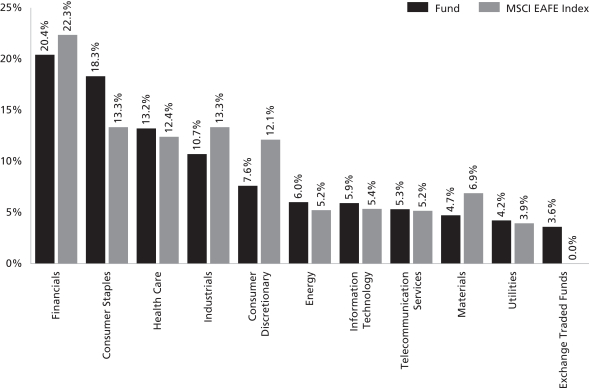
| 4 | The Fund is actively managed and, as such, its composition may differ over time. Consequently, the Fund’s overall sector allocations may differ from percentages contained in the graph above. The graph categorizes investments using Global Industry Classification Standard (“GICS”), however, the sector classifications used by the portfolio management team may differ from GICS. The percentage shown for each investment category reflects the value of investments in that category as a percentage of market value. Underlying sector allocations of Exchange Traded Funds and Investment Companies held by the Fund, if any, are not reflected in the graph above. The graph depicts the Fund’s investments but may not represent the Fund’s market exposure due to the exclusion of certain derivatives, if any, as listed in the Additional Investment Information section of the Schedule of Investments. |
7
GOLDMAN SACHS VARIABLE INSURANCE TRUST STRATEGIC INTERNATIONAL EQUITY FUND
Schedule of Investments
June 30, 2016 (Unaudited)
| Shares | Description | Value | ||||||
| Common Stocks – 94.6% | ||||||||
| Australia – 4.6% |
| ||||||
| 190,888 | Australia & New Zealand Banking Group Ltd. (Banks) | $ | 3,477,989 | |||||
| 65,306 | BHP Billiton PLC (Materials) | 826,574 | ||||||
| 363,921 | Computershare Ltd. (Software & Services) | 2,516,481 | ||||||
|
| |||||||
| 6,821,044 | ||||||||
|
| |||||||
| Belgium – 3.9% |
| ||||||
| 43,794 | Anheuser-Busch InBev SA/NV (Food, Beverage & Tobacco) | 5,791,163 | ||||||
|
| |||||||
| China – 0.6% |
| ||||||
| 486,000 | China Mengniu Dairy Co. Ltd. (Food, Beverage & Tobacco) | 850,215 | ||||||
|
| |||||||
| Denmark – 1.9% |
| ||||||
| 51,786 | Novo Nordisk A/S Class B (Pharmaceuticals, Biotechnology & Life Sciences) | 2,788,826 | ||||||
|
| |||||||
| France – 8.7% |
| ||||||
| 18,489 | Air Liquide SA (Materials) | 1,926,215 | ||||||
| 57,092 | Klepierre (REIT) | 2,519,199 | ||||||
| 25,473 | Publicis Groupe SA (Media) | 1,704,206 | ||||||
| 54,369 | Rexel SA (Capital Goods)* | 683,548 | ||||||
| 32,372 | Safran SA (Capital Goods) | 2,179,989 | ||||||
| 21,087 | Sanofi (Pharmaceuticals, Biotechnology & Life Sciences) | 1,751,965 | ||||||
| 30,647 | Vinci SA (Capital Goods) | 2,162,663 | ||||||
|
| |||||||
| 12,927,785 | ||||||||
|
| |||||||
| Germany – 9.0% |
| ||||||
| 34,064 | Bayer AG (Registered) (Pharmaceuticals, Biotechnology & Life Sciences) | 3,421,215 | ||||||
| 39,448 | Beiersdorf AG (Household & Personal Products) | 3,734,722 | ||||||
| 160,378 | Commerzbank AG (Banks) | 1,044,438 | ||||||
| 15,745 | Covestro AG (Materials)(a) | 701,288 | ||||||
| 42,229 | GEA Group AG (Capital Goods) | 1,993,266 | ||||||
| 32,475 | SAP SE (Software & Services) | 2,439,040 | ||||||
|
| |||||||
| 13,333,969 | ||||||||
|
| |||||||
| Ireland – 5.5% |
| ||||||
| 9,498,054 | Bank of Ireland (Banks)* | 1,935,103 | ||||||
| 41,081 | Kerry Group PLC Class A (Food, Beverage & Tobacco) | 3,643,424 | ||||||
| 42,295 | Shire PLC (Pharmaceuticals, Biotechnology & Life Sciences) | 2,613,937 | ||||||
|
| |||||||
| 8,192,464 | ||||||||
|
| |||||||
| Italy – 4.4% |
| ||||||
| 599,820 | Enel SpA (Utilities) | 2,662,870 | ||||||
| 71,896 | Moncler SpA (Consumer Durables & Apparel) | 1,135,048 | ||||||
|
| |||||||
| Common Stocks – (continued) | ||||||||
| Italy – (continued) |
| ||||||
| 2,295,502 | Telecom Italia SpA (Telecommunication Services)* | $ | 1,885,317 | |||||
| 386,002 | UniCredit SpA (Banks) | 848,917 | ||||||
|
| |||||||
| 6,532,152 | ||||||||
|
| |||||||
| Japan – 20.8% |
| ||||||
| 15,100 | Dentsu, Inc. (Media) | 707,825 | ||||||
| 80,900 | HIS Co. Ltd. (Consumer Services) | 2,612,681 | ||||||
| 66,400 | Hoya Corp. (Health Care Equipment & Services) | 2,371,542 | ||||||
| 103,500 | Japan Tobacco, Inc. (Food, Beverage & Tobacco) | 4,171,278 | ||||||
| 57,400 | Kao Corp. (Household & Personal Products) | 3,343,100 | ||||||
| 94,800 | KDDI Corp. (Telecommunication Services) | 2,882,843 | ||||||
| 113,400 | Kubota Corp. (Capital Goods) | 1,533,772 | ||||||
| 168,000 | Mitsubishi Estate Co. Ltd. (Real Estate) | 3,081,589 | ||||||
| 36,700 | Nidec Corp. (Capital Goods) | 2,793,715 | ||||||
| 172,000 | ORIX Corp. (Diversified Financials) | 2,225,760 | ||||||
| 26,100 | Pola Orbis Holdings, Inc. (Household & Personal Products) | 2,456,275 | ||||||
| 92,800 | Sumitomo Mitsui Financial Group, Inc. (Banks) | 2,679,606 | ||||||
|
| |||||||
| 30,859,986 | ||||||||
|
| |||||||
| Netherlands – 6.0% |
| ||||||
| 20,293 | ASML Holding NV (Semiconductors & Semiconductor Equipment) | 1,997,607 | ||||||
| 249,409 | Royal Dutch Shell PLC Class A (Energy) | 6,850,060 | ||||||
|
| |||||||
| 8,847,667 | ||||||||
|
| |||||||
| Norway – 1.2% |
| ||||||
| 106,852 | Statoil ASA (Energy) | 1,846,238 | ||||||
|
| |||||||
| Singapore – 1.8% |
| ||||||
| 223,021 | DBS Group Holdings Ltd. (Banks) | 2,629,623 | ||||||
|
| |||||||
| South Korea – 0.9% |
| ||||||
| 36,051 | Kia Motors Corp. (Automobiles & Components) | 1,358,380 | ||||||
|
| |||||||
| Spain – 4.1% |
| ||||||
| 283,125 | Banco Bilbao Vizcaya Argentaria SA (Banks) | 1,622,151 | ||||||
| 766,618 | Banco Popular Espanol SA (Banks) | 996,264 | ||||||
| 161,661 | EDP Renovaveis SA (Utilities) | 1,216,816 | ||||||
| 330,670 | Iberdrola SA (Utilities) | 2,255,688 | ||||||
|
| |||||||
| 6,090,919 | ||||||||
|
| |||||||
| 8 | The accompanying notes are an integral part of these financial statements. |
GOLDMAN SACHS VARIABLE INSURANCE TRUST STRATEGIC INTERNATIONAL EQUITY FUND
| Shares | Description | Value | ||||||
| Common Stocks – (continued) | ||||||||
| Sweden – 3.3% |
| ||||||
| 77,478 | Hennes & Mauritz AB Class B (Retailing) | $ | 2,279,466 | |||||
| 81,339 | Svenska Cellulosa AB SCA Class B (Household & Personal Products) | 2,613,476 | ||||||
|
| |||||||
| 4,892,942 | ||||||||
|
| |||||||
| Switzerland – 9.1% |
| ||||||
| 194,438 | Credit Suisse Group AG (Registered) (Diversified Financials)* | 2,071,235 | ||||||
| 57,513 | Novartis AG (Registered) (Pharmaceuticals, Biotechnology & Life Sciences) | 4,747,040 | ||||||
| 6,167 | Syngenta AG (Registered) (Materials) | 2,367,194 | ||||||
| 128,097 | UBS Group AG (Registered) (Diversified Financials) | 1,662,134 | ||||||
| 50,522 | Wolseley PLC (Capital Goods) | 2,616,213 | ||||||
|
| |||||||
| 13,463,816 | ||||||||
|
| |||||||
| United Kingdom – 8.8% |
| ||||||
| 274,524 | Aviva PLC (Insurance) | 1,447,096 | ||||||
| 159,212 | BTG PLC (Pharmaceuticals, Biotechnology & Life Sciences)* | 1,537,716 | ||||||
| 287,533 | Just Eat PLC (Software & Services)* | 1,641,393 | ||||||
| 67,633 | Melrose Industries PLC (Capital Goods) | 384,230 | ||||||
| 473,096 | Rentokil Initial PLC (Commercial & Professional Services) | 1,221,728 | ||||||
| 34,705 | Rio Tinto PLC (Materials) | 1,078,164 | ||||||
| 153,988 | UBM PLC (Media) | 1,320,651 | ||||||
| 445,088 | Virgin Money Holdings UK PLC (Banks) | 1,493,223 | ||||||
| 980,108 | Vodafone Group PLC (Telecommunication Services) | 2,988,212 | ||||||
|
| |||||||
| 13,112,413 | ||||||||
|
| |||||||
| TOTAL COMMON STOCKS | ||||||||
| (Cost $148,577,111) | $ | 140,339,602 | ||||||
|
| |||||||
| Exchange Traded Funds – 3.5% | ||||||||
| United States – 3.5% |
| ||||||
| 26,431 | iShares MSCI EAFE Fund | $ | 1,475,114 | |||||
| 321,029 | iShares MSCI Japan Fund | 3,691,834 | ||||||
|
| |||||||
| TOTAL EXCHANGE TRADED FUNDS | ||||||||
| (Cost $5,454,248) | $ | 5,166,948 | ||||||
|
| |||||||
| TOTAL INVESTMENTS – 98.1% | ||||||||
| (Cost $154,031,359) | $ | 145,506,550 | ||||||
|
| |||||||
| OTHER ASSETS IN EXCESS OF | 2,780,586 | ||||||
|
| |||||||
| NET ASSETS – 100.0% | $ | 148,287,136 | ||||||
|
| |||||||
| The percentage shown for each investment category reflects the value of investments in that category as a percentage of net assets. | ||
| * | Non-income producing security. | |
| (a) | Exempt from registration under Rule 144A of the Securities Act of 1933. Under procedures approved by the Board of Trustees, such securities may be deemed liquid by the Investment Adviser and may be resold, normally to qualified institutional buyers in transactions exempt from registration. Total market value of Rule 144A securities amounts to $701,288, which represents approximately 0.5% of net assets as of June 30, 2016. | |
| Investment Abbreviation: | ||
| REIT | —Real Estate Investment Trust | |
| The accompanying notes are an integral part of these financial statements. | 9 |
GOLDMAN SACHS VARIABLE INSURANCE TRUST STRATEGIC INTERNATIONAL EQUITY FUND
Statement of Assets and Liabilities
June 30, 2016 (Unaudited)
| Assets: | ||||
Investments, at value (cost $154,031,359) | $ | 145,506,550 | ||
Cash | 2,455,008 | |||
Foreign currencies, at value (cost $136,877) | 136,793 | |||
Receivables: | ||||
Dividends | 501,568 | |||
Foreign tax reclaims | 429,451 | |||
Reimbursement from investment adviser | 20,565 | |||
Fund shares sold | 1,361 | |||
| Total assets | 149,051,296 | |||
| Liabilities: | ||||
Payables: | ||||
Investments purchased | 397,085 | |||
Fund shares redeemed | 129,507 | |||
Management fees | 99,140 | |||
Distribution and Service fees and Transfer Agency fees | 25,022 | |||
Accrued expenses | 113,406 | |||
| Total liabilities | 764,160 | |||
| Net Assets: | ||||
Paid-in capital | 245,663,508 | |||
Undistributed net investment income | 2,326,865 | |||
Accumulated net realized loss | (91,151,991 | ) | ||
Net unrealized loss | (8,551,246 | ) | ||
| NET ASSETS | $ | 148,287,136 | ||
Net Assets: | ||||
Institutional | $ | 38,803,556 | ||
Service | 109,483,580 | |||
Total Net Assets | $ | 148,287,136 | ||
Shares outstanding $0.001 par value (unlimited shares authorized): | ||||
Institutional | 4,384,513 | |||
Service | 12,356,959 | |||
Net asset value, offering and redemption price per share: | ||||
Institutional | $8.85 | |||
Service | 8.86 | |||
| 10 | The accompanying notes are an integral part of these financial statements. |
GOLDMAN SACHS VARIABLE INSURANCE TRUST STRATEGIC INTERNATIONAL EQUITY FUND
Statement of Operations
For the Six Months Ended June 30, 2016 (Unaudited)
| Investment income: | ||||
Dividends (net of foreign taxes withheld of $270,413) | $ | 3,034,213 | ||
| Expenses: | ||||
Management fees | 631,835 | |||
Distribution and Service fees — Service Shares(a) | 137,040 | |||
Custody, accounting and administrative services | 58,606 | |||
Professional fees | 43,731 | |||
Printing and mailing costs | 33,788 | |||
Transfer Agency fees(a) | 14,865 | |||
Trustee fees | 11,954 | |||
Other | 9,311 | |||
| Total expenses | 941,130 | |||
Less — expense reductions | (135,761 | ) | ||
| Net expenses | 805,369 | |||
| NET INVESTMENT INCOME | 2,228,844 | |||
| Realized and unrealized gain (loss): | ||||
Net realized loss from: | ||||
Investments | (5,117,755 | ) | ||
Foreign currency transactions | (26,224 | ) | ||
Net change in unrealized gain (loss) on: | ||||
Investments (including the effects of the net change in the foreign capital gains tax liability of $(176,824)) | (3,137,955 | ) | ||
Foreign currency translation | 98,164 | |||
| Net realized and unrealized loss | (8,183,770 | ) | ||
| NET DECREASE IN NET ASSETS RESULTING FROM OPERATIONS | $ | (5,954,926 | ) | |
(a) Institutional and Service Shares incurred Transfer Agency fees of $3,903 and $10,962, respectively.
| The accompanying notes are an integral part of these financial statements. | 11 |
GOLDMAN SACHS VARIABLE INSURANCE TRUST STRATEGIC INTERNATIONAL EQUITY FUND
Statements of Changes in Net Assets
| For the Six Months Ended June 30, 2016 (Unaudited) | For the Fiscal Year Ended December 31, 2015 | |||||||
| From operations: | ||||||||
Net investment income | $ | 2,228,844 | $ | 2,199,254 | ||||
Net realized gain (loss) | (5,143,979 | ) | 1,656,787 | |||||
Net change in unrealized loss | (3,039,791 | ) | (1,838,095 | ) | ||||
| Net increase (decrease) in net assets resulting from operations | (5,954,926 | ) | 2,017,946 | |||||
| Distributions to shareholders: | ||||||||
From net investment income | ||||||||
Institutional Shares | — | (744,425 | ) | |||||
Service Shares | — | (1,759,317 | ) | |||||
| Total distributions to shareholders | — | (2,503,742 | ) | |||||
| From share transactions: | ||||||||
Proceeds from sales of shares | 2,629,286 | 10,473,455 | ||||||
Reinvestment of distributions | — | 2,503,742 | ||||||
Cost of shares redeemed | (6,934,849 | ) | (27,045,586 | ) | ||||
| Net decrease in net assets resulting from share transactions | (4,305,563 | ) | (14,068,389 | ) | ||||
| TOTAL DECREASE | (10,260,489 | ) | (14,554,185 | ) | ||||
| Net assets: | ||||||||
Beginning of period | 158,547,625 | 173,101,810 | ||||||
End of period | $ | 148,287,136 | $ | 158,547,625 | ||||
| Undistributed net investment income | $ | 2,326,865 | $ | 98,021 | ||||
| 12 | The accompanying notes are an integral part of these financial statements. |
GOLDMAN SACHS VARIABLE INSURANCE TRUST STRATEGIC INTERNATIONAL EQUITY FUND
Financial Highlights
Selected Data for a Share Outstanding Throughout Each Period
| Income (loss) from investment operations | ||||||||||||||||||||||||||||||||||||||||||||||||
| Year - Share Class | Net asset value, beginning of period | Net investment income(a) | Net realized and unrealized gain (loss) | Total from investment operations | Distributions to shareholders from net investment income | Net asset value, end of period | Total return(b) | Net assets, end of period (in 000s) | Ratio of net expenses to average net assets | Ratio of total expenses to average net assets | Ratio of net investment income to average net assets | Portfolio turnover rate(c) | ||||||||||||||||||||||||||||||||||||
FOR THE SIX MONTHS ENDED JUNE 30, (UNAUDITED) | ||||||||||||||||||||||||||||||||||||||||||||||||
2016 - Institutional | $ | 9.19 | $ | 0.14 | (d) | $ | (0.48 | ) | $ | (0.34 | ) | $ | — | $ | 8.85 | (3.70 | )% | $ | 38,804 | 0.90 | %(e) | 1.08 | %(e) | 3.18 | %(d)(e) | 22 | % | |||||||||||||||||||||
2016 - Service | 9.21 | 0.13 | (d) | (0.48 | ) | (0.35 | ) | — | 8.86 | (3.80 | ) | 109,484 | 1.15 | (e) | 1.33 | (e) | 2.93 | (d)(e) | 22 | |||||||||||||||||||||||||||||
FOR THE FISCAL YEARS ENDED DECEMBER 31, | ||||||||||||||||||||||||||||||||||||||||||||||||
2015 - Institutional | 9.26 | 0.14 | (f) | (0.04 | ) | 0.10 | (0.17 | ) | 9.19 | 1.05 | 41,737 | 0.89 | 1.06 | 1.42 | (f) | 58 | ||||||||||||||||||||||||||||||||
2015 - Service | 9.28 | 0.12 | (f) | (0.05 | ) | 0.07 | (0.14 | ) | 9.21 | 0.77 | 116,811 | 1.14 | 1.31 | 1.18 | (f) | 58 | ||||||||||||||||||||||||||||||||
2014 - Institutional | 10.43 | 0.39 | (g) | (1.18 | ) | (0.79 | ) | (0.38 | ) | 9.26 | (7.54 | ) | 46,871 | 0.99 | 1.04 | 3.75 | (g) | 74 | ||||||||||||||||||||||||||||||
2014 - Service | 10.44 | 0.36 | (g) | (1.17 | ) | (0.81 | ) | (0.35 | ) | 9.28 | (7.70 | ) | 126,230 | 1.24 | 1.29 | 3.47 | (g) | 74 | ||||||||||||||||||||||||||||||
2013 - Institutional | 8.56 | 0.16 | 1.89 | 2.05 | (0.18 | ) | 10.43 | 24.20 | 59,187 | 0.98 | 1.05 | 1.67 | 95 | |||||||||||||||||||||||||||||||||||
2013 - Service | 8.57 | 0.13 | 1.90 | 2.03 | (0.16 | ) | 10.44 | 23.73 | 152,513 | 1.23 | 1.30 | 1.42 | 95 | |||||||||||||||||||||||||||||||||||
2012 - Institutional | 7.20 | 0.16 | 1.38 | 1.54 | (0.18 | ) | 8.56 | 21.17 | 56,872 | 0.97 | 1.03 | 2.06 | 110 | |||||||||||||||||||||||||||||||||||
2012 - Service | 7.22 | 0.14 | 1.37 | 1.51 | (0.16 | ) | 8.57 | 20.82 | 139,250 | 1.22 | 1.28 | 1.80 | 110 | |||||||||||||||||||||||||||||||||||
2011 - Institutional | 8.82 | 0.26 | (h) | (1.59 | ) | (1.33 | ) | (0.29 | ) | 7.20 | (15.05 | ) | 55,954 | 0.99 | 1.04 | 3.03 | (h) | 143 | ||||||||||||||||||||||||||||||
2011 - Service | 8.83 | 0.24 | (h) | (1.58 | ) | (1.34 | ) | (0.27 | ) | 7.22 | (15.16 | ) | 125,991 | 1.24 | 1.29 | 2.80 | (h) | 143 | ||||||||||||||||||||||||||||||
| (a) | Calculated based on the average shares outstanding methodology. |
| (b) | Assumes investment at the net asset value at the beginning of the period, reinvestment of all distributions, and a complete redemption of the investment at the net asset value at the end of the period. Total returns for periods less than one full year are not annualized. |
| (c) | The Fund’s portfolio turnover rate is calculated in accordance with regulatory requirements, without regard to transactions involving short term investments. If such transactions were included, the Fund’s portfolio turnover rate may be higher. |
| (d) | Reflects income recognized from a corporate action which amounted to $0.03 per share and 0.31% of average net assets. |
| (e) | Annualized. |
| (f) | Reflects income recognized from a corporate action which amounted to $0.02 per share and 0.17% of average net assets. |
| (g) | Reflects income recognized from a corporate action which amounted to $0.22 per share and 2.10% of average net assets. |
| (h) | Reflects income recognized from a corporate action which amounted to $0.11 per share and 1.33% of average net assets. |
| The accompanying notes are an integral part of these financial statements. | 13 |
GOLDMAN SACHS VARIABLE INSURANCE TRUST STRATEGIC INTERNATIONAL EQUITY FUND
Notes to Financial Statements
June 30, 2016 (Unaudited)
1. ORGANIZATION
Goldman Sachs Variable Insurance Trust (the “Trust” or “VIT”) is a Delaware statutory trust registered under the Investment Company Act of 1940, as amended (the “Act”), as an open-end management investment company. The Trust includes the Goldman Sachs Strategic International Equity Fund (the “Fund”). The Fund is a diversified portfolio under the Act offering two classes of shares — Institutional and Service Shares. Shares of the Trust are offered to separate accounts of participating life insurance companies for the purpose of funding variable annuity contracts and variable life insurance policies.
Goldman Sachs Asset Management International (“GSAMI”), an affiliate of Goldman, Sachs & Co. (“Goldman Sachs”), serves as investment adviser to the Fund pursuant to a management agreement (the “Agreement”) with the Trust.
2. SIGNIFICANT ACCOUNTING POLICIES
The financial statements have been prepared in accordance with accounting principles generally accepted in the United States of America (“GAAP”) and require management to make estimates and assumptions that may affect the reported amounts and disclosures. Actual results may differ from those estimates and assumptions.
A. Investment Valuation — The Fund’s valuation policy is to value investments at fair value.
B. Investment Income and Investments — Investment income includes interest income, dividend income, net of any foreign withholding taxes, less any amounts reclaimable, and securities lending income. Interest income is accrued daily and adjusted for amortization of premiums and accretion of discounts. Dividend income is recognized on ex-dividend date or, for certain foreign securities, as soon as such information is obtained subsequent to the ex-dividend date. Investment transactions are reflected on trade date. Realized gains and losses are calculated using identified cost. Investment transactions are recorded on the following business day for daily net asset value (“NAV”) calculations. Any foreign capital gains tax is accrued daily based upon net unrealized gains, and is payable upon sale of such investments. Distributions received from the Fund’s investments in United States (“U.S.”) real estate investment trusts (“REITs”) may be characterized as ordinary income, net capital gain or a return of capital. A return of capital is recorded by the Fund as a reduction to the cost basis of the REIT.
C. Class Allocations and Expenses — Investment income, realized and unrealized gain (loss), and non-class specific expenses of the Fund are allocated daily based upon the proportion of net assets of each class. Non-class specific expenses directly incurred by the Fund are charged to the Fund, while such expenses incurred by the Trust are allocated across the Fund on a straight-line and/or pro-rata basis depending upon the nature of the expenses. Class specific expenses, where applicable, are borne by the respective share classes and include Distribution and Service and Transfer Agency fees.
D. Federal Taxes and Distributions to Shareholders — It is the Fund’s policy to comply with the requirements of the Internal Revenue Code of 1986, as amended (the “Code”), applicable to regulated investment companies (mutual funds) and to distribute each year substantially all of its investment company taxable income and capital gains to its shareholders. Accordingly, the Fund is not required to make any provisions for the payment of federal income tax. Distributions to shareholders are recorded on the ex-dividend date. Income and capital gains distributions, if any, are declared and paid annually.
Net capital losses are carried forward to future fiscal years and may be used to the extent allowed by the Code to offset any future capital gains. Utilization of capital loss carryforwards will reduce the requirement of future capital gains distributions.
Under the Regulated Investment Company Modernization Act of 2010, the Fund is permitted to carry forward capital losses incurred in taxable years beginning after December 22, 2010 for an unlimited period. However, any losses incurred during those future taxable years will be required to be utilized prior to the losses incurred in pre-enactment taxable years. As a result of this ordering rule, pre-enactment capital loss carryforwards may be more likely to expire unused. Additionally, post-enactment capital losses that are carried forward will retain their character as either short-term or long-term capital losses rather than being considered all short-term as under previous law.
The characterization of distributions to shareholders for financial reporting purposes is determined in accordance with federal income tax rules, which may differ from GAAP. The source of the Fund’s distributions may be shown in the accompanying
14
GOLDMAN SACHS VARIABLE INSURANCE TRUST STRATEGIC INTERNATIONAL EQUITY FUND
2. SIGNIFICANT ACCOUNTING POLICIES (continued)
financial statements as either from net investment income, net realized gain or capital. Certain components of the Fund’s net assets on the Statement of Assets and Liabilities reflect permanent GAAP/tax differences based on the appropriate tax character.
E. Foreign Currency Translation — The accounting records and reporting currency of the Fund are maintained in U.S. dollars. Assets and liabilities denominated in foreign currencies are translated into U.S. dollars using the current exchange rates at the close of each business day. The effect of changes in foreign currency exchange rates on investments is included within net realized and unrealized gain (loss) on investments. Changes in the value of other assets and liabilities as a result of fluctuations in foreign exchange rates are included in the Statement of Operations within net change in unrealized gain (loss) on foreign currency translations. Transactions denominated in foreign currencies are translated into U.S. dollars on the date the transaction occurred, the effects of which are included within net realized gain (loss) on foreign currency transactions.
3. INVESTMENTS AND FAIR VALUE MEASUREMENTS
The fair value of a financial instrument is the amount that would be received to sell an asset or paid to transfer a liability in an orderly transaction between market participants at the measurement date (i.e., the exit price). GAAP establishes a fair value hierarchy that prioritizes the inputs to valuation techniques used to measure fair value. The hierarchy gives the highest priority to unadjusted quoted prices in active markets for identical assets or liabilities (Level 1 measurements) and the lowest priority to unobservable inputs (Level 3 measurements). The levels used for classifying investments are not necessarily an indication of the risk associated with investing in these investments. The three levels of the fair value hierarchy are described below:
Level 1 — Unadjusted quoted prices in active markets that are accessible at the measurement date for identical, unrestricted assets or liabilities;
Level 2 — Quoted prices in markets that are not active or financial instruments for which significant inputs are observable (including, but not limited to, quoted prices for similar investments, interest rates, foreign exchange rates, volatility and credit spreads), either directly or indirectly;
Level 3 — Prices or valuations that require significant unobservable inputs (including GSAMI’s assumptions in determining fair value measurement).
Changes in valuation techniques may result in transfers into or out of an assigned level within the hierarchy. In accordance with the Fund’s policy, transfers between different levels of the fair value hierarchy resulting from such changes are deemed to have occurred as of the beginning of the reporting period.
The Board of Trustees (“Trustees”) has approved Valuation Procedures that govern the valuation of the portfolio investments held by the Fund, including investments for which market quotations are not readily available. The Trustees have delegated to GSAMI day-to-day responsibility for implementing and maintaining internal controls and procedures related to the valuation of the Fund’s portfolio investments. To assess the continuing appropriateness of pricing sources and methodologies, GSAMI regularly performs price verification procedures and issues challenges as necessary to third party pricing vendors or brokers, and any differences are reviewed in accordance with the Valuation Procedures.
A. Level 1 and Level 2 Fair Value Investments — The valuation techniques and significant inputs used in determining the fair values for investments classified as Level 1 and Level 2 are as follows:
Equity Securities — Equity securities traded on a U.S. securities exchange or the NASDAQ system, or those located on certain foreign exchanges, including but not limited to the Americas, are valued daily at their last sale price or official closing price on the principal exchange or system on which they are traded. If there is no sale or official closing price or such price is believed by GSAMI to not represent fair value, equity securities are valued at the last bid price for long positions and at the last ask price for short positions. To the extent these investments are actively traded, they are classified as Level 1 of the fair value hierarchy, otherwise they are generally classified as Level 2.
15
GOLDMAN SACHS VARIABLE INSURANCE TRUST STRATEGIC INTERNATIONAL EQUITY FUND
Notes to Financial Statements (continued)
June 30, 2016 (Unaudited)
3. INVESTMENTS AND FAIR VALUE MEASUREMENTS (continued)
Unlisted equity securities for which market quotations are available are valued at the last sale price on the valuation date, or if no sale occurs, at the last bid price. Securities traded on certain foreign securities exchanges are valued daily at fair value determined by an independent fair value service (if available) under Valuation Procedures approved by the Trustees and consistent with applicable regulatory guidance. The independent fair value service takes into account multiple factors including, but not limited to, movements in the securities markets, certain depositary receipts, futures contracts and foreign currency exchange rates that have occurred subsequent to the close of the foreign securities exchange. These investments are generally classified as Level 2 of the fair value hierarchy.
Exchange Traded Funds — Investments in exchange-traded funds (“ETFs”) are valued daily at the last sale price or official closing price on the principal exchange or system on which the investment is traded. To the extent these investments are actively traded, they are classified as Level 1 of the fair value hierarchy, otherwise they are generally classified as Level 2. For information regarding an ETF’s accounting policies and investment holdings, please see the ETF’s shareholder report.
B. Level 3 Fair Value Investments — To the extent that significant inputs to valuation models and other alternative pricing sources are unobservable, or if quotations are not readily available, or if GSAMI believes that such quotations do not accurately reflect fair value, the fair value of the Fund’s investments may be determined under Valuation Procedures approved by the Trustees. GSAMI, consistent with its procedures and applicable regulatory guidance, may make an adjustment to the most recent valuation prices of either domestic or foreign securities in light of significant events to reflect what it believes to be the fair value of the securities at the time of determining a Fund’s NAV. Significant events which could affect a large number of securities in a particular market may include, but are not limited to: significant fluctuations in U.S. or foreign markets; market dislocations; market disruptions; or unscheduled market closings. Significant events which could also affect a single issuer may include, but are not limited to: corporate actions such as reorganizations, mergers and buy-outs; ratings downgrades; and bankruptcies.
C. Fair Value Hierarchy — The following is a summary of the Fund’s investments classified in the fair value hierarchy as of June 30, 2016:
| Investment Type | Level 1 | Level 2 | Level 3 | |||||||||
| Assets | ||||||||||||
| Common Stock and/or Other Equity Investments(a) | ||||||||||||
Asia | $ | — | $ | 35,698,204 | $ | — | ||||||
Australia and Oceania | — | 6,821,044 | — | |||||||||
Europe | — | 97,820,354 | — | |||||||||
North America | 5,166,948 | — | — | |||||||||
| Total | $ | 5,166,948 | $ | 140,339,602 | $ | — | ||||||
| (a) | Amounts are disclosed by continent to highlight the impact of time zone differences between local market close and the calculation of NAV. Security valuations are based on the principal exchange or system on which they are traded, which may differ from country of domicile noted in table. The Fund utilizes fair value model prices provided by an independent fair value service for certain international equity securities, resulting in a Level 2 classification. |
For further information regarding security characteristics, see the Schedule of Investments.
4. AGREEMENTS AND AFFILIATED TRANSACTIONS
A. Management Agreement — Under the Agreement, GSAMI manages the Fund, subject to the general supervision of the Trustees.
As compensation for the services rendered pursuant to the Agreement, the assumption of the expenses related thereto and administration of the Fund’s business affairs, including providing facilities, GSAMI is entitled to a management fee, accrued daily and paid monthly, equal to an annual percentage rate of the Fund’s average daily net assets.
16
GOLDMAN SACHS VARIABLE INSURANCE TRUST STRATEGIC INTERNATIONAL EQUITY FUND
4. AGREEMENTS AND AFFILIATED TRANSACTIONS (continued)
For the six months ended June 30, 2016, contractual and effective net management fees with GSAMI were at the following rates:
| Contractual Management Rate | ||||||||||||||||||||||||
| First $1 billion | Next $1 billion | Next $3 billion | Next $3 billion | Over $8 billion | Effective Rate | Effective Net Management Rate^ | ||||||||||||||||||
| 0.85% | 0.77 | % | 0.73 | % | 0.72 | % | 0.71 | % | 0.85 | % | 0.81 | %* | ||||||||||||
| ^ | Effective Net Management Rate includes the impact of management fee waivers of affiliated underlying funds, if any. |
| * | GSAMI agreed to waive a portion of its management fee in order to achieve a net management rate, as defined in the Fund’s most recent prospectus. This waiver will be effective through at least April 29, 2017 and prior to such date GSAMI may not terminate the arrangement without approval of the Trustees. For the six months ended June 30, 2016, GSAMI waived $29,734 of its management fee. |
B. Distribution and Service Plan — The Trust, on behalf of the Service Shares of the Fund, has adopted a Distribution and Service Plan (the “Plan”). Under the Plan, Goldman Sachs, which serves as distributor (the “Distributor”), is entitled to a fee accrued daily and paid monthly, for distribution services and personal and account maintenance services, which may then be paid by Goldman Sachs to authorized dealers, equal to, on an annual basis, 0.25% of the Fund’s average daily net assets attributable to Service Shares.
C. Transfer Agency Agreement — Goldman Sachs also serves as the transfer agent of the Fund for a fee pursuant to the Transfer Agency Agreement. The fees charged for such transfer agency services are accrued daily and paid monthly at an annual rate of 0.02% of the average daily net assets of Institutional and Service Shares.
D. Other Expense Agreements and Affiliated Transactions — GSAMI has agreed to limit certain “Other Expenses” of the Fund (excluding acquired fund fees and expenses, transfer agency fees and expenses, taxes, interest, brokerage fees, shareholder meeting, litigation, indemnification and extraordinary expenses) to the extent such expenses exceed, on an annual basis, a percentage rate of the average daily net assets of the Fund. Such Other Expense reimbursements, if any, are accrued daily and paid monthly. In addition, the Fund is not obligated to reimburse GSAMI for prior fiscal year expense reimbursements, if any. The Other Expense limitation as an annual percentage rate of average daily net assets for the Fund is 0.044%. Prior to April 30, 2016 the Other Expense limitation for the Fund was 0.084%. The Other Expense limitation will remain in place through at least April 29, 2017, and prior to such date GSAMI may not terminate the arrangement without the approval of the Trustees. For the six months ended June 30, 2016, GSAMI reimbursed $105,344 to the Fund. In addition, the Fund has entered into certain offset arrangements with the custodian and the transfer agent, which may result in a reduction of the Fund’s expenses and are received irrespective of the application of the “Other Expense” limitations described above. For the six months ended June 30, 2016, custody fee credits were $683.
E. Line of Credit Facility — As of June 30, 2016, the Fund participated in a $1,100,000,000 committed, unsecured revolving line of credit facility (the “facility”) together with other funds of the Trust and registered investment companies having management agreements with GSAMI or its affiliates (“Other Borrowers”). This facility is to be used for temporary or emergency purposes, or to allow for an orderly liquidation of securities to meet redemption requests. The interest rate on borrowings is based on the federal funds rate. The facility also requires a fee to be paid by the Fund based on the amount of the commitment that has not been utilized. For the six months ended June 30, 2016, the Fund did not have any borrowings under the facility.
5. PORTFOLIO SECURITIES TRANSACTIONS
The cost of purchases and proceeds from sales and maturities of long-term securities for the six months ended June 30, 2016, were $32,854,497 and $35,205,631, respectively.
17
GOLDMAN SACHS VARIABLE INSURANCE TRUST STRATEGIC INTERNATIONAL EQUITY FUND
Notes to Financial Statements (continued)
June 30, 2016 (Unaudited)
6. TAX INFORMATION
As of the Fund’s most recent fiscal year end, December 31, 2015, the Fund’s capital loss carryforwards and certain timing differences, on a tax-basis were as follows:
| Capital loss carryforwards:(1) | ||||
Expiring 2016 | (21,940,989 | ) | ||
Expiring 2017 | (63,558,058 | ) | ||
| Total capital loss carryforwards | $ | (85,499,047 | ) | |
| Timing differences (Qualified Late Year Loss Deferral/Post October Loss Deferral) | $ | (64,875 | ) |
| (1) | Expiration occurs on December 31 of the year indicated. |
As of June 30, 2016, the Fund’s aggregate security unrealized gains and losses based on cost for U.S. federal income tax purposes were as follows:
| Tax cost | $ | 154,481,611 | ||
| Gross unrealized gain | 13,992,238 | |||
| Gross unrealized loss | (22,967,299 | ) | ||
| Net unrealized loss | $ | (8,975,061 | ) |
The difference between GAAP-basis and tax-basis unrealized gains (losses) is attributable primarily to wash sales.
GSAMI has reviewed the Fund’s tax positions for all open tax years (the current and prior three years, as applicable) and has concluded that no provision for income tax is required in the Fund’s financial statements. Such open tax years remain subject to examination and adjustment by tax authorities.
7. OTHER RISKS
The Fund’s risks include, but are not limited to, the following:
Foreign Countries Risk — Investing in foreign markets may involve special risks and considerations not typically associated with investing in the U.S. Foreign securities may be subject to risk of loss because of more or less foreign government regulation, less public information and less economic, political and social stability in the countries in which the Fund invests. Loss may also result from the imposition of exchange controls, confiscations and other government restrictions by the U.S. or other governments, or from problems in registration, settlement or custody. Foreign risk also involves the risk of negative foreign currency rate fluctuations, which may cause the value of securities denominated in such foreign currency (or other instruments through which the Fund has exposure to foreign currencies) to decline in value. Currency exchange rates may fluctuate significantly over short periods of time.
Foreign Custody Risk — The Fund that invests in foreign securities may hold such securities and cash with foreign banks, agents, and securities depositories appointed by the Fund’s custodian (each a “Foreign Custodian”). Some foreign custodians may be recently organized or new to the foreign custody business. In some countries, Foreign Custodians may be subject to little or no regulatory oversight over, or independent evaluation of, their operations. Further, the laws of certain countries may place limitations on the Fund’s ability to recover its assets if a Foreign Custodian enters bankruptcy.
Investments in Other Investment Companies — As a shareholder of another investment company, including an exchange traded fund (“ETF”), the Fund will indirectly bear its proportionate share of any net management fees and other expenses paid by such other investment companies, in addition to the fees and expenses regularly borne by the Fund. ETFs are subject to risks that do not apply to conventional mutual funds, including but not limited to the following: (i) the market price of the ETF’s shares may
18
GOLDMAN SACHS VARIABLE INSURANCE TRUST STRATEGIC INTERNATIONAL EQUITY FUND
7. OTHER RISKS (continued)
trade at a premium or a discount to their NAV; and (ii) an active trading market for an ETF’s shares may not develop or be maintained.
Large Shareholder Transactions Risk — The Fund may experience adverse effects when certain large shareholders, such as other funds, participating insurance companies, accounts and Goldman Sachs affiliates, purchase or redeem large amounts of shares of the Fund. Such large shareholder redemptions may cause the Fund to sell portfolio securities at times when it would not otherwise do so, which may negatively impact the Fund’s NAV and liquidity. These transactions may also accelerate the realization of taxable income to shareholders if such sales of investments resulted in gains, and may also increase transaction costs. In addition, a large redemption could result in the Fund’s current expenses being allocated over a smaller asset base, leading to an increase in the Fund’s expense ratio. Similarly, large Fund share purchases may adversely affect the Fund’s performance to the extent that the Fund is delayed in investing new cash and is required to maintain a larger cash position than it ordinarily would.
Liquidity Risk — The Fund may make investments that are illiquid or that may become less liquid in response to market developments or adverse investor perceptions. Illiquid investments may be more difficult to value. Liquidity risk may also refer to the risk that the Fund will not be able to pay redemption proceeds within the allowable time period because of unusual market conditions, an unusually high volume of redemption requests, or other reasons. To meet redemption requests, the Fund may be forced to sell investments at an unfavorable time and/or under unfavorable conditions.
Market and Credit Risks — In the normal course of business, the Fund trades financial instruments and enters into financial transactions where risk of potential loss exists due to changes in the market (market risk). Additionally, the Fund may also be exposed to credit risk in the event that an issuer or guarantor fails to perform or that an institution or entity with which the Fund has unsettled or open transactions defaults.
8. INDEMNIFICATIONS
Under the Trust’s organizational documents, its Trustees, officers, employees and agents are indemnified, to the extent permitted by the Act and state law, against certain liabilities that may arise out of performance of their duties to the Fund. Additionally, in the course of business, the Fund enters into contracts that contain a variety of indemnification clauses. The Fund’s maximum exposure under these arrangements is unknown, as this would involve future claims that may be made against the Fund that have not yet occurred. However, GSAMI believes the risk of loss under these arrangements to be remote.
9. SUBSEQUENT EVENTS
Subsequent events after the Statement of Assets and Liabilities date have been evaluated through the date the financial statements were issued. GSAMI has concluded that there is no impact requiring adjustment or disclosure in the financial statements.
19
GOLDMAN SACHS VARIABLE INSURANCE TRUST STRATEGIC INTERNATIONAL EQUITY FUND
Notes to Financial Statements (continued)
June 30, 2016 (Unaudited)
10. SUMMARY OF SHARE TRANSACTIONS
Share activity is as follows:
| For the Six Months Ended June 30, 2016 (Unaudited) | For the Fiscal Year Ended December 31, 2015 | |||||||||||||||
| Shares | Dollars | Shares | Dollars | |||||||||||||
| Institutional Shares | ||||||||||||||||
| Shares sold | 67,724 | $ | 597,980 | 78,427 | $ | 762,672 | ||||||||||
| Reinvestment of distributions | — | — | 81,626 | 744,425 | ||||||||||||
| Shares redeemed | (226,502 | ) | (1,995,293 | ) | (678,130 | ) | (6,709,975 | ) | ||||||||
| (158,778 | ) | (1,397,313 | ) | (518,077 | ) | (5,202,878 | ) | |||||||||
| Service Shares | ||||||||||||||||
| Shares sold | 230,207 | 2,031,306 | 982,644 | 9,710,783 | ||||||||||||
| Reinvestment of distributions | — | — | 192,485 | 1,759,317 | ||||||||||||
| Shares redeemed | (558,830 | ) | (4,939,556 | ) | (2,092,691 | ) | (20,335,611 | ) | ||||||||
| (328,623 | ) | (2,908,250 | ) | (917,562 | ) | (8,865,511 | ) | |||||||||
| NET DECREASE | (487,401 | ) | $ | (4,305,563 | ) | (1,435,639 | ) | $ | (14,068,389 | ) | ||||||
20
GOLDMAN SACHS VARIABLE INSURANCE TRUST STRATEGIC INTERNATIONAL EQUITY FUND
| Fund Expenses — Six Month Period Ended June 30, 2016 (Unaudited) |
As a shareholder of Institutional or Service Shares of the Fund, you incur ongoing costs, including management fees, distribution and service (12b-1) fees (with respect to Service Shares) and other Fund expenses. This example is intended to help you understand your ongoing costs (in dollars) of investing in the Institutional Shares and Service Shares of the Fund and to compare these costs with the ongoing costs of investing in other mutual funds.
The example is based on an investment of $1,000 invested at the beginning of the period and held for the entire period from January 1, 2016 through June 30, 2016, which represents a period of 182 days of a 366 day year.
Actual Expenses — The first line under each share class in the table below provides information about actual account values and actual expenses. You may use the information in this line, together with the amount you invested, to estimate the expenses that you paid over the period. Simply divide your account value by $1,000 (for example, an $8,600 account value divided by $1,000=8.6), then multiply the result by the number in the first line under the heading entitled “Expenses Paid” to estimate the expenses you paid on your account during this period.
Hypothetical Example for Comparison Purposes — The second line under each share class in the table below provides information about hypothetical account values and hypothetical expenses based on the Fund's actual net expense ratio and an assumed rate of return of 5% per year before expenses, which is not the Fund's actual return. The hypothetical account values and expenses may not be used to estimate the actual ending account balance or expenses you paid for the period. You may use this information to compare the ongoing costs of investing in the Fund and other funds. To do so, compare this 5% hypothetical example with the 5% hypothetical examples that appear in the shareholder reports of the other funds.
Please note that the expenses shown in the table are meant to highlight your ongoing costs only. As a shareholder of the Fund you do not incur any transaction costs, such as sales charges, redemption fees, or exchange fees, but shareholders of other funds may incur such costs. The second line of the table is useful in comparing ongoing costs only, and will not help you determine the relative total costs of owning different funds whose shareholders may incur transaction costs.
| Share Class | Beginning Account Value 01/01/16 | Ending Account Value | Expenses Paid for the 6 Months Ended 06/30/16* | |||||||||
| Institutional | ||||||||||||
| Actual | $ | 1,000 | $ | 963.00 | $ | 4.39 | ||||||
| Hypothetical 5% return | 1,000 | 1,020.39 | + | 4.52 | ||||||||
| Service | ||||||||||||
| Actual | 1,000 | 962.00 | 5.61 | |||||||||
| Hypothetical 5% return | 1,000 | 1,019.14 | + | 5.77 | ||||||||
| * | Expenses are calculated using the Fund’s annualized net expense ratio for each class, which represents the ongoing expenses as a percentage of net assets for the six months ended June 30, 2016. Expenses are calculated by multiplying the annualized net expense ratio by the average account value for the period; then multiplying the result by the number of days in the most recent fiscal half year; and then dividing that result by the number of days in the fiscal year. The annualized net expense ratios for the period were 0.90% and 1.15% for Institutional and Service Shares, respectively. |
| + | Hypothetical expenses are based on the Fund’s actual annualized net expense ratios and an assumed rate of return of 5% per year before expenses. |
21
GOLDMAN SACHS VARIABLE INSURANCE TRUST STRATEGIC INTERNATIONAL EQUITY FUND
Statement Regarding Basis for Approval of Management Agreement (Unaudited)
Background
The Goldman Sachs Strategic International Equity Fund (the “Fund”) is an investment portfolio of Goldman Sachs Variable Insurance Trust (the “Trust”). The Board of Trustees oversees the management of the Trust and reviews the investment performance and expenses of the Fund at regularly scheduled meetings held throughout the year. In addition, the Board of Trustees determines annually whether to approve the continuance of the Trust’s investment management agreement (the “Management Agreement”) with Goldman Sachs Asset Management International (the “Investment Adviser”) on behalf of the Fund.
The Management Agreement was most recently approved for continuation until June 30, 2017 by the Board of Trustees, including those Trustees who are not parties to the Management Agreement or “interested persons” (as defined in the Investment Company Act of 1940, as amended) of any party thereto (the “Independent Trustees”), at a meeting held on June 15-16, 2016 (the “Annual Meeting”).
The review process undertaken by the Trustees spans the course of the year and culminates with the Annual Meeting. To assist the Trustees in their deliberations, the Trustees have established a Contract Review Committee (the “Committee”), comprised of the Independent Trustees. The Committee held three meetings over the course of the year since the Management Agreement was last approved. At those Committee meetings, regularly scheduled Board or other committee meetings, and/or the Annual Meeting, matters relevant to the renewal of the Management Agreement were considered by the Board, or the Independent Trustees, as applicable. With respect to the Fund, such matters included:
| (a) | the nature and quality of the advisory, administrative, and other services provided to the Fund by the Investment Adviser and its affiliates, including information about: |
| (i) | the structure, staff, and capabilities of the Investment Adviser and its portfolio management teams; |
| (ii) | the groups within the Investment Adviser and its affiliates that support the portfolio management teams or provide other types of necessary services, including fund services groups (e.g., accounting and financial reporting, tax, shareholder services, and operations); controls and risk management groups (e.g., legal, compliance, valuation oversight, credit risk management, internal audit, compliance testing, market risk analysis, finance, and central funding); sales and distribution support groups, and others (e.g., information technology and training); |
| (iii) | trends in employee headcount; |
| (iv) | the Investment Adviser’s financial resources and ability to hire and retain talented personnel and strengthen its operations; and |
| (v) | the parent company’s support of the Investment Adviser and its mutual fund business, as expressed by the firm’s senior management; |
22
GOLDMAN SACHS VARIABLE INSURANCE TRUST STRATEGIC INTERNATIONAL EQUITY FUND
Statement Regarding Basis for Approval of Management Agreement (Unaudited) (continued)
| (b) | information on the investment performance of the Fund, including comparisons to the performance of similar mutual funds, as provided by a third-party mutual fund data provider engaged as part of the contract review process (the “Outside Data Provider”), and a benchmark performance index, and general investment outlooks in the markets in which the Fund invests; |
| (c) | information provided by the Investment Adviser indicating the Investment Adviser’s views on whether the Fund’s peer group and/or benchmark index had high, medium, or low relevance given the Fund’s particular investment strategy; |
| (d) | the terms of the Management Agreement and other agreements with affiliated service providers entered into by the Trust on behalf of the Fund; |
| (e) | fee and expense information for the Fund, including: |
| (i) | the relative management fee and expense level of the Fund as compared to those of comparable funds managed by other advisers, as provided by the Outside Data Provider; |
| (ii) | the Fund’s expense trends over time; and |
| (iii) | to the extent the Investment Adviser manages other types of accounts (such as bank collective trusts, private wealth management accounts, institutional separate accounts, sub-advised mutual funds, and non-U.S. funds) having investment objectives and policies similar to those of the Fund, comparative information on the advisory fees charged and services provided to those accounts by the Investment Adviser; |
| (f) | with respect to the extensive investment performance and expense comparison data provided by the Outside Data Provider, its processes in producing that data for the Fund; |
| (g) | the undertaking of the Investment Adviser to waive certain fees and to limit certain expenses of the Fund that exceed a specified level; |
| (h) | information relating to the profitability of the Management Agreement and the transfer agency and distribution and service arrangements of the Fund and the Trust as a whole to the Investment Adviser and its affiliates; |
| (i) | whether the Fund’s existing management fee schedule adequately addressed any economies of scale; |
| (j) | a summary of the “fall-out” benefits derived by the Investment Adviser and its affiliates from their relationships with the Fund, including the fees received by the Investment Adviser’s affiliates from the Fund for transfer agency, portfolio trading, distribution and other services; |
| (k) | a summary of potential benefits derived by the Fund as a result of its relationship with the Investment Adviser; |
| (l) | information regarding commissions paid by the Fund and broker oversight, an update on the Investment Adviser’s soft dollars practices, other information regarding portfolio trading, and how the Investment Adviser carries out its duty to seek best execution; |
23
GOLDMAN SACHS VARIABLE INSURANCE TRUST STRATEGIC INTERNATIONAL EQUITY FUND
Statement Regarding Basis for Approval of Management Agreement (Unaudited) (continued)
| (m) | the manner in which portfolio manager compensation is determined; and the number and types of accounts managed by the portfolio managers; |
| (n) | the nature and quality of the services provided to the Fund by its unaffiliated service providers, and the Investment Adviser’s general oversight and evaluation (including reports on due diligence) of those service providers as part of the administration services provided under the Management Agreement; and |
| (o) | the Investment Adviser’s processes and policies addressing various types of potential conflicts of interest; its approach to risk management; the annual review of the effectiveness of the Fund’s compliance program; and periodic compliance reports. |
The Trustees also received an overview of the Fund’s distribution arrangements. They received information regarding the Fund’s assets, share purchase and redemption activity, and payment of distribution and service fees by the Fund’s Service Shares. Information was also provided to the Trustees relating to revenue sharing payments made by and services provided by the Investment Adviser and its affiliates to intermediaries that promote the sale, distribution, and/or servicing of Fund shares. The Independent Trustees also discussed the broad range of other investment choices that are available to Fund investors, including the availability of comparable funds managed by other advisers.
The presentations made at the Board and Committee meetings and at the Annual Meeting encompassed the Fund and other mutual funds for which the Board of Trustees has responsibility. In evaluating the Management Agreement at the Annual Meeting, the Trustees relied upon their knowledge, resulting from their meetings and other interactions throughout the year, of the Investment Adviser and its affiliates, their services, and the Fund. In conjunction with these meetings, the Trustees received written materials and oral presentations on the topics covered, and the Investment Adviser addressed the questions and concerns of the Trustees, including concerns regarding the investment performance of certain of the funds they oversee. The Independent Trustees were advised by their independent legal counsel regarding their responsibilities and other regulatory requirements related to the approval and continuation of mutual fund investment management agreements under applicable law. In addition, the Investment Adviser and its affiliates provided the Independent Trustees with a written response to a formal request for information sent on behalf of the Independent Trustees by their independent legal counsel. During the course of their deliberations, the Independent Trustees met in executive sessions with their independent legal counsel, without representatives of the Investment Adviser or its affiliates present.
Nature, Extent, and Quality of the Services Provided Under the Management Agreement
As part of their review, the Trustees considered the nature, extent, and quality of the services provided to the Fund by the Investment Adviser. In this regard, the Trustees considered both the investment advisory services and non-advisory services that are
24
GOLDMAN SACHS VARIABLE INSURANCE TRUST STRATEGIC INTERNATIONAL EQUITY FUND
Statement Regarding Basis for Approval of Management Agreement (Unaudited) (continued)
provided by the Investment Adviser and its affiliates. The Trustees noted the transition in the leadership and changes in personnel of various of the Investment Adviser’s portfolio management teams that had occurred in recent periods, and the ongoing recruitment efforts aimed at bringing high quality investment talent to the Investment Adviser. They also noted the Investment Adviser’s commitment to maintaining high quality systems and expending substantial resources to respond to ongoing changes to the regulatory and control environment in which the Fund and its service providers operate, as well as the efforts of the Investment Adviser and its affiliates to combat cyber security risks. The Trustees concluded that the Investment Adviser continued to commit substantial financial and operational resources to the Fund and expressed confidence that the Investment Adviser would continue to do so in the future. The Trustees also recognized that the Investment Adviser had made significant commitments to address regulatory compliance requirements applicable to the Fund and the Investment Adviser and its affiliates.
Investment Performance
The Trustees also considered the investment performance of the Fund. In this regard, they compared the investment performance of the Fund to its peers using rankings and ratings compiled by the Outside Data Provider as of December 31, 2015, and updated performance information prepared by the Investment Adviser using the peer group identified by the Outside Data Provider as of March 31, 2016. The information on the Fund’s investment performance was provided for the one-, three-, five-, and ten-year periods ending on the applicable dates. The Trustees also reviewed the Fund’s investment performance relative to its performance benchmark. As part of this review, they considered the investment performance trends of the Fund over time, and reviewed the investment performance of the Fund in light of its investment objective and policies and market conditions.
In addition, the Trustees considered materials prepared and presentations made by the Investment Adviser’s senior management and portfolio management personnel in which Fund performance was assessed. The Trustees also considered the Investment Adviser’s periodic reports with respect to the Fund’s risk profile, and how the Investment Adviser’s approach to risk monitoring and management influences portfolio management.
The Trustees observed that the Fund’s Institutional Shares had placed in the second quartile of the Fund’s peer group for the one-, three-, and five-year periods, and in the third quartile for the ten-year period, and had outperformed the Fund’s benchmark index for the one-, three-, and five-year periods and underperformed for the ten-year period ended March 31, 2016.
Costs of Services Provided and Competitive Information
The Trustees considered the contractual terms of the Management Agreement and the fee rates payable by the Fund thereunder. In this regard, the Trustees considered information on the services rendered by the Investment Adviser to the Fund, which included both advisory and administrative services that were directed to the needs and operations of the Fund as a registered mutual fund.
25
GOLDMAN SACHS VARIABLE INSURANCE TRUST STRATEGIC INTERNATIONAL EQUITY FUND
Statement Regarding Basis for Approval of Management Agreement (Unaudited) (continued)
In particular, the Trustees reviewed analyses prepared by the Outside Data Provider regarding the expense rankings of the Fund. The analyses provided a comparison of the Fund’s management fee and breakpoints to those of a relevant peer group and category universe; an expense analysis which compared the Fund’s overall net and gross expenses to a peer group and a category universe; and a five-year history comparing the Fund’s net expenses to the peer and category medians. The analyses also compared the Fund’s transfer agency, custody, and distribution fees, other expenses and fee waivers/reimbursements to those of the peer group and category medians. The Trustees concluded that the comparisons provided by the Outside Data Provider were useful in evaluating the reasonableness of the management fees and total expenses paid by the Fund.
In addition, the Trustees considered the Investment Adviser’s undertaking to waive a portion of its management fee and to limit certain expenses of the Fund that exceed a specified level. They also considered, to the extent that the Investment Adviser manages other types of accounts having investment objectives and policies similar to those of the Fund, comparative fee information for services provided by the Investment Adviser to those accounts, and information that indicated that services provided to the Fund differed in various significant respects from the services provided to other types of accounts which, in many cases, operated under less stringent legal and regulatory structures, required fewer services from the Investment Adviser to a smaller number of client contact points, and were less time-intensive.
In addition, the Trustees noted that shareholders are able to redeem their Fund shares at any time if shareholders believe that the Fund fees and expenses are too high or if they are dissatisfied with the performance of the Fund.
Profitability
The Trustees reviewed the Investment Adviser’s revenues and pre-tax profit margins with respect to the Trust and the Fund. In this regard the Trustees noted that they had received, among other things, profitability analyses and summaries, revenue and expense schedules by Fund and by function (i.e., investment management, transfer agency and distribution and service), and information on the Investment Adviser’s expense allocation methodology. They observed that the profitability and expense figures are substantially similar to those used by the Investment Adviser for many internal purposes, including compensation decisions among various business groups, and are thus subject to a vigorous internal debate about how certain revenue and expenses should be allocated. The Trustees also noted that the internal audit group within the Goldman Sachs organization had audited the expense allocation methodology and was satisfied with the reasonableness, consistency, and accuracy of the Investment Adviser’s expense allocation methodology and profitability analysis calculations. Profitability data for the Trust the Fund were provided for 2015 and 2014, and the Trustees considered this information in relation to the Investment Adviser’s overall profitability. The Trustees considered the Investment Adviser’s revenues and pre-tax profit margins both in absolute terms and in comparison to information on the reported pre-tax profit margins earned by certain other asset management firms.
26
GOLDMAN SACHS VARIABLE INSURANCE TRUST STRATEGIC INTERNATIONAL EQUITY FUND
Statement Regarding Basis for Approval of Management Agreement (Unaudited) (continued)
Economies of Scale
The Trustees considered the information that had been provided regarding the Investment Adviser’s profitability. The Trustees also considered the breakpoints in the fee rate payable under the Management Agreement for the Fund at the following annual percentage rates of the average daily net assets of the Fund:
| First $1 billion | 0.85 | % | ||
| Next $1 billion | 0.77 | |||
| Next $3 billion | 0.73 | |||
| Next $3 billion | 0.72 | |||
| Over $8 billion | 0.71 |
The Trustees noted that the breakpoints were designed to share potential economies of scale, if any, with the Fund and its shareholders as assets under management reach those asset levels. The Trustees considered the amounts of assets in the Fund; the Fund’s recent share purchase and redemption activity; the information provided by the Investment Adviser relating to the costs of the services provided by the Investment Adviser and its affiliates and their realized profits; information comparing fee rates charged by the Investment Adviser with fee rates charged to other funds in the peer group; and the Investment Adviser’s undertaking to waive a portion of its management fee and to limit certain expenses of the Fund that exceed a specified level. Upon reviewing these matters at the Annual Meeting, the Trustees concluded that the fee breakpoints represented a means of assuring that benefits of scalability, if any, would be passed along to shareholders at the specified asset levels.
Other Benefits to the Investment Adviser and Its Affiliates
The Trustees also considered the other benefits derived by the Investment Adviser and its affiliates from their relationships with the Fund as stated above, including: (a) transfer agency fees received by Goldman, Sachs & Co. (“Goldman Sachs”); (b) brokerage and futures commissions earned by Goldman Sachs for executing securities and futures transactions on behalf of the Fund; (c) research received by the Investment Adviser from broker-dealers in exchange for executing certain transactions on behalf of the Fund; (d) trading efficiencies resulting from aggregation of orders of the Fund with those for other funds or accounts managed by the Investment Adviser; (e) the Investment Adviser’s ability to leverage the infrastructure designed to service the Fund on behalf of its other clients; (f) the Investment Adviser’s ability to cross-market other products and services to Fund shareholders; (g) Goldman Sachs’ retention of certain fees as Fund Distributor; (h) the Investment Adviser’s ability to negotiate better pricing with custodians on behalf of its other clients, as a result of the relationship with the Fund; and (i) the possibility that the working relationship between the Investment Adviser and the Fund’s third-party service providers may cause those service providers to be
27
GOLDMAN SACHS VARIABLE INSURANCE TRUST STRATEGIC INTERNATIONAL EQUITY FUND
Statement Regarding Basis for Approval of Management Agreement (Unaudited) (continued)
more likely to do business with other areas of Goldman Sachs. In the course of considering the foregoing, the Independent Trustees requested and received further information quantifying certain of these fall-out benefits.
Other Benefits to the Fund and Its Shareholders
The Trustees also noted that the Fund receives certain potential benefits as a result of its relationship with the Investment Adviser, including: (a) trading efficiencies resulting from aggregation of orders of the Fund with those of other funds or accounts managed by the Investment Adviser; (b) enhanced servicing from vendors because of the volume of business generated by the Investment Adviser and its affiliates; (c) enhanced servicing from broker-dealers because of the volume of business generated by the Investment Adviser and its affiliates; (d) the Investment Adviser’s ability to negotiate favorable terms with derivatives counterparties on behalf of the Fund as a result of the size and reputation of the Goldman Sachs organization; (e) the Investment Adviser’s knowledge and experience gained from managing other accounts and products; (f) the Investment Adviser’s ability to hire and retain qualified personnel to provide services to the Fund because of the reputation of the Goldman Sachs organization; (g) the Fund’s access, through the Investment Adviser, to certain firmwide resources (e.g., proprietary risk management systems and databases), subject to certain restrictions; and (h) the Fund’s access to certain affiliated distribution channels. In addition, the Trustees noted the competitive nature of the mutual fund marketplace, and considered that many of the Fund’s shareholders invested in the Fund in part because of the Fund’s relationship with the Investment Adviser and that those shareholders have a general expectation that the relationship will continue.
Conclusion
In connection with their consideration of the Management Agreement, the Trustees gave weight to each of the factors described above, but did not identify any particular factor as controlling their decision. After deliberation and consideration of all of the information provided, including the factors described above, the Trustees concluded, in the exercise of their business judgment, that the management fees paid by the Fund were reasonable in light of the services provided to it by the Investment Adviser, the Investment Adviser’s costs and the Fund’s current and reasonably foreseeable asset levels. The Trustees unanimously concluded that the Investment Adviser’s continued management likely would benefit the Fund and its shareholders and that the Management Agreement should be approved and continued with respect to the Fund until June 30, 2017.
28
| TRUSTEES | OFFICERS | |
| Ashok N. Bakhru, Chairman | James A. McNamara, President | |
| Kathryn A. Cassidy | Scott M. McHugh, Principal Financial Officer, | |
| Diana M. Daniels | Senior Vice President and Treasurer | |
| Herbert J. Markley | Caroline L. Kraus, Secretary | |
| James A. McNamara | ||
| Jessica Palmer | ||
| Alan A. Shuch | ||
| Roy W. Templin | ||
| Gregory G. Weaver |
GOLDMAN, SACHS & CO.
Distributor and Transfer Agent
GOLDMAN SACHS ASSET MANAGEMENT, L.P.
Investment Adviser
200 West Street, New York, New York 10282
GOLDMAN SACHS ASSET MANAGEMENT INTERNATIONAL
Investment Adviser
Christchurch Court, 10-15 Newgate Street London, EC1A 7HD, England, United Kingdom
Visit our web site at www.GSAMFUNDS.com to obtain the most recent month-end returns.
The reports concerning the Fund included in this shareholder report may contain certain forward-looking statements about the factors that may affect the performance of the Fund in the future. These statements are based on Fund management’s predictions and expectations concerning certain future events and their expected impact on the Fund, such as performance of the economy as a whole and of specific industry sectors, changes in the levels of interest rates, the impact of developing world events, and other factors that may influence the future performance of the Fund. Management believes these forward-looking statements to be reasonable, although they are inherently uncertain and difficult to predict. Actual events may cause adjustments in portfolio management strategies from those currently expected to be employed.
A description of the policies and procedures that the Fund uses to determine how to vote proxies relating to portfolio securities and information regarding how the Fund voted proxies relating to portfolio securities during the most recent 12-month period ended June 30 is available (i) without charge, upon request by calling 1-800-621-2550; and (ii) on the Securities and Exchange Commission (“SEC”) web site at http://www.sec.gov.
The Fund files its complete schedule of portfolio holdings with the SEC for the first and third quarters of each fiscal year on Form N-Q. The Fund’s Form N-Qs are available on the SEC’s web site at http://www.sec.gov within 60 days after the Fund’s first and third fiscal quarters. The Fund’s Form N-Qs may be reviewed and copied at the SEC’s Public Reference Room in Washington, D.C. and information on the operation of the Public Reference Room may also be obtained by calling 1-800-SEC-0330. Form N-Qs may be obtained upon request and without charge by calling 1-800-621-2550.
The website links provided are for your convenience only and are not an endorsement or recommendation by GSAM of any of these websites or the products or services offered. GSAM is not responsible for the accuracy and validity of the content of these websites.
Economic and market forecasts presented herein reflect our judgment as of the date of this presentation and are subject to change without notice. These forecasts do not take into account the specific investment objectives, restrictions, tax and financial situation or other needs of any specific client. Actual data will vary and may not be reflected here. These forecasts are subject to high levels of uncertainty that may affect actual performance. Accordingly, these forecasts should be viewed as merely representative of a broad range of possible outcomes. These forecasts are estimated, based on assumptions, and are subject to significant revision and may change materially as economic and market conditions change. Goldman Sachs has no obligation to provide updates or changes to these forecasts. Case studies and examples are for illustrative purposes only.
Fund holdings and allocations shown are as of June 30, 2016 and may not be representative of future investments. Fund holdings should not be relied on in making investment decisions and should not be construed as research or investment advice regarding particular securities. Current and future holdings are subject to risk.
References to indices, benchmarks or other measures of relative market performance over a specified period of time are provided for your information only and do not imply that the portfolio will achieve similar results. The index composition may not reflect the manner in which a portfolio is constructed. While an adviser seeks to design a portfolio which reflects appropriate risk and return features, portfolio characteristics may deviate from those of the benchmark.
The Global Industry Classification Standard (“GICS”) was developed by and is the exclusive property and a service mark of Morgan Stanley Capital International Inc. (“MSCI”) and Standard & Poor’s, a division of The McGraw-Hill Companies, Inc. (“S&P”) and is licensed for use by Goldman Sachs. Neither MSCI, S&P nor any other party involved in making or compiling the GICS or any GICS classifications makes any express or implied warranties or representations with respect to such standard or classification (or the results to be obtained by the use thereof), and all such parties hereby expressly disclaim all warranties of originality, accuracy, completeness, merchantability or fitness for a particular purpose with respect to any of such standard or classification. Without limiting any of the foregoing, in no event shall MSCI, S&P, any of their affiliates or any third party involved in making or compiling the GICS or any GICS classifications have any liability for any direct, indirect, special, punitive, consequential or any other damages (including lost profits) even if notified of the possibility of such damages.
The portfolio risk management process includes an effort to monitor and manage risk, but does not imply low risk.
Shares of the Goldman Sachs VIT Funds are offered to separate accounts of participating life insurance companies for the purpose of funding variable annuity contracts and variable life insurance policies. Shares of the Fund are not offered directly to the general public. The variable annuity contracts and variable life insurance policies are described in the separate prospectuses issued by participating insurance companies. You should refer to those prospectuses for information about surrender charges, mortality and expense risk fees and other charges that may be assessed by participating insurance companies under the variable annuity contracts or variable life insurance policies. Such fees or charges, if any, may affect the return you may realize with respect to your investments. Ask your representative for more complete information. Please consider a fund’s objectives, risks and charges and expenses, and read the prospectus carefully before investing. The prospectus contains this and other information about the Fund.
This material is not authorized for distribution to prospective investors unless preceded or accompanied by a current Prospectus or summary prospectus, if applicable. Investors should consider a Fund’s objective, risks, and charges and expenses, and read the summary prospectus, if available, and/or the Prospectus carefully before investing or sending money. The summary prospectus, if available, and the Prospectus contain this and other information about a Fund and may be obtained from your Authorized Institution or from Goldman, Sachs & Co. by calling 1-800-621-2550.
This report is prepared for the general information of contract owners and is not an offer of shares of the Goldman Sachs Variable Insurance Trust: Goldman Sachs Strategic International Equity Fund.
Goldman, Sachs & Co. is the distributor of the Goldman Sachs Funds and the Goldman Sachs Variable Insurance Trust Funds.
© 2016 Goldman Sachs. All rights reserved.
VITINTLSAR-16/58894-TMPL-08/2016/12.2K
Goldman
Sachs Variable Insurance Trust
Goldman Sachs
U.S. Equity Insights Fund
Semi-Annual Report
June 30, 2016

GOLDMAN SACHS VARIABLE INSURANCE TRUST U.S. EQUITY INSIGHTS FUND
INVESTMENT OBJECTIVE
The Fund seeks long-term growth of capital and dividend income.
Portfolio Management Discussion and Analysis
Below, the Goldman Sachs Quantitative Investment Strategies Team discusses the Goldman Sachs Variable Insurance Trust — Goldman Sachs U.S. Equity Insights Fund’s (the “Fund”) performance and positioning for the six-month period ended June 30, 2016 (the “Reporting Period”).
How did the Fund perform during the Reporting Period?
During the Reporting Period, the Fund’s Institutional and Service Shares generated cumulative total returns of 1.74% and 1.61%, respectively. These returns compare to the 3.84% cumulative total return of the Fund’s benchmark, the Standard & Poor’s 500® Index (with dividends reinvested) (the “S&P 500® Index”) during the same time period.
What economic and market factors most influenced the equity markets as a whole during the Reporting Period?
Representing the U.S. equity market, the S&P 500® Index gained 3.84% during the Reporting Period.
As the Reporting Period began in January 2016, U.S. equities were embroiled in a global rout, triggered by investor concerns about an intensifying economic slowdown in China and exacerbated by an oil price plunge. Following a December 2015 interest rate hike, the January 2016 Federal Reserve (“Fed”) statement acknowledged these external risks and tightening financial conditions. U.S. equities stabilized in February 2016, as market sentiment improved on the more dovish tone set by global central banks. (Dovish language tends to suggest lower interest rates.) U.S. equities were also supported by stronger economic data, rallying as fourth quarter U.S. Gross Domestic Product (“GDP”) came in above consensus expectations. In March 2016, the Fed kept interest rates on hold and surprised on the dovish side, reducing its forecast to two interest rate hikes in 2016, down from four. Along with receding global economic concerns, we believe this helped to drive a recovery in U.S. equities. Released in March 2016, February 2016 unemployment data came in ahead of market consensus, with unemployment steady at 4.9% in spite of higher participation rates and declining underemployment.
Following the rebound in March 2016, market sentiment appeared to remain sanguine in April 2016, as oil prices rose and China’s economic growth concerns abated. U.S. equities fell near the end of the month as investors were disappointed by a lack of additional stimulus from the Bank of Japan and by a weaker than consensus expected first quarter U.S. GDP rate of 0.5%. Hawkish Fed minutes released in May 2016 temporarily revived market expectations for a Fed interest rate hike in June 2016, but weaker than expected May 2016 payroll data subsequently drove such expectations lower. (Hawkish language tends to suggest higher interest rates; opposite of dovish.) The Fed ultimately held interest rates steady in June 2016 and signaled a slower pace of hikes, acknowledging the slowdown in the labor market. Markets were otherwise dominated in June 2016 by the U.K. referendum on membership in the European Union, popularly known as Brexit. U.S. equities sold off in the global risk-off, or heightened risk averse, sentiment in June 2016 following the surprise “leave” result. Markets rebounded in the latter days of the month owing to improving risk sentiment as markets digested the Brexit vote outcome and on dovish remarks from Bank of England Governor Carney.
For the Reporting Period overall, telecommunication services and utilities were the best performing sectors in the S&P 500 Index by a wide margin. Energy and consumer staples also posted double-digit gains. The energy sector was the largest positive contributor to S&P 500 Index returns, as measured by weight times performance. The weakest performing sectors in the S&P 500 Index during the Reporting Period were financials and information technology, the only two to post negative absolute returns, followed by consumer discretionary and health care, which were also weak but generated modestly positive returns during the Reporting Period.
Within the U.S. equity market, there was significant disparity in performance not only among sectors but also among the various capitalization and style segments. While all capitalization segments posted positive returns, mid-cap stocks, as measured by the Russell Midcap® Index, performed best, followed by large-cap stocks, as measured by the Russell 1000® Index, and then, small-cap stocks, as measured by the Russell 2000® Index. From a style perspective, value-oriented stocks significantly outpaced growth-oriented stocks across the capitalization spectrum. Value outperformed relative to growth during the Reporting Period primarily due to weaker performance of the growth-oriented health care sector. (All as measured by the Russell Investments indices.)
1
GOLDMAN SACHS VARIABLE INSURANCE TRUST U.S. EQUITY INSIGHTS FUND
What key factors were responsible for the Fund’s performance during the Reporting Period?
During the Reporting Period, the Fund underperformed the S&P 500® Index largely due to stock selection driven by our quantitative model and two of our quantitative model’s six investment themes. Four of our quantitative model’s six investment themes contributed positively to the Fund’s relative returns.
What impact did the Fund’s investment themes have on performance during the Reporting Period?
As expected, and in keeping with our investment approach, our quantitative model and its six investment themes — Valuation, Profitability, Quality, Management, Momentum and Sentiment — had the greatest impact on relative performance. We use these themes to take a long-term view of market patterns and look for inefficiencies, selecting stocks for the Fund and overweighting or underweighting the ones chosen by the model. Over time and by design, the performance of any one of the model’s investment themes tends to have a low correlation with the model’s other themes, demonstrating the diversification benefit of the Fund’s theme-driven quantitative model. The variance in performance supports our research indicating that the diversification provided by the Fund’s different investment themes is a significant investment advantage over the long term, even though the Fund may experience underperformance in the short term. Of course, diversification does not protect an investor from market risk nor does it ensure a profit.
During the Reporting Period, two of our six investment themes — Momentum and Management — detracted from relative returns. The Momentum theme seeks to predict drifts in stock prices caused by delayed investor reaction to company-specific information and information about related companies. The Management theme assesses the characteristics, policies and strategic decisions of company managements.
The other four investment themes added to the Fund’s relative returns. The Sentiment theme contributed most positively to the Fund’s relative performance during the Reporting Period, followed by Quality. The Profitability and Valuation themes also contributed positively, albeit to a lesser extent. The Sentiment theme reflects selected investment views and decisions of individuals and financial intermediaries. The Quality theme assesses both firm and financial quality. The Profitability theme assesses whether a company is earning more than its cost of capital. The Valuation theme attempts to capture potential mispricings of securities, typically by comparing a measure of the company’s intrinsic value to its market value.
How did the Fund’s sector and industry allocations affect relative performance?
In constructing the Fund’s portfolio, we focus on picking stocks rather than making industry or sector bets. Consequently, the Fund is similar to its benchmark, the S&P 500® Index, in terms of its industry and sector allocation and style. We manage the Fund’s industry and sector exposure by including industry factors in our risk model and by explicitly penalizing industry and sector deviations from the benchmark index in optimization. Sector weights or changes in sector weights generally do not have a meaningful impact on relative performance.
Did stock selection help or hurt Fund performance during the Reporting Period?
We seek to outpace the S&P 500® Index by overweighting stocks that we expect to outperform and underweighting those that we think may lag. We also build positions based on our thematic views. For example, the Fund aims to hold a basket of stocks with more favorable Momentum characteristics than the benchmark index. During the Reporting Period, stock selection overall detracted from the Fund’s relative performance.
Stock selection in the energy, financials and health care sectors detracted most from the Fund’s results relative to the S&P 500® Index. Partially offsetting these detractors was effective stock selection in the industrials, consumer discretionary and consumer staples sectors, which contributed positively to the Fund’s results relative to its benchmark index during the Reporting Period.
Which individual positions detracted from the Fund’s results during the Reporting Period?
Detracting most from the Fund’s results relative to its benchmark index were overweight positions in petroleum refiner Marathon Petroleum and insurance and financial services provider Lincoln National and an underweight position in telecommunications giant AT&T. We chose to overweight Marathon Petroleum and Lincoln National due to our positive views on Sentiment and Value. The Fund had an underweight position in AT&T given our negative view on Quality.
Which individual stock positions contributed the most to the Fund’s relative returns during the Reporting Period?
The Fund benefited most from overweight positions in packaged food producer Tyson Foods and oil and natural gas exploration and production company Newfield Exploration and an underweight position in specialty pharmaceuticals manufacturer Allergan.
2
GOLDMAN SACHS VARIABLE INSURANCE TRUST U.S. EQUITY INSIGHTS FUND
We chose to overweight Tyson Foods due to our positive views on Quality and Value. The Fund was overweight Newfield Exploration given our positive views on Quality and Sentiment. The underweight in Allergan was established because of our negative view on Quality.
How did the Fund use derivatives during the Reporting Period?
During the Reporting Period, we did not use derivatives as part of an active management strategy to add value to the Fund’s results. However, we used equity index futures contracts, on an opportunistic basis, to equitize the Fund’s excess cash holdings. In other words, we put the Fund’s excess cash holdings to work by using them as collateral for the purchase of stock futures. The use of these futures contracts did not have a material impact on the Fund’s performance during the Reporting Period.
Did you make any enhancements to your quantitative models during the Reporting Period?
We continuously look for ways to improve our investment process. We made no significant changes to our quantitative models during the first quarter of 2016. In the second quarter of 2016, we made a number of enhancements across a variety of investment themes.
We enhanced the Profitability theme for stocks within developed markets by introducing a factor that evaluates the geographic exposure of companies by tracking the physical locations of their branches, outlets and subsidiaries. We believe that a company with a footprint in growing parts of the world is better positioned relative to a company with a footprint in contracting parts. We are able to estimate this factor for more than 5,500 companies globally, which have more than one million subsidiaries spread across more than 47,000 cities in more than 200 countries. This extends our analysis of a company’s global footprint, which has focused historically on their revenue mix across markets.
In the U.S. investment region, we enhanced the Momentum theme by introducing a signal that evaluates linkages embedded within companies’ web pages. Embedded linkages are effective indicators of the similarity of the underlying businesses of companies across a variety of sectors, such as retail, media, hospitality, software, banks, airlines, etc.
We have undertaken research of various Environment, Social and Governance (“ESG”) metrics and their ability to forecast returns. We have enhanced our models with the following ESG related metrics:
| n | Within the Quality theme in the U.S. and Europe investment regions, we have introduced an environmental impact factor. The factor measures the amount of environmental resources consumed to produce a unit of output for more than 2,000 companies. This factor helps to strategically tilt towards companies with a favorable environmental profile. |
| n | Within the Momentum theme in the U.S. investment region, we have introduced the ESG topic signal. We use natural language processing techniques to read through more than 24,000 articles, collected since 1999, on Corporate Social Responsibility (“CSR”) activities to identify economic linkages among more than 1,000 companies. The signal aims to identify companies linked to each other by such common CSR themes and can dynamically adjust our positions accordingly. |
What was the Fund’s sector positioning relative to its benchmark index at the end of the Reporting Period?
As of June 30, 2016, the Fund was overweight the health care, materials and utilities sectors relative to the S&P 500® Index. The Fund was underweight industrials, financials and information technology and was rather neutrally weighted in energy, consumer staples, telecommunication services and consumer discretionary compared to the benchmark index on the same date.
Were there any changes to the Fund’s portfolio management team during the Reporting Period?
On February 5, 2016, Ron Hua, Chief Investment Officer of Equity Alpha Strategies for the Quantitative Investment Strategies (“QIS”) Team, announced his intention to retire from Goldman Sachs Asset Management, L.P. (“GSAM”). As such, effective that date, Mr. Hua no longer had portfolio management responsibility for the Fund.
Ron’s responsibilities were assumed by Armen Avanessians, Managing Director and Chief Investment Officer of GSAM’s QIS Team. The senior portfolio management team for the Fund remained Osman Ali, Len Ioffe and Dennis Walsh, each a Managing Director. Dennis Walsh continues to head research and portfolio management for the Fund. Len Ioffe continues to head portfolio implementation, and Osman Ali continues to head client strategy. Armen Avanessians continues to oversee all QIS strategies globally. Gary Chropuvka, Managing Director, continues to head QIS client strategy efforts globally.
As always, the QIS platform is organized into a series of specialist portfolio management teams that focus on generating and implementing investment ideas within their area of expertise. Investment decisions are made by these portfolio management teams,
3
GOLDMAN SACHS VARIABLE INSURANCE TRUST U.S. EQUITY INSIGHTS FUND
rather than by one portfolio manager or committee. Ultimate accountability for the Fund resides with the senior portfolio managers dedicated to each Team strategy, who oversee their respective research, portfolio management and implementation processes.
In all, during the Reporting Period, one Vice President joined the Equity Alpha team and one Managing Director and five Vice Presidents left the Equity Alpha team. QIS employs a globally integrated team of more than 90 professionals, with an additional 90-plus professionals dedicated to trading, information technology and development of analytical tools.
What is your strategy going forward for the Fund?
Looking ahead, we continue to believe that less expensive stocks should outpace more expensive stocks, and stocks with good momentum are likely to outperform those with poor momentum. We intend to maintain our focus on seeking companies about which fundamental research analysts are becoming more positive as well as profitable companies with sustainable earnings and a track record of using their capital to enhance shareholder value. As such, we anticipate remaining fully invested with long-term performance likely to be the result of stock selection rather than sector or capitalization allocations.
We stand behind our investment philosophy that sound economic investment principles, coupled with a disciplined quantitative approach, can provide strong, uncorrelated returns over the long term. Our research agenda is robust, and we continue to enhance our existing models, add new proprietary forecasting signals and improve our trading execution as we seek to provide the most value to our shareholders.
4
GOLDMAN SACHS VARIABLE INSURANCE TRUST U.S. EQUITY INSIGHTS FUND
Index Definitions
The S&P 500® Index (with dividends reinvested) is the Standard & Poor’s 500 Composite Index of 500 stocks, an unmanaged index of common stock prices. The figures for the Index do not include any deduction for fees, expenses or taxes. It is not possible to invest directly in an index.
The Russell 2000® Index (with dividends reinvested) is an unmanaged index of common stock prices that measures the performance of the 2000 smallest companies in the Russell 3000® Index. The figures for the Index do not include any deduction for fees, expenses or taxes. It is not possible to invest directly in an index.
The Russell Midcap® Index measures the performance of the 800 smallest companies in the Russell 1000® Index, which represent approximately 25% of the total market capitalization of the Russell 1000 Index. It is not possible to invest directly in an index.
The Russell 1000® Index measures the performance of the 1,000 largest companies in the Russell 3000® Index, which represents approximately 92% of the total market capitalization of the Russell 3000 Index. It is not possible to invest directly in an index.
5
FUND BASICS
U.S. Equity Insights Fund
as of June 30, 2016
STANDARDIZED TOTAL RETURNS1
| For the period ended 6/30/16 | One Year | Five Years | Ten Years | Since Inception | Inception Date | |||||||||||||
| Institutional | 1.48 | % | 12.31 | % | 6.13 | % | 5.33 | % | 02/13/98 | |||||||||
| Service | 1.25 | 12.08 | 5.93 | 5.54 | 01/09/06 | |||||||||||||
| 1 | The Standardized Total Returns are average annual total returns as of the most recent calendar quarter-end. They assume reinvestment of all distributions at net asset value (“NAV”). Because Institutional and Service Shares do not involve a sales charge, such a charge is not applied to their Standardized Total Returns. |
Total return figures in the above chart represent past performance and do not indicate future results, which will vary. The investment return and principal value of an investment will fluctuate and, therefore, an investor’s shares, when redeemed, may be worth more or less than their original cost. Current performance may be lower or higher than the total return figures in the above chart. Please visit www.GSAMFUNDS.com to obtain the most recent month-end returns. Performance reflects fee waivers and/or expense limitations in effect during the periods shown. In their absence, performance would be reduced.
EXPENSE RATIOS2
| Net Expense Ratio (Current) | Gross Expense Ratio (Before Waivers) | |||||||
| Institutional | 0.64 | % | 0.71 | % | ||||
| Service | 0.85 | 0.96 | ||||||
| 2 | The expense ratios of the Fund, both current (net of any fee waivers or expense limitations) and before waivers (gross of any fee waivers or expense limitations) are as set forth above according to the most recent publicly available Prospectuses for the Fund and may differ from the expense ratios disclosed in the Financial Highlights in this report. Pursuant to a contractual arrangement, the Fund’s waivers and/or expense limitations will remain in place through at least April 29, 2017 and prior to such date the Investment Adviser may not terminate the arrangements without the approval of the Fund’s Board of Trustees. If these arrangements are discontinued in the future, the expense ratios may change without shareholder approval. |
TOP TEN HOLDINGS AS OF 6/30/163
| Holding | % of Net Assets | Line of Business | ||||
Johnson & Johnson | 2.5% | Pharmaceuticals, Biotechnology & Life Sciences | ||||
Apple, Inc. | 2.2 | Technology Hardware & Equipment | ||||
The Home Depot, Inc. | 1.9 | Retailing | ||||
PepsiCo, Inc. | 1.9 | Food, Beverage & Tobacco | ||||
Altria Group, Inc. | 1.7 | Food, Beverage & Tobacco | ||||
Oracle Corp. | 1.7 | Software & Services | ||||
Pfizer, Inc. | 1.7 | Pharmaceuticals, Biotechnology & Life Sciences | ||||
Amgen, Inc. | 1.6 | Pharmaceuticals, Biotechnology & Life Sciences | ||||
CVS Health Corp. | 1.6 | Food & Staples Retailing | ||||
Merck & Co., Inc. | 1.5 | Pharmaceuticals, Biotechnology & Life Sciences | ||||
| 3 | The top 10 holdings may not be representative of the Fund’s future investments. |
6
FUND BASICS
FUND vs. BENCHMARK SECTOR ALLOCATIONS4
As of June 30, 2016

| 4 | The Fund is actively managed and, as such, its composition may differ over time. Consequently, the Fund’s overall sector allocations may differ from percentages contained in the graph above. The graph categorizes investments using Global Industry Classification Standard (“GICS”), however, the sector classifications used by the portfolio management team may differ from GICS. The percentage shown for each investment category reflects the value of investments in that category as a percentage of total market value (excluding investments in the securities lending reinvestment vehicle, if any). Underlying sector allocations of Exchange Traded Funds and Investment Companies held by the Fund are not reflected in the graph above. The graph depicts the Fund’s investments but may not represent the Fund’s market exposure due to the exclusion of certain derivatives, if any, as listed in the Additional Investment Information section of the Schedule of Investments. |
7
GOLDMAN SACHS VARIABLE INSURANCE TRUST U.S. EQUITY INSIGHTS FUND
Schedule of Investments
June 30, 2016 (Unaudited)
| Shares | Description | Value | ||||||
| Common Stocks – 97.7% | ||||||||
| Automobiles & Components – 0.5% |
| ||||||
| 13,380 | Ford Motor Co. | $ | 168,187 | |||||
| 18,006 | Lear Corp. | 1,832,290 | ||||||
|
| |||||||
| 2,000,477 | ||||||||
|
| |||||||
| Banks – 3.2% |
| ||||||
| 197,225 | Bank of America Corp.(a) | 2,617,176 | ||||||
| 38,792 | Citizens Financial Group, Inc. | 775,064 | ||||||
| 6,748 | East West Bancorp, Inc. | 230,647 | ||||||
| 27,138 | JPMorgan Chase & Co. | 1,686,355 | ||||||
| 194,572 | Regions Financial Corp. | 1,655,808 | ||||||
| 57,290 | SunTrust Banks, Inc. | 2,353,473 | ||||||
| 12,926 | The PNC Financial Services Group, Inc. | 1,052,047 | ||||||
| 19,527 | Wells Fargo & Co. | 924,213 | ||||||
| 21,452 | Western Alliance Bancorp* | 700,408 | ||||||
|
| |||||||
| 11,995,191 | ||||||||
|
| |||||||
| Capital Goods – 4.1% |
| ||||||
| 41,880 | Allison Transmission Holdings, Inc. | 1,182,273 | ||||||
| 14,659 | AMETEK, Inc. | 677,686 | ||||||
| 14,056 | BWX Technologies, Inc. | 502,783 | ||||||
| 20,006 | Eaton Corp. PLC | 1,194,958 | ||||||
| 68,378 | General Electric Co. | 2,152,540 | ||||||
| 29,089 | HD Supply Holdings, Inc.* | 1,012,879 | ||||||
| 11,290 | Ingersoll-Rand PLC | 718,947 | ||||||
| 8,150 | Northrop Grumman Corp. | 1,811,582 | ||||||
| 5,567 | Owens Corning | 286,812 | ||||||
| 41,711 | Quanta Services, Inc.* | 964,358 | ||||||
| 1,923 | Raytheon Co. | 261,432 | ||||||
| 31,234 | United Rentals, Inc.* | 2,095,801 | ||||||
| 17,238 | Watsco, Inc. | 2,425,214 | ||||||
|
| |||||||
| 15,287,265 | ||||||||
|
| |||||||
| Commercial & Professional Services – 0.1% |
| ||||||
| 4,731 | ManpowerGroup, Inc. | 304,393 | ||||||
|
| |||||||
| Consumer Durables & Apparel – 0.3% |
| ||||||
| 29,016 | D.R. Horton, Inc. | 913,423 | ||||||
| 2,514 | NIKE, Inc. Class B | 138,773 | ||||||
|
| |||||||
| 1,052,196 | ||||||||
|
| |||||||
| Consumer Services – 0.8% |
| ||||||
| 24,939 | McDonald’s Corp. | 3,001,159 | ||||||
|
| |||||||
| Diversified Financials – 4.4% |
| ||||||
| 67,884 | Ally Financial, Inc.* | 1,158,780 | ||||||
| 28,915 | Ameriprise Financial, Inc. | 2,598,013 | ||||||
| 12,626 | Berkshire Hathaway, Inc. Class B* | 1,828,118 | ||||||
| 26,945 | Capital One Financial Corp. | 1,711,277 | ||||||
| 79,993 | E*TRADE Financial Corp.* | 1,879,035 | ||||||
| 1,551 | Intercontinental Exchange, Inc. | 396,994 | ||||||
| 6,616 | Morgan Stanley | 171,884 | ||||||
| 30,280 | SEI Investments Co. | 1,456,771 | ||||||
| 76,953 | Synchrony Financial* | 1,945,372 | ||||||
|
| |||||||
| Common Stocks – (continued) | ||||||||
| Diversified Financials – (continued) |
| ||||||
| 68,056 | The Bank of New York Mellon Corp. | $ | 2,643,975 | |||||
| 17,709 | Voya Financial, Inc. | 438,475 | ||||||
|
| |||||||
| 16,228,694 | ||||||||
|
| |||||||
| Energy – 7.2% |
| ||||||
| 57,003 | Anadarko Petroleum Corp. | 3,035,410 | ||||||
| 3,071 | Chevron Corp. | 321,933 | ||||||
| 2,712 | Cimarex Energy Co. | 323,596 | ||||||
| 2,287 | Concho Resources, Inc.* | 272,770 | ||||||
| 7,254 | Devon Energy Corp. | 262,957 | ||||||
| 12,175 | Energen Corp. | 586,957 | ||||||
| 6,714 | EOG Resources, Inc. | 560,082 | ||||||
| 45,416 | Exxon Mobil Corp. | 4,257,296 | ||||||
| 69,970 | FMC Technologies, Inc.* | 1,866,100 | ||||||
| 43,142 | Kinder Morgan, Inc. | 807,618 | ||||||
| 59,372 | Newfield Exploration Co.* | 2,623,055 | ||||||
| 35,992 | Noble Energy, Inc. | 1,291,033 | ||||||
| 43,602 | Occidental Petroleum Corp. | 3,294,567 | ||||||
| 9,546 | Oceaneering International, Inc. | 285,044 | ||||||
| 25,764 | Pioneer Natural Resources Co. | 3,895,774 | ||||||
| 34,877 | Schlumberger Ltd. | 2,758,073 | ||||||
| 15,636 | The Williams Companies, Inc. | 338,207 | ||||||
| 4,114 | World Fuel Services Corp. | 195,374 | ||||||
|
| |||||||
| 26,975,846 | ||||||||
|
| |||||||
| Food & Staples Retailing – 3.5% |
| ||||||
| 62,030 | CVS Health Corp. | 5,938,752 | ||||||
| 38,545 | Sysco Corp. | 1,955,773 | ||||||
| 62,720 | Walgreens Boots Alliance, Inc. | 5,222,695 | ||||||
|
| |||||||
| 13,117,220 | ||||||||
|
| |||||||
| Food, Beverage & Tobacco – 6.2% |
| ||||||
| 94,785 | Altria Group, Inc. | 6,536,374 | ||||||
| 9,411 | Archer-Daniels-Midland Co. | 403,638 | ||||||
| 88,182 | ConAgra Foods, Inc. | 4,215,981 | ||||||
| 26,305 | Dr. Pepper Snapple Group, Inc. | 2,541,852 | ||||||
| 65,592 | PepsiCo, Inc. | 6,948,816 | ||||||
| 15,487 | The J.M. Smucker Co. | 2,360,374 | ||||||
| 1,728 | Tyson Foods, Inc. Class A | 115,413 | ||||||
|
| |||||||
| 23,122,448 | ||||||||
|
| |||||||
| Health Care Equipment & Services – 6.5% |
| ||||||
| 30,848 | Abbott Laboratories | 1,212,635 | ||||||
| 2,568 | Aetna, Inc. | 313,630 | ||||||
| 12,876 | Anthem, Inc. | 1,691,134 | ||||||
| 25,018 | Boston Scientific Corp.* | 584,671 | ||||||
| 16,461 | C. R. Bard, Inc. | 3,870,969 | ||||||
| 34,776 | Cigna Corp. | 4,450,980 | ||||||
| 47,208 | Express Scripts Holding Co.* | 3,578,366 | ||||||
| 89,169 | Hologic, Inc.* | 3,085,247 | ||||||
| 18,040 | McKesson Corp. | 3,367,166 | ||||||
| 25,732 | Medtronic PLC | 2,232,766 | ||||||
|
| |||||||
| 24,387,564 | ||||||||
|
| |||||||
| 8 | The accompanying notes are an integral part of these financial statements. |
GOLDMAN SACHS VARIABLE INSURANCE TRUST U.S. EQUITY INSIGHTS FUND
| Shares | Description | Value | ||||||
| Common Stocks – (continued) | ||||||||
| Household & Personal Products – 0.5% |
| ||||||
| 7,720 | Kimberly-Clark Corp. | $ | 1,061,346 | |||||
| 10,766 | The Procter & Gamble Co. | 911,557 | ||||||
|
| |||||||
| 1,972,903 | ||||||||
|
| |||||||
| Insurance – 4.9% |
| ||||||
| 30,718 | Allied World Assurance Co. Holdings AG | 1,079,431 | ||||||
| 79,510 | Lincoln National Corp. | 3,082,603 | ||||||
| 30,721 | Principal Financial Group, Inc. | 1,262,940 | ||||||
| 38,958 | Reinsurance Group of America, Inc. | 3,778,536 | ||||||
| 26,684 | The Allstate Corp. | 1,866,546 | ||||||
| 33,066 | The Travelers Companies, Inc. | 3,936,177 | ||||||
| 98,940 | XL Group PLC | 3,295,691 | ||||||
|
| |||||||
| 18,301,924 | ||||||||
|
| |||||||
| Materials – 5.4% |
| ||||||
| 16,318 | Air Products & Chemicals, Inc. | 2,317,809 | ||||||
| 22,126 | Axalta Coating Systems Ltd.* | 587,003 | ||||||
| 42,456 | Nucor Corp. | 2,097,751 | ||||||
| 40,322 | PPG Industries, Inc. | 4,199,536 | ||||||
| 50,055 | Reliance Steel & Aluminum Co. | 3,849,229 | ||||||
| 156,495 | Steel Dynamics, Inc. | 3,834,127 | ||||||
| 26,741 | Vulcan Materials Co. | 3,218,547 | ||||||
|
| |||||||
| 20,104,002 | ||||||||
|
| |||||||
| Media – 3.0% |
| ||||||
| 82,870 | Comcast Corp. Class A | 5,402,295 | ||||||
| 4,914 | Liberty Global PLC Series C* | 140,786 | ||||||
| 3,540 | Liberty Global PLC LiLAC Series C* | 115,001 | ||||||
| 53,673 | The Interpublic Group of Companies, Inc. | 1,239,846 | ||||||
| 8,497 | Thomson Reuters Corp. | 343,449 | ||||||
| 14,161 | Time Warner, Inc. | 1,041,400 | ||||||
| 111,362 | Twenty-First Century Fox, Inc. Class A | 3,012,342 | ||||||
|
| |||||||
| 11,295,119 | ||||||||
|
| |||||||
| Pharmaceuticals, Biotechnology & Life Sciences – 11.2% |
| ||||||
| 14,646 | AbbVie, Inc. | 906,734 | ||||||
| 4,852 | Alexion Pharmaceuticals, Inc.* | 566,519 | ||||||
| 6,172 | Allergan PLC* | 1,426,287 | ||||||
| 40,297 | Amgen, Inc. | 6,131,189 | ||||||
| 2,591 | Biogen, Inc.* | 626,556 | ||||||
| 19,041 | Celgene Corp.* | 1,878,014 | ||||||
| 1,962 | Eli Lilly & Co. | 154,507 | ||||||
| 30,174 | Gilead Sciences, Inc. | 2,517,115 | ||||||
| 2,995 | Incyte Corp.* | 239,540 | ||||||
| 78,353 | Johnson & Johnson | 9,504,219 | ||||||
| 99,823 | Merck & Co., Inc. | 5,750,803 | ||||||
| 34,957 | Mylan NV* | 1,511,541 | ||||||
| 177,260 | Pfizer, Inc. | 6,241,325 | ||||||
| 4,214 | Regeneron Pharmaceuticals, Inc.* | 1,471,655 | ||||||
| 4,242 | Thermo Fisher Scientific, Inc. | 626,798 | ||||||
|
| |||||||
| Common Stocks – (continued) | ||||||||
| Pharmaceuticals, Biotechnology & Life Sciences – (continued) |
| ||||||
| 14,040 | United Therapeutics Corp.* | $ | 1,487,117 | |||||
| 11,114 | Vertex Pharmaceuticals, Inc.* | 956,026 | ||||||
|
| |||||||
| 41,995,945 | ||||||||
|
| |||||||
| Real Estate Investment Trusts – 0.3% |
| ||||||
| 13,425 | Equity Commonwealth* | 391,071 | ||||||
| 5,542 | Equity LifeStyle Properties, Inc. | 443,637 | ||||||
| 3,380 | Prologis, Inc. | 165,755 | ||||||
|
| |||||||
| 1,000,463 | ||||||||
|
| |||||||
| Retailing – 6.8% |
| ||||||
| 7,864 | Amazon.com, Inc.* | 5,627,636 | ||||||
| 1,859 | AutoZone, Inc.* | 1,475,748 | ||||||
| 12,263 | Dollar General Corp. | 1,152,722 | ||||||
| 1,574 | Expedia, Inc. | 167,316 | ||||||
| 66,099 | Lowe’s Companies, Inc. | 5,233,058 | ||||||
| 8,978 | Netflix, Inc.* | 821,307 | ||||||
| 4,268 | O’Reilly Automotive, Inc.* | 1,157,055 | ||||||
| 20,523 | Target Corp. | 1,432,916 | ||||||
| 54,640 | The Home Depot, Inc. | 6,976,982 | ||||||
| 1,009 | The Priceline Group, Inc.* | 1,259,646 | ||||||
|
| |||||||
| 25,304,386 | ||||||||
|
| |||||||
| Semiconductors & Semiconductor Equipment – 3.5% |
| ||||||
| 110,389 | Applied Materials, Inc. | 2,646,024 | ||||||
| 87,818 | Intel Corp. | 2,880,431 | ||||||
| 56,393 | KLA-Tencor Corp. | 4,130,787 | ||||||
| 8,335 | Lam Research Corp. | 700,640 | ||||||
| 64,983 | Maxim Integrated Products, Inc. | 2,319,243 | ||||||
| 7,265 | QUALCOMM, Inc. | 389,186 | ||||||
| 8,478 | Teradyne, Inc. | 166,932 | ||||||
|
| |||||||
| 13,233,243 | ||||||||
|
| |||||||
| Software & Services – 11.7% |
| ||||||
| 33,824 | Adobe Systems, Inc.* | 3,240,001 | ||||||
| 6,244 | Alphabet, Inc. Class A* | 4,392,841 | ||||||
| 6,269 | Alphabet, Inc. Class C* | 4,338,775 | ||||||
| 46,647 | Citrix Systems, Inc.* | 3,735,958 | ||||||
| 55,664 | Cognizant Technology Solutions Corp. Class A* | 3,186,207 | ||||||
| 5,516 | CSRA, Inc. | 129,240 | ||||||
| 176,742 | eBay, Inc.* | 4,137,530 | ||||||
| 47,076 | Facebook, Inc. Class A* | 5,379,845 | ||||||
| 100,414 | Microsoft Corp. | 5,138,185 | ||||||
| 97,884 | Nuance Communications, Inc.* | 1,529,927 | ||||||
| 155,253 | Oracle Corp. | 6,354,505 | ||||||
| 20,307 | salesforce.com, Inc.* | 1,612,579 | ||||||
| 17,601 | Yahoo!, Inc.* | 661,094 | ||||||
|
| |||||||
| 43,836,687 | ||||||||
|
| |||||||
| Technology Hardware & Equipment – 2.9% |
| ||||||
| 85,943 | Apple, Inc. | 8,216,151 | ||||||
| 4,887 | Cisco Systems, Inc. | 140,208 | ||||||
| 47,084 | EMC Corp. | 1,279,272 | ||||||
| 25,946 | HP, Inc. | 325,622 | ||||||
|
| |||||||
| The accompanying notes are an integral part of these financial statements. | 9 |
GOLDMAN SACHS VARIABLE INSURANCE TRUST U.S. EQUITY INSIGHTS FUND
Schedule of Investments (continued)
June 30, 2016 (Unaudited)
| Shares | Description | Value | ||||||
| Common Stocks – (continued) | ||||||||
| Technology Hardware & Equipment – (continued) |
| ||||||
| 13,929 | Juniper Networks, Inc. | $ | 313,263 | |||||
| 3,881 | Palo Alto Networks, Inc.* | 475,966 | ||||||
|
| |||||||
| 10,750,482 | ||||||||
|
| |||||||
| Telecommunication Services – 2.5% |
| ||||||
| 94,860 | AT&T, Inc. | 4,098,901 | ||||||
| 22,348 | CenturyLink, Inc. | 648,315 | ||||||
| 82,568 | Verizon Communications, Inc. | 4,610,597 | ||||||
|
| |||||||
| 9,357,813 | ||||||||
|
| |||||||
| Transportation – 3.0% |
| ||||||
| 22,556 | Alaska Air Group, Inc. | 1,314,789 | ||||||
| 135,530 | CSX Corp. | 3,534,622 | ||||||
| 25,520 | Delta Air Lines, Inc. | 929,694 | ||||||
| 50,158 | JetBlue Airways Corp.* | 830,617 | ||||||
| 50,688 | Norfolk Southern Corp. | 4,315,069 | ||||||
| 2,938 | Union Pacific Corp. | 256,341 | ||||||
|
| |||||||
| 11,181,132 | ||||||||
|
| |||||||
| Utilities – 5.2% |
| ||||||
| 113,301 | AES Corp. | 1,413,997 | ||||||
| 5,262 | Ameren Corp. | 281,938 | ||||||
| 158,506 | CenterPoint Energy, Inc. | 3,804,144 | ||||||
| 116,175 | FirstEnergy Corp. | 4,055,669 | ||||||
| 124,915 | Great Plains Energy, Inc. | 3,797,416 | ||||||
| 153,610 | NiSource, Inc. | 4,073,737 | ||||||
| 33,996 | PPL Corp. | 1,283,349 | ||||||
| 16,041 | Questar Corp. | 406,960 | ||||||
| 3,282 | Sempra Energy | 374,214 | ||||||
|
| |||||||
| 19,491,424 | ||||||||
|
| |||||||
| TOTAL INVESTMENTS – 97.7% | ||||||||
| (Cost $345,264,178) | $ | 365,297,976 | ||||||
|
| |||||||
| OTHER ASSETS IN EXCESS OF | 8,678,187 | ||||||
|
| |||||||
| NET ASSETS – 100.0% | $ | 373,976,163 | ||||||
|
| |||||||
| The percentage shown for each investment category reflects the value of investments in that category as a percentage of net assets. | ||
| * | Non-income producing security. | |
| (a) | All or a portion of security is segregated as collateral for initial margin requirements on futures transactions. | |
ADDITIONAL INVESTMENT INFORMATION
FUTURES CONTRACTS — At June 30, 2016, the Fund had the following futures contracts:
| Type | Number of Contracts Long (Short) | Expiration Date | Current Value | Unrealized Gain (Loss) | ||||||||||
| S&P 500 E-Mini Index | 41 | September 2016 | $ | 4,284,910 | $ | 41,527 | ||||||||
| 10 | The accompanying notes are an integral part of these financial statements. |
GOLDMAN SACHS VARIABLE INSURANCE TRUST U.S. EQUITY INSIGHTS FUND
Statement of Assets and Liabilities
June 30, 2016 (Unaudited)
| Assets: | ||||
Investments, at value (cost $345,264,178) | $ | 365,297,976 | ||
Cash | 9,212,263 | |||
Receivables: | ||||
Investments sold | 18,595,049 | |||
Dividends | 322,512 | |||
Fund shares sold | 106,365 | |||
Reimbursement from investment adviser | 22,190 | |||
Securities lending income | 11 | |||
Variation margin on certain derivative contracts | 47,972 | |||
| Total assets | 393,604,338 | |||
| Liabilities: | ||||
Payables: | ||||
Investments purchased | 18,101,650 | |||
Fund shares redeemed | 624,779 | |||
Management fees | 190,002 | |||
Distribution and Service fees and Transfer Agency fees | 26,520 | |||
Accrued expenses and other liabilities | 685,224 | |||
| Total liabilities | 19,628,175 | |||
| Net Assets: | ||||
Paid-in capital | 351,207,483 | |||
Undistributed net investment income | 2,881,909 | |||
Accumulated net realized loss | (188,554 | ) | ||
Net unrealized gain | 20,075,325 | |||
| NET ASSETS | $ | 373,976,163 | ||
Net Assets: | ||||
Institutional | $ | 254,721,501 | ||
Service | 119,254,662 | |||
Total Net Assets | $ | 373,976,163 | ||
Shares of beneficial interest outstanding $0.001 par value (unlimited shares authorized): | ||||
Institutional | 14,984,654 | |||
Service | 6,999,181 | |||
Net asset value, offering and redemption price per share: | ||||
Institutional | $17.00 | |||
Service | 17.04 | |||
| The accompanying notes are an integral part of these financial statements. | 11 |
GOLDMAN SACHS VARIABLE INSURANCE TRUST U.S. EQUITY INSIGHTS FUND
Statement of Operations
For the Six Months Ended June 30, 2016 (Unaudited)
| Investment income: | ||||
Dividends | $ | 3,731,997 | ||
Securities lending income — affiliated issuer | 1,006 | |||
| Total investment income | 3,733,003 | |||
| Expenses: | ||||
Management fees | 1,140,702 | |||
Distribution and Service fees — Service Shares | 144,439 | |||
Professional fees | 47,160 | |||
Printing and mailing costs | 42,117 | |||
Transfer Agency fees(a) | 36,794 | |||
Custody, accounting and administrative services | 26,072 | |||
Trustee fees | 13,433 | |||
Other | 13,267 | |||
| Total expenses | 1,463,984 | |||
Less — expense reductions | (161,297 | ) | ||
| Net expenses | 1,302,687 | |||
| NET INVESTMENT INCOME | 2,430,316 | |||
| Realized and unrealized gain (loss): | ||||
Net realized gain from: | ||||
Investments | 978,152 | |||
Futures contracts | 104,298 | |||
Net change in unrealized gain on: | ||||
Investments | 2,041,796 | |||
Futures contracts | 45,148 | |||
| Net realized and unrealized gain | 3,169,394 | |||
| NET INCREASE IN NET ASSETS RESULTING FROM OPERATIONS | $ | 5,599,710 | ||
(a) Institutional and Service Shares incurred Transfer Agency fees of $25,240 and $11,554, respectively.
| 12 | The accompanying notes are an integral part of these financial statements. |
GOLDMAN SACHS VARIABLE INSURANCE TRUST U.S. EQUITY INSIGHTS FUND
Statements of Changes in Net Assets
For the Six Months Ended | For the Fiscal Year Ended | |||||||
| From operations: | ||||||||
Net investment income | $ | 2,430,316 | $ | 5,175,212 | ||||
Net realized gain | 1,082,450 | 11,268,621 | ||||||
Net change in unrealized gain (loss) | 2,086,944 | (17,308,308 | ) | |||||
| Net increase (decrease) in net assets resulting from operations | 5,599,710 | (864,475 | ) | |||||
| Distributions to shareholders: | ||||||||
From net investment income | ||||||||
Institutional Shares | — | (3,792,329 | ) | |||||
Service Shares | — | (1,391,634 | ) | |||||
From net realized gains | ||||||||
Institutional Shares | — | (16,773,187 | ) | |||||
Service Shares | — | (7,603,702 | ) | |||||
| Total distributions to shareholders | — | (29,560,852 | ) | |||||
| From share transactions: | ||||||||
Proceeds from sales of shares | 8,785,314 | 19,987,592 | ||||||
Reinvestment of distributions | — | 29,560,852 | ||||||
Cost of shares redeemed | (32,177,552 | ) | (78,448,750 | ) | ||||
| Net decrease in net assets resulting from share transactions | (23,392,238 | ) | (28,900,306 | ) | ||||
| TOTAL DECREASE | (17,792,528 | ) | (59,325,633 | ) | ||||
| Net assets: | ||||||||
Beginning of period | 391,768,691 | 451,094,324 | ||||||
End of period | $ | 373,976,163 | $ | 391,768,691 | ||||
| Undistributed net investment income | $ | 2,881,909 | $ | 451,593 | ||||
| The accompanying notes are an integral part of these financial statements. | 13 |
GOLDMAN SACHS VARIABLE INSURANCE TRUST U.S. EQUITY INSIGHTS FUND
Financial Highlights
Selected Data for a Share Outstanding Throughout Each Period
| Income (loss) from investment operations | Distributions to shareholders | |||||||||||||||||||||||||||||||||||||||||||||||||||||||
| Year - Share Class | Net asset value, beginning of period | Net investment income(a) | Net realized and unrealized gain (loss) | Total from investment operations | From net investment income | From net realized gains | Total distributions | Net asset value, end of period | Total return(b) | Net assets, period (in 000s) | Ratio of net expenses to average net assets | Ratio of total expenses to average net assets | Ratio of to average net assets | Portfolio turnover rate(c) | ||||||||||||||||||||||||||||||||||||||||||
FOR THE SIX MONTHS ENDED JUNE 30, (UNAUDITED) | ||||||||||||||||||||||||||||||||||||||||||||||||||||||||
2016 - Institutional | $ | 16.71 | $ | 0.11 | $ | 0.18 | $ | 0.29 | $ | — | $ | — | $ | — | $ | 17.00 | 1.74 | % | $ | 254,722 | 0.64 | %(d) | 0.72 | %(d) | 1.39 | %(d) | 108 | % | ||||||||||||||||||||||||||||
2016 - Service | 16.77 | 0.10 | 0.17 | 0.27 | — | — | — | 17.04 | 1.61 | 119,255 | 0.85 | (d) | 0.97 | (d) | 1.18 | (d) | 108 | |||||||||||||||||||||||||||||||||||||||
FOR THE FISCAL YEARS ENDED DECEMBER 31, | ||||||||||||||||||||||||||||||||||||||||||||||||||||||||
2015 - Institutional | 18.12 | 0.23 | (0.27 | ) | (0.04 | ) | (0.25 | ) | (1.12 | ) | (1.37 | ) | 16.71 | (0.20 | ) | 269,238 | 0.64 | 0.71 | 1.29 | 200 | ||||||||||||||||||||||||||||||||||||
2015 - Service | 18.17 | 0.20 | (0.28 | ) | (0.08 | ) | (0.20 | ) | (1.12 | ) | (1.32 | ) | 16.77 | (0.41 | ) | 122,531 | 0.85 | 0.96 | 1.08 | 200 | ||||||||||||||||||||||||||||||||||||
2014 - Institutional | 16.52 | 0.21 | 2.47 | 2.68 | (0.26 | ) | (0.82 | ) | (1.08 | ) | 18.12 | 16.37 | 312,370 | 0.65 | 0.71 | 1.21 | 214 | |||||||||||||||||||||||||||||||||||||||
2014 - Service | 16.55 | 0.18 | 2.47 | 2.65 | (0.21 | ) | (0.82 | ) | (1.03 | ) | 18.17 | 16.18 | 138,725 | 0.86 | 0.96 | 1.01 | 214 | |||||||||||||||||||||||||||||||||||||||
2013 - Institutional | 12.14 | 0.20 | 4.35 | 4.55 | (0.17 | ) | — | (0.17 | ) | 16.52 | 37.52 | 307,589 | 0.65 | 0.71 | 1.36 | 207 | ||||||||||||||||||||||||||||||||||||||||
2013 - Service | 12.16 | 0.17 | 4.35 | 4.52 | (0.13 | ) | — | (0.13 | ) | 16.55 | 37.23 | 125,748 | 0.86 | 0.96 | 1.15 | 207 | ||||||||||||||||||||||||||||||||||||||||
2012 - Institutional | 10.80 | 0.20 | 1.36 | (e) | 1.56 | (0.22 | ) | — | (0.22 | ) | 12.14 | 14.42 | (e) | 262,759 | 0.64 | 0.72 | 1.71 | 134 | ||||||||||||||||||||||||||||||||||||||
2012 - Service | 10.82 | 0.18 | 1.35 | (e) | 1.53 | (0.19 | ) | — | (0.19 | ) | 12.16 | 14.10 | (e) | 99,892 | 0.85 | 0.97 | 1.51 | 134 | ||||||||||||||||||||||||||||||||||||||
2011 - Institutional | 10.57 | 0.18 | (f) | 0.25 | 0.43 | (0.20 | ) | — | (0.20 | ) | 10.80 | 4.05 | 273,555 | 0.64 | 0.70 | 1.69 | (f) | 51 | ||||||||||||||||||||||||||||||||||||||
2011 - Service | 10.58 | 0.16 | (f) | 0.25 | 0.41 | (0.17 | ) | — | (0.17 | ) | 10.82 | 3.90 | 99,711 | 0.85 | 0.95 | 1.48 | (f) | 51 | ||||||||||||||||||||||||||||||||||||||
| (a) | Calculated based on the average shares outstanding methodology. |
| (b) | Assumes investment at the net asset value at the beginning of the period, reinvestment of all distributions, and a complete redemption of the investment at the net asset value at the end of the period. Total returns for periods less than one full year are not annualized. |
| (c) | The Fund's portfolio turnover rate is calculated in accordance with regulatory requirements, without regard to transactions involving short term investments and certain derivatives. If such transactions were included, the Fund's portfolio turnover rate may be higher. |
| (d) | Annualized. |
| (e) | Reflects payment from affiliate relating to certain investment transactions which amounted to $0.01 per share and 0.07% of average net assets. Excluding such payment, the total return would have been 14.32% and 14.01%, respectively. |
| (f) | Reflects income recognized from special dividends which amounted to $0.02 per share and 0.17% of average net assets. |
| The accompanying notes are an integral part of these financial statements. | 14 |
GOLDMAN SACHS VARIABLE INSURANCE TRUST U.S. EQUITY INSIGHTS FUND
Notes to Financial Statements
June 30, 2016 (Unaudited)
1. ORGANIZATION
Goldman Sachs Variable Insurance Trust (the “Trust” or “VIT”) is a Delaware statutory trust registered under the Investment Company Act of 1940, as amended (the “Act”), as an open-end management investment company. The Trust includes the Goldman Sachs U.S. Equity Insights Fund (the “Fund”). The Fund is a diversified portfolio under the Act offering two classes of shares — Institutional and Service Shares. Shares of the Trust are offered to separate accounts of participating life insurance companies for the purpose of funding variable annuity contracts and variable life insurance policies.
Goldman Sachs Asset Management, L.P. (“GSAM”), an affiliate of Goldman, Sachs & Co. (“Goldman Sachs”), serves as investment adviser to the Fund pursuant to a management agreement (the “Agreement”) with the Trust.
2. SIGNIFICANT ACCOUNTING POLICIES
The financial statements have been prepared in accordance with accounting principles generally accepted in the United States of America (“GAAP”) and require management to make estimates and assumptions that may affect the reported amounts and disclosures. Actual results may differ from those estimates and assumptions.
A. Investment Valuation — The Fund’s valuation policy is to value investments at fair value.
B. Investment Income and Investments — Investment income includes interest income, dividend income, net of any foreign withholding taxes, less any amounts reclaimable, and securities lending income. Interest income is accrued daily and adjusted for amortization of premiums and accretion of discounts. Dividend income is recognized on ex-dividend date or, for certain foreign securities, as soon as such information is obtained subsequent to the ex-dividend date. Investment transactions are reflected on trade date. Realized gains and losses are calculated using identified cost. Investment transactions are recorded on the following business day for daily net asset value (“NAV”) calculations. Any foreign capital gains tax is accrued daily based upon net unrealized gains, and is payable upon sale of such investments.
Distributions received from the Fund’s investments in United States (“U.S.”) real estate investment trusts (“REITs”) may be characterized as ordinary income, net capital gain or a return of capital. A return of capital is recorded by the Fund as a reduction to the cost basis of the REIT.
For derivative contracts, realized gains and losses are recorded upon settlement of the contract.
C. Class Allocations and Expenses — Investment income, realized and unrealized gain (loss), and non-class specific expenses of the Fund are allocated daily based upon the proportion of net assets of each class. Non-class specific expenses directly incurred by the Fund are charged to the Fund, while such expenses incurred by the Trust are allocated across the Fund on a straight-line and/or pro-rata basis depending upon the nature of the expenses. Class specific expenses, where applicable, are borne by the respective share classes and include Distribution and Service and Transfer Agency fees.
D. Federal Taxes and Distributions to Shareholders — It is the Fund’s policy to comply with the requirements of the Internal Revenue Code of 1986, as amended (the “Code”), applicable to regulated investment companies (mutual funds) and to distribute each year substantially all of its investment company taxable income and capital gains to its shareholders. Accordingly, the Fund is not required to make any provisions for the payment of federal income tax. Distributions to shareholders are recorded on the ex-dividend date. Income and capital gains distributions, if any, are declared and paid annually.
Net capital losses are carried forward to future fiscal years and may be used to the extent allowed by the Code to offset any future capital gains. Losses that are carried forward will retain their character as either short-term or long-term capital losses. Utilization of capital loss carryforwards will reduce the requirement of future capital gains distributions.
The characterization of distributions to shareholders for financial reporting purposes is determined in accordance with federal income tax rules, which may differ from GAAP. The source of the Fund’s distributions may be shown in the accompanying financial statements as either from net investment income, net realized gain or capital. Certain components of the Fund’s net assets on the Statement of Assets and Liabilities reflect permanent GAAP/tax differences based on the appropriate tax character.
15
GOLDMAN SACHS VARIABLE INSURANCE TRUST U.S. EQUITY INSIGHTS FUND
Notes to Financial Statements (continued)
June 30, 2016 (Unaudited)
3. INVESTMENTS AND FAIR VALUE MEASUREMENTS
The fair value of a financial instrument is the amount that would be received to sell an asset or paid to transfer a liability in an orderly transaction between market participants at the measurement date (i.e., the exit price). GAAP establishes a fair value hierarchy that prioritizes the inputs to valuation techniques used to measure fair value. The hierarchy gives the highest priority to unadjusted quoted prices in active markets for identical assets or liabilities (Level 1 measurements) and the lowest priority to unobservable inputs (Level 3 measurements). The levels used for classifying investments are not necessarily an indication of the risk associated with investing in these investments. The three levels of the fair value hierarchy are described below:
Level 1 — Unadjusted quoted prices in active markets that are accessible at the measurement date for identical, unrestricted assets or liabilities;
Level 2 — Quoted prices in markets that are not active or financial instruments for which significant inputs are observable (including, but not limited to, quoted prices for similar investments, interest rates, foreign exchange rates, volatility and credit spreads), either directly or indirectly;
Level 3 — Prices or valuations that require significant unobservable inputs (including GSAM’s assumptions in determining fair value measurement).
Changes in valuation techniques may result in transfers into or out of an assigned level within the hierarchy. In accordance with the Fund’s policy, transfers between different levels of the fair value hierarchy resulting from such changes are deemed to have occurred as of the beginning of the reporting period.
The Board of Trustees (“Trustees”) has approved Valuation Procedures that govern the valuation of the portfolio investments held by the Fund, including investments for which market quotations are not readily available. The Trustees have delegated to GSAM day-to-day responsibility for implementing and maintaining internal controls and procedures related to the valuation of the Fund’s portfolio investments. To assess the continuing appropriateness of pricing sources and methodologies, GSAM regularly performs price verification procedures and issues challenges as necessary to third party pricing vendors or brokers, and any differences are reviewed in accordance with the Valuation Procedures.
A. Level 1 and Level 2 Fair Value Investments — The valuation techniques and significant inputs used in determining the fair values for investments classified as Level 1 and Level 2 are as follows:
Equity Securities — Equity securities traded on a U.S. securities exchange or the NASDAQ system, or those located on certain foreign exchanges, including but not limited to the Americas, are valued daily at their last sale price or official closing price on the principal exchange or system on which they are traded. If there is no sale or official closing price or such price is believed by GSAM to not represent fair value, equity securities are valued at the last bid price for long positions and at the last ask price for short positions. To the extent these investments are actively traded, they are classified as Level 1 of the fair value hierarchy, otherwise they are generally classified as Level 2.
Unlisted equity securities for which market quotations are available are valued at the last sale price on the valuation date, or if no sale occurs, at the last bid price. Securities traded on certain foreign securities exchanges are valued daily at fair value determined by an independent fair value service (if available) under Valuation Procedures approved by the Trustees and consistent with applicable regulatory guidance. The independent fair value service takes into account multiple factors including, but not limited to, movements in the securities markets, certain depositary receipts, futures contracts and foreign currency exchange rates that have occurred subsequent to the close of the foreign securities exchange. These investments are generally classified as Level 2 of the fair value hierarchy.
Money Market Funds — Investments in the Goldman Sachs Financial Square Money Market Fund (“Underlying Fund”) are valued at the NAV of the FST Institutional Share class on the day of valuation. These investments are generally classified as Level 1 of the fair value hierarchy. For information regarding an Underlying Fund’s accounting policies and investment holdings, please see the Underlying Fund’s shareholder report.
Derivative Contracts — A derivative is an instrument whose value is derived from underlying assets, indices, reference rates or a combination of these factors. The Fund enters into derivative transactions to hedge against changes in interest rates, securities
16
GOLDMAN SACHS VARIABLE INSURANCE TRUST U.S. EQUITY INSIGHTS FUND
3. INVESTMENTS AND FAIR VALUE MEASUREMENTS (continued)
prices, and/or currency exchange rates, to increase total return, or to gain access to certain markets or attain exposure to other underliers.
Exchange-traded derivatives, including futures and options contracts, are valued at the last sale or settlement price and typically fall within Level 1 of the fair value hierarchy. Over-the-counter (“OTC”) and centrally cleared derivatives are valued using market transactions and other market evidence, including market-based inputs to models, calibration to market-clearing transactions, broker or dealer quotations, or other alternative pricing sources. Where models are used, the selection of a particular model to value OTC and centrally cleared derivatives depends upon the contractual terms of, and specific risks inherent in, the instrument, as well as the availability of pricing information in the market. Valuation models require a variety of inputs, including contractual terms, market prices, yield curves, credit curves, measures of volatility, voluntary and involuntary prepayment rates, loss severity rates and correlations of such inputs. For OTC and centrally cleared derivatives that trade in liquid markets, model inputs can generally be verified and model selection does not involve significant management judgment. OTC and centrally cleared derivatives are classified within Level 2 of the fair value hierarchy when significant inputs are corroborated by market evidence.
i. Futures Contracts — Futures contracts are contracts to buy or sell a standardized quantity of a specified commodity or security and are valued based on exchanged settlement prices or independent market quotes. Futures contracts are valued at the last settlement price, or in the absence of a sale, the last bid price for long positions and at the last ask price for short positions, at the end of each day on the board of trade or exchange upon which they are traded. Upon entering into a futures contract, the Fund deposits cash or securities in an account on behalf of the broker in an amount sufficient to meet the initial margin requirement. Subsequent payments are made or received by the Fund equal to the daily change in the contract value and are recorded as variation margin receivable or payable with a corresponding offset to unrealized gains or losses.
B. Level 3 Fair Value Investments — To the extent that significant inputs to valuation models and other alternative pricing sources are unobservable, or if quotations are not readily available, or if GSAM believes that such quotations do not accurately reflect fair value, the fair value of the Fund’s investments may be determined under Valuation Procedures approved by the Trustees. GSAM, consistent with its procedures and applicable regulatory guidance, may make an adjustment to the most recent valuation prices of either domestic or foreign securities in light of significant events to reflect what it believes to be the fair value of the securities at the time of determining the Fund’s NAV. Significant events which could affect a large number of securities in a particular market may include, but are not limited to: significant fluctuations in U.S. or foreign markets; market dislocations; market disruptions; or unscheduled market closings. Significant events which could also affect a single issuer may include, but are not limited to: corporate actions such as reorganizations, mergers and buy-outs; ratings downgrades; and bankruptcies.
C. Fair Value Hierarchy — The following is a summary of the Fund’s investments and derivatives classified in the fair value hierarchy as of June 30, 2016:
| Investment Type | Level 1 | Level 2 | Level 3 | |||||||||
| Assets | ||||||||||||
| Common Stock(a) | ||||||||||||
North America | $ | 365,297,976 | $ | — | $ | — | ||||||
| Derivative Type | ||||||||||||
| Assets(b) | ||||||||||||
Futures Contracts | $ | 41,527 | $ | — | $ | — | ||||||
| (a) | Amounts are disclosed by continent to highlight the impact of time zone differences between local market close and the calculation of NAV. Security valuations are based on the principal exchange or system on which they are traded, which may differ from country of domicile noted in table. |
| (b) | Amount shown represents unrealized gain (loss) at period end. |
For further information regarding security characteristics, see the Schedule of Investments.
17
GOLDMAN SACHS VARIABLE INSURANCE TRUST U.S. EQUITY INSIGHTS FUND
Notes to Financial Statements (continued)
June 30, 2016 (Unaudited)
4. INVESTMENTS IN DERIVATIVES
The following table sets forth, by certain risk types, the gross value of derivative contracts as of June 30, 2016. These instruments were used as part of the Fund’s investment strategies and to obtain and/or manage exposure related to the risks below. The values in the table below exclude the effects of cash collateral received or posted pursuant to these derivative contracts, and therefore are not representative of the Fund’s net exposure.
| Risk | Statement of Assets and Liabilities | Assets(a) | Statement of Assets and Liabilities | Liabilities | ||||||||||
| Equity | Variation margin on certain derivative contracts | $ | 41,527 | Variation margin on certain derivative contracts | $ | — | ||||||||
| (a) | Includes unrealized gain (loss) on futures contracts described in the Additional Investment Information section of the Schedule of Investments. Only current day’s variation margin is reported within the Statement of Assets and Liabilities. |
The following table sets forth, by certain risk types, the Fund’s gains (losses) related to these derivatives and their indicative volumes for the six months ended June 30, 2016. These gains (losses) should be considered in the context that these derivative contracts may have been executed to create investment opportunities and /or economically hedge certain investments, and accordingly, certain gains (losses) on such derivative contracts may offset certain (losses) gains attributable to investments. These gains (losses) are included in “Net realized gain (loss)” or “Net change in unrealized gain (loss)” on the Statement of Operations:
| Risk | Statement of Operations | Net Realized Gain (Loss) | Net Change in Unrealized Gain (Loss) | Average Number of Contracts(a) | ||||||
| Equity | Net realized gain (loss) from futures contracts/Net change in unrealized gain (loss) on futures contracts | $104,298 | $ | 45,148 | 41 | |||||
| (a) | Average number of contracts is based on the average of month end balances for the period ended June 30, 2016. |
5. AGREEMENTS AND AFFILIATED TRANSACTIONS
A. Management Agreement — Under the Agreement, GSAM manages the Fund, subject to the general supervision of the Trustees.
As compensation for the services rendered pursuant to the Agreement, the assumption of the expenses related thereto and administration of the Fund’s business affairs, including providing facilities, GSAM is entitled to a management fee, accrued daily and paid monthly, equal to an annual percentage rate of the Fund’s average daily net assets.
For the six months ended June 30, 2016, contractual and effective net management fees with GSAM were at the following rates:
| Contractual Management Rate | ||||||||||
First $1 billion | Next $1 billion | Next $3 billion | Next $3 billion | Over $8 billion | Effective Rate | |||||
| 0.62% | 0.59% | 0.56% | 0.55% | 0.54% | 0.62% | |||||
B. Distribution and Service Plan — The Trust, on behalf of the Service Shares of the Fund, has adopted a Distribution and Service Plan (the “Plan”). Under the Plan, Goldman Sachs, which serves as distributor (the “Distributor”), is entitled to a fee accrued daily and paid monthly, for distribution services and personal and account maintenance services, which may then be paid by Goldman Sachs to authorized dealers, equal to, on an annual basis, 0.25% of the Fund’s average daily net assets attributable to Service Shares. Goldman Sachs has agreed to waive distribution and service fees so as not to exceed an annual rate of 0.21% of the Fund’s average daily net assets attributable to Service Shares. The distribution and service fee waiver will remain in place through at least April 29, 2017, and prior to such date Goldman Sachs may not terminate the arrangement without the approval of the Trustees. For the six months ended June 30, 2016, Goldman Sachs waived $23,110 in distribution and service fees for the Fund’s Service Shares.
18
GOLDMAN SACHS VARIABLE INSURANCE TRUST U.S. EQUITY INSIGHTS FUND
5. AGREEMENTS AND AFFILIATED TRANSACTIONS (continued)
C. Transfer Agency Agreement — Goldman Sachs also serves as the transfer agent of the Fund for a fee pursuant to the Transfer Agency Agreement. The fees charged for such transfer agency services are accrued daily and paid monthly at an annual rate of 0.02% of the average daily net assets of Institutional and Service Shares.
D. Other Expense Agreements and Affiliated Transactions — GSAM has agreed to limit certain “Other Expenses” of the Fund (excluding acquired fund fees and expenses, transfer agency fees and expenses, taxes, interest, brokerage fees, shareholder meeting, litigation, indemnification and extraordinary expenses) to the extent such expenses exceed, on an annual basis, a percentage rate of the average daily net assets of the Fund. Such Other Expense reimbursements, if any, are accrued daily and paid monthly. In addition, the Fund is not obligated to reimburse GSAM for prior fiscal year expense reimbursements, if any. The Other Expense limitation as an annual percentage rate of average daily net assets for the Fund is 0.004%. The Other Expense limitation will remain in place through at least April 29, 2017, and prior to such date GSAM may not terminate the arrangement without the approval of the Trustees. For the six months ended June 30, 2016, GSAM reimbursed $134,690 to the Fund. In addition, the Fund has entered into certain offset arrangements with the custodian and the transfer agent, which may result in a reduction of the Fund’s expenses and are received irrespective of the application of the “Other Expense” limitations described above. For the six months ended June 30, 2016, custody fee credits were $3,497.
E. Line of Credit Facility — As of June 30, 2016, the Fund participated in a $1,100,000,000 committed, unsecured revolving line of credit facility (the “facility”) together with other funds of the Trust and registered investment companies having management agreements with GSAM or its affiliates (“Other Borrowers”). This facility is to be used for temporary or emergency purposes, or to allow for an orderly liquidation of securities to meet redemption requests. The interest rate on borrowings is based on the federal funds rate. The facility also requires a fee to be paid by the Fund based on the amount of the commitment that has not been utilized. For the six months ended June 30, 2016, the Fund did not have any borrowings under the facility.
6. PORTFOLIO SECURITIES TRANSACTIONS
The cost of purchases and proceeds from sales and maturities of long-term securities for the six months ended June 30, 2016, were $395,676,188 and $417,907,519, respectively.
7. SECURITIES LENDING
Pursuant to exemptive relief granted by the Securities and Exchange Commission (“SEC”) and the terms and conditions contained therein, the Fund may lend its securities through a securities lending agent, Goldman Sachs Agency Lending (“GSAL”), a wholly-owned subsidiary of Goldman Sachs, to certain qualified borrowers including Goldman Sachs and affiliates. In accordance with the Fund’s securities lending procedures, the Fund receives cash collateral at least equal to the market value of the securities on loan. The market value of the loaned securities is determined at the close of business of the Fund, at their last sale price or official closing price on the principal exchange or system on which they are traded, and any additional required collateral is delivered to the Fund on the next business day. As with other extensions of credit, the Fund may experience delay in the recovery of its securities or incur a loss should the borrower of the securities breach its agreement with the Fund or become insolvent at a time when the collateral is insufficient to cover the cost of repurchasing securities on loan. Dividend income received from securities on loan may not be subject to withholding taxes and therefore withholding taxes paid may differ from the amounts listed in the Statement of Operations. Loans of securities are terminable at any time and as such 1) the remaining contractual maturities of the outstanding securities lending transactions are considered to be overnight and continuous and 2) the borrower, after notice, is required to return borrowed securities within the standard time period for settlement of securities transactions.
The Fund invests the cash collateral received in connection with securities lending transactions in the Goldman Sachs Financial Square Money Market Fund (“Money Market Fund”), an affiliated series of the Trust. The Money Market Fund is registered under the Act as an open end investment company, is subject to Rule 2a-7 under the Act, and is managed by GSAM, for
19
GOLDMAN SACHS VARIABLE INSURANCE TRUST U.S. EQUITY INSIGHTS FUND
Notes to Financial Statements (continued)
June 30, 2016 (Unaudited)
7. SECURITIES LENDING (continued)
which GSAM may receive an investment advisory fee of up to 0.205% on an annualized basis of the average daily net assets of the Money Market Fund.
In the event of a default by a borrower with respect to any loan, GSAL will exercise any and all remedies provided under the applicable borrower agreement to make the Fund whole. These remedies include purchasing replacement securities by applying the collateral held from the defaulting broker against the purchase cost of the replacement securities. If, despite such efforts by GSAL to exercise these remedies, the Fund sustains losses as a result of a borrower’s default, GSAL indemnifies the Fund by purchasing replacement securities at GSAL’s expense, or paying the Fund an amount equal to the market value of the replacement securities, subject to an exclusion for any shortfalls resulting from a loss of value in the cash collateral pool due to reinvestment risk and a requirement that the Fund agrees to assign rights to the collateral to GSAL for purpose of using the collateral to cover purchase of replacement securities as more fully described in the Securities Lending Agency Agreement. The Fund’s loaned securities were all subject to enforceable Securities Lending Agreements and the value of the collateral is at least equal to the value of the cash received. The value of loaned securities and cash collateral at period end are disclosed in the Fund’s Statement of Assets and Liabilities.
Both the Fund and GSAL received compensation relating to the lending of the Fund’s securities. The amounts earned by the Fund for the six months ended June 30, 2016, are reported under Investment Income on the Statement of Operations.
The table below details securities lending activity with affiliates of Goldman Sachs:
| For the six months ended June 30, 2016 | ||||
Earnings of GSAL Relating to Securities Loaned | Amounts Received by the Funds from Lending to Goldman Sachs | Amounts Payable to Goldman Sachs Upon Return of Securities Loaned as of 6/30/16 | ||
| $339 | $213 | $— |
The following table provides information about the Fund’s investment in the Money Market Fund for the six months ended June 30, 2016:
Market Value 12/31/15 | Purchases at Cost | Proceeds from Sales | Market Value 6/30/16 | |||
| $754,400 | $2,623,627 | $(3,378,027) | $— |
8. TAX INFORMATION
As of the Fund’s most recent fiscal year end, December 31, 2015, the Fund’s timing differences, on a tax-basis were as follows:
Timing differences (Post October Loss Deferral/Deferred REITs Distributions) | $ | (179,979 | ) |
As of June 30, 2016, the Fund’s aggregate security unrealized gains and losses based on cost for U.S. federal income tax purposes were as follows:
| Tax cost | $ | 346,431,843 | ||
| Gross unrealized gain | 28,142,444 | |||
| Gross unrealized loss | (9,276,311 | ) | ||
| Net unrealized security gain | $ | 18,866,133 |
20
GOLDMAN SACHS VARIABLE INSURANCE TRUST U.S. EQUITY INSIGHTS FUND
8. TAX INFORMATION (continued)
The difference between GAAP-basis and tax-basis unrealized gains (losses) is attributable primarily to wash sales and net mark to market gains (losses) on regulated futures contracts.
GSAM has reviewed the Fund’s tax positions for all open tax years (the current and prior three years, as applicable) and has concluded that no provision for income tax is required in the Fund’s financial statements. Such open tax years remain subject to examination and adjustment by tax authorities.
9. OTHER RISKS
The Fund’s risks include, but are not limited to, the following:
Derivatives Risk — Loss may result from the Fund’s investments in derivative instruments. These instruments may be illiquid, difficult to price and leveraged so that small changes in the value of the underlying instruments may produce disproportionate losses to the Fund. Derivatives are also subject to counterparty risk, which is the risk that the other party in the transaction will not fulfill its contractual obligation. Losses from investments in derivatives can also result from a lack of correlation between changes in the value of derivative instruments and the portfolio assets (if any) being hedged.
Large Shareholder Transactions Risk — The Fund may experience adverse effects when certain large shareholders, such as other funds, participating insurance companies, accounts and Goldman Sachs affiliates, purchase or redeem large amounts of shares of the Fund. Such large shareholder redemptions may cause the Fund to sell portfolio securities at times when it would not otherwise do so, which may negatively impact the Fund’s NAV and liquidity. These transactions may also accelerate the realization of taxable income to shareholders if such sales of investments resulted in gains, and may also increase transaction costs. In addition, a large redemption could result in the Fund’s current expenses being allocated over a smaller asset base, leading to an increase in the Fund’s expense ratio. Similarly, large Fund share purchases may adversely affect the Fund’s performance to the extent that the Fund is delayed in investing new cash and is required to maintain a larger cash position than it ordinarily would.
Liquidity Risk — The Fund may make investments that are illiquid or that may become less liquid in response to market developments or adverse investor perceptions. Illiquid investments may be more difficult to value. Liquidity risk may also refer to the risk that the Fund will not be able to pay redemption proceeds within the allowable time period because of unusual market conditions, an unusually high volume of redemption requests, or other reasons. To meet redemption requests, the Fund may be forced to sell investments at an unfavorable time and/or under unfavorable conditions.
Market and Credit Risks — In the normal course of business, the Fund trades financial instruments and enters into financial transactions where risk of potential loss exists due to changes in the market (market risk). Additionally, the Fund may also be exposed to credit risk in the event that an issuer or guarantor fails to perform or that an institution or entity with which the Fund has unsettled or open transactions defaults.
10. INDEMNIFICATIONS
Under the Trust’s organizational documents, its Trustees, officers, employees and agents are indemnified, to the extent permitted by the Act and state law, against certain liabilities that may arise out of performance of their duties to the Fund. Additionally, in the course of business, the Fund enters into contracts that contain a variety of indemnification clauses. The Fund’s maximum exposure under these arrangements is unknown, as this would involve future claims that may be made against the Fund that have not yet occurred. However, GSAM believes the risk of loss under these arrangements to be remote.
21
GOLDMAN SACHS VARIABLE INSURANCE TRUST U.S. EQUITY INSIGHTS FUND
Notes to Financial Statements (continued)
June 30, 2016 (Unaudited)
11. SUBSEQUENT EVENTS
Subsequent events after the Statement of Assets and Liabilities date have been evaluated through the date the financial statements were issued. GSAM has concluded that there is no impact requiring adjustment or disclosure in the financial statements.
12. SUMMARY OF SHARE TRANSACTIONS
Share activity is as follows:
| For the Six Months Ended June 30, 2016 (Unaudited) | For the Fiscal Year Ended December 31, 2015 | |||||||||||||||
| Shares | Dollars | Shares | Dollars | |||||||||||||
| Institutional Shares | ||||||||||||||||
| Shares sold | 186,407 | $ | 3,088,680 | 430,772 | $ | 7,764,027 | ||||||||||
| Reinvestment of distributions | — | — | 1,232,945 | 20,565,516 | ||||||||||||
| Shares redeemed | (1,309,821 | ) | (21,475,564 | ) | (2,794,030 | ) | (50,484,586 | ) | ||||||||
| (1,123,414 | ) | (18,386,884 | ) | (1,130,313 | ) | (22,155,043 | ) | |||||||||
| Service Shares | ||||||||||||||||
| Shares sold | 345,037 | 5,696,634 | 671,118 | 12,223,565 | ||||||||||||
| Reinvestment of distributions | — | — | 537,356 | 8,995,336 | ||||||||||||
| Shares redeemed | (651,966 | ) | (10,701,988 | ) | (1,538,497 | ) | (27,964,164 | ) | ||||||||
| (306,929 | ) | (5,005,354 | ) | (330,023 | ) | (6,745,263 | ) | |||||||||
| NET DECREASE | (1,430,343 | ) | $ | (23,392,238 | ) | (1,460,336 | ) | $ | (28,900,306 | ) | ||||||
22
GOLDMAN SACHS VARIABLE INSURANCE TRUST U.S. EQUITY INSIGHTS FUND
| Fund Expenses — Six Month Period Ended June 30, 2016 (Unaudited) |
As a shareholder of Institutional or Service Shares of the Fund, you incur ongoing costs, including management fees, distribution and service (12b-1) fees (with respect to Service Shares) and other Fund expenses. This example is intended to help you understand your ongoing costs (in dollars) of investing in the Institutional Shares and Service Shares of the Fund and to compare these costs with the ongoing costs of investing in other mutual funds.
The example is based on an investment of $1,000 invested at the beginning of the period and held for the entire period from January 1, 2016 through June 30, 2016, which represents a period of 182 days of a 366 day year.
Actual Expenses — The first line under each share class in the table below provides information about actual account values and actual expenses. You may use the information in this line, together with the amount you invested, to estimate the expenses that you paid over the period. Simply divide your account value by $1,000 (for example, an $8,600 account value divided by $1,000=8.6), then multiply the result by the number in the first line under the heading entitled “Expenses Paid” to estimate the expenses you paid on your account during this period.
Hypothetical Example for Comparison Purposes — The second line under each share class in the table below provides information about hypothetical account values and hypothetical expenses based on the Fund's actual net expense ratio and an assumed rate of return of 5% per year before expenses, which is not the Fund's actual return. The hypothetical account values and expenses may not be used to estimate the actual ending account balance or expenses you paid for the period. You may use this information to compare the ongoing costs of investing in the Fund and other funds. To do so, compare this 5% hypothetical example with the 5% hypothetical examples that appear in the shareholder reports of the other funds.
Please note that the expenses shown in the table are meant to highlight your ongoing costs only. As a shareholder of the Fund you do not incur any transaction costs, such as sales charges, redemption fees, or exchange fees, but shareholders of other funds may incur such costs. The second line of the table is useful in comparing ongoing costs only, and will not help you determine the relative total costs of owning different funds whose shareholders may incur transaction costs.
| Share Class | Beginning Account Value 01/01/16 | Ending Account Value | Expenses Paid for the 6 Months Ended 06/30/16* | |||||||||
| Institutional | ||||||||||||
| Actual | $ | 1,000 | $ | 1,017.40 | $ | 3.21 | ||||||
| Hypothetical 5% return | 1,000 | 1,021.68 | + | 3.22 | ||||||||
| Service | ||||||||||||
| Actual | 1,000 | 1,016.10 | 4.26 | |||||||||
| Hypothetical 5% return | 1,000 | 1,020.64 | + | 4.27 | ||||||||
| * | Expenses are calculated using the Fund’s annualized net expense ratio for each class, which represents the ongoing expenses as a percentage of net assets for the six months ended June 30, 2016. Expenses are calculated by multiplying the annualized net expense ratio by the average account value for the period; then multiplying the result by the number of days in the most recent fiscal half year; and then dividing that result by the number of days in the fiscal year. The annualized net expense ratios for the period were 0.64% and 0.85% for Institutional and Service Shares, respectively. |
| + | Hypothetical expenses are based on the Fund’s actual annualized net expense ratios and an assumed rate of return of 5% per year before expenses. |
23
GOLDMAN SACHS VARIABLE INSURANCE TRUST U.S. EQUITY INSIGHTS FUND
Statement Regarding Basis for Approval of Management Agreement (Unaudited)
Background
The Goldman Sachs U.S. Equity Insights Fund (the “Fund”) is an investment portfolio of Goldman Sachs Variable Insurance Trust (the “Trust”). The Board of Trustees oversees the management of the Trust and reviews the investment performance and expenses of the Fund at regularly scheduled meetings held throughout the year. In addition, the Board of Trustees determines annually whether to approve the continuance of the Trust’s investment management agreement (the “Management Agreement”) with Goldman Sachs Asset Management, L.P. (the “Investment Adviser”) on behalf of the Fund.
The Management Agreement was most recently approved for continuation until June 30, 2017 by the Board of Trustees, including those Trustees who are not parties to the Management Agreement or “interested persons” (as defined in the Investment Company Act of 1940, as amended) of any party thereto (the “Independent Trustees”), at a meeting held on June 15-16, 2016 (the “Annual Meeting”).
The review process undertaken by the Trustees spans the course of the year and culminates with the Annual Meeting. To assist the Trustees in their deliberations, the Trustees have established a Contract Review Committee (the “Committee”), comprised of the Independent Trustees. The Committee held three meetings over the course of the year since the Management Agreement was last approved. At those Committee meetings, regularly scheduled Board or other committee meetings, and/or the Annual Meeting, matters relevant to the renewal of the Management Agreement were considered by the Board, or the Independent Trustees, as applicable. With respect to the Fund, such matters included:
| (a) | the nature and quality of the advisory, administrative, and other services provided to the Fund by the Investment Adviser and its affiliates, including information about: |
| (i) | the structure, staff, and capabilities of the Investment Adviser and its portfolio management teams; |
| (ii) | the groups within the Investment Adviser and its affiliates that support the portfolio management teams or provide other types of necessary services, including fund services groups (e.g., accounting and financial reporting, tax, shareholder services, and operations); controls and risk management groups (e.g., legal, compliance, valuation oversight, credit risk management, internal audit, compliance testing, market risk analysis, finance, and central funding); sales and distribution support groups, and others (e.g., information technology and training); |
| (iii) | trends in employee headcount; |
| (iv) | the Investment Adviser’s financial resources and ability to hire and retain talented personnel and strengthen its operations; and |
| (v) | the parent company’s support of the Investment Adviser and its mutual fund business, as expressed by the firm’s senior management; |
| (b) | information on the investment performance of the Fund, including comparisons to the performance of similar mutual funds, as provided by a third-party mutual fund data provider engaged as part of the contract review process (the “Outside Data Provider”), a benchmark performance index, and a composite of accounts with comparable investment strategies managed by the Investment Adviser; and general investment outlooks in the markets in which the Fund invests; |
| (c) | information provided by the Investment Adviser indicating the Investment Adviser’s views on whether the Fund’s peer group and/or benchmark index had high, medium, or low relevance given the Fund’s particular investment strategy; |
| (d) | the terms of the Management Agreement and other agreements with affiliated service providers entered into by the Trust on behalf of the Fund; |
| (e) | fee and expense information for the Fund, including: |
| (i) | the relative management fee and expense level of the Fund as compared to those of comparable funds managed by other advisers, as provided by the Outside Data Provider; and |
| (ii) | the Fund’s expense trends over time; |
| (f) | with respect to the extensive investment performance and expense comparison data provided by the Outside Data Provider, its processes in producing that data for the Fund; |
| (g) | the undertakings of the Investment Adviser and Goldman, Sachs & Co. (“Goldman Sachs”), the Fund’s affiliated distributor, to waive certain fees and to limit certain expenses of the Fund that exceed a specified level; |
| (h) | information relating to the profitability of the Management Agreement and the transfer agency and distribution and service arrangements of the Fund and the Trust as a whole to the Investment Adviser and its affiliates; |
| (i) | whether the Fund’s existing management fee schedule adequately addressed any economies of scale; |
| (j) | a summary of the “fall-out” benefits derived by the Investment Adviser and its affiliates from their relationships with the Fund, including the fees received by the Investment Adviser’s affiliates from the Fund for transfer agency, securities lending, portfolio trading, distribution and other services; |
| (k) | a summary of potential benefits derived by the Fund as a result of its relationship with the Investment Adviser; |
24
GOLDMAN SACHS VARIABLE INSURANCE TRUST U.S. EQUITY INSIGHTS FUND
Statement Regarding Basis for Approval of Management Agreement (Unaudited) (continued)
| (l) | information regarding commissions paid by the Fund and broker oversight, other information regarding portfolio trading, and how the Investment Adviser carries out its duty to seek best execution; |
| (m) | the manner in which portfolio manager compensation is determined; and the number and types of accounts managed by the portfolio managers; |
| (n) | the nature and quality of the services provided to the Fund by its unaffiliated service providers, and the Investment Adviser’s general oversight and evaluation (including reports on due diligence) of those service providers as part of the administration services provided under the Management Agreement; and |
| (o) | the Investment Adviser’s processes and policies addressing various types of potential conflicts of interest; its approach to risk management; the annual review of the effectiveness of the Fund’s compliance program; and periodic compliance reports. |
The Trustees also received an overview of the Fund’s distribution arrangements. They received information regarding the Fund’s assets, share purchase and redemption activity, and payment of distribution and service fees. Information was also provided to the Trustees relating to revenue sharing payments made by and services provided by the Investment Adviser and its affiliates to intermediaries that promote the sale, distribution, and/or servicing of Fund shares. The Independent Trustees also discussed the broad range of other investment choices that are available to Fund investors, including the availability of comparable funds managed by other advisers.
The presentations made at the Board and Committee meetings and at the Annual Meeting encompassed the Fund and other mutual funds for which the Board of Trustees has responsibility. In evaluating the Management Agreement at the Annual Meeting, the Trustees relied upon their knowledge, resulting from their meetings and other interactions throughout the year, of the Investment Adviser and its affiliates, their services, and the Fund. In conjunction with these meetings, the Trustees received written materials and oral presentations on the topics covered, and the Investment Adviser addressed the questions and concerns of the Trustees, including concerns regarding the investment performance of certain of the funds they oversee. The Independent Trustees were advised by their independent legal counsel regarding their responsibilities and other regulatory requirements related to the approval and continuation of mutual fund investment management agreements under applicable law. In addition, the Investment Adviser and its affiliates provided the Independent Trustees with a written response to a formal request for information sent on behalf of the Independent Trustees by their independent legal counsel. During the course of their deliberations, the Independent Trustees met in executive sessions with their independent legal counsel, without representatives of the Investment Adviser or its affiliates present.
Nature, Extent, and Quality of the Services Provided Under the Management Agreement
As part of their review, the Trustees considered the nature, extent, and quality of the services provided to the Fund by the Investment Adviser. In this regard, the Trustees considered both the investment advisory services and non-advisory services that are provided by the Investment Adviser and its affiliates. The Trustees noted the transition in the leadership and changes in personnel of various of the Investment Adviser’s portfolio management teams that had occurred in recent periods, and the ongoing recruitment efforts aimed at bringing high quality investment talent to the Investment Adviser. They also noted the Investment Adviser’s commitment to maintaining high quality systems and expending substantial resources to respond to ongoing changes to the regulatory and control environment in which the Fund and its service providers operate, as well as the efforts of the Investment Adviser and its affiliates to combat cyber security risks. The Trustees concluded that the Investment Adviser continued to commit substantial financial and operational resources to the Fund and expressed confidence that the Investment Adviser would continue to do so in the future. The Trustees also recognized that the Investment Adviser had made significant commitments to address regulatory compliance requirements applicable to the Fund and the Investment Adviser and its affiliates.
Investment Performance
The Trustees also considered the investment performance of the Fund. In this regard, they compared the investment performance of the Fund to its peers using rankings and ratings compiled by the Outside Data Provider as of December 31, 2015, and updated performance information prepared by the Investment Adviser using the peer group identified by the Outside Data Provider as of March 31, 2016. The information on the Fund’s investment performance was provided for the one-, three-, five-, and ten-year periods ending on the applicable dates. The Trustees also reviewed the Fund’s investment performance relative to its performance benchmark. As part of this review, they considered the investment performance trends of the Fund over time, and reviewed the investment performance of the Fund in light of its investment objective and policies and market conditions. The Trustees also received information comparing the Fund’s performance to that of a composite of accounts with comparable investment strategies managed by the Investment Adviser.
25
GOLDMAN SACHS VARIABLE INSURANCE TRUST U.S. EQUITY INSIGHTS FUND
Statement Regarding Basis for Approval of Management Agreement (Unaudited) (continued)
In addition, the Trustees considered materials prepared and presentations made by the Investment Adviser’s senior management and portfolio management personnel in which Fund performance was assessed. The Trustees also considered the Investment Adviser’s periodic reports with respect to the Fund’s risk profile, and how the Investment Adviser’s approach to risk monitoring and management influences portfolio management. They noted the efforts of the Fund’s portfolio management team to continue to enhance the investment model used in managing the Fund.
The Trustees observed that the Fund’s Institutional Shares had placed in the top half of the Fund’s peer group for the one-, three-, and five-year periods and in the third quartile for the ten-year period, and had outperformed the Fund’s benchmark index for the three- and five-year periods and underperformed for the one- and ten-year periods ended March 31, 2016.
Costs of Services Provided and Competitive Information
The Trustees considered the contractual terms of the Management Agreement and the fee rates payable by the Fund thereunder. In this regard, the Trustees considered information on the services rendered by the Investment Adviser to the Fund, which included both advisory and administrative services that were directed to the needs and operations of the Fund as a registered mutual fund.
In particular, the Trustees reviewed analyses prepared by the Outside Data Provider regarding the expense rankings of the Fund. The analyses provided a comparison of the Fund’s management fee and breakpoints to those of a relevant peer group and category universe; an expense analysis which compared the Fund’s overall net and gross expenses to a peer group and a category universe; and a five-year history comparing the Fund’s net expenses to the peer and category medians. The analyses also compared the Fund’s transfer agency, custody, and distribution fees, other expenses and fee waivers/reimbursements to those of the peer group and category medians. The Trustees concluded that the comparisons provided by the Outside Data Provider were useful in evaluating the reasonableness of the management fees and total expenses paid by the Fund.
In addition, the Trustees considered the Investment Adviser’s undertaking to limit certain expenses of the Fund that exceed a specified level and Goldman Sachs’ undertaking to waive a portion of the distribution and service fees paid by the Fund’s Service Shares. The Trustees also noted that certain changes were being made to existing fee waiver or expense limitation arrangements of the Fund that would have the effect of decreasing total Fund expenses, with such changes taking effect in connection with the Fund’s next annual registration statement update. They also noted that the Investment Adviser did not manage other types of accounts having investment objectives and policies similar to those of the Fund, and therefore this type of fee comparison was not possible.
In addition, the Trustees noted that shareholders are able to redeem their Fund shares at any time if shareholders believe that the Fund fees and expenses are too high or if they are dissatisfied with the performance of the Fund.
Profitability
The Trustees reviewed the Investment Adviser’s revenues and pre-tax profit margins with respect to the Trust and the Fund. In this regard the Trustees noted that they had received, among other things, profitability analyses and summaries, revenue and expense schedules by Fund and by function (i.e., investment management, transfer agency and distribution and service), and information on the Investment Adviser’s expense allocation methodology. They observed that the profitability and expense figures are substantially similar to those used by the Investment Adviser for many internal purposes, including compensation decisions among various business groups, and are thus subject to a vigorous internal debate about how certain revenue and expenses should be allocated. The Trustees also noted that the internal audit group within the Goldman Sachs organization had audited the expense allocation methodology and was satisfied with the reasonableness, consistency, and accuracy of the Investment Adviser’s expense allocation methodology and profitability analysis calculations. Profitability data for the Trust and the Fund were provided for 2015 and 2014, and the Trustees considered this information in relation to the Investment Adviser’s overall profitability. The Trustees considered the Investment Adviser’s revenues and pre-tax profit margins both in absolute terms and in comparison to information on the reported pre-tax profit margins earned by certain other asset management firms.
26
GOLDMAN SACHS VARIABLE INSURANCE TRUST U.S. EQUITY INSIGHTS FUND
Statement Regarding Basis for Approval of Management Agreement (Unaudited) (continued)
Economies of Scale
The Trustees considered the information that had been provided regarding the Investment Adviser’s profitability. The Trustees also considered the breakpoints in the fee rate payable under the Management Agreement for the Fund at the following annual percentage rates of the average daily net assets of the Fund:
| First $1 billion | 0.62 | % | ||
| Next $1 billion | 0.59 | |||
| Next $3 billion | 0.56 | |||
| Next $3 billion | 0.55 | |||
| Over $8 billion | 0.54 |
The Trustees noted that the breakpoints were designed to share potential economies of scale, if any, with the Fund and its shareholders as assets under management reach those asset levels. The Trustees considered the amounts of assets in the Fund; the Fund’s recent share purchase and redemption activity; the information provided by the Investment Adviser relating to the costs of the services provided by the Investment Adviser and its affiliates and their realized profits; information comparing fee rates charged by the Investment Adviser with fee rates charged to other funds in the peer group; and the Investment Adviser’s undertaking to limit certain expenses of the Fund that exceed a specified level and Goldman Sachs’ undertaking to waive a portion of the distribution and service fees paid by the Fund’s Service Shares. Upon reviewing these matters at the Annual Meeting, the Trustees concluded that the fee breakpoints represented a means of assuring that benefits of scalability, if any, would be passed along to shareholders at the specified asset levels.
Other Benefits to the Investment Adviser and Its Affiliates
The Trustees also considered the other benefits derived by the Investment Adviser and its affiliates from their relationships with the Fund as stated above, including: (a) transfer agency fees received by Goldman Sachs; (b) brokerage and futures commissions earned by Goldman Sachs for executing securities and futures transactions on behalf of the Fund; (c) trading efficiencies resulting from aggregation of orders of the Fund with those for other funds or accounts managed by the Investment Adviser; (d) fees earned by Goldman Sachs Agency Lending (“GSAL”), an affiliate of the Investment Adviser, as securities lending agent (and fees earned by the Investment Adviser for managing the fund in which the Fund’s cash collateral is invested); (e) the Investment Adviser’s ability to leverage the infrastructure designed to service the Fund on behalf of its other clients; (f) the Investment Adviser’s ability to cross-market other products and services to Fund shareholders; (g) Goldman Sachs’ retention of certain fees as Fund Distributor; (h) the Investment Adviser’s ability to negotiate better pricing with custodians on behalf of its other clients, as a result of the relationship with the Fund; and (i) the possibility that the working relationship between the Investment Adviser and the Fund’s third-party service providers may cause those service providers to be more likely to do business with other areas of Goldman Sachs. In the course of considering the foregoing, the Independent Trustees requested and received further information quantifying certain of these fall-out benefits.
Other Benefits to the Fund and Its Shareholders
The Trustees also noted that the Fund receives certain potential benefits as a result of its relationship with the Investment Adviser, including: (a) trading efficiencies resulting from aggregation of orders of the Fund with those of other funds or accounts managed by the Investment Adviser; (b) enhanced servicing from vendors because of the volume of business generated by the Investment Adviser and its affiliates; (c) enhanced servicing from broker-dealers because of the volume of business generated by the Investment Adviser and its affiliates; (d) the Investment Adviser’s ability to negotiate favorable terms with derivatives counterparties on behalf of the Fund as a result of the size and reputation of the Goldman Sachs organization; (e) the Investment Adviser’s knowledge and experience gained from managing other accounts and products; (f) the Investment Adviser’s ability to hire and retain qualified personnel to provide services to the Fund because of the reputation of the Goldman Sachs organization; (g) the Fund’s access, through the Investment Adviser, to certain firmwide resources (e.g., proprietary risk management systems and databases), subject to certain restrictions; (h) the Fund’s ability to participate in the securities lending program administered by GSAL, as measured by the revenue received by the Fund in connection with the program; and (i) the Fund’s access to certain affiliated distribution channels. In addition, the Trustees noted the competitive nature of the mutual fund marketplace, and considered that many of the Fund’s shareholders invested in the Fund in part because of the Fund’s relationship with the Investment Adviser and that those shareholders have a general expectation that the relationship will continue.
27
GOLDMAN SACHS VARIABLE INSURANCE TRUST U.S. EQUITY INSIGHTS FUND
Statement Regarding Basis for Approval of Management Agreement (Unaudited) (continued)
Conclusion
In connection with their consideration of the Management Agreement, the Trustees gave weight to each of the factors described above, but did not identify any particular factor as controlling their decision. After deliberation and consideration of all of the information provided, including the factors described above, the Trustees concluded, in the exercise of their business judgment, that the management fees paid by the Fund were reasonable in light of the services provided to it by the Investment Adviser, the Investment Adviser’s costs and the Fund’s current and reasonably foreseeable asset levels. The Trustees unanimously concluded that the Investment Adviser’s continued management likely would benefit the Fund and its shareholders and that the Management Agreement should be approved and continued with respect to the Fund until June 30, 2017.
28
| TRUSTEES | OFFICERS | |
| Ashok N. Bakhru, Chairman | James A. McNamara, President | |
| Kathryn A. Cassidy | Scott M. McHugh, Principal Financial Officer, | |
| Diana M. Daniels | Senior Vice President and Treasurer | |
| Herbert J. Markley | Caroline L. Kraus, Secretary | |
| James A. McNamara | ||
| Jessica Palmer | ||
| Alan A. Shuch | ||
| Roy W. Templin | ||
| Gregory G. Weaver |
GOLDMAN, SACHS & CO.
Distributor and Transfer Agent
GOLDMAN SACHS ASSET MANAGEMENT, L.P.
Investment Adviser
200 West Street, New York
New York 10282
Visit our web site at www.GSAMFUNDS.com to obtain the most recent month-end returns.
The reports concerning the Fund included in this shareholder report may contain certain forward-looking statements about the factors that may affect the performance of the Fund in the future. These statements are based on Fund management’s predictions and expectations concerning certain future events and their expected impact on the Fund, such as performance of the economy as a whole and of specific industry sectors, changes in the levels of interest rates, the impact of developing world events, and other factors that may influence the future performance of the Fund. Management believes these forward-looking statements to be reasonable, although they are inherently uncertain and difficult to predict. Actual events may cause adjustments in portfolio management strategies from those currently expected to be employed.
A description of the policies and procedures that the Fund uses to determine how to vote proxies relating to portfolio securities and information regarding how the Fund voted proxies relating to portfolio securities for the 12-month period ended June 30 is available (i) without charge, upon request by calling 1-800-621-2550; and (ii) on the Securities and Exchange Commission (“SEC”) web site at http://www.sec.gov.
The Fund files its complete schedule of portfolio holdings with the SEC for the first and third quarters of each fiscal year on Form N-Q. The Fund’s Form N-Qs are available on the SEC’s web site at http://www.sec.gov within 60 days after the Fund’s first and third fiscal quarters. The Fund’s Form N-Qs may be reviewed and copied at the SEC’s Public Reference Room in Washington, D.C. and information on the operation of the Public Reference Room may also be obtained by calling 1-800-SEC-0330. Form N-Qs may be obtained upon request and without charge by calling 1-800-621-2550.
The website links provided are for your convenience only and are not an endorsement or recommendation by GSAM of any of these websites or the products or services offered. GSAM is not responsible for the accuracy and validity of the content of these websites.
Fund holdings and allocations shown are as of June 30, 2016 and may not be representative of future investments. Fund holdings should not be relied on in making investment decisions and should not be construed as research or investment advice regarding particular securities. Current and future holdings are subject to risk.
References to indices, benchmarks or other measures of relative market performance over a specified period of time are provided for your information only and do not imply that the portfolio will achieve similar results. The index composition may not reflect the manner in which a portfolio is constructed. While an adviser seeks to design a portfolio which reflects appropriate risk and return features, portfolio characteristics may deviate from those of the benchmark.
The Global Industry Classification Standard (“GICS”) was developed by and is the exclusive property and a service mark of Morgan Stanley Capital International Inc. (“MSCI”) and Standard & Poor’s, a division of The McGraw-Hill Companies, Inc. (“S&P”) and is licensed for use by Goldman Sachs. Neither MSCI, S&P nor any other party involved in making or compiling the GICS or any GICS classifications makes any express or implied warranties or representations with respect to such standard or classification (or the results to be obtained by the use thereof), and all such parties hereby expressly disclaim all warranties of originality, accuracy, completeness, merchantability or fitness for a particular purpose with respect to any of such standard or classification. Without limiting any of the foregoing, in no event shall MSCI, S&P, any of their affiliates or any third party involved in making or compiling the GICS or any GICS classifications have any liability for any direct, indirect, special, punitive, consequential or any other damages (including lost profits) even if notified of the possibility of such damages.
The portfolio risk management process includes an effort to monitor and manage risk, but does not imply low risk.
Shares of the Goldman Sachs VIT Funds are offered to separate accounts of participating life insurance companies for the purpose of funding variable annuity contracts and variable life insurance policies. Shares of the Fund are not offered directly to the general public. The variable annuity contracts and variable life insurance policies are described in the separate prospectuses issued by participating insurance companies. You should refer to those prospectuses for information about surrender charges, mortality and expense risk fees and other charges that may be assessed by participating insurance companies under the variable annuity contracts or variable life insurance policies. Such fees or charges, if any, may affect the return you may realize with respect to your investments. Ask your representative for more complete information. Please consider a fund’s objectives, risks and charges and expenses, and read the prospectus carefully before investing. The prospectus contains this and other information about the Fund.
This material is not authorized for distribution to prospective investors unless preceded or accompanied by a current Prospectus or summary prospectus, if applicable. Investors should consider a Fund’s objective, risks, and charges and expenses, and read the summary prospectus, if available, and/or the Prospectus carefully before investing or sending money. The summary prospectus, if available, and the Prospectus contain this and other information about a Fund and may be obtained from your Authorized Institution or from Goldman, Sachs & Co. by calling 1-800-621-2550.
This report is prepared for the general information of contract owners and is not an offer of shares of the Goldman Sachs Variable Insurance Trust: Goldman Sachs U.S. Equity Insights Fund.
Goldman, Sachs & Co. is the distributor of the Goldman Sachs Funds and the Goldman Sachs Variable Insurance Trust Funds.
© 2016 Goldman Sachs. All rights reserved.
VITUSSAR-16/58895-TMPL-08/2016/8.5K
| ITEM 2. | CODE OF ETHICS. |
| (a) | As of the end of the period covered by this report, the registrant has adopted a code of ethics that applies to the registrant’s principal executive officer, principal financial officer, principal accounting officer or controller, or persons performing similar functions, regardless of whether these individuals are employed by the registrant or a third party (the “Code of Ethics”). |
| (b) | During the period covered by this report, no amendments were made to the provisions of the Code of Ethics. |
| (c) | During the period covered by this report, the registrant did not grant any waivers, including an implicit waiver, from any provision of the Code of Ethics. |
| (d) | A copy of the Code of Ethics is available as provided in Item 12(a)(1) of this report. |
| ITEM 3. | AUDIT COMMITTEE FINANCIAL EXPERT. |
| The registrant’s board of trustees has determined that the registrant has at least one “audit committee financial expert” (as defined in Item 3 of Form N-CSR) serving on its audit committee. Gregory G. Weaver is the “audit committee financial expert” and is “independent” (as each term is defined in Item 3 of Form N-CSR). |
| ITEM 4. | PRINCIPAL ACCOUNTANT FEES AND SERVICES. |
| Not applicable for the reporting period. The information required by this Item is only required in an annual report on this Form N-CSR. |
| ITEM 5. | AUDIT COMMITTEE OF LISTED REGISTRANTS. |
Not applicable.
| ITEM 6. | SCHEDULE OF INVESTMENTS |
Schedule of Investments is included as part of the Reports to Shareholders filed under Item 1.
| ITEM 7. | DISCLOSURE OF PROXY VOTING POLICIES AND PROCEDURES FOR CLOSED-END MANAGEMENT INVESTMENT COMPANIES. |
Not applicable.
| ITEM 8. | PORTFOLIO MANAGERS OF CLOSED-END MANAGEMENT INVESTMENT COMPANIES |
Not applicable.
| ITEM 9. | PURCHASES OF EQUITY SECURITIES BY CLOSED-END MANAGEMENT INVESTMENT COMPANY AND AFFILIATED PURCHASERS |
Not applicable.
| ITEM 10. | SUBMISSION OF MATTERS TO A VOTE OF SECURITY HOLDERS. |
There have been no material changes to the procedures by which shareholders may recommend nominees to the registrant’s board of trustees.
| ITEM 11. | CONTROLS AND PROCEDURES. |
| (a) | The registrant’s principal executive and principal financial officers or persons performing similar functions have concluded that the registrant’s disclosure controls and procedures (as defined in Rule 30a-3(c) under the Investment Company Act of 1940, as amended (the “1940 Act”)) are effective as of a date within 90 days of the filing date of this report that includes the disclosure required by this paragraph, based on the evaluation of these controls and procedures required by Rule 30a-3(b) under the 1940 Act and 15d-15(b) under the Securities Exchange Act of 1934, as amended. |
| (b) | There were no changes in the registrant’s internal control over financial reporting (as defined in Rule 30a-3(d) under the 1940 Act) that occurred during the registrant’s second fiscal quarter of the period covered by this report that has materially affected, or is reasonably likely to materially affect the registrant’s internal control over financial reporting. |
| ITEM 12. | EXHIBITS. |
| (a)(1) | Goldman Sachs Variable Insurance Trust’s Code of Ethics for Principal Executive and Senior Financial Officers is incorporated by reference to Exhibit 12(a)(1) of the registrant’s Form N-CSR filed on February 27, 2015. | |||
| (a)(2) | Exhibit 99.CERT | Certifications pursuant to Section 302 of the Sarbanes-Oxley Act of 2002 filed herewith | ||
| Exhibit 99.906CERT | Certifications pursuant to Section 906 of the Sarbanes-Oxley Act of 2002 filed herewith | |||
SIGNATURES
Pursuant to the requirements of the Securities Exchange Act of 1934 and the Investment Company Act of 1940, the registrant has duly caused this report to be signed on its behalf by the undersigned, thereunto duly authorized.
Goldman Sachs Variable Insurance Trust
/s/ James A. McNamara | ||
By: James A. McNamara | ||
Chief Executive Officer of | ||
Goldman Sachs Variable Insurance Trust | ||
Date: August 26, 2016 | ||
Pursuant to the requirements of the Securities Exchange Act of 1934 and the Investment Company Act of 1940, the report has been signed below by the following persons on behalf of the registrant and in the capacities and on the dates indicated.
/s/ James A. McNamara | ||
By: James A. McNamara | ||
Chief Executive Officer of | ||
Goldman Sachs Variable Insurance Trust | ||
Date: August 26, 2016 | ||
/s/ Scott McHugh | ||
By: Scott McHugh | ||
Principal Financial Officer of | ||
Goldman Sachs Variable Insurance Trust | ||
Date: August 26, 2016 | ||