Table of Contents
FORM 6-K
SECURITIES AND EXCHANGE COMMISSION
Report of Foreign Issuer
Pursuant to Rule 13a-16 or 15d-16 of
the Securities Exchange Act of 1934
For the month of June 2004
LEICA GEOSYSTEMS FINANCE PLC
Davy Avenue, Knowlhill
Milton Keynes, MK5 8LB
England
(Exact name of registrant and address of principal executive offices)
[Indicate by check mark whether the registrant files or will file annual reports under cover Form 20-F or Form 40-F.]
| Form 20-F þ | Form 40-F o |
[Indicate by check mark whether the registrant by furnishing the information contained in this Form is also thereby furnishing the information to the Commission pursuant to Rule 12g3-2(b) under the Securities Exchange Act of 1934.]
| Yes o | No þ |
[If “Yes” is marked, indicate below the file number assigned to the registrant in connection with Rule 12g3-2(b):]
Enclosure: Press Release dated June 10, 2004
Table of Contents
SIGNATURES
Pursuant to the requirements of the Securities Exchange Act of 1934, the registrant has duly caused this report to be signed on its behalf by the undersigned, thereunto duly authorized.
| LEICA GEOSYSTEMS FINANCE PLC | ||||
| Date: 14 June, 2004 | By: | /s/ Christian Leu Name: Christian Leu Title: Chief Financial Officer | ||
Contents
| 1 | ||||
| 2 | ||||
| 4 | ||||
| 5 | ||||
| 8 | ||||
| 9 | ||||
| 9 | ||||
| 15 |
Leica Geosystems’ Shareholder News
Issue 15 — Heerbrugg, Switzerland, 10 June 2004
Fourth Quarter and Full Year — Fiscal Year 2004
At a Glance
FOURTH QUARTER FISCAL YEAR 2004
| • | Sales grew by 7.8% to CHF 184.9 million in the fourth quarter, led by robust sales growth of 12.7 % in Surveying & Engineering on the back of new product launches; | |||
| • | Gross profit margins increased to 51.5%, significantly above 48.8% in the prior year; | |||
| • | Net income jumped to CHF 1.7 million in the fourth quarter compared with a net loss of CHF (4.2) million from continuing operations in the previous year; | |||
FULL FISCAL YEAR 2004
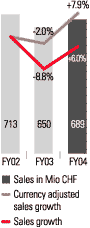
| • | Full year sales from continuing operations increased by 6% to CHF 689.1 million, and by 7.9% in local currency; | |||
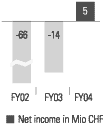
| • | Full year net income increased by CHF 19.0 million, rising to CHF 5.2 million, compared with a net loss of CHF (13.7) million from continuing operations in the previous year; | |||
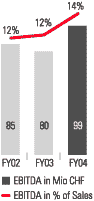
| • | Full year EBITDA from continuing operations rose by 23% to CHF 98.7 million, or 14.3% of sales, up from CHF 80.3 million, or 12.3% of sales, in the previous year. | |||
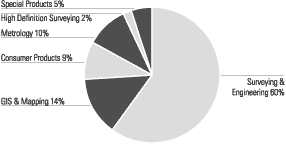
Sales by Division in Fiscal Year 2004
Sales
Fiscal Year 2004 closed on a very positive note, as momentum from our new product releases had a favorable impact on order intake, and pushed sales to CHF 184.9 million. Sales growth was 7.8% in the quarter, fueled by a robust 12.7% growth in Surveying & Engineering. In addition to strong European sales and double-digit growth in the Americas, S&E revenue was also bolstered by shipments of our new flagship product — the System 1200, which began shipping in the final weeks of the quarter. In our other divisions, fourth quarter sales rose by 5.9% in Metrology and by 4.6% in Consumer Products. In GIS & Mapping, Swiss franc revenues declined in comparison with the previous year but grew by 1.3% in local currencies. In the High Definition Surveying (formerly Cyra) division, sales declined by (7.2%) in advance of shipments of its new HDS products. At the end of the fourth

Table of Contents
Financial Overview
quarter, however, the division had an order backlog of over three months, from which it started shipping in quarter one.
For the full year, sales from continuing operations grew by 6%, rising to CHF 689.1 million; sales growth in local currencies was 7.9%. Full year revenues advanced by 6.5% in Surveying & Engineering, 15.9% in Consumer Products, and 11.8% in Metrology, while sales in the GIS & Mapping and HDS divisions fell below the previous year due to the lower US dollar and the phase-out of older generation products, respectively.
Solid sales growth (continuing operations) in Fiscal Year 2004
Rise in Fourth Quarter Gross Profit Margins
Gross profit margins reached 51.5% in the fourth quarter, well above the third quarter, and significantly above the prior year level of 48.8%. As expected, margins benefited from the impact of new products and higher software content in the quarterly sales mix. For the full year, consolidated gross margins held steady, closing at 51.2%.
Operating Expenses Increase with Product Launches
As expected, in conjunction with our product release activities, operating costs from continuing operations increased both sequentially and year-over-year. Marketing and selling costs increased by CHF 4.6 million as a result of extensive new product road shows and trade exhibitions during the quarter. Net research and development costs, which amounted to 10.8% of sales in the fourth quarter, also increased over the previous year. Marginally higher cash expenditures and amortization costs, combined with a momentary lull in development cost capitalization after several product releases, pushed costs higher. General and administrative costs also increased, partially as a result of the consolidation of Tritronics in the fourth quarter. For the full year, we lowered overall operating expenses, as well as the ratio of operating expenses to sales, which fell from 50.3% to 47.1%.
Increases in EBIT and Net Income
We recorded EBIT from continuing operations of CHF 6.3 million in the fourth quarter compared with CHF 4.2 million in the previous year. Higher sales, combined with improved margins and significantly higher earnings from associated companies positively impacted earnings. Higher operating expenses in the quarter partially offset this increase. EBITDA from continuing operations declined to CHF 24.0 million, or 13.0% of sales, in the fourth quarter, compared with CHF 28.1 million, or 16.4% in the previous year.
Growth in EBITA margin (continuing operations)
As mentioned above, costs associated with our fourth quarter product launches had an unfavorable impact on earnings.
Net income from continuing operations, on the other hand, increased to CHF 1.7 million in the fourth quarter, compared with a net loss of CHF (4.2) million from continuing operations in the previous year. This result represents the fourth consecutive quarter of positive net income. Fourth quarter net income improved through the combination of lower tax and finance expenses. Specifically, tax costs fell to CHF 0.02 million in the quarter compared with CHF 2.3 million from continued operations in the previous year. Tax costs were lower as a result of the favorable distribution of earnings within our various tax jurisdictions. Finance charges declined to CHF 4.7 million in quarter four, compared with CHF 6.1 million in the previous year. Favorable interest rates, coupled with lower debt levels, resulted in a CHF 0.6 million decline in cash interest costs. Additionally, exchange losses on non-Swiss franc debt were lower by CHF 0.8 million in comparison with the previous year.
Significant increase in net income
For the full year, EBIT from continuing operations rose to CHF 29.5 million, up from CHF 7.3 million in the previous year. EBITDA from continuing operations also grew significantly, rising to CHF 98.7 million, or 14.3% of sales, compared with CHF 80.3 million, or 12.3% of sales, in the
2
Table of Contents
Financial Overview
previous year. Net income from continuing operations increased to CHF 5.2 million, a material improvement over the net loss of CHF (13.7) million in the previous year (continuing operations).
Results at a glance
| Fourth Quarter | (In million CHF) | Full Fiscal Year | ||||||||||||||||||||||
| Prior | Current | Current | Prior | |||||||||||||||||||||
| year | year | year | year | |||||||||||||||||||||
| Changes | (28.12.02 to | (27.12.03 to | (01.04.03 to | (01.04.02 to | Changes | |||||||||||||||||||
| (%) | 31.03.03) | 31.03.04) | 31.03.04) | 31.03.03) | (%) | |||||||||||||||||||
| 35.9 | % | 137.8 | 187.3 | ORDER INTAKE— Continuing operations | 705.9 | 655.3 | 7.7 | % | ||||||||||||||||
| 7.8 | % | 171.6 | 184.9 | SALES— Continuing operations | 689.1 | 650.4 | 6.0 | % | ||||||||||||||||
| 12.7 | % | 101.5 | 114.4 | Surveying & Engineering | 423.4 | 397.5 | 6.5 | % | ||||||||||||||||
| –3.3 | % | 26.6 | 25.7 | GIS & Mapping | 94.9 | 100.7 | –5.8 | % | ||||||||||||||||
| 4.6 | % | 16.5 | 17.3 | Consumer Products (Disto) | 58.6 | 50.6 | 15.9 | % | ||||||||||||||||
| 5.9 | % | 16.0 | 16.9 | Metrology | 66.4 | 59.4 | 11.8 | % | ||||||||||||||||
| –7.2 | % | 3.5 | 3.2 | High-Definition Surveying (HDS) | 12.8 | 13.5 | –5.4 | % | ||||||||||||||||
| 0.0 | % | 7.4 | 7.4 | Special Products — Continuing operations | 33.0 | 27.0 | 22.3 | % | ||||||||||||||||
| — | 0.1 | 0.0 | Central Services | 0.0 | 1.7 | — | ||||||||||||||||||
Gross margin(Continuing operations) | ||||||||||||||||||||||||
| 2.6 | % | 48.8 | % | 51.5 | % | in percentage of sales | 51.2 | % | 51.7 | % | –0.5 | % | ||||||||||||
EARNINGS | ||||||||||||||||||||||||
| –14.7 | % | 28.1 | 24.0 | EBITDA— Continuing operations | 98.7 | 80.3 | 22.9 | % | ||||||||||||||||
| 16.4 | % | 13.0 | % | - in percentage of sales | 14.3 | % | 12.3 | % | ||||||||||||||||
| –13.6 | % | 22.4 | 19.4 | EBITA— Continuing operations | 80.7 | 60.3 | 33.7 | % | ||||||||||||||||
| 13.1 | % | 10.5 | % | - in percentage of sales | 11.7 | % | 9.3 | % | ||||||||||||||||
| 50.0 | % | 4.2 | 6.3 | EBIT— Continuing operations | 29.5 | 7.3 | 303.6 | % | ||||||||||||||||
| 2.5 | % | 3.4 | % | - in percentage of sales | 4.3 | % | 1.1 | % | ||||||||||||||||
| –16.7 | % | 6.8 | 5.6 | Operating profit/(loss)— Contin. operat. | 27.8 | 9.8 | 183.7 | % | ||||||||||||||||
| 3.9 | % | 3.0 | % | - in percentage of sales | 4.0 | % | 1.5 | % | ||||||||||||||||
| 140.5 | % | (4.2 | ) | 1.7 | Net income /(loss)—Contin. operat. | 5.2 | (13.7 | ) | 137.7 | % | ||||||||||||||
| –2.4 | % | 0.9 | % | - in percentage of sales | 0.8 | % | –2.1 | % | ||||||||||||||||
| –85.5 | % | 15.1 | 2.2 | Net income /(loss) | 5.6 | 21.9 | –74.3 | % | ||||||||||||||||
| 8.6 | % | 1.2 | % | - in percentage of sales | 0.8 | % | 3.0 | % | ||||||||||||||||
Earnings per share (CHF) | ||||||||||||||||||||||||
| –85.7 | % | 6.82 | 0.97 | - basic | 2.54 | 9.80 | –74.1 | % | ||||||||||||||||
| –86.1 | % | 6.82 | 0.95 | - diluted | 2.48 | 9.78 | –74.6 | % | ||||||||||||||||
Cash earnings per share (CHF) | ||||||||||||||||||||||||
| –31.7 | % | 17.52 | 11.96 | - basic | 35.36 | 40.71 | –13.1 | % | ||||||||||||||||
| –33.6 | % | 17.52 | 11.63 | - diluted | 34.62 | 40.71 | –15.0 | % | ||||||||||||||||
| –3.9 | % | 23.64 | 24.55 | - non-cash adjustment | 72.89 | 68.04 | 7.1 | % | ||||||||||||||||
Currency Exposure
We have a net exposure to foreign currency movements in the range of CHF 122.2 million, of which approximately 10% is in US Dollars, 58% in Euro, and the balance in other currencies. Our corporate policy is to hedge a minimum of 40% of any net exposure twelve months forward. At the end of the fourth quarter, we had hedged approximately 80% of this net exposure for the coming twelve months. Our balance sheet is also exposed to movements in exchange rates. In particular, a material amount of our intangible assets and working capital are in US Dollars. Net translation adjustments to equity in the fourth quarter were a positive CHF 2.5 million. For Fiscal Year 2004 as a whole, translation adjustments reduced equity by CHF 5.5 million, compared to a reduction of CHF 33.0 million in Fiscal Year 2003.
3
Table of Contents
Financial Overview
| FY04 | FY04 | FY04 | FY04 | FY03 | ||||||||||||||||
| Balance Sheet Summary * | March 31, | Dec. 26, | Sep. 26, | June 27, | March 31, | |||||||||||||||
| (Amounts in million CHF) | 2004 | 2003 | 2003 | 2003 | 2003 | |||||||||||||||
| Net Working Capital | 121.1 | 109.3 | 125.6 | 128.2 | 112.1 | |||||||||||||||
| Net Working Capital % of Sales | 16.4 | % | 15.7 | % | 19.2 | % | 19.3 | % | 16.0 | % | ||||||||||
| Total Assets | 683.6 | 685.2 | 688.1 | 693.1 | 683.1 | |||||||||||||||
| Net Debt ** | 152.0 | 150.3 | 159.6 | 166.5 | 154.0 | |||||||||||||||
| Total Equity | 319.0 | 312.0 | 314.7 | 312.3 | 313.6 | |||||||||||||||
| Equity / Asset Ratio | 46.7 | % | 45.5 | % | 45.7 | % | 45.1 | % | 45.9 | % | ||||||||||
| Capital Expenditures on Tangible and Intangible Assets | 11.7 | 16.3 | 15.3 | 11.8 | 17.2 | |||||||||||||||
| Goodwill | 175.0 | 174.0 | 168.3 | 172.5 | 177.5 | |||||||||||||||
| Cash provided from operating activities | 6.1 | 28.5 | 18.0 | 7.1 | 27.4 | |||||||||||||||
| *) | Balance Sheet as of March 31, 2003 reflects the impact of the divestments of Wiltronic and Leica Vectronix. | |||
| **) | Q4 FY04 amount is shown net of cash of CHF 1.0 million and capitalized debt issue cost/discounts of CHF 3.1 million. | |||
Balance Sheet and Cash Flow
Net Working Capital was CHF 121.1 million, or 16.4% of sales, at the end of the fourth quarter, an increase of CHF 11.9 million over quarter three. Although higher than in the third quarter, net working capital is in line with our mid-term target ratio of 16% of sales. Net working capital rose primarily as a result of higher year-end trade receivables, which increased in conjunction with the rise in fourth quarter sales. Despite the increase in the absolute level of trade receivables, Days Sales Outstanding declined by six days down to 63. Inventory was unchanged from third quarter levels despite the numerous product transitions during the fourth quarter. Accounts payable decreased with the payment of a large tax liability on the previous year’s divestment gain.
We generated CHF 6.1 million in operating cash flow for the quarter compared with CHF 27.4 million in the previous year. Operating cash flow declined as a result of higher working capital and taxes paid during the quarter. For the full year, we generated operating cash flow of CHF 59.7 million compared with CHF 59.1 million in the previous year.
We had negative free cash flow of CHF (1.5) million in the fourth quarter after investments of CHF 11.7 million in capital expenditures and CHF 4.4 million for the acquisition of Van Hopplynus (see separate note in the attached financial statements), offset by sale proceeds of CHF 8.5 million from divestments in the quarter. Comparable free cash flow in the previous year was CHF 13.8 million.
We remain solidly financed, with net debt of CHF 152.0 million at the end of fourth quarter, representing a ratio to equity of 47.9%.

Stable Net Working Capital ratio to Sales in Q4
4
Table of Contents
Divisional Results
Divisional Performance
Surveying & Engineering Division
| Fourth Quarter | Sales and results (In million CHF) | Full Fiscal Year | ||||||||||||||||||||||||||||||
| Change | Prior | Current | Current | Prior | Change | |||||||||||||||||||||||||||
| (%) | (mCHF) | year | year | year | year | (mCHF) | (%) | |||||||||||||||||||||||||
| 12.7 | % | 12.9 | 101.5 | 114.4 | SALES | 423.4 | 397.5 | 25.9 | 6.5 | % | ||||||||||||||||||||||
| –11.0 | % | –1.7 | 15.1 | 13.4 | EBIT | 57.9 | 53.2 | 4.8 | 9.0 | % | ||||||||||||||||||||||
| –5.7 | % | –1.1 | 19.9 | 18.8 | EBITDA | 78.2 | 69.5 | 8.8 | 12.6 | % | ||||||||||||||||||||||
| –3.2 pts. | — | 19.6 | % | 16.4 | % | EBITDA Margin | 18.5 | % | 17.5 | % | — | 1.0 pts. | ||||||||||||||||||||
Surveying and Engineering recorded sales of CHF 114.4 million in the fourth quarter, the highest quarterly sales performance since the first quarter of Fiscal Year 2001. Sales growth was 12.7% for the quarter, with solid performance in all market segments and regions, particularly in Europe and the United States. Demand was also robust for our new System 1200 launch, which the division started shipping in the last two weeks of March. The quarter ended with a solid order book for these products. EBITDA in quarter four was CHF 18.8 million, or 16.4% of sales, down from CHF 19.9 million in the previous year. Marketing and Selling costs incurred in conjunction product launches impacted earnings in the quarter.
For the full year, sales rose by 6.5% to CHF 423.4 million. In local currency, full year sales increased by 7.4% over the previous year. EBITDA increased to CHF 78.2 million, or 18.5% of sales, compared with 17.5% in the previous year.
GIS& Mapping Division
| Fourth Quarter | Sales and results (In million CHF) | Full Fiscal Year | |||||||||||||||||||||||||||||||
| Change | Prior | Current | Current | Prior | Change | ||||||||||||||||||||||||||||
| (%) | (mCHF) | year | year | year | year | (mCHF) | (%) | ||||||||||||||||||||||||||
| –3.4 | % | –0.9 | 26.6 | 25.7 | SALES | 94.9 | 100.7 | –5.8 | –5.8 | % | |||||||||||||||||||||||
| 151.7 | % | 3.2 | –2.1 | 1.1 | EBIT | –3.5 | –10.4 | 6.8 | 65.9 | % | |||||||||||||||||||||||
| –6.4 | % | –0.3 | 5.0 | 4.7 | EBITDA | 10.3 | 8.2 | 2.1 | 25.3 | % | |||||||||||||||||||||||
| –0.6 pts | — | 18.8 | % | 18.2 | % | EBITDA Margin | 10.8 | % | 8.2 | % | — | 2.6 pts | |||||||||||||||||||||
Fourth quarter sales in GIS & Mapping declined by (3.4%) against the previous year, but rose by 1.3% in local currencies. Local currency sales were bolstered by strong demand for the division’s imaging software and customized software solutions, as well as the new Leica Photogrammetry Suite and ALS 50 product. Sales for other hardware sensors declined against the previous year, which reflects the rather lumpy nature of sensor revenues between quarters. Fourth quarter EBITDA rose to 18.2% of sales in the fourth quarter, significantly above the third quarter but lower against the previous year. Software revenues in the quarter positively impacted EBITDA.
For the full year, sales declined by 5.8% against the previous year, but rose by 1.1% in local currencies. EBITDA grew 25.3% over the previous year, with a full year margin of 10.8% compared with 8.2% in Fiscal Year 2003.
5
Table of Contents
Divisional Results
Consumer Products Division
| Fourth Quarter | Sales and results (In million CHF) | Full Fiscal Year | |||||||||||||||||||||||||||||||
| Change | Prior | Current | Current | Prior | Change | ||||||||||||||||||||||||||||
| (%) | (mCHF) | year | year | year | year | (mCHF) | (%) | ||||||||||||||||||||||||||
| 4.3 | % | 0.7 | 16.5 | 17.3 | SALES | 58.6 | 50.6 | 8.1 | 15.9 | % | |||||||||||||||||||||||
| 780.1 | % | 2.1 | 0.3 | 2.4 | EBIT | 3.4 | 1.2 | 2.3 | 196.6 | % | |||||||||||||||||||||||
| 116.8 | % | 1.9 | 1.6 | 3.5 | EBITDA | 8.5 | 6.0 | 2.5 | 41.6 | % | |||||||||||||||||||||||
| 10.4 pts | — | 9.7 | % | 20.1 | % | EBITDA Margin | 14.4 | % | 11.8 | % | — | 2.6 pts | |||||||||||||||||||||
Consumer Products sales were CHF 17.3 million in the fourth quarter, an increase of 4.3% above the previous year. Currency-adjusted sales growth was 1.2%, reflecting the impact of a stronger Euro against the Swiss franc. Demand in the division’s European and Asian markets remained steady in the fourth quarter, offset by slightly lower demand in North America. Although not yet a material component in this quarter’s revenue stream, the new DISTOTM plus received an enthusiastic response from the professional markets following its release at the end of the quarter. In terms of earnings, the division’s EBITDA margin increased to 20.1% of sales in the fourth quarter. A favorable sales mix and lower production costs were responsible for the rise in EBITDA.
For the full year, sales increased by 15.9% over Fiscal Year 2003. EBITDA also improved significantly, with the full year margin reaching 14.4% compared with 11.8% in the previous year.
Metrology Division
| Fourth Quarter | Sales and results (In million CHF) | Full Fiscal Year | |||||||||||||||||||||||||||||||
| Change | Prior | Current | Current | Prior | Change | ||||||||||||||||||||||||||||
| (%) | (mCHF) | year | year | year | year | (mCHF) | (%) | ||||||||||||||||||||||||||
| 5.9 | % | 0.9 | 16.0 | 16.9 | SALES | 66.4 | 59.4 | 7.0 | 11.9 | % | |||||||||||||||||||||||
| –151.2 | % | –1.1 | 0.7 | –0.4 | EBIT | 5.4 | 5.9 | –0.5 | –9.1 | % | |||||||||||||||||||||||
| –58.9 | % | –2.7 | 4.5 | 1.9 | EBITDA | 12.6 | 13.1 | –0.5 | –4.2 | % | |||||||||||||||||||||||
| –17.3 pts | — | 28.3 | % | 11.0 | % | EBITDA Margin | 18.9 | % | 22.1 | % | — | 3.2 pts | |||||||||||||||||||||
Metrology recorded sales of CHF 16.9 million in the fourth quarter, an increase of 5.9% over the previous year. Sales grew by 5.8% on a currency-adjusted basis. Metrology sales benefited from a strong market position in Europe, combined with significant growth in the Americas region, where the division continued to make inroads in the automotive sector. Metrology’s new Local Positioning Technology product basket, based on its new LTD 800 Laser Tracker, also sparked sales in advance of the release of the new T-Products. EBITDA for the quarter was significantly lower than the previous year. The combination of higher marketing, selling and product development costs negatively impacted earnings. The division expects earnings to be below their normal run-rate for the next two quarters, while it completes work on several development projects and product introductions.
For the full year, sales increased by 11.9%, and by 15.2% in local currency. The division’s EBITDA margin declined to 18.9%, more in line with sustainable levels than the previous year.
6
Table of Contents
Divisional Results
High Definition Surveying (HDS) Division
| Fourth Quarter | Sales and results (In million CHF) | Full Fiscal Year | ||||||||||||||||||||||||||||||
| Change | Prior | Current | Current | Prior | Change | |||||||||||||||||||||||||||
| (%) | (mCHF) | year | year | year | year | (mCHF) | (%) | |||||||||||||||||||||||||
| –6.7 | % | –0.2 | 3.5 | 3.2 | SALES | 12.8 | 13.5 | –0.8 | –5.6 | % | ||||||||||||||||||||||
| –7.3 | % | –0.4 | –4.9 | –5.2 | EBIT | –17.7 | –18.3 | 0.6 | 3.3 | % | ||||||||||||||||||||||
| –55.9 | % | –1.3 | –2.3 | –3.5 | EBITDA | –9.7 | –9.3 | –0.5 | –4.9 | % | ||||||||||||||||||||||
| –43.6 pts | — | –65.0 | % | –108.6 | % | EBITDA Margin | –76.2 | % | –68.6 | % | — | –7.6 pts | ||||||||||||||||||||
Consistent with the division’s core activities and strategic direction, the name of the New Businesses division was changed to High Definition Surveying (HDS) at the end of the fourth quarter. In terms of the fourth quarter business performance, HDS revenues declined by 6.7% to CHF 3.2 million. Sales in the quarter were lower in advance of shipments of the new HDS 3000 and Cyclone 5.0 products, which began in March. Order intake for these products has been brisk, however, with a backlog of orders in excess of three months. EBITDA for the quarter was impacted by lower sales volume. The division initiated several cost reduction measures at the end of the quarter, which should benefit earnings starting in the first quarter of the new Fiscal Year 2005.
For the full year, both sales and EBITDA were below the previous year, as the division transitioned its new suite of products.
Special Products Division — Continuing Operations
| Fourth Quarter | Sales and results (In million CHF) | Full Fiscal Year | ||||||||||||||||||||||||||||||
| Change | Prior | Current | Current | Prior | Change | |||||||||||||||||||||||||||
| (%) | (mCHF) | year | year | year | year | (mCHF) | (%) | |||||||||||||||||||||||||
| 0.0 | % | 0.0 | 7.4 | 7.4 | SALES | 33.0 | 27.1 | 5.9 | 21.9 | % | ||||||||||||||||||||||
| 1.2 | % | 0.0 | 2.0 | 2.0 | EBIT | 8.9 | 5.8 | 3.1 | 53.9 | % | ||||||||||||||||||||||
| –25.9 | % | –0.8 | 3.0 | 2.2 | EBITDA | 11.2 | 9.3 | 2.0 | 21.5 | % | ||||||||||||||||||||||
| –10.4 pts | — | 40.5 | % | 30.1 | % | EBITDA Margin | 34.0 | % | 34.1 | % | — | –0.1 pts | ||||||||||||||||||||
Fourth quarter sales in the Special Products division were CHF 7.4 million, on par with the previous year. The division generated CHF 2.2 million in EBITDA. For the full year, Special Product sales were CHF 33.0 million with EDITDA of 11.2 million.
7
Table of Contents
Other Matters / Outlook
Other Matters
Refinancing of High-Yield Notes
On May 7, 2004, we concluded an agreement with UBS AG Zurich and our Multi-Currency Revolving Credit Facility syndicate, for the early retirement and subsequent refinancing of our 65 million in 9 7/8% notes. As part of this transaction we extended the life of our existing CHF 150 million Revolving Credit Facility for an additional two years, which will now expire on May 7, 2008, and entered into a new CHF 80 million, four-year amortizing term loan. The term loan is repayable in semi-annual installments of CHF 10 million, beginning March 31, 2005 and bears an interest rate of LIBOR plus a margin, significantly lower than the 9 7/8% notes. On May 14, 2004, we officially notified the existing note holders of our intention to call and retire the outstanding notes on June 15, 2004 at the stated premium to face value of 104.938%. Together with transaction fees and associated costs, these one-off costs are expected to be in the range of CHF 6 million to CHF 7 million, and should be fully offset by lower interest costs within one year.
Employees
We employed 2,461 employees at the end of March 2004. The geographical distribution of our workforce at the end of the quarter was as follows: 29% in Europe (including Heerbrugg), 24% in the Americas, and 17% in Asia and the rest of the world.
Annual Report
Leica Geosystems’ Fiscal Year 2004 Annual Report is now available electronically in English and German via the Company’s website under www.leica-geosystems.com. This year’s Annual Report is comprised of four separate Reports including a Company Overview Report, a Corporate Governance Report, a Corporate Responsibility Report, and a report covering our Financial Results. Printed copies of the report can be ordered directly over the website.
Results conference
We will present our full year results today at our Annual Media and Analyst conference at 10:30 CET in Zurich. The conference will be in German and will be carried live via audio Webcast. This Webcast can be accessed via our Investor Relations website at www.leica-geosystems.com/investor. We will also hold our regular earnings conference call with analysts at 15:00 CET. This call will be conducted in English and can be followed live via audio Webcast. Access to the Webcast is also available via our Investor Relations website at www.leica-geosystems.com/investor.
Annual Shareholders Meeting
As a shareholder, you are cordially invited to our shareholders meeting on July 7, 2004 at the Kongresshaus in Zurich, Switzerland. An invitation to this event has been sent to all shareholders today.
Performance of LGSN share
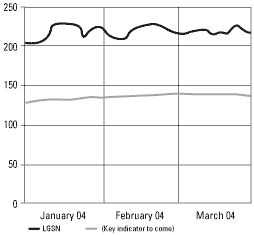
2,235,273 LGSN shares
| — | @ 50 CHF nominal per share:Share capital CHF 111.8m | |||
| — | @ 142.7 CHF carrying amount per share:Shareholders’ equity CHF 319.0m | |||
| — | @ 195 average quarterly share price:Market capitalization (quart. average) CHF 435.9m | |||
8
Table of Contents
Financial Statements
Business Outlook — Fiscal Year 2005
(Barring any unforeseen circumstances)
In line with our previously announced mid-term growth expectations, we expect to grow sales by ten percent in fiscal year 2005 reflecting demand for our new products, opportunities we are addressing in target market segments and geographic regions, and the strength of our current position in all of our major markets segments. We also expect to further increase gross profit margins in the coming year through the impact of new products and proportionally higher software revenues. As a result of our sales and margin expectations, together with prudent control of our operating costs, we expect to see a further improvement of our EBITDA margin for fiscal year 2005. Furthermore, we expect net income to exceed CHF 30 million for the full year. The forecasted increase in net income reflects the combination of significantly improved operating results, the discontinuation of goodwill amortization charges, as required under the new IFRS 3 accounting rules, and approximately CHF 7 million of non-recurring charges associated with the refinancing of our high-yield notes.
Within the year, sales and earnings should follow the seasonality of our business cycle, with relatively higher results in the second half of the year than in the first. Seasonality will be more pronounced than usual as the positive impact of new products builds throughout the fiscal year. Exceptionally, in the first quarter we will record non-recurring charges, as mentioned above, associated with the refinancing of our high-yield notes. Although these charges will lower earnings in the first quarter, interest costs going forward should be significantly lower than the previous year.
On behalf of the Board of Directors, the management team and the employees of Leica Geo-systems, thank you for your support and continued investment in Leica Geosystems.
| Sincerely, | ||
 |  | |
| Mario Fontana Chairman of the Board Leica Geosystems | Hans Hess CEO and Member of the Board of Directors Leica Geosystems |
CONDENSED FINANCIAL STATEMENTS
LEICA GEOSYSTEMS HOLDINGS AG
3 Months (4th Quarter)
for the periods from December 28, 2002 to March 31, 2003 and December 27, 2003 to March 31, 2004
12 Months (Full Fiscal Year)
for the periods from April 1, 2002 to March 31, 2003 and April 1, 2003 to March 31, 2004
According to International Financial Reporting Standards (IFRS)
Under the safe harbor provisions of the U.S. Private Securities Litigation Reform Act of 1995, we caution investors that all statements other than statements of historical fact included in this document, including without limitation, those regarding our financial position, business strategy, plans and objectives of management for future operations (including development plans and objectives relating to our existing and future products), are forward-looking statements. Such forward-looking statements involve known and unknown risks, uncertainties and other factors, which may cause our actual results, performance or achievements, or industry results, to be materially different from any future results, performance or achievements expressed or implied by such forward-looking statements. Such forward-looking statements are based on numerous assumptions regarding our present and future business strategies and the environment in which we expect to operate in the future. Important factors that could cause our actual results, performance or achievements to differ materially from those in the forward-looking statements include, among other factors: (i) our ability to develop and introduce new products and technologies that gain market acceptance on a timely basis; (ii) our ability to respond to competitive challenges, such as the introduction of innovative products or technologies by our competitors; (iii) our ability to identify and realize growth opportunities; and (iv) overall levels of investment in infrastructure and capital spending in our markets. Additionally, any forward-looking statements speak only as of the date of this document. We expressly disclaim any obligation or undertaking to release publicly any update of or revisions to any forward-looking statement contained herein to reflect any change in our expectations with regard hereto or any change in events, conditions or circumstances on which any such statement is based.
9
Table of Contents
LEICA GEOSYSTEMS HOLDINGS AG
CONSOLIDATED STATEMENTS OF INCOME
(in thousand CHF, except share data)
| unaudited | audited | |||||||||||||||
| 3 Months (4th Quarter) | 12 Months (Full Fiscal Year) | |||||||||||||||
| This year | Last year | This year | Last year | |||||||||||||
| For the period | For the period | For the period | For the period | |||||||||||||
| Dec. 27, 2003 to | Dec. 28, 2002 to | April 1, 2003 to | April 1, 2002 to | |||||||||||||
| March 31, 2004 | March 31, 2003 | March 31, 2004 | March 31, 2003 | |||||||||||||
| CHF | CHF | CHF | CHF | |||||||||||||
| Total sales | 184,942 | 175,174 | 689,097 | 735,813 | ||||||||||||
| Sales from discontinued operations | – | 3,519 | – | 85,501 | ||||||||||||
| Sales from continuing operations | 184,942 | 171,655 | 689,097 | 650,312 | ||||||||||||
| Cost of sales | –89,773 | –87,853 | –336,483 | –314,051 | ||||||||||||
Gross profit | 95,169 | 83,802 | 352,614 | 336,261 | ||||||||||||
| Research and development costs | –19,928 | –17,206 | –69,172 | –63,486 | ||||||||||||
| Selling and marketing costs | –44,635 | –40,064 | –162,502 | –161,990 | ||||||||||||
| General and administrative costs | –21,151 | –15,613 | –78,264 | –77,894 | ||||||||||||
| Other operating income/(expense) net | –4,186 | –4,013 | –15,330 | –22,022 | ||||||||||||
| Gain/(loss) on disposal of property, plant and equipment net | 371 | –133 | 422 | –1,069 | ||||||||||||
Operating result from continuing operations | 5,640 | 6,774 | 27,923 | 9,801 | ||||||||||||
Operating result from discontinued operations | 557 | 31,938 | 557 | 53,441 | ||||||||||||
Operating result | 6,197 | 38,712 | 28,325 | 63,242 | ||||||||||||
| Income/(loss) from associated companies | 660 | –2,557 | 1,691 | –2,538 | ||||||||||||
| Finance costs | –4,701 | –6,147 | –15,845 | –19,357 | ||||||||||||
Income/(loss) before tax | 2,155 | 30,008 | 14,170 | 41,347 | ||||||||||||
| Income tax benefit/(expense) | 24 | –14,945 | –8,537 | –19,432 | ||||||||||||
Net income/(loss) | 2,179 | 15,063 | 5,633 | 21,915 | ||||||||||||
| Weighted average number of ordinary shares in issue | 2,235,273 | 2,209,554 | 2,220,101 | 2,237,195 | ||||||||||||
Basic earnings per share (single CHF) | 0.97 | 6.82 | 2.54 | 9.80 | ||||||||||||
| Adjustments for share options | 64,251 | — | 47,068 | 4,624 | ||||||||||||
| Weighted average number of shares for diluted earnings per share | 2,299,524 | 2,209,554 | 2,267,169 | 2,241,819 | ||||||||||||
Diluted earnings per share (single CHF) | 0.95 | 6.82 | 2.48 | 9.78 | ||||||||||||
| 10 | ACCORDING TO INTERNATIONAL FINANCIAL REPORTING STANDARDS (IFRS) |
Table of Contents
LEICA GEOSYSTEMS HOLDINGS AG
CONSOLIDATED BALANCE SHEETS
(in thousand CHF)
| audited | unaudited | audited | ||||||||||
| March 31, 2004 | Dec. 26, 2003 | March 31, 2003 | ||||||||||
| CHF | CHF | CHF | ||||||||||
ASSETS | ||||||||||||
Current assets | ||||||||||||
| Cash and cash equivalents | 992 | 2,160 | 1,701 | |||||||||
| Trade accounts receivable | 149,836 | 138,986 | 141,624 | |||||||||
| Inventories | 111,326 | 111,660 | 104,507 | |||||||||
| Prepayments and accrued income | 6,240 | 5,950 | 12,999 | |||||||||
| Other current assets | 13,890 | 21,095 | 15,039 | |||||||||
Total current assets | 282,284 | 279,851 | 275,870 | |||||||||
Non-current assets | ||||||||||||
| Property, plant and equipment | 91,465 | 89,653 | 93,545 | |||||||||
| Goodwill | 174,964 | 174,022 | 177,484 | |||||||||
| Other intangible assets | 97,274 | 98,120 | 92,066 | |||||||||
| Investments in associates | 3,451 | 9,280 | 8,091 | |||||||||
| Deferred taxes | 32,149 | 32,292 | 34,202 | |||||||||
| Other non-current assets | 1,999 | 1,972 | 1,795 | |||||||||
Total non-current assets | 401,302 | 405,339 | 407,183 | |||||||||
TOTAL ASSETS | 683,586 | 685,190 | 683,053 | |||||||||
of which discontinued operations | — | — | — | |||||||||
LIABILITIES AND EQUITY | ||||||||||||
Current liabilities | ||||||||||||
| Bank overdrafts | 480 | 77 | 1,269 | |||||||||
| Loans and borrowings | 1,432 | 6,386 | 5,829 | |||||||||
| Trade accounts payable | 68,958 | 58,134 | 57,891 | |||||||||
| Advance payments | 989 | 4,780 | 502 | |||||||||
| Accrued compensation | 32,943 | 31,395 | 26,127 | |||||||||
| Other accrued liabilities | 32,544 | 39,052 | 32,831 | |||||||||
| Provisions | 6,911 | 8,034 | 10,609 | |||||||||
| Corporate tax, current | 5,914 | 15,343 | 20,201 | |||||||||
| Other current liabilities | 11,894 | 11,678 | 13,910 | |||||||||
Total current liabilities | 162,064 | 174,879 | 169,169 | |||||||||
of which discontinued operations | — | — | — | |||||||||
Non-current liabilities | ||||||||||||
| Loans and borrowings | ||||||||||||
| Revolving Credit Facility | 49,730 | 44,987 | 52,945 | |||||||||
| 9 7/8% Notes | 99,499 | 99,437 | 93,842 | |||||||||
| Other loans & borrowings | 1,842 | 1,536 | 1,959 | |||||||||
| Pension obligations | 11,147 | 11,433 | 12,959 | |||||||||
| Deferred taxes | 36,730 | 37,186 | 35,132 | |||||||||
| Other non-current liabilities | 3,597 | 3,694 | 3,427 | |||||||||
Total non-current liabilities | 202,543 | 198,271 | 200,264 | |||||||||
Total liabilities | 364,608 | 373,150 | 369,433 | |||||||||
SHAREHOLDERS’ EQUITY | ||||||||||||
| Share capital | 111,764 | 111,129 | 110,478 | |||||||||
| Share premium | 63,939 | 62,493 | 59,918 | |||||||||
| Reserves | 250,788 | 250,788 | 250,788 | |||||||||
| Accumulated deficit | –70,969 | –73,148 | –76,602 | |||||||||
| Hedging and currency translation adjustment | –36,544 | –39,222 | –30,962 | |||||||||
Total shareholders’ equity | 318,978 | 312,040 | 313,620 | |||||||||
TOTAL LIABILITIES AND EQUITY | 683,586 | 685,190 | 683,053 | |||||||||
| ACCORDING TO INTERNATIONAL FINANCIAL REPORTING STANDARDS (IFRS) | 11 |
Table of Contents
LEICA GEOSYSTEMS HOLDINGS AG
CONSOLIDATED STATEMENTS OF SHAREHOLDERS’ EQUITY
(in thousand CHF, except number of shares)
| Number of | Hedging and | |||||||||||||||||||||||||
| registered | Share | Accumu- | currency | |||||||||||||||||||||||
| shares | Share | Premium/ | lated | translation | ||||||||||||||||||||||
| outstanding | Capital | Reserves | Deficit | adjustment | TOTAL | |||||||||||||||||||||
| No. | CHF | CHF | CHF | CHF | CHF | |||||||||||||||||||||
Balance at March 31, 2002 | 2,251,101 | 112,554 | 316,178 | –98,517 | 2,060 | 332,275 | ||||||||||||||||||||
| Issuance of common stock | 3,154 | 158 | 444 | — | — | 602 | ||||||||||||||||||||
| Treasury shares movement | –44,701 | –2,234 | –5,916 | — | — | –8,150 | ||||||||||||||||||||
| Net Income | — | — | — | 21,915 | — | 21,915 | ||||||||||||||||||||
| Cash flow hedging adjust. (net of tax) | — | — | — | — | –20 | –20 | ||||||||||||||||||||
| Currency translation adjustment | — | — | — | — | –33,002 | –33,002 | ||||||||||||||||||||
Balance at March 31, 2003 | 2,209,554 | 110,478 | 310,706 | –76,602 | –30,962 | 313,620 | ||||||||||||||||||||
Balance at March 31, 2003 | 2,209,554 | 110,478 | 310,706 | –76,602 | –30,962 | 313,620 | ||||||||||||||||||||
| Issuance of common stock | 21,791 | 1,090 | 3,405 | — | — | 4,495 | ||||||||||||||||||||
| Treasury shares movement | 3,928 | 196 | 615 | — | — | 812 | ||||||||||||||||||||
| Net Income | — | — | — | 5,633 | — | 5,633 | ||||||||||||||||||||
| Cash flow hedging adjust. (net of tax) | — | — | — | — | –137 | –137 | ||||||||||||||||||||
| Currency translation adjustment | — | — | — | — | –5,444 | –5,444 | ||||||||||||||||||||
Balance at March 31, 2004 | 2,235,273 | 111,764 | 314,727 | –70,969 | –36,544 | 319,978 | ||||||||||||||||||||
| 12 | ACCORDING TO INTERNATIONAL FINANCIAL REPORTING STANDARDS (IFRS) |
Table of Contents
LEICA GEOSYSTEMS HOLDINGS AG
CONDENSED CONSOLIDATED STATEMENTS OF CASH FLOWS
(in thousand CHF)
| unaudited | audited | |||||||||||||||
| 3 Months (4th Quarter) | 12 Months (Full Fiscal Year) | |||||||||||||||
| This year | Last year | This year | Last year | |||||||||||||
| For the period | For the period | For the period | For the period | |||||||||||||
| Dec. 27, 2003 to | Dec. 28, 2002 to | April 1, 2003 to | April 1, 2002 to | |||||||||||||
| March 31, 2004 | March 31, 2003 | March 31, 2004 | March 31, 2003 | |||||||||||||
| CHF | CHF | CHF | CHF | |||||||||||||
Cash Flows from Operating Activities: | ||||||||||||||||
| Operating profit/(loss) | 6,198 | 38,712 | 28,325 | 63,242 | ||||||||||||
| Net interest expense paid | –1,059 | –1,560 | –13,998 | –15,077 | ||||||||||||
| Taxes paid | –9,878 | 488 | –19,362 | –2,832 | ||||||||||||
| Depreciation and amortization | 17,689 | 21,071 | 69,243 | 71,294 | ||||||||||||
| Other non-cash items | –1,481 | –32,122 | –1,001 | –33,058 | ||||||||||||
| Changes in net working capital | –5,400 | 827 | –3,506 | –11,378 | ||||||||||||
Cash provided by operating activities | 6,070 | 27,416 | 59,701 | 72,191 | ||||||||||||
of which discontinued operations | — | –718 | — | 13,072 | ||||||||||||
Cash Flows from Investing Activities: | ||||||||||||||||
| Purchase of property, plant and equipment | –4,180 | –6,169 | –16,025 | –20,662 | ||||||||||||
| Cash expended on intangible assets | –7,553 | –11,041 | –39,209 | –41,157 | ||||||||||||
| Cash expended on acquisition | –4,406 | –295 | –16,305 | –608 | ||||||||||||
| Disposal of subsidiary and interests in associates | 7,050 | 55,614 | 14,050 | 55,614 | ||||||||||||
| Sale of assets | 1,448 | 3,076 | 2,948 | 20,466 | ||||||||||||
Cash provided by used in investing activities | –7,639 | 41,185 | –54,540 | 13,653 | ||||||||||||
of which discontinued operations | — | –61 | — | –1,312 | ||||||||||||
Cash Flows from Financing Activities: | ||||||||||||||||
| Loans and borrowings | 4,020 | –67,758 | –2,454 | –83,989 | ||||||||||||
| Debt issuance costs | –200 | — | –1,536 | — | ||||||||||||
| Proceeds from issue of share capital and own shares | 1,201 | –2,127 | 2,753 | –2,693 | ||||||||||||
| Finance lease principal payments | –4,518 | — | –4,518 | — | ||||||||||||
Cash provided by /(used in) financing activities | 502 | –69,885 | –5,756 | –86,682 | ||||||||||||
of which discontinued operations | — | –295 | — | –9,960 | ||||||||||||
| Effect of exchange rate changes on cash and cash equivalents | –100 | 7 | –114 | –451 | ||||||||||||
| Net increase/(decrease) in cash and cash equivalents | –1,167 | –1,277 | –709 | –1,289 | ||||||||||||
| Cash and cash equivalents at beginning of specified period | 2,160 | 2,978 | 1,701 | 2,990 | ||||||||||||
Cash and cash equivalents at end of specified period | 992 | 1,701 | 992 | 1,701 | ||||||||||||
of which discontinued operations | — | 1,847 | — | 1,847 | ||||||||||||
| ACCORDING TO INTERNATIONAL FINANCIAL REPORTING STANDARDS (IFRS) | 13 |
Table of Contents
LEICA GEOSYSTEMS HOLDINGS AG
CONDENSED CONSOLIDATED SEGMENT INFORMATION
(in thousand CHF)
BUSINESS SEGMENTS
| unaudited | audited | |||||||||||||||
| 3 Months (4th Quarter) | 12 Months (Full Fiscal Year) | |||||||||||||||
| This year | Last year | This year | Last year | |||||||||||||
| For the period | For the period | For the period | For the period | |||||||||||||
| Dec. 27, 2003 to | Dec. 28, 2002 to | April 1, 2003 to | April 1, 2002 to | |||||||||||||
| March 31, 2004 | March 31, 2003 | March 31, 2004 | March 31, 2003 | |||||||||||||
| CHF | CHF | CHF | CHF | |||||||||||||
Sales to external customers: | ||||||||||||||||
| Surveying & Engineering | 114,365 | 101,507 | 423,414 | 397,500 | ||||||||||||
| GIS & Mapping | 25,734 | 26,634 | 94,860 | 100,650 | ||||||||||||
| Consumer Products | 17,257 | 16,540 | 58,640 | 50,579 | ||||||||||||
| Metrology | 16,942 | 16,006 | 66,389 | 59,353 | ||||||||||||
| High-Definition Surveying (HDS) | 3,246 | 3,479 | 12,766 | 13,526 | ||||||||||||
| Total Segments | 177,545 | 164,166 | 656,069 | 621,608 | ||||||||||||
| Special Products — Continuing operations | 7,398 | 7,358 | 33,028 | 27,023 | ||||||||||||
| Special Products — Discontinued operations | — | 3,519 | — | 85,501 | ||||||||||||
| Central Services | — | 131 | — | 1,681 | ||||||||||||
Total sales to external customers | 184,942 | 175,174 | 689,097 | 735,813 | ||||||||||||
Results: | ||||||||||||||||
| Surveying & Engineering | 13,400 | 15,060 | 57,938 | 53,157 | ||||||||||||
| GIS & Mapping | 709 | –541 | –3,705 | –8,689 | ||||||||||||
| Consumer Products | 2,359 | 268 | 3,447 | 1,162 | ||||||||||||
| Metrology | –374 | 2,093 | 5,389 | 7,569 | ||||||||||||
| High-Definition Surveying (HDS) | –5,214 | –4,859 | –17,723 | –18,334 | ||||||||||||
| Total Segments | 10,879 | 12,021 | 45,347 | 34,865 | ||||||||||||
| Special Products — Continuing operations | 1,157 | 1,754 | 6,830 | 5,305 | ||||||||||||
| Special Products — Discontinued operations | 557 | –51 | 557 | 21,452 | ||||||||||||
| Gain on sale of discontinued operations | — | 31,989 | — | 31,989 | ||||||||||||
| Central Services | –6,397 | –7,001 | –24,409 | –30,369 | ||||||||||||
Total operating profit/ (loss) | 6,197 | 38,712 | 28,325 | 63,242 | ||||||||||||
Income/(loss) from associated companies: | ||||||||||||||||
| Surveying & Engineering | — | 4 | — | — | ||||||||||||
| GIS & Mapping | 380 | –1,565 | 162 | –1,689 | ||||||||||||
| Consumer Products | — | — | — | — | ||||||||||||
| Metrology | — | –1,362 | — | –1,638 | ||||||||||||
| High-Definition Surveying (HDS) | — | — | — | — | ||||||||||||
| Total Segments | 380 | –2,923 | 162 | –3,326 | ||||||||||||
| Special Products — Continuing operations | 309 | 231 | 1,500 | 532 | ||||||||||||
| Special Products — Discontinued operations | — | — | — | — | ||||||||||||
| Central Services | –29 | 135 | 29 | 257 | ||||||||||||
Total associates gain/(loss) | 659 | –2,557 | 1,691 | –2,538 | ||||||||||||
Depreciation and Amortization: | ||||||||||||||||
| Surveying & Engineering | –5,398 | –4,873 | –20,289 | –16,318 | ||||||||||||
| GIS & Mapping | –3,589 | –7,105 | –13,822 | –18,584 | ||||||||||||
| Consumer Products | –1,112 | –1,333 | –5,020 | –4,818 | ||||||||||||
| Metrology | –2,241 | –3,807 | –7,175 | –7,181 | ||||||||||||
| High-Definition Surveying (HDS) | –1,687 | –2,597 | –7,996 | –9,059 | ||||||||||||
| Total Segments | –14,026 | –19,715 | –54,303 | –55,960 | ||||||||||||
| Special Products — Continuing operations | –756 | –994 | –2,911 | –3,365 | ||||||||||||
| Special Products — Discontinued operations | — | 4 | — | –1,099 | ||||||||||||
| Central Services | –2,907 | –3,207 | –12,030 | –13,711 | ||||||||||||
Total depreciation and amortization | –17,689 | –23,912 | –69,243 | –74,135 | ||||||||||||
EBITDA: | ||||||||||||||||
| Surveying & Engineering | 18,797 | 19,937 | 78,228 | 69,475 | ||||||||||||
| GIS & Mapping | 4,678 | 4,999 | 10,279 | 8,206 | ||||||||||||
| Consumer Products | 3,471 | 1,601 | 8,467 | 5,980 | ||||||||||||
| Metrology | 1,867 | 4,538 | 12,564 | 13,112 | ||||||||||||
| High-Definition Surveying (HDS) | –3,527 | –2,262 | –9,726 | –9,275 | ||||||||||||
| Total Segments | 25,285 | 28,813 | 99,811 | 87,499 | ||||||||||||
| Special Products — Continuing operations | 2,223 | 2,979 | 11,241 | 9,202 | ||||||||||||
| Special Products — Discontinued operations | 557 | 31,934 | 557 | 54,540 | ||||||||||||
| Central Services | –3,519 | –3,659 | –12,350 | –16,401 | ||||||||||||
Total EBITDA | 24,546 | 60,067 | 99,260 | 134,840 | ||||||||||||
| 14 | ACCORDING TO INTERNATIONAL FINANCIAL REPORTING STANDARDS (IFRS) |
Table of Contents
LEICA GEOSYSTEMS HOLDINGS AG
NOTES TO THE UNAUDITED, CONDENSED AND CONSOLIDATED FINANCIAL INFORMATION
(in thousand CHF)
1 Accounting policies
These consolidated interim condensed financial statements are prepared in accordance with IAS 34Interim Financial Reporting. The accounting policies used in the preparation of the interim financial statements are consistent with those used in the annual financial statements for the year ended March 31, 2004.
These condensed and consolidated interim financial statements should be read in conjunction with the annual financial statements for the Fiscal Year ended March 31, 2004.
2 Finance costs
Finance costs (in thousand CHF) for the comparative periods are itemized below:
| unaudited | audited | |||||||||||||||
| 3 Months (4th Quarter) | 12 Months (Full Fiscal Year) | |||||||||||||||
| This year | Last year | This year | Last year | |||||||||||||
| For the period | For the period | For the period | For the period | |||||||||||||
| Dec. 27, 2003 to | Dec. 28, 2002 to | April 1, 2003 to | April 1, 2002 to | |||||||||||||
| March 31, 2004 | March 31, 2003 | March 31, 2004 | March 31, 2003 | |||||||||||||
| CHF | CHF | CHF | CHF | |||||||||||||
Interest income | 43 | 328 | 85 | 742 | ||||||||||||
Interest expense: | ||||||||||||||||
| Revolving Credit Facility | –991 | –1,309 | –3,813 | –5,590 | ||||||||||||
| 9 7/8% Notes | –2,675 | –2,611 | –10,191 | –9,633 | ||||||||||||
| Other | –39 | –358 | –158 | –877 | ||||||||||||
Total interest expense | –3,705 | –4,278 | –14,162 | –16,100 | ||||||||||||
Debt acquisition, issuance and share offering costs: | ||||||||||||||||
| Amort. of debt acquisition cost — | ||||||||||||||||
| Revolving Credit Facility | –129 | –489 | –978 | –2,204 | ||||||||||||
| Amort. of debt acquisition cost — | ||||||||||||||||
| 9 7/8% Notes | –97 | –98 | –384 | –388 | ||||||||||||
| Other | — | 67 | — | –34 | ||||||||||||
Total debt acquisition, issuance and share offering costs | –226 | –520 | –1,362 | –2,626 | ||||||||||||
Foreign exchange gains/(losses) on borrowings | –813 | –1,677 | –406 | –1,373 | ||||||||||||
Total finance costs | –4,701 | –6,147 | –15,845 | –19,357 | ||||||||||||
3 Acquisition of selling activities in Belgium
In February 2004, Leica Geosystems established a direct presence in Belgium by the acquisition of the former Geodesy business of Van Hopplynus. The cash transaction of Euro 2.8 million (CHF 4.4 million) resulted in goodwill of CHF 4.3 million. The goodwill has been amortized on a straight-line basis over its estimated useful life, which is assessed to be 10 years.
| ACCORDING TO INTERNATIONAL FINANCIAL REPORTING STANDARDS (IFRS) | 15 |
Table of Contents
LEICA GEOSYSTEMS HOLDINGS AG
NOTES TO THE UNAUDITED, CONDENSED AND CONSOLIDATED FINANCIAL INFORMATION
(in thousand CHF)
Following is a summary of the key elements of this acquisition:
| February 9, 2004 | ||||
| CHF | ||||
| Cash paid | 4,406 | |||
Total purchase consideration | 4,406 | |||
| Fair value of net assets / liabilities acquired | –72 | |||
Goodwill | 4,334 | |||
| Total purchase consideration | 4,406 | |||
| Less cash and cash equivalents in subsidiaries acquired | — | |||
Cash expended on acquisition | 4,406 | |||
4 High-Definition Surveying (HDS)
The previously named segment “New Businesses” is now called High-Definition Surveying (HDS).
5 Post balance sheet events
On April 23, 2004, the Company announced that it, together with Leica Micorsystems, would terminate the 50-50 Joint-venture agreement of Leica Instruments (Singapore) Pte Ltd. As a result, two separate entities will be established, each fully owned by both the respective shareholders. The new organisation will allow each company to implement its plans and strategies to further invest and expand activities in their own subsidiaries.
On May 7, 2004, the Company concluded an agreement with UBS AG Zurich and its Multi-Currency Revolving Credit Facility syndicate, for the early retirement and subsequent refinancing of the 65 million 9 7/8% Notes. As part of this transaction the Company extended the life of the existing CHF 150 million Multi-Currency Revolving Credit Facility for an additional 2 years, which will now expire on May 7, 2008, and entered into a new CHF 80 million, 4-year amortizing term loan. The term loan is repayable in semi-annual installments of CHF 10 million, beginning March 31, 2005 and bears an interest rate of LIBOR plus a margin, significantly lower than the 9 7/8% notes. On May 14, 2004, the Company officially notified the existing note holders of the intention to call and retire the outstanding notes on June 15, 2004 at 104.938% of the stated face value. The Company expects the one-off impact of the premium plus transaction fees to be fully offset by lower interest costs within one year. The refinancing costs will be recorded in the first quarter results of Fiscal Year 2005, which ends on June, 30 2004.
There are no other events to report that could have a significant influence on the financial statements for the year ended March 31, 2004.
| For electronic copies of this publication and other company information, please visit our web-site at: www.leica-geosystems.com/investor/index.htm | | |
| Company contact information: | ||
| Leica Geosystems | ||
| Investor Relations: | CH-9435 Heerbrugg | |
| George Aase | (Switzerland) | |
| Director Investor Relations | Phone +41 71 727 31 31 | |
| Phone +41-71-727-3064 | Fax +41 71 727 46 73 | |
| Email: investor@leica-geosystems.com | www.leica-geosystems.com |
Table of Contents
Communication to Investors and Media | | |
More detailed information at www.leica-geosystems.com/investor 4th Quarter & Full Year Results FY 2003/04 (10 June 2004) ContactGeorge Aase, Investor Relations, Phone +41 (0)71 727 3064 | Leica Geosystems AG Heinrich-Wild-Strasse CH-9435 Heerbrugg (Switzerland) www.leica-geosystems.com |
Leica Geosystems reports fourth quarter momentum in sales and earnings
*******************************************************************************************************************
FULL FISCAL YEAR 2004
| • | Full year net income increased by CHF 19.0 million, rising to CHF 5.2 million, compared with a net loss of CHF (13.7) million from continuing operations in the previous year; | |||
| • | Full year sales from continuing operations increased by 6% to CHF 689.1 million, and by 7.9% in local currency; | |||
| • | Full year EBITDA from continuing operations rose 23% to CHF 98.7 million, or 14.3% of sales, up from CHF 80.3 million, or 12.3% of sales, in the previous year. | |||
FOURTH QUARTER FISCAL YEAR 2004
| • | Sales grew by 7.8% to CHF 184.9 million in the fourth quarter, led by robust growth of 12.7% in Surveying & Engineering sales on the back of new product launches; | |||
| • | Net income jumped to CHF 1.7 million in fourth quarter compared with a net loss of CHF (4.2) million from continuing operations in the previous year. | |||
*******************************************************************************************************************
Heerbrugg (Switzerland), June 10, 2004 — Leica Geosystems (SWX: LGSN) today reported 7.8% growth in its fourth quarter sales from continuing operations, together with a growth in net income to CHF 1.7 million, compared with a loss of CHF (4.2) million from continuing operations in the previous year. The rise in sales was led by the robust 12.7% growth in the Company’s largest division, Surveying & Engineering, which began shipment of its new flagship surveying system, the Leica System 1200, at the end of the fourth quarter. As expected, marketing and selling costs rose in conjunction with the intensive product launch activities in the quarter. As a consequence, fourth quarter EBITDA declined year-on-year to CHF 24.0 million, or 13.0% of sales, compared with CHF 28.1 million, or 16.4%, in the previous year.
For the full fiscal year the Company grew revenues by 6%, and by 7.9% in local currencies. EBITDA from continuing operations rose by 23% to CHF 98.7 million, or 14.3% of sales, comfortably above the CHF 80.3 million, or 12.3% of sales in the previous year. Leica Geosystems’ full year net income from continuing operations increased by CHF 19.0 million, rising to CHF 5.2 million, compared with a net loss from of CHF (13.7) million in the previous year.
Table of Contents
“We closed this year on a very positive note, as momentum from our numerous product releases had a favorable impact on order intake and sales in the fourth quarter. During the period since March 31, 2004, order intake has further intensified in all divisions, particularly in Surveying and Engineering and HDS, confirming robust demand for our new generation of GPS, TPS and HDS products,” said Hans Hess, CEO of Leica Geosystems.
Sales Climb on Strength of Surveying and Engineering
Fourth quarter sales from continuing operations grew by 7.8% to CHF 184.9 million. The Company’s gross profit margins reached 51.5% in the fourth quarter, well above the third quarter, and significantly above the prior year level of 48.8%. The Surveying and Engineering division, which generates 60% of Leica Geosystems’ revenue, led the fourth quarter sales growth with an increase of 12.7%. S&E sales growth came from strong performance in its high-end GPS and TPS surveying systems, combined with solid performance in Europe, and in the Americas, where sales in local currency grew by double digit percentage points. Sales rose by 5.9% in Leica Geosystems’ Metrology business, followed by 4.3% in Consumer Products division.
In GIS & Mapping, Swiss franc revenues declined in comparison with the previous year but grew by 1.3% in local currencies. In the High-Definition Surveying division (formerly named New Businesses — Cyra), sales declined by (6.7%) in advance of shipments of its new HDS products. At the end of the fourth quarter, however, the division had an order backlog of over three months, from which it started shipping in quarter one.
For the full year, sales from continuing operations grew by 6.0%, rising to CHF 689.1 million; sales growth in local currencies was 7.9%. The Company posted solid full year revenue growth in Surveying & Engineering (6.5%), Consumer Products (15.9%), and Metrology (11.9%), while sales in the GIS & Mapping and HDS divisions fell below the previous year due to the lower US dollar and the phase-out of older generation products, respectively.
Operating Expenses Rise in Conjunction with Product Launches
The Company recorded CHF 89.4 million in operating costs during the fourth quarter, up from CHF 77.0 million in the previous year. Marketing and selling costs increased by CHF 4.6 million over the previous year, as the Company aggressively marketed its new product offerings through global road shows and trade exhibitions. Net research and development costs also increased over the previous year, rising CHF 2.7 million year-over-year. For the full year, however, the Company lowered its overall operating expenses by CHF 1.8 million, and lowered its ratio of operating expense to sales from 50.3% down to 47.1%.
Continued Growth in Net Income
Despite higher operating costs, Leica Geosystems recorded net income of CHF 1.7 million in the fourth quarter compared with a net loss of CHF (4.2) million in the previous year, and has generated four consecutive quarters of positive net income. Fourth quarter net income improved through lower tax and finance costs, combined with significantly improved earnings
Leica Geosystems, 10 June, 2004 | 2 | 4Q & Full Year Results FY04 |
Table of Contents
from associated companies. In the first quarter of Fiscal Year 2005 the Company will record one-off costs of approximately CHF 7.0 million in the first quarter of Fiscal Year 2005 in conjunction with the refinancing of its 9 7/8% high yield notes. Subsequent to the refinancing, quarterly net income should improve significantly.
Leica Geosystems generated CHF 24.0 million in EBITDA from continuing operations in the fourth quarter and CHF 98.7 million for the full year, a 23% improvement over the previous year.
Stable Inventory During Product Transition
The Company closed the quarter with net working capital of CHF 121.1 million, or 16.4% of sales. Although higher than the third quarter, net working capital is in line with Leica Geosystems’ targeted ratio of 16%. Net working capital rose primarily as a result of higher year-end trade receivables, which increased in conjunction with the rise in fourth quarter sales. Inventory levels were unchanged from the third quarter despite the numerous product transitions during the fourth quarter.
The Company generated CHF 6.1 million in operating cash flow for the quarter compared with CHF 28.1 million in the previous year. Operating cash flow declined against the previous year as a result of higher working capital and taxes paid during the quarter. For the full year Leica Geosystems generated operating cash flow of CHF 59.7 million compared with CHF 59.1 million in the previous year.
Refinancing of 9 7/8% High-Yield Notes
As reported on May 14, 2004, Leica Geosystems concluded an agreement with UBS AG Zurich and its Multi-Currency Revolving Credit Facility syndicate for the early retirement and subsequent refinancing of its ¬ 65 million, 9 7/8% notes. The Company will retire the outstanding notes on June 15, 2004 at the stated premium to face value of 104.938%, which together with one-off transaction fees and associated costs, is expected to be in the range of approximately CHF 7.0 million. The Company estimates that at current rates, these refinancing charges will be fully offset by lower interest costs within one year.
Business Outlook — Fiscal Year 2005
In line with its previously announced mid-term growth expectations, Leica Geosystems expects to grow sales by ten percent in fiscal year 2005 reflecting demand for its new products, opportunities it is addressing in target market segments and geographic regions, and the strength of its current position in all of its major markets segments. The Company also expects to further increase gross profit margins in the coming year through the impact of new products and proportionally higher software revenues. As a result of its sales and margin expectations, together with prudent control of operating costs, Leica Geosystems also expects to see a further improvement of its EBITDA margin for fiscal year 2005. Furthermore, the Company expects net income to exceed CHF 30 million for the full year. The forecasted increase in net income reflects the combination of significantly improved operating results, the discontinuation of goodwill amortization charges, as required under the new IFRS 3 accounting rules, and approximately CHF 7 million of non-recurring charges associated with the refinancing of its high-yield notes.
Leica Geosystems, 10 June, 2004 | 3 | 4Q & Full Year Results FY04 |
Table of Contents
Within the year, sales and earnings should follow the seasonality of the Company’s business cycle, with relatively higher results in the second half of the year than in the first. Seasonality will be more pronounced than usual as the positive impact of new products builds throughout the fiscal year. Exceptionally, in the first quarter Leica Geosystems will record non-recurring charges, as previously mentioned, associated with the refinancing of its high-yield notes. The Company stated that although these charges will lower earnings in the first quarter, interest costs going forward should be significantly lower than the previous year.
* * *
Annual Report
Leica Geosystems’ Fiscal Year 2004 Annual Report is now available electronically in English and German via the Company’s website at: www.leica-geosystems.com. Printed copies of the report can be ordered directly over the Company’s website.
Fiscal Year 2004 Results Conference
The Company will present its full year results today at its annual Media and Analyst conference at 10:30 CET in Zurich. The conference will be in German and will be carried live via audio Webcast. This Webcast can be accessed via the Company’s Investor Relations website at www.leica-geosystems.com/investor. Leica Geosystems will also hold its regular earnings conference call with analysts at 15:00 CET. This call will be conducted in English and can also be followed live via audio Webcast. Access to the Webcast is also available via the Company’s Investor Relations website at www.leica-geosystems.com/investor.
* * *
Under the safe harbor provisions of the U.S. Private Securities Litigation Reform Act of 1995, we caution investors that all statements other than statements of historical fact included in this document, including without limitation, those regarding our financial position, business strategy, plans and objectives of management for future operations (including development plans and objectives relating to our existing and future products), are forward-looking statements. Such forward-looking statements involve known and unknown risks, uncertainties and other factors, which may cause our actual results, performance or achievements, or industry results, to be materially different from any future results, performance or achievements expressed or implied by such forward-looking statements. Such forward-looking statements are based on numerous assumptions regarding our present and future business strategies and the environment in which we expect to operate in the future. Important factors that could cause our actual results, performance or achievements to differ materially from those in the forward-looking statements include, among other factors: (i) our ability to develop and introduce new products and technologies that gain market acceptance on a timely basis; (ii) our ability to respond to competitive challenges, such as the introduction of innovative products or technologies by our competitors; (iii) our ability to identify and realize growth opportunities; and (iv) overall levels of investment in infrastructure and capital spending in our markets. Additionally, any forward-looking statements speak only as of the date of this document. We expressly disclaim any obligation or undertaking to release publicly any update of or revisions to any forward-looking statement contained herein to reflect any change in our expectations with regard hereto or any change in events, conditions or circumstances on which any such statement is based.
Leica Geosystems, 10 June, 2004 | 4 | 4Q & Full Year Results FY04 |
Table of Contents
Balance Sheet Summary of Leica Geosystems
Balance Sheet Summary*
| FY04 | FY04 | FY04 | FY04 | FY03 | ||||||||||||||||
| March 31, | Dec. 26, | Sep. 26, | June 27, | March 31, | ||||||||||||||||
| (in million Swiss Francs) | 2004 | 2003 | 2003 | 2003 | 2003 | |||||||||||||||
| Net Working Capital (NWC) | 121.1 | m | 109.3 | m | 125.6 | m | 128.2 | m | 112.1 | m | ||||||||||
| NWC / Sales | 16.4 | % | 15.7 | % | 19.2 | % | 19.3 | % | 16.0 | % | ||||||||||
| Total Assets | 683.6 | m | 685.2 | m | 688.1 | m | 693.1 | m | 683.1 | m | ||||||||||
| Net Debt** | 152.0 | m | 150.3 | m | 159.6 | m | 166.5 | m | 154.0 | m | ||||||||||
| Total Equity | 319.0 | m | 312.0 | m | 314.7 | m | 312.3 | m | 313.6 | m | ||||||||||
| Equity / Assets Ratio | 46.7 | % | 45.5 | % | 45.7 | % | 45.1 | % | 45.9 | % | ||||||||||
| Capital Expenditures (excl. Capital Goodwill) | 11.7 | m | 16.3 | m | 15.3 | m | 11.8 | m | 17.2 | m | ||||||||||
| Goodwill | 175.0 | m | 174.0 | m | 168.3 | m | 172.5 | m | 177.5 | m | ||||||||||
| Cash provided from Operating activities | 6.1 | m | 28.5 | m | 18.0 | m | 7.1 | m | 27.4 | m | ||||||||||
| *) | Balance Sheet as of March 31, 2003 reflects the impact of the divestments of Wiltronic and Leica Vectronix. | |
| **) | Q4 FY04 amount is shown net of cash of CHF 1.0 million and capitalized debt issue cost/discounts of CHF 3.1 million. |
Share Related Data / registered shares
2,235,273 LGSN shares
| — | @ 50 CHF nominal per share: Share capital CHF 111.8m | |||
| — | @ 142.7 CHF carrying amount per share: Shareholders’ equity: CHF 319m | |||
| — | @ 195 CHF average quarterly share price: | |||
Market capitalization (average 4th quarter): CHF 435.9m
Leica Geosystems, 10 June, 2004 | 5 | 4Q & Full Year Results FY04 |
Table of Contents
4th Quarter FY 04 Results of Leica Geosystems
| Current | Prior | |||||||||||
| year | year | |||||||||||
| (27.12.03 to | (28.12.02 to | Changes | ||||||||||
| (in million Swiss Francs) | 31.03.04) | 31.03.03) | (%) | |||||||||
ORDER INTAKE —Continuing operations | 187.3 | m | 137.8 | m | 35.9 | % | ||||||
SALES —Continuing operations | 184.9 | m | 171.6 | m | 7.8 | % | ||||||
| Surveying & Engineering | 114.4 | m | 101.5 | m | 12.7 | % | ||||||
| GIS & Mapping | 25.7 | m | 26.6 | m | –3.3 | % | ||||||
| Consumer Products | 17.3 | m | 16.5 | m | 4.6 | % | ||||||
| Metrology | 16.9 | m | 16.0 | m | 5.9 | % | ||||||
| High-Definition Surveying (HDS) | 3.2 | m | 3.5 | m | –7.2 | % | ||||||
| Special Products — Continuing operations | 7.4 | m | 7.4 | m | 0.0 | % | ||||||
| Central Services | 0.0 | m | 0.1 | m | –100.0 | % | ||||||
Gross margin —Continuing operations | ||||||||||||
in percentage of sales | 51.5 | % | 48.8 | % | 2.6 pts | |||||||
EARNINGS | ||||||||||||
EBITDA —Continuing operations | 24.0 | m | 28.1 | m | –14.7 | % | ||||||
| - in percentage of sales | 13.0 | % | 16.4 | % | ||||||||
EBITA —Continuing operations | 19.4 | m | 22.4 | m | –13.6 | % | ||||||
| - in percentage of sales | 10.5 | % | 13.1 | % | ||||||||
EBIT —Continuing operations | 6.3 | m | 4.2 | m | 50.0 | % | ||||||
| - in percentage of sales | 3.4 | % | 2.5 | % | ||||||||
Operating profit —Continuing operations | 5.6 | m | 6.8 | m | –16.7 | % | ||||||
| - in percentage of sales | 3.0 | % | 3.9 | % | ||||||||
Net income Continuing operations | 1.7 | m | –4.2 | m | 140.5 | % | ||||||
| - in percentage of sales | 0.9 | % | –2.4 | % | ||||||||
Net income | 2.2 | m | 15.1 | m | –85.5 | % | ||||||
| - in percentage of sales | 1.2 | % | 8.6 | % | ||||||||
Earnings per share (CHF) | ||||||||||||
| - basic | 0.97 | 6.82 | –85.7 | % | ||||||||
| - diluted | 0.95 | 6.82 | –86.1 | % | ||||||||
Cash earnings per share (CHF) | ||||||||||||
| - basic | 11.96 | 17.52 | –31.7 | % | ||||||||
| - diluted | 11.63 | 17.52 | –33.6 | % | ||||||||
| - non-cash adjustments | 24.55 | 23.64 | 3.9 | % | ||||||||
Leica Geosystems, 10 June, 2004 | 5 | 4Q & Full Year Results FY04 |
Table of Contents
Full Year FY 04 Results of Leica Geosystems
| Current | Prior | |||||||||||
| year | year | |||||||||||
| (01.04.03 to | (01.04.02 to | Changes | ||||||||||
| (in million Swiss Francs) | 31.03.04) | 31.03.03) | (%) | |||||||||
ORDER INTAKE —Continuing operations | 705.9 | m | 655.3 | m | 7.7 | % | ||||||
SALES —Continuing operations | 689.1 | m | 650.3 | m | 6.0 | % | ||||||
| Surveying & Engineering | 423.4 | m | 397.5 | m | 6.5 | % | ||||||
| GIS & Mapping | 94.9 | m | 100.6 | m | –5.7 | % | ||||||
| Consumer Products | 58.6 | m | 50.6 | m | 15.9 | % | ||||||
| Metrology | 66.4 | m | 59.4 | m | 11.8 | % | ||||||
| High-Definition Surveying (HDS) | 12.8 | m | 13.5 | m | –5.4 | % | ||||||
| Special Products — Continuing operations | 33.0 | m | 27.0 | m | 22.3 | % | ||||||
| Central Services | 0.0 | m | 1.7 | m | –100.0 | % | ||||||
Gross margin —Continuing operations | ||||||||||||
in percentage of sales | 51.2 | % | 51.7 | % | –0.5pts | |||||||
EARNINGS | ||||||||||||
EBITDA —Continuing operations | 98.7 | m | 80.3 | m | 22.9 | % | ||||||
| - in percentage of sales | 14.3 | % | 12.3 | % | ||||||||
EBITA —Continuing operations | 80.7 | m | 60.3 | m | 33.7 | % | ||||||
| - in percentage of sales | 11.7 | % | 9.3 | % | ||||||||
EBIT —Continuing operations | 29.5 | m | 7.3 | m | 303.6 | % | ||||||
| - in percentage of sales | 4.3 | % | 1.1 | % | ||||||||
Operating profit —Continuing operations | 27.8 | m | 9.8 | m | 183.7 | % | ||||||
| - in percentage of sales | 4.0 | % | 1.5 | % | ||||||||
Net income Continuing operations | 5.2 | m | –13.7 | m | 137.7 | % | ||||||
| - in percentage of sales | 0.8 | % | –2.1 | % | ||||||||
Net income | 5.6 | m | 21.9 | m | –74.3 | % | ||||||
| - in percentage of sales | 0.8 | % | 3.0 | % | ||||||||
Earnings per share (CHF) | ||||||||||||
| - basic | 2.54 | 9.80 | –74.1 | % | ||||||||
| - diluted | 2.48 | 9.78 | –74.6 | % | ||||||||
Cash earnings per share (CHF) | ||||||||||||
| - basic | 35.36 | 40.71 | –13.1 | % | ||||||||
| - diluted | 34.62 | 40.71 | –15.0 | % | ||||||||
| - non-cash adjustments | 72.89 | 68.04 | 7.1 | % | ||||||||
Leica Geosystems, 10 June, 2004 | 6 | 4Q & Full Year Results FY04 |
Table of Contents
4th Quarter FY 04 Divisional Results of Leica Geosystems
| Percentage of | Division | Division | EBITDA- | |||||||||||||
| Total Sales | Sales | EBITDA | Margin % of | |||||||||||||
| Division | (%) | (CHF) | (CHF) | Sales | ||||||||||||
| Surveying & Engineering | 62 | % | 114.4m | 18.8m | 16.4 | % | ||||||||||
| GIS & Mapping | 14 | % | 25.7m | 4.7m | 18.2 | % | ||||||||||
| Consumer Products | 9 | % | 17.3m | 3.5m | 20.1 | % | ||||||||||
| Metrology | 9 | % | 16.9m | 1.9m | 11.0 | % | ||||||||||
| High-Definition Surveying (HDS) | 2 | % | 3.2m | –3.5m | –108.6 | % | ||||||||||
| Special Products | 4 | % | 7.4m | 2.8m | 37.6 | % | ||||||||||
Central Services | 0 | % | 0.0m | –3.5m | — | |||||||||||
Total 4th Quarter | 100 | % | 184.9m | 24.5m | 13.3 | % | ||||||||||
Full Year FY 04 Divisional Results of Leica Geosystems
| Percentage of | Division | Division | EBITDA- | |||||||||||||
| Total Sales | Sales | EBITDA | Margin of | |||||||||||||
| Division | (%) | (CHF) | (CHF) | Sales | ||||||||||||
| Surveying & Engineering | 61 | % | 423.4m | 78.2m | 18.5 | % | ||||||||||
| GIS & Mapping | 14 | % | 94.9m | 10.3m | 10.8 | % | ||||||||||
| Consumer Products | 9 | % | 58.6m | 8.5m | 14.4 | % | ||||||||||
| Metrology | 10 | % | 66.4m | 12.6m | 18.9 | % | ||||||||||
| High-Definition Surveying (HDS) | 2 | % | 12.8m | –9.7m | –76.2 | % | ||||||||||
| Special Products | 5 | % | 33.0m | 11.8m | 35.7 | % | ||||||||||
Central Services | 0 | % | 0.0m | –F12.4m | — | |||||||||||
Total Full Year | 100 | % | 689.1m | 99.3m | 14.4 | % | ||||||||||
* * *
Comprehensive and detailed information on Leica Geosystems’ 4Q & Full Year FY 2003/04 results is available on our website www.leica-geosystems.com/investor.
* * *
Contact Person:
George Aase, Director Investor Relations, Leica Geosystems AG, Heinrich-Wild-Strasse, CH-9435 Heerbrugg (Switzerland) — Internet: www.leica-geosystems.com
| Telephone (direct) | +41 (0)71 727 3064 | George.Aase@leica-geosystems.com | ||||
| Telephone (operator) | +41 (0)71 727 3131 | Fax | +41 (0)71 727 4678 |
Leica Geosystems, 10 June, 2004 | 8 | 4Q & Full Year Results FY04 |