As filed with the Securities and Exchange Commission on
April 2
9
, 2022
UNITED STATES SECURITIES AND EXCHANGE COMMISSION
Washington, DC 20549
FORM
20-F
☐
REGISTRATION STATEMENT PURSUANT TO SECTION 12(b) OR (g) OF THE SECURITIES EXCHANGE ACT OF 1934or
☒
ANNUAL REPORT PURSUANT TO SECTION 13 OR 15(d) OF THE SECURITIES EXCHANGE ACT OF 1934For the fiscal year
ended December 31, 2021
or
☐
TRANSITION REPORT PURSUANT TO SECTION 13 OR 15 (d) OF THE SECURITIES EXCHANGE ACT OF 1934or
☐
SHELL COMPANY REPORT PURSUANT TO SECTION 13 OR 15(d) OF THE SECURITIES EXCHANGE ACT OF 1934Date of event requiring this shell company report______________
For the transition period from _______________ to ________________
Commission file number:
1-16269
AMÉRICA MÓVIL, S.A.B. DE C.V.
(exact name of registrant as specified in its charter)
America Mobile
(translation of registrant’s name into English)
United Mexican States
(jurisdiction of incorporation)
Lago Zurich 245, Plaza Carso / Edificio Telcel, Colonia Ampliación Granada, Miguel Hidalgo, 11529, Mexico City, Mexico
(address of principal executive offices)
Daniela Lecuona Torras
Lago Zurich 245
,Plaza Carso
/ Edificio Telcel, Piso 16, Colonia Ampliación Granada, Miguel Hidalgo 11529 Mexico City,Telephone: (5255) 2581-3700 / Facsimile: (5255) 2581-4422
E-mail:
daniela.lecuona@americamovil.com(name, telephone,
e-mail
and/or facsimile number and address of company contact person)Securities registered pursuant to Section 12(b) of the Act:
Title of each class: | Trading symbol | Name of each exchange on which registered | ||
A Shares, without par value | AMOV | New York Stock Exchange | ||
L Shares, without par value | AMX | New York Stock Exchange | ||
3.625% Senior Notes Due 2029 | AMX29 | New York Stock Exchange | ||
2.875% Senior Notes Due 2030 | AMX30 | New York Stock Exchange | ||
6.375% Notes Due 2035 | AMX35 | New York Stock Exchange | ||
6.125% Notes Due 2037 | AMX37 | New York Stock Exchange | ||
6.125% Senior Notes Due 2040 | AMX40 | New York Stock Exchange | ||
4.375% Senior Notes Due 2042 | AMX42 | New York Stock Exchange | ||
4.375% Senior Notes Due 2049 | AMX49 | New York Stock Exchange |
Securities registered pursuant to Section 12(g) of the Act: None
Securities for which there is a reporting obligation pursuant to Section 15(d) of the Act: None
The number of outstanding shares of each of the registrant’s classes of capital or common stock as of December 31, 2021:
20,555 million | AA Shares | |
502 million | A Shares | |
45,582 million | L Shares |
| Indicate by check mark if the registrant is a well-known seasoned issuer, as defined in Rule 405 of the Securities Act. | Yes | ✓ | No | |||||
| If this report is an annual or transition report, indicate by check mark if the registrant is not required to file reports pursuant to Section 13 or 15(d) of the Securities Exchange Act of 1934. | Yes | No | ✓ | |||||
| Indicate by check mark whether the registrant: (1) has filed all reports required to be filed by Section 13 or 15(d) of the Securities Exchange Act of 1934 during the preceding 12 months (or for such shorter period that the registrant was required to file such reports) and (2) has been subject to such filing requirements for the past 90 days. | Yes | ✓ | No | |||||
| Indicate by check mark whether the registrant has submitted electronically every Interactive Data File required to be submitted pursuant to Rule 405 of Regulation S-T (§ 232.405 of this Chapter) during the preceding 12 months (or for such shorter period that the registrant was required to submit such files). | Yes | ✓ | No | |||||
Indicate by check mark whether the registrant is a large accelerated filer, an accelerated filer, a
non-accelerated
filer, or an emerging growth company. See the definitions of “large accelerated filer,” “accelerated filer,” and “emerging growth company” in Rule12b-2
of the Exchange Act| ✓ | Large accelerated filer | Accelerated filer | Non-accelerated filer | Emerging growth company | ||||||||||||
| Indicate by check mark whether the registrant has filed a report on and attestation to its management’s assessment of the effectiveness of its internal control over financial reporting under Section 404(b) of the Sarbanes-Oxley Act (15 U.S.C. 7262(b)) by the registered public accounting firm that prepared or issued its audit report. | Yes | ✓ | No | |||||
Indicate by check mark which basis of accounting the registrant has used to prepare the financial statements
included
in this filing| U.S. GAAP | ✓ | International Financial Reporting Standards as issued by the International Accounting Standards Board | Other | |||||||||||
If “other” has been checked in response to the previous question, indicate by check mark which financial statement item the registrant has elected to follow.
Item 17 Item 18
| If this is an annual report, indicate by check mark whether the registrant is a shell company (as defined in Rule 12b-2 of the Exchange Act). | Yes | No | ✓ |


TABLE OF CONTENTS | ||||
(See Form 20-F Cross Reference Guide on page 89) | ||||
6 | ||||
9 | ||||
10 | ||||
16 | ||||
17 | ||||
18 | ||||
20 | ||||
22 | ||||
23 | ||||
25 | ||||
31 | ||||
36 | ||||
48 | ||||
49 | ||||
50 | ||||
50 | ||||
51 | ||||
51 | ||||
52 | ||||
53 | ||||
58 | ||||
59 | ||||
63 | ||||
65 | ||||
67 | ||||
68 | ||||
70 | ||||
85 | ||||
86 | ||||
86 | ||||
87 | ||||
87 | ||||
88 | ||||
89 | ||||
91 | ||||
93 | ||||
5

SELECTED FINANCIAL DATA We prepared our audited consolidated financial statements included in this annual report in accordance with International Financial Reporting Standards as issued by the International Accounting Standards Board (“IFRS”). The selected financial information should be read in conjunction with, and is qualified in its entirety by reference to, our audited consolidated financial statements. We present our consolidated financial statements in Mexican pesos. This annual report contains translations of various peso amounts into U.S. dollars at specified rates solely for your convenience. You should not construe these translations as representations that the peso amounts actually represent the U.S. dollar amounts or could be converted into U.S. dollars at the rate indicated. Unless otherwise indicated, we have translated U.S. dollar amounts from pesos at the exchange rate of Ps.20.5835 to U.S.$1.00, which was the rate reported by Banco de México on December 30, 2021, as published in the Official Gazette of the Federation ( Diario Oficial de la Federación On November 23, 2021, we completed the sale of our U.S. operations to Verizon Communications Inc. (“Verizon”), as previously disclosed in our press release furnished on a report on Form 6-K on November 23, 2021. As a result, in accordance with IFRS 5, TracFone Wireless Inc.’s (“TracFone”) operations are classified as discontinued operations for all years presented in the consolidated financial information included in this report. Accordingly, results are presented in a single amount as profit after tax from discontinued operations in the consolidated financial information included in this annual report. Operating and financial information presented herein therefore excludes TracFone, including for periods prior to the sale.We have not included earnings or dividends on a per American Depositary Share (“ADS”) basis. Each L Share ADS represents 20 L Shares and each A Share ADS represents 20 A Shares. |
6
FOR THE YEAR ENDED DECEMBER 31, | ||||||||||||||||||||||||||||||||
2019 | 2020 | 2021 | 2021 | |||||||||||||||||||||||||||||
| (in millions of Mexican pesos, except share and per share amounts) | | (in millions of U.S. dollars, except share and per share amounts) | ||||||||||||||||||||||||||||||
STATEMENT OF COMPREHENSIVE INCOME DATA: | ||||||||||||||||||||||||||||||||
Operating revenues | Ps. | 851,483 | Ps. | 839,707 | Ps. | 855,535 | U.S. | 41,564 | ||||||||||||||||||||||||
Operating costs and expenses | 707,685 | 694,204 | 689,402 | 33,494 | ||||||||||||||||||||||||||||
Depreciation and amortization | 157,519 | 162,682 | 162,627 | 7,901 | ||||||||||||||||||||||||||||
Operating income | 143,798 | 145,503 | 166,133 | 8,070 | ||||||||||||||||||||||||||||
Net profit for the year continued | Ps. | 60,468 | Ps. | 34,034 | Ps. | 74,615 | U.S. | 3,625 | ||||||||||||||||||||||||
Net profit for the year discontinued | 9,845 | 16,993 | 121,711 | 5,913 | ||||||||||||||||||||||||||||
Net profit for the year | Ps. | 70,313 | Ps. | 51,027 | Ps. | 196,326 | U.S. | 9,538 | ||||||||||||||||||||||||
Net profit attributable for the year to: | ||||||||||||||||||||||||||||||||
Equity holders of the parent continued | Ps. | 57,886 | Ps. | 29,860 | Ps. | 70,712 | U.S. | 3,435 | ||||||||||||||||||||||||
Equity holders of the parent discontinued | 9,845 | 16,993 | 121,711 | 5,913 | ||||||||||||||||||||||||||||
Equity holders of the parent | Ps. | 67,731 | Ps. | 46,853 | Ps. | 192,423 | U.S. | 9,348 | ||||||||||||||||||||||||
Non-controlling interests | 2,582 | 4,174 | 3,903 | 190 | ||||||||||||||||||||||||||||
Net profit for the year | Ps. | 70,313 | Ps. | 51,027 | Ps. | 196,326 | U.S. | 9,538 | ||||||||||||||||||||||||
Earnings per share: | ||||||||||||||||||||||||||||||||
Basic diluted continued | Ps. | 0.88 | Ps. | 0.45 | Ps. | 1.07 | U.S. | 0.05 | ||||||||||||||||||||||||
Basic diluted discontinued | Ps. | 0.15 | Ps. | 0.26 | Ps. | 1.85 | U.S. | 0.09 | ||||||||||||||||||||||||
Dividends declared per share (1) | Ps. | 0.35 | Ps. | 0.38 | Ps. | 0.40 | U.S. | 0.02 | ||||||||||||||||||||||||
Weighted average number of shares outstanding (millions): | ||||||||||||||||||||||||||||||||
Basic | 66,016 | 66,265 | 65,967 | - | ||||||||||||||||||||||||||||
Diluted | 66,016 | 66,265 | 65,967 | - | ||||||||||||||||||||||||||||
BALANCE SHEET DATA: | ||||||||||||||||||||||||||||||||
Property, plant and equipment, net | Ps. | 639,343 | Ps. | 722,930 | Ps. | 731,197 | U.S. | 35,523 | ||||||||||||||||||||||||
Right of use assets | 118,003 | 101,977 | 90,372 | 4,391 | ||||||||||||||||||||||||||||
Total assets | 1,531,934 | 1,625,048 | 1,689,650 | 82,086 | ||||||||||||||||||||||||||||
Short-term debt and current portion of long-term debt | 129,172 | 148,083 | 145,223 | 7,055 | ||||||||||||||||||||||||||||
Short-term lease debt | 25,895 | 25,068 | 27,632 | 1,342 | ||||||||||||||||||||||||||||
Long-term debt | 495,082 | 480,300 | 418,807 | 20,347 | ||||||||||||||||||||||||||||
Long-term lease debt | 94,702 | 84,259 | 71,022 | 3,450 | ||||||||||||||||||||||||||||
Capital stock | 96,338 | 96,342 | 96,333 | 4,680 | ||||||||||||||||||||||||||||
Total equity | Ps. | 226,907 | Ps. | 315,118 | Ps. | 454,042 | U.S. | 22,057 | ||||||||||||||||||||||||
NUMBER OF OUTSTANDING SHARES (MILLIONS): | ||||||||||||||||||||||||||||||||
AA Shares | 20,607 | 20,578 | 20,555 | - | ||||||||||||||||||||||||||||
A Shares | 531 | 520 | 502 | - | ||||||||||||||||||||||||||||
L Shares | 44,872 | 45,764 | 43,633 | - | ||||||||||||||||||||||||||||
(1) | Figures for each year provided represent the annual dividend declared at the general shareholders’ meeting that year. For information on dividends paid per share translated into U.S. dollars, see “Share Ownership and Trading—Dividends” under Part IV of this annual report. |
(2) | For the years 2019 to 2020 the financial statements were modified for the sale of TracFone. See Note 2 Ac to our audited consolidated financial statements included in this annual report. |
7

8

9

BUSINESS OVERVIEW
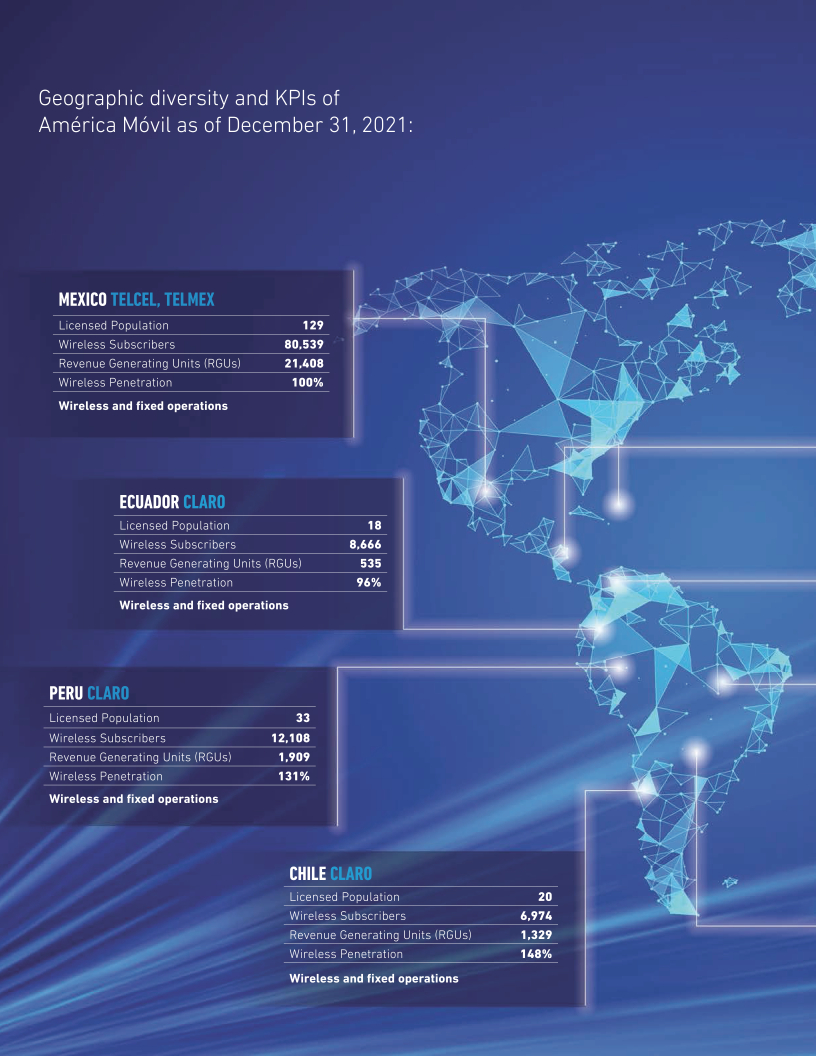
We provide telecommunications services in 24 countries. We are a leading telecommunications services provider in Latin America, ranking first in wireless, fixed-line, broadband and Pay TV services based on the number of revenue generating units (“RGUs”).
Our largest operations are in Mexico and Brazil, which together account for over half of our total RGUs and where we have the largest market share based on RGUs. We also have operations in 15 other countries in the Americas and seven countries in Central and Eastern Europe as of December 31, 2021. For a list of our principal subsidiaries, see Note 2 a(ii) to our audited consolidated financial statements and “Additional Information—Exhibit 8.1” under Part VII of this annual report.
We intend to build on our position as a leader in integrated telecommunications services in Latin America and the Caribbean, and to grow in other parts of the world by continuing to expand our subscriber base through the development of our existing businesses and strategic acquisitions when opportunities arise. We have developed world-class integrated telecommunications platforms to offer our customers new services and enhanced communications solutions with higher data speed transmissions at lower prices. We continue investing in our networks to increase coverage and implement new technologies to optimize our network capabilities. See “Operating and Financial Review and Prospects—Overview” under Part II of this annual report for a discussion on the seasonality of our business.
On November 23, 2021, we completed the sale of our U.S. operations to Verizon, as previously disclosed in our press release furnished on a report on Form 6-K on November 23, 2021. As a result, in accordance with IFRS 5, TracFone’s operations are classified as discontinued operations for all years presented in the consolidated financial information included in this report. Accordingly, results are presented in a single amount as profit after tax from discontinued operations in the consolidated financial information included in this annual report. Operating and financial information presented herein therefore excludes Tracfone, including for periods prior to the sale.
The following map illustrates the geographic diversity of our operations and certain key performance indicators (“KPIs”) as of December 31, 2021.
HISTORY AND CORPORATE INFORMATION
América Móvil, S.A.B. de C.V. (“América Móvil,” “we” or the “Company”) is a
Sociedad Anónima Bursátil de Capital Variable
organized under the laws of Mexico.
We were established in 2000 when Teléfonos de México, S.A.B. de C.V. (“Telmex”), a fixed-line Mexican telecommunications operator privatized in 1990, spun off to us its wireless operations in Mexico and other countries. We have made significant acquisitions throughout Latin America, the United States, the Caribbean and Europe, and we have also expanded our businesses organically.
Our principal executive offices are located at Lago Zurich 245, Plaza Carso / Edificio Telcel, Colonia Ampliación Granada, Miguel Hidalgo, 11529, Mexico City, Mexico. Our telephone number at this location is (5255) 2581-3700.
10
11

12
KEY PERFORMANCE INDICATORS
We have identified RGUs as a KPI that helps measure the performance of our operations. The table below includes the number of our wireless subscribers and our fixed RGUs, which together make up the total RGUs, in the countries where we operate. Wireless subscribers consist of the number of prepaid and postpaid subscribers to our wireless services. Fixed RGUs consist of fixed voice, fixed data and Pay TV units (which include customers of our Pay TV services and, separately, of certain other digital services). The figures below reflect total wireless subscribers and fixed RGUs of all our consolidated subsidiaries, without adjustments to reflect our equity interest, in the following reportable segments:
| • | Mexico Wireless; |
| • | Mexico Fixed; |
| • | Brazil; |
| • | Colombia; |
| • | Southern Cone (Argentina, Chile, Paraguay and Uruguay); |
| • | Andean Region (Ecuador and Peru); |
| • | Central America (Costa Rica, El Salvador, Guatemala, Honduras, Nicaragua and Panama); |
| • | the Caribbean (the Dominican Republic and Puerto Rico); and |
| • | Europe (Austria, Belarus, Bulgaria, Croatia, Macedonia, Serbia and Slovenia). |
AS OF DECEMBER 31, | ||||||||||||
2019 | 2020 | 2021 | ||||||||||
(in thousands) | ||||||||||||
WIRELESS SUBSCRIBERS | ||||||||||||
Mexico | 76,918 | 77,789 | 80,539 | |||||||||
Brazil | 54,488 | 63,140 | 70,541 | |||||||||
Colombia | 31,104 | 33,009 | 35,062 | |||||||||
Southern Cone | 31,507 | 30,669 | 33,322 | |||||||||
Andean Region | 20,104 | 18,877 | 20,774 | |||||||||
Central America | 15,488 | 15,044 | 16,508 | |||||||||
Caribbean | 6,244 | 6,422 | 7,020 | |||||||||
Europe | 21,296 | 21,864 | 22,766 | |||||||||
Total Wireless Subscribers | 257,149 | 266,814 | 286,532 | |||||||||
FIXED RGUS: | ||||||||||||
Mexico | 21,992 | 21,925 | 21,408 | |||||||||
Brazil | 34,048 | 32,648 | 31,287 | |||||||||
Colombia | 7,613 | 8,318 | 8,876 | |||||||||
Southern Cone | 2,514 | 2,836 | 3,349 | |||||||||
Andean Region | 2,049 | 2,158 | 2,444 | |||||||||
Central America | 4,409 | 4,247 | 4,412 | |||||||||
Caribbean | 2,528 | 2,558 | 2,608 | |||||||||
Europe | 6,143 | 6,050 | 6,082 | |||||||||
Total Fixed RGUs | 81,296 | 80,740 | 80,466 | |||||||||
Total RGUs | 338,445 | 347,554 | 366,998 | |||||||||
PRINCIPAL BRANDS
We operate in all of our geographic segments under the Claro brand name, except in Mexico and Europe, where we principally do business under the brand names listed below.
COUNTRY | PRINCIPAL BRANDS | SERVICES AND PRODUCTS | ||
Mexico | Telcel | Wireless voice | ||
| Wireless data | ||||
| Telmex Infinitum | Fixed voice | |||
| Fixed data | ||||
Europe | A1 | Wireless voice | ||
| Wireless data | ||||
| Fixed voice | ||||
| Fixed data | ||||
| Pay TV | ||||
SERVICES AND PRODUCTS
We offer a wide range of services and products that vary by market, including wireless voice, wireless data and value-added services, fixed voice, fixed data, broadband and IT services, Pay TV and(“OTT”) services.
over-the-top
Wireless Operations
In 2021, our wireless voice and data operations generated revenues of Ps.549.7 billion, representing 54.5% of our consolidated revenues. As of December 31, 2021, our wireless operations represented approximately 78.1% of our total RGUs, the same as of December 31, 2020.
VOICE AND DATA.
Our wireless subsidiaries provide voice communication services across the countries in which they operate. We offer international roaming services to our wireless subscribers through a network of cellular service providers with which our wireless subsidiaries have entered into international roaming agreements around the world, and who provide GSM, 3G and
4G-LTE
roaming services.The voice and data plans are either “postpaid,” where the customer is billed monthly for the previous month, or “prepaid,” where the customer pays in advance for a specified volume of use over a specified period. Postpaid plans increased as a percentage of the wireless base from 34.0% in December 2020 to 37.6% as of December 31, 2021, while prepaid plans represented 62.4% as of December 31, 2021.
Our wireless voice services are offered under a variety of plans to meet the needs of different market segments. In addition, we often bundle wireless data communications services together with wireless voice services. Our wireless subsidiaries had approximately 286.5 million wireless voice and data subscribers as of December 31, 2021.
13

Prepaid customers typically generate lower levels of usage and are often unwilling or financially ineligible to purchase postpaid plans. Our prepaid plans have been instrumental to increase wireless penetration in Latin America and Eastern Europe to levels similar to those of developed markets. Additionally, prepaid plans entail little to no risk of
non-payment,
as well as lower customer acquisition costs and billing expenses, compared to the average postpaid plan.In general, our average rates per minute of wireless voice are very competitive for both prepaid and postpaid plans. On average, rates per minute of wireless voice used in 2021 decreased by approximately 1.1% at constant exchange rates relative to 2020.
In addition, the plans we offer our retail customers include selective discounts and promotions that reduce the rates our customers pay.
VALUE-ADDED SERVICES.
As part of our wireless data business, our subsidiaries offer value-added services that include Internet access, messaging and other wireless entertainment and corporate services through GSM/EDGE, 3G and 4G LTE networks.
Internet services include roaming capability and wireless Internet connectivity for feature phones, smartphones, tablets and laptops, including data transmission,services, mobile banking, virtual private network (”VPN“) services, video calls and personal communications services (”PCS“).
e-mail
services, instant messaging, content streaming and interactive applications. For example, in Mexico, our website for our wireless services (www.telcel.com) through Radiomóvil Dipsa, S.A. de C.V (”Telcel“), offers a wide range of services and content such as video, music, games and other applications, which our subscribers can access from mobile devices. In addition, we offer other wireless services, including wireless security services, mobile payment solutions,machine-to-machine
Fixed Operations
In 2021, our fixed voice, data, broadband and IT solutions had revenues of Ps.272.3 billion, representing 27.0% of our consolidated revenues. As of December 31, 2021, our fixed operations represented approximately 21.9% of our total RGUs, the same as of December 31, 2020.
VOICE.
Our fixed voice services include local, domestic and international long-distance, under a variety of plans to meet the needs of different market segments, specifically tailored to our residential and corporate clients.
DATA.
We offer data services, including data centers, data administration and hosting services to our residential and corporate clients under a variety of plans.
BROADBAND.
We provide residential broadband access through hybrid
fiber-coaxial
(”HFC“) orfiber-optic
cable. These services are typically bundled with voice services and are competitively priced as a function of the desired or available speed. As a complement to these services, we offer a number of products such as home networking and smart home services.IT SOLUTIONS.
Our subsidiaries provide a number of different IT solutions for small businesses and large corporations. We also provide specific solutions to the industrial, financial, government and tourism sectors, among others.
Pay TV
We offer Pay TV through cable and satellite TV subscriptions to both retail and corporate customers under a variety of plans. As of December 31, 2021, we had approximately 19.8 million Pay TV RGUs, a decrease of approximately 309 thousand Pay TV RGUs from the prior year.
Equipment, accessories and computer sales
Equipment, accessories and computer sales primarily include the sale of handsets, accessories and other equipment.
Other Services
Other services include other businesses such as telephone directories, call center services, wireless security services, advertising, media and software development services.
OTT Services
We sell video, audio and other media content that is delivered through the internet directly from the content provider to the viewer or end user. Our most important service is ClaroVideo, an
on-demand
internet streaming video provider with more than 20,900 content titles sold across all the Latin American and Caribbean markets in which we operate. We offer bundled packages of ClaroVideo, which may include:| • | Subscription video on demand, providing unlimited access to a catalogue of over 20,900 titles for a fixed monthly subscription fee; |
| • | Transactional video on demand and electronic sell-through, offering the option to rent or buy new content releases; and |
| • | Add-on services such as subscription and other OTT services through a platform payment system, including access to FOX, HBO, Noggin and Paramount+, among others. |
We also offer an advertised and unlimited music streaming and downloading service in 16 countries in Latin America and Europe through ClaroMúsica, with access to approximately 50 million titles across all music genres.
14
Services and Products by Country
The following table is a summary of our principal services rendered and products produced as of December 31, 2021 in the countries in which we operate.
WIRELESS VOICE, DATA AND VALUE ADDED SERVICES (1) | FIXED VOICE, BROADBAND, DATA AND IT SERVICES (2) | PAY TV | OTT SERVICES (3) | |||||
Argentina | 🌑 | 🌑 | 🌑 | 🌑 | ||||
Austria | 🌑 | 🌑 | 🌑 | 🌑 | ||||
Belarus | 🌑 | 🌑 | 🌑 | 🌑 | ||||
Brazil | 🌑 | 🌑 | 🌑 | 🌑 | ||||
Bulgaria | 🌑 | 🌑 | 🌑 | 🌑 | ||||
Chile | 🌑 | 🌑 | 🌑 | 🌑 | ||||
Colombia | 🌑 | 🌑 | 🌑 | 🌑 | ||||
Costa Rica | 🌑 | 🌑 | 🌑 | 🌑 | ||||
Croatia | 🌑 | 🌑 | 🌑 | 🌑 | ||||
Dominican Republic | 🌑 | 🌑 | 🌑 | 🌑 | ||||
Ecuador | 🌑 | 🌑 | 🌑 | 🌑 | ||||
El Salvador | 🌑 | 🌑 | 🌑 | 🌑 | ||||
Guatemala | 🌑 | 🌑 | 🌑 | 🌑 | ||||
Honduras | 🌑 | 🌑 | 🌑 | 🌑 | ||||
Macedonia | 🌑 | 🌑 | 🌑 | 🌑 | ||||
Mexico | 🌑 | 🌑 | 🌑 (4) | |||||
Nicaragua | 🌑 | 🌑 | 🌑 | 🌑 | ||||
Panama | 🌑 | 🌑 | 🌑 | 🌑 | ||||
Paraguay | 🌑 | 🌑 | 🌑 | 🌑 | ||||
Peru | 🌑 | 🌑 | 🌑 | 🌑 | ||||
Puerto Rico | 🌑 | 🌑 | 🌑 | 🌑 | ||||
Serbia | 🌑 | 🌑 | ||||||
Slovenia | 🌑 | 🌑 | 🌑 | 🌑 | ||||
Uruguay | 🌑 | 🌑 | ||||||
(1) Includes voice communication and international roaming services, interconnection and termination services, SMS, MMS,e-mail, mobile browsing, entertainment and gaming applications.(2) Includes local calls, national and international long distance.(3) Includes ClaroVideo and ClaroMúsica.(4) Services provided bynon-concessionaire subsidiaries. | ||||||||
15

Our networks are one of our main competitive advantages. Today, we own and operate one of the largest integrated platforms based on our covered population across 17 countries in Latin America, and we are expanding our network in Europe.
INFRASTRUCTURE
For the year ended December 31, 2021, our capital expenditures totaled Ps.158.1 billion, which allowed us to increase our network, to expand our capacity and to upgrade our systems to operate with the latest technologies. With fully convergent platforms, we are able to deliver high-quality voice, video and data products.
As of December 31, 2021, the main components of our infrastructure were comprised of:
| • | Cell sites: spin-off of our towers and related passive infrastructure in Latin America outside of Mexico. See “Acquisitions, Other Investments and Divestitures.” |
| • | Fiber-optic network: |
| • | Submarine cable systems: AMX-1 submarine cable that extends 18,300 km and connects the United States to Central and South America with 13 landing points and also the South Pacific Submarine Cable that extends 7,300 km along the Latin American Pacific coast, connecting Guatemala, Ecuador, Peru and Chile with 5 landing points. Both systems provide international connectivity to all of our subsidiaries in these geographic areas. |
| • | Satellites: |
| • | Data centers: |
Service (“IAAS”), Software as a Service (“SAAS”), security solutions and unified communications. |
TECHNOLOGY
Our primary wireless networks use GSM/EDGE, 3G and 4G LTE technologies, which we offer in most of the countries where we operate. We aim to increase the speed of transmission of our data services and have been expanding our 3G and 4G LTE coverage. We have begun our 5G rollout in some countries. In February 2022, we launched 5G through Telcel, which is the largest data infrastructure deployment in Latin America. At launch, we cover 18 cities in the country and by end of the year we will cover 120 cities.
We transmit wireless calls and data through radio frequencies that we use under spectrum licenses. Spectrum is a limited resource, and, as a result, we may face spectrum and capacity constraints on our wireless network. We continue to invest significant capital in expanding our network capacity and reach and to address spectrum and capacity constraints on abasis.
market-by-market
The table below presents a summary of the population covered by our network, by country, as of December 31, 2021.
GENERATION TECHNOLOGY | ||||||||||||||||
GSM | UMTS | LTE | 5G | |||||||||||||
(% of covered population) | ||||||||||||||||
Argentina | 99 | % | 98 | % | 97 | % | - | |||||||||
Austria | 100 | % | 96 | % | 99 | % | 62 | % | ||||||||
Belarus | 100 | % | 100 | % | 0 | % | - | |||||||||
Brazil | 94 | % | 95 | % | 87 | % | 17 | % | ||||||||
Bulgaria | 100 | % | 100 | % | 99 | % | 52 | % | ||||||||
Chile | 97 | % | 97 | % | 98 | % | - | |||||||||
Colombia | 91 | % | 80 | % | 73 | % | - | |||||||||
Costa Rica | 85 | % | 86 | % | 96 | % | - | |||||||||
Croatia | 99 | % | 99 | % | 99 | % | 13 | % | ||||||||
Dominican Republic | 100 | % | 99 | % | 97 | % | 6 | % | ||||||||
Ecuador | 96 | % | 80 | % | 78 | % | - | |||||||||
El Salvador | 91 | % | 88 | % | 87 | % | - | |||||||||
Guatemala | 89 | % | 89 | % | 88 | % | - | |||||||||
Honduras | 81 | % | 82 | % | 72 | % | - | |||||||||
Macedonia | 100 | % | 100 | % | 99 | % | - | |||||||||
Mexico | 94 | % | 95 | % | 93 | % | - | |||||||||
Nicaragua | 72 | % | 72 | % | 50 | % | - | |||||||||
Panama | 82 | % | 90 | % | 86 | % | - | |||||||||
Paraguay | 77 | % | 80 | % | 83 | % | - | |||||||||
Peru | 88 | % | 83 | % | 83 | % | 18 | % | ||||||||
Puerto Rico | 82 | % | 94 | % | 99 | % | 49 | % | ||||||||
Serbia | 99 | % | 98 | % | 98 | % | - | |||||||||
Slovenia | 100 | % | 100 | % | 99 | % | 19 | % | ||||||||
Uruguay | 100 | % | 99 | % | 98 | % | - | |||||||||
16

We operate in an intensely competitive industry. Competitive factors within our industry include pricing, brand recognition, service and product offerings, customer experience, network coverage and quality, development and deployment of technologies, availability of additional spectrum licenses and regulatory developments.
Our principal competitors differ, depending on the geographical market and the types of service we offer. We compete against other providers of wireless, broadband and Pay TV that operate on a multi-national level, such as AT&T Inc., Teléfonica and Millicom, as well as various providers that operate on a nationwide level, such as Telecom Argentina in Argentina and Telecom Italia in Brazil.
Competition remains intense as a result of saturation in the fixed and wireless market, increased network investment by our competitors, the development and deployment of new technologies, the introduction of new products and services, new market entrants, the availability of additional spectrum, both licensed and unlicensed, and regulatory changes.
The effects of competition on our subsidiaries depend, in part, on the size, service offerings, financial strength and business strategies of their competitors, regulatory developments and the general economic and business climate in the countries in which they operate, including demand growth, interest rates, inflation and exchange rates. The effects could include loss of market share and pressure to reduce rates. See “Regulation” under Part VI and “Risk Factors” under Part III of this annual report.
17

Geographic diversification has been a key to our financial success, as it has provided for greater stability in our cash flow and profitability and has contributed to our strong credit ratings. In recent years, we have been evaluating the expansion of our operations to regions outside of Latin America. We believe that Europe and other areas beyond Latin America present opportunities for investment in the telecommunications sector that could benefit us and our shareholders over the long term.
We continue to seek ways to optimize our portfolio, including by finding investment opportunities in telecommunications and related companies worldwide, including in markets where we are already present, and we often have several possible acquisitions under consideration. We may pursue opportunities in Latin America or in other areas in the world. Some of the assets that we acquire may require significant funding for capital expenditures. We can give no assurance as to the extent, timing or cost of such investments. We also periodically evaluate opportunities for dispositions, in particular for businesses and in geographies that we no longer consider strategic. The following are recent developments relating to acquisitions, other investments and divestitures:
| • | On September 13, 2020, we entered into an agreement to sell our wholly-owned subsidiary TracFone to Verizon. On November 23, 2021, we completed the sale of TracFone to Verizon. We received the closing consideration of U.S.$3,625.7 million in cash, which included U.S.$500.7 million of customary adjustment for TracFone’s cash and working capital and 57,596,544 shares of Verizon’s common stock, par value U.S.$0.10 per share. Verizon has asserted post-closing claims under the adjustments and other provisions of this agreement, which may result in payments by us. Subject to TracFone continuing to achieve certain operating metrics (earn-out), Verizon will be required pay up to an additional U.S.$650 million of cash consideration within two years from November 23, 2021. |
| • | In December 2020, our Brazilian subsidiary, Claro S.A. (“Claro Brasil”), together with two other offerors, won a competitive bid to acquire the mobile business owned by Oi Group in Brazil. Pursuant to the transaction, Claro Brasil will pay R$3.6 billion for 32% of Oi Group’s mobile business and approximately 4.7 thousand mobile access sites (representing 32% of Oi Group’s mobile business access sites). Claro Brasil also committed to enter into long term |
agreements with Oi Group for the supply of data transmission capacity. This transaction closed on April 20, 2022. |
| • | In February 2021, our Board of Directors approved a plan to spin off our telecommunications towers and other related passive infrastructure in Latin America outside of Mexico. The spin-off was approved by our shareholders in an extraordinary shareholders’ meeting on September 29, 2021. In thespin-off and the associated corporate restructuring, we will contribute to Sitios a portion of our capital stock, assets and liabilities, mainly consisting of the shares of our subsidiaries holding telecommunications towers and other associated infrastructure in Latin America outside of Mexico, other than Colombia and our telecommunications towers existing in Peru prior to thespin-off. This operation is intended to maximize the infrastructure’s value, as the resulting entity, to be named Sitios Latinoamérica, S.A.B. de C.V. (“Sitios”), will be separate from América Móvil and will have its own management and personnel, who will be exclusively focused on developing, building and leasing telecommunications towers for wireless services. We will have master services agreements with subsidiaries of Sitios under which we will have access to and use of the tower space to provide wireless services. Completion of thespin-off is subject to the fulfillment of conditions that are typical in these type of transactions, as well as the implementation of several previous steps in several of the countries involved in the transaction, including receipt of confirmation from the Mexican Tax Administration Service (Servicio de Administración Tributaria spin-off and the transactions contemplated thereby, among other things, comply with all requirements under Mexican tax law and regulations so that thespin-off and the corporate reorganization arising from it are considered neutral for Mexican tax purposes, and the receipt of all necessary approvals in the applicable countries and the expiration of all legal or statutory waiting periods for its effectiveness in all applicable countries, all of which are outside of our control. |
| • | On September 15, 2021, we announced that we entered into an agreement with Cable & Wireless Panama, S.A., an affiliate of Liberty Latin America LTD., to sell 100% of our interest in our subsidiary Claro Panama, S.A. The transaction excludes (i) all telecommunication towers owned indirectly by América Móvil in Panama and (ii) the Claro trademarks. The agreed purchase price is U.S.$200 million on a cash/ debt free basis. The closing of the transaction is subject to customary conditions for this type of transactions, including obtaining required governmental approvals, and we expect closing to occur during the first half of 2022. |
18

| • | On September 29, 2021, we announced an agreement with Liberty Latin America LTD. to combine our respective Chilean operations, VTR Communicaciones SpA (“VTR”) and Claro Chile, to form a 50- 50 joint venture. The proposed transaction combines the complementary operations of VTR, a leading provider of high-speed consumer fixed products, such as broadband and Pay TV services, where it connects close to 3 million subscribers nationwide, and Claro Chile, one of Chile’s leading telecommunications service providers with over 6.5 million mobile customers. Completion of the transaction is subject to certain customary closing conditions, including obtaining required regulatory approvals, and we expect closing to occur during the second half of 2022. |
For additional information on our acquisitions and investments, see Note 12 to our audited consolidated financial statements included in this annual report.
19

MARKETING
We advertise our services and products through different channels with consistent and distinct branding and targeted marketing. We advertise via print, radio, television, digital media, sports event sponsorships and other outdoor advertising campaigns. In 2021, our efforts were mainly focused on promoting our 4.5G LTE services, leveraging the speed and quality of our networks and our fixed bundled offers, which compete on broadband speed and premium content.
We build on the strength of our well-recognized brand names to increase consumer awareness and customer loyalty. Building brand recognition is crucial for our business, and we have managed to position our brands as those of a premium carrier in most countries where we operate. According to the 2021 Brand Finance Telecom 150 report, Claro and Telcel rank among the top fifty strongest brands in the telecom sector worldwide. Also, in the Brand Finance Latin America report Claro was named the most valuable telecom brand in the Latin America region and Telcel one of the top ten strongest brands. In addition, a
year-end
2021 study by Austrian Brand Monitor found that A1, the brand name behind Telekom Austria AG (“Telekom Austria” or “TKA”), ranked number one in the Austrian telecommunications market for brand preference.SALES AND DISTRIBUTION
Our extensive sales and distribution channels help us attract new customers and develop new business opportunities. We primarily sell our services and products through a network of retailers and service centers for retail customers and a dedicated sales force for corporate customers, with more than 402,000 points of sale and more than 3,300 customer service centers. Our subsidiaries also sell their services and products online.
CUSTOMER SERVICE
We give priority to providing our customers with quality customer care and support. We focus our efforts on constantly improving our customers’ experience by leveraging our commercial offerings and our sales and distribution networks. Customers may make inquiries by calling a toll-free telephone number, accessing our subsidiaries’ web sites and social media accounts or visiting one of the customer sales and service centers located throughout the countries we serve.
20

21

22

INTRODUCTION
Effects of the
COVID-19
PandemicThe unprecedented health crisis arising from the
COVID-19
pandemic has resulted in a severe global economic downturn and has caused significant volatility, uncertainty, and disruption. We continue to monitor the evolution of theCOVID-19
pandemic in the countries where we operate to take preventive measures to ensure the continuity of operations and safeguard the health and safety of our personnel and customers.During 2021, there were lockdowns and other measures implemented to control the spread of
COVID-19
in our region of operations, resulting in the closure of shops and customer-care centers, the imposition of constraints on the mobility of our clients and the disruption of our supply chain for handsets and other equipment. In order to mitigate the effects of supply-chain disruption and handset scarcity, we began ordering excess quantities of handsets in each country in which we operate in October, November and December of 2021. Most major smartphone manufacturers were able to respond to our increased handset orders.Our investments in capital expenditures are expected to return to
pre-pandemic
levels in 2022.Segments
We have operations in 24 countries, which are aggregated for financial reporting purposes into ten reportable segments. Our operations in Mexico are presented in two segments—Mexico Wireless and Mexico Fixed, which consist principally of Telcel and Telmex, respectively. Our headquarters operations are allocated to the Mexico Wireless segment. Financial information about our segments is presented in Note 23 to our audited consolidated financial statements included in this annual report.
The factors that drive our financial performance differ in the various countries where we operate, including subscriber acquisition costs, the competitive landscape, the regulatory environment, economic factors and interconnection rates, among others. Accordingly, our results of operations in each period reflect a combination of these effects on our different segments.
Constant Currency Presentation
Our financial statements are presented in Mexican pesos, but our operations outside Mexico account for a significant portion of our revenues. Currency variations between the Mexican peso and the currencies of our
non-Mexican
subsidiaries, especially the Euro, U.S. dollar, Brazilian real, Colombian and Argentine peso, affect our results of operations as reported in Mexican pesos. In the following discussion regarding our operating results, we include adiscussion of the change in the different components of our revenues between periods at constant exchange rates, i.e., using the same exchange rate to translate the local-currency results of our
non-Mexican
operations for both periods. We believe that this additional information helps investors better understand the performance of ournon-Mexican
operations and their contribution to our consolidated results.Effects of Exchange Rates
Our results of operations are affected by changes in currency exchange rates. In 2021 compared to 2020, the Mexican peso was stronger against some of our operating currencies, including the U.S. Dollar and the Euro.
Since most of our debt is issued by América Móvil out of Mexico, to the extent that our functional currency, the Mexican peso, appreciates or depreciates against the currencies in which our indebtedness is denominated, we may incur foreign exchange gains or losses that are recorded as other comprehensive income in our consolidated statements of financial position.
Changes in exchange rates also affect the fair value of derivative financial instruments that we use to manage our currency-risk exposure, which are generally not accounted for as hedging instruments. In 2021, the Mexican peso strengthened against the currencies in which most of our indebtedness is denominated, and we recorded net foreign exchange losses of Ps.17.0 and net fair value losses on derivatives of Ps.6.8. In 2020, the Mexican peso weakened against the currencies in which most of our indebtedness is denominated, and we recorded net foreign exchange losses of Ps.65.4 billion and net fair value gains on derivatives of Ps.12.4 billion. See Note 7 to our audited consolidated financial statements included in this annual report.
Effects of Regulation
We operate in a regulated industry. Our results of operations and financial condition have been, and will continue to be, affected by regulatory actions and changes. Significant regulatory developments are presented in more detail in “Regulation” under Part VI and “Risk Factors” under Part III of this annual report.
Comparison of Results of Operations Between 2020 and 2019
Discussions of year-over-year comparisons between 2020 and 2019 that are not included in this report can be found in under Part II, Operating and Financial Review and Prospects of our Form
20-F
for the fiscal year ended December 31, 2020 as filed on April 29, 2021.23
Composition of Operating Revenues
In 2021, our total operating revenues were Ps.855.5.
Revenues from wireless and fixed voice services primarily include charges from monthly subscriptions, usage charges billed to customers and usage charges billed to other service providers for calls completed on our network. The primary drivers of revenues from monthly subscription charges are the number of total RGUs and the prices of our service packages. The primary driver of revenues from usage charges (airtime, international and long- distance calls and interconnection costs) is traffic, which is represented by the number of total RGUs and their average usage.
Revenues from wireless and fixed data services primarily include charges for data, cloud, internet,OTT services and data center services. In addition, revenues from value-added services and IT solutions, including revenues from dedicated links and VPN services to our corporate clients, also contribute to our results for wireless and fixed data services.
machine-to-machine,
Pay TV revenues consist primarily of charges from subscription services, additional programming, including
on-demand
programming and advertising.Equipment, accessories and computer sales revenues primarily include revenues from the sale of handsets, accessories and other equipment such as smart devices. Most of our sales in handsets are driven by the number of new customers and contract renewals.
Other services primarily include revenues from software and system development, call center services, entertainment content and news, telephone directories, advertising, cybersecurity services, mobile banking and corporate IT solutions.
Seasonality of our Business
Our business is subject to a certain degree of seasonality, characterized by a higher number of new customers during the fourth quarter of each year. We believe this seasonality is mainly driven by the Christmas shopping season. Revenue also tends to decrease during the months of August and September, when family expenses shift towards school supplies in many of the countries in which we operate, mainly Mexico.
General Trends Affecting Operating Results
Our results of operations in 2021 reflected several continuing long-term trends, including:
| • | intense competition, with growing costs for marketing and subscriber acquisition and retention, as well as declining customer prices; |
| • | developments in the telecommunications regulatory environment; |
| • | growing demand for data services over fixed and wireless networks, as well as for smartphones and devices with data service capabilities; |
| • | declining demand for voice services; |
| • | increasing capital expenditures in line with our historical capital expenditure levels after a decrease in capital expenditures in 2020 due to pressures from the COVID-19 pandemic; |
| • | our continued strategic focus on controlling operating costs in view of pressures from costs of customer care, the growing size and complexity of our infrastructure and general price inflation; and |
| • | instability in economic conditions caused by political uncertainty, inflation and volatility in financial markets and exchange rates. |
These trends are broadly characteristic of our businesses in all regions in recent years, and they have affected comparable telecommunications providers as well.
24

CONSOLIDATED RESULTS OF OPERATIONS FOR 2021 AND 2020
Operating Revenues
Total operating revenues for 2021 increased by 1.9%, or Ps.15.8 billion, over 2020. At constant exchange rates, total operating revenues for 2021 increased by 7.8% over 2020. This increase principally reflects an increase in
one-off
items including the impact of the sale of towers by our subsidiary Telmex and an increase in equipment sales and handset financing revenues, partially offset by a decrease in Pay TV service revenues.SERVICE REVENUES.
Service revenues for 2021 increased by 0.8%, or Ps.5.8 billion, over 2020. At constant exchange rates, service revenues for 2021 increased by 6.8% over 2020. This increase principally reflects increases in revenues from our postpaid mobile services, fixed broadband and corporate networks, which were partially offset by a decrease in revenues from our Pay TV services.
SALES OF EQUIPMENT.
Sales of equipment revenues for 2021 increased by 7.7%, or Ps.10.1 billion, over 2020. At constant exchange rates, sales of equipment revenues for 2021 increased by 12.8% over 2020. This increase principally reflects higher sales of smartphones, data-enabled devices and accessories.
Operating Costs and Expenses
TOTAL OPERATING COSTS AND EXPENSES.
Total operating costs and expenses for 2021 decreased by 0.9%, or Ps.4.8 billion, over 2020. At constant exchange rates, total operating costs and expenses for 2021 increased by 4.9% over 2020. This increase in operating costs and expenses at constant exchange rates principally reflects increased network maintenance, infrastructure, lease space and electric energy costs and certain
one-off
items, including awrite-off
of certain uncollectible accounts.COST OF SALES AND SERVICES.
Cost of sales and services increased by 1.8%, or Ps.6.2 billion, over 2020. At constant exchange rates, cost of sales and services for 2021 increased by 7.3% over 2020. This increase principally reflects an increase in sales of
higher-end
smartphones and handset financing plans as well as increased network maintenance, infrastructure, lease space and electricity costs. This increase, which was also due to inflationary pressures, was partially offset by the success of our continued cost savings program.COMMERCIAL, ADMINISTRATIVE AND GENERAL EXPENSES.
Commercial, administrative and general expenses for 2021 decreased by 5.8%, or Ps.11.1 billion, over 2020. As a percentage of operating revenues, commercial, administrative and general expenses were 21.1% for 2021, as compared to
22.9% for 2020. At constant exchange rates, commercial, administrative and general expenses for 2021 increased by 0.7% over 2020. This increase principally reflects one-off items, including a
write-off
of certain uncollectible accounts, which decreased our balance of expenditures.OTHER EXPENSES.
Other expenses for 2021 increased by Ps.0.1 billion over 2020.
DEPRECIATION AND AMORTIZATION.
Depreciation and amortization for 2021 decreased by 0.03%, or Ps.0.1 billion, over 2020. As a percentage of operating revenues, depreciation and amortization were 19.0% for 2021, as compared to 19.4% for 2020. At constant exchange rates, depreciation and amortization for 2021 increased by 8.5% over 2020. This increase principally reflects depreciation and amortization expenses resulting from the revaluation of the passive infrastructure of the telecommunications towers, which became effective as of December 31, 2020.
Operating Income
Operating income for 2021 increased by 14.2%, or Ps.20.6 billion, over 2020. Operating margin (operating income as a percentage of operating revenues) was 19.4% for 2021, as compared to 17.3% for 2020.
Non-Operating
ItemsNET INTEREST EXPENSE.
Net interest expense (interest expense less interest income) for 2021 decreased by 4.2%, or Ps.1.4 billion, over 2020. This decrease principally reflects a decrease in interest expense on lease liabilities and a decrease in interest on debt.
FOREIGN CURRENCY EXCHANGE LOSSES,
NET. We recorded a net foreign currency exchange loss of Ps.17.0 billion for 2021, compared to our net foreign currency exchange loss of Ps.65.4 billion for 2020. The loss principally reflects the appreciation of some of the currencies in which our indebtedness is denominated, particularly the euro and the U.S. dollar.
VALUATION OF DERIVATIVES, INTEREST COST FROM LABOR OBLIGATIONS AND OTHER FINANCIAL ITEMS, NET.
We recorded a net loss of Ps.14.3 billion for 2021 on the valuation of derivatives, interest cost from labor obligations and other financial items, net, compared to a net gain of Ps.1.3 billion for 2020. The change in 2021 principally reflects a loss on hedging instruments as a result of the depreciation of some of the currencies in which our indebtedness is denominated.
INCOME TAX.
Our income tax expense related to continuing operations for 2021 increased by 108.3%, or Ps.14.6 billion, over 2020. This increase principally reflects higher profit before income tax due to a decrease in our net foreign currency exchange loss of Ps.48.3 billion compared to 2020.
25
Our income tax expense related to discontinued operations for 2021 resulted from the sale of 100% of our ownership in TracFone as described above.
Our effective corporate income tax rate as a percentage of profit before income tax was 22.5% for 2021, compared to 24.3% for 2020. This rate differed from the Mexican statutory rate of 30.0% and changed year over year principally due to our discontinued operations, local tax inflation effects and registry of benefits related to tax losses credits in Brazil and Chile and impairment related to subsidiaries in Europe, which lowered our income tax expense and our effective corporate income tax for 2021.
Net Profit
We recorded a net profit of our continuing operations of Ps.74.6 billion for 2021, an increase of 119.2%, or Ps.40.6 billion over 2020.
The net profit obtained through both the operation of TracFone until its sale on November 23, 2021 and the sale itself is classified as net profit for the period discontinued, which totaled Ps.121.7 billion in 2021. Together with the net income of our continuing operations, in 2021, we recorded a net profit of Ps.196.3 billion, compared to Ps.51.0 billion in 2020.
SEGMENT RESULTS OF OPERATIONS
We discuss below the operating results of each reportable segment. Notes 2. z) and 23 to our audited consolidated financial statements describe how we translate the financial statements of our
non-Mexican
subsidiaries. Exchange rate changes between the Mexican peso and the currencies in which our subsidiaries operate affect our reported results in Mexican pesos and the comparability of reported results between periods.The following table sets forth the exchange rates used to translate the results of our significant non Mexican operations, as expressed in Mexican pesos per foreign currency unit, and the change from the rate used in the prior period indicated. The U.S. dollar is our functional currency in several of the countries or territories in which we operate, including Ecuador, Puerto Rico, Panama and El Salvador.
MEXICAN PESOS PER FOREIGN CURRENCY UNIT (AVERAGE FOR THE PERIOD) FOR THE YEARS ENDED DECEMBER 31, | ||||||||||||
2020 | 2021 | % CHANGE | ||||||||||
Brazilian real | 4.1850 | 3.7625 | (10.1 | ) | ||||||||
Colombian peso | 0.0058 | 0.0054 | (7.1 | ) | ||||||||
Argentine peso | 0.3070 | 0.2137 | (30.4 | ) | ||||||||
U.S. dollar | 21.4859 | 20.2768 | (5.6 | ) | ||||||||
Euro | 24.5080 | 23.9834 | (2.1 | ) | ||||||||
The tables below set forth operating revenues and operating income for each of our segments for the years indicated.
| | YEAR ENDED DECEMBER 31, 2021 | |||||||||||||||
| | OPERATING REVENUES | OPERATING INCOME | ||||||||||||||
| (in millions of Mexican pesos) | (as a% of to- tal operating revenues) | (in millions of Mexican pesos) | (as a% of total operat- ing income) | |||||||||||||
Mexico Wireless | Ps. | 243,261 | 28.4% | Ps. | 77,784 | 46.8% | ||||||||||
Mexico Fixed | 102,427 | 12.0 | 21,100 | 12.7 | ||||||||||||
Brazil | 152,774 | 17.9 | 21,867 | 13.2 | ||||||||||||
Colombia | 79,673 | 9.3 | 15,165 | 9.1 | ||||||||||||
Southern Cone | 62,359 | 7.3 | 2,145 | 1.3 | ||||||||||||
Andean Region | 52,962 | 6.2 | 7,458 | 4.5 | ||||||||||||
Central America | 48,567 | 5.7 | 8,217 | 4.9 | ||||||||||||
Caribbean | 39,929 | 4.7 | 8,661 | 5.2 | ||||||||||||
Europe | 113,838 | 13.3 | 13,421 | 8.1 | ||||||||||||
Eliminations | (40,255) | (4.7) | (9,685) | (5.8) | ||||||||||||
Total | Ps. | 855,535 | 100.0% | Ps. | 166,133 | 100.0% | ||||||||||
| | YEAR ENDED DECEMBER 31, 2020 | |||||||||||||||
| | OPERATING REVENUES | OPERATING INCOME | ||||||||||||||
| (in millions of Mexican pesos) | (as a% of to- tal operating revenues) | (in millions of Mexican pesos) | (as a% of total operat- ing income) | |||||||||||||
Mexico Wireless | Ps. | 232,242 | 27.7% | Ps. | 70,852 | 48.7% | ||||||||||
Mexico Fixed | 91,589 | 10.9 | 11,204 | 7.7 | ||||||||||||
Brazil | 168,073 | 20.0 | 25,204 | 17.3 | ||||||||||||
Colombia | 77,635 | 9.2 | 15,112 | 10.4 | ||||||||||||
Southern Cone | 56,705 | 6.8 | 1,877 | 1.3 | ||||||||||||
Andean Region | 53,935 | 6.4 | 8,699 | 6.0 | ||||||||||||
Central America | 48,195 | 5.7 | 4,005 | 2.8 | ||||||||||||
Caribbean | 38,624 | 4.6 | 6,701 | 4.6 | ||||||||||||
Europe | 111,472 | 13.3 | 13,160 | 9.0 | ||||||||||||
Eliminations | (38,763) | (4.6) | (11,311) | (7.8) | ||||||||||||
Total | Ps. | 839,707 | 100% | Ps. | 145,503 | 100% | ||||||||||
26
Interperiod Segment Comparaions
The following discussion addresses the financial performance of each of our reportable segments by comparing results for 2021 and 2020. In thecomparisons for each segment, we include percentage changes in operating revenues, percentage changes in operating income and operating margin (operating income as a percentage of operating revenues), in each case calculated based on the segment financial information presented in Note 23 to our audited consolidated financial statements, which is prepared in accordance with IFRS.
year-to-year
Each reportable segment includes all income, cost and expense eliminations that occurred between subsidiaries within the reportable segment. The Mexico Wireless segment also includes corporate income, costs and expenses.
Comparisons in the following discussion are calculated using figures in Mexican pesos. We also include percentage changes in adjusted segment operating revenues, adjusted segment operating income and adjusted operating margin (adjusted operating income as a percentage of adjusted operating revenues). The adjustments eliminate (i) certain intersegment transactions, (ii) for our non Mexican segments, the effects of exchange rate changes and (iii) for the Mexican Wireless segment only, revenues and costs of group corporate activities and other businesses that are allocated to the Mexico Wireless segment.
Discussions of year-over-year comparisons between 2020 and 2019 that are not included in this report can be found under Part II, Operating and Financial Review and Prospects of our Form
20-F
for the fiscal year ended December 31, 2020 as filed on April 29, 2021.2021 Compared to 2020
Mexico Wireless
The number of prepaid wireless subscribers for 2021 increased by 4.3% over 2020, and the number of postpaid wireless subscribers increased by 0.1%, resulting in an increase in the total number of wireless subscribers in Mexico of 3.5%, or 2.7 million, to approximately 80.5 million as of December 31, 2021.
Segment operating revenues for 2021 increased by 4.7% over 2020. Adjusted segment operating revenues for 2021 increased by 5.0% over 2020. This increase in segment operating revenues principally reflects an increase in prepaid, postpaid and equipment sales and handset financing plans.
Segment operating income for 2021 increased by 9.8% over 2020. Adjusted segment operating income for 2020 increased by 11.9% over 2020.
Segment operating margin was 32.0% in 2021, as compared to 30.5% in 2020. Adjusted segment operating margin for this segment was 39.1% in 2021, as compared to 36.7% in 2020. This increase in segment operating margin for 2021 principally reflects the success of our corporate cost savings program in operations, optimization in networks and maintenance costs, which we successfully continue to implement without affecting the quality of our services and coverage.
Mexico Fixed
The number of fixed voice RGUs in Mexico for 2021 decreased by 4.6% over 2020, and the number of broadband RGUs in Mexico increased by 0.3%, resulting in a decrease in total fixed RGUs in Mexico of 2.4% over 2020, or 517 thousand, to approximately 21.4 million as of December 31, 2021.
Segment operating revenues for 2021 increased by 11.8% over 2020. Adjusted segment operating revenues for 2021 increased by 11.9% over 2020. This increase in segment operating revenues principally reflects an increase in corporate networks services by 2.8% and broadband by 3.2%, which was partially offset by a decrease in fixed voice revenues of 2.6%.
Segment operating income for 2021 increased by 88.3% over 2020. Adjusted segment operating income for 2021 increased by 298.2% over 2020. This increase principally reflects an increase in services provided and
one-off
revenue due to the sale of towers, partially set off by increases in the contractual salary of our employees and higher information technology and customer service costs.Segment operating margin was 20.6% in 2021, as compared to 12.2% in 2020. Adjusted segment operating margin was 10.6% in 2021, as compared to 3.0% in 2020. The increase in segment operating margin for 2021 principally reflects an increase in revenues from voice services, partially offset by a decrease in segment depreciation expenses.
Brazil
The number of prepaid wireless subscribers for 2021 increased by 6.0% over 2020, and the number of postpaid wireless subscribers increased by 16.2%, resulting in an increase in the total number of wireless subscribers in Brazil of 11.7%, or 7.4 million, to approximately 70.5 million as of December 31, 2021. The increase in the number of postpaid wireless subscribers is due primarily to commercial efforts aimed at converting prepaid subscribers to postpaid subscribers. The number of fixed voice RGUs for 2021 decreased by 5.7% over 2020, the number of broadband RGUs decreased by 1.2%, and the number of Pay TV RGUs decreased by 5.3%, resulting in a decrease in total fixed RGUs in Brazil of 4.2%, or 1.4 million, to approximately 31.3 million as of December 31, 2021.
27
Segment operating revenues for 2021 decreased by 9.1% over 2020. Adjusted segment operating revenues for 2021 increased by 0.9% over 2020. This increase in adjusted segment operating revenues principally reflects higher mobile data and fixed data revenues in 2021 over 2020. The increase in mobile data revenues in 2021 principally reflects the increased usage of social networking platforms, cloud services and other content, and fixed data revenues increased principally due to an increase in broadband revenues, which were, in each case, partially offset by a decrease in Pay TV revenues.
Segment operating income for 2021 decreased by 13.2% over 2020. Adjusted segment operating income for 2021 increased by 4.5% over 2020.
Segment operating margin was 14.3% in 2021, as compared to 15.0% in 2020. Adjusted segment operating margin was 14.6% in 2021, as compared to 14.1% in 2020. This increase in adjusted segment operating margin for 2021 principally reflects an increase in doubtful accounts allowances and optimization of call centers, mainly as a result of our cost savings program.
Colombia
The number of prepaid wireless subscribers for 2021 increased by 4.2% over 2020, and the number of postpaid wireless subscribers increased by 12.7%, resulting in an increase in the total number of wireless subscribers in Colombia of 6.2%, or 2.0 million, to approximately 35.1 million as of December 31, 2021. The number of fixed voice RGUs for 2021 increased by 8.5% over 2020, the number of broadband RGUs increased by 6.4% and the number of Pay TV RGUs increased by 5.5%, resulting in an increase in total fixed RGUs in Colombia of 6.7%, or 558 thousand, to approximately 8.9 million as of December 31, 2021.
Segment operating revenues for 2021 increased by 2.6% over 2020. Adjusted segment operating revenues for 2021 increased by 10.0% over 2020. This increase in segment operating revenues principally reflects increases in fixed data revenues, mobile data revenues, both in prepaid and postpaid mobile data, and Pay TV revenues.
Segment operating income for 2021 increased by 0.4% over 2020. Adjusted segment operating income for 2021 increased by 16.2% over 2020.
Segment operating margin was 19.0% in 2021, as compared to 19.5% in 2020. Adjusted segment operating margin was 26.1% in 2021, as compared to 24.7% in 2020. This increase is due to an amortization expenses caused by investments in spectrum and submarine cables.
Southern Cone - Argentina, Chile, Paraguay and Uruguay
The number of prepaid wireless subscribers for 2021 increased by 9.0% over 2020, and the number of postpaid wireless subscribers increased by 8.1%, resulting in an increase in the total number of wireless subscribers in our Southern Cone segment of 8.7%, or 2.7 million, to approximately 33.3 million as of December 31, 2021. The number of fixed voice RGUs for 2021 increased by 22.7% over 2020, the number of broadband RGUs increased by 23.4%, and the number of Pay TV RGUs increased by 6.6%, resulting in an increase in total fixed RGUs in our Southern Cone segment of 18.1%, or 513 thousand, to approximately 3.3 million as of December 31, 2021.
Segment operating revenues for 2021 increased by 10.0% over 2020. Adjusted segment operating revenues for 2021 decreased by 1.6% over 2020. This decrease principally reflects a decrease in adjusted operating revenues in Argentina and Paraguay. In Argentina, we experienced a decrease in revenues from prepaid and postpaid wireless voice and corporate networks, which were attributable to adverse economic conditions and which were partially offset by an increase in broadband, fixed voice and Pay TV. In Chile, we experienced an increase in postpaid and Pay TV revenues. For this segment, we analyze results in Argentina, Paraguay and Uruguay in terms of the Argentine peso, because Argentina accounts for the major portion of the operations in these three countries.
Segment operating income for 2021 increased by 14.3% over 2020. Adjusted segment operating income for 2021 increased by 1.3% over 2020.
Segment operating margin was 3.4% in 2021, as compared to 3.3% in 2020. Adjusted segment operating margin was 17.4% in 2021, as compared to 15.7% in 2020. This increase in the segment operating margin for 2021 principally reflects a decrease in revenues, as described above, coupled with a decrease in costs and expenses, including as a result of inflation or exchange rates.
28
Andean Region - Ecuador and Peru
The number of prepaid wireless subscribers for 2021 increased by 7.3% over 2020, and the number of postpaid wireless subscribers increased by 15.7%, resulting in an increase in the total number of wireless subscribers in our Andean Region segment of 10.0%, or 1.9 million, to approximately 21.0 million as of December 31, 2021. The number of fixed voice RGUs for 2021 increased by 13.6% over 2020, the number of broadband RGUs increased by 15.6% and the number of Pay TV RGUs increased by 4.0%, resulting in an increase in total fixed RGUs in our Andean Region segment of 13.2%, or 286 thousand, to approximately 2.5 million as of December 31, 2021.
Segment operating revenues for 2021 decreased by 1.8% over 2020. Adjusted segment operating revenues for 2021 increased by 11.0% over 2020. This increase principally reflects an increase in revenues in Peru, partially offset by a decrease in Ecuador. The increase in revenues in Peru reflects an increase in revenues from prepaid and postpaid wireless, broadband, corporate networks, fixed voice and Pay TV services. The decrease in revenues in Ecuador reflects a decrease in revenues from postpaid mobile.
Segment operating income for 2021 decreased by 14.3% over 2020. Adjusted segment operating income for 2021 increased by 17.1% over 2020. This increase principally reflects an operating income increase of 55.9% in Peru partially offset by a decrease of 10.2% in Ecuador.
Segment operating margin was 14.1% in 2021, as compared to 16.1% in 2020. Adjusted segment operating margin was 19.6% in 2021, as compared to 18.4% in 2020. This increase in the segment operating margin for 2021 principally reflects a recovery in Peru, partially offset by a decrease in operating income in Ecuador.
Central America - Guatemala, El Salvador, Honduras, Nicaragua, Panama and Costa Rica
The number of prepaid wireless subscribers for 2021 increase by 10.7% over 2020, and the number of postpaid wireless subscribers increased by 4.4%, resulting in an increase in the total number of wireless subscribers in our Central America segment of 9.7%, or 1.5 million, to approximately 16.5 million as of December 31, 2021. The number of fixed voice RGUs for 2021 decreased by 2.1% over 2020, the number of broadband RGUs increased by 7.1%, and the number of Pay TV RGUs increased by 10.6%, resulting in an increase in total fixed RGUs in our Central America segment of 3.9%, or 165 thousand, to approximately 4.4 million as of December 31, 2021.
Segment operating revenues for 2021 increased by 0.8% over 2020. Adjusted segment operating revenues for 2021 increased by 6.5% over 2020.
Segment operating income for 2021 increased by 105.2% over 2020. Adjusted segment operating income for 2021 increased by 102.2% over 2020. This increase in segment operating income for 2021 principally reflects a decrease in depreciation expenses as a result of the exhaustion of the useful life of certain assets in Guatemala in 2021 and the recognition of asset impairment in Panama and Honduras in the prior year, which was not recognized in 2021.
Segment operating margin was 16.9% in 2021, as compared to 8.3% in 2020. Adjusted segment operating margin was 19.1% in 2021, as compared to 10.1% in 2020. This increase in segment operating margin for 2021 principally reflects an increase in income, particularly in El Salvador, Honduras, Guatemala, Nicaragua and Costa Rica.
Caribbean - The Dominican Republic & Puerto Rico
The number of prepaid wireless subscribers for 2021 increased by 12.1% over 2020, and the number of postpaid wireless subscribers increased by 3.3%, resulting in an increase in the total number of wireless subscribers in our Caribbean segment of 9.3%, or 600 thousand, to approximately 7.0 million as of December 31, 2021. The number of fixed voice RGUs for 2021 decreased by 1.2% over 2020, the number of broadband RGUs increased by 4.6% and the number of Pay TV RGUs increased by 5.3%, resulting in an increase in total fixed RGUs in our Caribbean segment of 1.9%, or 50 thousand, to approximately 2.6 million as of December 31, 2021.
Segment operating revenues for 2021 increased by 3.4% over 2020. Adjusted segment operating revenues for 2021 increased by 7.5% over 2020. This increase in segment operating revenues principally reflects increase in operating revenues in Puerto Rico and the Dominican Republic. We analyze segment results in U.S. dollars because it is the functional currency of our operations in Puerto Rico.
Segment operating income for 2021 increased by 29.2% over 2020. Adjusted segment operating income for 2021 increased by 32.4% over 2020. This increase principally reflects an increase of 34.3% in Puerto Rico and 22.4% in the Dominican Republic.
Segment operating margin was 21.7% in 2021, as compared to 17.3% in 2020. Adjusted segment operating margin was 18.4% in 2021, as compared to 14.9% in 2020. This increase in segment operating margin for 2021 principally reflects an increase in service revenues in Puerto Rico in postpaid and Pay TV and in the Dominican Republic, in broadband and fixed data services, and the effects of the cost savings program, partially offset by the depreciation of the Dominican Peso.
29
Europe
The number of prepaid wireless subscribers for 2021 decreased by 4.1% over 2020, and the number of postpaid wireless subscribers increased by 6.0%, resulting in an increase in the total number of wireless subscribers in our Europe segment of 4.1%, or 901 thousand, to approximately 22.8 million as of December 31, 2021. The number of fixed voice RGUs for 2021 decreased by 1.7% over 2020, the number of broadband RGUs increased by 1.8% and the number of Pay TV RGUs increased by 1.1%, resulting in an increase in total fixed RGUs in our Europe segment of 0.5%, or 31 thousand, to approximately 6.1 million as of December 31, 2021.
Segment operating revenues for 2021 increased by 2.1% over 2020. Adjusted segment operating revenues for 2021 increased by 4.4% over 2020. This increase in segment operating revenues principally reflects an increase in mobile services.
Segment operating income for 2021 increased by 2.0% over 2020. Adjusted segment operating income for 2021 increased by 21.5% over 2020. Segment operating margin was 11.8% in 2021, the same as in 2020. Adjusted segment operating margin was 13.6% in 2021, as compared to 11.7% in 2020. This increase in adjusted segment operating margin for 2021 principally reflects our corporate cost savings program and improved performance in all the countries in our Europe segment.
30

FUNDING REQUIREMENTS
We generate substantial cash flows from our operations. On a consolidated basis, our cash flows from operating activities were Ps.258.2 billion in 2021, compared to Ps.280.8 billion in 2020. Our cash and cash equivalents amounted to Ps.38.7 billion at December 31, 2021, compared to Ps.35.9 billion at December 31, 2020. We believe our working capital is sufficient for our present requirements, and we anticipate generating sufficient cash to satisfy our long-term liquidity needs.
We use the cash that we generate from our operations and from borrowings principally for the following purposes:
• | Capital expenditures - COVID-19 outbreak. Our capital expenditures for 2021 and our budgeted capital expenditures for 2022 are in line with our historical capital expenditure levels. |
• | Acquisitions - |
• | Short-term debt and contractual obligations - |
• | Long-term debt and contractual obligations - |
and Ps.9.0 billion in purchase obligations. On the same date, we had approximately Ps.73.5 billion in debt and contractual obligations due between 2026 and 2027, including approximately Ps.54.9 billion of principal and amortization, Ps.13.0 billion in long-term lease debt, and Ps.5.5 billion in purchase obligations. On the same date, we had approximately Ps.277.2 billion in debt and contractual obligations due after 2027, including approximately Ps.254 billion of principal and amortization, Ps.11.6 billion in long-term lease debt, and Ps.11.7 billion in purchase obligations. |
• | Dividends - |
• | Share repurchases - |
BORROWINGS
In addition to cash flows generated from operations, we rely on a combination of borrowings from a range of different sources, including the international capital markets, capital markets in Mexico and other countries where we operate, international and local banks, equipment suppliers and export credit agencies. We seek to maintain access to diverse sources of funding. In managing our funding, we generally seek to keep our leverage, as measured by the ratio of net debt to EBITDA, at a level that is consistent with maintaining the ratings given to our debt by the principal credit rating agencies. Our total consolidated indebtedness as of December 31, 2021 was Ps.564.0 billion, of which Ps.145.2 billion was short-term debt (including the current portion of long-term debt), compared to Ps.628.4 billion as of December 31, 2020.
Management defines net debt as total debt minus cash and cash equivalents, minus marketable securities (including Koninklijke KPN N.V. (“KPN”) shares and Verizon shares), other short term investments and fixed-income securities with a tenor of more than one year. Verizon shares are factored into calculations of net debt for information as of December 31, 2021, but are not factored into calculations of net debt for information as of December 31, 2020. As of December 31, 2021, we had net debt of Ps.400.8 billion, compared to Ps.537.8 billion as of December 31, 2020.
31
Without taking into account the effects of derivative financial instruments that we use to manage our interest rate and currency risk, approximately 84.8% of our indebtedness at December 31, 2021 was denominated in currencies other than Mexican pesos (approximately 36.4% of such
non-Mexican
peso debt was in U.S. dollars and 63.6% in other currencies), and approximately 13.5% of our consolidated debt obligations bore interest at floating rates. After the effects of derivative transactions and excluding the debt of Telekom Austria, approximately 46.3% of our net debt as of December 31, 2021 was denominated in Mexican pesos.The weighted average cost of all our third-party debt at December 31, 2021 (excluding commissions and reimbursement of certain lenders for Mexican taxes withheld) was approximately 3.78% per annum.
Our major categories of indebtedness at December 31, 2021 are summarized in the table below. See also Note 14 to our audited consolidated financial statements included in this annual report.
DEBT | | |||
(millions of Mexican pesos) | ||||
SENIOR NOTES | | |||
DENOMINATED IN U.S. DOLLARS | ||||
América Móvil 3.625% Senior Notes due 2029 | 20,584 | |||
América Móvil 2.875% Senior Notes due 2030 | 20,584 | |||
América Móvil 6.375% Senior Notes due 2035 | 20,199 | |||
América Móvil 6.125% Senior Notes due 2037 | 7,600 | |||
América Móvil 6.125% Senior Notes due 2040 | 41,167 | |||
América Móvil 4.375% Senior Notes due 2042 | 23,671 | |||
América Móvil 4.375% Senior Notes due 2049 | 25,729 | |||
Total | 159,534 | |||
DENOMINATED IN MEXICAN PESOS | ||||
América Móvil 6.450% Senior Notes due 2022 | 22,500 | |||
América Móvil 7.125% Senior Notes due 2024 | 11,000 | |||
América Móvil 0.000% Domestic Senior Notes due 2025 | 5,285 | |||
América Móvil 8.460% Senior Notes due 2036 | 7,872 | |||
Telmex 8.360% Domestic Senior Notes due 2037 | 5,000 | |||
Total | 51,657 | |||
DENOMINATED IN EURO | ||||
TKA 4.000% Senior Notes due 2022 | 17,566 | |||
TKA 3.500% Senior Notes due 2023 | 7,027 | |||
América Móvil 3.259% Senior Notes due 2023 | 17,566 | |||
América Móvil 1.500% Senior Notes due 2024 | 19,909 | |||
Exchangeable Bond 0.00% due 2024 | 49,116 | |||
TKA 1.500% Senior Notes due 2026 | 17,566 | |||
América Móvil 0.750% Senior Notes due 2027 | 23,422 | |||
América Móvil 2.125% Senior Notes due 2028 | 15,224 | |||
Total | 167,396 | |||
DEBT | | |||
(millions of Mexican pesos) | ||||
DENOMINATED IN POUND STERLING | ||||
América Móvil 5.000% Senior Notes due 2026 | 13,925 | |||
América Móvil 5.750% Senior Notes due 2030 | 18,102 | |||
América Móvil 4.948% Senior Notes due 2033 | 8,355 | |||
América Móvil 4.375% Senior Notes due 2041 | 20,887 | |||
Total | 61,269 | |||
DENOMINATED IN JAPANESE YEN | ||||
América Móvil 2.950% Senior Notes due 2039 | 2,326 | |||
Total | 2,326 | |||
DENOMINATED IN CHILEAN PESOS | ||||
América Móvil 3.961% Senior Notes due 2035 | 3,776 | |||
Total | 3,776 | |||
DENOMINATED IN BRAZILIAN REAIS | ||||
Claro Brasil CDI + 0.960% Domestic Senior Notes due 2022 | 9,221 | |||
Claro Brasil 106.000% of CDI Domestic Senior Notes due 2022 | 7,377 | |||
Claro Brasil 106.500% of CDI Domestic Senior Notes due 2022 | 3,688 | |||
Total | 20,286 | |||
HYBRID NOTES | | |||
DENOMINATED IN EURO | ||||
América Móvil NC10 (Series B) Capital Securities due 2073 | 12,882 | |||
Total | 12,882 | |||
BANK DEBT AND OTHER | | |||
DENOMINATED IN US DOLLARS | 14,724 | |||
DENOMINATED IN EUROS | 18,738 | |||
DENOMINATED IN MEXICAN PESOS | 34,080 | |||
DENOMINATED IN CHILEAN PESOS | 7,467 | |||
DENOMINATED IN PERUVIAN SOLES | 9,815 | |||
DENOMINATED IN OTHER CURRENCIES | 80 | |||
Total | 84,904 | |||
Total Debt | 564,030 | |||
Less short-term debt and current portion of long-term debt | 145,223 | |||
Total Long-term Debt | 418,807 | |||
EQUITY | | |||
Capital stock | 96,333 | |||
Total retained earnings | 447,690 | |||
Other comprehensive income (loss) items | (154,389) | |||
Non-controlling interest | 64,407 | |||
Total Equity | 454,041 | |||
Total Capitalization (total long-term debt plus equity) | 872,848 | |||
32
Additional information about certain categories of our indebtedness is provided below:
Mexican peso-denominated international notes.
Our 8.46% senior notes due 2036 are denominated in Mexican pesos, but all amounts in respect of the notes are payable in U.S. dollars, unless a holder of notes elects to receive payment in Mexican pesos in accordance with specified procedures.
Mexican peso-denominated domestic notes.
Our domestic senior notes () sold in the Mexican capital markets have varying maturities, ranging from 2025 through 2037, and bear interest at fixed rates.
certificados bursátiles
Global peso notes program.
The global peso notes program was established in November 2012. Since its establishment, we have issued peso-denominated notes that can be distributed and traded on a seamless basis in Mexico and internationally. The notes are registered with the SEC in the United States and with the CNBV in Mexico.
International notes.
We have outstanding debt securities in the international markets denominated in U.S. dollars, pounds sterling and euros. We have also issued debt securities in the local market in Japan.
In April 2022, we issued a total of U.S.$1 billion aggregate principal amount of 5.375% senior notes. On the date on which Sitios is duly incorporated in accordance with Mexican law and the resolutions approved by our shareholders in the extraordinary shareholders’ meeting dated as of September 29, 2021 (the
“Spin-off
Effective Date”), Sitios will assume all of our obligations under the aforementioned notes and the associated indenture, and we will be released from all of our obligations under such notes and indenture.Hybrid notes.
We have outstanding one series of Capital Securities maturing in 2073, denominated in euros totaling
€
550 million. The Capital Securities are subject to redemption at our option at varying dates beginning in 2023. Our hybrid notes are deeply subordinated, and when they were issued, the principal rating agencies stated that they would treat half of the principal amount as indebtedness for purposes of evaluating our leverage (an analysis referred to as 50% equity credit). Standard & Poor’s now treats 100% of the principal amount under the hybrid notes as indebtedness.Bank loans.
At December 31, 2021, we had approximately Ps.84.9 billion outstanding under a number of bank facilities bearing interest at fixed and variable rates. We also have two revolving syndicated credit facilities—one for U.S.$2.5 billion expiring in August 2024 and one for the Euro equivalent of U.S.$1.5 billion expiring in May 2026, which contains a
sustainability-linked framework. As long as the facilities are committed, a commitment fee is paid. As of December 31, 2021, these credit facilities were not drawn. Both facilities include covenants that limit our ability to incur secured debt, to effect a merger in which the surviving entity would not be América Móvil or to sell substantially all of our assets. In addition, both facilities require us to maintain a consolidated ratio of debt to EBITDA not greater than 4.0 to 1.0 and a consolidated ratio of EBITDA to interest expense not less than 2.5 to 1.0. As of the date of this annual report, we are in compliance with these covenants.
Telekom Austria has an undrawn revolving syndicated credit facility for
€
1.0 billion (the “TKA Facility”) expiring in July 2026. The TKA Facility includes covenants that limit Telekom Austria’s ability to incur secured debt, effect certain mergers or sell substantially all of its assets and our ability to transfer control over, or reduce our share ownership in, Telekom Austria. For more information, see Note 14 to our audited consolidated financial statements included in this annual report. In addition to the bank loans summarized in the table above, in March 2022, we entered into a credit agreement providing for borrowings in an amount up to Ps.20,558,500,000 (the “Sitios Credit Facility”) with a group of lenders that includes affiliates and BBVA México, S.A., Institución de Banca Múltiple, Grupo Financiero BBVA México, as administrative agent for the lenders. The full principal amount available under this facility was disbursed on March 23, 2022. On theSpin-off
Effective Date, we will be released from our obligations under the Sitios Credit Facility and all liabilities with respect thereto will be transferred to Sitios, and Sitios will assume all of our obligations thereunder. Additionally, on April 14, 2022, Claro Brasil entered into an uncommitted term loan facility agreement for borrowings in an amount up to R$1.7 billion with BNP Paribas S.A. as lender. This facility will mature in 2023.Options involving TKA shares.
The Company has entered into the sale of a cash-settled put option related to TKA shares that will expire in August 2023. See Note 7 to our audited consolidated financial statements included in this annual report.
Bonds exchangeable for KPN shares.
On March 2, 2021, our wholly-owned Dutch subsidiary, América Móvil B.V., issued approximately EUR 2.1 billion principal amount of senior unsecured bonds. The bonds will mature in 3 years, will not bear interest and were issued at an issue price of 104.75% of their principal amount. The Bonds will be exchangeable into ordinary shares of KPN and the initial exchange price is EUR 3.1185.
33
Euro-denominated commercial paper program.
From time to time we have issued commercial paper under our euro-denominated commercial paper program. At December 31, 2021, there were no amounts outstanding under such program.
As of December 31, 2021, we had, on an unconsolidated basis, unsecured and unsubordinated indebtedness of approximately Ps.391.3 billion (U.S.$19.0 billion), excluding guarantees of subsidiaries’ indebtedness. As of December 31, 2021, our subsidiaries had indebtedness (excluding guarantees of indebtedness of us and our other subsidiaries) of approximately Ps.172.7 billion (U.S.$8.3 billion), and a substantial portion of our subsidiaries’ indebtedness is owed by Telekom Austria.
GUARANTOR FINANCIAL INFORMATION
Some of the public securities issued by América Móvil in international and Mexican capital markets are guaranteed by Telcel, a wholly-owned subsidiary. As of December 31, 2021, the aggregate principal amount of debt guaranteed by Telcel was Ps.106,327 million. The guarantees provide that, in case of the failure of the Company to punctually make payment of any principal, premium, interest, additional amounts or any other amounts that may become payable by the Company in respect of the notes, Telcel agrees to immediately pay the amount that is due and required to be paid.
The following tables present summarized unconsolidated financial information for the Company and Telcel after eliminating transactions and balances between them.
| | AS OF DECEMBER 31, 2021 | |||||||||||
| | PARENT | GUARANTOR | ||||||||||
Current assets | Ps. | 25,288 | Ps. | 48,552 | ||||||||
Total assets | 56,794 | 221,510 | ||||||||||
Current liabilities | 80,566 | 177,133 | ||||||||||
Total liabilities | 420,630 | 190,518 | ||||||||||
Total revenues | Ps. | - | Ps. | 169,203 | ||||||||
Operating Income | (27,424) | 99,246 | ||||||||||
Net profit for the year | (66,596) | 100,072 | ||||||||||
RISK MANAGEMENT
We regularly assess our interest rate and currency exchange exposures in order to determine how to manage the risk associated with these exposures. We have indebtedness denominated in currencies other than the currency of our operating environments, and we have expenses for operations and for capital expenditures in a variety of currencies. We use derivatives to manage the resulting exchange rate and interest rate exposures. We do not use derivatives to hedge the exchange rate exposures that arise from having operations in different countries. For additional information on market risk, see Note 2 v(ii) to our audited consolidated financial statements included in this annual report.
Our practices vary from time to time depending on our judgment of the level of risk, expectations as to exchange rate or interest rate movements and the costs of using derivative financial instruments. We may stop using derivative financial instruments or modify our practices at any time.
As of December 31, 2021, the net fair value of our derivatives and other financial items was a net asset of Ps.0.1 billion, which are described in Note 7 to our audited consolidated financial statements. For additional information, see Note 2 v to our audited consolidated financial statements included in this annual report.
34

35

36

RISKS RELATING TO OUR OPERATIONS
Competition in the telecommunications industry is intense and could adversely affect the revenues and profitability of our operations
Our businesses face substantial competition. We expect that competition will intensify in the future as a result of the entry of new competitors, the development of new technologies, products and services and convergence. We also expect consolidation in the telecommunications industry, as companies respond to the need for cost reduction and additional spectrum. This trend may result in larger competitors with greater financial, technical, promotional and other resources to compete with our businesses.
Among other things, our competitors could:
| • | provide higher handset subsidies; |
| • | offer higher commissions to retailers; |
| • | provide free airtime or other services (such as internet access); |
| • | offer services at lower costs through double, triple and quadruple play packages or other pricing strategies; |
| • | expand their networks faster; or |
| • | develop and deploy improved technologies faster, such as 5G LTE technology. |
Competition can lead us to increase advertising and promotional spending and to reduce prices for services and handsets. These developments may lead to lower operating margins, greater choices for customers and increasing movement of customers among competitors, which may make it difficult for us to retain or add new customers. The cost of adding new customers may also continue to increase, reducing profitability even if customer growth continues.
Our ability to compete successfully will depend on our coverage, the quality of our network and service, our rates, customer service, effective marketing, our success in selling double, triple and quadruple play packages and our ability to anticipate and respond to various competitive factors affecting the telecommunications industry, including new services and technologies, changes in consumer preferences, demographic trends, economic conditions and discount pricing strategies by competitors.
If we are unable to respond to competition and compensate for declining prices by adding new customers, increasing usage and offering new services, our revenues and profitability could decline.
Governmental or regulatory actions could adversely affect our operations
Our operations are subject to extensive government regulation and can be adversely affected by changes in law, regulation or regulatory policy. The licensing, construction,
operation, sale, resale and interconnection arrangements of telecommunications systems in Latin America and elsewhere are regulated to varying degrees by government or regulatory authorities. Any of these authorities having jurisdiction over our businesses could adopt or change regulations or take other actions that could adversely affect our operations. In particular, the regulation of prices that operators may charge for their services and environmental matters, including renewable energy and climate change regulation, could have a material adverse effect by reducing our profit margins. See “Regulation” under Part VI for a discussion on the functional separation of Telmex and Telnor wholesale services, “Legal Proceedings” under Part VII and Note 17 to our audited consolidated financial statements included in this annual report.
In addition, changes in political administrations could lead to new regulation and the adoption of policies that could adversely affect our operations, including those concerning competition and taxation of communications services. For example, since 2013, Mexico has implemented reforms to the telecommunications sector that aim to promote more competition and investment by imposing asymmetric regulation upon economic agents deemed “preponderant or dominant.” The asymmetric regulations that are applicable to us, which have adversely affected the results of our Mexican operations, may be reviewed every two years. We are unable to anticipate the effect of an amendment on existing asymmetric regulations, or the imposition of new ones, on our results or operations in Mexico. In other countries, we could also face policies such as preferences for local over foreign ownership of communications licenses and assets or for government over private ownership, which could make it more cumbersome or impossible for us to continue to develop our businesses. Restrictions such as those described above could result in lower revenues and require capital investments, all of which could materially adversely affect our businesses and results of operations.
Our failure to meet or maintain quality of service goals and standards could result in fines and other adverse consequences
The terms of the concessions under which our subsidiaries operate require them to meet certain service quality goals, including, for example, minimum call completion rates, maximum busy circuits rates, operator availability and responsiveness to repair requests. Failure to meet service quality obligations in the past has resulted in the imposition of material fines by regulatory entities. We are also subject to and may be subject to additional claims by customers, including class actions, seeking remedies for service problems. Our ability to comply with these obligations in the future may be affected by factors beyond our control and,
37
accordingly, we cannot assure that we will be able to comply with them.
Dominant carrier related regulations could adversely affect our business by limiting our ability to pursue competitive and profitable strategies
Our regulators are authorized to impose specific requirements as to rates (including termination rates), quality of service, access to active or passive infrastructure and information, among other matters, on operators that are determined to have substantial market power in a specific market. We cannot predict what steps regulatory authorities might take in response to determinations regarding substantial market power in the countries in which we operate. However, adverse determinations against our subsidiaries could result in material restrictions on our operations. We may also face additional regulatory restrictions and scrutiny as a result of our provision of combined services.
If dominant carrier regulations are imposed on our business in the future, they could likely reduce our flexibility to adopt competitive market policies and impose specific tariff requirements or other special regulations on us, such as additional requirements regarding disclosure of information or quality of service. Any such new regulation could have a material adverse effect on our operations.
We must continue to acquire additional radio spectrum capacity and upgrade our networks in order to expand our customer base and maintain the quality of our wireless services
Licensed radio spectrum is essential to our growth and the quality of our wireless services and for the operation and deployment of our networks, including new generation networks such as 5G LTE technology, to offer improved data and value-added services. We obtain most of our radio spectrum through auctions conducted by governments of the countries in which we operate. Participation in spectrum auctions in most of these countries requires prior government authorization, and we may be subject to caps on our ability to acquire additional spectrum. Our inability to acquire additional radio spectrum capacity could affect our ability to compete successfully because it could result in, among other things, a decrease in the quality of our network and service and in our ability to meet the demands of our customers.
In the event we are unable to acquire additional radio spectrum capacity, we can increase the density of our network by building more cell and switch sites, but such measures are costly and may be subject to local restrictions and regulatory approvals, and they would not meet our needs as effectively.
We have concessions and licenses for fixed terms, and the government may revoke or terminate them as well as reacquire the assets under our concession under various circumstances, some of which are beyond our control
Our concessions and licenses have specified terms, ranging typically from five to 20 years, and are generally subject to renewal upon payment of a fee, but renewal is not assured. The loss of, or failure to renew, any one concession could have a material adverse effect on our business and results of operations. Our ability to renew concessions and the terms of renewal are subject to a number of factors beyond our control, including the prevalent regulatory and political environment at the time of renewal. Fees are typically established at the time of renewal. As a condition for renewal, we may be required to agree to new and stricter terms and service requirements. In some of the jurisdictions where we operate and under certain circumstances, mainly in connection with fixed services, we may be required to transfer certain assets covered by some of our concessions to the government pursuant to valuation methodologies that vary in each jurisdiction. It is uncertain whether reversion would ever be applied in many of the jurisdictions where we operate and how reversion provisions would be interpreted in practice. For further information, see “Regulation” under Part VI of this annual report and Note 17 to our audited consolidated financial statements included in this annual report.
In addition, the regulatory authorities in the jurisdictions in which we operate can revoke our concessions under certain circumstances. In Mexico, for example, the Federal Law on Telecommunications and Broadcasting gives the government the right to temporarily seize our concessions or to take over the management of our networks, facilities and personnel in cases of failures to meet obligations under our concession agreements, imminent danger to national security, internal peace or the national economy, natural disasters and public unrest. See “Regulation” under Part VI of this annual report.
We continue to look for acquisition opportunities, and any future acquisitions and related financing could have a material effect on our business, results of operations and financial condition
We continue to look for investment opportunities in telecommunications and related companies worldwide, including in markets where we are already present, and we often have several possible acquisitions under consideration. Any future acquisitions, and related financing and acquired indebtedness, could have a material effect on our business, results of operations and financial condition, but we cannot provide assurances that we will complete any of them. In addition, we may incur significant costs and expenses as we
38
integrate these companies in our systems, controls and networks.
We are subject to significant litigation
Some of our subsidiaries are subject to significant litigation that, if determined adversely to our interests, may have a material adverse effect on our business, results of operations, financial condition or prospects. Our significant litigation is described in “Regulation” under Part VI and in Note 17 to our audited consolidated financial statements included in this annual report.
We are contesting significant tax assessments
We and some of our subsidiaries have been notified of tax assessments for significant amounts by the tax authorities of the countries in which we operate, especially in Brazil, Mexico and Colombia. The tax assessments relate to, among other things, alleged improper deductions and underpayments. We are contesting these tax assessments in several administrative and legal proceedings, and our challenges are at various stages. The amounts claimed by the tax authorities in these matters are significant. In many cases, we have not established a provision in our audited financial statements for these matters, or the amount claimed may be significantly in excess of any reserve established. We evaluate income tax contingencies applying IAS 12 and IFRIC 23. For other tax contingencies we consider the applicable IFRS guidance. Our significant tax assessments are described in Note 17 to our audited consolidated financial statements included in this annual report. If determined adversely to us, these proceedings may have a material adverse effect on our business, results of operations, financial condition or prospects. In addition, in some jurisdictions, challenges to tax assessments require the posting of a bond or security for the contested amount, which may reduce our flexibility in operating our business.
Failure to comply with anti-corruption, anti- bribery and anti-money laundering laws could harm our reputation, subject us to substantial fines and adversely affect our business
We operate in multiple jurisdictions and are subject to complex regulatory frameworks with increased enforcement activities worldwide. Our governance and compliance processes may not prevent future breaches of legal, accounting or governance standards and regulations. We may be subject to breaches of our code of ethics, anti-corruption policies and business conduct protocols and to instances of fraudulent behavior, corrupt practices and dishonesty by our employees, contractors or other agents. Our failure to comply with applicable laws and other regulatory requirements could harm our reputation, subject us to substantial fines, sanctions or penalties and adversely affect our business and ability to access financial markets.
A system failure could cause delays or interruptions of service, which could have an adverse effect on our operations
We need to continue to provide our subscribers with a reliable service over our network. Some of the risks to our network and infrastructure include the following:
| • | physical damage to access lines and fixed networks; |
| • | power surges or outages; |
| • | natural disasters; |
| • | climate change; |
| • | malicious actions, such as theft or misuse of customer data; |
| • | limitations on the use of our radio bases; |
| • | software defects; |
| • | human error; and |
| • | other disruptions beyond our control, including as a result of civil unrest in the regions where we operate. |
In Brazil, for example, our satellite operations may be affected if we experience a delay in launching new satellites to replace those currently in use when they reach the end of their operational lives.
Such delay may occur because of, among other reasons, construction delays, unavailability of launch vehicles and/ or launch failures. In addition, our operations have been disrupted by natural disturbances such as hurricanes and earthquakes.
We have instituted measures to reduce these risks. However, there is no assurance that any measures we implement will be effective in preventing system failures under all circumstances. System failures may cause interruptions in services or reduced capacity for our customers, either of which may have an adverse effect on our operations due to, for example, increased expenses, potential legal liability, loss of existing and potential subscribers, reduced user traffic, decreased revenues and reputational harm.
Our financial condition and results of operations may be adversely affected by the occurrence of severe weather, natural or
man-made
disasters and other catastrophic events, including war, terrorism and other acts of violence, and diseaseOur operations can be disrupted by unforeseen events, including war, terrorism, and other international, regional, or local instability or conflicts (including labor issues), embargos, public health issues (including tainted food, food-borne illnesses, food tampering, tampering with or failure of water supply or widespread or pandemic illness such as coronavirus (“COVID-19”), Ebola, the avian or H1N1 flu, MERS), and natural disasters such as earthquakes, tsunamis, hurricanes, or other adverse weather and climate conditions in the countries in which we operate. These events could
39
disrupt or prevent our ability to perform functions and otherwise impede our ability to continue business operations in a continuous manner, which in turn may materially and adversely impact our business and operating results.
Effects of climate change may impose risk of damage to our infrastructure and our ability to provide services, all of which may result in potential adverse impact to our financial results
Extreme weather events precipitated by long-term climate change have the potential to directly damage network facilities or disrupt our ability to build and maintain portions of our network and could potentially disrupt suppliers’ ability to provide products and services required to provide reliable network coverage. Any such disruption could delay network deployment plans, interrupt service for our customers, increase our costs and have a negative effect on our operating results. The potential physical effects of climate change, such as increased frequency and severity of storms, floods, fires, freezing conditions,
sea-level
rise, and other climate-related events, could adversely affect our operations, infrastructure, and financial results. Operational impacts resulting from the potential physical effects of climate change, such as damage to our network infrastructure, could result in increased costs and loss of revenue. We could incur significant costs to improve the climate resiliency of our infrastructure and otherwise prepare for, respond to, and mitigate such physical effects of climate change. We are not able to accurately predict the materiality of any potential losses or costs associated with the physical effects of climate change.Public health crises, including the
COVID-19
pandemic, could materially adversely affect our business, financial condition and results of operationsWe are subject to risks related to public health crises, such as the
COVID-19
pandemic, which had an adverse effect on our operating results in 2020. Our business is based on our ability to provide products and services to customers throughout Mexico and around the world and the ability of those customers to use and pay for those products and services for their businesses and in their daily lives. As a result, our business, financial condition and results of operations could be materially adversely affected by a crisis, like theCOVID-19
pandemic, that significantly impacts the way customers use and are able to pay for our products and services, the way our employees are able to provide services to our customers, and the ways that our partners and suppliers are able to provide products and services to us. For example, public and private sector policies and initiatives to reduce the transmission ofCOVID-19,
including the initiatives we took in response to the health crisis to promote the health and safetyof our employees and provide critical infrastructure and connectivity to our customers, along with the related global slowdown in economic activity, contributed to decreased net profit for the year and lower earnings per share during 2020.
In addition, such a crisis could significantly increase the probability or consequences of the risks our business faces in ordinary circumstances, such as risks associated with our supplier and vendor relationships, risks of an economic slowdown, regulatory risks, and the costs and availability of financing. Because the severity, magnitude and duration of the
COVID-19
pandemic and its economic consequences are uncertain and rapidly changing, the impact on our business, financial condition and results of operations in 2022 and beyond remains uncertain and difficult to predict. In addition, the ultimate impact of theCOVID-19
pandemic on our business, financial condition and results of operations depends on many factors, including those discussed above, that are not within our control.Many of our employees are unionized and increases in labor and employee benefit costs may reduce our profitability, increase our funding requirements and could have an adverse impact on our operations
Many of our employees are members of labor unions with which we conduct collective negotiations on wages, benefits and working conditions. We use actuarial methodologies and assumptions such as discount rate, salary increase and mortality, among others, for the determination and valuation of our employee benefits, including retirement benefits. We evaluate from time to time, with the support of specialists, our actuarial methodologies and assumptions, as well as the valuation of the assets related to these benefits.
Our labor costs and the costs of maintaining employee benefits are substantial, and could be affected by several factors, including legislative and regulatory changes, work stoppages, subsequent negotiations, increases in healthcare costs, minimum wages, decreases in investment returns on the assets held in funds to support the payment of certain employee benefits and changes in the discount rate and mortality assumptions. An increase in labor and employee benefit costs could reduce our profitability, increase our funding requirements and have an adverse impact on our operations.
Inflationary pressures on costs may impact our network construction, financial condition and results of operations
As a provider of telecommunications and technology services, we sell handsets, wireless data cards, wireless computing devices and customer premises equipment manufactured by various suppliers. We depend on suppliers to provide us,
40
directly or through other suppliers, with items such as network equipment, customer premises equipment, and wireless-related equipment such as mobile hotspots, handsets, wirelessly enabled computers, wireless data cards and other connected devices for our customers. In 2021 and 2022 year to date, the costs of these inputs and the costs of labor necessary to develop and maintain our networks and our products and services have rapidly increased. In addition, many of these inputs are subject to price fluctuations from a number of factors, including, but not limited to, market conditions, demand and volatility in the prices for raw materials used in the production of these devices and network components, weather, climate change, energy costs (including as a result of the ongoing conflict in Ukraine, which has resulted in historically high energy market prices), currency fluctuations, supplier capacities, governmental actions, import and export requirements (including tariffs), and other factors beyond our control. Although we are unable to predict the impact on our ability to source materials in the future, we expect these supply pressures to continue into 2022. We also expect the pressures of input cost inflation to continue into 2022.
Our attempts to offset these cost pressures, such as through increases in the selling prices of some of our products and services, may not be successful. Higher product prices may result in reductions in sales volume. Consumers may be less willing to pay a price differential for our products and may increasingly purchase lower-priced offerings, or may forego some purchases altogether, during an economic downturn. To the extent that price increases are not sufficient to offset these increased costs adequately or in a timely manner, and/or if they result in significant decreases in sales volume, our business, financial condition or operating results may be adversely affected. Furthermore, we may not be able to offset any cost increases through productivity and cost-saving initiatives.
We rely on highly skilled personnel throughout all levels of our business. Our business could be harmed if we are unable to retain or motivate key personnel, hire qualified personnel or maintain our corporate culture
The market for highly skilled workers and leaders in our industry is extremely competitive. We believe that our future success depends in substantial part on our ability to recruit, hire, motivate, develop, and retain talented personnel for all areas of our organization, including our CEO and the other members of our senior leadership team. Our inability to retain these employees or to replace them with qualified and capable successors could hinder our strategic planning and execution. If key employees depart, our business could be negatively impacted. We may incur significant costs in identifying, hiring and replacing departing employees and
may lose significant expertise and talent. As a result, we may not be able to meet our business plan and our revenue growth and profitability may be materially adversely affected.
Cybersecurity incidents and other breaches of network or information technology security could have an adverse effect on our business and our reputation
Cybersecurity incidents, and other tactics designed to gain access to and exploit sensitive information by breaching critical systems of large companies, are evolving and have been increasing in both sophistication and occurrence in recent years. While we employ a number of measures to prevent, detect and mitigate such incidents, there is no guarantee that we will be able to adequately anticipate or prevent one. Cybercrime, including attempts to overload our servers withattacks, theft, social engineering, phishing, ransomware or similar disruptions from unauthorized access or attempted unauthorized access to our systems could result in the destruction, misuse or release of personal information or other sensitive data. However, it is difficult to detect or prevent evolving forms of cybersecurity incidents, and our systems, and those of our third-party service providers and of our customers, are vulnerable to cybersecurity incidents.
denial-of-service
In the event that our systems are breached or damaged for any reason, we may suffer loss or unavailability of data and interruptions to our business operations. If such an event occurs, the unauthorized disclosure, loss or unavailability of data and the disruption to our fixed-line or wireless networks may have a material adverse effect on our business and results of operations. The costs associated with a cybersecurity incident could include increased expenditures on information and cybersecurity measures, damage to our reputation, loss of existing customers and business partners and lead to financial losses from remedial actions and potential liability, including possible litigation and sanctions. Any of these occurrences may result in a material adverse effect on our results of operations and financial condition.
Failure to achieve proper data governance could lead to data mismanagement
We process large amounts of personally identifiable information of customers and employees and are subject to various compliance, security, privacy, data quality and regulatory requirements. Failure to achieve proper data governance could lead to data mismanagement which in turn could result in data loss, regulatory investigations or sanctions, and cybersecurity risk. We are subject to data privacy regulations in the countries where we operate. Complying with such regulations may expose us to increased costs and limit our ability to transfer data between certain jurisdictions, which may adversely affect our operations.
41
If our churn rate increases, our business could be negatively affected
The cost of acquiring a new subscriber is much higher than the cost of maintaining an existing subscriber. Accordingly, subscriber deactivations, or “churn,” could have a material negative impact on our operating income, even if we are able to obtain one new subscriber for each lost subscriber. A substantial majority of our subscribers are prepaid, and we do not have long-term contracts with them. Our average churn rate on a consolidated basis was 3.3% for the year ended December 31, 2021 and 3.8% for the year ended December 31, 2020. If we experience an increase in our churn rate, our ability to achieve revenue growth could be materially impacted. In addition, a decline in general economic conditions could lead to an increase in churn, particularly among our prepaid subscribers.
We rely on key suppliers to provide equipment that we need to operate our business
We rely upon various key suppliers to provide us with handsets, network equipment or services, which we need to expand and operate our business. Our key suppliers include Huawei, Ericsson and Alcatel. If these suppliers fail to provide equipment or service to us on a timely basis, we could experience disruptions, which could have an adverse effect on our revenues and results of operations. In addition, we might be unable to satisfy requirements under our concessions.
Government or regulatory actions with respect to certain suppliers may impact us. For example, the government of the United States and Canada, among others, are currently conducting a regulatory review of certain international suppliers of network equipment and technologies to evaluate potential risks. We are currently unable to predict the outcome of such reviews, including any possible restrictions placed on our key suppliers, and as a result we cannot determine their potential impact on our business.
Our ability to pay dividends and repay debt depends on our subsidiaries’ ability to pay dividends and make other transfers to us
We are a holding company with no significant assets, other than the shares of our subsidiaries and our holdings of cash and cash equivalents. Our ability to pay dividends and repay debt depends on the continued transfer to us of dividends and other income from our subsidiaries. The ability of our subsidiaries to pay dividends and make other transfers to us may be limited by various regulatory, contractual and legal constraints that affect them.
We may fail to realize the benefits anticipated from acquisitions, divestments and significant investments we make from time to time
The business growth opportunities, revenue benefits, cost savings and other benefits we anticipated to result from our acquisitions, divestments and significant investments may not be achieved as expected, or may be delayed. Our divestments may also adversely affect our prospects. For example, we may be unable to fully implement our business plans and strategies for the combined businesses due to regulatory limitations, and we may face regulatory restrictions in our provision of combined services in some of the countries in which we operate. To the extent that we incur higher integration costs or achieve lower revenue benefits or fewer cost savings than expected, or if we are required to recognize impairments of acquired assets, investments or goodwill, our results of operations and financial condition may suffer.
A downgrade of Mexico’s credit rating could affect us
Credit rating agencies regularly evaluate Mexico and its sovereign rating based on various factors including macroeconomic trends, tax and budgetary conditions and indebtedness metrics. If Mexico’s sovereign credit rating is downgraded by credit rating agencies, the rating of our securities may also be downgraded, which could negatively affect our financing costs and the market price of our securities.
Changing expectations from stakeholders with respect to our environmental, social and governance practices may impose additional costs on us or expose us to new or additional risks
Influential investors and other stakeholders are increasingly focused on the environmental, social and governance (“ESG”) practices of companies across all industries. If we do not adapt to or comply with evolving expectations, or if we are perceived to have not responded appropriately to the growing concern for ESG issues, regardless of whether there is a legal requirement to do so, we may suffer from reputational damage, and our business, financial condition or stock price could be materially and adversely affected. If we do not meet our stakeholders’ expectations or we are not effective in addressing ESG matters or achieve relevant sustainability goals, trust in our brand may suffer and our business or our ability to access capital could be harmed.
42
RISKS RELATING TO THE TELECOMMUNICATIONS INDUSTRY GENERALLY
Changes in the telecommunications industry could affect our future financial performance
The telecommunications industry continues to experience significant changes as new technologies are developed that offer subscribers an array of choices for their communications needs. These changes include, among others, regulatory changes, evolving industry standards, ongoing improvements in the capacity and quality of digital technology, shorter development cycles for new products, evolving renewable energy and clean technologies, and changes in
end-user
needs and preferences. There is uncertainty as to the pace and extent of growth in subscriber demand, and as to the extent to which prices for airtime, broadband access, Pay TV and fixed-line rental may continue to decline. Our ability to compete in the delivery of high-quality internet and broadband services is particularly important, given the increasing contribution of revenues from data services to our overall growth. If we are unable to meet future advances in competing technologies on a timely basis or at an acceptable cost, we could lose subscribers to our competitors. In general, the development of new services in our industry requires us to anticipate and respond to the varied and continually changing demands of our subscribers. It also requires significant capital expenditure, including investment in the continual maintenance and upgrading of our networks, in order to expand coverage, increase our capacity to absorb higher bandwidth usage and adapt to new technologies. We may not be able to accurately predict technological trends or the success of new services in the market. In addition, there could be legal or regulatory restraints to our introduction of new services. If these services fail to gain acceptance in the marketplace, or if costs associated with implementation and completion of the introduction of these services materially increase, our ability to retain and attract subscribers could be adversely affected. This is true across many of the services we provide, including wireless and cable technology.The intellectual property used by us, our suppliers or service providers may infringe on intellectual property rights owned by others
Some of our products and services use intellectual property that we own or license from others. We also provide content we receive from content producers and distributors, such as ringtones, text games, video games, video, including TV programs and movies, wallpapers or screensavers, and we outsource services to service providers, including billing and customer care functions, that incorporate or utilize intellectual property. We and some of our suppliers, content
distributors and service providers have received, and may receive in the future, assertions and claims from third parties that the content, products or software utilized by us or our suppliers, content producers and distributors and service providers infringe on the patents or other intellectual property rights of these third parties. These claims could require us or an infringing supplier, content distributor or service provider to cease engaging in certain activities, including selling, offering and providing the relevant products and services. Such claims and assertions also could subject us to costly litigation and significant liabilities for damages or royalty payments, or require us to cease certain activities or prevent us from selling certain products or services.
Concerns about health risks relating to the use of wireless handsets and base stations may adversely affect our business
Portable communications devices have been alleged to pose health risks, including cancer, due to radio frequency emissions. Lawsuits have been filed in the United States against certain participants in the wireless industry alleging various adverse health consequences as a result of wireless phone usage, and our subsidiaries may be subject to similar litigation in the future.
Government authorities could increase regulation on electromagnetic emissions of mobile handsets and base stations, which could have an adverse effect on our business, financial condition and results of operations. Research and studies are ongoing, and there can be no assurance that further research and studies will not demonstrate a link between radio frequency emissions and health concerns. Any negative findings in these studies could adversely affect the use of wireless technology and, as a result, our future financial performance.
Developments in the telecommunications sector have resulted, and may result, in substantial write-downs of the carrying value of certain of our assets
Where the circumstances require, we review the carrying value of each of our assets, subsidiaries and investments in associates to assess whether those carrying values can be supported by the future discounted cash flows expected to be derived from such assets.
Whenever we consider that due to changes in the economic, regulatory, business or political environment, our goodwill, investments in associates, intangible assets or fixed assets may be impaired, we consider the necessity of performing certain valuation tests, which may result in impairment charges. The recognition of impairments of tangible, intangible and financial assets could adversely affect our results of operations.
43
RISKS RELATING TO OUR CONTROLLING SHAREHOLDERS, CAPITAL STRUCTURE AND TRANSACTIONS WITH AFFILIATES
Members of one family may be deemed to control us and may exercise their control in a manner that may differ from the interest of other shareholders
Based on reports of beneficial ownership of our shares filed with the SEC, Carlos Slim Helú, together with his sons, daughters and grandchildren (together, the “Slim Family”) may be deemed to control us. The Slim Family may be able to elect a majority of the members of our Board of Directors and to determine the outcome of other actions requiring a vote of our shareholders. The interests of the Slim Family may diverge from the interests of our other investors.
We have significant transactions with affiliates
We engage in various transactions with Telesites, S.A.B. de C.V. (“Telesites”) and certain subsidiaries of Grupo Carso, S.A.B. de C.V. (“Grupo Carso”) and Grupo Financiero Inbursa, S.A.B. de C.V. (“Grupo Financiero Inbursa”), all which may be deemed for certain purposes to be under common control with América Móvil.
These transactions occur in the ordinary course of business. Transactions with affiliates may create the potential for conflicts of interest.
We also make investments together with related parties, sell investments to related parties and buy investments from related parties. For more information about our transactions with affiliates, see “Related Party Transactions” under Part IV of this annual report.
Our bylaws restrict transfers of shares in some circumstances
Our bylaws provide that any acquisition or transfer of 10.0% or more of our capital stock by any person or group of persons acting together requires the approval of our Board of Directors. You may not acquire or transfer more than 10.0% of our capital stock without the approval of our Board of Directors.
The protections afforded to minority shareholders in Mexico are different from those in the United States
Under Mexican law, the protections afforded to minority shareholders are different from those in the United States. In particular, the law concerning fiduciary duties of directors is not as fully developed as in other jurisdictions, the procedure for class actions is different, and there are different procedural requirements for bringing shareholder lawsuits. As a result, in practice it may be more difficult for minority shareholders of América Móvil to seek remedies against us
or our directors or controlling shareholders than it would be for shareholders of a company incorporated in another jurisdiction, such as Delaware.
Holders of L Shares and L Share ADSs have limited voting rights
Our bylaws provide that holders of L Shares are not permitted to vote, except on such limited matters as, among others, the transformation or merger of América Móvil or the cancellation of registration of the L Shares with the Mexican Securities Registry (, or “RNV”) maintained by the CNBV or any stock exchange on which they are listed. If you hold L Shares or L Share ADSs, you will not be able to vote on most matters, including the declaration of dividends, which are subject to a shareholder vote in accordance with our bylaws.
Registro Nacional de Valores
Holders of ADSs are not entitled to attend shareholders’ meetings, and they may only vote through the depositary
Under our bylaws, a shareholder is required to deposit its shares with a custodian in order to attend a shareholders’ meeting. A holder of ADSs will not be able to meet this requirement and, accordingly, is not entitled to attend shareholders’ meetings. A holder of ADSs is entitled to instruct the depositary as to how to vote the shares represented by ADSs, in accordance with procedures provided for in the deposit agreements, but a holder of ADSs will not be able to vote its shares directly at a shareholders’ meeting or to appoint a proxy to do so.
Our bylaws may only be enforced in Mexico
Our bylaws provide that legal actions relating to the execution, interpretation or performance of the bylaws may be brought only in Mexican courts. As a result, it may be difficult for
non-Mexican
shareholders to enforce their shareholder rights pursuant to the bylaws.It may be difficult to enforce civil liabilities against us or our directors, officers and controlling persons
América Móvil is organized under the laws of Mexico, with its principal place of business in Mexico City, and most of our directors, officers and controlling persons reside outside the United States. In addition, all or a substantial portion of our assets and their assets are located outside of the United States. As a result, it may be difficult for investors to effect service of process within the United States on such persons or to enforce judgments against them, including in any action based on civil liabilities under U.S. federal securities laws.
There is doubt as to the enforceability against such persons in Mexico, whether in original actions or in actions to judgments of U.S. courts, of liabilities based solely on U.S. federal securities laws.
44
You may not be entitled to participate in future preemptive rights offerings
Under Mexican law, if we issue new shares for cash as part of certain capital increases, we must grant our shareholders the right to purchase a sufficient number of shares to maintain their existing ownership percentage in América Móvil. Rights to purchase shares in these circumstances are known as preemptive rights. Our shareholders do not have preemptive rights in certain circumstances such as mergers, convertible debentures, public offers and placement of repurchased shares. We may not be legally permitted to allow holders of ADSs or holders of L Shares or A Shares in the United States to exercise any preemptive rights in any future capital increase unless we file a registration statement with the U.S. Securities and Exchange Commission (the “SEC”) with respect to that future issuance of shares. At the time of any future capital increase, we will evaluate the costs and potential liabilities associated with filing a registration statement with the SEC and any other factors that we consider important to determine whether we will file such a registration statement.
We cannot assure you that we will file a registration statement with the SEC to allow holders of ADSs or U.S. holders of L Shares or A Shares to participate in a preemptive rights offering. As a result, the equity interest of such holders in América Móvil may be diluted proportionately. In addition, under current Mexican law, it is not practicable for the depositary to sell preemptive rights and distribute the proceeds from such sales to ADS holders.
RISKS RELATING TO DEVELOPMENTS IN MEXICO AND OTHER COUNTRIES
Economic, political and social conditions in Latin America, the Caribbean and Europe may adversely affect our business
Our financial performance may be significantly affected by general economic, political and social conditions in the markets where we operate. Many countries in Latin America and the Caribbean, including Mexico, Brazil and Argentina, have undergone significant economic, political and social crises in the past, and these events may occur again in the future. We cannot predict whether changes in political administrations will result in changes in governmental policy and whether such changes will affect our business. Factors related to economic, political and social conditions that could affect our performance include:
| • | significant governmental influence over local economies; |
| • | substantial fluctuations in economic growth; |
| • | high levels of inflation, including hyperinflation; |
| • | changes in currency values; |
| • | exchange controls or restrictions on expatriation of earnings; |
| • | high domestic interest rates; |
| • | price controls; |
| • | changes in governmental economic, tax, labor or other policies; |
| • | imposition of trade barriers; |
| • | changes in law or regulation; and |
| • | overall political, social and economic instability and civil unrest. |
Adverse economic, political and social conditions in Latin America, the Caribbean or in Europe may inhibit demand for telecommunication services and create uncertainty regarding our operating environment or may affect our ability to renew our licenses and concessions, to maintain or increase our market share or profitability and may have an adverse impact on future acquisitions, which could have a material adverse effect on our company. In addition, the perception of risk in the countries in which we operate may have a negative effect on the trading price of our shares and ADSs and may restrict our access to international financial markets.
Our business may also be especially affected by conditions in Mexico and Brazil, two of our largest markets. For example, Mexican elections in July 2018 and July 2021 resulted in a new president and in a Congress in which the political party with more members in both houses is a different political party from the parties that have been in power in the past. We cannot predict what changes in policy the Mexican administration may adopt, or their impact on our operations. Additionally, in Mexico, economic conditions are strongly impacted by those of the United States. There is continuing uncertainty regarding U.S. policies with respect to matters of importance to Mexico and its economy, particularly with respect to trade and migration.
The phase out of the London Interbank Offered Rate (LIBOR), or the replacement of LIBOR with a different reference rate, may adversely affect interest rates
In March 2021, the ICE Benchmark Administration (the Financial Conduct Authority-regulated and authorized administrator of LIBOR) announced that it would cease the publication of the
one-week
andtwo-month
U.S. dollar LIBOR after December 31, 2021, and the publication of all remaining U.S. dollar LIBOR tenors after June 30, 2023.The U.S. Federal Reserve, in conjunction with the Alternative Reference Rates Committee (the “ARRC”), a steering committee comprised of large U.S. financial institutions, has proposed a new index calculated by short term repurchase agreements, backed by U.S. Treasury securities, called the Secured Overnight Financing Rate (“SOFR”) as an alternative
45
to LIBOR for use in contracts that are currently indexed to U.S. dollar LIBOR and has proposed a paced market transition plan to SOFR. On July 29, 2021, the ARRC formally recommended SOFR as its preferred alternative replacement rate for U.S. dollar LIBOR.
Although many of our LIBOR-based obligations provide for alternative methods of calculating the interest rate payable if LIBOR is not reported, the extent and manner of any future changes with respect to methods of calculating LIBOR or replacing LIBOR with another benchmark are unknown and impossible to predict at this time and, as such, may result in interest rates that are materially higher than current interest rates. This could materially and adversely affect our results of operations, cash flows and liquidity.
Changes in exchange rates could adversely affect our financial condition and results of operations
We are affected by fluctuations in the value of the currencies in which we conduct operations compared to the currencies in which our indebtedness is denominated. Such changes result in exchange losses or gains on our net indebtedness and accounts payable. In 2021, we reported net foreign exchange losses of Ps.17.0 billion.
In addition, currency fluctuations between the Mexican peso and the currencies of our
non-Mexican
subsidiaries affect our results as reported in Mexican pesos. Currency fluctuations are expected to continue to affect our financial income and expense.Major depreciation of the currencies in which we conduct operations could cause governments to impose exchange controls that would limit our ability to transfer funds between us and our subsidiaries Major depreciation of the currencies in which we conduct operations may result in disruption of the international foreign exchange markets and may limit our ability to transfer or to convert such currencies into U.S. dollars and other currencies for the purpose of making timely payments of interest and principal on our indebtedness. The government of Argentina has adopted exchange controls and restrictions on the movement of capital and has taken other measures in response to capital flight and the significant depreciation of the Argentine peso. In addition, although the Mexican government does not currently restrict, and for many years has not restricted, the right or ability of Mexican or foreign persons or entities to convert Mexican pesos into U.S. dollars or to transfer other currencies out of Mexico, it could institute restrictive exchange rate policies in the future. Similarly, the Brazilian government may impose temporary restrictions on the conversion of Brazilian reais into foreign currencies and on the remittance to foreign investors of proceeds from investments in Brazil whenever there is a
serious imbalance in Brazil’s balance of payments or a reason to foresee a serious imbalance.
Developments in other countries may affect the market price of our securities and adversely affect our ability to raise additional financing
The market value of securities of Mexican companies is, to varying degrees, affected by economic and market conditions in other countries, including the United States, the European Union (the “EU”) and emerging market countries. Although economic conditions in such countries may differ significantly from economic conditions in Mexico, investors’ reactions to developments in any of these other countries may have an adverse effect on the market value of securities of Mexican issuers. Crises in the United States, the EU and emerging market countries may diminish investor interest in securities of Mexican issuers. For example, in response to the ongoing military conflict involving Russia and Ukraine, the United States, other North Atlantic Treaty Organization member states, as well as
non-member
states, have announced targeted economic sanctions on Russia, certain Russian citizens and enterprises. The continuation of the conflict may trigger a series of additional economic and other sanctions enacted by the United States, other North Atlantic Treaty Organization member states, and other countries. This could materially and adversely affect economic conditions, the market price of our securities and our operations in Belarus, and could also make it more difficult for us to access the capital markets and finance our operations in the future on acceptable terms or at all.46

47

48

The following table sets forth our capital structure as of March 31, 2022.
SERIES | NUMBER OF SHARES (MILLIONS) | PERCENT OF COMBINED CAPITAL | A SHARES AND AA SHARES (1) | |||||||||
L Shares | 43,164 | 67.2 | % | — | ||||||||
(no par value) | ||||||||||||
AA Shares | 20,555 | 32.0 | % | 97.6 | % | |||||||
(no par value) | ||||||||||||
A Shares | 498 | 0.8 | % | 2.4 | % | |||||||
(no par value) | ||||||||||||
Total (2) | 64,217 | 100 | % | 100 | % | |||||||
(1) The AA Shares and A Shares of América Móvil, together, are entitled to elect a majority of our directors. Holders of L Shares are entitled to limited voting rights under our bylaws. See “Bylaws—Voting Rights” under this Part IV.(2) Figures in the table may not recalculate exactly due to rounding. | ||||||||||||
According to reports of beneficial ownership of our shares filed with the SEC, the Slim Family may be deemed to control us through their interests in a Mexican trust that holds AA Shares and L Shares for their benefit (the “Family Trust”), their interest in Control Empresarial de Capitales, S.A. de C.V. (“Control Empresarial de Capitales”) (formerly known as Inversora Carso, S.A. de C.V.), and their direct ownership of our shares. See “Management—Directors” and “Management—Executive Committee” under Part V and “Related Party Transactions” under this Part IV of this annual report.
The following table identifies owners of more than 5.0% of any series of our shares as of March 31, 2022. Except as described in the table below and the accompanying notes, we are not aware of any holder of more than 5.0% of any series of our shares. Figures below do not include L Shares that would be held by each shareholder upon conversion of AA Shares or A Shares, as provided for under our bylaws. See “Management—Share Ownership of Directors and Senior Management” under Part V of this annual report.
SHAREHOLDER | SHARES OWNED (MILLIONS) | PERCENT OF CLASS (1) | ||||||||||
AA SHARES: | ||||||||||||
Family Trust (2) | 10,894 | 53.0% | ||||||||||
Control Empresarial de | ||||||||||||
Capitales (3) | 4,381 | 21.3% | ||||||||||
Carlos Slim Helú | 1,879 | 9.1% | ||||||||||
L SHARES: | ||||||||||||
| Control Empresarial de Capitales (3) | 6,318 | 14.6% | ||||||||||
Family Trust (2) | 6,849 | 15.9% | ||||||||||
Carlos Slim Helú | 3,322 | 7.7% | ||||||||||
Blackrock (4) | 2,164 | 5.0% | ||||||||||
(1) Percentage figures are based on the number of shares outstanding as of March 31, 2022.(2) The Family Trust is a Mexican trust that holds AA Shares and L Shares for the benefit of members of the Slim Family. In addition to shares held by the Family Trust, members of the Slim Family, including Carlos Slim Helú, directly own an aggregate of 3,558 million AA Shares and 10,227 million L Shares representing 17.3% and 23.7%, respectively, of each series. According to beneficial reports filed with the SEC, none of these members of the Slim Family, other than Carlos Slim Helú, individually directly own more than 5.0% of any class of our shares.(3) Includes shares owned by subsidiaries of Control Empresarial de Capitales, formerly known as Inversora Carso. Based on beneficial ownership reports filed with the SEC, Control Empresarial de Capitales is a Mexican sociedad anónima de capital variable and may be deemed to be controlled by the Slim Family.(4) Based on beneficial ownership reports filed with the SEC. | ||||||||||||
As of March 31, 2022, 12.2% of the outstanding L Shares were represented by L Share ADSs, each representing the right to receive 20 L Shares, and 99.9% of the L Share ADSs were held by 6,246 registered holders with addresses in the United States. As of such date, 23.8% of the A Shares were held in the form of A Share ADSs, each representing the right to receive 20 A Shares, and 99.84% of the A Share ADSs were held by 3,113 registered holders with addresses in the United States. Each A Share may be exchanged at the option of the holder for one L Share.
We have no information concerning the number of holders with registered addresses in the United States that hold:
| • | AA Shares; |
| • | A Shares not represented by ADSs; or |
| • | L Shares not represented by ADSs. |
49

Our subsidiaries purchase materials or services from a variety of companies that may be deemed for certain purposes to be under common control with us, including Telesites, Grupo Carso, Grupo Financiero Inbursa and their respective subsidiaries.
These services include insurance and banking services provided by Grupo Financiero Inbursa and its subsidiaries. In addition, we sell products in Mexico through the Sanborns and Sears Operadora México, S.A. de C.V. store chains. Some of our subsidiaries also purchase network construction services and materials from subsidiaries of Grupo Carso. Our subsidiaries purchase these materials and services on terms no less favorable than they could obtain from unaffiliated parties, and would have access to other sources if our related parties ceased to provide them on competitive terms.
We and Telesites have entered into an agreement providing for site usage fees, annual price escalations and fixed annual charges that permit us to install a
pre-determined
amount of equipment at the Telesite towers and provide for incrementalfee payments if capacity use is exceeded. The principal economic terms of the agreement conform to the reference terms published by Telesites and approved by the Federal Telecommunications Institute (, or “IFT”).
Instituto Federal de Telecomunicaciones
We enter into a number of transactions with related parties in the ordinary course of our business. We believe that these transactions are on terms comparable to those that could be obtained in arm’s length negotiations with unaffiliated third parties. Note 6 and Note 15 to our audited consolidated financial statements included in this annual report set forth information on related party transactions for the three year period set forth therein. We do not regard any of these transactions as material to us.
In accordance with Mexican law, an independent audit committee must provide an opinion to the Board of Directors regarding any transaction with a related party that requires approval by the Board of Directors. Pursuant to Mexican law, related party transactions that are
non-material,
are within the ordinary course of business, or are on anarm’s-length
basis, do not require specific board approval, if consistent with the guidelines approved by the Board of Directors.
We regularly pay cash dividends on our shares. The table below sets forth the nominal amount of dividends paid per share on each date indicated, in Mexican pesos and translated into U.S. dollars at the exchange rate reported by Banco de México, as published in the Official Gazette, for each of the respective payment dates.
PAYMENT DATE | PESOS PER SHARE | DOLLARS PER SHARE | ||||||
November 8, 2021 | Ps.0.20 | U.S.$ 0.0097 | ||||||
July 19, 2021 | Ps.0.20 | U.S.$ 0.0100 | ||||||
November 9, 2020 | Ps.0.19 | U.S.$ 0.0092 | ||||||
July 20, 2020 | Ps.0.19 | U.S.$ 0.0085 | ||||||
November 11, 2019 | Ps.0.17 | U.S.$ 0.0090 | ||||||
July 15, 2019 | Ps.0.18 | U.S.$ 0.0095 | ||||||
November 12, 2018 | Ps.0.16 | U.S.$ 0.0080 | ||||||
July 16, 2018 | Ps.0.16 | U.S.$ 0.0085 | ||||||
November 13, 2017 | Ps.0.15 | U.S.$ 0.0079 | ||||||
July 17, 2017 | Ps.0.15 | U.S.$ 0.0085 | ||||||
On April 20, 2022 our shareholders approved a cash dividend of Ps.0.44 per share, payable in one installment on August 29, 2022.
The declaration, amount and payment of dividends by América Móvil is determined by majority vote of the holders of AA Shares and A Shares, generally on the recommendation of the Board of Directors, and depends on our results of operations, financial condition, cash requirements, future prospects and other factors considered relevant by the holders of AA Shares and A Shares.
Our bylaws provide that holders of AA Shares, A Shares and L Shares participate equally on a
per-share
basis in dividend payments and other distributions, subject to certainnon-material
preferential dividend rights of holders of L Shares.50


Our shares and ADSs are listed on the following markets:
SECURITY | STOCK EXCHANGE | TICKER SYMBOL | ||
L Shares | Mexican Stock Exchange—Mexico City | AMXL | ||
L Share ADSs | New York Stock Exchange—New York | AMX | ||
A Shares | Mexican Stock Exchange—Mexico City | AMXA | ||
A Share ADSs | New York Stock Exchange—New York | AMOV | ||
We are aorganized under Mexican law. For a description of our AA Shares, A Shares and L Shares, and a brief summary of certain significant provisions in our current bylaws and Mexican law, see “Description of Securities Registered Under Section 12 of the Exchange Act,” filed as Exhibit 2.1 with this annual report. For a description of our Board of Directors, Executive and Audit and Corporate Practices Committees and External Auditor, see “Management” under Part V of this annual report.
Sociedad Anónima Bursátil de Capital Variable
51

We periodically repurchase at our discretion our L Shares and A Shares on the open market pursuant to guidelines approved by our Board of Directors, using funds up to an amount authorized by our shareholders specifically for the repurchase of L Shares and A Shares. Our shareholders authorized the allocation of up to Ps.6 billion in February 2021, Ps.25 billion in April 2021 and Ps.26 billion in November 2021, in each case to repurchase L Shares and A Shares. In our 2022 annual ordinary shareholders’ meeting, our shareholders authorized increase to the buyback program fund by an amount equal to Ps.26 billion, which after the increase amounts to Ps.36.539 billion to repurchase L Shares and A Shares from April 2022 to April 2023.
The following table sets out information concerning purchases of our L Shares by us and our affiliated purchasers in 2021. We did not repurchase our L Shares other than through the share repurchase program, and we did not repurchase any A Shares.
PERIOD | TOTAL NUMBER OF SHARES PURCHASED (1) | AVERAGE PRICE PER SHARE | TOTAL NUMBER OF SHARES PURCHASED AS PART OF PUBLICLY ANNOUNCED PLANS OR PROGRAMS | APPROXIMATE MEXICAN PESO VALUE OF SHARES THAT MAY YET BE PURCHASED UNDER THE PLANS OR PROGRAMS (2) | ||||||||||||
January 2021 | 58,300,000 | Ps. | 14.70 | 58,300,000 | Ps. | 137,547,600.71 | ||||||||||
February 2021 | 83,000,000 | 13.76 | 83,000,000 | 5,002,342,621.26 | ||||||||||||
March 2021 | 180,000,000 | 14.11 | 180,000,000 | 2,476,906,037.20 | ||||||||||||
April 2021 | 169,345,689 | 14.42 | 169,345,689 | 24,433,023,601.16 | ||||||||||||
May 2021 | 132,896,900 | 14.86 | 132,896,900 | 22,469,536,093.00 | ||||||||||||
June 2021 | 141,528,312 | 15.63 | 141,528,312 | 20,270,462,806.00 | ||||||||||||
July 2021 | 184,489,748 | 15.81 | 184,489,748 | 17,370,881,547.05 | ||||||||||||
August 2021 | �� | 214,000,000 | 17.87 | 214,000,000 | 13,568,848,403.30 | |||||||||||
September 2021 | 249,000,000 | 18.64 | 249,000,000 | 8,954,740,926.13 | ||||||||||||
October 2021 | 273,600,000 | 18.14 | 273,600,000 | 4,020,009,413.98 | ||||||||||||
November 2021 | 285,400,000 | 18.70 | 285,400,000 | 24,714,680,611.87 | ||||||||||||
December 2021 | 201,259,367 | 20.50 | 201,259,367 | 20,612,674,146.83 | ||||||||||||
Total L Shares | 2,172,820,016 | 2,172,820,016 | ||||||||||||||
(1) This includes purchases by us and our affiliated purchasers in 2021.(2) This is the approximate peso amount available at the end of the period for purchases of both L Shares and A Shares pursuant to our share repurchase program. | ||||||||||||||||
52

The following summary contains a description of certain Mexican federal and U.S. federal income tax consequences of the acquisition, ownership and disposition of L Shares, A Shares, L Share ADSs or A Share ADSs, but it does not purport to be a comprehensive description of all of the tax considerations that may be relevant to a decision to purchase, hold or sell shares or ADSs.
This discussion does not constitute, and should not be considered as, legal or tax advice to holders. The discussion is for general information purposes only and is based upon the federal tax laws of Mexico (including the Mexican Income Tax Law () and the United States in effect on the date of this annual report, including the Convention for the Avoidance of Double Taxation and the Prevention of Fiscal Evasion and the protocols thereto between the United States and Mexico currently in force (together, the "Tax Treaty") and the agreement between the United States and Mexico concerning the exchange of information with respect to tax matters. The Tax Treaty is subject to change, and such changes may have retroactive effects. Holders of shares or ADSs should consult their own tax advisors as to the Mexican, U.S. or other tax consequences of the purchase, ownership and disposition of shares or ADSs, including, in particular, the effect of any foreign, state or local tax laws.
Ley del Impuesto sobre la Renta
MEXICAN TAX CONSIDERATIONS
The following is a general summary of the principal consequences under the Mexican Income Tax Law and the rules and regulations thereunder, as currently in effect, of an investment in shares or ADSs by a holder that is not a resident of Mexico and that will not hold shares or ADSs or a beneficial interest therein in connection with the conduct of a trade or business through a permanent establishment in Mexico (a "nonresident holder").
For purposes of Mexican taxation, the definition of residence is highly technical and residence arises in several situations. Generally, an individual is a resident of Mexico if he or she has established his or her home or center of vital interests in Mexico, and a corporation is considered a resident if it has its place of effective management in Mexico. However, any determination of residence should take into account the particular situation of each person or legal entity.
If a legal entity or an individual is deemed to have a permanent establishment in Mexico for Mexican tax purposes, all income attributable to that permanent establishment will be subject to Mexican income taxes, in accordance with applicable tax laws.
This summary does not purport to be a comprehensive description of all the Mexican tax considerations that may be relevant to a decision to purchase, own or dispose of the shares. In particular, this summary (i) does not describe any tax consequences arising under the laws of any state, locality, municipality or taxing jurisdiction other than certain federal laws of Mexico and (ii) does not address all of the Mexican tax consequences that may be applicable to specific holders of the shares, including a holder:
| • | whose shares were not acquired through the Mexican Stock Exchange or other markets authorized by the Ministry of Finance and Public Credit ( Secretaría de Hacienda y Crédito Público |
| • | of shares or ADSs that control us; |
| • | that holds 10.0% or more of our shares; |
| • | that is part of a group of persons for purposes of Mexican law that controls us (or holds 10.0% or more of our shares); or |
| • | that is a resident of Mexico or is a corporation resident in a tax haven (as defined by the Mexican Income Tax Law). |
Tax Treaties
Provisions of the Tax Treaty that may affect the taxation of certain U.S. holders (as defined below) are summarized below.
The Mexican Income Tax Law has established procedural requirements for a nonresident holder to be entitled to benefits under any of the tax treaties to which Mexico is a party, including on dispositions and dividends. These procedural requirements include, among others, the obligation to (i) prove tax treaty residence, (ii) file tax calculations made by an authorized certified public accountant or an informational tax statement, as the case may be, and (iii) appoint representatives in Mexico for taxation purposes. Parties related to the issuer may be subject to additional procedural requirements.
Payment of Dividends
Dividends, either in cash or in kind, paid with respect to L Shares, A Shares, L Share ADSs or A Share ADSs will generally be subject to a 10.0% Mexican withholding tax (provided that no Mexican withholding tax will apply to distributions of net taxable profits generated before 2014).
53
Taxation of Dispositions
The tax rate on income realized by a nonresident holder from a disposition of shares through the Mexican Stock Exchange is generally 10.0%, which is applied to the net gain realized on the disposition. This tax is payable through withholding made by intermediaries. However, such withholding does not apply to a nonresident holder who certifies that the holder is resident in a country with which Mexico has entered into an income tax treaty.
The sale or other transfer or disposition of shares not carried out through the Mexican Stock Exchange and not held in the form of ADSs will be subject to a 25% tax rate in Mexico, which is applicable to the gross proceeds realized from the sale.
Alternatively, a nonresident holder may, subject to certain requirements, elect to pay taxes on the net gain realized from the sale of shares at a rate of 35%.
The sale or disposition of ADSs through securities exchanges or markets recognized under the Mexican federal tax code (which includes the NYSE) by nonresidents who are residents of a country with which Mexico has entered into an income tax treaty is not subject to income tax in Mexico under the current tax rules. The tax treatment of such transfer of ADSs by nonresidents who are also not residents of a country with which Mexico has entered into an income tax treaty is not clear under the current Mexican tax rules.
Pursuant to the Tax Treaty, gains realized by a U.S. resident that is eligible to receive benefits pursuant to the Tax Treaty from the sale or other disposition of shares or ADSs, even if the sale or disposition is not carried out under the circumstances described in the preceding paragraphs, will not be subject to Mexican income tax, provided that the gains are not attributable to a permanent establishment or a fixed base in Mexico, and further provided that such U.S. holder owned less than 25% of the shares representing our capital stock (including ADSs), directly or indirectly, during the
12-month
period preceding such disposition. U.S. residents should consult their own tax advisors as to their possible eligibility under the Tax Treaty.Gains and gross proceeds realized by other nonresident holders that are eligible to receive benefits pursuant to other income tax treaties to which Mexico is a party may be exempt from Mexican income tax, in whole or in part.
Non-U.S.
holders should consult their own tax advisors as to their possible eligibility under such treaties.Other Mexican Taxes
A nonresident holder generally will not be liable for estate, inheritance or similar taxes with respect to its holdings of shares or ADSs; provided, however, that gratuitous transfers of shares or ADSs may, in certain circumstances, result in the imposition of a Mexican tax upon the recipient.
There are no Mexican stamp, issue registration or similar taxes payable by a nonresident holder with respect to shares or ADSs.
U.S. FEDERAL INCOME TAX CONSIDERATIONS
The following is a summary of certain U.S. federal income tax consequences to U.S. holders (as defined below) of the acquisition, ownership and disposition of shares or ADSs. The summary does not purport to be a comprehensive description of all of the tax consequences of the acquisition, ownership or disposition of shares or ADSs. The summary applies only to U.S. holders that will hold their shares or ADSs as capital assets and does not apply to special classes of U.S. holders, such as dealers in securities or currencies, holders with a functional currency other than the U.S. dollar, holders of 10.0% or more of our shares measured by vote or value (whether held directly or through ADSs or both),basis, entities that are treated for U.S. federal income tax purposes as partnerships or other pass-through entities or equity holders therein and persons holding their shares or ADSs in a hedging transaction or as part of a straddle or conversion transaction.
tax-exempt
organizations, banks, insurance companies or other financial institutions, holders liable for the alternative minimum tax, securities traders electing to account for their investment in their shares or ADSs on amark-to-market
For purposes of this discussion, a "U.S. holder" is a holder of shares or ADSs that is:
| • | a citizen or resident of the United States of America, |
| • | a corporation (or other entity taxable as a corporation) organized under the laws of the United States of America or any state thereof or |
| • | otherwise subject to U.S. federal income taxation on a net income basis with respect to the shares or ADSs. |
Each U.S. holder should consult such holder’s own tax advisor concerning the overall tax consequences to it of the ownership or disposition of shares or ADSs that may arise under foreign, state and local laws.
54
Treatment of ADSs
In general, a U.S. holder of ADSs will be treated as the owner of the shares represented by those ADSs for U.S. federal income tax purposes. Deposits or withdrawals of shares by U.S. holders in exchange for ADSs will not result in the realization of gain or loss for U.S. federal income tax purposes. U.S. holders that withdraw any shares should consult their own tax advisors regarding the treatment of any foreign currency gain or loss on any pesos received in respect of such shares.
Taxation of Distributions
In general, a U.S. holder will treat the gross amount of distributions we pay, without reduction for Mexican withholding tax, as dividend income for U.S. federal income tax purposes to the extent of our current and accumulated earnings and profits. Because we do not expect to maintain calculations of our earnings and profits under U.S. federal income tax principles, it is expected that distributions paid to U.S. holders generally will be reported as dividends. In general, the gross amount of any dividends will be includible in the gross income of a U.S. holder as ordinary income on the day on which the dividends are received by the U.S. holder, in the case of shares, or by the depositary, in the case of ADSs.
Dividends will be paid in pesos and will be includible in the income of a U.S. holder in a U.S. dollar amount calculated by reference to the exchange rate in effect on the date that they are received by the U.S. holder, in the case of shares, or by the depositary, in the case of ADSs (regardless of whether such pesos are in fact converted into U.S. dollars on such date). If such dividends are converted into U.S. dollars on the date of such receipt, a U.S. holder generally should not be required to recognize foreign currency gain or loss in respect of the dividends. U.S. holders should consult their own tax advisors regarding the treatment of foreign currency gain or loss, if any, on any pesos received by a U.S. holder or depositary that are converted into U.S. dollars on a date subsequent to receipt. Dividends paid by us will not be eligible for the dividends-received deduction allowed to corporations under the U.S. Internal Revenue Code of 1986, as amended (the "Code").
The amount of Mexican tax withheld generally will give rise to a foreign tax credit or deduction for U.S. federal income tax purposes. Dividends generally will constitute "passive category income" for purposes of the foreign tax credit. The foreign tax credit rules are complex. U.S. holders should consult their own tax advisors with respect to the implications of those rules for their investments in our shares or ADSs.
Subject to certain exceptions for short-term and hedged positions, the U.S. dollar amount of dividends received by an individual with respect to the shares or ADSs will be subject
to taxation at reduced rates if the dividends are "qualified dividends." Dividends paid on the shares or ADSs will be treated as qualified dividends if (i) (A) the shares or ADSs are readily tradable on an established securities market in the United States or (B) we are eligible for the benefits of a comprehensive tax treaty with the United States which the U.S. Treasury determines is satisfactory for purposes of this provision and which includes an exchange of information program, and (ii) we were not, in the year prior to the year in which the dividend was paid, and are not, in the year in which the dividend is paid, a passive foreign investment company ("PFIC"). The ADSs are listed on the NYSE, and will qualify as readily tradable on an established securities market in the United States so long as they are so listed. In addition, the U.S. Treasury has determined that the Tax Treaty meets the requirements for reduced rates of taxation, and we believe we are eligible for the benefits of the Tax Treaty. Based on our audited consolidated financial statements and relevant market data, we believe that we were not treated as a PFIC for U.S. federal income tax purposes with respect to the 2020 and 2021 taxable years. In addition, based on our audited consolidated financial statements and our current expectations regarding the value and nature of our assets, the sources and nature of our income and relevant market data, we do not anticipate becoming a PFIC for the 2022 taxable year. Holders of shares or ADSs should consult their own tax advisors regarding the availability of the reduced dividend tax rate in the light of their own particular circumstances.
Distributions of additional shares or ADSs to U.S. holders with respect to their shares or ADSs that are made as part of a pro rata distribution to all of our shareholders generally will not be subject to U.S. federal income tax.
Taxation of Dispositions
A U.S. holder generally will recognize capital gain or loss on the sale or other disposition of the shares or ADSs in an amount equal to the difference between the U.S. holder’s basis in such shares or ADSs (in U.S. dollars) and the amount realized on the disposition (in U.S. dollars, determined at the spot rate on the date of disposition if the amount realized is denominated in a foreign currency). Gain or loss recognized by a U.S. holder on such sale or other disposition generally will be long-term capital gain or loss if, at the time of disposition, the shares or ADSs have been held for more than one year. Long-term capital gain recognized by a U.S. holder that is an individual is taxable at reduced rates. The deductibility of a capital loss is subject to limitations.
Gain, if any, realized by a U.S. holder on the sale or other disposition of the shares or ADSs generally will be treated as U.S. source income for U.S. foreign tax credit purposes. Consequently, if a Mexican withholding tax is imposed on the sale or disposition of the shares, a U.S. holder that does not
55
receive significant foreign source income from other sources may not be able to derive effective U.S. foreign tax credit benefits in respect of such Mexican taxes. In addition, as a result of recent changes to the foreign tax credit rules, for taxable years beginning after December 28, 2021, any Mexican tax imposed on the sale or other disposition of the shares or ADSs is unlikely to be treated as creditable, unless the U.S. Holder is eligible for and elects the benefits of the Tax Treaty. U.S. holders should consult their own tax advisors regarding the application of the foreign tax credit rules to their investment in, and disposition of, the shares or ADSs.
Information Reporting and Backup Withholding
Dividends on, and proceeds from the sale or other disposition of, the shares or ADSs paid to a U.S. holder generally may be subject to the information reporting requirements of the Code and may be subject to backup withholding unless the holder:
| • | establishes that it is an exempt recipient, if required, or |
| • | provides an accurate taxpayer identification number on a properly completed Internal Revenue Service Form W-9 and certifies that no loss of exemption from backup withholding has occurred. |
The amount of any backup withholding from a payment to a holder will be allowed as a credit against the U.S. holder’s U.S. federal income tax liability and may entitle such holder to a refund, provided that certain required information is timely furnished to the Internal Revenue Service.
U.S. Tax Consequences for
Non-U.S.
holdersDISTRIBUTIONS. A holder of shares or ADSs that is, with respect to the United States, a foreign corporation or a nonresident alien individual (a
“non-U.S.
holder”) will generally not be subject to U.S. federal income or withholding tax on dividends received on shares or ADSs, unless such income is effectively connected with the conduct by the holder of a U.S. trade or business.DISPOSITIONS. A
non-U.S.
holder of shares or ADSs will not be subject to U.S. federal income or withholding tax on gain realized on the sale of shares or ADSs, unless:| • | gain is effectively connected with the conduct by the holder of a U.S. trade or business or |
| • | in the case of gain realized by an individual holder, the holder is present in the United States for 183 days or more in the taxable year of the sale and certain other conditions are met. |
INFORMATION REPORTING AND BACKUP WITHHOLDING. Although
non-U.S.
holders generally are exempt from backup withholding, anon-U.S.
holder may be required to comply with certification and identification procedures in order to establish its exemption from information reporting and backup withholding.56

57

58

DIRECTORS
Our Board of Directors has broad authority to manage our company. Our bylaws provide for the Board of Directors to consist of between 5 and 21 directors and allow for the election of an equal number of alternate directors. Directors need not be shareholders. A majority of our directors and a majority of the alternate directors must be Mexican citizens and elected by Mexican shareholders.
A majority of the holders of the AA Shares and A Shares voting together elect a majority of the directors and alternate directors, provided that any holder or group of holders of at least 10.0% of the total AA Shares and A Shares is entitled to name one director and one alternate director. Two directors and two alternate directors, if any, are elected by a majority vote of the holders of L Shares. Each alternate director may attend meetings of the Board of Directors and vote in the absence of the corresponding director. Directors and alternate directors are elected or reelected at each annual general meeting of shareholders and each annual ordinary special meeting of holders of L Shares. In accordance with the Mexican Securities Market Law (), the determination as to the independence of our directors is made by our shareholders, though the CNBV may challenge this determination. Pursuant to our bylaws and the Mexican Securities Market Law, at least 25.0% of our directors must be independent. In order to have a quorum for a meeting of the Board of Directors, a majority of those present must be Mexican nationals.
Ley del Mercado de Valores
At a shareholders’ meeting held on November 22, 2021, Claudia Jañez Sanchez and Gisselle Morán Jiménez were designated as independent members of our Board of Directors. At the annual ordinary shareholders’ meeting held on April 20, 2022, except for Mr. Elías Ayub, the current members of the Board of Directors, the Executive Committee and the Audit and Corporate Practices Committee were reelected, and the Corporate Secretary and the Corporate Pro Secretary were reappointed, with 12 directors elected by the AA Shares and A Shares voting together and 2 directors elected by the L Shares. 64% of the members of the Board of Directors are independent and 21% are women.
Our bylaws provide that the members of the Board of Directors are elected for a term of one year. Pursuant to Mexican law, members of the Board continue in their positions after the expiration of their terms for up to an additional
30-day
period if new members are not elected. Furthermore, in certain circumstances provided under the Mexican Securities Market Law, the Board of Directors may elect temporary directors who then may be elected or replaced at the shareholders’ meetings.The names and positions of the members of the Board reelected or elected for the first time at the 2022 annual general shareholders’ meeting, their year of birth, and information
concerning their committee membership and principal business activities outside América Móvil are set forth below:
Directors elected by holders of Series AA and Series A Shares:
CARLOS SLIM DOMIT | ||
Chairman of the Board and the Executive Committee | ||
Born: | 1967 | |
First elected: | 2011 | |
Term expires: | 2023 | |
Principal occupation: | Chairman of the Board of América Móvil | |
Other directorships: | Chairman of the Board of Grupo Carso and its affiliates | |
Business experience: | Business administration; Chief Executive Officer of Sanborn Hermanos | |
PATRICK SLIM DOMIT | ||
Vice Chairman and Member of the Executive Committee | ||
Born: | 1969 | |
First elected: | 2004 | |
Term expires: | 2023 | |
Principal occupation: | Vice Chairman of our Board of Directors | |
Other directorships: | Director of Grupo Carso and its affiliates | |
Business experience: | Business administration; Chief Executive Officer of Grupo Carso and Vice President of Commercial Markets of Telmex | |
DANIEL HAJJ ABOUMRAD | ||
Director and Member of the Executive Committee | ||
Born: | 1966 | |
First elected: | 2000 | |
Term expires: | 2023 | |
Principal occupation: | Chief Executive Officer of América Móvil | |
Other directorships: | Director of Grupo Carso and Telmex | |
Business experience: | Business administration; Chief Executive Officer of Compañía Hulera Euzkadi | |
LUIS ALEJANDRO SOBERÓN KURI | ||
Director | ||
Born: | 1960 | |
First elected: | 2000 | |
Term expires: | 2023 | |
Principal occupation: | Chief Executive Officer and Chairman of the Board of Serinem México (a subsidiary of Corporación Interamericana de Entretenimiento) | |
Other directorships: | Director of CIE; Director of Grupo Financiero Citibanamex | |
Business experience: | Business administration; Various positions at CIE | |
59
FRANCISCO JOSÉ MEDINA CHÁVEZ | ||
Director | ||
Born: | 1956 | |
First elected: | 2018 | |
Term expires: | 2023 | |
Principal occupation: | Chief Executive Officer and Chairman of Grupo Fame, and Chairman of Grupo Altozano | |
Other directorships: | Director of Banco Nacional de México and Grupo Chedraui | |
Business experience: | Real estate; Director of Aeroméxico and Mitsui Mexico | |
ERNESTO VEGA VELASCO | ||
Director, Chairman of the Audit and Corporate Practices Committee | ||
Born: | 1937 | |
First elected: | 2007 | |
Term expires: | 2023 | |
Principal occupation: | Retired. Member of the Board of Directors and audit and corporate practices, planning and finance and evaluation and compensation committees of certain companies. | |
Other directorships: | Director of Kuo and its affiliates, Inmuebles Carso and its affiliates, and Industrias Peñoles | |
Business experience: | Accounting and business administration; Various positions in Desc Group, including Corporate Vice- President | |
RAFAEL MOISÉS KALACH MIZRAHI | ||
Director and Member of the Audit and Corporate Practices Committee | ||
Born: | 1946 | |
First elected: | 2012 | |
Term expires: | 2023 | |
Principal occupation: | Chairman and Chief Executive Officer of Grupo Kaltex | |
Other directorships: | Director of Grupo Carso and its affiliates | |
Business experience: | Accounting and business administration; various positions in Grupo Kaltex | |
ANTONIO COSÍO PANDO | ||
Director | ||
Born: | 1968 | |
First elected: | 2015 | |
Term expires: | 2023 | |
Principal occupation: | Vice President of Grupo Hotelero las Brisas, Compañía Industrial Tepeji del Río, and Bodegas de Santo Tomás | |
Other directorships: | Director of Grupo Carso and its affiliates, Corporación Actinver, and Grupo Aeromexico | |
Business experience: | Engineer; various positions in Grupo Brisas and Compañía Industrial Tepeji del Río | |
OSCAR VON HAUSKE SOLÍS | ||
Director | ||
Born: | 1957 | |
First elected: | 2011 | |
Term expires: | 2023 | |
Principal occupation: | Chief Fixed-line Operations Officer of América Móvil | |
Other directorships: | Member of Telekom Austria’s Supervisory Board | |
Business experience: | Accounting and business administration; Chief Executive Officer of Telmex Internacional, Chief Systems and Telecommunications Operators Officer of Telmex and member of KPN’s | |
VANESSA HAJJ SLIM | ||
Director | ||
Born: | 1997 | |
First elected: | 2018 | |
Term expires: | 2023 | |
DAVID IBARRA MUÑOZ | ||
Director | ||
Born: | 1930 | |
First elected: | 2000 | |
Term expires: | 2023 | |
Principal occupation: | Retired | |
Other directorships: | Director of Grupo Carso and its affiliates, and Grupo Mexicano de Desarrollo | |
Business experience: | Economist; Chief Executive Officer of Nacional Financiera and Secretary of Finance and Public Credit of Mexico | |
GISSELLE MORÁN JIMÉNEZ | ||
Director | ||
Born: | 1974 | |
First elected: | 2021 | |
Term expires: | 2023 | |
Principal occupation: | Chief Executive Officer of Real Estate, Market and Lifestyle | |
Other directorships: | Director of Alignmex Real Estate Capital | |
Business experience: | Commercial Manager of Grupo Mundo Ejecutivo | |
60
Directors elected by holders of Series L Shares:
PABLO ROBERTO GONZÁLEZ GUAJARDO | ||
Director and Member of the Audit and Corporate Practices Committee | ||
Born: | 1967 | |
First elected: | 2007 | |
Term expires: | 2023 | |
Principal occupation: | Chief Executive Officer of Kimberly Clark de México | |
Other directorships: | Director of Kimberly Clark de México, Grupo Sanborns and Grupo Lala | |
Business experience: | Various positions in the Kimberly Clark Corporation and Kimberly Clark de México | |
CLAUDIA JAÑEZ SÁNCHEZ | ||
Director | ||
Born: | 1971 | |
First elected: | 2021 | |
Term expires: | 2023 | |
Principal occupation: | Independent Director | |
Other directorships: | Director of Bolsa Mexicana de Valores and Board Member of Grupo Industrial Saltillo, HSBC Mexico and Impulsora de Desarollo y de Empleo en América Latina | |
Business experience: | Chairman of DuPont Latin America and Chairman of the Executive Council of Global Companies | |
Our 2022 annual ordinary general shareholders’ meeting determined that the following directors are independent: Claudia Jañez Sanchez, Gisselle Morán Jiménez, Ernesto Vega Velasco, Pablo Roberto González Guajardo, David Ibarra Muñoz, Antonio Cosío Pando, Rafael Moisés Kalach Mizrahi, Luis Alejandro Soberón Kuri and Francisco José Medina Chávez.
Alejandro Cantú Jiménez, our General Counsel, serves as Corporate Secretary and Rafael Robles Miaja as Corporate
Pro-Secretary.
Patrick Slim Domit and Carlos Slim Domit are brothers. Daniel Hajj Aboumrad is
brother-in-law
of Patrick Slim Domit and Carlos Slim Domit. Vanessa Hajj Slim is the daughter of Daniel Hajj Aboumrad.EXECUTIVE COMMITTEE
Our bylaws provide that the Executive Committee may generally exercise the powers of the Board of Directors, with certain exceptions. In addition, the Board of Directors is required to consult the Executive Committee before deciding on certain matters set forth in the bylaws, and the Executive Committee must provide its views following a request from
the Board of Directors, the Chief Executive Officer or the Chairman of the Board of Directors. If the Executive Committee is unable to make a recommendation within ten calendar days, or if a majority of the Board of Directors or any other corporate body duly acting within its mandate determines in good faith that action cannot be deferred until the Executive Committee makes a recommendation, the Board of Directors is authorized to act without such recommendation. The Executive Committee may not delegate its powers to special delegates or
attorneys-in-fact.
The Executive Committee is elected from among the directors and alternate directors by a majority vote of the holders of common shares (AA Shares and A Shares). The majority of its members must be Mexican citizens and elected by Mexican shareholders. The current members of the Executive Committee are Carlos Slim Domit, Patrick Slim Domit and Daniel Hajj Aboumrad. See “Major Shareholders” under Part IV of this annual report.
AUDIT AND CORPORATE PRACTICES COMMITTEE
Our Audit and Corporate Practices Committee is comprised of independent members of the Board of Directors, as determined by our shareholders pursuant to the Mexican Securities Market Law and as defined under Rule
10A-3
under the Exchange. The Audit and Corporate Practices Committee consists of Ernesto Vega Velasco (Chairman), Rafael Moisés Kalach Mizrahi and Pablo Roberto González Guajardo. The mandate of the Audit and Corporate Practices Committee is to assist our Board of Directors in overseeing our operations and establish and monitor procedures and controls in order to ensure that the financial information we distribute is useful, appropriate and reliable and accurately reflects our financial position. In particular, the Audit and Corporate Practices Committee is required to, among other things, (i) call shareholders’ meetings and recommend items to be included on the agenda, (ii) advise the Board of Directors on internal control procedures, related party transactions that are outside the ordinary course of our business, succession plans and compensation structures of our key executives, (iii) select and monitor our auditors, (iv) discuss with our auditors the procedures for the preparation of the annual financial statements and the accounting principles to the annual and the interim financial statements and (v) obtain from our auditors a report that includes a discussion of the critical accounting policies used by us, any alternative accounting treatments for material items that have been discussed by management with our auditors and any other written communications between our auditors and management.61
The Company is required to make public disclosure of any Board action that is inconsistent with the opinion of the Audit and Corporate Practices Committee. In addition, pursuant to our bylaws, the Audit and Corporate Practices Committee is in charge of our corporate governance functions under the Mexican securities laws and regulations and is required to submit an annual report to the Board of Directors with respect to our corporate and audit practices. The Audit and Corporate Practices Committee must request the opinions of our executive officers for purposes of preparing this annual report.
SENIOR MANAGEMENT
The names, responsibilities and prior business experience of our executive officers are as follows:
DANIEL HAJJ ABOUMRAD | ||
Chief Executive Officer | ||
Appointed: | 2000 | |
Business experience: | Director of Telmex; Chief Executive Officer of Compañía Hulera Euzkadi | |
CARLOS JOSÉ GARCÍA MORENO ELIZONDO | ||
Chief Financial Officer | ||
Appointed: | 2001 | |
Business experience: | General Director of Public Credit at the Ministry of Finance and Public Credit; Managing Director of UBS Warburg; Associate Director of Financing at Petróleos Mexicanos (Pemex); Member of Telekom Austria’s Supervisory Board; Member of KPN Supervisory Board | |
ALEJANDRO CANTÚ JIMÉNEZ | ||
General Counsel | ||
Appointed: | 2001 | |
Business experience: | Member of Telekom Austria’s Supervisory Board | |
OSCAR VON HAUSKE SOLÍS | ||
Chief Fixed-line Operations Officer | ||
Appointed: | 2010 | |
Business experience: | Chief Executive Officer of Telmex Internacional; Chief Systems and Telecommunications Officer of Telmex; Head of Finance at Grupo Condumex; Director of Telmex, Telmex Internacional, Empresa Brasileira de Telecomunicaçőes S.A. (“Embratel”), and Net Serviços de Comunicaçăo S.A. (“Net Serviços”); Member of Telekom Austria’s Supervisory Board | |
RAFAEL COUTTOLENC URREA | ||
Chief Wireless Operations Officer | ||
Appointed: | 2021 | |
Business experience: | Various positions in América Móvil | |
AUDIT COMMITTEE FINANCIAL EXPERT
Our Board of Directors has determined that Ernesto Vega Velasco qualifies as an “audit committee financial expert,” and Mr. Vega Velasco is independent under the definition of independence applicable to us under the rules of the NYSE.
COMPENSATION OF DIRECTORS AND SENIOR MANAGEMENT
The aggregate compensation paid to our directors (including compensation paid to members of our Audit and Corporate Practices Committee) and senior management in 2021 was approximately Ps.5.8 million and Ps.85 million, respectively. None of our directors is a party to any contract with us or any of our subsidiaries that provides for benefits upon termination of employment. We do not provide pension, retirement or similar benefits to our directors in their capacity as directors. Our executive officers are eligible for retirement and severance benefits required by Mexican law on the same terms as all other employees, and we do not separately set aside, accrue or determine the amount of our costs that is attributable to executive officers because they are included in the overall accrual for all employees subject to such benefits.
SHARE OWNERSHIP OF DIRECTORS AND SENIOR MANAGEMENT
Carlos Slim Domit, Chairman of our Board of Directors, holds 647 million (or as of March 31, 2022, 3.1%) of our AA Shares and 1,679 million (or as of March 31, 2022, 3.9%) of our L Shares directly. Patrick Slim Domit, Vice Chairman of our Board of Directors, holds 323 million (or as of March 31, 2022, 1.6%) of our AA Shares and 919 million (or as of March 31, 2022, 2.1%) of our L Shares directly. In addition, according to beneficial ownership reports filed with the SEC, Patrick Slim Domit and Carlos Slim Domit are beneficiaries of a trust that owns shares of the Company. See “Major Shareholders” under Part IV of this annual report. Except as described above, according to the information provided to us by our directors and members of senior management, none of our directors or executive officers is the beneficial owner of more than 1.0% of any class of our capital stock.
62

Our corporate governance practices are governed by our bylaws, the Mexican Securities Market Law and the regulations issued by the CNBV. We also comply with the Mexican Code of Best Corporate Practices (). On an annual basis, we file a report with the Mexican Stock Exchange regarding our compliance with the Mexican Code of Best Corporate Practices.
Código de Mejores Prácticas Corporativas
The table below discloses the significant differences between our corporate governance practices and those required for U.S. companies under the NYSE listing standards.
NYSE STANDARDS | OUR CORPORATE GOVERNANCE PRACTICES | |
DIRECTOR INDEPENDENCE | ||
Majority of Board of Directors must be independent. §303A.01. “Controlled companies” are exempt from this requirement. A controlled company is one in which more than 50.0% of the voting power is held by an individual, group or another company, rather than the public. §303A.00. As a controlled company, we would be exempt from this requirement if we were a U.S. issuer. | Pursuant to the Mexican Securities Market Law, our shareholders are required to elect a Board of Directors of no more than 21 members, 25% of whom must be independent. Certain persons are per se non-independent, including insiders, control persons, major suppliers and any relatives of such persons. Under the Mexican Securities Market Law, our shareholders’ meeting is required to make a determination as to the independence of our directors, though such determination may be challenged by the CNBV. There is no exemption from the independence requirement for controlled companies.Currently, a majority of our Board of Directors is independent. | |
EXECUTIVE SESSIONS | ||
Non-management directors must meet at regularly scheduled executive sessions without management. Independent directors should meet alone in an executive session at least once a year. §303A.03. | Our non-management directors have not held executive sessions without management in the past, and they are not required to do so. | |
NOMINATING/CORPORATE GOVERNANCE COMMITTEE | ||
Nominating/corporate governance committee composed entirely of independent directors is required. The committee must have a charter specifying the purpose, duties and evaluation procedures of the committee. §303A.04. | Mexican law requires us to have one or more committees that oversee certain corporate practices, including the appointment of directors and executives. Under the Mexican Securities Market Law, committees overseeing certain corporate practices must be composed of independent directors. However, in the case of controlled companies, such as ours, only a majority of the committee members must be independent. | |
“Controlled companies” are exempt from these requirements. §303A.00. As a controlled company, we would be exempt from this requirement if we were a U.S. issuer. | Currently, we do not have a nominating committee, and we are not required to have one. Our Audit and Corporate Practices Committee, which is composed of independent directors, oversees our corporate practices, including the compensation and appointment of directors and executives. | |
COMPENSATION COMMITTEE | ||
Compensation committee composed entirely of independent directors is required, which must evaluate and approve executive officer compensation. The committee must have a charter specifying the purpose, duties and evaluation procedures of the committee. §303A.02(a)(ii) and §303A.05. “Controlled companies” are exempt from this requirement. §303A.00. | We currently do not have a compensation committee, and we are not required to have one. Our Audit and Corporate Practices Committee, which is comprised solely of independent directors, evaluates and approves the compensation of management (including our CEO) and directors. | |
AUDIT COMMITTEE | ||
Audit committee satisfying the independence and other requirements of Rule 10A-3 under the Exchange Act and the additional requirements under the NYSE standards is required. §§303A.06 and 303A.07. | We have an Audit and Corporate Practices Committee of three members. Each member of the Audit and Corporate Practices Committee is independent, as independence is defined under the Mexican Securities Market Law, and also meets the independence requirements of Rule 10A-3 under the U.S. Securities Exchange Act of 1934, as amended. Our Audit and Corporate Practices Committee operates primarily pursuant to (1) a written charter adopted by our Board of Directors, which assigns to the Committee responsibility over those matters required by Rule10A-3(2) our bylaws and (3) Mexican law. For a more detailed description of the duties of our Audit and Corporate Practices Committee, see “Management” under Part V of this annual report. | |
63
NYSE STANDARDS | OUR CORPORATE GOVERNANCE PRACTICES | |
EQUITY COMPENSATION PLANS | ||
Equity compensation plans and all material revisions thereto require shareholder approval, subject to limited exemptions. §§303A.08 and 312.03. | Shareholder approval is required under Mexican law for the adoption or amendment of an equity compensation plan. Such plans must provide for similar treatment of executives in comparable positions. | |
SHAREHOLDER APPROVAL FOR ISSUANCE OF SECURITIES | ||
Issuances of securities (1) that will result in a change of control of the issuer, (2) that are to a related party or someone closely related to a related party, (3) that have voting power equal to at least 20.0% of the outstanding common stock voting power before such issuance or (4) that will increase the number of shares of common stock by at least 20.0% of the number of outstanding shares before such issuance requires shareholder approval. §§312.03(b)-(d). | Mexican law requires us to obtain shareholder approval for any issuance of equity securities. Under certain circumstances, however, we may sell treasury stock subject to the approval of our Board of Directors. | |
CODE OF BUSINESS CONDUCT AND ETHICS | ||
Corporate governance guidelines and a code of business conduct and ethics are required, with disclosure of any waiver for directors or executive officers. The code must contain compliance standards and procedures that will facilitate the effective operation of the code. §303A.10. | We have adopted a code of ethics, which applies to all of our directors and executive officers and other personnel. For more information, see “Corporate Governance—Code of Ethics” under Part V of this annual report. | |
CONFLICTS OF INTEREST | ||
A company’s audit committee or another independent body of the board of directors shall conduct a reasonable prior review and oversight of related party transactions required by Item 7.B of Form 20-F for potential conflicts of interest and will prohibit such transaction if it determines it to be inconsistent with the interests of the company and its shareholders. §314.00. Certain issuances of common stock to a related party require shareholder approval. §312.03(b). | In accordance with Mexican law, an independent audit committee must provide an opinion to the board of directors regarding any transaction with a related party, which must be approved by the board of directors. Pursuant to Mexican Law, non-material related party transactions, or transactions with certain related parties within the ordinary course of business or on arms-length basis, do not require specific board approval, if consistent with guidelines approved by the Board of Directors. | |
SOLICITATION OF PROXIES | ||
Solicitation of proxies and provision of proxy materials is required for all meetings of shareholders. Copies of such proxy solicitations are to be provided to NYSE. §§402.01 and 402.04. | We are not required to solicit proxies from our shareholders. In accordance with Mexican law and our bylaws, we inform shareholders of all meetings by public notice, which states the requirements for admission to the meeting and we make materials available to be discussed at each shareholders’ meeting. Under the deposit agreement relating to our ADSs, holders of our ADSs receive notices of shareholders’ meetings and, where applicable, instructions on how to instruct the depositary to vote at the meeting. Under the deposit agreement relating to our ADS, we may direct the voting of any ADS as to which no voting instructions are received by the depositary, except with respect to any matter where substantial opposition exists or that materially and adversely affects the rights of holders. | |
64

A) DISCLOSURE CONTROLS AND PROCEDURES
We carried out an evaluation under the supervision and with the participation of our management, including our Chief Executive Officer and Chief Financial Officer, of the effectiveness of our disclosure controls and procedures as of December 31, 2021. Based upon our evaluation, our Chief Executive Officer and Chief Financial Officer concluded that our disclosure controls and procedures were effective to provide reasonable assurance that information required to be disclosed by us in the reports that we file or submit under the Exchange Act is recorded, processed, summarized and reported within the time periods specified in the applicable rules and forms, and that it is accumulated and communicated to our management, including our Chief Executive Officer and Chief Financial Officer, as appropriate to allow timely decisions regarding required disclosure.
B) MANAGEMENT’S ANNUAL REPORT ON INTERNAL CONTROL OVER FINANCIAL REPORTING
Our management is responsible for establishing and maintaining adequate internal control over financial reporting, as defined in Rules
13a-15(f)
and15d-15(f)
under the Exchange Act. Under the supervision and with the participation of our management, including our Chief Executive Officer, Chief Financial Officer and other personnel, we conducted an evaluation of the effectiveness of our internal control over financial reporting based on the framework in Internal Control—Framework (2013) issued by the Committee of Sponsoring Organizations of the Treadway Commission.Our internal control over financial reporting is a process designed to provide reasonable assurance regarding the reliability of financial reporting and the preparation of financial statements for external purposes in accordance with IFRS. Our internal control over financial reporting includes those policies and procedures that (i) pertain to the maintenance of records that, in reasonable detail, accurately and fairly reflect the transactions and dispositions of our assets, (ii) provide reasonable assurance that transactions are recorded as necessary to permit preparation of financial statements in accordance with IFRS and that our receipts and expenditures are being made only in accordance with authorizations of our management and directors and (iii) provide reasonable assurance regarding prevention or timely detection of unauthorized acquisition, use or disposition of our assets that could have a material effect on our financial statements.
Because of the inherent limitations in all control systems, internal control over financial reporting may not prevent or detect misstatements. Also, projections of any evaluation of effectiveness to future periods are subject to the risk that controls may become inadequate because of changes in conditions or that the degree of compliance with the policies or procedures may deteriorate.
Based on our evaluation under the framework in Internal Control—Integrated Framework, our management concluded that our internal control over financial reporting was effective as of December 31, 2021.
Mancera, S.C. (“Mancera”), a member practice of Ernst & Young Global Limited, an independent registered public accounting firm, our independent auditor, issued an attestation report on our internal control over financial reporting on
April 29
, 2022.
65
C) ATTESTATION REPORT OF THE REGISTERED PUBLIC ACCOUNTING FIRM
REPORT OF INDEPENDENT REGISTERED PUBLIC ACCOUNTING FIRM
The Board of Directors and Shareholders of América Móvil, S.A.B. de C.V.
Opinion on Internal Control over Financial Reporting
We have audited América Móvil, S.A.B. de C.V. and subsidiaries’ internal control over financial reporting as of December 31, 2021, based on criteria established in Internal Control—Integrated Framework issued by the Committee of Sponsoring Organizations of the Treadway Commission (2013 framework) (the COSO criteria). In our opinion, América Móvil, S.A.B. de C.V. and subsidiaries (the Company) maintained, in all material respects, effective internal control over financial reporting as of December 31, 2021, based on the COSO criteria.
We also have audited, in accordance with the standards of the Public Company Accounting Oversight Board (United States) (PCAOB), the consolidated statements of financial position of the Company as of December 31, 2021 and 2020, the related consolidated statements of comprehensive income, changes in shareholders’ equity and cash flows for each of three years in the period ended December 31, 2021, and the related notes, and our report dated April 29, 2022 expressed an unqualified opinion thereon.
Basis for Opinion
The Company´s management is responsible for maintaining effective internal control over financial reporting and for its assessment of the effectiveness of internal control over financial reporting included in the accompanying Management’s Annual Report on Internal Control over Financial Reporting. Our responsibility is to express an opinion on the Company´s internal control over financial reporting based on our audit. We are a public accounting firm registered with the PCAOB and are required to be independent with respect to the Company in accordance with the U.S. federal securities laws and the applicable rules and regulations of the Securities and Exchange Commission and the PCAOB.
We conducted our audit in accordance with the standards of the PCAOB. Those standards require that we plan and perform the audit to obtain reasonable assurance about whether effective internal control over financial reporting was maintained in all material respects.
Our audit included obtaining an understanding of internal control over financial reporting, assessing the risk that a
material weakness exists, testing and evaluating the design and operating effectiveness of internal control based on the assessed risk, and performing such other procedures as we considered necessary in the circumstances. We believe that our audit provides a reasonable basis for our opinion.
Definitions and Limitations of Internal Control over Financial Reporting
A company’s internal control over financial reporting is a process designed to provide reasonable assurance regarding the reliability of financial reporting and the preparation of financial statements for external purposes in accordance with generally accepted accounting principles. A company’s internal control over financial reporting includes those policies and procedures that (1) pertain to the maintenance of records that, in reasonable detail, accurately and fairly reflect the transactions and dispositions of the assets of the company; (2) provide reasonable assurance that transactions are recorded as necessary to permit preparation of financial statements in accordance with generally accepted accounting principles, and that receipts and expenditures of the company are being made only in accordance with authorizations of management and directors of the company; and (3) provide reasonable assurance regarding prevention or timely detection of unauthorized acquisition, use or disposition of the company’s assets that could have a material effect on the financial statements.
Because of its inherent limitations, internal control over financial reporting may not prevent or detect misstatements. Also, projections of any evaluation of effectiveness to future periods are subject to the risk that controls may become inadequate because of changes in conditions, or that the degree of compliance with the policies or procedures may deteriorate.
/s/ MANCERA, S.C.
Mexico City, Mexico
April 29, 2022
D) CHANGES IN INTERNAL CONTROL OVER FINANCIAL REPORTING
There has been no change in our internal control over financial reporting during 2021 that has materially affected, or is reasonably likely to materially affect, our internal control over financial reporting.
66

Chaired by our CEO, the Corporate Sustainability Executive Committee defines and oversees the implementation of our overall strategy to improve our performance on sustainability matters.
By incorporating sustainability in our daily decision-making, we seek to foster greater efficiencies and operate with the highest sense of social responsibility and environmental care, strengthening our market leadership while contributing to economic, social, and cultural development in the communities where we operate.
Our corporate sustainability reports are available on our website at www.americamovil.com. This URL is intended to be an inactive textual reference only. It is not intended to be an active hyperlink to our website. The information on our website, which might be accessible through a hyperlink resulting from this URL, is not incorporated into this annual report.
67

We have developed an Integrity and Compliance Program (ICP), which has as its foundation our Code of Ethics. The ICP codifies the ethical principles that govern our business and promotes, among other things:
| • | honest and ethical conduct; |
| • | full, fair, accurate, timely and understandable disclosure in reports and documents that we file with, or submit to, the SEC and other authorities; |
| • | compliance with applicable governmental laws, rules and regulations; the prompt internal reporting of violations of the Code of Ethics and the ICP; |
| • | accountability for adherence to the Code of Ethics. |
Both the ICP and our Code of Ethics apply to all of our officers, senior management, directors, employees, the Company’s supply chain and/or other business relationships.
In 2021, we updated our Code of Ethics to include references to various ICP policies as well as to the whistleblower portal, which permits reporting of any conduct that infringes our Code of Ethics, any applicable law or regulation or any of our policies or procedures. The full text of our Code of Ethics and associated ICP policies may be found on our website at América Móvil—Corporate Governance (americamovil.com). This URL is intended to be an inactive textual reference only. It is not intended to be an active hyperlink to our website. The information on our website, which might be accessible through a hyperlink resulting from this URL, is not incorporated into this annual report.
68

69

70

MEXICO
Legal Framework
The legal framework for the regulation of telecommunications and broadcasting services is based on constitutional amendments passed in June 2013, the Federal Law on Telecommunications and Broadcasting () as amended and the Federal Law on Economic Competition () as amended.
Ley Federal de Telecomunicaciones y Radiodifusión
Ley Federal de Competencia Económica
Under the framework, the IFT may determine whether there is a “preponderant economic agent” in the telecommunications sector, based on number of customers, traffic or network capacity. In 2014, the IFT determined that an “economic interest group” consisting of us and our Mexican operating subsidiaries (Telcel, Telmex and Telnor) as well as Grupo Carso and Grupo Financiero Inbursa, constitutes the “preponderant economic agent” in the telecommunications sector, based on a finding that we serve more than half of the customers in Mexico, as measured by the IFT on a national basis.
The IFT has authority to impose on any preponderant economic agent a special regulatory regime. The special regime is referred to as “asymmetric” regulation because it applies to one sector participant and not to the others. Pursuant to the IFT’s determination that we are part of a group constituting a preponderant economic agent, we are subject to extensive asymmetric regulations in the telecom sector, which impacts our Mexican
fixed-line
and wireless businesses. See “ — Asymmetric Regulation of the Preponderant Economic Agent” and “ — Creation of Red Nacional Última Milla and Red Última Milla Del Noroeste” under this Part VI. This legal framework has had a substantial impact on our business and operations in Mexico.Principal Regulatory Authorities
The IFT is an autonomous authority that regulates telecommunications and broadcasting. It is headed by seven commissioners appointed by the President, and ratified by the Senate, from among candidates nominated by an evaluation committee. The IFT has authority over the application of legislation specific to the telecommunications and broadcasting sectors, and also over competition legislation as it applies to those sectors. The Mexican Ministry of Communications and Transportation () retains regulatory authority over a few specific public policy matters.
Secretaría de Comunicaciones y Transportes
The Mexican government has certain powers in its relations with concessionaires, including the right to take over the management of an operator’s networks, facilities and
personnel in cases of imminent danger to national security, public order or the national economy, natural disasters and public unrest, as well as to ensure continuity of public services.
Telecommunications operators are also subject to regulation by the Federal Consumer Bureau (r) under the Federal Consumer Protection Law (), which regulates publicity, quality of services and information required to be provided to consumers.
Procuraduría Federal del
Consumido
Ley Federal de Protección al Consumidor
Asymmetric Regulation of the Preponderant Economic Agent
We are currently subject to extensive specific asymmetric measures based on the IFT’s determination that we and certain affiliates constitute the preponderant economic agent in the telecommunications sector. Below is a summary of the most important measures applicable to us.
Interconnection Rates.
The Federal Law on Telecommunications and Broadcasting provides that we are not permitted to charge other carriers for the termination services we provide in our networks. These provisions were declared unconstitutional by the Mexican Supreme Court () in August 2017 with respect to wireless services and in April 2018 with respect to fixed services. As a result, the IFT ruled that, as of January 1, 2018, in the case of Telcel, and as of January 1, 2019, in the case of Telmex, we are able to charge other carriers for terminating calls to our networks at asymmetric rates established by the IFT. We continue to pay such carriers for their interconnection services in accordance with the fixed and mobile rates set by the IFT.
Suprema Corte de Justicia de la Nación
Sharing Of Wireless Infrastructure and Services.
We must provide other carriers access to (i) passive infrastructure, including towers, sites, ducts and rights of way, (ii) elements of our network that allow other carriers and mobile virtual network operators (“MVNOs”) to use our network or resell those services we provide to our customers and (iii) domestic roaming services; in each case, pursuant to IFT). If we cannot reach an agreement with other carriers or MVNOs, our rates may be determined by the IFT using a
pre-approved
reference terms (ofertas públicas de referencia
long-run
average incremental costs methodology or, in the case of MVNOs, a “retail-minus” methodology.For mobile services,
the IFT has the right to verify, through a replicability test, that carriers using our regulated wholesale services can match our end user rates.
71
Sharing of Fixed Infrastructure and Services.
We must provide other carriers access to (i) passive infrastructure, including towers, sites, telephone poles, ducts, manholes and rights of way, (ii) elements of our network that allow other carriers to use our network or resell those services we provide to our customers and (iii) our dedicated links (either local or long distance). Rates for this access are determined by the IFT using a
long-run
average incremental cost methodology.For fixed services, the IFT has the right to verify, through a replicability test, that carriers using our regulated wholesale services can match our end user rates.
Local Loop Unbundling.
We must offer other carriers access to elements of our local loop network separately on terms and conditions (including rates)
pre-approved
by the IFT. The IFT has also ordered the legal and functional separation of the provision of wholesale regulated fixed services related to local loop unbundling, local dedicated links and shared access/use of passive infrastructure related with the local loop network. See “ — Creation of Red Nacional Última Milla and Red Última Milla Del Noroeste” under this Part VI.Certain Obligations Relating to Retail Services.
Rates for the provision of telecommunications services to our customers are subject to the IFT’s prior authorization.
We are also subject to certain obligations and restrictions relating to the sale of our services and products; one such obligation includes unlocking mobile devices for our customers and regulations on the sale end financing at mobile devices.
Content.
We are subject to specific limitations on acquisitions of exclusive transmission rights to “relevant” content (), as determined from time to time by the IFT, including the Mexican national team soccer matches, the opening and closing ceremonies and certain matches of the FIFA World Cup, the semifinal and final matches of the Liga MX soccer tournament and the Super Bowl.
contenidos audiovisuales relevantes
Reference Terms.
Every year we must submit, for IFT’s approval, a proposal of the reference terms for all wholesale services that are subject to asymmetric regulation for the following year. Once approved, we must publish and offer the regulated wholesale services, in the terms approved by IFT.
IFT’s Biannual Review of Asymmetric Regulation
The next IFT biannual review is scheduled to begin in 2022. The measures are transitory and may be amended by the IFT, or terminated if the IFT determines effective competition conditions exist in the telecommunications sector or if we cease to be considered a preponderant economic agent. The IFT reviews the impact of the asymmetrical measures every
two years and may modify or eliminate measures or set forth new measures. The IFT reviewed the measures in 2020 and determined, among other things, to modify and add new asymmetrical regulations for mobile and fixed services. See “ — Creation of Red Nacional Última Milla and Red Última Milla Del Noroeste” under this Part VI.
Creation of Red Nacional Última Milla and Red Última Milla Del Noroeste
In 2018, in response to an IFT resolution, we began to separate out the provision of wholesale regulated fixed services by Telmex and Telnor (the “Separation Plan”). Pursuant to the Separation Plan, Telmex and Telnor established new subsidiaries, Red Nacional Última Milla, S.A.P.I. de C.V. and Red Última Milla Del Noroeste, S.A.P.I. de C.V. (the “New Companies”), to provide local wholesale services related to the elements of the access network, including local access dedicated links, as well as those services related to passive infrastructure associated with the access network, such as ducts, poles and rights of way.
The prices and terms of the services provided by the New Companies are subject to IFT regulation, which could affect the viability and financial requirements of the New Companies. The practices of the New Companies may be subject to regulatory challenges by other market participants. In August 2021, the New Companies received a resolution issued by IFT lifting price regulation on access to certain local loop access services () in 52 municipalities.
servicios de desagregación indirecta del bucle local
The implementation of the Separation Plan has been complex, and some features remain uncertain and may require further development. As a result, we are not yet able to identify all the possible consequences, but some of the consequences could have a material adverse impact on us.
We have challenged the resolution in the Mexican courts. However, legal challenges will not suspend the implementation of the Separation Plan and final determinations are pending.
Substantial Market Power Investigations
When IFT was established, it succeeded to several major proceedings begun by predecessor agencies. These legacy proceedings have never been finally resolved, but the substance of the investigations and the potential relief have been largely superseded by the asymmetric regulation and other subsequent actions of IFT.
Our competitors have submitted multiple requests to IFT alleging anti-competitive practices or
non-compliance
with regulations on the part of the separate subsidiaries we established to provide wholesale services under the72
Separation Plan. We expect IFT to investigate these allegations, and it is possible that some of them could lead IFT to make findings adverse to us or to impose fines or other penalties.
Concessions
Under the current legal framework, a carrier of public telecommunications networks, such as Telcel or Telmex, must operate under a concession. The IFT is an autonomous federal agency that grants new or extends existing concessions, which may only be granted to a Mexican citizen or corporation that has agreed to the concession terms and may not be transferred or assigned without the approval of the IFT. There are three types of concessions:
Network Concessions.
Telcel, Telmex and its subsidiary Telnor hold network concessions, granted under the previous regulatory framework, to provide specified types of services. Their ability to migrate to the new regime of unified concessions and, consequently, to provide any and all telecommunications and broadcasting services, is subject to conditions, as described under “Migration of Concessions and Additional Services” below.
Spectrum Concessions.
Telcel holds multiple concessions, granted under both the previous and current regulatory frameworks, to provide wireless services that utilize frequencies of radio-electric spectrum. These concessions have terms of 15 to 20 years and may be extended for an additional term of equal length.
Unified Concession.
Each of the New Companies holds a unified concession granted to provide only wholesale telecommunications services. These concessions were issued in March 2020 and have a term of 30 years and may be extended for an additional term of equal length.
Termination of Concessions
Mexican legislation provides that under certain circumstances, some assets of a concessionaire may be acquired by the federal government upon termination of these concessions.
There is no specific guidance or precedent for applying these provisions, so the scope of assets covered, the compensation to the concessionaire and the procedures to be followed would depend on the type of concession, the type of assets and the interpretation of applicable legislation by the competent authorities at the time.
Migration of Concessions and Additional Services
The new legislative framework established the unified concession (), which allows the holder to provide all types of telecommunications and broadcasting services, and a regime under which an existing concession can be migrated to
concesión única
the new unified concession at the end of its term or upon request by the concession holder. A unified concession has a term of up to 30 years, extendable for up to an equal term. Also, under this new framework a current concession may be modified to add services not previously contemplated therein.
However, as a result of our preponderant economic agent status, Telcel, Telmex and Telnor are subject to additional conditions for the migration to a unified concession or the addition of a service, such as Pay TV, to a current concession, including in certain cases (i) payment of any new concession fee to be determined by the IFT, (ii) compliance with current requirements under the network concession, the 2013 constitutional amendments, the 2014 legislation and any additional measures imposed by the IFT on the preponderant economic agent and (iii) such other requirements, terms and conditions as the IFT may establish in the concession itself. We expect the process of migration or additional services to be lengthy and complex. Consequently, Telcel, Telmex and Telnor may not be able to provide certain additional services, such as Pay TV and broadcasting, in the near term.
Telcel’s Concessions
Telcel operates under several different network and spectrum concessions covering particular frequencies and regions, holding an average of 289.26 MHz of capacity in Mexico’s nine regions in the 850 MHz, 1900 MHz,1.7/2.1 GHz, 2.5 GHz and 3.5 GHz bands. The following table summarizes Telcel’s concessions.
FREQUENCY | COVERAGE AREA | INITIAL DATE | TERMINATION DATE | |||
| Band A (1900 MHz) | Nationwide | Sep. 1999 | Oct. 2039 | |||
| Band D (1900 MHz) | Nationwide | Oct. 1998 | Oct. 2038 | |||
| Band B (850 MHz) | Regions 1, 2, 3 | Aug. 2011 | Aug. 2026 | |||
| Band B (850 MHz) | Regions 4, 5 | Aug. 2010 | Aug. 2025 (1) | |||
| Band B (850 MHz) | Regions 6, 7, 8 | Oct. 2011 | Oct. 2026 | |||
| Band B (850 MHz) | Region 9 | Oct. 2015 | Oct. 2030 | |||
| Band F (1900 MHz) | Nationwide | Apr. 2005 | Apr. 2025 (1) | |||
| Bands A and B (1.7/2.1 GHz) | Nationwide | Oct. 2010 | Oct. 2030 | |||
| Bands H, I and J (1.7/2.1 GHz) | Nationwide | May 2016 | Oct. 2030 | |||
| Band 7 (2.5 GHz) | 98.94% of the population (2) | Jul. 2017 | Sep. 2020 (1) – Nov. 2028 – Oct. 2040 – May 2041, Nov. 2041 | |||
| Band 3.5 GHz (3) | Nationwide | Oct. 2020(4) | Oct. 2038 and 2040 | |||
(1) A request for extension has already been filed with the IFT.(2) Except 7 municipalities in the state of Jalisco and 34 municipalities in the state of Zacatecas.(3) On December 18, 2020, Telcel filed a formal request with the IFT to include mobile service in these concessions.(4) The term of this concession is currently in force and was extended by IFT in favor of Telmex until 2040 and afterwards it was assigned by Telmex to Telcel as of March 11, 2020. Concessions acquired from Axtel were extended by the IFT until 2038. | ||||||
73
Concession Fees
All of Telcel’s concessions granted or renewed on or after January 1, 2003 are required to pay annual fees for the use and exploitation of radio spectrum bands. The amounts payable are set forth by the annual Federal Fees Law () and vary depending on the relevant region and radio spectrum band.
Ley Federal de Derechos
Telmex’s Concessions
Telmex’s concession was granted in 1976 and is currently set to expire in 2026. In December 2016, the IFT granted Telmex a
30-year
extension of this concession, which will become effective in 2026 and will be valid until 2056. The new terms of this concession will be issued in early 2023.Telmex’s subsidiary, Telnor, holds a separate concession, which covers one state and two municipalities in northwestern Mexico and will expire in 2026. The IFT also granted Telnor a
30-year
extension of its concession, which will be effective in 2026 and will be valid until 2056. The material terms of Telnor’s concession are similar to those of Telmex’s concession.In addition, Telmex currently holds concessions for the use of frequencies to provideandtransmission in 10.5, 15 and 23 GHz bands.
point-to-point
point-to-multipoint
In 2018, Telmex was notified of a resolution issued by the IFT, through which the IFT imposed a fine of Ps.2.5 billion derived from an alleged breach in 2013 and 2014 of certain minimum quality of service goals for dedicated link services. Telmex has exercised all legal remedies challenging such resolution and a final resolution is pending.
Rates for Wireless Service
Wireless services concessionaires are generally free to establish the prices they charge customers for telecommunications services. Wireless rates are not subject to a price cap or any other form of price regulation. The interconnection rates concessionaires charge other operators are also generally established by agreement between the parties and, if the parties cannot agree, may be imposed by the IFT, subject to certain guidelines, cost models and criteria. The IFT publishes at the end of the year the rates they would impose in the event of a dispute, eliminating all incentives for a negotiation among the parties. The establishment of interconnection rates has resulted, and may in the future result, in disputes between carriers and with the IFT.
As a result of the preponderance determination, Telcel’s retail prices are subject to
pre-approval
by the IFT before they can take effect.The IFT is also authorized to impose specific rate requirements on any carrier that is determined by the IFT to have substantial market power under the Federal Antitrust
Law () and the 2014 legislation. For more information on litigation related to the Federal Antitrust Law and the 2014 legislation, see “–Substantial Market Power Investigations” under this Part VI.
Ley Federal de Competencia Económica
Rates for Fixed Service
Telmex’s concessions subject its rates for basic retail telephone services in any period, including installation, monthly rent, measured local-service and long-distance service, to a ceiling on the price of a “basket” of such services, weighted to reflect the volume of each service provided by Telmex during the preceding period. Telmex is required to file a survey with the IFT every four years with its projections of units of operation for basic services, costs and prices. Telmex is free to determine the structure of its own rates, with the exception of domestic long-distance rates, which were eliminated in 2015, and of the residential
fixed-line
rates, which have a cap based on thelong-run
average incremental cost. As a result of the preponderance determination, Telmex’s retail prices are subject topre-approval
by the IFT before they can take effect.The price ceiling varies directly with the Mexican National Consumer Price Index (), allowing Telmex to raise nominal rates to keep pace with inflation (minus a productivity factor set for the telecommunications industry), subject to consultation with the IFT. Telmex has not raised its nominal rates for many years. Under Telmex’s concession, the price ceiling is also adjusted downward periodically to pass on the benefits of Telmex’s increased productivity to its customers. The IFT sets a periodic adjustment for every four-year period to permit Telmex to maintain an internal rate of return equal to its weighted average cost of capital.
Indice Nacional de Precios al Consumidor
In addition, basic retail telephone services, as well as broadband services and “calling party pays” charges, are subject to a separate price ceiling structure based on productivity indicators. In each case, Telmex is required to submit a survey on productivity indicators to the IFT every two years, including a total factor productivity. The IFT establishes the productivity factor that will apply over the next two years, and, based on this, the IFT will approve the customer prices before they can take effect.
Prices for Telmex’s wholesale services are established by the IFT based on the
long-run
average incremental cost model methodology.BRAZIL
Legal Framework and Principal Regulatory Authorities
The Brazilian Telecommunications Law () provides the framework for
Lei Geral
das Telecomunicações Brasileiras
74
telecommunications regulation. The primary telecommunications regulator in Brazil is the Telecommunications Agency (, or “Anatel”), which has the authority to grant concessions and licenses in connection with telecommunications services and the use of orbits, except broadcasting, and to adopt regulations that are legally binding on telecommunications services providers.
Agência Nacional de Telecomunicações
The Brazilian Congress has approved an updated legislation to modernize the current concession-based model to an authorization- based model. The updated law brings the possibility of allowing
fixed-line
concessionaires, such as Claro Brasil, to provide services under an authorization rather than a concession, as long as certain investment-related obligations are met. Under the new legislation, it is possible to extend the current concessions, as well as radio frequency licenses and orbital positions, for more than one period. The legislation also permits the possibility of a secondary market for trading cellphone frequencies. The legislation will be implemented by regulations promulgated by Anatel. We are currently evaluating the potential impact of this legislation on our operations.Licenses
In 2014, we simplified our corporate structure, and our subsidiaries Embratel, Embratel Participações S.A. (“Embrapar”) and Net Serviços were merged into Claro Brasil, with all licenses previously granted to our subsidiaries transferred to Claro Brasil.
In 2018, subsidiary Star One merged into Claro Brasil. As a result, all Brazilian satellite operation rights previously granted to Star One were transferred under the same terms and conditions to Claro Brasil. The satellite operation rights
(AMC-12)
covering regions outside of Brazil were relinquished by Star One before the merger. In 2020, the satellite operation rights were transferred to Embratel Tysat Telecomunicações S.A. (“Claro TV”), after approval by Anatel.On December 18, 2019, we announced the acquisition of 100% of the shares of Nextel Brazil (currently known as Claro NXT Telecomunicações S.A.) and Sunbird Telecomunicações Ltda. (“Sundbird”), as well as its correspondent subsidiaries and parent companies in Brazil. Nextel Brazil had authorizations to provide personal mobile services, specialized mobile services, multimedia communication services, paid fixed telephony services (national and international long-distance) and radiofrequency services in Brazil that were granted by Anatel. Sunbird had authorizations to provide specialized mobile services and radiofrequency services. Derived from our acquisition of Nextel Brazil and Sunbird, Anatel provided us with: (i) a term of 18 months to consolidate and cancel the overlapped
authorizations granted in favor of Nextel Brazil and Sunbird; and (ii) a term of 2 months to adjust the radiofrequency thresholds. In 2020, the authorizations and radiofrequencies granted in favor of Nextel Brazil and Sunbird for specialized mobile services were waived. Also in 2020, Nextel’s PS licenses were transferred to Claro Brasil. Moreover, to comply with the obligation mentioned on item “(i)” above, on February 5, 2021, all of Nextel Brazil’s mobile services assets and licenses were transferred to Claro Brasil by means of a corporate restructuring.
In 2019, the subsidiary Primesys was merged into Claro Brasil. As a result, service authorizations granted to Primesys were transferred under the same terms and conditions to Claro Brasil.
Our Brazilian subsidiaries hold licenses for the telecommunications services listed below and expect to continue acquiring spectrum if Anatel conducts additional public auctions, although Claro Brasil, like all of its peer competitors, is subject to a cap on the additional spectrum it may acquire per frequency band.
SUBSIDIARY | LICENSE | TERMINATION DATE | ||
Claro Brasil | Fixed Local Voice Services | Indefinite | ||
| Domestic and International Long-Distance | 2025 | |||
| Voice Services | Indefinite | |||
| Personal Communication Services | Indefinite | |||
| Data Services | Indefinite | |||
| Mobile Maritime Services | Indefinite | |||
| Global Mobile Satellite Services | Indefinite | |||
Claro TV | DTH TV Services | Indefinite | ||
| Data Services | Indefinite | |||
| Data Services | Indefinite | |||
Americel S.A. | Data Services | Indefinite | ||
Telmex do Brasil | Data Services | Indefinite | ||
Nextel Brazil | Cable TV Services | Indefinite | ||
| Domestic and International Long-Distance | Indefinite | |||
| Data Services | Indefinite | |||
In addition, Claro TV has various orbital position authorizations for our satellite operations, which are set to expire between 2022 and 2033. Requests for extensions for 15 more years have been requested from Anatel. Claro TV also has radio frequency licenses to provide PCS, which are set to expire between 2022 and 2032. These grants were transferred from Claro Brasil to Claro TV in 2020, subsequent to Anatel’s approval.
75
Nextel Brazil has radio frequency licenses to provide PCS, which were transferred to Claro Brasil on February 2021 and will expire between 2026 and 2031.
On June 30, 2021, all of Claro Brasil’s cable TV (SeAC) assets and its license were transferred to Nextel Brazil by means of a corporate restructuring.
On November 4 and 5 of 2021, during a 5G auction, Claro Brasil won 100 MHz of the 3.5 GHz frequency band. This band has national reach and is committed to taking 5G to municipalities with more than 30,000 inhabitants. In the same auction, the company also won the 2.3 GHz frequencies in the North, South, Midwest, São Paulo and Triângulo Mineiro regions and two blocks of 200 MHz National frequencies of 26 GHz. These licenses are valid until 2041 and are renewable.
Concessions
Claro Brasil holds two
fixed-line
concessions to provide domestic and international long-distance telephone services. The remaining telecommunications services provided by Claro Brasil are governed by a system of licenses instead of concession arrangements.Concession Fees
Claro Brasil is required to pay a biennial fee after the first 15 year term of its PCS authorizations equal to 2.0% of net revenues from wireless services, except for the final year of the 15 year term of its PCS authorizations, in which the fee equals 1.0% of net revenues from wireless services.
Claro Brasil is also required to pay a biennial fee during the term of its domestic and international long-distance concessions equal to 2.0% of the revenues from long- distance telephone services, net of taxes and social contributions, for the year preceding the payment.
Termination of Concessions
Our domestic and international long-distance
fixed-line
concessions provide that certain of our assets deemed “indispensable” for the provision of these services will revert to the Brazilian state upon termination of these concessions. Compensation for those assets would be their depreciated cost. See Note 17 to our audited consolidated financial statements included in this annual report.Regulation of Rates
Anatel regulates rates (tariffs and prices) for all telecommunications services, except for
fixed-line
broadband services, Pay TV and satellite capacity rates, which are not regulated. In general, PCS license holders and fixed local voice services license-holders are authorized to increase basic plan rates annually. Claro Brasil may set domestic long-distance and international long-distance and mobile rates freely, provided that it gives Anatel and the public advance notice.Regulation of Wholesale Market Competition
In November 2012, Anatel approved the General Competition Plan (, or “PGMC”), a comprehensive regulatory framework aimed at increasing competition in the telecommunications sector. The PGMC imposes asymmetric measures upon economic groups determined by Anatel to have significant market power in any of the five wholesale markets in the telecommunications sector, on the basis of several criteria, including having over 20.0% of market share in the applicable market.
Plano Geral de Metas da Competição
In 2012, Claro Brasil and three of its primary competitors were determined to have significant market power in the mobile wireless termination and national roaming markets. As a result, Claro Brasil was required to reduce mobile termination rates to 75.0% of the 2013 rates by February 2014, and to 50.0% of the 2013 rates by February 2015. In July 2014, Anatel established termination rates for mobile services applicable to operators with significant market power through 2019, based on a cost model, and in December 2018, Anatel established termination rates for mobile services applicable to operators with significant market power from 2020 to 2023. These termination rates were revised by Anatel in February 2020. Claro Brasil is also required to publish its reference roaming prices for voice, data and SMS on an annual basis, among other measures. These prices must be related to the Anatel reference values and need to be approved by Anatel before they can take effect. The approval of new prices by Anatel took place in January 2021.
In 2018, Anatel approved Claro Brasil’s most recent wholesale reference offers with respect to national roaming, telecommunications duct infrastructure, long-distance leased lines, high capacity transport above 34 Mbps, wireless networks interconnection, fixed network interconnection, internet network interconnection and internet links, which are reviewed and approved by Anatel on an annual basis. Anatel also reviews its determination of which operators have significant market power on a quadrennial basis. Anatel began its first review of all telecom operators in 2014 and published the most recent list of operators with significant market power for each of the relevant markets in 2018. In addition to the review, in 2018 Anatel changed some of the asymmetric measures applicable under the PGMC and added two new wholesale markets covering high capacity transport and fixed network interconnection. Anatel has determined that Claro Brasil has significant market power in eight wholesale markets.
Network Usage Fees and Fixed-Line Interconnection Rates
In July 2014, Anatel approved a resolution establishing the reference terms for fees charged by operators in connection with the use of their mobile network and leased lines and set
76
a price cap on fees charged for fixed network usage by operators deemed to have significant market power. Such fees, based on costs of allocation services (), have been applicable since February 2016.
coubicación
In December 2018, Anatel published reference values for fees network that are applicable from 2020 to 2023.
Fixed-line operators determined by Anatel to have significant market power in the local
fixed-line
market may freely negotiate interconnection rates, subject to a price cap established by Anatel.Other Obligations
Under applicable law and our concessions, Claro Brasil has an obligation to (i) comply with certain coverage obligations to ensure universal access to itstargets and (iv) comply with applicable telecommunications services consumer rights.
fixed-line
voice services, (ii) contribute to the funding of the country’s transition from analogue to digital TV (due to the acquisition of the 700 MHz frequency), (iii) meetquality-of-service
In addition to the associated coverage obligations for the 3.5 GHz band, the winners will have to create an entity (EAF) to clear the spectrum (migration of the parabolic TV signal), build a private communication network for the federal government of Brazil and install an optic fiber network in the North of Brazil. There are no coverage obligations for the 26 GHz band, but the winners will have to create an entity (EACE) which will be responsible for meeting public schools’ connection needs as defined by Anatel, the Ministry of Communications and the Ministry of Education.
CADE Anti-Competition Proceeding
On March 9 2021, the General Superintendence at the Administrative Council for Economic Defense (“CADE”) issued a
non-binding
opinion recommending fines against Claro Brasil, Oi Móvel S.A. (“Oi”) and Telefônica Brasil S.A. (“Telefônica”, together Claro Brasil and Oi, the “Defendants”). The potential fines relate to a complaint filed by British Telecom do Brasil (“BT”) against the Defendants alleging, among other things, that, in connection with a public bid, the Defendants (i) colluded to prevent competition between the leading players in the broadband internet services market in Brazil, which caused anti-competitive effects in the telecommunications sector and (ii) made it difficult for BT to participate in the bid through price discrimination tactics and by refusing to supply communication circuits (specifically, MPLS links) that were required for BT to participate in the bid. The case will be reviewed by CADE’s tribunal for a final ruling and CADE’s final decision may be challenged in judicial courts. We intend to challenge the final decision if it is not in our favor. The amount of monetary penalty recommended bythe General Superintendence at CADE could be substantial, but we cannot reasonably estimate the range of possible loss related to the proceeding.
COLOMBIA
Legal Framework and Principal Regulatory Authorities
The Information and Communications Ministry (, or “ICT Ministry”) and the Communications Regulatory Commission (, or “CRC”) are responsible for overseeing and regulating the telecommunications sector. The main audiovisual regulatory authorities in Colombia with respect to Pay TV services are the CRC, the ICT Ministry and the Industry and Commerce Superintendence (Superintendencia de Industria y Comercio, or “SIC”). Claro is also subject to supervision by other government entities responsible for enforcing other regulations, such as antitrust rules or those protecting consumer rights.
Ministerio de Tecnologías de la Información y las Comunicaciones
Comisión de Regulación de Comunicaciones
Concessions
Comunicación Celular S.A. (“Comcel”) is qualified to provide fixed and mobile services and was included in the registry of networks and services administered by the ICT Ministry. Such general authorization superseded all of Comcel’s former concession contracts, and, consequently, such former concessions were terminated.
As a result of the termination of Comcel’s former concessions, the ICT Ministry and Comcel began discussions with respect to the liquidation of the agreements governing those concessions. In light of the decision of the Colombian Constitutional Court () holding that certain laws limiting the reversion of assets of telecommunications providers did not apply to concessions granted prior to 1998 and, consequently, that reversion of assets under those earlier concessions would be governed by their contractual terms, the ICT Ministry obtained a domestic award ordering Comcel to revert assets under its earlier concessions to the Colombian government. Comcel challenged such award and the Company filed an international arbitration claim against Colombia arising from Colombia’s measures. The international arbitration court overseeing this claim upheld the decision to grant the aforementioned domestic award.
Corte Constitucional de Colombia
77
Licenses and Permits
Comcel holds licenses to provide mobile services in the spectrum frequency bands shown in the table below.
FREQUENCY | BANDWIDTH | TERMINATION DATE | ||
850 MHz | 25 MHz | Mar. 2024 | ||
1900 MHz | 10 MHz | Dec. 2039 | ||
| 5 MHz | Oct. 2041 | |||
| 15 MHz | Mar. 2024 | |||
2.5 GHz | 30 MHz | Aug. 2023 | ||
| 10 MHz | Mar. 2040 | |||
| 10 MHz | Mar. 2040 | |||
| 10 MHz | Mar. 2040 | |||
700 MHz | 20 MHz | May 2040 | ||
In 2013, Telmex Colombia S.A. obtained permission to provide Pay TV services under any available technology, pursuant to the ICT Ministry’s unified licensing system. On May 31, 2019, Telmex Colombia, S.A. merged into Comcel. The permission to provide Pay TV services granted in favor of Telmex Colombia, S.A. was simultaneously transferred to Comcel without modifications in connection with the merger. On July 30, 2019, Comcel’s permission to provide Pay TV was incorporated under Comcel’s general power to provide Pay TV granted to it under Law 1978 of 2019.
In 2017, the ICT Ministry issued a decree approving a higher cap on spectrum acquisitions by operators in low and high frequency bands. This new cap allows Comcel to participate in future spectrum auctions. The ICT Ministry has released its plan to conduct spectrum auctions in the 700 MHz, 1900 MHz and 2.5 GHz bands. The final resolution containing the auctions’ terms and conditions was published by the ICT Ministry during the fourth quarter of 2019. The auction took place on December 20, 2019. A subsidiary of Novator Partners LLP, a London-based private equity firm (the “Novator Subsidiary”), participated in the auction as a new competitor in the market. The Novator Subsidiary was granted a 20MHz license to operate in the 700MHz frequency band and three blocks of 10MHz for the 2,500MHz frequency band. Colombia Telecomunicaciones (Movistar) and Colombia Movil (Tigo) also participated in the auction. Tigo was granted a 40MHz license to operate in the 700MHz frequency band. Colombia Telecomunicaciones was not granted any licenses in the auction.
Subsequently, the Novator Subsidiary resigned and refused to exercise its rights under the license to operate one block of 10MHz for the 2,500MHz frequency band. As a consequence, on February 11, 2020, the ICT Ministry initiated an administrative proceeding to evaluate and decide on the effects caused by such resignation. Comcel was notified by the ICT Ministry and was considered an interested third party
in the administrative proceeding. The ICT Ministry imposed a sanction of 42 billion Colombian Pesos, approximately U.S. $12.3 million against Partners as a result of the aforementioned administrative proceeding.
Asymmetric Charges
In January 2017, the Colombian government approved symmetrical access charges among established operators like Comcel, Movistar and Tigo. However, under current regulation, new market entrants continue to receive a higher interconnection rate than incumbent operators and pay lower national roaming fees, in both cases, for a limited period.
In 2017, the CRC issued a resolution updating the list of relevant telecommunication markets by adding the mobile services market (including bundled mobile voice and data services) and by also including the mobile service market in the list of relevant markets subject to
ex-ante
regulation. In connection with the mobile services market, on January 28, 2021, the CRC determined that COMCEL has a dominant position in the relevant mobile services market, but did not impose particular measures. COMCEL considers that the CRC did not take into account important elements in its determination, which COMCEL has challenged before the administrative courts of competent jurisdiction. The proceeding is currently at a mandatory conciliation stage.SOUTHERN CONE
ARGENTINA
The National Communications Agency (, or “Enacom”) is the main telecommunications regulatory authority in Argentina and became operational in 2016.
Ente Nacional de Comunicaciones
Fixed and mobile services providers are prohibited from providing DTH technology, which is currently the fastest way to provide Pay TV services. In 2017, the Argentine government issued a decree allowing telecommunications providers, including AMX Argentina S.A. (“AMX Argentina”), to provide Pay TV services via cable within a limited number of territories as of January 2018 and to the rest of the country as of January 2019. AMX Argentina has obtained the permissions necessary to provide Pay TV services via cable in accordance with the decree.
AMX Argentina holds licenses in the 700 MHz, 900 MHz, 1700/2100 MHz (AWS), 1900 MHz and 2600 MHz frequency bands, some of which expire in 15 years and some of which have no expiration date. Each license also contains certain coverage parameters, reporting and service requirements and provides Enacom a revocation right upon a material breach of the license terms.
78
All telecommunications providers in Argentina must contribute approximately 1.0% of their monthly revenues to finance the provision of telecommunications services in underserved areas and to underserved persons. All providers must also meet certainrequirements.
quality-of-service
In 2020, the government of Argentina issued decree 690/20 by which it declared information and communications technology (“ICT”) services and access to telecommunications networks, for and between licensees of ICT services, as essential and strategic public services in competition. It also established that Enacom is the competent authority to approve prices for ICT services and to establish regulations to that effect.
In 2021, in accordance with the provisions of decree 690/20, Enacom established the conditions of a “compulsory universal basic benefit” (“PBU”), which must be provided under conditions of equality. This PBU covers pay TV, internet, fixed and mobile telephony services, and consists of basic plans for each of these services at affordable prices. It is aimed at a special segment of beneficiaries.”
CHILE
The General Telecommunications Law () establishes the legal framework for telecommunications services in Chile, including the regulation of concessions, permits, rates and interconnection. The main regulatory agency of the telecommunications sector is the Chilean Transportation and Communications Ministry (), which acts primarily through the Undersecretary of Telecommunications (, or “SUBTEL”).
Ley General de Telecomunicaciones
Ministerio de Transportes y Telecomunicaciones
Subsecretaría de Telecomunicaciones
Claro Chile S.A. (“Claro Chile”) holds concessions to provide mobile andMHz) from ENTEL.
fixed-line
services in the 700MHz, 850 MHz, 1900 MHz, 2.6 GHz, 3.4 GHz and 5.8 GHz frequency bands. Except for the concession to provide services in the 850 MHz frequency, which has an indefinite termination date, the concessions to provide services in the 700 MHz, 1900 MHz, 2.6 GHz, 3.4 GHz and 5.8 GHz frequencies have termination dates that vary from 2027 to 2045. In 2020, Claro Chile received a 10 MHz license from Movistar to operate in the 1900 MHz frequency band. In February 2021, as part of a public tender, Claro Chile S.A. was granted a concession of 400 MHz block, in the 26 GHz Band. Later, in May 2021, Claro Chile acquired a concession of 30 MHz spectrum block in the 3.5 GHz Band(3.425-3.440MHz
y3.525-3-525-3.540
Claro Chile also holds a license to provide DTH technology services until 2024 and a license with an indefinite term to provide Pay TV services. Some of Claro Chile’s concessions impose additional requirements, such as coverage, reporting
and service quality requirements. The Chilean Transportation and Communications Ministry is authorized to terminate any concession in the event of specified breaches under the terms of such concessions. Additionally, Claro Chile’s concession in the 700 MHz band imposes certain obligations to expand mobile and data services in rural areas. In 2017, the Undersecretary of Telecommunication approved Claro Chile’s expansion project in connection with its obligations under its concession in the 700 MHz band.
In September 2021, Claro Chile S.A. and VTR, a subsidiary of Liberty Latin America Ltd., announced the beginning of a process to form an independent and permanent economic agent (Joint Venture) with the purpose of merging their telecommunications industry operations in Chile. In November 2021, the parties notified The National Economic Prosecutor’s Office (“FNE”) about this merger, which requires prior authorization of the FNE. The merger is currently in the first phase of investigation and analysis by the FNE.
PARAGUAY
The National Telecommunications Commission of Paraguay () is in charge of supervising the telecommunications industry in Paraguay. It is authorized to cancel licenses in the event of specified breaches of the terms of a license. AMX Paraguay, S.A. (“AMX Paraguay”) holds licenses to operate in the 1900 MHz and the 1700/2100 MHz bands.
Comisión Nacional de Telecomunicaciones de Paraguay
The 1700/2100 MHz band was renewed in August 2021. AMX Paraguay also holds a nationwide internet access and data transmission license. In addition, AMX Paraguay holds licenses to provide DTH services and cable TV services. The DTH License was renewed for another 5 years (until 2025). Additionally, in January 2018, AMX Paraguay participated in a spectrum auction and was awarded a license to provide telecommunications services in the 700 MHz band. In November 2018, the Telecommunications Commission of Paraguay granted the renewal of spectrum license in the 1900 MHz band. These licenses are renewable, subject to regulatory approval, and contain coverage, reporting and service requirements.
In November 2019, the Telecommunications Commission of Paraguay granted AMX Paraguay a license to provide internet access and data transmission services in the 3,500 MHz frequency band, effective until January 12, 2024.
URUGUAY
The Regulatory Unit of Communications Services (, or “URSEC”) is in charge of the regulation of the telecommunications industry in Uruguay.
Unidad Reguladora de Servicios de Comunicaciones
79
AM Wireless Uruguay, S.A. (“AM Wireless Uruguay”) holds licenses to operate in the 1900 MHz, 1700/2100 MHz and 700 MHz frequency bands that expire in 2024, 2033, 2037, 2039 and 2045. Additionally, AM Wireless Uruguay holds an authorization to do a trial for 5G in the 26, 50 GHz – 26, 85 GHz frequency band that expires on July 2021. In 2021, AM Wireless Uruguay obtained a “Class C” license, which enables it to provide internet services using fixed or wireless connections to authorized telecommunications companies. Telstar S.A. holds licenses to provide international long-distance communications and international and national data services that have no expiration date.
The license initially granted to Flimay S.A. (“Flimay”) to provide DTH technology services in Uruguay has been contested by the government since 2012. In 2017, the executive branch of Uruguay held under a new ruling that Flimay does not have a valid license to provide DTH services in the country. Flimay requested this ruling be voided, but in February 2018, the executive branch of Uruguay, with support from the Administrative Court (“TCA”), requested the process be closed. As of the date of this annual report, a decision on Flimay’s appeal is pending.
In July 2020, the Consideration Law () No. 19,889 was enacted, and pursuant to articles 471 through 476, established a number portability regime for mobile services. In January 2021 Decree No. 26 approved the regulation of the portability system.
Ley de Urgente Consideración
In November 2021, the Accountability Law () was enacted, whereby URSEC´s antitrust practices competencies were transferred to the Antitrust Commission ().
Ley de Rendición de Cuentas
Comisión de Promoción y Defensa de la Competencia
Notwithstanding the foregoing, URSEC remains competent to hold hearings on and authorize mergers and acquisitions of telecommunications licenses.
ANDEAN REGION
ECUADOR
The primary regulatory authorities for our mobile and, or “Arcotel”) and the Telecommunications and Information Society Ministry (, or “Mintel”). Arcotel is responsible for the licensing and oversight of radio-electric spectrum use and telecommunications services provisions. Mintel is responsible for the promotion of equal access to telecommunications services.
fixed-line
operations are the National Telecommunications, Regulation and Control Agency (Agencia de Regulación y Control de las Telecomunicaciones
Ministerio de Telecomunicaciones y Sociedad de la Información
The Telecommunications Law (), adopted in 2015, serves as the legal framework for telecommunications services. It established regulations for operators with significant market power based on their gross incomes as well as additional fees also based on an operator’s gross income, but that can vary depending on the size of their market share. Consorcio Ecuatoriano de Telecomunicaciones, S.A. (“Conecel”) has a significant percentage of users in the advanced wireless services market, and therefore is obliged to make fee payments on its income pursuant to the Telecommunications Law.
Ley Orgánica de Telecomunicaciones
Conecel paid to the Ecuadorian government U.S. $17.6 million, which corresponds to 3.0% of its wireless service revenues generated in the 2021. An arbitration proceeding to partially void the payment by Conecel of such fees was conducted and a decision in favor of the government was reached. Conecel has appealed this decision and, as of the date of this annual report, a decision of the Constitutional Court is pending. However, the Law for Economic Development and Sustainability after the) issued on November 29, 2021 eliminates the regulation (Article 34) of the Telecommunications Law that required Conecel to make quarterly payments on its income. This elimination will become effective as of January 1, 2023.
COVID-19
Pandemic (Ley Orgánica para el Desarrollo Económico y Sostenibilidad Fiscal tras la Pandemia
COVID-19
Conecel holds concessions to operate in the 850MHz, 1900 MHz and AWS bands, which include concessions for PCS that expire in 2023. The PCS concession containsrequirements for successful call completions, SMS delivery times, customer service, geographic coverage and other service conditions. The renewal of the PCS concession is in the process of negotiation with the Ecuadorian government.
quality-of-service
Conecel also holds licenses to provide Pay TV Services (through DTH technology), bearer services, and internet services, expiring in 2023, 2032 and 2036, respectively.
Conecel also holds a concession to offer
fixed-line
voice as well as a license to provide Pay TV (through HFC technology) that expires in 2032 and 2031, respectively.On March 15, 2021, the Superintendence of Companies (), approved the division of CONECEL, which was duly registered on April 8, 2021. This division resulted in the creation of a new company named Sites Ecuador
Superintendencia de Compañías
(Ecu-Sites)
S.A.S. The new company is now the owner of most of the towers which used to belong to CONECEL, and its core business is to provide tower services to other companies. Most of these towers services are provided to CONECEL.80
On May 18, 2021 the Telecommunications Authority dictated a resolution that grants CONECEL a concession to provide submarine cable services for a period of 20 years.
Recalculation of Concession Fees
Arcotel initiated several proceedings to recalculate the variable portion of the concession fees payable under Conecel’s concessions, which, as of the date of this annual report, is equivalent to 2.93% of Conecel’s annual subscriber base revenues, in addition to its contribution for Universal Service (), both for the periods from 2017 to 2019. These recalculation proceedings with Arcotel remain ongoing.
Servicio Universal 1%
In 2018, in addition to the variable portion of the concession, Conecel paid to Arcotel U.S.$11.9 million based on its annual revenues for the 2015 period and was required to pay U.S.$13 million based on its annual revenues for the 2016 period.
The recalculation proceedings mentioned in this section were disputed with Arcotel in arbitration. On April 17, 2020, the arbitration court issued its resolution which was favorable for Conecel. Arcotel was ordered to pay Conecel U.S.$32.4 million plus interest for the periods between 2009 and 2015.
On January 15, 2021, the Provincial Court of Justice accepted Arcotel´s request to nullify the resolution issued by the arbitration court, thereby declaring it null. However, the annulment of the resolution has not ended the dispute with Arcotel. A new arbitration court must issue a new resolution. At the same time Conecel enforced its rights by presenting an Extraordinary Action for Protection before the Constitutional Court for the violation of its rights.
For its Universal Service contribution, Conecel was required to pay U.S.$5 million for the 2015 period and U.S.$6 million for the 2016 period. On December 17, 2021, Conocel obtained a final judicial order that suspended definitely the collection process for the 2015 and 2016 periods. This is a final and
non-appealable
decision.PERU
The Supervisory Agency for Private Investment in Telecommunication (, or “OSIPTEL”) is in charge of the regulation of the telecommunications industry in Peru. The Ministry of Transport and Communications (, or “MTC”) grants concessions, permits and licenses. The Telecommunications Law (Ley de Telecomunicaciones), adopted in 1993, serves as the legal framework for telecommunications services.
Organismo Supervisor de la Inversión Privada en Telecomunicaciones
Ministerio de Transportes y Comunicaciones
Decreto Supremo N
°
013-93-TCC
América Móvil Perú, S.A.C. (“Claro Perú”) holds nationwide concessions to provide wireless, PCS,
fixed-line,
local wholesale, domestic and international long-distance, Pay TV services (through DTH and HFC technologies), public telephone and value-added services (including internet access). The concessions allow Claro Perú to operate on the 450 MHz, 700 MHz, 850 MHz, 1900 MHz, 3.5 GHz and 10.5 GHz bands. As part of Claro Perú’s acquisition of Olo del Perú S.A.C., TVS Wireless S.A.C. and their respective subsidiaries in 2016, Claro Perú has a resale agreement with such companies to operate in certain regions on the 2.5 GHz band.Spectrum reframing is the process conducted by the MTC to properly order the assignment of a frequency band in order to have continuous coverage nationwide and adequate bandwidth. The MTC issued the final decision on the spectrum reframing for the 2.5 Ghz band, granting 80 Mhz to TVS Wireless, S.A.C. (Lima and Callao) and Olo del Peru, S.A.C. (rest of the country).
Each of the concessions was awarded by the MTC and covers a
20-year
period. The concessions contain coverage, reporting, service requirement and spectral efficiency goals. The MTC is authorized to cancel any of the concessions in the case of specified breaches of its terms.EUROPE AND OTHER JURISDICTIONS
European Legal Framework and Principal Regulatory Authorities
The telecommunications regulatory framework in the EU is based on the European Electronic Communications Code (“EECC”) that is currently in the process of being transposed into national laws for all EU member states. Austria, Bulgaria, Croatia and Slovenia are EU member states. Macedonia and Serbia, candidates for accession to the EU, are expected to gradually harmonize their regulatory frameworks with the EU’s framework.
In each European country in which we operate, we are also subject to a domestic telecommunications regulatory framework and to oversight by one or more local regulators.
Licenses
COUNTRY | FREQUENCY | TERMINATION DATE | ||
AUSTRIA | 800 MHz | 2029 | ||
| 900 MHz | 2034 | |||
| 1500 MHz | 2044 | |||
| 1800 MHz | 2034 | |||
| 2100 MHz | 2044 | |||
| 2600 MHz | 2026 | |||
| 3500 MHz | 2039 | |||
81
COUNTRY | FREQUENCY | TERMINATION DATE | ||
BELARUS | 900 MHz | Not applicable | ||
| 1800 MHz | Not applicable | |||
| 2100 MHz | Not applicable | |||
BULGARIA | 900 MHz | 2024 | ||
| 1800 MHz | 2024 | |||
| 2100 MHz | 2025 | |||
| 3500 MHz | 2041 | |||
CROATIA | 700 MHz | 2036 | ||
| 800 MHz | 2024 | |||
| 900 MHz | 2024 | |||
| 1800 MHz | 2024 | |||
| 2100 MHz | 2024 | |||
| 3500 MHz | 2036 | |||
| 26000 MHz | 2036 | |||
NORTH MACEDONIA | 800 MHz | 2033 | ||
| 900 MHz | 2023 | |||
| 1800 MHz | 2033 | |||
| 2100 MHz | 2028 | |||
COUNTRY | FREQUENCY | TERMINATION DATE | ||
SERBIA | 800 MHz | 2026 | ||
| 900 MHz | 2026 | |||
| 1800 MHz | 2026 | |||
| 2100 MHz | 2026 | |||
SLOVENIA | 700 MHz | 2036 | ||
| 800 MHz | 2029 | |||
| 900 MHz | 2031 | |||
| 1500 MHz | 2036 | |||
| 1800 MHz | 2031 | |||
| 2100 MHz | 2021 | |||
| 2600 MHz | 2029 | |||
| 3500 MHz | 2036 | |||
| 26000 MHz | 2029 | |||
OTHER JURISDICTIONS
COUNTRY | PRINCIPAL REGULATORY AUTHORITIES | CONCESSION AND LICENSES | ||
COSTA RICA | Superintendency of Telecommunications (Superintendencia de Telecomunicaciones) Ministerio de Ciencia, Innovación, Tecnología y Telecomunicaciones | • Concessions in the AWS and 1800 MHz bands that expire in 2032 • Concessions in the 2100 MHz band that expire in 2026 • License to operate Pay TV services using DTH technology that will expire in 2026 | ||
EL SALVADOR | Electricity and Telecommunications Superintendency ( Superintendencia General de Electricidad y Telecomunicaciones | • Concession of 50 MHz in the 1900 MHz band of which 30 MHz that expire in 2038, 10 MHz that expire in 2041 and 10 MHz that expire in 2028 • Concession to provide public telephone service that expires in 2027 • Licenses to provide Pay TV Services through HFC and DTH technologies have an indefinite term • Concession of 40 MHz in 1700/2100 MHz bands (AWS) that will expire in 2040. | ||
GUATEMALA | Guatemalan Telecommunications Agency ( Superintendencia de Telecomunicaciones | • Licenses (Frequencies Usufruct Rights) to use 12 MHz in the 900 MHz band, 120 MHz in the 1900 MHz band and 175 MHz in the 3.5 GHz band that all expire in 2033 and were granted for the provision of any type of telecommunications service. | ||
NICARAGUA | Nicaraguan Telecommunications and Mailing Institute ( Instituto Nicaragüense de Telecomunicaciones y Correos | • Concessions in the 700 MHz, 850 MHz, 1900 MHz and 1700/2100 MHz bands that all expire in 2042 • Concession of 50 MHz in the 3.5 GHz band that will expire in 2042 • Licenses to provide DTH technology that will expire in January 2028 and Pay TV services that has an indefinite term | ||
HONDURAS | Honduran National Telecommunications Commission ( Comisión Nacional de Telecomunicaciones | • Concessions to use 80 MHz in the 1900 MHz PCS band and 40 MHz in the LTE-4G 1700/2100 MHz band that all expire in 2033• Licenses to operate Pay TV services through (i) HFC technology that will expire in 2027 and (ii) DTH technology that will expire in 2030 | ||
PANAMA | National Authority of Public Services ( Autoridad Nacional de los Servicios Públicos | • License to use 40 MHz in the 1900 MHz and 20 MHz in the 700 MHz bands that all expire in 2028 • Licenses to provide fixed local and long-distance services that expire in 2030 | ||
82
COUNTRY | PRINCIPAL REGULATORY AUTHORITIES | CONCESSION AND LICENSES | ||
• License to provide internet service that expires in 2033 • Licenses to provide international long-distance, value-added services, interactive television, and Pay TV service through DTH and IPTV technologies, which expire in 2028, 2030, 2037 and 2034, respectively • License to provide Pay TV service through optical fiber that expires in 2037. • License for data transportation, Service No. 200, which expires in 2023 | ||||
DOMINICAN REPUBLIC | Dominican Institute of Telecommunications ( Instituto Dominicano de las Telecomunicaciones | • Concession to provide fixed and wireless services, internet and pay TV services through DTH and IPTV technologies that expire in 2030 • Licenses to use 25 MHz in the 800 MHz band, 30 MHz in the 1900 MHz band, 80 MHz in the 2.5/2.7 GHz band, 30 MHz in the 3.5 GHz band and 40 MHz in the 1.7/2.1 GHz (AWS) band that expire in 2030 | ||
PUERTO RICO | Federal Communications Commission (FCC) and the Telecommunications Bureau of Puerto Rico | • Concessions to use the 700 MHz, 1900 MHz and the 28 GHz bands that expire in 2021 (currently pending renewal application extending to 2031), 2027 and 2029, respectively • Concessions to use the 800 MHz bands that expire in 2026, 2028, 2030 and 2031. • Concessions to use the AWS-1 andAWS-3 bands (1.7/2.1 GHz) that expire in 2026 and 2028, respectively.• Concessions to use the 3.5 GHz band that expires in 2030. • Long-term transfer lease concessions to use 35.6 MHz of the 2.5 GHz band that expire in 2022, 2023, 2025, 2026 and 2030. • Franchise to operate Pay TV services using IPTV technology that expires in 2030. | ||
83

84

85

Many of our employees are members of labor unions with which we conduct collective negotiations on wages, benefits and working conditions. We believe that we have good current relations with our workforce.
The following table sets forth the total number of employees and a breakdown of employees by main category of activity and geographic location, as of the dates indicated.
| | | DECEMBER 31, | �� | | ||||||||
| | 2019 | 2020 | 2021 | |||||||||
NUMBER OF EMPLOYEES | 190,664 | 185,948 | 181,205 | |||||||||
CATEGORY OF ACTIVITY: | ||||||||||||
Wireless | 82,232 | 72,501 | 72,098 | |||||||||
Fixed | 87,034 | 91,460 | 86,788 | |||||||||
Other businesses | 21,398 | 21,987 | 22,319 | |||||||||
GEOGRAPHIC LOCATION: | ||||||||||||
Mexico | 89,539 | 88,172 | 87,233 | |||||||||
South America | 61,058 | 59,244 | 56,147 | |||||||||
Central America | 10,372 | 9,936 | 9,713 | |||||||||
Caribbean | 11,351 | 10,647 | 10,256 | |||||||||
Europe | 18,344 | 17,949 | 17,856 | |||||||||

In each of the countries in which we operate, we are party to various legal proceedings in the ordinary course of business. These proceedings include tax, labor, antitrust, contractual matters and administrative and judicial proceedings concerning regulatory matters such as interconnection and tariffs. We are party to a number of proceedings regarding our compliance with administrative rules and regulations and concession standards. Our material legal proceedings are described in Note 17 to our audited consolidated financial statements included in this annual report and in “Regulation” under Part VI of this annual report. |
86

AUDIT AND
NON-AUDIT
FEESThe following table sets forth the fees billed to us and our subsidiaries by our independent registered public accounting firm, Mancera, during the fiscal years ended December 31, 2020 and 2021:
| | YEAR ENDED DECEMBER 31, | |||||||
| | 2020 | 2021 | ||||||
| | (in millions of Mexican pesos) | |||||||
Audit fees (1) | Ps. 250 | Ps. 267 | ||||||
Audit-related fees (2) | 10 | 23 | ||||||
Tax fees (3) | 19 | 13 | ||||||
Total fees | Ps. 279 | Ps. 303 | ||||||
(1) Audit fees represent the aggregate fees billed by Mancera and its Ernst & Young Global affiliated firms in connection with the audit of our annual financial statements and statutory and regulatory audits.(2) Audit-related fees represent the aggregate fees billed by Mancera and its Ernst & Young Global affiliated firms for the review of reports on our operations submitted to IFT and attestation services that are not required by statute or regulation.(3) Tax fees represent fees billed by Mancera and its Ernst & Young Global affiliated firms for tax compliance services, tax planning services and tax advice services. | ||||||||
AUDIT AND CORPORATE PRACTICES COMMITTEE APPROVAL POLICIES AND PROCEDURES
Our audit and corporate practices committee has established policies and procedures for the engagement of our independent auditors for services.
Our audit and corporate practices committee expressly approves any engagement of our independent auditors for audit or
non-audit
services provided to us or our subsidiaries. Prior to providing any service that requires specificpre-approval,
our independent auditor and our Chief Financial Officer present to the audit committee a request for approval of services in which they confirm that the request complies with the applicable rules.
We file reports, including annual reports on Form
20-F,
and other information with the SEC pursuant to the rules and regulations of the SEC that apply to foreign private issuers.Any fillings we make electronically will be available to the public over the internet at the SEC’s web site at www.sec.gov and at our website at www.americamovil.com. This URL is intended to be an inactive textual reference only. It is not intended to be an active hyperlink to our website. The information on our website, which might be accessible through a hyperlink resulting from this URL, is not incorporated into this annual report.
The following documents have been filed with the SEC as exhibits to this annual report:
8.1 | ||
12.1 | Certification of Chief Executive Officer pursuant to Section 302 of the Sarbanes-Oxley Act of 2002. | |
12.2 | Certification of Chief Financial Officer pursuant to Section 302 of the Sarbanes-Oxley Act of 2002. | |
13.1 | Certification pursuant to Section 906 of the Sarbanes- Oxley Act of 2002. | |
15.1 | Code of Ethics. | |
15.2 | Consent of independent registered public accounting firm. | |
17.1 | Subsidiary Guarantors | |
101.INS | Inline XBRL Instance Document. | |
101.SCH | Inline XBRL Taxonomy Extension Schema Document. | |
101.CAL | Inline XBRL Taxonomy Extension Calculation Linkbase Document. | |
101.LAB | Inline XBRL Taxonomy Extension Label Linkbase Document. | |
101.PRE | Inline XBRL Taxonomy Extension Presentation Linkbase Document. | |
101.DEF | Inline XBRL Taxonomy Extension Definition Document. | |
104 | Cover Page Interactive Data File (the cover page XBRL tags are embedded within the inline XBRL document). | |
Omitted from the exhibits filed with this annual report are certain instruments and agreements with respect to long-term debt of América Móvil, none of which, individually, authorizes securities in a total amount that exceeds 10% of the total assets of América Móvil. We hereby agree to furnish to the SEC copies of any such omitted instruments or agreements as the Commission requests.
87

Some of the information contained or incorporated by reference in this annual report constitutes “forward-looking statements” within the meaning of the safe harbor provisions of the Private Securities Litigation Reform Act of 1995.
Although we have based these forward-looking statements on our expectations and projections about future events, it is possible that actual events may differ materially from our expectations. In many cases, we include, together with the forward-looking statements themselves, a discussion of factors that may cause actual events to differ from our forward-looking statements.
Examples of forward-looking statements include the following:
| • | projections of our commercial, operating or financial performance, our financing, our capital structure or our other financial items or ratios; |
| • | statements of our plans, objectives or goals, including those relating to acquisitions, competition and rates; |
| • | statements concerning regulation or regulatory developments; |
| • | the impact of COVID-19; |
| • | statements about our future economic performance or that of Mexico or other countries in which we operate; |
| • | competitive developments in the telecommunications sector; |
| • | other factors and trends affecting the telecommunications industry generally and our financial condition in particular; and |
| • | statements of assumptions underlying the foregoing statements. |
We use words such as “believe,” “anticipate,” “plan,” “expect,” “intend,” “target,” “estimate,” “project,” “predict,” “forecast,” “guideline,” “should” and other similar expressions to identify forward- looking statements, but they are not the only way we identify such statements.
Forward-looking statements involve inherent risks and uncertainties. We caution you that a number of important factors could cause actual results to differ materially from the plans, objectives, expectations, estimates and intentions expressed in such forward- looking statements. These factors, some of which are discussed under “Risk Factors,” include the impact of the COVID-19 pandemic, economic and political conditions and government policies in Mexico, Brazil, Colombia, Europe and elsewhere, inflation rates, exchange rates, regulatory developments, technological improvements, customer demand and competition. We caution you that the foregoing list of factors is not exclusive and that other risks and uncertainties may cause actual results to differ materially from those in forward-looking statements. You should evaluate any statements made by us in light of these important factors.
Forward-looking statements speak only as of the date they are made. We undertake no obligation to publicly update or revise any forward-looking statements, whether as a result of new information or future events or for any other reason.
88

ITEM | FORM 20-F CAPTION | LOCATION IN THIS REPORT | PAGE | |||
1 | IDENTITY OF DIRECTORS, SENIOR MANAGEMENT AND ADVISERS | Not applicable | — | |||
2 | OFFER STATISTICS AND EXPECTED TIMETABLE | Not applicable | — | |||
3 | KEY INFORMATION | |||||
| 3A Selected financial data | Selected financial data | 6 | ||||
| 3B Capitalization and indebtedness | Not applicable | — | ||||
| 3C Reasons for the offer and use of proceeds | Not applicable | — | ||||
| 3D Risk factors | Risk factors | 36 | ||||
4 | INFORMATION ON THE COMPANY | |||||
| 4A History and development of the Company | Information on the Company | 9 | ||||
| Note 10—Property, Plant and Equipment, net | F-44 | |||||
| Liquidity and capital resources | 31 | |||||
| Additional Information | 85 | |||||
| 4B Business overview | Information on the Company | 9 | ||||
| Regulation | 70 | |||||
| 4C Organizational structure | Exhibit 8.1 | — | ||||
| 4D Property, plant and equipment | Information on the Company | 9 | ||||
| Note 10—Property Plant and Equipment, net | F-44 | |||||
| Liquidity and capital resources | 31 | |||||
| Regulation | 70 | |||||
| 4A Unresolved staff comments | None | — | ||||
5 | OPERATING AND FINANCIAL REVIEW AND PROSPECTS | |||||
| 5A Operating results | Overview | 23 | ||||
| Results of operations | 25 | |||||
| Regulation | 70 | |||||
| Liquidity and capital resources | 31 | |||||
| 5B Liquidity and capital resources | Note 14—Debt | F-56 | ||||
| 5C Research and development, patents and licenses, etc. | Not applicable | — | ||||
| 5D Trend information | Overview | 23 | ||||
| Results of operations | 25 | |||||
| 5E Critical Accounting Estimates | Not applicable | — | ||||
6 | DIRECTORS, SENIOR MANAGEMENT AND EMPLOYEES | |||||
| 6A Directors and senior management | Management | 59 | ||||
| 6B Compensation | Management | 59 | ||||
| 6C Board practices | Management | 59 | ||||
| Management | 59 | |||||
| 6D Employees | Employees | 86 | ||||
| 6E Share ownership | Major shareholders | 49 | ||||
| Management | 59 | |||||
7 | MAJOR SHAREHOLDERS AND RELATED PARTY TRANSACTIONS | |||||
| 7A Major shareholders | Major shareholders | 49 | ||||
| 7B Related party transactions | Related party transactions | 50 | ||||
| 7C Interests of experts and counsel | Not applicable | — | ||||
8 | FINANCIAL INFORMATION | |||||
| 8A Consolidated statements and other financial information | Consolidated Financial Statements | 93 | ||||
| Dividends | 50 | |||||
| Note 17—Commitments and Contingencies | F-64 | |||||
| 8B Significant changes | Not applicable | — | ||||
89

ITEM | FORM 20-F CAPTION | LOCATION IN THIS REPORT | PAGE | |||
9 | THE OFFER AND LISTING | |||||
9A Offer and listing details | Trading markets | 51 | ||||
| 9B Plan of distribution | Not applicable | — | ||||
| 9C Markets | Trading markets | 51 | ||||
| 9D Selling shareholders | Not applicable | — | ||||
| 9E Dilution | Not applicable | — | ||||
| 9F Expenses of the issue | Not applicable | — | ||||
10 | ADDITIONAL INFORMATION | |||||
| 10A Share Capital | Not applicable | — | ||||
| 10B Memorandum and articles of association | Bylaws | 51 | ||||
| 10C Material contracts | Information on the Company | 9 | ||||
| Results of operations | 25 | |||||
| Related party transactions | 50 | |||||
| Regulation | 70 | |||||
| 10D Exchange controls | Additional information | 85 | ||||
| 10E Taxation | Taxation of shares and ADSs | 53 | ||||
| 10F Dividends and paying agents | Not applicable | — | ||||
| 10G Statement by experts | Not applicable | — | ||||
| 10H Documents on display | Additional information | 85 | ||||
| 10I Subsidiary information | Not applicable | — | ||||
11 | QUANTITATIVE AND QUALITATIVE DISCLOSURES ABOUT MARKET RISK | Risk management | 34 | |||
| Note 2 a)—Basis of Preparation of the Consolidated Financial Statements and Summary of Significant Accounting Policies and Practices | F-11 | |||||
12 | DESCRIPTION OF SECURITIES OTHER THAN EQUITY SECURITIES | |||||
| 12A Debt securities | Not applicable | — | ||||
| 12B Warrants and rights | Not applicable | — | ||||
| 12C Other securities | Not applicable | — | ||||
| 12D American Depositary Shares | Bylaws | 51 | ||||
13 | DEFAULTS, DIVIDEND ARREARAGES AND DELINQUENCIES | Not applicable | — | |||
14 | MATERIAL MODIFICATIONS TO THE RIGHTS OF SECURITY HOLDERS AND USE OF PROCEEDS | Not applicable | — | |||
15 | CONTROLS AND PROCEDURES | Controls and procedures | 65 | |||
16A | AUDIT COMMITTEE FINANCIAL EXPERT | Management | 59 | |||
16B | CODE OF ETHICS | Code of ethics | 68 | |||
16C | PRINCIPAL ACCOUNTANT FEES AND SERVICES | Principal accountant fees and services | 87 | |||
16D | EXEMPTIONS FROM THE LISTING STANDARDS FOR AUDIT COMMITTEES | Not applicable | — | |||
16E | PURCHASES OF EQUITY SECURITIES BY THE ISSUER AND AFFILIATED PUR- CHASERS | Purchases of equity securities by the issuer and affiliated purchasers | 52 | |||
16F | CHANGE IN REGISTRANT’S CERTIFYING ACCOUNTANT | Not applicable | — | |||
16G | CORPORATE GOVERNANCE | Corporate governance | 63 | |||
16H | MINE SAFETY DISCLOSURE | Not applicable | — | |||
16I | DISCLOSURE REGARDING FOREIGN JURISDICATIONS THAT PREVENT IN- SPECTIONS | Not applicable | — | |||
17 | FINANCIAL STATEMENTS | Not applicable | — | |||
18 | FINANCIAL STATEMENTS | Consolidated Financial statements | 93 | |||
19 | EXHIBITS | Additional Information | 85 | |||
19 | EXHIBITS | Additional Information | ||||
90

The registrant hereby certifies that it meets all of the requirements for filing on Form
20-F
and that it has duly caused and authorized the undersigned to sign this annual report on its behalf.Dated: April 29, 2022
AMÉRICA MÓVIL, S.A.B. DE C.V.
By: | /s/ Carlos José García Moreno Elizondo | |
Name: | Carlos José García Moreno Elizondo | |
Title: | Chief Financial Officer | |
By: | /s/ Alejandro Cantú Jiménez | |
Name: | Alejandro Cantú Jiménez | |
Title: | General Counsel | |
91

92

AMÉRICA MÓVIL, S.A.B. DE C.V. AND SUBSIDIARIES
Consolidated Financial Statements
Years Ended December 31, 2019, 2020 and 2021
with Report of Independent Registered Public Accounting Firm
AMÉRICA MÓVIL, S.A.B. DE C.V. AND SUBSIDIARIES
Consolidated Financial Statements
Years Ended
December
31,2019
, 2020 and 2021Contents:
| F-2 | ||||
| Audited Consolidated Financial Statements: | ||||
| F-6 | ||||
| F-7 | ||||
| F-8 | ||||
| F-9 | ||||
| F-10 | ||||
F-1
REPORT OF INDEPENDENT REGISTERED PUBLIC ACCOUNTING FIRM
To the Board of Directors and Shareholders of
América Móvil, S.A.B. de C.V.
Opinion on the Financial Statements
We have audited the accompanying consolidated statements of financial position of América Móvil, S.A.B. de C.V. and its subsidiaries (the Company) as of December 31, 2021 and 2020, the related consolidated statements of comprehensive income, changes in shareholders’ equity and cash flows for each of the three years in the period ended December 31, 2021, and the related notes (collectively referred to as the “consolidated financial statements”). In our opinion, the consolidated financial statements present fairly, in all material respects, the financial position of the Company at December 31, 2021 and 2020, and the consolidated results of its operations and its cash flows for each of the three years in the period ended December 31, 2021, in conformity with International Financial Reporting Standards, as issued by the International Accounting Standards Board.
We also have audited, in accordance with the standards of the Public Company Accounting Oversight Board (United States) (PCAOB), the Company’s internal control over financial reporting as of December 31, 2021, based on criteria established in Internal Control-Integrated Framework issued by the Committee of Sponsoring Organizations of the Treadway Commission (2013 framework) and our report dated April
2
, 2022 expressed an unqualified opinion thereon.9
Basis for Opinion
These financial statements are the responsibility of the Company’s management. Our responsibility is to express an opinion on the Company’s financial statements based on our audits. We are a public accounting firm registered with the PCAOB and are required to be independent with respect to the Company in accordance with the U.S. federal securities laws and the applicable rules and regulations of the Securities and Exchange Commission and the PCAOB.
We conducted our audits in accordance with the standards of the PCAOB. Those standards require that we plan and perform the audit to obtain reasonable assurance about whether the financial statements are free of material misstatement, whether due to error or fraud. Our audits included performing procedures to assess the risks of material misstatement of the financial statements, whether due to error or fraud, and performing procedures that respond to those risks. Such procedures included examining, on a test basis, evidence regarding the amounts and disclosures in the financial statements. Our audits also included evaluating the accounting principles used and significant estimates made by management, as well as evaluating the overall presentation of the financial statements. We believe that our audits provide a reasonable basis for our opinion.
Critical Audit Matters
The critical audit matters communicated below are matters arising from the current period audit of the financial statements that were communicated or required to be communicated to the audit committee and that: (1) relate to accounts or disclosures that are material to the financial statements and (2) involved our especially challenging, subjective or complex judgments. The communication of critical audit matters does not alter in any way our opinion on the consolidated financial statements, taken as a whole, and we are not, by communicating the critical audit matters below, providing separate opinions on the critical audit matters or on the accounts or disclosures to which they relate.
F-2
Deferred tax assets, realizability of Net Operating Loss Carryforwards | ||
Description of the Matter | As discussed in Note 13 to the consolidated financial statements, as of December 31, 2021, the net balance of deferred tax assets was Ps.77,822,839 thousand. The Company has recognized deferred tax assets arising from net operating loss carryforwards (NOLs) of approximately Ps.24,449,622 thousand. The NOLs were generated primarily by its subsidiary in Brazil. Auditing management’s assessment of the realizability of the deferred tax assets arising from Brazilian NOLs involved complex auditor judgement because management´s estimate of realizability was based on assessing the probability, timing and sufficiency of expected reversals of taxable temporary differences, future taxable profits and available tax planning opportunities. These projections are sensitive because they can be affected by future operating results and future market and economic conditions. | |
How We Addressed the Matter in Our Audit | We obtained an understanding, evaluated the design and tested the operating effectiveness of controls that address the risks of material misstatement related to the realizability of the deferred tax assets. We tested controls over management’s analyses of future reversal of existing taxable temporary differences, their projections of future taxable income and related assumptions used in developing the projected financial information and their identification of available tax planning opportunities. Our audit also included the testing of controls that address the completeness and accuracy of the data utilized in the analysis. To test the realizability of the deferred tax assets arising from NOLs our audit procedures included, among other things, the review of management´s estimates of future taxable income in Brazil, the methodology used, the significant assumptions and the underlying data used by the Company in developing the projected financial information, such as the weighted average cost of capital, customer attrition rates, growth rates, and other key assumptions by comparing them with historical, economic and industry trends and evaluating whether changes to the Company´s business model and other factors would significantly affect the projected financial information. We also involved our valuation specialists to evaluate the analysis and assumptions used, and to test the calculations used by the Company. In addition, with the assistance of our tax professionals, we assessed the application of relevant tax laws, including assessing the Company’s future tax planning opportunities and tested the Company´s scheduling of the timing and amounts of expected reversals of taxable temporary differences. We also assessed the adequacy of the related financial statement disclosures. | |
Impairment of goodwill | ||
Description of the Matter | As discussed in Note 2 and Note 11 to the consolidated financial statements, as of December 31, 2021, the Company’s goodwill balance was Ps.136,578,194 thousand. The Company tests goodwill at least annually at the Cash Generating Unit (CGU) level. Impairment exists when the carrying value of a CGU exceeds its recoverable amount, which is the higher of its fair value less cost to sell and its value-in-use. Auditing management´s annual assessment of impairment of goodwill involved complex auditor judgement because the estimations required to determine the value-in-use | |
F-3
How We Addressed the Matter in Our Audit | We obtained an understanding, evaluated the design and tested the operating effectiveness of controls that address the risks of material misstatement related to the determination of the impairment of goodwill, including controls over management’s review of the significant assumptions described above, projected financial information and the valuation model used to develop such estimates. To test the impairment of goodwill our audit procedures included, among others, evaluating the methodology used, testing the significant assumptions mentioned above and the underlying data used by the Company. We assessed the historical accuracy of management’s estimates and projections by comparing them to actual results and obtaining appropriate explanations for the variances; examined management’s support for the current estimates and projections by comparing them to industry and economic trends, including market participant data; evaluated management’s methodology on the estimation of the weighted average cost of capital reflecting the economic conditions for each CGU; tested the completeness and accuracy of the underlying data, and evaluated other factors that would significantly affect the projected financial information and thus the value-in-use In addition, we involved our valuation specialist to evaluate the methodologies and assumptions used and to test the calculations made by the Company. We also assessed the adequacy of the related financial statement disclosures. | |
Discount rate used in determining defined benefit pension obligations in Mexico | ||
Description of the Matter | As discussed in Note 2, item iii), q) and in Note 18 to the consolidated financial statements, as of December 31, 2021, the defined benefit pension obligation balance was Ps.142,850,465 thousand. The Company assessed and updated its estimates and assumptions used to actuarially measure and value the defined benefit pension obligation as of December 31, 2021, using the assistance of independent actuarial specialists. Auditing the defined benefit pension obligation which the majority of it arises from one of its subsidiaries in Mexico and for which this matter is related, involved complex auditor judgement and required the involvement of our actuarial and valuation specialists because of the highly judgmental nature of the actuarial assumptions, primarily the discount rate used in the Company’s measurement process. This assumption was complex because it required a valuation of the credit quality of the corporate bonds used to develop the discount rate and the correlation of those bonds’ cash inflows to the timing and amount of future expected benefit payments. | |
How We Addressed the Matter in Our Audit | We obtained an understanding, evaluated the design and tested the operating effectiveness of controls that address the risks of material misstatement relating to the determination of the discount rate used in the defined benefit pension obligations calculations. We tested controls over management’s determination and review of the discount rate provided to the independent actuaries. To test the determination of the discount rate of the defined benefit pension obligation we involved our valuation and actuarial specialists to assist us in evaluating the methodology used to select the yield curve applied on the calculation, assessing the credit quality of the corporate bonds that comprise the yield curve, the timing and amount of cash flows at maturity with the expected amounts and duration of the related benefit payments. | |
F-4
We also evaluated the objectivity and competence management´s qualified persons responsible for overseeing the preparation of the discount rate through the consideration of their professional qualifications, experience and their use of accepted methodology. We also assessed the adequacy of the related financial statement disclosures. |
/s/ Mancera, S.C.
We have served as the Company’s auditor since 1993.
Mexico City, Mexico
April
2
9
,
2022F-5
AMÉRICA MÓVIL, S.A.B. DE C.V. AND SUBSIDIARIES
Consolidated Statements of Financial Position
(In thousands of Mexican pesos)
| Note | At December 31, | |||||||||||||
| 2020 | 2021 | 2021 Millions of U.S. dollars | ||||||||||||
Assets | ||||||||||||||
Current assets: | ||||||||||||||
Cash and cash equivalents | 3 | Ps. | 35,917,907 | Ps. | 38,679,891 | US$ | 1,879 | |||||||
Equity investments at fair value through other comprehensive income (OCI) and other short-term investments | 4 | 50,096,051 | 117,703,202 | 5,718 | ||||||||||
Accounts receivable: | ||||||||||||||
Subscribers, distributors, recoverable taxes, contract assets and other, net | 5 | 207,977,954 | 202,846,597 | 9,855 | ||||||||||
Related parties | 6 | 1,391,300 | 1,158,611 | 56 | ||||||||||
Derivative financial instruments | 7 | 20,928,335 | 10,130,806 | 492 | ||||||||||
Inventories, net | 8 | 30,377,439 | 24,185,310 | 1,175 | ||||||||||
Other current assets, net | 9 | 8,993,907 | 9,452,252 | 459 | ||||||||||
Total current assets | Ps. | 355,682,893 | Ps. | 404,156,669 | US$ | 19,634 | ||||||||
Non-current assets: | ||||||||||||||
Property, plant and equipment, net | 10 | Ps. | 722,929,631 | Ps. | 731,196,679 | US$ | 35,523 | |||||||
Intangibles, net | 11 | 133,456,967 | 143,225,764 | 6,958 | ||||||||||
Goodwill | 11 | 143,052,859 | 136,578,194 | 6,635 | ||||||||||
Investments in associated companies | 1,829,760 | 3,052,481 | 148 | |||||||||||
Deferred income taxes | 13 | 115,370,240 | 127,287,934 | 6,184 | ||||||||||
Accounts receivable, subscriber, distributors and contract assets, net | 5 | 7,792,863 | 6,928,888 | 337 | ||||||||||
Other assets, net | 9 | 38,415,826 | 39,956,090 | 1,941 | ||||||||||
Debt instruments at fair value through other comprehensive income (OCI) | 4 | 4,540,344 | 6,894,757 | 335 | ||||||||||
Right-of-use assets | 15 | 101,976,844 | 90,372,393 | 4,391 | ||||||||||
Total assets | Ps. | 1,625,048,227 | Ps. | 1,689,649,849 | US$ | 82,086 | ||||||||
Liabilities and equity | ||||||||||||||
Current liabilities: | ||||||||||||||
Short-term debt and current portion of long-term debt | 14 | Ps. | 148,083,184 | Ps. | 145,222,672 | US$ | 7,055 | |||||||
Short-term liability related to right-of-use of assets | 15 | 25,067,905 | 27,632,357 | 1,342 | ||||||||||
Accounts payable | 16a | 186,995,472 | 206,487,681 | 10,032 | ||||||||||
Accrued liabilities | 16b | 50,291,851 | 54,391,464 | 2,642 | ||||||||||
Income tax | 13 | 14,644,979 | 33,247,318 | 1,615 | ||||||||||
Other taxes payable | 27,969,739 | 26,278,007 | 1,277 | |||||||||||
Derivative financial instruments | 7 | 14,230,249 | 10,034,508 | 488 | ||||||||||
Related parties | 6 | 3,999,916 | 4,216,882 | 205 | ||||||||||
Deferred revenues | 36,027,383 | 26,501,877 | 1,288 | |||||||||||
Total current liabilities | Ps. | 507,310,678 | Ps. | 534,012,766 | US$ | 25,944 | ||||||||
Non-current liabilities: | ||||||||||||||
Long-term debt | 14 | Ps. | 480,299,772 | Ps. | 418,807,430 | US$ | 20,347 | |||||||
Long-term liability related to right-of-use of assets | 15 | 84,259,336 | 71,021,868 | 3,450 | ||||||||||
Deferred income taxes | 13 | 49,067,163 | 49,465,095 | 2,403 | ||||||||||
Deferred revenues | 2,875,467 | 2,698,276 | 131 | |||||||||||
Asset retirement obligations | 16c | 17,887,991 | 16,752,223 | 814 | ||||||||||
Employee benefits | 18 | 168,230,202 | 142,850,465 | 6,940 | ||||||||||
Total non-current liabilities | Ps. | 802,619,931 | Ps. | 701,595,357 | US$ | 34,085 | ||||||||
Total liabilities | Ps. | 1,309,930,609 | Ps. | 1,235,608,123 | US$ | 60,029 | ||||||||
Equity: | ||||||||||||||
Capital stock | 20 | Ps. | 96,341,695 | Ps. | 96,333,432 | US$ | 4,680 | |||||||
Retained earnings: | ||||||||||||||
Prior years | 267,865,420 | 255,267,259 | 12,402 | |||||||||||
Profit for the year | 46,852,605 | 192,423,167 | 9,348 | |||||||||||
Total retained earnings | 314,718,025 | 447,690,426 | 21,750 | |||||||||||
Other comprehensive loss items | (160,580,917 | ) | (154,388,931 | ) | (7,502 | ) | ||||||||
Equity attributable to equity holders of the parent | 250,478,803 | 389,634,927 | 18,928 | |||||||||||
Non-controlling interests | 64,638,815 | 64,406,799 | 3,129 | |||||||||||
Total equity | 315,117,618 | 454,041,726 | 22,057 | |||||||||||
Total liabilities and equity | Ps. | 1,625,048,227 | Ps. | 1,689,649,849 | US$ | 82,086 | ||||||||
The accompanying notes are an integral part of these consolidated financial statements.
F-
6
AMÉRICA MÓVIL, S.A.B. DE C.V. AND SUBSIDIARIES
Consolidated Statements of Comprehensive Income
(In thousands of Mexican pesos, except for earnings per share)
| Note | For the years ended December 31 | |||||||||||||||||
2019 (1) | 2020 (1) | 2021 | 2021 Millions of U.S. dollars, except for earnings per share | |||||||||||||||
Operating revenues: | ||||||||||||||||||
Service revenues | Ps . | 702,961,964 | Ps . | 708,483,701 | Ps . | 714,244,392 | US$ | 34,700 | ||||||||||
Sales of equipment | 148,521,512 | 131,223,459 | 141,290,479 | 6,864 | ||||||||||||||
Ps . | 851,483,476 | Ps. | 839,707,160 | Ps . | 855,534,871 | US$ | 41,564 | |||||||||||
Operating costs and expenses: | ||||||||||||||||||
Cost of sales and services | 348,776,249 | 334,881,859 | 341,059,662 | 16,570 | ||||||||||||||
Commercial, administrative and general expenses | 195,507,880 | 191,901,898 | 180,838,412 | 8,786 | ||||||||||||||
Other expenses | 5,882,276 | 4,737,626 | 4,877,290 | 237 | ||||||||||||||
Depreciation and amortization | 9,10,11 and 15 | 157,518,787 | 162,682,398 | 162,626,866 | 7,901 | |||||||||||||
Ps . | 707,685,192 | Ps . | 694,203,781 | Ps . | 689,402,230 | US$ | 33,494 | |||||||||||
Operating income | Ps . | 143,798,284 | Ps . | 145,503,379 | Ps. | 166,132,641 | US$ | 8,070 | ||||||||||
Interest income | 6,284,672 | 5,062,036 | 3,834,827 | 186 | ||||||||||||||
Interest expense | (37,910,954 | ) | (38,661,485 | ) | (36,025,312 | ) | (1,750 | ) | ||||||||||
Foreign currency exchange gain (loss), net | 5,226,071 | (65,366,200 | ) | (17,045,843 | ) | (828 | ) | |||||||||||
Valuation of derivatives, interest cost from labor obligations and other financial items, net | 22 | (6,997,844 | ) | 1,292,878 | (14,250,066 | ) | (692 | ) | ||||||||||
Equity interest in net result of associated companies | (17,609 | ) | (287,006 | ) | 113,918 | 6 | ||||||||||||
Profit before income tax | 110,382,620 | 47,543,602 | 102,760,165 | 4,992 | ||||||||||||||
Income tax | 13 | 49,914,055 | 13,509,270 | 28,144,769 | 1,367 | |||||||||||||
Net profit for the year from continuing operations | Ps. | 60,468,565 | Ps. | 34,034,332 | Ps. | 74,615,396 | US$ | 3,625 | ||||||||||
Profit after tax for the year from discontinued operations | 9,844,889 | 16,992,625 | 121,710,718 | 5,913 | ||||||||||||||
Net profit for the year | Ps. | 70,313,454 | Ps. | 51,026,957 | Ps. | 196,326,114 | US$ | 9,538 | ||||||||||
Net profit for the year attributable to: | ||||||||||||||||||
Equity holders of the parent from continuing operations | Ps. | 57,886,001 | Ps. | 29,859,980 | Ps. | 70,712,449 | US$ | 3,435 | ||||||||||
Equity holders of the parent from discontinued operations | 2, Ac | 9,844,889 | 16,992,625 | 121,710,718 | 5,913 | |||||||||||||
Non-controlling interests | 2,582,564 | 4,174,352 | 3,902,947 | 190 | ||||||||||||||
| Ps. | 70,313,454 | Ps. | 51,026,957 | Ps. | 196,326,114 | US$ | 9,538 | |||||||||||
Basic and diluted earnings per share attributable to equity holders of the parent from continuing operations | 20 | Ps. | 0.88 | Ps. | 0.45 | Ps. | 1.07 | US$ | 0.05 | |||||||||
Basic and diluted earnings per share attributable to equity holders of the parent from discontinued operations | 20 | Ps. | 0.15 | Ps. | 0.26 | Ps. | 1.85 | US$ | 0.09 | |||||||||
Other comprehensive income (loss) items: | ||||||||||||||||||
Net other comprehensive loss that may be reclassified to profit or loss in subsequent years: | ||||||||||||||||||
Effect of translation of foreign entities from continuing operations | Ps. | (35,536,252 | ) | Ps. | (11,515,297 | ) | Ps. | (7,134,153 | ) | US$ | (347 | ) | ||||||
Effect of translation of foreign entities from discontinued operations | — | — | (829,163 | ) | (40 | ) | ||||||||||||
Items that will not be reclassified to (loss) or profit in subsequent years: | ||||||||||||||||||
Re-measurement of defined benefit plan, net of deferred taxes | (29,535,672 | ) | (10,299,558 | ) | 11,261,896 | 547 | ||||||||||||
Unrealized (loss) gain on equity investments at fair value, net of deferred taxes | 883,409 | (1,952,414 | ) | 4,560,869 | 222 | |||||||||||||
Revaluation surplus, net of deferred taxes | — | 77,230,031 | 0 | 0 | ||||||||||||||
Total other comprehensive (loss) income items for the year, net of deferred taxes | 21 | (64,188,515 | ) | 53,462,762 | 7,859,449 | 382 | ||||||||||||
Total comprehensive income for the year | Ps. | 6,124,939 | Ps. | 104,489,719 | Ps. | 204,185,563 | US$ | 9,920 | ||||||||||
Comprehensive income for the year attributable to: | ||||||||||||||||||
Equity holders of the parent from continuing operations | Ps. | 5,450,679 | Ps. | 86,150,118 | Ps. | 202,418,502 | US$ | 9,834 | ||||||||||
Non-controlling interests | 674,260 | 18,339,601 | 1,767,061 | 86 | ||||||||||||||
| Ps. | 6,124,939 | Ps. | 104,489,719 | Ps. | 204,185,563 | US$ | 9,920 | |||||||||||
Comprehensive income for the period: | ||||||||||||||||||
Net comprehensive (loss) income from continuing operations | Ps. | (3,719,950 | ) | Ps. | 87,497,094 | Ps. | 82,474,845 | US$ | 4,007 | |||||||||
Net comprehensive income from discontinued operations | 2, Ac | 9,844,889 | 16,992,625 | 121,710,718 | 5,913 | |||||||||||||
| Ps. | 6,124,939 | Ps. | 104,489,719 | Ps. | 204,185,563 | US$ | 9,920 | |||||||||||
| (1) | Restated for discontinued operations. |
The accompanying notes are an integral part of these consolidated financial statements.
F-7
AMÉRICA MÓVIL, S.A.B. DE C.V. AND SUBSIDIARIES
Consolidated Statements of Changes in Shareholders’ Equity
For the years ended December 31, 2019, 2020 and 2021
(In thousands of Mexican pesos)
Capital stock | Legal reserve | Retained earnings | Unrealized (loss) gain on equity investment at fair value | Re-measurement of defined benefit plans | Cumulative translation adjustment | Revaluation surplus | Total equity attributable to equity holders of the parent | Non- controlling interests | Total equity | |||||||||||||||||||||||||||||||
As of January 31, 2019 | Ps. | 96,338,378 | Ps. | 358,440 | Ps. | 236,897,045 | Ps. | (9,812,984 | ) | Ps. | (74,427,934 | ) | Ps. | (53,357,300 | ) | Ps. | — | Ps. | 195,995,645 | Ps. | 49,876,777 | Ps. | 245,872,422 | |||||||||||||||||
Net profit for the year | — | — | 67,730,890 | — | — | — | — | 67,730,890 | 2,582,564 | 70,313,454 | ||||||||||||||||||||||||||||||
Unrealized gain on equity investments at fair value, net of deferred taxes | — | — | — | 883,409 | — | — | — | 883,409 | — | 883,409 | ||||||||||||||||||||||||||||||
Remeasurement of defined benefit plan, net of deferred taxes | — | — | — | — | (29,153,554 | ) | — | — | (29,153,554 | ) | (382,118 | ) | (29,535,672 | ) | ||||||||||||||||||||||||||
Effect of translation of foreign entities | — | — | — | — | — | (34,010,066 | ) | — | (34,010,066 | ) | (1,526,186 | ) | (35,536,252 | ) | ||||||||||||||||||||||||||
Comprehensive income (loss) for the year | — | — | 67,730,890 | 883,409 | (29,153,554 | ) | (34,010,066 | ) | — | 5,450,679 | 674,260 | 6,124,939 | ||||||||||||||||||||||||||||
Dividends declared | — | — | (23,106,823 | ) | — | — | — | — | (23,106,823 | ) | (1,473,290 | ) | (24,580,113 | ) | ||||||||||||||||||||||||||
Repurchase of shares | (116 | ) | — | (427,212 | ) | — | — | — | — | (427,328 | ) | — | (427,328 | ) | ||||||||||||||||||||||||||
Other acquisitions of non-controlling interests | — | — | (2,214 | ) | — | — | — | — | (2,214 | ) | (80,841 | ) | (83,055 | ) | ||||||||||||||||||||||||||
Balance at December 31, 2019 | Ps. | 96,338,262 | Ps. | 358,440 | Ps. | 281,091,686 | Ps. | (8,929,575 | ) | Ps. | (103,581,488 | ) | Ps. | (87,367,366 | ) | Ps. | — | Ps. | 177,909,959 | Ps. | 48,996,906 | Ps. | 226,906,865 | |||||||||||||||||
Net profit for the year | — | — | 46,852,605 | — | — | — | — | 46,852,605 | 4,174,352 | 51,026,957 | ||||||||||||||||||||||||||||||
Unrealized loss on equity investments at fair value, net of deferred taxes | — | — | — | (1,952,414 | ) | — | — | (1,952,414 | ) | — | (1,952,414 | ) | ||||||||||||||||||||||||||||
Remeasurement of defined benefit plan, net of deferred taxes | — | — | — | — | (10,026,454 | ) | — | — | (10,026,454 | ) | (273,104 | ) | (10,299,558 | ) | ||||||||||||||||||||||||||
Effect of translation of foreign entities | — | — | — | — | — | (13,558,774 | ) | — | (13,558,774 | ) | 2,043,477 | (11,515,297 | ) | |||||||||||||||||||||||||||
Revaluation surplus, net of deferred taxes | — | — | — | — | — | — | 64,835,155 | 64,835,155 | 12,394,876 | 77,230,031 | ||||||||||||||||||||||||||||||
Comprehensive income (loss) for the year | — | — | 46,852,605 | (1,952,414 | ) | (10,026,454 | ) | (13,558,774 | ) | 64,835,155 | 86,150,118 | 18,339,601 | 104,489,719 | |||||||||||||||||||||||||||
Dividends declared | — | — | (25,161,564 | ) | — | — | — | — | (25,161,564 | ) | (1,860,300 | ) | (27,021,864 | ) | ||||||||||||||||||||||||||
Stock dividend | 4,650 | — | 17,054,007 | — | — | — | — | 17,058,657 | — | 17,058,657 | ||||||||||||||||||||||||||||||
Repurchase of shares | (1,217 | ) | — | (5,209,880 | ) | — | — | — | — | (5,211,097 | ) | — | (5,211,097 | ) | ||||||||||||||||||||||||||
Other acquisitions of non-controlling interests | — | — | (267,270 | ) | — | — | — | — | (267,270 | ) | (837,392 | ) | (1,104,662 | ) | ||||||||||||||||||||||||||
Balance at December 31, 2020 | Ps. | 96,341,695 | Ps. | 358,440 | Ps. | 314,359,584 | Ps. | (10,881,989 | ) | Ps. | (113,607,942 | ) | Ps. | (100,926,140 | ) | Ps. | 64,835,155 | Ps. | 250,478,803 | Ps. | 64,638,815 | Ps. | 315,117,618 | |||||||||||||||||
Net profit for the year | — | — | 192,423,167 | — | — | — | — | 192,423,167 | 3,902,947 | 196,326,114 | ||||||||||||||||||||||||||||||
Unrealized gain on equity and debt investments at fair value, net of deferred taxes | — | — | — | 4,560,869 | — | — | — | 4,560,869 | — | 4,560,869 | ||||||||||||||||||||||||||||||
Remeasurement of defined benefit plan, net of deferred taxes | — | — | — | — | 11,100,835 | — | — | 11,100,835 | 161,061 | 11,261,896 | ||||||||||||||||||||||||||||||
Effect of translation of foreign entities | — | — | — | — | — | (2,514,992 | ) | (2,322,214 | ) | (4,837,206 | ) | (2,296,947 | ) | (7,134,153 | ) | |||||||||||||||||||||||||
Discontinued operations | — | — | — | — | — | (829,163 | ) | — | (829,163 | ) | —�� | (829,163 | ) | |||||||||||||||||||||||||||
Transfer of revaluation surplus | — | — | 3,803,349 | — | — | — | (3,803,349 | ) | — | — | — | |||||||||||||||||||||||||||||
Comprehensive income (loss) for the year | — | — | 196,226,516 | 4,560,869 | 11,100,835 | (3,344,155 | ) | (6,125,563 | ) | 202,418,502 | 1,767,061 | 204,185,563 | ||||||||||||||||||||||||||||
Dividends declared | — | — | (26,640,797 | ) | — | — | — | — | (26,640,797 | ) | (1,919,674 | ) | (28,560,471 | ) | ||||||||||||||||||||||||||
Repurchase of shares | (8,263 | ) | — | (36,752,766 | ) | — | — | — | — | (36,761,029 | ) | — | (36,761,029 | ) | ||||||||||||||||||||||||||
Other acquisitions of non-controlling interests | — | — | 139,448 | — | — | — | — | 139,448 | (79,403 | ) | 60,045 | |||||||||||||||||||||||||||||
Balance at December 31, 2021 | Ps. | 96,333,432 | Ps. | 358,440 | Ps. | 447,331,985 | Ps. | (6,321,120 | ) | Ps. | (102,507,107 | ) | Ps. | (104,270,295 | ) | Ps. | 58,709,592 | Ps. | 389,634,927 | Ps. | 64,406,799 | Ps. | 454,041,726 | |||||||||||||||||
The accompanying notes are an integral part of these consolidated financial statements.
F-
8
AMÉRICA MÓVIL, S.A.B. DE C.V. AND SUBSIDIARIES
Consolidated Statements of Cash Flows
(In thousands of Mexican pesos)
For the years ended December 31 | ||||||||||||||||||
| Note | 2019 (1) | 2020 (1) | 2021 | 2021 Millions of U.S. dollars | ||||||||||||||
Operating activities | ||||||||||||||||||
Profit before income tax from continuing operations | Ps. | 110,382,620 | Ps. | 47,543,602 | Ps. | 102,760,165 | US$ | 4,992 | ||||||||||
Profit before income tax from discontinued operations | 2, Ac | 10,964,368 | 19,849,507 | 150,576,681 | 7,316 | |||||||||||||
Profit before income tax | 121,346,988 | 67,393,109 | 253,336,846 | 12,308 | ||||||||||||||
Items not requiring the use of cash: | ||||||||||||||||||
Depreciation property, plant and equipment and right-of-use assets | 10 and 15 | 137,867,698 | 143,108,182 | 139,211,403 | 6,763 | |||||||||||||
Amortization of intangible and other assets | 9 and 11 | 19,651,089 | 19,574,216 | 23,415,463 | 1,138 | |||||||||||||
Equity interest in net (loss) income of associated companies | 17,609 | 287,006 | (113,918 | ) | (6 | ) | ||||||||||||
(Gain) Loss on sale of property, plant and equipment | 119,272 | 257,330 | (6,849,699 | ) | (333 | ) | ||||||||||||
Net period cost of labor obligations | 18 | 16,609,565 | 18,085,954 | 18,688,374 | 908 | |||||||||||||
Foreign currency exchange loss (income), net | (7,250,635 | ) | 59,923,928 | 14,523,412 | 706 | |||||||||||||
Interest income | (6,284,672 | ) | (5,062,036 | ) | (3,834,827 | ) | (186 | ) | ||||||||||
Interest expense | 37,910,954 | 38,661,485 | 36,025,312 | 1,750 | ||||||||||||||
Employee profit sharing | 1,618,695 | 2,066,066 | 3,130,722 | 152 | ||||||||||||||
Gain expense and other, net | (9,202,167 | ) | (13,678,083 | ) | 5,246,476 | 255 | ||||||||||||
Gain on net monetary positions | 22 | (4,267,194 | ) | (3,262,512 | ) | (4,876,842 | ) | (237 | ) | |||||||||
Gain on sale of subsidiary | 2, Ac | — | — | (132,821,709 | ) | (6,453 | ) | |||||||||||
Working capital changes: | ||||||||||||||||||
Subscribers, distributors, recoverable taxes, contract assets and other, net | 7,422,351 | 3,189,136 | 6,883,270 | 334 | ||||||||||||||
Prepaid expenses | 8,860,172 | (160,082 | ) | (890,729 | ) | (43 | ) | |||||||||||
Related parties | 476,671 | 421,337 | 449,655 | 22 | ||||||||||||||
Inventories | (463,461 | ) | 10,402,117 | 5,756,325 | 280 | |||||||||||||
Other assets | (6,560,640 | ) | (2,650,867 | ) | (9,802,727 | ) | (476 | ) | ||||||||||
Employee benefits | (20,224,276 | ) | (18,795,532 | ) | (27,223,091 | ) | (1,323 | ) | ||||||||||
Accounts payable and accrued liabilities | (15,730,804 | ) | 11,247,681 | 9,946,257 | 483 | |||||||||||||
Employee profit sharing paid | (2,187,316 | ) | (2,436,223 | ) | (1,922,029 | ) | (93 | ) | ||||||||||
Financial instruments and other | (1,774,932 | ) | 2,606,938 | (1,664,465 | ) | (81 | ) | |||||||||||
Deferred revenues | 1,237,894 | 1,958,553 | (9,257,456 | ) | (450 | ) | ||||||||||||
Interest received | 1,008,076 | 3,946,110 | 2,665,854 | 130 | ||||||||||||||
In come taxes paid | (41,418,114 | ) | (61,366,231 | ) | (60,535,903 | ) | (2,942 | ) | ||||||||||
Cash flows from discontinued operating | (4,504,355 | ) | 5,109,961 | (1,304,336 | ) | (63 | ) | |||||||||||
Net cash flows provided by continuing operating activities | Ps. | 234,278,468 | Ps. | 280,827,543 | Ps. | 258,181,638 | US$ | 12,543 | ||||||||||
Investing activities | ||||||||||||||||||
Purchase of property, plant and equipment | (132,834,246 | ) | (108,866,816 | ) | (145,279,359 | ) | (7,058 | ) | ||||||||||
Acquisition of intangibles | (18,962,856 | ) | (20,647,571 | ) | (12,791,580 | ) | (621 | ) | ||||||||||
Dividends received | 22 | 1,773,336 | 2,122,826 | 2,628,600 | 128 | |||||||||||||
Proceeds from sale of plant, property and equipment | 344,924 | 162,060 | 7,215,177 | 351 | ||||||||||||||
Acquisition of businesses, net of cash acquired | 12 | (13,330,651 | ) | (152,896 | ) | 0 | 0 | |||||||||||
Partial sale of shares of associated company | 36,478 | 601,509 | 199,158 | 10 | ||||||||||||||
Investments in associate companies | (56,985 | ) | (64,341 | ) | — | — | ||||||||||||
Sale of shares | — | — | 75,518,886 | 3,669 | ||||||||||||||
Short-term investments | — | (8,671,662 | ) | (3,361,507 | ) | (163 | ) | |||||||||||
Cash flows from discontinued investing | 2, Ac | (50,089 | ) | (40,602 | ) | (650,319 | ) | (32 | ) | |||||||||
Net cash flows used in investing continuing activities | Ps. | (163,080,089 | ) | Ps. | (135,557,493 | ) | Ps. | (76,520,944 | ) | US$ | (3,716 | ) | ||||||
Financing activities | ||||||||||||||||||
Loans obtained | 118,082,256 | 277,515,598 | 93,675,127 | 4,551 | ||||||||||||||
Repayment of loans | (109,808,816 | ) | (330,607,399 | ) | (152,029,408 | ) | (7,388 | ) | ||||||||||
Payment of liability related to right-of-use of assets | 15 | (26,765,075 | ) | (29,623,565 | ) | (30,544,750 | ) | (1,484 | ) | |||||||||
Interest paid | (28,046,695 | ) | (28,421,734 | ) | (23,884,410 | ) | (1,160 | ) | ||||||||||
Repurchase of shares | (435,713 | ) | (5,076,119 | ) | (36,745,743 | ) | (1,785 | ) | ||||||||||
Dividends paid | (24,248,145 | ) | (9,592,253 | ) | (27,829,345 | ) | (1,352 | ) | ||||||||||
Acquisition of non-controlling interests | 12 | (83,055 | ) | (1,104,662 | ) | (7,720 | ) | — | ||||||||||
Net cash flows used in financing activities | Ps. | (71,305,243 | ) | Ps. | (126,910,134 | ) | Ps. | (177,366,249 | ) | US$ | (8,618 | ) | ||||||
Net (decrease) gain in cash and cash equivalents | Ps. | (106,864 | ) | Ps. | 18,359,916 | Ps. | 4,294,445 | US$ | 209 | |||||||||
Adjustment to cash flows due to exchange rate fluctuations, net | (1,807,442 | ) | (2,187,665 | ) | (1,532,461 | ) | (74 | ) | ||||||||||
Cash and cash equivalents at beginning of the year | 21,659,962 | 19,745,656 | 35,917,907 | 1,744 | ||||||||||||||
Cash and cash equivalents at end of the year | Ps. | 19,745,656 | Ps. | 35,917,907 | Ps. | 38,679,891 | US$ | 1,879 | ||||||||||
Non-cash transactions related to: | ||||||||||||||||||
Acquisitions of property, plant and equipment in accounts payable at end year | Ps. | 19,673,706 | Ps. | 3,063,081 | Ps. | 18,385,498 | US$ | 893 | ||||||||||
Revaluation surplus | — | 107,152,628 | — | — | ||||||||||||||
Non-cash transactions | Ps. | 19,673,706 | Ps. | 110,215,709 | Ps. | 18,385,498 | US$ | 893 | ||||||||||
| (1) | Restated for discontinued operations. |
The accompanying notes are an integral part of these consolidated financial statements.
F-
9
AMÉRICA MÓVIL, S.A.B. DE C.V. AND SUBSIDIARIES
Notes to Consolidated Financial Statements
Years ended December 31, 2019, 2020 and 2021
(In thousands of Mexican pesos Ps. and thousands of
U.S. dollars US$, unless otherwise indicated)
1. Description of the Business and Relevant Events
I. Corporate Information
América Móvil, S.A.B. de C.V. and subsidiaries (hereinafter, the “Company”, “América Móvil” or “AMX”) was incorporated under laws of Mexico on September 25, 2000. The Company provides telecommunications services in 24 countries throughout Latin America, the United States, the Caribbean and Europe. These telecommunications services include mobile and fixed-line voice services, wireless and fixed data services, internet access and Pay TV, over the top and other related services. The Company also sells equipment, accessories and computers.
| • | Voice services provided by the Company, both wireless and fixed, mainly include the following: airtime, local, domestic and international long-distance services, and network interconnection services. |
| • | Data services include value added, corporate networks, data and Internet services. |
| • | Pay TV represents basic services, as well as pay per view and additional programming and advertising services. |
| • | AMX provides other related services to advertising in telephone directories, publishing and call center services. |
| • | The Company also provides video, audio and other media content that is delivered through the internet directly from the content provider to the end user. |
In order to provide these services, América Móvil has licenses, permits and concessions (collectively referred to herein as “licenses”) to build, install, operate and exploit public and/or private telecommunications networks and provide miscellaneous telecommunications services (mostly mobile and fixed voice and data services) and to operate frequency bands in the radio-electric spectrum for point-to-point and point-to-multipoint microwave links. The Company holds licenses in the 24 countries where it has networks, and such licenses have different dates of expiration through 2056.
Certain licenses require the payment to the respective governments of a share in sales determined as a percentage of revenues from services under concession. The percentage is set as either a fixed rate or in some cases based on certain size of the infrastructure in operation.
The corporate offices of América Móvil are located in Mexico City, Mexico, at Lago Zurich 245, Colonia Ampliación Granada, Delegación Miguel Hidalgo, 11529, Mexico City, Mexico.
The accompanying consolidated financial statements were approved for their issuance by the Company’s Chief Financial Officer on April 20, 2022, and subsequent events have been considered through that date.
II. Relevant events in 2021
a) In September 2021, the Company entered into an agreement with Cable & Wireless Panama, S.A. an affiliate of Liberty Latin America LTD., to sell our 100% interest in Claro Panama, S.A. The agreed purchase price is Us$200 million on a cash/debt free basis. The closing of the transaction is subject to customary conditions for this type of transactions, including obtaining required governmental approvals.
F-
10
b) In September 2021, the Company announced that shareholders representing approximately 98% of our capital stock approved the spin-off of approximately 36,000
telecommunications towers and other associated passive infrastructure deployed in 14 countries in Latin America. The spin-off is subject to customary conditions and adjustments for corporate reorganizations and shall comply with applicable requirements under the laws of Mexico and the jurisdictions where the telecommunications towers are located.
c) In September 2021, Liberty Latin America and América Móvil announced an agreement to combine their respective Chilean operations, VTR and Claro Chile, to form a 50:50 joint venture. The proposed transaction combines the complementary operations of VTR, a leading provider of high-speed consumer fixed products, such as broadband and Pay TV services, where it connects close to 3 million subscribers nationwide, and Claro Chile, one of Chile’s leading telecommunications service providers with over 6.5 million mobile customers, to create a business with greater scale, product diversification, and a capital structure that will enable significant investment for fixed fiber footprint expansion and to be at the forefront of 5G mobile delivery. Completion of the transaction is subject to certain customary closing conditions, including regulatory approvals, and is expected to close in the second half of 2022.
d) On November 23, 2021, the Company completed the sale of TracFone Wireless to Verizon Communications. The Company received US$3,625.7 million in cash and 57,596,544 shares of Verizon stock which had a closing price on that date of 51.54 dollars per share.
Verizon has asserted post-closing claims under the adjustments and other provisions of this agreement, which may result in additional payments by us
.
Subject to TracFone continuing to achieve certain operating metrics (earn-out), Verizon shall pay
up to
an additional US$650million in future cash consideration within two years from that date. See Note 2Ac.
Effects of the COVID-19 Pandemic
:The unprecedented health crisis arising from the COVID-19 pandemic has resulted in a severe global economic downturn and has caused significant volatility, uncertainty, and disruption.
The Company continues to closely
monitor
the evolution of the COVID-19 pandemic in the countries where
it operates
to take preventive measures to ensure the continuity of operations and safeguard the health and safety of personnel and customers.
During 2021, there were lockdowns and other measures implemented to control the spread of COVID-19 in
the
region of operations, resulting in the closure of shops and customer-care centers, the imposition of constraints on the mobility ofthe
clients and the disruption ofthe
supply chain for handsets and other equipment. In order to mitigate the effects of supply-chain disruption and handset scarcity, the Company
began ordering excess quantities of handsets in each country in which operate in October, November and December of 2021. Most major smartphonemanufacturers
were able to respond to increased handset orders.
The
investments in capital expenditures are expected to increaseto pre-pandemic levels in 2022.
2. Basis of Preparation of the Consolidated Financial Statements and Summary of Significant Accounting Policies and Practices
a) Basis of preparation
The accompanying consolidated financial statements have been prepared in conformity with International Financial Reporting Standards, as issued by the International Accounting Standards Board (“IASB”) (hereafter referred to as IFRS).
The consolidated financial statements have been prepared on the historical cost basis, except for the derivative financial instruments, the mobile telecommunications towers, the trust assets of post-employment and other employee benefit plans and the investments in equity at fair value through other comprehensive income (OCI), which are presented at their market value.
F-
11
Effective July 1, 2018, the Argentinian economy has been considered to be hyperinflationary in accordance with the criteria in IAS 29 “Financial Reporting in Hyperinflationary Economies” (“IAS 29”). Accordingly, for the Argentinian subsidiaries, we have included adjustments for hyperinflation and reclassifications as is required by the standard for purposes of presentation of IFRS in the consolidated financial statements.
The preparation of these consolidated financial statements under IFRS requires the use of critical estimates and assumptions that affect the amounts reported for certain assets, liabilities, income and expenses, including the main impact generated by the COVID-19 pandemic and the potential effect on the amounts disclosed in the consolidated financial statements.
It also requires that management exercise judgment in the application of the Company’s accounting policies. Actual results could differ from these estimates and assumptions.
The Mexican peso is the functional currency of the Company’s Mexican operations and the consolidated reporting currency of the Company.
i) Changes in Accounting Policies and Disclosures
As of December 31, 2020, the company changed its accounting policy to record the value of the passive infrastructure (towers) of its subsidiaries. With the change, this passive infrastructure was no longer recognized at historical cost and it began to be recognized under the revaluation model (market value). The company considers that the revaluation model represents the actual conditions of the industry of this class of assets and improves its financial position, this allows its shareholders and stakeholders to have the necessary financial information associated with market expectations about this class of assets.
ii) Basis of consolidation
The consolidated financial statements include the accounts of América Móvil, S.A.B. de C.V. and those subsidiaries over which the Company exercises control. The consolidated financial statements for the subsidiaries were prepared for the same period as the Company´s and applying consistent accounting policies. All of the subsidiary companies operate in the telecommunications sector or related.
Subsidiaries are entities over which the Company has control. Control is achieved when the Company has power over the investee, when it is exposed to, or has rights to, variable returns from its involvement with the investee, and has the ability to use its power over the investee to affect the amount of the investor’s returns. Subsidiaries are consolidated on a line-by-line basis from the date which control is achieved by the Company. The Company reassesses whether or not it controls an investee if facts and circumstances indicate that there are changes to one or more of the elements of control.
On March 6, 2020, in accordance with a resolution of the Federal Telecommunications Institute (Instituto Federal de Telecomunicaciones or IFT), the subsidiaries Teléfonos de México, S.A.B. de C.V. and Teléfonos del Noroeste, S.A. de C.V. created separate companies related to the wholesale services named Red Nacional Última Milla S.A.P.I. de C.V., Servicios de Telecomunicaciones Ultima Milla, S.A. de C.V. and Red Última Milla del Noroeste S.A.P.I. de C.V. The restructuring of Telmex has no impact
o
n the consolidated financial information of the Company.Changes in the Company’s ownership interests in a subsidiary that do not result in the Company losing control over the subsidiary are accounted for as equity transactions. The carrying amounts of the equity attributable to owners of the parent and non-controlling interests are adjusted to reflect the changes in their relative interests in the subsidiary. Any difference between the carrying amount of the non-controlling interests and the fair value of the consideration paid or received in the transaction is recognized directly in the equity attributable to the owners.
F-
12
Subsidiaries are deconsolidated from the date which control ceases. When the Company ceases to have control over a subsidiary, it derecognizes the assets (including any goodwill) and liabilities of the subsidiary at their carrying amounts, derecognizes the carrying amount of non-controlling interests in the former subsidiary and recognizes the fair value of any consideration received from the transaction. Any retained interest in the former subsidiary is then remeasured to its fair value.
All intra-Company balances and transactions, and any unrealized gains and losses arising from intra-Company transactions, are eliminated in preparing the consolidated financial statements.
Non-controlling interests represent the portion of profits or losses and net assets not held by the Company. Non-controlling interests are presented separately in the consolidated statements of comprehensive income and in equity in the consolidated statements of financial position separately from Company’s own equity.
Associates:
An associate is an entity over which the Company has significant influence. Significant influence is the power to participate in the financial and operating policy decisions of the investee but does not have control or joint control over those decisions.
The Company’s investment in associates includes goodwill identified on acquisition, net of any accumulated impairment losses.
The investments in associated companies in which the Company exercises significant influence are accounted for using the equity method, whereby Company recognizes its share in the net profit (losses) and equity of the associate.
The results of operations of the subsidiaries and associates are included in the Company’s consolidated financial statements beginning as of the month following their acquisition and its share of other comprehensive income after acquisition is recognized directly in other comprehensive income.
The Company assesses at each reporting date whether there is objective evidence that investment in associates is impaired. If so, the Company calculates the amount of impairment as the difference between the recoverable amount of the associate and its carrying value.
F-
13
The equity interest in the most significant subsidiaries at December 31, 2020 and 2021 is as follows:
Company name | Country | Equity interest at December 31 | ||||||||||
2020 | 2021 | |||||||||||
Subsidiaries: | ||||||||||||
América Móvil B.V. a) | Netherlands | 100.0 | % | 100.0 | % | |||||||
Compañía Dominicana de Teléfonos, S.A. (“Codetel”) b) | Dominican Republic | 100.0 | % | 100.0 | % | |||||||
Sercotel, S.A. de C.V. a) | Mexico | 100.0 | % | 100.0 | % | |||||||
Radiomóvil Dipsa, S.A. de C.V. and subsidiaries (“Telcel”) b) | Mexico | 100.0 | % | 100.0 | % | |||||||
Puerto Rico Telephone Company, Inc. b) | Puerto Rico | 100.0 | % | 100.0 | % | |||||||
Servicios de Comunicaciones de Honduras, S.A. de C.V. (“Sercom Honduras”) b) | Honduras | 100.0 | % | 100.0 | % | |||||||
TracFone Wireless, Inc. (“TracFone”) b) c) | USA | 100.0 | % | 0 | ||||||||
Claro S.A. (Claro Brasil) b) | Brazil | 98.2 | % | 98.2 | % | |||||||
NII Brazil Holding S.A.R.L a) | Luxembourg | 100.0 | % | 100.0 | % | |||||||
Nextel Telecomunicações Ltda b) | Brazil | 100.0 | % | 100.0 | % | |||||||
Telecomunicaciones de Guatemala, S.A. (“Telgua”) b) | Guatemala | 99.3 | % | 99.3 | % | |||||||
Claro Guatemala, S.A. b) | Guatemala | 100.0 | % | 100.0 | % | |||||||
Empresa Nicaragüense de Telecomunicaciones, S.A. (“Enitel”) b) | Nicaragua | 99.6 | % | 99.6 | % | |||||||
Compañía de Telecomunicaciones de El Salvador, S.A. de C.V. (“CTE”) b) | El Salvador | 95.8 | % | 95.8 | % | |||||||
Comunicación Celular, S.A. (“Comcel”) b) | Colombia | 99.4 | % | 99.4 | % | |||||||
Consorcio Ecuatoriano de Telecomunicaciones, S.A. (“Conecel”) b) | Ecuador | 100.0 | % | 100.0 | % | |||||||
AMX Argentina, S.A. b) | Argentina | 100.0 | % | 100.0 | % | |||||||
AMX Paraguay, S.A. b) | Paraguay | 100.0 | % | 100.0 | % | |||||||
AM Wireless Uruguay, S.A. b) | Uruguay | 100.0 | % | 100.0 | % | |||||||
Claro Chile, S.A. b) | Chile | 100.0 | % | 100.0 | % | |||||||
América Móvil Perú, S.A.C b) | Peru | 100.0 | % | 100.0 | % | |||||||
Claro Panamá, S.A. b) | Panamá | 100.0 | % | 100.0 | % | |||||||
Teléfonos de México, S.A.B. de C.V. b) | Mexico | 98.8 | % | 98.8 | % | |||||||
Telekom Austria AG b) | Austria | 51.0 | % | 51.0 | % | |||||||
| a) | Holding companies |
| b) | Operating companies of mobile and fixed services |
| c) | On November 23, 2021, this entity was discontinued operations. See Note 2Ac. |
iii) Basis of translation of financial statements of foreign subsidiaries and associated companies
The operating revenues of foreign subsidiaries jointly represent approximately 65%, 66% and 64% of consolidated operating revenues for the years ended December 31, 2019, 2020 and 2021, respectively, and their total assets jointly represent approximately 75% and 70% of consolidated total assets at December 31, 2020 and 2021, respectively.
The financial statements of foreign subsidiaries have been prepared under or converted to IFRS in the respective local currency (which is their functional currency) and then translated into the Company´s reporting currency as follows:
| • | all monetary assets and liabilities were translated at the closing exchange rate of the period; |
| • | all non-monetary assets and liabilities at the closing exchange rate of the period; |
F-1
4
| • | equity accounts are translated at the exchange rate at the time the capital contributions were made and the profits were generated; |
| • | revenues, costs and expenses are translated at the average exchange rate of the period, except for the operations of the subsidiaries in Argentina, whose economy is considered hyperinflationary since 2018; |
| • | the consolidated statements of cash flows presented using the indirect method were translated using the weighted-average exchange rate for the applicable period (except for Argentina), and the resulting difference is shown in the consolidated statements of cash flows under the heading “Adjustment to cash flows due to exchange rate fluctuations, net”. |
The basis of translation for the operations of the subsidiaries in Argentina are described:
In recent years, the Argentina economy has shown high rates of inflation. Although inflation data has not been consistent in recent years and several indexes have coexisted, inflation in Argentina indicates that the three-year cumulative inflation rate exceeded 100% in 2018, which is one of the quantitative references established by IAS 29. As a result, Argentina was considered a hyperinflationary economy in 2018 and the Company applies hyperinflation accounting to its subsidiary whose functional currency is the Argentine peso for financial information for periods ending on or after July 1, 2018, however the calculation of the cumulative impact was measured as of January 1, 2018.
In order to restate for hyperinflation its financial statements, the subsidiary used the series of indices defined by resolution JG No. 539/18 issued by the “Federación Argentina de Consejos Profesionales de Ciencias Económicas” (“FACPCE”), based on the National Consumer Price Index (IPC) published by the Instituto Nacional de Estadística y Censos (INDEC) of the Argentine Republic and the Wholesale Internal Price Index (IPIM) published by FACPCE. The cumulative index at December 31, 2021 is 582.4575, while on an annual inflation for 2021 is 50.9%.
The main implications are as follows:
| • | Adjustment of the historical cost of non-monetary assets and liabilities and equity items from their date of acquisition, or the date of inclusion in the consolidated statements of financial position, to the end of the year, in order to reflect changes in the currency’s purchasing power caused by inflation. |
| • | The gain on the net monetary position caused by the impact of inflation in the year is included in the consolidated statements of comprehensive income as part of the caption “ Valuation of derivatives, interest cost from labor obligations and other financial items, net ” . Items in the statement of comprehensive income and in the statements of cash flows are adjusted by the inflation index since their origination, with a balancing entry, and a reconciling item in the statements of cash flows, respectively. |
| • | All items in the financial statements of the Argentine company are translated at the closing exchange rate, which at December 31, 2020 and 2021 were 0.2371 and 0.2004, respectively, per argentine peso per Mexican peso. |
The difference resulting from the translation process is recognized in equity in the caption “Effect of translation of foreign entities”. At December 31, 2020 and 2021, the cumulative translation adjustment was Ps. (100,926,140) and Ps. (104,270,295), respectively.
b) Revenue recognition
The Company revenues are derived principally from providing the following telecommunications services and products: wireless voice, wireless data and value-added services, fixed voice, fixed data, broadband and IT services, Pay TV and over-the-top (“OTT”) services.
F-1
5
The Company provides fixed and mobile services. These services are offered independently in contracts with customers or together with the sale of handsets (mobile) under the postpaid model. In accordance with IFRS 15, the transaction price should be assigned to the different performance obligations based on their relative standalone selling price.
“Revenues from contracts with customers”
The Company with respect to the provided services, it has market observable information, to determine the standalone selling price of the services. On the other hand, in the case of the sale of bundled mobile phones sold (including service and handset) by the Company, the allocation of the sales is done based on their relative standalone selling price of each individual component related to the total bundled price. The result is that more equipment revenue is recognized at the moment of a sale and, therefore, less service revenue from the monthly fee is being recognized under IFRS 15.
The services provided by the Company are satisfied over the time of the contract period, given that the customer simultaneously receives and consumes the benefits provided by the Company.
Such service bundles, voice and data, accomplish the criteria mentioned in IFRS 15 of being substantially similar and of having the same transfer pattern which is why the Company concluded that the revenue from these different services offered to its customers are considered as a single performance obligation with revenue being recognized over time, except for sales of equipment.
Under IFRS 15, for those contracts with customers in which generally the sale of equipment and other electronic equipment is a single performance obligation, the Company recognizes the revenue at the moment when it transfers control to the customer which generally occurs when such goods are delivered.
The commissions are considered incremental contract acquisition costs that are capitalized and are amortized over the expected period of benefit, during the average duration of customer contracts.
Some subsidiaries have loyalty programs where the Company awards credits customer credit awards referred as “points”. The customer can redeem accrued “points” for awards such as devices, accessories or airtime. The Company provides all awards. The consideration allocated to the award credits is identified as a separate performance obligation; the corresponding liability of the award credits is measured at its fair value. The consideration allocated to award credits amount is recognized as a contract liability until the points are redeemed. Revenue is recognized upon redemption of products by the customer.
c) Cost of sales
The cost of mobile equipment and computers is recognized at the time the client and distributor receive the device which is when the control is are transferred to the customer.
d) Cost of services
The cost of services represents the costs incurred to properly deliver the services to the customers, it includes the network operating costs and licenses related costs and is accounted at the moment in which such services are provided.
e) Commissions to distributors
The Company pays commissions to its distributors different than those that acquire customers. Such commissions are recognized inin the consolidated statements of comprehensive income at the time in which the distributor either reports an activation or reaches certain number of lines activated or obtained at a certain point of time.
“commercial, administrative and general expenses”
F-1
6
f) Cash and cash equivalents
Cash and cash equivalents represent bank deposits and liquid investments with maturities of less than three months. These amounts are stated at cost plus accrued interest, which is similar to their market value.
The Company also maintains restricted cash held as collateral to meet certain contractual obligations. Restricted cash is presented as part of “Other assets” within other non-current financial assets given that the restrictions are long-term in nature. See Note 9.
g) Equity investments at fair value through OCI and other short/long-term investments
Equity investments at fair value through OCI and other short-term investments are primarily composed of equity investments and other short-term financial investments. Amounts are initially recorded at their estimated fair value. Fair value adjustments for equity investments are recorded through other comprehensive income, and other short-term investment.
h) Inventories
Inventories are initially recognized at historical cost and are valued using the average cost method without exceeding their net realizable value.
The estimate of the realizable value of inventories on-hand is based on their age and turnover.
i) Business combinations and goodwill
Business combinations are accounted for using the acquisition method, which in accordance with IFRS 3, “”, consists in general terms as follows:
Business acquisitions
| (i) | Identify the acquirer |
| (ii) | Determine the acquisition date |
| (iii) | Value the acquired identifiable assets and assumed liabilities |
| (iv) | Recognize the goodwill or a bargain purchase gain |
For acquired subsidiaries, goodwill represents the difference between the purchase price and the fair value of the net assets acquired at the acquisition date. The investment in acquired associates includes goodwill identified on acquisition, net of any impairment loss.
Goodwill is reviewed annually to determine its recoverability or more often if circumstances indicate that the carrying value of the goodwill might not be fully recoverable.
The possible loss of value in goodwill is determined by analyzing the recovery value of the cash generating unit (or the group thereof) to which the goodwill is associated at the time it was originated. If this recoverable amount is lower than the carrying value, an impairment loss is charged to the results of operations. The recoverable amount is determined based on the higher of fair value less cost of disposal or value in use.
For the years ended December 31, 2019, 2020 and 2021, 0 impairment losses were recognized for goodwill.
j) Property, plant and equipment
i) Property, plant and equipment are recorded at acquisition cost, net of accumulated depreciation; except for the passive infrastructure of telecommunications towers, which are recognized under the revaluation model as of December 31, 2020. Depreciation is computed on the cost of assets using the straight line method, based on the estimated useful lives of the related assets, beginning the month after they become available for use.
F-1
7
Borrowing costs that are incurred for general financing for construction in progress for periods exceeding six months are capitalized as part of the cost of the asset. During the years ended December 31, 2019, 2020 and 2021, borrowing costs that were capitalized amounted to Ps. 2,233,358, Ps. 1,771,613 and Ps.1,527,259 respectively.
In addition to the purchase price and costs directly attributable to preparing an asset in terms of its physical location and condition for operating as intended by management, when required, the cost also includes the estimated costs of dismantling and removal of the asset and for restoration of the site where it is located. See Note 16c.
The passive infrastructure of telecommunications towers will be recorded at revalued value, which is its fair value at the time of revaluation less accumulated depreciation; if there is any loss or impairment, it must also be considered within its value. The revaluations will be calculated with sufficient regularity to ensure that the book value, every time, does not differ significantly from that which could be determined using the fair value at the end of the reporting period.
The increase resulting from a revaluation is recorded in other comprehensive income (OCI) and is accumulated in equity as a revaluation surplus. To the extent that there is a decrease in revaluation, it will be recognized in profit or loss, except to the extent that it compensates for an existing surplus on the same asset.
An annual transfer of the asset revaluation surplus and accumulated earnings is made to the extent that the asset is used, therefore, the surplus is equal to the difference between the depreciation calculated on the revalued value and the one calculated according to its original cost. These transfers do not record in the results for the period. A total transfer of the surplus may be made when the entity disposes of the asset.
ii) The net book value of property, plant and equipment is removed from the consolidated statements of financial position at the time the asset is sold or when no future economic benefits are expected from its use or sale. Any gains or losses on the sale of property, plant and equipment represent the difference between net proceeds of the sale and the net book value of the item at the time of sale. These gains or losses are recognized as either other operating income or other operating expenses upon sale.
iii) The Company periodically assesses the residual values, useful lives and depreciation methods associated with its property, plant and equipment. If necessary, the effects of any changes in accounting estimates is recognized prospectively, at the closing of each period, in accordance with IAS 8, “”.
Accounting Policies, Changes in Accounting Estimates and Errors
For property, plant and equipment made up of several components with different useful lives, the major individual components are depreciated over their individual useful lives. Maintenance costs and repairs are expensed as incurred.
Annual depreciation rates are as follows:
Network infrastructure | 5%-33% | |||
Buildings and leasehold improvement | 2%-33% | |||
Other assets | 10%-50% |
iv) The carrying value of property, plant and equipment is reviewed if there are indicators of impairment in such assets. If an asset’s recovery value is less than the asset’s net carrying value, the difference is recognized as an impairment loss.
During the years ended December 31, 2019, 2020 and 2021, 0 impairment losses were recognized.
F-1
8
v) Spare parts for network operation are recognized at cost.
The valuation of inventory for network considered obsolete, defective or slow-moving, is reduced to their estimated net realizable value. The estimate of the recovery value of inventories is based on their age and turnover.
k) Intangibles
i) Licenses
Licenses to operate wireless telecommunications networks granted by the governments of the countries in which the Company operates are recorded at acquisition cost or at fair value at their acquisition date, net of accumulated amortization. Certain licenses require payments to the governments, such payments are recognized in the cost of service and equipment.
The licenses that in accordance with government requirements are categorized as automatically renewable, for a nominal cost and with substantially consistent terms, are considered by the Company as intangible assets with an indefinite useful life. Accordingly, they are not amortized. Licenses are amortized when the Company does not have a basis to conclude that they are indefinite lived. Licenses are amortized using the straight-line method over a period ranging from 3 to 30 years, which represents the usage period of the assets.
The Company has conducted an internal analysis on the applicability of the International Financial Reporting Interpretation Committee (“IFRIC”) No. 12 (Service Concession Agreements) and has concluded that its concessions are outside the scope of IFRIC 12. To determine the applicability of IFRIC 12, the Company analyzes each concession or group of similar concessions in a given jurisdiction. As a threshold matter, the Company identifies those government concessions that provide for the development, financing, operation or maintenance of infrastructure used to render a public service, and that set out performance standards, mechanisms for adjusting prices and arrangements for arbitrating disputes.
With respect to those services, the Company evaluates whether the grantor controls or regulates (i) what services the operator must provide, (ii) to whom it must provide them and (iii) the applicable price (the “Services Criterion”). In evaluating whether the applicable government, as grantor, controls the price at which the Company provides its services, the Company looks at the terms of the concession agreement according to all applicable regulations. If the Company determines that the concession under analysis meets the Services Criterion, then the Company evaluates whether the grantor would hold a significant residual interest in the concession’s infrastructure at the end of the term of the arrangement.
ii) Trademarks
Trademarks acquired are measured on initial recognition at cost. The cost of trademarks acquired in a business combination is their fair value at the date of acquisition. The useful lives of trademarks are assessed as either definite or indefinite. Trademarks with finite useful lives are amortized using the straight-line method over a period ranging from 1 to 10 years. Trademarks with indefinite useful lives are not amortized but are tested for impairment annually at the cash generating unit level. The assessment of indefinite life is reviewed annually to determine whether the indefinite life continues to be supportable, if not, the change in useful life from indefinite to definite is made on a prospective basis.
iii) Irrevocable rights of use
Irrevocable rights of use are recognized according to the amount paid for the right and are amortized over the period in which they are granted.
F-1
9
The carrying values of the Company’s licenses and trademarks are reviewed annually and whenever there are indicators of impairment in the value of such assets. When an asset’s recoverable amount, which is the higher of the asset’s fair value, less disposal costs and its value in use (the present value of future cash flows), is less than the asset’s carrying value, the difference is recognized as an impairment loss.
iv) Customer relationships
The value of customer relations is determined and valued at the time that a new subsidiary is acquired, as determined by the Company with the assistance of independent appraisers and is amortized over a 5-year period.
During the years ended December 31, 2019, 2020 and 2021, 0 significant impairment losses were recognized for licenses, trademarks, irrevocable rights of use or customer relationships.
l) Impairment in the value of long-lived assets
The Company assesses the existence of indicators of impairment in the carrying value of long-lived assets, investments in associates, goodwill and intangible assets according to IAS 36 “”. When there are such indicators, or in the case of assets whose nature requires an annual impairment analysis (goodwill and intangible assets with indefinite useful lives), the Company estimates the recoverable amount of the asset, which is the higher of its fair value, less disposal costs, and its value in use. Value in use is determined by discounting estimated future cash flows, applying a pre-tax discount rate that reflects the time value of money and taking into consideration the specific risks associated with the asset. When the recoverable amount of an asset is below its carrying value, impairment is considered to exist. In this case, the carrying value of the asset is reduced to the asset’s recoverable amount, recognizing the loss in results of operations for the respective period. Depreciation and/or amortization expense of future periods is adjusted based on the new carrying value determined for the asset over the asset’s remaining useful life. Impairment is computed individually for each asset. Recoverable amount is determined for an individual asset, unless the asset does not generate cash inflows that are largely independent of those from other assets or group of assets.
Impairment of assets
In the estimation of impairments, the Company uses the strategic plans established for the separate cash-generating units to which the assets are assigned. Such strategic plans generally cover a period from 3 to 5 years. For longer periods, beginning in the fifth year, projections are based on such strategic plans while applying a constant or declining expected perpetual growth rate.
Key assumptions used in value in use calculations
The forecasts are made in real terms (net of inflation) and in the functional currency of the subsidiary as of December 31, 2021. Financial forecasts, premises and assumptions are similar to what any other market participant in similar conditions would consider
, including the impact of the COVID-19 pandemic.
Local synergies, that any other market participant would not have taken into consideration to prepare similar forecasted financial information, have not been included.
The assumptions used to develop the financial forecasts were validated for each of the cash generating units (“CGUs”), typically identified by country and by service (in the case of Mexico) taking into consideration the following:
| • | Current subscribers and expected growth. |
| • | Type of subscribers (prepaid, postpaid, fixed line, multiple services) |
| • | Market environment and penetration expectations |
| • | New products and services |
F-
20
| • | Economic environment of each country |
| • | Expenses for maintaining the current assets |
| • | Investments in technology for expanding the current assets |
| • | Market consolidation and synergies |
The foregoing forecasts could differ from the results obtained through time; however, the Company prepares its estimates based on the current situation of each of the CGUs.
The recoverable amounts are based on value in use. The value in use is determined based on the method of discounted cash flows. The key assumptions used in projecting cash flows are:
| • | Margin on EBITDA is determined by dividing EBITDA (operating income plus depreciation and amortization) by total revenues. |
| • | Margin on CAPEX is determined by dividing capital expenditures (“CAPEX”) by total revenues. |
| • | Pre-tax weighted average cost of capital (“WACC”) is used to discount the projected cash flows. |
As discount rate, the Company uses the WACC which was determined for each of the cash generating units and is described in the following paragraphs.
The estimated discount rates to perform the IAS 36 “”, impairment test for each CGU consider market participants assumptions. Market participants were selected taking into consideration size, operations and characteristics of the business that were similar to those of Company.
Impairment of assets
These discount rates do not include inflation.
The discount rates represent the current market assessment of the risks specific to each CGU, taking into consideration the time value of money and individual risks of the underlying assets that have not been incorporated in the cash flow estimates. The discount rate calculation is based on the specific circumstances of the Company and its operating segments. The WACC takes into account both debt and equity costs. The cost of equity is derived from the expected return on investment for each GCU. The cost of debt is based on the interest-bearing borrowings the Company is obliged to service. Segment-specific risk is incorporated by applying individual beta factors.
The beta factors are evaluated annually based on publicly available market data.
Market participant assumptions are important because, not only do they include industry data for growth rates, but also management assesses how the CGU’s position, relative to its competitors, might change over the forecasted period.
F-
21
The most significant forward-looking estimates used for the 2020 and 2021 impairment evaluations are shown below:
Average margin on EBIDTA | Average margin on CAPEX | Average pre-tax discount rate (WACC) | ||||||||||
2020: | ||||||||||||
Europe (7 countries) | 32.20% - 40.76% | 7.04% - 19.39% | 3.88% - 12.02% | |||||||||
Brazil (fixed line, wireless and TV) | 40.67% | 25.36% | 9.50% | |||||||||
Puerto Rico | 23.06% | 14.57% | 3.53% | |||||||||
Dominican Republic | 47.57% | 13.71% | 8.27% | |||||||||
Mexico (fixed line and wireless) | 32.69% | 11.01% | 6.03% | |||||||||
Ecuador | 49.23% | 11.14% | 17.50% | |||||||||
Peru | 38.72% | 15.43% | 4.76% | |||||||||
El Salvador | 45.92% | 21.19% | 14.63% | |||||||||
Chile | 26.34% | 13.18% | 3.37% | |||||||||
Colombia | 43.45% | 18.19% | 6.44% | |||||||||
Other countries | 10.07% - 47.23% | 0.48% - 31.67% | 3.42% - 21.85% | |||||||||
2021: | ||||||||||||
Europe (7 countries) | 31.60% - 45.32% | 7.48% - 24.37% | 2.91% - 9.83% | |||||||||
Brazil (fixed line, wireless and TV) | 41.37% | 22.98% | 4.62% | |||||||||
Puerto Rico | 21.54% | 14.36% | 3.00% | |||||||||
Dominican Republic | 52.02% | 13.86% | 5.84% | |||||||||
Mexico (fixed line and wireless) | 36.21% | 15.89% | 6.24% | |||||||||
Ecuador | 44.76% | 12.48% | 14.48% | |||||||||
Peru | 36.63% | 17.19% | 3.99% | |||||||||
El Salvador | 44.82% | 24.25% | 10.78% | |||||||||
Chile | 27.36% | 17.98% | 2.81% | |||||||||
Colombia | 43.36% | 23.18% | 7.18% | |||||||||
Other countries | 30.55% - 48.52% | 4.91% - 30.03% | 4.64% - 14.39% | |||||||||
Sensitivity to changes in assumptions:
The implications of the key assumptions for the recoverable amount are discussed below:
Margin on CAPEX- The Company performed a sensitivity analysis by increasing its CAPEX by 5% and maintaining all other assumptions the same
,
results without impairment.WACC- Additionally, should the Company increase by 50 base points in WACC per CGU and maintain all other assumptions the same, results without impairment.
m
Right-of-use assets
The Company applies a single recognition and measurement approach for all leases, except for short-term leases and leases of low-value assets. The Company recognizes lease liabilities to make lease payments and right-of-use assets representing the right to use the underlying assets.
| i) | Right-of-use assets |
The Company recognizes right-of-use assets at the commencement date of the lease (i.e., the date the underlying asset is available for use). Right-of-use assets are measured at cost, less any accumulated depreciation and impairment losses, and adjusted for any remeasurement of lease liabilities. The cost of right-of-use assets includes the amount of lease liabilities recognized, initial direct costs incurred, and lease payments made at or
F-
22
before the commencement date less any lease incentives received. Right-of-use assets are depreciated on a straight-line basis over the shorter of the lease term and the estimated useful lives of the assets, as follows:
| Assets | Useful life | |
Towers and sites | 5 to 12 years | |
Property | 10 to 25 years | |
Other equipment | 5 to 15 years |
The right-of-use assets are also subject to impairment test.
| ii) | Lease liabilities. |
At the commencement date of the lease, the Company recognizes the lease liabilities measured at the present value of the lease payments to be made over the lease term. Lease payments include fixed payments (including in-substance fixed payments) less any lease incentives receivable, variable lease payments that depend on an index or rate, and amounts expected to be paid under residual value guarantees. The lease payments also include payments of penalties for early termination of the lease, if the term of the lease reflects that the Company exercises the option to terminate early. The variable lease payments that do not depend on an index or a rate are recognized as an expense in the period on which the event or condition that triggers the payment occurs.
In calculating the present value of the lease payments, the Company uses an incremental borrowing rate at the lease commencement date, if the interest rate implicit in the lease is not readily determinable. After the commencement date, the amount of lease liabilities is increased to reflect the accretion of interest and reduced for the lease payments made. In addition, the carrying amount of the lease liabilities is remeasured if there is a modification, a change in the lease term, a change in the in-substance fixed payments or change in the assessment to purchase the underlying asset.
| iii) | Short-term leases and leases of low value assets. |
The Company applies the short-term lease recognition exemption for its leases of machinery and equipment (i.e., those leases that have a lease term of 12 months or less from the commencement date and do not contain a purchase option). It also applies the recognition exemption lease of low-value assets (that is, below US$ 5,000). Short-term lease payments and leases of low-value assets are recognized as expenses on straight-line basis over the lease term.
n) Financial assets and liabilities
Financial assets
Initial recognition and measurement
Financial assets are classified, at initial recognition, as subsequently measured at amortized cost, fair value through other comprehensive income (OCI), and fair value through profit or loss.
The classification of financial assets at initial recognition depends on the financial asset’s contractual cash flow characteristics and the Company’s business model for managing them, with the exception of trade receivables that do not contain a significant financing component or for which the Company has applied the practical expedient, the Company initially measures a financial asset at its fair value plus, in the case of a financial asset not at fair value through profit or loss, transaction costs.
Subsequent measurement
For purposes of subsequent measurement, financial assets are classified in four categories:
| • | Financial assets at amortized cost (debt instruments) |
F-
23
| • | Financial assets at fair value through OCI with recycling of cumulative gains and losses (debt instruments) |
| • | Financial assets designated at fair value through OCI with no recycling of cumulative gains and losses upon derecognition (equity instruments) |
| • | Financial assets at fair value through profit or loss |
Financial assets at amortized cost (debt instruments)
The Company measures financial assets at amortized cost if both of the following conditions are met:
| • | The financial asset is held within a business model with the objective to hold financial assets in order to collect contractual cash flows, and |
| • | The contractual terms of the financial asset give rise on specified dates to cash flows that are solely payments of principal and interest on the principal amount outstanding |
Financial assets at amortized cost are subsequently measured using the effective interest (EIR) method and are subject to impairment. Gains and losses are recognized in profit or loss when the asset is derecognized, modified or impaired.
The Company’s financial assets at amortized cost includes cash equivalents, loans and receivables.
Financial assets at fair value through OCI with recycling of cumulative gains and losses (debt instruments)
The Company measures debt instruments at fair value through OCI if both of the following conditions are met:
| • | The financial asset is held within a business model with the objective of both holding to collect contractual cash flows and selling, and |
| • | The contractual terms of the financial asset give rise on specified dates to cash flows that are solely payments of principal and interest on the principal amount outstanding |
For debt instruments at fair value through OCI, interest income, foreign exchange revaluation and impairment losses or reversals are recognized in the statements of profit or loss and computed in the same manner as for financial assets measured at amortized cost. The remaining fair value changes are recognized in OCI. Upon derecognition, the cumulative fair value change recognized in OCI is recycled to profit or loss.
Financial assets designated at fair value through OCI with no recycling of cumulative gains and losses upon derecognition (equity instruments)
Upon initial recognition, the Company can elect to classify irrevocably its equity investments as equity instruments designated at fair value through OCI when they meet the definition of equity under IAS 32 Financial Instruments: Presentation and are not held for trading. The classification is determined on an instrument by instrument basis.
Gains and losses on these financial assets are never recycled to profit or loss. Dividends are recognized as other income in the statements of profit or loss when the right of payment has been established, except when the Company benefits from such proceeds as a recovery of part of the cost of the financial asset, in which case, such gains are recorded in OCI. Equity instruments designated at fair value through OCI are not subject to impairment assessment.
Financial assets at fair value through profit or loss
Financial assets at fair value through profit or loss include financial assets held for trading, financial assets designated upon initial recognition at fair value through profit or loss, or financial assets mandatorily required to
F-2
4
be measured at fair value. Financial assets are classified as held for trading if they are acquired for the purpose of selling or repurchasing in the near term. Derivatives, including separated embedded derivatives, are also classified as held for trading unless they are designated as effective hedging instruments. Financial assets with cash flows that are not solely payments of principal and interest are classified and measured at fair value through profit or loss, irrespective of the business model. Notwithstanding the criteria for debt instruments to be classified at amortized cost or at fair value through OCI, as described above, debt instruments may be designated at fair value through profit or loss on initial recognition if doing so eliminates, or significantly reduces, an accounting mismatch.
Financial assets at fair value through profit or loss are carried in the statements of financial position at fair value with net changes in fair value recognized in the consolidated statements of comprehensive income within “Valuation of derivatives, interest cost from labor obligations and other financial items”.
Derecognition of financial assets
A financial asset is primarily derecognized when:
| • | The rights to receive cash flows from the asset have expired, or |
| • | The Company has transferred its rights to receive cash flows from the asset or has assumed an obligation to pay the received cash flows in full without material delay to a third party under a ‘pass-through’ arrangement; and either (a) the Company has transferred substantially all the risks and rewards of the asset, or (b) the Company has neither transferred nor retained substantially all the risks and rewards of the asset, but has transferred control of the asset |
When the Company has transferred its rights to receive cash flows from an asset or has entered into a passthrough arrangement, it evaluates if, and to what extent, it has retained the risks and rewards of ownership. When it has neither transferred nor retained substantially all the risks and rewards of the asset, nor transferred control of the asset, the Company continues to recognize the transferred asset to the extent of its continued involvement. In that case, the Company also recognizes an associated liability. The transferred asset and the associated liability are measured on a basis that reflects the rights and obligations that the Company has retained.
Impairment of financial assets
The Company recognizes an allowance for expected credit losses (ECLs) for all debt instruments not held at fair value through profit or loss. ECLs are based on the difference between the contractual cash flows due in accordance with the contract and all the cash flows that the Company expects to receive, discounted at an approximation of the original effective interest rate. The expected cash flows will include cash flows from the sale of collateral held or other credit enhancements that are integral to the contractual terms.
ECLs are recognized in two stages. For credit exposures for which there has not been a significant increase in credit risk since initial recognition, ECLs are provided for credit losses that result from default events that are possible within the next 12-months (a 12-month ECL). For those credit exposures for which there has been a significant increase in credit risk since initial recognition, a loss allowance is required for credit losses expected over the remaining life of the exposure, irrespective of the timing of the default (a lifetime ECL).
For some trade receivables and contract assets, the Company applies the simplified approach in calculating ECLs. Therefore, the Company does not track changes in credit risk, but instead recognizes a loss allowance based on lifetime ECLs at each reporting date. The Company has established athat is based on its historical credit loss experience, adjusted for forward-looking factors specific to the debtors and the economic environment, including the impact by the COVID-19 pandemic.
based on available information
loss rate approach
F-2
5
Financial liabilities
Initial recognition
Financial liabilities are classified, at initial recognition, as financial liabilities at fair value through profit or loss, loans and borrowings, payables, or as derivatives designated as hedging instruments in an effective hedge, as appropriate.
All financial liabilities are recognized initially at fair value and, in the case of loans and borrowings and payables, net of directly attributable transaction costs.
The Company’s financial liabilities include trade and other payables, loans and borrowings including bank overdrafts, and derivative financial instruments.
Subsequent measurement
The measurement of financial liabilities depends on their classification, as described below:
Financial liabilities at fair value through profit or loss financial liabilities at fair value through profit or loss include financial liabilities held for trading and financial liabilities designated upon initial recognition as at fair value through profit or loss.
Financial liabilities are classified as held for trading if they are incurred for the purpose of repurchasing in the near term. This category also includes derivative financial instruments entered into by the Company that are not designated as hedging instruments in hedge relationships as defined by IFRS 9. Separated embedded derivatives are also classified as held for trading unless they are designated as effective hedging instruments.
Gains or losses on liabilities held for trading are recognized in the statements of profit or loss.
Financial liabilities designated upon initial recognition at fair value through profit or loss are designated at the initial date of recognition, and only if the criteria in IFRS 9 are satisfied. The Company has not designated any financial liability as at fair value through profit or loss.
Loans and borrowings
After initial recognition, interest-bearing loans and borrowings are subsequently measured at amortized cost using the EIR method. Gains and losses are recognized in profit or loss when the liabilities are derecognized as well as through the EIR amortization process.
Amortized cost is calculated by taking into account any discount or premium on acquisition and fees or costs that are an integral part of the EIR. The EIR amortization is included as finance costs in the statements of profit or loss.
Derecognition of financial liabilities
A financial liability is derecognized when the obligation under the liability is discharged, cancelled or expires. When an existing financial liability is replaced by another from the same lender on substantially different terms, or the terms of an existing liability are substantially modified, such an exchange or modification is treated as the derecognition of the original liability and the recognition of a new liability. The difference in the respective carrying amounts is recognized in the consolidated statements of comprehensive income.
Offsetting of financial instruments
Financial assets and financial liabilities are offset and the net amount is reported in the consolidated statements of financial position if there is a currently enforceable legal right to offset the recognized amounts and there is an intention to settle on a net basis, to realize the assets and settle the liabilities simultaneously.
F-26
o) Transactions in foreign currency
Transactions in foreign currency are initially recorded at the prevailing exchange rate at the time of the related transactions. Foreign currency denominated assets and liabilities are subsequently translated at the prevailing exchange rate at the financial statements reporting date. Exchange differences determined from the transaction date to the time foreign currency denominated assets and liabilities are settled or translated at the financial statements reporting date are charged or credited to the results of operations.
In determining the spot exchange rate to use on initial recognition of the related asset, expense or income (or part of it) on the derecognition of a non-monetary asset or non-monetary liability relating to advance consideration, the date of the transaction is the date on which the Company initially recognizes the non-monetary asset or non-monetary liability arising from the advance consideration. If there are multiple payments or receipts in advance, the Company determines the transaction date for each payment or receipt of advance consideration.
The exchange rates used for the translation of foreign currencies against the Mexican peso are as follows:
Average exchange rate | Closing exchange rate at December 31, | |||||||||||||||||||||
Country or Zone | Currency | 2019 | 2020 | 2021 | 2020 | 2021 | ||||||||||||||||
| Argentina (1) | Argentine Peso (AR$) | 0.4110 | 0.3070 | 0.2137 | 0.2371 | 0.2004 | ||||||||||||||||
| Brazil | Real (R$) | 4.8907 | 4.1850 | 3.7625 | 3.8387 | 3.6885 | ||||||||||||||||
| Colombia | Colombian Peso (COP$) | 0.0059 | 0.0058 | 0.0054 | 0.0058 | 0.0052 | ||||||||||||||||
| Guatemala | Quetzal | 2.5023 | 2.7826 | 2.6212 | 2.5596 | 2.6666 | ||||||||||||||||
| U.S.A. (2) | US Dollar | 19.2641 | 21.4860 | 20.2769 | 19.9487 | 20.5835 | ||||||||||||||||
| Uruguay | Uruguay Peso | 0.5479 | 0.5110 | 0.4655 | 0.4712 | 0.4605 | ||||||||||||||||
| Nicaragua | Cordoba | 0.5817 | 0.6257 | 0.5765 | 0.5728 | 0.5795 | ||||||||||||||||
| Honduras | Lempira | 0.7806 | 0.8678 | 0.8384 | 0.8215 | 0.8396 | ||||||||||||||||
| Chile | Chilean Peso | 0.0275 | 0.0271 | 0.0268 | 0.0281 | 0.0244 | ||||||||||||||||
| Paraguay | Guaraní | 0.0031 | 0.0032 | 0.0030 | 0.0029 | 0.0030 | ||||||||||||||||
| Peru | Sol (PEN$) | 5.7708 | 6.1483 | 5.2297 | 5.5046 | 5.1484 | ||||||||||||||||
| Dominican Republic | Dominican Peso | 0.3737 | 0.3766 | 0.3540 | 0.3416 | 0.3570 | ||||||||||||||||
| Costa Rica | Colon | 0.0326 | 0.0366 | 0.0325 | 0.0323 | 0.0319 | ||||||||||||||||
| European Union | Euro | 21.5642 | 24.5080 | 23.9835 | 24.3693 | 23.4220 | ||||||||||||||||
| Bulgaria | Lev | 11.0257 | 12.5284 | 12.2617 | 12.4594 | 11.9762 | ||||||||||||||||
| Belarus | New Belarusian Ruble | 9.2159 | 8.8172 | 7.9932 | 7.5721 | 8.0279 | ||||||||||||||||
| Croatia | Croatian Kuna | 2.9069 | 3.2498 | 3.1852 | 3.2279 | 3.1161 | ||||||||||||||||
| Macedonia | Macedonian Denar | 0.3504 | 0.3975 | 0.3893 | 0.3950 | 0.3800 | ||||||||||||||||
| Serbia | Serbian Denar | 0.1830 | 0.2083 | 0.2040 | 0.2071 | 0.1992 | ||||||||||||||||
| (1) | Year-end rates are used for the translation of revenues and expenses if IAS 29 “Financial Reporting in Hyperinflationary Economies” |
Financial reporting in hyperinflationary economies
Financial statements of Argentina subsidiaries are restated before translation to the reporting currency of the Company and before consolidation in order to reflect the same value of money for all items. Items recognized in the statements of financial position which are not measured at the applicable year-end measuring unit are restated based on the general price index. All non-monetary items measured at cost or amortized cost is restated for the changes in the general price index from the date of transaction or the last hyperinflationary calculation to the reporting date. Monetary items are not restated. All items of shareholders’ equity are restated for the changes in the general price index since their addition or the last hyperinflationary calculation until the end of the reporting period. All items of comprehensive income are restated for the change in a general price index from the date of initial recognition to the reporting date. Gains and losses resulting from the net-position of monetary items are reported in the consolidated
F-2
7
statements of operations in financial result in exchange differences. In accordance with IFRS, prior year financial statements were not restated.
| (2) | Includes U.S.A., Ecuador, El Salvador, Puerto Rico and Panama. |
The exchange rate between the US dollar and Mexican Peso for April 28, 2022 was 20.3560 per US dollar, which represents an appreciation of 1.11% as compared to December 31, 2021.
p) Accounts payable, accrued liabilities and provisions
Liabilities are recognized whenever (i) the Company has current obligations (legal or assumed) resulting from a past event, (ii) when it is probable the obligation will give rise to a future cash disbursement for its settlement, and (iii) the amount of the obligation can be reasonably estimated.
When the effect of the time value of money is significant, the amount of the liability is determined as the present value of the expected disbursements to settle the obligation. The discount rate is determined on a pre-tax basis and reflects current market conditions at the financial statements reporting date and, where appropriate, the risks specific to the liability. Where discounting is used, an increase in the liability is recognized as finance expense.
Contingent liabilities are recognized only when it is probable, they will give rise to a future cash disbursement for their settlement.
q) Employee benefits
The Company has defined benefit pension plans for its subsidiaries Puerto Rico Telephone Company, Teléfonos de Mexico, Claro Brasil, and Telekom Austria. Claro Brasil also has medical plans and defined contribution plans and Telekom Austria provides retirement benefits to its employees under a defined contribution plan. The Company recognizes the costs of these plans based upon independent actuarial computations and are determined using the projected unit credit method. The latest actuarial computations were prepared as of December 31, 2021.
Mexico
Mexican subsidiaries have the obligation to pay seniority premiums to personnel based on the Mexican Federal Labor Law which also establishes the obligation to make certain payments to personnel who cease to provide services under certain circumstances. Pensions (for Telmex) and seniority premiums are determined based on the salary of employees in their final year of service, the number of years worked at and their age at the moment of retirement.
The costs of pensions, seniority premiums and severance benefits, are recognized based on calculations by independent actuaries using the projected unit credit method using financial hypotheses, net of inflation.
Telmex has established an irrevocable trust fund and makes annual contributions to that fund.
Puerto Rico
In Puerto Rico, the Company has noncontributing pension plans for full-time employees, which are tax qualified as they meet Employee Retirement Income Security Act of 1974 requirements.
The pension benefit is composed of two elements:
(i) An employee receives an annuity at retirement if they meet the rule of 85 (age at retirement plus accumulated years of service). The annuity is calculated by applying a percentage times year of services to the last three years of salary.
F-2
8
(ii) The second element is a lump-sum benefit based on years of service ranging from 9 to 12 months of salary. Health care and life insurance benefits are also provided to retirees under a separate plan (post-retirement benefits).
Brazil
Claro Brasil provides a defined benefit plan and post-retirement medical assistance plan, and a defined contribution plan, through a pension fund that supplements the government retirement benefit for certain employees.
Under the defined benefit plan, the Company makes monthly contributions to the pension fund equal to 17.5%
of the employee’s aggregate salary. In addition, the Company contributes a percentage of the aggregate salary base for funding the post-retirement medical assistance plan for the employees who remain in the defined benefit plan. Each employee makes contributions to the pension fund based on age and salary. All newly hired employees automatically adhere to the defined contribution plan and no further admittance to the defined benefit plan is allowed. For the defined contribution plan. See Note 18.
Austria
Telekom Austria provides retirement benefits to its employees under defined contribution and defined benefit plans.
The Company pays contributions to publicly or privately administered pension or severance insurance plans on mandatory or contractual basis. Once the contributions have been paid, the Company has no further payment obligations. The regular contributions are recognized as employee expenses in the year in which they are due.
All other employee benefit obligations provided in Austria are unfunded defined benefit plans for which the Company records provisions which are calculated using the projected unit credit method. The future benefit obligations are measured using actuarial methods on the basis of an appropriate assessment of the discount rate, rate of employee turnover, rate of compensation increase and rate of increase in pensions.
For severance and pensions, the subsidiary recognizes actuarial gains and losses in other comprehensive income. The re-measurement of defined benefit plans relates to actuarial gains and losses only as Telekom Austria holds no plan assets. Interest expense related to employee benefit obligations is reported in “Valuation of derivatives, interests cost from labor obligation and other financial items, net” in the statements of comprehensive income.
Other subsidiaries
For the rest of the Company’s subsidiaries, there are no defined benefit plans or compulsory defined contribution structures. However, certain subsidiaries make contributions to national pension, social security and severance plans in accordance with the percentages and rates established by the applicable social security and labor laws of each country. Such contributions are made to the entities designated by the countries legislation and are recorded as direct labor expenses in the consolidated statements of comprehensive income as they are incurred.
Remeasurements of defined benefit plans, comprising of actuarial gains and losses, the effect of the asset ceiling, excluding net interest and the return on plan assets (excluding net interest), are recognized immediately in the consolidated statements of financial position with a corresponding debit or credit to retained earnings through OCI in the period in which they occur. Re-measurements are not reclassified to profit or loss in subsequent periods.
Past service costs are recognized in profit or loss on the earlier of:
| (i) | The date of the plan amendment or curtailment, and |
F-2
9
| (ii) | The date that the Company recognizes restructuring-related costs |
Net interest on liability for defined benefits is calculated by applying the discount rate to the net defined benefit liability or asset and it is recognized in the “valuation of derivatives, interest cost from labor obligations and other financial items” in the consolidated statements of comprehensive income. The Company recognizes the changes in the net defined benefit obligation under “Cost of sales and services” and “Commercial, administrative and general expenses” in the consolidated statements of comprehensive income.
Paid absences
The Company recognizes a provision for the cost of paid absences, such as vacation time, based on the accrual method.
r) Employee profit sharing
Employee profit sharing is paid by certain subsidiaries of the Company to its eligible employees. The Company has employee profit sharing in Mexico, Ecuador and Peru. In Mexico, employee profit sharing is computed at the rate of 10% on the individual subsidiaries taxable base adjusted for employee profit sharing purposes as provided by law.
Employee profit sharing is presented as an operating expense in the consolidated statements of comprehensive income.
s) Taxes
Income taxes
Current income tax payable is presented as a short-term liability, net of prepayments made during the year.
Deferred income tax is determined using the liability method based on the temporary differences between the tax values of the assets and liabilities and their book values at the consolidated financial statements reporting date.
Deferred tax assets and liabilities are measured using the tax rates that are expected to be in effect in the period when the asset will materialize or the liability will be settled, based on the enacted tax rates (and tax legislation) that have been enacted or substantially enacted at the financial statements reporting date. The value of deferred tax assets is reviewed by the Company at each financial statement reporting date and is reduced to the extent that it is more likely that the Company will not have sufficient future tax profits to allow for the realization of all or a part of its deferred tax assets. Unrecognized deferred tax assets are revalued at each financial statement reporting date and are recognized when it is more likely that there will be sufficient future tax profits to allow for the realization of these assets.
Deferred taxes relating to items recognized in Other Comprehensive Income are recognized together with the concept that generated such deferred taxes. Deferred taxes consequence on unremitted earnings from subsidiaries and associates are considered as temporary differences, when the timing of the reversal of the temporary differences can be controlled and it is probable that the temporary differences will not reverse in the foreseeable future. Taxes withheld on remitted foreign earnings are creditable against Mexican taxes, thus to the extent that a remittance is to be made, the deferred tax would be limited to the incremental difference between the Mexican tax rate and the rate of the remitting country. As of December 31, 2020 and 2021, the Company has not provided for any deferred taxes related to unremitted foreign earnings.
The Company offsets tax assets and liabilities if it has a legally enforceable right to set off current tax assets and current tax liabilities and the deferred tax assets and deferred tax liabilities relate to income taxes levied by the same tax authority.
F-
30
Sales tax
Revenues, expenses and assets are recognized net of the amount of sales tax, except:
| • | When the sales tax incurred on a purchase of assets or services is not recoverable from the taxation authority, in which case, the sales tax is recognized as part of the cost of acquisition of the asset or as part of the expense item, as applicable. |
| • | Receivables and payables that are stated with the amount of sales tax included. |
The net amount of sales tax recoverable from, or payable to, the tax authorities is included as part of the current receivables or payables in the consolidated statements of financial position unless they are due in more than a year in which case they are classified as non-current.
t) Advertising
Advertising expenses are recognized as incurred. For the years ended December 31, 2019, 2020 and 2021, advertising expenses were Ps. 13,100,877, Ps. 11,157,495 and Ps. 12,018,536 respectively, and are presented in the consolidated statements of comprehensive income in the caption “Commercial, administrative and general expenses”.
u) Earnings per share
Basic and diluted earnings per share are determined by dividing net profit of the year by the weighted-average number of shares outstanding during the year. In determining the weighted average number of outstanding shares, shares repurchased by the Company have been excluded.
v) Financial risks
The main risks associated with the Company’s financial instruments are: (i) liquidity risk, (ii) market risk (foreign currency exchange risk and interest rate risk) and (iii) credit risk and counterparty risk. The Board of Directors approves the policies submitted by management to mitigate these risks.
i) Liquidity risk
Liquidity risk is the risk that the Company may not meet its financial obligations associated with financial instruments when they are due. The Company’s financial obligations and commitments are included in Notes 14 and 17.
ii) Market risk
The Company is exposed to certain market risks derived from changes in interest rates and fluctuations in exchange rates of foreign currencies. The Company’s debt is denominated in foreign currencies, mainly in US dollars and euros, other than its functional currency. In order to reduce the risks related to fluctuations in the exchange rate of foreign currency, the Company uses derivative financial instruments such as cross-currency swaps and forwards to adjust exposures resulting from foreign exchange currency. The Company does not use derivatives to hedge the exchange risk arising from having operations in different countries.
Additionally, the Company occasionally uses interest rate swaps to adjust its exposure to the variability of the interest rates or to reduce their financing costs. The Company’s practices vary from time to time depending on judgments about the level of risk, expectations of change in the movements of interest rates and the costs of using derivatives. The Company may terminate or modify a derivative financial instrument at any time. See Note 7 for disclosure of the fair value of derivatives as of December 31, 2020 and 2021.
F-
3
1
iii) Credit risk
Credit risk represents the loss that could be recognized in case the counterparties fail to comply with their contractual obligations.
The financial instruments that potentially represent concentrations of credit risk are cash and short-term deposits, trade accounts receivable and financial instruments related to debt and derivatives. The Company’s policy is designed in order to limit its exposure to any one financial institution; therefore, the Company’s financial instruments are contracted with several different financial institutions located in different geographic regions.
The credit risk in accounts receivable is diversified because the Company has a broad customer base that is geographically dispersed. The Company continuously evaluates the credit conditions of its customers and generally does not require collateral to guarantee collection of its accounts receivable. The Company monitors on a monthly basis its collection cycle to avoid deterioration of its results of operations.
A portion of the Company’s cash surplus is invested in short- term deposits with financial institutions with high credit ratings.
iv) Sensitivity analysis for market risks
The Company uses sensitivity analysis to measure the potential losses based on a theoretical increase of 100 basis points in interest rates and a 5% fluctuation in exchange rates:
Interest rate
In the event that the Company’s agreed-upon interest rates at December 31, 2021 decrease by 100 (14,606,005), respectively.
basis points and a 5.23% fluctuation in exchange rates, the net interest expense would (decrease) by Ps.
(1,188,821) and Ps.Exchange rate fluctuations
Should the Company’s debt at December 31, 2021 of Ps.564,030,102, if suffer a 5% increase/(decrease) in exchange rates, the debt would increase/(decrease) by Ps. 28,394,119 and Ps. (28,019,972), respectively.
w) Derivative financial instruments
Derivative financial instruments are recognized in the consolidated statements of financial position at fair value. Valuations obtained by the Company are compared against those of the financial institutions with which the agreements are entered into, and it is the Company’s policy to compare such fair value to a valuation provided by an independent pricing provider in case of discrepancies. Changes in the fair value of derivatives that do not qualify as hedging instruments are recognized immediately in the line “Valuation of derivatives, interest cost from labor obligations and other financial items, net”.
The Company is exposed to interest rate and foreign currency risks, which tries to mitigate through a controlled risk management program that includes the use of derivative financial instruments. The Company principally uses to offset the risk of exchange rate and interest rate fluctuations. Additionally, for the years ended December 31, 2019, 2020 and 2021 certain of the Company’s derivative financial instruments had been designated, and had qualified, as cash flow hedges. The effective portion of gains or losses on the cash flow derivatives is recognized in equity under the heading “Effect for fair value of derivatives”, and the ineffective portion is charged to results of operations of the period.
F-
32
x) Current versus non-current classification
The Company presents assets and liabilities in its consolidated statements of financial position based on current/non-current classification.
An asset is current when it is either:
| (i) | Expected to be realized or intended to be sold or consumed in the normal operating cycle. |
| (ii) | Held primarily for the purpose of trading. |
| (iii) | Expected to be realized within twelve months after the reporting period. |
| (iv) | Cash and cash equivalents unless restricted from being exchanged or used to settle a liability for at least twelve months after the reporting period. |
A liability is current when:
| • | It is expected to be settled in the normal operating cycle. |
| • | It is held primarily for the purpose of trading. |
| • | It is due to be settled within twelve months after the reporting period. |
| • | There is no unconditional right to defer the settlement of the liability for at least twelve months after the reporting period. |
The Company classifies all other assets and liabilities, including deferred income tax assets and liabilities, as non-current.
y) Presentation of consolidated statements of comprehensive income
The costs and expenses shown in the consolidated statements of comprehensive income are presented in combined manner (based on both their function and nature), which allows a better understanding of the components of the Company’s operating income. This classification allows a comparison to the telecommunications industry.
The Company presents operating income in its consolidated statements of comprehensive income since it is a key indicator of the Company’s performance. Operating income represents operating revenues less operating costs and expenses.
z) Operating segments
Segment information is presented based on information used by management in its decision-making processes. Segment information is presented based on the geographic areas in which the Company operates. The management of the Company is responsible for making decisions regarding the resources to be allocated to the Company’s different segments, as well as evaluating the performance of each segment. Intersegment revenues and costs, intercompany balances as well as investments in shares in consolidated entities are eliminated upon consolidation and reflected in the “eliminations” column in Note 23.
None of the segment’s records revenue from transactions with a single external customer amounting to 10% or more of the revenues.
Aa) Convenience translation
The consolidated financial statements are stated in thousands of Mexican pesos (“Ps.”); however, solely for the convenience of the readers, the consolidated statement of financial position as of December 31, 2021 and the
F-
33
consolidated statement of comprehensive income and consolidated statement of cash flows for the year ended December 31, 2021 were converted into U.S. dollars at the exchange rate of Ps.
20.5835 per U.S. dollar, which was the exchange rate at that date. This arithmetic conversion should not be construed as representations that the amounts expressed in Mexican pesos may be converted into U.S. dollars at that or any other exchange rate.Ab) Significant accounting judgments, estimates and assumptions
In preparing its consolidated financial statements, the Company makes estimates concerning a variety of matters. Some of these matters are highly uncertain, and its estimates involve judgments it makes based on the available information. In the discussion below, the Company has identified several of these matters for which its financial statements would be materially affected if either (1) the Company uses different estimates that it could have reasonably used or (2) in the future América Móvil changes its estimates in response to changes that are reasonably likely to occur.
The following discussion addresses only those estimates that the Company considers most important based on the degree of uncertainty and the likelihood of a material impact had it used a different estimate. There are many other areas in which the Company uses estimates about uncertain matters, but the reasonably likely effect of changed or different estimates is not material to the financial presentation for those other areas.
Estimated useful lives of plant, property and equipment
The Company currently depreciates most of its network infrastructure based on an estimated useful life determined upon the expected particular conditions of operation and maintenance in each of the countries in which it operates. The estimates are based on AMX’s historical experience with similar assets, anticipated technological changes and other factors, taking into account the practices of other telecommunications companies. The Company reviews estimated useful lives each year to determine, for each particular class of assets, whether they should be changed. The Company may shorten/extend the estimated useful life of an asset class in response to technological changes, changes in the market or other developments. This results in increased/decreased depreciation expense. See Note 10.
Revaluation of passive infrastructure of telecommunications towers
The Company recognizes the passive infrastructure of the telecommunication towers at fair value, recognizing the changes in OCI. The discounted cash flow model was used. The Company hired a valuation specialist with industry experience to measure fair values as of December 31, 2021
Impairment of Long-Lived Assets
The Company has large amounts of long-lived assets, including property, plant and equipment, intangible assets, investments in affiliates and goodwill on its consolidated statements of financial position. The Company is required to test long-lived assets for impairment when circumstances indicate a potential impairment or, in some cases, at least on an annual basis. The impairment analysis for long-lived assets requires the Company to estimate the recoverable amount of the asset, which is the higher of its fair value (minus any disposal costs) and its value in use. To estimate the fair value of a long-lived asset, the Company typically takes into account recent market transactions or, if no such transactions can be identified, the Company uses a valuation model that requires making certain assumptions and estimates. Similarly, to estimate the value in use of long-lived assets, the Company typically makes various assumptions about the future prospects for the business to which the asset relates, considers market factors specific to that business and estimates future cash flows to be generated by that business. Based on this impairment analysis, including all assumptions and estimates related thereto, as well as guidance provided by IFRS relating to the impairment of long-lived assets different assumptions and estimates could materially impact the Company’s reported financial results. More conservative assumptions of the anticipated future benefits from these businesses could result in impairment charges, which would decrease net
F-3
4
income and result in lower asset values on the consolidated statements of financial position. Conversely, less conservative assumptions could result in smaller or no impairment charges, higher net income and higher asset values. The key assumptions used to determine the recoverable amount for the Company’s CGUs, are further explained in Notes 23, 10 and 11.
Deferred Income Taxes
The Company is required to estimate its income taxes in each of the jurisdictions in which it operates. This process involves the jurisdiction-by-jurisdiction estimation of actual current tax exposure and the assessment of temporary differences resulting from the differing treatment of certain items, such as accruals and amortization, for tax and financial reporting purposes, as well as net operating loss carry-forwards and other tax credits. These items result in deferred tax assets and liabilities as discussed in Note 2 s). The analysis is based on estimates of taxable income in the jurisdictions in which the Company operates and the period on which the deferred tax assets and liabilities will be recovered or settled. If actual results differ from these estimates, or the Company adjusts these estimates in future periods, its financial position and results of operations may be materially affected.
In assessing the future realization of deferred tax assets, the Company considers future taxable income, ongoing planning strategies and future results in its operations. In the event that the estimates of projected future taxable income are lowered, or changes in current tax regulations are enacted that would impose restrictions on the timing or extent of the ability to utilize the tax benefits of net operating loss carry-forwards in the future, an adjustment to the recorded amount of deferred tax assets would be made, with a related charge to income. See Note 13.
Accruals
Accruals are recorded when, at the end of the period, the Company has a present obligation as a result of past events, whose settlement requires an outflow of resources that is considered probable and can be measured reliably. This obligation may be legal or constructive, arising from, but not limited to, regulation, contracts, common practice or public commitments, which have created a valid expectation for third parties that the Company will assume certain responsibilities. The amount recorded is the best estimation performed by the Company’s management in respect of the disbursement that will be required to settle the obligations, considering all the information available at the date of the financial statements, including the opinion of external experts, such as legal advisors or consultants. Accruals are adjusted to account for changes in circumstances for ongoing matters and the establishment of additional accruals for new matters.
If the Company is unable to reliably measure the obligation, no accrual is recorded, and information is then presented in the notes to its consolidated financial statements. Because of the inherent uncertainties in these estimations, actual expenditures may be different from the originally estimated amount recognized. See Note 16.
The Company is subject to various claims and contingencies related to tax, labor and legal proceedings as described in Note 17b).
Labor Obligations
The Company recognizes liabilities on its consolidated statements of financial position and expenses in its statements of comprehensive income to reflect its obligations related to its post-retirement seniority premiums, pension and retirement plans in the countries in which it operates and offer defined contribution and benefit
The Company uses estimates in four specific areas that have a significant effect on these amounts: (i) the rate of return the Company assumes its pension plans will earn on its investments, (ii) the salaries increase rate that the
F-3
5
Company assumes it will observe in future years, (iii) the discount rates that the Company uses to calculate the present value of its future obligations and (iv) the expected inflation rate. The assumptions applied are further
disclosed in Note 18. These estimates are determined based on actuarial studies performed by independent experts using the projected unit-credit method.
Ac) Discontinued operations
On September 14, 2020, the Company, announced that it ha
d
entered into an agreement with Verizon Communications Inc. (“Verizon”) to sell its 100% interest in its subsidiary TracFone Wireless, Inc. (“TracFone”), the largest mobile virtual prepaid service operator in the United States, serving 21 million subscribers. On November 23, 2021, the Company announced that it had
completed the sale of its 100% interest in TracFone to Verizon.AMX received a closing consideration of US$3,625.7 million in cash, which includes US$500.7 million related to TracFone’s closing cash and working capital, customary adjustment and other adjustments and 57,596,544 shares of Verizon stock valued at approximately US$2,968 million.
Following
the
transaction
closing, Verizon shall pay to AMX: (i) up to US$500 million as an earn-out if TracFone continues to achieve certain performance measures during the 24 months following the closing, calculated and paid in 4 consecutive
semesters
periods, and (ii) US$150 million deferred consideration payable within two years following the
transaction
closing. The earn-out was not recognized as gain by the Company, in accordance with
IFRS 9, 13 and
IAS 37
,
since
management does not believe the realization of incomeand the inflow of economic benefits are virtually certain.
TracFone was deconsolidated from that date resulting in a
net
gain of Ps. 106,527,287including the recycling of foreign currency exchange losses accumulated in equity. This gain has been recognized under profit after tax from discontinued operations in the consolidated statements of comprehensive income. Furthermore, no impairment loss was identified. Moreover, TracFone had identifiable operations and cash flows and represented a separate geographical area. Therefore, in accordance with IFRS 5, TracFone was classified as discontinued operations for all years presented in these consolidated financial statements; results were accordingly presented as a single amount as profit after tax from discontinued operations in the consolidated statements of comprehensive income. The consolidated statements of comprehensive income comparative figures have therefore been restated accordingly.
All other notes to the consolidated financial statements include amounts for continuing operations, unless indicated otherwise.
F-3
6
Additionally, TracFone represented the U.S.A. segment until November 23, 2021. With TracFone being classified as discontinued operations, the U.S.A. segment is no longer presented in the segment note. The results of TracFone for the year are presented below:
For the years ended December 31 | ||||||||||||
| 2019 | 2020 | 2021 | ||||||||||
Operating revenues: | ||||||||||||
Service revenues | Ps. | 131,403,268 | Ps. | 149,376,532 | Ps. | 130,091,540 | ||||||
Sales of equipment | 24,461,125 | 27,802,837 | 22,160,481 | |||||||||
| 155,864,393 | 177,179,369 | 152,252,021 | ||||||||||
Total costs and expenses | 144,822,141 | 157,327,836 | 134,495,316 | |||||||||
Operating income | 11,042,252 | 19,851,533 | 17,756,705 | |||||||||
Financial cost | (77,884 | ) | (2,026 | ) | (1,733 | ) | ||||||
Gain on disposal of discontinued operations | 0 | 0 | 132,821,709 | |||||||||
Profit before income tax discontinued operations | 10,964,368 | 19,849,507 | 150,576,681 | |||||||||
Tax expense: | ||||||||||||
Related to pre-tax profit from the ordinary activities for the period | 1,119,479 | 2,856,882 | 2,571,541 | |||||||||
Related to gain on disposal from discontinued operations | 0 | 0 | 26,294,422 | |||||||||
Net profit for the year from discontinued operations | Ps. | 9,844,889 | Ps. | 16,992,625 | Ps. | 121,710,718 | ||||||
The assets and liabilities deconsolidated on the date of the disposal were as follows:
November 23, | ||||
2021 | ||||
Current assets | ||||
Cash | Ps. | 338,439 | ||
Subscribers, distributors, recoverable taxes, contract assets and other net | 12,368,407 | |||
Inventories, net | 9,604,658 | |||
Other current assets, net | 389,052 | |||
Total current assets | 22,700,556 | |||
Non-current assets: | ||||
Property, plant and equipment | 1,989,498 | |||
Intangibles, net | 555,012 | |||
Goodwill | 2,695,557 | |||
Deferred income taxes | 1,094,756 | |||
Other assets, net | 327,546 | |||
Rights of use | 1,625 | |||
Total assets | Ps. | 29,364,550 | ||
Short term liability related to rigth of use of assets | Ps. | 1,625 | ||
Accounts payable | 17,446,513 | |||
Income tax | 3,267,585 | |||
Deferred revenue | 13,187,667 | |||
Total liabilities | 33,903,390 | |||
Net liability directly associated with disposal group | Ps. | (4,538,840 | ) | |
F-3
7
Furthermore, pursuant to the Stock Purchase Agreement, the Company agreed to indemnify Verizon against pre-closing tax matters. As of the closing, certain tax related matters had not been resolved, and Verizon has asserted post-closing claims under the adjustments and other provisions of this agreements, which may result in payments by us.
Ad)
Reclassification
The Company reclassified Ps. 4,540,344
from current
equity investments at fair value through other comprehensive income (OCI) to non-current
debt instruments at fair value through other comprehensive income (OCI)
as of December 31, 2020.
3. Cash and Cash Equivalents
Cash and cash equivalents are comprised of short-term deposits with different financial institutions. Cash equivalents only include instruments with purchased maturity of less than three months. The amount includes the amount deposited, plus any interest earned.
4. Equity
and debt
investments at fair value through OCI and other short/long-term investments
As of December 31, 2020 and 2021, equity investments at fair value through OCI and other short-term investments includes an equity investment in KPN for Ps. 50,033,111 and Ps. 56,087,598 , respectively, other short-term investments for Ps. 62,940 and Ps. 15,026, respectively, equity investment in Verizon for
Ps. 61,600,578 in December 31, 2021.
The investment
s
in KPN, Verizon and others
, are carried at fair value with changes in fair value being recognized through other comprehensive (loss) gain items (equity) in the Company’s consolidated statements of financial position. As of December 31, 2020 and 2021, the Company has recognized in equity changes in fair value of Ps. (1,952,414) and Ps. 4,560,869 respectively, net of deferred taxes.During the years ended December 31, 2019, 2020 and 2021, the Company received dividends from KPN for an amount of Ps. 1,742,242 and Ps. 2,119,668 and Ps. 2,628,600, respectively, which are included within “Valuation of derivatives, interest cost from labor obligations, and other financial items, net” in the consolidated statements of comprehensive income.
As of December 31, 2020 and 2021 long-term debt instrument at fair value through OCI for Ps. 4,540,344 and Ps. 6,894,757, respectively.
F-
3
8
5. Accounts receivable from subscribers, distributors, recoverable taxes contractual assets and other, net
a)
At December 31, | ||||||||
| 2020 | 2021 | |||||||
Subscribers and distributors | Ps. 168,758,386 | Ps. 157,433,609 | ||||||
Telecommunications carriers for network interconnection and other services | 4,914,094 | 3,968,675 | ||||||
Recoverable taxes | 44,557,402 | 43,734,164 | ||||||
Sundry debtors | 12,504,566 | 15,573,586 | ||||||
Contract assets | 29,588,104 | 30,901,277 | ||||||
Impairment of trade receivables | (44,551,735 | ) | (41,835,826 | ) | ||||
Total net | Ps. 215,770,817 | Ps. 209,775,485 | ||||||
Non-current subscribers, distributors and contractual assets | 7,792,863 | 6,928,888 | ||||||
Total current subscribers, distributors and contractual assets | Ps. 207,977,954 | Ps. 202,846,597 | ||||||
b) Changes in the impairment of trade receivables is as follows:
For the years ended December 31, | ||||||||||||
| 2019 | 2020 | 2021 | ||||||||||
Balance at beginning of year | Ps.(40,798,025 | ) | Ps.(39,480,909 | ) | Ps.(44,551,735 | ) | ||||||
Increases recorded in expenses | (16,346,395 | ) | (19,112,635 | ) | (10,677,421 | ) | ||||||
Write-offs (i) | 17,839,957 | 11,953,227 | 11,682,343 | |||||||||
Business combination | (3,265,490 | ) | (2,066 | ) | — | |||||||
Translation effect | 3,089,044 | 2,090,648 | 1,710,987 | |||||||||
Balance at end of year | Ps.(39,480,909 | ) | Ps.(44,551,735 | ) | Ps.(41,835,826 | ) | ||||||
| (i) | Includes discontinued operation of Tracfone. See Note 2Ac. |
c) The following table shows the aging of accounts receivable at December 31, 2020 and 2021, for subscribers and distributors:
Past due | ||||||||||||||||||||||||
Total | Unbilled services provided | a-30 days | 31-60 days | 61-90 days | Greater than 90 days | |||||||||||||||||||
December 31, 2020 | Ps. | 168,758,386 | Ps. | 75,972,811 | Ps. | 37,439,995 | Ps. | 5,325,264 | Ps. | 3,313,835 | Ps. | 46,706,481 | ||||||||||||
December 31, 2021 | Ps. | 157,433,609 | Ps. | 69,082,837 | Ps. | 35,694,272 | Ps. | 4,533,604 | Ps. | 2,645,034 | Ps. | 45,477,862 | ||||||||||||
d) The following table shows the accounts receivable from subscribers and distributors included in the impairments of trade receivables, as of December 31, 2020 and 2021:
Total | 1-90 days | Greater than 90 days | ||||||||||
December 31, 2020 | Ps. | 44,551,735 | Ps. | 4,455,174 | Ps. | 40,096,561 | ||||||
December 31, 2021 | Ps. | 41,835,826 | Ps. | 4,183,583 | Ps. | 37,652,243 | ||||||
F-
39
e) An analysis of contract assets and liabilities at December 31, 2020 and 2021 is as follows:
| 2020 | 2021 | |||||||
Contract Assets: | ||||||||
Balance at the beginning of the year | Ps. | 34,274,007 | Ps. | 29,588,104 | ||||
Additions | 27,242,031 | 31,758,626 | ||||||
Disposals | (1,397,714 | ) | (5,946,487 | ) | ||||
Amortization | (29,002,995 | ) | (25,354,712 | ) | ||||
Translation effect | (1,527,225 | ) | 855,746 | |||||
Balance at the end of the year | Ps. | 29,588,104 | Ps. | 30,901,277 | ||||
Non-current contract assets | Ps. | 817,740 | Ps. | 989,519 | ||||
Current portion contracts assets | Ps. | 28,770,364 | Ps. | 29,911,758 | ||||
6. Related Parties
a) The following is an analysis of the balances with related parties as of December 31, 2020 and 2021. All of the companies were considered affiliates of América Móvil since the Company’s principal shareholders are either direct or indirect shareholders in the related parties.
| 2020 | 2021 | |||||||
Accounts receivable: | ||||||||
Sears Roebuck de México, S.A. de C.V. and Subsidiaries | Ps. | 233,402 | Ps. | 339,366 | ||||
Sanborns Hermanos, S.A. | 160,116 | 192,599 | ||||||
Patrimonial Inbursa, S.A. | 327,985 | 145,676 | ||||||
Grupo Condumex, S.A. de C.V. and Subsidiaries | 10,038 | 122,555 | ||||||
Hubard y Bourlon, S.A. de C.V. | 437,231 | 52,026 | ||||||
Claroshop.com, S.A.P.I de C.V. | 100,075 | 40,906 | ||||||
Other | 122,453 | 265,483 | ||||||
Total | Ps. | 1,391,300 | Ps. | 1,158,611 | ||||
| 2020 | 2021 | |||||||
Accounts payable: | ||||||||
Carso Infraestructura y Construcción, S.A. de C.V. and Subsidiaries | Ps. | 2,192,405 | Ps. | 1,273,085 | ||||
Grupo Condumex, S.A. de C.V. and Subsidiaries | 1,054,526 | 1,709,487 | ||||||
Fianzas Guardiana Inbursa, S.A. de C.V. | 241,898 | 385,287 | ||||||
Claroshop.com, S.A.P.I de C.V. | 4,300 | 247,081 | ||||||
Grupo Financiero Inbursa, S.A.B. de C.V. | 234,954 | 102,314 | ||||||
Seguros Inbursa, S.A. de C.V. | 92,173 | 113,089 | ||||||
Sociedad Financiera Inbursa, S.A. de C.V. | 0 | 80,382 | ||||||
PC Industrial, S.A. de C.V. and Subsidiaries | 44,198 | 4,761 | ||||||
Enesa, S.A. de C.V. and Subsidiaries | 22,014 | 9,384 | ||||||
Other | 113,448 | 292,012 | ||||||
Total | Ps. | 3,999,916 | Ps. | 4,216,882 | ||||
For the years ended December 31, 2019, 2020 and 2021, the Company has not recorded any impairment of receivables in connection with amounts owed by related parties.
F-
40
b) For the years ended December 31, 2019, 2020 and 2021, the Company conducted the following transactions with related parties:
| 2019 | 2020 | 2021 | ||||||||||
Investments and expenses: | ||||||||||||
Construction services, purchases of materials, inventories and property, plant and equipment (i) | Ps. | 8,573,894 | Ps. | 7,130,769 | Ps. | 13,544,289 | ||||||
Insurance premiums, fees paid for administrative and operating services, brokerage services and others (ii) | 4,590,620 | 4,375,113 | 4,336,133 | |||||||||
Other services | 1,277,404 | 1,101,528 | 1,617,102 | |||||||||
| Ps. | 14,441,918 | Ps. | 12,607,410 | Ps. | 19,497,524 | |||||||
Revenues: | ||||||||||||
Service revenues | Ps. | 538,110 | Ps. | 608,248 | Ps. | 714,148 | ||||||
Sales of equipment (iii) | 944,697 | 656,801 | 7,629,181 | |||||||||
| Ps. | 1,482,807 | Ps. | 1,265,049 | Ps. | 8,343,329 | |||||||
| i) | In 2021, this amount includes Ps. |
| ii) | In 2021, this amount includes Ps. |
| iii) | In November 2021, a subsidiary of Telmex sold certain tower assets to Telesites, S.A.B. de C.V. |
| iv) | The amounts related to payments for tower lease are reflected in Note 15. |
c) The aggregate compensation paid to the Company’s, directors (including compensation paid to members of the Audit and Corporate Practices Committee), and senior management in 2021 was approximately Ps.5,800 and Ps.85,000, respectively. None of the Company’s directors is a party to any contract with the Company or any of its subsidiaries that provides for benefits upon termination of employment. The Company does not provide pension, retirement or similar benefits to its directors in their capacity as directors. The Company’s executive officers are eligible for retirement and severance benefits required by Mexican law on the same terms as all other employees.
d) Österreichische Bundes- und Industriebeteiligungen GmbH (ÖBIB) is considered a related party due to it is a significant non-controlling shareholder in Telekom Austria. Through Telekom Austria, América Móvil is related to the Republic of Austria and its subsidiaries, which are mainly ÖBB Group, ASFINAG Group and Post Group as well as Rundfunk und Telekom Reguliegungs-GmbH, all of which these are related parties. In 2019, 2020 and 2021, NaN of the individual transactions associated with government agencies or government-owned entities of Austria were considered significant to América Móvil.
7. Derivative Financial Instruments
To mitigate the risks of future increases in interest rates and foreign exchange rates for the servicing of its debt, the Company has entered into derivative contracts in over-the-counter transactions carried out with financial institutions. In 2021 the weighted-average interest rate of the total debt including the impact of interest rate derivatives held by the Company is 3.1% (3.5% and 3.8% in 2020 and 2019, respectively).
F-
41
An analysis of the derivative financial instruments contracted by the Company at December 31, 2020 and 2021 is as follows:
At December 31, | ||||||||||||||||
2020 | 2021 | |||||||||||||||
Instrument | Notional amount in millions | Fair Value | Notional amount in millions | Fair Value | ||||||||||||
Assets: | ||||||||||||||||
Swaps US Dollar – Mexican Peso | US$ | 3,490 | Ps. | 16,806,937 | US$ | 1,890 | Ps. | 6,881,934 | ||||||||
Swaps US Dollar – Euro | US$ | 150 | 117,726 | US$ | 150 | 307,646 | ||||||||||
Swaps Yen – US Dollar | ¥ | 9,750 | 269,215 | ¥ | 6,500 | 119,325 | ||||||||||
Swaps Pound Sterling – US Dollar | £ | 1,010 | 2,237,919 | £ | 100 | 99,463 | ||||||||||
Forwards US Dollar – Mexican Peso | US$ | 240 | 39,607 | US$ | 2,080 | 321,864 | ||||||||||
Forwards Mexican Peso – US Dollar | — | — | MX$ | 35,419 | 1,635,087 | |||||||||||
Forwards Brazilian Real – US Dollar | BRL$ | 4,193 | 1,190,292 | BRL$ | 2,480 | 127,131 | ||||||||||
Forwards Euro – US Dollar | € | 915 | 266,639 | 0 | 0 | |||||||||||
Put Option | — | — | € | 374 | 638,347 | |||||||||||
Total Assets | — | Ps. | 20,928,335 | — | Ps. | 10,130,806 | ||||||||||
At December 31, | ||||||||||||||||
2020 | 2021 | |||||||||||||||
Instrument | Notional amount in millions | Fair Value | Notional amount in millions | Fair Value | ||||||||||||
Liabilities: | ||||||||||||||||
Swaps US Dollar – Euro | US$ | 800 | Ps. | (4,811,031 | ) | US$ | 800 | Ps. | (1,270,005 | ) | ||||||
Swaps Yen – US Dollar | ¥ | 3,250 | (14,802 | ) | ¥ | 6,500 | (119,313 | ) | ||||||||
Swaps Pound Sterling – Euro | £ | 640 | (3,122,492 | ) | £ | 640 | (1,924,941 | ) | ||||||||
Swap Pound Sterling – US Dollar | £ | 550 | (457,559 | ) | £ | 1,460 | (2,117,583 | ) | ||||||||
Swaps Euro – US Dollar | 0 | 0 | € | 495 | (528,298 | ) | ||||||||||
Swaps Euro – Mexican Peso | — | — | € | 750 | (680,720 | ) | ||||||||||
Forwards US Dollar – Mexican Peso | US$ | 3,494 | (4,052,852 | ) | US$ | 1,175 | (286,937 | ) | ||||||||
Forwards Brazilian Real – US Dollar | BRL$ | 1,762 | (425,249 | ) | BRL$ | 4,021 | (234,822 | ) | ||||||||
Forwards Euro – US Dollar | — | — | € | 815 | (1,122,641 | ) | ||||||||||
Forwards US Dollar – Euro | — | — | US$ | 8 | (1,570 | ) | ||||||||||
Forwards Euro – Mexican Peso | € | 200 | (272,274 | ) | € | 200 | (22,182 | ) | ||||||||
Put option | € | 374 | (1,073,990 | ) | 0 | 0 | ||||||||||
Call option | 0 | 0 | € | 2,097 | (1,725,495 | ) | ||||||||||
Total Liabilities | — | Ps. | (14,230,249 | ) | — | Ps. | (10,034,508 | ) | ||||||||
| * | Totals may not sum due to rounding. |
The changes in the fair value of these derivative financial instruments for the years ended December 31, 2019, 2020 and 2021 amounted to a gain (loss) of Ps. 4,432,023, Ps. 12,378,193 and Ps. (6,755,214), respectively. Such amounts are included in the consolidated statements of comprehensive income as part of the caption “Valuation of derivatives interest cost from labor obligations and other financial items, net”.
F-
42
The maturities of the notional amount of the derivatives are as follows:
Instrument | Notional amount in millions | 2022 | 2023 | 2024 | 2025 | 2026 Thereafter | ||||||||||||||||||
Assets | ||||||||||||||||||||||||
Swaps US Dollar-Mexican Peso | US$ | — | 0 | — | — | 1,890 | ||||||||||||||||||
Swaps Yen-US Dollar | ¥ | — | — | — | — | 6,500 | ||||||||||||||||||
Swaps US Dollar – Euro | US$ | — | — | — | — | 150 | ||||||||||||||||||
Swaps Pound Sterling – US Dollar | £ | — | — | — | — | 100 | ||||||||||||||||||
Forwards US Dollar-Mexican Peso | US$ | 2,080 | — | — | — | — | ||||||||||||||||||
Forwards Mexican Peso – US Dollar | MX$ | 35,419 | — | — | — | — | ||||||||||||||||||
Forwards Brazilian Real-US Dollar | BRL | 2,480 | — | — | — | — | ||||||||||||||||||
Put Option | € | — | 374 | — | — | — | ||||||||||||||||||
Liabilities | ||||||||||||||||||||||||
Swaps US Dollar-Euro | US$ | — | — | — | — | 800 | ||||||||||||||||||
Swaps Euro – US Dollar | € | — | 320 | 175 | — | — | ||||||||||||||||||
Swaps Euro – Mexican Peso | US$ | — | 750 | — | — | — | ||||||||||||||||||
Swaps Yen-US Dollar | ¥ | — | — | — | — | 6,500 | ||||||||||||||||||
Swaps Pound Sterling-Euro | £ | — | — | — | — | 640 | ||||||||||||||||||
Swap Pound Sterling-US Dollar | £ | — | — | — | — | 1,460 | ||||||||||||||||||
Forwards US Dollar – Mexican Peso | US$ | 1,175 | — | — | — | — | ||||||||||||||||||
Forwards Euro – US Dollar | € | 765 | — | 50 | — | — | ||||||||||||||||||
Forwards US Dollar—Euro | US$ | 8 | — | — | — | — | ||||||||||||||||||
Forwards Brazilian Real-US Dollar | BRL | 4,021 | — | — | — | — | ||||||||||||||||||
Forwards Euro – Mexican Peso | € | 200 | — | — | — | — | ||||||||||||||||||
Call option | € | — | — | 2,097 | — | — | ||||||||||||||||||
8. Inventories, net
An analysis of inventories at December 31, 2020 and 2021 is as follows:
| 2020 | 2021 | |||||||
Mobile phones, accessories, computers, TVs, cards and other materials | Ps.33,763,086 | Ps. | ||||||
Less: Reserve for obsolete and slow-moving inventories | (3,385,647 | ) | (1,946,211 | ) | ||||
Total | Ps.30,377,439 | Ps. | ||||||
For the years ended December 31, 2019, 2020 and 2021, the cost of inventories recognized in cost of sales was Ps. 128,559,826, Ps. 114,711,857 122,220,495
and
Ps.respectively
.F-
43
9. Other assets, net
An analysis of other assets at December 31, 2020 and 2021 is as follows:
2020 | 2021 | |||||||
Current portion: | ||||||||
Advances to suppliers (different from PP&E and inventories) | Ps. | 7,600,644 | Ps. | 7,474,932 | ||||
Prepaid insurance | 1,300,019 | 1,749,589 | ||||||
Other | 93,244 | 227,731 | ||||||
| Ps. | 8,993,907 | Ps. | 9,452,252 | |||||
Non-current portion: | ||||||||
Recoverable taxes | Ps. | 11,559,961 | Ps. | 11,689,094 | ||||
Prepayments for the use of fiber optics | 2,709,358 | 3,783,496 | ||||||
Judicial Deposits (1) | 15,402,840 | 14,583,504 | ||||||
Prepaid expenses | 8,743,667 | 9,899,996 | ||||||
Total | Ps. | 38,415,826 | Ps. | 39,956,090 | ||||
For the years ended December 31, 2019, 2020 and 2021, amortization expense for other assets was Ps. 318,824, Ps. 213,833 and Ps. 442,098, respectively.
| (1) | Judicial deposits represent cash and cash equivalents pledged in order to fulfill the collateral requirements for tax contingencies mainly in Brazil. As of December 31, 2020 and 2021, the amount for these deposits is Ps. 15,402,840 and Ps. 14,583,504, respectively for Brazil. Based on its evaluation of the underlying contingencies, the Company believes that such amounts are recoverable. |
10. Property, Plant and Equipment, net
a)
At December 31, 2018 | Additions | Retirements | Business combinations | Effect of translation of foreign subsidiaries and hyperinflation adjustment | Depreciation for the year | At December 31, 2019 | ||||||||||||||||||||||
Cost | ||||||||||||||||||||||||||||
Network in operation and equipment | Ps. | 969,195,936 | Ps. | 82,992,062 | Ps. | (13,417,360 | ) | Ps. | 9,572,805 | Ps. | (57,669,840 | ) | Ps. | — | Ps. | 990,673,603 | ||||||||||||
Land and buildings | 57,130,326 | 1,530,677 | (4,025,222 | ) | 115,935 | (3,950,463 | ) | — | 50,801,253 | |||||||||||||||||||
Other assets | 149,809,137 | 26,881,611 | (7,594,735 | ) | 1,021,051 | (7,776,500 | ) | — | 162,340,564 | |||||||||||||||||||
Construction in process and advances plant suppliers (1) | 81,092,529 | 82,640,305 | (76,892,011 | ) | 209,790 | (5,511,439 | ) | — | 81,539,174 | |||||||||||||||||||
Spare parts for operation of the network | 28,444,529 | 44,776,904 | (36,525,735 | ) | 0 | (2,462,605 | ) | — | 34,233,093 | |||||||||||||||||||
Total | 1,285,672,457 | 238,821,559 | (138,455,063 | ) | 10,919,581 | (77,370,847 | ) | — | 1,319,587,687 | |||||||||||||||||||
Accumulated depreciation | ||||||||||||||||||||||||||||
Network in operation and equipment | 560,005,547 | — | (24,954,514 | ) | — | (47,778,627 | ) | 93,097,695 | 580,370,101 | |||||||||||||||||||
Buildings | 8,810,949 | — | (287,072 | ) | — | (1,386,974 | ) | 2,330,405 | 9,467,308 | |||||||||||||||||||
Other assets | 76,533,494 | — | (695,425 | ) | — | (4,754,982 | ) | 19,249,104 | 90,332,191 | |||||||||||||||||||
Spare parts for operation of the network | 321,747 | — | (283,986 | ) | — | (79,226 | ) | 116,182 | 74,717 | |||||||||||||||||||
Total | Ps. | 645,671,737 | Ps. | — | Ps. | (26,220,997 | ) | Ps. | — | Ps. | (53,999,809 | ) | Ps. | 114,793,386 | Ps. | 680,244,317 | ||||||||||||
Net Cost | Ps. | 640,000,720 | Ps. | 238,821,559 | Ps. | (112,234,066 | ) | Ps. | 10,919,581 | Ps. | (23,371,038 | ) | Ps. | (114,793,386 | ) | Ps. | 639,343,370 | |||||||||||
F-
44
At December 31, 2019 | Additions | Retirements | Business combinations | Revaluation adjustments | Transfers | Effect of translation of foreign subsidiaries and hyperinflation adjustment | Depreciation for the year | At December 31, 2020 | ||||||||||||||||||||||||||||
Cost | ||||||||||||||||||||||||||||||||||||
Network in operation and equipment | Ps. | 990,673,603 | Ps. | 90,387,449 | Ps. | (19,574,391 | ) | Ps. | 996,974 | Ps. | 107,152,628 | Ps. | (62,050,212 | ) | Ps. | (49,993,808 | ) | Ps. | — | Ps. | 1,057,592,243 | |||||||||||||||
Land and buildings | 50,801,253 | 570,062 | (2,853,037 | ) | — | — | — | 369,300 | — | 48,887,578 | ||||||||||||||||||||||||||
Other assets | 162,340,564 | 17,474,218 | (14,454,598 | ) | 55,848 | — | — | (8,393,187 | ) | — | 157,022,845 | |||||||||||||||||||||||||
Construction in process and advances plant suppliers (1) | 81,539,174 | 59,635,316 | (68,661,847 | ) | 1,099 | — | — | (5,011,829 | ) | — | 67,501,913 | |||||||||||||||||||||||||
Spare parts for operation of the network | 34,233,093 | 30,721,413 | (37,829,818 | ) | — | — | — | (2,328,430 | ) | — | 24,796,258 | |||||||||||||||||||||||||
Total | 1,319,587,687 | 198,788,458 | (143,373,691 | ) | 1,053,921 | 107,152,628 | (62,050,212 | ) | (65,357,954 | ) | — | 1,355,800,837 | ||||||||||||||||||||||||
Accumulated depreciation | ||||||||||||||||||||||||||||||||||||
Network in operation and equipment | 580,370,101 | — | (25,726,856 | ) | — | — | (62,050,212 | ) ( 2 ) | (58,055,450 | ) | 96,729,723 | 531,267,306 | ||||||||||||||||||||||||
Buildings | 9,467,308 | — | (1,663,796 | ) | — | — | — | (622,253 | ) | 1,906,140 | 9,087,399 | |||||||||||||||||||||||||
Other assets | 90,332,191 | — | (9,317,821 | ) | — | — | — | (5,120,175 | ) | 16,549,822 | 92,444,017 | |||||||||||||||||||||||||
Spare parts for operation of the network | 74,717 | — | (176,131 | ) | — | — | — | 38,898 | 135,000 | 72,484 | ||||||||||||||||||||||||||
Total | Ps. | 680,244,317 | Ps. | — | Ps. | (36,884,604 | ) | Ps. | — | Ps. | — | Ps. | (62,050,212 | ) | Ps. | (63,758,980 | ) | Ps. | 115,320,685 | P | s 632,871,206 | |||||||||||||||
Net Cost | Ps. | 639,343,370 | Ps. | 198,788,458 | Ps. | (106,489,087 | ) | Ps. | 1,053,921 | Ps. | 107,152,628 | . | — | Ps. | (1,598,974 | ) | Ps. | (115,320,685 | ) | Ps. | 722,929,631 | |||||||||||||||
At December 31, 2020 | Additions | Retirements (3) | Business combinations | Transfers | Effect of translation of foreign subsidiaries and hyperinflation adjustment | Depreciation for the year | At December 31, 2021 | |||||||||||||||||||||||||
Cost | ||||||||||||||||||||||||||||||||
Network in operation and equipment | Ps. | 1,057,592,243 | Ps. | 89,696,150 | Ps. | (45,044,049 | ) | Ps. | 0 | Ps. | 53,531,590 | Ps. | (44,061,097 | ) | Ps. | — | Ps . | 1,111,714,837 | ||||||||||||||
Land and buildings | 48,887,578 | 784,460 | (473,785 | ) | — | 38,250 | (1,216,894 | ) | — | 48,019,609 | ||||||||||||||||||||||
Other assets | 157,022,845 | 10,782,903 | (11,994,756 | ) | 0 | (1,800,756 | ) | (1,870,104 | ) | — | 152,140,132 | |||||||||||||||||||||
Construction in process and advances plant suppliers (1) | 67,501,913 | 83,366,813 | (47,178,796 | ) | 0 | (38,944,421 | ) | (1,420,843 | ) | — | 63,324,666 | |||||||||||||||||||||
Spare parts for operation of the network | 24,796,258 | 46,909,494 | (23,108,928 | ) | — | (13,824,767 | ) | (974,011 | ) | — | 33,798,046 | |||||||||||||||||||||
Total | 1,355,800,837 | 231,539,820 | (127,800,314 | ) | 0 | (1,000,104 | ) | (49,542,949 | ) | — | 1,408,997,290 | |||||||||||||||||||||
Accumulated depreciation | ||||||||||||||||||||||||||||||||
Network in operation and equipment | 531,267,306 | — | (24,322,904 | ) | — | 638,066 | (30,254,288 | ) | 97,343,878 | 574,672,058 | ||||||||||||||||||||||
Buildings | 9,087,399 | — | (219,030 | ) | — | (221,937 | ) | (738,748 | ) | 1,941,819 | 9,849,503 | |||||||||||||||||||||
Other assets | 92,444,017 | — | (10,522,319 | ) | — | 549,855 | (2,522,458 | ) | 13,310,584 | 93,259,679 | ||||||||||||||||||||||
Spare parts for operation of the network | 72,484 | — | (92,421 | ) | — | — | (26,823 | ) | 66,131 | 19,371 | ||||||||||||||||||||||
Total | Ps | 632,871,206 | Ps . | — | Ps. | (35,156,674 | ) | Ps. | — | Ps. | (965,984 | ) | Ps . | (33,542,317 | ) | Ps. | 112,662,412 | Ps . | 677,800,611 | |||||||||||||
Net Cost | Ps . | 722,929,631 | Ps . | 231,539,820 | Ps . | (92,643,640 | ) | Ps. | 0 | Ps. | (1,966,088 | ) | Ps. | (16,000,632 | ) | Ps . | (112,662,412 | ) | Ps . | 731,196,679 | ||||||||||||
(1) | Construction in progress includes fixed and mobile network facilities as well as satellite developments and fiber optic which is in the process of being installed. |
(2) | This transfer relates to the accumulated depreciation as at the revaluation date that was eliminated against the gross carrying amount of the revalued asset. |
(3) | Includes disposals related to the sale of TracFone. See Note 2Ac. |
The completion period of construction in progress is variable and depends upon the type of plant and equipment under construction.
b) Revaluation of t
e
lecommunications towersThe Fair value of the passive infrastructure of telecommunications towers was determined using the “income approach” method through a discounted flow model (DFC) where, among others, inputs such as average rents per tower were used, contract term and discount rates considering market information.
As of December 31, 2020 and 2021, date of the revaluation, the fair values of the passive infrastructure of the telecommunications towers were determinate by a valuation specialist with experience in the industry. The complement for the revaluation of the passive infrastructure of the telecommunications towers amounted to Ps. 107,152,628 and 98,172,675, respectively, and was recognized in OCI, the change in revaluation did not have an impact
during 2020. For
the year
ended
as of December 31, 2021 the impact amounted to Ps. 6,450,825.F-4
5
The information to be disclosed on the fair value measurement for the revalued telecommunications towers is provided in Note 19.
| 2020 | 2021 | |||||||
Book value as of December 31, (cost model) | Ps. | 615,777,003 | Ps. | 633,024,004 | ||||
Supplement for change in accounting policy | 107,152,628 | 98,172,675 | ||||||
Book value and fair value as of December 31, (revaluation model) | Ps. | 722,929,631 | Ps. | 731,196,679 | ||||
c) Relevant information related to the computation of the capitalized borrowing costs is as follows:
Year ended December 31, | ||||||||||||
| 2019 | 2020 | 2021 | ||||||||||
Amount invested in the acquisition of qualifying assets | Ps. 50,783,957 | Ps. 46,528,232 | Ps. 38,573,605 | |||||||||
Capitalized interest | 2,233,358 | 1,771,613 | 1,527,259 | |||||||||
Capitalization rate | 4.4 | % | 3.8 | % | 4.0 | % | ||||||
Capitalized interest is being amortized over a period of estimated useful life of the related assets.
11. Intangible assets, net and goodwill
a)
| For the year ended December 31, 2019 | ||||||||||||||||||||||||||||
| Balance at beginning of year | Acquisitions | Acquisitions in business combinations | Disposals and other | Amortization of the year | Effect of translation of foreign subsidiaries and Hyperinflation adjustment | Balance at end of year | ||||||||||||||||||||||
Licenses and rights of use | Ps. | 233,478,974 | Ps. | 13,206,877 | Ps. | 7,844,339 | Ps. | 7,286,114 | Ps. | — | Ps. | (15,715,442 | ) | Ps. | 246,100,862 | |||||||||||||
Accumulated amortization | (130,180,579 | ) | — | — | (2,391,624 | ) | (11,577,160 | ) | 9,481,480 | (134,667,883 | ) | |||||||||||||||||
Net | 103,298,395 | 13,206,877 | 7,844,339 | 4,894,490 | (11,577,160 | ) | (6,233,962 | ) | 111,432,979 | |||||||||||||||||||
Trademarks | 28,207,166 | 53,467 | — | (6,012 | ) | — | (835,613 | ) | 27,419,008 | |||||||||||||||||||
Accumulated amortization | (23,539,961 | ) | 0 | — | 0 | (1,008,483 | ) | 618,145 | (23,930,299 | ) | ||||||||||||||||||
Net | 4,667,205 | 53,467 | — | (6,012 | ) | (1,008,483 | ) | (217,468 | ) | 3,488,709 | ||||||||||||||||||
Customer relationships | 25,543,068 | 20,248 | — | 5,507 | — | (2,693,812 | ) | 22,875,011 | ||||||||||||||||||||
Accumulated amortization | (18,761,537 | ) | 0 | — | 0 | (3,371,924 | ) | 2,357,831 | (19,775,630 | ) | ||||||||||||||||||
Net | 6,781,531 | 20,248 | — | 5,507 | (3,371,924 | ) | (335,981 | ) | 3,099,381 | |||||||||||||||||||
Software licenses | 14,309,258 | 2,729,480 | — | (949,858 | ) | 0 | (2,984,770 | ) | 13,104,110 | |||||||||||||||||||
Accumulated amortization | (7,704,803 | ) | 0 | — | (1 | ) | (2,479,088 | ) | 2,183,149 | (8,000,743 | ) | |||||||||||||||||
Net | 6,604,455 | 2,729,480 | — | (949,859 | ) | (2,479,088 | ) | (801,621 | ) | 5,103,367 | ||||||||||||||||||
Content rights | 7,549,709 | 1,427,694 | — | 1,638,007 | — | (455,228 | ) | 10,160,182 | ||||||||||||||||||||
Accumulated amortization | (6,763,592 | ) | — | — | (8,720 | ) | (1,772,779 | ) | 429,862 | (8,115,229 | ) | |||||||||||||||||
Net | 786,117 | 1,427,694 | — | 1,629,287 | (1,772,779 | ) | (25,366 | ) | 2,044,953 | |||||||||||||||||||
Total of intangibles, net | Ps. | 122,137,703 | Ps. | 17,437,766 | Ps. | 7,844,339 | Ps. | 5,573,413 | Ps. | (20,209,434 | ) | Ps. | (7,614,398 | ) | Ps. | 125,169,389 | ||||||||||||
Goodwill | Ps. | 145,566,497 | Ps . | — | Ps. | 10,869,571 | Ps. | (843,005 | ) | — | Ps. | (2,693,262 | ) | Ps. | 152,899,801 | |||||||||||||
F-4
6
| For the year ended December 31, 2020 | ||||||||||||||||||||||||||||
| Balance at beginning of year | Acquisitions | Acquisitions in business combinations | Disposals and other | Amortization of the year | Effect of translation of foreign subsidiaries and Hyperinflation adjustment | Balance at end of year | ||||||||||||||||||||||
Licenses and rights of use | Ps. | 246,100,862 | Ps. | 15,079,714 | Ps. | 4,436,313 | Ps. | 1,502,981 | Ps. | — | Ps. | (14,029,709 | ) | Ps. | 253,090,161 | |||||||||||||
Accumulated amortization | (134,667,883 | ) | — | — | 105,892 | (14,274,497 | ) | 14,227,424 | (134,609,064 | ) | ||||||||||||||||||
Net | 111,432,979 | 15,079,714 | 4,436,313 | 1,608,873 | (14,274,497 | ) | 197,715 | 118,481,097 | ||||||||||||||||||||
Trademarks | 27,419,008 | 162,309 | 12,110 | 4,000 | — | 1,534,938 | 29,132,365 | |||||||||||||||||||||
Accumulated amortization | (23,930,299 | ) | — | — | (4,276 | ) | (300,727 | ) | (1,119,645 | ) | (25,354,947 | ) | ||||||||||||||||
Net | 3,488,709 | 162,309 | 12,110 | (276 | ) | (300,727 | ) | 415,293 | 3,777,418 | |||||||||||||||||||
Customer relationships | 22,875,011 | 1,935 | 2,689,718 | (5,763 | ) | — | 4,018,365 | 29,579,266 | ||||||||||||||||||||
Accumulated amortization | (19,775,630 | ) | — | — | 855 | (1,654,237 | ) | (3,996,593 | ) | (25,425,605 | ) | |||||||||||||||||
Net | 3,099,381 | 1,935 | 2,689,718 | (4,908 | ) | (1,654,237 | ) | 21,772 | 4,153,661 | |||||||||||||||||||
Software licenses | 13,104,110 | 2,445,784 | 36 | (2,485,429 | ) | — | 4,236,645 | 17,301,146 | ||||||||||||||||||||
Accumulated amortization | (8,000,743 | ) | — | — | 2,013,617 | (2,667,870 | ) | (3,578,452 | ) | (12,233,448 | ) | |||||||||||||||||
Net | 5,103,367 | 2,445,784 | 36 | (471,812 | ) | (2,667,870 | ) | 658,193 | 5,067,698 | |||||||||||||||||||
Content rights | 10,160,182 | 1,570,415 | — | (313,942 | ) | — | 619,657 | 12,036,312 | ||||||||||||||||||||
Accumulated amortization | (8,115,229 | ) | — | — | — | (1,440,749 | ) | (503,241 | ) | (10,059,219 | ) | |||||||||||||||||
Net | 2,044,953 | 1,570,415 | — | (313,942 | ) | (1,440,749 | ) | 116,416 | 1,977,093 | |||||||||||||||||||
Total of intangibles, net | Ps. | 125,169,389 | Ps. | 19,260,157 | Ps. | 7,138,177 | Ps. | 817,935 | Ps. | (20,338,080 | ) | Ps. | 1,409,389 | Ps. | 133,456,967 | |||||||||||||
Goodwill | Ps. | 152,899,801 | Ps. | — | Ps. | (7,014,120 | ) | Ps. | (537,343 | ) | Ps. | — | Ps. | (2,295,479 | ) | Ps. | 143,052,859 | |||||||||||
| For the year ended December 31, 2021 | ||||||||||||||||||||||||
| Balance at beginning of year | Acquisitions | Disposals and other | Amortization of the year | Effect of translation of foreign subsidiaries and Hyperinflation adjustment | Balance at end of year | |||||||||||||||||||
Licenses and rights of use | Ps. | 253,090,161 | Ps. | 24,406,905 | Ps. | (4,427,685 | ) | Ps. | — | Ps. | (7,011,691 | ) | Ps. | 266,057,690 | ||||||||||
Accumulated amortization | (134,609,064 | ) | — | 6,764,067 | (14,682,451 | ) | 6,737,503 | (135,789,945 | ) | |||||||||||||||
Net | 118,481,097 | 24,406,905 | 2,336,382 | (14,682,451 | ) | (274,188 | ) | 130,267,745 | ||||||||||||||||
Trademarks (1) | 29,132,365 | 75,100 | (1,129,666 | ) | — | (401,946 | ) | 27,675,853 | ||||||||||||||||
Accumulated amortization | (25,354,947 | ) | — | 802,717 | (140,205 | ) | 308,745 | (24,383,690 | ) | |||||||||||||||
Net | 3,777,418 | 75,100 | (326,949 | ) | (140,205 | ) | (93,201 | ) | 3,292,163 | |||||||||||||||
Customer relationships (1) | 29,579,266 | 229,936 | (4,133,408 | ) | — | (1,105,668 | ) | 24,570,126 | ||||||||||||||||
Accumulated amortization | (25,425,605 | ) | — | 3,830,742 | (707,500 | ) | 1,093,401 | (21,208,962 | ) | |||||||||||||||
Net | 4,153,661 | 229,936 | (302,666 | ) | (707,500 | ) | (12,267 | ) | 3,361,164 | |||||||||||||||
Software licenses | 17,301,146 | 2,660,330 | (3,484,755 | ) | — | (1,225,585 | ) | 15,251,136 | ||||||||||||||||
Accumulated amortization | (12,233,448 | ) | (626 | ) | 3,482,440 | (2,738,978 | ) | 1,052,938 | (10,437,674 | ) | ||||||||||||||
Net | 5,067,698 | 2,659,704 | (2,315 | ) | (2,738,978 | ) | (172,647 | ) | 4,813,462 | |||||||||||||||
Content rights | 12,036,312 | 818,436 | (281,747 | ) | — | 429,319 | 13,002,320 | |||||||||||||||||
Accumulated amortization | (10,059,219 | ) | — | (147,668 | ) | (899,666 | ) | (404,537 | ) | (11,511,090 | ) | |||||||||||||
Net | 1,977,093 | 818,436 | (429,415 | ) | (899,666 | ) | 24,782 | 1,491,230 | ||||||||||||||||
Total of intangibles, net | Ps. | 133,456,967 | Ps. | 28,190,081 | Ps. | 1,275,037 | Ps. | (19,168,800 | ) | Ps. | (527,521 | ) | Ps. | 143,225,764 | ||||||||||
Goodwill (1) | Ps. | 143,052,859 | Ps. | — | Ps. | (3,516,287 | ) | Ps. | — | Ps. | (2,958,378 | ) | Ps. | 136,578,194 | ||||||||||
| (1) | Includes disposals related to the sale of TracFone. See Note 2Ac. |
F-4
7
b) The aggregate carrying amount of goodwill is allocated as follows:
| 2020 | 2021 | |||||||
Europe | Ps . | Ps . | ||||||
Brazil | 18,730,686 | 18,017,916 | ||||||
Puerto Rico | 17,463,394 | 17,463,394 | ||||||
Dominican Republic | 14,186,723 | 14,186,723 | ||||||
Colombia | 12,253,743 | 11,685,585 | ||||||
México | 10,148,380 | 10,164,814 | ||||||
Peru | 2,710,979 | 2,532,770 | ||||||
Chile | 2,558,098 | 2,311,239 | ||||||
El Salvador | 2,499,544 | 2,510,595 | ||||||
United States (Tracfone) (3) | 3,362,900 | 0 | ||||||
Ecuador | 2,155,384 | 2,155,384 | ||||||
Guatemala | 2,301,533 | 1,947,203 | ||||||
Other countries | 1,293,356 | 1,295,381 | ||||||
| Ps.143,052,859 | Ps.136,578,194 | |||||||
c) The following is a description of the major changes in the “Licenses and rights of use” caption during the years ended December 31, 2019, 2020 and 2021:
2019 Acquisitions
i) In 2019, Claro Brasil increased its licenses value by Ps. 3,457,251 by renewal licenses Anatel and reversion of IRU of Telxus referring to ICMS.
ii) In 2019,
AMX’s subsidiary in
Austria acquired licenses to operate certain frequencies for Ps. 3,023,732, (3.5 GHz; EUR 64.3 mn), Belarus (2.1 GHz; EUR 9.5 mn) and Croatia (2.1 GHz; EUR 7.2 mn).
iii) In 2019, Telmex increased its licenses value by Ps. 459,668 for rights to use IFETEL with a validity of 20 years, and a right to use submarine cable with a validity of 10 years.
iv) In January 2019, Telcel acquired licenses for an amount of Ps.1,649,525 for PC´s 98 concessions titles and September 30, 2019 for 400 MHZ concessions titles.
v) In December 2019, Comcel increased its licenses value by Ps. 2,753,768 or (468,511,573,375 Colombian pesos) in accordance with Res.3386 of December 23, granted Claro (Comcel) the 20 years renewal of 10 MHz of spectrum in the 1900 MHz band.
vi) Additionally, in 2019, the Company acquired other licenses in Puerto Rico, Argentina, Guatemala, Panamá and other countries in the amount of Ps. 1,862,934.
2020 Acquisitions
i) In February 2020, Comcel increased its licenses value by Ps. 9,246,825 for an auction of the 30 Mhz spectrum in the 2,500 band for a period of 20 years in accordance with resolution. 325,326 and 327 of February 20, 2020 issued by the Ministry of Information and Communication (MINTIC)
ii) In 2020, Telcel acquired licenses for an amount Ps. 1,806,875 for Axtel and Ultra Vision concession titles valid from 2020 to 2040.
iii) In January 2020, CTE acquired licenses by Ps. 620,052 for 12 pairs of frequencies, advance payment of Advanced Wireless Services (AWS) band and complementary payment of AWS band of block 4.
F-
4
8
iv) In 2020, TAG acquired licenses for the right of us for Ps. 1,704,280, in Slovenia and VIP Movil 1940E.
v) Additionally, in 2020, the Company acquired other licenses in Puerto Rico, Argentina, Uruguay, Honduras, Paraguay, Brasil and other countries in the amount of
Ps.2021 Acquisitions
i) In December the subsidiary Claro Brasil acquired a 5G license for
Ps. 17,789,163
carried out by ANATEL in November 2021, for the sale of radio frequency bands. The total amount of this license was recorded in the intangibles line on December 31, 2021.
ii) During the year, AMX’s subsidiary in Austria acquired licenses for
Ps..
iii) In November, AMX’s subsidiary in the Dominican Republic acquired a 5G concession and right of operation until
2041 for an amount of Ps..
iv) AMX’s subsidiary in Colombia renewed spectrum at 5 MHZ in the 1900 MHZ band for an amount of
Ps. 1,599,473
according to resolution 2802 of October 2021, and made acquisitions of terrestrial fiber optics and submarine cable valid for
2 and 3 years.
v) In February 2021, AMX’s subsidiary in El Salvador acquired licenses for an amount of
Ps.139,363.
The concession is for 10 MHZ in the 1,900 mobile network bandwidth coverage in the national territory, exploitable as of February 28, 2021 with validity of
20 years.vi) In February 2021, AMX’s subsidiary in Chile acquired a concession for
Ps. the Concession of Band 1900 MHZ with a term
of 10 years.Additionally, in 2021, the Company acquired other licenses in Mexico, Guatemala, Brazil, Ecuador, Peru, Argentina and other countries for an amount of
Ps.
706,900Amortization of intangibles for the years ended December 31, 2019, 2020 and 2021 amounted to Ps. 20,209,434, Ps. 20,338,080 and Ps. 19,168,800 respectively.
Some of the jurisdictions in which the Company operates can revoke their concessions under certain circumstances such as imminent danger to national security, national economy and natural disasters.
12. Business combinations, acquisitions and non-controlling interest
a)
Acquisitions 2020
a) During 2020, the Company acquired through its subsidiaries, other entities for which it paid Ps. 152,896, net of acquired cash.
b) The Company acquired an additional non-controlling interest in its entities for an amount of Ps. 1,104,662.
c) In December 2020, the offer submitted by our Brazilian subsidiary, Claro, jointly with Telefónica Brasil, S.A. and TIM, S.A. for the acquisition of the mobile business owned by Oi Group was accepted. The offer is in the amount of R$16.5 billion, of which Claro will pay 22%. In consideration of such amount, Claro will receive 32% of Oi Group’s mobile business customer base and approximately 4.7 thousand mobile access sites. The closing of the transaction is subject to customary conditions including regulatory approvals from Anatel and Conselho Administrativo de Defesa Econômica, CADE.
F-4
9
Acquisitions 2021
a) The Company acquired an additional non-controlling interest in its entities for an amount of Ps.7,720
Consolidated subsidiaries with non-controlling interests
The Company has control over Telekom Austria, which has a material non-controlling interest. Set out below is summarized information as of December 31, 2020 and 2021 of TKA’s consolidated financial statements.
The amounts disclosed for this subsidiary are before inter-company eliminations and using the same accounting policies of América Móvil.
Selected financial data from the consolidated statements of financial position
| December 31, | ||||||||
| 2020 | 2021 | |||||||
Assets: | ||||||||
Current assets | Ps . | 32,775,046 | Ps. | 39,781,192 | ||||
Non-current assets | 150,747,947 | 142,407,870 | ||||||
Total assets | Ps. | 183,522,993 | Ps. | 182,189,062 | ||||
Liabilities and equity: | ||||||||
Current liabilities | Ps. | 49,942,415 | Ps. | 68,795,807 | ||||
Non-current liabilities | 82,293,652 | 58,312,238 | ||||||
Total liabilities | 132,236,067 | 127,108,045 | ||||||
Equity attributable to equity holders of the parent | 26,129,649 | 28,066,198 | ||||||
Non-controlling interest | 25,157,277 | 27,014,819 | ||||||
Total equity | Ps. | 51,286,926 | Ps. | 55,081,017 | ||||
Total liabilities and equity | Ps. | 183,522,993 | Ps. | 182,189,062 | ||||
Summarized consolidated statements of comprehensive income
For the year ended December 31, | ||||||||||||
| 2019 | 2020 | 2021 | ||||||||||
Operating revenues | Ps. | 98,420,289 | Ps. | 111,472,191 | Ps. | 113,838,487 | ||||||
Operating costs and expenses | 89,732,428 | 98,312,325 | 98,346,896 | |||||||||
Operating income | Ps. | 8,687,861 | Ps. | 13,159,866 | Ps. | 15,491,591 | ||||||
Net income | Ps. | 5,051,145 | Ps. | 7,787,388 | Ps. | 9,104,962 | ||||||
Total comprehensive income | Ps. | 1,466,783 | Ps. | 12,103,406 | Ps. | 7,790,499 | ||||||
Net income attributable to: | ||||||||||||
Equity holders of the parent | Ps. | 2,565,733 | Ps. | 3,986,412 | Ps. | 4,629,816 | ||||||
Non-controlling interest | 2,485,412 | 3,800,976 | 4,475,146 | |||||||||
| Ps. | 5,051,145 | Ps. | 7,787,388 | Ps. | 9,104,962 | |||||||
Comprehensive income attributable to: | ||||||||||||
Equity holders of the parent | Ps. | 748,059 | Ps. | 6,172,737 | Ps. | 3,973,154 | ||||||
Non-controlling interest | 718,724 | 5,930,669 | 3,817,345 | |||||||||
| Ps. | 1,466,783 | Ps. | 12,103,406 | Ps. | 7,790,499 | |||||||
F-
50
13. Income Taxes
As explained previously in these consolidated financial statements, the Company is a Mexican corporation which has numerous consolidated subsidiaries operating in different countries. Presented below is a discussion of income tax matters that relates to the Company’s consolidated operations, its Mexican operations and significant foreign operations.
i) Consolidated income tax matters
The composition of income tax expense (benefit) for the years ended December 31, 2019, 2020 and 2021 is as follows:
| 2019 | 2020 | 2021 | ||||||||||
In Mexico: | ||||||||||||
Current year income tax | Ps. | 26,295,431 | Ps. | 13,407,948 | Ps. | 24,355,240 | ||||||
Deferred income tax | 208,658 | (9,334,246 | ) | (5,079,397 | ) | |||||||
Foreign: | ||||||||||||
Current year income tax | 19,830,227 | 12,319,690 | 23,412,990 | |||||||||
Deferred income tax | 3,579,739 | (2,884,122 | ) | (14,544,064 | ) | |||||||
Total Income tax | Ps. | 49,914,055 | Ps. | 13,509,270 | Ps. | 28,144,769 | ||||||
Income Tax attributable to a discontinued operation | ||||||||||||
Income tax discontinued operations in Mexico (1) | 0 | 0 | (26,294,422 | ) | ||||||||
Income tax discontinued operations Foreign (1) | (1,119,479 | ) | (2,856,882 | ) | (2,571,541 | ) | ||||||
(1) | Includes effects related to the sale of Tracfone. See Note 2Ac. |
Deferred tax related to items recognized in OCI during the year:
For the years ended December 31, | ||||||||||||
| 2019 | 2020 | 2021 | ||||||||||
Remeasurement of defined benefit plans | Ps. | 9,217,320 | Ps. | 4,151,600 | Ps. | (4,760,089 | ) | |||||
Equity investments at fair value | (378,606 | ) | (665,814 | ) | 583,892 | |||||||
Other | 0 | (35,670 | ) | 0 | ||||||||
Revaluation assets | — | (29,922,597 | ) | 0 | ||||||||
Deferred tax benefit recognized in OCI | Ps. | 8,838,714 | Ps. | (26,472,481 | ) | Ps. | (4,176,197 | ) | ||||
F-
51
A reconciliation of the statutory income tax rate in Mexico to the consolidated effective income tax rate recognized by the Company is as follows:
Year ended December 31, | ||||||||||||
| 2019 | 2020 | 2021 | ||||||||||
Statutory income tax rate in Mexico | 30.0 | % | 30.0 | % | 30.0 | % | ||||||
Impact of non-deductible and non-taxable items: | ||||||||||||
Tax inflation effects | 3.8 | % | 8.6 | % | 7.9 | % | ||||||
Derivatives | (0.1 | %) | (1.0 | %) | (0.9 | %) | ||||||
Employee benefits | 2.0 | % | 4.2 | % | 2.6 | % | ||||||
Other | 2.0 | % | (3.4 | %) | (2.9 | %) | ||||||
Effective tax rate on Mexican operations | 37.7 | % | 38.4 | % | 36.7 | % | ||||||
Tax recoveries in Brazil | — | (13.2 | %) | (10.8 | %) | |||||||
Dividends received from associates Equity | (0.5 | %) | (1.3 | %) | (0.7 | %) | ||||||
Foreign subsidiaries and other non-deductible items, net | 8.0 | % | 4.5 | % | 2.2 | % | ||||||
Effective tax rate from continuing operations | 45.2 | % | 28.4 | % | 27.4 | % | ||||||
Effective tax rate from discontinued operations | 10.2 | % | 14.4 | % | 19.2 | % | ||||||
An analysis of temporary differences giving rise to the net deferred tax
assets
is as follows:
Consolidated statements of financial position | Consolidated statements of net income | |||||||||||||||||||
| 2020 | 2021 | 2019 | 2020 | 2021 | ||||||||||||||||
Provisions | Ps. | 19,312,081 | Ps. | 18,038,607 | Ps. | 318,843 | Ps. | 3,887,471 | Ps. | 2,324,227 | ||||||||||
Deferred revenues | 6,748,101 | 9,041,137 | (1,077,259 | ) | 897,762 | 2,202,413 | ||||||||||||||
Tax losses carry forward | 25,121,933 | 33,954,926 | (9,873 | ) | 2,236,244 | 10,352,978 | ||||||||||||||
Property, plant and equipment (1) | (39,459,549 | ) | (33,445,815 | ) | (1,067,307 | ) | 3,990,750 | 9,246,429 | ||||||||||||
Inventories | (537,404 | ) | 135,658 | (55,380 | ) | (2,394,485 | ) | 814,626 | ||||||||||||
Licenses and rights of use (1) | (5,177,924 | ) | (3,668,389 | ) | 432,403 | 344,729 | (151,013 | ) | ||||||||||||
Employee benefits | 45,467,827 | 40,246,031 | (1,019,042 | ) | 422,473 | (354,803 | ) | |||||||||||||
Other | 14,828,012 | 13,520,684 | (1,310,782 | ) | 2,833,424 | (4,811,396 | ) | |||||||||||||
Net deferred tax assets | Ps. | 66,303,077 | Ps. | 77,822,839 | ||||||||||||||||
Deferred tax expense in net profit for the year | Ps. | (3,788,397 | ) | Ps. | 12,218,368 | Ps. | 19,623,461 | |||||||||||||
Deferred tax discontinued operations | (105,986 | ) | 73,646 | 143,482 | ||||||||||||||||
| (1) | As of December 31, 2020 and 2021, the balance included the effects of hyperinflation and revaluation of telecommunications towers. |
F-
52
Reconciliation of deferred tax assets and liabilities, net:
| 2019 | 2020 | 2021 | ||||||||||
Opening balance as of January 1, | Ps. | 86,613,327 | Ps. | 88,074,856 | Ps. | 66,303,077 | ||||||
Deferred tax benefit | (3,894,383 | ) | 12,292,014 | 19,623,461 | ||||||||
Translation effect | 2,047,915 | 375,105 | (727,099 | ) | ||||||||
Deferred tax benefit recognized in OCI | 8,838,714 | (26,472,481 | ) | (4,176,197 | ) | |||||||
Deferred taxes acquired in business combinations | (276,568 | ) | (2,580,552 | ) | 0 | |||||||
Hyperinflationary effect in Argentina | (5,254,149 | ) | (5,385,865 | ) | (3,540,962 | ) | ||||||
Disposals see to 2Ac | — | — | (1,203,203 | ) | ||||||||
Related discontinued operation | — | — | 1,543,762 | |||||||||
Closing balance as of December 31, | Ps. | 88,074,856 | Ps. | 66,303,077 | Ps. | 77,822,839 | ||||||
Presented in the consolidated statements of financial position as follows: | ||||||||||||
Deferred income tax assets | Ps. | 106,167,897 | Ps. | 115,370,240 | Ps. | 127,287,934 | ||||||
Deferred income tax liabilities | (18,093,041 | ) | (49,067,163 | ) | (49,465,095 | ) | ||||||
| Ps. | 88,074,856 | Ps. | 66,303,077 | Ps. | 77,822,839 | |||||||
The deferred tax assets are in tax jurisdictions in which the Company considers that based on financial projections of its cash flows, results of operations and synergies between subsidiaries, will generate sufficient taxable income in subsequent periods to utilize or realize such assets.
The Company does not recognize a deferred tax liability related to the undistributed earnings of its subsidiaries, because it currently does not expect these earnings to be taxable or to be repatriated in the near future. The Company’s policy has been to distribute the profits when it has paid the corresponding taxes in its home jurisdiction and the tax can be accredited in Mexico.
At December 31, 2020 and 2021, the balance of the contributed capital account (“CUCA”) is Ps. 573,362,949 and Ps. 612,351,412 respectively. Effectively, on January 1, 2014, the(“CUFIN”) is computed on an América Móvil’s stand-alone basis. The balance of the América Móvil’s stand-alone basis CUFIN amounted to Ps. 332,273,039 and Ps. 431,249,107 as of December 31, 2020 and 2021, respectively.
Cuenta de Utilidad Fiscal Neta
During 2021, America Móvil sold 100% of its participation in Tracfone Wireless, Inc (Tracfone), virtual operator of the most important mobile prepaid services in USA to Verizon Communications Inc. (“Verizon”), tax profit of this transaction was Ps. 93,968,555.
ii) Significant foreign income tax matters
a)
The foreign subsidiaries determine their taxes on profits based on their individual taxable income, in accordance with the specific tax regimes of each country.
The effective income tax rate for the Company’s foreign jurisdictions was 38% in 2019, 15% in 2020 and 14.2% in 2021. The statutory tax rates in these jurisdictions vary, although many approximate 10% to 34%. The primary difference between the statutory rates and the effective rates in 2019, 2020 and 2021 was attributable to dividends received from KPN, other non-deductible items, non-taxable income and tax recoveries in Brazil and registry of benefits related to tax losses credits in Brazil and Chile and Impairment related to subsidiaries in Europe.
F-
53
a.1
Given the more likely than not position of success of this lawsuit as consequence of the decision, with general repercussion, of the STF, Brazil updated its analysis, support documentation and forecast and recorded Ps. 2,647,919 (R$703,761) of which Ps. 2,076,594 (R$551,915) represent an excess on deferred IRPJ and CSLL and Ps. 571,325 (R$151,846) represent an excess on current IRPJ and CSLL. The subsidiaries are waiting for the necessary procedural steps to continue, to start the compensation of such amounts.
a.
2
,
Claro Brasil began to use the tax benefit related to the ICMS Grant on TV based on Complementary Law 160/2017 and art. 30 of Law 12,973, as well as in recent interpretations on the subject, investment grants are not computed in determining actual profit in the amount of Ps. 1,721,453 (R$411,336). The Company kicked back the application of the benefit for the years 2018 and 2019, with a total impact of Ps. 2,748,084 (R$656,646). In 2021 the tax benefit was Ps. 1,431,164 (R$380,373).iii) Tax losses
a) At December 31, 2021, the available tax loss carryforwards recorded in deferred tax assets are as follows on a country by country basis:
Country | Gross balance of available tax loss carryforwards at December 31, 2021 | Tax-effected loss carryforward benefit | ||||||
Brazil | Ps.71,910,653 | Ps.24,449,622 | ||||||
Mexico | 14,768,325 | 4,430,497 | ||||||
Europe | 2,031,465 | 507,866 | ||||||
United States | 432,301 | 112,398 | ||||||
Peru | 356,133 | 105,060 | ||||||
Chile | 16,109,194 | 4,349,483 | ||||||
Total | Ps.105,608,071 | Ps.33,954,926 | ||||||
b)
bi)
The Company believes that it is more likely than not that the accumulated balances of its net deferred tax assets are recoverable, based on the positive evidence of the Company to generate future taxable income related to the same taxation authority which will result in taxable amounts against which the available tax losses can be utilized before they expire.
bii)
biii)
F-
5
4
realization of deferred tax assets is dependent upon the expected generation of future taxable income during the periods in which these temporary differences become deductible.
biv) The Company has accumulated Ps. 16,109,194 in NOL’s in Chile as of December 31, 2021. In Chile, the NOL´s have no expiration. The Company estimates that there is positive evidence that allows it to use these losses, these should be reduced to the extent that it is considered likely that there will be sufficient taxable profits to allow them to recover in full or in part, the losses will only be compensated when there is a right legally required and are approved by the tax authorities in Chile.
iv) Optional regime
The Mexican Tax Law establishes an optional regime for group companies called: Optional Regime for Groups of Companies. For these purposes, the integrating (controlling) company must own more than 80% of the shares with voting rights of the integrated (controlled) companies. In general terms, the Integration regime allowed deferral, for each of the companies that make up the group, and for up to three years, or sooner if certain assumptions are made, the whole of the income tax that results from considering the determination of the individual income tax to its charge is the effect derived from recognizing, indirectly, the tax losses incurred by the companies in the group for the year in question
.
On December 19, 2019, the integrating company submitted to the Mexican tax authorities, the notice to end to belong under the Optional Regime for Groups of Companies, which implied a payment made in January 2020 related to the deferred income tax for the years 2016-2018. From the year 2020, the group is taxable under the General Regime for Legal Persons.
v) Limiting interest deductions
The Mexican Tax Law establishes since 2020 new rules related to the limit on interest deductions, in concordance with the action 4 of Base Erosion and Profit Shifting (BEPS) project issued by the Organization for Economic Co-operation and Development (OECD), from which Mexico is member.
In general terms, each Mexican companies should calculate an adjusted Tax EBITDA, whose amount times the corporate income tax, will be the interest limit allowed to be deducted in each tax year. It is important to mention that the amount that was not deductible could be carryforward in the following ten years.
vi) Revaluation of telecommunications towers
Deferred taxes related to the revaluation of the passive infrastructure of the telecommunications towers have been calculated at the tax rate of the jurisdiction in which the subsidiaries are located.
F-
5
5
14. Debt
a)
At December 31, 2020 | (Thousands of Mexican pesos) | |||||||||||||
Currency | Loan | Interest rate | Maturity | Total | ||||||||||
Senior Notes | ||||||||||||||
| U.S. dollars | ||||||||||||||
| Fixed-rate Senior notes (i) | 3.125% | 2022 | Ps. | 31,917,920 | ||||||||||
| Fixed-rate Senior notes (i) | 3.625% | 2029 | 19,948,700 | |||||||||||
| Fixed-rate Senior notes (i) | 2.875% | 2030 | 19,948,700 | |||||||||||
| Fixed-rate Senior notes (i) | 6.375% | 2035 | 19,576,258 | |||||||||||
| Fixed-rate Senior notes (i) | 6.125% | 2037 | 7,365,559 | |||||||||||
| Fixed-rate Senior notes (i) | 6.125% | 2040 | 39,897,400 | |||||||||||
| Fixed-rate Senior notes (i) | 4.375% | 2042 | 22,941,005 | |||||||||||
| Fixed-rate Senior notes (i) | 4.375% | 2049 | 24,935,875 | |||||||||||
Subtotal U.S. dollars | Ps. | 186,531,417 | ||||||||||||
Mexican pesos | ||||||||||||||
| Fixed-rate Senior notes (i) | 6.450% | 2022 | Ps. | 22,500,000 | ||||||||||
| Fixed-rate Senior notes (i) | 7.125% | 2024 | 11,000,000 | |||||||||||
| Domestic Senior notes (i) | 0.000% | 2025 | 4,911,181 | |||||||||||
| Fixed-rate Senior notes (i) | 8.460% | 2036 | 7,871,700 | |||||||||||
| Domestic Senior notes (i) | 8.360% | 2037 | 5,000,000 | |||||||||||
Subtotal Mexican pesos | Ps. | 51,282,881 | ||||||||||||
Euros | ||||||||||||||
| Fixed-rate Senior notes (i) | 3.000% | 2021 | Ps. | 24,369,332 | ||||||||||
| Fixed-rate Senior notes (i) | 3.125% | 2021 | 18,276,999 | |||||||||||
| Fixed-rate Senior notes (i) | 4.000% | 2022 | 18,276,999 | |||||||||||
| Fixed-rate Senior notes (i) | 4.750% | 2022 | 18,276,999 | |||||||||||
| Fixed-rate Senior notes (i) | 3.500% | 2023 | 7,310,800 | |||||||||||
| Fixed-rate Senior notes (i) | 3.259% | 2023 | 18,276,999 | |||||||||||
| Fixed-rate Senior notes (i) | 1.500% | 2024 | 20,713,932 | |||||||||||
| Fixed-rate Senior notes (i) | 1.500% | 2026 | 18,276,999 | |||||||||||
| Fixed-rate Senior notes (i) | 0.750% | 2027 | 24,369,332 | |||||||||||
| Fixed-rate Senior notes (i) | 2.125% | 2028 | 15,840,066 | |||||||||||
| Commercial Paper (iv) | (0.230%) - (0.310%) | 2021 | 40,940,477 | |||||||||||
Subtotal Euros | Ps. | 224,928,934 | ||||||||||||
Pound sterling | ||||||||||||||
| Fixed-rate Senior notes (i) | 5.000% | 2026 | Ps. | 13,634,936 | ||||||||||
| Fixed-rate Senior notes (i) | 5.750% | 2030 | 17,725,417 | |||||||||||
| Fixed-rate Senior notes (i) | 4.948% | 2033 | 8,180,962 | |||||||||||
Fixed-rate Senior notes (i) | 4.375% | 2041 | 20,452,405 | |||||||||||
Subtotal Pound sterling | Ps. | 59,993,720 | ||||||||||||
Brazilian reais | ||||||||||||||
Debentures (i) | 104.000% of CDI | 2021 | Ps. | 4,222,597 | ||||||||||
Debentures (i) | 104.250% of CDI | 2021 | 5,815,668 | |||||||||||
Promissory notes (i) | CDI + 0.600% | 2021 | 1,381,941 | |||||||||||
Debentures (i) | CDI + 0.960% | 2022 | 9,596,811 | |||||||||||
Promissory notes (i) | 106.000% of CDI | 2022 | 7,677,449 | |||||||||||
Debentures (i) | 106.500% of CDI | 2022 | 3,838,725 | |||||||||||
Subtotal Brazilian reais | Ps. | 32,533,191 | ||||||||||||
Other currencies | ||||||||||||||
Japanese yen | ||||||||||||||
Fixed-rate Senior notes (i) | 2.950% | 2039 | Ps. | 2,511,701 | ||||||||||
Subtotal Japanese yen | Ps. | 2,511,701 | ||||||||||||
Chilean pesos | ||||||||||||||
Fixed-rate Senior notes (i) | 3.961% | 2035 | Ps. | 4,078,453 | ||||||||||
Subtotal Chilean pesos | Ps. | 4,078,453 | ||||||||||||
Subtotal other currencies | Ps. | 6,590,154 | ||||||||||||
F-
5
6
At December 31, 2020 | (Thousands of Mexican pesos) | |||||||||||||
Currency | Loan | Interest rate | Maturity | Total | ||||||||||
Hybrid Notes | ||||||||||||||
Euros | ||||||||||||||
Euro NC10 Series B Capital Securities (iii) | 6.375% | 2073 | Ps. | 13,403,133 | ||||||||||
Subtotal Euros | Ps. | 13,403,133 | ||||||||||||
Subtotal Hybrid notes | Ps. | 13,403,133 | ||||||||||||
Lines of Credit and others | ||||||||||||||
| Mexican pesos | ||||||||||||||
Lines of credit (ii) | | TIIE + 0.300 % -TIIE + 1.000 % | 2021 | Ps. | 27,100,000 | |||||||||
| Peruvian soles | ||||||||||||||
Lines of credit (ii) | 1.200% - 1.450% | 2021 | Ps. | 17,094,079 | ||||||||||
| Chilean pesos | ||||||||||||||
Lines of credit (ii) | | TAB + 0.350 %TAB + 0.450 % | | 2021 | Ps. | 8,868,181 | ||||||||
Financial Leases | 8.700% - 8.970% | 2021 - 2027 | Ps. | 57,266 | ||||||||||
Subtotal Lines of Credit and others | Ps. | 53,119,526 | ||||||||||||
Total debt | Ps. | 628,382,956 | ||||||||||||
Less: Short-term debt and current portion of long-term debt | Ps. | 148,083,184 | ||||||||||||
Long-term debt | Ps. | 480,299,772 | ||||||||||||
At December 31, 2021 | (Thousands of Mexican pesos) | |||||||||
Currency | Loan | Interest rate | Maturity | Total | ||||||
Senior Notes | ||||||||||
U.S. dollars | ||||||||||
Fixed-rate Senior notes (i) | 3.625% | 2029 | Ps. | 20,583,500 | ||||||
Fixed-rate Senior notes (i) | 2.875% | 2030 | 20,583,500 | |||||||
Fixed-rate Senior notes (i) | 6.375% | 2035 | 20,199,206 | |||||||
Fixed-rate Senior notes (i) | 6.125% | 2037 | 7,599,943 | |||||||
Fixed-rate Senior notes (i) | 6.125% | 2040 | 41,167,000 | |||||||
Fixed-rate Senior notes (i) | 4.375% | 2042 | 23,671,025 | |||||||
Fixed-rate Senior notes (i) | 4.375% | 2049 | 25,729,375 | |||||||
Subtotal U.S. dollars | Ps. | 159,533,549 | ||||||||
Mexican pesos | ||||||||||
Fixed-rate Senior notes (i) | 6.450% | 2022 | Ps. | 22,500,000 | ||||||
Fixed-rate Senior notes (i) | 7.125% | 2024 | 11,000,000 | |||||||
Domestic Senior notes (i) | 0.000% | 2025 | 5,284,885 | |||||||
Fixed-rate Senior notes (i) | 8.460% | 2036 | 7,871,700 | |||||||
Domestic Senior notes (i) | 8.360% | 2037 | 5,000,000 | |||||||
Subtotal Mexican pesos | Ps. | 51,656,585 | ||||||||
Euros | ||||||||||
Fixed-rate Senior notes (i) | 4.000% | 2022 | Ps. | 17,566,473 | ||||||
Fixed-rate Senior notes (i) | 3.500% | 2023 | 7,026,589 | |||||||
Fixed-rate Senior notes (i) | 3.259% | 2023 | 17,566,474 | |||||||
Fixed-rate Senior notes (i) | 1.500% | 2024 | 19,908,670 | |||||||
Exchangeable Bond (i) | 0.000% | 2024 | 49,115,860 | |||||||
Fixed-rate Senior notes (i) | 1.500% | 2026 | 17,566,473 | |||||||
Fixed-rate Senior notes (i) | 0.750% | 2027 | 23,421,965 | |||||||
Fixed-rate Senior notes (i) | 2.125% | 2028 | 15,224,277 | |||||||
Subtotal euros | Ps. | 167,396,781 | ||||||||
Pound sterling | ||||||||||
Fixed-rate Senior notes (i) | 5.000% | 2026 | Ps. | 13,924,738 | ||||||
Fixed-rate Senior notes (i) | 5.750% | 2030 | 18,102,159 | |||||||
Fixed-rate Senior notes (i) | 4.948% | 2033 | 8,354,843 | |||||||
Fixed-rate Senior notes (i) | 4.375% | 2041 | 20,887,106 | |||||||
Subtotal Pound sterling | Ps. | 61,268,846 | ||||||||
F-5
7
At December 31, 2021 | (Thousands of Mexican pesos) | |||||||||||||
Currency | Loan | Interest rate | Maturity | Total | ||||||||||
Brazilian reais | ||||||||||||||
Debentures (i) | CDI + 0.960% | 2022 | Ps. | 9,221,172 | ||||||||||
Promissory notes (i) | 106.000% of CDI | 2022 | 7,376,937 | |||||||||||
Debentures (i) | 106.500% of CDI | 2022 | 3,688,469 | |||||||||||
Subtotal Brazilian reais | Ps. | 20,286,578 | ||||||||||||
Other currencies | ||||||||||||||
Japanese yen | ||||||||||||||
Fixed-rate Senior notes (i) | 2.950% | 2039 | Ps. | 2,325,617 | ||||||||||
Subtotal Japanese yen | Ps. | 2,325,617 | ||||||||||||
Chilean pesos | ||||||||||||||
Fixed-rate Senior notes (i) | 3.961% | 2035 | Ps. | 3,776,051 | ||||||||||
Subtotal Chilean pesos | Ps. | 3,776,051 | ||||||||||||
Subtotal other currencies | Ps. | 6,101,668 | ||||||||||||
Hybrid Notes | ||||||||||||||
Euros | ||||||||||||||
| Euro NC10 Series B Capital Securities (iii) | 6.375% | 2073 | Ps. | 12,882,081 | ||||||||||
Subtotal Euros | Ps. | 12,882,081 | ||||||||||||
Subtotal Hybrid Notes | Ps. | 12,882,081 | ||||||||||||
Lines of Credit and others | ||||||||||||||
U.S. dollars | ||||||||||||||
Lines of credit (ii) | 0.350% - 0.700% | 2022 | Ps. | 14,723,980 | ||||||||||
Euros | ||||||||||||||
Lines of credit (ii) | (0.400%) - (0.450%) | 2022 | Ps. | 18,737,572 | ||||||||||
Mexican pesos | ||||||||||||||
Lines of credit (ii) | | TIIE + 0.280% - TIIE + 0.400% | 2022 | Ps. | 34,080,000 | |||||||||
Peruvian soles | ||||||||||||||
Lines of credit (ii) | 0.976% - 1.045% | 2022 | Ps. | 9,815,068 | ||||||||||
Chilean pesos | ||||||||||||||
Lines of credit (ii) | TAB + 0.450% | 2022 | Ps. | 7,419,372 | ||||||||||
Financial Leases | 8.700% - 8.970% | 2022 - 2027 | Ps. | 47,743 | ||||||||||
| Others | Lines of credit (ii) | 15.790% | 2022 | Ps. | 80,279 | |||||||||
Subtotal Lines of Credit and others | Ps. | 84,904,014 | ||||||||||||
Total debt | Ps. | 564,030,102 | ||||||||||||
Less: Short-term debt and current portion of long-term debt | Ps. | 145,222,672 | ||||||||||||
Long-term debt | Ps. | 418,807,430 | ||||||||||||
L = LIBOR (London Interbank Offered Rate)
TIIE = Mexican Interbank Rate
CDI = Brazil Interbank Deposit Rate
TAB = Chilean weighted average funding rate
Interest rates on the Company’s debt are subject to fluctuations in international and local rates. The Company’s weighted average cost of borrowed funds as of December 31, 2020, and December 31, 2021 was approximately 3.72% and 3.78%, respectively.
Such rates do not include commissions or the reimbursements for Mexican tax withholdings (typically a tax rate of 4.9%) that the Company must pay to international lenders.
F-
58
An analysis of the Company’s short-term debt maturities as of December 31, 2020, a
n
d December 31, 2021, is as follows:2020 | 2021 | |||||||
Obligations and Senior Notes | Ps. | 95,007,014 | Ps. | 60,353,052 | ||||
Lines of credit | 53,062,260 | 84,856,270 | ||||||
Financial Leases | 13,910 | 13,350 | ||||||
Subtotal short term debt | Ps. | 148,083,184 | Ps. | 145,222,672 | ||||
Weighted average interest rate | 2.23 | % | 4.02 | % | ||||
The Company’s long-term debt maturities are as follows:
Years | Amount | |||
2023 | Ps. | 24,599,324 | ||
2024 | 80,031,350 | |||
2025 | 5,292,314 | |||
2026 and thereafter | 308,884,442 | |||
Total | Ps. | 418,807,430 | ||
(i) Senior Notes
The outstanding Senior Notes as of December 31, 2020, and December 31, 2021, are as follows:
Currency* | 2020 | 2021 | ||||||
U.S. dollars | Ps.186,531,417 | Ps.159,533,549 | ||||||
Mexican pesos | 51,282,881 | 51,656,585 | ||||||
Euros | 183,988,456 | 167,396,781 | ||||||
Pound sterling | 59,993,720 | 61,268,846 | ||||||
Brazilian reais | 32,533,191 | 20,286,578 | ||||||
Japanese yens | 2,511,701 | 2,325,617 | ||||||
Chilean pesos | 4,078,453 | 3,776,051 | ||||||
| * | Thousands of Mexican pesos |
| * | Includes secured and unsecured senior notes. |
In December 2021, the Company redeemed in advance 1,600 million U.S. Dollars senior notes with an interest rate of 3.125% and 750 million Euros senior notes with an interest rate of 4.75%. Both were set to mature in 2022.
(ii) Lines of credit
As of December 31, 2020, and December 31, 2021, debt under lines of credit aggregated to Ps. 53,062 million and Ps. 84,856 million, respectively. Telekom Austria closed December 2021 with an aggregated debt of Ps. 18,818 under lines of credit.
F-
59
The Company has two revolving syndicated credit facilities, one for the Euro equivalent of U.S. $1,500 million and the other for U.S. $2,500 million maturing in 2026 and 2024, respectively. As long as the facilities are committed, a commitment fee is paid. As of December 31, 2021, these credit facilities are undrawn. Telekom Austria has an undrawn revolving syndicated credit facility in Euros for €1,000 million that matures in 2026.
(iii) Hybrid Notes
We currently have a Capital Securities (hybrid notes) maturing in 2073: a series denominated in euros for a total amount of €550 million with a coupon of 6.375%. The Capital Securities are deeply subordinated, and when they were issued the principal rating agencies stated that they would treat only half of the principal amount as indebtedness for purposes of evaluating our leverage (an analysis referred to as 50.0% equity credit). Standard & Poor´s considers 100% of the total amount of this note as debt. The Capital Securities are subject to redemption at our option at varying dates beginning in 2023 for the euro-denominated series.
(iv) Commercial Paper
In August 2020, we established a new Euro-Commercial Paper program for a total amount of €2,000 million. As of December 31, 2021, there is no debt under this program.
Restrictions
A portion of the debt is subject to certain restrictions with respect to maintaining certain financial ratios, as well as restrictions on selling a significant portion of groups of assets, among others. As of December 31, 2021, the Company was in compliance with all these requirements.
A portion of the debt is also subject to early maturity or repurchase at the option of the holders in the event of a change in control of the Company, as defined in each instrument. The definition of change in control varies from instrument to instrument; however, no change in control shall be considered to have occurred as long as its current shareholders continue to hold the majority of the Company’s voting shares.
Covenants
In conformity with the credit agreements, the Company is obliged to comply with certain financial and operating commitments. Such covenants limit in certain cases, the ability of the Company or the guarantor to: pledge assets, carry out certain types of mergers, sell all or substantially all of its assets, and sell control of Telcel.
Such covenants do not restrict the ability of AMX’s subsidiaries to pay dividends or other payment distributions to AMX. The more restrictive financial covenants require the Company to maintain a consolidated ratio of debt to EBITDA (defined as operating income plus depreciation and amortization) that does not exceed 4 to 1, and a consolidated ratio of EBITDA to interest paid that is not below 2.5 to 1 (in accordance with the clauses included in the credit agreements).
Several of the financing instruments of the Company may be accelerated, at the option of the debt holder in the case that a change in control occurs.
As of December 31, 2021, the Company was in compliance with all the covenants.
15. Right-of-use assets and lease debt
The Company has lease contracts for various items of towers & sites, property and other equipment used in its operations. Towers and sites generally have lease terms between 5 and 12 years, while property and other equipment generally have lease terms between 5 and 25 years.
F-
6
0
At December 31, 2019, 2020 and 2021 theassets and lease liabilities are as follows:
right-of-use
Right-of-use | Liability related to right-of-use assets | |||||||||||||||||||
| Towers & Sites | Property | Other equipment | Total | |||||||||||||||||
As of January 1, 2019 | Ps. | 94,252,098 | Ps. | 21,075,884 | Ps. | 4,750,320 | Ps. | 120,078,302 | Ps. | 119,387,660 | ||||||||||
Additions and release | 6,364,508 | 921,542 | 729,001 | 8,015,051 | 7,437,621 | |||||||||||||||
Business Combinations | 9,668,507 | — | — | 9,668,507 | 10,810,111 | |||||||||||||||
Modifications | 7,474,469 | 1,288,974 | 728,837 | 9,492,280 | 8,363,045 | |||||||||||||||
Depreciation | (17,286,497 | ) | (4,941,222 | ) | (1,365,847 | ) | (23,593,566 | ) | — | |||||||||||
Interest expense | — | — | — | — | 7,940,240 | |||||||||||||||
Payments | — | — | — | — | (26,765,075 | ) | ||||||||||||||
Translation adjustment | (4,370,636 | ) | (905,808 | ) | (380,907 | ) | (5,657,351 | ) | (6,576,869 | ) | ||||||||||
Balance at December 31, 2019 | Ps. | 96,102,449 | Ps. | 17,439,370 | Ps. | 4,461,404 | Ps. | 118,003,223 | Ps. | 120,596,733 | ||||||||||
Right-of-use | Liability related to right-of-use assets | |||||||||||||||||||
| Towers & Sites | Property | Other equipment | Total | |||||||||||||||||
Balance at the beginning of the year | Ps. | 96,102,449 | Ps. | 17,439,370 | Ps. | 4,461,404 | Ps. | 118,003,223 | Ps. | 120,596,733 | ||||||||||
Additions and release | 5,745,869 | 309,576 | 1,514,519 | 7,569,964 | 4,833,959 | |||||||||||||||
Modifications | 8,559,335 | (3,035,831 | ) | 1,048,858 | 6,572,362 | 7,769,326 | ||||||||||||||
Depreciation | (22,064,413 | ) | (3,440,428 | ) | (2,866,244 | ) | (28,371,085 | ) | — | |||||||||||
Interest expense | — | — | — | — | 9,134,288 | |||||||||||||||
Payments | — | — | — | — | (29,623,565 | ) | ||||||||||||||
Translation adjustment | (3,124,365 | ) | 932,748 | 393,997 | (1,797,620 | ) | (3,383,500 | ) | ||||||||||||
Balance at December 31, 2020 | Ps. | 85,218,875 | Ps. | 12,205,435 | Ps. | 4,552,534 | Ps. | 101,976,844 | Ps. | 109,327,241 | ||||||||||
Right-of-use | Liability related to right-of-use assets | |||||||||||||||||||
| Towers & Sites | Property | Other equipment | Total | |||||||||||||||||
Balance at the beginning of the year | Ps. | 85,218,875 | Ps. | 12,205,435 | Ps. | 4,552,534 | Ps. | 101,976,844 | Ps. | 109,327,241 | ||||||||||
Additions and release | 3,145,941 | 482,456 | 1,052,022 | 4,680,419 | 3,060,042 | |||||||||||||||
Modifications | 10,945,985 | 1,024,573 | 998,161 | 12,968,719 | 12,535,394 | |||||||||||||||
Depreciation | (20,699,207 | ) | (3,221,499 | ) | (2,630,526 | ) | (26,551,232 | ) | — | |||||||||||
Interest expense | — | — | — | — | 7,301,216 | |||||||||||||||
Payments | — | — | — | — | (30,544,750 | ) | ||||||||||||||
Translation adjustment | (2,054,566 | ) | (554,260 | ) | (93,531 | ) | (2,702,357 | ) | (3,024,918 | ) | ||||||||||
Balance at December 31, 2021 | Ps. | 76,557,028 | Ps. | 9,936,705 | Ps. | 3,878,660 | Ps. | 90,372,393 | Ps. | 98,654,225 | ||||||||||
At December 31, 2020 and 2021, the total of the right-of-use assets include an amount of Ps. 18,499,851 and Ps. 14,785,012, corresponding to related parties, respectively and the total of lease liabilities include an amount of Ps. 20,016,478 and Ps. 16,212,629 corresponding to related parties, respectively.
The implementation of IFRS 16 required a significant effort due to the fact of the need to make certain estimates, such as the lease term, based on the non-cancelable period and the periods covered by options to extend the lease. The Company considered the extension of the lease terms beyond the non-cancelable period only when it was reasonably certain to extend it. The reasonability of the extension was affected by several factors, such as regulation, business model, and geographical business strategies.
F-
61
The lease debt of the Company is integrated according to its maturities as follows:
2021 | ||||
Short term | Ps. | 27,632,357 | ||
Long term | 71,021,868 | |||
Total | Ps. | 98,654,225 | ||
The Company’s long-term debt maturities as of December 31, 2021 are as follows:
Year ended December 31, | ||||
2023 | Ps. | 13,370,533 | ||
2024 | 22,664,124 | |||
2025 | 10,342,707 | |||
2026 and thereafter | 24,644,504 | |||
Total | Ps. | 71,021,868 | ||
During the years ended December 31, 2019, 2020 and 2021, the Company recognized expenses as follows:
| 2019 | ||||||||||||
| Others | Related parties | Total | ||||||||||
Depreciation expense of right-of-use assets | Ps. | 18,176,521 | Ps. | 5,417,045 | Ps. | 23,593,566 | ||||||
Interest expense on lease liabilities | 5,654,721 | 2,285,519 | 7,940,240 | |||||||||
Expense relating to short-term leases | 1,978,403 | 1,958 | 1,980,361 | |||||||||
Expense relating to leases of low-value assets | 25,935 | — | 25,935 | |||||||||
Variable lease payments | 1,299,502 | — | 1,299,502 | |||||||||
Total | Ps. | 27,135,082 | Ps. | 7,704,522 | Ps. | 34,839,604 | ||||||
| 2020 | ||||||||||||
| Others | Related parties | Total | ||||||||||
Depreciation expense of right-of-use assets | Ps. | 22,404,924 | Ps. | 5,966,161 | Ps. | 28,371,085 | ||||||
Interest expense on lease liabilities | 7,081,693 | 2,052,595 | 9,134,288 | |||||||||
Expense relating to short-term leases | 32,238 | — | 32,238 | |||||||||
Expense relating to leases of low-value assets | 2,883 | — | 2,883 | |||||||||
Variable lease payments | 78,494 | — | 78,494 | |||||||||
Total | Ps. | 29,600,232 | Ps. | 8,018,756 | Ps. | 37,618,988 | ||||||
2021 | ||||||||||||
| Others | Related parties | Total | ||||||||||
Depreciation expense of right-of-use assets | Ps. | 19,932,316 | Ps. | 6,618,916 | Ps. | 26,551,232 | ||||||
Interest expense on lease liabilities | 6,212,774 | 1,088,442 | 7,301,216 | |||||||||
Expense relating to short-term leases | 29,833 | — | 29,833 | |||||||||
Expense relating to leases of low-value assets | 685 | — | 685 | |||||||||
Variable lease payments | 68,236 | — | 68,236 | |||||||||
Total | Ps. | 26,243,844 | Ps. | 7,707,358 | Ps. | 33,951,202 | ||||||
F-
62
Impact on accounting for changes in lease payments applying the exemption.
Based on the information available for evaluation as of the date of adoption, the effect of applying this amendment to IFRS 16 in the Company’s consolidated financial statements as of December 31, 2021 was Ps. 59,104, reflecting an adjustment to accrued liability for leases and recognizing a benefit in the income statement for the period.
16. Accounts payable, accrued liabilities and asset retirement obligations
a)
At December 31, | ||||||||
| 2020 | 2021 | |||||||
Suppliers | Ps. | 74,285,881 | Ps. | 87,942,106 | ||||
Sundry creditors | 101,406,307 | 107,111,390 | ||||||
Interest payable | 7,661,762 | 6,827,225 | ||||||
Guarantee deposits from customers | 1,386,645 | 1,577,424 | ||||||
Dividends payable | 2,254,877 | 3,029,536 | ||||||
Total | Ps. | 186,995,472 | Ps. | 206,487,681 | ||||
b)
At December 31, | ||||||||
| 2020 | 2021 | |||||||
Current liabilities | ||||||||
Direct employee benefits payable | Ps. | 18,965,160 | Ps. | 20,052,946 | ||||
Contingencies | 31,326,691 | 34,338,518 | ||||||
Total | Ps. | 50,291,851 | Ps. | 54,391,464 | ||||
F-
63
The movements in contingencies for the years ended December 31, 2020 and 2021 are as follows:
Balance at December 31, 2019 | Business combination | Effect of translation | Increase of the year | Applications | Balance at December 31, 2020 | |||||||||||||||||||||||
Payments | Reversals | |||||||||||||||||||||||||||
Contingencies | Ps. | 34,379,969 | Ps. | 292 | Ps. | (4,290,753 | ) | Ps. | 7,442,292 | Ps. | (3,214,407 | ) | Ps. | (2,990,702 | ) | Ps. | 31,326,691 | |||||||||||
Balance at December 31, 2020 | Business combination | Effect of translation | Increase of the year | Applications | Balance at December 31, 2021 | |||||||||||||||||||||||
Payments | Reversals | |||||||||||||||||||||||||||
Contingencies | Ps. | 31,326,691 | Ps. | 0 | Ps. | 1,556,950 | Ps. | 7,425,182 | Ps. | (4,079,190 | ) | Ps. | (1,891,115 | ) | Ps. | 34,338,518 | ||||||||||||
Contingencies include tax, labor, regulatory and other legal type contingencies. See Note 17 b) for detail of contingencies.
c)
| Balance at December 31, 2019 | Business combination | Effect of translation | Increase of the year | Applications | Balance at December 31, 2020 | |||||||||||||||||||||||
| Payments | Reversals | |||||||||||||||||||||||||||
Asset retirement obligations | Ps. | 15,816,744 | Ps. | 0 | Ps. | 374,418 | Ps. | 2,412,908 | Ps. | (593,644 | ) | Ps. | (122,435 | ) | Ps. | 17,887,991 | ||||||||||||
Balance at December 31, 2020 | Business combination | Effect of translation | Increase of the year | Applications | Balance at December 31, 2021 | |||||||||||||||||||||||
Payments | Reversals | |||||||||||||||||||||||||||
Asset retirement obligations | Ps. | 17,887,991 | Ps. | 0 | Ps. | (910,181 | ) | Ps. | 1,273,201 | Ps. | (148,634 | ) | Ps. | (1,350,154 | ) | Ps. | 16,752,223 | |||||||||||
The discount rates used for the asset retirement obligation are based on market rates that are expected to be undertaken by the dismantling or restoration of cell sites and may include labor costs.
17. Commitments and Contingencies
a) Commitments
The Company and its subsidiaries have commitments that mature on different dates, related to committed capital expenditures.
As of December 31, 2021, the total amounts equivalent to the contract period are detailed below:
Year ended December 31, | ||||
2022 | Ps. | 7,770,936 | ||
2023 | 3,469,647 | |||
2024 | 2,808,660 | |||
2025 and thereafter | 19,960,884 | |||
Total | Ps. | 34,010,127 | ||
b) Contingencies
In each of the countries in which we operate, we are party to legal proceedings in the ordinary course of business. These proceedings include tax, labor, antitrust, contractual matters and administrative and judicial proceedings concerning regulatory matters regarding interconnection and tariffs. The following is a description of our material legal proceedings.
F-
64
(1) Telcel Mobile Termination Rates
The mobile termination rates between Telcel and other network operators have been the subject of various legal proceedings. With respect to interconnection fees for 2017, 2018, 2019, 2020 and 2021, Telcel has challenged the applicable resolutions and final resolutions are pending.
With respect to 2022, Telcel will challenge the applicable resolutions.
Given that the “zero rate” that prevented Telcel from charging termination rates in its mobile network was held unconstitutional by the Supreme Court (Suprema Corte de Justicia de la Nación or “SCJN”), the IFT has determined asymmetric interconnection rates for the termination of traffic in Telcel’s and other operators’ networks for 2018, 2019, 2020, 2021 and 2022. The resolutions setting such rates have been challenged by Telcel, and final resolutions are pending.
The Company expects that mobile termination rates, as well as other rates applicable to mobile interconnection (such as transit), will continue to be the subject of litigation and administrative proceedings. The Company cannot predict when or how these disputes will be resolved or the financial effects of any such resolution.
(
2
)Telcel Class Action Lawsuits
One of the three class action lawsuits that have been filed against Telcel by customers allegedly affected by Telcel’s quality of service and wireless and broadband rates continues in process, the remaining two lawsuits have been concluded without any adverse effect on the Company. At this stage, the Company cannot assess whether this class action lawsuit could have an adverse effect on the Company’s business and results of operations in the event that it is resolved against Telcel, due to uncertainty about the factual and legal claims underlying this proceeding. Consequently, the Company has not established a provision in the accompanying consolidated financial statements for an eventual loss arising from this proceeding.
(
3
) IFT Proceedings Against TelmexIn 2018, the IFT imposed a fine of Ps. 2,543,937 on Telmex relating to a sanction procedure triggered by the alleged breach in 2013 and 2014 of certain minimum quality goals for
dedicated
link services.
Telmex challenged this fine, and a final resolution is pending
.
() Brazilian Tax Matters
4
As of December 31, 2021, certain Company’s Brazilian subsidiaries had aggregate tax contingencies of Ps. 131,140,527 (R$ 35,554,192) for which the Company has established provisions of Ps. 17,915,605 (R$ 4,857,193) in the accompanying consolidated financial statements for eventual losses arising from contingencies that the Company considers probable.
The most significant contingencies for which provisions have been established are:
| • | Ps. (Imposto sobre a Circulação de Mercadorias e Prestação de Serviços or “ICMS” ) assessments; |
| • | Ps. 18,360,489 (R$ 4,977,808) aggregate contingencies and Ps. 3,228,656 (R$ 875,338) provisions related to social contribution on net income (Contribuição Social sobre o Lucro Lĺquido or “CSLL”) and corporate income tax (Imposto de Renda sobre Pessoa Jurĺdica or “IRPJ”) assessments; |
| • | Ps. provisions related to the social integration program (Programa de Integração Social or “PIS”) and the contribution for social security financing (Contribuição para o Financiamento da Seguridade Social or “COFINS”) assessments; |
| • | Ps. 11,684,785 (R$ 3,167,923) aggregate contingencies and Ps. 1,396,376 (R$ 378,579) provisions mainly related to an allegedly improper exclusion of interconnection revenues and costs from the basis used to |
F-
65
calculate Fund for Universal Telecommunication Services (Fundo de Universalização dos Serviços de Telecomunicações or “FUST”) obligations, which are being contested; |
| • | Ps. provisions related to an alleged underpayment of obligations to the Telecommunications Technology Development Fund (Fundo para o Desenvolvimento Tecnológico das Telecomunicações or “FUNTTEL”), which are being challenged and for which a final resolution is pending; |
| • | Ps. provisions related to the alleged nonpayment of Services Tax (Imposto Sobre Serviços or “ISS”) over several communication services, including Pay TV services, considered taxable for ISS by the Municipal Revenue Services, which are being challenged and for which a final resolution is pending; |
| • | Ps. provisions arising from, among other , things the alleged underpayment of IRRF and CIDE taxes and on remittances made to foreign operators as remuneration for completing international calls abroad (outgoing traffic); and |
| • | Ps. provisions related to the requirement to contribute to the Promotion of Public Radio Broadcasting (“EBC”). |
In addition, the Company’s Brazilian subsidiaries are subject to a number of contingencies for which it has not established provisions in the accompanying consolidated financial statements because the Company does not consider the potential losses related to these contingencies to be probable. These include Ps.
(R$
4,912,087)related to
an unpaid installation inspection
rate
(Taxa de Fiscalização de Instalação or “TFI”) allegedly due
to
the renovation of radio base stations, which is being challenged on the basis that there was no new equipment installation that could have led to this charge, along with any unpaid functioning inspection rate (Taxa de Fiscalização de Funcionamento or “TFF”).
(
5
) Anatel Challenge to Inflation AdjustmentsAnatel has challenged the calculation of inflation-related adjustments due under the concession agreements with Tess S.A. (“Tess”), and Algar Telecom Leste S.A. (“ATL”), two of the Company’s subsidiaries that were previously merged into Claro Brasil. Anatel rejected Tess and ATL’s calculation of the inflation-related adjustments applicable to 60%
of the concessions price (which was due in three equal annual installments, subject to inflation-related adjustments and interest), claiming that the companies’ calculation of the inflation related adjustments resulted in a shortfall of the installment payments. The companies filed declaratory and consignment actions seeking the resolution of the disputes and have obtained injunctions from the Federal Court of Appeal. suspending any payment until the pending appeals are resolved.
The amount of the alleged shortfall as well as the method used to calculate monetary corrections are in dispute. If other methods or assumptions are applied, the amount may increase. In 2021, Anatel calculated the monetary correction in a total amount of Ps. 24,620,529 (R$ 6,675,000). As of December 31, 2021, the Company has established a provision of Ps. 4,577,389 (R$ 1,241,000) in the accompanying consolidated financial statements for the losses arising from these contingencies, which the Company considers probable.
F-
66
18
. Employee BenefitsAn analysis of the net liability and net period cost for employee benefits i
s
as follows:At December 31, | ||||||||
| 2020 | 2021 | |||||||
Mexico | Ps. | 129,260,355 | Ps. | 110,225,654 | ||||
Puerto Rico | 14,924,874 | 12,502,377 | ||||||
Brazil | 8,913,548 | 6,108,744 | ||||||
Europe | 14,392,445 | 13,127,228 | ||||||
Ecuador | 488,161 | 601,239 | ||||||
El Salvador | 154,422 | 177,922 | ||||||
Nicaragua | 61,337 | 75,084 | ||||||
Honduras | 35,060 | 32,217 | ||||||
Total | Ps. | 168,230,202 | Ps. | 142,850,465 | ||||
For the year ended December 31 | ||||||||||||
| 2019 | 2020 | 2021 | ||||||||||
Mexico | Ps. | 12,788,464 | Ps. | 14,911,208 | Ps. | 15,507,652 | ||||||
Puerto Rico | 747,755 | 664,046 | 548,550 | |||||||||
Brazil | 511,964 | 722,412 | 724,587 | |||||||||
Europe | 2,526,957 | 1,701,424 | 1,753,872 | |||||||||
Ecuador | 34,425 | 67,402 | 111,353 | |||||||||
El Salvador | 0 | 15,751 | 19,081 | |||||||||
Nicaragua | 0 | 3,711 | 18,561 | |||||||||
Honduras | 0 | 0 | 4,718 | |||||||||
Total | Ps. | 16,609,565 | Ps. | 18,085,954 | Ps. | 18,688,374 | ||||||
a) Defined Benefit Plans
The defined benefit obligation (DBO) and plan assets for the pension and other benefit obligation plans, by country, are as follows:
At December 31 | ||||||||||||||||||||||||||||||||
2020 | 2021 | |||||||||||||||||||||||||||||||
| DBO | Plan Assets | Effect of asset ceiling | Net employee benefit liability | DBO | Plan Assets | Effect of asset ceiling | Net employee benefit liability | |||||||||||||||||||||||||
Mexico | Ps. | 278,434,302 | Ps. | (150,090,481 | ) | Ps. | — | Ps. | 128,343,821 | Ps. | 286,396,483 | Ps. | (177,270,561 | ) | Ps. | — | Ps. | 109,125,922 | ||||||||||||||
Puerto Rico | 40,240,193 | (25,315,319 | ) | — | 14,924,874 | 38,092,662 | (25,590,285 | ) | — | 12,502,377 | ||||||||||||||||||||||
Brazil | 18,568,932 | (16,143,783 | ) | 3,393,640 | 5,818,789 | 15,497,227 | (15,466,336 | ) | 4,422,459 | 4,453,350 | ||||||||||||||||||||||
Europe | 5,490,873 | — | — | 5,490,873 | 5,093,036 | — | — | 5,093,036 | ||||||||||||||||||||||||
Total | Ps. | 342,734,300 | Ps. | (191,549,583 | ) | Ps. | 3,393,640 | Ps. | 154,578,357 | Ps. | 345,079,408 | Ps. | (218,327,182 | ) | Ps. | 4,422,459 | Ps. | 131,174,685 | ||||||||||||||
F-
67
Below is a summary of the actuarial results generated for the pension and retirement plans as well as the medical services in Puerto Rico and Brazil; the pension plans and seniority premiums related to Telmex; the pension plan, the service awards plan and severance in Austria corresponding to the years ended December 31, 2019, 2020 and 2021:
| At December 31, 2019 | ||||||||||||||||
| DBO | Plan Assets | Effectofasset ceiling | Net employee benefit liability | |||||||||||||
Balance at the beginning of the year | Ps. | 306,702,447 | Ps. | (203,671,122 | ) | Ps. | 5,087,543 | Ps. | 108,118,868 | |||||||
Current service cost | 2,591,975 | 2,591,975 | ||||||||||||||
Interest cost on projected benefit obligation | 31,001,348 | 31,001,348 | ||||||||||||||
Expected return on plan assets | (20,070,037 | ) | (20,070,037 | ) | ||||||||||||
Changes in the asset ceiling during the period and others | 445,743 | 445,743 | ||||||||||||||
Past service costs and others | 144,481 | 144,481 | ||||||||||||||
Actuarial gain for changes in experience | (22,599 | ) | (22,599 | ) | ||||||||||||
Actuarial gain from changes in demographic assumptions | (129 | ) | (129 | ) | ||||||||||||
Actuarial loss from changes in financial assumptions | 36,163 | 36,163 | ||||||||||||||
Net period cost | Ps. | 33,606,758 | Ps. | (19,925,556 | ) | Ps. | 445,743 | Ps. | 14,126,945 | |||||||
Actuarial loss for changes in experience | 31,606,323 | 31,606,323 | ||||||||||||||
Actuarial gain from changes in demographic assumptions | (339,657 | ) | (339,657 | ) | ||||||||||||
Actuarial loss from changes in financial assumptions | 7,207,072 | 7,207,072 | ||||||||||||||
Changes in the asset ceiling during the period and others | (712,064 | ) | (712,064 | ) | ||||||||||||
Return on plan assets greater than discount rate (shortfall) | 423,514 | 423,514 | ||||||||||||||
Recognized in other comprehensive income | Ps. | 38,473,738 | Ps. | 423,514 | Ps. | (712,064 | ) | Ps. | 38,185,188 | |||||||
Contributions made by plan participants | 155,188 | (155,188 | ) | — | ||||||||||||
Contributions to the pension plan made by the Company | (1,337,610 | ) | (1,337,610 | ) | ||||||||||||
Benefits paid | (15,836,928 | ) | 15,836,928 | — | ||||||||||||
Payments to employees | (16,996,920 | ) | (16,996,920 | ) | ||||||||||||
Effect of translation | (3,534,509 | ) | 2,528,213 | (393,201 | ) | (1,399,497 | ) | |||||||||
Others | Ps. | (36,213,169 | ) | Ps. | 16,872,343 | Ps. | (393,201 | ) | Ps. | (19,734,027 | ) | |||||
Balance at the end of the year | 342,569,774 | (206,300,821 | ) | 4,428,021 | 140,696,974 | |||||||||||
Less short-term portion | (213,065 | ) | (213,065 | ) | ||||||||||||
Non-current obligation | Ps. | 342,356,709 | Ps. | (206,300,821 | ) | Ps. | 4,428,021 | Ps. | 140,483,909 | |||||||
F-
68
| At December 31, 2020 | ||||||||||||||||
| DBO | Plan Assets | Effect of asset ceiling | Net employee benefit liability | |||||||||||||
Balance at the beginning of the year | Ps. | 342,569,774 | Ps. | (206,300,821 | ) | Ps. | 4,428,021 | Ps. | 140,696,974 | |||||||
Current service cost | 2,810,584 | 2,810,584 | ||||||||||||||
Interest cost on projected benefit obligation | 30,482,173 | 30,482,173 | ||||||||||||||
Expected return on plan assets | (17,655,119 | ) | (17,655,119 | ) | ||||||||||||
Changes in the asset ceiling during the period and others | 278,639 | 278,639 | ||||||||||||||
Past service costs and other | 148,253 | 148,253 | ||||||||||||||
Actuarial gain for changes in experience | (8,945 | ) | (8,945 | ) | ||||||||||||
Actuarial gain from changes in demographic assumptions | (270 | ) | (270 | ) | ||||||||||||
Actuarial loss from changes in financial assumptions | 20,219 | 20,219 | ||||||||||||||
Net period cost | Ps. | 33,303,761 | Ps. | (17,506,866 | ) | Ps. | 278,639 | Ps. | 16,075,534 | |||||||
Actuarial gain for changes in experience | (9,677 | ) | (9,677 | ) | ||||||||||||
Actuarial gain from changes in demographic assumptions | (103,987 | ) | (103,987 | ) | ||||||||||||
Actuarial loss from changes in financial assumptions | 3,475,345 | 3,475,345 | ||||||||||||||
Changes in the asset ceiling during the period and others | (542,430 | ) | (542,430 | ) | ||||||||||||
Return on plan assets greater than discount rate (shortfall) | 12,320,777 | 12,320,777 | ||||||||||||||
Others | (924,084 | ) | (924,084 | ) | ||||||||||||
Recognized in other comprehensive income | Ps. | 2,437,597 | Ps. | 12,320,777 | Ps. | (542,430 | ) | Ps. | 14,215,944 | |||||||
Contributions made by plan participants | 137,947 | (137,947 | ) | — | ||||||||||||
Contributions to the pension plan made by the Company | (1,882,654 | ) | (1,882,654 | ) | ||||||||||||
Benefits paid | (19,740,727 | ) | 19,740,727 | — | ||||||||||||
Payments to employees | (14,426,720 | ) | (14,426,720 | ) | ||||||||||||
Effect of translation | (1,278,392 | ) | 2,217,201 | (770,590 | ) | 168,219 | ||||||||||
Others | Ps. | (35,307,892) | Ps. | 19,937,327 | Ps. | (770,590) | Ps. | (16,141,155) | ||||||||
Balance at the end of the year | 343,003,240 | (191,549,583 | ) | 3,393,640 | 154,847,297 | |||||||||||
Less short-term portion | (268,940 | ) | (268,940 | ) | ||||||||||||
Non-current obligation | Ps. | 342,734,300 | Ps. | (191,549,583) | Ps. | 3,393,640 | Ps. | 154,578,357 | ||||||||
F-
69
At December 31, 2021 | ||||||||||||||||
DBO | Plan Assets | Effect of asset ceiling | Net employee benefit liability | |||||||||||||
Balance at the beginning of the year | Ps. | 343,003,240 | Ps. | (191,549,583) | Ps. | 3,393,640 | Ps. | 154,847,297 | ||||||||
Current service cost | 2,090,896 | 2,090,896 | ||||||||||||||
Interest cost on projected benefit obligation | 28,913,257 | 28,913,257 | ||||||||||||||
Expected return on plan assets | (15,112,669 | ) | (15,112,669 | ) | ||||||||||||
Changes in the asset ceiling during the period and others | 215,544 | 215,544 | ||||||||||||||
Past service costs and other | 139,910 | 139,910 | ||||||||||||||
Actuarial gain for changes in experience | (23,024 | ) | (23,024 | ) | ||||||||||||
Actuarial gain from changes in demographic assumptions | (48 | ) | (48 | ) | ||||||||||||
Actuarial gain from changes in financial assumptions | (6,907 | ) | (6,907 | ) | ||||||||||||
Net period cost | Ps. | 30,974,174 | Ps. | (14,972,759) | Ps. | 215,544 | Ps. | 16,216,959 | ||||||||
Actuarial loss for changes in experience | 10,728,950 | 10,728,950 | ||||||||||||||
Actuarial gain from changes in demographic assumptions | (104,568 | ) | (104,568 | ) | ||||||||||||
Actuarial gain from changes in financial assumptions | (4,099,321 | ) | (4,099,321 | ) | ||||||||||||
Changes in the asset ceiling during the period and others | 969,433 | 969,433 | ||||||||||||||
Return on plan assets greater than discount rate (shortfall) | (22,198,615 | ) | (22,198,615 | ) | ||||||||||||
Recognized in other comprehensive income | Ps. | 6,525,061 | Ps. | (22,198,615 | ) | Ps. | 969,433 | Ps. | (14,704,121 | ) | ||||||
Contributions made by plan participants | 99,201 | (99,201 | ) | — | ||||||||||||
Contributions to the pension plan made by the Company | 311,108 | 311,108 | ||||||||||||||
Benefits paid | (10,574,420 | ) | 10,348,544 | (225,876 | ) | |||||||||||
Payments to employees | (25,042,314 | ) | (25,042,314 | ) | ||||||||||||
Effect of translation | 330,770 | (166,676 | ) | (156,158 | ) | 7,936 | ||||||||||
Others | Ps. | (35,186,763) | Ps. | 10,393,775 | Ps. | (156,158) | Ps. | (24,949,146) | ||||||||
Balance at the end of the year | 345,315,712 | (218,327,182 | ) | 4,422,459 | 131,410,989 | |||||||||||
Less short-term portion | (236,304 | ) | (236,304 | ) | ||||||||||||
Non-current obligation | Ps. | 345,079,408 | Ps. | (218,327,182) | Ps. | 4,422,459 | Ps. | 131,174,685 | ||||||||
In the case of other subsidiaries in Mexico, the net period cost of other employee benefits for the years ended December 31, 2019, 2020 and 2021 was Ps. 49,050, Ps. 174,994 and Ps.267,728, respectively. The balance of other employee benefits at December 31, 2020 and 2021 was Ps. 916,534 and Ps. 1,099,732, respectively.
In the case of Brazil, the net period cost of other benefits for the years ended December 31, 2019, 2020 and 2021 was Ps. 99,498, Ps. 268,562 and Ps. 225,984, respectively. The balance of employee benefits at December 31, 2020 and 2021 was Ps. 2,111,801 and Ps.1,380,764, respectively.
In the case of Ecuador, the net period cost of other benefits for the years ended December 31, 2019, 2020 and 2021 was Ps. 34,425, Ps. 67,402 and Ps. 111,353, respectively. The balance of employee benefits at December 31, 2020 and 2021 was Ps. 488,161 and Ps. 601,239, respectively.
F-
70
In the case of Central America, the net period cost of other benefits for the years ended December
31,
2020and
2021was Ps.
19,462and Ps.
42,360, respectively. The balance of employee benefits at December
31,
2020and
2021was Ps.
250,819and Ps.
285,223, respectively.
Plan assets are invested in:
At December 31
| 2020 | 2021 | |||||||||||||||||||||||
| Puerto Rico | Brazil | Mexico | Puerto Rico | Brazil | Mexico | |||||||||||||||||||
Equity instruments | 43 | % | — | 68 | % | 42 | % | — | 74 | % | ||||||||||||||
Debt instruments | 22 | % | 95 | % | 32 | % | 21 | % | 94 | % | 26 | % | ||||||||||||
Others | 35 | % | 5 | % | — | 37 | % | 6 | % | — | ||||||||||||||
| 100 | % | 100 | % | 100 | % | 100 | % | 100 | % | 100 | % | |||||||||||||
Included in the Telmex’s net pension plan liability are plan assets of Ps. 150,090,481 and Ps. 177,270,561 as of December 31, 2020 and 2021, respectively, of which 36.9% and 47.5% during 2020 and 2021, respectively, were invested in equity and debt instruments of both América Movil and also of related parties, primarily entities that are under common control of the Company’s principal shareholder. The Telmex pension plan recorded a re-measurement of its defined pension plan of Ps. 11,753,416 and Ps
. (
9,928,728) during 2020
and 2021
, respectively, attributable to a change in actuarial assumptions, and also a decline and an increase in the fair value of plan investments from December 31, 2020 to December 31, 2021. The decrease and increase in fair value of the aforementioned related party pension plan investments approximated Ps. 14,820,220 and Ps. (20,234,095) during the years ended December 31, 2020 and 2021, respectively.The assumptions used in determining the net period cost were as follows:
| 2019 | 2020 | 2021 | ||||||||||||||||||||||||||||||||||||||||
| Puerto Rico | Brazil | Mexico | Europe | Puerto Rico | Brazil | Mexico | Europe | Puerto Rico | Brazil | Mexico | Europe | |||||||||||||||||||||||||||||||
| 0.75%, | 0.25%, | 0.25%, | ||||||||||||||||||||||||||||||||||||||||
| 1.00% & | 6.48% & | 0.50% & | 8.51% & | 0.75% & | ||||||||||||||||||||||||||||||||||||||
Discount rate and long-term | 3.23 | % | 7.03 | % | 10.50 | % | 1.25% | 2.34 | % | 7.39 | % | 10.04 | % | 0.75% | 2.75 | % | 8.67% | 10.4 | % | 1.00% | ||||||||||||||||||||||
| 3.00%, | 3.00%, | 3.00%, | ||||||||||||||||||||||||||||||||||||||||
| 3.5% & | 3.5% & | 3.40% & | ||||||||||||||||||||||||||||||||||||||||
Rate of future salary increases | 2.75% | 3.80% | 3.20% | 4.40% | 2.75% | 3.25% | 2.84% | 4.10% | 2.75% | 3.25% | 2.80% | 4.00% | ||||||||||||||||||||||||||||||
Percentage of increase in health care costs for the coming year | 3.18% | 10.30% | 2.28% | 9.96% | 2.72% | 9.44% | ||||||||||||||||||||||||||||||||||||
Year to which this level will be maintained | N/A | 2029 | N/A | 2031 | NA | 2030 | ||||||||||||||||||||||||||||||||||||
Rate of increase of pensions | 1.60% | 1.60% | 1.60% | |||||||||||||||||||||||||||||||||||||||
Employee turnover rate* | 0.00%-1.38% | 0.00%-1.31% | 0.00%-1.12% | |||||||||||||||||||||||||||||||||||||||
| * | Depending on years of service |
F-
71
Biometric
| Puerto Rico: | ||
| Mortality: | RP 2014, MSS 202 1 Tables. | |
| Disability: | 1985 Pension Disability Table | |
| Brazil: | ||
| Mortality: | 2000 Basic AT Table for gender | |
| Disability for assets: | UP 84 modified table for gender | |
| Disability retirement: | 80 CSO Code Table | |
| Rotation: | Probability of leaving the Company other than death, Disability and retirement is zero | |
Europe
Life expectancy in Austria is base on “AVÖ 2018-P – Rechnungsgrundlagen für die Pensionsversicherung – Pagler & Pagler”.
| Telmex | ||
| Mortality: | Mexican 2000 (CNSF) adjusted | |
| Disability: | Mexican Social Security adjusted by Telmex experience | |
| Turnover: | Telmex experience | |
| Retirement: | Telmex experience |
For the year ended December 31, 2021, the Company conducted a sensitivity analysis on the most significant variables that affect the DBO, simulating independently, reasonable changes to roughly 100 basis points in each of these variables. The increase (decrease) would have resulted in the DBO pension and other benefits at December 31, 2021 are as follows:
-100 points | +100 points | |||||||
Discount rate | Ps. | 32,094,727 | Ps. | (22,626,321 | ) | |||
Health care cost trend rat | Ps. | (431,724 | ) | Ps. | 499,356 | |||
Telmex Plans
Part of the Telmex´s employees are covered under defined benefit pension plans and seniority premiums. Pension benefits and seniority premiums are determined on the basis in their final year of employment, their seniority, and their age at the time of retirement. Telmex has set up an irrevocable trust fund to finance these employee benefits and has adopted the policy of making contributions to such fund when it is considered necessary.
Europe
Defined benefit pension plans
A1 Telekom Austria Group provides defined benefits for certain former employees in Austria. All eligible employees are retired and were employed prior to January 1, 1975. This unfunded plan provides benefits based on a percentage of salary and years employed, not exceeding 80% of the salary before retirement, and taking into consideration the pension provided by the social security system. A1 Telekom Austria Group is exposed primarily to the risk of development of life expectancy and inflation because the benefits from pension plans are lifetime benefits. Furthermore, at December 31, 2021, approximately 24% (2020: 20%) of the obligation for pensions relate to the employees of the company Akenes in Lausanne.
F-
72
Service awards
Civil servants and certain employees (in the following “employees”) are eligible to receive service awards. In accordance with the legal regulations, eligible employees receive a cash bonus of two months’ salary after 25 years of service and four months’ salary after 40 years of service. Employees with at least 35 years of service when retiring (at the age of 65) or who are retiring based on specific legal regulations are also eligible to receive the service award of four monthly salaries. The obligation is accrued over the period of service, taking into account the employee turnover rate for employees who leave employment prematurely. The main risk that A1 Telekom Austria Group is exposed to is the risk of development of salary increases and changes of interest rates.
Severance
Defined contribution plans
Employees who started work for A1 Telekom Austria Group in Austria on or after January 1, 2003 are covered by a defined contribution plan. In 2021, A1 Telekom Austria Group paid Ps. 68,425 (2020: Ps. 66,294), 1.53% of the salary or wage, into this defined contribution plan (BAWAG Allianz Mitarbeitervorsorgekasse AG).
Defined benefit plans
Severance benefit obligations for employees, whose employment commenced before January 1, 2003, excluding civil servants, are covered by defined benefit plans. Upon termination of employment by A1 Telekom Austria Group or upon retirement, eligible employees receive severance payments. Depending on their time in service, their severance amounts to a multiple of their monthly basic compensation plus variable components such as overtime or bonuses, up to a maximum of twelve monthly salaries. In case of death, the heirs of eligible employees receive 50% of the severance benefits. The primary risks to A1 Telekom Austria Group are salary increases and changes of interest rates.
b) Defined Contribution Plans
Brazil
Claro makes contributions to the DCP through Embratel Social Security Fund – Telos. Contributions are computed based on the salaries of the employees, who decide on the percentage of their contributions to the plan (participants enrolled before October 31st, 2014 is from 1% to 8% and, for those subscribed after that date, the contribution is from 1% to 7% of their salaries). Claro contributes the same percentage as the employee, capped at 8% of the participant’s balance for the employees that are eligible to participate in this plan.
At December 31, 2020 and 2021, the balance of the DCP liability was Ps. 980,014 and Ps 61,649, respectively.
.
274,630 respectively. For the years ended December 31, 2019, 2020 and 2021 the cost of labor were Ps. 3,365, Ps. 2,930 and Ps.Europe
In Austria, pension benefits are generally provided by the social security system for employees, and by the government for civil servants. The contributions of 12.55% of gross salaries that A1 Telekom Austria Group made in 2021 to the social security system and the government in Austria amount to Ps. 1,436,587 (2020: Ps. 1,474,721). In 2021, contributions of the foreign subsidiaries into the respective systems range between 7% and 29% of gross salaries and amount to Ps. 601,626 (2020: Ps. 601,476).
Additionally, A1 Telekom Austria Group offers a defined contribution plan for employees of some of its Austrian subsidiaries. A1 Telekom Austria Group’s contributions to this plan are based on a percentage of the compensation not exceeding 5%. In 2021, the annual expenses for this plan amounted to Ps. 286,195 (2020: Ps. 295,567).
F-
73
As of December 31, 2020 and 2021 the liability related to this defined contribution plan amounted to Ps. 134,034 and Ps. 114,233, respectively.
Other countries
For the rest of the countries where the Company operates and that do not have defined benefit plans or defined contribution plans, the Company makes contributions to the respective governmental social security agencies which are recognized in results of operations as they are incurred.
c) Long-term direct employee benefits
| Balance at December 31, 2019 | Effect of translation | Increase of the year | Payments | Balance at December 31, 2020 | ||||||||||||||||
Long-term direct employee benefits | Ps. | 8,175,767 | Ps. | 1,256,880 | Ps. | 1,729,392 | Ps. | (2,411,436 | ) | Ps. | 8,750,603 | |||||||||
Balance at December 31, 2020 | Effect of translation | Increase of the year | Payments | Balance at December 31, 2021 | ||||||||||||||||
Long-term direct employee benefits | Ps. | 8,750,603 | Ps. | (328,619 | ) | Ps. | 1,824,693 | Ps. | (2,320,831 | ) | Ps. | 7,925,846 | ||||||||
�� | ||||||||||||||||||||
In 2008, a comprehensive restructuring program was initiated in the segment Austria. The provision for restructuring includes future compensation of employees who will no longer provide services for A1 Telekom Austria Group but who cannot be laid off due to their status as civil servants. These employment contracts are onerous contracts under IAS 37, as the unavoidable cost related to the contractual obligation exceeds the future economic benefit. The restructuring program also includes social plans for employees whose employment will be terminated in a socially responsible way. In 2009 and every year from 2011 to 2019, new social plans were initiated that provide for early retirement, special severance packages and golden handshake options. Due to their nature as termination benefits, these social plans are accounted for according to IAS 19.
F-7
4
19. Financial Assets and Liabilities
Set out below is the categorization of the financial instruments, excluding cash and cash equivalents, held by the Company as of December 31, 2020 and 2021:
December 31, 2020 | ||||||||||||
Loans and Receivables | Fair value through profit or loss | Fair value through OCI | ||||||||||
Financial Assets: | ||||||||||||
Equity investments at fair value through OCI and other short term investments | Ps. | 62,940 | Ps. | — | Ps. | 50,033,111 | ||||||
Accounts receivable from subscribers, distributors, contractual assets and other | 171,213,415 | — | — | |||||||||
Related parties | 1,391,300 | — | — | |||||||||
Derivative financial instruments (Note 7) | — | 20,928,335 | — | |||||||||
Total current assets | 172,667,655 | 20,928,335 | 50,033,111 | |||||||||
Non-current assets | ||||||||||||
Debt instruments at fair value through OCI | 0 | — | 4,540,344 | |||||||||
Total | Ps. | 172,667,655 | Ps. | 20,928,335 | Ps. | 54,573,455 | ||||||
Financial Liabilities: | ||||||||||||
Debt | Ps. | 628,382,956 | Ps. | — | Ps. | — | ||||||
Liability related to right-of-use of assets | 109,327,241 | — | — | |||||||||
Accounts payable | 186,995,472 | — | — | |||||||||
Related parties | 3,999,916 | — | — | |||||||||
Derivative financial instruments (Note 7) | — | 14,230,249 | — | |||||||||
Total | Ps. | 928,705,585 | Ps. | 14,230,249 | Ps. | — | ||||||
F-
75
December 31, 2021 | ||||||||||||
Loans and Receivables | Fair value through profit or loss | Fair value through OCI | ||||||||||
Financial Assets: | ||||||||||||
Equity investments at fair value through OCI and other short term investments | Ps. | 15,026 | Ps. | — | Ps. | 117,688,176 | ||||||
Accounts receivable from subscribers, distributors, contractual assets and other | 166,041,321 | — | — | |||||||||
Related parties | 1,158,611 | — | — | |||||||||
Derivative financial instruments (Note 7) | — | 10,130,806 | — | |||||||||
Total current assets | 167,214,958 | 10,130,806 | 117,688,176 | |||||||||
Non-current assets | ||||||||||||
Debt instruments at fair value through OCI | — | — | 6,894,757 | |||||||||
Total | Ps. | 167,214,958 | Ps. | 10,130,806 | Ps. | 124,582,933 | ||||||
Financial Liabilities: | ||||||||||||
Debt | Ps. | 564,030,102 | Ps. | — | Ps. | — | ||||||
Liability related to right-of-use of assets | 98,654,225 | — | — | |||||||||
Accounts payable | 201,341,806 | — | — | |||||||||
Related parties | 4,216,882 | — | — | |||||||||
Derivative financial instruments (Note 7) | — | 10,034,508 | — | |||||||||
Total | Ps. | 868,243,015 | Ps. | 10,034,508 | Ps. | — | ||||||
Fair value hierarchy
The Company’s valuation techniques used to determine and disclose the fair value of its financial instruments are based on the following hierarchy:
Level 1: Quoted prices (unadjusted) in active markets for identical assets or liabilities;
Level 2: Variables other than quoted prices in Level 1 that are observable for the asset or liability, either directly (prices) or indirectly (derived from prices); and
Level 3: Variables used for the asset or liability that are not based on any observable market data (non-observable variables).
F-7
6
The fair value for the financial assets (excluding cash and cash equivalents) and financial liabilities shown in the consolidated statements of financial position at December 31, 2020 and 2021 is as follows:
Measurement of fair value at December 31, 2020 | ||||||||||||||||
Level 1 | Level 2 | Level 3 | Total | |||||||||||||
Assets: | ||||||||||||||||
Equity investments at fair value through OCI and other short-term investments | Ps. | 50,033,111 | Ps. | 62,940 | Ps. | — | Ps. | 50,096,051 | ||||||||
Derivative financial instruments (Note 7) | — | 20,928,335 | — | 20,928,335 | ||||||||||||
Revalued of assets (Note 23) | — | — | 107,152,628 | 107,152,628 | ||||||||||||
Pension plan assets (Note 18) | 168,939,091 | 22,589,392 | 21,100 | 191,549,583 | ||||||||||||
Total current assets | 218,972,202 | 43,580,667 | 107,173,728 | 369,726,597 | ||||||||||||
Debt instruments at fair value through OCI | — | 4,540,344 | — | 4,540,344 | ||||||||||||
Total | Ps. | 218,972,202 | Ps. | 48,121,011 | Ps. | 107,173,728 | Ps. | 374,266,941 | ||||||||
Liabilities: | ||||||||||||||||
Debt | Ps. | 578,712,562 | Ps. | 135,645,912 | Ps. | — | Ps. | 714,358,474 | ||||||||
Liability related to right-of-use of assets | 109,327,241 | — | — | 109,327,241 | ||||||||||||
Derivative financial instruments (Note 7) | — | 14,230,249 | — | 14,230,249 | ||||||||||||
Total | Ps. | 688,039,803 | Ps. | 149,876,161 | Ps. | — | Ps. | 837,915,964 | ||||||||
Measurement of fair value at December 31, 2021 | ||||||||||||||||
Level 1 | Level 2 | Level 3 | Total | |||||||||||||
Assets: | ||||||||||||||||
Equity investments at fair value through OCI and other short-term investments | Ps. | 117,688,176 | Ps. | 15,026 | Ps. | — | Ps. | 117,703,202 | ||||||||
Derivative financial instruments (Note 7) | — | 10,130,806 | — | 10,130,806 | ||||||||||||
Revalued of assets (Note 23) | — | — | 98,172,675 | 98,172,675 | ||||||||||||
Pension plan assets (Note 18) | 196,148,604 | 22,124,138 | 54,440 | 218,327,182 | ||||||||||||
Total current assets | 313,836,780 | 32,269,970 | 98,227,115 | 444,333,865 | ||||||||||||
Debt instruments at fair value through OCI | — | 6,894,757 | — | 6,894,757 | ||||||||||||
Total | Ps. | 313,836,780 | Ps. | 39,164,727 | Ps. | 98,227,115 | Ps. | 451,228,622 | ||||||||
Liabilities: | ||||||||||||||||
Debt | Ps. | 440,660,165 | Ps. | 180,122,540 | Ps. | — | Ps. | 620,782,705 | ||||||||
Liability related to right-of-use of assets | 98,654,225 | — | — | 98,654,225 | ||||||||||||
Derivative financial instruments | — | 10,034,508 | — | 10,034,508 | ||||||||||||
Total | Ps. | 539,314,390 | Ps. | 190,157,048 | Ps. | — | Ps. | 729,471,438 | ||||||||
F-7
7
Fair value of derivative financial instruments is valued using valuation techniques with market observable inputs. To determine its Level 2 fair value, the Company applies different valuation techniques including forward pricing and swaps models, using present value calculations. The models incorporate various inputs including credit quality of counterparties, foreign exchange spot and forward rates and interest rate curves. Fair value of debt Level 2 has been determined using a model based on present value calculation incorporating credit quality of AMX. The Company’s investment in equity investments at fair value, specifically the investment in KPN and Verizon, is valued using the quoted prices (unadjusted) in active markets for identical assets. The net realized (loss) gain related to derivative financial instruments for the years ended December 31, 2020 and 2021 was Ps. 2,606,938 and Ps. (1,664,465) respectively.
The fair value of the asset revaluation was calculated using valuation techniques, using observable market data and internal information on transactions carried out with independent third parties. To determine fair value we use level 2 and 3 information, the Company used inputs such as average rents, contract term and discount rates for discounted flow modeling techniques; in the case of discount rates, we use level 2 data where the information is public and is found in recognized databases, such as country risks, inflation, etc. In the case of average rents and contract terms, we use level 3 data, where the information is mainly internal based on lease contracts entered into with independent third parties.
During the end of the period ended December 31, 2020 and 2021, there were 0 transfers between the Level 1 and Level 2 fair value measurement hierarchies.
Changes in liabilities arising from financing activities
At 2019 | Cash flow | Foreign currency exchange and other | At December 31, 2020 | |||||||||||||
Debt | Ps. | 624,254,477 | Ps. | (53,091,801 | ) | Ps. | 57,220,280 | Ps. | 628,382,956 | |||||||
Liability related to right-of-use of assets | 120,596,733 | (29,623,565 | ) | 18,354,073 | 109,327,241 | |||||||||||
Total liabilities from financing activities | Ps. | 744,851,210 | Ps. | (82,715,366 | ) | Ps. | 75,574,353 | Ps. | 737,710,197 | |||||||
At December 31, 2020 | Cash flow | Foreign currency exchange and other | At December 31, 2021 | |||||||||||||
Debt | Ps. | 628,382,956 | Ps. | (58,354,281 | ) | Ps. | (5,998,573 | ) | Ps. | 564,030,102 | ||||||
Liability related to right-of-use of assets | 109,327,241 | (30,544,750 | ) | 19,871,734 | 98,654,225 | |||||||||||
Total liabilities from financing activities | Ps. | 737,710,197 | Ps. | (88,899,031 | ) | Ps. | 13,873,161 | Ps. | 662,684,327 | |||||||
20. Shareholders’ Equity
a)
represented as of December 31, 2021 by a total of 66,411,260,649 shares (including treasury shares available for placement in accordance with the provisions of the Ley del Mercado de Valores), of which (i) 20,554,697,460 are “AA” shares (full voting rights); (ii) 502,404,175 are “A” shares (full
voting rights); and (iii) 45,354,159,014 are “L” shares (limited voting rights).
b)
F-7
8
c)
d)
The Company’s bylaws contain restrictions and limitations related to the subscription and acquisition of “AA” shares by non-Mexican investors.
e)
“A” shares, which may be freely subscribed, must not represent more than 19.6% of capital stock and must not exceed 49% of the common shares representing such capital. Common shares (entitled to full voting rights, represented by “AA” and “A” shares), must represent no more than 51% of the Company’s capital stock.
Lastly
, “L” shares which have limited voting rights and may be freely subscribed may not exceed, along with “A” shares,
80% of the Company’s capital stock. For purposes of determining these restrictions, the percentages mentioned above refer only to the number of the Company’s shares outstanding.
Dividends
On April 26, 2021, the Company’s shareholders approved, among other resolutions, the payment of a dividend of Ps. 0.40 (forty peso cents) per share to each of the shares series of its capital stock “AA”, “A” and “L”. It was approved, that such dividend would be paid in two installments of Ps. 0.20 (twenty peso cents) each, on July 19 and November 08, 2021 respectively.
On April 24, 2020, the Company’s shareholders approved, among other resolutions, the payment of a dividend of Ps. 0.38 (thirty-eight peso cents) per share to each of the shares series of its capital stock “AA”, “A” and “L”. It was approved, that such dividend would be paid in two installments of Ps. 0.19 (nineteen peso cents) each, on July 20 and November 09, 2020 respectively.
Legal Reserve
According to the Ley General de Sociedades Mercantiles, companies must allocate from the net profit of each year, at least 5% to increase the legal reserve until it reaches 20% of its capital stock. This reserve may not be distributed to shareholders during the existence of the Company, except as a stock dividend. As of December 31, 2021 and 2020, the legal reserve amounted Ps. 358,440.
F-7
9
Restrictions on Certain Transactions
Pursuant to the Company’s bylaws any transfer of more than 10% of the full voting shares (“A” shares and “AA” shares), effected in one or more transactions by any person or group of persons acting in concert, requires prior approval by our Board of Directors. If the Board of Directors denies such approval, however, the Company bylaws require it to designate an alternate transferee, who must pay market price for the shares as quoted on the Bolsa Mexicana de Valores, S.A.B. de C.V.
Payment of Dividends
Dividends, either in cash or in kind, paid with respect to the “A” Shares, “L” Shares, “A” Share ADSs or “L” Share ADSs will generally be subject to a 10% Mexican withholding tax (provided that no Mexican withholding tax will apply to distributions of net taxable profits generated before 2014). Nonresident holders could be subject to a lower tax rate, to the extent that they are eligible for benefits under an income tax treaty to which Mexico is a party.
Earnings per Share
The following table shows the computation of the basic and diluted earnings per share:
For the years ended December 31, | ||||||||||||
2019 | 2020 | 2021 | ||||||||||
Net profit for the period attributable to equity holders of the parent from continuing operations | Ps. | 57,886,001 | Ps. | 29,859,980 | Ps. | 70,712,449 | ||||||
Net profit for the period attributable to equity holders of the parent from discontinued operations | 9,844,889 | 16,992,625 | 121,710,718 | |||||||||
Net profit for the period attributable to equity holders of the parent | 67,730,890 | 46,852,605 | 192,423,167 | |||||||||
Weighted average shares (in millions) | 66,016 | 66,265 | 65,967 | |||||||||
Earnings per share attributable to equity holders of the parent continuing operations | Ps. | 0.88 | Ps. | 0.45 | Ps. | 1.07 | ||||||
Earnings per share attributable to equity holders of the parent discontinued operations | Ps. | 0.15 | Ps. | 0.26 | Ps. | 1.85 | ||||||
21. Components of other comprehensive loss (income)
The movement on the components of the other comprehensive (loss) income for the years ended December 31, 2019, 2020 and 2021 is as follows:
For the years ended December 31, | ||||||||||||
2019 | 2020 | 2021 | ||||||||||
Controlling interest: | ||||||||||||
Unrealized gain (loss) on equity investments at fair value, net of deferred taxes | Ps. | 883,409 | Ps. | (1,952,414 | ) | Ps. | 4,560,869 | |||||
Translation effect of foreign entities | (34,010,066 | ) | (13,558,774 | ) | (4,837,206 | ) | ||||||
Translation effect by discontinued operations | — | — | (829,163 | ) | ||||||||
Remeasurement of defined benefit plan, net of deferred taxes | (29,153,554 | ) | (10,026,454 | ) | 11,100,835 | |||||||
Asset’s revaluation surplus net of deferred taxes | — | 64,835,155 | — | |||||||||
Non-controlling interest of the items above | (1,908,304 | ) | 14,165,249 | (2,135,886 | ) | |||||||
Other comprehensive (loss) income | Ps. | (64,188,515 | ) | Ps. | 53,462,762 | Ps. | 7,859,449 | |||||
F-
80
22. Valuation of derivatives, interest cost from labor obligations and other financial items, net
For the years ended December 31, 2019, 2020 and 2021, valuation of derivatives and other financial items are as follows:
For the years ended December 31, | ||||||||||||
| 2019 | 2020 | 2021 | ||||||||||
Controlling interest: | ||||||||||||
Gain (loss) in valuation of derivatives, net | Ps. | 4,432,023 | Ps. | 12,378,193 | Ps. | (6,755,214 | ) | |||||
Capitalized interest expense (Note 10 b) | 2,233,358 | 1,771,613 | 1,527,259 | |||||||||
Commissions | (2,820,477 | ) | (1,135,082 | ) | (1,071,935 | ) | ||||||
Interest cost of labor obligations (Note 18) | (11,377,054 | ) | (13,105,693 | ) | (14,375,520 | ) | ||||||
Interest expense on taxes | (516,522 | ) | (59,032 | ) | (243,075 | ) | ||||||
Dividend received (Note 4) | 1,773,336 | 2,122,826 | 2,628,600 | |||||||||
Gain on net monetary positions | 4,267,194 | 3,262,512 | 4,876,842 | |||||||||
Other financial cost (i) | (4,989,702 | ) | (3,942,459 | ) | (837,023 | ) | ||||||
Total with discontinued operations | Ps. | (6,997,844 | ) | Ps. | 1,292,878 | Ps. | (14,250,066 | ) | ||||
| (i) | Includes discontinued operations of Tracfone (See note 2, Ac) |
23. Segments
América Móvil operates in different countries. As mentioned in Note 1, the Company has operations in Mexico, Guatemala, Nicaragua, Ecuador, El Salvador, Costa Rica, Brazil, Argentina, Colombia, Honduras, Chile, Peru, Paraguay, Uruguay, Dominican Republic, Puerto Rico, Panama, Austria, Croatia, Bulgaria, Belarus, Macedonian, Serbia and Slovenia. The accounting policies for the segments are the same as those described in Note 2.
The Chief Executive Officer, who is the Chief Operating Decision Maker (“CODM”), analyzes the financial and operating information by operating segment. All operating segments that (i) represent more than 10% of consolidated revenues, (ii) more than the absolute amount of its reported 10% of profits before income tax or (iii) more than 10% of consolidated assets, are presented separately.
The Company presents the following reportable segments for the purposes of its consolidated financial statements: Mexico (includes Telcel and Corporate operations and assets), Telmex (Mexico), Brazil, Southern Cone (includes Argentina, Chile, Paraguay and Uruguay), Colombia, Andean (includes Ecuador and Peru), Central America (includes Guatemala, El Salvador, Honduras, Nicaragua, Costa Rica and Panama), U.S.A. (excludes Puerto Rico), Caribbean (includes Dominican Republic and Puerto Rico), and Europe (includes Austria, Bulgaria, Croatia, Belarus, Slovenia, Macedonia and Serbia).
The segment Southern Cone comprises mobile communication services in Argentina as well as Chile, Paraguay and Uruguay. Beginning in 2018, hyperinflation accounting in accordance with IAS 29 was initially applied to Argentina, which results in the restatement of non-monetary assets, liabilities and all items of the statement of comprehensive income for the change in a general price index and the translation of these items applying the period-end exchange rate.
The Company considers that the quantitative and qualitative aspects of any aggregated operating segments (that is, Central America and Caribbean reportable segments) are similar in nature for all periods presented. In evaluating the appropriateness of aggregating operating segments, the key indicators considered included but were not limited to: (i) the similarity of key financial statements measures and trends, (ii) all entities provide telecommunications services, (iii) similarities of customer base and services, (iv) the methods to distribute services are the same, based on telephone plant in both cases, wireless and fixed lines, (v) similarities of governments and regulatory entities that oversee the activities and services of telecom companies, (vi) inflation trends, and (vii) currency trends.
F-
81
Mexico | Telmex | Brazil | Southern Cone | Colombia | Andean | Central America | U.S.A.(1) | Caribbean | Europe | Eliminations | Consolidated total | |||||||||||||||||||||||||||||||||||||
As of and for the year ended December 31, 2019 (in Ps.): | ||||||||||||||||||||||||||||||||||||||||||||||||
External revenues | 226,164,231 | 84,173,980 | 177,596,077 | 54,230,682 | 74,274,684 | 55,440,675 | 46,602,036 | — | 34,580,822 | 98,420,289 | — | 851,483,476 | ||||||||||||||||||||||||||||||||||||
Intersegment revenues | 11,676,015 | 11,863,364 | 4,182,248 | 11,041,705 | 361,386 | 92,249 | 132,061 | — | 1,136,879 | — | (40,485,907 | ) | — | |||||||||||||||||||||||||||||||||||
Total revenues | 237,840,246 | 96,037,344 | 181,778,325 | 65,272,387 | 74,636,070 | 55,532,924 | 46,734,097 | — | 35,717,701 | 98,420,289 | (40,485,907 | ) | 851,483,476 | |||||||||||||||||||||||||||||||||||
Depreciation and amortization | 24,742,622 | 16,346,927 | 39,424,474 | 13,847,506 | 13,439,489 | 10,256,129 | 11,045,817 | — | 6,322,648 | 24,975,146 | (2,881,971 | ) | 157,518,787 | |||||||||||||||||||||||||||||||||||
Operating income (loss) | 67,694,409 | 9,731,852 | 28,846,565 | 4,007,614 | 15,324,977 | 8,023,002 | 5,712,068 | — | 5,741,368 | 8,687,862 | (9,971,433 | ) | 143,798,284 | |||||||||||||||||||||||||||||||||||
Interest income | 23,713,455 | 1,839,973 | 3,155,681 | 896,256 | 1,306,571 | 1,283,788 | 532,046 | — | 1,478,560 | 115,359 | (28,037,017 | ) | 6,284,672 | |||||||||||||||||||||||||||||||||||
Interest expense | 30,972,658 | 1,439,785 | 19,021,965 | 3,849,318 | 2,952,123 | 2,422,887 | 1,406,720 | — | 1,435,862 | 2,220,168 | (27,810,532 | ) | 37,910,954 | |||||||||||||||||||||||||||||||||||
Income tax | 30,000,511 | 1,528,229 | 4,251,116 | 2,022,336 | 5,405,452 | 1,681,159 | 2,355,380 | — | 719,774 | 1,946,255 | 3,843 | 49,914,055 | ||||||||||||||||||||||||||||||||||||
Equity interest in net income (loss) of associated companies | (3,732 | ) | 46,789 | (1,538 | ) | (23,424 | ) | — | — | (28,795 | ) | — | — | (6,909 | ) | — | (17,609 | ) | ||||||||||||||||||||||||||||||
Net profit (loss) attributable to equity holders of the parent continues operations | 42,598,946 | (1,705,068 | ) | 5,618,095 | (6,984 | ) | 9,571,046 | (2,604,646 | ) | 2,335,963 | — | 4,312,630 | 5,051,145 | (7,285,126 | ) | 57,886,001 | ||||||||||||||||||||||||||||||||
Net profit (loss) attributable to equity holders of the parent discontinued operations | — | — | — | — | — | — | — | — | — | — | — | 9,844,889 | ||||||||||||||||||||||||||||||||||||
Net profit (loss) attributable to equity holders of the parent | 42,598,946 | (1,705,068 | ) | 5,618,095 | (6,984 | ) | 9,571,046 | (2,604,646 | ) | 2,335,963 | — | 4,312,630 | 5,051,145 | 2,559,763 | 67,730,890 | |||||||||||||||||||||||||||||||||
Assets by segment | 915,233,048 | 201,283,526 | 382,561,753 | 132,722,497 | 115,851,227 | 94,021,632 | 77,355,732 | 30,775,893 | 100,694,650 | 191,744,924 | (710,311,225 | ) | 1,531,933,657 | |||||||||||||||||||||||||||||||||||
Plant, property and equipment, net | 54,589,459 | 106,869,482 | 174,761,167 | 60,537,650 | 50,133,642 | 39,068,450 | 38,934,747 | 1,405,755 | 38,223,641 | 75,707,738 | (888,361 | ) | 639,343,370 | |||||||||||||||||||||||||||||||||||
Goodwill | 27,396,393 | 215,381 | 25,379,805 | 5,241,305 | 12,124,685 | 4,895,331 | 7,289,748 | 3,220,105 | 14,186,723 | 52,950,325 | — | 152,899,801 | ||||||||||||||||||||||||||||||||||||
Trademarks, net | 46,476 | 212,324 | 37,207 | — | — | — | — | 369,950 | 227,156 | 2,595,596 | — | 3,488,709 | ||||||||||||||||||||||||||||||||||||
Licenses and rights, net | 11,087,882 | 452,504 | 29,324,718 | 12,103,980 | 5,530,422 | 8,064,487 | 4,390,547 | — | 7,942,670 | 25,951,335 | — | 104,848,545 | ||||||||||||||||||||||||||||||||||||
Investment in associated companies | 3,562,323 | 610,807 | 111,073 | (7,806 | ) | 391 | — | 25,603 | — | — | — | (1,828,198 | ) | 2,474,193 | ||||||||||||||||||||||||||||||||||
Liabilities by segments | 718,354,229 | 175,774,964 | 297,877,328 | 103,330,525 | 55,576,253 | 55,463,339 | 37,993,180 | 31,557,816 | 54,276,868 | 124,319,541 | (349,497,251 | ) | 1,305,026,792 | |||||||||||||||||||||||||||||||||||
| (1) | Restated for discontinued operations. |
F-
82
Mexico | Telmex | Brazil | Southern Cone | Colombia | Andean | Central America | U.S.A. (1) | Caribbean | Europe | Eliminations | Consolidated total | |||||||||||||||||||||||||||||||||||||
As of and for the year ended December 31, 2020 (in Ps.): | ||||||||||||||||||||||||||||||||||||||||||||||||
External revenues | 214,578,600 | 77,920,910 | 163,865,421 | 55,484,744 | 77,282,658 | 53,846,358 | 48,073,436 | — | 37,182,842 | 111,472,191 | — | 839,707,160 | ||||||||||||||||||||||||||||||||||||
Intersegment revenues | 17,663,525 | 13,668,264 | 4,207,466 | 1,220,100 | 352,694 | 88,305 | 121,580 | — | 1,440,983 | — | (38,762,917 | ) | — | |||||||||||||||||||||||||||||||||||
Total revenues | 232,242,125 | 91,589,174 | 168,072,887 | 56,704,844 | 77,635,352 | 53,934,663 | 48,195,016 | — | 38,623,825 | 111,472,191 | (38,762,917 | ) | 839,707,160 | |||||||||||||||||||||||||||||||||||
Depreciation and amortization | 24,748,756 | 13,341,479 | 41,795,397 | 13,095,004 | 14,413,760 | 11,447,356 | 14,355,899 | — | 7,094,331 | 25,593,204 | (3,202,788 | ) | 162,682,398 | |||||||||||||||||||||||||||||||||||
Operating income (loss) | 70,851,525 | 11,204,433 | 25,203,504 | 1,877,079 | 15,111,947 | 8,698,645 | 4,004,501 | — | 6,701,086 | 13,159,865 | (11,309,206 | ) | 145,503,379 | |||||||||||||||||||||||||||||||||||
Interest income | 21,322,406 | 1,479,021 | 2,904,430 | 980,581 | 822,447 | 1,049,261 | 1,130,767 | — | 1,105,420 | 90,746 | (25,823,043 | ) | 5,062,036 | |||||||||||||||||||||||||||||||||||
Interest expense | 30,936,195 | 1,306,867 | 17,976,227 | 3,334,966 | 2,586,708 | 2,223,478 | 1,559,917 | — | 1,658,619 | 2,546,255 | (25,467,747 | ) | 38,661,485 | |||||||||||||||||||||||||||||||||||
Income tax | 4,905,863 | 577,178 | (4,442,598 | ) | 992,831 | 2,078,789 | 3,115,693 | 1,518,953 | — | 2,524,214 | 2,234,065 | 4,282 | 13,509,270 | |||||||||||||||||||||||||||||||||||
Equity interest in net income (loss) of associated companies | (3,820 | ) | 23,955 | (2,972 | ) | (15,422 | ) | — | — | — | — | — | (288,747 | ) | — | (287,006 | ) | |||||||||||||||||||||||||||||||
Net profit (loss) attributable to equity holders of the parent continues operations | 3,613,907 | (1,085,038 | ) | 4,963,424 | 1,456,062 | 16,579,303 | 4,649,047 | 1,919,558 | — | 3,294,111 | 7,777,426 | (13,307,820 | ) | 29,859,980 | ||||||||||||||||||||||||||||||||||
Net profit (loss) attributable to equity holders of the parent discontinued operations | — | — | — | — | — | — | — | — | — | — | — | 16,992,625 | ||||||||||||||||||||||||||||||||||||
Net profit (loss) attributable to equity holders of the parent | 3,613,907 | (1,085,038 | ) | 4,963,424 | 1,456,062 | 16,579,303 | 4,649,047 | 1,919,558 | — | 3,294,111 | 7,777,426 | 3,684,805 | 46,852,605 | |||||||||||||||||||||||||||||||||||
Assets by segment | 947,396,510 | 203,081,314 | 386,982,711 | 118,266,380 | 132,210,369 | 101,717,708 | 88,690,683 | 35,083,285 | 109,914,293 | 239,583,759 | (737,878,785 | ) | 1,625,048,227 | |||||||||||||||||||||||||||||||||||
Plant, property and equipment, net | 52,117,395 | 110,751,083 | 145,307,497 | 62,157,797 | 48,876,853 | 36,102,261 | 37,855,227 | 1,761,595 | 39,128,447 | 82,595,077 | (876,229 | ) | 615,777,003 | |||||||||||||||||||||||||||||||||||
Revalued of assets | — | — | 36,076,207 | 7,494,408 | 12,893,284 | 9,500,708 | 7,059,247 | — | 2,572,504 | 31,556,270 | — | 107,152,628 | ||||||||||||||||||||||||||||||||||||
Goodwill | 26,949,185 | 215,381 | 16,048,092 | 5,436,675 | 12,253,743 | 4,866,363 | 6,345,659 | 3,362,899 | 14,186,723 | 53,388,139 | — | 143,052,859 | ||||||||||||||||||||||||||||||||||||
Trademarks, net | 126,823 | 181,094 | — | — | — | — | — | 269,325 | 219,087 | 2,981,089 | — | 3,777,418 | ||||||||||||||||||||||||||||||||||||
Licenses and rights, net | 12,017,318 | 100,623 | 26,171,345 | 12,099,873 | 12,363,039 | 6,870,531 | 5,427,857 | — | 8,616,880 | 27,963,250 | — | 111,630,716 | ||||||||||||||||||||||||||||||||||||
Investment in associated companies | 51,645 | 613,449 | 64,125 | (20,970 | ) | 395 | — | 25,413 | — | — | — | 1,095,703 | 1,829,760 | |||||||||||||||||||||||||||||||||||
Liabilities by segments | 725,408,198 | 193,840,756 | 263,989,566 | 61,786,265 | 63,610,642 | 53,379,366 | 34,252,511 | 33,141,315 | 60,839,340 | 138,747,621 | (319,064,971 | ) | 1,309,930,609 | |||||||||||||||||||||||||||||||||||
| (1) | Restated for discontinued operations. |
F-
83
Mexico | Telmex | Brazil | Southern Cone | Colombia | Andean | Central America | Caribbean | Europe | Eliminations | Consolidated total | ||||||||||||||||||||||||||||||||||
As of and for the year ended December 31, 2021 (in Ps.): | ||||||||||||||||||||||||||||||||||||||||||||
External revenues | 225,219,719 | 87,189,642 | 148,729,232 | 62,030,033 | 79,312,071 | 52,888,323 | 48,468,386 | 37,858,979 | 113,838,486 | — | 855,534,871 | |||||||||||||||||||||||||||||||||
Intersegment revenues | 18,041,465 | 15,237,420 | 4,044,386 | 329,000 | 360,638 | 73,828 | 98,530 | 2,069,648 | — | (40,254,915 | ) | — | ||||||||||||||||||||||||||||||||
Total revenues | 243,261,184 | 102,427,062 | 152,773,618 | 62,359,033 | 79,672,709 | 52,962,151 | 48,566,916 | 39,928,627 | 113,838,486 | (40,254,915 | ) | 855,534,871 | ||||||||||||||||||||||||||||||||
Depreciation and amortization | 25,797,791 | 12,740,332 | 40,342,871 | 14,996,243 | 15,067,211 | 11,211,523 | 11,962,486 | 6,987,129 | 27,469,463 | (3,948,183 | ) | 162,626,866 | ||||||||||||||||||||||||||||||||
Operating income (loss) | 77,783,972 | 21,100,316 | 21,867,457 | 2,144,825 | 15,165,356 | 7,457,802 | 8,216,945 | 8,661,475 | 13,421,147 | (9,686,654 | ) | 166,132,641 | ||||||||||||||||||||||||||||||||
Interest income | 14,864,242 | 758,126 | 2,104,574 | 821,594 | 431,314 | 833,540 | 269,379 | 701,785 | 116,031 | (17,065,758 | ) | 3,834,827 | ||||||||||||||||||||||||||||||||
Interest expense | 24,586,641 | 1,385,103 | 15,875,138 | 2,987,751 | 2,240,707 | 1,213,421 | 1,219,061 | 1,066,733 | 2,414,415 | (16,963,658 | ) | 36,025,312 | ||||||||||||||||||||||||||||||||
Income tax | 25,002,390 | 2,496,010 | (9,603,701 | ) | (3,795,160 | ) | 3,112,946 | 2,375,281 | 2,945,700 | 2,171,594 | 3,438,161 | 1,548 | 28,144,769 | |||||||||||||||||||||||||||||||
Equity interest in net income (loss) of associated companies | 85,648 | 44,525 | 4,575 | (19,073 | ) | — | — | — | — | (1,757 | ) | — | 113,918 | |||||||||||||||||||||||||||||||
Net profit (loss) attributable to equity holders of the parent continues operations | 34,195,093 | 4,594,450 | 14,185,905 | 415,994 | 5,959,563 | 4,180,473 | 4,099,930 | 5,151,166 | 8,313,018 | (10,383,143 | ) | 70,712,449 | ||||||||||||||||||||||||||||||||
Net profit (loss) attributable to equity holders of the parent discontinued operations | — | — | — | — | — | — | — | — | — | — | 121,710,718 | |||||||||||||||||||||||||||||||||
Net profit (loss) attributable to equity holders of the parent | 34,195,093 | 4,594,450 | 14,185,905 | 415,994 | 5,959,563 | 4,180,473 | 4,099,930 | 5,151,166 | 8,313,018 | (10,383,143 | ) | 192,423,167 | ||||||||||||||||||||||||||||||||
Assets by segment | 999,502,407 | 195,869,232 | 407,458,440 | 135,862,040 | 133,232,525 | 95,719,937 | 101,725,955 | 102,949,901 | 210,944,575 | (693,615,163 | ) | 1,689,649,849 | ||||||||||||||||||||||||||||||||
Plant, property and equipment, net | 50,420,866 | 118,056,718 | 153,607,199 | 64,864,986 | 48,888,907 | 34,395,339 | 42,407,727 | 41,601,009 | 79,764,422 | (983,169 | ) | 633,024,004 | ||||||||||||||||||||||||||||||||
Revalued of assets | — | — | 33,004,669 | 6,159,077 | 10,266,464 | 8,389,460 | 9,113,632 | 2,564,149 | 28,675,224 | — | 98,172,675 | |||||||||||||||||||||||||||||||||
Goodwill | 26,965,618 | 215,381 | 15,335,322 | 5,191,841 | 11,685,585 | 4,688,154 | 6,002,380 | 14,186,723 | 52,307,190 | — | 136,578,194 | |||||||||||||||||||||||||||||||||
Trademarks, net | 90,673 | 149,865 | — | — | — | — | — | 229,000 | 2,822,625 | — | 3,292,163 | |||||||||||||||||||||||||||||||||
Licenses and rights, net | 11,081,972 | 129,233 | 39,620,009 | 13,791,003 | 11,384,533 | 5,502,139 | 5,220,437 | 10,847,685 | 25,709,849 | — | 123,286,860 | |||||||||||||||||||||||||||||||||
Investment in associated companies | 4,725,279 | 522,403 | 65,699 | (34,401 | ) | 351 | — | 26,348 | — | — | (2,253,198 | ) | 3,052,481 | |||||||||||||||||||||||||||||||
Liabilities by segments | 679,954,783 | 176,177,522 | 273,655,967 | 72,702,285 | 65,631,866 | 44,676,727 | 42,823,861 | 53,885,848 | 134,357,142 | (308,257,878 | ) | 1,235,608,123 | ||||||||||||||||||||||||||||||||
F-8
4
24. Recently Issued Accounting Standards
New and amended standards and interpretations
The Company applied for the first-time certain standards and amendments, which are effective for annual periods beginning on or after January 1, 2021. The Company has not early adopted any other standard, interpretation or amendment that has been issued but is not yet effective.
Interest Rate Benchmark Reform – Phase 2: Amendments to IFRS 9, IAS 39, IFRS 7, IFRS 4 and IFRS 16.
The amendments provide temporary reliefs which address the financial reporting effects when an interbank offered rate (IBOR) is replaced with an alternative nearly risk-free interest rate (RFR). The amendments include the following practical expedients:
| • | To require contractual changes, or changes to cash flows that are directly required by the reform, to be treated as changes to a floating interest rate, equivalent to a movement in a market rate of interest |
| • | To permit changes required by IBOR reform to be made to hedge designations and hedge documentation without the hedging relationship being discontinued |
| • | To provide temporary relief to entities from having to meet the separately identifiable requirement when an RFR instrument is designated as a hedge of a risk component |
These amendments had no impact on the consolidated financial statements of the Company. The Company intends to use the practical expedients in future periods if they become applicable.
COVID-19-Related
On 28 May 2020, the IASB issuedRent Concessions – amendment to IFRS 16 Leases. The amendments provide relief to lessees from applying IFRS 16 guidance on lease modification accounting for rent concessions arising as a direct consequence of the
COVID-19-Related
COVID-19
pandemic. As a practical expedient, a lessee may elect not to assess whether aCOVID-19
related rent concession from a lessor is a lease modification. A lessee that makes this election accounts for any change in lease payments resulting from theCOVID-19
related rent concession the same way it would account for the change under IFRS 16, if the change were not a lease modification.The amendment was intended to apply until 30 June 2021, but as the impact of the
COVID-19
pandemic is continuing, on 31 March 2021, the IASB extended the period of application of the practical expedient to 30 June 2022.The amendment applies to annual reporting periods beginning on or after 1 April 2021; however, the Company has not receivedrent concessions.
COVID-19-related
New standards, amendments and interpretations not yet effective
The new and amended standards and interpretations that are issued, but not yet effective, up to the date of issuance of the Company’s financial statements are disclosed below. The Company intends to adopt these new and amended standards and interpretations, if applicable, when they become effective.
Amendments to IAS 1: Classification of Liabilities as Current or Non-current
In January 2020, the IASB issued amendments to paragraphs 69 to 76 of IAS 1 to specify the requirements for classifying liabilities as current or
non-current.
The amendments clarify:| • | What is meant by a right to defer settlement |
| • | That a right to defer must exist at the end of the reporting period |
| • | That classification is unaffected by the likelihood that an entity will exercise its deferral right |
F-8
5
| • | That only if an embedded derivative in a convertible liability is itself an equity instrument would the terms of a liability not impact its classification |
The amendments are effective for annual reporting periods beginning on or after January 1, 2023 and must be applied retrospectively. The Company is currently assessing the impact the amendments will have on current practice and whether existing loan agreements may require renegotiation; however, the amendments are not expected to have a material impact on the Company.
Reference to the Conceptual Framework – Amendments to IFRS 3
In May 2020, the IASB issued Amendments to IFRS 3 Business Combinations – Reference to the Conceptual Framework. The amendments are intended to replace a reference to the Framework for the Preparation and Presentation of Financial Statements, issued in 1989, with a reference to the Conceptual Framework for Financial Reporting issued in March 2018 without significantly changing its requirements.
The Board also added an exception to the recognition principle of IFRS 3 to avoid the issue of potential ‘day 2’ gains or losses arising for liabilities and contingent liabilities that would be within the scope of IAS 37 or IFRIC 21 Levies, if incurred separately.
At the same time, the Board decided to clarify existing guidance in IFRS 3 for contingent assets that would not be affected by replacing the reference to the Framework for the Preparation and Presentation of Financial Statements.
The amendments are effective for annual reporting periods beginning on or after January 1, 2022 and apply prospectively.
Property, Plant and Equipment: Proceeds before Intended Use – Amendments to IAS 16
In May 2020, the IASB issued Property, Plant and Equipment – Proceeds before Intended Use, which prohibits entities deducting from the cost of an item of property, plant and equipment, any proceeds from selling items produced while bringing that asset to the location and condition necessary for it to be capable of operating in the manner intended by management. Instead, an entity recognizes the proceeds from selling such items, and the costs of producing those items, in profit or loss. The amendment is effective for annual reporting periods beginning on or after January 1, 2022 and must be applied retrospectively to items of property, plant and equipment made available for use on or after the beginning of the earliest period presented when the entity first applies the amendment. The amendments are not expected to have a material impact on the Company.
Onerous Contracts – Costs of Fulfilling a Contract – Amendments to IAS 37
In May 2020, the IASB issued amendments to IAS 37 to specify which costs an entity needs to include when assessing whether a contract is onerous or loss-making.
The amendments apply a “directly related cost approach”. The costs that relate directly to a contract to provide goods or services include both incremental costs and an allocation of costs directly related to contract activities. General and administrative costs do not relate directly to a contract and are excluded unless they are explicitly chargeable to the counterparty under the contract.
The amendments are effective for annual reporting periods beginning on or after January 1, 2022. The Company will apply these amendments to contracts for which it has not yet fulfilled all its obligations at the beginning of the annual reporting period in which it first applies the amendments.
F-8
6
IFRS 1 First-time Adoption of International Financial Reporting Standards – Subsidiary as a first-time adopter
As part of its 2018-2020 annual improvements to IFRS standards process, the IASB issued an amendment to IFRS 1 First-time Adoption of International Financial Reporting Standards. The amendment permits a subsidiary that elects to apply paragraph D16(a) of IFRS 1 to measure cumulative translation differences using the amounts reported by the parent, based on the parent’s date of transition to IFRS.
This amendment is also applied to an associate or joint venture that elects to apply paragraph D16(a) of IFRS 1. The amendment is effective for annual reporting periods beginning on or after January 1, 2022 with earlier adoption permitted.
IFRS 9 Financial Instruments – Fees in the ’10 per cent’ test for derecognition of financial liabilities
As part of its 2018-2020 annual improvements to IFRS standards process the IASB issued amendment to IFRS 9. The amendment clarifies the fees that an entity includes when assessing whether the terms of a new or modified financial liability are substantially different from the terms of the original financial liability. These fees include only those paid or received between the borrower and the lender, including fees paid or received by either the borrower or lender on the other’s behalf. An entity applies the amendment to financial liabilities that are modified or exchanged on or after the beginning of the annual reporting period in which the entity first applies the amendment.
The amendment is effective for annual reporting periods beginning on or after January 1, 2022 with earlier adoption permitted. The amendments are not expected to have a material impact on the Company.
Definition of Accounting Estimates – Amendments to IAS 8
In February 2021, the IASB issued amendments to IAS 8, in which it introduces a definition of ‘accounting estimates’. The amendments clarify the distinction between changes in accounting estimates and changes in accounting policies and the correction of errors. Also, they clarify how entities use measurement techniques and inputs to develop accounting estimates.
The amendments are effective for annual reporting periods beginning on or after January 1, 2023 and apply to changes in accounting policies and changes in accounting estimates that occur on or after the start of that period. Earlier application is permitted as long as this fact is disclosed.
The amendments are not expected to have a material impact on the Company.
Disclosure of Accounting Policies – Amendments to IAS 1 and IFRS Practice Statement 2
In February 2021, the IASB issued amendments to IAS 1 and IFRS Practice Statement 2 Making Materiality Judgements, in which it provides guidance and examples to help entities apply materiality judgements to accounting policy disclosures. The amendments aim to help entities provide accounting policy disclosures that are more useful by replacing the requirement for entities to disclose their ‘significant’ accounting policies with a requirement to disclose their ‘material’ accounting policies and adding guidance on how entities apply the concept of materiality in making decisions about accounting policy disclosures.
The amendments to IAS 1 are applicable for annual periods beginning on or after January 1, 2023 with earlier application permitted. Since the amendments to the Practice Statement 2 provide non-mandatory guidance on the application of the definition of material to accounting policy information, an effective date for these amendments is not necessary.
F-
8
7
The Company is currently assessing the impact of the amendments to determine the impact they will have on the Company’s accounting policy disclosures.
25. Subsequent Events
a) In July 2020, the Company announced that its Brazilian subsidiary, Claro S.A. (“Claro”), agreed to extend and amend the binding offer submitted, jointly with Telefónica Brasil S.A. (“Telefonica”) and TIM S.A. (“TIM”), for the acquisition of the mobile business owned by Oi Group, in the amount of R
$
16,500million. Such joint offer contemplated, additionally, the possibility of entering into long term agreements for the use of infrastructure with Oi Group. The offer was submitted by the parties, and is subject to certain conditions, including their right to make a higher bid than another offer potentially presented by a third party (“right to top”) in the competitive process of Oi Group’s mobile business sale. Therefore, Claro believes that the joint offer with TIM and Telefonica is the one that best serves the interests of current customers of Oi, as it provides long-term experience in the Brazilian market, investment capacity and technical innovation to the sector as a whole; besides being in line with current regulation. On February 9, 2022, the Company announced that Brazil’s antitrust authority had approved the sale.
This
transactionclosed on
April 20, 2022. b) On March 18, 2022, the Company entered into a credit agreement providing for borrowings in an amount up to Ps.20,558,500 with a group of lenders and BBVA México, S.A., Institución de Banca Múltiple, Grupo Financiero BBVA México, as administrative agent for the lenders (the “Sitios Credit Facility”). The full principal amount available under the Sitios Credit Facility was disbursed on March 23, 2022. Under this credit agreement, the Company is an initial co-borrower with Torres Latinoamérica, S.A. de C.V. (“Torres”). In connection with the spin-off (through an escisión) by the Company of certain of its telecommunications towers and other associated passive infrastructure outside of Mexico to a new company (the “Sitios Spin-off”) to be named Sitios Latinoamérica, S.A.B. de C.V. (“Sitios”), on the date on which Sitios is duly incorporated in accordance with Mexican law, pursuant to the resolutions approved by the shareholders of the Company in the extraordinary shareholders’ meeting dated as of September 29, 2021, the Company will be released from its obligations under the Sitios Credit Facility and all liabilities with respect thereto will be transferred to Sitios, and Sitios will assume all of our obligations thereunder. After such date, Torres will continue to be a co-borrower under the Sitios Credit Facility and Torres do Brasil S.A. will become a guarantor thereunder.
c) In April 2022, the Company issued a bond for a total of U.S.$ 1 billion at a rate of 5.375% maturing in 2032. América Móvil plans to transfer, through the spin-off, the total amount of the bonds to Sitios and any obligation of the Company with respect to the Sitios notes will be extinguished.
d) On April 14, 2022, the Company acquired a loan of 1,640.8 million reais maturing in 2023 at a rate of 13.32%.
F-88