Exhibit 99.5
SILVERCORP METALS INC.
MANAGEMENT’s DISCUSSION AND ANALYSIS
For the Three and Nine Months Ended December 31, 2020
(Expressed in thousands of US dollars, except per share figures or otherwise stated)
Table of Contents
| 1. | Core Business and Strategy | 2 |
| 2. | Third Quarter Fiscal Year 2021 Highlights | 2 |
| 3. | Operating Review | 4 |
| 4. | Fiscal 2022 Production, Cash Cost, and Capital Expenditure Guidance | 14 |
| 5. | Investment in Associates | 16 |
| 6. | Financial Results | 18 |
| 7. | Liquidity and Capital Resources | 21 |
| 8. | Financial Instruments and Related Risks | 24 |
| 9. | Off-Balance Sheet Arrangements | 25 |
| 10. | Transactions with Related Parties | 26 |
| 11 | Alternative Performance (non-IFRS) Measures | 26 |
| 12. | Critical Accounting Policies and Estimates | 30 |
| 13. | New Accounting Standards | 30 |
| 14. | Other MD&A Requirements | 30 |
| 15. | Outstanding Share Data | 30 |
| 16. | Risks, Uncertainties, and Contingencies | 31 |
| 17. | Management’s Report on Internal Control over Financial Reporting | 35 |
| 18. | Directors and Officers | 36 |
| Technical Information | 36 | |
| Forward Looking Statements | 36 | |
| SILVERCORP METALS INC. |
| Management’s Discussion and Analysis |
| For the Three and Nine Months Ended December 31, 2020 |
| (Expressed in thousands of U.S. dollars, unless otherwise stated) |
This Management’s Discussion and Analysis (“MD&A”) is intended to help the reader understand the significant factors that have affected Silvercorp Metals Inc. and its subsidiaries’ (collectively, “Silvercorp” or the “Company”) performance and such factors that may affect its future performance. This MD&A should be read in conjunction with the Company’s unaudited condensed consolidated financial statements for the three and nine months ended December 31, 2020 and the related notes contained therein. In addition, the following should be read in conjunction with the audited consolidated financial statements of the Company for the year ended March 31, 2020, the related MD&A, the Annual Information Form (available on SEDAR at www.sedar.com), and the annual report on Form 40-F (available on EDGAR at www.sec.gov). The Company reports its financial position, results of operations and cash flow in accordance with International Financial Reporting Standards (“IFRS”) as issued by the International Accounting Standards Board (“IASB”). Silvercorp’s significant accounting policies are set out in Note 2 of the unaudited condensed consolidated financial statements for the three and nine months ended December 31, 2020, as well as Note 2 to the audited consolidated financial statements for the year ended March 31, 2020. This MD&A refers to various alternative performance (non-IFRS) measures such as total and cash cost per ounce of silver, net of by-product credits, all-in & all-in sustaining cost per ounce of silver, net of by-product credits, and production costs per tonne. Alternative performance (non-IFRS) measures do not have standardized meanings under IFRS. Accordingly, alternative performance (non-IFRS) measures should not be considered in isolation or as a substitute for measures of performance prepared in accordance with IFRS. To facilitate a better understanding of these measures as calculated by the Company, we have provided detailed descriptions and reconciliations, in section 11 of this MD&A.
This MD&A is prepared as of February 3, 2021 and expressed in thousands of U.S. dollars, except share, per share, unit cost, and production data, or unless otherwise stated. Figures may not add up precisely due to rounding.
| 1. | Core Business and Strategy |
Silvercorp is a profitable Canadian mining company currently producing silver, gold, lead, and zinc metals in concentrates from mines in China. The Company’s goal is to continuously create healthy returns to shareholders through efficient management, organic growth and the acquisition of profitable projects. Silvercorp balances profitability, social and environmental relationships, employees’ wellbeing, and sustainable development. Silvercorp operates several silver-lead-zinc mines at the Ying Mining District in Henan Province, China and the GC silver-lead-zinc mine in Guangdong Province, China. The Company’s common shares are traded on the Toronto Stock Exchange and NYSE American under the symbol “SVM”.
| 2. | Third Quarter Fiscal Year 2021 Highlights |
Mined 279,445 tonnes of ore, up 6% compared to the prior year quarter, with ore milled of 260,648 tonnes, a decrease of 2% compared to the prior year quarter;
Sold approximately 1.6 million ounces of silver, 800 ounces of gold, 16.8 million pounds of lead, and 9.0 million pounds of zinc, representing increases of 14% and 7% in gold and zinc sold and decreases of 4% and 11% in silver and lead sold compared to the prior year quarter;
Revenue of $53.3 million, up 20% or $8.8 million compared to $44.5 million in the prior year quarter;
Net income attributable to equity shareholders of $8.4 million or $0.05 per share, up 33% compared to $6.3 million or $0.04 per share in the prior year quarter;
Cash cost per ounce of silver1, net of by-product credits, of negative $2.76, compared to negative $1.21 in the prior year quarter;
All-in sustaining cost per ounce of silver1, net of by-product credits, of $6.92, compared to $7.21 in the prior year quarter;
Gain on equity investments of $0.6 million;
Cash flow from operations of $23.9 million compared to $24.9 million in the prior year quarter;
Paid dividends of $2.2 million, or $0.0125 per share, to equity shareholders;
Acquired a 26.99% interest in Whitehorse Gold Corp. (“WHG”) at total cost of $1.3 million, having a fair market value of $35.5 million as at December 31, 2020, as result of (a) receiving 5,740,286 WHG common shares under a spin-out transaction completed by New Pacific Metals Corp. (“NUAG”), and (b) subscribing for 5,774,000 WHG common shares under a private placement;
____________________
1 Alternative performance (non-IFRS) measure. Please refer to section 11 for reconciliation.
| Management’s Discussion and Analysis | Page 2 |
| SILVERCORP METALS INC. |
| Management’s Discussion and Analysis |
| For the Three and Nine Months Ended December 31, 2020 |
| (Expressed in thousands of U.S. dollars, unless otherwise stated) |
Won an online auction to acquire the exploration rights to the Zhonghe Silver Project from the Henan provincial government of China, with the mineral rights transfer contract pending the clearance of the project area as not being in military area by the related authorities;
Acquired a 45% interest in the La Yesca Silver Project in Mexico for approximately $7.6 million;
Investment in NUAG with a carrying value of $50.8 million and market value of $277.0 million and other investments of $18.8 million as at December 31,2020; and
Strong balance sheet with $204.1 million in cash and cash equivalents and short-term investments, an increase of $4.0 million or 2% compared to $200.1 million as at September 30, 2020. This does not include the investments in associates and equity investment in other companies, having a total market value of $331.3 million as at December 31, 2020.
| Management’s Discussion and Analysis | Page 3 |
| SILVERCORP METALS INC. |
| Management’s Discussion and Analysis |
| For the Three and Nine Months Ended December 31, 2020 |
| (Expressed in thousands of U.S. dollars, unless otherwise stated) |
| 3. | Operating Review |
(a) Consolidated Operating Performance
The following table summarizes the consolidated operational information for the three and nine months ended December 31, 2020 and 2019:
| Consolidated | Three months ended December 31, | Nine months ended December 31, | |||||||||||
| 2020 | 2019 | Changes | 2020 | 2019 | Changes | ||||||||
| Production Data | |||||||||||||
Mine Data | |||||||||||||
Ore Mined (tonne) | 279,445 | 262,586 | 6% | 801,853 | 779,235 | 3% | |||||||
Ore Milled (tonne) | 260,648 | 264,860 | -2% | 786,907 | 789,684 | 0% | |||||||
Head Grades | |||||||||||||
Silver (gram/tonne) | 216 | 228 | -5% | 222 | 241 | -8% | |||||||
Lead (%) | 3.2 | 3.7 | -13% | 3.5 | 3.7 | -6% | |||||||
Zinc (%) | 1.8 | 1.7 | 7% | 1.7 | 1.7 | -1% | |||||||
Recovery Rates | |||||||||||||
Silver (%) | 92.3 | 93.5 | -1% | 92.9 | 93.6 | -1% | |||||||
Lead (%) | 95.3 | 95.2 | 0% | 95.1 | 94.8 | 0% | |||||||
Zinc (%) | 82.4 | 80.2 | 3% | 79.9 | 77.4 | 3% | |||||||
| Cost Data | |||||||||||||
+ Mining cost per tonne of ore mined ($) | 78.90 | 78.65 | 0% | 76.66 | 76.31 | 0% | |||||||
Cash mining cost per tonne of ore mined ($) | 58.79 | 57.54 | 2% | 57.18 | 55.13 | 4% | |||||||
Depreciation and amortization charges per tonne of ore mined ($) | 20.11 | 21.11 | -5% | 19.48 | 21.18 | -8% | |||||||
+ Unit shipping costs ($) | 2.59 | 2.61 | -1% | 2.55 | 2.66 | -4% | |||||||
+ Milling costs per tonne of ore milled ($) | 13.23 | 13.58 | -3% | 11.79 | 12.85 | -8% | |||||||
Cash milling costs per tonne of ore milled ($) | 11.66 | 12.01 | -3% | 10.29 | 11.14 | -8% | |||||||
Depreciation and amortization charges per tonne of ore milled ($) | 1.57 | 1.57 | 0% | 1.50 | 1.71 | -12% | |||||||
+ Cash production cost per tonne of ore processed ($) | 73.04 | 72.16 | 1% | 70.02 | 68.93 | 2% | |||||||
+ All-in sustaining cost per tonne of ore processed ($) | 129.09 | 121.49 | 6% | 122.02 | 117.12 | 4% | |||||||
+ Cash cost per ounce of Silver, net of by-product credits ($) | (2.76 | ) | (1.21 | ) | -128% | (2.08 | ) | (2.06 | ) | -1% | |||
+ All-in sustaining cost per ounce of silver, net of by-product credits ($) | 6.92 | 7.21 | -4% | 6.48 | 5.64 | 15% | |||||||
| Concentrate inventory | |||||||||||||
Lead concentrate (tonne) | 1,153 | 3,815 | -70% | 1,153 | 3,815 | -70% | |||||||
Zinc concentrate (tonne) | 611 | 270 | 126% | 611 | 270 | 126% | |||||||
| Sales Data | |||||||||||||
Metal Sales | |||||||||||||
Silver (in thousands of ounces) | 1,647 | 1,709 | -4% | 5,259 | 5,458 | -4% | |||||||
Gold (in thousands of ounces) | 0.8 | 0.7 | 14% | 4.1 | 2.8 | 4% | |||||||
Lead (in thousands of pounds) | 16,806 | 18,779 | -11% | 56,242 | 55,690 | 1% | |||||||
Zinc (in thousands of pounds) | 8,965 | 8,353 | 7% | 23,334 | 22,342 | 4% | |||||||
Revenue | |||||||||||||
Silver (in thousands of $) | 30,720 | 24,040 | 28% | 89,951 | 75,037 | 20% | |||||||
Gold (in thousands of $) | 1,222 | 890 | 37% | 5,717 | 3,286 | 74% | |||||||
Lead (in thousands of $) | 12,853 | 14,133 | -9% | 41,614 | 45,513 | -9% | |||||||
Zinc (in thousands of $) | 7,923 | 5,039 | 57% | 17,314 | 14,236 | 22% | |||||||
Other (in thousands of $) | 578 | 406 | 42% | 1,777 | 1,898 | -6% | |||||||
| 53,296 | 44,508 | 20% | 156,373 | 139,970 | 12% | ||||||||
Average Selling Price, Net of Value Added Tax and Smelter Charges | |||||||||||||
Silver ($ per ounce) | 18.65 | 14.07 | 33% | 17.10 | 13.75 | 24% | |||||||
Gold ($ per ounce) | 1,528 | 1,271 | 20% | 1,394 | 1,174 | 19% | |||||||
Lead ($ per pound) | 0.76 | 0.75 | 1% | 0.74 | 0.82 | -10% | |||||||
Zinc ($ per pound) | 0.88 | 0.60 | 47% | 0.74 | 0.64 | 16% | |||||||
+ Alternative performance (Non-IFRS) measures, see section 11 for reconciliation.
| Management’s Discussion and Analysis | Page 4 |
| SILVERCORP METALS INC. |
| Management’s Discussion and Analysis |
| For the Three and Nine Months Ended December 31, 2020 |
| (Expressed in thousands of U.S. dollars, unless otherwise stated) |
(i) Mine and Mill Production
For the three months ended December 31, 2020 (“Q3 Fiscal 2021”), on a consolidated basis, the Company mined 279,445 tonnes of ore, up 6% or 16,859 tonnes compared to 262,586 tonnes in the three months ended December 31, 2019 (“Q3 Fiscal 2020”). Ore milled was 260,648 tonnes, a decrease of 2% or 4,212 tonnes, compared to 264,860 tonnes in Q3 Fiscal 2020. The decrease was mainly due to a 7% decrease in the ore milled at the Ying Mining District caused by power rationing in December 2020, as the local government is subject to an annual environmental emissions KPI assessment.
For the nine months ended December 31, 2020, on a consolidated basis, the Company mined 801,853 tonnes of ore, up 3% or 22,618 tonnes, compared to 779,235 tonnes mined in the same prior year period. Ore milled was 786,907 tonnes, a slight decrease of 2,777 tonnes, compared to 789,684 tonnes in the same prior year period.
(ii) Metal Sales
In Q3 Fiscal 2021, the Company sold approximately 1.6 million ounces of silver, 800 ounces of gold, 16.8 million pounds of lead, and 9.0 million pounds of zinc, an increase of 14% and 7% in gold and zinc sold, and a decrease of 4% and 11% in silver and lead sold, compared to 1.7 million ounces of silver, 700 ounces of gold, 18.8 million pounds of lead, and 8.4 million pounds of zinc in Q3 Fiscal 2020.
For the nine months ended December 31, 2020, the Company sold approximately 5.3 million ounces of silver, 4,100 ounces of gold, 56.2 million pounds of lead, and 23.3 million pounds of zinc, an increase of 46%, 1%, and 4% in gold, lead, and zinc sold, and a decrease of 4% in silver sold, compared to 5.5 million ounces of silver, 2,800 ounces of gold, 55.7 million pounds of lead, and 22.3 million pounds of zinc sold in the same prior year period.
As at December 31, 2020, the Company had inventories of 1,153 tonnes of silver-lead concentrate and 611 tonnes of zinc concentrate, compared to 1,327 tonnes of silver-lead concentrate and 635 tonnes of zinc concentrate as at September 30, 2020.
(iii) Per Tonne Production Costs1
In Q3 Fiscal 2021, the consolidated total mining and cash mining costs were $78.90 and $58.79 per tonne, up 0% and 2% compared to $78.65 and $57.54 per tonne, respectively, in Q3 Fiscal 2020. The increase in per tonne cash mining cost was mainly due to an increase of $0.4 million in labour costs and $0.9 million in mining contractor costs.
The consolidated total milling and cash milling costs in Q3 Fiscal 2021 were $13.23 and $11.66 per tonne, down 3% and 3% compared to $13.58 and $12.01 per tonne, respectively, in Q3 Fiscal 2020. The decrease in per tonne cash milling cost was mainly due to a decrease of $0.2 million in mill administration costs.
Correspondingly, the consolidated cash production cost per tonne of ore processed in Q3 Fiscal 2021 was $73.04, up 1% compared to $72.16 in Q3 Fiscal 2020. The consolidated all-in sustaining production cost per tonne of ore processed was $129.09, up 6% compared to $121.49 in Q3 Fiscal 2020, but within the Company’s annual cost guidance. The increase in all-in sustaining production cost per tonne was mainly due to an increase of $1.4 million in mine and corporate general and administrative expenses and a $0.3 million increase in sustaining capital expenditures.
For the nine months ended December 31, 2020, the consolidated total mining costs and cash mining costs were $76.66 and $57.18 per tonne, respectively, compared to $76.31 and $55.13 per tonne in the same prior year period. The increase in per tonne cash mining cost was mainly due to i) an increase of $0.4 million in labour costs, ii) an increase of $0.6 million in raw material costs and iii) an increase of $1.3 million in mining contractor costs.
For the nine months ended December 31, 2020, the consolidated total milling cost and cash milling cost were $11.79 and $10.29, respectively, compared to $12.85 and $11.14 per tonne in the same prior year period.
Correspondingly, the consolidated cash production cost per tonne of ore processed for the nine months ended December 31, 2020 was $70.02, up 2% compared to $68.93 in the same prior year period. The all-in sustaining production cost per tonne of ore processed was $122.02, up 4% compared to $117.12 in the same prior year period. The increase was mainly
____________
1 Alternative performance (non-IFRS) measure. Please refer to section 11 for reconciliation.
| Management’s Discussion and Analysis | Page 5 |
| SILVERCORP METALS INC. |
| Management’s Discussion and Analysis |
| For the Three and Nine Months Ended December 31, 2020 |
| (Expressed in thousands of U.S. dollars, unless otherwise stated) |
due to the increase in per tonne cash mining costs as discussed above and an increase of $1.0 million in sustaining capital expenditures.
(iv) Costs per Ounce of Silver, Net of By-Product Credits1
In Q3 Fiscal 2021, the consolidated cash cost per ounce of silver, net of by-product credits, was negative $2.76, compared to negative $1.21, in Q3 Fiscal 2020. The decrease in cash cost per ounce of silver, net of by-product credits, was mainly due to an increase of $2.1 million in by-product sales, offset by an increase of 1% in per tonne production costs.
In Q3 Fiscal 2021, the consolidated all-in sustaining cost per ounce of silver, net of by-product credits, was $6.92 compared to $7.21 in Q3 Fiscal 2020. The decrease was mainly due to the decrease in cash cost per ounce of silver, net of by-product credits as discussed above offset by an increase of $0.3 million in sustaining capital expenditures.
For the nine months ended December 31, 2020, the consolidated cash cost per ounce of silver, net of by-product credits, was negative $2.08, compared to negative $2.06 in the same prior year period. The consolidated all-in sustaining cost per ounce of silver, net of by-product credits was $6.48 compared to $5.64 in the same prior year period. The increase was mainly due to i) an increase of 2% in per tonne production costs; ii) an increase of $1.0 million in sustaining capital expenditures; and iii) a decrease of 4% in silver sold.
(v) Exploration and Development
In Q3 Fiscal 2021, on a consolidated basis, approximately 74,070 metres or $1.8 million worth of diamond drilling (Q3 Fiscal 2020 - 32,948 metres or $1.1 million) and 10,624 metres or $3.8 million worth of preparation tunnelling (Q3 Fiscal 2020 -11,656 metres or $3.1 million) were completed and expensed as mining preparation costs. In addition, approximately 24,916 metres or $1.0 million of surface diamond drilling (Q3 Fiscal 2020 - nil) and 21,829 metres or $9.4 million worth of horizontal tunnels, raises, ramps and declines (Q3 Fiscal 2020 - 20,107 metres or $7.1 million) were completed and capitalized.
For the nine months ended December 31, 2020, on a consolidated basis, approximately 154,748 metres or $4.2 million worth of diamond drilling (same prior year period - 93,544 metres or $3.0 million) and 27,622 metres or $7.4 million worth of preparation tunnelling (same prior year period - 37,224 metres or $9.6 million) were completed and expensed as mining preparation costs. In addition, approximately 63,400 metres or $2.9 million worth of surface diamond drilling (same prior year period - nil) and 74,418 metres or $26.7 million worth of horizontal tunnels, raises, ramps and declines (same prior year period - 63,736 metres or $22.0 million) were completed and capitalized.
_____________________________
1 Alternative performance (non-IFRS) measure. Please refer to section 11 for reconciliation.
| Management’s Discussion and Analysis | Page 6 |
| SILVERCORP METALS INC. |
| Management’s Discussion and Analysis |
| For the Three and Nine Months Ended December 31, 2020 |
| (Expressed in thousands of U.S. dollars, unless otherwise stated) |
(b) Individual Mine Performance
(i) Ying Mining District
The following table summarizes the operational information at the Ying Mining District for the three and nine months ended December 31, 2020 and 2019. The Ying Mining District is the Company’s primary source of production, and consists of several mines, including the SGX, HPG, TLP, LME, LMW, and HZG mines.
| Ying Mining District | Three months ended December 31, | Nine months ended December 31, | |||||||||||
| 2020 | 2019 | Changes | 2020 | 2019 | Changes | ||||||||
| Production Data | |||||||||||||
Mine Data | |||||||||||||
Ore Mined (tonne) | 182,268 | 176,149 | 3% | 537,464 | 528,818 | 2% | |||||||
Ore Milled (tonne) | 162,905 | 175,488 | -7% | 519,677 | 532,317 | -2% | |||||||
Head Grades | |||||||||||||
Silver (gram/tonne) | 297 | 296 | 0% | 293 | 311 | -6% | |||||||
Lead (%) | 4.3 | 4.6 | -7% | 4.4 | 4.6 | -4% | |||||||
Zinc (%) | 0.8 | 0.9 | -11% | 0.8 | 0.9 | -11% | |||||||
Recovery Rates | |||||||||||||
Silver (%) | 93.9 | 96.1 | -2% | 94.4 | 96.1 | -2% | |||||||
Lead (%) | 96.4 | 96.3 | 0% | 96.2 | 95.9 | 0% | |||||||
Zinc (%) | 63.3 | 70.3 | -10% | 61.7 | 62.6 | -1% | |||||||
| Cost Data | |||||||||||||
+ Mining cost per tonne of ore mined ($) | 94.03 | 91.91 | 2% | 91.47 | 89.67 | 2% | |||||||
Cash mining cost per tonne of ore mined ($) | 68.02 | 64.69 | 5% | 66.67 | 62.33 | 7% | |||||||
Depreciation and amortization charges per tonne of ore mined ($) | 26.01 | 27.22 | -4% | 24.80 | 27.34 | -9% | |||||||
+ Unit shipping costs ($) | 3.98 | 3.89 | 2% | 3.80 | 3.92 | -3% | |||||||
+ Milling costs per tonne of ore milled ($) | 12.94 | 12.76 | 1% | 10.97 | 11.74 | -7% | |||||||
Cash milling cost per tonne of ore milled ($) | 11.09 | 10.99 | 1% | 9.30 | 9.98 | -7% | |||||||
Depreciation and amortization charges per tonne of ore milled ($) | 1.85 | 1.77 | 5% | 1.67 | 1.76 | -5% | |||||||
+ Cash production cost per tonne of ore processed ($) | 83.09 | 79.57 | 4% | 79.77 | 76.23 | 5% | |||||||
+ All-in sustaining cost per tonne of ore processed ($) | 133.07 | 126.43 | 5% | 127.40 | 124.31 | 2% | |||||||
+ Cash cost per ounce of Silver, net of by-product credits ($) | (1.12 | ) | (0.72 | ) | -56% | (0.71 | ) | (1.40 | ) | 49% | |||
+ All-in sustaining cost per ounce of Silver, net of by-product credits ($) | 5.24 | 5.57 | -6% | 5.31 | 4.55 | 17% | |||||||
| Concentrate inventory | |||||||||||||
Lead concentrate (tonne) | 871 | 3,625 | -76% | 871 | 3,625 | -76% | |||||||
Zinc concentrate (tonne) | 62 | 190 | -67% | 62 | 190 | -67% | |||||||
| Sales Data | |||||||||||||
Metal Sales | |||||||||||||
Silver (in thousands of ounces) | 1,446 | 1,475 | -2% | 4,674 | 4,848 | -4% | |||||||
Gold (in thousands of ounces) | 0.8 | 0.7 | 14% | 2.9 | 2.8 | 4% | |||||||
Lead (in thousands of pounds) | 14,207 | 14,912 | -5% | 47,571 | 46,137 | 3% | |||||||
Zinc (in thousands of pounds) | 2,241 | 2,882 | -22% | 5,662 | 6,400 | -12% | |||||||
Revenue | |||||||||||||
Silver (in thousands of $) | 28,013 | 21,437 | 31% | 82,625 | 68,648 | 20% | |||||||
Gold (in thousands of $) | 1,194 | 890 | 34% | 4,164 | 3,286 | 27% | |||||||
Lead (in thousands of $) | 10,892 | 11,112 | -2% | 35,386 | 37,750 | -6% | |||||||
Zinc (in thousands of $) | 2,114 | 1,836 | 15% | 4,556 | 4,460 | 2% | |||||||
Other (in thousands of $) | 273 | 406 | -33% | 1,112 | 1,609 | -31% | |||||||
| 42,486 | 35,681 | 19% | 127,843 | 115,753 | 10% | ||||||||
Average Selling Price, Net of Value Added Tax and Smelter Charges | |||||||||||||
Silver ($ per ounce) | 19.37 | 14.53 | 33% | 17.68 | 14.16 | 25% | |||||||
Gold ($ per ounce) | 1,493 | 1,271 | 17% | 1,436 | 1,174 | 22% | |||||||
Lead ($ per pound) | 0.77 | 0.75 | 3% | 0.74 | 0.82 | -10% | |||||||
Zinc ($ per pound) | 0.94 | 0.64 | 47% | 0.80 | 0.70 | 14% | |||||||
+ Alternative Performance (Non-IFRS) measures, see section 11 for reconciliation
| Management’s Discussion and Analysis | Page 7 |
| SILVERCORP METALS INC. |
| Management’s Discussion and Analysis |
| For the Three and Nine Months Ended December 31, 2020 |
| (Expressed in thousands of U.S. dollars, unless otherwise stated) |
i) Q3 Fiscal 2021 vs. Q3 Fiscal 2020
In Q3 Fiscal 2021, the total ore mined at the Ying Mining District was 182,268 tonnes, up 3% or 6,119 tonnes compared to 176,149 tonnes in Q3 Fiscal 2020. Ore milled was 162,905 tonnes, a decrease of 7% compared to 175,488 tonnes in Q3 Fiscal 2020. The decrease in ore milled was mainly a result of the milling operations being temporarily suspended for seven days due to power rationing in December 2020 as the local government is subject to an annual environmental emissions KPI assessment.
Head grades were 297 grams per tonne (“g/t”) for silver, 4.3% for lead, and 0.8% for zinc, compared to 296 g/t for silver, 4.6% for lead, and 0.9% for zinc in Q3 Fiscal 2020.
In Q3 Fiscal 2021, the Ying Mining District sold approximately 1.4 million ounces of silver, 800 ounces of gold, 14.2 million pounds of lead, and 2.2 million pounds of zinc, compared to 1.5 million ounces of silver, 700 ounces of gold, 14.9 million pounds of lead, and 2.9 million pounds of zinc in Q3 Fiscal 2020.
Total and cash mining costs per tonne at the Ying Mining District in Q3 Fiscal 2021 were $94.03 and $68.02 per tonne, respectively, compared to $91.91 and $64.69 per tonne in Q3 Fiscal 2020. The increase in the per tonne cash mining cost was mainly due to an increase of $0.2 million in labour costs and $0.6 million in mining contractor costs.
Total and cash milling costs per tonne at the Ying Mining District in Q3 Fiscal 2021 were $12.94 and $11.09, respectively, compared to $12.76 and $10.99 in Q3 Fiscal 2020. The slight increase in per tonne milling costs was mainly due to less ore milled resulting in higher fixed costs allocation.
Correspondingly, the cash production cost per tonne of ore processed in Q3 Fiscal 2021 at the Ying Mining District was $83.09, compared to $79.57 in Q3 Fiscal 2020. The all-in sustaining production cost per tonne of ore processed was $133.07, up 5% compared to $126.43 in Q3 Fiscal 2020, but below the Company’s annual cost guidance. The increase was mainly due to the increase in per tonne cash production costs as discussed above.
In Q3 Fiscal 2021, the cash cost per ounce of silver, net of by-product credits, at the Ying Mining District was negative $1.12 compared to negative $0.72 in Q3 Fiscal 2020. All-in sustaining cost per ounce of silver, net of by-product credits, was $5.24 compared to $5.57 in Q3 Fiscal 2020. The decrease was mainly due to an increase of $0.2 million in by-product sales, offset by a decrease of 2% in silver sold.
In Q3 Fiscal 2021, approximately 57,401 metres or $1.2 million worth of diamond drilling (Q3 Fiscal 2020 - 22,576 metres or $0.7 million) and 6,623 metres or $2.8 million worth of preparation tunnelling (Q3 Fiscal 2020 - 5,329 metres or $1.8 million) were completed and expensed as mining preparation costs at the Ying Mining District. In addition, approximately 24,916 metres or $1.0 million worth of surface diamond drilling (Q3 Fiscal 2020 - nil) and 19,014 metres or $8.3 million worth of horizontal tunnels, raises, ramps and declines (Q3 Fiscal 2020 - 22,105 metres or $10.5 million) were completed and capitalized. ii) Nine months ended December 31, 2020 vs. nine months ended December 31, 2019
For the nine months ended December 31, 2020, a total of 537,464 tonnes of ore were mined at the Ying Mining District, up 2% or 8,646 tonnes compared to 528,818 tonnes in the same prior year period. Ore milled was 519,677 tonnes, down 2% compared to 532,317 tonnes in the same prior year period. Average head grades of ore processed were 293 g/t for silver, 4.4% for lead, and 0.8% for zinc compared to 311 g/t for silver, 4.6% for lead, and 0.9% for zinc, in the same prior year period.
During the same time period, the Ying Mining District sold approximately 4.7 million ounces of silver, 2,900 ounces of gold, 47.6 million pounds of lead, and 5.7 million pounds of zinc, compared to 4.8 million ounces of silver, 2,800 ounces of gold, 46.1 million pounds of lead, and 6.4 million pounds of zinc in the same prior year period.
For the nine months ended December 31, 2020, the cash mining cost at the Ying Mining District was $66.67 per tonne, up 7% compared to $62.33 in the same prior year period. The increase in the per tonne cash mining cost was mainly due to an increase of $1.3 million in mining contractor’s costs. The cash milling cost was $9.30 per tonne, a decrease of 7% compared to $9.98 in the same prior year period.
| Management’s Discussion and Analysis | Page 8 |
| SILVERCORP METALS INC. |
| Management’s Discussion and Analysis |
| For the Three and Nine Months Ended December 31, 2020 |
| (Expressed in thousands of U.S. dollars, unless otherwise stated) |
Correspondingly, the cash production cost per tonne of ore processed was $79.77, up 5% compared to $76.23 in the same prior year period. The all-in sustaining cash production cost per tonne of ore processed was $127.40, up 2%, compared to $124.31 in the same prior year period, but below the Company’s annual cost guidance.
For the nine months ended December 31, 2020, the cash cost per ounce of silver and all-in sustaining cost per ounce of silver, net of by-product credits, at the Ying Mining District, were negative $0.71 and $5.31 respectively, compared to negative $1.40 and $4.55 in the same prior year period. The increase was mainly due to i) the increase in per tonne production costs as discussed above; ii) a decrease of $1.8 million in by-product credits; and iii) a decrease of 4% in silver sold.
For the nine months ended December 31, 2020, approximately 117,773 metres or $2.5 million worth of underground diamond drilling (same prior year period - 73,231 metres or $2.1 million) and 17,786 metres or $5.6 million worth of preparation tunnelling (same prior year period - 17,278 metres or $5.1 million) were completed and expensed as mining preparation costs at the Ying Mining District. In addition, approximately 63,400 metres or $2.9 million worth of surface diamond drilling (same prior year period - nil) and 63,936 metres or $23.4 million worth of horizontal tunnels, raises, and declines (same prior year period - 62,661 metres or $24.3 million) were completed and capitalized.
| Management’s Discussion and Analysis | Page 9 |
| SILVERCORP METALS INC. |
| Management’s Discussion and Analysis |
| For the Three and Nine Months Ended December 31, 2020 |
| (Expressed in thousands of U.S. dollars, unless otherwise stated) |
(ii) GC Mine
The following table summarizes the operational information at the GC Mine for the three and nine months ended December 31, 2020 and 2019:
| GC Mine | Three months ended December 31, | Nine months ended December 31 | |||||||||||
| 2020 | 2019 | Changes | 2020 | 2019 | Changes | ||||||||
| Production Data | |||||||||||||
Mine Data | |||||||||||||
Ore Mined (tonne) | 97,177 | 86,437 | 12% | 264,389 | 250,417 | 6% | |||||||
Ore Milled (tonne) | 97,743 | 89,372 | 9% | 267,230 | 257,367 | 4% | |||||||
Head Grades | |||||||||||||
Silver (gram/tonne) | 82 | 96 | -15% | 85 | 97 | -12% | |||||||
Lead (%) | 1.4 | 2.0 | -30% | 1.7 | 1.9 | -11% | |||||||
Zinc (%) | 3.5 | 3.3 | 6% | 3.4 | 3.3 | 3% | |||||||
Recovery Rates | |||||||||||||
Silver (%) * | 82.6 | 78.0 | 6% | 82.6 | 76.9 | 7% | |||||||
Lead (%) | 89.6 | 90.4 | -1% | 89.5 | 89.2 | 0% | |||||||
Zinc (%) | 89.7 | 85.5 | 5% | 88.2 | 85.8 | 3% | |||||||
| Cost Data | |||||||||||||
+ Mining cost per tonne of ore mined ($) | 50.53 | 51.60 | -2% | 46.56 | 48.07 | -3% | |||||||
Cash mining cost per tonne of ore mined ($) | 41.47 | 42.96 | -3% | 37.89 | 39.91 | -5% | |||||||
Depreciation and amortization charges per tonne of ore mined ($) | 9.06 | 8.64 | 5% | 8.67 | 8.16 | 6% | |||||||
+ Milling cost per tonne of ore milled ($) | 13.72 | 15.20 | -10% | 13.39 | 15.14 | -12% | |||||||
Cash milling cost per tonne of ore milled ($) | 12.60 | 14.01 | -10% | 12.22 | 13.53 | -10% | |||||||
Depreciation and amortization charges per tonne of ore milled ($) | 1.12 | 1.19 | -6% | 1.17 | 1.61 | -27% | |||||||
+ Cash production cost per tonne of ore processed ($) | 54.07 | 56.97 | -5% | 50.11 | 53.44 | -6% | |||||||
+ All-in sustaining cost per tonne of ore processed ($) | 78.63 | 71.03 | 11% | 71.58 | 67.14 | 7% | |||||||
+ Cash cost per ounce of Silver, net of by-product credits ($) | (14.43 | ) | (4.33 | ) | -233% | (11.21 | ) | (7.30 | ) | -54% | |||
+ All-in sustaining cost per ounce of Silver, net of by-product credits ($) | (1.05 | ) | 2.18 | 148% | (0.10 | ) | (0.33 | ) | 70% | ||||
| Concentrate inventory | |||||||||||||
Lead concentrate (tonne) | 282 | 190 | 48% | 282 | 190 | 48% | |||||||
Zinc concentrate (tonne) | 549 | 80 | 586% | 549 | 80 | 586% | |||||||
| Sales Data | |||||||||||||
Metal Sales | |||||||||||||
Silver (in thousands of ounces) | 201 | 234 | -14% | 585 | 610 | -4% | |||||||
Lead (in thousands of pounds) | 2,599 | 3,867 | -33% | 8,671 | 9,553 | -9% | |||||||
Zinc (in thousands of pounds) | 6,724 | 5,471 | 23% | 17,672 | 15,942 | 11% | |||||||
Revenue | |||||||||||||
Silver (in thousands of $) | 2,707 | 2,603 | 4% | 7,326 | 6,389 | 15% | |||||||
Lead (in thousands of $) | 1,961 | 3,021 | -35% | 6,228 | 7,763 | -20% | |||||||
Zinc (in thousands of $) | 5,809 | 3,203 | 81% | 12,758 | 9,776 | 31% | |||||||
Other (in thousands of $) | 305 | - | 0% | 665 | 289 | 130% | |||||||
| 10,782 | 8,827 | 22% | 26,977 | 24,217 | 11% | ||||||||
Average Selling Price, Net of Value Added Tax and Smelter Charges | |||||||||||||
Silver ($ per ounce) ** | 13.47 | 11.12 | 21% | 12.52 | 10.47 | 20% | |||||||
Lead ($ per pound) | 0.75 | 0.78 | -4% | 0.72 | 0.81 | -11% | |||||||
Zinc ($ per pound) | 0.86 | 0.59 | 46% | 0.72 | 0.61 | 18% | |||||||
| * | Silver recovery includes silver recovered in lead concentrate and silver recovered in zinc concentrate. |
| ** | Silver in zinc concentrate is subjected to higher smelter and refining charges which lowers the net silver selling price. |
| + | Alternative Performance (Non-IFRS) measures, see section 11 for reconciliation |
| Management’s Discussion and Analysis | Page 10 |
| SILVERCORP METALS INC. |
| Management’s Discussion and Analysis |
| For the Three and Nine Months Ended December 31, 2020 |
| (Expressed in thousands of U.S. dollars, unless otherwise stated) |
i) Q3 Fiscal 2021 vs. Q3 Fiscal 2020
In Q3 Fiscal 2021, the total ore mined at the GC Mine was 97,177 tonnes, up 12% or 10,740 tonnes, compared to 86,437 tonnes in Q3 Fiscal 2020. Ore milled was 97,743 tonnes, up 9% or 8,371 tonnes, compared to 89,372 tonnes in Q3 Fiscal 2020.
Average head grades of ore processed at the GC Mine were 82 g/t for silver, 1.4% for lead, and 3.5% for zinc, compared to 96 g/t for silver, 2.0% for lead, and 3.3% for zinc in Q3 Fiscal 2020. Recovery rates of ore processed were 82.6% for silver, 89.6% for lead, and 89.7% for zinc, compared to 78.0% for silver, 90.4% for lead, and 85.5% for zinc in Q3 Fiscal 2020.
In Q3 Fiscal 2021, GC Mine sold approximately 201 thousand ounces of silver, 2.6 million pounds of lead, and 6.7 million pounds of zinc, compared to 234 thousand ounces of silver, 3.9 million pounds of lead, and 5.5 million pounds of zinc in Q3 Fiscal 2020.
Total and cash mining costs per tonne at the GC Mine in Q3 Fiscal 2021 were $50.53 and $41.47 per tonne, a decrease of 2% and 3%, respectively, compared to $51.60 and $42.96 per tonne in Q3 Fiscal 2020. The decrease in the cash mining cost was mainly due to a $0.2 million decrease in mining preparation costs. Total and cash milling costs per tonne at the GC Mine in Q3 Fiscal 2021 were $13.72 and $12.60, a decrease of 10% and 10%, respectively, compared to $15.20 and $14.01 in Q3 Fiscal 2020.
Correspondingly, the cash production cost per tonne of ore processed in Q3 Fiscal 2021 at the GC Mine was $54.07, down 5% compared to $56.97 in Q3 Fiscal 2020. The all-in sustaining production cost per tonne of ore processed was $78.63, up 11% compared to $71.03 in Q3 Fiscal 2020. The increase was mainly due to an increase of $1.1 million in sustaining capital expenditures.
In Q3 Fiscal 2021, the cash cost per ounce of silver, net of by-product credits, at the GC Mine was negative $14.43 compared to negative $4.33 in Q3 Fiscal 2020. The decrease was mainly due to the decrease in per tonne production costs as discussed above and an increase of $1.9 million in by-product sales.
In Q3 Fiscal 2021, all-in sustaining cost per ounce of silver, net of by-product credits, at the GC Mine was negative $1.05 compared to $2.18 in Q3 Fiscal 2020. The decrease was mainly due to the decrease in cash cost per ounces of silver offset by an increase of $1.0 million in sustaining capital expenditures.
In Q3 Fiscal 2021, approximately 17,029 metres or $0.6 million worth of underground diamond drilling (Q3 Fiscal 2020 -6,402 metres or $0.3 million) and 4,001 metres or $1.0 million worth of tunnelling (Q3 Fiscal 2020 - 6,599 metres or $1.5 million) were completed and expensed as mining preparation costs at the GC Mine. In addition, approximately 2,815 metres or $1.1 million worth of horizontal tunnels, raises, ramps and declines (Q3 Fiscal 2020 - 532 metres or $0.3 million) were completed and capitalized. ii) Nine months ended December 31, 2020 vs. nine months ended December 31, 2019
For the nine months ended December 31, 2020, a total of 264,389 tonnes of ore were mined and 267,230 tonnes were milled at the GC Mine, up 6% and 4%, respectively, compared to 250,417 tonnes mined and 257,367 tonnes milled in the same prior year period. Average head grades of ore milled were 85 g/t for silver, 1.7% for lead, and 3.4% for zinc compared to 97 g/t for silver, 1.9% for lead, and 3.3% for zinc, in the same prior year period.
During the same time period, the GC Mine sold approximately 585 thousand ounces of silver, 8.7 million pounds of lead, and 17.7 million pounds of zinc, compared to 610 thousand ounces of silver, 9.6 million pounds of lead, and 15.9 million pounds of zinc in the same prior year period.
For the nine months ended December 31, 2020, the cash mining cost at the GC Mine was $37.89 per tonne, a decrease of 5% compared to $39.91 per tonne in the same prior year period. The cash milling cost was $12.22 per tonne, a decrease of 10% compared to $13.53 in the same prior year period. Correspondingly, the cash production cost per tonne of ore processed at the GC Mine was $50.11, a decrease of 6% compared to $53.44 in the same prior year period. The all-in sustaining production cost per tonne of ore processed was $71.58, an increase of 7% compared to $67.14 in the same prior year period.
| Management’s Discussion and Analysis | Page 11 |
| SILVERCORP METALS INC. |
| Management’s Discussion and Analysis |
| For the Three and Nine Months Ended December 31, 2020 |
| (Expressed in thousands of U.S. dollars, unless otherwise stated) |
For the nine months ended December 31, 2020, the cash cost per ounce of silver and all-in sustaining cost per ounce of silver, net of by-product credits, at the GC Mine were negative $11.21 and negative $0.10 respectively, compared to negative $7.30 and negative $0.33 in the same prior year period.
For the nine months ended December 31, 2020, approximately 36,975 metres or $1.7 million worth of underground diamond drilling (same prior year period - 20,313 metres or $0.9 million) and 9,836 metres or $1.8 million of tunnelling (same prior year period - 18,962 metres or $4.5 million) were completed and expensed as mining preparation costs at the GC Mine. In addition, approximately 10,482 metres or $3.3 million of horizontal tunnels, raise, and declines (same prior year period - 1,476 metres or $1.0 million) were completed and capitalized.
(iii) BYP Mine
The BYP Mine was placed on care and maintenance in August 2014 due to required capital upgrades to sustain ongoing production and the market environment.
The Company is carrying out activities to apply for new mining licenses, but the process has taken longer than expected. No guarantee can be given that the new mining licenses for the BYP Mine will be issued, or if they are issued, that they will be issued under reasonable operational and/or financial terms, or in a timely manner, or that the Company will be in a position to comply with all conditions that are imposed. An updated National Instrument 43-101 - Standards of Disclosure of Mineral Projects (“NI 43-101”) Technical Report on the BYP Mine, with an effective date of April 30, 2019, was completed by RPM Global Asia Limited and filed under the Company’s SEDAR profile at www.sedar.com.
(c) Annual Operating Outlook
All references to Fiscal 2021 Guidance in this MD&A refer to the “Fiscal 2021 Production, Cash Cost Guidance” section in the Company’s Fiscal 2020 Annual MD&A dated May 20, 2020 (“Fiscal 2021 Guidance”) filed under the Company’s SEDAR profile at www.sedar.com.
(i) Production and Production Costs
The following table summarizes the actual production and production costs in the first nine months of Fiscal 2021 compared to the Fiscal 2021 Guidance:
| Head grades | Metal production | Production costs | ||||||||||||||||
| Ore processed | Silver | Lead | Zinc | Silver | Lead | Zinc | Cash cost | AISC | ||||||||||
| (tonnes) | (g/t) | (%) | (%) | (Koz) | (Klbs) | (Klbs) | ($/t) | ($/t) | ||||||||||
| First Nine Months of Fiscal 2021 Actual Results | ||||||||||||||||||
| Ying Mining District | 519,677 | 293 | 4.4 | 0.8 | 4,532 | 47,382 | 5,420 | 79.77 | 127.40 | |||||||||
| GC Mine | 267,230 | 85 | 1.7 | 3.4 | 604 | 8,892 | 17,919 | 50.11 | 71.58 | |||||||||
| Consolidated | 786,907 | 222 | 3.5 | 1.7 | 5,135 | 56,274 | 23,340 | 70.02 | 122.02 | |||||||||
| Fiscal 2021 Guidance | ||||||||||||||||||
| Ying Mining District | 640,000 - 660,000 | 292 | 4.3 | 0.9 | 5,600-5,800 | 56,600-58,000 | 7,000-8,000 | 74.7-82.5 | 133.5 - 140.5 | |||||||||
| GC Mine | 290,000 - 310,000 | 96 | 1.7 | 3.3 | 600-700 | 9,500-10,500 | 17,500-18,700 | 52.2-57.5 | 78.5 - 82.9 | |||||||||
| Consolidated | 930,000 - 970,000 | 229-231 | 3.5-3.5 | 1.6-1.7 | 6,200-6,500 | 66,100-68,500 | 24,500-26,700 | 66.6-73.6 | 122.6-135.5 | |||||||||
| % of Fiscal 2021 Guidance* | ||||||||||||||||||
| Ying Mining District | 80 | % | 100 | % | 102 | % | 89 | % | 80 | % | 83 | % | 72 | % | 101 | % | 93 | % |
| GC Mine | 89 | % | 89 | % | 100 | % | 103 | % | 93 | % | 89 | % | 99 | % | 91 | % | 89 | % |
| Consolidated | 83 | % | 97 | % | 100 | % | 103 | % | 81 | % | 84 | % | 91 | % | 100 | % | 95 | % |
* Percentage caculated based on mid-point of the related Fiscal 2021 Guidance
Based on the year-to-date production levels, production costs and the expected production for the remainder of the year, the Company reaffirms its Fiscal 2021 Guidance.
(ii) Development and Capital Expenditures
The following table summarizes the development work and capitalized expenditures in the first nine months of Fiscal 2021 compared to the Fiscal 2021 Guidance.
| Management’s Discussion and Analysis | Page 12 |
| SILVERCORP METALS INC. |
| Management’s Discussion and Analysis |
| For the Three and Nine Months Ended December 31, 2020 |
| (Expressed in thousands of U.S. dollars, unless otherwise stated) |
| Expensed | Expensed | |||||||||||||||||||||||||
| Capitalized Development and Expenditures | Tunneling | Drilling | ||||||||||||||||||||||||
| Exploration and | Equipment & | Mining | Exploration | |||||||||||||||||||||||
| Ramp Development | Development Tunnels | Facilities | Total | Preparation | Drilling | |||||||||||||||||||||
| (Metres) ($ Thousand) | (Metres) | ($ Thousand) | ($ Thousand) | (Metres) | ($ Thousand) | (Metres) | (Metres) | |||||||||||||||||||
| First nine months of Fiscal 2021 Actual Results | ||||||||||||||||||||||||||
| Ying Mining District | 8,415 | $ | 5,110 | 55,521 | $ | 18,291 | $ | 8,122 | 63,936 | $ | 31,523 | 17,786 | 117,773 | |||||||||||||
| GC Mine | 940 | 676 | 9,542 | 2,603 | 639 | 10,482 | 3,918 | 9,836 | 36,975 | |||||||||||||||||
| Consolidated | 9,355 | $ | 5,786 | 65,063 | $ | 20,894 | $ | 8,761 | 74,418 | $ | 35,441 | 27,622 | 154,748 | |||||||||||||
| Fiscal 2021 Guidance | ||||||||||||||||||||||||||
| Ying Mining District | 6,700 | $ | 5,500 | 81,300 | $ | 26,900 | $ | 4,600 | 88,000 | $ | 37,000 | 21,100 | 79,300 | |||||||||||||
| GC Mine | 1,600 | 1,400 | 11,000 | 3,200 | 800 | 12,600 | 5,400 | 13,500 | 25,700 | |||||||||||||||||
| Consolidated | 8,300 | $ | 6,900 | 92,300 | $ | 30,100 | $ | 5,400 | 100,600 | $ | 42,400 | 34,600 | 105,000 | |||||||||||||
| % of Fiscal 2021 Guidance | ||||||||||||||||||||||||||
| Ying Mining District | 126 | % | 93 | % | 68 | % | 68 | % | 177 | % | 73 | % | 85 | % | 84 | % | 149 | % | ||||||||
| GC Mine | 59 | % | 48 | % | 87 | % | 81 | % | 80 | % | 83 | % | 73 | % | 73 | % | 144 | % | ||||||||
| *Not including the capitalized expenditures for the surface diamond drilling ad described below. | ||||||||||||||||||||||||||
Based on the year-to-date capital expenditures and the expected capital expenditures for the remainder of the year (save for the capital expenditures being incurred to build an aggregate plant and additional surface drilling as described below, which was not included in Fiscal 2021 Guidance), the Company reaffirms the Fiscal 2021 Guidance.
The Company spent approximately $3.3 million (approximately RMB ¥22.9 million) in constructing a 1,000,000 tonnes per year aggregate plant to crush and recycle the waste rock from the Ying Mining District with the goal of supplying the resulting products to the local construction market. The construction of the plant has been completed and it is currently under commissioning. The profits from the aggregate plant, after capital recovery, will be shared between the local government, the local communities, and employees. This investment demonstrates our ongoing commitment and efforts to minimize our operations’ impacts on the environment and our commitment to create a sustainable contribution to the communities where our people work and live.
The Company is currently undertaking extensive drilling programs at the Ying Mining District and GC Mine with two main objectives: i) areas with existing development and access are being re-examined to potentially define additional resources and reserves, which may lead to a substantial reduction in mining and sustaining capital costs associated with the tonnes identified, and ii) areas which may have been overlooked for potential gold mineralization are being tested for different alteration styles from the typical silver-lead zones. The drilling programs include underground diamond drilling and surface diamond drilling. Costs related to underground diamond drilling are expensed as part of mining preparation costs, and costs related to surface diamond drilling, which were not included in Fiscal 2021 Guidance, are capitalized. For the nine months ended December 31, 2020, approximately 50,785 metres or $2.9 million worth of surface diamond drilling were completed and capitalized.
(d) La Yesca Acquisition
In December 2020, the Company and its subsidiary New Infini Silver Inc. (“New Infini”) entered into a framework agreement (the “Agreement”) with various arm’s length vendors (the “Vendors”), whereby New Infini agreed to acquire a 100% interest in the La Yesca Silver Project (“La Yesca”) through the indirect purchase of all of the issued and outstanding shares of Infini Resources, S.A. de C.V., a Mexican company which owns La Yesca.
La Yesca is a silver-polymetallic, epithermal-type project located approximately 100 kilometres (“km”) (185 km by road) northwest of Guadalajara, the second-largest city in Mexico. The concessions comprising La Yesca cover an area of approximately 47.7 km2. In total, 7,649 metres from 25 drill holes have previously been completed, all of which intersected mineralization.
Agreement details are summarized as follows:
In December 2020, Silvercorp’s 100% subsidiary New Infini acquired 100% interest in Infini SA, a Mexican corporation which holds 100% interest in the La Yesca project for $9.25 million cash payment and a 45% interest in
| Management’s Discussion and Analysis | Page 13 |
| SILVERCORP METALS INC. |
| Management’s Discussion and Analysis |
| For the Three and Nine Months Ended December 31, 2020 |
| (Expressed in thousands of U.S. dollars, unless otherwise stated) |
- New Infini shares to the vendors (the “Vendors”);
Of the cash payment of $9.25 million, Silvercorp provided $7.57 million and a group of Silvercorp’s directors, officers, employees, and consultants (the “Management team”) provided $1.68 million in return for their interests of 45% and 10%, respectively, in New Infini;
Through New Infini, Silvercorp assumed management and control of Infini SA, and became the operator of the Project;
Upon closing of the Agreement, New Infini paid $8.25 million and issued 45% New Infini shares to the Vendors; Shares”) to the Vendors;
Within 90 days of closing of the Agreement, New Infini would make second cash payment of $1.0 million, less any liabilities contemplated under the Agreement to the Vendors; and
A “Discovery payment” of up to $30.0 million calculated on the basis of $0.20 per ounce of Ag resources as defined by National Instrument 43-101 Standards of Disclosure for Mineral Projects paid by New Infini to the Vendors subject to certain permitting considerations.
Subsequent to December 31, 2020, New Infini finished a private placement and raised $4.0 million by issuing 8,000,000 shares of New Infini at $0.50 per share The Company purchased additional 3,000,000 shares for $1.5 million. Upon completion of the private placement, New Infini has a total of 48,000,000 shares issued and outstanding, of which the Company owns 21,000,000 shares or 43.75%, the Vendors own 18,600,000 shares or 38.75%, and the Management team has 8,400,000 shares or 17.5%.
(e) Zhonghe Silver Project Acquisition
On December 17, 2020, the Company, through its subsidiary, Henan Found, won an online auction to acquire the exploration rights to the Zhonghe Silver Project (the “Zhonghe Project”) from the Henan provincial government. The Zhonghe Project covers an area of 4.96 square km, approximately 50 km (75 km by road) northeast of the Company’s Ying Mining District, also located in Luoning County. The final winning bid submitted by the Company was approximately $76.0 million (RMB 495.0 million) (the “Purchase Price”).
The Company will enter into a mineral rights transfer contract with the Department of Natural Resources of Henan Province and will make an initial payment of approximately $15.2 million, once the project area is cleared by the relevant authorities as a non-military area. The initial payment represents 20% of the Purchase Price.
The balance of the Purchase Price is due only if the exploration rights to the Zhonghe Project are converted into a mining license and shall be paid annually over the duration of the term of the mining license.
| 4. | Fiscal 2022 Production, Cash Cost, and Capital Expenditure Guidance |
In Fiscal 2022, the Company expects to process approximately 960,000 - 1,010,000 tonnes of ore, yielding 6.4 million to 6.7 million ounces of silver, 65.7 million to 68.9 million pounds of lead, and 26.9 million to 28.5 million pounds of zinc. Fiscal 2022 production guidance represents an anticipated increase of approximately 3% in silver production, and 7% to 10% in zinc production compared to the current Fiscal 2021 guidance. In Fiscal 2022, lead production is expected to be similar to the current Fiscal 2021 guidance.
| Head grades | Metal production | Production costs | |||||||
| Ore processed | Silver | Lead | Zinc | Silver | Lead | Zinc | Cash cost* | AISC* | |
| (tonnes) | (g/t) | (%) | (%) | (Moz) | (Mlbs) | (Mlbs) | ($/t) | ($/t) | |
| Fiscal 2022 production and cash costs guidance | |||||||||
| Ying Mining District | 670,000-700,000 | 290 | 4.2 | 0.9 | 5.8 - 6.0 | 57.2 - 59.8 | 7.8 - 8.1 | 87.1 - 91.7 | 134.2 - 141.2 |
| GC Mine | 290,000-310,000 | 86 | 1.5 | 3.6 | 0.6 - 0.7 | 8.5 - 9.1 | 19.1 - 20.4 | 55.7 - 59.6 | 81.3 - 85.6 |
| Consolidated | 960,000-1,010,000 | 223 | 3.3 | 1.7 | 6.4 - 6.7 | 65.7 - 68.9 | 26.9 - 28.5 | 77.7 - 82.6 | 130.7 - 141.7 |
*Both AISC and cash costs are non-IFRS measures. AISC refers to all-in sustaining costs per tonne of ore processed. Cash costs refer to cash production costs per tonne of ore processed. Foreign exchange rates assumptions used are: US$1 = CAD$1.30, US$1 = RMB¥6.50.
| Management’s Discussion and Analysis | Page 14 |
| SILVERCORP METALS INC. |
| Management’s Discussion and Analysis |
| For the Three and Nine Months Ended December 31, 2020 |
| (Expressed in thousands of U.S. dollars, unless otherwise stated) |
The Company has been consistently active in exploring its existing mining permit areas through drilling and tunneling, with the objective of replacing the depleted ore. In recent years, the Company has embarked on a capital investment program at both of its mining operations with the objective of adding facilities and infrastructure that will enhance the environmental friendliness, safety, efficiency and future profitability of the mines. This program includes the excavation of additional access ramps and tunnels which are expected to facilitate the efficient movement of ore, equipment and personnel within the mines, as well as provide access to new areas of mineralization that may be suitable for mining in current and future periods. Depending on the extent of each project and the rate of development progress, the spending associated with these projects may be spread across several reporting periods until they are complete.
For Fiscal 2022, the Company plans to i) complete 6,600 metres of ramp development tunneling at estimated capitalized expenditures of $5.6 million, representing a 20% decrease in meterage and a 19% decrease in total cost compared to Fiscal 2021 guidance; ii) complete 62,500 metres of exploration and other development tunneling at estimated capitalized expenditures of $21.8 million, representing a 32% decrease in meterage and a 28% decrease in total cost compared to Fiscal 2021 guidance, and iii) spend $7.3 million on equipment and facilities, an increase of 35% compared to Fiscal 2021 guidance. In addition, the Company plans to complete 50,000 metres of surface diamond drilling at estimated capitalized expenditures of $3.5 million. The total capital expenditures are budgeted at $38.2 million, representing a decrease of 10% compared to Fiscal 2021 annual guidance. The Company also plans to complete and expense 33,600 metres of mining preparation tunneling and 206,900 metres of underground diamond drilling. The table below summarizes the work plan and estimated capital expenditures in Fiscal 2022.
| Capitalized Development Work and Expenditures | Expensed | |||||||||
| Mining | ||||||||||
| Exploration and | Surface Diamond | Equipment | Preparation | Underground | ||||||
| Ramp Development | Development Tunnels | Drilling | & Facilities | Total | Tunnels | drilling | ||||
| (Metres) | ($ Million) | (Metres) | ($ Million) | (Metres) | ($ Million) | ($ Million) | ($ Million) | (Metres) | (Metres) | |
| Ying Mining District | 6,100 | 5.2 | 52,200 | 18.8 | 50,000 | 3.5 | 6.3 | 33.8 | 23,400 | 148,400 |
| GC Mine | 500 | 0.4 | 10,300 | 3.0 | - | - | 1.0 | 4.4 | 10,200 | 58,500 |
| Consolidated | 6,600 | 5.6 | 62,500 | 21.8 | 50,000 | 3.5 | 7.3 | 38.2 | 33,600 | 206,900 |
(a) Ying Mining District
In Fiscal 2022, the Company plans to mine and process 670,000 to 700,000 tonnes of ore at the Ying Mining District averaging 290 g/t silver, 4.2% lead, and 0.9% zinc with expected metal production of 5.8 million to 6.0 million ounces of silver, 57.2 million to 59.8 million pounds of lead, and 7.8 million to 8.1 million pounds of zinc. Fiscal 2022 production guidance at the Ying Mining District represents increases of approximately 4% to 6% in ore production, 3% to 4% in silver production, 1% to 3% in lead production, and 1% to 11% in zinc production compared to its Fiscal 2021 guidance.
The cash production costs are expected to be $87.1 to $91.7 per tonne of ore, and the all-in sustaining costs are estimated at $134.2 to $141.2 per tonne of ore processed.
| Management’s Discussion and Analysis | Page 15 |
| SILVERCORP METALS INC. |
| Management’s Discussion and Analysis |
| For the Three and Nine Months Ended December 31, 2020 |
| (Expressed in thousands of U.S. dollars, unless otherwise stated) |
In Fiscal 2022, the Ying Mining District plans to i) complete 6,100 metres of ramp development tunneling at estimated capital expenditures of $5.2 million, representing a 9% decrease in meterage and 5% decrease in total cost compared to its Fiscal 2021 guidance; ii) complete 52,200 metres of exploration and other development tunneling at estimated capital expenditures of $18.8 million, representing a 36% decrease in meterage and 30% decrease in total cost compared to its Fiscal 2021 guidance; and iii) spend $6.3 million on equipment and facilities, an increase of 37% compared to its Fiscal 2021 guidance. In addition, the Company plans to complete 50,000 metres of surface diamond drilling at estimated capitalized expenditures of $3.5 million. The total capital expenditures at the Ying Mining District are budgeted at $33.8 million, a decrease of 9% compared to its Fiscal 2021 guidance. The Ying Mining District also plans to complete and expense 23,400 metres of mining preparation tunneling and 148,400 metres of diamond drilling, representing an increase of 11% and 87%, respectively, compared to Fiscal 2021 guidance.
(b) GC Mine
In Fiscal 2022, the Company plans to mine and process 290,000 to 310,000 tonnes of ore at the GC Mine averaging 86 g/t silver, 1.5% lead, and 3.6% zinc with expected metal production of 0.6 million to 0.7 million ounces of silver, 8.5 million to 9.1 million pounds of lead and 19.1 million to 20.4 million pounds of zinc. Fiscal 2022 production guidance at the GC Mine represents similar ore production and silver production, an increase of approximately 9% in zinc production, but a 10% to 13% decrease in lead production due to lower head grade compared to its Fiscal 2021 annual guidance.
The cash production costs are expected to be $55.7 to $59.6 per tonne of ore, and the all-in sustaining costs are estimated at $81.3 to $85.6 per tonne of ore processed.
In Fiscal 2022, the GC Mine plans to i) complete 500 metres of ramp development tunneling at estimated capital expenditures of $0.4 million, representing a 69% decrease in meterage and a decrease of 71% in total cost compared to its Fiscal 2021 guidance; ii) complete 10,300 metres of exploration and development tunneling at estimated capital expenditures of $3.0 million, a 6% decrease in meterage and total cost; and iii) spend $1.0 million on equipment and facilities, an increase of 70% compared to its Fiscal 2021 guidance. The total capital expenditures at the GC Mine are budgeted at $4.4 million, a decrease of 19% compared to its Fiscal 2021 guidance. The GC Mine also plans to complete and expense 10,200 metres of mining preparation tunneling and 58,500 metres of underground diamond drilling.
(c) Other Development Plans
In Fiscal 2022, the Company plans to commence a Phase I 10,000 metre drilling program at the La Yesca Silver Project, which the drilling program is pending the receipt of the necessary drilling permits from the respective Mexican government agencies. As a result, the budget for the drill program has not yet been finalized.
The Company plans to initiate an extensive drilling campaign at the Zhonghe Project. The Company will formalize the plan and provide an update on the cost estimates with respect to the Zhonghe Project once the mineral rights transfer contract is executed.
The Company is in the process applying for permits to build a third tailings facility near the existing tailings facilities at the Ying Mining District. The Company is also considering plans to expand the current milling capacity or build a new mill for future production expansion at the Ying Mining District. There is potential to consolidate mineral properties near the Ying Mining District, or to process ore from Zhonghe Project during its development stage. The Company will provide further update when plans and costs estimates are formalized.
| 5. | Investment in Associates |
(a) Investment in New Pacific Metals Corp.
New Pacific Metals Corp. (“NUAG”) is a Canadian public company listed on the Toronto Stock Exchange (symbol: NUAG). NUAG is a related party of the Company by way of two common directors and one common officer, and the Company accounts for its investment in NUAG using the equity method as it is able to exercise significant influence over the financial and operating policies of NUAG.
On June 9, 2020, the Company participated in an underwritten offering of common shares of NUAG and acquired an additional 1,320,710 common shares of NUAG for a cost of $5.8 million.
| Management’s Discussion and Analysis | Page 16 |
| SILVERCORP METALS INC. |
| Management’s Discussion and Analysis |
| For the Three and Nine Months Ended December 31, 2020 |
| (Expressed in thousands of U.S. dollars, unless otherwise stated) |
On July 22, 2020, NUAG announced the spin-out by way of a plan of arrangement (the “Arrangement”) of its then wholly-owned subsidiary, Whitehorse Gold Corp. (“WHG”), which owns 100% Skukum Gold Project (formerly “Tagish Lake Gold Project”) located in Yukon, Canada. Upon completion of the Arrangement on November 18, 2020, NUAG and WHG became two separate entities, and NUAG distributed all of the WHG common shares held by NUAG to its shareholders on a pro rata basis. WHG common shares were listed on the TSX Venture Exchange.
As at December 31, 2020, the Company owned 43,917,216 common shares of NUAG (March 31, 2020 - 42,596,506), representing an ownership interest of 28.6% (March 31, 2020 - 28.8%). The summary of the investment in NUAG common shares and its market value as at the respective balance sheet dates are as follows:
| Value of NUAG’s | ||||||||
| Number of | common shares per | |||||||
| shares | Amount | quoted market price | ||||||
| Balance April 1, 2019 | 39,346,300 | $ | 38,703 | $ | 69,783 | |||
| Purchase from open market | 502,600 | 861 | ||||||
| Exercise of warrants | 1,500,000 | 2,349 | ||||||
| Participation in public offering | 1,247,606 | 3,820 | ||||||
| Share of net loss | (1,276 | ) | ||||||
| Share of other comprehensive income | 1,077 | |||||||
| Dilution gain | 723 | |||||||
| Disposal of common shares held by the associate | 1,127 | |||||||
| Foreign exchange impact | (2,829 | ) | ||||||
| Balance March 31, 2020 | 42,596,506 | $ | 44,555 | $ | 148,624 | |||
| Participation in public offering | 1,320,710 | 5,805 | ||||||
| WHG Spin-out | (1,793 | ) | ||||||
| Share of net loss | (986 | ) | ||||||
| Share of other comprehensive loss | (1,960 | ) | ||||||
| Foreign exchange impact | 5,221 | |||||||
| Balance December 31, 2020 | 43,917,216 | $ | 50,842 | $ | 276,983 |
(b) Investment in Whitehorse Gold Corp.
WHG is a Canadian public company listed on the TSX Venture Exchange (symbol: WHG). The Company accounts for its investment in WHG using the equity method as it is able to exercise significant influence over the financial and operating policies of WHG.
On November 18, 2020, the Company received 5,740,286 WHG common shares distributed by NUAG to the Company under the Arrangement. In connection with the Arrangement, WHG conducted a non-brokered private placement financing. The Company participated in WHG’s private placement and acquired an additional 5,774,000 common shares of WHG for a cost of $1.3 million.
As at December 31, 2020, the Company owned 11,514,286 common shares of WHG (March 31, 2020 - nil), representing an ownership interest of 26.99% (March 31, 2020 - nil). The summary of the investment in WHG common shares and its market value as at the respective balance sheet dates are as follows:

| Management’s Discussion and Analysis | Page 17 |
| SILVERCORP METALS INC. |
| Management’s Discussion and Analysis |
| For the Three and Nine Months Ended December 31, 2020 |
| (Expressed in thousands of U.S. dollars, unless otherwise stated) |
| 6. | Financial Results |
(a) Selected Annual and Quarterly Information
The following tables set out selected quarterly results for the past eleven as well as selected current year-to-date results and annual results for the past two years. The dominant factors affecting results presented below are the volatility of realized metal prices and the timing of sales.
| Fiscal 2021 | Quearter Ended | Nine Months Ended | ||||||||||||||
| (In thousands of USD, other than per share amounts) | Jun 30, 2020 | Sep 30, 2020 | Dec 31, 2020 | Dec 31, 2020 | ||||||||||||
| Revenue | $ | 46,705 | $ | 56,372 | $ | 53,296 | $ | 156,373 | ||||||||
| Income from mine operations | 19,285 | 26,672 | 24,801 | 70,758 | ||||||||||||
| Expenses and foreign exchange | (1,677 | ) | (4,666 | ) | (6,771 | ) | (13,114 | ) | ||||||||
| Gain on equity investments | 5,466 | 2,771 | 600 | 8,837 | ||||||||||||
| Finance items | 800 | 657 | (295 | ) | 1,162 | |||||||||||
| Net income | 18,492 | 19,557 | 12,289 | 50,338 | ||||||||||||
| Net income attributable to equity holders of the Company | 15,491 | 15,472 | 8,392 | 39,355 | ||||||||||||
| Basic earnings per share | 0.09 | 0.09 | 0.05 | 0.23 | ||||||||||||
| Diluted earnings per share | 0.09 | 0.09 | 0.05 | 0.22 | ||||||||||||
| Cash dividend declared | 2,178 | - | 2,190 | 4,368 | ||||||||||||
| Cash dividend declared per share | 0.0125 | - | 0.0125 | 0.03 | ||||||||||||
| Other financial information | ||||||||||||||||
| Total assets | 655,893 | |||||||||||||||
| Total liabilities | 104,060 | |||||||||||||||
| Total attributable shareholders' equity | 459,044 | |||||||||||||||
| Fiscal 2020 | Quarter ended | Year ended | ||||||||||||||
| (In thousands of USD, other than per share amounts) | Jun 30, 2019 | Sep 30, 2019 | Dec 31, 2019 | Mar 31, 2020 | Mar 31, 2020 | |||||||||||
| Revenue | $ | 45,576 | $ | 49,886 | $ | 44,508 | $ | 18,859 | $ | 158,829 | ||||||
| Income from mine operations* | 17,733 | 22,668 | 15,769 | 3,204 | 59,374 | |||||||||||
| Expenses and foreign exchange* | (3,873 | ) | (2,550 | ) | (4,326 | ) | 1,337 | (9,412 | ) | |||||||
| Dilution gain on investment in associate | 723 | - | - | - | 723 | |||||||||||
| Gain on disposal of mineral rights and properties | 1,477 | - | - | 1,477 | ||||||||||||
| Finance items | 754 | 682 | 988 | (474 | ) | 1,950 | ||||||||||
| Net income | 17,301 | 15,661 | 8,716 | 3,525 | 45,203 | |||||||||||
| Net income attributable to equity holders of the Company | 12,607 | 12,221 | 6,283 | 3,163 | 34,274 | |||||||||||
| Basic earnings per share | 0.07 | 0.07 | 0.04 | 0.02 | 0.20 | |||||||||||
| Diluted earnings per share | 0.07 | 0.07 | 0.04 | 0.02 | 0.20 | |||||||||||
| Cash dividend declared | 2,125 | - | 2,162 | - | 4,287 | |||||||||||
| Cash dividend declared per share | 0.0125 | - | 0.0125 | - | 0.03 | |||||||||||
| Other financial information | ||||||||||||||||
| Total assets | 512,760 | |||||||||||||||
| Total liabilities | 73,788 | |||||||||||||||
| Total attributable shareholders' equity | 368,682 | |||||||||||||||
| Fiscal 2019 | Quarter ended | Year ended | ||||||||||||||
| (In thousands of USD, other than per share amounts) | Jun 30, 2018 | Sep 30, 2018 | Dec 31, 2018 | Mar 31, 2019 | Mar 31, 2019 | |||||||||||
| Revenue | $ | 45,125 | $ | 48,091 | $ | 42,351 | $ | 34,952 | $ | 170,519 | ||||||
| Income from mine operations* | 21,919 | 19,485 | 15,967 | 13,562 | 70,932 | |||||||||||
| Expenses and foreign exchange* | (1,905 | ) | (3,308 | ) | (796 | ) | (4,029 | ) | (10,037 | ) | ||||||
| Impairment reveral | - | - | - | 9,178 | 9,178 | |||||||||||
| Finance items | 661 | 663 | 815 | 706 | 2,845 | |||||||||||
| Net (loss) income | 14,176 | 11,077 | 10,853 | 15,941 | 52,047 | |||||||||||
| Net income attributable to equity holders of the Company | 10920 | 8,037 | 8,660 | 12,107 | 39,724 | |||||||||||
| Basic earnings per share | 0.07 | 0.05 | 0.05 | 0.07 | 0.24 | |||||||||||
| Diluted (loss) earnings per share | 0.06 | 0.05 | 0.05 | 0.07 | 0.23 | |||||||||||
| Cash dividend declared | 2,096 | - | 2,112 | - | 4,208 | |||||||||||
| Cash dividend declared per share (CAD) | 0.0125 | - | 0.0125 | - | 0.025 | |||||||||||
| Other financial information | ||||||||||||||||
| Total assets | 499,076 | |||||||||||||||
| Total liabilities | 85,895 | |||||||||||||||
| Total attributable shareholders' equity | 347,446 | |||||||||||||||
*Certain financial information was reclassified to conform with the current quarter’s presentation. The reclassification has no impact on the Company’s financial position and financial performance.
| Management’s Discussion and Analysis | Page 18 |
| SILVERCORP METALS INC. |
| Management’s Discussion and Analysis |
| For the Three and Nine Months Ended December 31, 2020 |
| (Expressed in thousands of U.S. dollars, unless otherwise stated) |
(b) Financial Results
Net income attributable to equity shareholders of the Company in Q3 Fiscal 2021 was $8.4 million, or $0.05 per share, up 33% compared to $6.3 million, or $0.04 per share in Q3 Fiscal 2020.
Compared to Q3 Fiscal 2020, the Company’s financial results in Q3 Fiscal 2021 were mainly impacted by the following: i) an increase of 33%, 20%, 1% and 47% in the net realized selling prices for silver, gold, lead and zinc; ii) an increase of 14% and 7% in the amount of gold and zinc sold, offset by i) a decrease of 4% and 11% in the amount of silver and lead sold; ii) a $3.0 million in foreign exchange loss, and iii) a $1.4 million finance costs.
Net income attributable to the shareholders of the Company for the nine months ended December 31, 2020 was $39.4 million, or $0.23 per share, an increase of $8.2 million, compared to $31.1 million or $0.18 per share in the same prior year period.
Revenue in Q3 Fiscal 2021 was $53.3 million, up 20% or $8.8 million compared to $44.5 million in Q3 Fiscal 2020. The increase was mainly due to i) an increase of $10.5 million in revenue arising from the increase in the net realized selling prices for silver, gold, lead and zinc; ii) an increase of $0.7 million in revenue arising from the increase in the amount of gold and zinc sold; offset by iii) a decrease of $2.6 million arising from the decrease in the amount of silver and lead sold. Silver, gold and base metal sales represented $30.7 million, $1.2 million, and $21.4 million, respectively, compared to silver, gold and base metals sales of $24.0 million, $0.9 million, and $19.6 million, respectively, in Q3 Fiscal 2020. Revenue from the Ying Mining District in Q3 Fiscal 2021 was $42.5 million, up 19% compared to $35.7 million in Q3 Fiscal 2020. Revenue from the GC Mine in Q3 Fiscal 2021 was $10.8 million, up 22% compared to $8.8 million in Q3 Fiscal 2020.
For the nine months ended December 31, 2020, revenue was $156.4 million, up 12% or $16.4 million, compared to $140.0 million in the same prior year period. Silver, gold, and base metals sales represented $90.0 million, $5.7 million, and $60.7 million, respectively, compared to silver, gold and base metals sales of $75.0 million, $3.3 million, and $61.6 million, respectively, in the same prior year period.
Fluctuation in sales revenue is mainly dependent on metal sales and realized metal prices. The net realized selling price is calculated using the Shanghai Metal Exchange (“SME”) price, less smelter charges, recovery, and value added tax (“VAT”). The metal prices quoted on SME, excluding gold, include VAT. The following table is a comparison among the Company’s net realized prices, prices quoted on SME, and prices quoted on London Metal Exchange (“LME”):
| Silver (in US$/ounce) | Gold (in US$/ounce) | Lead (in US$/pound) | Zinc (in US$/pound) | |||||||||||||
| Q3 2021 | Q3 2020 | Q3 2021 | Q3 2020 | Q3 2021 | Q3 2020 | Q3 2021 | Q3 2020 | |||||||||
| Net realized selling prices | $ | 18.65 | $ | 14.07 | $ | 1,528 | $ | 1,271 | $ | 0.76 | $ | 0.75 | $ | 0.88 | $ | 0.60 |
| SME | $ | 22.06 | $ | 17.61 | $ | 1,800 | $ | 1,437 | $ | 0.98 | $ | 1.07 | $ | 1.24 | $ | 1.28 |
| LME | $ | 21.81 | $ | 16.41 | $ | 1,832 | $ | 1,430 | $ | 0.83 | $ | 0.89 | $ | 1.06 | $ | 1.13 |
Production costs expensed in Q3 Fiscal 2021 were $18.0 million, a decrease of $0.4 million, compared to $18.4 million in Q3 Fiscal 2020. The production costs expensed represent approximately 247,000 tonnes of ore processed and expensed at a cost of $73.04 per tonne compared to approximately 255,000 tonnes at $72.16 per tonne in Q3 Fiscal 2020.
For the nine months ended December 31, 2020, production costs expensed were $55.5 million, an increase of $1.8 million, compared to $53.7 million in the same prior year period.
Mineral resource taxes in Q3 Fiscal 2021 were $1.3 million, compared to $1.3 million in Q3 Fiscal 2020.
For the nine months ended December 31, 2020, mineral resources taxes were $4.1 million, compared to $4.0 million in the same prior year period.
Government fees and other taxes in Q3 Fiscal 2021 were $0.8 million, compared to $0.8 million in Q3 Fiscal 2020. Government fees and other taxes are comprised of environmental protection fees, surtaxes on VAT, land usage levies, stamp duties and other miscellaneous levies, duties and taxes imposed by the state and local Chinese governments.
For the nine months ended December 31, 2020, government fee and other taxes were $2.0 million, compared to $1.9 million in the same prior year period.
| Management’s Discussion and Analysis | Page 19 |
| SILVERCORP METALS INC. |
| Management’s Discussion and Analysis |
| For the Three and Nine Months Ended December 31, 2020 |
| (Expressed in thousands of U.S. dollars, unless otherwise stated) |
Income from mine operations in Q3 Fiscal 2021 was $24.8 million or 47% of revenue, compared to $15.8 million or 35% of revenue in Q3 Fiscal 2020. Income from mine operations at the Ying Mining District was $21.7 million or 51% of revenue, compared to $14.5 million or 41% of revenue in Q3 Fiscal 2020. Income from mine operations at the GC Mine was $3.3 million or 31% of revenue, compared to $1.4 million or 16% of revenue in Q3 Fiscal 2020.
Income from mine operations for the nine months ended December 31, 2020 was $70.8 million or 45% of revenue, compared to $56.2 million or 40% of revenue. Income from mine operations at the Ying Mining District was $62.4 million or 49% of revenue, compared to $51.1 million or 44% of revenue in the same prior year period. Income from mine operations at the GC Mine was $8.1 million or 30% of revenue, compared to $5.4 million or 22% of revenue in the same prior year period.
General and administrative expenses in Q3 Fiscal 2021 were $6.3 million, an increase of $1.4 million, compared to $4.9 million in Q3 Fiscal 2020. The increase was mainly due to an increase of $0.7 million in salaries and benefits and $0.3 million in share-based compensation.
General and administrative expenses for the nine months ended December 31, 2020 were $16.2 million, an increase of $2.0 million, compared to $14.2 million in the same prior year period. The increase was mainly due to an increase of $0.6 million in salaries and benefits and $0.9 million in share-based compensation.
General and administrative expenses include corporate administrative expenses and mine administrative expenses. Items included in general and administrative expenses are as follows:
| Three months ended December 31, 2020 | Three months ended December 31, 2019 | ||||||||||||||||||
| Corporate | Mines | Total | Corporate | Mines | Total | ||||||||||||||
| Amortization and depreciation | $ | 139 | $ | 329 | $ | 468 | $ | 118 | $ | 265 | $ | 383 | |||||||
| Office and administrative expenses | 531 | 896 | 1,427 | 563 | 815 | 1,378 | |||||||||||||
| Professional Fees | 198 | 118 | 316 | 67 | 105 | 172 | |||||||||||||
| Salaries and benefits | 1,442 | 1,417 | 2,859 | 970 | 1,163 | 2,133 | |||||||||||||
| Share-based compensation | 1,215 | - | 1,215 | 850 | - | 850 | |||||||||||||
| $ | 3,525 | $ | 2,760 | $ | 6,285 | $ | 2,568 | $ | 2,348 | $ | 4,916 | ||||||||
| Nine months ended December 31, 2020 | Nine months ended December 31, 2019 | ||||||||||||||||||
| Corporate | Mines | Total | Corporate | Mines | Total | ||||||||||||||
| Amortization and depreciation | $ | 391 | $ | 922 | $ | 1,313 | $ | 325 | $ | 798 | $ | 1,123 | |||||||
| Office and administrative expenses | 1,559 | 2,227 | 3,786 | 1,787 | 2,065 | 3,852 | |||||||||||||
| Professional Fees | 561 | 345 | 906 | 333 | 412 | 745 | |||||||||||||
| Salaries and benefits | 3,574 | 3,662 | 7,236 | 3,234 | 3,413 | 6,647 | |||||||||||||
| Share-based compensation | 2,911 | - | 2,911 | 1,825 | - | 1,825 | |||||||||||||
| $ | 8,996 | $ | 7,156 | $ | 16,152 | $ | 7,504 | $ | 6,688 | $ | 14,192 | ||||||||
Property evaluation and business development expenses in Q3 Fiscal 2021 were $0.2 million, compared to $0.2 million in Q3 Fiscal 2020.
Property evaluation and business development expenses for the nine months ended December 31, 2020 were a recovery of $3.7 million, compared to an expense of $0.2 million in the same prior year period. On April 26, 2020, the Company entered into a definitive agreement with Guyana Goldfields Inc. (“Guyana Goldfield”), subsequently amended on May 16, 2020 (collectively, the “Arrangement Agreement”) to acquire all of the issued and outstanding shares of Guyana Goldfield. On June 10, 2020, Guyana Goldfield terminated the Arrangement Agreement and paid the Company a break fee of $6.5 million (CAD$9.0 million). Net of expenses of $2.5 million, a gain of $4.0 million on this transaction was recorded as a recovery of property evaluation and business development expenses.
Foreign exchange loss in Q3 Fiscal 2021 was $3.0 million, an increase of $1.7 million compared to $1.3 million in Q3 Fiscal 2020. The foreign exchange loss is mainly driven by the appreciation of the Canadian dollar against the US dollar.
| Management’s Discussion and Analysis | Page 20 |
| SILVERCORP METALS INC. |
| Management’s Discussion and Analysis |
| For the Three and Nine Months Ended December 31, 2020 |
| (Expressed in thousands of U.S. dollars, unless otherwise stated) |
Foreign exchange loss for the nine months ended December 31, 2020 was $7.0 million, compared to $1.3 million in the same prior year period.
Share of loss in associates in Q3 Fiscal 2021 was $0.6 million (Q3 Fiscal 2020 - $0.3 million), representing the Company’s equity share of the loss in NUAG and WHG.
Share of loss in an associate for the nine months ended December 31, 2020 was $1.0 million, compared to $0.8 million in the same prior year period.
Gain on equity investments recorded in profit in Q3 Fiscal 2021 was $0.6 million, compared to $nil in Q3 Fiscal 2020.
Gain on equity investments recorded in profit for the nine months ended December 31, 2020 was $8.8 million, compared to $nil in the same prior year period. A total gain of $21.7 million on equity investments was reported for the nine months ended December 31, 2020 (same prior year period - $2.7 million), of which $8.8 million was recorded in profit (same prior year period - $nil) and $12.9 million was recorded in other comprehensive income (same prior year period - $2.7 million) as the Company made elections to account for equity investments on an instrument-by-instrument basis.
Finance income in Q3 Fiscal 2021 was $1.1 million compared to $1.1 million in Q3 Fiscal 2020. The Company invests in high yield debt instruments. Finance income for the nine months ended December 31, 2020 was $2.8 million, compared to $2.9 million in the same prior year period.
Finance costs in Q3 Fiscal 2021 and the nine months ended December 31, 2020 were $1.4 million and $1.6 million, respectively, compared to $0.1 million in Q3 Fiscal 2020 and $0.4 million for the nine months ended December 31, 2019. Items included in finance costs are summarized below:
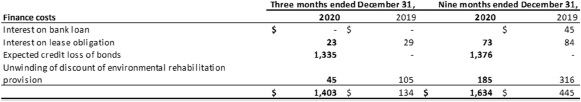
Income tax expenses in Q3 Fiscal 2021 and the nine months ended December 31, 2020 were $6.0 million and $17.3 million, respectively, compared to $3.7 million in Q3 Fiscal 2020 and $8.4 million for the nine months ended December 31, 2019. Items included in income tax expenses are summarized below:
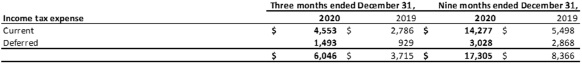
| 7. | Liquidity and Capital Resources |
| As at | December 31, 2020 | March 31, 2020 | Changes | ||||||
| Cash and cash equivalents | $ | 103,347 | $ | 65,777 | $ | 37,570 | |||
| Short-term investment | 100,774 | 76,742 | 24,032 | ||||||
| $ | 204,121 | $ | 142,519 | $ | 61,602 | ||||
| Working capital | $ | 168,748 | $ | 130,351 | $ | 38,397 |
| Management’s Discussion and Analysis | Page 21 |
| SILVERCORP METALS INC. |
| Management’s Discussion and Analysis |
| For the Three and Nine Months Ended December 31, 2020 |
| (Expressed in thousands of U.S. dollars, unless otherwise stated) |
| Three months ended December 31, | Nine months ended December 31, | ||||||||||||||||||
| 2020 | 2019 | Changes | 2020 | 2019 | Changes | ||||||||||||||
| Cash flow | |||||||||||||||||||
Cash provided by operating activities | $ | 23,938 | $ | 24,852 | $ | (914 | ) | $ | 83,681 | $ | 70,968 | $ | 12,713 | ||||||
Cash used in investing activities | (18,480 | ) | (22,736 | ) | 4,256 | (51,403 | ) | (73,726 | ) | 22,323 | |||||||||
Cash used in financing activities | (2,136 | ) | 2,596 | (4,732 | ) | (3,714 | ) | (2,368 | ) | (1,346 | ) | ||||||||
| Increase (decrease) in cash and cash equivalents | 3,322 | 4,712 | (1,390 | ) | 28,564 | (5,126 | ) | 33,690 | |||||||||||
| Effect of exchange rate changes on cash and cash equivalent | 4,705 | 1,090 | 3,615 | 9,006 | (421 | ) | 9,427 | ||||||||||||
| Cash and cash equivalents, beginning of the period | 95,320 | 56,092 | 39,228 | 65,777 | 67,441 | (1,664 | ) | ||||||||||||
| Cash and cash equivalents, end of the period | $ | 103,347 | $ | 61,894 | $ | 41,453 | $ | 103,347 | $ | 61,894 | $ | 41,453 | |||||||
Cash and cash equivalents and short-term investments as at December 31, 2020 were $204.1 million, an increase of $61.6 million or 43%, compared to $142.5 million as at March 31, 2020.
Working capital1 as at December 31, 2020 was $168.7 million, an increase of $38.4 million or 29%, compared to $130.4 million as at March 31, 2020.
Cash flow provided by operating activities in Q3 Fiscal 2021 was $23.9 million, a decrease of $1.0 million, compared to $24.9 million in Q3 Fiscal 2020. The decrease was mainly due to i) higher income taxes paid; ii) negative impact from change in non-cash operating working capital, offset by iii) higher operating income. Cash flow provided by operating activities comprised primarily of:
$20.9 million from operating activities before changes in non-cash working capital, an increase of $1.4 million, compared to $19.5 million in Q3 Fiscal 2020; and
$3.0 million from a reduction in non-cash working capital, compared to $5.4 million from a decrease in non-cash working capital in Q3 Fiscal 2020.
For the nine months ended December 31, 2020, cash flow provided by operating activities was $83.7 million, up 18% compared to $71.0 million in the same prior year period. Before changes in non-cash operating working capital, cash flow provided by operating activities for the nine months ended December 31, 2020 was $70.9 million, compared to $66.3 million in the same prior year period.
Cash flow used in investing activities in Q3 Fiscal 2021 was $18.4 million, a decrease of $4.3 million compared to $22.7 million in Q3 Fiscal 2020. The increase was mainly due to the cash used for acquisition activities offset by the increase in proceeds on disposal of other investments. Cash flow used in investing activities comprised primarily of:
$12.4 million spent on mineral exploration and development expenditures (Q3 Fiscal 2020 - $7.9 million);
$6.6 million spent on the acquisition of La Yesca (Q3 Fiscal 2020 - $nil);
$3.0 million spent to acquire plant and equipment (Q3 Fiscal 2020 - $1.9 million);
$1.3 million spent on other investments (Q3 Fiscal 2020 - $2.1 million);
$1.3 million spent on investment in associate (Q3 Fiscal 2020 - $3.8 million); offset by
$6.1 million received from the net redemption of short-term investments (Q3 Fiscal 2020 - net spend $11.9 million); and
$0.01 million proceeds from the disposal of other investments (Q3 Fiscal 2020 - $4.9 million).
For the nine months ended December 31, 2020, cash flow used in investing activities was $51.4 million (same prior year period - $73.7 million) and comprised primarily of:
$29.1 million spent on mineral exploration and development expenditures (same prior year period - $21.9 million);
____________________
1 Alternative performance (non-IFRS) measure. Please refer to section 11 for reconciliation.
| Management’s Discussion and Analysis | Page 22 |
| SILVERCORP METALS INC. |
| Management’s Discussion and Analysis |
| For the Three and Nine Months Ended December 31, 2020 |
| (Expressed in thousands of U.S. dollars, unless otherwise stated) |
$6.6 million spent on the acquisition of La Yesca (same prior year period - $nil);
$6.0 million spent to acquire plant and equipment (same prior year period - $6.2 million);
$0.4 million payments for reclamation deposits (same prior year period - $1.6 million);
$12.7 million spent on other investments (same prior year period - $3.9 million);
$7.1 million spent on investment in associates (same prior year period - $7.0 million);
$9.3 million spent on the net purchase of short-term investments (same prior year period - $45.5 million), offset by
$1.8 million cash from refund on reclamation deposit (same prior year period - $nil); and
$17.9 million proceeds from disposal of other investments (same prior year period - $6.1 million).
Cash flow used in financing activities in Q3 Fiscal 2021 was $2.1 million, compared to cash flow provided from financing activities of $2.6 million in Q3 Fiscal 2020. The decrease was mainly due to:
$0.1 million lease payment (Q3 Fiscal 2020 - $81);
$2.2 million cash dividends paid (Q3 Fiscal 2020 - $2.2 million); offset by
$0.2 million cash received arising from exercise of stock options (Q3 Fiscal 2020 - $1.9 million; and
$nil repayment received from related parties (Q3 Fiscal 2020 - $2.9 million) );
For nine months ended December 31, 2020, cash flow used in financing activities was $3.7 million (same prior year period -$2.4 million) and comprised primarily of:
$0.4 million lease payment (same prior year period - $0.4 million);
$nil repayment to a bank loan (same prior year period - $4.4 million);
$3.2 million distributions to non-controlling interest shareholders (same prior year period - $3.3 million); and
$4.4 million cash dividend to the equity shareholders of the Company (same prior year period - $4.3 million); offset by
$1.4 million repayment received from a related party (same prior year period - $2.9); and
$2.8 million cash received arising from exercise of stock options (same prior year period - $7.0 million).
Capital Resources
The Company’s objective when managing capital is to maintain financial flexibility to continue as a going concern while optimizing growth and maximizing returns on investments from shareholders.
The Company monitors its capital structure and based on changes in operations and economic conditions, may adjust the structure by repurchasing shares, issuing new shares, issuing debt or retiring debt. The Company prepares annual budget to facilitate the management of its capital requirements. However, the Company does not have unlimited resources and its future capital requirements will depend on many factors, including, among others, cash flow from operations. To the extent that its existing resources and the funds generated by future income are insufficient to fund the Company’s operations, the Company may need to raise additional funds through public or private debt or equity financing. If additional funds are raised through the issuance of equity securities, the percentage ownership of current shareholders will be reduced, and such equity securities may have rights, preferences or privileges senior to those of the holders of the Company’s common shares. No assurance can be given that additional financing will be available or that, if available, can be obtained on terms favourable to the Company and its shareholders. If adequate funds are not available, the Company may be required to delay, limit or eliminate some or all of its proposed operations. The Company believes it has sufficient capital to meet its cash needs for the next 12 months, including the cost of compliance with continuing reporting requirements.
The Company is not subject to any externally imposed capital requirements.
| Management’s Discussion and Analysis | Page 23 |
| SILVERCORP METALS INC. |
| Management’s Discussion and Analysis |
| For the Three and Nine Months Ended December 31, 2020 |
| (Expressed in thousands of U.S. dollars, unless otherwise stated) |
| 8. | Financial Instruments and Related Risks |
The Company manages its exposure to financial risks, including liquidity risk, foreign exchange risk, interest rate risk, credit risk and equity price risk in accordance with its risk management framework. The Company’s Board of Directors (the “Board”) has overall responsibility for the establishment and oversight of the Company’s risk management framework and reviews the Company’s policies on an ongoing basis.
(a) Fair value
The Company classifies its fair value measurements within a fair value hierarchy, which reflects the significance of the inputs used in making the measurements as defined in IFRS 13, Fair Value Measurement (“IFRS 13”).
Level 1 - Unadjusted quoted prices at the measurement date for identical assets or liabilities in active markets.
Level 2 - Observable inputs other than quoted prices included in Level 1, such as quoted prices for similar assets and liabilities in active markets; quoted prices for identical or similar assets and liabilities in markets that are not active; or other inputs that are observable or can be corroborated by observable market data.
Level 3 - Unobservable inputs which are supported by little or no market activity.
The following tables set forth the Company’s financial assets and liabilities that are measured at fair value level on a recurring basis within the fair value hierarchy as at December 31, 2020 and March 31, 2020 that are not otherwise disclosed. As required by IFRS 13, the assets and liabilities are classified in their entirety based on the lowest level of input that is significant to the fair value measurement.
| Fair value as at December 31, 2020 | ||||||||||||
| Recurring measurements | Level 1 | Level 2 | Level 3 | Total | ||||||||
| Financial assets | ||||||||||||
| Cash and cash equivalents | $ | 103,347 | $ | - | $ | - | $ | 103,347 | ||||
| Short-term investments - money market instruments | 78,859 | - | - | 78,859 | ||||||||
| Investments in public companies | 16,467 | - | - | 16,467 | ||||||||
| Investments in private companies | - | - | 2,296 | 2,296 | ||||||||
| Fair value as at March 31, 2020 | ||||||||||||
| Recurring measurements | Level 1 | Level 2 | Level 3 | Total | ||||||||
| Financial assets | ||||||||||||
| Cash and cash equivalents | $ | 65,777 | $ | - | $ | - | $ | 65,777 | ||||
| Short-term investments - money market instruments | 53,430 | - | - | 53,430 | ||||||||
| Investments in public companies | 6,633 | - | - | 6,633 | ||||||||
| Investments in private companies | - | - | 2,117 | 2,117 | ||||||||
Fair value of the other financial instruments excluded from the table above approximates their carrying amount as at December 31, 2020 and March 31, 2020, due to the short-term nature of these instruments.
There were no transfers into or out of Level 3 during the three and nine months ended December 31, 2020 and 2019.
(b) Liquidity risk
Liquidity risk is the risk that the Company will not be able to meet its short-term business requirements. The Company has in place a planning and budgeting process to help determine the funds required to support the Company’s normal operating requirements on an ongoing basis and its expansion plans.
| Management’s Discussion and Analysis | Page 24 |
| SILVERCORP METALS INC. |
| Management’s Discussion and Analysis |
| For the Three and Nine Months Ended December 31, 2020 |
| (Expressed in thousands of U.S. dollars, unless otherwise stated) |
In the normal course of business, the Company enters into contracts that give rise to commitments for future minimum payments. The following summarizes the remaining contractual maturities of the Company’s financial liabilities.
| December 31, 2020 | March 31, 2020 | ||||||||||||||
| Within a year | 2-5 years | Over 5 years | Total | Total | |||||||||||
| Accounts payable and accrued liabilities | 45,446 | - | - | 45,446 | 23,129 | ||||||||||
| Lease obligation | 644 | 1,225 | - | 1,869 | 2,069 | ||||||||||
| $ | 46,090 | $ | 1,225 | $ | - | $ | 47,315 | $ | 25,198 | ||||||
(c) Foreign exchange risk
The Company reports its financial statements in US dollars. The functional currency of the head office, Canadian subsidiaries and all intermediate holding companies is CAD and the functional currency of all Chinese subsidiaries is RMB. The Company is exposed to foreign exchange risk when the Company undertakes transactions and holds assets and liabilities in currencies other than its functional currencies.
The Company currently does not engage in foreign exchange currency hedging. The Company’s exposure to currency risk affect net income is summarized as follows:
| December 31, 2020 | March 31, 2020 | ||||
| Financial assets denominated in U.S. Dollars | $ | 58,210 | $ | 60,534 |
As at December 31, 2020, with other variables unchanged, a 10% strengthening (weakening) of the CAD against the USD would have decreased (increased) net income by approximately $5.8 million.
(d) Interest rate risk
The Company is exposed to interest rate risk on its cash equivalents and short term investments. As at December 31, 2020, all of its interest-bearing cash equivalents and short-term investments earn interest at market rates that are fixed to maturity or at variable interest rates with terms of less than one year. The Company monitors its exposure to changes in interest rates on cash equivalents and short term investments. Due to the short-term nature of these financial instruments, fluctuations in interest rates would not have a significant impact on the Company’s net income.
(e) Credit risk
Credit risk is the risk that one party to a financial instrument will fail to discharge an obligation and cause the other party to incur a financial loss. The Company is exposed to credit risk primarily associated to accounts receivable, due from related parties, cash and cash equivalents, and short-term investments. The carrying amount of assets included on the balance sheet represents the maximum credit exposure.
The Company undertakes credit evaluations on counterparties as necessary, requests deposits from customers prior to delivery, and has monitoring processes intended to mitigate credit risks. There were no amounts in trade or other receivables which were past due on December 31, 2020 (at March 31, 2020 - $nil) for which no provision is recognized.
(f) Equity price risk
The Company holds certain marketable securities that will fluctuate in value as a result of trading on Canadian financial markets. As the Company’s marketable securities holdings are mainly in mining companies, the value will also fluctuate based on commodity prices. Based upon the Company’s portfolio as at December 31, 2020, a 10% increase (decrease) in the market price of the securities held, ignoring any foreign currency effects, would have resulted in an increase (decrease) to the net income and other comprehensive income of $1,163 and $484, respectively.
| 9. | Off-Balance Sheet Arrangements |
The Company does not have any off-balance sheet arrangements.
| Management’s Discussion and Analysis | Page 25 |
| SILVERCORP METALS INC. |
| Management’s Discussion and Analysis |
| For the Three and Nine Months Ended December 31, 2020 |
| (Expressed in thousands of U.S. dollars, unless otherwise stated) |
| 10. | Transactions with Related Parties |
Related party transactions are made on terms agreed upon by the related parties. The balances with related parties are unsecured, non-interest bearing, and due on demand. Related party transactions not disclosed elsewhere in the condensed consolidated interim financial statements are as follows:
| Due from related parties | December 31, 2020 | March 31, 2020 | |||
| NUAG (a) | $ | 86 | $ | 94 | |
| WHG (b) | 16 | - | |||
| Henan Non-ferrous (c) | - | 1,425 | |||
| $ | 102 | $ | 1,519 |
| (a) | The Company recovers costs for services rendered to NUAG and expenses incurred on behalf of NUAG pursuant to a services and administrative costs reallocation agreement. During the three and nine months ended December 31, 2020, the Company recovered $136 and $476, respectively (the three and nine months ended December 31, 2019 - $183 and $397, respectively), from NUAG for services rendered and expenses incurred on behalf of NUAG. The costs recovered from NUAG were recorded as a direct reduction of general and administrative expenses on the consolidated statements of income. |
| (b) | The Company recovers costs for services rendered to WHG and expenses incurred on behalf of WHG pursuant to a services and administrative costs reallocation agreement. During the three and nine months ended December 31, 2020, the Company recovered $44 and $44, respectively (the three and nine months ended December 31, 2019 - $nil and $nil), from WHG for services rendered and expenses incurred on behalf of WHG. The costs recovered from WHG were recorded as a direct reduction of general and administrative expenses on the consolidated statements of income. |
| (c) | In January 2020, Henan Found advanced a loan of $1,426 (RMB¥10 million) to Henan Non-ferrous. The loan has a term of four months and bears an interest rate of 4.35% per annum. In May 2020, the loan, including accumulated interest, of $1,423 (RMB¥10.1 million) was repaid in full. |
The balances with related parties are unsecured.
| 11. | Alternative Performance (non-IFRS) Measures |
The following alternative performance measures are used by the Company to manage and evaluate operating performance of the Company’s mines and are widely reported in the silver mining industry as benchmarks for performance, but are alternative performance (non-IFRS) measures that do not have standardized meaning prescribed by IFRS and therefore unlikely to be comparable to similar measures presented by other companies. Accordingly, it is intended to provide additional information and should not be considered in isolation or as a substitute for measures of performance prepared in accordance with IFRS. To facilitate a better understanding of these measures, the tables in this section provide the reconciliation of these measures to the financial statements for the three and nine months ended December 31, 2020 and 2019: (a) Costs per Ounce of Silver Cash cost and all-in sustaining cost (“AISC”) per ounce of silver, net of by-product credits, are non-IFRS measures. The Company produces by-product metals incidentally to our silver mining activities. We have adopted the practice of calculating a performance measure with the net cost of producing an ounce of silver, our primary payable metal, after deducting revenues gained from incidental by-product production. This performance measure has been commonly used in the mining industry for many years and was developed as a relatively simple way of comparing the net production costs of the primary metal for a specific period against the prevailing market price of such metal.
Cash cost is calculated by deducting revenue from the sales of all metals other than silver and is calculated per ounce of silver sold.
| Management’s Discussion and Analysis | Page 26 |
| SILVERCORP METALS INC. |
| Management’s Discussion and Analysis |
| For the Three and Nine Months Ended December 31, 2020 |
| (Expressed in thousands of U.S. dollars, unless otherwise stated) |
AISC is an extension of the “cash cost” metric and provides a comprehensive measure of the Company’s operating performance and ability to generate cash flows. AISC has been calculated based on World Gold Council (“WGC”) guidance released in 2013 and undated in 2018. The WGC is not a regulatory organization and does not have the authority to develop accounting standards for disclosure requirements.
AISC is based on the Company’s cash costs, net of by-product sales, and further includes corporate general and administrative expense, government fee and other taxes, reclamation cost accretion, lease liability payments, and sustaining capital expenditures. Sustaining capital expenditures are those costs incurred to sustain and maintain existing assets at current productive capacity and constant planned levels of production output. Excluded are non-sustaining capital expenditures, which result in a material increase in the life of assets, materially increase resources or reserves, productive capacity, or future earning potential, or significant improvement in recovery or grade, or which do not relate to the current production activities. The Company believes that this measure represents the total sustainable costs of producing silver from current operations and provides additional information about the Company’s operational performance and ability to generate cash flows.
The following table provides a reconciliation of cash cost and AISC per ounce of silver, net of by-product credits:
| Three months ended December 31, 2020 | Three months ended December 31, 2019 | |||||||||||||||||||||||||||||||
| (Expressed in thousands of U.S. dollars, except ounce and per ounce amount) | Ying Mining District | GC | Other | Corporate | Consolidated | Ying Mining District | GC | Other | Corporate | Consolidated | ||||||||||||||||||||||
| Production costs expensed as reported | A | $ | 12,852 | $ | 5,174 | $ | - | $ | - | $ | 18,026 | $ | 13,184 | 5,211 | $ | - | $ | - | $ | 18,395 | ||||||||||||
| By-product sales | ||||||||||||||||||||||||||||||||
Gold | (1,194 | ) | - | (28 | ) | - | (1,222 | ) | (890 | ) | - | - | - | (890 | ) | |||||||||||||||||
Lead | (10,892 | ) | (1,961 | ) | - | - | (12,853 | ) | (11,112 | ) | (3,021 | ) | - | - | (14,133 | ) | ||||||||||||||||
Zinc | (2,114 | ) | (5,809 | ) | - | - | (7,923 | ) | (1,836 | ) | (3,203 | ) | - | - | (5,039 | ) | ||||||||||||||||
Other | (273 | ) | (305 | ) | - | - | (578 | ) | (406 | ) | - | - | - | (406 | ) | |||||||||||||||||
| Total by-product sales | B | (14,473 | ) | (8,075 | ) | (28 | ) | - | (22,576 | ) | (14,244 | ) | (6,224 | ) | - | - | (20,468 | ) | ||||||||||||||
| Total cash cost, net of by-product credits | C=A-B | (1,621 | ) | (2,901 | ) | (28 | ) | - | (4,550 | ) | (1,060 | ) | (1,013 | ) | - | - | (2,073 | ) | ||||||||||||||
Add: Mineral resources tax | 1,050 | 288 | - | - | 1,338 | 1,057 | 265 | - | - | 1,322 | ||||||||||||||||||||||
General and administrative | 1,676 | 870 | 214 | 3,524 | 6,284 | 1,020 | 733 | 104 | 3,059 | 4,916 | ||||||||||||||||||||||
Amortization included in general and administrative | (134 | ) | (96 | ) | (99 | ) | (139 | ) | (468 | ) | (111 | ) | (80 | ) | (74 | ) | (117 | ) | (382 | ) | ||||||||||||
Property evaluation and business development* | - | - | - | 207 | 207 | - | - | - | 232 | 232 | ||||||||||||||||||||||
Government fees and other taxes | 483 | 290 | 3 | - | �� | 776 | 452 | 334 | 1 | 787 | ||||||||||||||||||||||
Reclamation accretion | 34 | 7 | 5 | - | 46 | 91 | 6 | 8 | - | 105 | ||||||||||||||||||||||
Lease payment | - | - | - | 143 | 143 | - | - | - | 81 | 81 | ||||||||||||||||||||||
Sustaining capital expenditures | 6,083 | 1,330 | 194 | 15 | 7,622 | 6,772 | 264 | - | 290 | 7,326 | ||||||||||||||||||||||
| All-in sustaining cost, net of by-product credits | F | 7,571 | (212 | ) | 289 | 3,750 | 11,398 | 8,221 | 509 | 39 | 3,545 | 12,314 | ||||||||||||||||||||
Add: Non-sustaining capital expenditures | 6,805 | 322 | 733 | - | 7,860 | 2,197 | 298 | (1 | ) | - | 2,494 | |||||||||||||||||||||
| All-in cost, net of by-product credits | G | 14,376 | 110 | 1,022 | 3,750 | 19,258 | 10,418 | 807 | 38 | 3,545 | 14,808 | |||||||||||||||||||||
| Silver ounces sold ('000s) | H | 1,446 | 201 | - | - | 1,647 | 1,475 | 234 | - | - | 1,709 | |||||||||||||||||||||
| Cash cost per ounce of silver, net of by-product credits | (A+B)/H | $ | (1.12 | ) | $ | (14.43 | ) | $ | - | $ | - | $ | (2.76 | ) | $ | (0.72 | ) | (4.33 | ) | $ | - | $ | - | $ | (1.21 | ) | ||||||
| All-in sustaining cost per ounce of silver, net of by-product credits | F/H | $ | 5.24 | $ | (1.05 | ) | $ | - | $ | - | $ | 6.92 | $ | 5.57 | 2.18 | $ | - | $ | - | $ | 7.21 | |||||||||||
| All-in cost per ounce of silver, net of by-product credits | G/H | $ | 9.94 | $ | 0.55 | $ | - | $ | - | $ | 11.69 | $ | 7.06 | 3.45 | $ | - | $ | - | $ | 8.66 | ||||||||||||
| By-product credits per ounce of silver | ||||||||||||||||||||||||||||||||
Gold | (0.83 | ) | - | - | - | (0.74 | ) | (0.60 | ) | - | - | - | (0.52 | ) | ||||||||||||||||||
Lead | (7.53 | ) | (9.76 | ) | - | - | (7.80 | ) | (7.53 | ) | (12.91 | ) | - | - | (8.27 | ) | ||||||||||||||||
Zinc | (1.46 | ) | (28.90 | ) | - | - | (4.81 | ) | (1.24 | ) | (13.69 | ) | - | - | (2.95 | ) | ||||||||||||||||
Other | (0.19 | ) | (1.52 | ) | - | - | (0.35 | ) | (0.28 | ) | - | - | - | (0.24 | ) | |||||||||||||||||
| Total by-product credits per ounce of silver | $ | (10.01 | ) | $ | (40.18 | ) | $ | - | $ | - | $ | (13.70 | ) | $ | (9.65 | ) | $ | (26.60 | ) | $ | - | $ | - | $ | (11.98 | ) | ||||||
| Management’s Discussion and Analysis | Page 27 |
| SILVERCORP METALS INC. |
| Management’s Discussion and Analysis |
| For the Three and Nine Months Ended December 31, 2020 |
| (Expressed in thousands of U.S. dollars, unless otherwise stated) |
| Nine months ended December 31, 2020 | Nine months ended December 31, 2019 | |||||||||||||||||||||||||||||||
| (Expressed in thousands of U.S. dollars, except ounce and per ounce amount) | Ying Mining District | GC | Other | Corporate | Consolidated | Ying Mining District | GC | Other | Corporate | Consolidated | ||||||||||||||||||||||
| Production costs expensed as reported | A | $ | 41,916 | $ | 13,095 | $ | 449 | $ | - | $ | 55,460 | $ | 40,313 | 13,372 | $ | - | $ | - | $ | 53,685 | ||||||||||||
| By-product sales | ||||||||||||||||||||||||||||||||
Gold | (4,164 | ) | - | (1,553 | ) | - | (5,717 | ) | (3,286 | ) | - | - | - | (3,286 | ) | |||||||||||||||||
Lead | (35,386 | ) | (6,228 | ) | - | - | (41,614 | ) | (37,750 | ) | (7,763 | ) | - | - | (45,513 | ) | ||||||||||||||||
Zinc | (4,556 | ) | (12,758 | ) | - | - | (17,314 | ) | (4,460 | ) | (9,776 | ) | - | - | (14,236 | ) | ||||||||||||||||
Other | (1,112 | ) | (665 | ) | - | - | (1,777 | ) | (1,609 | ) | (289 | ) | - | - | (1,898 | ) | ||||||||||||||||
| Total by-product sales | B | (45,218 | ) | (19,651 | ) | (1,553 | ) | - | (66,422 | ) | (47,105 | ) | (17,828 | ) | - | - | (64,933 | ) | ||||||||||||||
| Total cash cost, net of by-product credits | C=A+B | (3,302 | ) | (6,556 | ) | (1,104 | ) | - | (10,962 | ) | (6,792 | ) | (4,456 | ) | - | - | (11,248 | ) | ||||||||||||||
Add: Mineral resources tax | 3,347 | 760 | - | - | 4,107 | 3,255 | 726 | - | - | 3,981 | ||||||||||||||||||||||
General and administrative | 4,591 | 2,114 | 451 | 8,996 | 16,152 | 4,543 | 1,761 | 384 | 7,504 | 14,192 | ||||||||||||||||||||||
Amortization included in general and administrative | (371 | ) | (275 | ) | (276 | ) | (391 | ) | (1,313 | ) | (333 | ) | (241 | ) | (224 | ) | (324 | ) | (1,122 | ) | ||||||||||||
Property evaluation and business development* | - | - | - | 519 | 519 | - | - | - | 405 | 405 | ||||||||||||||||||||||
Government fees and other taxes | 1,460 | 500 | 5 | - | 1,965 | 1,375 | 475 | 2 | 25 | 1,877 | ||||||||||||||||||||||
Reclamation accretion | 145 | 19 | 22 | - | 186 | 275 | 18 | 23 | - | 316 | ||||||||||||||||||||||
Lease payment | - | - | - | 414 | 414 | - | - | - | 369 | 369 | ||||||||||||||||||||||
Sustaining capital expenditures | 18,929 | 3,380 | 195 | 494 | 22,998 | 19,733 | 1,514 | - | 768 | 22,015 | ||||||||||||||||||||||
| All-in sustaining cost, net of by-product credits | F | 24,799 | (58 | ) | (707 | ) | 10,032 | 34,066 | 22,056 | (203 | ) | 185 | 8,747 | 30,785 | ||||||||||||||||||
Add: Non-sustaining capital expenditures | 10,164 | 712 | 1,315 | - | 12,191 | 5,360 | 697 | 87 | - | 6,144 | ||||||||||||||||||||||
| All-in cost, net of by-product credits | G | 34,963 | 654 | 608 | 10,032 | 46,257 | 27,416 | 494 | 272 | 8,747 | 36,929 | |||||||||||||||||||||
| Silver ounces sold ('000s) | H | 4,674 | 585 | - | - | 5,259 | 4,848 | 610 | - | - | 5,458 | |||||||||||||||||||||
| Cash cost per ounce of silver, net of by-product credits | (A+B)/H | $ | (0.71 | ) | $ | (11.21 | ) | $ | - | $ | - | $ | (2.08 | ) | $ | (1.40 | ) | $ | (7.30 | ) | $ | - | $ | - | $ | (2.06 | ) | |||||
| All-in sustaining cost per ounce of silver, net of by-product credits | F/H | $ | 5.31 | $ | (0.10 | ) | $ | - | $ | - | $ | 6.48 | $ | 4.55 | $ | (0.33 | ) | $ | - | $ | - | $ | 5.64 | |||||||||
| All-in cost per ounce of silver, net of by-product credits | G/H | $ | 7.48 | $ | 1.12 | $ | - | $ | - | $ | 8.80 | $ | 5.66 | $ | 0.81 | $ | - | $ | - | $ | 6.77 | |||||||||||
| By-product credits per ounce of silver | ||||||||||||||||||||||||||||||||
Gold | (0.89 | ) | - | - | - | (1.09 | ) | (0.68 | ) | - | - | - | (0.60 | ) | ||||||||||||||||||
Lead | (7.57 | ) | (10.65 | ) | - | - | (7.91 | ) | (7.79 | ) | (12.73 | ) | - | - | (8.34 | ) | ||||||||||||||||
Zinc | (0.97 | ) | (21.81 | ) | - | - | (3.29 | ) | (0.92 | ) | (16.03 | ) | - | - | (2.61 | ) | ||||||||||||||||
Other | (0.24 | ) | (1.14 | ) | - | - | (0.34 | ) | (0.33 | ) | (0.47 | ) | - | - | (0.35 | ) | ||||||||||||||||
| Total by-product credits per ounce of silver | $ | (9.67 | ) | $ | (33.60 | ) | $ | - | $ | - | $ | (12.63 | ) | $ | (9.72 | ) | $ | (29.23 | ) | $ | - | $ | - | $ | (11.90 | ) | ||||||
*Recovery of $3,970, arising from the receipt of $6,497 (CAD$9,000) break fee from Guyana Goldfield net of expenses of $2,527, was excluded for the nine months ended December 31, 2020.
(b) Costs per Tonne of Ore Processed
The Company uses cost per tonne of ore processed to manage and evaluate operating performance at each of its mines. Cost per tonne of ore processed is calculated based on total production costs on a sales basis, adjusted for changes in inventory, to arrive at total production costs that relate to ore production during the period. These total production costs are then further divided into mining cost, shipping cost, and milling cost. Cost per tonne of ore processed is the total of per tonne mining cost, per tonne shipping cost, and per tonne milling cost.
All-in sustaining production cost per tonne is an extension of the cash production cost per tonne and provides a comprehensive measure of the Company’s operating performance and ability to generate cash flows. All-in sustaining production cost per tonne is based on the Company’s cash production cost, and further includes corporate general and administrative expense, government fee and other taxes, reclamation cost accretion, lease liability payments, and sustaining capital expenditures. The Company believes that this measure represents the total sustainable costs of processing ore from current operations and provides additional information about the Company’s operational performance and ability to generate cash flows.
The following table provides a reconciliation of production cost and all-in sustaining production cost per tonne of ore processed:
| Management’s Discussion and Analysis | Page 28 |
| SILVERCORP METALS INC. |
| Management’s Discussion and Analysis |
| For the Three and Nine Months Ended December 31, 2020 |
| (Expressed in thousands of U.S. dollars, unless otherwise stated) |
| Three months ended December 31, 2020 | Three months ended December 31, 2019 | |||||||||||||||||||||||||||||||
| (Expressed in thousands of U.S. dollars, except ounce and per ounce amount) | Ying Mining District | GC | Other | Corporate | Consolidated | Ying Mining District | GC | Other | Corporate | Consolidated | ||||||||||||||||||||||
| Production costs expensed as reported | $ | 12,852 | $ | 5,174 | $ | - | $ | - | $ | 18,026 | $ | 13,184 | $ | 5,211 | $ | - | $ | - | $ | 18,395 | ||||||||||||
| Depreciation and amortization as reported | 4,623 | 973 | - | - | 5,596 | 4,984 | 902 | - | - | 5,886 | ||||||||||||||||||||||
| Change in stockpile and concentrate inventory | ||||||||||||||||||||||||||||||||
Less: stockpile and concentrate inventory - Beginning | (3,052 | ) | (365 | ) | (32 | ) | - | (3,449 | ) | (5,014 | ) | (600 | ) | (784 | ) | - | (6,398 | ) | ||||||||||||||
Add: stockpile and concentrate inventory - Ending | 6,156 | 499 | 34 | - | 6,689 | 6,158 | 322 | 805 | - | 7,285 | ||||||||||||||||||||||
Adjustment for foreign exchange movement | (614 | ) | (30 | ) | (2 | ) | - | (646 | ) | (199 | ) | (17 | ) | (21 | ) | - | (237 | ) | ||||||||||||||
| 2,490 | 104 | - | - | 2,594 | 945 | (295 | ) | - | - | 650 | ||||||||||||||||||||||
| Total production cost | $ | 19,965 | $ | 6,251 | $ | - | $ | - | $ | 28,810 | $ | 19,113 | $ | 5,818 | $ | - | $ | 24,931 | ||||||||||||||
| Depreciation and amortization charged to mining costs | A | 4,740 | 880 | - | - | 5,620 | 4,795 | 747 | - | - | 5,542 | |||||||||||||||||||||
| Depreciation and amortization charged to milling costs | B | 301 | 109 | - | - | 410 | 311 | 106 | - | - | 417 | |||||||||||||||||||||
| Total non-cash production cost | $ | 5,041 | $ | 989 | $ | - | $ | - | $ | 6,030 | $ | 5,106 | $ | 853 | $ | - | $ | 5,959 | ||||||||||||||
Cash mining cost | C | 12,398 | 4,030 | - | - | 16,428 | 11,395 | 3,713 | - | - | 15,108 | |||||||||||||||||||||
Shipping cost | D | 720 | - | - | - | 720 | 683 | - | - | - | 683 | |||||||||||||||||||||
Cash milling cost | E | 1,807 | 1,232 | - | - | 3,039 | 1,929 | 1,252 | - | - | 3,181 | |||||||||||||||||||||
| Total cash production cost | $ | 14,925 | $ | 5,262 | $ | - | $ | - | $ | 20,187 | $ | 14,007 | $ | 4,965 | $ | - | $ | - | $ | 18,972 | ||||||||||||
General and administrative | 1,676 | 870 | 214 | 3,524 | 6,284 | 1,020 | 733 | 104 | 3,059 | 4,916 | ||||||||||||||||||||||
Property evaluation and business development* | - | - | - | 207 | 207 | - | - | - | 232 | 232 | ||||||||||||||||||||||
Amortization included in general and administrative | (134 | ) | (96 | ) | (99 | ) | (139 | ) | (468 | ) | (111 | ) | (80 | ) | (74 | ) | (117 | ) | (382 | ) | ||||||||||||
Government fees and other taxes | 483 | 290 | 3 | - | 776 | 452 | 334 | 1 | - | 787 | ||||||||||||||||||||||
Reclamation accretion | 34 | 7 | 5 | - | 46 | 91 | 6 | 8 | - | 105 | ||||||||||||||||||||||
Lease payment | - | - | - | 143 | 143 | - | - | - | 81 | 81 | ||||||||||||||||||||||
Sustaining capital expenditures | 6,083 | 1,330 | 194 | 15 | 7,622 | 6,772 | 264 | - | 290 | 7,326 | ||||||||||||||||||||||
| All-in sustaining production cost | F | $ | 23,067 | $ | 7,663 | $ | 317 | $ | 3,750 | $ | 34,797 | $ | 22,231 | $ | 6,222 | $ | 39 | $ | 3,545 | $ | 32,037 | |||||||||||
| Non-sustaining capital expenditures | 6,805 | 322 | 733 | - | 7,860 | 2,197 | 298 | (1 | ) | - | 2,494 | |||||||||||||||||||||
| All in production cost | G | $ | 29,872 | $ | 7,985 | $ | 1,050 | $ | 3,750 | $ | 42,657 | $ | 24,428 | $ | 6,520 | $ | 38 | $ | 3,545 | $ | 34,531 | |||||||||||
Ore mined (’000s) | H | 182.268 | 97.177 | - | - | 279.445 | 176.149 | 86.437 | - | - | 262.586 | |||||||||||||||||||||
Ore shipped (’000s) | I | 180.906 | 97.177 | - | - | 278.083 | 175.639 | 86.437 | - | - | 262.076 | |||||||||||||||||||||
Ore milled (’000s) | J | 162.905 | 97.743 | - | - | 260.648 | 175.488 | 89.372 | - | - | 264.860 | |||||||||||||||||||||
| Per tonne Production cost | ||||||||||||||||||||||||||||||||
Non-cash mining cost ($/tonne) | K=A/H | 26.01 | 9.06 | - | - | 20.11 | 27.22 | 8.64 | - | - | 21.11 | |||||||||||||||||||||
Non-cash milling cost ($/tonne) | L=B/J | 1.85 | 1.12 | - | - | 1.57 | 1.77 | 1.19 | - | - | 1.57 | |||||||||||||||||||||
| Non-cash production cost ($/tonne) | M=K+L | $ | 27.86 | $ | 10.18 | $ | - | $ | - | $ | 21.68 | $ | 28.99 | $ | 9.83 | $ | - | $ | - | $ | 22.68 | |||||||||||
Cash mining cost ($/tonne) | N=C/H | 68.02 | 41.47 | - | - | 58.79 | 64.69 | 42.96 | - | - | 57.54 | |||||||||||||||||||||
Shipping costs ($/tonne) | O=D/I | 3.98 | - | - | - | 2.59 | 3.89 | - | - | - | 2.61 | |||||||||||||||||||||
Cash milling costs ($/tonne) | P=E/J | 11.09 | 12.60 | - | - | 11.66 | 10.99 | 14.01 | - | - | 12.01 | |||||||||||||||||||||
| Cash production costs ($/tonne) | Q=N+O+P | $ | 83.09 | $ | 54.07 | $ | - | $ | - | $ | 73.04 | $ | 79.57 | $ | 56.97 | $ | - | $ | - | $ | 72.16 | |||||||||||
| All-in sustaining production costs ($/tonne) | P=(F-C-D-E)/J+Q | $ | 133.07 | $ | 78.63 | $ | - | $ | - | $ | 129.09 | $ | 126.43 | $ | 71.03 | $ | - | $ | - | $ | 121.49 | |||||||||||
| All in costs ($/tonne) | S=P+(G-F)/J | $ | 174.84 | $ | 81.93 | $ | - | $ | - | $ | 159.25 | $ | 138.95 | $ | 74.37 | $ | - | $ | - | $ | 130.90 | |||||||||||
| Nine months ended December 31, 2020 | Nine months ended December 31, 2019 | |||||||||||||||||||||||||||||||
| (Expressed in thousands of U.S. dollars, except ounce and per ounce amount) | Ying Mining District | GC | Other | Corporate | Consolidated | Ying Mining District | GC | Other | Corporate | Consolidated | ||||||||||||||||||||||
| Production costs expensed as reported | $ | 41,916 | $ | 13,095 | $ | 449 | $ | - | $ | 55,460 | $ | 40,313 | $ | 13,372 | $ | - | $ | - | $ | 53,685 | ||||||||||||
| Depreciation and amortization | 14,042 | 2,568 | �� | 318 | - | 16,928 | 15,123 | 2,446 | - | - | 17,569 | |||||||||||||||||||||
| Changes in stockpile and concentrate inventory | ||||||||||||||||||||||||||||||||
Less: stockpile and concentrate inventory - Beginning | (4,474 | ) | (241 | ) | (790 | ) | - | (5,505 | ) | (5,947 | ) | (213 | ) | (834 | ) | - | (6,994 | ) | ||||||||||||||
Add: stockpile and concentrate inventory - Ending | 6,156 | 499 | 34 | - | 6,689 | 6,158 | 322 | 805 | - | 7,285 | ||||||||||||||||||||||
Adjustment for foreign exchange movement | (724 | ) | (34 | ) | (11 | ) | - | (769 | ) | 95 | 9 | 29 | - | 133 | ||||||||||||||||||
| 958 | 224 | (767 | ) | - | 415 | 306 | 118 | - | - | 424 | ||||||||||||||||||||||
| Total production cost | $ | 56,916 | $ | 15,887 | $ | - | $ | - | $ | 72,803 | $ | 55,742 | $ | 15,936 | $ | - | $ | 71,678 | ||||||||||||||
| Depreciation and amortization charged to mining costs | A | 13,329 | 2,292 | - | - | 15,621 | 14,457 | 2,044 | - | - | 16,501 | |||||||||||||||||||||
| Depreciation and amortization charged to milling costs | B | 867 | 313 | - | - | 1,180 | 936 | 415 | - | - | 1,351 | |||||||||||||||||||||
| Total non-cash production cost | $ | 14,196 | $ | 2,605 | $ | - | $ | - | $ | 16,801 | $ | 15,393 | $ | 2,459 | $ | - | $ | - | 17,852 | |||||||||||||
Cash mining cost | C | 35,834 | 10,017 | - | - | 45,851 | 32,963 | 9,995 | - | - | 42,958 | |||||||||||||||||||||
Shipping cost | D | 2,055 | - | - | - | 2,055 | 2,074 | - | - | - | 2,074 | |||||||||||||||||||||
Cash milling cost | E | 4,831 | 3,265 | - | - | 8,096 | 5,313 | 3,482 | - | - | 8,795 | |||||||||||||||||||||
| Total cash production cost | $ | 42,720 | $ | 13,282 | $ | - | $ | - | $ | 56,002 | $ | 40,350 | $ | 13,477 | $ | - | $ | - | $ | 53,827 | ||||||||||||
General and administrative | 4,591 | 2,114 | 451 | 8,996 | 16,152 | 4,543 | 1,761 | 384 | 7,504 | 14,192 | ||||||||||||||||||||||
Property evaluation and business development* | - | - | - | 519 | 519 | - | - | - | 405 | 405 | ||||||||||||||||||||||
Amortization included in general and administrative | (371 | ) | (275 | ) | (276 | ) | (391 | ) | (1,313 | ) | (333 | ) | (241 | ) | (224 | ) | (324 | ) | (1,122 | ) | ||||||||||||
Government fees and other taxes | 1,460 | 500 | 5 | - | 1,965 | 1,375 | 475 | 2 | 25 | 1,877 | ||||||||||||||||||||||
Reclamation accretion | 145 | 19 | 22 | - | 186 | 275 | 18 | 23 | - | 316 | ||||||||||||||||||||||
Lease payment | - | - | - | 414 | 414 | - | - | - | 369 | 369 | ||||||||||||||||||||||
Sustaining capital expenditures | 18,929 | 3,380 | 195 | 494 | 22,998 | 19,733 | 1,514 | - | 768 | 22,015 | ||||||||||||||||||||||
| All-in sustaining production cost | F | $ | 67,474 | $ | 19,020 | $ | 397 | $ | 10,032 | $ | 96,923 | $ | 65,943 | $ | 17,004 | $ | 185 | $ | 8,747 | $ | 91,879 | |||||||||||
| Non-sustaining capital expenditures | 10,164 | 712 | 1,315 | - | 12,191 | 5,360 | 697 | 87 | - | $ | 6,144 | |||||||||||||||||||||
| All in production cost | G | $ | 77,638 | $ | 19,732 | $ | 1,712 | $ | 10,032 | $ | 109,114 | $ | 71,303 | $ | 17,701 | $ | 272 | $ | 8,747 | $ | 98,023 | |||||||||||
Ore mined (’000s) | H | 537.464 | 264.389 | - | - | 801.853 | 528.818 | 250.417 | - | 779.235 | ||||||||||||||||||||||
Ore shipped (’000s) | I | 540.131 | 264.389 | - | - | 804.520 | 529.590 | 250.417 | - | 780.007 | ||||||||||||||||||||||
Ore milled (’000s) | J | 519.677 | 267.230 | - | - | 786.907 | 532.317 | 257.367 | - | 789.684 | ||||||||||||||||||||||
| Per tonne Production cost | ||||||||||||||||||||||||||||||||
Non-cash mining cost ($/tonne) | K=A/H | 24.80 | 8.67 | - | - | 19.48 | 27.34 | 8.16 | - | - | 21.18 | |||||||||||||||||||||
Non-cash milling cost ($/tonne) | L=B/J | 1.67 | 1.17 | - | - | 1.50 | 1.76 | 1.61 | - | - | 1.71 | |||||||||||||||||||||
| Non-cash production cost ($/tonne) | M=K+L | $ | 26.47 | $ | 9.84 | $ | - | $ | - | $ | 20.98 | $ | 29.10 | $ | 9.77 | $ | - | $ | - | $ | 22.89 | |||||||||||
Cash mining cost ($/tonne) | N=C/H | 66.67 | 37.89 | - | - | 57.18 | 62.33 | 39.91 | - | - | 55.13 | |||||||||||||||||||||
Shipping costs ($/tonne) | O=D/I | 3.80 | - | - | - | 2.55 | 3.92 | - | - | - | 2.66 | |||||||||||||||||||||
Cash milling costs ($/tonne) | P=E/J | 9.30 | 12.22 | - | - | 10.29 | 9.98 | 13.53 | - | - | 11.14 | |||||||||||||||||||||
| Cash production costs ($/tonne) | Q=N+O+P | $ | 79.77 | $ | 50.11 | $ | - | $ | - | $ | 70.02 | $ | 76.23 | $ | 53.44 | $ | - | $ | - | $ | 68.93 | |||||||||||
| All-in sustaining production costs ($/tonne) | P=(F-C-D-E)/J+Q | $ | 127.40 | $ | 71.58 | $ | - | $ | - | $ | 122.02 | $ | 124.31 | $ | 67.14 | $ | - | $ | - | $ | 117.12 | |||||||||||
| All in costs ($/tonne) | S=P+(G-F)/J | $ | 146.96 | $ | 74.25 | $ | - | $ | - | $ | 137.51 | $ | 134.38 | $ | 69.85 | $ | - | $ | - | $ | 124.90 | |||||||||||
*Recovery of $3,970, arising from receipt of $6,497 (CAD$9,000) break fee from Guyana Goldfield net of expenses of $2,527, was excluded for the nine months ended December 31, 2020.
| Management’s Discussion and Analysis | Page 29 |
| SILVERCORP METALS INC. |
| Management’s Discussion and Analysis |
| For the Three and Nine Months Ended December 31, 2020 |
| (Expressed in thousands of U.S. dollars, unless otherwise stated) |
(c) Working Capital
Working capital is an alternative performance (non-IFRS) measure calculated as current asset less current liabilities. Working capital dose not have any standardized meaning prescribed by IFRS and is therefore unlikely to be comparable to similar measures presented by other companies. The Company and certain investors use this information to evaluate whether the Company is able to meet its current obligations using its current assets.
| 12. | Critical Accounting Policies and Estimates |
The preparation of financial statements in conformity with IFRS requires management to make estimates and assumptions that affect the amounts reported on the consolidated financial statements. These critical accounting estimates represent management estimates that are uncertain and any changes in these estimates could materially impact the Company’s consolidated financial statements. Management continuously reviews its estimates and assumptions using the most current information available.
The Company’s critical accounting policies and estimates are described in Note 2 of the unaudited condensed consolidated financial statements for the three and nine months ended December 31, 2020, as well as the audited consolidated financial statements for the year ended March 31, 2020.
| 13. | New Accounting Standards |
(a) Changes in accounting standards
The accounting policies applied in the preparation of the unaudited condensed interim consolidated financial statements for the three and nine months ended December 31, 2020 are consistent with those applied and disclosed in the Company’s audited consolidated financial statements for the year ended March 31, 2020.
(b) Accounting standards not yet effective
New accounting standards and interpretations have been published that are not mandatory for the current period have not been early adopted. These standards ae not expected to have a material impact on the Company in the current or future reporting periods. The Company has not early adopted any amendment, standard or interpretation that has been issued by the IASB but is not yet effective.
| 14. | Other MD&A Requirements |
Additional information relating to the Company may be found: (a) on SEDAR at www.sedar.com or EDGAR at www.sec.gov; (b) at the Company’s website www.silvercorp.ca; (c) in the Company’s Annual Information Form; and
(d) in the Company’s annual audited consolidated financial statements as of March 31, 2020.
| 15. | Outstanding Share Data |
As at the date of this MD&A, the following securities were outstanding: (a) Share Capital
Authorized - unlimited number of common shares without par value
Issued and outstanding - 175,358,212 common shares with a recorded value of $248.8 million
Shares subject to escrow or pooling agreements - nil
(b) Options
As at the date of this MD&A, there are 2,117,001 options outstanding comprised as follows:
| Management’s Discussion and Analysis | Page 30 |
| SILVERCORP METALS INC. |
| Management’s Discussion and Analysis |
| For the Three and Nine Months Ended December 31, 2020 |
| (Expressed in thousands of U.S. dollars, unless otherwise stated) |
| Number of Options | Exercise Price (CAD$) | Expiry Date |
| 445,000 | $2.60 | 2021-11-16 |
| 207,500 | $3.23 | 2021-03-12 |
| 382,500 | $3.40 | 2021-08-24 |
| 587,001 | $5.46 | 2025-05-26 |
| 495,000 | $9.45 | 2025-11-11 |
| 2,117,001 |
(c) Restricted Share Units (“RSUs”)
Outstanding - 1,405,751 RSUs outstanding with weighted average grant date closing price of CAD$5.21 per share.
| 16. | Risks, Uncertainties, and Contingencies |
The Company is exposed to many risks in conducting its business, including but not limited to: metal price risk as the Company derives its revenue from the sale of silver, lead, zinc, and gold; credit risk in the normal course of dealing with other companies and financial institutions; foreign exchange risk as the Company reports its financial statements in USD whereas the Company operates in jurisdictions that utilize other currencies; equity price risk and interest rate risk as the Company has investments in marketable securities that are traded in the open market or earn interest at market rates that are fixed to maturity or at variable interest rates; inherent risk of uncertainties in estimating mineral reserves and mineral resources; political risks; economic and social risks related to conducting business in foreign jurisdictions such as China; environmental risks; risks related to its relations with employees and local communities where the Company operates, and emerging risks relating to the spread of COVID-19, which has to date resulted in profound health and economic impacts globally and which presents future risks and uncertainties that are largely unknown at this time.
Management and the Board continuously assess risks that the Company is exposed to and attempt to mitigate these risks where practical through a range of risk management strategies.
These and other risks are described in the Company’s Annual Information Form, NI 43-101 technical reports, Form 40-F, and Audited Consolidated Financial Statements, which are available on SEDAR at www.sedar.com and on EDGAR at www.sec.gov. Readers are encouraged to refer to these documents for a more detailed description of some of the risks and uncertainties inherent to Silvercorp’s business.
COVID-19
The Company’s business, operations and financial condition could be materially adversely affected by the outbreak of pandemics or other health crises, such as the outbreak of COVID-19 that was designated as a pandemic by the World Health Organization on March 11, 2020. The international response to the spread of COVID-19 has led to significant restrictions on travel, temporary business closures, quarantines, global stock market volatility, and a general reduction in consumer activity. Such public health crises can result in operating, supply chain and project development delays and disruptions, global stock market and financial market volatility, declining trade and market sentiment, reduced movement of people and labour shortages, and travel and shipping disruption and shutdowns, including as a result of government regulation and prevention measures, or a fear of any of the foregoing, all of which could affect commodity prices, interest rates, credit risk and inflation. In addition, the current COVID-19 pandemic, and any future emergence and spread of similar pathogens could have an adverse impact on global economic conditions which may adversely impact the Company’s operations, and the operations of suppliers, contractors and service providers.
The Company may experience business interruptions, including suspended (whether government mandated or otherwise) or reduced operations relating to COVID-19 and other such events outside of the Company’s control, which could have a material adverse impact on its business, operations and operating results, financial condition and liquidity.
As at the date of this MD&A, the duration of the business disruptions internationally and related financial impact of COVID-19 cannot be reasonably estimated. It is unknown whether and how the Company may be affected if the pandemic persists for an extended period of time.
| Management’s Discussion and Analysis | Page 31 |
| SILVERCORP METALS INC. |
| Management’s Discussion and Analysis |
| For the Three and Nine Months Ended December 31, 2020 |
| (Expressed in thousands of U.S. dollars, unless otherwise stated) |
The Company’s exposure to such public health crises also includes risks to employee health and safety. Should an employee, contractor, community member or visitor become infected with a serious illness that has the potential to spread rapidly, this could place the Company’s workforce at risk.
Metal Price Risk
The Company’s sales prices for lead and zinc pounds are fixed against the SME as quoted at www.shmet.com; gold ounces are fixed against the Shanghai Gold Exchange as quoted at www.sge.com.cn and silver ounces are fixed against the Shanghai White Platinum & Silver Exchange as quoted at www.ex-silver.com.
The Company’s revenues, if any, are expected to be in large part derived from the mining and sale of silver, lead, zinc, and gold contained in metal concentrates. The prices of those commodities have fluctuated widely, particularly in recent years, and are affected by numerous factors beyond the Company’s control including international and regional economic and political conditions; expectations of inflation; currency exchange fluctuations; interest rates; global or regional supply and demand for jewellery and industrial products containing silver and other metals; sale of silver and other metals by central banks and other holders, speculators and producers of silver and other metals; availability and cost of metal substitutes; and increased production due to new mine developments and improved mining and production methods. The price of base and precious metals may have a significant influence on the market price of the Company’s shares and the value of its projects. The effect of these factors on the price of base and precious metals, and therefore the viability of the Company’s exploration projects and mining operations, cannot be accurately predicted.
If silver and other metals prices were to decline significantly or for an extended period of time, the Company may be unable to continue operations, develop its projects, or fulfil obligations under agreements with the Company’s joint venture partners or under its permits or licenses.
Permits and licenses
All mineral resources and mineral reserves of the Company’s subsidiaries are owned by their respective governments, and mineral exploration and mining activities may only be conducted by entities that have obtained or renewed exploration or mining permits and licenses in accordance with the relevant mining laws and regulations. No guarantee can be given that the necessary exploration and mining permits and licenses will be issued to the Company or, if they are issued, that they will be renewed, or if renewed under reasonable operational and/or financial terms, or in a timely manner, or that the Company will be in a position to comply with all conditions that are imposed.
Nearly all mining projects require government approval. There can be no certainty that approvals necessary to develop and operate mines on the Company’s properties will be granted or renewed in a timely and/or economical manner, or at all.
Title to properties
With respect to the Company’s Chinese properties, while the Company has investigated title to all of its mineral claims and to the best of its knowledge, title to all of its properties is in good standing, the properties may be subject to prior unregistered agreements or transfers and title may be affected by undetected defects. There may be valid challenges to the title of the Company’s properties which, if successful, could impair development and/or operations. The Company cannot give any assurance that title to its properties will not be challenged. Title insurance is generally not available for mineral properties and the Company’s ability to ensure that it has obtained secure claims to individual mineral properties or mining concessions may be severely constrained. The Company’s mineral properties in China have not been surveyed, and the precise location and extent thereof may be in doubt.
Operations and political conditions
All the properties in which the Company has an interest are located in China, which has different regulatory and legal standards than those in North America. Even when the Company’s mineral properties are proven to host economic reserves of metals, factors such as political instability, terrorism, opposition and harassment from local miners, or governmental expropriation or regulation may prevent or restrict mining of any such deposits or repatriation of profits.
| Management’s Discussion and Analysis | Page 32 |
| SILVERCORP METALS INC. |
| Management’s Discussion and Analysis |
| For the Three and Nine Months Ended December 31, 2020 |
| (Expressed in thousands of U.S. dollars, unless otherwise stated) |
All the Company’s operations are located in China. These operations are subject to the risks normally associated with conducting business in China. Some of these risks are more prevalent in countries which are less developed or have emerging economies, including uncertain political and economic environments, as well as risks of war and civil disturbances or other risks which may limit or disrupt a project, restrict the movement of funds or result in the deprivation of contractual rights or the taking of property by nationalization or expropriation without fair compensation, risk of adverse changes in laws or policies, increases in foreign taxation or royalty obligations, license fees, permit fees, delays in obtaining or the inability to obtain necessary governmental permits, limitations on ownership and repatriation of earnings, and foreign exchange controls and currency devaluations.
In addition, the Company may face import and export regulations, including export restrictions, disadvantages of competing against companies from countries that are not subject to similar laws, restrictions on the ability to pay dividends offshore, and risk of loss due to disease and other potential endemic health issues. Although the Company is not currently experiencing any significant or extraordinary problems in China arising from such risks, there can be no assurance that such problems will not arise in the future. The Company currently does not carry political risk insurance coverage.
The Company’s interests in its mineral properties are held through joint venture companies established under and governed by the laws of China. The Company’s joint venture partners in China include state-sector entities and, like other state-sector entities, their actions and priorities may be dictated by government policies instead of purely commercial considerations. Additionally, companies with a foreign ownership component operating in China may be required to work within a framework which is different from that imposed on domestic Chinese companies. The Chinese government currently allows foreign investment in certain mining projects under central government guidelines. There can be no assurance that these guidelines will not change in the future.
Regulatory environment in China
The Company conducts its operations in China. The laws of China differ significantly from those of Canada and all such laws are subject to change. Mining is subject to potential risks and liabilities associated with pollution of the environment and disposal of waste products occurring as a result of mineral exploration and production.
Failure to comply with applicable laws and regulations may result in enforcement actions and may also include corrective measures requiring capital expenditures, installation of additional equipment or remedial actions. Parties engaged in mining operations may be required to compensate those suffering loss or damage by reason of mining activities and may have civil or criminal fines or penalties imposed for violations of applicable laws and regulations.
New laws and regulations, amendments to existing laws and regulations, administrative interpretation of existing laws and regulations, or more stringent enforcement of existing laws and regulations could have a material adverse impact on future cash flow, results of operations and the financial condition of the Company.
Environmental risks
The Company’s activities are subject to extensive laws and regulations governing environmental protection and employee health and safety, including environmental laws and regulations in China. These laws address emissions into the air, discharges into water, management of waste, management of hazardous substances, protection of natural resources, antiquities and endangered species, and reclamation of lands disturbed by mining operations.
| Management’s Discussion and Analysis | Page 33 |
| SILVERCORP METALS INC. |
| Management’s Discussion and Analysis |
| For the Three and Nine Months Ended December 31, 2020 |
| (Expressed in thousands of U.S. dollars, unless otherwise stated) |
There are also laws and regulations prescribing reclamation activities on some mining properties. Environmental legislation in many countries, including China, is evolving and the trend has been toward stricter standards and enforcement, increased fines and penalties for non-compliance, more stringent environmental assessments of proposed projects and increasing responsibility for companies and their officers, directors and employees. Compliance with environmental laws and regulations may require significant capital outlays on behalf of the Company and may cause material changes or delays in the Company’s intended activities. There can be no assurance that the Company has been or will be at all times in complete compliance with current and future environmental and health and safety laws and permits will not materially adversely affect the Company’s business, results of operations or financial condition. It is possible that future changes in these laws or regulations could have a significant adverse impact on some portion of the Company’s business, causing the Company to re-evaluate those activities at that time. The Company’s compliance with environmental laws and regulations entail uncertain cost.
Risks and hazards of mining operations
Mining is inherently dangerous, and the Company’s operations are subject to a number of risks and hazards including, without limitation:
| (i) | environmental hazards; | |
| (ii) | discharge of pollutants or hazardous chemicals; | |
| (iii) | industrial accidents; | |
| (iv) | failure of processing and mining equipment; | |
| (v) | labour disputes; | |
| (vi) | supply problems and delays; | |
| (vii) | encountering unusual or unexpected geologic formations or other geological or grade problems; | |
| (viii) | encountering unanticipated ground or water conditions; | |
| (ix) | cave-ins, pit wall failures, flooding, rock bursts and fire; | |
| (x) | periodic interruptions due to inclement or hazardous weather conditions; | |
| (xi) | equipment breakdown; | |
| (xii) | other unanticipated difficulties or interruptions in development, construction or production; | |
| (xiii) | other acts of God or unfavourable operating conditions; and | |
| (xiv) | health and safety risks associated with spread of COVID-19 and any future emergence and spread of similar pathogens. | |
Such risks could result in damage to, or destruction of, mineral properties or processing facilities, personal injury or death, loss of key employees, environmental damage, delays in mining, monetary losses and possible legal liability. Satisfying such liabilities may be very costly and could have a material adverse effect on the Company’s future cash flow, results of operations and financial condition.
| Management’s Discussion and Analysis | Page 34 |
| SILVERCORP METALS INC. |
| Management’s Discussion and Analysis |
| For the Three and Nine Months Ended December 31, 2020 |
| (Expressed in thousands of U.S. dollars, unless otherwise stated) |
Cybersecurity Risks
The Company is subject to cybersecurity risks including, without limitation: unauthorized access to privileged information and risks related to the destruction of data or the disabling, degrading or sabotaging of the Company’s systems, including through the introduction of computer viruses. Although the Company takes steps to secure configurations and manage information system, including, without limitation, computer systems, internet sites, emails and other telecommunications, and financial/geological data, there can be no assurance that measures the Company takes to ensure the integrity of our systems will provide protection, especially because cyberattack techniques used change frequently or are often not recognized until successful. The Company has not experienced any material cybersecurity incident in the past, but there can be no assurance that the Company would not experience the same in the future. If the Company’s systems are compromised, do not operate properly or are disabled, the Company could, among other things, suffer financial loss, disruption of business, loss of geology data which could affect our ability to conduct effective mine planning and accurate mineral resources estimates, and loss of financial data which could affect our ability to provide accurate and timely financial reporting.
General Economic Conditions
General economic conditions may adversely affect the Company’s growth, profitability and ability to obtain financing. Events in global financial markets in the past several years have had a profound impact on the global economy. Many industries, including the silver and gold mining industry, have been and continue to be impacted by these market conditions. Some of the key impacts of the current financial market turmoil include contraction in credit markets resulting in a widening of credit risk, devaluations, high volatility in global equity, commodity, foreign exchange and precious metal markets and a lack of market confidence and liquidity. A continued or worsened slowdown in the financial markets or other economic conditions, including but not limited to, consumer spending, employment rates, business conditions, inflation, fuel and energy costs, consumer debt levels, lack of available credit, the state of the financial markets, interest rates and tax rates, may adversely affect the Company’s growth, profitability and ability to obtain financing. A number of issues related to economic conditions could have a material adverse effect on our business, financial condition and results of operations, including:
| (i) | significant disruption to the global economic conditions caused by COVID-19 as discussed above; | |
| (ii) | contraction in credit markets could impact the cost and availability of financing and our overall liquidity; | |
| (iii) | the volatility of silver, gold and other metal prices would impact our revenues, profits, losses and cash flow; | |
| (iv) | recessionary pressures could adversely impact demand for our production; | |
| (v) | volatile energy, commodity and consumables prices and currency exchange rates could impact our production costs; and | |
| (vi) | the devaluation and volatility of global stock markets could impact the valuation of our equity and other securities. | |
| 17. | Management’s Report on Internal Control over Financial Reporting |
(a) Internal Control over Financial Reporting
Management of the Company is responsible for establishing and maintaining an adequate system of internal control, including internal controls over financial reporting. Internal control over financial reporting is a process designed by and/or under the supervision of the Chief Executive Officer and the Chief Financial Officer and effected by the Board, management and other personnel to provide reasonable assurance regarding the reliability of financial reporting and the preparation of financial statements for external purposes in accordance with IFRS as issued by IASB. It includes those policies and procedures that:
| (i) | pertain to the maintenance of records that in reasonable detail accurately and fairly reflect the transactions and dispositions of the assets of the Company; | |
| (ii) | are designed to provide reasonable assurance that transactions are recorded as necessary to permit preparation of financial statements in accordance with IFRS, and that receipts and expenditures of the Company’s are being made only in accordance with authorizations of management and the Company’s directors; and | |
| Management’s Discussion and Analysis | Page 35 |
| SILVERCORP METALS INC. |
| Management’s Discussion and Analysis |
| For the Three and Nine Months Ended December 31, 2020 |
| (Expressed in thousands of U.S. dollars, unless otherwise stated) |
| (iii) | are designed to provide reasonable assurance regarding prevention or timely detection of unauthorized acquisition, use or disposition of the Company’s assets that could have a material effect on the annual financial statements or interim financial reports. |
The Company’s management, including its Chief Executive Officer and Chief Financial Officer, believes that due to its inherent limitations, internal control over financial reporting may not prevent or detect misstatements on a timely basis. In addition, projections of any evaluation of the effectiveness of internal control over financial reporting to future periods are subject to the risk that the controls may become inadequate because of changes in conditions, or that the degree of compliance with the policies or procedures may deteriorate.
The Company’s management evaluates the effectiveness of the Company’s internal control over financial reporting based upon the criteria set forth in Internal Control - Integrated Framework (2013) issued by the Committee of Sponsoring Organization of the Treadway Commission. Based on the evaluation, management concluded that the Company’s internal control over financial reporting as of December 31, 2020 was effective and provides a reasonable assurance of the reliability of the Company’s financial reporting and preparation of the financial statements.
(b) Changes in Internal Control over Financial Reporting
There has been no change in the Company’s internal control over financial reporting during the three months ended December 31, 2020 that has materially affected or is reasonably likely to materially affect the Company’s internal control over financial reporting.
| 18. | Directors and Officers |
As at the date of this MD&A, the Company’s directors and officers are as follows:
| Directors | Officers |
| Dr. Rui Feng, Director, Chairman | Dr. Rui Feng, Chief Executive Officer |
| Yikang Liu, Director | Derek Liu, Chief Financial Officer |
| Paul Simpson, Director | Yong-Jae Kim, General Counsel & Corporate Secretary |
| David Kong, Director | Lon Shaver, Vice President |
| Marina A. Katusa, Director |
Technical Information
Scientific and technical information contained in this MD&A has been reviewed and approved by Mr. Guoliang Ma, P.Geo., Manager of Exploration and Resources of the Company and a Qualified Person as such term is defined in NI 43-101.
Forward Looking Statements
Certain of the statements and information in this MD&A constitute “forward-looking statements” within the meaning of the United States Private Securities Litigation Reform Act of 1995 and “forward-looking information” within the meaning of applicable Canadian provincial securities laws. Any statements or information that express or involve discussions with respect to predictions, expectations, beliefs, plans, projections, objectives, assumptions or future events or performance (often, but not always, using words or phrases such as “expects”, “is expected”, “anticipates”, “believes”, “plans”, “projects”, “estimates”, “assumes”, “intends”, “strategies”, “targets”, “goals”, “forecasts”, “objectives”, “budgets”, “schedules”, “potential” or variations thereof or stating that certain actions, events or results “may”, “could”, “would”, “might” or “will” be taken, occur or be achieved, or the negative of any of these terms and similar expressions) are not statements of historical fact and may be forward-looking statements or information. Forward-looking statements or information relate to, among other things:
the price of silver and other metals;
estimates of the Company’s revenues and capital expenditures;
estimated ore production and grades from the Company’s mines in the Ying Mining District and the GC Mine;
| Management’s Discussion and Analysis | Page 36 |
| SILVERCORP METALS INC. |
| Management’s Discussion and Analysis |
| For the Three and Nine Months Ended December 31, 2020 |
| (Expressed in thousands of U.S. dollars, unless otherwise stated) |
projected cash operating costs and all-in sustaining costs, and budgets, on a consolidated and mine-by-mine basis;
statements regarding anticipated exploration, drilling, development, construction, and other activities or achievements of the Company;
plans, projections and estimates included in the Fiscal 2021 Guidance and the Fiscal 2022 Guidance;
timing of clearance of the Zhonghe Project as a non-military area by the relevant governmental authorities and the Company s expectation that it will enter into the mineral rights transfer contract with respect to the Zhonghe Project; and
timing of receipt of permits and regulatory approvals.
Forward-looking statements or information are subject to a variety of known and unknown risks, uncertainties and other factors that could cause actual events or results to differ from those reflected in the forward-looking statements or information, including, without limitation, risks relating to,
COVID-19;
fluctuating commodity prices;
fluctuating currency exchange rates;
increasing labour cost;
exploration and development programs;
feasibility and engineering reports;
permits and licenses;
operations and political conditions;
regulatory environment in China and Canada;
environmental risks;
mining operations;
cybersecurity;
general economic conditions; and
matters referred to in this MD&A under the heading “Risks and Uncertainties” and other public filings of the Company.
This list is not exhaustive of the factors that may affect any of the Company’s forward-looking statements or information. Forward-looking statements or information are statements about the future and are inherently uncertain, and actual achievements of the Company or other future events or conditions may differ materially from those expressed or implied in the forward-looking statements or information. Although the Company has attempted to identify important factors that could cause actual results to differ materially, there may be other factors that cause results not to be as anticipated, estimated, described or intended. Accordingly, readers should not place undue reliance on forward-looking statements or information.
The Company’s forward-looking statements and information are necessarily based on a number of estimates, assumptions, beliefs, expectations and opinions of management as of the date of this MD&A that, while considered reasonable by management of the Company, are inherently subject to significant business, economic and competitive uncertainties and contingencies. These estimates, assumptions, beliefs, expectations and options include, but are not limited to, those related to the Company’s ability to carry on current and future operations, including: the duration and effects of COVID-19 on our operations and workforce; development and exploration activities; the timing, extent, duration and economic viability of such operations; the accuracy and reliability of estimates, projections, forecasts, studies and assessments; the Company’s ability to meet or achieve estimates, projections and forecasts; the availability and cost of inputs; the price and market for outputs; foreign exchange rates; taxation levels; the timely receipt of necessary approvals or permits; the ability to meet current and future obligations; the ability to obtain timely financing on reasonable terms when required; the current and future social, economic and political conditions; and other assumptions and factors generally associated with the mining industry.
Other than as required by applicable securities laws, the Company does not assume any obligation to update forward-looking statements and information if circumstances or management’s assumptions, beliefs, expectations or opinions should change, or changes in any other events affecting such statements or information. For the reasons set forth above, investors should not place undue reliance on forward-looking statements and information.
| Management’s Discussion and Analysis | Page 37 |